UNITED STATES
SECURITIES AND EXCHANGE COMMISSION
Washington, D.C. 20549
FORM N-CSR
CERTIFIED SHAREHOLDER REPORT OF REGISTERED
MANAGEMENT INVESTMENT COMPANIES
Investment Company Act file number: (811- 03061 )
Exact name of registrant as specified in charter: Putnam Global Natural Resources Fund
Address of principal executive offices: One Post Office Square, Boston, Massachusetts 02109
| Name and address of agent for service: | Beth S. Mazor, Vice President |
| | One Post Office Square |
| | Boston, Massachusetts 02109 |
| |
| Copy to: | John W. Gerstmayr, Esq. |
| | Ropes & Gray LLP |
| | One International Place |
| | Boston, Massachusetts 02110 |
Registrant’s telephone number, including area code: (617) 292-1000
Date of fiscal year end: August 31, 2007
Date of reporting period: September 1, 2006— February 28, 2007
Item 1. Report to Stockholders:
The following is a copy of the report transmitted to stockholders pursuant to Rule 30e-1 under the Investment Company Act of 1940:
What makes Putnam different?

In 1830, Massachusetts Supreme Judicial Court Justice Samuel Putnam established The Prudent Man Rule, a legal foundation for responsible money management.
THE PRUDENT MAN RULE
All that can be required of a trustee to invest is that he shall conduct himself faithfully and exercise a sound discretion. He is to observe how men of prudence, discretion, and intelligence manage their own affairs, not in regard to speculation, but in regard to the permanent disposition of their funds, considering the probable income, as well as the probable safety of the capital to be invested.

A time-honored tradition
in money management
Since 1937, our values have been rooted in a profound sense of responsibility for the money entrusted to us.
A prudent approach to investing
We use a research-driven team approach to seek consistent, dependable, superior investment results over time, although there is no guarantee a fund will meet its objectives.
Funds for every investment goal
We offer a broad range of mutual funds and other financial products so investors and their financial representatives can build diversified portfolios.
A commitment to doing
what’s right for investors
We have below-average expenses and stringent investor protections, and provide a wealth of information about the Putnam funds.
Industry-leading service
We help investors, along with their financial representatives, make informed investment decisions with confidence.
Putnam
Global Natural
Resources Fund
2| 28| 07
Semiannual Report
| Message from the Trustees | 2 |
| About the fund | 4 |
| Report from the fund managers | 7 |
| Performance | 13 |
| Expenses | 16 |
| Portfolio turnover | 18 |
| Risk | 19 |
| Your fund’s management | 20 |
| Terms and definitions | 23 |
| Trustee approval of management contract | 25 |
| Other information for shareholders | 32 |
| Financial statements | 33 |
| Brokerage commissions | 54 |
Cover photograph: © Marco Cristofori
Message from the Trustees
Dear Fellow Shareholder
From our present vantage point, it has become apparent that certain sectors of the U.S. economy have slowed somewhat, although the global economy continues to demonstrate healthy growth. In recent weeks, financial markets have reflected increased uncertainty about the effects of the housing market decline and tighter credit standards by mortgage lenders on the U.S. economy. However, we believe that the U.S. economy is flexible enough to adapt to these challenges, just as it has adapted to other challenges that have arisen in the course of the recent economic expansion.
As you may have heard, on February 1, 2007, Marsh & McLennan Companies, Inc. announced that it had signed a definitive agreement to sell its ownership interest in Putnam Investments Trust, the parent company of Putnam Management and its affiliates, to Great-West Lifeco Inc. Great-West Lifeco Inc. is a financial services holding company with operations in Canada, the United States, and Europe and is a member of the Power Financial Corporation group of companies. This transaction is subject to regulatory approvals and other conditions, including the approval of new management contracts by shareholders of a substantial number of Putnam funds at shareholder meetings scheduled for May 15, 2007. Proxy solicitation materials related to these meetings, which provide detailed information regarding the proposed transaction, were recently mailed. We currently expect the transaction to be completed by the middle of 2007.
Putnam’s team of investment and business professionals will continue to be led by Putnam President and Chief Executive Officer Ed Haldeman. Your Trustees have been actively involved through every step of the discussions, and we will continue in our role of overseeing the Putnam funds on your behalf.
2
We would like to take this opportunity to announce that a new independent Trustee, Kenneth R. Leibler, has joined your fund’s Board of Trustees. Mr. Leibler has had a distinguished career as a leader in the investment management industry. He is a founding partner of and advisor to the Boston Options Exchange; a Trustee of Beth Israel Deaconess Hospital in Boston; a lead director of Ruder Finn Group, a global communications and advertising firm; and a director of Northeast Utilities.
In the following pages, members of your fund’s management team discuss the fund’s performance and strategies for the fiscal period ended February 28, 2007, and provide their outlook for the months ahead. As always, we thank you for your support of the Putnam funds.

Putnam Global Natural Resources Fund:
mining opportunities in natural resources stocks
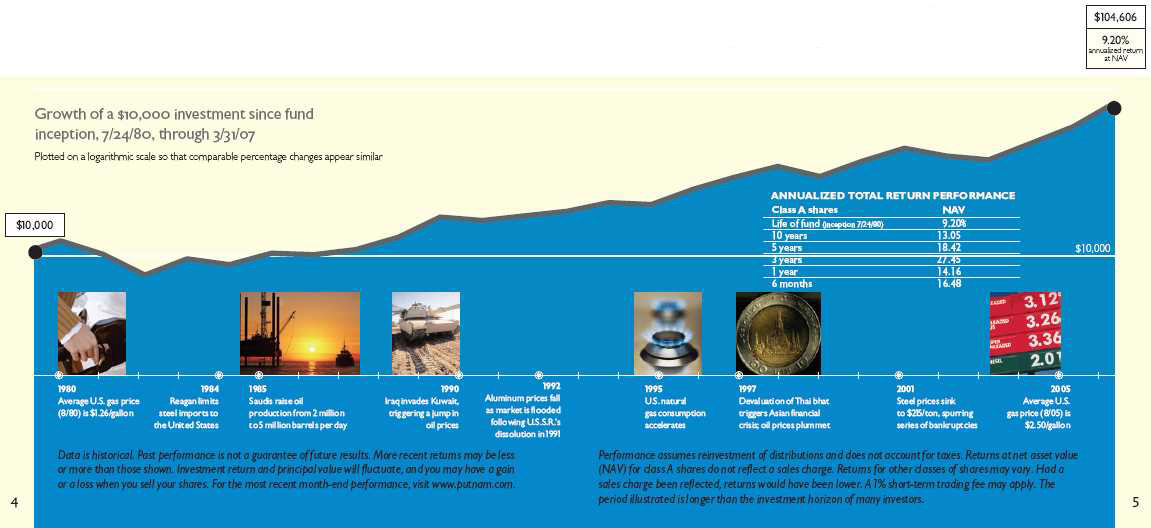
From the OPEC-driven oil crisis of the 1970s to the current commodity environment, the balance of geopolitical stability, technological development, and economic growth have shaped natural resources markets. Putnam Global Natural Resources Fund seeks to capitalize on that ever-changing balance by investing in stocks with the most advantageous exposure to the existing commodity environment. While investors in Putnam Global Natural Resources Fund have benefited from the recent rise in the stock prices of energy and materials companies, they have also been rewarded by the fund’s diversified approach to natural resources investing over the fund’s 26-year history.
The fund’s diversification sets it apart from many of its competitors in two respects: its view of natural resources industries is broader, including energy, mining, paper, chemical, aggregates, and natural resource-related equipment and infrastructure companies; furthermore, it has a global scope. Stock prices in the natural resources sector rise and fall with supply and demand imbalances, so this strategy helps the fund seek to offset that volatility while enabling it to pursue a wider field of opportunities.
Interestingly, the seeds of the recent rise in the stock prices of energy and mining companies were, in part, sown during the 1990s. At that time, several natural resources sectors were suffering from excess capacity and emphasized cost reduction rather than capital investment. Wall Street’s focus on technology stocks in the late 1990s also dampened the ability of companies in the natural resources sector to raise capital. An underinvestment in the capital infrastructure required to harvest natural resources meant that supply could not grow to meet demand. We believe that these industries still need more time and money to build capacity before supply/demand equilibrium is reached, and expect the resulting strength of energy-related, mining, and materials stocks to drive the sector’s performance for some time to come.
International investing involves certain risks, such as currency fluctuations, economic instability, and political developments. Additional risks may be associated with emerging-market securities, including illiquidity and volatility. The fund invests some or all of its assets in small and/or midsize companies. Such investments increase the risk of greater price fluctuations. The fund invests in fewer issuers or concentrates its investments by region or sector, and involves more risk than a fund that invests more broadly.
Putnam Global Natural Resources Fund seeks capital appreciation by investing in stocks of companies in the energy and natural resources industries. The fund targets companies in markets worldwide, in industries such as oil and gas, chemicals, metals and mining, and paper and forest products. The fund may be appropriate for investors seeking capital appreciation through investments in natural resources stocks worldwide.
Highlights
• For the six months ended February 28, 2007, Putnam Global Natural Resources Fund’s class A shares gained 5.81% without sales charges.
• The fund’s benchmark, the S&P 500 Index, returned 8.93% for the same period.
• The average return for the fund’s Lipper category, Natural Resources Funds, was 4.49% .
• Additional fund performance, comparative performance, and Lipper data can be found in the performance section beginning on page 13.
Performance
Total return for class A shares for periods ended 2/28/07
Since the fund’s inception (7/24/80), average annual return is 9.00% at NAV and 8.78% at POP.
| | Average annual return | Cumulative return |
| | NAV | POP | NAV | POP |
|
| 10 years | 12.40% | 11.80% | 221.86% | 205.02% |
|
| 5 years | 18.80 | 17.53 | 136.67 | 124.27 |
|
| 3 years | 24.81 | 22.58 | 94.41 | 84.20 |
|
| 1 year | 13.26 | 7.32 | 13.26 | 7.32 |
|
| 6 months | — | — | 5.81 | 0.27 |
|
Data is historical. Past performance does not guarantee future results. More recent returns may be less or more than those shown. Investment return and principal value will fluctuate, and you may have a gain or a loss when you sell your shares. Performance assumes reinvestment of distributions and does not account for taxes. Returns at POP reflect a maximum sales charge of 5.25% . For the most recent month-end performance, visit www.putnam.com. For a portion of the period, this fund limited expenses, without which returns would have been lower. A 1% short-term trading fee may apply.
6
Report from the fund managers
The period in review
Falling oil prices contributed to a less robust environment for natural resources stocks during the six months ended February, 28, 2007 — the first half of Putnam Global Natural Resources Fund’s 2007 fiscal year. In addition, prices of many metals dropped substantially during the first five months of the period, reflecting higher inventories and fears of a global economic slowdown. By the close of the reporting period, however, energy and metals prices had recovered somewhat, reflecting what we believe is the start of an inventory downtrend. While the fund posted positive returns based on results at net asset value (NAV, or without sales charges), it could not keep pace with its benchmark, the S&P 500 Index, which is diversified across all sectors of the U.S. economy. However, the fund did outperform the average return for its Lipper peer group, Natural Resources Funds, for the six-month period. We think this favorable result is due to the fund’s global expos ure and its ability to invest more broadly in the natural resources sector than many of its peers, which often focus on a single commodity such as energy or metals. We take full advantage of this investment flexibility, because we believe it offers the potential for more competitive returns over time.
Market overview
Global stock markets rallied during the six-month reporting period until February, when concerns about global economic growth triggered a sharp sell-off. Up until that point, the markets had flourished, bolstered by strong corporate profits, the Federal Reserve’s (the Fed’s) pause in its program of interest-rate increases, and a benign macroeconomic environment of solid growth and relatively mild inflation worldwide. During the period, U.S. equity markets periodically grappled with various worries, but overcame them to post healthy gains prior to the correction. The price of oil remained an important issue, as threats to supplies from Iran, Nigeria, and Venezuela and the specter of production cuts by OPEC contributed to price swings. A weaker housing market in the
7
United States also influenced market sentiment, while the Fed’s intentions and actions added to investors’ uncertainty. Despite these issues, the frequent news of mergers and acquisitions and generally positive corporate earnings news helped investors maintain a bias toward optimism, driving the S&P 500 index to its highest level in six years before reversing course in February.
Against a generally favorable global economic backdrop, all sectors of the equity market delivered positive returns for the six-month period. However, international stocks outperformed domestic stocks. Small-company and midsize-company stocks continued to surpass large-company stocks, and value stocks outpaced growth stocks.
Strategy overview
As a rule, we look for what we consider attractive natural resources stocks across a broad investment universe. The fund may invest in domestic and international markets, and in growth or value stocks, depending on our assessment of where the best opportunities exist. In general, though, we target stocks that appear undervalued relative to the company’s assets, cash flow generation, and growth potential. We also consider financial strength and quality of management when selecting stocks that we believe have significant upside potential. Our industry emphasis shifts over time as we see opportunities change with market cycles and world events.
During the period, we maintained a substantial exposure to stocks of metals
Market sector performance
These indexes provide an overview of performance in different market sectors for the six months ended 2/28/07.
| Equities | |
| S&P 500 Index (broad stock market) | 8.93% |
|
| Russell 1000 Growth Index (large-company growth stocks) | 9.54% |
|
| Russell 1000 Value Index (large-company value stocks) | 9.82% |
|
| MSCI World Index (global stocks) | 10.38% |
|
| Bonds | |
| Lehman Aggregate Bond Index (broad bond market) | 3.66% |
|
| Lehman Municipal Bond Index (tax-exempt bonds) | 2.89% |
|
| Lehman Global Aggregate Bond Index (international bonds) | 3.12% |
|
8
companies, because demand in this sector continued to outpace supply. Also, in our opinion, stock valuations in this industry had been quite attractive, particularly for steel companies. Within the energy sector, we have maintained meaningful positions in the oilfield services, drilling, and energy-related construction sub-sectors. Given the very tight supply-demand dynamics for oil and natural gas, we believe that companies involved in building the infrastructure necessary to extract, distribute, and transport energy will continue to benefit. We increased exposure to selected North American exploration and production companies, where we felt that stock prices were reflecting unsustainably low long-term natural gas prices. Throughout the period, we maintained a smaller-than-benchmark position in the paper and packaging industry because of the excess supply of this commodity in the market. The fund’s holdings in the chemical sector cont inue to emphasize specialty chemical companies that we consider attractively valued, while exposure to commodity chemicals stocks remains limited.
Your fund’s holdings
Two of the fund’s best-performing stocks for the six-month period were in the metals sector. United States Steel benefited from a considerable rise in steel prices during the period. We had anticipated that the blast furnaces
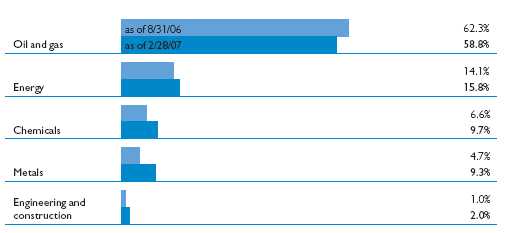
Comparison of top industry weightings
This chart shows how the fund’s top weightings have changed over the last six months. Weightings are shown as a percentage of net assets. Holdings will vary over time.
9
essential to steel production would shut down at a higher-than-normal rate for maintenance, allowing steel companies to whittle down inventories during the course of 2006. This turned out to be the case, and the falling supply allowed producers to push through price increases — boosting the profits and stock price of this steel manufacturer. Australian zinc producer Zinifex also benefited from rising zinc prices until January 2007, when softer-than-expected U.S. manufacturing and housing data exerted some downward pressure on prices, and we opted to sell the position before the end of the period to preserve the fund’s gains.
Performance of energy-related stocks reflected the volatility in oil prices throughout much of the period; crude oil fell from $70 per barrel in late August 2006 to $50 per barrel in mid-January, but subsequent production cuts by OPEC drove prices back above $60 per barrel by the end of February. Natural gas prices, on the other hand, began the period at unusually low levels as a very cool summer curtailed demand. However, prices had risen nearly 40% by the end of the period.
Amid this volatility, we held energy-related stocks that we thought would be able to deliver consistent long-term performance in spite of these trends. One such holding, Hess Corp., benefited from a restructuring program that it began five years ago to lower costs and refocus its exploration efforts. Although we think
Top holdings
This table shows the fund’s top holdings, and the percentage of the fund’s net assets that each represented, as of 2/28/07. The fund’s holdings will change over time.
| Holding (percent of fund’s net assets) | Country | Industry |
|
| Exxon Mobil Corp. (10.3%) | United States | Oil and gas |
|
| BP PLC (6.7%) | United Kingdom | Oil and gas |
|
| Valero Energy Corp. (4.4%) | United States | Oil and gas |
|
| Total SA (4.0%) | France | Oil and gas |
|
| Occidental Petroleum Corp. (3.9%) | United States | Oil and gas |
|
| XTO Energy, Inc. (3.5%) | United States | Oil and gas |
|
| Devon Energy Corp. (3.5%) | United States | Oil and gas |
|
| Marathon Oil Corp. (3.4%) | United States | Oil and gas |
|
| Halliburton Co. (3.3%) | United States | Energy |
|
| Total SA ADR (3.1%) | France | Oil and gas |
|
10
Hess maintains superior production costs compared to its peers, its stock has been trading at a discount to others in this sector, and we see potential for further appreciation. Last fall, we participated in an initial public stock offering of the European refining company Petroplus Holdings, which, in our estimation, came to market at a discounted valuation compared to other refiners in Europe. We believe Petroplus will benefit from economies of scale as it integrates recent purchases of other refineries into its existing operations. The stock has already appreciated in response to strong profit margins from its refining franchise and we sold the fund’s position at a profit shortly after the end of the period.
A handful of companies in the energy and energy-services sectors performed below expectations. BJ Services, which provides pressure-pumping services to extract natural gas, has felt the pinch of lower prices. Gas producers who utilize this company’s services have scaled back their operations until the current abundance of supply is absorbed by the market. The stock of integrated oil producer BP suffered from the early retirement of its CEO, settlements related to its Texas City Refinery explosion in 2005, and a series of operational difficulties. We viewed these setbacks as temporary and took advantage of the depressed stock price to add the fund’s position. We think BP is poised to deliver industry-leading production growth over the next few years. Finally, the stock of Norwegian oil producer Statoil ASA declined following its bid to acquire Norsk Hydro, another Norwegian oil company, as the merger was not initially favored by investors. In our opinion, this merger, which is expected to gain shareholder approval in late 2007, has the potential to result in substantial cost savings and logistics optimization that will ultimately benefit Statoil. Consequently, we have been taking advantage of the price decline to increase the fund’s position.
While the larger, more established oil and natural gas producers are domiciled in the United States and Europe, much of the world’s supply of raw materials is located outside these two markets, particularly in developing countries. We believe timely identification of natural resources companies poised to benefit from the modernization of China’s and India’s economies can provide significant growth potential for the fund. We think the fund’s investments in the two Russian oil producers Gazprom and Lukoil, as well as the coal producer China Shenhua Energy, exemplify some of the most promising opportunities in the energy and basic materials sectors at this time.
Please note that the holdings discussed in this report may not have been held by the fund for the entire period. Portfolio composition is subject to review in accordance with the fund’s investment strategy and may vary in the future.
11
The outlook for your fund
The following commentary reflects anticipated developments that could affect your fund over the next six months, as well as your management team’s plans for responding to them.
We expect to see continued strength in the oil/natural gas and metals markets during the remainder of the fund’s 2007 fiscal year. Oil and gas prices are likely to remain above historical norms, because of tight supply-and-demand dynamics. However, as production in new supply area increases, we think two companies in which the fund invests — Saipem (Italy) and Chiyoda (Japan) — have the potential to prosper. U.S. drilling companies also look compelling to us, and we expect to benefit from the potential for a strong ramping up in day rates in 2007 and 2008 as well as prospects for consolidation.
We also think investors have been overly pessimistic about the outlook for natural gas as a result of higher inventories in North America and Europe. In our estimations, investors’ dim view of this sector is creating some attractive opportunities. We believe the current supply surplus is weather related and will be absorbed by decreases in production as producers curtail production, especially in the higher-cost regions like the U.S. Rockies and Western Canada. We expect natural gas prices will remain volatile over the near term and be driven by changes in winter weather. However, we also anticipate that they will eventually trade back toward parity with crude oil. In the metals market, we think concerns about a slowdown in demand for copper and aluminum have been overblown and expect higher-than-average pricing for both commodities to continue over the near term. In the steel market, we expect fundamentals to continue to improve in 2007, as healthy global demand for this metal should allow producers to continue to raise prices as we move through the year.
We plan to keep the portfolio’s current emphasis on stocks from the oil and gas-related industries, while maintaining exposure to the metals, chemical, paper, building materials, and aggregate industries for strategic diversification. As always, we will keep a close eye on valuations to ensure that the stocks in the portfolio are trading at prices that remain reasonable relative to earnings prospects.
The views expressed in this report are exclusively those of Putnam Management. They are not meant as investment advice.
International investing involves certain risks, such as currency fluctuations, economic instability, and political developments. Additional risks may be associated with emerging-market securities, including illiquidity and volatility. The fund invests some or all of its assets in small and/or midsize companies. Such investments increase the risk of greater price fluctuations. The fund invests in fewer issuers or concentrates its investments by region or sector, and involves more risk than a fund that invests more broadly.
12
Your fund’s performance
This section shows your fund’s performance for periods ended February 28, 2007, the end of the first half of its current fiscal year. In accordance with regulatory requirements for mutual funds, we also include performance as of the most recent calendar quarter-end and expense information taken from the fund’s current prospectus. Performance should always be considered in light of a fund’s investment strategy. Data represents past performance. Past performance does not guarantee future results. More recent returns may be less or more than those shown. Investment return and principal value will fluctuate, and you may have a gain or a loss when you sell your shares. For the most recent month-end performance, please visit www.putnam.com or call Putnam at 1-800-225-1581. Class Y shares are generally only available to corporate and institutional clients. See the Terms and Definitions section in this report for definitions of the share classes offered by yo ur fund.
| Fund performance | | | | | | | | |
| | | | | | | | |
| Total return for periods ended 2/28/07 | | | | | | | |
|
| |
| | Class A | | Class B | | Class C | | Class M | | Class R | Class Y |
| (inception dates) | (7/24/80) | | (2/1/94) | | (7/26/99) | | (7/3/95) | | (12/1/03) | (10/4/05) |
| | NAV | POP | NAV | CDSC | NAV | CDSC | NAV | POP | NAV | NAV |
|
| Annual average | | | | | | | | | | |
| (life of fund) | 9.00% | 8.78% | 8.11% | 8.11% | 8.13% | 8.13% | 8.38% | 8.24% | 8.73% | 9.02% |
|
| 10 years | 221.86 | 205.02 | 198.37 | 198.37 | 198.66 | 198.66 | 205.69 | 195.72 | 214.21 | 223.07 |
| Annual average | 12.40 | 11.80 | 11.55 | 11.55 | 11.56 | 11.56 | 11.82 | 11.45 | 12.13 | 12.44 |
|
| 5 years | 136.67 | 124.27 | 127.91 | 125.91 | 127.88 | 127.88 | 130.82 | 123.35 | 133.87 | 137.56 |
| Annual average | 18.80 | 17.53 | 17.91 | 17.70 | 17.91 | 17.91 | 18.21 | 17.43 | 18.52 | 18.89 |
|
| 3 years | 94.41 | 84.20 | 90.09 | 87.09 | 90.07 | 90.07 | 91.49 | 85.30 | 92.98 | 95.14 |
| Annual average | 24.81 | 22.58 | 23.88 | 23.22 | 23.87 | 23.87 | 24.18 | 22.83 | 24.50 | 24.96 |
|
| 1 year | 13.26 | 7.32 | 12.44 | 7.44 | 12.44 | 11.44 | 12.73 | 9.07 | 12.95 | 13.56 |
|
| 6 months | 5.81 | 0.27 | 5.38 | 0.67 | 5.41 | 4.47 | 5.54 | 2.10 | 5.69 | 5.92 |
|
Performance assumes reinvestment of distributions and does not account for taxes. Returns at public offering price (POP) for class A and M shares reflect a maximum sales charge of 5.25% and 3.25%, respectively. Class B share returns reflect the applicable contingent deferred sales charge (CDSC), which is 5% in the first year, declining to 1% in the sixth year, and is eliminated thereafter. Class C shares reflect a 1% CDSC for the first year and is eliminated thereafter. Class R and Y shares have no initial sales charge or CDSC. Performance for class B, C, M, R, and Y shares before their inception is derived from the historical performance of class A shares, adjusted for the applicable sales charge (or CDSC) and, except for class Y shares, the higher operating expenses for such shares.
For a portion of the period, this fund limited expenses, without which returns would have been lower.
A 1% short-term trading fee may be applied to shares exchanged or sold within 90 days of purchase.
13
Comparative index returns
For periods ended 2/28/07
| | | Lipper Natural |
| | S&P 500 | Resources Funds |
| | Index | category average* |
|
| Annual average |
| (life of fund) | 12.84% | 8.76% |
|
| 10 years | 108.64 | 258.76 |
| Annual average | 7.63 | 13.41 |
|
| 5 years | 39.06 | 158.24 |
| Annual average | 6.82 | 20.38 |
|
| 3 years | 29.84 | 96.33 |
| Annual average | 9.10 | 25.07 |
|
| 1 year | 11.97 | 10.48 |
|
| 6 months | 8.93 | 4.49 |
|
Index and Lipper results should be compared to fund performance at net asset value.
* Over the 6-month and 1-, 3-, 5-, and 10-year periods ended 2/28/07, there were 133, 113, 86, 73, and 36 funds, respectively, in this Lipper category.
Fund price and distribution information
For the six-month period ended 2/28/07
| Distributions* | Class A | Class B | Class C | Class M | Class R | Class Y |
|
| Number | 1 | 1 | 1 | 1 | 1 | 1 |
|
| Income | $0.539 | $0.266 | $0.267 | $0.382 | $0.488 | $0.618 |
|
| Capital gains | | | | | | |
|
| Long-term | 1.940 | 1.940 | 1.940 | 1.940 | 1.940 | 1.940 |
|
| Short-term | 1.187 | 1.187 | 1.187 | 1.187 | 1.187 | 1.187 |
|
| Total | $3.666 | $3.393 | $3.394 | $3.509 | $3.615 | $3.745 |
|
| Share value: | NAV | POP | NAV | NAV | NAV | POP | NAV | NAV |
|
| 8/31/06 | $31.31 | $33.04 | $29.48 | $29.90 | $30.55 | $31.58 | $31.09 | $31.38 |
|
| 2/28/07 | 29.54 | 31.18 | 27.75 | 28.20 | 28.81 | 29.78 | 29.32 | 29.57 |
|
* Dividend sources are estimated and may vary based on final tax calculations after the fund’s fiscal year-end.
14
Fund performance as of most recent calendar quarter
Total return for periods ended 3/31/07
| | Class A | | Class B | | Class C | | Class M | | Class R | Class Y |
|
| (inception dates) | (7/24/80) | | (2/1/94) | | (7/26/99) | | (7/3/95) | | (12/1/03) | (10/4/05) |
|
| | NAV | POP | NAV | CDSC | NAV | CDSC | NAV | POP | NAV | NAV |
|
| Annual average | | | | | | | | | | |
| (life of fund) | 9.20% | 8.98% | 8.30% | 8.30% | 8.32% | 8.32% | 8.57% | 8.43% | 8.93% | 9.21% |
|
| 10 years | 240.94 | 223.07 | 216.05 | 216.05 | 216.26 | 216.26 | 223.80 | 213.36 | 232.75 | 242.20 |
| Annual average | 13.05 | 12.44 | 12.20 | 12.20 | 12.20 | 12.20 | 12.47 | 12.10 | 12.77 | 13.09 |
|
| 5 years | 132.85 | 120.68 | 124.22 | 122.22 | 124.21 | 124.21 | 126.88 | 119.47 | 130.11 | 133.71 |
| Annual average | 18.42 | 17.15 | 17.53 | 17.32 | 17.53 | 17.53 | 17.80 | 17.02 | 18.14 | 18.50 |
|
| 3 years | 107.04 | 96.17 | 102.46 | 99.46 | 102.48 | 102.48 | 103.91 | 97.27 | 105.57 | 107.81 |
| Annual average | 27.45 | 25.18 | 26.51 | 25.88 | 26.51 | 26.51 | 26.81 | 25.42 | 27.15 | 27.61 |
|
| 1 year | 14.16 | 8.16 | 13.30 | 8.30 | 13.29 | 12.29 | 13.59 | 9.89 | 13.91 | 14.46 |
|
| 6 months | 16.48 | 10.34 | 16.03 | 11.03 | 16.01 | 15.01 | 16.19 | 12.43 | 16.35 | 16.63 |
|
Fund’s annual operating expenses
For the fiscal year ended 8/31/06
| | Class A | Class B | Class C | Class M | Class R | Class Y |
|
| Total annual fund | | | | | | |
| operating expenses | 1.21% | 1.96% | 1.96% | 1.71% | 1.46% | 0.96% |
|
Expense information in this table may differ from that shown in the next section and in the financial highlights of this report.
15
Your fund’s expenses
As a mutual fund investor, you pay ongoing expenses, such as management fees, distribution fees (12b-1 fees), and other expenses. In the most recent six-month period, your fund limited these expenses; had it not done so, expenses would have been higher. Using the information below, you can estimate how these expenses affect your investment and compare them with the expenses of other funds. You may also pay one-time transaction expenses, including sales charges (loads) and redemption fees, which are not shown in this section and would have resulted in higher total expenses. For more information, see your fund’s prospectus or talk to your financial advisor.
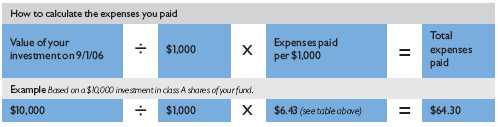
Review your fund’s expenses
The table below shows the expenses you would have paid on a $1,000 investment in Putnam Global Natural Resources Fund from September 1, 2006, to February 28, 2007. It also shows how much a $1,000 investment would be worth at the close of the period, assuming actual returns and expenses.
| | Class A | Class B | Class C | Class M | Class R | Class Y |
|
| Expenses paid per $1,000* | $ 6.43 | $ 10.24 | $ 10.24 | $ 8.97 | $ 7.70 | $ 5.16 |
|
| Ending value (after expenses) | $1,058.10 | $1,053.80 | $1,054.10 | $1,055.40 | $1,056.90 | $1,059.20 |
|
* Expenses for each share class are calculated using the fund’s annualized expense ratio for each class, which represents the ongoing expenses as a percentage of average net assets for the six months ended 2/28/07. The expense ratio may differ for each share class (see the last table in this section). Expenses are calculated by multiplying the expense ratio by the average account value for the period; then multiplying the result by the number of days in the period; and then dividing that result by the number of days in the year.
Estimate the expenses you paid
To estimate the ongoing expenses you paid for the six months ended February 28, 2007, use the calculation method below. To find the value of your investment on September 1, 2006, go to www.putnam.com and log on to your account. Click on the “Transaction History” tab in your Daily Statement and enter 09/01/2006 in both the “from” and “to” fields. Alternatively, call Putnam at 1-800-225-1581.
16
Compare expenses using the SEC’s method
The Securities and Exchange Commission (SEC) has established guidelines to help investors assess fund expenses. Per these guidelines, the table below shows your fund’s expenses based on a $1,000 investment, assuming a hypothetical 5% annualized return. You can use this information to compare the ongoing expenses (but not transaction expenses or total costs) of investing in the fund with those of other funds. All mutual fund shareholder reports will provide this information to help you make this comparison. Please note that you cannot use this information to estimate your actual ending account balance and expenses paid during the period.
| | Class A | Class B | Class C | Class M | Class R | Class Y |
|
| Expenses paid per $1,000* | $ 6.31 | $ 10.04 | $ 10.04 | $ 8.80 | $ 7.55 | $ 5.06 |
|
| Ending value (after expenses) | $1,018.55 | $1,014.83 | $1,014.83 | $1,016.07 | $1,017.31 | $1,019.79 |
|
* Expenses for each share class are calculated using the fund’s annualized expense ratio for each class, which represents the ongoing expenses as a percentage of average net assets for the six months ended 2/28/07. The expense ratio may differ for each share class (see the last table in this section). Expenses are calculated by multiplying the expense ratio by the average account value for the period; then multiplying the result by the number of days in the period; and then dividing that result by the number of days in the year.
Compare expenses using industry averages
You can also compare your fund’s expenses with the average of its peer group, as defined by Lipper, an independent fund-rating agency that ranks funds relative to others that Lipper considers to have similar investment styles or objectives. The expense ratio for each share class shown below indicates how much of your fund’s average net assets have been used to pay ongoing expenses during the period.
| | Class A | Class B | Class C | Class M | Class R | Class Y |
|
| Your fund’s annualized | | | | | | |
| expense ratio | 1.26% | 2.01% | 2.01% | 1.76% | 1.51% | 1.01% |
|
| Average annualized expense | | | | | | |
| ratio for Lipper peer group* | 1.43% | 2.18% | 2.18% | 1.93% | 1.68% | 1.18% |
|
* Simple average of the expenses of all front-end load funds in the fund’s Lipper peer group, calculated in accordance with Lipper’s standard method for comparing fund expenses (excluding 12b-1 fees and without giving effect to any expense offset and brokerage service arrangements that may reduce fund expenses). This average reflects each fund’s expenses for its most recent fiscal year available to Lipper as of 12/31/06. To facilitate comparison, Putnam has adjusted this average to reflect the 12b-1 fees carried by each class of shares other than class Y shares, which do not incur 12b-1 fees. The peer group may include funds that are significantly smaller or larger than the fund, which may limit the comparability of the fund’s expenses to the simple average, which typically is higher than the asset-weighted average.
17
Your fund’s
portfolio turnover
Putnam funds are actively managed by teams of experts who buy and sell securities based on intensive analysis of companies, industries, economies, and markets. Portfolio turnover is a measure of how often a fund’s managers buy and sell securities for your fund. A portfolio turnover of 100%, for example, means that the managers sold and replaced securities valued at 100% of a fund’s assets within a one-year period. Funds with high turnover may be more likely to generate capital gains and dividends that must be distributed to shareholders as taxable income. High turnover may also cause a fund to pay more brokerage commissions and other transaction costs, which may detract from performance.
Turnover comparisons
Percentage of holdings that change every year
| | 2006 | 2005 | 2004 | 2003 | 2002 |
|
| Putnam Global Natural | | | | | |
| Resources Fund | 56% | 81% | 74% | 131% | 138% |
|
| Lipper Natural Resources Funds | | | | | |
| category average | 127% | 136% | 236% | 299% | 309% |
|
Turnover data for the fund is calculated based on the fund’s fiscal-year period, which ends on August 31. Turnover data for the fund’s Lipper category is calculated based on the average of the turnover of each fund in the category for its fiscal year ended during the indicated year. Fiscal years vary across funds in the Lipper category, which may limit the comparability of the fund’s portfolio turnover rate to the Lipper average. Comparative data for 2006 is based on information available as of 12/31/06.
18
Your fund’s risk
This risk comparison is designed to help you understand how your fund compares with other funds. The comparison utilizes a risk measure developed by Morningstar, an independent fund-rating agency. This risk measure is referred to as the fund’s Morningstar Risk.
Your fund’s Morningstar® Risk
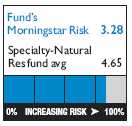
Your fund’s Morningstar Risk is shown alongside that of the average fund in its Morningstar category. The risk bar broadens the comparison by translating the fund’s Morningstar Risk into a percentile, which is based on the fund’s ranking among all funds rated by Morningstar as of March 31, 2007. A higher Morningstar Risk generally indicates that a fund’s monthly returns have varied more widely.
Morningstar determines a fund’s Morningstar Risk by assessing variations in the fund’s monthly returns — with an emphasis on downside variations — over a 3-year period, if available. Those measures are weighted and averaged to produce the fund’s Morningstar Risk. The information shown is provided for the fund’s class A shares only; information for other classes may vary. Morningstar Risk is based on historical data and does not indicate future results. Morningstar does not purport to measure the risk associated with a current investment in a fund, either on an absolute basis or on a relative basis. Low Morningstar Risk does not mean that you cannot lose money on an investment in a fund. Copyright 2007 Morningstar, Inc. All Rights Reserved. The information contained herein (1) is proprietary to Morningstar and/or its content providers; (2) may not be copied or distributed; and (3) is not warranted to be accurate, complete, or timely. Neither Morningstar nor its content providers are responsible for any damages or losses arising from any use of this information.
19
Your fund’s management
Your fund is managed by the members of the Putnam Global Equity Research Team. Maria Elena Drew and Christopher O’Malley are the Portfolio Leaders of your fund. The Portfolio Leaders coordinate the team’s management of the fund.
Investment team fund ownership
The table below shows how much the fund’s current Portfolio Leaders have invested in the fund and in all Putnam mutual funds (in dollar ranges). Information shown is as of February 28, 2007, and February 28, 2006.

Trustee and Putnam employee fund ownership
As of February 28, 2007, all of the Trustees of the Putnam funds owned fund shares. The table below shows the approximate value of investments in the fund and all Putnam funds as of that date by the Trustees and Putnam employees. These amounts include investments by the Trustees’ and employees’ immediate family members and investments through retirement and deferred compensation plans.
| | | Total assets in |
| | Assets in the fund | all Putnam funds |
|
| Trustees | $ 432,000 | $101,000,000 |
|
| Putnam employees | $5,617,000 | $459,000,000 |
|
20
Fund manager compensation
The total 2006 fund manager compensation that is attributable to your fund is approximately $860,000. This amount includes a portion of 2006 compensation paid by Putnam Management to the fund managers listed in this section for their portfolio management responsibilities, calculated based on the fund assets they manage taken as a percentage of the total assets they manage. The compensation amount also includes a portion of the 2006 compensation paid to the Chief Investment Officers of the team and the Group Chief Investment Officer of the fund’s broader investment category for their oversight responsibilities, calculated based on the fund assets they oversee taken as a percentage of the total assets they oversee. This amount does not include compensation of other personnel involved in research, trading, administration, systems, compliance, or fund operations; nor does it include non-compensation costs. These percentages are determined as of the fund’s fiscal period-end. For personnel who joined Putnam Management during or after 2006, the calculation reflects annualized 2006 compensation or an estimate of 2007 compensation, as applicable.
Other Putnam funds managed by the Portfolio Leaders
Maria Elena Drew and Christopher O’Malley are not Portfolio Leaders or Portfolio Members of any other Putnam funds. They may, however, also manage other accounts and variable trust funds advised by Putnam Management or an affiliate.
Changes in your fund’s Portfolio Leaders
Your fund’s Portfolio Leaders did not change during the year ended February 28, 2007.
21
Putnam fund ownership by Putnam’s Executive Board
The table below shows how much the members of Putnam’s Executive Board have invested in all Putnam mutual funds (in dollar ranges). Information shown is as of February 28, 2007, and February 28, 2006.
| | | | $1 – | $10,001 – | $50,001 – | $100,001 – | $500,001 – | $1,000,001 |
| | Year | $0 | $10,000 | $50,000 | $100,000 | $500,000 | $1,000,000 | and over |
|
| Philippe Bibi | 2007 | | | | | | | • |
|
|
| Chief Technology Officer | 2006 | | | | | | | • |
|
| Joshua Brooks | 2007 | | | | | | | • |
|
|
| Deputy Head of Investments | 2006 | | | | | | | • |
|
| William Connolly | 2007 | | | | | | | • |
|
|
| Head of Retail Management | 2006 | | | | | | | • |
|
| Kevin Cronin | 2007 | | | | | | | • |
|
|
| Head of Investments | 2006 | | | | | | | • |
|
| Charles Haldeman, Jr. | 2007 | | | | | | | • |
|
|
| President and CEO | 2006 | | | | | | | • |
|
| Amrit Kanwal | 2007 | | | | | | • | |
|
|
| Chief Financial Officer | 2006 | | | | | • | | |
|
| Steven Krichmar | 2007 | | | | | | | • |
|
|
| Chief of Operations | 2006 | | | | | | • | |
|
| Francis McNamara, III | 2007 | | | | | | | • |
|
|
| General Counsel | 2006 | | | | | | | • |
|
| Jeffrey Peters | 2007 | | | | | | | • |
|
|
| Head of International Business | N/A | | | | | | | |
|
| Richard Robie, III | 2007 | | | | | | • | |
|
|
| Chief Administrative Officer | 2006 | | | | | | • | |
|
| Edward Shadek | 2007 | | | | | | | • |
|
|
| Deputy Head of Investments | 2006 | | | | | | | • |
|
| Sandra Whiston | 2007 | | | | | | | • |
|
|
| Head of Institutional Management | 2006 | | | | | | • | |
|
N/A indicates the individual was not a member of Putnam’s Executive Board as of 2/28/06.
22
Terms and definitions
Important terms
Total return shows how the value of the fund’s shares changed over time, assuming you held the shares through the entire period and reinvested all distributions in the fund.
Net asset value (NAV) is the price, or value, of one share of a mutual fund, without a sales charge. NAVs fluctuate with market conditions. NAV is calculated by dividing the net assets of each class of shares by the number of outstanding shares in the class.
Public offering price (POP) is the price of a mutual fund share plus the maximum sales charge levied at the time of purchase. POP performance figures shown here assume the 5.25% maximum sales charge for class A shares and 3.25% for class M shares.
Contingent deferred sales charge (CDSC) is generally a charge applied at the time of the redemption of class B or C shares and assumes redemption at the end of the period. Your fund’s class B CDSC declines from a 5% maximum during the first year to 1% during the sixth year. After the sixth year, the CDSC no longer applies. The CDSC for class C shares is 1% for one year after purchase.
Share classes
Class A shares are generally subject to an initial sales charge and no CDSC (except on certain redemptions of shares bought without an initial sales charge).
Class B shares are not subject to an initial sales charge. They may be subject to a CDSC.
Class C shares are not subject to an initial sales charge and are subject to a CDSC only if the shares are redeemed during the first year.
Class M shares have a lower initial sales charge and a higher 12b-1 fee than class A shares and no CDSC (except on certain redemptions of shares bought without an initial sales charge).
Class R shares are not subject to an initial sales charge or CDSC and are available only to certain defined contribution plans.
Class Y shares are not subject to an initial sales charge or CDSC, and carry no 12b-1 fee. They are only available to eligible purchasers, including eligible defined contribution plans or corporate IRAs.
23
Comparative indexes
Lehman Aggregate Bond Index is an unmanaged index of U.S. investment-grade fixed-income securities.
Lehman Global Aggregate Bond Index is an unmanaged index of global investment-grade fixed-income securities.
Lehman Municipal Bond Index is an unmanaged index of long-term fixed-rate investment-grade tax-exempt bonds.
Morgan Stanley Capital International (MSCI) World Index is an unmanaged index of equity securities from developed countries.
Russell 1000 Growth Index is an unmanaged index of those companies in the large-cap Russell 1000 Index chosen for their growth orientation.
Russell 1000 Value Index is an unmanaged index of those companies in the large-cap Russell 1000 Index chosen for their value orientation.
S&P 500 Index is an unmanaged index of common stock performance.
Indexes assume reinvestment of all distributions and do not account for fees. Securities and performance of a fund and an index will differ. You cannot invest directly in an index.
Lipper is a third-party industry-ranking entity that ranks mutual funds. Its rankings do not reflect sales charges. Lipper rankings are based on total return at net asset value relative to other funds that have similar current investment styles or objectives as determined by Lipper. Lipper may change a fund’s category assignment at its discretion. Lipper category averages reflect performance trends for funds within a category.
24
Trustee approval of
management contract
General conclusions
The Board of Trustees of the Putnam funds oversees the management of each fund and, as required by law, determines annually whether to approve the continuance of your fund’s management contract with Putnam Management. In this regard, the Board of Trustees, with the assistance of its Contract Committee consisting solely of Trustees who are not “interested persons” (as such term is defined in the Investment Company Act of 1940, as amended) of the Putnam funds (the “Independent Trustees”), requests and evaluates all information it deems reasonably necessary under the circumstances. Over the course of several months ending in June 2006, the Contract Committee met four times to consider the information provided by Putnam Management and other information developed with the assistance of the Board’s independent counsel and independent staff. The Contract Committee reviewed and discussed key aspects of this information with all of the Independe nt Trustees. Upon completion of this review, the Contract Committee recommended, and the Independent Trustees approved, the continuance of your fund’s management contract, effective July 1, 2006.
This approval was based on the following conclusions:
• That the fee schedule in effect for your fund represented reasonable compensation in light of the nature and quality of the services being provided to the fund, the fees paid by competitive funds and the costs incurred by Putnam Management in providing such services, and
• That such fee schedule represented an appropriate sharing between fund shareholders and Putnam Management of such economies of scale as may exist in the management of the fund at current asset levels.
These conclusions were based on a comprehensive consideration of all information provided to the Trustees and were not the result of any single factor. Some of the factors that figured particularly in the Trustees’ deliberations and how the Trustees considered these factors are described below, although individual Trustees may have evaluated the information presented differently, giving different weights to various factors. It is also important to recognize that the fee arrangements for your fund and the other Putnam funds are the result of many years of review and discussion between the Independent Trustees and Putnam Management, that certain aspects of such arrangements may receive greater scrutiny in some years than others, and that the Trustees’ conclusions may be based, in part, on their consideration of these same arrangements in prior years.
25
Management fee schedules and categories; total expenses
The Trustees reviewed the management fee schedules in effect for all Putnam funds, including fee levels and breakpoints, and the assignment of funds to particular fee categories. In reviewing fees and expenses, the Trustees generally focused their attention on material changes in circumstances — for example, changes in a fund’s size or investment style, changes in Putnam Management’s operating costs, or changes in competitive practices in the mutual fund industry — that suggest that consideration of fee changes might be warranted. The Trustees concluded that the circumstances did not warrant changes to the management fee structure of your fund, which had been carefully developed over the years, re-examined on many occasions and adjusted where appropriate. The Trustees focused on two areas of particular interest, as discussed further below:
• Competitiveness. The Trustees reviewed comparative fee and expense information for competitive funds, which indicated that, in a custom peer group of competitive funds selected by Lipper Inc., your fund ranked in the 36th percentile in management fees and in the 7th percentile in total expenses (less any applicable 12b-1 fees) as of December 31, 2005 (the first percentile being the least expensive funds and the 100th percentile being the most expensive funds). (Because the fund’s custom peer group is smaller than the fund’s broad Lipper Inc. peer group, this expense information may differ from the Lipper peer expense information found elsewhere in this report.) The Trustees noted that expense ratios for a number of Putnam funds, which show the percentage of fund assets used to pay for management and administrative services, distribution (12b-1) fees and other expenses, had been increasing recently as a result of declining net assets and the natural operation of fee breakpoints.
The Trustees noted that the expense ratio increases described above were currently being controlled by expense limitations implemented in January 2004 and which Putnam Management, in consultation with the Contract Committee, has committed to maintain at least through 2007. These expense limitations give effect to a commitment by Putnam Management that the expense ratio of each open-end fund would be no higher than the average expense ratio of the competitive funds included in the fund’s relevant Lipper universe (exclusive of any applicable 12b-1 charges in each case). The Trustees observed that this commitment to limit fund expenses has served shareholders well since its inception. In order to ensure that the expenses of the Putnam funds continue to meet evolving competitive standards, the Trustees requested, and Putnam Management agreed, to implement an additional expense limitation for certain funds for the twelve months beginning January 1, 2007 equal to the average expense ratio (exclusive of 12b-1 charges) of a custom peer group of competitive funds selected by Lipper based on the size of the fund. This additional expense limitation will be applied to those open-end funds that had above-average expense ratios (exclusive of 12b-1 charges) based on the Lipper custom peer group data for the period ended December 31, 2005. This additional expense limitation will not be applied to your fund.
26
• Economies of scale. Your fund currently has the benefit of breakpoints in its management fee that provide shareholders with significant economies of scale, which means that the effective management fee rate of a fund (as a percentage of fund assets) declines as a fund grows in size and crosses specified asset thresholds. Conversely, as a fund shrinks in size — as has been the case for many Putnam funds in recent years — these breakpoints result in increasing fee levels. In recent years, the Trustees have examined the operation of the existing breakpoint structure during periods of both growth and decline in asset levels. The Trustees concluded that the fee schedules in effect for the funds represented an appropriate sharing of economies of scale at current asset levels. In reaching this conclusion, the Trustees considered the Contract Committee’s stated intent to continue to work with Putnam Management to plan for an eventual resumption in the growth of assets, including a study of potential economies that might be produced under various growth assumptions.
In connection with their review of the management fees and total expenses of the Putnam funds, the Trustees also reviewed the costs of the services to be provided and profits to be realized by Putnam Management and its affiliates from the relationship with the funds. This information included trends in revenues, expenses and profitability of Putnam Management and its affiliates relating to the investment management and distribution services provided to the funds. In this regard, the Trustees also reviewed an analysis of Putnam Management’s revenues, expenses and profitability with respect to the funds’ management contracts, allocated on a fund-by-fund basis. Because many of the costs incurred by Putnam Management in managing the funds are not readily identifiable to particular funds, the Trustees observed that the methodology for allocating costs is an important factor in evaluating Putnam Management’s costs and profitability, both as to the Putnam funds in the aggregate and as to individual funds. The Trustees reviewed Putnam Management’s cost allocation methodology with the assistance of independent consultants and concluded that this methodology was reasonable and well-considered.
Investment performance
The quality of the investment process provided by Putnam Management represented a major factor in the Trustees’ evaluation of the quality of services provided by Putnam Management under your fund’s management contract. The Trustees were assisted in their review of the Putnam funds’ investment process and performance by the work of the Investment Process Committee of the Trustees and the Investment Oversight Committees of the Trustees, which meet on a regular monthly basis with the funds’ portfolio teams throughout the year. The Trustees concluded that Putnam Management generally provides a high-quality investment process — as measured by the experience and skills of the individuals assigned to the management of fund portfolios, the resources made available to such personnel, and in general the ability of Putnam Management to attract and retain high-quality personnel — but also recognize that this does not guarantee favorable investment results for every fund in every time period. The Trustees considered the investment performance of each fund over multiple time periods
27
and considered information comparing each fund’s performance with various benchmarks and with the performance of competitive funds.
The Trustees noted the satisfactory investment performance of many Putnam funds. They also noted the disappointing investment performance of certain funds in recent years and discussed with senior management of Putnam Management the factors contributing to such underperfor-mance and actions being taken to improve performance. The Trustees recognized that, in recent years, Putnam Management has made significant changes in its investment personnel and processes and in the fund product line to address areas of underperformance. In particular, they noted the important contributions of Putnam Management’s leadership in attracting, retaining and supporting high-quality investment professionals and in systematically implementing an investment process that seeks to merge the best features of fundamental and quantitative analysis. The Trustees indicated their intention to continue to monitor performance trends to assess the effectiveness of these changes and to evaluate whether additional changes to address areas of underperformance are warranted.
In the case of your fund, the Trustees considered that your fund’s class A share cumulative total return performance at net asset value was in the following percentiles of its Lipper Inc. peer group (Lipper Natural Resources Funds) for the one-, three- and five-year periods ended March 31, 2006 (the first percentile being the best performing funds and the 100th percentile being the worst performing funds):
| One-year period | Three-year period | Five-year period |
|
| 74th | 84th | 49th |
(Because of the passage of time, these performance results may differ from the performance results for more recent periods shown elsewhere in this report. Over the one-, three- and five-year periods ended March 31, 2006, there were 101, 74, and 67 funds, respectively, in your fund’s Lipper peer group.* Past performance is no guarantee of future performance.)
The Trustees noted the disappointing performance for your fund for the three-year period ended March 31, 2006. In this regard, the Trustees considered Putnam Management’s view that relative performance suffered in part because the fund was less concentrated than some competitors in particular industries and sectors with strong performance over recent periods.
As a general matter, the Trustees concluded that cooperative efforts between the Trustees and Putnam Management represent the most effective way to address investment performance problems. The Trustees noted that investors in the Putnam funds have, in effect, placed their trust in the Putnam organization, under the oversight of the funds’ Trustees, to make appropriate decisions regarding the management of the funds. Based on the responsiveness of Putnam
* The percentile rankings for your fund’s class A share annualized total return performance in the Lipper Natural Resources Funds category for the one-, five- and ten-year periods ended March 31, 2007, were 23%, 54%, and 66%, respectively. Over the one-, five- and ten-year periods ended March 31, 2007, the fund ranked 27 out of 121, 41 out of 75, and 25 out of 37 funds, respectively. Note that this more recent information was not available when the Trustees approved the continuance of your fund’s management contract.
28
Management in the recent past to Trustee concerns about investment performance, the Trustees concluded that it is preferable to seek change within Putnam Management to address performance shortcomings. In the Trustees’ view, the alternative of terminating a management contract and engaging a new investment adviser for an underperforming fund would entail significant disruptions and would not provide any greater assurance of improved investment performance.
Brokerage and soft-dollar allocations; other benefits
The Trustees considered various potential benefits that Putnam Management may receive in connection with the services it provides under the management contract with your fund. These include benefits related to brokerage and soft-dollar allocations, whereby a portion of the commissions paid by a fund for brokerage may be used to acquire research services that may be useful to Putnam Management in managing the assets of the fund and of other clients. The Trustees indicated their continued intent to monitor the potential benefits associated with the allocation of fund brokerage to ensure that the principle of seeking “best price and execution” remains paramount in the portfolio trading process.
The Trustees’ annual review of your fund’s management contract also included the review of its distributor’s contract and distribution plan with Putnam Retail Management Limited Partnership and the custodian agreement and investor servicing agreement with Putnam Fiduciary Trust Company, all of which provide benefits to affiliates of Putnam Management.
Comparison of retail and institutional fee schedules
The information examined by the Trustees as part of their annual contract review has included for many years information regarding fees charged by Putnam Management and its affiliates to institutional clients such as defined benefit pension plans, college endowments, etc. This information included comparison of such fees with fees charged to the funds, as well as a detailed assessment of the differences in the services provided to these two types of clients. The Trustees observed, in this regard, that the differences in fee rates between institutional clients and the funds are by no means uniform when examined by individual asset sectors, suggesting that differences in the pricing of investment management services to these types of clients reflect to a substantial degree historical competitive forces operating in separate market places. The Trustees considered the fact that fee rates across all asset sectors are higher on average for funds than for institutional clients, as well as the differences between the services that Putnam Management provides to the Putnam funds and those that it provides to institutional clients of the firm, but did not rely on such comparisons to any significant extent in concluding that the management fees paid by your fund are reasonable.
29
Approval of new management and sub-management contracts in connection with pending change in control
As discussed in the “Message from the Trustees” at the beginning of this shareholder report, on February 1, 2007, Marsh & McLennan Companies, Inc. announced that it had signed a definitive agreement to sell its ownership interest in Putnam Investments Trust, the parent company of Putnam Management and its affiliates, to Great-West Lifeco Inc., a member of the Power Financial Corporation group of companies. This transaction is subject to regulatory approvals and other conditions, including the approval of new management contracts by shareholders of a substantial number of Putnam funds at shareholder meetings scheduled for May 15, 2007. Proxy solicitation materials related to these meetings, which provide detailed information regarding the transaction, were recently mailed. The transaction is currently expected to be completed by the middle of 2007.
At an in-person meeting on February 8–9, 2007, the Trustees considered the approval of new management contracts for each Putnam fund (and, in the case of your fund, a new sub-management contract) proposed to become effective upon the closing of the transaction, and the filing of a preliminary proxy statement. At an in-person meeting on March 8–9, 2007, the Trustees considered the approval of the final forms of the proposed new management contracts for each Putnam fund (and, in the case of your fund, the new sub-management contract) and the proxy statement. They reviewed the terms of the proposed new management contracts and the differences between the proposed new management contracts and the current management contracts. They noted that the terms of the proposed new management contracts were substantially identical to the current management contracts, except for certain changes developed at the initiative of the Trustees and designed largely to address inconsistencies among various of the existing contracts, which had been developed and implemented at different times in the past. They noted, in the case of your fund, that the terms of the proposed new sub-management contract were identical to the current sub-management contract, except for the effective date. In considering the approval of the proposed new management contracts (and, in the case of your fund, the new sub-management contract), the Trustees also considered, as discussed further in the proxy statement, various matters relating to the transaction. Finally, in considering the proposed new management contracts (and, in the case of your fund, the new sub-management contract), the Trustees also took into account their deliberations and conclusions (discussed above in the preceding paragraphs of the “Trustee Approval of Management Contract” section) in connection with the most recent annual approval of the continuance of the Putnam funds’ management (and, in the case of your fund, sub-management) contracts effective July 1, 2006, and the extensive materials that they had reviewed in connection with that approval process. Based upon the foregoing considerations, on March 9, 2007, the Trustees, including all of the Independent Trustees, unanimously approved the proposed new management contracts (and, in the case of your fund, the new sub-management contract) and determined to recommend their approval to the shareholders of the Putnam funds.
30
Approval of the sub-management contract between Putnam Management and Putnam Investments Limited
In September 2006, the Trustees approved a sub-management contract between Putnam Management and Putnam Investments Limited, an affiliate of Putnam Management. The Contract Committee reviewed information provided by Putnam Management and PIL and, upon completion of this review, recommended, and the Independent Trustees approved, your fund’s sub-management contract, effective September 15, 2006.
The Trustees considered numerous factors they believe relevant in approving your fund’s sub-management contract, including Putnam Management’s belief that the interest of shareholders would be best served by utilizing investment professionals in Putnam’s London office to manage a portion of your fund’s assets and PIL’s expertise in managing assets invested in European markets. The Trustees also considered that United Kingdom securities laws require a sub-advisory relationship between Putnam Management and PIL in order for Putnam’s investment professionals in London to be involved in the management of your fund. The Trustees noted that Putnam Management, and not your fund, would pay the sub-management fee to PIL for its services and that the sub-management relationship with PIL will not reduce the nature, quality or overall level of service provided to your fund.
31
Other information
for shareholders
Important notice regarding delivery of shareholder documents
In accordance with SEC regulations, Putnam sends a single copy of annual and semiannual shareholder reports, prospectuses, and proxy statements to Putnam shareholders who share the same address, unless a shareholder requests otherwise. If you prefer to receive your own copy of these documents, please call Putnam at 1-800-225-1581, and Putnam will begin sending individual copies within 30 days.
Proxy voting
Putnam is committed to managing our mutual funds in the best interests of our shareholders. The Putnam funds’ proxy voting guidelines and procedures, as well as information regarding how your fund voted proxies relating to portfolio securities during the 12-month period ended June 30, 2006, are available on the Putnam Individual Investor Web site, www.putnam.com/individual, and on the SEC’s Web site, www.sec.gov. If you have questions about finding forms on the SEC’s Web site, you may call the SEC at 1-800-SEC-0330. You may also obtain the Putnam funds’ proxy voting guidelines and procedures at no charge by calling Putnam’s Shareholder Services at 1-800-225-1581.
Fund portfolio holdings
The fund will file a complete schedule of its portfolio holdings with the SEC for the first and third quarters of each fiscal year on Form N-Q. Shareholders may obtain the fund’s Forms N-Q on the SEC’s Web site at www.sec.gov. In addition, the fund’s Forms N-Q may be reviewed and copied at the SEC’s Public Reference Room in Washington, D.C. You may call the SEC at 1-800-SEC-0330 for information about the SEC’s Web site or the operation of the Public Reference Room.
32
Financial statements
A guide to financial statements
These sections of the report, as well as the accompanying Notes, constitute the fund’s financial statements.
The fund’s portfolio lists all the fund’s investments and their values as of the last day of the reporting period. Holdings are organized by asset type and industry sector, country, or state to show areas of concentration and diversification.
Statement of assets and liabilities shows how the fund’s net assets and share price are determined. All investment and noninvestment assets are added together. Any unpaid expenses and other liabilities are subtracted from this total. The result is divided by the number of shares to determine the net asset value per share, which is calculated separately for each class of shares. (For funds with preferred shares, the amount subtracted from total assets includes the liquidation preference of preferred shares.)
Statement of operations shows the fund’s net investment gain or loss. This is done by first adding up all the fund’s earnings — from dividends and interest income — and subtracting its operating expenses to determine net investment income (or loss). Then, any net gain or loss the fund realized on the sales of its holdings — as well as any unrealized gains or losses over the period — is added to or subtracted from the net investment result to determine the fund’s net gain or loss for the fiscal period.
Statement of changes in net assets shows how the fund’s net assets were affected by the fund’s net investment gain or loss, by distributions to shareholders, and by changes in the number of the fund’s shares. It lists distributions and their sources (net investment income or realized capital gains) over the current reporting period and the most recent fiscal year-end. The distributions listed here may not match the sources listed in the Statement of operations because the distributions are determined on a tax basis and may be paid in a different period from the one in which they were earned. Dividend sources are estimated at the time of declaration. Actual results may vary. Any non-taxable return of capital cannot be determined until final tax calculations are completed after the end of the fund’s fiscal year.
Financial highlights provide an overview of the fund’s investment results, per-share distributions, expense ratios, net investment income ratios, and portfolio turnover in one summary table, reflecting the five most recent reporting periods. In a semiannual report, the highlight table also includes the current reporting period.
33
The fund’s portfolio 2/28/07 (Unaudited)
| COMMON STOCKS (99.3%)* | | | |
|
| | Shares | | Value |
| |
| Building Materials (1.1%) | | | |
| Vulcan Materials Co. (S) | 55,300 | $ | 6,441,897 |
|
| |
| Chemicals (9.7%) | | | |
| Akzo Nobel NV (Netherlands) | 61,391 | | 3,776,862 |
| Asahi Kasei Corp. (Japan) | 638,000 | | 4,680,788 |
| BASF AG (Germany) | 134,886 | | 13,718,120 |
| E.I. du Pont de Nemours & Co. | 277,354 | | 14,075,716 |
| Imperial Chemical Industries PLC (United Kingdom) | 604,840 | | 5,475,625 |
| JSR Corp. (Japan) | 160,200 | | 3,710,151 |
| Monsanto Co. | 149,400 | | 7,871,886 |
| Rohm & Haas Co. | 110,400 | | 5,835,744 |
| | | | 59,144,892 |
|
| |
| Coal (0.6%) | | | |
| China Shenhua Energy Co., Ltd. Class H (China) | 1,401,000 | | 3,557,776 |
|
| |
| Construction (0.9%) | | | |
| Martin Marietta Materials, Inc. (S) | 41,881 | | 5,248,527 |
|
| |
| Energy (15.8%) | | | |
| BJ Services Co. | 518,500 | | 13,890,615 |
| Cameron International Corp. † | 98,600 | | 5,589,634 |
| ENSCO International, Inc. (S) | 125,200 | | 6,273,772 |
| Grant Prideco, Inc. † | 154,100 | | 6,689,481 |
| Halliburton Co. (S) | 652,196 | | 20,139,812 |
| Noble Corp. | 57,605 | | 4,045,023 |
| Pride International, Inc. † | 209,506 | | 6,033,773 |
| Rowan Cos., Inc. | 147,975 | | 4,532,474 |
| Saipem SpA (Italy) | 433,400 | | 11,653,230 |
| Schlumberger, Ltd. | 193,800 | | 12,170,640 |
| Weatherford International, Ltd. † | 141,422 | | 5,678,093 |
| | | | 96,696,547 |
|
| |
| Engineering & Construction (2.0%) | | | |
| Chiyoda Corp. (Japan) | 546,000 | | 12,137,436 |
|
| |
| Metals (9.3%) | | | |
| Alcoa, Inc. | 296,000 | | 9,889,360 |
| BHP Billiton, Ltd. (Australia) | 174,112 | | 3,720,353 |
| BHP Billiton PLC (United Kingdom) | 287,837 | | 5,798,002 |
| Freeport-McMoRan Copper & Gold, Inc. Class B | 98,000 | | 5,626,180 |
| IPSCO, Inc. | 40,900 | | 4,451,962 |
| Rio Tinto PLC (United Kingdom) | 97,765 | | 5,281,079 |
| Salzgitter AG (Germany) | 48,892 | | 6,061,930 |
| Teck Cominco, Ltd. Class B (Canada) | 48,115 | | 3,393,352 |
34
| COMMON STOCKS (99.3%)* continued | | | |
|
| | Shares | | Value |
| |
| Metals continued | | | |
| TMK OAO 144A GDR (Russia) † | 27,704 | $ | 911,573 |
| United States Steel Corp. | 89,760 | | 7,954,531 |
| Xstrata PLC (Switzerland) | 78,783 | | 3,683,187 |
| | | | 56,771,509 |
|
| |
| Oil & Gas (58.8%) | | | |
| Apache Corp. | 218,631 | | 14,982,782 |
| BP PLC (United Kingdom) | 3,970,560 | | 40,768,451 |
| Canadian Natural Resources, Ltd. (Canada) | 109,652 | | 5,506,509 |
| Devon Energy Corp. | 321,474 | | 21,124,057 |
| EOG Resources, Inc. | 219,872 | | 14,894,129 |
| Exxon Mobil Corp. | 872,672 | | 62,553,129 |
| Gazprom (Russia) | 555,493 | | 5,649,175 |
| Hess Corp. | 231,286 | | 12,269,722 |
| Lukoil ADR (Russia) | 88,133 | | 7,037,420 |
| Marathon Oil Corp. | 228,099 | | 20,697,703 |
| MOL Magyar Olaj-es Gazipari Nyilvanosan Mukodo Rt. | | | |
| ADR (Hungary) | 42,792 | | 4,515,799 |
| Newfield Exploration Co. † | 237,321 | | 10,257,014 |
| Occidental Petroleum Corp. (S) | 520,806 | | 24,050,821 |
| Petroplus Holdings AG (Switzerland) † | 48,841 | | 3,393,322 |
| Saras SpA (Italy) † | 623,903 | | 3,423,824 |
| Statoil ASA (Norway) | 597,700 | | 15,280,533 |
| Total SA (France) | 363,076 | | 24,393,591 |
| Total SA ADR (France) | 284,438 | | 19,148,366 |
| Valero Energy Corp. | 460,454 | | 26,545,173 |
| XTO Energy, Inc. | 418,066 | | 21,597,290 |
| | | | 358,088,810 |
|
| |
| Shipping (1.1%) | | | |
| Overseas Shipholding Group | 111,400 | | 6,748,612 |
|
| |
| Total common stocks (cost $454,871,811) | | $ | 604,836,006 |
|
| |
| |
| SHORT-TERM INVESTMENTS (6.5%)* | | | |
|
| | Principal amount/shares | | Value |
| |
| Putnam Prime Money Market Fund (e) | 1,827,859 | $ | 1,827,859 |
| Short-term investments held as collateral for loaned | | | |
| securities with yields ranging from 5.29% to 5.46% and | | | |
| due dates ranging from March 1, 2007 to April 29, 2007 (d) | $38,079,254 | | 38,008,193 |
|
| |
| Total short-term investments (cost $39,836,052) | | $ | 39,836,052 |
|
| |
| |
| TOTAL INVESTMENTS | | | |
| Total investments (cost $494,707,863) | | $ | 644,672,058 |
35
* Percentages indicated are based on net assets of $609,301,941.
† Non-income-producing security.
(d) See Note 1 to the financial statements.
(e) See Note 5 to the financial statements regarding investments in Putnam Prime Money Market Fund.
(S) Securities on loan, in part or in entirety, at February 28, 2007.
At February 28, 2007, liquid assets totaling $3,297,188 have been designated as collateral for open forward contracts.
144A after the name of an issuer represents securities exempt from registration under Rule 144A under the Securities Act of 1933, as amended. These securities may be resold in transactions exempt from registration, normally to qualified institutional buyers.
ADR or GDR after the name of a foreign holding stands for American Depository Receipts or Global Depository Receipts, respectively, representing ownership of foreign securities on deposit with a custodian bank.
DIVERSIFICATION BY COUNTRY
Distribution of investments by country of issue at February 28, 2007 (as a percentage of Portfolio Value):
| Australia | 0.6% |
| Canada | 1.5 |
| China | 0.6 |
| France | 7.2 |
| Germany | 3.3 |
| Hungary | 0.7 |
| Italy | 2.5 |
| Japan | 3.4 |
| Netherlands | 0.6 |
| Norway | 2.5 |
| Russia | 2.2 |
| Switzerland | 1.2 |
| United Kingdom | 9.4 |
| United States | 64.3 |
|
| | |
| Total | 100.0% |
| FORWARD CURRENCY CONTRACTS TO BUY at 2/28/07 (aggregate face value $29,014,272) (Unaudited) |
|
| | | | | | Unrealized |
| | | Aggregate | | Delivery | appreciation/ |
| | Value | face value | | date | (depreciation) |
|
| Australian Dollar | $ 4,453,117 | $ 4,382,667 | | 4/18/07 | $ 70,450 |
| British Pound | 6,859,238 | 6,899,032 | | 3/22/07 | (39,794) |
| Canadian Dollar | 17,280,078 | 17,205,719 | | 4/18/07 | 74,359 |
| Swedish Krona | 509,564 | 526,854 | | 3/22/07 | (17,290) |
|
| Total | | | | | $ 87,725 |
| |
| |
| |
| FORWARD CURRENCY CONTRACTS TO SELL at 2/28/07 (aggregate face value $85,071,227) (Unaudited) |
|
| | | | | | Unrealized |
| | | Aggregate | | Delivery | appreciation/ |
| | Value | face value | | date | (depreciation) |
|
| British Pound | $11,592,461 | $11,591,381 | | 3/22/07 | $ (1,080) |
| Euro | 51,395,779 | 51,816,155 | | 3/22/07 | 420,376 |
| Hong Kong Dollar | 3,304,315 | 3,308,221 | | 5/16/07 | 3,906 |
| Japanese Yen | 6,621,121 | 6,464,456 | | 5/16/07 | (156,665) |
| Norwegian Krone | 8,874,998 | 8,927,590 | | 3/22/07 | 52,592 |
| Swiss Franc | 2,944,646 | 2,963,424 | | 3/22/07 | 18,778 |
|
| Total | | | | | $ 337,907 |
The accompanying notes are an integral part of these financial statements.
36
Statement of assets and liabilities 2/28/07 (Unaudited)
| ASSETS | |
| Investment in securities, at value, including $36,868,248 of securities on loan (Note 1): | |
| Unaffiliated issuers (identified cost $492,880,004) | $642,844,199 |
| Affiliated issuers (identified cost $1,827,859) (Note 5) | 1,827,859 |
|
| Foreign currency (cost $40) (Note 1) | 42 |
|
| Dividends, interest and other receivables | 1,388,759 |
|
| Receivable for shares of the fund sold | 640,094 |
|
| Receivable for securities sold | 3,102,190 |
|
| Receivable for open forward currency contracts (Note 1) | 721,022 |
|
| Receivable for closed forward currency contracts (Note 1) | 332,748 |
|
| Foreign tax reclaim | 39,750 |
|
| Total assets | 650,896,663 |
|
| |
| LIABILITIES | |
| Payable for shares of the fund repurchased | 1,559,905 |
|
| Payable for compensation of Manager (Notes 2 and 5) | 1,041,968 |
|
| Payable for investor servicing and custodian fees (Note 2) | 139,546 |
|
| Payable for Trustee compensation and expenses (Note 2) | 66,063 |
|
| Payable for administrative services (Note 2) | 1,901 |
|
| Payable for distribution fees (Note 2) | 290,150 |
|
| Payable for open forward currency contracts (Note 1) | 295,390 |
|
| Payable for closed forward currency contracts (Note 1) | 99,772 |
|
| Collateral on securities loaned, at value (Note 1) | 38,008,193 |
|
| Other accrued expenses | 91,834 |
|
| Total liabilities | 41,594,722 |
|
| Net assets | $609,301,941 |
|
| |
| REPRESENTED BY | |
| Paid-in capital (Unlimited shares authorized) (Notes 1 and 4) | $434,257,754 |
|
| Distributions in excess of net investment income (Note 1) | (5,638,103) |
|
| Accumulated net realized gain on investments | |
| and foreign currency transactions (Note 1) | 30,290,423 |
|
| Net unrealized appreciation of investments | |
| and assets and liabilities in foreign currencies | 150,391,867 |
|
| Total — Representing net assets applicable to capital shares outstanding | $609,301,941 |
(Continued on next page)
37
Statement of assets and liabilities (Continued)
| COMPUTATION OF NET ASSET VALUE AND OFFERING PRICE | |
| Net asset value and redemption price per class A share | |
| ($462,272,651 divided by 15,648,718 shares) | $29.54 |
|
| Offering price per class A share | |
| (100/94.75 of $29.54)* | $31.18 |
|
| Net asset value and offering price per class B share | |
| ($101,220,139 divided by 3,647,441 shares)** | $27.75 |
|
| Net asset value and offering price per class C share | |
| ($21,648,211 divided by 767,643 shares)** | $28.20 |
|
| Net asset value and redemption price per class M share | |
| ($7,516,184 divided by 260,887 shares) | $28.81 |
|
| Offering price per class M share | |
| (100/96.75 of $28.81)* | $29.78 |
|
| Net asset value, offering price and redemption price per class R share | |
| ($2,695,558 divided by 91,942 shares) | $29.32 |
|
| Net asset value, offering price and redemption price per class Y share | |
| ($13,949,198 divided by 471,755 shares) | $29.57 |
* On single retail sales of less than $50,000. On sales of $50,000 or more the offering price is reduced.
** Redemption price per share is equal to net asset value less any applicable contingent deferred sales charge.
The accompanying notes are an integral part of these financial statements.
38
| Statement of operations Six months ended 2/28/07 (Unaudited) | |
|
| |
| INVESTMENT INCOME | |
| Dividends (net of foreign tax of $123,799) | $ 4,662,325 |
|
| Interest (including interest income of $79,436 | |
| from investments in affiliated issuers) (Note 5) | 90,567 |
|
| Securities lending | 40,371 |
|
| Total investment income | 4,793,263 |
|
| |
| EXPENSES | |
| Compensation of Manager (Note 2) | 2,084,775 |
|
| Investor servicing fees (Note 2) | 629,093 |
|
| Custodian fees (Note 2) | 211,044 |
|
| Trustee compensation and expenses (Note 2) | 18,136 |
|
| Administrative services (Note 2) | 15,431 |
|
| Distribution fees — Class A (Note 2) | 570,806 |
|
| Distribution fees — Class B (Note 2) | 547,615 |
|
| Distribution fees — Class C (Note 2) | 110,720 |
|
| Distribution fees — Class M (Note 2) | 28,482 |
|
| Distribution fees — Class R (Note 2) | 6,082 |
|
| Other | 142,333 |
|
| Fees waived and reimbursed by Manager (Note 5) | (1,355) |
|
| Total expenses | 4,363,162 |
|
| Expense reduction (Note 2) | (141,906) |
|
| Net expenses | 4,221,256 |
|
| Net investment income | 572,007 |
|
| Net realized gain on investments (Notes 1 and 3) | 35,430,286 |
|
| Net realized gain on futures contracts (Note 1) | 146,058 |
|
| Net realized loss on foreign currency transactions (Note 1) | (179,781) |
|
| Net unrealized depreciation of assets and liabilities | |
| in foreign currencies during the period | (716,935) |
|
| Net unrealized depreciation of investments during the period | (2,402,706) |
|
| Net gain on investments | 32,276,922 |
|
| Net increase in net assets resulting from operations | $ 32,848,929 |
The accompanying notes are an integral part of these financial statements.
39
Statement of changes in net assets
| INCREASE (DECREASE) IN NET ASSETS | | | |
|
| | Six months ended | | Year ended |
| | 2/28/07* | | 8/31/06 |
|
| Operations: | | | |
| Net investment income | $ 572,007 | $ | 1,486,541 |
|
| Net realized gain on investments and | | | |
| foreign currency transactions | 35,396,563 | | 70,531,901 |
|
| Net unrealized appreciation (depreciation) of investments | | | |
| and assets and liabilities in foreign currencies | (3,119,641) | | 6,838,556 |
|
| Net increase in net assets resulting from operations | 32,848,929 | | 78,856,998 |
|
| Distributions to shareholders: (Note 1) | | | |
|
| From ordinary income | | | |
|
| Net investment income | | | |
|
| Class A | (7,670,869) | | (350,625) |
|
| Class B | (970,742) | | — |
|
| Class C | (190,696) | | — |
|
| Class M | (92,222) | | — |
|
| Class R | (37,605) | | (1,005) |
|
| Class Y | (262,174) | | (16,690) |
|
| Net realized short-term gain on investments | | | |
|
| Class A | (16,892,990) | | (23,104,984) |
|
| Class B | (4,331,843) | | (8,505,873) |
|
| Class C | (847,778) | | (1,631,382) |
|
| Class M | (286,564) | | (407,376) |
|
| Class R | (91,470) | | (71,106) |
|
| Class Y | (503,561) | | (741,737) |
|
| From net realized long-term gain on investments | | | |
|
| Class A | (27,609,436) | | (23,552,333) |
|
| Class B | (7,079,844) | | (8,670,561) |
|
| Class C | (1,385,584) | | (1,662,969) |
|
| Class M | (468,353) | | (415,263) |
|
| Class R | (149,497) | | (72,483) |
|
| Class Y | (823,005) | | (756,098) |
|
| Redemption fees (Note 1) | 60,554 | | 156,895 |
|
| Increase from capital share transactions (Note 4) | 3,324,085 | | 97,453,419 |
|
| Total increase (decrease) in net assets | (33,460,665) | | 106,506,827 |
(Continued on next page)
40
Statement of changes in net assets (Continued)
| NET ASSETS | | |
|
| | Six months ended | Year ended |
| | 2/28/07* | 8/31/06 |
|
| Beginning of period | $642,762,606 | $536,255,779 |
|
| End of period (including distributions in excess of net | | |
| investment income of $5,638,103 and undistributed net | | |
| investment income of $3,014,198, respectively) | $609,301,941 | $642,762,606 |
* Unaudited
The accompanying notes are an integral part of these financial statements.
41
Financial highlights (For a common share outstanding throughout the period)
| INVESTMENT OPERATIONS: | | | | LESS DISTRIBUTIONS: | | | | | RATIOS AND SUPPLEMENTAL DATA: | |
|
| | | | Net | | | | | | | Total | | | Ratio of net | |
| | Net asset | | realized and | Total | From | From | | | Net asset | return | Net | Ratio of | investment | |
| | value, | Net | unrealized | from | net | net realized | | | value, | at net | assets, | expenses to | income (loss ) | Portfolio |
| | beginning | investment | gain (loss )on | investment | investment | gain on | Total | Redemption | end | asset | end of period | average net | to average | turnover |
| Period ended | of period | income (loss)(a ) | investments | operations | income | investments | distributions | fees | of period | value (%)(b ) | (in thousands ) | assets (%)(c ) | net assets (% ) | (% ) |
|
| CLASS A | | | | | | | | | | | | | | |
| February 28, 2007** | $31.31 | .05(d ) | 1.85 | 1.90 | (.54 ) | (3.13 ) | (3.67 ) | —(e) | $29.54 | 5.81* | $462,273 | .63*(d) | .17*(d) | 22.80* |
| August 31, 2006 | 31.01 | .14(d,f) | 4.04 | 4.18 | (.03) | (3.86) | (3.89) | .01 | 31.31 | 14.92 | 471,531 | 1.20(d,f) | .45(d,f) | 56.42 |
| August 31, 2005 | 22.78 | .23(d,g) | 10.48 | 10.71 | — | (2.49) | (2.49) | .01 | 31.01 | 50.62(g) | 368,872 | 1.22(d) | .87(d,g) | 81.22 |
| August 31, 2004 | 17.92 | .16(d) | 4.69 | 4.85 | — | — | — | .01 | 22.78 | 27.12 | 183,294 | 1.33(d) | .77(d) | 74.37 |
| August 31, 2003 | 16.22 | .18 | 1.61 | 1.79 | (.10) | — | (.10) | .01 | 17.92 | 11.12 | 186,504 | 1.26 | 1.12 | 131.17 |
| August 31, 2002 | 19.58 | .14 | (1.50) | (1.36) | (.12) | (1.88) | (2.00) | — | 16.22 | (7.26) | 173,632 | 1.18 | .81 | 137.57 |
|
| |
| CLASS B | | | | | | | | | | | | | | |
| February 28, 2007** | $29.48 | (.06)(d) | 1.73 | 1.67 | (.27) | (3.13) | (3.40) | —(e) | $27.75 | 5.38* | $101,220 | 1.00*(d) | (.20)*(d) | 22.80* |
| August 31, 2006 | 29.58 | (.10)(d,f) | 3.85 | 3.75 | — | (3.86) | (3.86) | .01 | 29.48 | 14.11 | 121,924 | 1.95(d,f) | (.33)(d,f) | 56.42 |
| August 31, 2005 | 21.98 | .02(d,g) | 10.06 | 10.08 | — | (2.49) | (2.49) | .01 | 29.58 | 49.53(g) | 134,729 | 1.97(d) | .09(d,g) | 81.22 |
| August 31, 2004 | 17.42 | .01(d) | 4.54 | 4.55 | — | — | — | .01 | 21.98 | 26.18 | 86,574 | 2.08(d) | .03(d) | 74.37 |
| August 31, 2003 | 15.80 | .05 | 1.56 | 1.61 | — | — | — | .01 | 17.42 | 10.25 | 82,109 | 2.01 | .35 | 131.17 |
| August 31, 2002 | 19.14 | .01 | (1.47) | (1.46) | — | (1.88) | (1.88) | — | 15.80 | (7.96) | 87,085 | 1.93 | .05 | 137.57 |
|
| |
| CLASS C | | | | | | | | | | | | | | |
| February 28, 2007** | $29.90 | (.06)(d) | 1.76 | 1.70 | (.27) | (3.13) | (3.40) | —(e) | $28.20 | 5.41* | $21,648 | 1.00*(d) | (.20)*(d) | 22.80* |
| August 31, 2006 | 29.96 | (.10)(d,f) | 3.89 | 3.79 | — | (3.86) | (3.86) | .01 | 29.90 | 14.06 | 24,107 | 1.95(d,f) | (.33)(d,f) | 56.42 |
| August 31, 2005 | 22.23 | .03(d,g) | 10.18 | 10.21 | — | (2.49) | (2.49) | .01 | 29.96 | 49.55(g) | 25,518 | 1.97(d) | .10(d,g) | 81.22 |
| August 31, 2004 | 17.62 | —(d,e) | 4.60 | 4.60 | — | — | — | .01 | 22.23 | 26.16 | 14,322 | 2.08(d) | .01(d) | 74.37 |
| August 31, 2003 | 15.98 | .06 | 1.57 | 1.63 | — | — | — | .01 | 17.62 | 10.26 | 14,546 | 2.01 | .40 | 131.17 |
| August 31, 2002 | 19.34 | .02 | (1.49) | (1.47) | (.01) | (1.88) | (1.89) | — | 15.98 | (7.94) | 9,657 | 1.93 | .09 | 137.57 |
|
| |
| CLASS M | | | | | | | | | | | | | | |
| February 28, 2007** | $30.55 | (.02)(d) | 1.79 | 1.77 | (.38) | (3.13) | (3.51) | —(e) | $28.81 | 5.54* | $7,516 | .87*(d) | (.07)*(d) | 22.80* |
| August 31, 2006 | 30.46 | (.01)(d,f) | 3.95 | 3.94 | — | (3.86) | (3.86) | .01 | 30.55 | 14.35 | 8,036 | 1.70(d,f) | (.04)(d,f) | 56.42 |
| August 31, 2005 | 22.51 | .10(d,g) | 10.33 | 10.43 | — | (2.49) | (2.49) | .01 | 30.46 | 49.94(g) | 6,438 | 1.72(d) | .37(d,g) | 81.22 |
| August 31, 2004 | 17.80 | .05(d) | 4.65 | 4.70 | — | — | — | .01 | 22.51 | 26.46 | 3,207 | 1.83(d) | .26(d) | 74.37 |
| August 31, 2003 | 16.11 | .10 | 1.58 | 1.68 | —(e) | — | —(e) | .01 | 17.80 | 10.52 | 3,550 | 1.76 | .60 | 131.17 |
| August 31, 2002 | 19.43 | .05 | (1.49) | (1.44) | — | (1.88) | (1.88) | — | 16.11 | (7.72) | 3,881 | 1.68 | .30 | 137.57 |
|
| |
| CLASS R | | | | | | | | | | | | | | |
| February 28, 2007** | $31.09 | .02(d) | 1.83 | 1.85 | (.49) | (3.13) | (3.62) | —(e) | $29.32 | 5.69* | $2,696 | .75*(d) | .05*(d) | 22.80* |
| August 31, 2006 | 30.89 | .10(d,f) | 3.98 | 4.08 | (.03) | (3.86) | (3.89) | .01 | 31.09 | 14.62 | 2,370 | 1.45(d,f) | .28(d,f) | 56.42 |
| August 31, 2005 | 22.74 | .21(d,g ) | 10.42 | 10.63 | — | (2.49) | (2.49) | .01 | 30.89 | 50.34(g) | 699 | 1.47(d) | .78(d,g) | 81.22 |
| August 31, 2004† | 18.32 | .12(d) | 4.30 | 4.42 | — | — | — | —(e) | 22.74 | 24.13* | 72 | 1.19*(d) | .63*(d) | 74.37 |
|
| |
| CLASS Y | | | | | | | | | | | | | | |
| February 28, 2007** | $31.38 | .09(d) | 1.85 | 1.94 | (.62) | (3.13) | (3.75) | —(e) | $29.57 | 5.92* | $13,949 | .50*(d) | .30*(d) | 22.80* |
| August 31, 2006†† | 32.74 | .22(d,f) | 2.31 | 2.53 | (.04) | (3.86) | (3.90) | .01 | 31.38 | 9.14* | 14,795 | .87* (d,f ) | .73* (d,f ) | 56.42 |
|
See notes to financial highlights at the end of this section.
The accompanying notes are an integral part of these financial statements.
42 43
Financial highlights (Continued)
* Not annualized.
** Unaudited.
† For the period December 1, 2003 (commencement of operations) to August 31, 2004.
†† For the period October 4, 2005 (commencement of operations) to August 31, 2006.
(a) Per share net investment income (loss) has been determined on the basis of the weighted average number of shares outstanding during the period.
(b) Total return assumes dividend reinvestment and does not reflect the effect of sales charges.
(c) Includes amounts paid through expense offset and brokerage service arrangements (Note 2).
(d) Reflects waivers of certain fund expenses in connection with investments in Putnam Prime Money Market Fund during the period. As a result of such waivers, the expenses of each class, reflect a reduction of the following amounts (Note 5):
| | Percentage |
| | of average |
| | net assets |
|
| February 28, 2007 | <0.01% |
|
| August 31, 2006 | <0.01 |
|
| August 31, 2005 | <0.01 |
|
| August 31, 2004 | <0.01 |
|
(e) Amount represents less than $0.01 per share.
(f) Reflects a non-recurring reimbursement from Putnam Investments relating to the calculation of certain amounts paid by the fund to Putnam in previous years for transfer agent services, which amounted to less than $0.01 per share and 0.01% of average net assets for the period ended August 31, 2006 (Note 6).
(g) Reflects a non-recurring accrual related to Putnam Management’s settlement with the SEC regarding brokerage allocation practices, which amounted to the following amounts:
| | | Percentage |
| | | of average |
| | Per share | net assets |
|
| Class A | $0.02 | 0.06% |
|
| Class B | 0.02 | 0.06 |
|
| Class C | 0.02 | 0.06 |
|
| Class M | 0.02 | 0.06 |
|
| Class R | 0.01 | 0.05 |
|
The accompanying notes are an integral part of these financial statements.
44
Notes to financial statements 2/28/07 (Unaudited)
Note 1: Significant accounting policies
Putnam Global Natural Resources Fund (the “fund”), a Massachusetts business trust, is registered under the Investment Company Act of 1940, as amended, as a diversified, open-end management investment company. The fund seeks capital appreciation by investing primarily in common stocks worldwide of large and midsized companies in the energy and natural resources industries. The fund concentrates its investments in one sector, which involves more risk than a fund that invests more broadly.
The fund offers class A, class B, class C, class M, class R and class Y shares. Class A and class M shares are sold with a maximum front-end sales charge of 5.25% and 3.25%, respectively, and generally do not pay a contingent deferred sales charge. Class B shares, which convert to class A shares after approximately eight years, do not pay a front-end sales charge and are subject to a contingent deferred sales charge, if those shares are redeemed within six years of purchase. Class C shares have a one-year 1.00% contingent deferred sales charge and do not convert to class A shares. Class R shares, which are offered to qualified employee-benefit plans, are sold without a front-end sales charge or a contingent deferred sales charge. The expenses for class A, class B, class C, class M and class R shares may differ based on the distribution fee of each class, which is identified in Note 2. Class Y shares, which are sold at net asset value, are generally subject to the sa me expenses as class A, class B, class C, class M and class R shares, but do not bear a distribution fee. Class Y shares are sold to certain eligible purchasers including certain defined contribution plans (including corporate IRAs), bank trust departments and trust companies.
Effective October 2, 2006, a 1.00% redemption fee may apply on any shares purchased on or after such date that are redeemed (either by selling or exchanging into another fund) within 90 days of purchase. The redemption fee is accounted for as an addition to paid-in-capital. Prior to October 2, 2006, a 2.00% redemption fee applied to any shares that were redeemed (either by selling or exchanging into another fund) within 5 days of purchase.
A 1.00% redemption fee applied to any shares that were redeemed (either by selling or exchanging into another fund) within 6–90 days of purchase.
Investment income, realized and unrealized gains and losses and expenses of the fund are borne pro-rata based on the relative net assets of each class to the total net assets of the fund, except that each class bears expenses unique to that class (including the distribution fees applicable to such classes). Each class votes as a class only with respect to its own distribution plan or other matters on which a class vote is required by law or determined by the Trustees. Shares of each class would receive their pro-rata share of the net assets of the fund, if the fund were liquidated. In addition, the Trustees declare separate dividends on each class of shares.
In the normal course of business, the fund enters into contracts that may include agreements to indemnify another party under given circumstances. The fund’s maximum exposure under these arrangements is unknown as this would involve future claims that may be, but have not yet been, made against the fund. However, the fund expects the risk of material loss to be remote.
The following is a summary of significant accounting policies consistently followed by the fund in the preparation of its financial statements. The preparation of financial statements is in conformity with accounting principles generally accepted in the United States of America and requires management to make estimates and assumptions that affect the reported amounts of assets and liabilities in the financial statements and the reported amounts of increases and decreases in net assets from operations during the reporting period. Actual results could differ from those estimates.
A) Security valuation Investments for which market quotations are readily available are valued at the last reported sales price on their principal
45
exchange, or official closing price for certain markets. If no sales are reported — as in the case of some securities traded over-the-counter — a security is valued at its last reported bid price. Many securities markets and exchanges outside the U.S. close prior to the close of the New York Stock Exchange and therefore the closing prices for securities in such markets or on such exchanges may not fully reflect events that occur after such close but before the close of the New York Stock Exchange. Accordingly, on certain days, the fund will fair value foreign equity securities taking into account multiple factors, including movements in the U.S. securities markets. The number of days on which fair value prices will be used will depend on market activity and it is possible that fair value prices will be used by the fund to a significant extent. At February 28, 2007, fair value pricing was used for certain foreign securities in the portfolio. Securities quot ed in foreign currencies, if any, are translated into U.S. dollars at the current exchange rate. Certain investments, including certain restricted securities, are also valued at fair value following procedures approved by the Trustees. Such valuations and procedures are reviewed periodically by the Trustees. The fair value of securities is generally determined as the amount that the fund could reasonably expect to realize from an orderly disposition of such securities over a reasonable period of time. By its nature, a fair value price is a good faith estimate of the value of a security at a given point in time and does not reflect an actual market price, which may be different by a material amount.
B) Joint trading account Pursuant to an exemptive order from the Securities and Exchange Commission (the “SEC”), the fund may transfer uninvested cash balances, including cash collateral received under security lending arrangements, into a joint trading account along with the cash of other registered investment companies and certain other accounts managed by Putnam Investment Management, LLC (“Putnam Management”), the fund’s manager, an indirect wholly-owned subsidiary of Putnam, LLC. These balances may be invested in issues of high-grade short-term investments having maturities of up to 397 days for collateral received under security lending arrangements and up to 90 days for other cash investments.
C) Repurchase agreements The fund, or any joint trading account, through its custodian, receives delivery of the underlying securities, the market value of which at the time of purchase is required to be in an amount at least equal to the resale price, including accrued interest. Collateral for certain tri-party repurchase agreements is held at the counterparty’s custodian in a segregated account for the benefit of the fund and the coun-terparty. Putnam Management is responsible for determining that the value of these underlying securities is at all times at least equal to the resale price, including accrued interest.
D) Security transactions and related investment income Security transactions are recorded on the trade date (the date the order to buy or sell is executed). Gains or losses on securities sold are determined on the identified cost basis.
Interest income is recorded on the accrual basis. Dividend income, net of applicable withholding taxes, is recognized on the ex-dividend date except that certain dividends from foreign securities, if any, are recognized as soon as the fund is informed of the ex-dividend date. Non-cash dividends, if any, are recorded at the fair market value of the securities received. Dividends representing a return of capital or capital gains, if any, are reflected as a reduction of cost and/or as a realized gain.
E) Foreign currency translation The accounting records of the fund are maintained in U.S. dollars. The market value of foreign securities, currency holdings, and other assets and liabilities are recorded in the books and records of the fund after translation to U.S. dollars based on the exchange rates on that day. The cost of each security is determined using historical exchange rates. Income and withholding taxes are translated at prevailing exchange rates when earned or
46
incurred. The fund does not isolate that portion of realized or unrealized gains or losses resulting from changes in the foreign exchange rate on investments from fluctuations arising from changes in the market prices of the securities. Such gains and losses are included with the net realized and unrealized gain or loss on investments. Net realized gains and losses on foreign currency transactions represent net realized exchange gains or losses on closed forward currency contracts, disposition of foreign currencies, currency gains and losses realized between the trade and settlement dates on securities transactions and the difference between the amount of investment income and foreign withholding taxes recorded on the fund’s books and the U.S. dollar equivalent amounts actually received or paid. Net unrealized appreciation and depreciation of assets and liabilities in foreign currencies arise from changes in the value of open forward currency contracts and asse ts and liabilities other than investments at the period end, resulting from changes in the exchange rate. Investments in foreign securities involve certain risks, including those related to economic instability, unfavorable political developments, and currency fluctuations, not present with domestic investments.
F) Forward currency contracts The fund may buy and sell forward currency contracts, which are agreements between two parties to buy and sell currencies at a set price on a future date. These contracts are used to protect against a decline in value relative to the U.S. dollar of the currencies in which its portfolio securities are denominated or quoted (or an increase in the value of a currency in which securities a fund intends to buy are denominated, when a fund holds cash reserves and short term investments), or for other investment purposes. The U.S. dollar value of forward currency contracts is determined using current forward currency exchange rates supplied by a quotation service. The market value of the contract will fluctuate with changes in currency exchange rates. The contract is marked to market daily and the change in market value is recorded as an unrealized gain or loss. When the c ontract is closed, the fund records a realized gain or loss equal to the difference between the value of the contract at the time it was opened and the value at the time it was closed. The fund could be exposed to risk if the value of the currency changes unfavorably, if the counterparties to the contracts are unable to meet the terms of their contracts or if the fund is unable to enter into a closing position. Risks may exceed amounts recognized on the statement of assets and liabilities. Forward currency contracts outstanding at period end, if any, are listed after the fund’s portfolio.
G) Futures and options contracts The fund may use futures and options contracts to hedge against changes in the values of securities the fund owns or expects to purchase, or for other investment purposes. The fund may also write options on swaps or securities it owns or in which it may invest to increase its current returns.
The potential risk to the fund is that the change in value of futures and options contracts may not correspond to the change in value of the hedged instruments. In addition, losses may arise from changes in the value of the underlying instruments, if there is an illiquid secondary market for the contracts, or if the counterparty to the contract is unable to perform. Risks may exceed amounts recognized on the statement of assets and liabilities. When the contract is closed, the fund records a realized gain or loss equal to the difference between the value of the contract at the time it was opened and the value at the time it was closed. Realized gains and losses on purchased options are included in realized gains and losses on investment securities. If a written call option is exercised, the premium originally received is recorded as an addition to sales proceeds. If a written put option is exercised, the premium originally received is recorded as a reduction to the cost of investments.
Futures contracts are valued at the quoted daily settlement prices established by the exchange on which they trade. The fund and the broker agree
47
to exchange an amount of cash equal to the daily fluctuation in the value of the futures contract. Such receipts or payments are known as “variation margin.” Exchange traded options are valued at the last sale price or, if no sales are reported, the last bid price for purchased options and the last ask price for written options. Options traded over-the-counter are valued using prices supplied by dealers. Futures and written option contracts outstanding at period end, if any, are listed after the fund’s portfolio.
H) Securities lending The fund may lend securities, through its agents, to qualified borrowers in order to earn additional income. The loans are collateralized by cash and/or securities in an amount at least equal to the market value of the securities loaned. The market value of securities loaned is determined daily and any additional required collateral is allocated to the fund on the next business day. The risk of borrower default will be borne by the fund’s agents; the fund will bear the risk of loss with respect to the investment of the cash collateral. Income from securities lending is included in investment income on the statement of operations. At February 28, 2007, the value of securities loaned amounted to $36,868,248. The fund received cash collateral of $38,008,193 which is pooled with collateral of other Putnam funds into 28 issues of high grade short-term investments.
I) Federal taxes It is the policy of the fund to distribute all of its taxable income within the prescribed time and otherwise comply with the provisions of the Internal Revenue Code of 1986 (the “Code”) applicable to regulated investment companies. It is also the intention of the fund to distribute an amount sufficient to avoid imposition of any excise tax under Section 4982 of the Code, as amended. Therefore, no provision has been made for federal taxes on income, capital gains or unrealized appreciation on securities held nor for excise tax on income and capital gains.
The aggregate identified cost on a tax basis is $494,793,129, resulting in gross unrealized appreciation and depreciation of $161,559,482 and $11,680,553, respectively, or net unrealized appreciation of $149,878,929.
J) Distributions to shareholders Distributions to shareholders from net investment income are recorded by the fund on the ex-dividend date. Distributions from capital gains, if any, are recorded on the ex-dividend date and paid at least annually. The amount and character of income and gains to be distributed are determined in accordance with income tax regulations, which may differ from generally accepted accounting principles. Dividend sources are estimated at the time of declaration. Actual results may vary. Any non-taxable return of capital cannot be determined until final tax calculations are completed after the end of the fund’s fiscal year. Reclassifications are made to the fund’s capital accounts to reflect income and gains available for distribution (or available capital loss carryovers) under income tax regulations.
Note 2: Management fee, administrative services and other transactions
Putnam Management is paid for management and investment advisory services quarterly based on the average net assets of the fund. Such fee is based on the following annual rates: 0.70% of the first $500 million of average net assets, 0.60% of the next $500 million, 0.55% of the next $500 million, 0.50% of the next $5 billion, 0.475% of the next $5 billion, 0.455% of the next $5 billion, 0.44% of the next $5 billion, and 0.43% thereafter.
Putnam Management has agreed to waive fees and reimburse expenses of the fund through August 31, 2007 to the extent necessary to ensure that the fund’s expenses do not exceed the simple average of the expenses of all front-end load funds viewed by Lipper Inc. as having the same investment classification or objective as the fund. The expense reimbursement is based on a comparison of the fund’s expenses with the average annualized operating expenses of the funds in its Lipper peer group for each calendar
48
quarter during the fund’s last fiscal year, excluding 12b-1 fees and without giving effect to any expense offset and brokerage service arrangements that may reduce fund expenses. For the period ended February 28, 2007, Putnam Management did not waive any of its management fee from the fund.
Effective September 15, 2006, Putnam Investments Limited (“PIL”), an affiliate of Putnam Management, is authorized by the Trustees to manage a separate portion of the assets of the fund as determined by Putnam Management from time to time. Putnam Management pays a quarterly sub-management fee to PIL for its services at an annual rate of 0.35% of the average net assets of the portion of the fund managed by PIL.
The fund reimburses Putnam Management an allocated amount for the compensation and related expenses of certain officers of the fund and their staff who provide administrative services to the fund. The aggregate amount of all such reimbursements is determined annually by the Trustees.
Custodial functions for the fund’s assets were provided by Putnam Fiduciary Trust Company (“PFTC”), a subsidiary of Putnam, LLC., and State Street Bank and Trust Company. Custody fees are based on the fund’s asset level, the number of its security holdings and transaction volumes. Putnam Investor Services, a division of PFTC, provided investor servicing agent functions to the fund. Putnam Investor Services received fees for investor servicing based on the number of shareholder accounts in the fund and the level of defined contribution plan assets in the fund. During the period ended February 28, 2007, the fund incurred $836,237 for custody and investor servicing agent functions provided by PFTC.
The fund has entered into arrangements with PFTC and State Street Bank and Trust Company whereby credits realized as a result of uninvested cash balances are used to reduce a portion of the fund’s expenses. The fund also reduced expenses through brokerage service arrangements. For the six months ended February 28, 2007, the fund’s expenses were reduced by $141,906 under these arrangements.
Each independent Trustee of the fund receives an annual Trustee fee, of which $368, as a quarterly retainer, has been allocated to the fund, and an additional fee for each Trustees meeting attended. Trustees receive additional fees for attendance at certain committee meetings, industry seminars and for certain compliance-related matters. Trustees also are reimbursed for expenses they incur relating to their services as Trustees. George Putnam, III, who is not an independent Trustee, also receives the foregoing fees for his services as Trustee.
The fund has adopted a Trustee Fee Deferral Plan (the “Deferral Plan”) which allows the Trustees to defer the receipt of all or a portion of Trustees fees payable on or after July 1, 1995. The deferred fees remain invested in certain Putnam funds until distribution in accordance with the Deferral Plan.
The fund has adopted an unfunded noncontribu-tory defined benefit pension plan (the “Pension Plan”) covering all Trustees of the fund who have served as a Trustee for at least five years and were first elected prior to 2004. Benefits under the Pension Plan are equal to 50% of the Trustee’s average annual attendance and retainer fees for the three years ended December 31, 2005. The retirement benefit is payable during a Trustee’s lifetime, beginning the year following retirement, for the number of years of service through December 31, 2006. Pension expense for the fund is included in Trustee compensation and expenses in the statement of operations. Accrued pension liability is included in Payable for Trustee compensation and expenses in the statement of assets and liabilities. The Trustees have terminated the Pension Plan with respect to any Trustee first elected after 2003.
The fund has adopted distribution plans (the “Plans”) with respect to its class A, class B, class C, class M and class R shares pursuant to Rule 12b-1 under the Investment Company Act of 1940. The purpose of the Plans is to compensate Putnam
49
Retail Management, a wholly-owned subsidiary of Putnam, LLC and Putnam Retail Management GP, Inc., for services provided and expenses incurred in distributing shares of the fund. The Plans provide for payments by the fund to Putnam Retail Management at an annual rate of up to 0.35%, 1.00%, 1.00%, 1.00% and 1.00% of the average net assets attributable to class A, class B, class C, class M and class R shares, respectively. The Trustees have approved payment by the fund at an annual rate of 0.25%, 1.00%, 1.00%, 0.75% and 0.50% of the average net assets attributable to class A, class B, class C, class M and class R shares, respectively.
For the six months ended February 28, 2007, Putnam Retail Management, acting as underwriter, received net commissions of $32,806 and $439 from the sale of class A and class M shares, respectively, and received $88,534 and $1,163 in contingent deferred sales charges from redemptions of class B and class C shares, respectively.
A deferred sales charge of up to 1.00% and 0.65% is assessed on certain redemptions of class A and class M shares, respectively. For the six months ended February 28, 2007, Putnam Retail Management, acting as underwriter, received $1,131 and no monies on class A and class M redemptions, respectively.
Note 3: Purchases and sales of securities
During the six months ended February 28, 2007, cost of purchases and proceeds from sales of investment securities other than short-term investments aggregated $141,261,993 and $205,913,238, respectively. There were no purchases or sales of U.S. government securities.
Note 4: Capital shares
At February 28, 2007, there was an unlimited number of shares of beneficial interest authorized. Transactions in capital shares were as follows:
| CLASS A | Shares | | Amount |
| Six months ended 2/28/07: | | |
| Shares sold | 1,591,273 | $ | 48,420,489 |
|
| Shares issued | | | |
| in connection | | | |
| with reinvestment | | | |
| of distributions | 1,611,773 | | 48,643,329 |
|
| | 3,203,046 | | 97,063,818 |
|
| Shares | | | |
| repurchased | (2,612,575) | (79,378,899) |
|
| Net increase | 590,471 | $ | 17,684,919 |
| |
| Year ended 8/31/06: | | | |
| Shares sold | 5,468,579 | $ 168,792,386 |
|
| Shares issued | | | |
| in connection | | | |
| with reinvestment | | | |
| of distributions | 1,559,482 | | 43,883,828 |
|
| | 7,028,061 | 212,676,214 |
|
| Shares | | | |
| repurchased | (3,864,633) | (118,806,410) |
|
| Net increase | 3,163,428 | $ | 93,869,804 |
|
| |
| CLASS B | Shares | | Amount |
| Six months ended 2/28/07: | | |
| Shares sold | 322,281 | $ | 9,285,068 |
|
| Shares issued | | | |
| in connection | | | |
| with reinvestment | | | |
| of distributions | 389,789 | | 11,066,123 |
|
| | 712,070 | | 20,351,191 |
|
| Shares | | | |
| repurchased | (1,201,006) | (33,961,505) |
|
| Net decrease | (488,936) | $(13,610,314) |
| |
| Year ended 8/31/06: | | | |
| Shares sold | 1,460,984 | $ 42,612,684 |
|
| Shares issued | | | |
| in connection | | | |
| with reinvestment | | | |
| of distributions | 587,738 | | 15,651,467 |
|
| | 2,048,722 | | 58,264,151 |
|
| Shares | | | |
| repurchased | (2,466,823) | (71,330,338) |
|
| Net decrease | (418,101) | $(13,066,187) |
50
| CLASS C | Shares | Amount |
| Six months ended 2/28/07: | |
| Shares sold | 73,197 | $ 2,122,289 |
|
| Shares issued | | |
| in connection | | |
| with reinvestment | | |
| of distributions | 74,706 | 2,155,272 |
|
| | 147,903 | 4,277,561 |
|
| Shares | | |
| repurchased | (186,440) | (5,413,956) |
|
| Net decrease | (38,537) | $ (1,136,395) |
| |
| Year ended 8/31/06: | | |
| Shares sold | 284,466 | $ 8,454,910 |
|
| Shares issued | | |
| in connection | | |
| with reinvestment | | |
| of distributions | 111,937 | 3,023,408 |
|
| | 396,403 | 11,478,318 |
|
| Shares | | |
| repurchased | (442,063) | (12,970,370) |
|
| Net decrease | (45,660) | $ (1,492,052) |
|
| |
| CLASS M | Shares | Amount |
| Six months ended 2/28/07: | |
| Shares sold | 34,505 | $ 1,035,712 |
|
| Shares issued | | |
| in connection | | |
| with reinvestment | | |
| of distributions | 27,864 | 820,877 |
|
| | 62,369 | 1,856,589 |
|
| Shares | | |
| repurchased | (64,521) | (1,903,113) |
|
| Net decrease | (2,152) | $ (46,524) |
| |
| Year ended 8/31/06: | | |
| Shares sold | 87,571 | $ 2,651,312 |
|
| Shares issued | | |
| in connection | | |
| with reinvestment | | |
| of distributions | 28,644 | 789,144 |
|
| | 116,215 | 3,440,456 |
|
| Shares | | |
| repurchased | (64,555) | (1,929,905) |
|
| Net increase | 51,660 | $ 1,510,551 |
| CLASS R | Shares | Amount |
| Six months ended 2/28/07: | |
| Shares sold | 28,307 | $ 855,024 |
|
| Shares issued | | |
| in connection | | |
| with reinvestment | | |
| of distributions | 8,857 | 265,356 |
|
| | 37,164 | 1,120,380 |
|
| Shares | | |
| repurchased | (21,437) | (652,619) |
|
| Net increase | 15,727 | $ 467,761 |
| |
| Year ended 8/31/06: | | |
| Shares sold | 78,992 | $2,437,972 |
|
| Shares issued | | |
| in connection | | |
| with reinvestment | | |
| of distributions | 4,851 | 135,777 |
|
| | 83,843 | 2,573,749 |
|
| Shares | | |
| repurchased | (30,258) | (918,361) |
|
| Net increase | 53,585 | $1,655,388 |
|
| |
| CLASS Y | Shares | Amount |
| Six months ended 2/28/07: | |
| Shares sold | 47,814 | $ 1,439,481 |
|
| Shares issued | | |
| in connection | | |
| with reinvestment | | |
| of distributions | 52,625 | 1,588,740 |
|
| | 100,439 | 3,028,221 |
|
| Shares | | |
| repurchased | (100,229) | (3,063,583) |
|
| Net increase/(decrease) 210 | $ (35,362) |
| |
| For the period 10/4/05 (commencement of operations) |
| to 8/31/06: | | |
| Shares sold | 554,056 | $17,645,426 |
|
| Shares issued | | |
| in connection | | |
| with reinvestment | | |
| of distributions | 53,821 | 1,514,525 |
|
| | 607,877 | 19,159,951 |
|
| Shares | | |
| repurchased | (136,332) | (4,184,036) |
|
| Net increase | 471,545 | $14,975,915 |
51
Note 5: Investment in Putnam Prime Money Market Fund
The fund invests in Putnam Prime Money Market Fund, an open-end management investment company managed by Putnam Management. Investments in Putnam Prime Money Market Fund are valued at its closing net asset value each business day. Management fees paid by the fund are reduced by an amount equal to the management and administrative services fees paid by Putnam Prime Money Market Fund with respect to assets invested by the fund in Putnam Prime Money Market Fund. For the period ended February 28, 2007, management fees paid were reduced by $1,355 relating to the fund’s investment in Putnam Prime Money Market Fund. Income distributions earned by the fund are recorded as income in the statement of operations and totaled $79,436 for the period ended February 28, 2007. During the period ended February 28, 2007, cost of purchases and proceeds of sales of investments in Putnam Prime Money Market Fund aggregated $62,570,367 and $66,348,315, respectively.
Note 6: Regulatory matters and litigation
In late 2003 and 2004, Putnam Management settled charges brought by the SEC and the Massachusetts Securities Division (“MSD”) in connection with excessive short-term trading by certain former Putnam employees and, in the case of charges brought by the MSD, excessive short-term trading by participants in some Putnam-administered 401(k) plans. Putnam Management agreed to pay $193.5 million in penalties and restitution, of which $153.5 million will be distributed to certain open-end Putnam funds and their shareholders after the SEC and MSD approve a distribution plan being developed by an independent consultant. The allegations of the SEC and MSD and related matters have served as the general basis for certain lawsuits, including purported class action lawsuits filed against Putnam Management and, in a limited number of cases, against some Putnam funds. Putnam Management believes that these lawsuits will have no material ad verse effect on the funds or on Putnam Management’s ability to provide investment management services. In addition, Putnam Management has agreed to bear any costs incurred by the Putnam funds as a result of these matters.
In connection with a settlement between Putnam and the fund’s Trustees in September 2006, the fund received $32,968 from Putnam to address issues relating to the calculation of certain amounts paid by the Putnam mutual funds to Putnam for transfer agent services.
Putnam Management and Putnam Retail Management are named as defendants in a civil suit in which the plaintiffs allege that the management and distribution fees paid by certain Putnam funds were excessive and seek recovery under the Investment Company Act of 1940. Putnam Management and Putnam Retail Management have contested the plaintiffs’ claims and the matter is currently pending in the U.S. District Court for the District of Massachusetts. Based on currently available information, Putnam Management believes that this action is without merit and that it is unlikely to have a material effect on Putnam Management’s and Putnam Retail Management’s ability to provide services to their clients, including the fund.
Note 7: New accounting pronouncements
In June 2006, the Financial Accounting Standards Board (“FASB”) issued Interpretation No. 48, Accounting for Uncertainty in Income Taxes (the “Interpretation”). The Interpretation prescribes a minimum threshold for financial statement recognition of the benefit of a tax position taken or expected to be taken by a filer in the filer’s tax return. The Interpretation will become effective for fiscal years beginning after December 15, 2006 but will also apply to tax positions reflected in the fund’s financial statements as of that date. No determination has been made whether the adoption of the Interpretation will require the fund to make any adjustments to its net assets or have any
52
other effect on the fund’s financial statements. The effects of implementing this pronouncement, if any, will be noted in the fund’s next semiannual financial statements.
In September 2006, the FASB issued Statement of Financial Accounting Standards No. 157, Fair Value Measurements (the “Standard”). The Standard defines fair value, sets out a framework for measuring fair value and requires additional disclosures about fair value measurements. The Standard applies to fair value measurements already required or permitted by existing standards. The Standard is effective for financial statements issued for fiscal years beginning after November 15, 2007 and interim periods within those fiscal years. Putnam Management is currently evaluating what impact the adoption of the Standard will have on the fund’s financial statements.
53
Brokerage commissions
(Unaudited)
Brokerage commissions are paid to firms that execute trades on behalf of your fund. When choosing these firms, Putnam is required by law to seek the best execution of the trades, taking all relevant factors into consideration, including expected quality of execution and commission rate. Listed below are the largest relationships based upon brokerage commissions for your fund and the other funds in Putnam’s Research group for the year ended February 28, 2007. The other Putnam mutual funds in this group are Putnam Health Sciences Trust, Putnam Research Fund, Putnam Utilities Growth and Income Fund, Putnam VT Health Sciences Fund, Putnam VT Research Fund, and Putnam VT Utilities Growth and Income Fund.
The top five firms that received brokerage commissions for trades executed for the Research group are (in descending order) Goldman Sachs, Merrill Lynch, Credit Suisse First Boston, UBS Warburg, and Citigroup Global Markets. Commissions paid to these firms together represented approximately 51% of the total brokerage commissions paid for the year ended February 28, 2007.
Commissions paid to the next 10 firms together represented approximately 31% of the total brokerage commissions paid during the period. These firms are (in alphabetical order) Bank of America, Bear Stearns & Company, Deutsche Bank Securities, JPMorgan Clearing, Lazard Freres & Co., Lehman Brothers, Morgan Stanley Dean Witter, RBC Capital Markets, SG Cowen, and Wachovia Securities.
Additional information about brokerage commissions is available on the Securities and Exchange Commission (SEC) Web site at www.sec.gov. Putnam funds disclose commissions by firm to the SEC in semiannual filings on Form N-SAR.
54
Putnam puts your
interests first
In January 2004, Putnam began introducing a number of voluntary initiatives designed to reduce fund expenses, provide investors with more useful information, and help safeguard the interests of all Putnam investors. Visit www.putnam.com for details.
Cost-cutting initiatives
Reduced sales charges The maximum sales charge for class A shares has been reduced to 5.25% for equity funds (formerly 5.75%) and 3.75% for most income funds (formerly 4.50%) . The maximum sales charge for class M shares has been reduced to 3.25% for equity funds (formerly 3.50%) .*
Lower class B purchase limit To help ensure that investors are in the most cost-effective share class, the maximum amount that can be invested in class B shares has been reduced to $100,000. (Larger trades or accumulated amounts will be refused.)
Ongoing expenses will be limited Through calendar 2007, total ongoing expenses, including management fees for all funds, will be maintained at or below the average of each fund’s industry peers in its Lipper load-fund universe. For more information, please see the Statement of Additional information.
Improved disclosure
Putnam fund prospectuses and shareholder reports have been revised to disclose additional information that will help shareholders compare funds and weigh their costs and risks along with their potential benefits. Shareholders will find easy-to-understand information about fund expense ratios, portfolio manager compensation, risk comparisons, turnover comparisons, brokerage commissions, and employee and trustee ownership of Putnam funds. Disclosure of breakpoint discounts has also been enhanced to alert investors to potential cost savings.
Protecting investors’ interests
Short-term trading fee introduced To discourage short-term trading, which can interfere with a fund’s long-term strategy, a 1% short-term trading fee may be imposed on any Putnam fund shares (other than money market funds) redeemed or exchanged within seven calendar days of purchase (for certain funds, this fee applies for 90 days).
* The maximum sales charge for class A shares of Putnam Limited Duration Government Income Fund and Putnam Floating Rate Income Fund remains 3.25% .
55
Services for shareholders
Investor services
Help your investment grow Set up a program for systematic investing from a Putnam fund or from your own savings or checking account. (Regular investing does not guarantee a profit or protect against loss in a declining market.)
Switch funds easily* You can move money from one Putnam fund to another within the same class of shares without a service charge.
Access your money easily You can have checks sent regularly or redeem shares any business day at the then-current net asset value, which may be more or less than the original cost of the shares. Class B and class C shares carry a sales charge that is applied to certain withdrawals.
How to buy additional shares You may buy shares through your financial advisor or directly from Putnam. To open an account by mail, send a check made payable to the name of the fund along with a completed fund application. To add to an existing account, complete the investment slip found at the top of your Confirmation of Activity statement and return it with a check payable to your fund.
For more information
Visit www.putnam.com A secure section of our Web site contains complete information on your account, including balances and transactions, updated daily. You may also conduct transactions, such as exchanges, additional investments, and address changes. Log on today to get your password.
Call us toll free at 1-800-225-1581 Ask a helpful Putnam representative or your financial advisor for details about any of these or other services, or see your prospectus.
*This privilege is subject to change or termination. An exchange of funds may result in a taxable event. In addition, a 1% redemption fee will be applied to shares exchanged or sold within 7 days of purchase, and, for certain funds, this fee applies on total assets redeemed or exchanged within 90 days of purchase.
56
Fund information
Founded over 65 years ago, Putnam Investments was built around the concept that a balance between risk and reward is the hallmark of a well-rounded financial program. We manage over 100 mutual funds in growth, value, blend, fixed income, and international.
| Investment Manager | Elizabeth T. Kennan | Beth S. Mazor |
| Putnam Investment | Kenneth R. Leibler | Vice President |
| Management, LLC | Robert E. Patterson | |
| One Post Office Square | George Putnam, III | James P. Pappas |
| Boston, MA 02109 | W. Thomas Stephens | Vice President |
| Richard B. Worley | |
| Investment Sub-Manager | | Richard S. Robie, III |
| Putnam Investments Limited | Officers | Vice President |
| 57–59 St. James’s Street | George Putnam, III | |
| London, England SW1A 1LD | President | Francis J. McNamara, III |
| | Vice President and |
| Marketing Services | Charles E. Porter | Chief Legal Officer |
| Putnam Retail Management | Executive Vice President, | |
| One Post Office Square | Principal Executive Officer, | Robert R. Leveille |
| Boston, MA 02109 | Associate Treasurer and | Chief Compliance Officer |
| | Compliance Liaison | |
| Custodians | | Mark C. Trenchard |
| Putnam Fiduciary Trust | Jonathan S. Horwitz | Vice President and |
| Company, State Street Bank | Senior Vice President | BSA Compliance Officer |
| and Trust Company | and Treasurer | |
| | Judith Cohen |
| Legal Counsel | Steven D. Krichmar | Vice President, Clerk and |
| Ropes & Gray LLP | Vice President and | Assistant Treasurer |
| | Principal Financial Officer | |
| Trustees | | Wanda M. McManus |
| John A. Hill, Chairman | Janet C. Smith | Vice President, Senior Associate |
| Jameson Adkins Baxter, | Vice President, Principal | Treasurer and Assistant Clerk |
| Vice Chairman | Accounting Officer and | |
| Charles B. Curtis | Assistant Treasurer | Nancy E. Florek |
| Myra R. Drucker | | Vice President, Assistant Clerk, |
| Charles E. Haldeman, Jr. | Susan G. Malloy | Assistant Treasurer and |
| Paul L. Joskow | Vice President and | Proxy Manager |
| Assistant Treasurer | |
This report is for the information of shareholders of Putnam Global Natural Resources Fund. It may also be used as sales literature when preceded or accompanied by the current prospectus, the most recent copy of Putnam’s Quarterly Performance Summary, and Putnam’s Quarterly Ranking Summary. For more recent performance, please visit www.putnam.com. Investors should carefully consider the investment objective, risks, charges, and expenses of a fund, which are described in its prospectus. For this and other information or to request a prospectus, call 1-800-225-1581 toll free. Please read the prospectus carefully before investing. The fund’s Statement of Additional Information contains additional information about the fund’s Trustees and is available without charge upon request by calling 1-800-225-1581.

Item 2. Code of Ethics:
Not applicable
Item 3. Audit Committee Financial Expert:
Not applicable
Item 4. Principal Accountant Fees and Services:
Not applicable
Item 5. Audit Committee of Listed Registrants
Not applicable
Item 6. Schedule of Investments:
The registrant’s schedule of investments in unaffiliated issuers is included in the report to shareholders in Item 1 above.
Item 7. Disclosure of Proxy Voting Policies and Procedures For Closed-End Management Investment Companies:
Not applicable
Item 8. Portfolio Managers of Closed-End Investment Companies
Not Applicable
Item 9. Purchases of Equity Securities by Closed-End Management Investment Companies and Affiliated Purchasers:
Not applicable
Item 10. Submission of Matters to a Vote of Security Holders:
Not applicable
Item 11. Controls and Procedures:
(a) The registrant's principal executive officer and principal financial officer have concluded, based on their evaluation of the effectiveness of the design and operation of the registrant's disclosure controls and procedures as of a date within 90 days of the filing date of this report, that the design and operation of such procedures are generally effective to provide reasonable assurance that information required to be disclosed by the registrant in this report is recorded, processed, summarized and reported within the time periods specified in the Commission's rules and forms.
(b) Changes in internal control over financial reporting: Effective January 1, 2007, the fund retained State Street Bank and Trust Company ("State Street") as its custodian. Putnam Fiduciary Trust Company, the fund's previous custodian, is managing the transfer of the fund's assets to State Street. This transfer is expected to be completed for all Putnam funds during the first half of 2007, with PFTC remaining as custodian with respect to fund assets until the assets are transferred. Also effective January 1, 2007, the fund's investment manager, Putnam Investment Management, LLC entered into a Master Sub-Accounting Services Agreement with State Street, under which the investment manager has delegated to State Street responsibility for providing certain
administrative, pricing, and bookkeeping services for the fund.
Item 12. Exhibits:
(a)(1) Not applicable
(a)(2) Separate certifications for the principal executive officer and principal financial officer of the registrant as required by Rule 30a-2(a) under the Investment Company Act of 1940, as amended, are filed herewith.
(b) The certifications required by Rule 30a-2(b) under the Investment Company Act of 1940, as amended, are filed herewith.
SIGNATURES
Pursuant to the requirements of the Securities Exchange Act of 1934 and the Investment Company Act of 1940, the registrant has duly caused this report to be signed on its behalf by the undersigned, thereunto duly authorized.
Putnam Global Natural Resources Fund
By (Signature and Title):
/s/Janet C. Smith
Janet C. Smith
Principal Accounting Officer
Date: April 27, 2007
Pursuant to the requirements of the Securities Exchange Act of 1934 and the Investment Company Act of 1940, this report has been signed below by the following persons on behalf of the registrant and in the capacities and on the dates indicated.
By (Signature and Title):
/s/Charles E. Porter
Charles E. Porter
Principal Executive Officer
Date: April 27, 2007
By (Signature and Title):
/s/Steven D. Krichmar
Steven D. Krichmar
Principal Financial Officer
Date: April 27, 2007