| | |
| UNITED STATES |
| SECURITIES AND EXCHANGE COMMISSION |
| Washington, D.C. 20549 |
| |
| FORM N-CSR |
| |
| CERTIFIED SHAREHOLDER REPORT OF REGISTERED |
| MANAGEMENT INVESTMENT COMPANIES |
| | |
| Investment Company Act file number: (811-03061) | |
| | |
| Exact name of registrant as specified in charter: Putnam Global Natural Resources Fund | |
| |
| Address of principal executive offices: One Post Office Square, Boston, Massachusetts 02109 |
| | |
| Name and address of agent for service: | Beth S. Mazor, Vice President |
| | One Post Office Square |
| | Boston, Massachusetts 02109 |
| |
| Copy to: | John W. Gerstmayr, Esq. |
| | Ropes & Gray LLP |
| | One International Place |
| | Boston, Massachusetts 02110 |
| |
| Registrant’s telephone number, including area code: | (617) 292-1000 |
| | | |
| Date of fiscal year end: August 31, 2009 | | |
| |
| Date of reporting period: September 1, 2008 — February 28, 2009 |
Item 1. Report to Stockholders:
The following is a copy of the report transmitted to stockholders pursuant to Rule 30e-1 under the Investment Company Act of 1940:
Since 1937, when George Putnam created a prudent mix of stocks and bonds in a single, professionally managed portfolio, we have championed the wisdom of the balanced approach. Today, we offer investors a world of equity, fixed-income, multi-asset, and absolute-return portfolios so investors can pursue a range of financial goals. Our seasoned portfolio managers seek superior results over time, backed by original, fundamental research on a global scale. We believe in service excellence, in the value of experienced financial advice, and in putting clients first in everything we do.
In 1830, Massachusetts Supreme Judicial Court Justice Samuel Putnam established The Prudent Man Rule, a legal foundation for responsible money management.

THE PRUDENT MAN RULE
All that can be required of a trustee to invest is that he shall conduct himself faithfully and exercise a sound discretion. He is to observe how men of prudence, discretion, and intelligence manage their own affairs, not in regard to speculation, but in regard to the permanent disposition of their funds, considering the probable income, as well as the probable safety of the capital to be invested.

Putnam
Global Natural
Resources Fund
2|28|09
Semiannual Report
| |
| Message from the Trustees | 2 |
| About the fund | 4 |
| Performance snapshot | 6 |
| Interview with your fund’s Portfolio Managers | 7 |
| Performance in depth | 12 |
| Expenses | 14 |
| Portfolio turnover | 16 |
| Your fund’s management | 17 |
| Terms and definitions | 18 |
| Trustee approval of management contract | 19 |
| Other information for shareholders | 25 |
| Financial statements | 26 |
Message from the Trustees
Dear Fellow Shareholder:
Financial markets have experienced significant upheaval for well over a year. Responses by governmental and financial authorities, including passage of a nearly $800 billion economic stimulus plan by Congress, have been rapid and often unprecedented in scale.
While it is difficult to predict how markets will perform in the near term, history shows that they have always recovered, with bull markets consistently outlasting bear markets over the long term. Under President and Chief Executive Officer Robert L. Reynolds, Putnam Investments has instituted several changes to prepare Putnam for the eventual recovery. In recent months, Putnam has hired top money management talent, added several seasoned equity analysts, and clarified how investment decisions are made.
The portfolio managers of Putnam Global Natural Resources Fund are Steve Curbow, who joined Putnam in 2008 and has 13 years of industry experience, and John J. Morgan, who has been in the industry since he joined the company in 1994.
We also are pleased to announce that Ravi Akhoury has been elected to the Board of Trustees of the Putnam Funds. Mr. Akhoury brings a wealth of experience and knowledge to the oversight of the Funds that will be of great benefit to Putnam shareholders. From 1992 to 2007, Mr. Akhoury
2
was Chairman and CEO of MacKay Shields, a multi-product investment management firm with over $40 billion in assets under management. He serves as advisor to New York Life Insurance Company, and previously was a member of its Executive Management Committee.
We would like to take this opportunity to welcome new shareholders to the fund and to thank all of our investors for your continued confidence in Putnam.

About the fund
Investing in natural resources stocks worldwide since 1980
From the OPEC-driven oil crisis of the 1970s to the more recent commodities boom, the balance of geopolitical stability, technological development, and economic growth has shaped natural resources markets. Putnam Global Natural Resources Fund seeks to capitalize on that ever-changing balance by investing in stocks of companies that can profit from the global demand for natural resources. While investors in the fund have benefited from the recent rise in the stock prices of energy and materials companies, they have also been rewarded by the fund’s diversified approach to natural resources investing over its nearly 30-year history.
The fund’s diversification sets it apart from many of its competitors in two respects: First, its view of natural resources industries is broader and includes energy, metals and mining, paper, chemical, aggregates, and natural resource-related equipment and infrastructure companies; and second, it has a global scope. Stock prices in the natural resources sector rise and fall with supply and demand imbalances, so this strategy helps the fund in its effort to offset that volatility while enabling it to pursue a wider field of opportunities.
From chemicals, construction, and railroads to forest products and packaging, the portfolio managers consider stocks in a wide array of areas, with support from a team of fundamental research analysts. Among the promising stocks the managers have targeted recently are those of industry-leading fertilizer, seed, and agrochemical companies. These companies may offer strong growth potential as world population has increased, wealth has grown in emerging markets, and demand for high-protein food has risen along with a greater need for fertilizer that can make land and crops more productive.
Another benefit for investors is the fund’s flexible strategy, which allows it to own growth- or value-style stocks, as it seeks to deliver competitive returns no matter which style is in favor.
International investing involves certain risks, such as currency fluctuations, economic instability, and political developments. Additional risks may be associated with emerging-market securities, including illiquidity and volatility. The fund invests some or all of its assets in small and/or midsize companies. Such investments increase the risk of greater price fluctuations. The fund invests in fewer issuers or concentrates its investments by region or sector, and involves more risk than a fund that invests more broadly.
Putnam Global Sector Funds
Dramatic changes, such as the growth of wireless communications and innovations in solar energy and software, can propel stocks in different industries to market-leading performance. Putnam Global Sector Funds help investors gain exposure to a number of dynamic industries.
Investing with flexibility and precision, the funds’ portfolio managers use rigorous fundamental research and a proprietary stock-ranking process. They work with teams of analysts to determine where each sector is headed and to pinpoint opportunities. Backed by Putnam’s nearly 30 years of sector investing experience, the nine funds invest in distinct sectors in markets around the world.
Global Consumer Fund
Retail, hotels, restaurants, media, food and beverages
Global Energy Fund
Oil and gas, energy equipment and services
Global Financials Fund
Commercial banks, insurance, diversified financial services, mortgage finance
Global Health Care Fund
Pharmaceuticals, biotechnology, health-care services
Global Industrials Fund
Airlines, railroads, trucking, aerospace and defense, construction, commercial services
Global Natural Resources Fund
Metals, chemicals, oil and gas, forest products
Global Technology Fund
Software, computers, Internet services
Global Telecommunications Fund
Diversified and wireless telecommunications services
Global Utilities Fund
Electric and gas utilities, telephone companies, water utilities
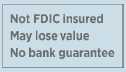
Developments and events that have
affected the natural resources sector
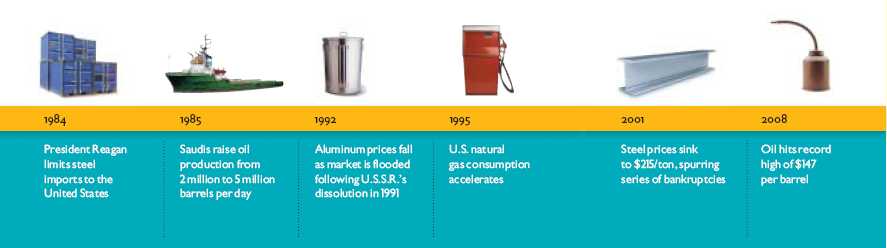
Performance snapshot
Average annual total return (%) comparison as of 2/28/09
Current performance may be lower or higher than the quoted past performance, which cannot guarantee future results. Share price, principal value, and return will fluctuate, and you may have a gain or a loss when you sell your shares. Performance of class A shares assumes reinvestment of distributions and does not account for taxes. Fund returns in the bar chart do not reflect a sales charge of 5.75%; had they, returns would have been lower. See pages 7 and 12–14 for additional performance information. For a portion of the periods, this fund may have limited expenses, without which returns would have been lower. A 1% short-term trading fee may apply. To obtain the most recent month-end performance, visit putnam.com.
* Returns for the six-month period are not annualized, but cumulative.
† The MSCI World Energy & Materials Index began operations on 6/1/05.
6
Interview with your
fund’s Portfolio Managers
Steve Curbow and John J. Morgan
Thank you for sitting down with us today to discuss the fund’s semiannual period. The past six months delivered some of the worst investing and economic climates in decades. How did the fund perform in this environment, Steve?
As the economic situation around the world deteriorated, including a whopping 6.2% contraction in U.S. gross domestic product in the fourth quarter, demand for natural resources and energy plummeted. The fund posted a loss of 50.83% for the six-month period ending February 28, 2009, compared to the 45.92% retreat of its benchmark, the MSCI World Energy & Materials Index. The fund underperformed its benchmark because the small number of very large companies — Exxon Mobil, for example — in the benchmark held up much better than the majority of companies. We were underweight these defensive, mega-cap, names.
The fund has an approximate 60%/40% split, respectively, between natural resources and energy holdings. John, you manage the natural resources portion of the portfolio. How did those holdings perform?
Throughout 2008, the markets and economies continued to weaken.
Broad market index and fund performance
This comparison shows your fund’s performance in the context of broad market indexes for the six months ended 2/28/09. See page 6 and pages 12–14 for additional fund performance information. Index descriptions can be found on page 18.

7
Then, in the third quarter, as the crisis reached a fever pitch, demand for natural resources fell off a cliff. From September through November, a sharp drop occurred in demand for aluminum, copper, and especially steel. Until August, the worldwide market for steel was strong, buoyed by demand from the “BRIC” [Brazil, Russia, India, and China] countries. But by last fall, even China had felt the weight of the global slowdown. In addition to diminished demand, forced selling by hedge funds played a major role in the sudden and dramatic price decline in these stocks as a group. When clients wanted to redeem shares in the fourth quarter, hedge funds began to frantically liquidate the holdings in the natural resources stocks that had significantly outperformed over the last few years. The sell-off continued until late November.
John, what were some of the holdings that hurt performance?
A significant detractor was U.K.-based Rio Tinto PLC, one of the world’s largest mining companies and the second-largest producer of iron ore, a primary material used in steel production. The fund was overweight Rio Tinto because BHP Billiton, another large U.K.-based mining company, had announced plans in 2007 for a hostile takeover of Rio Tinto. We believed that Rio Tinto stock would continue to appreciate. In November, citing the turmoil in the financial markets and declining commodity prices, BHP withdrew its offer and Rio Tinto stock lost 25% of its value in one day. The fund
Top 10 holdings
This table shows the fund’s top 10 holdings and the percentage of the fund’s net assets that each represented as of 2/28/09. Holdings will vary over time.
| | |
| HOLDING (percentage of fund’s net assets) | COUNTRY | INDUSTRY |
|
| Exxon Mobil Corp. (9.2%) | United States | Oil and gas |
| Chevron Corp. (7.7%) | United States | Oil and gas |
| Occidental Petroleum Corp. (5.5%) | United States | Oil and gas |
| BHP Billiton PLC (5.1%) | United Kingdom | Metals |
| Total SA (5.0%) | France | Oil and gas |
| BP PLC (4.7%) | United Kingdom | Oil and gas |
| BG Group PLC (3.4%) | United Kingdom | Oil and gas |
| XTO Energy, Inc. (3.4%) | United States | Oil and gas |
| Monsanto Co. (3.0%) | United States | Chemicals |
| Marathon Oil Corp. (2.7%) | United States | Oil and gas |
8
sold its holdings in Rio Tinto before end of the period.
Another detractor, ArcelorMittal, based in Luxembourg, is the world’s top producer of steel. Again, the stock’s plunge coincided with the sudden drop in demand for steel last fall. We still own ArcelorMittal in the portfolio and believe that, over the long term, it is well positioned to benefit from the eventual resurgence in steel demand, especially from the BRIC countries.
Our greater-than-benchmark holding in Xstrata PLC, a Swiss-based global copper and coal mining company, hurt performance on a relative basis. Last fall, when global commodity demand was collapsing, several hedge funds sold off significant shares in Xstrata to meet investor redemptions. Since then, the price has been recovering. We still hold the stock in the fund on the belief that copper and coal are very good investments over the long term. China has very little copper as a natural resource. Because copper is a great conductor of electricity, as China continues to build out its electricity and commercial infrastructures, it will experience significant demand for the metal.
What contributed to the fund’s performance during the period?
BHP Billiton, which I mentioned earlier, was our largest overweight holding in natural resources. Essentially, it’s a company that holds a near-perfect suite of products that are in demand from China: iron ore, copper, and, to a lesser extent, coal. Although BHP Billiton saw a slight decline during the global
Comparison of top industry weightings
This chart shows how the fund’s top weightings have changed over the past six months. Weightings are shown as a percentage of net assets. Holdings will vary over time.

9
commodity sell-off, including it in the fund’s portfolio helped performance on a relative basis. In contrast, Dow Chemical was the worst place to be invested, and we chose not to hold shares in the company. By avoiding Dow, the fund was helped significantly on a relative basis. Its petrochemical assets in North America are very high cost and have lost significant share in the export market to lower-cost Middle Eastern competitors.
Performance was also helped by our decision to avoid holding benchmark component Alcoa, based in Pittsburgh, the world’s leading producer of aluminum. In our view, aluminum does not offer much upside price and margin potential. Its primary input is bauxite, which is one of the most abundant ores in the earth’s crust. In addition, China overproduces aluminum.
Steve, what were some of the holdings within the energy side of the portfolio that helped performance?
Along with all commodities, oil prices plummeted in the past several months, dropping from a high of about $147 a barrel in July 2008, to the mid-$40s by the close of the period. We decided to position the fund defensively. This meant owning large-cap, integrated oil company stocks and avoiding smaller, oil-field service companies that tend to perform well only when energy prices are rising. Because integrated companies are involved in all phases of the energy business — from exploring and drilling to refining and marketing — this diversification allows them to better withstand economic slowdowns.
IN THE NEWS
The Federal Reserve (the Fed) opened a new front in its monetary policy offensive at its March 18, 2009 meeting. Since September 2007, the Fed has slashed its benchmark lending rate from 5.25% to near zero. Without the option of cutting rates further, the Fed moved to buy $300 billion in U.S.Treasury securities and increase the size of its lending programs. The Fed’s actions are designed to reduce mortgage rates, bolster the housing market, and bring an end to what some have described as the worst recession in 60 years.The Fed’s moves should also result in lower interest rates on a variety of consumer and business loans.
The fund’s greater-than-benchmark exposure to Chevron Corporation, a California-based integrated oil and natural gas company, helped performance on a relative basis. The fund’s overweight to Occidental Petroleum Corporation, an international oil and gas exploration and production company, also improved relative performance.
10
What were some of the energy holdings that held back performance?
Most of the top detractors for the period are best defined as those that we either were underweight or did not hold relative to the fund’s benchmark. At the top of the list were integrated oil companies. For example, fund performance was held back by our decision to underweight Exxon Mobil, a classic integrated stock, relative to the benchmark. Fund performance also was hurt by the fact that we did not hold U.K.-based Royal Dutch Shell PLC and by our underweight to BP PLC, also based in the United Kingdom.
While we were tactically defensive during this time, certain restrictions limited our ability to place more weight in these integrated oil names. Because the fund is classified as “diversified,” there is a cap [25%] on how much of the fund can be invested in individual stocks that represent more than 5% of the fund’s weight. Because the integrated oil companies have much bigger market capitalizations than the rest of the companies in the benchmark, this rule makes it difficult to be overweight in more than a select set of names.
What is your outlook for the fund and the sector, Steve?
Today, because of the global economic slowdown, we’re in a short-term down-cycle in global natural resources. The long-term picture for the fund and the sector remains quite positive. World energy consumption is expected to expand over the next several decades, with China and India leading the pack. In addition, we anticipate that China will drive demand for natural resources going forward.
Currently, the hope is that the broad and coordinated economic stimulus efforts around the world will hasten the return of economic growth. Once that happens, demand will begin to recover.
Thank you both for your time and insights today.
The views expressed in this report are exclusively those of Putnam Management. They are not meant as investment advice.
Please note that the holdings discussed in this report may not have been held by the fund for the entire period. Portfolio composition is subject to review in accordance with the fund’s investment strategy and may vary in the future. Current and future portfolio holdings are subject to risk.
11
Your fund’s performance
This section shows your fund’s performance, price, and distribution information for periods ended February 28, 2009, the end of the first half of its current fiscal year. In accordance with regulatory requirements for mutual funds, we also include performance as of the most recent calendar quarter-end and expense information taken from the fund’s current prospectus. Performance should always be considered in light of a fund’s investment strategy. Data represents past performance. Past performance does not guarantee future results. More recent returns may be less or more than those shown. Investment return and principal value will fluctuate, and you may have a gain or a loss when you sell your shares. Performance information does not reflect any deduction for taxes a shareholder may owe on fund distributions or on the redemption of fund shares. For the most recent month-end performance, please visit the Individual Investors section of putnam.com or call Put nam at 1-800-225-1581. Class Y shares are generally only available to corporate and institutional clients and clients in other approved programs. See the Terms and Definitions section in this report for definitions of the share classes offered by your fund.
Fund performance Total return for periods ended 2/28/09
| | | | | | | | | | |
| | Class A | Class B | Class C | Class M | Class R | Class Y |
| (inception dates) | (7/24/80) | (2/1/94) | (7/26/99) | (7/3/95) | (12/1/03) | (10/4/05) |
|
| | NAV | POP | NAV | CDSC | NAV | CDSC | NAV | POP | NAV | NAV |
|
| Annual average | | | | | | | | | | |
| (life of fund) | 6.24% | 6.01% | 5.36% | 5.36% | 5.44% | 5.44% | 5.63% | 5.50% | 5.97% | 6.27% |
|
| 10 years | 95.36 | 84.18 | 81.05 | 81.05 | 81.15 | 81.15 | 85.70 | 79.16 | 90.65 | 97.15 |
| Annual average | 6.93 | 6.30 | 6.12 | 6.12 | 6.12 | 6.12 | 6.39 | 6.00 | 6.67 | 7.02 |
|
| 5 years | 10.70 | 4.33 | 6.60 | 5.58 | 6.57 | 6.57 | 7.97 | 4.20 | 9.32 | 11.72 |
| Annual average | 2.05 | 0.85 | 1.29 | 1.09 | 1.28 | 1.28 | 1.55 | 0.83 | 1.80 | 2.24 |
|
| 3 years | –35.51 | –39.21 | –36.95 | –38.10 | –36.95 | –36.95 | –36.44 | –38.67 | –36.02 | –34.99 |
| Annual average | –13.60 | –15.29 | –14.25 | –14.78 | –14.25 | –14.25 | –14.02 | –15.04 | –13.83 | –13.37 |
|
| 1 year | –55.47 | –58.04 | –55.81 | –57.67 | –55.81 | –56.18 | –55.69 | –57.23 | –55.59 | –55.33 |
|
| 6 months | –50.83 | –53.66 | –51.02 | –53.08 | –51.03 | –51.45 | –50.96 | –52.68 | –50.90 | –50.75 |
|
Current performance may be lower or higher than the quoted past performance, which cannot guarantee future results. After-sales-charge returns (public offering price, or POP) for class A and M shares reflect a maximum 5.75% and 3.50% load, respectively. Class B share returns reflect the applicable contingent deferred sales charge (CDSC), which is 5% in the first year, declining to 1% in the sixth year, and is eliminated thereafter. Class C shares reflect a 1% CDSC for the first year that is eliminated thereafter. Class R and Y shares have no initial sales charge or CDSC. Performance for class B, C, M, R, and Y shares before their inception is derived from the historical performance of class A shares, adjusted for the applicable sales charge (or CDSC) and, except for class Y shares, the higher operating expenses for such shares.
For a portion of the periods, this fund may have limited expenses, without which returns would have been lower.
A 1% short-term trading fee may be applied to shares exchanged or sold within 90 days of purchase.
12
Comparative index returns For periods ended 2/28/09
| | |
| | MSCI World Energy & | Lipper Global Natural Resources |
| | Materials Index | Funds category average† |
|
| Annual average (life of fund) | —* | 6.58% |
|
| 10 years | —* | 239.15 |
| Annual average | — | 12.39 |
|
| 5 years | —* | 24.79 |
| Annual average | — | 4.39 |
|
| 3 years | –24.01% | –31.55 |
| Annual average | –8.75 | –11.98 |
|
| 1 year | –48.81 | –54.53 |
|
| 6 months | –45.92 | –52.75 |
|
Index and Lipper results should be compared to fund performance at net asset value.
* The MSCI World Energy & Materials Index began operations on 6/1/05.
† Over the 6-month, 1-year, 3-year, 5-year, 10-year, and life-of-fund periods ended 2/28/09, there were 108, 97, 64, 46, 31, and 3 funds, respectively, in this Lipper category.
Fund price and distribution information For the six-month period ended 2/28/09
| | | | | | | | |
| Distributions | Class A | Class B | Class C | Class M | Class R | Class Y |
|
| Number | 1 | 1 | 1 | 1 | 1 | 1 |
|
| Income | — | — | — | — | — | — |
|
| Capital gains — Long-term | $2.097 | $2.097 | $2.097 | $2.097 | $2.097 | $2.097 |
|
| Capital gains — Short-term | — | — | — | — | — | — |
|
| Total | $2.097 | $2.097 | $2.097 | $2.097 | $2.097 | $2.097 |
|
| Share value | NAV | POP | NAV | NAV | NAV | POP | NAV | NAV |
|
| 8/31/08 | $27.99 | $29.70 | $25.66 | $26.18 | $27.00 | $27.98 | $27.64 | $28.07 |
|
| 2/28/09 | 11.79 | 12.51 | 10.60 | 10.85 | 11.27 | 11.68 | 11.60 | 11.85 |
|
The classification of distributions, if any, is an estimate. Final distribution information will appear on your year-end tax forms.
Fund performance as of most recent calendar quarter
Total return for periods ended 3/31/09
| | | | | | | | | | |
| | Class A | Class B | Class C | Class M | Class R | Class Y |
| (inception dates) | (7/24/80) | (2/1/94) | (7/26/99) | (7/3/95) | (12/1/03) | (10/4/05) |
|
| | NAV | POP | NAV | CDSC | NAV | CDSC | NAV | POP | NAV | NAV |
|
| Annual average | | | | | | | | | | |
| (life of fund) | 6.49% | 6.27% | 5.62% | 5.62% | 5.70% | 5.70% | 5.89% | 5.76% | 6.23% | 6.53% |
|
| 10 years | 88.35 | 77.56 | 74.85 | 74.85 | 74.87 | 74.87 | 79.15 | 72.89 | 83.90 | 90.16 |
| Annual average | 6.54 | 5.91 | 5.75 | 5.75 | 5.75 | 5.75 | 6.00 | 5.63 | 6.28 | 6.64 |
|
| 5 years | 20.29 | 13.37 | 15.95 | 14.84 | 15.97 | 15.97 | 17.39 | 13.31 | 18.89 | 21.45 |
| Annual average | 3.76 | 2.54 | 3.00 | 2.81 | 3.01 | 3.01 | 3.26 | 2.53 | 3.52 | 3.96 |
|
| 3 years | –33.67 | –37.49 | –35.11 | –36.29 | –35.11 | –35.11 | –34.61 | –36.90 | –34.12 | –33.11 |
| Annual average | –12.79 | –14.50 | –13.42 | –13.95 | –13.42 | –13.42 | –13.20 | –14.23 | –12.99 | –12.54 |
|
| 1 year | –50.34 | –53.20 | –50.68 | –52.76 | –50.68 | –51.10 | –50.57 | –52.31 | –50.45 | –50.19 |
|
| 6 months | –32.53 | –36.40 | –32.74 | –35.58 | –32.73 | –33.30 | –32.67 | –35.02 | –32.58 | –32.42 |
|
13
Fund’s annual operating expenses For the fiscal year ended 8/31/08
| | | | | | |
| | Class A | Class B | Class C | Class M | Class R | Class Y |
|
| Total annual fund operating expenses | 1.18% | 1.93% | 1.93% | 1.68% | 1.43% | 0.93% |
|
Expense information in this table is taken from the most recent prospectus, is subject to change, and may differ from that shown in the next section and in the financial highlights of this report. Expenses are shown as a percentage of average net assets.
Your fund’s expenses
As a mutual fund investor, you pay ongoing expenses, such as management fees, distribution fees (12b-1 fees), and other expenses. In the most recent six-month period, your fund limited these expenses; had it not done so, expenses would have been higher. Using the following information, you can estimate how these expenses affect your investment and compare them with the expenses of other funds. You may also pay one-time transaction expenses, including sales charges (loads) and redemption fees, which are not shown in this section and would have resulted in higher total expenses. For more information, see your fund’s prospectus or talk to your financial representative.
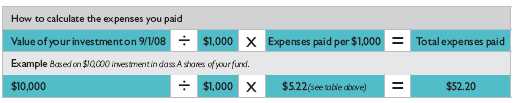
Review your fund’s expenses
The following table shows the expenses you would have paid on a $1,000 investment in Putnam Global Natural Resources Fund from September 1, 2008, to February 28, 2009. It also shows how much a $1,000 investment would be worth at the close of the period, assuming actual returns and expenses.
| | | | | | |
| | Class A | Class B | Class C | Class M | Class R | Class Y |
|
| Expenses paid per $1,000* | $5.22 | $7.98 | $7.98 | $7.06 | $6.14 | $4.29 |
|
| Ending value (after expenses) | $491.70 | $489.80 | $489.70 | $490.40 | $491.00 | $492.50 |
|
* Expenses for each share class are calculated using the fund’s annualized expense ratio for each class, which represents the ongoing expenses as a percentage of average net assets for the six months ended 2/28/09. The expense ratio may differ for each share class (see the last table in this section). Expenses are calculated by multiplying the expense ratio by the average account value for the period; then multiplying the result by the number of days in the period; and then dividing that result by the number of days in the year.
Estimate the expenses you paid
To estimate the ongoing expenses you paid for the six months ended February 28, 2009, use the following calculation method. To find the value of your investment on September 1, 2008, call Putnam at 1-800-225-1581.
14
Compare expenses using the SEC’s method
The Securities and Exchange Commission (SEC) has established guidelines to help investors assess fund expenses. Per these guidelines, the following table shows your fund’s expenses based on a $1,000 investment, assuming a hypothetical 5% annualized return. You can use this information to compare the ongoing expenses (but not transaction expenses or total costs) of investing in the fund with those of other funds. All mutual fund shareholder reports will provide this information to help you make this comparison. Please note that you cannot use this information to estimate your actual ending account balance and expenses paid during the period.
| | | | | | |
| | Class A | Class B | Class C | Class M | Class R | Class Y |
|
| Expenses paid per $1,000* | $7.05 | $10.79 | $10.79 | $9.54 | $8.30 | $5.81 |
|
| Ending value (after expenses) | $1,017.80 | $1,014.08 | $1,014.08 | $1,015.32 | $1,016.56 | $1,019.04 |
|
* Expenses for each share class are calculated using the fund’s annualized expense ratio for each class, which represents the ongoing expenses as a percentage of average net assets for the six months ended 2/28/09. The expense ratio may differ for each share class (see the last table in this section). Expenses are calculated by multiplying the expense ratio by the average account value for the period; then multiplying the result by the number of days in the period; and then dividing that result by the number of days in the year.
Compare expenses using industry averages
You can also compare your fund’s expenses with the average of its peer group, as defined by Lipper, an independent fund-rating agency that ranks funds relative to others that Lipper considers to have similar investment styles or objectives. The expense ratio for each share class shown indicates how much of your fund’s average net assets have been used to pay ongoing expenses during the period.
| | | | | | |
| | Class A | Class B | Class C | Class M | Class R | Class Y |
|
| Your fund’s annualized | | | | | | |
| expense ratio | 1.41% | 2.16% | 2.16% | 1.91% | 1.66% | 1.16% |
|
| Average annualized expense | | | | | | |
| ratio for Lipper peer group* | 1.47% | 2.22% | 2.22% | 1.97% | 1.72% | 1.22% |
|
* Putnam keeps fund expenses below the Lipper peer group average expense ratio by limiting our fund expenses if they exceed the Lipper average. The Lipper average is a simple average of front-end load funds in the peer group that excludes 12b-1 fees as well as any expense offset and brokerage/service arrangements that may reduce fund expenses. To facilitate the comparison in this presentation, Putnam has adjusted the Lipper average to reflect 12b-1 fees. Investors should note that the other funds in the peer group may be significantly smaller or larger than the fund, and that an asset-weighted average would likely be lower than the simple average. Also, the fund and Lipper report expense data at different times; the fund’s expense ratio shown here is annualized data for the most recent six-month period, while the quarterly updated Lipper average is based on the most recent fiscal year-end data available for the peer group funds as of 12/31/08.
15
Your fund’s portfolio turnover
Putnam funds are actively managed by experts who buy and sell securities based on intensive analysis of companies, industries, economies, and markets. Portfolio turnover is a measure of how often a fund’s managers buy and sell securities for your fund. A portfolio turnover of 100%, for example, means that the managers sold and replaced securities valued at 100% of a fund’s average portfolio value within a given period. Funds with high turnover may be more likely to generate capital gains that must be distributed to shareholders as taxable income. High turnover may also cause a fund to pay more brokerage commissions and other transaction costs, which may detract from performance.
You can use the following table to compare your fund’s turnover with the average turnover for funds in its Lipper category.
Turnover comparisons Percentage of holdings that change every year
| | | | | |
| | 2008 | 2007 | 2006 | 2005 | 2004 |
|
| Putnam Global Natural | | | | | |
| Resources Fund | 99% | 64% | 56% | 81% | 74% |
|
| Lipper Global Natural Resources | | | | | |
| Funds category average | 69% | 96% | 127% | 136% | 236% |
|
Turnover data for the fund is calculated based on the fund's fiscal-year period, which ends on August 31. Turnover data for the fund's Lipper category is calculated based on the average of the turnover of each fund in the category for its fiscal year ended during the indicated year. Fiscal years vary across funds in the Lipper category, which may limit the comparability of the fund's portfolio turnover rate to the Lipper average. Comparative data for 2008 is based on information available as of 12/31/08.
For years prior to 2009 Lipper turnover represents data for the funds previous category, Lipper Natural Resources Funds.
16
Your fund’s management
Your fund’s Portfolio Managers are Steve Curbow and John Morgan.
Portfolio management fund ownership
The following table shows how much the fund’s current Portfolio Managers have invested in the fund and in all Putnam mutual funds (in dollar ranges). Information shown is as of February 28, 2009.
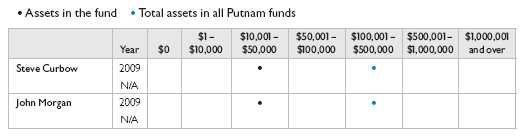
N/A indicates the individual was not a Portfolio Manager as of 2/29/08.
Trustee and Putnam employee fund ownership
As of February 28, 2009, all of the Trustees of the Putnam funds owned fund shares. The following table shows the approximate value of investments in the fund and all Putnam funds as of that date by the Trustees and Putnam employees. These amounts include investments by the Trustees’ and employees’ immediate family members and investments through retirement and deferred compensation plans.
| | |
| | Assets in the fund | Total assets in all Putnam funds |
|
| Trustees | $251,000 | $29,000,000 |
|
| Putnam employees | $3,556,000 | $311,000,000 |
|
Other Putnam funds managed by the Portfolio Managers
Steve Curbow is also a Portfolio Manager of Putnam Global Energy Fund.
Steve Curbow and John Morgan may also manage other accounts and variable trust funds advised by Putnam Management or an affiliate.
17
Terms and definitions
Important terms
Total return shows how the value of the fund’s shares changed over time, assuming you held the shares through the entire period and reinvested all distributions in the fund.
Net asset value (NAV) is the price, or value, of one share of a mutual fund, without a sales charge. NAVs fluctuate with market conditions. NAV is calculated by dividing the net assets of each class of shares by the number of outstanding shares in the class.
Public offering price (POP) is the price of a mutual fund share plus the maximum sales charge levied at the time of purchase. POP performance figures shown here assume the 5.75% maximum sales charge for class A shares and 3.50% for class M shares.
Contingent deferred sales charge (CDSC) is generally a charge applied at the time of the redemption of class B or C shares and assumes redemption at the end of the period. Your fund’s class B CDSC declines from a 5% maximum during the first year to 1% during the sixth year. After the sixth year, the CDSC no longer applies. The CDSC for class C shares is 1% for one year after purchase.
Share classes
Class A shares are generally subject to an initial sales charge and no CDSC (except on certain redemptions of shares bought without an initial sales charge).
Class B shares are not subject to an initial sales charge. They may be subject to a CDSC.
Class C shares are not subject to an initial sales charge and are subject to a CDSC only if the shares are redeemed during the first year.
Class M shares have a lower initial sales charge and a higher 12b-1 fee than class A shares and no CDSC (except on certain redemptions of shares bought without an initial sales charge).
Class R shares are not subject to an initial sales charge or CDSC and are available only to certain defined contribution plans.
Class Y shares are not subject to an initial sales charge or CDSC, and carry no 12b-1 fee. They are generally only available to corporate and institutional clients and clients in other approved programs.
Comparative indexes
Barclays Capital Aggregate Bond Index is an unmanaged index of U.S. investment-grade fixed-income securities.
Merrill Lynch U.S. 3-Month Treasury Bill Index is an unmanaged index that seeks to measure the performance of U.S. Treasury bills available in the marketplace.
Morgan Stanley Capital International (MSCI) World Energy & Materials Index is a free float-adjusted market-capitalization weighted index that is designed to measure the equity market performance of developed markets in the energy and materials sector.
S&P 500 Index is an unmanaged index of common stock performance.
Indexes assume reinvestment of all distributions and do not account for fees. Securities and performance of a fund and an index will differ. You cannot invest directly in an index.
Lipper is a third-party industry-ranking entity that ranks mutual funds. Its rankings do not reflect sales charges. Lipper rankings are based on total return at net asset value relative to other funds that have similar current investment styles or objectives as determined by Lipper. Lipper may change a fund’s category assignment at its discretion. Lipper category averages reflect performance trends for funds within a category.
18
Trustee approval of management contract
General conclusions
The Board of Trustees of the Putnam funds oversees the management of each fund and, as required by law, determines annually whether to approve the continuance of your fund’s management contract with Putnam Investment Management (“Putnam Management”) and the sub-management contract, in respect of your fund, between Putnam Management’s affiliate, Putnam Investments Limited (“PIL”), and Putnam Management. In May 2008, the Board of Trustees also approved a new sub-advisory contract among Putnam Management, PIL and another affiliate, The Putnam Advisory Company (“PAC”), in respect of your fund. In this regard, the Board of Trustees, with the assistance of its Contract Committee consisting solely of Trustees who are not “interested persons” (as such term is defined in the Investment Company Act of 1940, as amended) of the Putnam funds (the “Independent Trustees”), requests and evaluates all information it deems reason ably necessary under the circumstances. Over the course of several months ending in June 2008, the Contract Committee met several times to consider the information provided by Putnam Management and other information developed with the assistance of the Board’s independent counsel and independent staff. The Contract Committee reviewed and discussed key aspects of this information with all of the Independent Trustees. The Contract Committee recommended, and the Independent Trustees approved, the continuance of your fund’s management, sub-management and sub-advisory contracts, effective July 1, 2008. (Because PIL and PAC are affiliates of Putnam Management and Putnam Management remains fully responsible for all services provided by PIL and PAC, the Trustees have not evaluated PIL and PAC as separate entities, except as otherwise indicated below, and all subsequent references to Putnam Management below should be deemed to include reference to PIL and PAC as necessary or a ppropriate in the context.)
The Independent Trustees’ approval was based on the following conclusions:
• That the fee schedule in effect for your fund represented reasonable compensation in light of the nature and quality of the services being provided to the fund, the fees paid by competitive funds and the costs incurred by Putnam Management in providing such services, and
• That this fee schedule represented an appropriate sharing between fund shareholders and Putnam Management of such economies of scale as may exist in the management of the fund at current asset levels.
These conclusions were based on a comprehensive consideration of all information provided to the Trustees, were subject to the continued application of certain expense reductions and waivers and other considerations noted below, and were not the result of any single factor. Some of the factors that figured particularly in the Trustees’ deliberations and how the Trustees considered these factors are described below, although individual Trustees may have evaluated the information presented differently, giving different weights to various factors. It is also important to recognize that the fee arrangements for your fund and the other Putnam funds are the result of many years of review and discussion between the Independent Trustees and Putnam Management, that certain aspects of such arrangements may receive greater scrutiny in some years than others, and that the Trustees’
19
conclusions may be based, in part, on their consideration of these same arrangements in prior years.
Management fee schedules and
categories; total expenses
The Trustees reviewed the management fee schedules in effect for all Putnam funds, including fee levels and breakpoints, and the assignment of funds to particular fee categories. In reviewing fees and expenses, the Trustees generally focused their attention on material changes in circumstances — for example, changes in a fund’s size or investment style, changes in Putnam Management’s operating costs or responsibilities, or changes in competitive practices in the mutual fund industry — that suggest that consideration of fee changes might be warranted. The Trustees concluded that the circumstances did not warrant changes to the management fee structure of your fund, which had been carefully developed over the years, re-examined on many occasions and adjusted where appropriate. In this regard, the Trustees also noted that shareholders of your fund voted in 2007 to approve new management contracts containing an identical fee structure. The Trustees focuse d on two areas of particular interest, as discussed further below:
• Competitiveness. The Trustees reviewed comparative fee and expense information for competitive funds, which indicated that, in a custom peer group of competitive funds selected by Lipper Inc., your fund ranked in the 33rd percentile in management fees and in the 39th percentile in total expenses (less any applicable 12b-1 fees) as of December 31, 2007 (the first percentile being the least expensive funds and the 100th percentile being the most expensive funds). (Because the fund’s custom peer group is smaller than the fund’s broad Lipper Inc. peer group, this expense information may differ from the Lipper peer expense information found elsewhere in this report.) The Trustees noted that expense ratios for a number of Putnam funds, which show the percentage of fund assets used to pay for management and administrative services, distribution (12b-1) fees and o ther expenses, had been increasing recently as a result of declining net assets and the natural operation of fee breakpoints.
The Trustees noted that the expense ratio increases described above were currently being controlled by expense limitations initially implemented in January 2004. The Trustees have received a commitment from Putnam Management and its parent company to continue this program through at least June 30, 2009. These expense limitations give effect to a commitment by Putnam Management that the expense ratio of each open-end fund would be no higher than the average expense ratio of the competitive funds included in the fund’s relevant Lipper universe (exclusive of any applicable 12b-1 charges in each case). The Trustees observed that this commitment to limit fund expenses has served shareholders well since its inception.
In order to ensure that the expenses of the Putnam funds continue to meet evolving competitive standards, the Trustees requested, and Putnam Management agreed, to extend for the twelve months beginning July 1, 2008, an additional expense limitation for certain funds at an amount equal to the average expense ratio (exclusive of 12b-1 charges) of a custom peer group of competitive funds selected by Lipper to correspond to the size of the fund. This additional expense limitation will be applied to those open-end funds that had above-average expense ratios (exclusive of 12b-1 charges) based on the custom peer group data for the period ended December 31, 2007. This additional expense limitation will not be applied to your fund because it had a below-average expense ratio relative to its custom peer group.
20
In addition, the Trustees devoted particular attention to analyzing the Putnam funds’ fees and expenses relative to those of competitors in fund complexes of comparable size and with a comparable mix of asset categories. The Trustees concluded that this analysis did not reveal any matters requiring further attention at the current time.
• Economies of scale. Your fund currently has the benefit of breakpoints in its management fee that provide shareholders with significant economies of scale, which means that the effective management fee rate of the fund (as a percentage of fund assets) declines as the fund grows in size and crosses specified asset thresholds. Conversely, if the fund shrinks in size — as has been the case for many Putnam funds in recent years — these breakpoints result in increasing fee levels. In recent years, the Trustees have examined the operation of the existing breakpoint structure during periods of both growth and decline in asset levels. The Trustees concluded that the fee schedule in effect for your fund represented an appropriate sharing of economies of scale at current asset levels.
In connection with their review of the management fees and total expenses of the Putnam funds, the Trustees also reviewed the costs of the services to be provided and profits to be realized by Putnam Management and its affiliates from the relationship with the funds. This information included trends in revenues, expenses and profitability of Putnam Management and its affiliates relating to the investment management and distribution services provided to the funds. In this regard, the Trustees also reviewed an analysis of Putnam Management’s revenues, expenses and profitability with respect to the funds’ management contracts, allocated on a fund-by-fund basis.
Investment performance
The quality of the investment process provided by Putnam Management represented a major factor in the Trustees’ evaluation of the quality of services provided by Putnam Management under your fund’s management contract. The Trustees were assisted in their review of the Putnam funds’ investment process and performance by the work of the Investment Oversight Coordinating Committee of the Trustees and the Investment Oversight Committees of the Trustees, which had met on a regular monthly basis with the funds’ portfolio teams throughout the year. The Trustees concluded that Putnam Management generally provides a high-quality investment process —as measured by the experience and skills of the individuals assigned to the management of fund portfolios, the resources made available to such personnel, and in general the ability of Putnam Management to attract and retain high-quality personnel — but also recognized that this does not guarantee favorabl e investment results for every fund in every time period. The Trustees considered the investment performance of each fund over multiple time periods and considered information comparing each fund’s performance with various benchmarks and with the performance of competitive funds.
While the Trustees noted the satisfactory investment performance of certain Putnam funds, they considered the disappointing investment performance of many funds in recent periods, particularly over periods in 2007 and 2008. They discussed with senior management of Putnam Management the factors contributing to such underperformance and actions being taken to improve performance. The Trustees recognized that, in recent years, Putnam Management has taken steps to strengthen its investment personnel and processes to address areas of underperformance, including recent efforts to further centralize Putnam Management’s equity research function. In this regard, the
21
Trustees took into consideration efforts by Putnam Management to improve its ability to assess and mitigate investment risk in individual funds, across asset classes, and across the complex as a whole. The Trustees indicated their intention to continue to monitor performance trends to assess the effectiveness of these efforts and to evaluate whether additional changes to address areas of underperformance are warranted.
In the case of your fund, the Trustees considered that your fund’s class A share cumulative total return performance at net asset value was in the following percentiles of its Lipper Inc. peer group (Lipper Natural Resources Funds) for the one-year, three-year, and five-year periods ended December 31, 2007 (the first percentile being the best-performing funds and the 100th percentile being the worst-performing funds):
| | | |
| One-year period | 82nd | | |
| | |
| Three-year period | 70th | | |
| | |
| Five-year period | 70th | | |
| | |
(Because of the passage of time, these performance results may differ from the performance results for more recent periods shown elsewhere in this report.) Over the one-year, three-year and five-year periods ended December 31, 2007, there were 143, 99, and 75 funds, respectively, in your fund’s Lipper peer group.* Past performance is no guarantee of future returns.
The Trustees noted the disappointing performance for your fund for the one-year period ended December 31, 2007. In this regard, the Trustees considered Putnam Management’s belief that relative performance suffered in part because the fund was less concentrated than some competitors in particular industries and sectors with strong performance over recent periods. The Trustees also considered Putnam Management’s belief that the Large Cap Equities team’s leadership changes and the research centralization efforts underway in the equity space at Putnam Management more generally will strengthen the fund’s investment process, which focuses on a blend of quantitative techniques and fundamental analysis, and enhance its performance potential.
As a general matter, the Trustees believe that cooperative efforts between the Trustees and Putnam Management represent the most effective way to address investment performance problems. The Trustees noted that investors in the Putnam funds have, in effect, placed their trust in the Putnam organization, under the oversight of the funds’ Trustees, to make appropriate decisions regarding the management of the funds. Based on the responsiveness of Putnam Management in the recent past to Trustee concerns about investment performance, the Trustees concluded that it is preferable to seek change within Putnam Management to address performance shortcomings. In the Trustees’ view, the alternative of engaging a new investment adviser for an underperforming fund would entail significant disruptions and would not provide any greater assurance of improved investment performance.
* The percentile rankings for your fund’s class A share annualized total return performance in the Lipper Global Natural Resources Funds category for the one-year, five-year, and ten-year periods ended March 31, 2009, were 61%, 66%, and 88%, respectively. Over the one-year, five-year, and ten-year periods ended March 31, 2009, your fund ranked 62nd out of 101, 31st out of 46, and 28th out of 31 funds, respectively. Note that this more recent information was not available when theTrustees approved the continuance of your fund’s management contract.
22
Brokerage and soft-dollar allocations;
other benefits
The Trustees considered various potential benefits that Putnam Management may receive in connection with the services it provides under the management contract with your fund. These include benefits related to brokerage and soft-dollar allocations, whereby a portion of the commissions paid by a fund for brokerage may be used to acquire research services that may be useful to Putnam Management in managing the assets of the fund and of other clients. The Trustees considered changes made in 2008, at Putnam Management’s request, to the Putnam funds’ brokerage allocation policy, which expanded the permitted categories of brokerage and research services payable with soft dollars and increased the permitted soft dollar allocation to third-party services over what had been authorized in previous years. The Trustees indicated their continued intent to monitor the potential benefits associated with the allocation of fund brokerage and trends in industry practice to ensur e that the principle of seeking “best price and execution” remains paramount in the portfolio trading process.
The Trustees’ annual review of your fund’s management contract arrangements also included the review of its distributor’s contract and distribution plan with Putnam Retail Management Limited Partnership and the investor servicing agreement with Putnam Fiduciary Trust Company (“PFTC”), each of which provides benefits to affiliates of Putnam Management. In the case of the investor servicing agreement, the Trustees considered that certain shareholder servicing functions were shifted to a third-party service provider by PFTC in 2007.
Comparison of retail and institutional
fee schedules
The information examined by the Trustees as part of their annual contract review has included for many years information regarding fees charged by Putnam Management and its affiliates to institutional clients such as defined benefit pension plans, college endowments, etc. This information included comparisons of such fees with fees charged to the funds, as well as a detailed assessment of the differences in the services provided to these two types of clients. The Trustees observed, in this regard, that the differences in fee rates between institutional clients and mutual funds are by no means uniform when examined by individual asset sectors, suggesting that differences in the pricing of investment management services to these types of clients reflect to a substantial degree historical competitive forces operating in separate market places. The Trustees considered the fact that fee rates across different asset classes are typically higher on average for mutual funds than for institutional clients, as well as the differences between the services that Putnam Management provides to the Putnam funds and those that it provides to institutional clients of the firm, but did not rely on such comparisons to any significant extent in concluding that the management fees paid by your fund are reasonable.
Approval of the Sub-Advisory
Contract among Putnam
Management andThe Putnam
Advisory Company
In December 2008, the Trustees approved a new sub-advisory contract among Putnam Management and PAC in respect of your fund, under which PAC’s Singapore branch would begin providing discretionary investment
23
management services for your fund. The Contract Committee reviewed information provided by Putnam Management and PAC and, upon completion of this review, recommended, and the Independent Trustees and the full Board of Trustees approved, the sub-advisory contract in respect of your fund, effective December 30, 2008.
The Trustees considered numerous factors they believed relevant in approving your fund’s sub-advisory contract, including Putnam Management’s belief that the interest of shareholders would be best served by utilizing investment professionals in PAC’s Singapore office to manage a portion of your fund’s assets and PAC’s expertise in managing assets invested in Asian markets. The Trustees also considered that applicable securities laws require a sub-advisory relationship among Putnam Management, PIL and PAC in order for Putnam’s investment professionals in Singapore to be involved in the management of your fund. The Trustees noted that Putnam Management and/or PIL, but not your fund, would pay the sub-advisory fee to PAC for its services and that the sub-advisory relationship with PAC will not reduce the nature, quality or overall level of service provided to your fund.
24
Other information for shareholders
Important notice regarding delivery
of shareholder documents
In accordance with SEC regulations, Putnam sends a single copy of annual and semiannual shareholder reports, prospectuses, and proxy statements to Putnam shareholders who share the same address, unless a shareholder requests otherwise. If you prefer to receive your own copy of these documents, please call Putnam at 1-800-225-1581, and Putnam will begin sending individual copies within 30 days.
Proxy voting
Putnam is committed to managing our mutual funds in the best interests of our shareholders. The Putnam funds’ proxy voting guidelines and procedures, as well as information regarding how your fund voted proxies relating to portfolio securities during the 12-month period ended June 30, 2008, are available in the Individual Investors section of www.putnam.com, and on the SEC’s Web site, www.sec.gov. If you have questions about finding forms on the SEC’s Web site, you may call the SEC at 1-800-SEC-0330. You may also obtain the Putnam funds’ proxy voting guidelines and procedures at no charge by calling Putnam’s Shareholder Services at 1-800-225-1581.
Fund portfolio holdings
The fund will file a complete schedule of its portfolio holdings with the SEC for the first and third quarters of each fiscal year on Form N-Q. Shareholders may obtain the fund’s Forms N-Q on the SEC’s Web site at www.sec.gov. In addition, the fund’s Forms N-Q may be reviewed and copied at the SEC’s Public Reference Room in Washington, D.C. You may call the SEC at 1-800-SEC-0330 for information about the SEC’s Web site or the operation of the Public Reference Room.
25
Financial statements
A guide to f1inancial statements
These sections of the report, as well as the accompanying Notes, constitute the fund’s financial statements.
The fund’s portfolio lists all the fund’s investments and their values as of the last day of the reporting period. Holdings are organized by asset type and industry sector, country, or state to show areas of concentration and diversification.
Statement of assets and liabilities shows how the fund’s net assets and share price are determined. All investment and noninvestment assets are added together. Any unpaid expenses and other liabilities are subtracted from this total. The result is divided by the number of shares to determine the net asset value per share, which is calculated separately for each class of shares. (For funds with preferred shares, the amount subtracted from total assets includes the liquidation preference of preferred shares.)
Statement of operations shows the fund’s net investment gain or loss. This is done by first adding up all the fund’s earnings —from dividends and interest income — and subtracting its operating expenses to determine net investment income (or loss). Then, any net gain or loss the fund realized on the sales of its holdings — as well as any unrealized gains or losses over the period — is added to or subtracted from the net investment result to determine the fund’s net gain or loss for the fiscal period.
Statement of changes in net assets shows how the fund’s net assets were affected by the fund’s net investment gain or loss, by distributions to shareholders, and by changes in the number of the fund’s shares. It lists distributions and their sources (net investment income or realized capital gains) over the current reporting period and the most recent fiscal year-end. The distributions listed here may not match the sources listed in the Statement of operations because the distributions are determined on a tax basis and may be paid in a different period from the one in which they were earned. Dividend sources are estimated at the time of declaration. Actual results may vary. Any non-taxable return of capital cannot be determined until final tax calculations are completed after the end of the fund’s fiscal year.
Financial highlights provide an overview of the fund’s investment results, per-share distributions, expense ratios, net investment income ratios, and portfolio turnover in one summary table, reflecting the five most recent reporting periods. In a semiannual report, the highlight table also includes the current reporting period.
26
The fund’s portfolio 2/28/09 (Unaudited)
| | |
| COMMON STOCKS (100.2%)* | Shares | Value |
|
| Chemicals (12.6%) | | |
| Air Liquide SA (France) | 52,400 | $3,858,135 |
|
| BASF SE (Germany) | 159,133 | 4,421,046 |
|
| Givaudan SA (Switzerland) | 3,603 | 2,078,905 |
|
| Linde AG (Germany) | 32,273 | 2,086,490 |
|
| Monsanto Co. | 111,700 | 8,519,359 |
|
| Potash Corp. of Saskatchewan, Inc. (Canada) | 69,500 | 5,835,915 |
|
| Shin-Etsu Chemical Co. (Japan) | 74,800 | 3,327,482 |
|
| Syngenta AG (Switzerland) | 26,062 | 5,554,611 |
|
| | | 35,681,943 |
| Construction (1.4%) | | |
| CRH PLC (Ireland) | 123,791 | 2,571,027 |
|
| Martin Marietta Materials, Inc. | 17,800 | 1,362,768 |
|
| | | 3,933,795 |
| Containers (1.7%) | | |
| Ball Corp. | 78,837 | 3,176,343 |
|
| Rexam PLC (United Kingdom) | 422,586 | 1,579,089 |
|
| | | 4,755,432 |
| Electric utilities (1.0%) | | |
| Entergy Corp. | 19,423 | 1,308,916 |
|
| Exelon Corp. | 29,617 | 1,398,515 |
|
| | | 2,707,431 |
| Energy (oil field) (4.9%) | | |
| Aker Solutions ASA (Norway) | 155,100 | 835,325 |
|
| Cameron International Corp. † | 55,700 | 1,073,896 |
|
| National-Oilwell Varco, Inc. † | 116,100 | 3,103,353 |
|
| Saipem SpA (Italy) | 110,919 | 1,725,560 |
|
| Schlumberger, Ltd. | 90,400 | 3,440,624 |
|
| Weatherford International, Ltd. † | 352,100 | 3,756,907 |
|
| | | 13,935,665 |
| Energy (other) (0.2%) | | |
| First Solar, Inc. † | 5,193 | 549,108 |
|
| | | 549,108 |
| Metals (16.8%) | | |
| ArcelorMittal (Luxembourg) | 164,351 | 3,217,144 |
|
| Barrick Gold Corp. (Canada) | 127,600 | 3,864,991 |
|
| BHP Billiton PLC (United Kingdom) | 908,229 | 14,285,885 |
|
| Cia Vale do Rio Doce Class A (Preference) (Brazil) | 350,300 | 3,952,624 |
|
| Freeport-McMoRan Copper & Gold, Inc. Class B | 126,900 | 3,860,298 |
|
| Goldcorp, Inc. (Canada) | 132,000 | 3,843,328 |
|
| Newmont Mining Corp. | 72,200 | 3,005,686 |
|
| Nucor Corp. | 75,600 | 2,543,940 |
|
| POSCO (South Korea) | 5,869 | 1,188,677 |
|
| Salzgitter AG (Germany) | 22,187 | 1,379,041 |
|
| Steel Dynamics, Inc. | 136,100 | 1,136,435 |
|
| Teck Cominco, Ltd. Class B (Canada) | 427,800 | 1,506,433 |
|
| Usinas Siderurgicas de Minas Gerais SA Class A | | |
| (Usiminas) (Preference) (Brazil) | 126,700 | 1,381,668 |
|
| Xstrata PLC (Switzerland) | 241,921 | 2,390,109 |
|
| | | 47,556,259 |
27
| | |
| COMMON STOCKS (100.2%)* cont. | Shares | Value |
|
| Natural gas utilities (0.4%) | | |
| Southwestern Energy Co. † | 37,800 | $1,087,506 |
|
| | | 1,087,506 |
| Oil and gas (60.2%) | | |
| Apache Corp. | 24,931 | 1,473,173 |
|
| BG Group PLC (United Kingdom) | 677,786 | 9,673,088 |
|
| BP PLC (United Kingdom) | 2,074,022 | 13,261,300 |
|
| Chevron Corp. | 358,900 | 21,788,819 |
|
| China Petroleum & Chemical Corp. ADR (China) | 86,426 | 4,533,044 |
|
| ENI SpA (Italy) | 287,519 | 5,726,487 |
|
| EOG Resources, Inc. | 128,672 | 6,438,747 |
|
| Exxon Mobil Corp. | 384,600 | 26,114,338 |
|
| Hess Corp. | 108,500 | 5,933,865 |
|
| Marathon Oil Corp. | 327,698 | 7,625,532 |
|
| Nexen, Inc. (Canada) | 454,573 | 6,223,790 |
|
| Occidental Petroleum Corp. | 298,306 | 15,473,132 |
|
| Petroleo Brasileiro SA ADR (Brazil) | 269,776 | 7,480,888 |
|
| Saras SpA (Italy) | 281,588 | 820,245 |
|
| StatoilHydro ASA (Norway) | 289,600 | 4,852,149 |
|
| Suncor Energy, Inc. (Canada) | 182,289 | 3,799,722 |
|
| Total SA (France) | 301,257 | 14,276,866 |
|
| Ultra Petroleum Corp. † | 142,900 | 5,021,506 |
|
| XTO Energy, Inc. | 305,432 | 9,669,977 |
|
| | | 170,186,668 |
| Paper and forest products (1.0%) | | |
| Crown Holdings, Inc. † | 134,400 | 2,833,152 |
|
| | | 2,833,152 |
| Total common stocks (cost $349,435,848) | | $283,226,959 |
| |
| |
| SHORT-TERM INVESTMENTS (0.8%)* | Shares | Value |
|
| Federated Prime Obligations Fund | 2,356,045 | $2,356,045 |
|
| Total short-term investments (cost $2,356,045) | | $2,356,045 |
| |
| |
| TOTAL INVESTMENTS | | |
|
| Total investments (cost $351,791,893) | | $285,583,004 |
* Percentages indicated are based on net assets of $282,723,187.
† Non-income-producing security.
ADR after the name of a foreign holding stands for American Depository Receipts representing ownership of foreign securities on deposit with a custodian bank.
28
| | | | |
| DIVERSIFICATION BY COUNTRY | | | | |
| | |
| Distribution of investments by country of issue at February 28, 2009 (as a percentage of Portfolio Value): | |
| | | | | |
| United States | 50.3% | | Norway | 2.0% |
| |
|
| United Kingdom | 13.6 | | China | 1.6 |
| |
|
| Canada | 8.8 | | Japan | 1.2 |
| |
|
| France | 6.4 | | Luxembourg | 1.1 |
| |
|
| Brazil | 4.5 | | Ireland | 0.9 |
| |
|
| Switzerland | 3.5 | | South Korea | 0.4 |
| |
|
| Italy | 2.9 | | Total | 100.0% |
| | |
| Germany | 2.8 | | | |
| | |
In September 2006, the FASB issued Statement of Financial Accounting Standards No. 157, Fair Value Measurements (SFAS 157). SFAS 157 is effective for financial statements issued for fiscal years beginning after November 15, 2007 and interim periods within those fiscal years. While the adoption of SFAS 157 does not have a material effect on the fund’s net asset value, it does require additional disclosures about fair value measurements. The Standard establishes a three-level hierarchy for disclosure of fair value measurements. The valuation hierarchy is based upon the transparency of inputs to the valuation of the fund’s investments. The three levels are defined as follows:
Level 1 — Valuations based on quoted prices for identical securities in active markets.
Level 2 — Valuations based on quoted prices in markets that are not active or for which all significant inputs are observable, either directly or indirectly.
Level 3 — Valuations based on inputs that are unobservable and significant to the fair value measurement.
The following is a summary of the inputs used to value the fund’s net assets as of February 28, 2009:
| | |
| Valuation inputs | Investments in securities | Other financial instruments |
|
| Level 1 | $186,474,343 | $— |
|
| Level 2 | 99,108,661 | — |
|
| Level 3 | — | — |
|
| Total | $285,583,004 | $— |
Other financial instruments include futures, written options, TBA sale commitments, swaps and forward contracts which are valued at the unrealized appreciation/(depreciation) on the instrument.
The accompanying notes are an integral part of these financial statements.
29
Statement of assets and liabilities 2/28/09 (Unaudited)
| |
| ASSETS | |
|
| Investment in securities, at value (Note 1): | |
| Unaffiliated issuers (identified cost $351,791,893) | $285,583,004 |
|
| Dividends, interest and other receivables | 1,152,226 |
|
| Receivable for shares of the fund sold | 312,443 |
|
| Receivable for securities sold | 12,509,541 |
|
| Receivable for closed forward currency contracts (Note 1) | 229,412 |
|
| Foreign tax reclaim | 49,064 |
|
| Total assets | 299,835,690 |
| |
| |
| LIABILITIES | |
|
| Payable to custodian (Note 2) | 68 |
|
| Payable for securities purchased | 13,298,454 |
|
| Payable for shares of the fund repurchased | 917,629 |
|
| Payable for compensation of Manager (Note 2) | 524,193 |
|
| Payable for investor servicing fees (Note 2) | 219,479 |
|
| Payable for custodian fees (Note 2) | 22,438 |
|
| Payable for Trustee compensation and expenses (Note 2) | 74,066 |
|
| Payable for administrative services (Note 2) | 4,013 |
|
| Payable for distribution fees (Note 2) | 141,041 |
|
| Payable for closed forward currency contracts (Note 1) | 1,557,080 |
|
| Payable for receivable purchase agreement (Note 2) | 246,175 |
|
| Other accrued expenses | 107,867 |
|
| Total liabilities | 17,112,503 |
| |
| Net assets | $282,723,187 |
|
| |
| REPRESENTED BY | |
|
| Paid-in capital (Unlimited shares authorized) (Notes 1 and 4) | $548,382,829 |
|
| Undistributed net investment income (Note 1) | 4,419,111 |
|
| Accumulated net realized loss on investments and foreign currency transactions (Note 1) | (204,215,332) |
|
| Net unrealized depreciation of investments and assets and liabilities in foreign currencies | (65,863,421) |
|
| Total — Representing net assets applicable to capital shares outstanding | $282,723,187 |
| |
| |
| COMPUTATION OF NET ASSET VALUE AND OFFERING PRICE | |
|
| Net asset value and redemption price per class A share ($228,936,896 divided by 19,421,865 shares) | $11.79 |
|
| Offering price per class A share (100/94.25 of $11.79)* | $12.51 |
|
| Net asset value and offering price per class B share ($26,624,097 divided by 2,511,267 shares)** | $10.60 |
|
| Net asset value and offering price per class C share ($10,265,025 divided by 946,001 shares)** | $10.85 |
|
| Net asset value and redemption price per class M share ($3,743,825 divided by 332,284 shares) | $11.27 |
|
| Offering price per class M share (100/96.50 of $11.27)* | $11.68 |
|
| Net asset value, offering price and redemption price per class R share | |
| ($6,054,491 divided by 521,867 shares) | $11.60 |
|
| Net asset value, offering price and redemption price per class Y share | |
| ($7,098,853 divided by 599,274 shares) | $11.85 |
|
* On single retail sales of less than $50,000. On sales of $50,000 or more the offering price is reduced.
** Redemption price per share is equal to net asset value less any applicable contingent deferred sales charge.
The accompanying notes are an integral part of these financial statements.
30
Statement of operations Six months ended 2/28/09 (Unaudited)
| |
| INVESTMENT INCOME | |
|
| Dividends (net of foreign tax of $177,397) | $4,572,079 |
|
| Interest (including interest income of $2,776 from investments in affiliated issuers) (Note 5) | 30,552 |
|
| Securities lending | 54,349 |
|
| Total investment income | 4,656,980 |
| |
| |
| EXPENSES | |
|
| Compensation of Manager (Note 2) | 1,307,263 |
|
| Investor servicing fees (Note 2) | 722,979 |
|
| Custodian fees (Note 2) | 14,630 |
|
| Trustee compensation and expenses (Note 2) | 20,354 |
|
| Administrative services (Note 2) | 11,545 |
|
| Distribution fees — Class A (Note 2) | 376,786 |
|
| Distribution fees — Class B (Note 2) | 184,297 |
|
| Distribution fees — Class C (Note 2) | 67,738 |
|
| Distribution fees — Class M (Note 2) | 18,414 |
|
| Distribution fees — Class R (Note 2) | 16,033 |
|
| Other | 125,103 |
|
| Fees waived and reimbursed by Manager (Notes 2 and 5) | (23,750) |
|
| Total expenses | 2,841,392 |
| | |
| Expense reduction (Note 2) | (30,465) |
|
| Net expenses | 2,810,927 |
| |
| Net investment income | 1,846,053 |
|
| |
| Net realized loss on investments (Notes 1 and 3) | (190,526,260) |
|
| Net realized loss on foreign currency transactions (Note 1) | (7,193,329) |
|
| Net unrealized appreciation of assets and liabilities in foreign currencies during the period | 2,600,773 |
|
| Net unrealized depreciation of investments during the period | (144,601,673) |
|
| Net loss on investments | (339,720,489) |
| |
| Net decrease in net assets resulting from operations | $(337,874,436) |
|
The accompanying notes are an integral part of these financial statements.
31
Statement of changes in net assets
| | |
| DECREASE IN NET ASSETS | Six months ended 2/28/09* | Year ended 8/31/08 |
|
| Operations: | | |
| Net investment income | $1,846,053 | $5,869,043 |
|
| Net realized gain (loss) on investments | | |
| and foreign currency transactions | (197,719,589) | 66,944,856 |
|
| Net unrealized depreciation of investments | | |
| and assets and liabilities in foreign currencies | (142,000,900) | (98,566,067) |
|
| Net decrease in net assets resulting from operations | (337,874,436) | (25,752,168) |
|
| Distributions to shareholders: (Note 1) | | |
| From ordinary income | | |
| Net investment income | | |
|
| Class A | — | (1,376,243) |
|
| Class B | — | — |
|
| Class C | — | — |
|
| Class M | — | — |
|
| Class R | — | (13,045) |
|
| Class Y | — | (86,343) |
|
| Net realized short-term gain on investments | | |
|
| Class A | — | (24,433,016) |
|
| Class B | — | (4,154,652) |
|
| Class C | — | (1,171,769) |
|
| Class M | — | (420,128) |
|
| Class R | — | (324,194) |
|
| Class Y | — | (770,937) |
|
| From net realized long-term gain on investments | | |
| Class A | (36,219,606) | (88,138,160) |
|
| Class B | (4,836,271) | (14,987,235) |
|
| Class C | (1,756,484) | (4,226,968) |
|
| Class M | (617,735) | (1,515,549) |
|
| Class R | (847,600) | (1,169,476) |
|
| Class Y | (1,049,530) | (2,781,032) |
|
| Redemption fees (Note 1) | 39,546 | 130,757 |
|
| Increase (decrease) from capital share transactions (Note 4) | (25,454,255) | 149,824,388 |
|
| Total decrease in net assets | (408,616,371) | (21,365,770) |
| |
| |
| NET ASSETS | | |
|
| Beginning of period | 691,339,558 | 712,705,328 |
|
| End of period (including undistributed net investment income | | |
| of $4,419,111 and $2,573,058, respectively) | $282,723,187 | $691,339,558 |
|
* Unaudited
The accompanying notes are an integral part of these financial statements.
32
|
| This page left blank intentionally. |
33
Financial highlights (For a common share outstanding throughout the period)
| | | | | | | | | | | | | | |
| INVESTMENT OPERATIONS: | | | LESS DISTRIBUTIONS: | | | RATIOS AND SUPPLEMENTAL DATA: | |
|
| | | | | | | | | | | | | Ratio | Ratio of net | |
| | | Net | Net realized | | | | | | | | | of expenses | investment | |
| | Net asset value, | investment | and unrealized | Total from | From net | From net | | | Net asset | Total return | Net assets, | to average | income (loss) | |
| | beginning | income | gain (loss) on | investment | investment | realized gain | Total | Redemption | value, end | at net asset | end of period | net assets | to average | Portfolio |
| Period ended | of period | (loss) a,b | investments | operations | income | on investments | distributions | fees | of period | value (%) c | (in thousands) | (%) b,d | net assets (%) b | turnover (%) |
|
| Class A | | | | | | | | | | | | | | |
| February 28, 2009 ** | $27.99 | .09 | (14.19) | (14.10) | — | (2.10) | (2.10) | — e | $11.79 | (50.83) * | $228,937 | .70 * | .54 * | 41.37 * |
| August 31, 2008 | 35.18 | .29 | (.54) | (.25) | (.08) | (6.87) | (6.95) | .01 | 27.99 | (2.76) | 559,989 | 1.18 | .87 | 98.54 |
| August 31, 2007 | 31.31 | .17 | 7.36 | 7.53 | (.42) | (3.25) | (3.67) | .01 | 35.18 | 26.01 | 557,614 | 1.23 | .52 | 63.78 |
| August 31, 2006 | 31.01 | .14 f | 4.04 | 4.18 | (.03) | (3.86) | (3.89) | .01 | 31.31 | 14.92 | 471,531 | 1.20 f | .45 f | 56.42 |
| August 31, 2005 | 22.78 | .23 g | 10.48 | 10.71 | — | (2.49) | (2.49) | .01 | 31.01 | 50.62 g | 368,872 | 1.22 | .87 g | 81.22 |
| August 31, 2004 | 17.92 | .16 | 4.69 | 4.85 | — | — | — | .01 | 22.78 | 27.12 | 183,294 | 1.33 | .77 | 74.37 |
|
| Class B | | | | | | | | | | | | | | |
| February 28, 2009 ** | $25.66 | .02 | (12.98) | (12.96) | — | (2.10) | (2.10) | — e | $10.60 | (51.02) * | $26,624 | 1.07 * | .17 * | 41.37 * |
| August 31, 2008 | 32.93 | .02 | (.43) | (.41) | — | (6.87) | (6.87) | .01 | 25.66 | (3.52) | 70,360 | 1.93 | .08 | 98.54 |
| August 31, 2007 | 29.48 | (.07) | 6.91 | 6.84 | (.15) | (3.25) | (3.40) | .01 | 32.93 | 25.05 | 98,246 | 1.98 | (.24) | 63.78 |
| August 31, 2006 | 29.58 | (.10) f | 3.85 | 3.75 | — | (3.86) | (3.86) | .01 | 29.48 | 14.11 | 121,924 | 1.95 f | (.33) f | 56.42 |
| August 31, 2005 | 21.98 | .02 g | 10.06 | 10.08 | — | (2.49) | (2.49) | .01 | 29.58 | 49.53 g | 134,729 | 1.97 | .09 g | 81.22 |
| August 31, 2004 | 17.42 | .01 | 4.54 | 4.55 | — | — | — | .01 | 21.98 | 26.18 | 86,574 | 2.08 | .03 | 74.37 |
|
| Class C | | | | | | | | | | | | | | |
| February 28, 2009 ** | $26.18 | .03 | (13.26) | (13.23) | — | (2.10) | (2.10) | — e | $10.85 | (51.03) * | $10,265 | 1.07 * | .17 * | 41.37 * |
| August 31, 2008 | 33.46 | .04 | (.45) | (.41) | — | (6.87) | (6.87) | — e | 26.18 | (3.49) | 25,383 | 1.93 | .12 | 98.54 |
| August 31, 2007 | 29.90 | (.07) | 7.02 | 6.95 | (.15) | (3.25) | (3.40) | .01 | 33.46 | 25.07 | 24,489 | 1.98 | (.24) | 63.78 |
| August 31, 2006 | 29.96 | (.10) f | 3.89 | 3.79 | — | (3.86) | (3.86) | .01 | 29.90 | 14.06 | 24,107 | 1.95 f | (.33) f | 56.42 |
| August 31, 2005 | 22.23 | .03 g | 10.18 | 10.21 | — | (2.49) | (2.49) | .01 | 29.96 | 49.55 g | 25,518 | 1.97 | .10 g | 81.22 |
| August 31, 2004 | 17.62 | — e | 4.60 | 4.60 | — | — | — | .01 | 22.23 | 26.16 | 14,322 | 2.08 | .01 | 74.37 |
|
| Class M | | | | | | | | | | | | | | |
| February 28, 2009 ** | $27.00 | .05 | (13.68) | (13.63) | — | (2.10) | (2.10) | — e | $11.27 | (50.96) * | $3,744 | .95 * | .30 * | 41.37 * |
| August 31, 2008 | 34.22 | .12 | (.48) | (.36) | — | (6.87) | (6.87) | .01 | 27.00 | (3.20) | 9,172 | 1.68 | .36 | 98.54 |
| August 31, 2007 | 30.55 | — e | 7.17 | 7.17 | (.26) | (3.25) | (3.51) | .01 | 34.22 | 25.36 | 9,283 | 1.73 | .01 | 63.78 |
| August 31, 2006 | 30.46 | (.01) f | 3.95 | 3.94 | — | (3.86) | (3.86) | .01 | 30.55 | 14.35 | 8,036 | 1.70 f | (.04) f | 56.42 |
| August 31, 2005 | 22.51 | .10 g | 10.33 | 10.43 | — | (2.49) | (2.49) | .01 | 30.46 | 49.94 g | 6,438 | 1.72 | .37 g | 81.22 |
| August 31, 2004 | 17.80 | .05 | 4.65 | 4.70 | — | — | — | .01 | 22.51 | 26.46 | 3,207 | 1.83 | .26 | 74.37 |
|
| Class R | | | | | | | | | | | | | | |
| February 28, 2009 ** | $27.64 | .06 | (14.00) | (13.94) | — | (2.10) | (2.10) | — e | $11.60 | (50.90) * | $6,054 | .83 * | .42 * | 41.37 * |
| August 31, 2008 | 34.87 | .22 | (.53) | (.31) | (.06) | (6.87) | (6.93) | .01 | 27.64 | (2.99) | 10,129 | 1.43 | .69 | 98.54 |
| August 31, 2007 | 31.09 | .08 | 7.31 | 7.39 | (.37) | (3.25) | (3.62) | .01 | 34.87 | 25.69 | 5,684 | 1.48 | .25 | 63.78 |
| August 31, 2006 | 30.89 | .10 f | 3.98 | 4.08 | (.03) | (3.86) | (3.89) | .01 | 31.09 | 14.62 | 2,370 | 1.45 f | .28 f | 56.42 |
| August 31, 2005 | 22.74 | .21 g | 10.42 | 10.63 | — | (2.49) | (2.49) | .01 | 30.89 | 50.34 g | 699 | 1.47 | .78 g | 81.22 |
| August 31, 2004 † | 18.32 | .12 | 4.30 | 4.42 | — | — | — | — e | 22.74 | 24.13 * | 72 | 1.19 * | .63 * | 74.37 |
|
| Class Y | | | | | | | | | | | | | | |
| February 28, 2009 ** | $28.07 | .11 | (14.23) | (14.12) | — | (2.10) | (2.10) | — e | $11.85 | (50.75) * | $7,099 | .58 * | .67 * | 41.37 * |
| August 31, 2008 | 35.26 | .38 | (.54) | (.16) | (.17) | (6.87) | (7.04) | .01 | 28.07 | (2.51) | 16,306 | .93 | 1.16 | 98.54 |
| August 31, 2007 | 31.38 | .25 | 7.37 | 7.62 | (.50) | (3.25) | (3.75) | .01 | 35.26 | 26.30 | 17,390 | .98 | .77 | 63.78 |
| August 31, 2006 † † | 32.74 | .22 f | 2.31 | 2.53 | (.04) | (3.86) | (3.90) | .01 | 31.38 | 9.14 * | 14,795 | .87 *f | .73 *f | 56.42 |
|
See notes to financial highlights at the end of this section.
The accompanying notes are an integral part of these financial statements.
Financial highlights (Continued)
* Not annualized.
** Unaudited.
† For the period December 1, 2003 (commencement of operations) to August 31, 2004.
† † For the period October 4, 2005 (commencement of operations) to August 31, 2006.
a Per share net investment income (loss) has been determined on the basis of the weighted average number of shares outstanding during the period.
b Reflects an involuntary contractual expense limitation and/or waivers of certain fund expenses in connection with investments in Putnam Prime Money Market Fund in effect during the period. As a result of such limitation and/or waivers, the expenses of each class reflect a reduction of the following amounts (Notes 2 and 5):
| | |
| | | Percentage of |
| | | average net assets |
|
| February 28, 2009 | | 0.01% |
|
| August 31, 2008 | | <0.01 |
|
| August 31, 2007 | | <0.01 |
|
| August 31, 2006 | | <0.01 |
|
| August 31, 2005 | | <0.01 |
|
| August 31, 2004 | | <0.01 |
|
c Total return assumes dividend reinvestment and does not reflect the effect of sales charges.
d Includes amounts paid through expense offset and brokerage/service arrangements (Note 2).
e Amount represents less than $0.01 per share.
f Reflects a non-recurring reimbursement from Putnam Investments relating to the calculation of certain amounts paid by the fund to Putnam in previous years for transfer agent services, which amounted to less than $0.01 per share and 0.01% of average net assets for the period ended August 31, 2006.
g Reflects a non-recurring accrual related to Putnam Management’s settlement with the SEC regarding brokerage allocation practices, which amounted to the following amounts:
| | |
| | | Percentage of |
| | Per share | average net assets |
|
| Class A | $0.02 | 0.06% |
|
| Class B | 0.02 | 0.06 |
|
| Class C | 0.02 | 0.06 |
|
| Class M | 0.02 | 0.06 |
|
| Class R | 0.01 | 0.05 |
|
The accompanying notes are an integral part of these financial statements.
36
Notes to financial statements 2/28/09 (Unaudited)
Note 1: Significant accounting policies
Putnam Global Natural Resources Fund (the “fund”), a Massachusetts business trust, is registered under the Investment Company Act of 1940, as amended, as a diversified, open-end management investment company. The fund seeks capital appreciation by investing primarily in common stocks worldwide of large and midsized companies in the energy and natural resources industries. The fund concentrates its investments in one sector, which involves more risk than a fund that invests more broadly.
The fund offers class A, class B, class C, class M, class R and class Y shares. Class A and class M shares are sold with a maximum front-end sales charge of 5.75% and 3.50%, respectively, and generally do not pay a contingent deferred sales charge. Class B shares, which convert to class A shares after approximately eight years, do not pay a front-end sales charge and are subject to a contingent deferred sales charge, if those shares are redeemed within six years of purchase. Class C shares have a one-year 1.00% contingent deferred sales charge and do not convert to class A shares. Class R shares, which are offered to qualified employee-benefit plans, are sold at net asset value. The expenses for class A, class B, class C, class M and class R shares may differ based on the distribution fee of each class, which is identified in Note 2. Class Y shares, which are sold at net asset value, are generally subject to the same expenses as class A, class B, class C, class M an d class R shares, but do not bear a distribution fee. Class Y shares are generally only available to corporate and institutional clients and clients in other approved programs.
A 1.00% redemption fee may apply on any shares that are redeemed (either by selling or exchanging into another fund) within 90 days of purchase. The redemption fee is accounted for as an addition to paid-in-capital.
Investment income, realized and unrealized gains and losses and expenses of the fund are borne pro-rata based on the relative net assets of each class to the total net assets of the fund, except that each class bears expenses unique to that class (including the distribution fees applicable to such classes). Each class votes as a class only with respect to its own distribution plan or other matters on which a class vote is required by law or determined by the Trustees. If the fund were liquidated, shares of each class would receive their pro-rata share of the net assets of the fund. In addition, the Trustees declare separate dividends on each class of shares.
In the normal course of business, the fund enters into contracts that may include agreements to indemnify another party under given circumstances. The fund’s maximum exposure under these arrangements is unknown as this would involve future claims that may be, but have not yet been, made against the fund. However, the fund’s management team expects the risk of material loss to be remote.
The following is a summary of significant accounting policies consistently followed by the fund in the preparation of its financial statements. The preparation of financial statements is in conformity with accounting principles generally accepted in the United States of America and requires management to make estimates and assumptions that affect the reported amounts of assets and liabilities in the financial statements and the reported amounts of increases and decreases in net assets from operations during the reporting period. Actual results could differ from those estimates.
A) Security valuation Investments for which market quotations are readily available are valued at the last reported sales price on their principal exchange, or official closing price for certain markets. If no sales are reported — as in the case of some securities traded over-the-counter — a security is valued at its last reported bid price. Many securities markets and exchanges outside the U.S. close prior to the close of the New York Stock Exchange and therefore the closing prices for securities in such markets or on such exchanges may not fully reflect events that occur after such close but before the close of the New York Stock Exchange. Accordingly, on certain days, the fund will fair value foreign equity securities taking into account multiple factors, including movements in the U.S. securities markets. The number of days on which fair value prices will be used will depend on market activity and it is possib le that fair value prices will be used by the fund to a significant extent. At February 28, 2009, fair value pricing was used for certain foreign securities in the portfolio. Securities quoted in foreign currencies, if any, are translated into U.S. dollars at the current exchange rate. To the extent a pricing service or dealer is unable to value a security or provides a valuation which Putnam Investment Management, LLC (“Putnam Management”), the fund’s manager, a wholly-owned subsidiary of
37
Putnam Investments, LLC, does not believe accurately reflects the security’s fair value, the security will be valued at fair value by Putnam Management. Certain investments, including certain restricted and illiquid securities and derivatives, are also valued at fair value following procedures approved by the Trustees. Such valuations and procedures are reviewed periodically by the Trustees. The fair value of securities is generally determined as the amount that the fund could reasonably expect to realize from an orderly disposition of such securities over a reasonable period of time. By its nature, a fair value price is a good faith estimate of the value of a security at a given point in time and does not reflect an actual market price, which may be different by a material amount.
B) Joint trading account Pursuant to an exemptive order from the Securities and Exchange Commission (the “SEC”), the fund may transfer uninvested cash balances, including cash collateral received under security lending arrangements, into a joint trading account along with the cash of other registered investment companies and certain other accounts managed by Putnam Management. These balances may be invested in issues of short-term investments having maturities of up to 397 days for collateral received under security lending arrangements and up to 90 days for other cash investments.
C) Repurchase agreements The fund, or any joint trading account, through its custodian, receives delivery of the underlying securities, the market value of which at the time of purchase is required to be in an amount at least equal to the resale price, including accrued interest. Collateral for certain tri-party repurchase agreements is held at the counterparty’s custodian in a segregated account for the benefit of the fund and the counterparty. Putnam Management is responsible for determining that the value of these underlying securities is at all times at least equal to the resale price, including accrued interest.
D) Security transactions and related investment income Security transactions are recorded on the trade date (the date the order to buy or sell is executed). Gains or losses on securities sold are determined on the identified cost basis.
Interest income is recorded on the accrual basis. Dividend income, net of applicable withholding taxes, is recognized on the ex-dividend date except that certain dividends from foreign securities, if any, are recognized as soon as the fund is informed of the ex-dividend date. Non-cash dividends, if any, are recorded at the fair market value of the securities received. Dividends representing a return of capital or capital gains, if any, are reflected as a reduction of cost and/or as a realized gain.
E) Foreign currency translation The accounting records of the fund are maintained in U.S. dollars. The market value of foreign securities, currency holdings, and other assets and liabilities is recorded in the books and records of the fund after translation to U.S. dollars based on the exchange rates on that day. The cost of each security is determined using historical exchange rates. Income and withholding taxes are translated at prevailing exchange rates when earned or incurred.The fund does not isolate that portion of realized or unrealized gains or losses resulting from changes in the foreign exchange rate on investments from fluctuations arising from changes in the market prices of the securities. Such gains and losses are included with the net realized and unrealized gain or loss on investments. Net realized gains and losses on foreign currency transactions represent net realized exchange gains or losses on closed for ward currency contracts, disposition of foreign currencies, currency gains and losses realized between the trade and settlement dates on securities transactions and the difference between the amount of investment income and foreign withholding taxes recorded on the fund’s books and the U.S. dollar equivalent amounts actually received or paid. Net unrealized appreciation and depreciation of assets and liabilities in foreign currencies arise from changes in the value of open forward currency contracts and assets and liabilities other than investments at the period end, resulting from changes in the exchange rate. Investments in foreign securities involve certain risks, including those related to economic instability, unfavorable political developments, and currency fluctuations, not present with domestic investments.
F) Forward currency contracts The fund may buy and sell forward currency contracts, which are agreements between two parties to buy and sell currencies at a set price on a future date. These contracts are used to protect against a decline in value relative to the U.S. dollar of the currencies in which its portfolio securities are denominated or quoted (or an increase in the value of a currency in which securities a fund intends to buy are denominated, when a fund holds cash reserves and short term investments), or for other investment purposes. The U.S. dollar value of forward currency contracts is determined using current forward currency exchange rates supplied by a quotation service. The market value of the contract will fluctuate with changes in currency exchange rates. The contract is marked to market daily and the change in market value is recorded as an unrealized gain or loss. When
38
the contract is closed, the fund records a realized gain or loss equal to the difference between the value of the contract at the time it was opened and the value at the time it was closed. The fund could be exposed to risk if the value of the currency changes unfavorably, if the counterparties to the contracts are unable to meet the terms of their contracts or if the fund is unable to enter into a closing position. Risks may exceed amounts recognized on the Statement of assets and liabilities. Forward currency contracts outstanding at period end, if any, are listed after the fund’s portfolio.
G) Master agreements The fund is a party to ISDA (International Swap and Derivatives Association, Inc.) Master Agreements (“Master Agreements”) with certain counterparties that govern over the counter derivative and foreign exchange contracts entered into from time to time. The Master Agreements may contain provisions regarding, among other things, the parties’ general obligations, representations, agreements, collateral requirements, events of default and early termination. With respect to certain counterparties, in accordance with the terms of the Master Agreement, collateral posted to the fund is held in a segregated account by the fund’s custodian; collateral pledged by the fund is segregated by the fund’s custodian and identified in The fund’s portfolio. Collateral can be in the form of cash or debt securities issued by the U.S. Government or related agencies or other securities as agreed to by the fund and the applicable counterparty Termination events applicable to the fund may occur upon a decline in the fund’s net assets below a specified threshold over a certain period of time. Termination events applicable to counterparties may occur upon a decline in the counterparty’s long and short term ratings below a specified level. In each case, upon occurrence, the other party may elect to terminate early and cause settlement of all derivative and foreign exchange contracts outstanding, including the payment of any losses and costs resulting from such early termination, as reasonably determined by the terminating party. Any decision by one or more of the fund’s counterparties to elect early termination could impact the fund’s future derivative activity.
H) Securities lending The fund may lend securities, through its agents, to qualified borrowers in order to earn additional income. The loans are collateralized by cash and/or securities in an amount at least equal to the market value of the securities loaned. The market value of securities loaned is determined daily and any additional required collateral is allocated to the fund on the next business day. The risk of borrower default will be borne by the fund’s agents; the fund will bear the risk of loss with respect to the investment of the cash collateral. Income from securities lending is included in investment income on the Statement of operations. At February 28, 2009, the fund had no securities out on loan.
I) Federal taxes It is the policy of the fund to distribute all of its taxable income within the prescribed time and otherwise comply with the provisions of the Internal Revenue Code of 1986, as amended (the“Code”), applicable to regulated investment companies. It is also the intention of the fund to distribute an amount sufficient to avoid imposition of any excise tax under Section 4982 of the Code. The fund is subject to the provisions of FASB Interpretation No. 48, Accounting for Uncertainties in Income Taxes (“FIN 48”). FIN 48 sets forth a minimum threshold for financial statement recognition of the benefit of a tax position taken or expected to be taken in a tax return. The fund did not have any unrecognized tax benefits in the accompanying financial statements. Therefore, no provision has been made for federal taxes on i ncome, capital gains or unrealized appreciation on securities held nor for excise tax on income and capital gains. Each of the fund’s federal tax returns for the prior three fiscal years remains subject to examination by the Internal Revenue Service.
The aggregate identified cost on a tax basis is $362,257,841, resulting in gross unrealized appreciation and depreciation of $10,287,936 and $86,962,773, respectively, or net unrealized depreciation of $76,674,837.
J) Distributions to shareholders Distributions to shareholders from net investment income are recorded by the fund on the ex-dividend date. Distributions from capital gains, if any, are recorded on the ex-dividend date and paid at least annually. The amount and character of income and gains to be distributed are determined in accordance with income tax regulations, which may differ from generally accepted accounting principles. Dividend sources are estimated at the time of declaration. Actual results may vary. Any non-taxable return of capital cannot be determined until final tax calculations are completed after the end of the fund’s fiscal year. Reclassifications are made to the fund’s capital accounts to reflect income and gains available for distribution (or available capital loss carryovers) under income tax regulations.
Note 2: Management fee, administrative
services and other transactions
The fund pays Putnam Management for management and investment advisory services quarterly based on the average net assets of the fund. Such fee is based on the following annual rates: 0.70% of the first
39
$500 million of average net assets, 0.60% of the next $500 million, 0.55% of the next $500 million, 0.50% of the next $5 billion, 0.475% of the next $5 billion, 0.455% of the next $5 billion, 0.44% of the next $5 billion, and 0.43% thereafter.
Putnam Management has agreed to waive fees and reimburse expenses of the fund through June 30, 2009 to the extent necessary to ensure that the fund’s expenses do not exceed the simple average of the expenses of all front-end load funds viewed by Lipper Inc. as having the same investment classification or objective as the fund. The expense reimbursement is based on a comparison of the fund’s expenses with the average annualized operating expenses of the funds in its Lipper peer group for each calendar quarter during the fund’s last fiscal year, excluding 12b-1 fees and without giving effect to any expense offset and brokerage/service arrangements that may reduce fund expenses. For the period ended February 28, 2009, Putnam Management waived $23,518 of its management fee from the fund.
Putnam Investments Limited (“PIL”), an affiliate of Putnam Management, is authorized by the Trustees to manage a separate portion of the assets of the fund as determined by Putnam Management from time to time. Putnam Management pays a quarterly sub-management fee to PIL for its services at an annual rate of 0.35% of the average net assets of the portion of the fund managed by PIL.
Effective December 30, 2008, The Putnam Advisory Company, LLC (“PAC”), an affiliate of Putnam Management, is authorized by the Trustees to manage and provide investment recommendations with respect to a portion of the assets of the fund, as designated from time to time by Putnam Management or PIL. Putnam Management or PIL, as applicable, pays a quarterly sub-advisory fee to PAC for its services at the annual rate of 0.35% of the average net assets of the portion of the fund’s assets managed and 0.10% of the average net assets of the portion of the fund’s assets for which PAC provides investment recommendations.
On September 26, 2008, the fund entered into an Agreement with another registered investment company (the “Seller”) managed by Putnam Management. Under the Agreement, the Seller sold to the fund the right to receive, in the aggregate, $955,226 in net payments from Lehman Brothers Special Financing, Inc. in connection with certain terminated derivatives transactions (the“Receivable”), in exchange for an initial payment plus (or minus) additional amounts based on the fund’s ultimate realized gain (or loss) with respect to the Receivable. The Receivable will be offset against the fund’s net payable to Lehman Brothers Special Financing, Inc. and is included in the Statement of assets and liabilities within Payable for closed forward currency contracts. Future payments under the Agreement are valued at fair value following procedures approved by the Trustees and are included in the Statement of assets and liabilities. All remaining payments under the Agreement will be recorded as realized gain or loss.
The fund reimburses Putnam Management an allocated amount for the compensation and related expenses of certain officers of the fund and their staff who provide administrative services to the fund. The aggregate amount of all such reimbursements is determined annually by the Trustees.
Custodial functions for the fund’s assets were provided by State Street Bank and Trust Company (“State Street”). Custody fees are based on the fund’s asset level, the number of its security holdings and transaction volumes.
Putnam Investor Services, Inc., an affiliate of Putnam Management, provided investor servicing agent functions to the fund. Prior to December 31, 2008, these services were provided by Putnam Investor Services, a division of Putnam Fiduciary Trust Company (“PFTC”), which is an affiliate of Putnam Management. Putnam Investor Services, Inc. and Putnam Investor Services received fees for investor servicing, subject to certain limitations, based on the number of shareholder accounts in the fund and the level of defined contribution plan assets in the fund. The amounts incurred for investor servicing agent functions provided by affiliates of Putnam Management during the six months ended February 28, 2009 are included in Investor servicing fees in the Statement of operations.
Under the custodian contract between the fund and State Street, the custodian bank has a lien on the securities of the fund to the extent permitted by the fund’s investment restrictions to cover any advances made by the custodian bank for the settlement of securities purchased by the fund. At February 28, 2009, the payable to the custodian bank represents the amount due for cash advanced for the settlement of securities purchased.
The fund has entered into expense offset arrangements with PFTC and State Street whereby PFTC’s and State Street’s fees are reduced by credits allowed on cash balances. The fund also reduced expenses through brokerage/service arrangements. For the six months ended February 28, 2009, the fund’s expenses were reduced by $3,233 under the expense offset
40
arrangements and by $27,232 under the brokerage/ service arrangements.
Each independentTrustee of the fund receives an annual Trustee fee, of which $403, as a quarterly retainer, has been allocated to the fund, and an additional fee for each Trustees meeting attended. Trustees receive additional fees for attendance at certain committee meetings and industry seminars and for certain compliance-related matters. Trustees also are reimbursed for expenses they incur relating to their services as Trustees.
The fund has adopted a Trustee Fee Deferral Plan (the “Deferral Plan”) which allows the Trustees to defer the receipt of all or a portion of Trustees fees payable on or after July 1, 1995. The deferred fees remain invested in certain Putnam funds until distribution in accordance with the Deferral Plan.
The fund has adopted an unfunded noncontributory defined benefit pension plan (the “Pension Plan”) covering all Trustees of the fund who have served as a Trustee for at least five years and were first elected prior to 2004. Benefits under the Pension Plan are equal to 50% of the Trustee’s average annual attendance and retainer fees for the three years ended December 31, 2005. The retirement benefit is payable during a Trustee’s lifetime, beginning the year following retirement, for the number of years of service through December 31, 2006. Pension expense for the fund is included in Trustee compensation and expenses in the Statement of operations. Accrued pension liability is included in Payable for Trustee compensation and expenses in the Statement of assets and liabilities. The Trustees have terminated the Pension Plan with respect to any Trustee first elected after 2003.
The fund has adopted distribution plans (the“Plans”) with respect to its class A, class B, class C, class M and class R shares pursuant to Rule 12b-1 under the Investment Company Act of 1940. The purpose of the Plans is to compensate Putnam Retail Management Limited Partnership, a wholly-owned subsidiary of Putnam Investments, LLC and Putnam Retail Management GP, Inc., for services provided and expenses incurred in distributing shares of the fund.The Plans provide for payments by the fund to Putnam Retail Management Limited Partnership at an annual rate of up to 0.35%, 1.00%, 1.00%, 1.00% and 1.00% of the average net assets attributable to class A, class B, class C, class M and class R shares, respectively. The Trustees have approved payment by the fund at an annual rate of 0.25%, 1.00%, 1.00%, 0.75% and 0.50% of the average net assets attributable to class A, class B, class C, class M and class R shares, respectively.
For the six months ended February 28, 2009, Putnam Retail Management Limited Partnership, acting as underwriter, received net commissions of $33,983 and $509 from the sale of class A and class M shares, respectively, and received $21,923 and $2,264 in contingent deferred sales charges from redemptions of class B and class C shares, respectively.
A deferred sales charge of up to 1.00% and 0.65% is assessed on certain redemptions of class A and class M shares, respectively. For the six months ended February 28, 2009, Putnam Retail Management Limited Partnership, acting as underwriter, received $120 and no monies on class A and class M redemptions, respectively.
Note 3: Purchases and sales of securities
During the six months ended February 28, 2009, cost of purchases and proceeds from sales of investment securities other than short-term investments aggregated $169,538,005 and $244,724,947, respectively. There were no purchases or sales of U.S. government securities.
Note 4: Capital shares
At February 28, 2009, there was an unlimited number of shares of beneficial interest authorized. Transactions in capital shares were as follows:
| | | | |
| | Six months ended 2/28/09 | Year ended 8/31/08 |
|
| Class A | Shares | Amount | Shares | Amount |
|
| Shares sold | 1,497,564 | $23,788,946 | 5,220,391 | $174,022,191 |
|
| Shares issued in connection with | 2,687,515 | 33,674,558 | 3,395,150 | 106,268,190 |
| reinvestment of distributions | | | | |
|
| | 4,185,079 | 57,463,504 | 8,615,541 | 280,290,381 |
|
| Shares repurchased | (4,767,554) | (78,584,491) | (4,461,011) | (142,433,070) |
|
| Net increase (decrease) | (582,475) | $(21,120,987) | 4,154,530 | $137,857,311 |
|
41
| | | | |
| | Six months ended 2/28/09 | Year ended 8/31/08 |
|
| Class B | Shares | Amount | Shares | Amount |
|
| Shares sold | 256,539 | $3,864,047 | 893,340 | $27,400,360 |
|
| Shares issued in connection with | 387,410 | 4,373,862 | 603,638 | 17,414,945 |
| reinvestment of distributions | | | | |
|
| | 643,949 | 8,237,909 | 1,496,978 | 44,815,305 |
|
| Shares repurchased | (874,174) | (13,052,360) | (1,739,356) | (52,645,470) |
|
| Net decrease | (230,225) | $(4,814,451) | (242,378) | $(7,830,165) |
|
| |
| | Six months ended 2/28/09 | Year ended 8/31/08 |
|
| Class C | Shares | Amount | Shares | Amount |
|
| Shares sold | 110,534 | $1,601,317 | 344,322 | $10,848,954 |
|
| Shares issued in connection with | 132,202 | 1,526,937 | 163,176 | 4,802,278 |
| reinvestment of distributions | | | | |
|
| | 242,736 | 3,128,254 | 507,498 | 15,651,232 |
|
| Shares repurchased | (266,266) | (4,126,234) | (269,876) | (7,986,501) |
|
| Net increase (decrease) | (23,530) | $(997,980) | 237,622 | $7,664,731 |
|
| |
| | Six months ended 2/28/09 | Year ended 8/31/08 |
|
| Class M | Shares | Amount | Shares | Amount |
|
| Shares sold | 67,740 | $1,224,381 | 108,943 | $3,543,185 |
|
| Shares issued in connection with | 49,992 | 599,409 | 61,921 | 1,875,577 |
| reinvestment of distributions | | | | |
|
| | 117,732 | 1,823,790 | 170,864 | 5,418,762 |
|
| Shares repurchased | (125,220) | (2,170,095) | (102,324) | (3,085,050) |
|
| Net increase (decrease) | (7,488) | $(346,305) | 68,540 | $2,333,712 |
|
| |
| | Six months ended 2/28/09 | Year ended 8/31/08 |
|
| Class R | Shares | Amount | Shares | Amount |
|
| Shares sold | 187,468 | $2,895,076 | 258,971 | $8,312,858 |
|
| Shares issued in connection with | 66,347 | 818,719 | 46,989 | 1,454,779 |
| reinvestment of distributions | | | | |
|
| | 253,815 | 3,713,795 | 305,960 | 9,767,637 |
|
| Shares repurchased | (98,359) | (1,618,526) | (102,522) | (3,100,960) |
|
| Net increase | 155,456 | $2,095,269 | 203,438 | $6,666,677 |
|
| |
| | Six months ended 2/28/09 | Year ended 8/31/08 |
|
| Class Y | Shares | Amount | Shares | Amount |
|
| Shares sold | 83,559 | $1,179,247 | 230,885 | $7,559,785 |
|
| Shares issued in connection with | 83,202 | 1,047,510 | 115,945 | 3,632,545 |
| reinvestment of distributions | | | | |
|
| | 166,761 | 2,226,757 | 346,830 | 11,192,330 |
|
| Shares repurchased | (148,289) | (2,496,558) | (259,219) | (8,060,208) |
|
| Net increase (decrease) | 18,472 | $(269,801) | 87,611 | $3,132,122 |
|
42
Note 5: Investment in Putnam Prime Money
Market Fund
The fund invested in Putnam Prime Money Market Fund, an open-end management investment company managed by Putnam Management. Investments in Putnam Prime Money Market Fund were valued at its closing net asset value each business day. Management fees paid by the fund were reduced by an amount equal to the management fees paid by Putnam Prime Money Market Fund with respect to assets invested by the fund in Putnam Prime Money Market Fund. For the period ended February 28, 2009, management fees paid were reduced by $232 relating to the fund’s investment in Putnam Prime Money Market Fund. Income distributions earned by the fund were recorded as interest income in the Statement of operations and totaled $2,776 for the period ended February 28, 2009. During the period ended February 28, 2009, cost of purchases and proceeds of sales of investments in Putnam Prime Money Market Fund aggregated $7,747,059 and $10,160,720, respectively.
On September 17, 2008, the Trustees of the Putnam Prime Money Market Fund voted to close that fund effective September 17, 2008. On September 24, 2008, the fund received shares of Federated Prime Obligations Fund, an unaffiliated management investment company registered under the Investment Company Act of 1940, in liquidation of its shares of Putnam Prime Money Market Fund.
Note 6: Regulatory matters and litigation
In late 2003 and 2004, Putnam Management settled charges brought by the SEC and the Massachusetts Securities Division in connection with excessive short-term trading in Putnam funds. Distribution of payments from Putnam Management to certain open-end Putnam funds and their shareholders is expected to be completed in the next several months. These allegations and related matters have served as the general basis for certain lawsuits, including purported class action lawsuits against Putnam Management and, in a limited number of cases, some Putnam funds. Putnam Management believes that these lawsuits will have no material adverse effect on the funds or on Putnam Management’s ability to provide investment management services. In addition, Putnam Management has agreed to bear any costs incurred by the Putnam funds as a result of these matters.
Note 7: New accounting pronouncement
In March 2008, Statement of Financial Accounting Standards No. 161, Disclosures about Derivative Instruments and Hedging Activities (“SFAS 161”) — an amendment of FASB Statement No. 133, was issued and is effective for fiscal years and interim periods beginning after November 15, 2008. SFAS 161 requires enhanced disclosures about how and why an entity uses derivative instruments and how derivative instruments affect an entity’s financial position. Putnam Management is currently evaluating the impact the adoption of SFAS 161 will have on the fund’s financial statement disclosures.
Note 8: Market and credit risk
In the normal course of business, the fund trades financial instruments and enters into financial transactions where risk of potential loss exists due to changes in the market (market risk) or failure of the contracting party to the transaction to perform (credit risk). The fund may be exposed to additional credit risk that an institution or other entity with which the funds have unsettled or open transactions will default.
43
Putnam puts your interests first
Putnam has introduced a number of voluntary initiatives designed to reduce fund expenses, provide investors with more useful information, and help safeguard the interests of all Putnam investors. Visit the Individual Investors section at www.putnam.com for details.
Cost-cutting initiatives
Ongoing expenses will be limited Through June 30, 2009, total ongoing expenses, including management fees for all funds, will be maintained at or below the average of each fund’s industry peers in its Lipper load-fund universe. For more information, please see the Statement of Additional information.
Lower class B purchase limit To help ensure that investors are in the most cost-effective share class, the maximum amount that can be invested in class B shares has been reduced to $100,000. (Larger trades or accumulated amounts will be refused.)
Improved disclosure
Putnam fund prospectuses and shareholder reports have been revised to disclose additional information that will help shareholders compare funds and weigh their costs and risks along with their potential benefits. Shareholders will find easy-to-understand information about fund expense ratios, portfolio manager compensation, turnover comparisons, and employee and trustee ownership of Putnam funds. Disclosure of breakpoint discounts has also been enhanced to alert investors to potential cost savings.
Protecting investors’ interests
Short-term trading fee introduced To discourage short-term trading, which can interfere with a fund’s long-term strategy, a 1% short-term trading fee may be imposed on any Putnam fund shares (other than money market funds) redeemed or exchanged within 7 calendar days of purchase (for certain funds, this fee applies for 90 days).
44
Fund information
Founded over 70 years ago, Putnam Investments was built around the concept that a balance between risk and reward is the hallmark of a well-rounded financial program. We manage 100 mutual funds across income, value, blend, growth, asset allocation, absolute return, and global sector categories.
| | |
| Investment Manager | Charles B. Curtis | Susan G. Malloy |
| Putnam Investment | Robert J. Darretta | Vice President and |
| Management, LLC | Myra R. Drucker | Assistant Treasurer |
| One Post Office Square | Charles E. Haldeman, Jr. | |
| Boston, MA 02109 | Paul L. Joskow | Beth S. Mazor |
| Elizabeth T. Kennan | Vice President |
| Investment Sub-Manager | Kenneth R. Leibler | |
| Putnam Investments Limited | Robert E. Patterson | James P. Pappas |
| 57–59 St James’s Street | George Putnam, III | Vice President |
| London, England, SW1A 1LD | Robert L. Reynolds | |
| Richard B. Worley | Francis J. McNamara, III |
| Investment Sub-Advisor | | Vice President and |
| The Putnam Advisory | Officers | Chief Legal Officer |
| Company, LLC | Charles E. Haldeman, Jr. | |
| One Post Office Square | President | Robert R. Leveille |
| Boston, MA 02109 | | Vice President and |
| | Charles E. Porter | Chief Compliance Officer |
| Marketing Services | Executive Vice President, | |
| Putnam Retail Management | Principal Executive Officer, | Mark C. Trenchard |
| One Post Office Square | Associate Treasurer and | Vice President and |
| Boston, MA 02109 | Compliance Liaison | BSA Compliance Officer |
| | |
| Custodian | Jonathan S. Horwitz | Judith Cohen |
| State Street Bank and | Senior Vice President | Vice President, Clerk and |
| Trust Company | and Treasurer | Assistant Treasurer |
| | |
| Legal Counsel | Steven D. Krichmar | Wanda M. McManus |
| Ropes & Gray LLP | Vice President and | Vice President, Senior Associate |
| | Principal Financial Officer | Treasurer and Assistant Clerk |
| Trustees | | |
| John A. Hill, Chairman | Janet C. Smith | Nancy E. Florek |
| Jameson A. Baxter, | Vice President, Principal | Vice President, Assistant Clerk, |
| Vice Chairman | Accounting Officer and | Assistant Treasurer and |
| Ravi Akhoury | Assistant Treasurer | Proxy Manager |
This report is for the information of shareholders of Putnam Global Natural Resources Fund. It may also be used as sales literature when preceded or accompanied by the current prospectus, the most recent copy of Putnam’s Quarterly Performance Summary, and Putnam’s Quarterly Ranking Summary. For more recent performance, please visit putnam.com. Investors should carefully consider the investment objective, risks, charges, and expenses of a fund, which are described in its prospectus. For this and other information or to request a prospectus, call 1-800-225-1581 toll free. Please read the prospectus carefully before investing. The fund’s Statement of Additional Information contains additional information about the fund’s Trustees and is available without charge upon request by calling 1-800-225-1581.

Item 2. Code of Ethics:
Not applicable
Item 3. Audit Committee Financial Expert:
Not applicable
Item 4. Principal Accountant Fees and Services:
Not applicable
Item 5. Audit Committee of Listed Registrants
Not applicable
Item 6. Schedule of Investments:
The registrant’s schedule of investments in unaffiliated issuers is included in the report to shareholders in Item 1 above.
Item 7. Disclosure of Proxy Voting Policies and Procedures For Closed-End Management Investment Companies:
Not applicable
Item 8. Portfolio Managers of Closed-End Investment Companies
Not Applicable
Item 9. Purchases of Equity Securities by Closed-End Management Investment Companies and Affiliated Purchasers:
Not applicable
Item 10. Submission of Matters to a Vote of Security Holders:
Not applicable
Item 11. Controls and Procedures:
(a) The registrant's principal executive officer and principal financial officer have concluded, based on their evaluation of the effectiveness of the design and operation of the registrant's disclosure controls and procedures as of a date within 90 days of the filing date of this report, that the design and operation of such procedures are generally effective to provide reasonable assurance that information required to be disclosed by the registrant in this report is recorded, processed, summarized and reported within the time periods specified in the Commission's rules and forms.
(b) Changes in internal control over financial reporting: Not applicable
Item 12. Exhibits:
(a)(1) Not applicable
(a)(2) Separate certifications for the principal executive officer and principal financial officer of the registrant as required by Rule 30a-2(a) under the Investment Company Act of 1940, as amended, are filed herewith.
(b) The certifications required by Rule 30a-2(b) under the Investment Company Act of 1940, as amended, are filed herewith.
SIGNATURES
Pursuant to the requirements of the Securities Exchange Act of 1934 and the Investment Company Act of 1940, the registrant has duly caused this report to be signed on its behalf by the undersigned, thereunto duly authorized.
Putnam Global Natural Resources Fund
By (Signature and Title):
/s/Janet C. Smith
Janet C. Smith
Principal Accounting Officer
Date: April 29, 2009
Pursuant to the requirements of the Securities Exchange Act of 1934 and the Investment Company Act of 1940, this report has been signed below by the following persons on behalf of the registrant and in the capacities and on the dates indicated.
By (Signature and Title):
/s/Charles E. Porter
Charles E. Porter
Principal Executive Officer
Date: April 29, 2009
By (Signature and Title):
/s/Steven D. Krichmar
Steven D. Krichmar
Principal Financial Officer
Date: April 29, 2009