| | | |
| UNITED STATES |
| SECURITIES AND EXCHANGE COMMISSION |
| Washington, D.C. 20549 |
| |
| FORM N-CSR |
| |
| CERTIFIED SHAREHOLDER REPORT OF REGISTERED |
| MANAGEMENT INVESTMENT COMPANIES |
| | |
| Investment Company Act file number: (811-03061) | |
| | |
| Exact name of registrant as specified in charter: | Putnam Global Natural Resources Fund |
| |
| Address of principal executive offices: One Post Office Square, Boston, Massachusetts 02109 |
| | |
| Name and address of agent for service: | Beth S. Mazor, Vice President |
| | One Post Office Square |
| | Boston, Massachusetts 02109 |
| | |
| Copy to: | | John W. Gerstmayr, Esq. |
| | Ropes & Gray LLP |
| | 800 Boylston Street |
| | Boston, Massachusetts 02199-3600 |
| | |
| Registrant’s telephone number, including area code: | (617) 292-1000 |
| | | |
| Date of fiscal year end: August 31, 2011 | | |
| |
| Date of reporting period: September 1, 2010 — February 28, 2011 |
Item 1. Report to Stockholders:
The following is a copy of the report transmitted to stockholders pursuant to Rule 30e-1 under the Investment Company Act of 1940:
Putnam Global
Natural Resources
Fund
Semiannual report
2 | 28 | 11
| | | |
| Message from the Trustees | 1 | | |
| | |
| About the fund | 2 | | |
| | |
| Performance snapshot | 4 | | |
| | |
| Interview with your fund’s portfolio managers | 5 | | |
| | |
| Your fund’s performance | 10 | | |
| | |
| Your fund’s expenses | 12 | | |
| | |
| Terms and definitions | 14 | | |
| | |
| Other information for shareholders | 15 | | |
| | |
| Financial statements | 16 | | |
| | |
Message from the Trustees
Dear Fellow Shareholder:
The U.S. economy and stock market continue to show resilience, even in the face of rising head winds around the globe. On March 9, 2011, U.S. equities marked the two-year anniversary of the beginning of the most powerful bull market since the 1950s, with the S&P 500 Index doubling from its 2009 low.
While Putnam maintains a positive outlook for U.S. equities and the overall economy in 2011, we believe volatility will punctuate the year ahead. Civil unrest in the Middle East and North Africa, high unemployment, rising oil prices, and Japan’s earthquake, tsunami, and nuclear crisis have all created a climate of uncertainty. In addition, the U.S. fixed-income market continues to struggle, as yields have risen and bond prices have fallen. We believe that Putnam’s active, research-intensive approach is well suited to uncovering opportunities in this environment.
In developments affecting oversight of your fund, we wish to thank Richard B. Worley and Myra R. Drucker, who have retired from the Board of Trustees, for their many years of dedicated and thoughtful leadership.
Lastly, we would like to take this opportunity to welcome new shareholders to the fund and to thank all of our investors for your continued confidence in Putnam.

About the fund
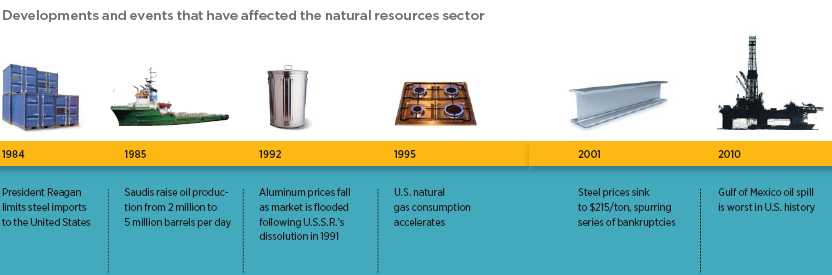
Investing in the natural resources sector for over 30 years
From the OPEC-driven oil crisis of the 1970s to the more recent commodities boom, the balance of geopolitical stability, technological development, and economic growth has shaped natural resources markets.
For more than 30 years, Putnam Global Natural Resources Fund has sought to capitalize on that ever-changing balance by investing in stocks of companies that can profit from the global demand for natural resources.
The fund’s diversification sets it apart in two respects: First, its view of natural resources industries is broader and includes energy, metals and mining, paper, chemical, and natural resource equipment and infrastructure companies; and second, it has a global scope. Stock prices in the natural resources sector rise and fall with supply and demand imbalances, so this strategy helps offset that volatility while enabling the fund’s managers to pursue a wider field of opportunities.
From chemicals, construction, and railroads to forest products and packaging, the portfolio managers consider stocks in a wide array of areas, with support from a team of analysts. Among the promising stocks the managers have targeted recently are those of fertilizer, seed, and agrochemical companies. These companies may offer strong growth potential as world population has increased, wealth has grown in emerging markets, and demand for high-protein food has risen along with a greater need for fertilizer that can make land and crops more productive.
Another benefit for investors is the fund’s flexible strategy, which allows the fund to own growth- or value-style stocks, as it seeks to deliver competitive returns no matter which style is in favor.
Consider these risks before investing: International investing involves certain risks, such as currency fluctuations, economic instability, and political developments. Additional risks may be associated with emerging-market securities, including illiquidity and volatility. The use of derivatives involves special risks and may result in losses. Growth stocks may be more susceptible to earnings disappointments, and value stocks may fail to rebound. The use of short selling may result in losses if the securities appreciate in value. The fund’s non-diversified status, which means the fund may invest in fewer issuers, can increase the fund’s vulnerability to common economic forces and may result in greater losses and volatility.
Sector investing at Putnam
In recent decades, innovation and business growth have propelled stocks in different industries to market-leading performance. Finding these stocks, many of which are in international markets, requires rigorous research and in-depth knowledge of global markets.
Putnam’s sector funds invest in nine sectors worldwide and offer active management, risk controls, and the expertise of dedicated sector analysts. The funds’ managers invest with flexibility and precision, using fundamental research to hand select stocks for the portfolios.
All sectors in one fund:
Putnam Global Sector Fund
A portfolio of individual Putnam Global Sector Funds that provides exposure to all sectors of the MSCI World Index.
Individual sector funds:
Global Consumer Fund
Retail, hotels, restaurants, media, food and beverages
Global Energy Fund
Oil and gas, energy equipment and services
Global Financials Fund
Commercial banks, insurance, diversified financial services, mortgage finance
Global Health Care Fund
Pharmaceuticals, biotechnology, health-care services
Global Industrials Fund
Airlines, railroads, trucking, aerospace and defense, construction, commercial services
Global Natural Resources Fund
Metals, chemicals, oil and gas, forest products
Global Technology Fund
Software, computers, Internet services
Global Telecommunications Fund
Diversified and wireless telecommunications services
Global Utilities Fund
Electric, gas, and water utilities
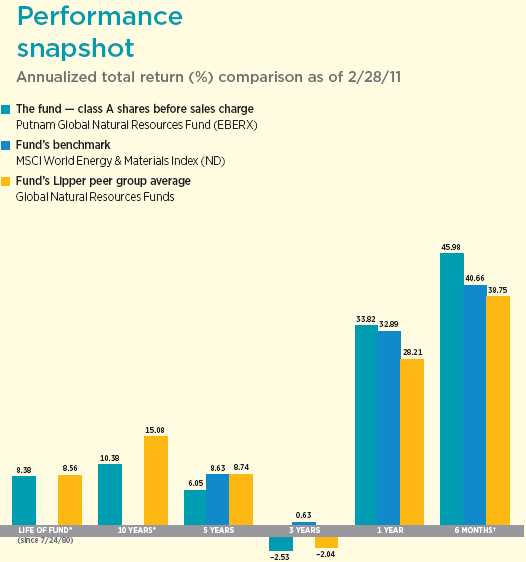
Current performance may be lower or higher than the quoted past performance, which cannot guarantee future results. Share price, principal value, and return will fluctuate, and you may have a gain or a loss when you sell your shares. Performance of class A shares assumes reinvestment of distributions and does not account for taxes. Fund returns in the bar chart do not reflect a sales charge of 5.75%; had they, returns would have been lower. See pages 5 and 10–11 for additional performance information. For a portion of the periods, the fund had expense limitations, without which returns would have been lower. A short-term trading fee of 1% may apply to redemptions or exchanges from certain funds within the time period specified in the fund’s prospectus. To obtain the most recent month-end performance, visit putnam.com.
* The fund’s benchmark, the MSCI World Energy & Materials Index (ND), was introduced on 6/1/05, which post-dates the inception of the fund’s class A shares.
† Returns for the six-month period are not annualized, but cumulative.
4
Interview with your fund’s portfolio managers
Steven Curbow and John Morgan
How did Putnam Global Natural Resources Fund perform for the semiannual period?
Steve: For the six months ending February 28, 2011, we are pleased to report that the fund’s class A shares at net asset value (NAV) increased 45.98%, ahead of the 40.66% advance of its benchmark, the MSCI World Energy & Materials Index (ND), and the 38.75% average return of its Lipper peers. Performance was helped by fundamental research within the energy and natural resources sectors, and our strategy of identifying basic materials that we believed would perform well during the period.
During the past six months, nearly all basic materials and natural resources have experienced significant price increases. What’s driving this growth?
John: The primary reason is that the world has returned to an economic growth mode, and the areas that are growing the most, namely China and India, are in need of many of these commodities. Demand has been growing across the board on all commodities for the past 18 months. Metallurgical, or “met,” coal, which is used in steel production, experienced a significant run up in price during the period. Price increases also occurred in iron ore, copper, and base metals such as zinc and nickel.
Agriculture-based commodities also rose in price, due, in large part, to a global food shortage in 2010. Demand for protein such as beef, chicken, and pork has been increasing in places like China and India, where improving economic conditions are leading people to add more meat to their diets. Grain and other animal feeds are key components in raising the livestock needed to support this demand. Last summer, a near “perfect storm” occurred with crop production around the world. First, severe forest fires and drought caused Russia, one of
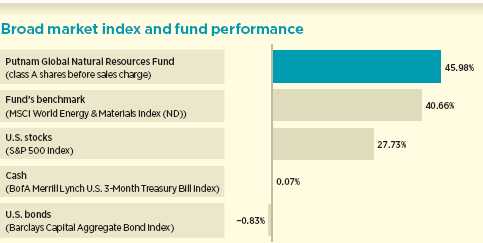
This comparison shows your fund’s performance in the context of broad market indexes for the six months ended 2/28/11. See pages 4 and 10–11 for additional fund performance information. Index descriptions can be found on page 14.
5
the world’s largest suppliers of wheat, to ban grain exports. Then, last summer’s heavy rains in the U.S. Midwest led to significantly lower crop yields in wheat and soybeans.
Which holdings within the basic materials portion of the portfolio affected performance?
John: An overweight to Teck Resources, the world’s second-largest producer of met coal, was the fund’s number one contributor. We bought Teck, based in Canada, at attractive price levels after an industry-wide sell-off. The company performed well, and its share price rallied strongly as global demand for met coal, particularly from China, increased. Over the past five years, China has built up a huge steel industry, which now represents more than 50% of the world’s steel consumption and production. Another overweight, JSR Corporation, a Japan-based manufacturer of synthetic rubber, benefited from rising demand among automakers in China and elsewhere around the world who use synthetic rubber in car tires.
As for detractors, an underweight to U.S.-based Freeport-McMoRan, an international mining company, hurt performance. The company’s shares appreciated as prices for copper, gold, and molybdenum, an element used in steel alloys, rose during the period and because we held less than the benchmark the fund’s returns were held back on a relative basis. Another detractor was an overweight position to Fortescue Metals Group, an Australian iron-ore mining company whose shares lost value during the period because the company missed its production figures during the fourth quarter.
The price of oil rose steadily throughout the period, but toward the end of the period prices spiked because of civil unrest in the Middle East and North Africa. How did you manage the fund in this volatile environment?
Steve: By the end of February, the price of Brent oil had shot up to $111.80 per barrel from $82.31 at the start of the period, driven by civil unrest in the Middle East and North Africa and
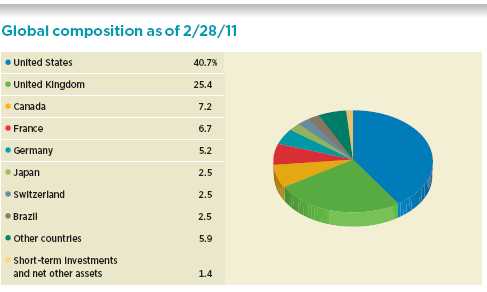
Country/territory allocations are shown as a percentage of the fund’s net assets. Summary information may differ from the portfolio schedule included in the financial statements due to the inclusion of derivative securities and the exclusion of as-of trades, if any, and the use of different classifications of securities for presentation purposes. Weightings will vary over time.
6
increasing global demand. For most of the period, demand growth took place in global economies, which contributed to the steady increase in oil prices. This helped oil stocks across the board, because investors grew confident that the companies would continue to invest in this environment. In late January and early February, however, civil unrest raised concerns about disruptions in the supply of oil in the Middle East. As a result, we made some short-term adjustments and adopted a more defensive posture, reducing the portfolio’s exposure to companies that we perceived as having substantial risks to their assets.
Within the energy portion of the portfolio, which holdings affected performance?
Steve: The fund’s overweight to Schlumberger, with offices in the United States and Europe, was the top contributor in energy. An exploration and production company, Schlumberger saw an increase in business as oil prices rose during the period. Our overweight position to National Oilwell Varco, a provider of land-based and offshore drilling rigs and related equipment and services, also helped performance. Rising oil prices during the period gave rig operators the capital and opportunity to upgrade their fleets, and the Houston-based company benefited.
Our overweight to Cairn Energy, an oil exploration and production company based in the United Kingdom, was the top detractor among the fund’s energy holdings. In 2010, Vedanta Resources, another U.K.-based company held by the fund, bid for a majority stake in Cairn’s Indian subsidiary. However, government regulators in India have prolonged approval of this transaction, and Cairn shares suffered. Petroleo Brasileiro (Petrobras) is an out-of-benchmark holding that hurt performance. The company held a large secondary offering
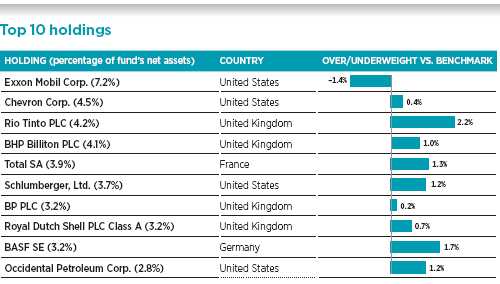
This table shows the fund’s top 10 holdings by percentage of the fund’s net assets as of 2/28/11. Short-term holdings are excluded. Holdings will vary over time.
7
of stock in 2010 to raise money to fund drilling and development activities offshore of Brazil. There was concern among investors that the offering had a dilutive effect on shares of the Brazil-based Petrobras and would hurt liquidity of its shares.
What is your outlook for the basic materials sector in 2011?
John: Barring anything out of the ordinary, I believe that we are not going to see much in the way of commodity price increases in 2011 on a year-to-year basis. Still, the outlook for the sector is good. Our strategy will not change — we will continue to identify companies that we believe have good production growth, regardless of the pricing of the underlying commodity. We will also continue to target those companies that supply the resources that China and India are lacking — met coal and copper, among other resources. As for the global economic outlook, I believe growth will remain healthy and emerging markets will continue to expand at a high rate.
What is your outlook for the energy sector?
Steve: With the situation still fluid in the Middle East and oil prices staying elevated, it’s difficult to predict what will happen. As fund managers, we will continue to select stocks that we believe have favorable investment potential and maintain a somewhat defensive stance. We are buying bigger, integrated energy companies like Exxon, which have better balance sheets and more diversified business models. Oil companies tend to do well as oil prices increase, but when prices get too high, it raises concerns about future demand. It is not easy to determine at which price this could happen, but we will continue to monitor this.
As for the global economy, if the price of oil does hit a certain level, consumers and businesses will likely start cutting back on use. When consumers decide not to go to the mall or out to eat because of the price of gasoline, this affects consumer spending. This could hurt the energy sector and the economic recovery. If tensions do ease, we could see oil drop down to the $90-to-$100 per-barrel
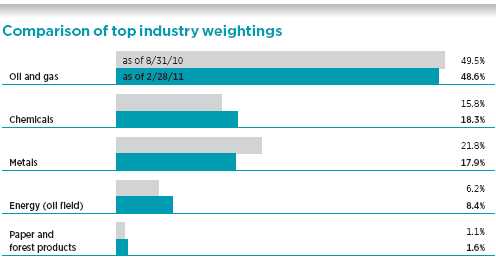
This chart shows how the fund’s top weightings have changed over the past six months. Weightings are shown as a percentage of net assets. Summary information may differ from the portfolio schedule included in the financial statements due to the inclusion of derivative securities and the exclusion of as-of trades, if any, and the use of different classifications of securities for presentation purposes. Holdings will vary over time.
8
range, which we believe is a fundamentally manageable price. But this is a process that will likely take months, not days or weeks. We think the situation will be volatile over the next several months, at least.
Thank you, Steve and John, for bringing us up to date.
The views expressed in this report are exclusively those of Putnam Management. They are not meant as investment advice.
Please note that the holdings discussed in this report may not have been held by the fund for the entire period. Portfolio composition is subject to review in accordance with the fund’s investment strategy and may vary in the future. Current and future portfolio holdings are subject to risk.

Portfolio Manager Steven Curbow is Energy and Basic Materials Sector Team Leader at Putnam. He has an M.B.A. from The University of Chicago Booth School of Business and a B.S. from the University of Southern California. Steven joined Putnam in 2008 and has been in the investment industry since 1996.

Portfolio Manager John Morgan has an M.B.A. from the Johnson School of Management at Cornell University and a B.A. from Denison University. A Certified Financial Planner, John has been in the investment industry since he joined Putnam in 1994.
IN THE NEWS
The U.S. bull market that hit its two-year anniversary on March 9, 2011, was the sharpest since 1955. As measured by the S&P 500 Index, U.S. stocks rose 103.68% from their March 9, 2009 nadir, adding more than $28 trillion to global share values. Prior to hitting their low two years ago, U.S. stocks were dragged down by the subprime mortgage collapse, global credit crisis, and worldwide recession. Even after hitting its recent milestone, the S&P 500’s two-year return remains 36 percentage points below the average bull-market gain of 131% since 1962, according to data compiled by Bloomberg and Birinyi Associates. While no one knows where the market will head from here, data suggest that this bull may have more room to run.
9
Your fund’s performance
This section shows your fund’s performance, price, and distribution information for periods ended February 28, 2011, the end of the first half of its current fiscal year. In accordance with regulatory requirements for mutual funds, we also include performance as of the most recent calendar quarter-end and expense information taken from the fund’s current prospectus. Performance should always be considered in light of a fund’s investment strategy. Data represent past performance. Past performance does not guarantee future results. More recent returns may be less or more than those shown. Investment return and principal value will fluctuate, and you may have a gain or a loss when you sell your shares. Performance information does not reflect any deduction for taxes a shareholder may owe on fund distributions or on the redemption of fund shares. For the most recent month-end performance, please visit the Individual Investors section at putnam.com or call Putnam at 1-800-225-1581. Class R and class Y shares are not available to all investors. See the Terms and Definitions section in this report for definitions of the share classes offered by your fund.
Fund performance Total return for periods ended 2/28/11
| | | | | | | | | | |
| | Class A | Class B | Class C | Class M | Class R | Class Y |
| (inception dates) | (7/24/80) | (2/1/94) | (7/26/99) | (7/3/95) | (12/1/03) | (10/4/05) |
|
| | NAV | POP | NAV | CDSC | NAV | CDSC | NAV | POP | NAV | NAV |
|
| Annual average | | | | | | | | | | |
| (life of fund) | 8.38% | 8.17% | 7.50% | 7.50% | 7.57% | 7.57% | 7.77% | 7.64% | 8.11% | 8.43% |
|
| 10 years | 168.37 | 152.99 | 148.99 | 148.99 | 148.90 | 148.90 | 155.34 | 146.38 | 162.08 | 172.18 |
| Annual average | 10.38 | 9.73 | 9.55 | 9.55 | 9.55 | 9.55 | 9.83 | 9.44 | 10.11 | 10.53 |
|
| 5 years | 34.13 | 26.44 | 29.23 | 27.68 | 29.21 | 29.21 | 30.91 | 26.32 | 32.49 | 35.88 |
| Annual average | 6.05 | 4.80 | 5.26 | 5.01 | 5.26 | 5.26 | 5.53 | 4.78 | 5.79 | 6.32 |
|
| 3 years | –7.40 | –12.74 | –9.42 | –11.68 | –9.44 | –9.44 | –8.74 | –11.92 | –8.05 | –6.64 |
| Annual average | –2.53 | –4.44 | –3.24 | –4.06 | –3.25 | –3.25 | –3.00 | –4.14 | –2.76 | –2.26 |
|
| 1 year | 33.82 | 26.10 | 32.86 | 27.86 | 32.82 | 31.82 | 33.20 | 28.52 | 33.55 | 34.16 |
|
| 6 months | 45.98 | 37.62 | 45.45 | 40.45 | 45.49 | 44.49 | 45.66 | 40.60 | 45.92 | 46.19 |
|
Current performance may be lower or higher than the quoted past performance, which cannot guarantee future results. After-sales-charge returns (public offering price, or POP) for class A and M shares reflect a maximum 5.75% and 3.50% load, respectively. Class B share returns reflect the applicable contingent deferred sales charge (CDSC), which is 5% in the first year, declining over time to 1% in the sixth year, and is eliminated thereafter. Class C shares reflect a 1% CDSC for the first year that is eliminated thereafter. Class R and Y shares have no initial sales charge or CDSC. Performance for class B, C, M, R, and Y shares before their inception is derived from the historical performance of class A shares, adjusted for the applicable sales charge (or CDSC) and the higher operating expenses for such shares, except for class Y shares, for which 12b-1 fees are not applicable.
For a portion of the periods, the fund had expense limitations, without which returns would have been lower.
Class B share performance does not reflect conversion to class A shares.
A short-term trading fee of 1% may apply to redemptions or exchanges from certain funds within the time period specified in the fund’s prospectus.
10
Comparative index returns For periods ended 2/28/11
| | |
| | MSCI World Energy & | Lipper Global Natural Resources |
| | Materials Index (ND) | Funds category average† |
|
| Annual average (life of fund) | —* | 8.56% |
|
| 10 years | —* | 327.25 |
| Annual average | —* | 15.08 |
|
| 5 years | 51.25% | 52.69 |
| Annual average | 8.63 | 8.74 |
|
| 3 years | 1.89 | –5.00 |
| Annual average | 0.63 | –2.04 |
|
| 1 year | 32.89 | 28.21 |
|
| 6 months | 40.66 | 38.75 |
|
Index and Lipper results should be compared to fund performance at net asset value.
* The fund’s benchmark, the MSCI World Energy & Materials Index (ND), was introduced on 6/1/05, which post-dates the inception of the fund’s class A shares.
† Over the 6-month, 1-year, 3-year, 5-year, 10-year, and life-of-fund periods ended 2/28/11, there were 134, 131, 87, 53, 32, and 3 funds, respectively, in this Lipper category.
Fund price and distribution information For the six-month period ended 2/28/11
| | | | | | | | |
| Distributions | Class A | Class B | Class C | Class M | Class R | Class Y |
|
| Number | 1 | 1 | 1 | 1 | 1 | 1 |
|
| Income | $0.403 | $0.255 | $0.278 | $0.314 | $0.364 | $0.454 |
|
| Capital gains | — | — | — | — | — | — |
|
| Total | $0.403 | $0.255 | $0.278 | $0.314 | $0.364 | $0.454 |
|
| Share value | NAV | POP | NAV | NAV | NAV | POP | NAV | NAV |
|
| 8/31/10 | $16.62 | $17.63 | $14.87 | $15.20 | $15.82 | $16.39 | $16.31 | $16.73 |
|
| 2/28/11 | 23.82 | 25.27 | 21.35 | 21.81 | 22.70 | 23.52 | 23.40 | 23.96 |
|
The classification of distributions, if any, is an estimate. Final distribution information will appear on your year-end tax forms.
Fund performance as of most recent calendar quarter
Total return for periods ended 3/31/11
| | | | | | | | | | |
| | Class A | Class B | Class C | Class M | Class R | Class Y |
| (inception dates) | (7/24/80) | (2/1/94) | (7/26/99) | (7/3/95) | (12/1/03) | (10/4/05) |
|
| | NAV | POP | NAV | CDSC | NAV | CDSC | NAV | POP | NAV | NAV |
|
| Annual average | | | | | | | | | | |
| (life of fund) | 8.40% | 8.19% | 7.51% | 7.51% | 7.58% | 7.58% | 7.78% | 7.66% | 8.13% | 8.45% |
|
| 10 years | 182.55 | 166.24 | 162.08 | 162.08 | 161.95 | 161.95 | 168.69 | 159.27 | 175.93 | 186.66 |
| Annual average | 10.95 | 10.29 | 10.11 | 10.11 | 10.11 | 10.11 | 10.39 | 10.00 | 10.68 | 11.11 |
|
| 5 years | 29.52 | 22.07 | 24.78 | 23.29 | 24.73 | 24.73 | 26.35 | 21.92 | 28.00 | 31.26 |
| Annual average | 5.31 | 4.07 | 4.53 | 4.28 | 4.52 | 4.52 | 4.79 | 4.04 | 5.06 | 5.59 |
|
| 3 years | –3.04 | –8.61 | –5.16 | –7.52 | –5.20 | –5.20 | –4.50 | –7.85 | –3.74 | –2.26 |
| Annual average | –1.02 | –2.96 | –1.75 | –2.57 | –1.76 | –1.76 | –1.52 | –2.69 | –1.26 | –0.76 |
|
| 1 year | 25.55 | 18.35 | 24.69 | 19.69 | 24.61 | 23.61 | 24.98 | 20.58 | 25.31 | 25.90 |
|
| 6 months | 30.97 | 23.47 | 30.49 | 25.49 | 30.43 | 29.43 | 30.58 | 25.99 | 30.82 | 31.17 |
|
11
Your fund’s expenses
As a mutual fund investor, you pay ongoing expenses, such as management fees, distribution fees (12b-1 fees), and other expenses. Using the following information, you can estimate how these expenses affect your investment and compare them with the expenses of other funds. You may also pay one-time transaction expenses, including sales charges (loads) and redemption fees, which are not shown in this section and would have resulted in higher total expenses. For more information, see your fund’s prospectus or talk to your financial representative.
Expense ratios
| | | | | | |
| | Class A | Class B | Class C | Class M | Class R | Class Y |
|
| Total annual operating expenses for the fiscal year | | | | | | |
| ended 8/31/10* | 1.35% | 2.10% | 2.10% | 1.85% | 1.60% | 1.10% |
|
| Annualized expense ratio for the six-month period | | | | | | |
| ended 2/28/11 | 1.27% | 2.02% | 2.02% | 1.77% | 1.52% | 1.02% |
|
Fiscal-year expense information in this table is taken from the most recent prospectus, is subject to change, and may differ from that shown for the annualized expense ratio and in the financial highlights of this report. Expenses are shown as a percentage of average net assets.
* Restated to reflect projected expenses under a management contract effective 1/1/10.
Expenses per $1,000
The following table shows the expenses you would have paid on a $1,000 investment in the fund from September 1, 2010, to February 28, 2011. It also shows how much a $1,000 investment would be worth at the close of the period, assuming actual returns and expenses.
| | | | | | |
| | Class A | Class B | Class C | Class M | Class R | Class Y |
|
| Expenses paid per $1,000*† | $7.75 | $12.29 | $12.30 | $10.78 | $9.27 | $6.23 |
|
| Ending value (after expenses) | $1,459.80 | $1,454.50 | $1,454.90 | $1,456.60 | $1,459.20 | $1,461.90 |
|
* Expenses for each share class are calculated using the fund’s annualized expense ratio for each class, which represents the ongoing expenses as a percentage of average net assets for the six months ended 2/28/11. The expense ratio may differ for each share class.
† Expenses are calculated by multiplying the expense ratio by the average account value for the period; then multiplying the result by the number of days in the period; and then dividing that result by the number of days in the year.
12
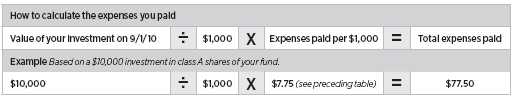
Estimate the expenses you paid
To estimate the ongoing expenses you paid for the six months ended February 28, 2011, use the following calculation method. To find the value of your investment on September 1, 2010, call Putnam at 1-800-225-1581.
Compare expenses using the SEC’s method
The Securities and Exchange Commission (SEC) has established guidelines to help investors assess fund expenses. Per these guidelines, the following table shows your fund’s expenses based on a $1,000 investment, assuming a hypothetical 5% annualized return. You can use this information to compare the ongoing expenses (but not transaction expenses or total costs) of investing in the fund with those of other funds. All mutual fund shareholder reports will provide this information to help you make this comparison. Please note that you cannot use this information to estimate your actual ending account balance and expenses paid during the period.
| | | | | | |
| | Class A | Class B | Class C | Class M | Class R | Class Y |
|
| Expenses paid per $1,000*† | $6.36 | $10.09 | $10.09 | $8.85 | $7.60 | $5.11 |
|
| Ending value (after expenses) | $1,018.50 | $1,014.78 | $1,014.78 | $1,016.02 | $1,017.26 | $1,019.74 |
|
* Expenses for each share class are calculated using the fund’s annualized expense ratio for each class, which represents the ongoing expenses as a percentage of average net assets for the six months ended 2/28/11. The expense ratio may differ for each share class.
† Expenses are calculated by multiplying the expense ratio by the average account value for the period; then multiplying the result by the number of days in the period; and then dividing that result by the number of days in the year.
13
Terms and definitions
Important terms
Total return shows how the value of the fund’s shares changed over time, assuming you held the shares through the entire period and reinvested all distributions in the fund.
Net asset value (NAV) is the price, or value, of one share of a mutual fund, without a sales charge. NAVs fluctuate with market conditions. NAV is calculated by dividing the net assets of each class of shares by the number of outstanding shares in the class.
Public offering price (POP) is the price of a mutual fund share plus the maximum sales charge levied at the time of purchase. POP performance figures shown here assume the 5.75% maximum sales charge for class A shares and 3.50% for class M shares.
Contingent deferred sales charge (CDSC) is generally a charge applied at the time of the redemption of class B or C shares and assumes redemption at the end of the period. Your fund’s class B CDSC declines over time from a 5% maximum during the first year to 1% during the sixth year. After the sixth year, the CDSC no longer applies. The CDSC for class C shares is 1% for one year after purchase.
Share classes
Class A shares are generally subject to an initial sales charge and no CDSC (except on certain redemptions of shares bought without an initial sales charge).
Class B shares are not subject to an initial sales charge. They may be subject to a CDSC.
Class C shares are not subject to an initial sales charge and are subject to a CDSC only if the shares are redeemed during the first year.
Class M shares have a lower initial sales charge and a higher 12b-1 fee than class A shares and no CDSC (except on certain redemptions of shares bought without an initial sales charge).
Class R shares are not subject to an initial sales charge or CDSC and are available only to certain defined contribution plans.
Class Y shares are not subject to an initial sales charge or CDSC, and carry no 12b-1 fee. They are generally only available to corporate and institutional clients and clients in other approved programs.
Comparative indexes
Barclays Capital Aggregate Bond Index is an unmanaged index of U.S. investment-grade fixed-income securities.
BofA (Bank of America) Merrill Lynch U.S. 3-Month Treasury Bill Index is an unmanaged index that seeks to measure the performance of U.S. Treasury bills available in the marketplace.
MSCI World Energy & Materials Index (ND) is a free float-adjusted market capitalization weighted index that is designed to measure the equity market performance of developed markets in the energy and materials sector.
S&P 500 Index is an unmanaged index of common stock performance.
Indexes assume reinvestment of all distributions and do not account for fees. Securities and performance of a fund and an index will differ. You cannot invest directly in an index.
Lipper is a third-party industry-ranking entity that ranks mutual funds. Its rankings do not reflect sales charges. Lipper rankings are based on total return at net asset value relative to other funds that have similar current investment styles or objectives as determined by Lipper. Lipper may change a fund’s category assignment at its discretion. Lipper category averages reflect performance trends for funds within a category.
14
Other information for shareholders
Important notice regarding delivery of shareholder documents
In accordance with SEC regulations, Putnam sends a single copy of annual and semiannual shareholder reports, prospectuses, and proxy statements to Putnam shareholders who share the same address, unless a shareholder requests otherwise. If you prefer to receive your own copy of these documents, please call Putnam at 1-800-225-1581, and Putnam will begin sending individual copies within 30 days.
Proxy voting
Putnam is committed to managing our mutual funds in the best interests of our shareholders. The Putnam funds’ proxy voting guidelines and procedures, as well as information regarding how your fund voted proxies relating to portfolio securities during the 12-month period ended June 30, 2010, are available in the Individual Investors section of putnam.com, and on the SEC’s website, www.sec.gov. If you have questions about finding forms on the SEC’s website, you may call the SEC at 1-800-SEC-0330. You may also obtain the Putnam funds’ proxy voting guidelines and procedures at no charge by calling Putnam’s Shareholder Services at 1-800-225-1581.
Fund portfolio holdings
The fund will file a complete schedule of its portfolio holdings with the SEC for the first and third quarters of each fiscal year on Form N-Q. Shareholders may obtain the fund’s Forms N-Q on the SEC’s website at www.sec.gov. In addition, the fund’s Forms N-Q may be reviewed and copied at the SEC’s Public Reference Room in Washington, D.C. You may call the SEC at 1-800-SEC-0330 for information about the SEC’s website or the operation of the Public Reference Room.
Trustee and employee fund ownership
Putnam employees and members of the Board of Trustees place their faith, confidence, and, most importantly, investment dollars in Putnam mutual funds. As of February 28, 2011, Putnam employees had approximately $372,000,000 and the Trustees had approximately $69,000,000 invested in Putnam mutual funds. These amounts include investments by the Trustees’ and employees’ immediate family members as well as investments through retirement and deferred compensation plans.
15
Financial statements
A guide to financial statements
These sections of the report, as well as the accompanying Notes, constitute the fund’s financial statements.
The fund’s portfolio lists all the fund’s investments and their values as of the last day of the reporting period. Holdings are organized by asset type and industry sector, country, or state to show areas of concentration and diversification.
Statement of assets and liabilities shows how the fund’s net assets and share price are determined. All investment and non-investment assets are added together. Any unpaid expenses and other liabilities are subtracted from this total. The result is divided by the number of shares to determine the net asset value per share, which is calculated separately for each class of shares. (For funds with preferred shares, the amount subtracted from total assets includes the liquidation preference of preferred shares.)
Statement of operations shows the fund’s net investment gain or loss. This is done by first adding up all the fund’s earnings — from dividends and interest income — and subtracting its operating expenses to determine net investment income (or loss). Then, any net gain or loss the fund realized on the sales of its holdings — as well as any unrealized gains or losses over the period — is added to or subtracted from the net investment result to determine the fund’s net gain or loss for the fiscal period.
Statement of changes in net assets shows how the fund’s net assets were affected by the fund’s net investment gain or loss, by distributions to shareholders, and by changes in the number of the fund’s shares. It lists distributions and their sources (net investment income or realized capital gains) over the current reporting period and the most recent fiscal year-end. The distributions listed here may not match the sources listed in the Statement of operations because the distributions are determined on a tax basis and may be paid in a different period from the one in which they were earned. Dividend sources are estimated at the time of declaration. Actual results may vary. Any non-taxable return of capital cannot be determined until final tax calculations are completed after the end of the fund’s fiscal year.
Financial highlights provide an overview of the fund’s investment results, per-share distributions, expense ratios, net investment income ratios, and portfolio turnover in one summary table, reflecting the five most recent reporting periods. In a semiannual report, the highlights table also includes the current reporting period.
16
The fund’s portfolio 2/28/11 (Unaudited)
| | |
| COMMON STOCKS (98.7%)* | Shares | Value |
|
| Chemicals (18.0%) | | |
| Agrium, Inc. (Canada) | 59,200 | $5,615,801 |
|
| Albemarle Corp. | 34,100 | 1,962,796 |
|
| Arkema (France) † | 67,833 | 4,956,766 |
|
| BASF SE (Germany) | 180,821 | 15,040,126 |
|
| Celanese Corp. Ser. A | 67,800 | 2,810,310 |
|
| CF Industries Holdings, Inc. S | 34,700 | 4,902,416 |
|
| Dow Chemical Co. (The) | 168,900 | 6,276,324 |
|
| Huntsman Corp. | 198,600 | 3,505,290 |
|
| JSR Corp. (Japan) | 234,200 | 5,034,073 |
|
| Lanxess AG (Germany) | 50,106 | 3,727,795 |
|
| LyondellBasell Industries NV Class A (Netherlands) † | 137,900 | 5,251,232 |
|
| Nitto Denko Corp. (Japan) | 92,300 | 5,583,376 |
|
| Petronas Chemicals Group Bhd (Malaysia) † | 3,241,700 | 6,713,505 |
|
| Syngenta AG (Switzerland) † | 20,971 | 7,030,975 |
|
| TSRC Corp. (Taiwan) | 842,000 | 1,953,701 |
|
| Uralkali (Russia) † | 645,167 | 5,224,737 |
|
| | | 85,589,223 |
| Coal (1.4%) | | |
| CONSOL Energy, Inc. | 86,800 | 4,401,628 |
|
| Patriot Coal Corp. † S | 101,200 | 2,388,320 |
|
| | | 6,789,948 |
| Construction (1.0%) | | |
| HeidelbergCement AG (Germany) | 66,865 | 4,682,062 |
|
| | | 4,682,062 |
| Containers (1.1%) | | |
| Crown Holdings, Inc. † | 134,700 | 5,183,256 |
|
| | | 5,183,256 |
| Energy (oil field) (8.4%) | | |
| Cameron International Corp. † | 51,000 | 3,015,630 |
|
| Global Geophysical Services, Inc. † | 119,927 | 1,687,373 |
|
| Helix Energy Solutions Group, Inc. † S | 152,000 | 2,340,800 |
|
| National Oilwell Varco, Inc. S | 126,700 | 10,081,519 |
|
| Schlumberger, Ltd. | 189,609 | 17,713,273 |
|
| Weatherford International, Ltd. (Switzerland) † S | 204,500 | 4,944,810 |
|
| | | 39,783,405 |
| Forest products and packaging (1.5%) | | |
| International Paper Co. | 184,400 | 5,122,632 |
|
| Rock-Tenn Co. Class A S | 16,100 | 1,105,265 |
|
| Smurfit-Stone Container Corp. † | 29,300 | 1,126,292 |
|
| | | 7,354,189 |
| Metals (18.3%) | | |
| ArcelorMittal (France) | 57,047 | 2,096,505 |
|
| BHP Billiton PLC (United Kingdom) | 497,697 | 19,702,917 |
|
| Fortescue Metals Group, Ltd. (Australia) † | 796,434 | 5,447,488 |
|
| Freeport-McMoRan Copper & Gold, Inc. Class B | 145,600 | 7,709,520 |
|
| Nucor Corp. S | 70,300 | 3,371,588 |
|
| Rio Tinto PLC (United Kingdom) | 283,560 | 19,879,526 |
|
| Teck Resources, Ltd. Class B (Canada) | 142,700 | 7,898,388 |
|
| Vale SA Class A (Preference) (Brazil) | 121,000 | 3,605,864 |
|
17
| | |
| COMMON STOCKS (98.7%)* cont. | Shares | Value |
|
| Metals cont. | | |
| Vedanta Resources PLC (United Kingdom) | 168,871 | $6,617,989 |
|
| Xstrata PLC (United Kingdom) | 456,383 | 10,431,336 |
|
| | | 86,761,121 |
| Natural gas utilities (0.4%) | | |
| Enterprise Products Partners LP | 38,300 | 1,669,880 |
|
| | | 1,669,880 |
| Oil and gas (48.6%) | | |
| Apache Corp. | 52,200 | 6,505,164 |
|
| BG Group PLC (United Kingdom) | 513,492 | 12,500,995 |
|
| BP PLC (United Kingdom) | 1,875,654 | 15,094,850 |
|
| Cairn Energy PLC (United Kingdom) † | 975,640 | 6,778,808 |
|
| Canadian Natural Resources, Ltd. (Canada) | 173,000 | 8,702,554 |
|
| Chevron Corp. S | 207,600 | 21,538,500 |
|
| Devon Energy Corp. | 74,000 | 6,766,560 |
|
| El Paso Pipeline Partners, LP (Units) | 49,800 | 1,877,460 |
|
| Exxon Mobil Corp. | 400,938 | 34,292,227 |
|
| Gazprom OAO (Russia) | 276,815 | 2,023,725 |
|
| Hess Corp. | 73,200 | 6,370,596 |
|
| Linn Energy, LLC (Units) | 44,106 | 1,712,636 |
|
| Marathon Oil Corp. | 62,500 | 3,100,000 |
|
| Nexen, Inc. (Canada) S | 369,222 | 10,079,369 |
|
| Noble Energy, Inc. | 49,400 | 4,577,404 |
|
| Occidental Petroleum Corp. | 131,206 | 13,379,076 |
|
| OGX Petroleo e Gas Participacoes SA (Brazil) † | 145,800 | 1,703,803 |
|
| Petrohawk Energy Corp. † | 177,500 | 3,834,000 |
|
| Petroleo Brasileiro SA ADR (Brazil) | 118,176 | 4,706,950 |
|
| Petroleo Brasileiro SA ADR (Preference) (Brazil) S | 47,900 | 1,684,643 |
|
| QEP Resources, Inc. | 34,400 | 1,360,520 |
|
| Royal Dutch Shell PLC Class A (United Kingdom) | 419,125 | 15,078,727 |
|
| Royal Dutch Shell PLC Class B (United Kingdom) | 343,404 | 12,281,912 |
|
| Swift Energy Co. † | 42,200 | 1,812,490 |
|
| Technip SA (France) | 62,448 | 6,166,532 |
|
| Total SA (France) | 299,847 | 18,380,358 |
|
| Tullow Oil PLC (United Kingdom) | 359,243 | 8,392,221 |
|
| | | 230,702,080 |
| | | |
| Total common stocks (cost $379,632,502) | | $468,515,164 |
| |
| |
| SHORT-TERM INVESTMENTS (6.2%)* | Principal amount/shares | Value |
|
| Putnam Cash Collateral Pool, LLC 0.21% d | 23,174,162 | $23,174,162 |
|
| Putnam Money Market Liquidity Fund 0.17% e | 4,192,141 | 4,192,141 |
|
| SSgA Prime Money Market Fund 0.12% i P | 180,000 | 180,000 |
|
| U.S. Treasury Bills with an effective yield of 0.23%, | | |
| November 17, 2011 | $181,000 | 180,710 |
|
| U.S. Treasury Bills with effective yields ranging from | | |
| 0.26% to 0.29%, March 10, 2011 ## | 659,000 | 658,955 |
|
18
| | |
| SHORT-TERM INVESTMENTS (6.2%)* cont. | Principal amount/shares | Value |
|
| U.S. Treasury Bills with effective yields ranging from | | |
| 0.20% to 0.25%, October 20, 2011 ## | $1,048,000 | $1,046,636 |
|
| Total short-term investments (cost $29,432,555) | | $29,432,604 |
| |
| |
| TOTAL INVESTMENTS | | |
|
| Total investments (cost $409,065,057) | | $497,947,768 |
Key to holding’s abbreviations
| |
| ADR | American Depository Receipts |
| OAO | Open Joint Stock Company |
Notes to the fund’s portfolio
Unless noted otherwise, the notes to the fund’s portfolio are for the close of the fund’s reporting period, which ran from September 1, 2010 through February 28, 2011 (the reporting period).
* Percentages indicated are based on net assets of $474,773,709.
† Non-income-producing security.
## These securities, in part or in entirety, were pledged and segregated with the custodian for collateral on certain derivatives contracts at the close of the reporting period.
d See Note 1 to the financial statements regarding securities lending. The rate quoted in the security description is the annualized 7-day yield of the fund at the close of the reporting period.
e See Note 6 to the financial statements regarding investments in Putnam Money Market Liquidity Fund. The rate quoted in the security description is the annualized 7-day yield of the fund at the close of the reporting period.
i Security purchased with cash or security received, that was pledged to the fund for collateral on certain derivatives contracts (Note 1).
P The rate quoted in the security description is the annualized 7-day yield of the fund at the close of the reporting period.
S Securities on loan, in part or in entirety, at the close of the reporting period.
At the close of the reporting period, the fund maintained liquid assets totaling $54,449 to cover certain derivatives contracts.
ADR after the name of a foreign holding represents ownership of foreign securities on deposit with a custodian bank.
| | | | |
| DIVERSIFICATION BY COUNTRY | | | | |
|
| Distribution of investments by country of risk at the close of the reporting period (as a percentage of Portfolio Value): |
| | | | |
| United States | 42.1% | | Japan | 2.2% |
| |
|
| United Kingdom | 26.7 | | Russia | 1.5 |
| |
|
| Canada | 6.8 | | Malaysia | 1.4 |
| |
|
| France | 6.7 | | Australia | 1.1 |
| |
|
| Germany | 5.0 | | Netherlands | 1.1 |
| |
|
| Switzerland | 2.5 | | Taiwan | 0.4 |
| |
|
| Brazil | 2.5 | | Total | 100.0% |
| | | |
19
FORWARD CURRENCY CONTRACTS at 2/28/11 (aggregate face value $193,679,552) (Unaudited)
| | | | | | |
| | | | | | Unrealized |
| | Contract | Delivery | | Aggregate | appreciation/ |
| Counterparty | Currency | type | date | Value | face value | (depreciation) |
|
| Bank of America, N.A. | | | | | |
|
| Australian Dollar | Sell | 3/16/11 | $5,089,645 | $5,051,144 | $(38,501) |
|
| British Pound | Sell | 3/16/11 | 6,408,622 | 6,359,393 | (49,229) |
|
| Canadian Dollar | Buy | 3/16/11 | 2,667,326 | 2,604,832 | 62,494 |
|
| Euro | Sell | 3/16/11 | 4,506,761 | 4,489,195 | (17,566) |
|
| Swiss Franc | Buy | 3/16/11 | 804,157 | 798,034 | 6,123 |
|
| Barclays Bank PLC | | | | | |
|
| Australian Dollar | Buy | 3/16/11 | 2,339,750 | 2,321,636 | 18,114 |
|
| British Pound | Sell | 3/16/11 | 2,406,222 | 2,388,567 | (17,655) |
|
| Canadian Dollar | Buy | 3/16/11 | 2,091,756 | 2,046,739 | 45,017 |
|
| Japanese Yen | Sell | 3/16/11 | 654,264 | 657,486 | 3,222 |
|
| Swiss Franc | Sell | 3/16/11 | 756,347 | 751,154 | (5,193) |
|
| Citibank, N.A. | | | | | |
|
| British Pound | Sell | 3/16/11 | 2,284,715 | 2,260,353 | (24,362) |
|
| Euro | Sell | 3/16/11 | 1,643,753 | 1,642,292 | (1,461) |
|
| Hong Kong Dollar | Sell | 3/16/11 | 1,197,224 | 1,197,588 | 364 |
|
| Singapore Dollar | Sell | 3/16/11 | 708 | 708 | — |
|
| Swiss Franc | Sell | 3/16/11 | 476,163 | 472,810 | (3,353) |
|
| Credit Suisse AG | | | | | |
|
| British Pound | Sell | 3/16/11 | 9,955,575 | 9,879,527 | (76,048) |
|
| Canadian Dollar | Buy | 3/16/11 | 8,925,503 | 8,734,385 | 191,118 |
|
| Euro | Sell | 3/16/11 | 1,412,046 | 1,410,502 | (1,544) |
|
| Japanese Yen | Buy | 3/16/11 | 16,939,746 | 17,023,061 | (83,315) |
|
| Norwegian Krone | Buy | 3/16/11 | 1,437,434 | 1,404,081 | 33,353 |
|
| Deutsche Bank AG | | | | | |
|
| Australian Dollar | Buy | 3/16/11 | 1,411,152 | 1,398,049 | 13,103 |
|
| Canadian Dollar | Buy | 3/16/11 | 1,686,767 | 1,649,469 | 37,298 |
|
| Euro | Sell | 3/16/11 | 1,926,244 | 1,924,934 | (1,310) |
|
| Swedish Krona | Buy | 3/16/11 | 1,377,399 | 1,352,186 | 25,213 |
|
| Goldman Sachs International | | | | | |
|
| British Pound | Sell | 3/16/11 | 3,847,385 | 3,818,091 | (29,294) |
|
| Euro | Buy | 3/16/11 | 1,105,541 | 1,104,316 | 1,225 |
|
| Japanese Yen | Sell | 3/16/11 | 1,322,806 | 1,329,271 | 6,465 |
|
| Norwegian Krone | Buy | 3/16/11 | 1,695,018 | 1,656,280 | 38,738 |
|
| HSBC Bank USA, National Association | | | | |
|
| Australian Dollar | Buy | 3/16/11 | 20,796,589 | 20,633,750 | 162,839 |
|
| British Pound | Sell | 3/16/11 | 6,732,639 | 6,681,170 | (51,469) |
|
| Hong Kong Dollar | Buy | 3/16/11 | 2,660,953 | 2,662,042 | (1,089) |
|
| Norwegian Krone | Buy | 3/16/11 | 2,436,588 | 2,380,342 | 56,246 |
|
| JPMorgan Chase Bank, N.A. | | | | | |
|
| Australian Dollar | Buy | 3/16/11 | 3,532,659 | 3,504,790 | 27,869 |
|
| British Pound | Buy | 3/16/11 | 377,370 | 374,493 | 2,877 |
|
| Canadian Dollar | Buy | 3/16/11 | 4,827,025 | 4,721,835 | 105,190 |
|
| Euro | Sell | 3/16/11 | 8,470,480 | 8,461,832 | (8,648) |
|
20
FORWARD CURRENCY CONTRACTS at 2/28/11 (aggregate face value $193,679,552) (Unaudited) cont.
| | | | | | |
| | | | | | Unrealized |
| | Contract | Delivery | | Aggregate | appreciation/ |
| Counterparty | Currency | type | date | Value | face value | (depreciation) |
|
| JPMorgan Chase Bank, N.A. cont. | | | | | |
|
| Hong Kong Dollar | Sell | 3/16/11 | $1,931,041 | $1,931,644 | $603 |
|
| Japanese Yen | Sell | 3/16/11 | 1,986,205 | 1,996,207 | 10,002 |
|
| Swiss Franc | Buy | 3/16/11 | 1,938,786 | 1,924,660 | 14,126 |
|
| Royal Bank of Scotland PLC (The) | | | | | |
|
| Australian Dollar | Sell | 3/16/11 | 652,592 | 647,154 | (5,438) |
|
| British Pound | Sell | 3/16/11 | 1,923,774 | 1,909,324 | (14,450) |
|
| Canadian Dollar | Buy | 3/16/11 | 1,625,514 | 1,592,119 | 33,395 |
|
| Euro | Sell | 3/16/11 | 1,855,311 | 1,853,914 | (1,397) |
|
| Israeli Shekel | Buy | 3/16/11 | 332,984 | 327,330 | 5,654 |
|
| Japanese Yen | Sell | 3/16/11 | 238,894 | 240,095 | 1,201 |
|
| State Street Bank and Trust Co. | | | | | |
|
| Australian Dollar | Buy | 3/16/11 | 1,958,690 | 1,943,754 | 14,936 |
|
| Canadian Dollar | Buy | 3/16/11 | 8,781,276 | 8,594,190 | 187,086 |
|
| Euro | Buy | 3/16/11 | 3,601,876 | 3,598,219 | 3,657 |
|
| Israeli Shekel | Buy | 3/16/11 | 333,012 | 327,501 | 5,511 |
|
| UBS AG | | | | | |
|
| Australian Dollar | Buy | 3/16/11 | 4,562,243 | 4,524,905 | 37,338 |
|
| British Pound | Sell | 3/16/11 | 5,017,070 | 4,979,702 | (37,368) |
|
| Euro | Buy | 3/16/11 | 10,593,103 | 10,588,351 | 4,752 |
|
| Israeli Shekel | Buy | 3/16/11 | 333,012 | 327,190 | 5,822 |
|
| Norwegian Krone | Buy | 3/16/11 | 854,279 | 835,083 | 19,196 |
|
| Westpac Banking Corp. | | | | | |
|
| Australian Dollar | Sell | 3/16/11 | 1,319,929 | 1,309,594 | (10,335) |
|
| British Pound | Sell | 3/16/11 | 1,927,840 | 1,913,037 | (14,803) |
|
| Euro | Buy | 3/16/11 | 5,301,243 | 5,296,676 | 4,567 |
|
| Japanese Yen | Sell | 3/16/11 | 1,862,875 | 1,872,566 | 9,691 |
|
| Total | | | | | $700,577 |
TOTAL RETURN SWAP CONTRACTS OUTSTANDING at 2/28/11 (Unaudited)
| | | | | | |
| | | | | Fixed payments | Total return | |
| Swap counterparty / | Termination | | received (paid) by | received by | Unrealized |
| Notional amount | date | | fund per annum | or paid by fund | appreciation |
|
| Goldman Sachs International | | | | | |
| baskets | 17,161 | 9/14/11 | | (1 month USD- | A basket | $78,679 |
| | | | | LIBOR-BBA | (GSGLPMIN) | |
| | | | | plus 60 bp) | of common stocks | |
|
| Total | | | | | | $78,679 |
21
Accounting Standards Codification ASC 820 Fair Value Measurements and Disclosures (ASC 820) establishes a three-level hierarchy for disclosure of fair value measurements. The valuation hierarchy is based upon the transparency of inputs to the valuation of the fund’s investments. The three levels are defined as follows:
Level 1 — Valuations based on quoted prices for identical securities in active markets.
Level 2 — Valuations based on quoted prices in markets that are not active or for which all significant inputs are observable, either directly or indirectly.
Level 3 — Valuations based on inputs that are unobservable and significant to the fair value measurement.
The following is a summary of the inputs used to value the fund’s net assets as of the close of the reporting period:
| | | | | | |
| | | | | Valuation inputs | |
|
| Investments in securities: | | Level 1 | Level 2 | Level 3 |
|
| Common stocks: | | | | |
|
| Basic materials | | $159,654,452 | $24,732,143 | $— |
|
| Capital goods | | 5,183,256 | — | — |
|
| Energy | | 277,275,433 | — | —�� |
|
| Utilities and power | | 1,669,880 | — | — |
|
| Total common stocks | | 443,783,021 | 24,732,143 | — |
| | | | | |
| Short-term investments | | 4,372,141 | 25,060,463 | — |
|
| Totals by level | | $448,155,162 | $49,792,606 | $— |
| | | | | |
| | | | | Valuation inputs | |
|
| Other financial instruments: | | Level 1 | Level 2 | Level 3 |
|
| Forward currency contracts | | $— | $700,577 | $— |
|
| Total return swap contracts | | — | 78,679 | — |
|
| Totals by level | | $— | $779,256 | $— |
The accompanying notes are an integral part of these financial statements.
22
Statement of assets and liabilities 2/28/11 (Unaudited)
| |
| ASSETS | |
|
| Investment in securities, at value, including $22,790,647 of securities on loan (Note 1): | |
| Unaffiliated issuers (identified cost $381,698,754) | $470,581,465 |
| Affiliated issuers (identified cost $27,366,303) (Notes 1 and 6) | 27,366,303 |
|
| Foreign currency (cost $8,768) (Note 1) | 8,676 |
|
| Dividends, interest and other receivables | 886,572 |
|
| Receivable for shares of the fund sold | 1,556,619 |
|
| Receivable for investments sold | 15,847,982 |
|
| Unrealized appreciation on swap contracts (Note 1) | 78,679 |
|
| Unrealized appreciation on forward currency contracts (Note 1) | 1,194,405 |
|
| Total assets | 517,520,701 |
|
| |
| LIABILITIES | |
|
| Payable for investments purchased | 17,482,511 |
|
| Payable for shares of the fund repurchased | 706,292 |
|
| Payable for compensation of Manager (Note 2) | 224,549 |
|
| Payable for investor servicing fees (Note 2) | 104,016 |
|
| Payable for custodian fees (Note 2) | 21,607 |
|
| Payable for Trustee compensation and expenses (Note 2) | 88,206 |
|
| Payable for administrative services (Note 2) | 1,642 |
|
| Payable for distribution fees (Note 2) | 204,874 |
|
| Unrealized depreciation on forward currency contracts (Note 1) | 493,828 |
|
| Collateral on securities loaned, at value (Note 1) | 23,174,162 |
|
| Collateral on certain derivative contracts, at value (Note 1) | 180,000 |
|
| Other accrued expenses | 65,305 |
|
| Total liabilities | 42,746,992 |
| |
| Net assets | $474,773,709 |
|
| |
| REPRESENTED BY | |
|
| Paid-in capital (Unlimited shares authorized) (Notes 1 and 4) | $482,696,825 |
|
| Distributions in excess of net investment income (Note 1) | (29,989) |
|
| Accumulated net realized loss on investments and foreign currency transactions (Note 1) | (97,559,603) |
|
| Net unrealized appreciation of investments and assets and liabilities in foreign currencies | 89,666,476 |
|
| Total — Representing net assets applicable to capital shares outstanding | $474,773,709 |
|
| |
| COMPUTATION OF NET ASSET VALUE AND OFFERING PRICE | |
|
| Net asset value and redemption price per class A share ($388,796,183 divided by 16,318,873 shares) | $23.82 |
|
| Offering price per class A share (100/94.25 of $23.82)* | $25.27 |
|
| Net asset value and offering price per class B share ($27,268,861 divided by 1,276,938 shares)** | $21.35 |
|
| Net asset value and offering price per class C share ($20,345,265 divided by 932,744 shares)** | $21.81 |
|
| Net asset value and redemption price per class M share ($7,338,519 divided by 323,305 shares) | $22.70 |
|
| Offering price per class M share (100/96.50 of $22.70)* | $23.52 |
|
| Net asset value, offering price and redemption price per class R share | |
| ($18,450,504 divided by 788,479 shares) | $23.40 |
|
| Net asset value, offering price and redemption price per class Y share | |
| ($12,574,377 divided by 524,733 shares) | $23.96 |
|
* On single retail sales of less than $50,000. On sales of $50,000 or more the offering price is reduced.
** Redemption price per share is equal to net asset value less any applicable contingent deferred sales charge.
The accompanying notes are an integral part of these financial statements.
23
Statement of operations Six months ended 2/28/11 (Unaudited)
| |
| INVESTMENT INCOME | |
|
| Dividends (net of foreign tax of $181,642) | $3,008,155 |
|
| Interest (including interest income of $4,042 from investments in affiliated issuers) (Note 6) | 5,135 |
|
| Securities lending (Note 1) | 59,735 |
|
| Total investment income | 3,073,025 |
|
| |
| EXPENSES | |
|
| Compensation of Manager (Note 2) | 1,318,486 |
|
| Investor servicing fees (Note 2) | 689,299 |
|
| Custodian fees (Note 2) | 27,524 |
|
| Trustee compensation and expenses (Note 2) | 21,269 |
|
| Administrative services (Note 2) | 3,581 |
|
| Distribution fees — Class A (Note 2) | 430,477 |
|
| Distribution fees — Class B (Note 2) | 124,933 |
|
| Distribution fees — Class C (Note 2) | 83,697 |
|
| Distribution fees — Class M (Note 2) | 23,831 |
|
| Distribution fees — Class R (Note 2) | 36,592 |
|
| Other | 64,274 |
|
| Total expenses | 2,823,963 |
| | |
| Expense reduction (Note 2) | (16,144) |
|
| Net expenses | 2,807,819 |
| |
| Net investment income | 265,206 |
|
| |
| Net realized gain on investments (Notes 1 and 3) | 49,743,183 |
|
| Net realized gain on swap contracts (Note 1) | 564,987 |
|
| Net realized gain on foreign currency transactions (Note 1) | 3,572,026 |
|
| Net unrealized appreciation of assets and liabilities in foreign currencies during the period | 732,368 |
|
| Net unrealized appreciation of investments and swap contracts during the period | 98,511,540 |
|
| Net gain on investments | 153,124,104 |
| |
| Net increase in net assets resulting from operations | $153,389,310 |
|
The accompanying notes are an integral part of these financial statements.
24
Statement of changes in net assets
| | |
| INCREASE (DECREASE) IN NET ASSETS | Six months ended 2/28/11* | Year ended 8/31/10 |
|
| Operations: | | |
| Net investment income | $265,206 | $2,538,891 |
|
| Net realized gain on investments and foreign | | |
| currency transactions | 53,880,196 | 55,579,563 |
|
| Net unrealized appreciation (depreciation) of investments | | |
| and assets and liabilities in foreign currencies | 99,243,908 | (56,939,941) |
|
| Net increase in net assets resulting from operations | 153,389,310 | 1,178,513 |
|
| Distributions to shareholders (Note 1): | | |
| From ordinary income | | |
| Net investment income | | |
|
| Class A | (6,537,764) | (3,744,786) |
|
| Class B | (334,168) | (137,638) |
|
| Class C | (240,868) | (85,731) |
|
| Class M | (100,316) | (46,266) |
|
| Class R | (256,967) | (109,392) |
|
| Class Y | (230,734) | (146,008) |
|
| Redemption fees (Note 1) | 9,264 | 19,914 |
|
| Decrease from capital share transactions (Note 4) | (15,703,682) | (45,610,374) |
|
| Total increase (decrease) in net assets | 129,994,075 | (48,681,768) |
|
| |
| NET ASSETS | | |
|
| Beginning of period | 344,779,634 | 393,461,402 |
|
| End of period (including distributions in excess of net investment | |
| income of $29,989 and undistributed net investment income | | |
| of $7,405,622, respectively) | $474,773,709 | $344,779,634 |
|
* Unaudited
The accompanying notes are an integral part of these financial statements.
25
Financial highlights (For a common share outstanding throughout the period)
| | | | | | | | | | | | | | | |
| INVESTMENT OPERATIONS: | | | | LESS DISTRIBUTIONS: | | | | | RATIOS AND SUPPLEMENTAL DATA: | | |
|
| | | | | | | | | | | | | | Ratio | | |
| | | | | | | | | | | | | | of expenses | | |
| | | | | | | | | | | | | | to average | Ratio | |
| | Net asset | | Net realized | | | | | | | | | Ratio | net assets, | of net investment | |
| | value, | | and unrealized | Total from | From | From | | | | Total return | Net assets, | of expenses | excluding | income (loss) | |
| | beginning | Net investment | gain (loss) | investment | net investment | net realized gain | Total | Redemption | Net asset value, | at net asset | end of period | to average | interest expense | to average | Portfolio |
| Period ended | of period | income (loss) a | on investments | operations | income | on investments | distributions | fees | end of period | value (%) b | (in thousands) | net assets (%) c | (%) c | net assets (%) | turnover (%) |
|
| Class A | | | | | | | | | | | | | | | |
| February 28, 2011** | $16.62 | .02 | 7.58 | 7.60 | (.40) | — | (.40) | — d | $23.82 | 45.98 * | $388,796 | .63* | .63* | .11* | 51* |
| August 31, 2010 | 16.87 | .13 | (.18) | (.05) | (.20) | — | (.20) | — d | 16.62 | (.44) | 284,668 | 1.39 | 1.39 | .71 | 107 |
| August 31, 2009 | 27.99 | .19 | (9.21) | (9.02) | — | (2.10) | (2.10) | — d | 16.87 | (29.64) | 321,830 | 1.44 e,f | 1.43 f | 1.22 f | 92 |
| August 31, 2008 | 35.18 | .29 | (.54) | (.25) | (.08) | (6.87) | (6.95) | .01 | 27.99 | (2.76) | 559,989 | 1.18 f | 1.18 f | .87 f | 99 |
| August 31, 2007 | 31.31 | .17 | 7.36 | 7.53 | (.42) | (3.25) | (3.67) | .01 | 35.18 | 26.01 | 557,614 | 1.23 f | 1.23 f | .52 f | 64 |
| August 31, 2006 | 31.01 | .14 g | 4.04 | 4.18 | (.03) | (3.86) | (3.89) | .01 | 31.31 | 14.92 | 471,531 | 1.20 f,g | 1.20 f,g | .45 f,g | 56 |
|
| Class B | | | | | | | | | | | | | | | |
| February 28, 2011** | $14.87 | (.05) | 6.79 | 6.74 | (.26) | — | (.26) | — d | $21.35 | 45.45 * | $27,269 | 1.00* | 1.00* | (.27)* | 51* |
| August 31, 2010 | 15.11 | (.01) | (.15) | (.16) | (.08) | — | (.08) | — d | 14.87 | (1.15) | 21,418 | 2.14 | 2.14 | (.05) | 107 |
| August 31, 2009 | 25.66 | .06 | (8.51) | (8.45) | — | (2.10) | (2.10) | — d | 15.11 | (30.18) | 30,849 | 2.19 e,f | 2.18 f | .45 f | 92 |
| August 31, 2008 | 32.93 | .02 | (.43) | (.41) | — | (6.87) | (6.87) | .01 | 25.66 | (3.52) | 70,360 | 1.93 f | 1.93 f | .08 f | 99 |
| August 31, 2007 | 29.48 | (.07) | 6.91 | 6.84 | (.15) | (3.25) | (3.40) | .01 | 32.93 | 25.05 | 98,246 | 1.98 f | 1.98 f | (.24) f | 64 |
| August 31, 2006 | 29.58 | (.10) g | 3.85 | 3.75 | — | (3.86) | (3.86) | .01 | 29.48 | 14.11 | 121,924 | 1.95 f,g | 1.95 f,g | (.33) f,g | 56 |
|
| Class C | | | | | | | | | | | | | | | |
| February 28, 2011** | $15.20 | (.05) | 6.94 | 6.89 | (.28) | — | (.28) | — d | $21.81 | 45.49 * | $20,345 | 1.00* | 1.00* | (.26)* | 51* |
| August 31, 2010 | 15.47 | (.01) | (.16) | (.17) | (.10) | — | (.10) | — d | 15.20 | (1.21) | 13,292 | 2.14 | 2.14 | (.04) | 107 |
| August 31, 2009 | 26.18 | .07 | (8.68) | (8.61) | — | (2.10) | (2.10) | — d | 15.47 | (30.18) | 14,156 | 2.19 e,f | 2.18 f | .47 f | 92 |
| August 31, 2008 | 33.46 | .04 | (.45) | (.41) | — | (6.87) | (6.87) | — d | 26.18 | (3.49) | 25,383 | 1.93 f | 1.93 f | .12 f | 99 |
| August 31, 2007 | 29.90 | (.07) | 7.02 | 6.95 | (.15) | (3.25) | (3.40) | .01 | 33.46 | 25.07 | 24,489 | 1.98 f | 1.98 f | (.24) f | 64 |
| August 31, 2006 | 29.96 | (.10) g | 3.89 | 3.79 | — | (3.86) | (3.86) | .01 | 29.90 | 14.06 | 24,107 | 1.95 f,g | 1.95 f,g | (.33) f,g | 56 |
|
| Class M | | | | | | | | | | | | | | | |
| February 28, 2011** | $15.82 | (.03) | 7.22 | 7.19 | (.31) | — | (.31) | — d | $22.70 | 45.66 * | $7,339 | .88* | .88* | (.14)* | 51* |
| August 31, 2010 | 16.08 | .04 | (.17) | (.13) | (.13) | — | (.13) | — d | 15.82 | (.91) | 5,141 | 1.89 | 1.89 | .20 | 107 |
| August 31, 2009 | 27.00 | .11 | (8.93) | (8.82) | — | (2.10) | (2.10) | — d | 16.08 | (30.03) | 5,609 | 1.94 e,f | 1.93 f | .73 f | 92 |
| August 31, 2008 | 34.22 | .12 | (.48) | (.36) | — | (6.87) | (6.87) | .01 | 27.00 | (3.20) | 9,172 | 1.68 f | 1.68 f | .36 f | 99 |
| August 31, 2007 | 30.55 | — d | 7.17 | 7.17 | (.26) | (3.25) | (3.51) | .01 | 34.22 | 25.36 | 9,283 | 1.73 f | 1.73 f | .01 f | 64 |
| August 31, 2006 | 30.46 | (.01) g | 3.95 | 3.94 | — | (3.86) | (3.86) | .01 | 30.55 | 14.35 | 8,036 | 1.70 f,g | 1.70 f,g | (.04) f,g | 56 |
|
| Class R | | | | | | | | | | | | | | | |
| February 28, 2011** | $16.31 | — d | 7.45 | 7.45 | (.36) | — | (.36) | — d | $23.40 | 45.92 * | $18,451 | .75* | .75* | (.01)* | 51* |
| August 31, 2010 | 16.58 | .09 | (.19) | (.10) | (.17) | — | (.17) | — d | 16.31 | (.72) | 11,192 | 1.64 | 1.64 | .48 | 107 |
| August 31, 2009 | 27.64 | .15 | (9.11) | (8.96) | — | (2.10) | (2.10) | — d | 16.58 | (29.82) | 9,966 | 1.69 e,f | 1.68 f | 1.00 f | 92 |
| August 31, 2008 | 34.87 | .22 | (.53) | (.31) | (.06) | (6.87) | (6.93) | .01 | 27.64 | (2.99) | 10,129 | 1.43 f | 1.43 f | .69 f | 99 |
| August 31, 2007 | 31.09 | .08 | 7.31 | 7.39 | (.37) | (3.25) | (3.62) | .01 | 34.87 | 25.69 | 5,684 | 1.48 f | 1.48 f | .25 f | 64 |
| August 31, 2006 | 30.89 | .10 g | 3.98 | 4.08 | (.03) | (3.86) | (3.89) | .01 | 31.09 | 14.62 | 2,370 | 1.45 f,g | 1.45 f,g | .28 f,g | 56 |
|
| Class Y | | | | | | | | | | | | | | | |
| February 28, 2011** | $16.73 | .05 | 7.63 | 7.68 | (.45) | — | (.45) | — d | $23.96 | 46.19 * | $12,574 | .50* | .50* | .23* | 51* |
| August 31, 2010 | 16.97 | .18 | (.18) | — d | (.24) | — | (.24) | — d | 16.73 | (.16) | 9,069 | 1.14 | 1.14 | .95 | 107 |
| August 31, 2009 | 28.07 | .23 | (9.23) | (9.00) | — | (2.10) | (2.10) | — d | 16.97 | (29.47) | 11,052 | 1.19 e,f | 1.18 f | 1.48 f | 92 |
| August 31, 2008 | 35.26 | .38 | (.54) | (.16) | (.17) | (6.87) | (7.04) | .01 | 28.07 | (2.51) | 16,306 | .93 f | .93 f | 1.16 f | 99 |
| August 31, 2007 | 31.38 | .25 | 7.37 | 7.62 | (.50) | (3.25) | (3.75) | .01 | 35.26 | 26.30 | 17,390 | .98 f | .98 f | .77 f | 64 |
| August 31, 2006† | 32.74 | .22 g | 2.31 | 2.53 | (.04) | (3.86) | (3.90) | .01 | 31.38 | 9.14 * | 14,795 | .87*f,g | .87*f,g | .73*f,g | 56 |
|
See notes to financial highlights at the end of this section.
The accompanying notes are an integral part of these financial statements.
Financial highlights (Continued)
* Not annualized.
** Unaudited.
† For the period October 4, 2005 (commencement of operations) to August 31, 2006.
a Per share net investment income (loss) has been determined on the basis of the weighted average number of shares outstanding during the period.
b Total return assumes dividend reinvestment and does not reflect the effect of sales charges.
c Includes amounts paid through expense offset and brokerage/service arrangements (Note 2).
d Amount represents less than $0.01 per share.
e Includes interest accrued in connection with certain terminated derivatives contracts, which amounted to 0.01% of average net assets for the period ended August 31, 2009.
f Reflects an involuntary contractual expense limitation and/or waivers of certain fund expenses in connection with investments in Putnam Prime Money Market Fund in effect during the period. As a result of such limitation and/or waivers, the expenses of each class reflect a reduction of the following amounts:
| |
| | Percentage of |
| | average net assets |
|
| August 31, 2009 | 0.05% |
|
| August 31, 2008 | <0.01 |
|
| August 31, 2007 | <0.01 |
|
| August 31, 2006 | <0.01 |
|
g Reflects a non-recurring reimbursement from Putnam Investments relating to the calculation of certain amounts paid by the fund to Putnam in previous years for transfer agent services, which amounted to less than $0.01 per share and 0.01% of average net assets for the period ended August 31, 2006.
The accompanying notes are an integral part of these financial statements.
28
Notes to financial statements 2/28/11 (Unaudited)
Note 1: Significant accounting policies
Putnam Global Natural Resources Fund (the fund), is a Massachusetts business trust, which is registered under the Investment Company Act of 1940, as amended, as a non-diversified open-end management investment company. The investment objective of the fund is to seek capital appreciation by investing primarily in common stocks of large and midsized companies worldwide in the energy and other natural resources industries that Putnam Investment Management, LLC (Putnam Management), the fund’s manager, an indirect wholly-owned subsidiary of Putnam Investments, LLC, believes have favorable investment potential. The fund concentrates its investments in one sector, which involves more risk than a fund that invests more broadly.
The fund offers class A, class B, class C, class M, class R and class Y shares. Class A and class M shares are sold with a maximum front-end sales charge of 5.75% and 3.50%, respectively, and generally do not pay a contingent deferred sales charge. Class B shares, which convert to class A shares after approximately eight years, do not pay a front-end sales charge and are subject to a contingent deferred sales charge if those shares are redeemed within six years of purchase. Class C shares have a one-year 1.00% contingent deferred sales charge and do not convert to class A shares. Class R shares, which are not available to all investors, are sold at net asset value. The expenses for class A, class B, class C, class M and class R shares may differ based on the distribution fee of each class, which is identified in Note 2. Class Y shares, which are sold at net asset value, are generally subject to the same expenses as class A, class B, class C, class M and class R shares, but do not bear a distribution fee. Class Y shares are not available to all investors.
A 1.00% redemption fee may apply on any shares that are redeemed (either by selling or exchanging into another fund) within 90 days of purchase. The redemption fee is accounted for as an addition to paid-in-capital.
Investment income, realized and unrealized gains and losses and expenses of the fund are borne pro-rata based on the relative net assets of each class to the total net assets of the fund, except that each class bears expenses unique to that class (including the distribution fees applicable to such classes). Each class votes as a class only with respect to its own distribution plan or other matters on which a class vote is required by law or determined by the Trustees. If the fund were liquidated, shares of each class would receive their pro-rata share of the net assets of the fund. In addition, the Trustees declare separate dividends on each class of shares.
In the normal course of business, the fund enters into contracts that may include agreements to indemnify another party under given circumstances. The fund’s maximum exposure under these arrangements is unknown as this would involve future claims that may be, but have not yet been, made against the fund. However, the fund’s management team expects the risk of material loss to be remote.
The following is a summary of significant accounting policies consistently followed by the fund in the preparation of its financial statements. The preparation of financial statements is in conformity with accounting principles generally accepted in the United States of America and requires management to make estimates and assumptions that affect the reported amounts of assets and liabilities in the financial statements and the reported amounts of increases and decreases in net assets from operations. Actual results could differ from those estimates. Subsequent events after the Statement of assets and liabilities date through the date that the financial statements were issued have been evaluated in the preparation of the financial statements. Unless otherwise noted, the “reporting period” represents the period from September 1, 2010 through February 28, 2011.
A) Security valuation Investments for which market quotations are readily available are valued at the last reported sales price on their principal exchange, or official closing price for certain markets, and are classified as Level 1 securities. If no sales are reported — as in the case of some securities traded over-the-counter — a security is valued at its last reported bid price and is generally categorized as a Level 2 security.
Many securities markets and exchanges outside the U.S. close prior to the close of the New York Stock Exchange and therefore the closing prices for securities in such markets or on such exchanges may not fully reflect events that occur after such close but before the close of the New York Stock Exchange. Accordingly, on certain days, the fund will fair value foreign equity securities taking into account multiple factors including movements in the U.S. securities markets, currency valuations and comparisons to the valuation of American Depository Receipts, exchange-traded funds and futures contracts. These securities, which will generally represent a transfer from a Level 1 to a Level 2 security, will be classified as Level 2. The number of days on which fair value prices will be used will depend on market activity and it is possible that fair value prices will be used by the fund to a significant extent. At the close of the reporting period, fair value pricing was used for certain foreign securities in the portfolio. Securities quoted in foreign currencies, if any, are translated into U.S. dollars at the current exchange rate.
29
To the extent a pricing service or dealer is unable to value a security or provides a valuation that Putnam Management does not believe accurately reflects the security’s fair value, the security will be valued at fair value by Putnam Management. Certain investments, including certain restricted and illiquid securities and derivatives, are also valued at fair value following procedures approved by the Trustees. These valuations consider such factors as significant market or specific security events such as interest rate or credit quality changes, various relationships with other securities, discount rates, U.S. Treasury, U.S. swap and credit yields, index levels, convexity exposures and recovery rates. These securities are classified as Level 2 or as Level 3 depending on the priority of the significant inputs.
Such valuations and procedures are reviewed periodically by the Trustees. The fair value of securities is generally determined as the amount that the fund could reasonably expect to realize from an orderly disposition of such securities over a reasonable period of time. By its nature, a fair value price is a good faith estimate of the value of a security in a current sale and does not reflect an actual market price, which may be different by a material amount.
B) Security transactions and related investment income Security transactions are recorded on the trade date (the date the order to buy or sell is executed). Gains or losses on securities sold are determined on the identified cost basis.
Interest income is recorded on the accrual basis. Dividend income, net of applicable withholding taxes, is recognized on the ex-dividend date except that certain dividends from foreign securities, if any, are recognized as soon as the fund is informed of the ex-dividend date. Non-cash dividends, if any, are recorded at the fair market value of the securities received. Dividends representing a return of capital or capital gains, if any, are reflected as a reduction of cost and/or as a realized gain.
All premiums/discounts are amortized/accreted on a yield-to-maturity basis.
C) Foreign currency translation The accounting records of the fund are maintained in U.S. dollars. The market value of foreign securities, currency holdings, and other assets and liabilities is recorded in the books and records of the fund after translation to U.S. dollars based on the exchange rates on that day. The cost of each security is determined using historical exchange rates. Income and withholding taxes are translated at prevailing exchange rates when earned or incurred. The fund does not isolate that portion of realized or unrealized gains or losses resulting from changes in the foreign exchange rate on investments from fluctuations arising from changes in the market prices of the securities. Such gains and losses are included with the net realized and unrealized gain or loss on investments. Net realized gains and losses on foreign currency transactions represent net realized exchange gains or losses on closed forward currency contracts, disposition of foreign currencies, currency gains and losses realized between the trade and settlement dates on securities transactions and the difference between the amount of investment income and foreign withholding taxes recorded on the fund’s books and the U.S. dollar equivalent amounts actually received or paid. Net unrealized appreciation and depreciation of assets and liabilities in foreign currencies arise from changes in the value of open forward currency contracts and assets and liabilities other than investments at the period end, resulting from changes in the exchange rate. Investments in foreign securities involve certain risks, including those related to economic instability, unfavorable political developments, and currency fluctuations, not present with domestic investments. The fund may be subject to taxes imposed by governments of countries in which it invests. Such taxes are generally based on either income or gains earned or repatriated. The fund accrues and applies such taxes to net investment income, net realized gains and net unrealized gains as income and/or capital gains are earned. In some cases, the fund may be entitled to reclaim all or a portion of such taxes, and such reclaim amounts, if any, are reflected as an asset on the fund’s books. In many cases, however, the fund may not receive such amounts for an extended period of time, depending on the country of investment.
D) Forward currency contracts The fund buys and sells forward currency contracts, which are agreements between two parties to buy and sell currencies at a set price on a future date. These contracts are used to hedge foreign exchange risk. The U.S. dollar value of forward currency contracts is determined using current forward currency exchange rates supplied by a quotation service. The market value of the contract will fluctuate with changes in currency exchange rates. The contract is marked to market daily and the change in market value is recorded as an unrealized gain or loss. When the contract is closed, the fund records a realized gain or loss equal to the difference between the value of the contract at the time it was opened and the value at the time it was closed. The fund could be exposed to risk if the value of the currency changes unfavorably, if the counterparties to the contracts are unable to meet the terms of their contracts or if the fund is unable to enter into a closing position. Risks may exceed amounts recognized on the Statement of assets and liabilities. Forward currency contracts outstanding at period end, if any, are listed after the fund’s portfolio. Outstanding contracts on forward currency contracts at the close of the reporting period are indicative of the volume of activity during the reporting period.
E) Total return swap contracts The fund enters into total return swap contracts, which are arrangements to exchange a market linked return for a periodic payment, both based on a notional principal amount to gain
30
exposure to specific sectors/industries. To the extent that the total return of the security, index or other financial measure underlying the transaction exceeds or falls short of the offsetting interest rate obligation, the fund will receive a payment from or make a payment to the counterparty. Total return swap contracts are marked to market daily based upon quotations from an independent pricing service or market makers and the change, if any, is recorded as an unrealized gain or loss. Payments received or made are recorded as realized gains or losses. Certain total return swap contracts may include extended effective dates. Payments related to these swap contracts are accrued based on the terms of the contract. The fund could be exposed to credit or market risk due to unfavorable changes in the fluctuation of interest rates or in the price of the underlying security or index, the possibility that there is no liquid market for these agreements or that the counterparty may default on its obligation to perform. The fund’s maximum risk of loss from counterparty risk is the fair value of the contract. This risk may be mitigated by having a master netting arrangement between the fund and the counterparty. Risk of loss may exceed amounts recognized on the Statement of assets and liabilities. Total return swap contracts outstanding at period end, if any, are listed after the fund’s portfolio. Outstanding notional amount on total return swap contracts at the close of the reporting period are indicative of the volume of activity during the reporting period.
F) Master agreements The fund is a party to ISDA (International Swap and Derivatives Association, Inc.) Master Agreements (Master Agreements) with certain counterparties that govern over-the-counter derivative and foreign exchange contracts entered into from time to time. The Master Agreements may contain provisions regarding, among other things, the parties’ general obligations, representations, agreements, collateral requirements, events of default and early termination. With respect to certain counterparties, in accordance with the terms of the Master Agreements, collateral posted to the fund is held in a segregated account by the fund’s custodian and with respect to those amounts which can be sold or repledged, are presented in the fund’s portfolio. Collateral posted to the fund which cannot be sold or repledged totaled $146,625 at the close of the reporting period. Collateral pledged by the fund is segregated by the fund’s custodian and identified in the fund’s portfolio. Collateral can be in the form of cash or debt securities issued by the U.S. Government or related agencies or other securities as agreed to by the fund and the applicable counterparty. Collateral requirements are determined based on the fund’s net position with each counterparty. Termination events applicable to the fund may occur upon a decline in the fund’s net assets below a specified threshold over a certain period of time. Termination events applicable to counterparties may occur upon a decline in the counterparty’s long-term and short-term credit ratings below a specified level. In each case, upon occurrence, the other party may elect to terminate early and cause settlement of all derivative and foreign exchange contracts outstanding, including the payment of any losses and costs resulting from such early termination, as reasonably determined by the terminating party. Any decision by one or more of the fund’s counterparties to elect early termination could impact the fund’s future derivative activity.
At the close of the reporting period, the fund had a net liability position of $76,371 on derivative contracts subject to the Master Agreements. Collateral posted by the fund totaled $577,498.
G) Securities lending The fund may lend securities, through its agent, to qualified borrowers in order to earn additional income. The loans are collateralized by cash in an amount at least equal to the market value of the securities loaned. The market value of securities loaned is determined daily and any additional required collateral is allocated to the fund on the next business day. The risk of borrower default will be borne by the fund’s agent; the fund will bear the risk of loss with respect to the investment of the cash collateral. Income from securities lending is included in investment income on the Statement of operations. Effective August 2010, cash collateral is invested in Putnam Cash Collateral Pool, LLC, a limited liability company managed by an affiliate of Putnam Management. Investments in Putnam Cash Collateral Pool, LLC are valued at its closing net asset value each business day. There are no management fees charged by Putnam Cash Collateral Pool, LLC. At the close of the reporting period, the value of securities loaned amounted to $22,790,647 and the fund received cash collateral of $23,174,162.
H) Interfund lending The fund, along with other Putnam funds, may participate in an interfund lending program pursuant to an exemptive order issued by the Securities and Exchange Commission (the SEC). This program allows the fund to borrow from or lend to other Putnam funds that permit such transactions. Interfund lending transactions are subject to each fund’s investment policies and borrowing and lending limits. Interest earned or paid on the interfund lending transaction will be based on the average of certain current market rates. During the reporting period, the fund did not utilize the program.
I) Line of credit The fund participates, along with other Putnam funds, in a $285 million unsecured committed line of credit and a $165 million unsecured uncommitted line of credit, both provided by State Street Bank and Trust Company (State Street). Borrowings may be made for temporary or emergency purposes, including the funding of shareholder redemption requests and trade settlements. Interest is charged to the fund based on the fund’s
31
borrowing at a rate equal to the Federal Funds rate plus 1.25% for the committed line of credit and the Federal Funds rate plus 1.30% for the uncommitted line of credit. A closing fee equal to 0.03% of the committed line of credit and $100,000 for the uncommitted line of credit has been paid by the participating funds. In addition, a commitment fee of 0.15% per annum on any unutilized portion of the committed line of credit is allocated to the participating funds based on their relative net assets and paid quarterly. During the reporting period, the fund had no borrowings against these arrangements.
J) Federal taxes It is the policy of the fund to distribute all of its taxable income within the prescribed time period and otherwise comply with the provisions of the Internal Revenue Code of 1986, as amended (the Code), applicable to regulated investment companies. It is also the intention of the fund to distribute an amount sufficient to avoid imposition of any excise tax under Section 4982 of the Code. The fund is subject to the provisions of Accounting Standards Codification ASC 740 Income Taxes (ASC 740). ASC 740 sets forth a minimum threshold for financial statement recognition of the benefit of a tax position taken or expected to be taken in a tax return. The fund did not have a liability to record for any unrecognized tax benefits in the accompanying financial statements. No provision has been made for federal taxes on income, capital gains or unrealized appreciation on securities held nor for excise tax on income and capital gains. Each of the fund’s federal tax returns for the prior three fiscal years remains subject to examination by the Internal Revenue Service.
At August 31, 2010, the fund had a capital loss carryover of $149,368,428 available to the extent allowed by the Code to offset future net capital gain, if any. The amounts of the carryovers and the expiration dates are:
| | |
| Loss carryover | Expiration |
|
| $77,589,426 | | August 31, 2017 |
|
| 71,779,002 | | August 31, 2018 |
|
Under the recently enacted Regulated Investment Company Modernization Act of 2010, the fund will be permitted to carry forward capital losses incurred in taxable years beginning after December 22, 2010 for an unlimited period. However, any losses incurred during those future years will be required to be utilized prior to the losses incurred in pre-enactment tax years. As a result of this ordering rule, pre-enactment capital loss carryforwards may be more likely to expire unused. Additionally, post-enactment capital losses that are carried forward will retain their character as either short-term or long-term capital losses rather than being considered all short-term as under previous law.
The aggregate identified cost on a tax basis is $411,136,425, resulting in gross unrealized appreciation and depreciation of $90,272,464 and $3,461,121, respectively, or net unrealized appreciation of $86,811,343.
K) Distributions to shareholders Distributions to shareholders from net investment income are recorded by the fund on the ex-dividend date. Distributions from capital gains, if any, are recorded on the ex-dividend date and paid at least annually. The amount and character of income and gains to be distributed are determined in accordance with income tax regulations, which may differ from generally accepted accounting principles. Dividend sources are estimated at the time of declaration. Actual results may vary. Any non-taxable return of capital cannot be determined until final tax calculations are completed after the end of the fund’s fiscal year. Reclassifications are made to the fund’s capital accounts to reflect income and gains available for distribution (or available capital loss carryovers) under income tax regulations.
Note 2: Management fee, administrative services and other transactions
The fund pays Putnam Management a management fee (based on the fund’s average net assets and computed and paid monthly) at annual rates that may vary based on the average of the aggregate net assets of most open-end funds, as defined in the fund’s management contract, sponsored by Putnam Management. Such annual rates may vary as follows:
| |
| 0.780% | of the first $5 billion, |
| 0.730% | of the next $5 billion, |
| 0.680% | of the next $10 billion, |
| 0.630% | of the next $10 billion, |
| 0.580% | of the next $50 billion, |
| 0.560% | of the next $50 billion, |
| 0.550% | of the next $100 billion, |
| 0.545% | of any excess thereafter. |
32
Putnam Management has contractually agreed, through June 30, 2011, to waive fees or reimburse the fund’s expenses to the extent necessary to limit the cumulative expenses of the fund, exclusive of brokerage, interest, taxes, investment-related expenses, extraordinary expenses and payments under the fund’s investor servicing contract, investment management contract and distribution plans, on a fiscal year-to-date basis to an annual rate of 0.20% of the fund’s average net assets over such fiscal year-to-date period. During the reporting period, the fund’s expenses were not reduced as a result of this limit.
Putnam Investments Limited (PIL), an affiliate of Putnam Management, is authorized by the Trustees to manage a separate portion of the assets of the fund as determined by Putnam Management from time to time. Putnam Management pays a quarterly sub-management fee to PIL for its services at an annual rate of 0.35% of the average net assets of the portion of the fund managed by PIL.
The Putnam Advisory Company, LLC (PAC), an affiliate of Putnam Management, is authorized by the Trustees to manage a separate portion of the assets of the fund, as designated from time to time by Putnam Management or PIL. Putnam Management or PIL, as applicable, pays a quarterly sub-advisory fee to PAC for its services at the annual rate of 0.35% of the average net assets of the portion of the fund’s assets for which PAC is engaged as sub-adviser.
The fund reimburses Putnam Management an allocated amount for the compensation and related expenses of certain officers of the fund and their staff who provide administrative services to the fund. The aggregate amount of all such reimbursements is determined annually by the Trustees.
Custodial functions for the fund’s assets are provided by State Street. Custody fees are based on the fund’s asset level, the number of its security holdings and transaction volumes.
Putnam Investor Services, Inc., an affiliate of Putnam Management, provides investor servicing agent functions to the fund. Putnam Investor Services, Inc. received fees for investor servicing based on the fund’s retail asset level, the number of shareholder accounts in the fund and the level of defined contribution plan assets in the fund. Investor servicing fees will not exceed an annual rate of 0.375% of the fund’s average net assets. The amounts incurred for investor servicing agent functions during the reporting period are included in Investor servicing fees in the Statement of operations.
The fund has entered into expense offset arrangements with Putnam Investor Services, Inc. and State Street whereby Putnam Investor Services, Inc.’s and State Street’s fees are reduced by credits allowed on cash balances. The fund also reduced expenses through brokerage/service arrangements. For the reporting period, the fund’s expenses were reduced by $1,063 under the expense offset arrangements and by $15,081 under the brokerage/service arrangements.
Each independent Trustee of the fund receives an annual Trustee fee, of which $280, as a quarterly retainer, has been allocated to the fund, and an additional fee for each Trustees meeting attended. Trustees also are reimbursed for expenses they incur relating to their services as Trustees.
The fund has adopted a Trustee Fee Deferral Plan (the Deferral Plan) which allows the Trustees to defer the receipt of all or a portion of Trustees fees payable on or after July 1, 1995. The deferred fees remain invested in certain Putnam funds until distribution in accordance with the Deferral Plan.
The fund has adopted an unfunded noncontributory defined benefit pension plan (the Pension Plan) covering all Trustees of the fund who have served as a Trustee for at least five years and were first elected prior to 2004. Benefits under the Pension Plan are equal to 50% of the Trustee’s average annual attendance and retainer fees for the three years ended December 31, 2005. The retirement benefit is payable during a Trustee’s lifetime, beginning the year following retirement, for the number of years of service through December 31, 2006. Pension expense for the fund is included in Trustee compensation and expenses in the Statement of operations. Accrued pension liability is included in Payable for Trustee compensation and expenses in the Statement of assets and liabilities. The Trustees have terminated the Pension Plan with respect to any Trustee first elected after 2003.
The fund has adopted distribution plans (the Plans) with respect to its class A, class B, class C, class M and class R shares pursuant to Rule 12b-1 under the Investment Company Act of 1940. The purpose of the Plans is to compensate Putnam Retail Management Limited Partnership, a wholly-owned subsidiary of Putnam Investments, LLC and Putnam Retail Management GP, Inc., for services provided and expenses incurred in distributing shares of the fund. The Plans provide for payments by the fund to Putnam Retail Management Limited Partnership at an annual rate of up to 0.35%, 1.00%, 1.00%, 1.00% and 1.00% of the average net assets attributable to class A, class B, class C, class M and class R shares, respectively. The Trustees have approved payment by the fund at an annual rate of 0.25%, 1.00%, 1.00%, 0.75% and 0.50% of the average net assets attributable to class A, class B, class C, class M and class R shares, respectively.
33
For the reporting period, Putnam Retail Management Limited Partnership, acting as underwriter, received net commissions of $24,452 and $478 from the sale of class A and class M shares, respectively, and received $14,026 and $181 in contingent deferred sales charges from redemptions of class B and class C shares, respectively.
A deferred sales charge of up to 1.00% and 0.65% is assessed on certain redemptions of class A and class M shares, respectively. For the reporting period, Putnam Retail Management Limited Partnership, acting as underwriter, received $4 and no monies on class A and class M redemptions, respectively.
Note 3: Purchases and sales of securities
During the reporting period, cost of purchases and proceeds from sales of investment securities other than short-term investments aggregated $206,269,131 and $225,067,759, respectively. There were no purchases or proceeds from sales of long-term U.S. government securities.
Note 4: Capital shares
At the close of the reporting period, there was an unlimited number of shares of beneficial interest authorized. Transactions in capital shares were as follows:
| | | | |
| | Six months ended 2/28/11 | Year ended 8/31/10 |
|
| Class A | Shares | Amount | Shares | Amount |
|
| Shares sold | 726,100 | $15,687,138 | 2,002,977 | $37,117,456 |
|
| Shares issued in connection with | | | | |
| reinvestment of distributions | 279,069 | 6,061,671 | 183,630 | 3,474,273 |
|
| | 1,005,169 | 21,748,809 | 2,186,607 | 40,591,729 |
|
| Shares repurchased | (1,819,394) | (37,647,193) | (4,131,637) | (74,958,092) |
|
| Net decrease | (814,225) | $(15,898,384) | (1,945,030) | $(34,366,363) |
|
| |
| | Six months ended 2/28/11 | Year ended 8/31/10 |
|
| Class B | Shares | Amount | Shares | Amount |
|
| Shares sold | 80,997 | $1,574,475 | 220,715 | $3,643,493 |
|
| Shares issued in connection with | | | | |
| reinvestment of distributions | 16,031 | 312,599 | 7,321 | 124,635 |
|
| | 97,028 | 1,887,074 | 228,036 | 3,768,128 |
|
| Shares repurchased | (260,587) | (4,887,609) | (828,527) | (13,735,781) |
|
| Net decrease | (163,559) | $(3,000,535) | (600,491) | $(9,967,653) |
|
| |
| | Six months ended 2/28/11 | Year ended 8/31/10 |
|
| Class C | Shares | Amount | Shares | Amount |
|
| Shares sold | 159,409 | $3,197,643 | 181,492 | $3,042,015 |
|
| Shares issued in connection with | | | | |
| reinvestment of distributions | 10,473 | 208,651 | 4,269 | 74,284 |
|
| | 169,882 | 3,406,294 | 185,761 | 3,116,299 |
|
| Shares repurchased | (111,636) | (2,158,875) | (226,318) | (3,757,876) |
|
| Net increase (decrease) | 58,246 | $1,247,419 | (40,557) | $(641,577) |
|
| |
| | Six months ended 2/28/11 | Year ended 8/31/10 |
|
| Class M | Shares | Amount | Shares | Amount |
|
| Shares sold | 31,827 | $642,949 | 75,669 | $1,343,470 |
|
| Shares issued in connection with | | | | |
| reinvestment of distributions | 4,599 | 95,293 | 2,429 | 43,891 |
|
| | 36,426 | 738,242 | 78,098 | 1,387,361 |
|
| Shares repurchased | (38,143) | (748,826) | (101,820) | (1,785,855) |
|
| Net decrease | (1,717) | $(10,584) | (23,722) | $(398,494) |
|
34
| | | | |
| | Six months ended 2/28/11 | Year ended 8/31/10 |
|
| Class R | Shares | Amount | Shares | Amount |
|
| Shares sold | 183,407 | $3,906,180 | 324,494 | $5,968,364 |
|
| Shares issued in connection with | | | | |
| reinvestment of distributions | 11,882 | 253,679 | 5,765 | 107,284 |
|
| | 195,289 | 4,159,859 | 330,259 | 6,075,648 |
|
| Shares repurchased | (92,799) | (1,885,422) | (245,226) | (4,353,298) |
|
| Net increase | 102,490 | $2,274,437 | 85,033 | $1,722,350 |
|
| |
| | Six months ended 2/28/11 | Year ended 8/31/10 |
|
| Class Y | Shares | Amount | Shares | Amount |
|
| Shares sold | 50,880 | $1,092,130 | 96,462 | $1,793,834 |
|
| Shares issued in connection with | | | | |
| reinvestment of distributions | 9,963 | 217,606 | 7,275 | 138,303 |
|
| | 60,843 | 1,309,736 | 103,737 | 1,932,137 |
|
| Shares repurchased | (78,266) | (1,625,771) | (212,692) | (3,890,774) |
|
| Net decrease | (17,423) | $(316,035) | (108,955) | $(1,958,637) |
|
Note 5: Summary of derivative activity
The following is a summary of the market values of derivative instruments as of the close of the reporting period:
Market values of derivative instruments as of the close of the reporting period
| | | | |
| | Asset derivatives | Liability derivatives |
|
| Derivatives not | | | | |
| accounted for as | Statement of | | Statement of | |
| hedging instruments | assets and | | assets and | |
| under ASC 815 | liabilities location | Market value | liabilities location | Market value |
|
| Foreign exchange | | | | |
| contracts | Receivables | $1,194,405 | Payables | $493,828 |
|
| Equity contracts | Receivables | 78,679 | Payables | — |
|
| Total | | $1,273,084 | | $493,828 |
|
The following is a summary of realized and change in unrealized gains or losses of derivative instruments on the Statement of operations for the reporting period (see Note 1):
Amount of realized gain or (loss) on derivatives recognized in net gain or (loss) on investments
| | | |
| Derivatives not accounted for as hedging | Forward currency | | |
| instruments under ASC 815 | contracts | Swaps | Total |
|
| Foreign exchange contracts | $3,793,582 | $— | $3,793,582 |
|
| Equity contracts | — | 564,987 | $564,987 |
|
| Total | $3,793,582 | $564,987 | $4,358,569 |
|
Change in unrealized appreciation or (depreciation) on derivatives recognized in net gain or (loss) on investments
| | | |
| Derivatives not accounted for as hedging | Forward currency | | |
| instruments under ASC 815 | contracts | Swaps | Total |
|
| Foreign exchange contracts | $711,337 | $— | $711,337 |
|
| Equity contracts | — | (72,674) | $(72,674) |
|
| Total | $711,337 | $(72,674) | $638,663 |
|
35
Note 6: Investment in Putnam Money Market Liquidity Fund
The fund invested in Putnam Money Market Liquidity Fund, an open-end management investment company managed by Putnam Management. Investments in Putnam Money Market Liquidity Fund are valued at its closing net asset value each business day. Income distributions earned by the fund are recorded as interest income in the Statement of operations and totaled $4,042 for the reporting period. During the reporting period, cost of purchases and proceeds of sales of investments in Putnam Money Market Liquidity Fund aggregated $70,619,524 and $66,628,092, respectively. Management fees charged to Putnam Money Market Liquidity Fund have been waived by Putnam Management.
Note 7: Regulatory matters and litigation
In late 2003 and 2004, Putnam Management settled charges brought by the SEC and the Massachusetts Securities Division in connection with excessive short-term trading in Putnam funds. Distribution of payments from Putnam Management to certain open-end Putnam funds and their shareholders is expected to be completed in the next several months. These allegations and related matters have served as the general basis for certain lawsuits, including purported class action lawsuits against Putnam Management and, in a limited number of cases, some Putnam funds. Putnam Management believes that these lawsuits will have no material adverse effect on the funds or on Putnam Management’s ability to provide investment management services. In addition, Putnam Management has agreed to bear any costs incurred by the Putnam funds as a result of these matters.
Note 8: Market and credit risk
In the normal course of business, the fund trades financial instruments and enters into financial transactions where risk of potential loss exists due to changes in the market (market risk) or failure of the contracting party to the transaction to perform (credit risk). The fund may be exposed to additional credit risk that an institution or other entity with which the fund has unsettled or open transactions will default.
36
Fund information
Founded over 70 years ago, Putnam Investments was built around the concept that a balance between risk and reward is the hallmark of a well-rounded financial program. We manage over 100 funds across income, value, blend, growth, asset allocation, absolute return, and global sector categories.
| | |
| Investment Manager | Ravi Akhoury | Robert R. Leveille |
| Putnam Investment | Barbara M. Baumann | Vice President and |
| Management, LLC | Charles B. Curtis | Chief Compliance Officer |
| One Post Office Square | Robert J. Darretta | |
| Boston, MA 02109 | Paul L. Joskow | Mark C. Trenchard |
| | Kenneth R. Leibler | Vice President and |
| Investment Sub-Manager | Robert E. Patterson | BSA Compliance Officer |
| Putnam Investments Limited | George Putnam, III | |
| 57–59 St James’s Street | Robert L. Reynolds | Francis J. McNamara, III |
| London, England SW1A 1LD | W. Thomas Stephens | Vice President and |
| | | Chief Legal Officer |
| Investment Sub-Advisor | Officers | |
| The Putnam Advisory | Robert L. Reynolds | James P. Pappas |
| Company, LLC | President | Vice President |
| One Post Office Square | | |
| Boston, MA 02109 | Jonathan S. Horwitz | Judith Cohen |
| | Executive Vice President, | Vice President, Clerk and |
| Marketing Services | Principal Executive | Assistant Treasurer |
| Putnam Retail Management | Officer, Treasurer and | |
| One Post Office Square | Compliance Liaison | Michael Higgins |
| Boston, MA 02109 | | Vice President, Senior Associate |
| | Steven D. Krichmar | Treasurer and Assistant Clerk |
| Custodian | Vice President and | |
| State Street Bank | Principal Financial Officer | Nancy E. Florek |
| and Trust Company | | Vice President, Assistant Clerk, |
| | Janet C. Smith | Assistant Treasurer and |
| Legal Counsel | Vice President, Assistant | Proxy Manager |
| Ropes & Gray LLP | Treasurer and Principal | |
| | Accounting Officer | Susan G. Malloy |
| Trustees | | Vice President and |
| John A. Hill, Chairman | Beth S. Mazor | Assistant Treasurer |
| Jameson A. Baxter, | Vice President | |
| Vice Chairman | | |
This report is for the information of shareholders of Putnam Global Natural Resources Fund. It may also be used as sales literature when preceded or accompanied by the current prospectus, the most recent copy of Putnam’s Quarterly Performance Summary, and Putnam’s Quarterly Ranking Summary. For more recent performance, please visit putnam.com. Investors should carefully consider the investment objective, risks, charges, and expenses of a fund, which are described in its prospectus. For this and other information or to request a prospectus, or a summary prospectus if available, call 1-800-225-1581 toll free. Please read the prospectus carefully before investing. The fund’s Statement of Additional Information contains additional information about the fund’s Trustees and is available without charge upon request by calling 1-800-225-1581.
Item 2. Code of Ethics:
Not applicable
Item 3. Audit Committee Financial Expert:
Not applicable
Item 4. Principal Accountant Fees and Services:
Not applicable
Item 5. Audit Committee of Listed Registrants
Not applicable
Item 6. Schedule of Investments:
The registrant’s schedule of investments in unaffiliated issuers is included in the report to shareholders in Item 1 above.
Item 7. Disclosure of Proxy Voting Policies and Procedures For Closed-End Management Investment Companies:
Not applicable
Item 8. Portfolio Managers of Closed-End Investment Companies
Not Applicable
Item 9. Purchases of Equity Securities by Closed-End Management Investment Companies and Affiliated Purchasers:
Not applicable
Item 10. Submission of Matters to a Vote of Security Holders:
Not applicable
Item 11. Controls and Procedures:
(a) The registrant's principal executive officer and principal financial officer have concluded, based on their evaluation of the effectiveness of the design and operation of the registrant's disclosure controls and procedures as of a date within 90 days of the filing date of this report, that the design and operation of such procedures are generally effective to provide reasonable assurance that information required to be disclosed by the registrant in this report is recorded, processed, summarized and reported within the time periods specified in the Commission's rules and forms.
(b) Changes in internal control over financial reporting: Not applicable
Item 12. Exhibits:
(a)(1) Not applicable
(a)(2) Separate certifications for the principal executive officer and principal financial officer of the registrant as required by Rule 30a-2(a) under the Investment Company Act of 1940, as amended, are filed herewith.
(b) The certifications required by Rule 30a-2(b) under the Investment Company Act of 1940, as amended, are filed herewith.
Putnam Global Natural Resources Fund
By (Signature and Title):
/s/Janet C. Smith
Janet C. Smith
Principal Accounting Officer
Date: April 28, 2011
Pursuant to the requirements of the Securities Exchange Act of 1934 and the Investment Company Act of 1940, this report has been signed below by the following persons on behalf of the registrant and in the capacities and on the dates indicated.
By (Signature and Title):
/s/Jonathan S. Horwitz
Jonathan S. Horwitz
Principal Executive Officer
Date: April 28, 2011
By (Signature and Title):
/s/Steven D. Krichmar
Steven D. Krichmar
Principal Financial Officer
Date: April 28, 2011