| | |
| UNITED STATES
SECURITIES AND EXCHANGE COMMISSION |
| | |
| CERTIFIED SHAREHOLDER REPORT OF REGISTERED
MANAGEMENT INVESTMENT COMPANIES
|
| | |
| Investment Company Act file number: | (811- 03061) |
| | |
| Exact name of registrant as specified in charter: | Putnam Global Natural Resources Fund |
| | |
| Address of principal executive offices: | One Post Office Square, Boston, Massachusetts 02109 |
| | |
| Name and address of agent for service: | Robert T. Burns, Vice President
One Post Office Square
Boston, Massachusetts 02109 |
| | |
| Copy to: | John W. Gerstmayr, Esq.
Ropes & Gray LLP
800 Boylston Street
Boston, Massachusetts 02199-3600 |
| | |
| Registrant’s telephone number, including area code: | (617) 292-1000 |
| | |
| Date of fiscal year end: | August 31, 2013 |
| | |
| Date of reporting period: | September 1, 2012 — February 28, 2013 |
| | |
|
Item 1. Report to Stockholders: | |
| | |
| The following is a copy of the report transmitted to stockholders pursuant to Rule 30e-1 under the Investment Company Act of 1940: | |
Putnam
Global Natural
Resources Fund
Semiannual report
2 | 28 | 13
| | |
| Message from the Trustees | 1 | |
| |
| About the fund | 2 | |
| |
| Performance snapshot | 4 | |
| |
| Interview with your fund’s portfolio managers | 5 | |
| |
| Your fund’s performance | 11 | |
| |
| Your fund’s expenses | 13 | |
| |
| Terms and definitions | 15 | |
| |
| Other information for shareholders | 16 | |
| |
| Financial statements | 17 | |
| |
Consider these risks before investing: International investing involves certain risks, such as currency fluctuations, economic instability, and political developments. Additional risks may be associated with emerging-market securities, including illiquidity and volatility. Investments in small and/or midsize companies increase the risk of greater price fluctuations. The fund’s policy of concentrating on a limited group of industries and the fund’s non-diversified status, which means the fund may invest in fewer issuers, can increase the fund’s vulnerability to common economic forces and may result in greater losses and volatility. The energy and other natural resources industries may be affected by changes in crude oil prices and changes in government regulatory policies. Derivatives also involve the risk, in the case of many over-the-counter instruments, of the potential inability to terminate or sell derivatives positions and the potential failure of the other party to the instrument to meet its obligations. Growth stocks may be more susceptible to earnings disappointments, and value stocks may fail to rebound. The use of short selling may result in losses if the securities appreciate in value. The prices of stocks in the fund’s portfolio may fall or fail to rise over extended periods of time for a variety of reasons, including both general financial market conditions and factors related to a specific company or industry. You can lose money by investing in the fund.
Message from the Trustees
Dear Fellow Shareholder:
The U.S. stock market has set record highs recently, thanks to steadily improving housing and employment data and the Federal Reserve’s pledge to continue to add stimulus until it believes the economy has meaningfully improved. The federal budget battle continues among Washington lawmakers, but investors appear to believe that a resolution will eventually take place.
The by-now familiar risks that have buffeted markets for a few years have not gone away entirely, but they appear to be steadily abating. Europe, while having slumped further into recession, is slowly addressing its sovereign debt problem; China’s economy appears to be improving; and here in the United States economic recovery is underway.
Times like these require a measured, balanced approach to investing. At Putnam, our investment team is actively focused on managing risk while pursuing returns. The guidance of your financial advisor is also important in helping to ensure that your portfolio remains in line with your individual goals and tolerance for risk.
We would like to extend a welcome to new shareholders of the fund and to thank all of our investors for your continued confidence in Putnam.

About the fund
Investing in the natural resources sector for over 30 years
From the oil crisis of the 1970s to the more recent commodities boom, the balance of geopolitical stability, technological development, and economic growth has shaped natural resources markets.
For more than 30 years, Putnam Global Natural Resources Fund has sought to capitalize on that ever-changing balance by investing in stocks of companies that can profit from the global demand for natural resources.
The fund’s diversification sets it apart in two respects: First, its view of natural resources industries includes energy, metals and mining, paper, chemicals, and natural resource equipment and infrastructure companies; and second, it has a global scope. Stock prices in the natural resources sector rise and fall with supply and demand imbalances, so this strategy helps offset that volatility while enabling the fund’s managers to pursue a wider field of opportunities.
From chemicals, construction, and railroads to forest products and packaging, the portfolio managers consider stocks in a wide range of areas, with support from a team of analysts. Among the promising stocks the managers have targeted recently are those of fertilizer, seed, and agrochemical companies. These companies may offer strong growth potential as world population has increased, wealth has grown in emerging markets, and demand for high-protein food has risen along with a greater need for fertilizer that can make land and crops more productive.
Another benefit for investors is the fund’s flexible strategy, which allows the fund to own growth- or value-style stocks, as it seeks to deliver competitive returns no matter which style is in favor.
Sector investing at Putnam
In recent decades, innovation and business growth have propelled stocks in different industries to market-leading performance. Finding these stocks, many of which are in international markets, requires rigorous research and in-depth knowledge of global markets.
Putnam’s sector funds invest in nine sectors worldwide and offer active management, risk controls, and the expertise of dedicated sector analysts. The funds’ managers invest with flexibility and precision, using fundamental research to hand select stocks for the portfolios.
All sectors in one fund:
Putnam Global Sector Fund
A portfolio of individual Putnam Global Sector Funds that provides exposure to all sectors of the MSCI World Index.
Individual sector funds:
Global Consumer Fund
Retail, hotels, restaurants, media, food and beverages
Global Energy Fund
Oil and gas, energy equipment and services
Global Financials Fund
Commercial banks, insurance, diversified financial services, mortgage finance
Global Health Care Fund
Pharmaceuticals, biotechnology, health-care services
Global Industrials Fund
Airlines, railroads, trucking, aerospace and defense, construction, commercial services
Global Natural Resources Fund
Metals, chemicals, oil and gas, forest products
Global Technology Fund
Software, computers, Internet services
Global Telecommunications Fund
Diversified and wireless telecommunications services
Global Utilities Fund
Electric, gas, and water utilities

| | |
| 2 Global Natural Resources Fund | Global Natural Resources Fund | 3 |
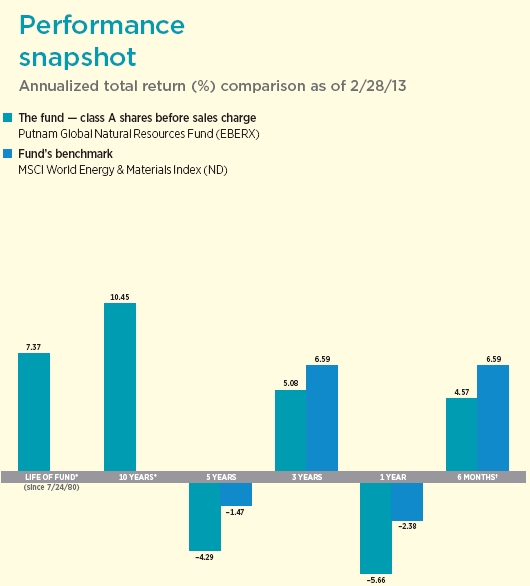
Current performance may be lower or higher than the quoted past performance, which cannot guarantee future results. Share price, principal value, and return will fluctuate, and you may have a gain or a loss when you sell your shares. Performance of class A shares assumes reinvestment of distributions and does not account for taxes. Fund returns in the bar chart do not reflect a sales charge of 5.75%; had they, returns would have been lower. See pages 5 and 11-13 for additional performance information. For a portion of the periods, the fund had expense limitations, without which returns would have been lower. To obtain the most recent month-end performance, visit putnam.com.
* The fund’s benchmark, the MSCI World Energy & Materials Index (ND), was introduced on 6/1/05, which post-dates the inception of the fund’s class A shares.
† Returns for the six-month period are not annualized, but cumulative.
| |
| 4 | Global Natural Resources Fund |
Interview with your fund’s portfolio managers

World natural resources markets began to show improvements in some areas during the past six months. How did Putnam Global Natural Resources Fund perform in this environment?
Steve: The fund’s class A shares underperformed the MSCI World Energy & Materials Index for the six months ended February 28, 2013. Performance was restrained by the continuing volatility of materials and agricultural stocks closely tied to emerging-market economies such as China and, to a lesser extent, by stocks of companies in the still somewhat weak natural gas industry. Active management and stock selection were key drivers of upside performance, and the fund experienced strong results from several companies engaged in the exploration and production segment of the oil industry.
What factors influenced the global natural resources markets during this period?
Steve: After bottoming in the summer of 2012, commodity prices improved during the reporting period as investors became less concerned about economic growth. While demand for energy, particularly in developed markets, is still challenged, there have been signs of improvement leading to better fundamentals, which, combined with attractive valuations and a high level of corporate restructuring actions in the industry, make the sector more attractive to investors.

This comparison shows your fund’s performance in the context of broad market indexes for the six months ended 2/28/13. See pages 4 and 11–13 for additional fund performance information. Index descriptions can be found on page 15.
| |
| Global Natural Resources Fund | 5 |
In addition, after several years of low natural gas prices in North America brought on by the successful development of shale gas resources, we started to see the early signs of supply and demand coming back into balance. This was driven, in part, by higher natural gas consumption due to low prices and, in part, by what has been an under-investment in natural gas resources. It has taken a bit longer than investors originally thought to rebalance this market, which has introduced a healthy level of skepticism about whether natural gas prices would ever rise, creating what we consider attractive investment opportunities.
Chris: A record drought in North America and production shortfalls in the rest of the world led to elevated agricultural prices throughout the reporting period. Demand rationing began to take place in late summer as exports fell, ethanol production was shut down, and livestock herds were reduced. The rationing slowed the pace of rising prices, but global supply is still tight and crop prices remain elevated, providing what we believe is a good environment for agricultural companies focused on farm productivity.
Also, the U.S. housing sector began to meaningfully improve after several years of limited activity and some investor concern that housing would be structurally impaired. The improvements continue to ripple through the materials sector, and several solid companies producing long-ignored materials have started to see better prospects. We believe the demand pull from U.S. housing on global materials continues to be underappreciated by the market.
Did either of you make any meaningful shifts in the fund’s positioning?
Steve: Energy demand growth is running at a slower pace than in previous decades; this suggests to us that global oil prices will be fairly range-bound. During the summer of 2012, we did increase the portfolio’s exposure to companies that are relatively dependent on the price of oil, but we moved to a more
Allocations are represented as a percentage of the fund’s net assets. Summary information may differ from the information in the portfolio schedule notes included in the financial statements due to the inclusion of derivative securities, any interest accruals, and the exclusion of as-of trades, if any. Holdings and allocations may vary over time.
| |
| 6 | Global Natural Resources Fund |
defensive position as oil prices approached the upper end of what we think is the appropriate price range. We also increased our exposure to natural gas stocks during the period, given our view that the industry is currently underinvesting in its own development and that supply and demand are coming back into balance.
Chris: After multiple visits to Asia, and China in particular, we began to have less confidence in a meaningful Chinese-led demand pull for materials. As the materials supply chain in China continues to evolve and improve, we believe this will likely lead to lower overall levels of total inventory in the system, providing a headwind for volume growth. Coupled with lower overall fixed-asset investment, we believe the high levels of volume growth that occurred prior to 2008 are unlikely to return. For this reason, we decreased our exposure to the bulk metals and mining space, and increased our exposure to U.S. commodity chemicals and U.S. paper and packaging. We feel each of these sectors has undergone structural changes that allow for higher levels of profitability even in a lower demand-growth environment.
Which individual holdings detracted from performance?
Chris: The largest detractor was our position in titanium dioxide producer Tronox, as an inventory correction cycle hurt the company’s financial performance. We believe this cycle is nearly complete, as inventories are now near normal and pricing has fallen to below cash break-even levels for high-cost producers. While we substantially reduced the size of the fund’s position early in the reporting period, we continue to hold shares. Another detractor was Freeport-McMoRan, whose stock price
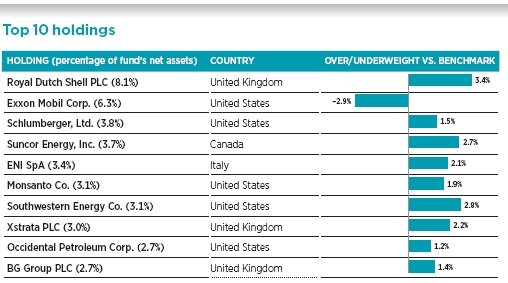
This table shows the fund’s top 10 holdings by percentage of the fund’s net assets as of 2/28/13. Short-term holdings and derivatives, if any, are excluded. Holdings will vary over time.
| |
| Global Natural Resources Fund | 7 |
suffered after an announced acquisition of two oil and gas exploration companies, Plains Exploration and McMoRan Exploration.
The market interpreted the acquisition as a drift in strategy from Freeport’s core copper production business and a sign that copper production growth would slow. We coincidentally owned stakes in Plains Exploration and McMoRan Exploration, as well, and we like the upside potential in both assets. Thus, we have a different view of the merits of the acquisitions versus Wall Street. While the acquisitions provide Freeport exposure to a different type of resource, we think the cash generation from the copper production will allow Freeport to bring forward the value of the cash-constrained oil and gas assets of Plains Exploration and McMoRan Exploration without restricting growth in copper.
Steve: Our stake in international oil company BG Group also detracted from the fund’s return. Early in the period, this U.K.-based company announced that 2013 oil and gas production would be flat compared with 2012. This came as a surprise to investors, including us. We own BG for what we believe is the attractive portfolio of growth assets the company holds. However, project delays in Brazil and the North Sea, as well as poor production results in Egypt, caused the outlook for 2013 to fall short of expectations. For the most part, we view these recent difficulties as delays rather than lost opportunities, and we continue to hold the shares.
What stocks produced better results for the fund?
Steve: In general, we believe that exploration and production energy companies that have high-quality resource assets and can develop those assets efficiently are the mostly likely to outperform. During the period, the fund benefited from positions in several companies that fit this theme. Cabot Oil & Gas has a leading position in the Marcellus Shale, a low-cost gas resource in the northeastern United States. Cabot is drilling wells that appear to improve with time, thus making
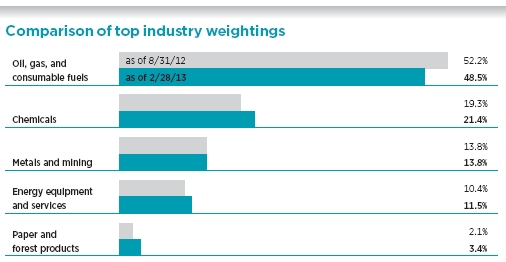
This chart shows how the fund’s top weightings have changed over the past six months. Allocations are represented as a percentage of the fund’s net assets. Current period summary information may differ from the portfolio schedule included in the financial statements due to the inclusion of derivative securities, any interest accruals, the exclusion of as-of trades, if any, and the use of different classifications of securities for presentation purposes. Holdings and allocations may vary over time.
| |
| 8 | Global Natural Resources Fund |
the resources controlled by Cabot more valuable, in our view. Noble Energy has a world-class position in the Niobrara Shale in Colorado. The company continues to improve on its development of this resource and, as a result, Noble has grown faster than investors expected.
Oilfield services company Halliburton benefited during the period as investors recognized its leading position in providing the critical services needed to develop the valuable shale resources I just mentioned.
Chris: Overweights in LyondellBasell and International Paper also benefitted performance. LyondellBasell is a key beneficiary of the oversupply of natural gas liquids in North America. This has taken Lyondell’s natural gas supply, the company’s largest asset base, from the high end of the global cost curve to the curve’s lower reaches and resulted in cash generation above investors’ expectations. As its balance sheet continued to improve, Lyondell also announced an increase in its dividend and a meaningful share repurchase program. Both moves were favorably received by the market.
International Paper has led a meaningful consolidation in the containerboard industry and began to see the benefits as the industry successfully started to raise prices. After two years of stagnant prices, the increases came as a positive surprise to investors. As its balance sheet continued to improve following the acquisitions, International Paper also raised its dividend for the first time in 18 months. We believe this may be the first of many dividend increases over the next several years.
How did the fund use derivatives during the period?
We used currency forwards to hedge portions of the portfolio’s foreign currency exposures. Currency forwards allow us to pursue strategies that can help protect the fund from adverse movements in exchange rates. We also used purchased and written options to hedge against losses in certain securities.
What is your near-term outlook for natural resources?
Steve: I believe the next several months will continue to exhibit the volatility that we have seen for the past couple of years in the energy sector, which will require energy investors to be disciplined and nimble. Unlike the early part of the 2000s, we do not believe that oil prices will continue to move higher each year; rather, we believe prices will be range-bound for the foreseeable future. While the best companies can outperform through the cycle and we continue to focus our efforts on strong bottom-up stock selection, I believe we need to be cognizant of where oil prices are and adjust the portfolio accordingly.
Chris: As Steve mentioned, the next several months are likely to show continued volatility in the energy sector, and this will likely be evident in materials as well. In our estimation, an improving U.S. economic environment and the removal of the worst-case economic scenarios for Europe should lead to stabilization and modest improvement in developed world demand profiles. We also expect emerging-market demand to improve somewhat as well but, as noted above, we believe overall growth levels are likely to be lower. We continue to focus on areas that are undergoing structural changes in the global cost curve, such as North American commodity chemicals, or industries such as paper and packaging. In the context of those themes, we continue to identify companies that also have an ability to help themselves and shareholders by disposing of non-core assets, leveraging the balance sheet to return capital to shareholders, and improving returns on capital.
Thank you, Steve and Chris, for your time and insights.
| |
| Global Natural Resources Fund | 9 |
The views expressed in this report are exclusively those of Putnam Management and are subject to change. They are not meant as investment advice.
Please note that the holdings discussed in this report may not have been held by the fund for the entire period. Portfolio composition is subject to review in accordance with the fund’s investment strategy and may vary in the future. Current and future portfolio holdings are subject to risk.
Portfolio Manager Steven W. Curbow has an M.B.A. from The University of Chicago Booth School of Business and a B.S. from the University of Southern California. Steven joined Putnam in 2008 and has been in the investment industry since 1996.
Portfolio Manager Christopher J. Eitzmann has an M.B.A. from the Tuck School of Business at Dartmouth College and an A.B. from Harvard University. Christopher joined Putnam in 2012 and has been in the investment industry since 2003.
IN THE NEWS
The global economy continues to expand, but the rate of expansion slowed recently. Manufacturing production and services activity worldwide both eased in February, according to data compiled by JPMorgan and Market Economics. Economic growth was led by the United States, followed by China, Germany, the United Kingdom, Brazil, India, Russia, and Ireland. The rate of increase, however, dropped in most of those countries, with the United States and Russia being the exceptions. Japan’s economic output, meanwhile, was stagnant. In the still-troubled eurozone, conditions weakened substantially in France, Italy, and Spain, with output contracting sharply in these countries’ manufacturing and services sectors. While the global economic deceleration was considered slight by most observers, the expansion rate hit a four-month low in February. As the employment picture improves in the United States and around the world, economists hope that jobs growth will spur further demand.
| |
| 10 | Global Natural Resources Fund |
Your fund’s performance
This section shows your fund’s performance, price, and distribution information for periods ended February 28, 2013, the end of the first half of its current fiscal year. In accordance with regulatory requirements for mutual funds, we also include performance information as of the most recent calendar quarter-end and expense information taken from the fund’s current prospectus. Performance should always be considered in light of a fund’s investment strategy. Data represent past performance. Past performance does not guarantee future results. More recent returns may be less or more than those shown. Investment return and principal value will fluctuate, and you may have a gain or a loss when you sell your shares. Performance information does not reflect any deduction for taxes a shareholder may owe on fund distributions or on the redemption of fund shares. For the most recent month-end performance, please visit the Individual Investors section at putnam.com or call Putnam at 1-800-225-1581. Class R and class Y shares are not available to all investors. See the Terms and Definitions section in this report for definitions of the share classes offered by your fund.
Fund performance Total return for periods ended 2/28/13
| | | | | | | | | | |
| | Class A | Class B | Class C | Class M | Class R | Class Y |
| (inception dates) | (7/24/80) | (2/1/94) | (7/26/99) | (7/3/95) | (12/1/03) | (10/4/05) |
|
| | Before | After | | | | | Before | After | Net | Net |
| | sales | sales | Before | After | Before | After | sales | sales | asset | asset |
| | charge | charge | CDSC | CDSC | CDSC | CDSC | charge | charge | value | value |
|
| Annual average | | | | | | | | | | |
| (life of fund) | 7.37% | 7.18% | 6.51% | 6.51% | 6.57% | 6.57% | 6.77% | 6.66% | 7.11% | 7.44% |
|
| 10 years | 170.30 | 154.76 | 150.85 | 150.85 | 150.84 | 150.84 | 157.29 | 148.29 | 163.96 | 175.54 |
| Annual average | 10.45 | 9.80 | 9.63 | 9.63 | 9.63 | 9.63 | 9.91 | 9.52 | 10.19 | 10.67 |
|
| 5 years | –19.70 | -24.32 | –22.61 | –23.87 | –22.65 | –22.65 | –21.65 | -24.40 | –20.65 | –18.64 |
| Annual average | –4.29 | -5.42 | –5.00 | –5.31 | –5.01 | –5.01 | –4.76 | -5.44 | –4.52 | –4.04 |
|
| 3 years | 16.04 | 9.37 | 13.51 | 10.51 | 13.45 | 13.45 | 14.35 | 10.35 | 15.24 | 16.93 |
| Annual average | 5.08 | 3.03 | 4.31 | 3.39 | 4.30 | 4.30 | 4.57 | 3.34 | 4.84 | 5.35 |
|
| 1 year | –5.66 | -11.09 | –6.32 | –11.00 | –6.36 | –7.29 | –6.08 | -9.37 | –5.86 | –5.38 |
|
| 6 months | 4.57 | -1.44 | 4.20 | –0.80 | 4.20 | 3.20 | 4.34 | 0.69 | 4.45 | 4.71 |
|
Current performance may be lower or higher than the quoted past performance, which cannot guarantee future results. After-sales-charge returns for class A and M shares reflect the deduction of the maximum 5.75% and 3.50% sales charge, respectively, levied at the time of purchase. Class B share returns after contingent deferred sales charge (CDSC) reflect the applicable CDSC, which is 5% in the first year, declining over time to 1% in the sixth year, and is eliminated thereafter. Class C share returns after CDSC reflect a 1% CDSC for the first year that is eliminated thereafter. Class R and Y shares have no initial sales charge or CDSC. Performance for class B, C, M, R, and Y shares before their inception is derived from the historical performance of class A shares, adjusted for the applicable sales charge (or CDSC) and the higher operating expenses for such shares, except for class Y shares, for which 12b-1 fees are not applicable.
For a portion of the periods, the fund had expense limitations, without which returns would have been lower.
Class B share performance does not reflect conversion to class A shares.
| |
| Global Natural Resources Fund | 11 |
Comparative index returns For periods ended 2/28/13
| |
| | MSCI World Energy & Materials Index (ND) |
|
| Annual average (life of fund) | —* |
|
| 10 years | —* |
| Annual average | —* |
|
| 5 years | –7.16% |
| Annual average | –1.47 |
|
| 3 years | 21.09 |
| Annual average | 6.59 |
|
| 1 year | –2.38 |
|
| 6 months | 6.59 |
|
Index results should be compared with fund performance before sales charge, before CDSC, or at net asset value.
* The fund’s benchmark, the MSCI World Energy & Materials Index (ND), was introduced on 6/1/05, which post-dates the inception of the fund’s class A shares.
Fund price and distribution information For the six-month period ended 2/28/13
| | | | | | |
| Distributions | Class A | Class B | Class C | Class M | Class R | Class Y |
|
| Number | 1 | 1 | 1 | 1 | 1 | 1 |
|
| Income | $0.166 | $0.018 | $0.024 | $0.060 | $0.117 | $0.219 |
|
| Capital gains | — | — | — | — | — | — |
|
| Total | $0.166 | $0.018 | $0.024 | $0.060 | $0.117 | $0.219 |
|
| | Before | After | Net | Net | Before | After | Net | Net |
| | sales | sales | asset | asset | sales | sales | asset | asset |
| Share value | charge | charge | value | value | charge | charge | value | value |
|
| 8/31/12 | $19.18 | $20.35 | $17.10 | $17.47 | $18.21 | $18.87 | $18.81 | $19.31 |
|
| 2/28/13 | 19.89 | 21.10 | 17.80 | 18.18 | 18.94 | 19.63 | 19.53 | 20.00 |
|
The classification of distributions, if any, is an estimate. Before-sales-charge share value and current dividend rate for class A and M shares, if applicable, do not take into account any sales charge levied at the time of purchase. After-sales-charge share value, current dividend rate, and current 30-day SEC yield, if applicable, are calculated assuming that the maximum sales charge (5.75% for class A shares and 3.50% for class M shares) was levied at the time of purchase. Final distribution information will appear on your year-end tax forms.
| |
| 12 | Global Natural Resources Fund |
Fund performance as of most recent calendar quarter
Total return for periods ended 3/31/13
| | | | | | | | | | |
| | Class A | Class B | Class C | Class M | Class R | Class Y |
| (inception dates) | (7/24/80) | (2/1/94) | (7/26/99) | (7/3/95) | (12/1/03) | (10/4/05) |
|
| | Before | After | | | | | Before | After | Net | Net |
| | sales | sales | Before | After | Before | After | sales | sales | asset | asset |
| | charge | charge | CDSC | CDSC | CDSC | CDSC | charge | charge | value | value |
|
| Annual average | | | | | | | | | | |
| (life of fund) | 7.37% | 7.18% | 6.51% | 6.51% | 6.57% | 6.57% | 6.77% | 6.66% | 7.11% | 7.44% |
|
| 10 years | 176.78 | 160.87 | 156.74 | 156.74 | 156.79 | 156.79 | 163.29 | 154.07 | 170.17 | 182.14 |
| Annual average | 10.72 | 10.06 | 9.89 | 9.89 | 9.89 | 9.89 | 10.16 | 9.77 | 10.45 | 10.93 |
|
| 5 years | –16.39 | –21.20 | –19.46 | –20.76 | –19.46 | –19.46 | –18.47 | –21.32 | –17.41 | –15.32 |
| Annual average | –3.52 | –4.65 | –4.24 | –4.55 | –4.24 | –4.24 | –4.00 | –4.68 | –3.75 | –3.27 |
|
| 3 years | 8.26 | 2.04 | 5.89 | 2.89 | 5.87 | 5.87 | 6.69 | 2.95 | 7.51 | 9.08 |
| Annual average | 2.68 | 0.67 | 1.93 | 0.95 | 1.92 | 1.92 | 2.18 | 0.98 | 2.44 | 2.94 |
|
| 1 year | –1.09 | –6.78 | –1.82 | –6.72 | –1.80 | –2.78 | –1.59 | –5.04 | –1.31 | –0.87 |
|
| 6 months | 1.70 | –4.15 | 1.35 | –3.65 | 1.35 | 0.35 | 1.44 | –2.11 | 1.58 | 1.81 |
|
See the discussion following the Fund performance table on page 11 for information about the calculation of fund performance.
Your fund’s expenses
As a mutual fund investor, you pay ongoing expenses, such as management fees, distribution fees (12b-1 fees), and other expenses. Using the following information, you can estimate how these expenses affect your investment and compare them with the expenses of other funds. You may also pay one-time transaction expenses, including sales charges (loads) and redemption fees, which are not shown in this section and would have resulted in higher total expenses. For more information, see your fund’s prospectus or talk to your financial representative.
Expense ratios
| | | | | | |
| | Class A | Class B | Class C | Class M | Class R | Class Y |
|
| Total annual operating expenses | | | | | | |
| for the fiscal year ended 8/31/12 | 1.28% | 2.03% | 2.03% | 1.78% | 1.53% | 1.03% |
|
| Annualized expense ratio for the | | | | | | |
| six-month period ended 2/28/13 | 1.25% | 2.00% | 2.00% | 1.75% | 1.50% | 1.00% |
|
Fiscal-year expense information in this table is taken from the most recent prospectus, is subject to change, and may differ from that shown for the annualized expense ratio and in the financial highlights of this report. Expenses are shown as a percentage of average net assets.
| |
| Global Natural Resources Fund | 13 |
Expenses per $1,000
The following table shows the expenses you would have paid on a $1,000 investment in the fund from September 1, 2012, to February 28, 2013. It also shows how much a $1,000 investment would be worth at the close of the period, assuming actual returns and expenses.
| | | | | | |
| | Class A | Class B | Class C | Class M | Class R | Class Y |
|
| Expenses paid per $1,000*† | $6.34 | $10.13 | $10.13 | $8.87 | $7.60 | $5.08 |
|
| Ending value (after expenses) | $1,045.70 | $1,042.00 | $1,042.00 | $1,043.40 | $1,044.50 | $1,047.10 |
|
* Expenses for each share class are calculated using the fund’s annualized expense ratio for each class, which represents the ongoing expenses as a percentage of average net assets for the six months ended 2/28/13. The expense ratio may differ for each share class.
† Expenses are calculated by multiplying the expense ratio by the average account value for the period; then multiplying the result by the number of days in the period; and then dividing that result by the number of days in the year.
Estimate the expenses you paid
To estimate the ongoing expenses you paid for the six months ended February 28, 2013, use the following calculation method. To find the value of your investment on September 1, 2012, call Putnam at 1-800-225-1581.

Compare expenses using the SEC’s method
The Securities and Exchange Commission (SEC) has established guidelines to help investors assess fund expenses. Per these guidelines, the following table shows your fund’s expenses based on a $1,000 investment, assuming a hypothetical 5% annualized return. You can use this information to compare the ongoing expenses (but not transaction expenses or total costs) of investing in the fund with those of other funds. All mutual fund shareholder reports will provide this information to help you make this comparison. Please note that you cannot use this information to estimate your actual ending account balance and expenses paid during the period.
| | | | | | |
| | Class A | Class B | Class C | Class M | Class R | Class Y |
|
| Expenses paid per $1,000*† | $6.26 | $9.99 | $9.99 | $8.75 | $7.50 | $5.01 |
|
| Ending value (after expenses) | $1,018.60 | $1,014.88 | $1,014.88 | $1,016.12 | $1,017.36 | $1,019.84 |
|
* Expenses for each share class are calculated using the fund’s annualized expense ratio for each class, which represents the ongoing expenses as a percentage of average net assets for the six months ended 2/28/13. The expense ratio may differ for each share class.
† Expenses are calculated by multiplying the expense ratio by the average account value for the period; then multiplying the result by the number of days in the period; and then dividing that result by the number of days in the year.
| |
| 14 | Global Natural Resources Fund |
Terms and definitions
Important terms
Total return shows how the value of the fund’s shares changed over time, assuming you held the shares through the entire period and reinvested all distributions in the fund.
Before sales charge, or net asset value, is the price, or value, of one share of a mutual fund, without a sales charge. Before-sales-charge figures fluctuate with market conditions, and are calculated by dividing the net assets of each class of shares by the number of outstanding shares in the class.
After sales charge is the price of a mutual fund share plus the maximum sales charge levied at the time of purchase. After-sales-charge performance figures shown here assume the 5.75% maximum sales charge for class A shares and 3.50% for class M shares.
Contingent deferred sales charge (CDSC) is generally a charge applied at the time of the redemption of class B or C shares and assumes redemption at the end of the period. Your fund’s class B CDSC declines over time from a 5% maximum during the first year to 1% during the sixth year. After the sixth year, the CDSC no longer applies. The CDSC for class C shares is 1% for one year after purchase.
Share classes
Class A shares are generally subject to an initial sales charge and no CDSC (except on certain redemptions of shares bought without an initial sales charge).
Class B shares are not subject to an initial sales charge. They may be subject to a CDSC.
Class C shares are not subject to an initial sales charge and are subject to a CDSC only if the shares are redeemed during the first year.
Class M shares have a lower initial sales charge and a higher 12b-1 fee than class A shares and no CDSC (except on certain redemptions of shares bought without an initial sales charge).
Class R shares are not subject to an initial sales charge or CDSC and are available only to certain defined contribution plans.
Class Y shares are not subject to an initial sales charge or CDSC, and carry no 12b-1 fee. They are generally only available to corporate and institutional clients and clients in other approved programs.
Comparative indexes
Barclays U.S. Aggregate Bond Index is an unmanaged index of U.S. investment-grade fixed-income securities.
BofA (Bank of America) Merrill Lynch U.S. 3-Month Treasury Bill Index is an unmanaged index that seeks to measure the performance of U.S. Treasury bills available in the marketplace.
MSCI World Energy & Materials Index (ND) is a free float-adjusted market capitalization weighted index that is designed to measure the equity market performance of developed markets in the energy and materials sector.
S&P 500 Index is an unmanaged index of common stock performance.
Indexes assume reinvestment of all distributions and do not account for fees. Securities and performance of a fund and an index will differ. You cannot invest directly in an index.
| |
| Global Natural Resources Fund | 15 |
Other information for shareholders
Important notice regarding delivery of shareholder documents
In accordance with Securities and Exchange Commission (SEC) regulations, Putnam sends a single copy of annual and semiannual shareholder reports, prospectuses, and proxy statements to Putnam shareholders who share the same address, unless a shareholder requests otherwise. If you prefer to receive your own copy of these documents, please call Putnam at 1-800-225-1581, and Putnam will begin sending individual copies within 30 days.
Proxy voting
Putnam is committed to managing our mutual funds in the best interests of our shareholders. The Putnam funds’ proxy voting guidelines and procedures, as well as information regarding how your fund voted proxies relating to portfolio securities during the 12-month period ended June 30, 2012, are available in the Individual Investors section of putnam.com, and on the SEC’s website, www.sec.gov. If you have questions about finding forms on the SEC’s website, you may call the SEC at 1-800-SEC-0330. You may also obtain the Putnam funds’ proxy voting guidelines and procedures at no charge by calling Putnam’s Shareholder Services at 1-800-225-1581.
Fund portfolio holdings
The fund will file a complete schedule of its portfolio holdings with the SEC for the first and third quarters of each fiscal year on Form N-Q. Shareholders may obtain the fund’s Forms N-Q on the SEC’s website at www.sec.gov. In addition, the fund’s Forms N-Q may be reviewed and copied at the SEC’s Public Reference Room in Washington, D.C. You may call the SEC at 1-800-SEC-0330 for information about the SEC’s website or the operation of the Public Reference Room.
Trustee and employee fund ownership
Putnam employees and members of the Board of Trustees place their faith, confidence, and, most importantly, investment dollars in Putnam mutual funds. As of February 28, 2013, Putnam employees had approximately $366,000,000 and the Trustees had approximately $87,000,000 invested in Putnam mutual funds. These amounts include investments by the Trustees’ and employees’ immediate family members as well as investments through retirement and deferred compensation plans.
| |
| 16 | Global Natural Resources Fund |
Financial statements
A guide to financial statements
These sections of the report, as well as the accompanying Notes, constitute the fund’s financial statements.
The fund’s portfolio lists all the fund’s investments and their values as of the last day of the reporting period. Holdings are organized by asset type and industry sector, country, or state to show areas of concentration and diversification.
Statement of assets and liabilities shows how the fund’s net assets and share price are determined. All investment and non-investment assets are added together. Any unpaid expenses and other liabilities are subtracted from this total. The result is divided by the number of shares to determine the net asset value per share, which is calculated separately for each class of shares. (For funds with preferred shares, the amount subtracted from total assets includes the liquidation preference of preferred shares.)
Statement of operations shows the fund’s net investment gain or loss. This is done by first adding up all the fund’s earnings — from dividends and interest income — and subtracting its operating expenses to determine net investment income (or loss). Then, any net gain or loss the fund realized on the sales of its holdings — as well as any unrealized gains or losses over the period — is added to or subtracted from the net investment result to determine the fund’s net gain or loss for the fiscal period.
Statement of changes in net assets shows how the fund’s net assets were affected by the fund’s net investment gain or loss, by distributions to shareholders, and by changes in the number of the fund’s shares. It lists distributions and their sources (net investment income or realized capital gains) over the current reporting period and the most recent fiscal year-end. The distributions listed here may not match the sources listed in the Statement of operations because the distributions are determined on a tax basis and may be paid in a different period from the one in which they were earned. Dividend sources are estimated at the time of declaration. Actual results may vary. Any non-taxable return of capital cannot be determined until final tax calculations are completed after the end of the fund’s fiscal year.
Financial highlights provide an overview of the fund’s investment results, per-share distributions, expense ratios, net investment income ratios, and portfolio turnover in one summary table, reflecting the five most recent reporting periods. In a semiannual report, the highlights table also includes the current reporting period.
| |
| Global Natural Resources Fund | 17 |
The fund’s portfolio 2/28/13 (Unaudited)
| | |
| COMMON STOCKS (99.5%)* | Shares | Value |
|
| Chemicals (21.4%) | | |
| Agrium, Inc. (Canada) | 48,200 | $4,991,300 |
|
| Akzo Nobel NV (Netherlands) | 58,685 | 3,736,874 |
|
| Albemarle Corp. | 42,800 | 2,785,424 |
|
| Arkema (France) | 23,830 | 2,413,138 |
|
| BASF SE (Germany) | 54,717 | 5,148,802 |
|
| Celanese Corp. Ser. A | 69,900 | 3,274,815 |
|
| Dow Chemical Co. (The) | 155,700 | 4,938,804 |
|
| Eastman Chemical Co. | 95,100 | 6,631,323 |
|
| H.B. Fuller Co. | 26,300 | 1,074,881 |
|
| Intrepid Potash, Inc. | 108,600 | 2,140,506 |
|
| Israel Chemicals, Ltd. (Israel) | 30,973 | 400,586 |
|
| LyondellBasell Industries NV Class A | 121,017 | 7,094,017 |
|
| Monsanto Co. | 94,769 | 9,574,512 |
|
| Nitto Denko Corp. (Japan) | 10,800 | 634,641 |
|
| Solvay SA (Belgium) | 38,708 | 5,532,744 |
|
| Tronox, Ltd. Class A S | 248,555 | 5,105,320 |
|
| | | 65,477,687 |
| Construction materials (0.6%) | | |
| Holcim, Ltd. (Switzerland) | 23,081 | 1,859,237 |
|
| | | 1,859,237 |
| Energy equipment and services (11.5%) | | |
| Cameron International Corp. † | 55,000 | 3,504,600 |
|
| FMC Technologies, Inc. † | 39,100 | 2,029,681 |
|
| Halliburton Co. | 190,100 | 7,891,051 |
|
| Nabors Industries, Ltd. † | 215,200 | 3,606,752 |
|
| Petrofac, Ltd. (United Kingdom) | 189,210 | 4,173,276 |
|
| Petroleum Geo-Services ASA (Norway) | 146,727 | 2,313,816 |
|
| Schlumberger, Ltd. | 149,509 | 11,639,276 |
|
| | | 35,158,452 |
| Metals and mining (13.9%) | | |
| Allegheny Technologies, Inc. | 76,900 | 2,343,143 |
|
| AuRico Gold, Inc. (Canada) † | 143,509 | 897,584 |
|
| BHP Billiton PLC (United Kingdom) | 151,517 | 4,794,314 |
|
| First Quantum Minerals, Ltd. (Canada) | 150,400 | 2,801,633 |
|
| Freeport-McMoRan Copper & Gold, Inc. Class B (Indonesia) | 261,700 | 8,353,464 |
|
| Goldcorp, Inc. (Canada) | 97,900 | 3,195,456 |
|
| Kinross Gold Corp. (Canada) | 663,800 | 5,052,926 |
|
| Pretium Resources, Inc. (Canada) † | 91,500 | 705,382 |
|
| ThyssenKrupp AG (Germany) † | 221,474 | 4,981,208 |
|
| Xstrata PLC (United Kingdom) | 521,501 | 9,199,402 |
|
| | | 42,324,512 |
| Oil, gas, and consumable fuels (48.5%) | | |
| Anadarko Petroleum Corp. | 89,700 | 7,138,326 |
|
| BG Group PLC (United Kingdom) | 472,492 | 8,356,164 |
|
| Cabot Oil & Gas Corp. | 86,300 | 5,348,011 |
|
| Cairn Energy PLC (United Kingdom) † | 847,492 | 3,493,615 |
|
| Canadian Natural Resources, Ltd. (Canada) | 135,300 | 4,135,424 |
|
| Chesapeake Energy Corp. | 34,438 | 694,270 |
|
| |
| 18 | Global Natural Resources Fund |
| | | |
| COMMON STOCKS (99.5%)* cont. | | Shares | Value |
|
| Oil, gas, and consumable fuels cont. | | | |
| Chevron Corp. | | 47,300 | $5,541,195 |
|
| Cobalt International Energy, Inc. † | | 98,279 | 2,424,543 |
|
| Energen Corp. | | 46,000 | 2,127,040 |
|
| ENI SpA (Italy) | | 453,265 | 10,307,899 |
|
| EXCO Resources, Inc. | | 343,000 | 2,277,520 |
|
| Exxon Mobil Corp. | | 214,238 | 19,185,013 |
|
| Gulfport Energy Corp. † | | 88,000 | 3,603,600 |
|
| Kodiak Oil & Gas Corp. † | | 211,500 | 1,882,350 |
|
| Marathon Oil Corp. | | 233,800 | 7,832,300 |
|
| Noble Energy, Inc. | | 57,900 | 6,417,057 |
|
| Occidental Petroleum Corp. | | 101,500 | 8,356,495 |
|
| Royal Dutch Shell PLC Class A (United Kingdom) | | 754,714 | 24,848,355 |
|
| Southwestern Energy Co. † | | 274,200 | 9,396,834 |
|
| Suncor Energy, Inc. (Canada) | | 377,600 | 11,442,424 |
|
| Tullow Oil PLC (United Kingdom) | | 190,700 | 3,512,745 |
|
| | | | 148,321,180 |
| Paper and forest products (3.4%) | | | |
| International Paper Co. | | 138,100 | 6,077,781 |
|
| MeadWestvaco Corp. | | 121,600 | 4,342,338 |
|
| | | | 10,420,119 |
| Semiconductors and semiconductor equipment (0.2%) | | |
| Sumco Corp. (Japan) † | | 60,300 | 602,589 |
| | | | 602,589 |
| | | |
| Total common stocks (cost $298,487,428) | | | $304,163,776 |
|
| |
| PURCHASED EQUITY OPTIONS | Expiration | Contract | |
| OUTSTANDING (—%)* | date/strike | amount | Value |
|
| Chesapeake Energy Corp. (Call) | Mar-13/$21.00 | 242,992 | $69,422 |
|
| Total purchased equity options outstanding (cost $182,244) | | $69,422 |
|
| |
| SHORT-TERM INVESTMENTS (1.1%)* | Principal amount/shares | Value |
|
| U.S. Treasury Bills with effective yields ranging from | | |
| 0.148% to 0.164%, July 25, 2013 Δ | | $706,000 | $705,678 |
|
| U.S. Treasury Bills with effective yields ranging from | | |
| 0.140% to 0.141%, February 6, 2014 Δ | | 250,000 | 249,638 |
|
| U.S. Treasury Bills with effective yields ranging from | | |
| 0.127% to 0.130%, January 9, 2014 Δ | | 670,000 | 669,139 |
|
| U.S. Treasury Bills with an effective yield of 0.122%, | | | |
| December 12, 2013 | | 234,000 | 233,740 |
|
| Putnam Cash Collateral Pool, LLC 0.21% d | | 801,550 | 801,550 |
|
| Putnam Short Term Investment Fund 0.10% L | | 464,959 | 464,959 |
|
| SSgA Prime Money Market Fund 0.08% P | | 290,000 | 290,000 |
|
| Total short-term investments (cost $3,414,731) | | | $3,414,704 |
|
| |
| TOTAL INVESTMENTS | | | |
|
| Total investments (cost $302,084,403) | | | $307,647,902 |
| |
| Global Natural Resources Fund | 19 |
Notes to the fund’s portfolio
Unless noted otherwise, the notes to the fund’s portfolio are for the close of the fund’s reporting period, which ran from September 1, 2012 through February 28, 2013 (the reporting period). Within the following notes to the portfolio, references to “ASC 820” represent Accounting Standards Codification ASC 820 Fair Value Measurements and Disclosures and references to “OTC”, if any, represent over-the-counter.
* Percentages indicated are based on net assets of $305,603.370.
† Non-income-producing security.
Δ This security, in part or in entirety, was pledged and segregated with the custodian for collateral on certain derivative contracts at the close of the reporting period.
d Affiliated company. See Note 1 to the financial statements regarding securities lending. The rate quoted in the security description is the annualized 7-day yield of the fund at the close of the reporting period.
L Affiliated company (Note 6). The rate quoted in the security description is the annualized 7-day yield of the fund at the close of the reporting period.
P Security was pledged, or purchased with cash that was pledged, to the fund for collateral on certain derivatives contracts. The rate quoted in the security description is the annualized 7-day yield of the fund at the close of the reporting period (Note 1).
S Security on loan, in part or in entirety, at the close of the reporting period (Note 1).
At the close of the reporting period, the fund maintained liquid assets totaling $824,476 to cover certain derivatives contracts.
|
| DIVERSIFICATION BY COUNTRY ⌂ |
Distribution of investments by country of risk at the close of the reporting period, excluding collateral received, if any (as a percentage of Portfolio Value):
| | | | |
| United States | 55.0% | | Netherlands | 1.2% |
| |
|
| United Kingdom | 19.0 | | France | 0.8 |
| |
|
| Canada | 10.8 | | Norway | 0.8 |
| |
|
| Italy | 3.4 | | Switzerland | 0.6 |
| |
|
| Germany | 3.3 | | Other | 0.6 |
| |
|
| Indonesia | 2.7 | | Total | 100.0% |
| | |
| Belgium | 1.8 | | | |
| | |
⌂ Methodology differs from that used for purposes of complying with the fund’s policy regarding investments in securities of foreign issuers, as discussed further in the fund’s prospectus.
FORWARD CURRENCY CONTRACTS at 2/28/13 (aggregate face value $135,581,187) (Unaudited)
| | | | | | |
| | | | | | | Unrealized |
| | | Contract | Delivery | | Aggregate | appreciation/ |
| Counterparty | Currency | type | date | Value | face value | (depreciation) |
|
| Bank of America N.A. | | | | | |
|
| | Australian Dollar | Sell | 4/17/13 | $2,642,638 | $2,689,327 | $46,689 |
|
| | British Pound | Buy | 3/20/13 | 633,464 | 654,334 | (20,870) |
|
| | Euro | Buy | 3/20/13 | 531,289 | 555,620 | (24,331) |
|
| Barclays Bank PLC | | | | | |
|
| | Australian Dollar | Buy | 4/17/13 | 5,918,601 | 6,023,761 | (105,160) |
|
| | British Pound | Sell | 3/20/13 | 5,754,724 | 5,981,072 | 226,348 |
|
| | Euro | Buy | 3/20/13 | 3,757,149 | 3,927,557 | (170,408) |
|
| | Japanese Yen | Buy | 5/15/13 | 900,703 | 902,702 | (1,999) |
|
| | Swiss Franc | Buy | 3/20/13 | 2,455,677 | 2,542,845 | (87,168) |
|
|
| 20 Global Natural Resources Fund |
FORWARD CURRENCY CONTRACTS at 2/28/13 (aggregate face value $135,581,187) (Unaudited) cont.
| | | | | | |
| | | | | | Unrealized |
| | Contract Delivery | | Aggregate | appreciation/ |
| Counterparty | Currency | type | date | Value | face value | (depreciation) |
|
| Citibank, N.A. | | | | | |
|
| British Pound | Buy | 3/20/13 | $1,811,501 | $1,882,238 | $(70,737) |
|
| Canadian Dollar | Buy | 4/17/13 | 73,040 | 75,383 | (2,343) |
|
| Danish Krone | Buy | 3/20/13 | 549,445 | 568,475 | (19,030) |
|
| Euro | Sell | 3/20/13 | 1,339,256 | 1,400,286 | 61,030 |
|
| Credit Suisse International | | | | | |
|
| Australian Dollar | Buy | 4/17/13 | 1,066,401 | 1,085,158 | (18,757) |
|
| British Pound | Sell | 3/20/13 | 4,854,738 | 5,046,039 | 191,301 |
|
| Canadian Dollar | Sell | 4/17/13 | 4,694,099 | 4,845,842 | 151,743 |
|
| Euro | Sell | 3/20/13 | 1,335,991 | 1,396,535 | 60,544 |
|
| Japanese Yen | Buy | 5/15/13 | 16,493,126 | 16,532,600 | (39,474) |
|
| Norwegian Krone | Sell | 3/20/13 | 242,354 | 254,063 | 11,709 |
|
| Swiss Franc | Buy | 3/20/13 | 713,238 | 738,710 | (25,472) |
|
| Deutsche Bank AG | | | | | |
|
| Australian Dollar | Sell | 4/17/13 | 1,829,832 | 1,861,981 | 32,149 |
|
| Canadian Dollar | Buy | 4/17/13 | 1,587,206 | 1,638,664 | (51,458) |
|
| Euro | Sell | 3/20/13 | 2,839,504 | 2,995,769 | 156,265 |
|
| Swedish Krona | Buy | 3/20/13 | 740,792 | 760,480 | (19,688) |
|
| Goldman Sachs International | | | | | |
|
| Australian Dollar | Buy | 4/17/13 | 1,813,238 | 1,845,220 | (31,982) |
|
| HSBC Bank USA, National Association | | | | |
|
| Australian Dollar | Buy | 4/17/13 | 11,495,241 | 11,700,139 | (204,898) |
|
| British Pound | Sell | 3/20/13 | 2,002,329 | 2,080,808 | 78,479 |
|
| JPMorgan Chase Bank N.A. | | | | | |
|
| Australian Dollar | Buy | 4/17/13 | 2,211,904 | 2,252,515 | (40,611) |
|
| British Pound | Buy | 3/20/13 | 5,618,353 | 5,836,115 | (217,762) |
|
| Canadian Dollar | Buy | 4/17/13 | 1,368,378 | 1,412,586 | (44,208) |
|
| Euro | Sell | 3/20/13 | 8,365,353 | 8,770,885 | 405,532 |
|
| Japanese Yen | Buy | 5/15/13 | 626,917 | 628,512 | (1,595) |
|
| Norwegian Krone | Buy | 3/20/13 | 2,578,341 | 2,704,318 | (125,977) |
|
| Swiss Franc | Buy | 3/20/13 | 1,921,282 | 1,989,833 | (68,551) |
|
| Royal Bank of Scotland PLC (The) | | | | | |
|
| Australian Dollar | Buy | 4/17/13 | 1,207,807 | 1,229,229 | (21,422) |
|
| State Street Bank and Trust Co. | | | | | |
|
| Australian Dollar | Buy | 4/17/13 | 122,267 | 124,427 | (2,160) |
|
| Canadian Dollar | Buy | 4/17/13 | 419,154 | 432,622 | (13,468) |
|
| Euro | Buy | 3/20/13 | 3,198,571 | 3,343,351 | (144,780) |
|
| Israeli Shekel | Buy | 4/17/13 | 188,108 | 188,812 | (704) |
|
| UBS AG | | | | | |
|
| Australian Dollar | Buy | 4/17/13 | 1,558,320 | 1,585,622 | (27,302) |
|
| British Pound | Sell | 3/20/13 | 2,261,418 | 2,302,483 | 41,065 |
|
| Canadian Dollar | Buy | 4/17/13 | 1,959,378 | 2,022,103 | (62,725) |
|
| Euro | Buy | 3/20/13 | 5,490,465 | 5,740,422 | (249,957) |
|
| Swiss Franc | Sell | 3/20/13 | 860,709 | 891,123 | 30,414 |
|
| |
| Global Natural Resources Fund | 21 |
FORWARD CURRENCY CONTRACTS at 2/28/13 (aggregate face value $135,581,187) (Unaudited) cont.
| | | | | | |
| | | | | | Unrealized |
| | Contract | Delivery | | Aggregate | appreciation/ |
| Counterparty | Currency | type | date | Value | face value | (depreciation) |
|
| WestPac Banking Corp. | | | | | |
|
| Australian Dollar | Sell | 4/17/13 | $1,321,319 | $1,344,618 | $23,299 |
|
| British Pound | Sell | 3/20/13 | 2,934,474 | 3,049,352 | 114,878 |
|
| Canadian Dollar | Buy | 4/17/13 | 1,325,949 | 1,368,725 | (42,776) |
|
| Euro | Buy | 3/20/13 | 3,244,662 | 3,392,907 | (148,245) |
|
| Japanese Yen | Sell | 5/15/13 | 4,964,098 | 4,985,019 | 20,921 |
|
| Total | | | | | $(453,652) |
| | | |
| | | | |
| WRITTEN EQUITY OPTIONS OUTSTANDING at 2/28/13 (premiums $19,439) (Unaudited) | |
| | |
| | Expiration | Contract | |
| | date/strike | amount | Value |
|
| Chesapeake Energy Corp. (Call) | Mar-13/$25.00 | 242,992 | $1,641 |
|
| Total | | | $1,641 |
ASC 820 establishes a three-level hierarchy for disclosure of fair value measurements. The valuation hierarchy is based upon the transparency of inputs to the valuation of the fund’s investments. The three levels are defined as follows:
Level 1: Valuations based on quoted prices for identical securities in active markets.
Level 2: Valuations based on quoted prices in markets that are not active or for which all significant inputs are observable, either directly or indirectly.
Level 3: Valuations based on inputs that are unobservable and significant to the fair value measurement.
The following is a summary of the inputs used to value the fund’s net assets as of the close of the reporting period:
| | | |
| | | Valuation inputs | |
|
| Investments in securities: | Level 1 | Level 2 | Level 3 |
|
| Common stocks: | | | |
|
| Energy | $126,473,762 | $57,005,870 | $— |
|
| Information technology | — | 602,589 | — |
|
| Materials | 81,380,609 | 38,700,946 | — |
|
| Total common stocks | 207,854,371 | 96,309,405 | — |
| | | | |
| Purchased equity options outstanding | — | 69,422 | — |
|
| Short-term investments | 754,959 | 2,659,745 | — |
|
| Totals by level | $208,609,330 | $99,038,572 | $— |
| | | | |
| | | Valuation inputs | |
|
| Other financial instruments: | Level 1 | Level 2 | Level 3 |
|
| Forward currency contracts | $— | $(453,652) | $— |
|
| Written equity options outstanding | — | (1,641) | — |
|
| Totals by level | $— | $(455,293) | $— |
The accompanying notes are an integral part of these financial statements.
|
| 22 Global Natural Resources Fund |
Statement of assets and liabilities 2/28/13 (Unaudited)
| |
| ASSETS | |
|
| Investment in securities, at value, including $803,114 of securities on loan (Note 1): | |
| Unaffiliated issuers (identified cost $300,817,894) | $306,381,393 |
| Affiliated issuers (identified cost $1,266,509) (Notes 1 and 6) | 1,266,509 |
|
| Cash | 2,030 |
|
| Dividends, interest and other receivables | 694,643 |
|
| Receivable for shares of the fund sold | 169,970 |
|
| Receivable for investments sold | 874,024 |
|
| Foreign tax reclaim | 61,840 |
|
| Unrealized appreciation on forward currency contracts (Note 1) | 1,652,366 |
|
| Total assets | 311,102,775 |
| |
| LIABILITIES | |
|
| Payable for investments purchased | 1,226,277 |
|
| Payable for shares of the fund repurchased | 448,413 |
|
| Payable for compensation of Manager (Note 2) | 151,739 |
|
| Payable for custodian fees (Note 2) | 14,507 |
|
| Payable for investor servicing fees (Note 2) | 135,661 |
|
| Payable for Trustee compensation and expenses (Note 2) | 102,663 |
|
| Payable for administrative services (Note 2) | 3,719 |
|
| Payable for distribution fees (Note 2) | 140,223 |
|
| Unrealized depreciation on forward currency contracts (Note 1) | 2,106,018 |
|
| Written options outstanding, at value (premiums $19,439) (Notes 1 and 3) | 1,641 |
|
| Collateral on securities loaned, at value (Note 1) | 801,550 |
|
| Collateral on certain derivative contracts, at value (Note 1) | 290,000 |
|
| Other accrued expenses | 76,994 |
|
| Total liabilities | 5,499,405 |
| | |
| Net assets | $305,603,370 |
|
| |
| REPRESENTED BY | |
|
| Paid-in capital (Unlimited shares authorized) (Notes 1 and 4) | $391,223,712 |
|
| Undistributed net investment income (Note 1) | 1,038,886 |
|
| Accumulated net realized loss on investments and foreign currency transactions (Note 1) | (91,775,776) |
|
| Net unrealized appreciation of investments and assets and liabilities in foreign currencies | 5,116,548 |
|
| Total — Representing net assets applicable to capital shares outstanding | $305,603,370 |
(Continued on next page)
| |
| Global Natural Resources Fund | 23 |
Statement of assets and liabilities (Continued)
| |
| COMPUTATION OF NET ASSET VALUE AND OFFERING PRICE | |
|
| Net asset value and redemption price per class A share | |
| ($250,170,202 divided by 12,576,731 shares) | $19.89 |
|
| Offering price per class A share (100/94.25 of $19.89)* | $21.10 |
|
| Net asset value and offering price per class B share ($14,280,483 divided by 802,319 shares)** | $17.80 |
|
| Net asset value and offering price per class C share ($12,698,098 divided by 698,347 shares)** | $18.18 |
|
| Net asset value and redemption price per class M share ($4,514,095 divided by 238,356 shares) | $18.94 |
|
| Offering price per class M share (100/96.50 of $18.94)* | $19.63 |
|
| Net asset value, offering price and redemption price per class R share | |
| ($13,697,691 divided by 701,464 shares) | $19.53 |
|
| Net asset value, offering price and redemption price per class Y share | |
| ($10,242,801 divided by 512,169 shares) | $20.00 |
|
* On single retail sales of less than $50,000. On sales of $50,000 or more the offering price is reduced.
** Redemption price per share is equal to net asset value less any applicable contingent deferred sales charge.
The accompanying notes are an integral part of these financial statements.
|
| 24 Global Natural Resources Fund |
Statement of operations Six months ended 2/28/13 (Unaudited)
| |
| INVESTMENT INCOME | |
|
| Dividends (net of foreign tax of $252,224) | $3,037,545 |
|
| Interest (including interest income of $1,502 from investments in affiliated issuers) (Note 6) | 2,445 |
|
| Securities lending (Note 1) | 4,240 |
|
| Total investment income | 3,044,230 |
| |
| EXPENSES | |
|
| Compensation of Manager (Note 2) | 1,005,615 |
|
| Investor servicing fees (Note 2) | 459,644 |
|
| Custodian fees (Note 2) | 14,329 |
|
| Trustee compensation and expenses (Note 2) | 16,673 |
|
| Distribution fees (Note 2) | 518,255 |
|
| Administrative services (Note 2) | 5,348 |
|
| Other | 76,989 |
|
| Total expenses | 2,096,853 |
| | |
| Expense reduction (Note 2) | (14,409) |
|
| Net expenses | 2,082,444 |
| | |
| Net investment income | 961,786 |
|
| |
| Net realized gain on investments (Notes 1 and 3) | 7,404,351 |
|
| Net realized loss on foreign currency transactions (Note 1) | (1,206,918) |
|
| Net realized gain on written options (Notes 1 and 3) | 18,164 |
|
| Net unrealized depreciation of assets and liabilities in foreign currencies during the period | (411,671) |
|
| Net unrealized appreciation of investments and written options during the period | 7,622,049 |
|
| Net gain on investments | 13,425,975 |
| | |
| Net increase in net assets resulting from operations | $14,387,761 |
|
The accompanying notes are an integral part of these financial statements.
| |
| Global Natural Resources Fund | 25 |
Statement of changes in net assets
| | |
| DECREASE IN NET ASSETS | Six months ended 2/28/13* | Year ended 8/31/12 |
|
| Operations: | | |
| Net investment income | $961,786 | $3,829,246 |
|
| Net realized gain (loss) on investments | | |
| and foreign currency transactions | 6,215,597 | (28,544,267) |
|
| Net unrealized appreciation of investments and assets | | |
| and liabilities in foreign currencies | 7,210,378 | 3,915,178 |
|
| Net increase (decrease) in net assets resulting from operations | 14,387,761 | (20,799,843) |
|
| Distributions to shareholders (Note 1): | | |
| From ordinary income | | |
| Net investment income | | |
|
| Class A | (2,144,610) | (8,268,152) |
|
| Class B | (14,844) | (421,959) |
|
| Class C | (17,596) | (334,299) |
|
| Class M | (15,020) | (141,190) |
|
| Class R | (83,705) | (410,298) |
|
| Class Y | (113,099) | (333,579) |
|
| Redemption fees (Note 1) | 8,153 | 72,188 |
|
| Decrease from capital share transactions (Note 4) | (27,073,084) | (43,804,045) |
|
| Total decrease in net assets | (15,066,044) | (74,441,177) |
| |
| NET ASSETS | | |
|
| Beginning of period | 320,669,414 | 395,110,591 |
|
| End of period (including undistributed net investment�� | | |
| income of $1,038,886 and $2,465,974, respectively) | $305,603,370 | $320,669,414 |
|
* Unaudited
The accompanying notes are an integral part of these financial statements.
|
| 26 Global Natural Resources Fund |
|
| This page left blank intentionally. |
| |
| Global Natural Resources Fund | 27 |
Financial highlights (For a common share outstanding throughout the period)
| | | | | | | | | | | | | | | |
| INVESTMENT OPERATIONS: | | | | LESS DISTRIBUTIONS: | | | | | | RATIOS AND SUPPLEMENTAL DATA: | |
|
| | | | | | | | | | | | | | | Ratio | |
| | Net asset | | Net realized | | | | | | | | | | Ratio | of net investment | |
| | value, | | and unrealized | Total from | From | From | | | | | Total return | Net assets, | of expenses | income (loss) | |
| | beginning | Net investment | gain (loss) | investment | net investment | net realized gain | Total | Redemption | Non-recurring | Net asset value, | at net asset | end of period | to average | to average | Portfolio |
| Period ended | of period | income (loss) a | on investments | operations | income | on investments | distributions | fees | reimbursements | end of period | value (%) b | (in thousands) | net assets (%) c | net assets (%) | turnover (%) |
|
| Class A | | | | | | | | | | | | | | | |
| February 28, 2013** | $19.18 | .07 | .81 | .88 | (.17) | — | (.17) | — d | — | $19.89 | 4.57* | $250,170 | .62* | .34* | 47* |
| August 31, 2012 | 20.81 | .23 | (1.30) | (1.07) | (.56) | — | (.56) | — d | — | 19.18 | (5.08) | 262,969 | 1.29 | 1.18 | 80 |
| August 31, 2011 | 16.62 | .15 | 4.44 | 4.59 | (.40) | — | (.40) | — d | — d,e | 20.81 | 27.53 | 322,408 | 1.26 | .66 | 90 |
| August 31, 2010 | 16.87 | .13 | (.18) | (.05) | (.20) | — | (.20) | — d | — | 16.62 | (.44) | 284,668 | 1.39 | .71 | 107 |
| August 31, 2009 | 27.99 | .19 | (9.21) | (9.02) | — | (2.10) | (2.10) | — d | — | 16.87 | (29.64) | 321,830 | 1.44 f,g | 1.22 g | 92 |
| August 31, 2008 | 35.18 | .29 | (.54) | (.25) | (.08) | (6.87) | (6.95) | .01 | — | 27.99 | (2.76) | 559,989 | 1.18 g | .87 g | 99 |
|
| Class B | | | | | | | | | | | | | | | |
| February 28, 2013** | $17.10 | (.01) | .73 | .72 | (.02) | — | (.02) | — d | — | $17.80 | 4.20* | $14,280 | .99* | (.03)* | 47* |
| August 31, 2012 | 18.58 | .08 | (1.16) | (1.08) | (.40) | — | (.40) | — d | — | 17.10 | (5.78) | 15,561 | 2.04 | .46 | 80 |
| August 31, 2011 | 14.87 | (.02) | 3.99 | 3.97 | (.26) | — | (.26) | — d | — d,e | 18.58 | 26.58 | 21,166 | 2.01 | (.10) | 90 |
| August 31, 2010 | 15.11 | (.01) | (.15) | (.16) | (.08) | — | (.08) | — d | — | 14.87 | (1.15) | 21,418 | 2.14 | (.05) | 107 |
| August 31, 2009 | 25.66 | .06 | (8.51) | (8.45) | — | (2.10) | (2.10) | — d | — | 15.11 | (30.18) | 30,849 | 2.19 f,g | .45 g | 92 |
| August 31, 2008 | 32.93 | .02 | (.43) | (.41) | — | (6.87) | (6.87) | .01 | — | 25.66 | (3.52) | 70,360 | 1.93 g | .08 g | 99 |
|
| Class C | | | | | | | | | | | | | | | |
| February 28, 2013** | $17.47 | (.01) | .74 | .73 | (.02) | — | (.02) | — d | — | $18.18 | 4.20* | $12,698 | .99* | (.03)* | 47* |
| August 31, 2012 | 18.98 | .08 | (1.19) | (1.11) | (.40) | — | (.40) | — d | — | 17.47 | (5.81) | 13,564 | 2.04 | .43 | 80 |
| August 31, 2011 | 15.20 | (.01) | 4.07 | 4.06 | (.28) | — | (.28) | — d | — d,e | 18.98 | 26.61 | 16,797 | 2.01 | (.04) | 90 |
| August 31, 2010 | 15.47 | (.01) | (.16) | (.17) | (.10) | — | (.10) | — d | — | 15.20 | (1.21) | 13,292 | 2.14 | (.04) | 107 |
| August 31, 2009 | 26.18 | .07 | (8.68) | (8.61) | — | (2.10) | (2.10) | — d | — | 15.47 | (30.18) | 14,156 | 2.19 f,g | .47 g | 92 |
| August 31, 2008 | 33.46 | .04 | (.45) | (.41) | — | (6.87) | (6.87) | — d | — | 26.18 | (3.49) | 25,383 | 1.93 g | .12 g | 99 |
|
| Class M | | | | | | | | | | | | | | | |
| February 28, 2013** | $18.21 | .02 | .77 | .79 | (.06) | — | (.06) | — d | — | $18.94 | 4.34* | $4,514 | .87* | .09* | 47* |
| August 31, 2012 | 19.77 | .13 | (1.23) | (1.10) | (.46) | — | (.46) | — d | — | 18.21 | (5.53) | 4,999 | 1.79 | .70 | 80 |
| August 31, 2011 | 15.82 | .03 | 4.23 | 4.26 | (.31) | — | (.31) | — d | — d,e | 19.77 | 26.86 | 6,233 | 1.76 | .17 | 90 |
| August 31, 2010 | 16.08 | .04 | (.17) | (.13) | (.13) | — | (.13) | — d | — | 15.82 | (.91) | 5,141 | 1.89 | .20 | 107 |
| August 31, 2009 | 27.00 | .11 | (8.93) | (8.82) | — | (2.10) | (2.10) | — d | — | 16.08 | (30.03) | 5,609 | 1.94 f,g | .73 g | 92 |
| August 31, 2008 | 34.22 | .12 | (.48) | (.36) | — | (6.87) | (6.87) | .01 | — | 27.00 | (3.20) | 9,172 | 1.68 g | .36 g | 99 |
|
| Class R | | | | | | | | | | | | | | | |
| February 28, 2013** | $18.81 | .04 | .80 | .84 | (.12) | — | (.12) | — d | — | $19.53 | 4.45* | $13,698 | .74* | .21* | 47* |
| August 31, 2012 | 20.41 | .18 | (1.27) | (1.09) | (.51) | — | (.51) | — d | — | 18.81 | (5.28) | 13,838 | 1.54 | .94 | 80 |
| August 31, 2011 | 16.31 | .10 | 4.36 | 4.46 | (.36) | — | (.36) | — d | — d,e | 20.41 | 27.27 | 16,971 | 1.51 | .46 | 90 |
| August 31, 2010 | 16.58 | .09 | (.19) | (.10) | (.17) | — | (.17) | — d | — | 16.31 | (.72) | 11,192 | 1.64 | .48 | 107 |
| August 31, 2009 | 27.64 | .15 | (9.11) | (8.96) | — | (2.10) | (2.10) | — d | — | 16.58 | (29.82) | 9,966 | 1.69 f,g | 1.00 g | 92 |
| August 31, 2008 | 34.87 | .22 | (.53) | (.31) | (.06) | (6.87) | (6.93) | .01 | — | 27.64 | (2.99) | 10,129 | 1.43 g | .69 g | 99 |
|
| Class Y | | | | | | | | | | | | | | | |
| February 28, 2013** | $19.31 | .09 | .82 | .91 | (.22) | — | (.22) | — d | — | $20.00 | 4.71* | $10,243 | .49* | .46* | 47* |
| August 31, 2012 | 20.96 | .28 | (1.31) | (1.03) | (.62) | — | (.62) | — d | — | 19.31 | (4.85) | 9,739 | 1.04 | 1.44 | 80 |
| August 31, 2011 | 16.73 | .21 | 4.47 | 4.68 | (.45) | — | (.45) | — d | — d,e | 20.96 | 27.89 | 11,535 | 1.01 | .94 | 90 |
| August 31, 2010 | 16.97 | .18 | (.18) | — d | (.24) | — | (.24) | — d | — | 16.73 | (.16) | 9,069 | 1.14 | .95 | 107 |
| August 31, 2009 | 28.07 | .23 | (9.23) | (9.00) | — | (2.10) | (2.10) | — d | — | 16.97 | (29.47) | 11,052 | 1.19 f,g | 1.48 g | 92 |
| August 31, 2008 | 35.26 | .38 | (.54) | (.16) | (.17) | (6.87) | (7.04) | .01 | — | 28.07 | (2.51) | 16,306 | .93 g | 1.16 g | 99 |
|
See notes to financial highlights at the end of this section.
The accompanying notes are an integral part of these financial statements.
| |
| 28 Global Natural Resources Fund | Global Natural Resources Fund 29 |
Financial highlights (Continued)
* Not annualized.
** Unaudited.
a Per share net investment income (loss) has been determined on the basis of the weighted average number of shares outstanding during the period.
b Total return assumes dividend reinvestment and does not reflect the effect of sales charges.
c Includes amounts paid through expense offset and brokerage/service arrangements (Note 2).
d Amount represents less than $0.01 per share.
e Reflects a non-recurring reimbursement related to restitution amounts in connection with a distribution plan approved by the Securities and Exchange Commission (the SEC) which amounted to less than $0.01 per share outstanding on July 21, 2011. Also reflects a non-recurring reimbursement related to short-term trading related lawsuits, which amounted to less than $0.01 per share outstanding on May 11, 2011.
f Includes interest accrued in connection with certain terminated derivatives contracts, which amounted to 0.01% of average net assets for the period ended August 31, 2009.
g Reflects an involuntary contractual expense limitation and/or waivers of certain fund expenses in connection with investments in Putnam Prime Money Market Fund in effect during the period. As a result of such limitation and/or waivers, the expenses of each class reflect a reduction of the following amounts:
| |
| | Percentage of |
| | average net assets |
|
| August 31, 2009 | 0.05% |
|
| August 31, 2008 | <0.01 |
|
The accompanying notes are an integral part of these financial statements.
|
| 30 Global Natural Resources Fund |
Notes to financial statements 2/28/13 (Unaudited)
Within the following Notes to financial statements, references to “State Street” represent State Street Bank and Trust Company, references to “the SEC” represent the Securities and Exchange Commission, references to “Putnam Management” represent Putnam Investment Management, LLC, the fund’s manager, an indirect wholly-owned subsidiary of Putnam Investments, LLC and references to “OTC”, if any, represent over-the-counter. Unless otherwise noted, the “reporting period” represents the period from September 1, 2012 through February 28, 2013.
Putnam Global Natural Resources Fund (the fund) is a Massachusetts business trust, which is registered under the Investment Company Act of 1940, as amended, as a non-diversified, open-end management investment company. The fund is currently operating as a diversified fund. In the future, the fund may operate as a non-diversified fund to the extent permitted by applicable law. The investment objective of the fund is to seek capital appreciation by concentrating its investments in the energy and other natural resources industries. The fund invests mainly in common stocks (growth or value stocks or both) of large and midsize companies worldwide that Putnam Management believes have favorable investment potential. Potential investments include companies in the discovery, development, production or distribution of energy or other natural resources, in the development of technologies for the production or efficient use of energy and other natural resources, and in furnishing of related supplies or services. The fund may purchase stocks of companies with stock prices that reflect a value lower than that which Putnam Management places on the company. Putnam Management also considers other factors that it believes will cause the stock price to rise. Putnam Management may consider, among other factors, a company’s valuation, financial strength, growth potential, competitive position in its industry, projected future earnings, cash flows and dividends when deciding whether to buy or sell investments.
The fund offers class A, class B, class C, class M, class R, and class Y shares. Class A and class M shares are sold with a maximum front-end sales charge of 5.75% and 3.50%, respectively, and generally do not pay a contingent deferred sales charge. Class B shares, which convert to class A shares after approximately eight years, do not pay a front-end sales charge and are subject to a contingent deferred sales charge if those shares are redeemed within six years of purchase. Class C shares have a one-year 1.00% contingent deferred sales charge and do not convert to class A shares. Class R shares, which are not available to all investors, are sold at net asset value. The expenses for class A, class B, class C, class M and class R shares may differ based on the distribution fee of each class, which is identified in Note 2. Class Y shares, which are sold at net asset value, are generally subject to the same expenses as class A, class B, class C, class M and class R shares, but do not bear a distribution fee. Class Y shares are not available to all investors.
In the normal course of business, the fund enters into contracts that may include agreements to indemnify another party under given circumstances. The fund’s maximum exposure under these arrangements is unknown as this would involve future claims that may be, but have not yet been, made against the fund. However, the fund’s management team expects the risk of material loss to be remote.
Note 1: Significant accounting policies
The following is a summary of significant accounting policies consistently followed by the fund in the preparation of its financial statements. The preparation of financial statements is in conformity with accounting principles generally accepted in the United States of America and requires management to make estimates and assumptions that affect the reported amounts of assets and liabilities in the financial statements and the reported amounts of increases and decreases in net assets from operations. Actual results could differ from those estimates. Subsequent events after the Statement of assets and liabilities date through the date that the financial statements were issued have been evaluated in the preparation of the financial statements.
A short-term trading fee of 1.00% may have applied to redemptions (including exchanges into another fund) of shares purchased before January 2, 2013 and held for 90 days or less. The short-term trading fee was accounted for as an addition to paid-in-capital. No short-term trading fee applies to shares purchased on or after January 2, 2013.
Investment income, realized and unrealized gains and losses and expenses of the fund are borne pro-rata based on the relative net assets of each class to the total net assets of the fund, except that each class bears expenses unique to that class (including the distribution fees applicable to such classes). Each class votes as a class only with respect to its own distribution plan or other matters on which a class vote is required by law or determined by the Trustees. If the fund were liquidated, shares of each class would receive their pro-rata share of the net assets of the fund. In addition, the Trustees declare separate dividends on each class of shares.
| |
| Global Natural Resources Fund | 31 |
Security valuation Investments for which market quotations are readily available are valued at the last reported sales price on their principal exchange, or official closing price for certain markets, and are classified as Level 1 securities under Accounting Standards Codification ASC 820 Fair Value Measurements and Disclosures (ASC 820). If no sales are reported, as in the case of some securities that are traded OTC, a security is valued at its last reported bid price and is generally categorized as a Level 2 security.
Investments in open-end investment companies (excluding exchange traded funds), if any, which can be classified as Level 1 or Level 2 securities, are based on their net asset value. The net asset value of such investment companies equals the total value of their assets less their liabilities and divided by the number of their outstanding shares.
Many securities markets and exchanges outside the U.S. close prior to the close of the New York Stock Exchange and therefore the closing prices for securities in such markets or on such exchanges may not fully reflect events that occur after such close but before the close of the New York Stock Exchange. Accordingly, on certain days, the fund will fair value foreign equity securities taking into account multiple factors including movements in the U.S. securities markets, currency valuations and comparisons to the valuation of American Depository Receipts, exchange-traded funds and futures contracts. These securities, which would generally be classified as Level 1 securities, will be transferred to Level 2 of the fair value hierarchy when they are valued at fair value. The number of days on which fair value prices will be used will depend on market activity and it is possible that fair value prices will be used by the fund to a significant extent. At the close of the reporting period, fair value pricing was used for certain foreign securities in the portfolio. Securities quoted in foreign currencies, if any, are translated into U.S. dollars at the current exchange rate.
To the extent a pricing service or dealer is unable to value a security or provides a valuation that Putnam Management does not believe accurately reflects the security’s fair value, the security will be valued at fair value by Putnam Management. Certain investments, including certain restricted and illiquid securities and derivatives, are also valued at fair value following procedures approved by the Trustees. These valuations consider such factors as significant market or specific security events such as interest rate or credit quality changes, various relationships with other securities, discount rates, U.S. Treasury, U.S. swap and credit yields, index levels, convexity exposures and recovery rates. These securities are classified as Level 2 or as Level 3 depending on the priority of the significant inputs.
Such valuations and procedures are reviewed periodically by the Trustees. The fair value of securities is generally determined as the amount that the fund could reasonably expect to realize from an orderly disposition of such securities over a reasonable period of time. By its nature, a fair value price is a good faith estimate of the value of a security in a current sale and does not reflect an actual market price, which may be different by a material amount.
Security transactions and related investment income Security transactions are recorded on the trade date (the date the order to buy or sell is executed). Gains or losses on securities sold are determined on the identified cost basis.
Interest income, net of any applicable withholding taxes, is recorded on the accrual basis. Dividend income, net of any applicable withholding taxes, is recognized on the ex-dividend date except that certain dividends from foreign securities, if any, are recognized as soon as the fund is informed of the ex-dividend date. Non-cash dividends, if any, are recorded at the fair market value of the securities received. Dividends representing a return of capital or capital gains, if any, are reflected as a reduction of cost and/or as a realized gain.
All premiums/discounts are amortized/accreted on a yield-to-maturity basis.
Foreign currency translation The accounting records of the fund are maintained in U.S. dollars. The market value of foreign securities, currency holdings, and other assets and liabilities is recorded in the books and records of the fund after translation to U.S. dollars based on the exchange rates on that day. The cost of each security is determined using historical exchange rates. Income and withholding taxes are translated at prevailing exchange rates when earned or incurred. The fund does not isolate that portion of realized or unrealized gains or losses resulting from changes in the foreign exchange rate on investments from fluctuations arising from changes in the market prices of the securities. Such gains and losses are included with the net realized and unrealized gain or loss on investments. Net realized gains and losses on foreign currency transactions represent net realized exchange gains or losses on closed forward currency contracts, disposition of foreign currencies, currency gains and losses realized between the trade and settlement dates on securities transactions and the difference between the amount of investment income and foreign withholding taxes recorded on the fund’s books and the U.S. dollar equivalent amounts actually received or paid. Net unrealized appreciation and depreciation of assets and liabilities in foreign currencies arise from changes in the value of open forward currency contracts and assets and liabilities other than investments at the period end, resulting from changes in the exchange rate.
|
| 32 Global Natural Resources Fund |
Options contracts The fund uses options contracts to enhance the return on securities owned.
The potential risk to the fund is that the change in value of options contracts may not correspond to the change in value of the hedged instruments. In addition, losses may arise from changes in the value of the underlying instruments, if there is an illiquid secondary market for the contracts, if interest or exchange rates move unexpectedly or if the counterparty to the contract is unable to perform. Realized gains and losses on purchased options are included in realized gains and losses on investment securities. If a written call option is exercised, the premium originally received is recorded as an addition to sales proceeds. If a written put option is exercised, the premium originally received is recorded as a reduction to the cost of investments.
Exchange traded options are valued at the last sale price or, if no sales are reported, the last bid price for purchased options and the last ask price for written options. OTC traded options are valued using prices supplied by dealers. Forward premium swap option contracts include premiums that do not settle until the expiration date of the contract. The delayed settlement of the premiums are factored into the daily valuation of the option contracts.
Written option contracts outstanding at period end, if any, are listed after the fund’s portfolio. For the fund’s average contract amount, see Note 5.
Forward currency contracts The fund buys and sells forward currency contracts, which are agreements between two parties to buy and sell currencies at a set price on a future date. These contracts are used to hedge foreign exchange risk.
The U.S. dollar value of forward currency contracts is determined using current forward currency exchange rates supplied by a quotation service. The market value of the contract will fluctuate with changes in currency exchange rates. The contract is marked to market daily and the change in market value is recorded as an unrealized gain or loss. The fund records a realized gain or loss equal to the difference between the value of the contract at the time it was opened and the value at the time it was closed when the contract matures or by delivery of the currency. The fund could be exposed to risk if the value of the currency changes unfavorably, if the counterparties to the contracts are unable to meet the terms of their contracts or if the fund is unable to enter into a closing position. Risks may exceed amounts recognized on the Statement of assets and liabilities.
Forward currency contracts outstanding at period end, if any, are listed after the fund’s portfolio. For the fund’s average contract amount, see Note 5.
Master agreements The fund is a party to ISDA (International Swaps and Derivatives Association, Inc.) Master Agreements (Master Agreements) with certain counterparties that govern OTC derivative and foreign exchange contracts entered into from time to time. The Master Agreements may contain provisions regarding, among other things, the parties’ general obligations, representations, agreements, collateral requirements, events of default and early termination. With respect to certain counterparties, in accordance with the terms of the Master Agreements, collateral posted to the fund is held in a segregated account by the fund’s custodian and with respect to those amounts which can be sold or repledged, are presented in the fund’s portfolio. Collateral posted to the fund which cannot be sold or repledged totaled $469,558 at the close of the reporting period.
Collateral pledged by the fund is segregated by the fund’s custodian and identified in the fund’s portfolio. Collateral can be in the form of cash or debt securities issued by the U.S. Government or related agencies or other securities as agreed to by the fund and the applicable counterparty. Collateral requirements are determined based on the fund’s net position with each counterparty.
Termination events applicable to the fund may occur upon a decline in the fund’s net assets below a specified threshold over a certain period of time. Termination events applicable to counterparties may occur upon a decline in the counterparty’s long-term and short-term credit ratings below a specified level. In each case, upon occurrence, the other party may elect to terminate early and cause settlement of all derivative and foreign exchange contracts outstanding, including the payment of any losses and costs resulting from such early termination, as reasonably determined by the terminating party. Any decision by one or more of the fund’s counterparties to elect early termination could impact the fund’s future derivative activity.
At the close of the reporting period, the fund had a net liability position of $872,922 on open derivative contracts subject to the Master Agreements. Collateral posted by the fund for these agreements totaled $502,337.
Securities lending The fund may lend securities, through its agent, to qualified borrowers in order to earn additional income. The loans are collateralized by cash in an amount at least equal to the market value of the securities loaned. The market value of securities loaned is determined daily and any additional required collateral is allocated to the fund on the next business day. The risk of borrower default will be borne by the fund’s agent; the fund will
| |
| Global Natural Resources Fund | 33 |
bear the risk of loss with respect to the investment of the cash collateral. Income from securities lending is included in investment income on the Statement of operations. Cash collateral is invested in Putnam Cash Collateral Pool, LLC, a limited liability company managed by an affiliate of Putnam Management. Investments in Putnam Cash Collateral Pool, LLC are valued at its closing net asset value each business day. There are no management fees charged to Putnam Cash Collateral Pool, LLC. At the close of the reporting period, the value of securities loaned amounted to $803,114 and the fund received cash collateral of $801,550.
Interfund lending The fund, along with other Putnam funds, may participate in an interfund lending program pursuant to an exemptive order issued by the SEC. This program allows the fund to borrow from or lend to other Putnam funds that permit such transactions. Interfund lending transactions are subject to each fund’s investment policies and borrowing and lending limits. Interest earned or paid on the interfund lending transaction will be based on the average of certain current market rates. During the reporting period, the fund did not utilize the program.
Line of credit The fund participates, along with other Putnam funds, in a $315 million unsecured committed line of credit and a $185 million unsecured uncommitted line of credit, both provided by State Street. Borrowings may be made for temporary or emergency purposes, including the funding of shareholder redemption requests and trade settlements. Interest is charged to the fund based on the fund’s borrowing at a rate equal to the Federal Funds rate plus 1.25% for the committed line of credit and the Federal Funds rate plus 1.30% for the uncommitted line of credit. A closing fee equal to 0.02% of the committed line of credit and $50,000 for the uncommitted line of credit has been paid by the participating funds. In addition, a commitment fee of 0.11% per annum on any unutilized portion of the committed line of credit is allocated to the participating funds based on their relative net assets and paid quarterly. During the reporting period, the fund had no borrowings against these arrangements.
Federal taxes It is the policy of the fund to distribute all of its taxable income within the prescribed time period and otherwise comply with the provisions of the Internal Revenue Code of 1986, as amended (the Code), applicable to regulated investment companies. It is also the intention of the fund to distribute an amount sufficient to avoid imposition of any excise tax under Section 4982 of the Code.
The fund is subject to the provisions of Accounting Standards Codification ASC 740 Income Taxes (ASC 740). ASC 740 sets forth a minimum threshold for financial statement recognition of the benefit of a tax position taken or expected to be taken in a tax return. The fund did not have a liability to record for any unrecognized tax benefits in the accompanying financial statements. No provision has been made for federal taxes on income, capital gains or unrealized appreciation on securities held nor for excise tax on income and capital gains. Each of the fund’s federal tax returns for the prior three fiscal years remains subject to examination by the Internal Revenue Service.
The fund may also be subject to taxes imposed by governments of countries in which it invests. Such taxes are generally based on either income or gains earned or repatriated. The fund accrues and applies such taxes to net investment income, net realized gains and net unrealized gains as income and/or capital gains are earned. In some cases, the fund may be entitled to reclaim all or a portion of such taxes, and such reclaim amounts, if any, are reflected as an asset on the fund’s books. In many cases, however, the fund may not receive such amounts for an extended period of time, depending on the country of investment.
At August 31, 2012, the fund had a capital loss carryover of $71,068,327 available to the extent allowed by the Code to offset future net capital gain, if any. The amounts of the carryovers and the expiration dates are:
| | | |
| | Loss carryover | |
|
| Short-term | Long-term | Total | Expiration |
|
| $519,717 | $— | $519,717 | * |
|
| 70,548,610 | N/A | 70,548,610 | August 31, 2018 |
|
* Under the Regulated Investment Company Modernization Act of 2010, the fund will be permitted to carry forward capital losses incurred in taxable years beginning after December 22, 2010 for an unlimited period. However, any losses incurred will be required to be utilized prior to the losses incurred in pre-enactment tax years. As a result of this ordering rule, pre-enactment capital loss carryforwards may be more likely to expire unused. Additionally, post-enactment capital losses that are carried forward will retain their character as either short-term or long-term capital losses rather than being considered all short-term as under previous law.
Pursuant to federal income tax regulations applicable to regulated investment companies, the fund has elected to defer certain capital losses of $26,651,615 recognized during the period between November 1, 2011 and August 31, 2012 to its fiscal year ending August 31, 2013.
|
| 34 Global Natural Resources Fund |
The aggregate identified cost on a tax basis is $302,355,834, resulting in gross unrealized appreciation and depreciation of $23,439,512 and $18,147,444, respectively, or net unrealized appreciation of $5,292,068.
Distributions to shareholders Distributions to shareholders from net investment income are recorded by the fund on the ex-dividend date. Distributions from capital gains, if any, are recorded on the ex-dividend date and paid at least annually. The amount and character of income and gains to be distributed are determined in accordance with income tax regulations, which may differ from generally accepted accounting principles. Dividend sources are estimated at the time of declaration. Actual results may vary. Any non-taxable return of capital cannot be determined until final tax calculations are completed after the end of the fund’s fiscal year. Reclassifications are made to the fund’s capital accounts to reflect income and gains available for distribution (or available capital loss carryovers) under income tax regulations.
Note 2: Management fee, administrative services and other transactions
The fund pays Putnam Management a management fee (based on the fund’s average net assets and computed and paid monthly) at annual rates that may vary based on the average of the aggregate net assets of most open-end funds, as defined in the fund’s management contract, sponsored by Putnam Management. Such annual rates may vary as follows:
| | | | |
| 0.780% | of the first $5 billion, | | 0.580% | of the next $50 billion, |
| |
|
| 0.730% | of the next $5 billion, | | 0.560% | of the next $50 billion, |
| |
|
| 0.680% | of the next $10 billion, | | 0.550% | of the next $100 billion and |
| |
|
| 0.630% | of the next $10 billion, | | 0.545% | of any excess thereafter. |
| |
|
Putnam Management has contractually agreed, through June 30, 2013, to waive fees or reimburse the fund’s expenses to the extent necessary to limit the cumulative expenses of the fund, exclusive of brokerage, interest, taxes, investment-related expenses, extraordinary expenses, acquired fund fees and expenses and payments under the fund’s investor servicing contract, investment management contract and distribution plans, on a fiscal year-to-date basis to an annual rate of 0.20% of the fund’s average net assets over such fiscal year-to-date period. During the reporting period, the fund’s expenses were not reduced as a result of this limit.
Putnam Investments Limited (PIL), an affiliate of Putnam Management, is authorized by the Trustees to manage a separate portion of the assets of the fund as determined by Putnam Management from time to time. Putnam Management pays a quarterly sub-management fee to PIL for its services at an annual rate of 0.35% of the average net assets of the portion of the fund managed by PIL.
The Putnam Advisory Company, LLC (PAC), an affiliate of Putnam Management, is authorized by the Trustees to manage a separate portion of the assets of the fund, as designated from time to time by Putnam Management or PIL. Putnam Management or PIL, as applicable, pays a quarterly sub-advisory fee to PAC for its services at the annual rate of 0.35% of the average net assets of the portion of the fund’s assets for which PAC is engaged as sub-adviser.
The fund reimburses Putnam Management an allocated amount for the compensation and related expenses of certain officers of the fund and their staff who provide administrative services to the fund. The aggregate amount of all such reimbursements is determined annually by the Trustees.
Custodial functions for the fund’s assets are provided by State Street. Custody fees are based on the fund’s asset level, the number of its security holdings and transaction volumes.
Putnam Investor Services, Inc., an affiliate of Putnam Management, provides investor servicing agent functions to the fund. Putnam Investor Services, Inc. received fees for investor servicing based on the fund’s retail asset level, the number of shareholder accounts in the fund and the level of defined contribution plan assets in the fund. Investor servicing fees will not exceed an annual rate of 0.32% of the fund’s average net assets. During the reporting period, the expenses for each class of shares related to investor servicing fees were as follows:
| | | | |
| Class A | $376,599 | | Class R | 20,234 |
| |
|
| Class B | 21,532 | | Class Y | 14,874 |
| |
|
| Class C | 19,479 | | Total | $459,644 |
| |
|
| Class M | 6,926 | | | |
| | |
|
| Global Natural Resources Fund 35 |
The fund has entered into expense offset arrangements with Putnam Investor Services, Inc. and State Street whereby Putnam Investor Services, Inc.’s and State Street’s fees are reduced by credits allowed on cash balances. The fund also reduced expenses through brokerage/service arrangements. For the reporting period, the fund’s expenses were reduced by $360 under the expense offset arrangements and by $14,049 under thebrokerage/service arrangements.
Each independent Trustee of the fund receives an annual Trustee fee, of which $241, as a quarterly retainer, has been allocated to the fund, and an additional fee for each Trustees meeting attended. Trustees also are reimbursed for expenses they incur relating to their services as Trustees.
The fund has adopted a Trustee Fee Deferral Plan (the Deferral Plan) which allows the Trustees to defer the receipt of all or a portion of Trustees fees payable on or after July 1, 1995. The deferred fees remain invested in certain Putnam funds until distribution in accordance with the Deferral Plan.
The fund has adopted an unfunded noncontributory defined benefit pension plan (the Pension Plan) covering all Trustees of the fund who have served as a Trustee for at least five years and were first elected prior to 2004. Benefits under the Pension Plan are equal to 50% of the Trustee’s average annual attendance and retainer fees for the three years ended December 31, 2005. The retirement benefit is payable during a Trustee’s lifetime, beginning the year following retirement, for the number of years of service through December 31, 2006. Pension expense for the fund is included in Trustee compensation and expenses in the Statement of operations. Accrued pension liability is included in Payable for Trustee compensation and expenses in the Statement of assets and liabilities. The Trustees have terminated the Pension Plan with respect to any Trustee first elected after 2003.
The fund has adopted distribution plans (the Plans) with respect to its class A, class B, class C, class M and class R shares pursuant to Rule 12b–1 under the Investment Company Act of 1940. The purpose of the Plans is to compensate Putnam Retail Management Limited Partnership, an indirect wholly-owned subsidiary of Putnam Investments, LLC, for services provided and expenses incurred in distributing shares of the fund. The Plans provide for payments by the fund to Putnam Retail Management Limited Partnership at an annual rate of up to 0.35%, 1.00%, 1.00%, 1.00% and 1.00% of the average net assets attributable to class A, class B, class C, class M and class R shares, respectively. The Trustees have approved payment by the fund at an annual rate of 0.25%, 1.00%, 1.00%, 0.75% and 0.50% of the average net assets attributable to class A, class B, class C, class M and class R shares, respectively. During the reporting period, the class specific expenses related to distribution fees were as follows:
| | | | |
| Class A | $324,184 | | Class M | 17,916 |
| |
|
| Class B | 74,232 | | Class R | 34,817 |
| |
|
| Class C | 67,106 | | Total | $518,255 |
| |
|
For the reporting period, Putnam Retail Management Limited Partnership, acting as underwriter, received net commissions of $13,201 and $168 from the sale of class A and class M shares, respectively, and received $4,081 and $57 in contingent deferred sales charges from redemptions of class B and class C shares, respectively.
A deferred sales charge of up to 1.00% and 0.65% is assessed on certain redemptions of class A and class M shares, respectively. For the reporting period, Putnam Retail Management Limited Partnership, acting as underwriter, received $143 and no monies on class A and class M redemptions, respectively.
Note 3: Purchases and sales of securities
During the reporting period, cost of purchases and proceeds from sales of investment securities other than short-term investments aggregated $145,497,676 and $168,188,374, respectively. There were no purchases or proceeds from sales of long-term U.S. government securities.
|
| 36 Global Natural Resources Fund |
Written option transactions during the reporting period are summarized as follows:
| | |
| | Written equity option | Written equity |
| | contract amounts | option premiums |
|
| Written options outstanding at the | | |
| beginning of the reporting period | — | $— |
|
| Options opened | 485,180 | 43,658 |
| Options exercised | — | — |
| Options expired | — | — |
| Options closed | (242,188) | (24,219) |
|
| Written options outstanding at the | | |
| end of the reporting period | 242,992 | $19,439 |
|
Note 4: Capital shares
At the close of the reporting period, there was an unlimited number of shares of beneficial interest authorized. Transactions in capital shares were as follows:
| | | | |
| | Six months ended 2/28/13 | Year ended 8/31/12 |
|
| Class A | Shares | Amount | Shares | Amount |
|
| Shares sold | 424,410 | $8,553,442 | 1,074,480 | $21,053,603 |
|
| Shares issued in connection with | | | | |
| reinvestment of distributions | 102,422 | 2,031,024 | 410,386 | 7,698,843 |
|
| | 526,832 | 10,584,466 | 1,484,866 | 28,752,446 |
|
| Shares repurchased | (1,661,516) | (33,118,434) | (3,267,327) | (63,084,064) |
|
| Net decrease | (1,134,684) | $(22,533,968) | (1,782,461) | $(34,331,618) |
|
| |
| | Six months ended 2/28/13 | Year ended 8/31/12 |
|
| Class B | Shares | Amount | Shares | Amount |
|
| Shares sold | 45,547 | $813,035 | 100,613 | $1,743,636 |
|
| Shares issued in connection with | | | | |
| reinvestment of distributions | 800 | 14,217 | 23,545 | 395,796 |
|
| | 46,347 | 827,252 | 124,158 | 2,139,432 |
|
| Shares repurchased | (154,053) | (2,729,527) | (353,282) | (6,191,623) |
|
| Net decrease | (107,706) | $(1,902,275) | (229,124) | $(4,052,191) |
|
| |
| | Six months ended 2/28/13 | Year ended 8/31/12 |
|
| Class C | Shares | Amount | Shares | Amount |
|
| Shares sold | 27,219 | $493,925 | 94,306 | $1,681,237 |
|
| Shares issued in connection with | | | | |
| reinvestment of distributions | 888 | 16,117 | 17,594 | 302,267 |
|
| | 28,107 | 510,042 | 111,900 | 1,983,504 |
|
| Shares repurchased | (106,066) | (1,928,826) | (220,612) | (3,855,893) |
|
| Net decrease | (77,959) | $(1,418,784) | (108,712) | $(1,872,389) |
|
| |
| Global Natural Resources Fund | 37 |
| | | | |
| | Six months ended 2/28/13 | Year ended 8/31/12 |
|
| Class M | Shares | Amount | Shares | Amount |
|
| Shares sold | 5,568 | $104,936 | 23,328 | $426,955 |
|
| Shares issued in connection with | | | | |
| reinvestment of distributions | 787 | 14,866 | 7,514 | 134,284 |
|
| | 6,355 | 119,802 | 30,842 | 561,239 |
|
| Shares repurchased | (42,515) | (808,072) | (71,537) | (1,304,773) |
|
| Net decrease | (36,160) | $(688,270) | (40,695) | $(743,534) |
|
| |
| | Six months ended 2/28/13 | Year ended 8/31/12 |
|
| Class R | Shares | Amount | Shares | Amount |
|
| Shares sold | 111,029 | $2,172,159 | 269,810 | $5,134,098 |
|
| Shares issued in connection with | | | | |
| reinvestment of distributions | 4,161 | 81,008 | 21,812 | 402,004 |
|
| | 115,190 | 2,253,167 | 291,622 | 5,536,102 |
|
| Shares repurchased | (149,575) | (2,928,449) | (387,216) | (7,413,233) |
|
| Net decrease | (34,385) | $(675,282) | (95,594) | $(1,877,131) |
|
| |
| | Six months ended 2/28/13 | Year ended 8/31/12 |
|
| Class Y | Shares | Amount | Shares | Amount |
|
| Shares sold | 88,012 | $1,761,766 | 61,110 | $1,208,361 |
|
| Shares issued in connection with | | | | |
| reinvestment of distributions | 5,454 | 108,639 | 16,962 | 319,910 |
|
| | 93,466 | 1,870,405 | 78,072 | 1,528,271 |
|
| Shares repurchased | (85,655) | (1,724,910) | (124,135) | (2,455,453) |
|
| Net increase (decrease) | 7,811 | $145,495 | (46,063) | $(927,182) |
|
Note 5: Summary of derivative activity
The average volume of activity for the reporting period for any derivative type that was held during the period is listed below and was as follows:
| |
| Purchased equity option contracts (number of contracts) | 210,000 |
|
| Written equity option contracts (number of contracts) | 210,000 |
|
| Forward currency contracts (contract amount) | $162,400,000 |
|
The following is a summary of the market values of derivative instruments as of the close of the reporting period:
Market values of derivative instruments as of the close of the reporting period
| | | | |
| | Asset derivatives | Liability derivatives |
|
| Derivatives not | | | | |
| accounted for as | Statement of | | Statement of | |
| hedging instruments | assets and | | assets and | |
| under ASC 815 | liabilities location | Market value | liabilities location | Market value |
|
| Foreign exchange | | | | |
| contracts | Receivables | $1,652,366 | Payables | $2,106,018 |
|
| Equity contracts | Investments | 69,422 | Payables | 1,641 |
|
| Total | | $1,721,788 | | $2,107,659 |
|
|
| 38 Global Natural Resources Fund |
The following is a summary of realized and change in unrealized gains or losses of derivative instruments on the Statement of operations for the reporting period (see Note 1):
Amount of realized gain or (loss) on derivatives recognized in net gain or (loss) on investments
| | | |
| Derivatives not accounted for as hedging | | Forward currency | |
| instruments under ASC 815 | Options | contracts | Total |
|
| Foreign exchange contracts | $— | $(1,216,906) | $(1,216,906) |
|
| Equity contracts | 859,767 | — | 859,767 |
|
| Total | $859,767 | $(1,216,906) | $(357,139) |
|
Change in unrealized appreciation or (depreciation) on derivatives recognized in net gain or (loss) on investments
| | | |
| Derivatives not accounted for as hedging | | Forward currency | |
| instruments under ASC 815 | Options | contracts | Total |
|
| Foreign exchange contracts | $ — | $(403,755) | $(403,755) |
|
| Equity contracts | (95,024) | — | (95,024) |
|
| Total | $(95,024) | $(403,755) | $(498,779) |
|
Note 6: Transactions with affiliated issuers
Transactions during the reporting period with a company which is under common ownership or control, or with companies in which the fund owned at least 5% of the voting securities, were as follows:
| | | | | |
| | Market value at | | | | Market value |
| | the beginning | | | | at the end of |
| | of the reporting | | | Investment | the reporting |
| Name of affiliates | period | Purchase cost | Sale proceeds | income | period |
|
| Putnam Money Market | | | | | |
| Liquidity Fund* | $6,486,362 | $47,373,434 | $53,859,796 | $1,494 | $— |
|
| Putnam Short Term | | | | | |
| Investment Fund* | — | 1,517,938 | 1,052,979 | 8 | 464,959 |
|
| Totals | $6,486,362 | $48,891,372 | $54,912,775 | $1,502 | $464,959 |
|
* Management fees charged to Putnam Money Market Liquidity Fund and Putnam Short Term Investment Fund have been waived by Putnam Management.
Note 7: Market, credit and other risks
In the normal course of business, the fund trades financial instruments and enters into financial transactions where risk of potential loss exists due to changes in the market (market risk) or failure of the contracting party to the transaction to perform (credit risk). The fund may be exposed to additional credit risk that an institution or other entity with which the fund has unsettled or open transactions will default. Investments in foreign securities involve certain risks, including those related to economic instability, unfavorable political developments, and currency fluctuations. The fund concentrates its investments in one sector, which involves more risk than a fund that invests more broadly.
Note 8: New accounting pronouncement
In December 2011, the FASB issued ASU No. 2011–11 “Disclosures about Offsetting Assets and Liabilities”. The update creates new disclosure requirements requiring entities to disclose both gross and net information for derivatives and other financial instruments that are either offset in the Statement of assets and liabilities or subject to an enforceable master netting arrangement or similar agreement. The disclosure requirements are effective for annual reporting periods beginning on or after January 1, 2013 and interim periods within those annual periods. Putnam Management is currently evaluating the application of ASU 2011–11 and its impact, if any, on the fund’s financial statements.
|
| Global Natural Resources Fund 39 |
The Putnam family of funds
The following is a list of Putnam’s open-end mutual funds offered to the public. Investors should carefully consider the investment objective, risks, charges, and expenses of a fund before investing. For a prospectus, or a summary prospectus if available, containing this and other information for any Putnam fund or product, call your financial advisor at 1-800-225-1581 and ask for a prospectus. Please read the prospectus carefully before investing.
| |
| Growth | Income |
| Growth Opportunities Fund | American Government Income Fund |
| International Growth Fund | Diversified Income Trust |
| Multi-Cap Growth Fund | Floating Rate Income Fund |
| Small Cap Growth Fund | Global Income Trust |
| Voyager Fund | High Yield Advantage Fund |
| | High Yield Trust |
| Blend | Income Fund |
| Asia Pacific Equity Fund | Money Market Fund* |
| Capital Opportunities Fund | Short Duration Income Fund |
| Capital Spectrum Fund | U.S. Government Income Trust |
| Emerging Markets Equity Fund | |
| Equity Spectrum Fund | Tax-free income |
| Europe Equity Fund | AMT-Free Municipal Fund |
| Global Equity Fund | Tax Exempt Income Fund |
| International Capital Opportunities Fund | Tax Exempt Money Market Fund* |
| International Equity Fund | Tax-Free High Yield Fund |
| Investors Fund | |
| Multi-Cap Core Fund | State tax-free income funds: |
| Research Fund | Arizona, California, Massachusetts, Michigan, |
| | Minnesota, New Jersey, New York, Ohio, |
| Value | and Pennsylvania. |
| Convertible Securities Fund | |
| Equity Income Fund | Absolute Return |
| George Putnam Balanced Fund | Absolute Return 100 Fund® |
| The Putnam Fund for Growth and Income | Absolute Return 300 Fund® |
| International Value Fund | Absolute Return 500 Fund® |
| Multi-Cap Value Fund | Absolute Return 700 Fund® |
| Small Cap Value Fund | |
* An investment in a money market fund is not insured or guaranteed by the Federal Deposit Insurance Corporation or any other government agency. Although the fund seeks to preserve the value of your investment at $1.00 per share, it is possible to lose money by investing in the fund.
|
| 40 Global Natural Resources Fund |
| |
| Global Sector | Putnam RetirementReady® Funds — portfolios |
| Global Consumer Fund | with automatically adjusting allocations to |
| Global Energy Fund | stocks, bonds, and money market instruments, |
| Global Financials Fund | becoming more conservative over time. |
| Global Health Care Fund | |
| Global Industrials Fund | RetirementReady 2055 Fund |
| Global Natural Resources Fund | RetirementReady 2050 Fund |
| Global Sector Fund | RetirementReady 2045 Fund |
| Global Technology Fund | RetirementReady 2040 Fund |
| Global Telecommunications Fund | RetirementReady 2035 Fund |
| Global Utilities Fund | RetirementReady 2030 Fund |
| | RetirementReady 2025 Fund |
| Asset Allocation | RetirementReady 2020 Fund |
| Putnam Global Asset Allocation Funds — | RetirementReady 2015 Fund |
| portfolios with allocations to stocks, bonds, | |
| and money market instruments that are | Putnam Retirement Income Lifestyle |
| adjusted dynamically within specified ranges | Funds — portfolios with managed |
| as market conditions change. | allocations to stocks, bonds, and money |
| | market investments to generate |
| Dynamic Asset Allocation Balanced Fund | retirement income. |
| Dynamic Asset Allocation | |
| Conservative Fund | Retirement Income Fund Lifestyle 1 |
| Dynamic Asset Allocation Growth Fund | Retirement Income Fund Lifestyle 2 |
| Dynamic Risk Allocation Fund | Retirement Income Fund Lifestyle 3 |
| |
A short-term trading fee of 1% may apply to redemptions or exchanges from certain funds within the time period specified in the fund's prospectus.
Check your account balances and the most recent month-end performance in the Individual Investors section at putnam.com.
| |
| Global Natural Resources Fund | 41 |
Services for shareholders
Investor services
Systematic investment plan Tell us how much you wish to invest regularly — weekly, semimonthly, or monthly — and the amount you choose will be transferred automatically from your checking or savings account. There’s no additional fee for this service, and you can suspend it at any time. This plan may be a great way to save for college expenses or to plan for your retirement.
Please note that regular investing does not guarantee a profit or protect against loss in a declining market. Before arranging a systematic investment plan, consider your financial ability to continue making purchases in periods when prices are low.
Systematic exchange You can make regular transfers from one Putnam fund to another Putnam fund. There are no additional fees for this service, and you can cancel or change your options at any time.
Dividends PLUS You can choose to have the dividend distributions from one of your Putnam funds automatically reinvested in another Putnam fund at no additional charge.
Free exchange privilege You can exchange money between Putnam funds free of charge, as long as they are the same class of shares. A signature guarantee is required if you are exchanging more than $500,000. The fund reserves the right to revise or terminate the exchange privilege.
Reinstatement privilege If you’ve sold Putnam shares or received a check for a dividend or capital gain, you may reinvest the proceeds with Putnam within 90 days of the transaction and they will be reinvested at the fund’s current net asset value — with no sales charge. However, reinstatement of class B shares may have special tax consequences. Ask your financial or tax representative for details.
Check-writing service You have ready access to many Putnam accounts. It’s as simple as writing a check, and there are no special fees or service charges. For more information about the check-writing service, call Putnam or visit our website.
Dollar cost averaging When you’re investing for long-term goals, it’s time, not timing, that counts. Investing on a systematic basis is a better strategy than trying to figure out when the markets will go up or down. This means investing the same amount of money regularly over a long period. This method of investing is called dollar cost averaging. When a fund’s share price declines, your investment dollars buy more shares at lower prices. When it increases, they buy fewer shares. Over time, you will pay a lower average price per share.
For more information
Visit the Individual Investors section at putnam.com A secure section of our website contains complete information on your account, including balances and transactions, updated daily. You may also conduct transactions, such as exchanges, additional investments, and address changes. Log on today to get your password.
Call us toll free at 1-800-225-1581 Ask a helpful Putnam representative or your financial advisor for details about any of these or other services, or see your prospectus.
|
| 42 Global Natural Resources Fund |
Putnam’s commitment to confidentiality
In order to conduct business with our shareholders, we must obtain certain personal information such as account holders’ names, addresses, Social Security numbers, and dates of birth. Using this information, we are able to maintain accurate records of accounts and transactions.
It is our policy to protect the confidentiality of our shareholder information, whether or not a shareholder currently owns shares of our funds. In particular, it is our policy not to sell information about you or your accounts to outside marketing firms. We have safeguards in place designed to prevent unauthorized access to our computer systems and procedures to protect personal information from unauthorized use.
Within the Putnam organization, your information is shared with those who need it to service your account or provide you with information about other Putnam products or services. Under certain circumstances, we must also share account information with outside vendors who provide services to us, such as mailings and proxy solicitations. In these cases, the service providers enter into confidentiality agreements with us, and we provide only the information necessary to process transactions and perform other services related to your account. It is also our policy to share account information with your financial advisor, if you've provided us with information about your advisor and that person is listed on your Putnam account.
If you would like clarification about our confidentiality policies or have any questions or concerns, please don't hesitate to contact us at 1-800-225-1581, Monday through Friday, 8:00 a.m. to 8:00 p.m. Eastern Time.
|
| Global Natural Resources Fund 43 |
Fund information
Founded over 75 years ago, Putnam Investments was built around the concept that a balance between risk and reward is the hallmark of a well-rounded financial program. We manage over 100 funds across income, value, blend, growth, asset allocation, absolute return, and global sector categories.
| | |
| Investment Manager | Trustees | Robert R. Leveille |
| Putnam Investment | Jameson A. Baxter, Chair | Vice President and |
| Management, LLC | Liaquat Ahamed | Chief Compliance Officer |
| One Post Office Square | Ravi Akhoury | |
| Boston, MA 02109 | Barbara M. Baumann | Michael J. Higgins |
| | Charles B. Curtis | Vice President and Treasurer |
| Investment Sub-Manager | Robert J. Darretta | |
| Putnam Investments Limited | Katinka Domotorffy | Janet C. Smith |
| 57–59 St James’s Street | John A. Hill | Vice President, |
| London, England SW1A 1LD | Paul L. Joskow | Principal Accounting Officer, |
| | Elizabeth T. Kennan | and Assistant Treasurer |
| Investment Sub-Advisor | Kenneth R. Leibler | |
| The Putnam Advisory | Robert E. Patterson | Susan G. Malloy |
| Company, LLC | George Putnam, III | Vice President and |
| One Post Office Square | Robert L. Reynolds | Assistant Treasurer |
| Boston, MA 02109 | W. Thomas Stephens | |
| | James P. Pappas |
| Marketing Services | Officers | Vice President |
| Putnam Retail Management | Robert L. Reynolds | |
| One Post Office Square | President | Mark C. Trenchard |
| Boston, MA 02109 | | Vice President and |
| Jonathan S. Horwitz | BSA Compliance Officer |
| Custodian | Executive Vice President, | |
| State Street Bank | Principal Executive Officer, and | Judith Cohen |
| and Trust Company | Compliance Liaison | Vice President, Clerk, and |
| | Associate Treasurer |
| Legal Counsel | Steven D. Krichmar | |
| Ropes & Gray LLP | Vice President and | Nancy E. Florek |
| | Principal Financial Officer | Vice President, Proxy |
| | Manager, Assistant Clerk, and |
| Robert T. Burns | Associate Treasurer |
| | Vice President and | |
| | Chief Legal Officer | |
This report is for the information of shareholders of Putnam Global Natural Resources Fund. It may also be used as sales literature when preceded or accompanied by the current prospectus, the most recent copy of Putnam’s Quarterly Performance Summary, and Putnam’s Quarterly Ranking Summary. For more recent performance, please visit putnam.com. Investors should carefully consider the investment objectives, risks, charges, and expenses of a fund, which are described in its prospectus. For this and other information or to request a prospectus or summary prospectus, call 1-800-225-1581 toll free. Please read the prospectus carefully before investing. The fund’s Statement of Additional Information contains additional information about the fund’s Trustees and is available without charge upon request by calling 1-800-225-1581.
|
| 44 Global Natural Resources Fund |
| |
| Item 3. Audit Committee Financial Expert: |
| |
| Item 4. Principal Accountant Fees and Services: |
| |
| Item 5. Audit Committee of Listed Registrants |
| |
| Item 6. Schedule of Investments: |
| |
| The registrant’s schedule of investments in unaffiliated issuers is included in the report to shareholders in Item 1 above. |
| |
| Item 7. Disclosure of Proxy Voting Policies and Procedures For Closed-End Management Investment Companies: |
| |
| Item 8. Portfolio Managers of Closed-End Investment Companies |
| |
| Item 9. Purchases of Equity Securities by Closed-End Management Investment Companies and Affiliated Purchasers: |
| |
| Item 10. Submission of Matters to a Vote of Security Holders: |
| |
| Item 11. Controls and Procedures: |
| |
| (a) The registrant’s principal executive officer and principal financial officer have concluded, based on their evaluation of the effectiveness of the design and operation of the registrant’s disclosure controls and procedures as of a date within 90 days of the filing date of this report, that the design and operation of such procedures are generally effective to provide reasonable assurance that information required to be disclosed by the registrant in this report is recorded, processed, summarized and reported within the time periods specified in the Commission’s rules and forms. |
| |
| (b) Changes in internal control over financial reporting: Not applicable |
| |
| (a)(2) Separate certifications for the principal executive officer and principal financial officer of the registrant as required by Rule 30a-2(a) under the Investment Company Act of 1940, as amended, are filed herewith. |
| |
| (b) The certifications required by Rule 30a-2(b) under the Investment Company Act of 1940, as amended, are filed herewith. |
| |
| Putnam Global Natural Resources Fund |
| |
| By (Signature and Title): |
| |
| /s/Janet C. Smith
Janet C. Smith
Principal Accounting Officer
|
| |
| Pursuant to the requirements of the Securities Exchange Act of 1934 and the Investment Company Act of 1940, this report has been signed below by the following persons on behalf of the registrant and in the capacities and on the dates indicated. |
| |
| By (Signature and Title): |
| |
| /s/Jonathan S. Horwitz
Jonathan S. Horwitz
Principal Executive Officer
|
| |
| By (Signature and Title): |
| |
| /s/Steven D. Krichmar
Steven D. Krichmar
Principal Financial Officer
|