CERTIFIED SHAREHOLDER REPORT OF REGISTERED MANAGEMENT INVESTMENT COMPANIES
Investment Company Act file number:
(811-03061)
Exact name of registrant as specified in charter:
Putnam Global Natural Resources Fund
Address of principal executive offices:
One Post Office Square, Boston, Massachusetts 02109
Name and address of agent for service:
Robert T. Burns, Vice President One Post Office Square Boston, Massachusetts 02109
Copy to:
Bryan Chegwidden, Esq. Ropes & Gray LLP 1211 Avenue of the Americas New York, New York 10036
Registrant’s telephone number, including area code:
(617) 292-1000
Date of fiscal year end:
August 31, 2015
Date of reporting period:
September 1, 2014 – February 28, 2015
Item 1. Report to Stockholders:
The following is a copy of the report transmitted to stockholders pursuant to Rule 30e-1 under the Investment Company Act of 1940:
Putnam Global Natural Resources Fund
Semiannual report 2 | 28 | 15
Message from the Trustees
1
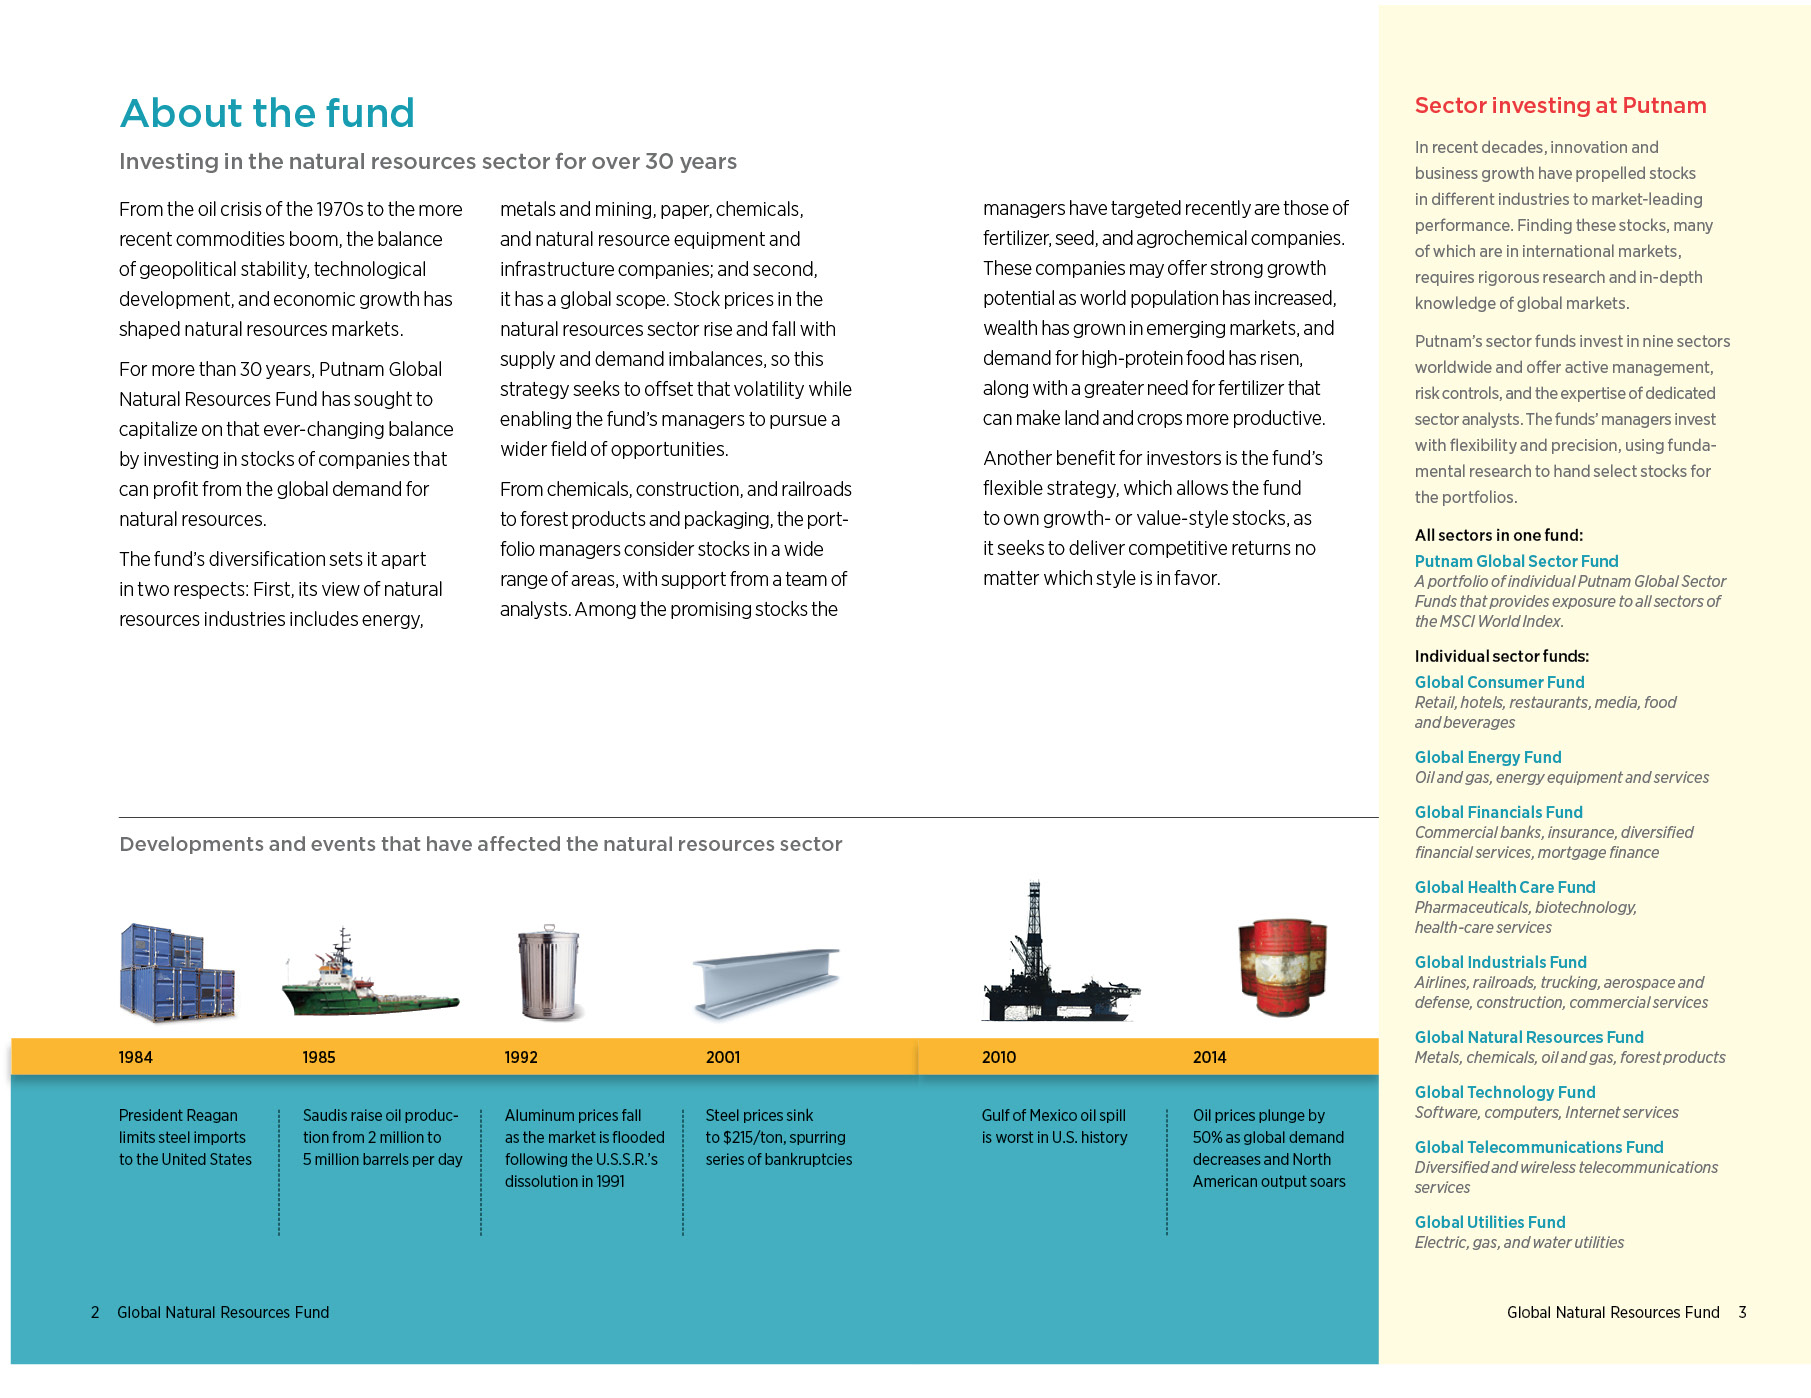
About the fund
2
Performance snapshot
4
Interview with your fund’s portfolio managers
5
Your fund’s performance
11
Your fund’s expenses
13
Terms and definitions
15
Other information for shareholders
16
Financial statements
17
Consider these risks before investing: International investing involves currency, economic, and political risks. Emerging-market securities carry illiquidity and volatility risks. Investments in small and/or midsize companies increase the risk of greater price fluctuations. The energy and other natural resources industries may be affected by changes in crude oil prices and changes in governmental regulatory policies. The fund concentrates on a limited group of industries and is non-diversified. Because the fund may invest in fewer issuers, it is vulnerable to common economic forces and may result in greater losses and volatility. Growth stocks may be more susceptible to earnings disappointments, and value stocks may fail to rebound. The use of short selling may result in losses if the securities appreciate in value. Risks associated with derivatives include increased investment exposure (which may be considered leverage) and, in the case of over-the-counter instruments, the potential inability to terminate or sell derivatives positions and the potential failure of the other party to the instrument to meet its obligations. Stock prices may fall or fail to rise over time for several reasons, including general financial market conditions and factors related to a specific issuer or industry. You can lose money by investing in the fund.
Message from the Trustees
Dear Fellow Shareholder:
Conditions for investors in early 2015 offer reasons for both optimism and a degree of caution. After losing ground at the start of the year, many stock markets around the world have delivered positive results, but not without some volatility. Markets in the United States, Europe, and Japan have hit record or multiyear highs. An improving U.S. economy, global economic data, and the accommodative policies of several central banks provide sources of confidence.
The European Central Bank’s asset-purchase program, begun in early March, seeks to stimulate growth and combat the eurozone’s deflation risk. Investors have responded by sending European equities to record highs. Meanwhile, the U.S. Federal Reserve has stated that it will be patient in raising interest rates, while also acknowledging the nation’s strengthening economic recovery.
In the United States, the unemployment rate has dropped, while the nation’s gross domestic product has expanded for three consecutive quarters. Europe’s gross domestic product expanded by 0.3% in the fourth quarter of 2014 from the third quarter, and a weaker euro has boosted the competitiveness of the region.
In today’s environment, investors should consider a range of investment opportunities. An example would be Putnam’s new ways of thinking, which integrate innovative investment ideas into time-tested, traditional strategies. Our experienced equity and fixed-income teams invest across many asset classes and pursue flexible strategies that seek out opportunities for growth or income while being mindful of risk. We also believe that it is important to rely on the counsel of your financial advisor, who can help your portfolio match your individual goals and tolerance for risk.
As always, thank you for investing with Putnam.
Respectfully yours,
Robert L. Reynolds President and Chief Executive Officer Putnam Investments
Jameson A. Baxter Chair, Board of Trustees
April 7, 2015
Performance snapshot
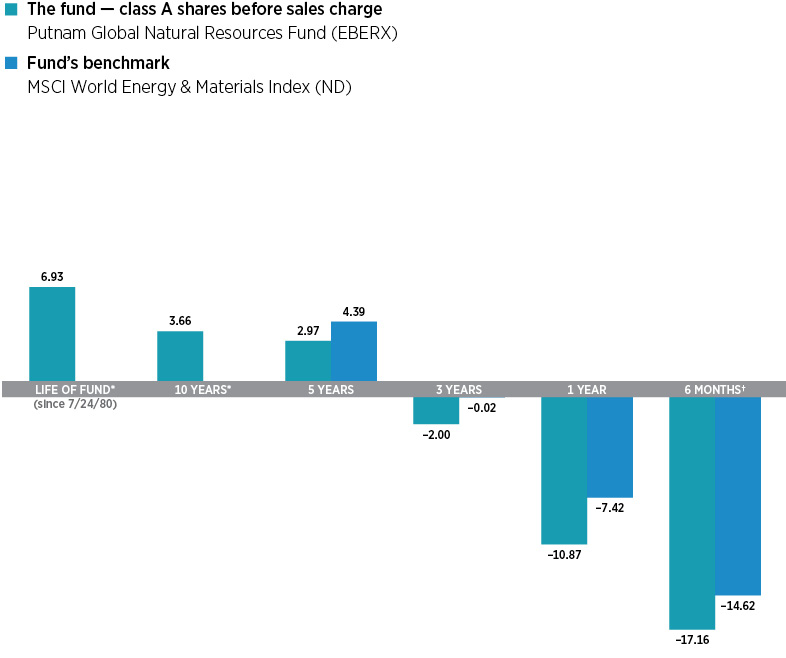
Annualized total return (%) comparison as of 2/28/15
Current performance may be lower or higher than the quoted past performance, which cannot guarantee future results. Share price, principal value, and return will fluctuate, and you may have a gain or a loss when you sell your shares. Performance of class A shares assumes reinvestment of distributions and does not account for taxes. Fund returns in the bar chart do not reflect a sales charge of 5.75%; had they, returns would have been lower. See pages 5 and 11–13 for additional performance information. For a portion of the periods, the fund had expense limitations, without which returns would have been lower. To obtain the most recent month-end performance, visit putnam.com.
*The fund’s benchmark, the MSCI World Energy & Materials Index (ND), was introduced on 6/1/05, which post-dates the inception of the fund’s class A shares.
†Returns for the six-month period are not annualized, but cumulative.
4 Global Natural Resources Fund
Interview with your fund’s portfolio managers
Christopher J. Eitzmann
Ryan W. Kauppila
How was the market environment during the six-month reporting period ending February 28, 2015, and how did the fund perform?
Chris: The environment was positive for overall economic growth, but challenging for the natural resources sector during the period. U.S. economic data continued to be generally supportive, propelling the S&P 500 Index to record highs, while the expectation of quantitative easing in Europe also led many key European equity indexes to all-time high levels. The strength of the U.S. dollar provided a boost to the economic outlooks of many economies outside the United States.
The natural resources sector, however, was challenged as crude oil went into modest oversupply when the Organization of Petroleum Exporting Countries [OPEC] chose not to cut production, which would have balanced the market. During the period, the price of crude fell nearly 50%. Lower energy prices, coupled with oversupply in industrial metals, caused most commodities to trade at 52-week lows during the period.
In this environment, Putnam Global Natural Resources Fund returned –17.16%. The return of its benchmark, the MSCI World Energy & Materials Index, was –14.62%.
What trends took place in the sector during the period?
Ryan:Rising inventories of oil from North American shale production, OPEC’s decision
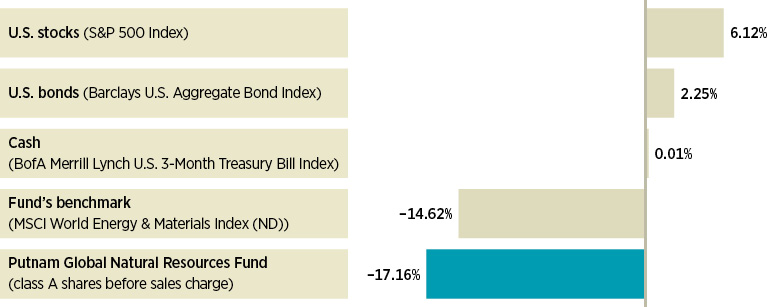
Broad market index and fund performance
This comparison shows your fund’s performance in the context of broad market indexes for the six months ended 2/28/15. See pages 4 and 11–13 for additional fund performance information. Index descriptions can be found on page 15.
Global Natural Resources Fund 5
to hold production flat, and the subsequent oil price decline were the dominant sector trends, with the per-barrel price of West Texas Intermediary [WTI] crude falling by 49% during the period. The combination of accelerating onshore U.S. shale production and weaker demand in China and Europe saw non-OPEC oil supply outstrip global demand by one million barrels per day in 2014.
The decision by OPEC at its November 2014 meeting to maintain production levels accelerated oil’s decline, as rising inventories drove down the price of the commodity. In response, oil producers dramatically curtailed capital spending plans, with the U.S. onshore rig count declining 40% since November and major oil companies announcing significant cuts to exploration and other discretionary spending for 2015. We believe this will likely result in a modest recovery in both capital spending and oil prices in 2016 and 2017.
Chris:In materials, individual stock selection was more important than any overall trend. As mentioned, the economic environment was generally supportive to bolster demand across the sector.
That said, lower energy prices led to lower costs of raw material prices expanding the margins in the short term. Higher-cost commodity chemical producers in Europe and Asia were suddenly seeing positive margins for the first time in years, while U.S. producers experienced lower profits. Many specialty chemical and packaging companies, however, saw their profits increase as they demonstrated pricing power above raw material price fluctuations.
Could you discuss strategies, sectors, or holdings that helped fund performance?
Ryan:We had positive performance from holdings in paper and packaging, specialty chemicals, and utilities. Each of these
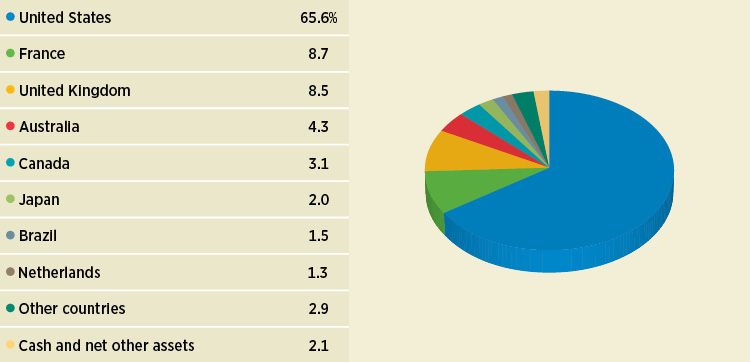
Global composition
Allocations are shown as a percentage of the fund’s net assets as of 2/28/15. Cash and net other assets, if any, represent the market value weights of cash, derivatives, short-term securities, and other unclassified assets in the portfolio. Summary information may differ from the information in the portfolio schedule notes included in the financial statements due to the inclusion of derivative securities, any interest accruals, and the exclusion of as-of trades, if any. Holdings and allocations may vary over time.
6 Global Natural Resources Fund
“We increased the fund’s underweight to energy in the early part of the period.”
Chris Eitzmann
subsectors was relatively immune to the volatility in energy and benefited from the overall positive economic environment.
Chris:Of the three top contributors to performance, two were holdings that have been in the fund for several years and one was a new position we acquired during the period. MeadWestvaco is a packaging company we have held since 2012. We believe its stock trades at an attractive valuation and has strong upside growth potential. Our thesis on MeadWestvaco was two-fold — first, the corporate cost structure could be significantly improved, resulting in higher profitability, and second, significant value could be created by spinning off its non-core assets to shareholders in a tax-free manner. During the period, MeadWestvaco announced plans to spin off or sell its specialty chemicals business and also announced major cost-cutting initiatives that resulted in an effective takeover by RockTenn.
Sealed Air, a plastics packaging company that the fund has held for many years, also was a top contributor. The company is undergoing a multiyear turnaround in its approach to both management of the business and the pricing of its products. As its product pricing improved and oil-based raw material costs fell, operating leverage aided financial deleveraging, resulting in upgrades to consensus earnings estimates.
The top contributor to performance was an initial public offering [IPO] of Axalta Coating Systems, a company we have followed for years. A business unit of DuPont, the chemical conglomerate, Axalta was acquired by Carlyle Group in 2012 and held its IPO in November 2014. The company has
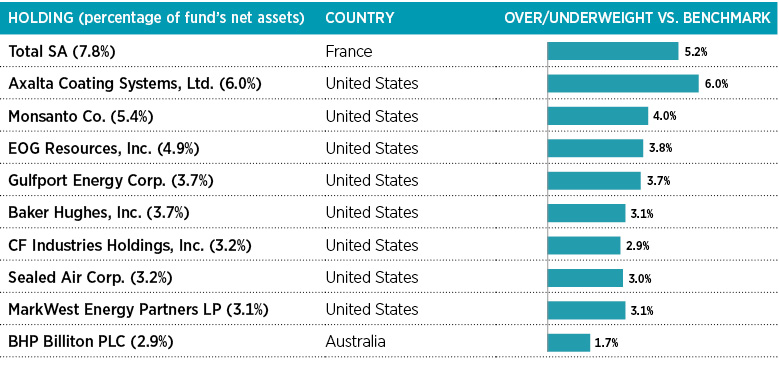
Top 10 holdings
This table shows the fund’s top 10 holdings by percentage of the fund’s net assets as of 2/28/15. Short-term investments and derivatives, if any, are excluded. Holdings will vary over time.
Global Natural Resources Fund 7
undergone significant management changes, major cost-cutting initiatives, and repositioning for growth. In addition, Axalta is a beneficiary of lower oil-based raw material costs because of its through-cycle pricing power. Axalta remained in the portfolio at the end of the period, and we continue to see upside potential with the stock.
What were some holdings that detracted from fund performance?
Ryan:Our three largest detractors were U.S. onshore crude shale producers whose growth was slowed by weakening demand for U.S. exploration and production activity.
QEP Resources, a producer in the Bakken and Permian shale fields, was the top detractor. Despite QEP following through on a commitment to divest non-core assets to repair its balance sheet, the fall in crude prices led to a decline in its profits. QEP was no longer in the portfolio at the close of the period.
Kodiak Oil & Gas was also a top detractor. The company recently merged with Whiting Petroleum, which left leverage relatively high in a lower crude price environment. We believe that the quality of the company’s assets remains high, and that its assets have strategic value compared with larger and better-capitalized producers. But the severity of the fall in crude prices, coupled with its high financial leverage, led to a substantial decline in the Kodiak’s share price.
EP Energy, a U.S. shale producer with assets in the Eagle Ford Shale and Permian Basin, also held back performance. Despite EP Energy’s substantial hedging through 2016, the market overlooked the hedges and imminent balance sheet improvement, in our opinion. Instead, investor focus during the period was on the company’s high financial leverage if oil prices do not recover by 2017.
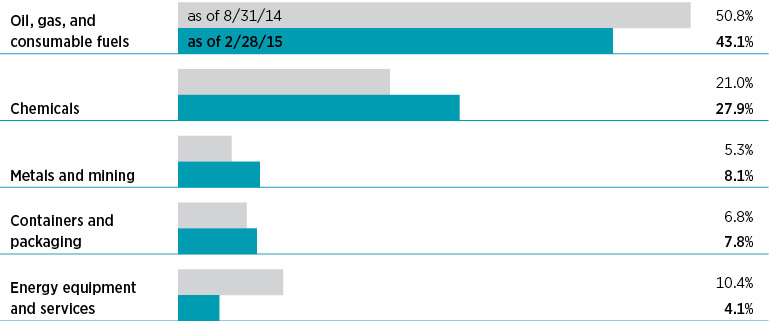
Comparison of top industry weightings
This chart shows how the fund’s top weightings have changed over the past six months. Allocations are shown as a percentage of the fund’s net assets. Current period summary information may differ from the portfolio schedule included in the financial statements due to the inclusion of derivative securities, any interest accruals, the exclusion of as-of trades, if any, and the use of different classifications of securities for presentation purposes. Holdings and allocations may vary over time.
8 Global Natural Resources Fund
What role did derivatives play during the period?
Chris: Forward currency contracts, which were used to hedge foreign exchange risk and to help protect the fund from adverse movements in exchange rates, had a negative impact on fund performance during the period.
Did you make any shifts in strategy during the period?
Chris:We made a number of significant shifts early in the period. It became apparent to us that in the face of weaker Chinese demand and without a supply response from OPEC, crude prices would likely fall, potentially significantly. While the pace and the severity of oil’s decline were a bit surprising, we increased our underweight to energy in the early part of the period. We also significantly reduced our investments in U.S. chemical producers.
We remain focused on our process of fundamental stock picking and identifying multiple ways to win on any investment where we choose to allocate capital. We believe the current environment provides ample opportunities for this investment process.
What is your outlook for the sector and the economy?
Chris:In the energy sector, the response to lower prices as measured by the fall in the U.S. oil-rig count has occurred at a faster pace than during prior downturns. In our view, fewer rigs, combined with high decline rates in shale oil wells, should see U.S. production growth slow and likely begin to fall by the second half of 2015.
We believe slower non-OPEC production growth and stable OPEC production, combined with expected global oil demand growth of one million barrels per day, should bring the oil market back into balance by the end of 2015. Without a reacceleration in oil supply, we believe markets would be in deficit in 2016. Even accounting for the impact of likely industry cost inflation and improved efficiency on new wells, we believe oil prices will need to increase from current levels to bring on the additional necessary supply.
In the interim, we believe the U.S. shale industry should be a focus of merger-and-acquisition activity.
For the overall economy, we remain concerned about the pace of China’s economic growth and the spillover into other emerging markets. This view continues to be the driving force behind our significant underweight in metals and mining. We are optimistic about the prospect for a gradual European recovery and hopeful that a continued recovery of the U.S. housing and non-residential construction markets can provide the growth needed for the final leg of the business cycle.
Thank you, Chris and Ryan, for bringing us up to date.
The views expressed in this report are exclusively those of Putnam Management and are subject to change. They are not meant as investment advice.
Please note that the holdings discussed in this report may not have been held by the fund for the entire period. Portfolio composition is subject to review in accordance with the fund’s investment strategy and may vary in the future. Current and future portfolio holdings are subject to risk.
Portfolio Manager Christopher J. Eitzmann has an M.B.A. from the Tuck School of Business at Dartmouth College and an A.B. from Harvard University. He joined Putnam in 2012 and has been in the investment industry since 2003.
Global Natural Resources Fund 9
Portfolio Manager Ryan W. Kauppila has an M.B.A. from Harvard Business School at Harvard University and an A.B. in Economics from Harvard College. He joined Putnam in 2014 and has been in the investment industry since 2000.
IN THE NEWS
The U.S. dollar showed continued strength in early March — climbing to a nearly 12-year high against the euro. A strengthening greenback supports consumer spending, with expected gains in the U.S. retail and travel sectors. At the same time, U.S.-based companies with global operations, such as those in pharmaceuticals and consumer electronics, may start earning less from international sales. German industrials, on the other hand, have taken advantage of a 17% decline in the euro in an effort to make prices more competitive. In 2014, sales from German manufacturers rose 11% in China and 6.5% in the United States, according to Germany’s federal statistical office Destatis. For 2015, the German machine tool industry expects another 3% boost in total production output. However, many countries in the 19-nation eurozone continue to cope with stagnation and high unemployment rates, which are up to 25% in Greece and Spain. To combat deflation, the European Central Bank implemented a €60 billion per-month bond repurchase program, which began in early March. However, these quantitative easing policies are likely to sustain currency weakness in many European economies.
10 Global Natural Resources Fund
Your fund’s performance
This section shows your fund’s performance, price, and distribution information for periods ended February 28, 2015, the end of the first half of its current fiscal year. In accordance with regulatory requirements for mutual funds, we also include performance information as of the most recent calendar quarter-end and expense information taken from the fund’s current prospectus. Performance should always be considered in light of a fund’s investment strategy. Data represent past performance. Past performance does not guarantee future results. More recent returns may be less or more than those shown. Investment return and principal value will fluctuate, and you may have a gain or a loss when you sell your shares. Performance information does not reflect any deduction for taxes a shareholder may owe on fund distributions or on the redemption of fund shares. For the most recent month-end performance, please visit the Individual Investors section at putnam.com or call Putnam at 1-800-225-1581. Class R and Y shares are not available to all investors. See the Terms and Definitions section in this report for definitions of the share classes offered by your fund.
Fund performance Total return for periods ended 2/28/15
Class A
Class B
Class C
Class M
Class R
Class Y
(inception dates)
(7/24/80)
(2/1/94)
(7/26/99)
(7/3/95)
(12/1/03)
(10/4/05)
Before sales charge
After sales charge
Before CDSC
After CDSC
Before CDSC
After CDSC
Before sales charge
After sales charge
Net asset value
Net asset value
Annual average
(life of fund)
6.93%
6.74%
6.70%
6.70%
6.12%
6.12%
6.33%
6.22%
6.66%
7.00%
10 years
43.27
35.03
34.99
34.99
32.94
32.94
36.31
31.54
39.77
46.78
Annual average
3.66
3.05
3.05
3.05
2.89
2.89
3.15
2.78
3.40
3.91
5 years
15.76
9.10
11.53
9.53
11.51
11.51
12.90
8.95
14.36
17.23
Annual average
2.97
1.76
2.21
1.84
2.20
2.20
2.46
1.73
2.72
3.23
3 years
–5.89
–11.30
–7.95
–10.71
–7.95
–7.95
–7.27
–10.51
–6.58
–5.14
Annual average
–2.00
–3.92
–2.72
–3.71
–2.73
–2.73
–2.48
–3.64
–2.24
–1.74
1 year
–10.87
–15.99
–11.53
–15.96
–11.49
–12.38
–11.33
–14.44
–11.10
–10.60
6 months
–17.16
–21.92
–17.46
–21.59
–17.46
–18.28
–17.37
–20.26
–17.29
–17.04
Current performance may be lower or higher than the quoted past performance, which cannot guarantee future results. After-sales-charge returns for class A and M shares reflect the deduction of the maximum 5.75% and 3.50% sales charge, respectively, levied at the time of purchase. Class B share returns after contingent deferred sales charge (CDSC) reflect the applicable CDSC, which is 5% in the first year, declining over time to 1% in the sixth year, and is eliminated thereafter. Class C share returns after CDSC reflect a 1% CDSC for the first year that is eliminated thereafter. Class R and Y shares have no initial sales charge or CDSC. Performance for class B, C, M, R, and Y shares before their inception is derived from the historical performance of class A shares, adjusted for the applicable sales charge (or CDSC) and the higher operating expenses for such shares, except for class Y shares, for which 12b-1 fees are not applicable.
For a portion of the periods, the fund had expense limitations, without which returns would have been lower.
Class B share performance reflects conversion to class A shares after eight years.
Global Natural Resources Fund 11
Comparative index returns For periods ended 2/28/15
MSCI World Energy & Materials Index (ND)
Annual average (life of fund)
—*
10 years
—*
Annual average
—*
5 years
23.98%
Annual average
4.39
3 years
–0.05
Annual average
–0.02
1 year
–7.42
6 months
–14.62
Index results should be compared with fund performance before sales charge, before CDSC, or at net asset value.
*The fund’s benchmark, the MSCI World Energy & Materials Index (ND), was introduced on 6/1/05, which post-dates the inception of the fund’s class A shares.
Fund price and distribution information For the six–month period ended 2/28/15
Distributions
Class A
Class B
Class C
Class M
Class R
Class Y
Number
1
—
—
—
—
1
Income
$0.011
—
—
—
—
$0.070
Capital gains
—
—
—
—
—
—
Total
$0.011
—
—
—
—
$0.070
Share value
Before sales charge
After sales charge
Net asset value
Net asset value
Before sales charge
After sales charge
Net asset value
Net asset value
8/31/14
$23.95
$25.41
$21.19
$21.65
$22.63
$23.45
$23.43
$24.17
2/28/15
19.83
21.04
17.49
17.87
18.70
19.38
19.38
19.98
The classification of distributions, if any, is an estimate. Before-sales-charge share value and current dividend rate for class A and M shares, if applicable, do not take into account any sales charge levied at the time of purchase. After-sales-charge share value, current dividend rate, and current 30-day SEC yield, if applicable, are calculated assuming that the maximum sales charge (5.75% for class A shares and 3.50% for class M shares) was levied at the time of purchase. Final distribution information will appear on your year-end tax forms.
12 Global Natural Resources Fund
Fund performance as of most recent calendar quarter Total return for periods ended 3/31/15
Class A
Class B
Class C
Class M
Class R
Class Y
(inception dates)
(7/24/80)
(2/1/94)
(7/26/99)
(7/3/95)
(12/1/03)
(10/4/05)
Before sales charge
After sales charge
Before CDSC
After CDSC
Before CDSC
After CDSC
Before sales charge
After sales charge
Net asset value
Net asset value
Annual average
(life of fund)
6.74%
6.56%
6.52%
6.52%
5.94%
5.94%
6.15%
6.04%
6.48%
6.82%
10 years
39.47
31.45
31.34
31.34
29.39
29.39
32.64
28.00
36.10
42.87
Annual average
3.38
2.77
2.76
2.76
2.61
2.61
2.86
2.50
3.13
3.63
5 years
1.78
–4.08
–1.92
–3.81
–1.95
–1.95
–0.70
–4.18
0.56
3.05
Annual average
0.35
–0.83
–0.39
–0.77
–0.39
–0.39
–0.14
–0.85
0.11
0.60
3 years
–7.02
–12.36
–9.06
–11.78
–9.05
–9.05
–8.41
–11.62
–7.69
–6.35
Annual average
–2.40
–4.30
–3.12
–4.09
–3.11
–3.11
–2.89
–4.03
–2.63
–2.16
1 year
–16.58
–21.37
–17.18
–21.32
–17.20
–18.03
–16.99
–19.90
–16.79
–16.37
6 months
–14.33
–19.26
–14.67
–18.93
–14.66
–15.51
–14.60
–17.58
–14.47
–14.26
See the discussion following the fund performance table on page 11 for information about the calculation of fund performance.
Your fund’s expenses
As a mutual fund investor, you pay ongoing expenses, such as management fees, distribution fees (12b-1 fees), and other expenses. Using the following information, you can estimate how these expenses affect your investment and compare them with the expenses of other funds. You may also pay one-time transaction expenses, including sales charges (loads) and redemption fees, which are not shown in this section and would have resulted in higher total expenses. For more information, see your fund’s prospectus or talk to your financial representative.
Expense ratios
Class A
Class B
Class C
Class M
Class R
Class Y
Total annual operating expenses for the fiscal year ended 8/31/14
1.19%
1.94%
1.94%
1.69%
1.44%
0.94%
Annualized expense ratio for the six–month period ended 2/28/15
1.17%
1.92%
1.92%
1.67%
1.42%
0.92%
Fiscal-year expense information in this table is taken from the most recent prospectus, is subject to change, and may differ from that shown for the annualized expense ratio and in the financial highlights of this report.
Expenses are shown as a percentage of average net assets.
Global Natural Resources Fund 13
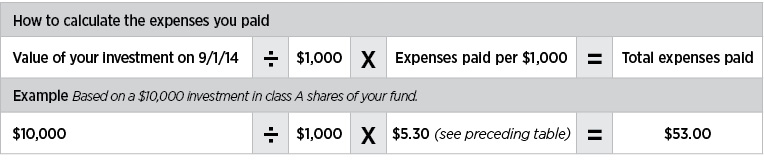
Expenses per $1,000
The following table shows the expenses you would have paid on a $1,000 investment in the fund from September 1, 2014, to February 28, 2015. It also shows how much a $1,000 investment would be worth at the close of the period, assuming actual returns and expenses.
Class A
Class B
Class C
Class M
Class R
Class Y
Expenses paid per $1,000*†
$5.30
$8.69
$8.69
$7.56
$6.43
$4.17
Ending value (after expenses)
$828.40
$825.40
$825.40
$826.30
$827.10
$829.60
*Expenses for each share class are calculated using the fund’s annualized expense ratio for each class, which represents the ongoing expenses as a percentage of average net assets for the six months ended 2/28/15. The expense ratio may differ for each share class.
†Expenses are calculated by multiplying the expense ratio by the average account value for the period; then multiplying the result by the number of days in the period; and then dividing that result by the number of days in the year.
Estimate the expenses you paid
To estimate the ongoing expenses you paid for the six months ended February 28, 2015, use the following calculation method. To find the value of your investment on September 1, 2014, call Putnam at 1-800-225-1581.
Compare expenses using the SEC’s method
The Securities and Exchange Commission (SEC) has established guidelines to help investors assess fund expenses. Per these guidelines, the following table shows your fund’s expenses based on a $1,000 investment, assuming a hypothetical 5% annualized return. You can use this information to compare the ongoing expenses (but not transaction expenses or total costs) of investing in the fund with those of other funds. All mutual fund shareholder reports will provide this information to help you make this comparison. Please note that you cannot use this information to estimate your actual ending account balance and expenses paid during the period.
Class A
Class B
Class C
Class M
Class R
Class Y
Expenses paid per $1,000*†
$5.86
$9.59
$9.59
$8.35
$7.10
$4.61
Ending value (after expenses)
$1,018.99
$1,015.27
$1,015.27
$1,016.51
$1,017.75
$1,020.23
*Expenses for each share class are calculated using the fund’s annualized expense ratio for each class, which represents the ongoing expenses as a percentage of average net assets for the six months ended 2/28/15. The expense ratio may differ for each share class.
†Expenses are calculated by multiplying the expense ratio by the average account value for the six-month period; then multiplying the result by the number of days in the six-month period; and then dividing that result by the number of days in the year.
14 Global Natural Resources Fund
Terms and definitions
Important terms
Total return shows how the value of the fund’s shares changed over time, assuming you held the shares through the entire period and reinvested all distributions in the fund.
Before sales charge, or net asset value, is the price, or value, of one share of a mutual fund, without a sales charge. Before-sales-charge figures fluctuate with market conditions, and are calculated by dividing the net assets of each class of shares by the number of outstanding shares in the class.
After sales charge is the price of a mutual fund share plus the maximum sales charge levied at the time of purchase. After-sales-charge performance figures shown here assume the 5.75% maximum sales charge for class A shares and 3.50% for class M shares.
Contingent deferred sales charge (CDSC) is generally a charge applied at the time of the redemption of class B or C shares and assumes redemption at the end of the period. Your fund’s class B CDSC declines over time from a 5% maximum during the first year to 1% during the sixth year. After the sixth year, the CDSC no longer applies. The CDSC for class C shares is 1% for one year after purchase.
Share classes
Class A shares are generally subject to an initial sales charge and no CDSC (except on certain redemptions of shares bought without an initial sales charge).
Class B shares are not subject to an initial sales charge and may be subject to a CDSC.
Class C shares are not subject to an initial sales charge and are subject to a CDSC only if the shares are redeemed during the first year.
Class M shares have a lower initial sales charge and a higher 12b-1 fee than class A shares and no CDSC (except on certain redemptions of shares bought without an initial sales charge).
Class R shares are not subject to an initial sales charge or CDSC and are available only to employer-sponsored retirement plans.
Class Y shares are not subject to an initial sales charge or CDSC, and carry no 12b-1 fee. They are generally only available to corporate and institutional clients and clients in other approved programs.
Comparative indexes
Barclays U.S. Aggregate Bond Index is an unmanaged index of U.S. investment-grade fixed-income securities.
BofA Merrill Lynch U.S. 3-Month Treasury Bill Index is an unmanaged index that seeks to measure the performance of U.S. Treasury bills available in the marketplace.
MSCI World Energy & Materials Index (ND) is a free float-adjusted market capitalization weighted index that is designed to measure the equity market performance of developed markets in the energy and materials sector.
S&P 500 Index is an unmanaged index of common stock performance.
Indexes assume reinvestment of all distributions and do not account for fees. Securities and performance of a fund and an index will differ. You cannot invest directly in an index.
Global Natural Resources Fund 15
Other information for shareholders
Important notice regarding delivery of shareholder documents
In accordance with Securities and Exchange Commission (SEC) regulations, Putnam sends a single copy of annual and semiannual shareholder reports, prospectuses, and proxy statements to Putnam shareholders who share the same address, unless a shareholder requests otherwise. If you prefer to receive your own copy of these documents, please call Putnam at 1-800-225-1581, and Putnam will begin sending individual copies within 30 days.
Proxy voting
Putnam is committed to managing our mutual funds in the best interests of our shareholders. The Putnam funds’ proxy voting guidelines and procedures, as well as information regarding how your fund voted proxies relating to portfolio securities during the 12-month period ended June 30, 2014, are available in the Individual Investors section of putnam.com, and on the SEC’s website, www.sec.gov. If you have questions about finding forms on the SEC’s website, you may call the SEC at 1-800-SEC-0330. You may also obtain the Putnam funds’ proxy voting guidelines and procedures at no charge by calling Putnam’s Shareholder Services at 1-800-225-1581.
Fund portfolio holdings
The fund will file a complete schedule of its portfolio holdings with the SEC for the first and third quarters of each fiscal year on Form N-Q. Shareholders may obtain the fund’s Form N-Q on the SEC’s website at www.sec.gov. In addition, the fund’s Form N-Q may be reviewed and copied at the SEC’s Public Reference Room in Washington, D.C. You may call the SEC at 1-800-SEC-0330 for information about the SEC’s website or the operation of the Public Reference Room.
Trustee and employee fund ownership
Putnam employees and members of the Board of Trustees place their faith, confidence, and, most importantly, investment dollars in Putnam mutual funds. As of February 28, 2015, Putnam employees had approximately $499,000,000 and the Trustees had approximately $142,000,000 invested in Putnam mutual funds. These amounts include investments by the Trustees’ and employees’ immediate family members as well as investments through retirement and deferred compensation plans.
16 Global Natural Resources Fund
Financial statements
A guide to financial statements
These sections of the report, as well as the accompanying Notes, constitute the fund’s financial statements.
The fund’s portfolio lists all the fund’s investments and their values as of the last day of the reporting period. Holdings are organized by asset type and industry sector, country, or state to show areas of concentration and diversification.
Statement of assets and liabilities shows how the fund’s net assets and share price are determined. All investment and non-investment assets are added together. Any unpaid expenses and other liabilities are subtracted from this total. The result is divided by the number of shares to determine the net asset value per share, which is calculated separately for each class of shares. (For funds with preferred shares, the amount subtracted from total assets includes the liquidation preference of preferred shares.)
Statement of operations shows the fund’s net investment gain or loss. This is done by first adding up all the fund’s earnings — from dividends and interest income — and subtracting its operating expenses to determine net investment income (or loss). Then, any net gain or loss the fund realized on the sales of its holdings — as well as any unrealized gains or losses over the period — is added to or subtracted from the net investment result to determine the fund’s net gain or loss for the fiscal period.
Statement of changes in net assets shows how the fund’s net assets were affected by the fund’s net investment gain or loss, by distributions to shareholders, and by changes in the number of the fund’s shares. It lists distributions and their sources (net investment income or realized capital gains) over the current reporting period and the most recent fiscal year-end. The distributions listed here may not match the sources listed in the Statement of operations because the distributions are determined on a tax basis and may be paid in a different period from the one in which they were earned. Dividend sources are estimated at the time of declaration. Actual results may vary. Any non-taxable return of capital cannot be determined until final tax calculations are completed after the end of the fund’s fiscal year.
Financial highlights provide an overview of the fund’s investment results, per-share distributions, expense ratios, net investment income ratios, and portfolio turnover in one summary table, reflecting the five most recent reporting periods. In a semiannual report, the highlights table also includes the current reporting period.
Global Natural Resources Fund 17
The fund’s portfolio 2/28/15 (Unaudited)
COMMON STOCKS (97.9%)*
Shares
Value
Chemicals (27.9%)
Air Products & Chemicals, Inc.
26,000
$4,059,640
Akzo Nobel NV (Netherlands)
39,668
2,947,528
Axalta Coating Systems, Ltd. †
496,700
14,106,280
Axiall Corp.
80,800
3,741,848
CF Industries Holdings, Inc.
24,500
7,502,635
Croda International PLC (United Kingdom)
101,654
4,282,855
Dow Chemical Co. (The)
109,700
5,401,628
E.I. du Pont de Nemours & Co.
61,800
4,811,130
Huntsman Corp.
216,500
4,862,590
Monsanto Co.
104,769
12,617,331
Tronox, Ltd. Class A
47,555
1,029,090
65,362,555
Construction and engineering (0.5%)
China WindPower Group, Ltd. (China) †
19,580,000
1,123,397
1,123,397
Containers and packaging (7.8%)
MeadWestvaco Corp.
46,600
2,472,596
Packaging Corp. of America
75,500
6,255,930
Sealed Air Corp.
156,800
7,389,984
Smurfit Kappa Group PLC (Ireland)
77,094
2,161,115
18,279,625
Energy equipment and services (4.1%)
Baker Hughes, Inc.
137,600
8,601,376
Ezion Holdings, Ltd. (Singapore)
1,275,000
1,039,000
9,640,376
Food products (0.1%)
S&W Seed Co. † S
61,112
260,948
260,948
Metals and mining (8.1%)
Agnico-Eagle Mines, Ltd. (Canada)
41,200
1,323,897
Allegheny Technologies, Inc.
69,300
2,332,638
BHP Billiton PLC (Australia)
268,195
6,693,168
BHP Billiton, Ltd. (Australia)
64,676
1,697,190
Goldcorp, Inc. (Canada)
57,300
1,259,454
Newcrest Mining, Ltd. (Australia) †
151,785
1,710,338
Norsk Hydro ASA (Norway)
456,439
2,607,866
Randgold Resources, Ltd. (United Kingdom)
16,271
1,301,216
18,925,767
Oil, gas, and consumable fuels (43.1%)
Anadarko Petroleum Corp.
40,900
3,445,007
Antero Resources Corp. † S
139,400
5,499,330
BG Group PLC (United Kingdom)
435,157
6,436,011
Cabot Oil & Gas Corp.
144,200
4,181,800
Cairn Energy PLC (United Kingdom) †
1,527,342
4,798,506
Cheniere Energy, Inc. †
65,700
5,297,391
EOG Resources, Inc.
127,700
11,457,244
EP Energy Corp. Class A †
481,400
5,415,750
Gaztransport Et Technigaz SA (France)
32,997
2,029,784
Genel Energy PLC (United Kingdom) †
343,127
3,091,015
18 Global Natural Resources Fund
COMMON STOCKS (97.9%)* cont.
Shares
Value
Oil, gas, and consumable fuels cont.
Gulfport Energy Corp. †
191,400
$8,768,034
MarkWest Energy Partners LP
113,000
7,339,350
Oryx Petroleum Corp., Ltd. (Canada) †
114,550
358,284
Petroleo Brasileiro SA (Brazil)
1,032,400
3,447,698
Scorpio Tankers, Inc.
529,300
4,583,738
Total SA (France)
339,116
18,304,595
Whiting Petroleum Corp. †
195,717
6,621,106
101,074,643
Paper and forest products (2.5%)
Boise Cascade Co. †
98,000
3,489,780
Louisiana-Pacific Corp. †
147,400
2,480,742
5,970,522
Semiconductors and semiconductor equipment (3.8%)
Canadian Solar, Inc. (Canada) †
144,700
4,286,738
Sumco Corp. (Japan) S
234,100
4,712,775
8,999,513
Total common stocks (cost $229,313,244)
$229,637,346
U.S. TREASURY OBLIGATIONS (0.2%)*
Principal amount
Value
U.S. Treasury Notes
1 7/8s, November 30, 2021 i
$40,000
$40,362
7/8s, October 15, 2017 i
418,000
419,024
Total U.S. Treasury obligations (cost $459,386)
$459,386
SHORT-TERM INVESTMENTS (6.0%)*
Principal amount/shares
Value
Putnam Cash Collateral Pool, LLC 0.20% d
Shares 9,758,990
$9,758,990
Putnam Short Term Investment Fund 0.10% L
Shares 2,311,862
2,311,862
U.S. Treasury Bills with an effective yield of 0.01%, May 28, 2015 Δ
$100,000
99,993
U.S. Treasury Bills with an effective yield of 0.02%, May 7, 2015 Δ
430,000
429,982
U.S. Treasury Bills with an effective yield of 0.01%, April 30, 2015 Δ
190,000
189,992
U.S. Treasury Bills with an effective yield of 0.02%, April 23, 2015 Δ
400,000
399,985
U.S. Treasury Bills with an effective yield of 0.03%, April 16, 2015 Δ
500,000
499,983
U.S. Treasury Bills with an effective yield of 0.03%, April 9, 2015 Δ
290,000
289,989
Total short-term investments (cost $13,980,787)
$13,980,776
TOTAL INVESTMENTS
Total investments (cost $243,753,417)
$244,077,508
Global Natural Resources Fund 19
Notes to the fund’s portfolio
Unless noted otherwise, the notes to the fund’s portfolio are for the close of the fund’s reporting period, which ran from September 1, 2014 through February 28, 2015 (the reporting period). Within the following notes to the portfolio, references to “ASC 820” represent Accounting Standards Codification 820 Fair Value Measurements and Disclosures and references to “OTC”, if any, represent over-the-counter.
*
Percentages indicated are based on net assets of $234,548,368.
†
This security is non-income-producing.
Δ
This security, in part or in entirety, was pledged and segregated with the custodian for collateral on certain derivative contracts at the close of the reporting period.
d
Affiliated company. See Note 1 to the financial statements regarding securities lending. The rate quoted in the security description is the annualized 7-day yield of the fund at the close of the reporting period.
i
This security was pledged, or purchased with cash that was pledged, to the fund for collateral on certain derivative contracts (Note 1).
L
Affiliated company (Note 5). The rate quoted in the security description is the annualized 7-day yield of the fund at the close of the reporting period.
S
Security on loan, in part or in entirety, at the close of the reporting period (Note 1).
At the close of the reporting period, the fund maintained liquid assets totaling $2,276,266 to cover certain derivative contracts.
Debt obligations are considered secured unless otherwise indicated.
The dates shown on debt obligations are the original maturity dates.
DIVERSIFICATION BY COUNTRY ⌂
Distribution of investments by country of risk at the close of the reporting period, excluding collateral received, if any (as a percentage of Portfolio Value):
United States
67.7%
France
8.7
United Kingdom
8.5
Australia
4.3
Canada
3.1
Japan
2.0
Brazil
1.5
Netherlands
1.3
Norway
1.1
Ireland
0.9
China
0.5
Singapore
0.4
Total
100.0%
⌂ Methodology differs from that used for purposes of complying with the fund’s policy regarding investments in securities of foreign issuers, as discussed further in the fund’s prospectus.
FORWARD CURRENCY CONTRACTS at 2/28/15 (aggregate face value $185,752,830) (Unaudited)
Counterparty
Currency
Contract type
Delivery date
Value
Aggregate face value
Unrealized appreciation/ (depreciation)
Barclays Bank PLC
Australian Dollar
Buy
4/15/15
$4,531,687
$4,663,983
$(132,296)
Australian Dollar
Sell
4/15/15
4,287,319
4,286,966
(353)
Canadian Dollar
Buy
4/15/15
4,577,958
4,818,742
(240,784)
Canadian Dollar
Sell
4/15/15
870,104
908,388
38,284
Japanese Yen
Sell
5/20/15
118,348
120,352
2,004
Singapore Dollar
Sell
5/20/15
1,647,127
1,667,754
20,627
Swiss Franc
Buy
3/18/15
1,881,686
1,863,470
18,216
20 Global Natural Resources Fund
FORWARD CURRENCY CONTRACTS at 2/28/15 (aggregate face value $185,752,830) (Unaudited) cont.
Counterparty
Currency
Contract type
Delivery date
Value
Aggregate face value
Unrealized appreciation/ (depreciation)
Citibank, N.A.
Danish Krone
Buy
3/18/15
$560,438
$627,153
$(66,715)
Euro
Buy
3/18/15
2,476,655
2,766,133
(289,478)
Japanese Yen
Sell
5/20/15
1,032,812
1,050,478
17,666
Credit Suisse International
Australian Dollar
Buy
4/15/15
2,165,641
2,228,713
(63,072)
Canadian Dollar
Buy
4/15/15
1,766,349
1,870,777
(104,428)
Euro
Buy
3/18/15
1,464,414
1,635,716
(171,302)
Japanese Yen
Buy
5/20/15
9,028,402
9,185,463
(157,061)
Norwegian Krone
Buy
3/18/15
2,000,377
2,136,623
(136,246)
Norwegian Krone
Sell
3/18/15
3,368,915
3,312,390
(56,525)
Deutsche Bank AG
Australian Dollar
Buy
4/15/15
152,935
157,364
(4,429)
Australian Dollar
Sell
4/15/15
2,099,853
2,167,512
67,659
British Pound
Buy
3/18/15
11,967,904
12,000,800
(32,896)
British Pound
Sell
3/18/15
6,148,355
6,258,375
110,020
Euro
Buy
3/18/15
3,225,762
3,386,860
(161,098)
HSBC Bank USA, National Association
Australian Dollar
Buy
4/15/15
2,930,470
3,015,307
(84,837)
Australian Dollar
Sell
4/15/15
891,106
886,815
(4,291)
British Pound
Buy
3/18/15
5,428,378
5,285,222
143,156
British Pound
Sell
3/18/15
1,849,956
1,885,443
35,487
Canadian Dollar
Buy
4/15/15
7,213,451
7,640,143
(426,692)
Canadian Dollar
Sell
4/15/15
2,146,480
2,216,810
70,330
Euro
Buy
3/18/15
4,321,498
4,468,451
(146,953)
Euro
Sell
3/18/15
12,139,167
13,133,114
993,947
JPMorgan Chase Bank N.A.
British Pound
Buy
3/18/15
8,099,885
8,154,707
(54,822)
British Pound
Sell
3/18/15
6,379,908
6,420,678
40,770
Canadian Dollar
Buy
4/15/15
3,827,769
4,056,217
(228,448)
Euro
Buy
3/18/15
6,597,585
7,316,513
(718,928)
Euro
Sell
3/18/15
8,130,720
9,035,621
904,901
Japanese Yen
Sell
5/20/15
895,289
910,534
15,245
Norwegian Krone
Buy
3/18/15
1,698,859
1,699,845
(986)
Norwegian Krone
Sell
3/18/15
660,212
729,330
69,118
Singapore Dollar
Buy
5/20/15
656,170
664,107
(7,937)
Swedish Krona
Buy
3/18/15
367,460
413,012
(45,552)
Swiss Franc
Buy
3/18/15
2,305,797
2,283,570
22,227
State Street Bank and Trust Co.
Australian Dollar
Buy
4/15/15
681,269
701,018
(19,749)
British Pound
Buy
3/18/15
573,943
573,468
475
Canadian Dollar
Buy
4/15/15
5,021,803
5,275,180
(253,377)
Canadian Dollar
Sell
4/15/15
2,219,308
2,230,141
10,833
Global Natural Resources Fund 21
FORWARD CURRENCY CONTRACTS at 2/28/15 (aggregate face value $185,752,830) (Unaudited) cont.
Counterparty
Currency
Contract type
Delivery date
Value
Aggregate face value
Unrealized appreciation/ (depreciation)
State Street Bank and Trust Co. cont.
Euro
Buy
3/18/15
$6,936,379
$7,747,388
$(811,009)
Euro
Sell
3/18/15
7,572,667
8,252,707
680,040
Israeli Shekel
Buy
4/15/15
175,684
177,033
(1,349)
Japanese Yen
Sell
5/20/15
890,127
905,605
15,478
UBS AG
British Pound
Buy
3/18/15
3,026,400
3,083,474
(57,074)
British Pound
Sell
3/18/15
1,114,080
1,125,238
11,158
Euro
Buy
3/18/15
4,509,418
5,036,085
(526,667)
WestPac Banking Corp.
British Pound
Sell
3/18/15
2,856,286
2,911,092
54,806
Euro
Buy
3/18/15
362,525
404,950
(42,425)
Total
$(1,705,332)
ASC 820 establishes a three-level hierarchy for disclosure of fair value measurements. The valuation hierarchy is based upon the transparency of inputs to the valuation of the fund’s investments. The three levels are defined as follows:
Level 1: Valuations based on quoted prices for identical securities in active markets.
Level 2: Valuations based on quoted prices in markets that are not active or for which all significant inputs are observable, either directly or indirectly.
Level 3: Valuations based on inputs that are unobservable and significant to the fair value measurement.
The following is a summary of the inputs used to value the fund’s net assets as of the close of the reporting period:
Valuation inputs
Investments in securities:
Level 1
Level 2
Level 3
Common stocks*:
Consumer staples
$260,948
$—
$—
Energy
109,676,019
1,039,000
—
Industrials
—
1,123,397
—
Information technology
4,286,738
4,712,775
—
Materials
105,130,941
3,407,528
—
Total common stocks
219,354,646
10,282,700
—
U.S. Treasury obligations
—
459,386
—
Short-term investments
2,311,862
11,668,914
—
Totals by level
$221,666,508
$22,411,000
$—
Valuation inputs
Other financial instruments:
Level 1
Level 2
Level 3
Forward currency contracts
$—
$(1,705,332)
$—
Totals by level
$—
$(1,705,332)
$—
*Common stock classifications are presented at the sector level, which may differ from the fund’s portfolio presentation.
During the reporting period, transfers within the fair value hierarchy, if any, (other than certain transfers involving non-U.S. equity securities as described in Note 1) did not represent, in the aggregate, more than 1% of the fund’s net assets measured as of the end of the period.
The accompanying notes are an integral part of these financial statements.
22 Global Natural Resources Fund
Statement of assets and liabilities 2/28/15 (Unaudited)
ASSETS
Investment in securities, at value, including $9,279,018 of securities on loan (Note 1):
Affiliated issuers (identified cost $12,070,852) (Notes 1 and 5)
12,070,852
Foreign currency (cost $24) (Note 1)
24
Dividends, interest and other receivables
66,158
Foreign tax reclaim
33,113
Receivable for shares of the fund sold
564,218
Receivable for investments sold
2,494,018
Unrealized appreciation on forward currency contracts (Note 1)
3,342,447
Prepaid assets
37,404
Total assets
250,614,890
LIABILITIES
Payable for shares of the fund repurchased
346,290
Payable for compensation of Manager (Note 2)
110,104
Payable for custodian fees (Note 2)
10,361
Payable for investor servicing fees (Note 2)
49,209
Payable for Trustee compensation and expenses (Note 2)
112,206
Payable for administrative services (Note 2)
781
Payable for distribution fees (Note 2)
98,235
Unrealized depreciation on forward currency contracts (Note 1)
5,047,779
Collateral on securities loaned, at value (Note 1)
9,758,990
Collateral on certain derivative contracts, at value (Note 1)
459,386
Other accrued expenses
73,181
Total liabilities
16,066,522
Net assets
$234,548,368
REPRESENTED BY
Paid-in capital (Unlimited shares authorized) (Notes 1 and 4)
$307,108,784
Undistributed net investment income (Note 1)
1,487,494
Accumulated net realized loss on investments and foreign currency transactions (Note 1)
(72,660,809)
Net unrealized depreciation of investments and assets and liabilities in foreign currencies
(1,387,101)
Total — Representing net assets applicable to capital shares outstanding
$234,548,368
(Continued on next page)
The accompanying notes are an integral part of these financial statements.
Global Natural Resources Fund 23
Statement of assets and liabilities (Continued)
COMPUTATION OF NET ASSET VALUE AND OFFERING PRICE
Net asset value and redemption price per class A share ($187,970,528 divided by 9,478,154 shares)
$19.83
Offering price per class A share (100/94.25 of $19.83)*
$21.04
Net asset value and offering price per class B share ($7,867,486 divided by 449,766 shares)**
$17.49
Net asset value and offering price per class C share ($9,659,864 divided by 540,614 shares)**
$17.87
Net asset value and redemption price per class M share ($3,391,168 divided by 181,315 shares)
$18.70
Offering price per class M share (100/96.50 of $18.70)*
$19.38
Net asset value, offering price and redemption price per class R share ($12,336,585 divided by 636,491 shares)
$19.38
Net asset value, offering price and redemption price per class Y share ($13,322,737 divided by 666,895 shares)
$19.98
*
On single retail sales of less than $50,000. On sales of $50,000 or more the offering price is reduced.
**
Redemption price per share is equal to net asset value less any applicable contingent deferred sales charge.
The accompanying notes are an integral part of these financial statements.
24 Global Natural Resources Fund
Statement of operations Six months ended 2/28/15 (Unaudited)
INVESTMENT INCOME
Dividends (net of foreign tax of $105,922)
$1,772,110
Interest (including interest income of $3,023 from investments in affiliated issuers) (Note 5)
3,266
Securities lending (Note 1)
13,389
Total investment income
1,788,765
EXPENSES
Compensation of Manager (Note 2)
743,488
Investor servicing fees (Note 2)
244,150
Custodian fees (Note 2)
17,240
Trustee compensation and expenses (Note 2)
1,398
Distribution fees (Note 2)
378,708
Administrative services (Note 2)
3,298
Other
102,944
Total expenses
1,491,226
Expense reduction (Note 2)
(25,571)
Net expenses
1,465,655
Net investment income
323,110
Net realized loss on investments (Notes 1 and 3)
(15,456,809)
Net realized loss on foreign currency transactions (Note 1)
(5,853,015)
Net realized loss on written options (Notes 1 and 3)
(2,466,639)
Net unrealized depreciation of assets and liabilities in foreign currencies during the period
(480,976)
Net unrealized depreciation of investments during the period
(26,132,396)
Net loss on investments
(50,389,835)
Net decrease in net assets resulting from operations
$(50,066,725)
The accompanying notes are an integral part of these financial statements.
Global Natural Resources Fund 25
Statement of changes in net assets
DECREASE IN NET ASSETS
Six months ended 2/28/15*
Year ended 8/31/14
Operations:
Net investment income
$323,110
$2,591,049
Net realized gain (loss) on investments and foreign currency transactions
(23,776,463)
44,750,149
Net unrealized appreciation (depreciation) of investments and assets and liabilities in foreign currencies
(26,613,372)
11,480,741
Net increase (decrease) in net assets resulting from operations
(50,066,725)
58,821,939
Distributions to shareholders (Note 1):
From ordinary income
Net investment income
Class A
(106,096)
—
Class Y
(46,053)
—
Decrease from capital share transactions (Note 4)
(9,384,857)
(77,702,927)
Total decrease in net assets
(59,603,731)
(18,880,988)
NET ASSETS
Beginning of period
294,152,099
313,033,087
End of period (including undistributed net investment income of $1,487,494 and $1,316,533, respectively)
$234,548,368
$294,152,099
*
Unaudited.
26 Global Natural Resources Fund
This page left blank intentionally.
Global Natural Resources Fund 27
Financial highlights (For a common share outstanding throughout the period)
INVESTMENT OPERATIONS:
LESS DISTRIBUTIONS:
RATIOS AND SUPPLEMENTAL DATA:
Period ended
Net asset value, beginning of period
Net investment income (loss)a
Net realized and unrealized gain (loss) on investments
Total from investment operations
From net investment income
Total distributions
Redemption fees
Non-recurring reimbursements
Net asset value, end of period
Total return at net asset value (%)b
Net assets, end of period (in thousands)
Ratio of expenses to average net assets (%)c
Ratio of net investment income (loss) to average net assets (%)
Portfolio turnover (%)
Class A
February 28, 2015**
$23.95
.03
(4.14)
(4.11)
(.01)
(.01)
—
—
$19.83
(17.16) *
$187,971
.58*
.17*
78*
August 31, 2014
20.09
.19
3.67
3.86
—
—
—
—
23.95
19.21
238,703
1.19
.83
101
August 31, 2013
19.18
.17
.91
1.08
(.17)
(.17)
—d
—
20.09
5.62
224,519
1.23
.85
104
August 31, 2012
20.81
.23
(1.30)
(1.07)
(.56)
(.56)
—d
—
19.18
(5.08)
262,969
1.29
1.18
80
August 31, 2011
16.62
.15
4.44
4.59
(.40)
(.40)
—d
—d,e
20.81
27.53
322,408
1.26
.66
90
August 31, 2010
16.87
.13
(.18)
(.05)
(.20)
(.20)
—d
—
16.62
(.44)
284,668
1.39
.71
107
Class B
February 28, 2015**
$21.19
(.04)
(3.66)
(3.70)
—
—
—
—
$17.49
(17.46) *
$7,867
.95*
(.20) *
78*
August 31, 2014
17.91
.02
3.26
3.28
—
—
—
—
21.19
18.31
10,791
1.94
.08
101
August 31, 2013
17.10
.02
.81
.83
(.02)
(.02)
—d
—
17.91
4.84
12,561
1.98
.10
104
August 31, 2012
18.58
.08
(1.16)
(1.08)
(.40)
(.40)
—d
—
17.10
(5.78)
15,561
2.04
.46
80
August 31, 2011
14.87
(.02)
3.99
3.97
(.26)
(.26)
—d
—d,e
18.58
26.58
21,166
2.01
(.10)
90
August 31, 2010
15.11
(.01)
(.15)
(.16)
(.08)
(.08)
—d
—
14.87
(1.15)
21,418
2.14
(.05)
107
Class C
February 28, 2015**
$21.65
(.04)
(3.74)
(3.78)
—
—
—
—
$17.87
(17.46) *
$9,660
.95*
(.21) *
78*
August 31, 2014
18.30
.02
3.33
3.35
—
—
—
—
21.65
18.31
12,205
1.94
.08
101
August 31, 2013
17.47
.02
.83
.85
(.02)
(.02)
—d
—
18.30
4.89
11,890
1.98
.10
104
August 31, 2012
18.98
.08
(1.19)
(1.11)
(.40)
(.40)
—d
—
17.47
(5.81)
13,564
2.04
.43
80
August 31, 2011
15.20
(.01)
4.07
4.06
(.28)
(.28)
—d
—d,e
18.98
26.61
16,797
2.01
(.04)
90
August 31, 2010
15.47
(.01)
(.16)
(.17)
(.10)
(.10)
—d
—
15.20
(1.21)
13,292
2.14
(.04)
107
Class M
February 28, 2015**
$22.63
(.02)
(3.91)
(3.93)
—
—
—
—
$18.70
(17.37) *
$3,391
.83*
(.08) *
78*
August 31, 2014
19.08
.07
3.48
3.55
—
—
—
—
22.63
18.61
4,247
1.69
.33
101
August 31, 2013
18.21
.06
.87
.93
(.06)
(.06)
—d
—
19.08
5.11
3,873
1.73
.34
104
August 31, 2012
19.77
.13
(1.23)
(1.10)
(.46)
(.46)
—d
—
18.21
(5.53)
4,999
1.79
.70
80
August 31, 2011
15.82
.03
4.23
4.26
(.31)
(.31)
—d
—d,e
19.77
26.86
6,233
1.76
.17
90
August 31, 2010
16.08 ��
.04
(.17)
(.13)
(.13)
(.13)
—d
—
15.82
(.91)
5,141
1.89
.20
107
Class R
February 28, 2015**
$23.43
.01
(4.06)
(4.05)
—
—
—
—
$19.38
(17.29) *
$12,337
.71*
.04*
78*
August 31, 2014
19.70
.13
3.60
3.73
—
—
—
—
23.43
18.93
14,258
1.44
.57
101
August 31, 2013
18.81
.12
.89
1.01
(.12)
(.12)
—d
—
19.70
5.36
13,888
1.48
.60
104
August 31, 2012
20.41
.18
(1.27)
(1.09)
(.51)
(.51)
—d
—
18.81
(5.28)
13,838
1.54
.94
80
August 31, 2011
16.31
.10
4.36
4.46
(.36)
(.36)
—d
—d,e
20.41
27.27
16,971
1.51
.46
90
August 31, 2010
16.58
.09
(.19)
(.10)
(.17)
(.17)
—d
—
16.31
(.72)
11,192
1.64
.48
107
Class Y
February 28, 2015**
$24.17
.06
(4.18)
(4.12)
(.07)
(.07)
—
—
$19.98
(17.04) *
$13,323
.46*
.28*
78*
August 31, 2014
20.23
.25
3.69
3.94
—
—
—
—
24.17
19.48
13,948
.94
1.13
101
August 31, 2013
19.31
.21
.93
1.14
(.22)
(.22)
—d
—
20.23
5.92
46,303
.98
1.01
104
August 31, 2012
20.96
.28
(1.31)
(1.03)
(.62)
(.62)
—d
—
19.31
(4.85)
9,739
1.04
1.44
80
August 31, 2011
16.73
.21
4.47
4.68
(.45)
(.45)
—d
—d,e
20.96
27.89
11,535
1.01
.94
90
August 31, 2010
16.97
.18
(.18)
—d
(.24)
(.24)
—d
—
16.73
(.16)
9,069
1.14
.95
107
See notes to financial highlights at the end of this section.
The accompanying notes are an integral part of these financial statements.
28
Global Natural Resources Fund
Global Natural Resources Fund
29
Financial highlights (Continued)
*Not annualized.
**Unaudited.
a Per share net investment income (loss) has been determined on the basis of the weighted average number of shares outstanding during the period.
b Total return assumes dividend reinvestment and does not reflect the effect of sales charges.
c Includes amounts paid through expense offset and/or brokerage service arrangements, if any (Note 2). Also excludes acquired fund fees and expenses, if any.
d Amount represents less than $0.01 per share.
e Reflects a non-recurring reimbursement related to restitution amounts in connection with a distribution plan approved by the Securities and Exchange Commission (SEC) which amounted to less than $0.01 per share outstanding on July 21, 2011. Also reflects a non-recurring reimbursement related to short-term trading related lawsuits, which amounted to less than $0.01 per share outstanding on May 11, 2011.
The accompanying notes are an integral part of these financial statements.
30 Global Natural Resources Fund
Notes to financial statements 2/28/15 (Unaudited)
Within the following Notes to financial statements, references to “State Street” represent State Street Bank and Trust Company, references to “the SEC” represent the Securities and Exchange Commission, references to “Putnam Management” represent Putnam Investment Management, LLC, the fund’s manager, an indirect wholly-owned subsidiary of Putnam Investments, LLC and references to “OTC”, if any, represent over-the-counter. Unless otherwise noted, the “reporting period” represents the period from September 1, 2014 through February 28, 2015.
Putnam Global Natural Resources Fund (the fund) is a Massachusetts business trust, which is registered under the Investment Company Act of 1940, as amended, as a non-diversified, open-end management investment company. The goal of the fund is to seek capital appreciation by concentrating in the energy and other natural resources industries. The fund invests mainly in common stocks (growth or value stocks or both) of large and midsize companies worldwide that Putnam Management believes have favorable investment potential. Potential investments include companies in the discovery, development, production or distribution of energy and other natural resources, in the development of technologies for the production or efficient use of energy or other natural resources, and in the furnishing of related supplies or services. The fund may purchase stocks of companies with stock prices that reflect a value lower than that which Putnam Management places on the company. Putnam Management may also consider other factors that it believes will cause the stock price to rise. Putnam Management may consider, among other factors, a company’s valuation, financial strength, growth potential, competitive position in its industry, projected future earnings, cash flows and dividends when deciding whether to buy or sell investments.
The fund offers class A, class B, class C, class M, class R and class Y shares. Class A and class M shares are sold with a maximum front-end sales charge of 5.75% and 3.50%, respectively, and generally do not pay a contingent deferred sales charge. Class B shares, which convert to class A shares after approximately eight years, do not pay a front-end sales charge and are subject to a contingent deferred sales charge if those shares are redeemed within six years of purchase. Class C shares have a one-year 1.00% contingent deferred sales charge and do not convert to class A shares. Class R shares, which are not available to all investors, are sold at net asset value. The expenses for class A, class B, class C, class M and class R shares may differ based on the distribution fee of each class, which is identified in Note 2. Class Y shares, which are sold at net asset value, are generally subject to the same expenses as class A, class B, class C, class M and class R shares, but do not bear a distribution fee. Class Y shares are not available to all investors.
In the normal course of business, the fund enters into contracts that may include agreements to indemnify another party under given circumstances. The fund’s maximum exposure under these arrangements is unknown as this would involve future claims that may be, but have not yet been, made against the fund. However, the fund’s management team expects the risk of material loss to be remote.
Note 1: Significant accounting policies
The following is a summary of significant accounting policies consistently followed by the fund in the preparation of its financial statements. The preparation of financial statements is in conformity with accounting principles generally accepted in the United States of America and requires management to make estimates and assumptions that affect the reported amounts of assets and liabilities in the financial statements and the reported amounts of increases and decreases in net assets from operations. Actual results could differ from those estimates. Subsequent events after the Statement of assets and liabilities date through the date that the financial statements were issued have been evaluated in the preparation of the financial statements.
Investment income, realized and unrealized gains and losses and expenses of the fund are borne pro-rata based on the relative net assets of each class to the total net assets of the fund, except that each class bears expenses unique to that class (including the distribution fees applicable to such classes). Each class votes as a class only with respect to its own distribution plan or other matters on which a class vote is required by law or determined by the Trustees. If the fund were liquidated, shares of each class would receive their pro-rata share of the net assets of the fund. In addition, the Trustees declare separate dividends on each class of shares.
Security valuation Portfolio securities and other investments are valued using policies and procedures adopted by the Board of Trustees. The Trustees have formed a Pricing Committee to oversee the implementation of these procedures and have delegated responsibility for valuing the fund’s assets in accordance with these procedures to Putnam Management. Putnam Management has established an internal Valuation Committee that is responsible for making fair value determinations, evaluating the effectiveness of the pricing policies of the fund and reporting to the Pricing Committee.
Global Natural Resources Fund 31
Investments for which market quotations are readily available are valued at the last reported sales price on their principal exchange, or official closing price for certain markets, and are classified as Level 1 securities under Accounting Standards Codification 820 Fair Value Measurements and Disclosures (ASC 820). If no sales are reported, as in the case of some securities that are traded OTC, a security is valued at its last reported bid price and is generally categorized as a Level 2 security.
Investments in open-end investment companies (excluding exchange-traded funds), if any, which can be classified as Level 1 or Level 2 securities, are valued based on their net asset value. The net asset value of such investment companies equals the total value of their assets less their liabilities and divided by the number of their outstanding shares.
Market quotations are not considered to be readily available for certain debt obligations and other investments; such investments are valued on the basis of valuations furnished by an independent pricing service approved by the Trustees or dealers selected by Putnam Management. Such services or dealers determine valuations for normal institutional-size trading units of such securities using methods based on market transactions for comparable securities and various relationships, generally recognized by institutional traders, between securities (which consider such factors as security prices, yields, maturities and ratings). These securities will generally be categorized as Level 2. Short-term securities with remaining maturities of 60 days or less may be valued at amortized cost, which approximates fair value, and are classified as Level 2 securities.
Many securities markets and exchanges outside the U.S. close prior to the close of the New York Stock Exchange and therefore the closing prices for securities in such markets or on such exchanges may not fully reflect events that occur after such close but before the close of the New York Stock Exchange. Accordingly, on certain days, the fund will fair value foreign equity securities taking into account multiple factors including movements in the U.S. securities markets, currency valuations and comparisons to the valuation of American Depository Receipts, exchange-traded funds and futures contracts. These securities, which would generally be classified as Level 1 securities, will be transferred to Level 2 of the fair value hierarchy when they are valued at fair value. The number of days on which fair value prices will be used will depend on market activity and it is possible that fair value prices will be used by the fund to a significant extent. At the close of the reporting period, fair value pricing was used for certain foreign securities in the portfolio. Securities quoted in foreign currencies, if any, are translated into U.S. dollars at the current exchange rate.
To the extent a pricing service or dealer is unable to value a security or provides a valuation that Putnam Management does not believe accurately reflects the security’s fair value, the security will be valued at fair value by Putnam Management in accordance with policies and procedures approved by the Trustees. Certain investments, including certain restricted and illiquid securities and derivatives, are also valued at fair value following procedures approved by the Trustees. These valuations consider such factors as significant market or specific security events such as interest rate or credit quality changes, various relationships with other securities, discount rates, U.S. Treasury, U.S. swap and credit yields, index levels, convexity exposures, recovery rates, sales and other multiples and resale restrictions. These securities are classified as Level 2 or as Level 3 depending on the priority of the significant inputs.
To assess the continuing appropriateness of fair valuations, the Valuation Committee reviews and affirms the reasonableness of such valuations on a regular basis after considering all relevant information that is reasonably available. Such valuations and procedures are reviewed periodically by the Trustees. The fair value of securities is generally determined as the amount that the fund could reasonably expect to realize from an orderly disposition of such securities over a reasonable period of time. By its nature, a fair value price is a good faith estimate of the value of a security in a current sale and does not reflect an actual market price, which may be different by a material amount.
Security transactions and related investment income Security transactions are recorded on the trade date (the date the order to buy or sell is executed). Gains or losses on securities sold are determined on the identified cost basis.
Interest income, net of any applicable withholding taxes, is recorded on the accrual basis. Dividend income, net of any applicable withholding taxes, is recognized on the ex-dividend date except that certain dividends from foreign securities, if any, are recognized as soon as the fund is informed of the ex-dividend date. Non-cash dividends, if any, are recorded at the fair value of the securities received. Dividends representing a return of capital or capital gains, if any, are reflected as a reduction of cost and/or as a realized gain.
All premiums/discounts are amortized/accreted on a yield-to-maturity basis.
Foreign currency translation The accounting records of the fund are maintained in U.S. dollars. The fair value of foreign securities, currency holdings, and other assets and liabilities is recorded in the books and records of the
32 Global Natural Resources Fund
fund after translation to U.S. dollars based on the exchange rates on that day. The cost of each security is determined using historical exchange rates. Income and withholding taxes are translated at prevailing exchange rates when earned or incurred. The fund does not isolate that portion of realized or unrealized gains or losses resulting from changes in the foreign exchange rate on investments from fluctuations arising from changes in the market prices of the securities. Such gains and losses are included with the net realized and unrealized gain or loss on investments. Net realized gains and losses on foreign currency transactions represent net realized exchange gains or losses on closed forward currency contracts, disposition of foreign currencies, currency gains and losses realized between the trade and settlement dates on securities transactions and the difference between the amount of investment income and foreign withholding taxes recorded on the fund’s books and the U.S. dollar equivalent amounts actually received or paid. Net unrealized appreciation and depreciation of assets and liabilities in foreign currencies arise from changes in the value of open forward currency contracts and assets and liabilities other than investments at the period end, resulting from changes in the exchange rate.
Options contracts The fund uses options contracts to hedge against changes in values of securities it owns, owned or expects to own.
The potential risk to the fund is that the change in value of options contracts may not correspond to the change in value of the hedged instruments. In addition, losses may arise from changes in the value of the underlying instruments if there is an illiquid secondary market for the contracts, if interest or exchange rates move unexpectedly or if the counterparty to the contract is unable to perform. Realized gains and losses on purchased options are included in realized gains and losses on investment securities. If a written call option is exercised, the premium originally received is recorded as an addition to sales proceeds. If a written put option is exercised, the premium originally received is recorded as a reduction to the cost of investments.
Exchange-traded options are valued at the last sale price or, if no sales are reported, the last bid price for purchased options and the last ask price for written options. OTC traded options are valued using prices supplied by dealers.
Options on swaps are similar to options on securities except that the premium paid or received is to buy or grant the right to enter into a previously agreed upon interest rate or credit default contract. Forward premium swap option contracts include premiums that have extended settlement dates. The delayed settlement of the premiums is factored into the daily valuation of the option contracts. In the case of interest rate cap and floor contracts, in return for a premium, ongoing payments between two parties are based on interest rates exceeding a specified rate, in the case of a cap contract, or falling below a specified rate in the case of a floor contract.
Written option contracts outstanding at period end, if any, are listed after the fund’s portfolio.
Forward currency contracts The fund buys and sells forward currency contracts, which are agreements between two parties to buy and sell currencies at a set price on a future date. These contracts are used to hedge foreign exchange risk.
The U.S. dollar value of forward currency contracts is determined using current forward currency exchange rates supplied by a quotation service. The fair value of the contract will fluctuate with changes in currency exchange rates. The contract is marked to market daily and the change in fair value is recorded as an unrealized gain or loss. The fund records a realized gain or loss equal to the difference between the value of the contract at the time it was opened and the value at the time it was closed when the contract matures or by delivery of the currency. The fund could be exposed to risk if the value of the currency changes unfavorably, if the counterparties to the contracts are unable to meet the terms of their contracts or if the fund is unable to enter into a closing position. Risks may exceed amounts recognized on the Statement of assets and liabilities.
Forward currency contracts outstanding at period end, if any, are listed after the fund’s portfolio.
Master agreements The fund is a party to ISDA (International Swaps and Derivatives Association, Inc.) Master Agreements (Master Agreements) with certain counterparties that govern OTC derivative and foreign exchange contracts entered into from time to time. The Master Agreements may contain provisions regarding, among other things, the parties’ general obligations, representations, agreements, collateral requirements, events of default and early termination. With respect to certain counterparties, in accordance with the terms of the Master Agreements, collateral posted to the fund is held in a segregated account by the fund’s custodian and with respect to those amounts which can be sold or repledged, is presented in the fund’s portfolio.
Collateral pledged by the fund is segregated by the fund’s custodian and identified in the fund’s portfolio. Collateral can be in the form of cash or debt securities issued by the U.S. Government or related agencies or other securities as agreed to by the fund and the applicable counterparty. Collateral requirements are determined based on the fund’s net position with each counterparty.
Global Natural Resources Fund 33
Termination events applicable to the fund may occur upon a decline in the fund’s net assets below a specified threshold over a certain period of time. Termination events applicable to counterparties may occur upon a decline in the counterparty’s long-term and short-term credit ratings below a specified level. In each case, upon occurrence, the other party may elect to terminate early and cause settlement of all derivative and foreign exchange contracts outstanding, including the payment of any losses and costs resulting from such early termination, as reasonably determined by the terminating party. Any decision by one or more of the fund’s counterparties to elect early termination could impact the fund’s future derivative activity.
At the close of the reporting period, the fund had a net liability position of $2,297,860 on open derivative contracts subject to the Master Agreements. Collateral posted by the fund at period end for these agreements totaled $1,698,000 and may include amounts related to unsettled agreements.
Securities lending The fund may lend securities, through its agent, to qualified borrowers in order to earn additional income. The loans are collateralized by cash in an amount at least equal to the fair value of the securities loaned. The fair value of securities loaned is determined daily and any additional required collateral is allocated to the fund on the next business day. The risk of borrower default will be borne by the fund’s agent; the fund will bear the risk of loss with respect to the investment of the cash collateral. Income from securities lending is included in investment income on the Statement of operations. Cash collateral is invested in Putnam Cash Collateral Pool, LLC, a limited liability company managed by an affiliate of Putnam Management. Investments in Putnam Cash Collateral Pool, LLC are valued at its closing net asset value each business day. There are no management fees charged to Putnam Cash Collateral Pool, LLC. At the close of the reporting period, the fund received cash collateral of $9,758,990 and the value of securities loaned amounted to $9,279,018.
Interfund lending The fund, along with other Putnam funds, may participate in an interfund lending program pursuant to an exemptive order issued by the SEC. This program allows the fund to borrow from or lend to other Putnam funds that permit such transactions. Interfund lending transactions are subject to each fund’s investment policies and borrowing and lending limits. Interest earned or paid on the interfund lending transaction will be based on the average of certain current market rates. During the reporting period, the fund did not utilize the program.
Lines of credit The fund participates, along with other Putnam funds, in a $392.5 million unsecured committed line of credit and a $235.5 million unsecured uncommitted line of credit, both provided by State Street. Borrowings may be made for temporary or emergency purposes, including the funding of shareholder redemption requests and trade settlements. Interest is charged to the fund based on the fund’s borrowing at a rate equal to the Federal Funds rate plus 1.25% for the committed line of credit and the Federal Funds rate plus 1.30% for the uncommitted line of credit. A closing fee equal to 0.04% of the committed line of credit and 0.04% of the uncommitted line of credit has been paid by the participating funds. In addition, a commitment fee of 0.11% per annum on any unutilized portion of the committed line of credit is allocated to the participating funds based on their relative net assets and paid quarterly. During the reporting period, the fund had no borrowings against these arrangements.
Federal taxes It is the policy of the fund to distribute all of its taxable income within the prescribed time period and otherwise comply with the provisions of the Internal Revenue Code of 1986, as amended (the Code), applicable to regulated investment companies. It is also the intention of the fund to distribute an amount sufficient to avoid imposition of any excise tax under Section 4982 of the Code.
The fund is subject to the provisions of Accounting Standards Codification 740 Income Taxes (ASC 740). ASC 740 sets forth a minimum threshold for financial statement recognition of the benefit of a tax position taken or expected to be taken in a tax return. The fund did not have a liability to record for any unrecognized tax benefits in the accompanying financial statements. No provision has been made for federal taxes on income, capital gains or unrealized appreciation on securities held nor for excise tax on income and capital gains. Each of the fund’s federal tax returns for the prior three fiscal years remains subject to examination by the Internal Revenue Service.
The fund may also be subject to taxes imposed by governments of countries in which it invests. Such taxes are generally based on either income or gains earned or repatriated. The fund accrues and applies such taxes to net investment income, net realized gains and net unrealized gains as income and/or capital gains are earned. In some cases, the fund may be entitled to reclaim all or a portion of such taxes, and such reclaim amounts, if any, are reflected as an asset on the fund’s books. In many cases, however, the fund may not receive such amounts for an extended period of time, depending on the country of investment.
34 Global Natural Resources Fund
At August 31, 2014, the fund had a capital loss carryover of $48,893,576 available to the extent allowed by the Code to offset future net capital gain, if any. The amounts of the carryovers and the expiration dates are:
Loss carryover
Short-term
Long-term
Total
Expiration
$48,893,576
N/A
$48,893,576
August 31, 2018
Under the Regulated Investment Company Modernization Act of 2010, the fund will be permitted to carry forward capital losses incurred in taxable years beginning after December 22, 2010 for an unlimited period. However, any losses incurred will be required to be utilized prior to the losses incurred in pre-enactment tax years. As a result of this ordering rule, pre-enactment capital loss carryforwards may be more likely to expire unused. Additionally, post-enactment capital losses that are carried forward will retain their character as either short-term or long-term capital losses rather than being considered all short-term as under previous law.
The aggregate identified cost on a tax basis is $243,744,187, resulting in gross unrealized appreciation and depreciation of $18,906,388 and $18,573,067, respectively, or net unrealized appreciation of $333,321.
Distributions to shareholders Distributions to shareholders from net investment income are recorded by the fund on the ex-dividend date. Distributions from capital gains, if any, are recorded on the ex-dividend date and paid at least annually. The amount and character of income and gains to be distributed are determined in accordance with income tax regulations, which may differ from generally accepted accounting principles. Dividend sources are estimated at the time of declaration. Actual results may vary. Any non-taxable return of capital cannot be determined until final tax calculations are completed after the end of the fund’s fiscal year. Reclassifications are made to the fund’s capital accounts to reflect income and gains available for distribution (or available capital loss carryovers) under income tax regulations.
Note 2: Management fee, administrative services and other transactions
The fund pays Putnam Management a management fee (based on the fund’s average net assets and computed and paid monthly) at annual rates that may vary based on the average of the aggregate net assets of most open-end funds, as defined in the fund’s management contract, sponsored by Putnam Management. Such annual rates may vary as follows:
0.780%
of the first $5 billion,
0.730%
of the next $5 billion,
0.680%
of the next $10 billion,
0.630%
of the next $10 billion,
0.580%
of the next $50 billion,
0.560%
of the next $50 billion,
0.550%
of the next $100 billion and
0.545%
of any excess thereafter.
Putnam Management has contractually agreed, through June 30, 2015, to waive fees or reimburse the fund’s expenses to the extent necessary to limit the cumulative expenses of the fund, exclusive of brokerage, interest, taxes, investment-related expenses, extraordinary expenses, acquired fund fees and expenses and payments under the fund’s investor servicing contract, investment management contract and distribution plans, on a fiscal year-to-date basis to an annual rate of 0.20% of the fund’s average net assets over such fiscal year-to-date period. During the reporting period, the fund’s expenses were not reduced as a result of this limit.
Putnam Investments Limited (PIL), an affiliate of Putnam Management, is authorized by the Trustees to manage a separate portion of the assets of the fund as determined by Putnam Management from time to time. Putnam Management pays a quarterly sub-management fee to PIL for its services at an annual rate of 0.35% of the average net assets of the portion of the fund managed by PIL.
The Putnam Advisory Company, LLC (PAC), an affiliate of Putnam Management, is authorized by the Trustees to manage a separate portion of the assets of the fund, as designated from time to time by Putnam Management or PIL. Putnam Management or PIL, as applicable, pays a quarterly sub-advisory fee to PAC for its services at the annual rate of 0.35% of the average net assets of the portion of the fund’s assets for which PAC is engaged as sub-adviser.
The fund reimburses Putnam Management an allocated amount for the compensation and related expenses of certain officers of the fund and their staff who provide administrative services to the fund. The aggregate amount of all such reimbursements is determined annually by the Trustees.
Global Natural Resources Fund 35
Custodial functions for the fund’s assets are provided by State Street. Custody fees are based on the fund’s asset level, the number of its security holdings and transaction volumes.
Putnam Investor Services, Inc., an affiliate of Putnam Management, provides investor servicing agent functions to the fund. Putnam Investor Services, Inc. received fees for investor servicing that included (1) a per account fee for each direct and underlying non-defined contribution accounts (“retail accounts”) of the fund and each of the other funds in its specified category, which was totaled and then allocated to each fund in the category based on its average daily net assets; (2) a specified rate of the fund’s assets attributable to defined contribution plan accounts; and (3) for the portion of the fund’s fiscal year beginning after January 1, 2015, a specified rate based on the average net assets in retail accounts. Putnam Investor Services has agreed that the aggregate investor servicing fees for each fund’s retail and defined contribution accounts will not exceed an annual rate of 0.320% of the fund’s average assets attributable to such accounts. During the reporting period, the expenses for each class of shares related to investor servicing fees were as follows:
Class A
$197,182
Class B
8,683
Class C
10,164
Class M
3,543
Class R
12,149
Class Y
12,429
Total
$244,150
The fund has entered into expense offset arrangements with Putnam Investor Services, Inc. and State Street whereby Putnam Investor Services, Inc.’s and State Street’s fees are reduced by credits allowed on cash balances. The fund also reduced expenses through brokerage/service arrangements. For the reporting period, the fund’s expenses were reduced by $222 under the expense offset arrangements and by $25,349 under the brokerage/service arrangements.
Each Independent Trustee of the fund receives an annual Trustee fee, of which $127, as a quarterly retainer, has been allocated to the fund, and an additional fee for each Trustees meeting attended. Trustees also are reimbursed for expenses they incur relating to their services as Trustees.
The fund has adopted a Trustee Fee Deferral Plan (the Deferral Plan) which allows the Trustees to defer the receipt of all or a portion of Trustees fees payable on or after July 1, 1995. The deferred fees remain invested in certain Putnam funds until distribution in accordance with the Deferral Plan.
The fund has adopted an unfunded noncontributory defined benefit pension plan (the Pension Plan) covering all Trustees of the fund who have served as a Trustee for at least five years and were first elected prior to 2004. Benefits under the Pension Plan are equal to 50% of the Trustee’s average annual attendance and retainer fees for the three years ended December 31, 2005. The retirement benefit is payable during a Trustee’s lifetime, beginning the year following retirement, for the number of years of service through December 31, 2006. Pension expense for the fund is included in Trustee compensation and expenses in the Statement of operations. Accrued pension liability is included in Payable for Trustee compensation and expenses in the Statement of assets and liabilities. The Trustees have terminated the Pension Plan with respect to any Trustee first elected after 2003.
The fund has adopted distribution plans (the Plans) with respect to its class A, class B, class C, class M and class R shares pursuant to Rule 12b–1 under the Investment Company Act of 1940. The purpose of the Plans is to compensate Putnam Retail Management Limited Partnership, an indirect wholly-owned subsidiary of Putnam Investments, LLC, for services provided and expenses incurred in distributing shares of the fund. The Plans provide for payments by the fund to Putnam Retail Management Limited Partnership at an annual rate of up to 0.35%, 1.00%, 1.00%, 1.00% and 1.00% of the average net assets attributable to class A, class B, class C, class M and class R shares, respectively. The Trustees have approved payment by the fund at an annual rate of 0.25%, 1.00%, 1.00%, 0.75% and 0.50% of the average net assets attributable to class A, class B, class C, class M and class R shares, respectively. During the reporting period, the class specific expenses related to distribution fees were as follows:
Class A
$242,809
Class B
42,803
Class C
50,074
Class M
13,090
Class R
29,932
Total
$378,708
For the reporting period, Putnam Retail Management Limited Partnership, acting as underwriter, received net commissions of $14,350 and $146 from the sale of class A and class M shares, respectively, and received $3,214 and $286 in contingent deferred sales charges from redemptions of class B and class C shares, respectively.
36 Global Natural Resources Fund
A deferred sales charge of up to 1.00% and 0.65% is assessed on certain redemptions of class A and class M shares, respectively. For the reporting period, Putnam Retail Management Limited Partnership, acting as underwriter, received $903 and no monies on class A and class M redemptions, respectively.
Note 3: Purchases and sales of securities
During the reporting period, cost of purchases and proceeds from sales, excluding short-term investments were as follows:
Cost of purchases
Proceeds from sales
Investments in securities (Long-term)
$188,158,546
$208,516,131
U.S. government securities (Long-term)
—
—
Total
$188,158,546
$208,516,131
Written option transactions during the reporting period are summarized as follows:
Written option contract amounts
Written option premiums
Written options outstanding at the beginning of the reporting period
$—
$—
Options opened
1,677,832
539,751
Options exercised
—
—
Options expired
(894,918)
(320,272)
Options closed
(782,914)
(219,479)
Written options outstanding at the end of the reporting period
$—
$—
Note 4: Capital shares
At the close of the reporting period, there were an unlimited number of shares of beneficial interest authorized. Transactions in capital shares were as follows:
Six months ended 2/28/15
Year ended 8/31/14
Class A
Shares
Amount
Shares
Amount
Shares sold
580,513
$11,298,962
614,431
$13,824,038
Shares issued in connection with reinvestment of distributions
5,166
100,532
—
—
585,679
11,399,494
614,431
13,824,038
Shares repurchased
(1,072,648)
(21,338,450)
(1,823,370)
(40,643,671)
Net decrease
(486,969)
$(9,938,956)
(1,208,939)
$(26,819,633)
Six months ended 2/28/15
Year ended 8/31/14
Class B
Shares
Amount
Shares
Amount
Shares sold
31,492
$555,629
36,557
$722,246
Shares issued in connection with reinvestment of distributions
—
—
—
—
31,492
555,629
36,557
722,246
Shares repurchased
(90,901)
(1,614,356)
(228,662)
(4,526,029)
Net decrease
(59,409)
$(1,058,727)
(192,105)
$(3,803,783)
Global Natural Resources Fund 37
Six months ended 2/28/15
Year ended 8/31/14
Class C
Shares
Amount
Shares
Amount
Shares sold
67,521
$1,214,463
64,456
$1,321,709
Shares issued in connection with reinvestment of distributions
—
—
—
—
67,521
1,214,463
64,456
1,321,709
Shares repurchased
(90,643)
(1,613,510)
(150,520)
(3,047,558)
Net decrease
(23,122)
$(399,047)
(86,064)
$(1,725,849)
Six months ended 2/28/15
Year ended 8/31/14
Class M
Shares
Amount
Shares
Amount
Shares sold
10,796
$198,233
13,402
$286,277
Shares issued in connection with reinvestment of distributions
—
—
—
—
10,796
198,233
13,402
286,277
Shares repurchased
(17,102)
(315,811)
(28,730)
(616,244)
Net decrease
(6,306)
$(117,578)
(15,328)
$(329,967)
Six months ended 2/28/15
Year ended 8/31/14
Class R
Shares
Amount
Shares
Amount
Shares sold
119,906
$2,351,759
181,030
$3,987,957
Shares issued in connection with reinvestment of distributions
—
—
—
—
119,906
2,351,759
181,030
3,987,957
Shares repurchased
(92,037)
(1,846,877)
(277,394)
(5,984,988)
Net increase (decrease)
27,869
$504,882
(96,364)
$(1,997,031)
Six months ended 2/28/15
Year ended 8/31/14
Class Y
Shares
Amount
Shares
Amount
Shares sold
204,886
$3,954,760
353,800
$7,907,819
Shares issued in connection with reinvestment of distributions
2,167
42,483
—
—
207,053
3,997,243
353,800
7,907,819
Shares repurchased
(117,206)
(2,372,674)
(2,065,960)
(50,934,483)
Net increase (decrease)
89,847
$1,624,569
(1,712,160)
$(43,026,664)
Note 5: Affiliated transactions
Transactions during the reporting period with Putnam Short Term Investment Fund, which is under common ownership and control, were as follows:
Name of affiliate
Fair value at the beginning of the reporting period
Purchase cost
Sale proceeds
Investment income
Fair value at the end of the reporting period
Putnam Short Term Investment Fund*
$2,192,548
$88,013,512
$87,894,198
$3,023
$2,311,862
Totals
$2,192,548
$88,013,512
$87,894,198
$3,023
$2,311,862
*Management fees charged to Putnam Short Term Investment Fund have been waived by Putnam Management.
38 Global Natural Resources Fund
Note 6: Market, credit and other risks
In the normal course of business, the fund trades financial instruments and enters into financial transactions where risk of potential loss exists due to changes in the market (market risk) or failure of the contracting party to the transaction to perform (credit risk). The fund may be exposed to additional credit risk that an institution or other entity with which the fund has unsettled or open transactions will default. Investments in foreign securities involve certain risks, including those related to economic instability, unfavorable political developments, and currency fluctuations. The fund concentrates a majority of its investments in the natural resources sector, which involves more risk than a fund that invests more broadly.
Note 7: Summary of derivative activity
The volume of activity for the reporting period for any derivative type that was held during the period is listed below and was as follows based on an average of the holdings at the end of each fiscal quarter:
Written equity option contracts (contract amount) (Note 3)
$—*
Forward currency contracts (contract amount)
$154,000,000
*For the reporting period there were no holdings at the end of each fiscal quarter and the transactions were considered minimal.
The following is a summary of the fair value of derivative instruments as of the close of the reporting period:
Fair value of derivative instruments as of the close of the reporting period
Asset derivatives
Liability derivatives
Derivatives not accounted for as hedging instruments under ASC 815
Statement of assets and liabilities location
Fair value
Statement of assets and liabilities location
Fair value
Foreign exchange contracts
Receivables
$3,342,447
Payables
$5,047,779
Total
$3,342,447
$5,047,779
The following is a summary of realized and change in unrealized gains or losses of derivative instruments on the Statement of operations for the reporting period (see Note 1):
Amount of realized gain or (loss) on derivatives recognized in net gain or (loss) on investments
Derivatives not accounted for as hedging instruments under ASC 815
Options
Forward currency contracts
Total
Foreign exchange contracts
$—
$(5,770,311)
$(5,770,311)
Equity contracts
351,782
—
$351,782
Total
$351,782
$(5,770,311)
$(5,418,529)
Change in unrealized appreciation or (depreciation) on derivatives recognized in net gain or (loss) on investments
Derivatives not accounted for as hedging instruments under ASC 815
Forward currency contracts
Total
Foreign exchange contracts
$(476,982)
$(476,982)
Total
$(476,982)
$(476,982)
Global Natural Resources Fund 39
Note 8: Offsetting of financial and derivative assets and liabilities
The following table summarizes any derivatives, repurchase agreements and reverse repurchase agreements, at the end of the reporting period, that are subject to an enforceable master netting agreement or similar agreement. For securities lending transactions or borrowing transactions associated with securities sold short, if any, see Note 1. For financial reporting purposes, the fund does not offset financial assets and financial liabilities that are subject to the master netting agreements in the Statement of assets and liabilities.
Barclays Bank PLC
Citibank, N.A.
Credit Suisse International
Deutsche Bank AG
HSBC Bank USA, National Association
JPMorgan Chase Bank N.A.
State Street Bank and Trust Co.
UBS AG
WestPac Banking Corp.
Total
Assets:
Forward currency contracts#
$79,131
$17,666
$—
$177,679
$1,242,920
$1,052,261
$706,826
$11,158
$54,806
$3,342,447
Total Assets
$79,131
$17,666
$—
$177,679
$1,242,920
$1,052,261
$706,826
$11,158
$54,806
$3,342,447
Liabilities:
Forward currency contracts#
373,433
356,193
688,634
198,423
662,773
1,056,673
1,085,484
583,741
42,425
5,047,779
Total Liabilities
$373,433
$356,193
$688,634
$198,423
$662,773
$1,056,673
$1,085,484
$583,741
$42,425
$5,047,779
Total Financial and Derivative Net Assets
$(294,302)
$(338,527)
$(688,634)
$(20,744)
$580,147
$(4,412)
$(378,658)
$(572,583)
$12,381
$(1,705,332)
Total collateral received (pledged)†##
$(294,302)
$(240,000)
$(609,000)
$—
$459,386
$—
$—
$(527,000)
$—
Net amount
$—
$(98,527)
$(79,634)
$(20,744)
$120,761
$(4,412)
$(378,658)
$(45,583)
$12,381
†
Additional collateral may be required from certain brokers based on individual agreements.
#
Covered by master netting agreement (Note 1).
##
Any over-collateralization of total financial and derivative net assets is not shown. Collateral may include amounts related to unsettled agreements.
40
Global Natural Resources Fund
Global Natural Resources Fund
41
Putnam family of funds
The following is a list of Putnam’s open-end mutual funds offered to the public. Investors should carefully consider the investment objective, risks, charges, and expenses of a fund before investing. For a prospectus, or a summary prospectus if available, containing this and other information for any Putnam fund or product, contact your financial advisor or call Putnam Investor Services at 1-800-225-1581. Please read the prospectus carefully before investing.
Growth
Growth Opportunities Fund
International Growth Fund
Multi-Cap Growth Fund
Small Cap Growth Fund
Voyager Fund
Blend
Asia Pacific Equity Fund
Capital Opportunities Fund
Capital Spectrum Fund
Emerging Markets Equity Fund
Equity Spectrum Fund
Europe Equity Fund
Global Equity Fund
International Capital Opportunities Fund
International Equity Fund
Investors Fund
Low Volatility Equity Fund
Multi-Cap Core Fund
Research Fund
Strategic Volatility Equity Fund
Value
Convertible Securities Fund
Equity Income Fund
Global Dividend Fund
The Putnam Fund for Growth and Income
International Value Fund
Multi-Cap Value Fund
Small Cap Value Fund
Income
American Government Income Fund
Diversified Income Trust
Emerging Markets Income Fund
Floating Rate Income Fund
Global Income Trust
High Yield Advantage Fund
High Yield Trust
Income Fund
Money Market Fund*
Short Duration Income Fund
U.S. Government Income Trust
Tax-free Income
AMT-Free Municipal Fund
Intermediate-Term Municipal Income Fund
Short-Term Municipal Income Fund
Tax Exempt Income Fund
Tax Exempt Money Market Fund*
Tax-Free High Yield Fund
State tax-free income funds†:
Arizona, California, Massachusetts, Michigan, Minnesota, New Jersey, New York, Ohio, and Pennsylvania.
* An investment in a money market fund is not insured or guaranteed by the Federal Deposit Insurance Corporation or any other government agency. Although the fund seeks to preserve the value of your investment at $1.00 per share, it is possible to lose money by investing in the fund.
†Not available in all states.
42 Global Natural Resources Fund
Absolute Return
Absolute Return 100 Fund®
Absolute Return 300 Fund®
Absolute Return 500 Fund®
Absolute Return 700 Fund®
Global Sector
Global Consumer Fund
Global Energy Fund
Global Financials Fund
Global Health Care Fund
Global Industrials Fund
Global Natural Resources Fund
Global Sector Fund
Global Technology Fund
Global Telecommunications Fund
Global Utilities Fund
Asset Allocation
George Putnam Balanced Fund
Global Asset Allocation Funds — four investment portfolios that spread your money across a variety of stocks, bonds, and money market instruments.
Dynamic Asset Allocation Balanced Fund
Dynamic Asset Allocation Conservative Fund
Dynamic Asset Allocation Growth Fund
Dynamic Risk Allocation Fund
Retirement Income Lifestyle Funds — portfolios with managed allocations to stocks, bonds, and money market investments to generate retirement income.
Retirement Income Fund Lifestyle 1
Retirement Income Fund Lifestyle 2
Retirement Income Fund Lifestyle 3
RetirementReady® Funds — portfolios with adjusting allocations to stocks, bonds, and money market instruments, becoming more conservative over time.
RetirementReady® 2055 Fund
RetirementReady® 2050 Fund
RetirementReady® 2045 Fund
RetirementReady® 2040 Fund
RetirementReady® 2035 Fund
RetirementReady® 2030 Fund
RetirementReady® 2025 Fund
RetirementReady® 2020 Fund
RetirementReady® 2015 Fund
Check your account balances and the most recent month-end performance in the Individual Investors section at putnam.com.
Global Natural Resources Fund 43
Services for shareholders
Investor services
Systematic investment plan Tell us how much you wish to invest regularly — weekly, semimonthly, or monthly — and the amount you choose will be transferred automatically from your checking or savings account. There’s no additional fee for this service, and you can suspend it at any time. This plan may be a great way to save for college expenses or to plan for your retirement.
Please note that regular investing does not guarantee a profit or protect against loss in a declining market. Before arranging a systematic investment plan, consider your financial ability to continue making purchases in periods when prices are low.
Systematic exchange You can make regular transfers from one Putnam fund to another Putnam fund. There are no additional fees for this service, and you can cancel or change your options at any time.
Dividends PLUS You can choose to have the dividend distributions from one of your Putnam funds automatically reinvested in another Putnam fund at no additional charge.
Free exchange privilege You can exchange money between Putnam funds free of charge, as long as they are the same class of shares. A signature guarantee is required if you are exchanging more than $500,000. The fund reserves the right to revise or terminate the exchange privilege.
Reinstatement privilege If you’ve sold Putnam shares or received a check for a dividend or capital gain, you may reinvest the proceeds with Putnam within 90 days of the transaction and they will be reinvested at the fund’s current net asset value — with no sales charge. However, reinstatement of class B shares may have special tax consequences. Ask your financial or tax representative for details.
Check-writing service You have ready access to many Putnam accounts. It’s as simple as writing a check, and there are no special fees or service charges. For more information about the check-writing service, call Putnam or visit our website.
Dollar cost averaging When you’re investing for long-term goals, it’s time, not timing, that counts. Investing on a systematic basis is a better strategy than trying to figure out when the markets will go up or down. This means investing the same amount of money regularly over a long period. This method of investing is called dollar cost averaging. When a fund’s share price declines, your investment dollars buy more shares at lower prices. When it increases, they buy fewer shares. Over time, you will pay a lower average price per share.
For more information
Visit the Individual Investors section at putnam.com A secure section of our website contains complete information on your account, including balances and transactions, updated daily. You may also conduct transactions, such as exchanges, additional investments, and address changes. Log on today to get your password.
Call us toll free at 1-800-225-1581 Ask a helpful Putnam representative or your financial advisor for details about any of these or other services, or see your prospectus.
44 Global Natural Resources Fund
Fund information
Founded over 75 years ago, Putnam Investments was built around the concept that a balance between risk and reward is the hallmark of a well-rounded financial program. We manage over 100 funds across income, value, blend, growth, asset allocation, absolute return, and global sector categories.
Investment Manager
Putnam Investment Management, LLC One Post Office Square Boston, MA 02109
Investment Sub-Manager
Putnam Investments Limited 57–59 St James’s Street London, England SW1A 1LD
Investment Sub-Advisor
The Putnam Advisory Company, LLC One Post Office Square Boston, MA 02109
Marketing Services
Putnam Retail Management One Post Office Square Boston, MA 02109
Custodian
State Street Bank and Trust Company
Legal Counsel
Ropes & Gray LLP
Trustees
Jameson A. Baxter, Chair Liaquat Ahamed Ravi Akhoury Barbara M. Baumann Charles B. Curtis Robert J. Darretta Katinka Domotorffy John A. Hill Paul L. Joskow Kenneth R. Leibler Robert E. Patterson George Putnam, III Robert L. Reynolds W. Thomas Stephens
Officers
Robert L. Reynolds President
Jonathan S. Horwitz Executive Vice President, Principal Executive Officer, and Compliance Liaison
Steven D. Krichmar Vice President and Principal Financial Officer
Robert T. Burns Vice President and Chief Legal Officer
Robert R. Leveille Vice President and Chief Compliance Officer
Michael J. Higgins Vice President, Treasurer, and Clerk
Janet C. Smith Vice President, Principal Accounting Officer, and Assistant Treasurer
Susan G. Malloy Vice President and Assistant Treasurer
James P. Pappas Vice President
Mark C. Trenchard Vice President and BSA Compliance Officer
Nancy E. Florek Vice President, Director of Proxy Voting and Corporate Governance, Assistant Clerk, and Associate Treasurer
This report is for the information of shareholders of Putnam Global Natural Resources Fund. It may also be used as sales literature when preceded or accompanied by the current prospectus, the most recent copy of Putnam’s Quarterly Performance Summary, and Putnam’s Quarterly Ranking Summary. For more recent performance, please visit putnam.com. Investors should carefully consider the investment objectives, risks, charges, and expenses of a fund, which are described in its prospectus. For this and other information or to request a prospectus or summary prospectus, call 1-800-225-1581 toll free. Please read the prospectus carefully before investing. The fund’s Statement of Additional Information contains additional information about the fund’s Trustees and is available without charge upon request by calling 1-800-225-1581.
Item 2. Code of Ethics:
Not applicable
Item 3. Audit Committee Financial Expert:
Not applicable
Item 4. Principal Accountant Fees and Services:
Not applicable
Item 5. Audit Committee of Listed Registrants
Not applicable
Item 6. Schedule of Investments:
The registrant’s schedule of investments in unaffiliated issuers is included in the report to shareholders in Item 1 above.
Item 7. Disclosure of Proxy Voting Policies and Procedures For Closed-End Management Investment Companies:
Not applicable
Item 8. Portfolio Managers of Closed-End Investment Companies
Not Applicable
Item 9. Purchases of Equity Securities by Closed-End Management Investment Companies and Affiliated Purchasers:
Not applicable
Item 10. Submission of Matters to a Vote of Security Holders:
Not applicable
Item 11. Controls and Procedures:
(a) The registrant’s principal executive officer and principal financial officer have concluded, based on their evaluation of the effectiveness of the design and operation of the registrant’s disclosure controls and procedures as of a date within 90 days of the filing date of this report, that the design and operation of such procedures are generally effective to provide reasonable assurance that information required to be disclosed by the registrant in this report is recorded, processed, summarized and reported within the time periods specified in the Commission’s rules and forms.
(b) Changes in internal control over financial reporting: Not applicable
Item 12. Exhibits:
(a)(1) Not applicable
(a)(2) Separate certifications for the principal executive officer and principal financial officer of the registrant as required by Rule 30a-2(a) under the Investment Company Act of 1940, as amended, are filed herewith.
(b) The certifications required by Rule 30a-2(b) under the Investment Company Act of 1940, as amended, are filed herewith.
Putnam Global Natural Resources Fund
By (Signature and Title):
/s/ Janet C. Smith Janet C. Smith Principal Accounting Officer
Date: April 28, 2015
Pursuant to the requirements of the Securities Exchange Act of 1934 and the Investment Company Act of 1940, this report has been signed below by the following persons on behalf of the registrant and in the capacities and on the dates indicated.
By (Signature and Title):
/s/ Jonathan S. Horwitz Jonathan S. Horwitz Principal Executive Officer
Date: April 28, 2015
By (Signature and Title):
/s/ Steven D. Krichmar Steven D. Krichmar Principal Financial Officer
Date: April 28, 2015
We use cookies on this site to provide a more responsive and personalized service. Continuing to browse, clicking I Agree, or closing this banner indicates agreement. See our Cookie Policy for more information.