Washington, D.C. 20549
Form N-CSR is to be used by management investment companies to file reports with the Commission, not later than 10 days after the transmission to stockholders of any report that is required to be transmitted to stockholders under Rule 30e-1 under the Investment Company Act of 1940 (17 CFR 270.30e-1). The Commission may use the information provided on Form N-CSR in its regulatory, disclosure review, inspection, and policymaking roles.
A registrant is required to disclose the information specified by Form N-CSR, and the Commission will make this information public. A registrant is not required to respond to the collection of information contained in Form N-CSR unless the Form displays a currently valid Office of Management and Budget ("OMB") control number. Please direct comments concerning the accuracy of the information collection burden estimate and any suggestions for reducing the burden to the Secretary, Securities and Exchange Commission, 100 F Street, NE, Washington, DC 20549. The OMB has reviewed this collection of information under the clearance requirements of 44 U.S.C. § 3507.
TABLE OF CONTENTS
| Shareholder Letter | 1 |
| Portfolio Update | 3 |
| Disclosure of Fund Expenses | 7 |
| Schedule of Investments | 8 |
| Statement of Assets and Liabilities | 12 |
| Statement of Operations | 13 |
| Statements of Changes in Net Assets | 14 |
| Financial Highlights | 17 |
| Notes to Financial Statements | 18 |
| Report of Independent Registered Public Accounting Firm | 23 |
| Additional Information | 24 |
| Trustees & Officers | 25 |
| Northeast Investors Growth Fund | Shareholder Letter |
Dear Fellow Shareholders:
The Northeast Investors Growth Fund nicely outperformed the S&P 500 for the year 2015 by returning +4.41% as compared to +1.38% for our benchmark. Such a flat year for U.S. large cap equities followed six consecutive positive returning years. Investors appeared on edge throughout the year waiting with bated breath in anticipation of The Federal Reserve Bank’s initial move to raise target rates for inter-bank deposits. Multiple years of expanding monetary policy to drive down interest rates had largely been credited with significant equity outperformance, and the thought of the foot coming off the gas gave reason to pause for many. The Fund, however, began the year in strong fashion with an early lead relative to its benchmark and never trailed at a month-end through the close of December.
Equity market volatility returned this past year on levels not seen since the sovereign debt crisis of 2011. The surprise decision by the People’s Bank of China to devalue their currency in August by three percent versus the U.S. Dollar set in motion what would become the market’s first correction in four years, as defined by a 10 percent decline from a peak. Ultimately, the S&P 500 declined by more than six percent for the third quarter before the bulls returned in October driving the benchmark to a gain of seven percent in the final quarter to finish slightly positive on the year.
The Fund’s outperformance was due in part to sector allocation but more importantly stock selection. From a sector perspective, we maintained our largest relative over/underweights throughout much of the year. Consumer Discretionary and Information Technology have been our two largest relative overweight sectors for some time, and 2015 rewarded us as both of these areas handily outperformed the broad market. In addition, a significant underweight to Energy as well as no direct exposure to Materials nor Utilities names largely shielded us from the three worst performing sectors for the year.
One of our smaller names, Manhattan Associates, contributed greatest to our return for the year. Its stellar performance (+63%) continues to be driven by its proprietary solutions for retailers in the new age of downward margin pressure from the e-commerce behemoth, Amazon. Alphabet, the new holding company of Google, as well as Facebook are earning the lion’s share of advertising dollars migrating to mobile internet platforms from the traditional television and print mediums. Alphabet returned +47% on the year while Facebook gained +34%. Nike was another winner on the year, finishing up +31% as its dominance of global athletic apparel, and in particular footwear, spreads.
Longtime Fund stalwart Union Pacific had a very weak year (-33%) and detracted most from our performance. We still hold our position in the name, but much lower energy-related carloads as well as West Coast port disruptions severely crimped their profits. Auto parts supplier Magna International (-24%) was hurt by weakness in the Canadian Dollar and a few company-specific operational issues despite U.S. light vehicle sales hitting an all-time record high. Finally industrial conglomerate United Technologies (-15%) was negatively affected by further strength in the U.S. Dollar impacting overseas sales as well as a slowdown in Chinese commercial construction.
At the time of this writing in early 2016, the same fears of slowing global growth, prolonged low commodity prices and an uncertain monetary policy have yielded another abrupt selloff in equities. We now find many of our positions trading at even more attractive valuations and we continue to look to add to our highest conviction ideas at opportune times. In spite of recent further gyrations, we maintain a guarded optimism on global markets for the duration of the year. Economic conditions across much of the western world likely will gradually improve further, but continued commodity price weakness, diverging central bank policies as well as a U.S. presidential election should provide plenty of ammo for both the bulls and bears.
| Annual Report | December 31, 2015 | 1 |
| Northeast Investors Growth Fund | Shareholder Letter |
We welcome and encourage you to contact us with any questions, concerns or comments. Please call us directly at 617-523-3588 or visit our website, www.northeastinvestorsgrowthfund.com, where you can view the Fund’s closing price, composition, and historical performance. If you follow your investments online, the ticker symbol for the Fund is NTHFX. Our lines of communication are always open to our most important partners – you our fellow shareholders. We continue to appreciate your support.
William A. Oates, Jr.
February, 2016
| 2 | www.northeastinvestorsgrowthfund.com |
| Northeast Investors Growth Fund | Portfolio Update |
December 31, 2015 (Unaudited)
Average Annual Total Return (For the Period Ended December 31, 2015)
| | 1 Year | 5 Year | 10 Year | Expense Ratio |
| Northeast Investors Growth Fund | 4.41% | 7.55% | 4.61% | 1.25%* |
S&P 500® Total Return Index | 1.38% | 12.57% | 7.31% | |
| * | As stated in the Fund’s most recent prospectus. |
Performance Graph
The following graph compares the cumulative total shareholder return on the Northeast Investors Growth Fund shares to the cumulative total return on the S&P 500® Total Return Index, assuming an investment of $10,000 in both at their closing prices on December 31, 2005 and reinvestment of dividends and capital gains. The graph does not reflect the deduction of taxes that a shareholder would pay on Fund distributions or the redemption of Fund shares. Keep in mind that past performance does not guarantee future returns, and an investment in the Fund is not guaranteed. For management’s discussion of the Fund’s performance for the period ended December 31, 2015, including strategies and market conditions which influenced such performance, see the Shareholder Letter.
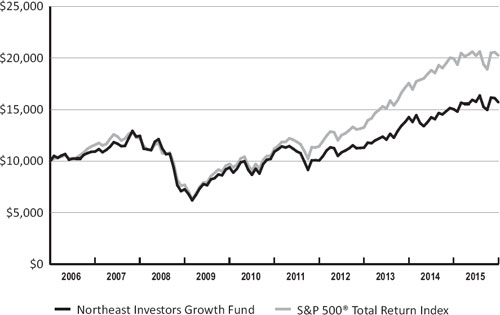
| | 2006 | 2007 | 2008 | 2009 | 2010 | 2011 | 2012 | 2013 | 2014 | 2015 |
| Northeast Investors Growth Fund | $10,924 | $12,442 | $7,265 | $9,375 | $10,911 | $10,055 | $11,304 | $14,255 | $15,035 | $15,699 |
S&P 500® Total Return Index | $11,579 | $12,216 | $7,696 | $9,733 | $11,199 | $11,435 | $13,265 | $17,562 | $19,966 | $20,242 |
| Annual Report | December 31, 2015 | 3 |
| Northeast Investors Growth Fund | Portfolio Update |
December 31, 2015 (Unaudited)
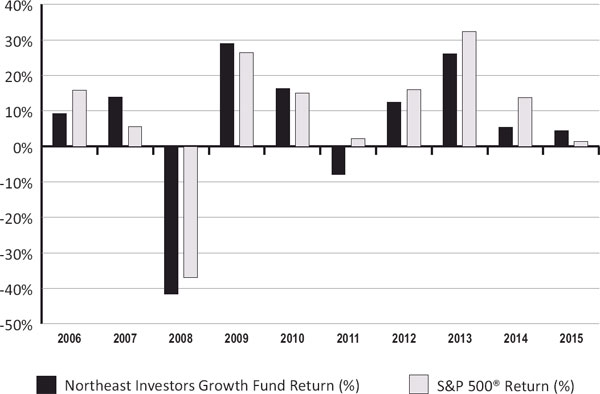
Returns and Per Share Data
| | 2006 | 2007 | 2008 | 2009 | 2010 | 2011 | 2012 | 2013 | 2014 | 2015 |
| Net Asset Value | 20.10 | 20.19 | 11.74 | 15.15 | 17.60 | 16.22 | 16.67 | 17.26 | 16.58 | 15.30 |
| Dividend Dist. | 0.00 | 0.04 | 0.05 | 0.00 | 0.03 | 0.00 | 0.10 | 0.08 | 0.00 | 0.04 |
| Capital Gains Dist. | 0.00 | 2.60 | 0.00 | 0.00 | 0.00 | 0.00 | 1.47 | 3.60 | 1.64 | 1.98 |
| Northeast Investors Growth Fund Return (%) | 9.24% | 13.90% | -41.61% | 29.05% | 16.38% | -7.84% | 12.42% | 26.11% | 5.47% | 4.41% |
S&P 500® Return (%) | 15.79% | 5.49% | -37.00% | 26.46% | 15.06% | 2.11% | 16.00% | 32.39% | 13.69% | 1.38% |
| 4 | www.northeastinvestorsgrowthfund.com |
| Northeast Investors Growth Fund | Portfolio Update |
December 31, 2015 (Unaudited)
Ten Largest Investment Holdings
| | | Market Value | | | Percent of Net Assets | |
| Apple, Inc. | | $ | 2,405,191 | | | | 4.18 | % |
| Visa, Inc., Class A | | | 2,303,235 | | | | 4.00 | % |
| Facebook, Inc., Class A | | | 2,208,326 | | | | 3.83 | % |
| Alphabet Inc., Class A | | | 2,022,826 | | | | 3.51 | % |
| Honeywell International, Inc. | | | 1,998,901 | | | | 3.47 | % |
| Gilead Sciences, Inc. | | | 1,892,253 | | | | 3.29 | % |
| Celgene Corp. | | | 1,796,400 | | | | 3.12 | % |
| NIKE, Inc., Class B | | | 1,775,000 | | | | 3.08 | % |
| Goldman Sachs Group, Inc. | | | 1,712,185 | | | | 2.97 | % |
| Costco Wholesale Corp. | | | 1,663,450 | | | | 2.89 | % |
Summary of Sector Weightings as a Percentage of Net Assets
| | Percent of Net Assets |
| Consumer, Non-Cyclical | 22.09% |
| Financial | 19.39% |
| Consumer, Cyclical | 16.97% |
| Technology | 13.28% |
| Communications | 12.73% |
| Industrial | 9.84% |
| Energy | 4.35% |
| Cash, Cash Equivalents, & Other Net Assets | 1.35% |
| Total | 100.00% |
| Annual Report | December 31, 2015 | 5 |
| Northeast Investors Growth Fund | Portfolio Update |
December 31, 2015 (Unaudited)
Summary of Net Assets by Industry
| | | Market Value | | | % of Net Assets | |
| Common Stocks | | | | | | |
| Aerospace/Defense | | $ | 326,638 | | | | 0.57 | % |
| Apparel | | | 3,589,409 | | | | 6.24 | % |
| Auto Parts & Equipment | | | 1,127,568 | | | | 1.96 | % |
| Banks | | | 5,762,908 | | | | 10.01 | % |
| Beverages | | | 829,336 | | | | 1.44 | % |
| Biotechnology | | | 4,610,061 | | | | 8.01 | % |
| Computers | | | 3,609,485 | | | | 6.27 | % |
| Diversified Financial Services | | | 2,865,093 | | | | 4.98 | % |
| Electronics | | | 1,998,901 | | | | 3.47 | % |
| Food | | | 1,307,086 | | | | 2.27 | % |
| Household Products/Wares | | | 1,268,300 | | | | 2.20 | % |
| Insurance | | | 1,612,713 | | | | 2.80 | % |
| Internet | | | 5,380,165 | | | | 9.34 | % |
| Media | | | 1,471,120 | | | | 2.55 | % |
| Miscellaneous Manufacturing | | | 2,020,032 | | | | 3.51 | % |
| Oil & Gas | | | 2,505,906 | | | | 4.35 | % |
| Pharmaceuticals | | | 4,707,776 | | | | 8.17 | % |
| Real Estate Investment Trusts | | | 921,025 | | | | 1.60 | % |
| Retail | | | 5,052,771 | | | | 8.77 | % |
| Semiconductors | | | 1,297,450 | | | | 2.25 | % |
| Software | | | 2,743,011 | | | | 4.76 | % |
| Telecommunications | | | 485,310 | | | | 0.84 | % |
| Transportation | | | 1,321,580 | | | | 2.29 | % |
| Total Common Stocks | | | 56,813,644 | | | | 98.65 | % |
| Total Investment Portfolio | | | 56,813,644 | | | | 98.65 | % |
| Other Assets in Excess of Liabilities | | | 779,364 | | | | 1.35 | % |
| Total Net Assets | | | 57,593,008 | | | | 100.00 | % |
| 6 | www.northeastinvestorsgrowthfund.com |
| Northeast Investors Growth Fund | Disclosure of Fund Expenses |
December 31, 2015 (Unaudited)
As a shareholder of the Northeast Investors Growth Fund (the “Fund”), you will incur ongoing costs, including management fees and other Fund expenses. The following examples are intended to help you understand your ongoing costs (in dollars) of investing in the Fund and to compare these costs with the ongoing costs of investing in other mutual funds. The examples are based on an investment of $1,000 invested on July 1, 2015 and held until December 31, 2015.
Actual Expenses. The first line of each table below provides information about actual account values and actual expenses. You may use the information in this line, together with the amount you invested, to estimate the expenses that you paid over the period. Simply divide your account value by $1,000 (for example, an $8,600 account value divided by $1,000 = 8.6), then multiply the result by the number in the first line under the heading “Expenses Paid During Period” to estimate the expenses you paid on your account during this period.
Hypothetical Example for Comparison Purposes. The second line of the table below provides information about hypothetical account values and hypothetical expenses based on the Fund’s actual expense ratio and an assumed rate of return of 5% per year before expenses, which is not the Fund’s actual return. The hypothetical account values and expenses may not be used to estimate the actual ending account balance or expenses you paid for the period. You may use this information to compare the ongoing costs of investing in the Fund and other mutual funds. To do so, compare this 5% hypothetical example with the 5% hypothetical examples that appear in the shareholder reports of the other funds. The expenses shown in the table are meant to highlight ongoing Fund costs. Therefore, the second line of each table below is useful in comparing ongoing costs only, and may not help you determine the relative total costs of owning different funds. In addition, if these transactional costs were included, your costs would have been higher.
| | Net Expense Ratios | Beginning Account Value July 1, 2015 | Ending Account Value December 31, 2015 | Expenses Paid During Period(a) |
| Northeast Investors Growth Fund | | | | |
| Actual Return | 1.29% | $1,000.00 | $996.10 | $6.49 |
| Hypothetical Return (5% return before expenses) | 1.29% | $1,000.00 | $1,018.70 | $6.56 |
(a) | Expenses are equal to the Fund’s annualized expense ratio multiplied by the average account value over the period, multiplied by the number of days in the most recent fiscal half year (184), divided by 365. |
| Annual Report | December 31, 2015 | 7 |
| Northeast Investors Growth Fund | Schedule of Investments |
December 31, 2015
| Description | | Shares | | | $ Value | |
| COMMON STOCKS - 98.65% | | | | | | |
| | | | | | | |
| Communications - 12.73% | | | | | | |
| | | | | | | |
| Internet - 9.34% | | | | | | |
Alphabet Inc., Class A(a) | | | 2,600 | | | $ | 2,022,826 | |
Amazon.com, Inc.(a) | | | 1,700 | | | | 1,149,013 | |
Facebook, Inc., Class A(a) | | | 21,100 | | | | 2,208,326 | |
| | | | | | | | 5,380,165 | |
| Media - 2.55% | | | | | | | | |
| Walt Disney Co. | | | 14,000 | | | | 1,471,120 | |
| | | | | | | | | |
| Telecommunications - 0.84% | | | | | | | | |
| Verizon Communications, Inc. | | | 10,500 | | | | 485,310 | |
| | | | | | | | | |
| Total Communications | | | | | | | 7,336,595 | |
| | | | | | | | | |
| Consumer, Cyclical - 16.97% | | | | | | | | |
| | | | | | | | | |
| Apparel - 6.24% | | | | | | | | |
| NIKE, Inc., Class B | | | 28,400 | | | | 1,775,000 | |
Under Armour, Inc., Class A(a) | | | 14,400 | | | | 1,160,784 | |
| VF Corp. | | | 10,500 | | | | 653,625 | |
| | | | | | | | 3,589,409 | |
| Auto Parts & Equipment - 1.96% | | | | | | | | |
| Magna International, Inc. | | | 27,800 | | | | 1,127,568 | |
| | | | | | | | | |
| Retail - 8.77% | | | | | | | | |
| Costco Wholesale Corp. | | | 10,300 | | | | 1,663,450 | |
| CVS Health Corp. | | | 16,500 | | | | 1,613,205 | |
| Lowe’s Cos., Inc. | | | 14,200 | | | | 1,079,768 | |
| Starbucks Corp. | | | 11,600 | | | | 696,348 | |
| | | | | | | | 5,052,771 | |
| Total Consumer, Cyclical | | | | | | | 9,769,748 | |
| | | | | | | | | |
| Consumer, Non-Cyclical - 22.09% | | | | | | | | |
| | | | | | | | | |
| Beverages - 1.44% | | | | | | | | |
| PepsiCo, Inc. | | | 8,300 | | | | 829,336 | |
| | | | | | | | | |
| Biotechnology - 8.01% | | | | | | | | |
| Amgen, Inc. | | | 2,600 | | | | 422,058 | |
Biogen, Inc.(a) | | | 1,630 | | | | 499,350 | |
Celgene Corp.(a) | | | 15,000 | | | | 1,796,400 | |
See accompanying notes which are an integral part of these financial statements.
| 8 | www.northeastinvestorsgrowthfund.com |
| Northeast Investors Growth Fund | Schedule of Investments |
December 31, 2015
| Description | | Shares | | | $ Value | |
| Consumer, Non-Cyclical - 22.09% (continued) | | | | | | |
| Gilead Sciences, Inc. | | | 18,700 | | | $ | 1,892,253 | |
| | | | | | | | 4,610,061 | |
| Food - 2.27% | | | | | | | | |
| Mondelez International, Inc., Class A | | | 29,150 | | | | 1,307,086 | |
| | | | | | | | | |
| Household Products/Wares - 2.20% | | | | | | | | |
| Clorox Co. | | | 10,000 | | | | 1,268,300 | |
| | | | | | | | | |
| Pharmaceuticals - 8.17% | | | | | | | | |
Alkermes PLC(a) | | | 5,500 | | | | 436,590 | |
| Bristol-Myers Squibb Co. | | | 19,700 | | | | 1,355,163 | |
| Johnson & Johnson | | | 10,740 | | | | 1,103,213 | |
| Merck & Co., Inc. | | | 8,000 | | | | 422,560 | |
| Perrigo Co. PLC | | | 4,700 | | | | 680,090 | |
| Pfizer, Inc. | | | 22,000 | | | | 710,160 | |
| | | | | | | | 4,707,776 | |
| Total Consumer, Non-Cyclical | | | | | | | 12,722,559 | |
| | | | | | | | | |
| Energy - 4.35% | | | | | | | | |
| | | | | | | | | |
| Oil & Gas - 4.35% | | | | | | | | |
| Chevron Corp. | | | 5,200 | | | | 467,792 | |
| ConocoPhillips | | | 6,500 | | | | 303,485 | |
| Exxon Mobil Corp. | | | 14,100 | | | | 1,099,095 | |
| Occidental Petroleum Corp. | | | 9,400 | | | | 635,534 | |
| | | | | | | | 2,505,906 | |
| Total Energy | | | | | | | 2,505,906 | |
| | | | | | | | | |
| Financial - 19.39% | | | | | | | | |
| | | | | | | | | |
| Banks - 10.01% | | | | | | | | |
| Bank of America Corp. | | | 47,600 | | | | 801,108 | |
| Citigroup Inc | | | 11,300 | | | | 584,775 | |
| First Republic Bank | | | 10,200 | | | | 673,812 | |
| Goldman Sachs Group, Inc. | | | 9,500 | | | | 1,712,185 | |
| JPMorgan Chase & Co. | | | 13,400 | | | | 884,802 | |
| Wells Fargo & Co. | | | 20,350 | | | | 1,106,226 | |
| | | | | | | | 5,762,908 | |
| Diversified Financial Services - 4.98% | | | | | | | | |
| BlackRock, Inc. | | | 1,650 | | | | 561,858 | |
| Visa, Inc., Class A | | | 29,700 | | | | 2,303,235 | |
| | | | | | | | 2,865,093 | |
See accompanying notes which are an integral part of these financial statements.
| Annual Report | December 31, 2015 | 9 |
| Northeast Investors Growth Fund | Schedule of Investments |
December 31, 2015
| Description | | Shares | | | $ Value | |
| Financial - 19.39% (continued) | | | | | | |
| Insurance - 2.80% | | | | | | |
| American International Group, Inc. | | | 7,700 | | | $ | 477,169 | |
Berkshire Hathaway, Inc., Class B(a) | | | 8,600 | | | | 1,135,544 | |
| | | | | | | | 1,612,713 | |
| Real Estate Investment Trusts - 1.60% | | | | | | | | |
| American Tower Corp. | | | 9,500 | | | | 921,025 | |
| | | | | | | | | |
| Total Financial | | | | | | | 11,161,739 | |
| | | | | | | | | |
| Industrial - 9.84% | | | | | | | | |
| | | | | | | | | |
| Aerospace/Defense - 0.57% | | | | | | | | |
| United Technologies Corp. | | | 3,400 | | | | 326,638 | |
| | | | | | | | | |
| Electronics - 3.47% | | | | | | | | |
| Honeywell International, Inc. | | | 19,300 | | | | 1,998,901 | |
| | | | | | | | | |
| Miscellaneous Manufacturing - 3.51% | | | | | | | | |
| 3M Co. | | | 5,800 | | | | 873,712 | |
| General Electric Co. | | | 36,800 | | | | 1,146,320 | |
| | | | | | | | 2,020,032 | |
| Transportation - 2.29% | | | | | | | | |
| Union Pacific Corp. | | | 16,900 | | | | 1,321,580 | |
| | | | | | | | | |
| Total Industrial | | | | | | | 5,667,151 | |
| | | | | | | | | |
| Technology - 13.28% | | | | | | | | |
| | | | | | | | | |
| Computers - 6.27% | | | | | | | | |
| Apple, Inc. | | | 22,850 | | | | 2,405,191 | |
Manhattan Associates, Inc.(a) | | | 18,200 | | | | 1,204,294 | |
| | | | | | | | 3,609,485 | |
| Semiconductors - 2.25% | | | | | | | | |
NXP Semiconductors N.V.(a) | | | 15,400 | | | | 1,297,450 | |
| | | | | | | | | |
| Software - 4.76% | | | | | | | | |
Akamai Technologies, Inc.(a) | | | 24,500 | | | | 1,289,435 | |
See accompanying notes which are an integral part of these financial statements.
| 10 | www.northeastinvestorsgrowthfund.com |
| Northeast Investors Growth Fund | Schedule of Investments |
| Description | | Shares | | | $ Value | |
| Technology - 13.28% (continued) | | | | | | |
| Microsoft Corp. | | | 26,200 | | | $ | 1,453,576 | |
| | | | | | | | 2,743,011 | |
| Total Technology | | | | | | | 7,649,946 | |
| | | | | | | | | |
| Total Common Stocks | | | | | | | | |
| (Cost $44,094,571) | | | | | | | 56,813,644 | |
| | | | | | | | | |
| Total Investments - 98.65% | | | | | | | | |
| (Cost $44,094,571) | | | | | | | 56,813,644 | |
| | | | | | | | | |
| Other Assets in Excess of Liabilities - 1.35% | | | | | | | 779,364 | |
| | | | | | | | | |
| Total Net Assets - 100.00% | | | | | | $ | 57,593,008 | |
(a) | Non-income producing security. Includes securities which did not pay at least one dividend in the year preceding the date of this statement. |
Common Abbreviations:
(N.V.) Naamloze Vennootschap is the Dutch term for a public limited liability corporation.
(PLC) Public Limited Company.
See accompanying notes which are an integral part of these financial statements.
| Annual Report | December 31, 2015 | 11 |
| Northeast Investors Growth Fund | Statement of Assets and Liabilities |
December 31, 2015
| ASSETS: | | | |
| Investments, at market value (Cost $44,094,571) | | $ | 56,813,644 | |
| Cash | | | 844,223 | |
| Dividends receivable | | | 58,854 | |
| Receivable for shares sold | | | 1,113 | |
| Other assets | | | 13,787 | |
| Total Assets | | | 57,731,621 | |
| | | | | |
| LIABILITIES: | | | | |
| Accrued audit and tax expense | | | 46,300 | |
| Accrued investment advisory fee | | | 33,438 | |
| Accrued insurance | | | 13,799 | |
| Accrued legal fees | | | 10,129 | |
| Accrued administration fees | | | 8,659 | |
| Accrued printing fees | | | 7,817 | |
| Payable for shares redeemed | | | 2,683 | |
| Accrued other expenses | | | 15,788 | |
| Total Liabilities | | | 138,613 | |
| NET ASSETS | | $ | 57,593,008 | |
| | | | | |
| NET ASSETS CONSISTS OF: | | | | |
| Paid-in capital | | $ | 44,129,486 | |
| Accumulated net realized gain | | | 744,449 | |
| Net unrealized appreciation on investments | | | 12,719,073 | |
| NET ASSETS | | $ | 57,593,008 | |
| | | | | |
| Shares of beneficial interest outstanding (unlimited number of shares, no par value common stock authorized) | | | 3,765,346 | |
| Net Asset Value, offering and redemption price per share | | $ | 15.30 | |
See accompanying notes which are an integral part of these financial statements.
| 12 | www.northeastinvestorsgrowthfund.com |
| Northeast Investors Growth Fund | Statement of Operations |
For the Year Ended December 31, 2015
| INVESTMENT INCOME: | | | |
| Dividends, (net of foreign withholding taxes of $3,670) | | $ | 945,670 | |
| Total Investment Income | | | 945,670 | |
| | | | | |
| EXPENSES: | | | | |
| Investment advisory fee (Note D) | | | 411,292 | |
| Administrative fees (Note C) | | | 101,277 | |
| Transfer agent fees (Note C) | | | 86,892 | |
| Audit and tax fees | | | 45,237 | |
| Insurance | | | 31,390 | |
| Legal fees | | | 31,328 | |
| Registration and filing fees | | | 30,513 | |
| Trustee fees | | | 30,000 | |
| Printing fees | | | 16,223 | |
| Custodian fees | | | 9,793 | |
| Miscellaneous fees | | | 15,417 | |
| Total Expenses | | | 809,362 | |
| Net Investment Income | | | 136,308 | |
| | | | | |
| REALIZED AND UNREALIZED GAIN ON INVESTMENTS: | | | | |
| Net realized gain on investment transactions | | | 7,504,907 | |
| Net change in unrealized depreciation on investments | | | (4,754,826 | ) |
| Net Gain on Investments | | | 2,750,081 | |
| NET INCREASE IN NET ASSETS RESULTING FROM OPERATIONS | | $ | 2,886,389 | |
See accompanying notes which are an integral part of these financial statements.
| Annual Report | December 31, 2015 | 13 |
| Northeast Investors Growth Fund | Statements of Changes in Net Assets |
| | | Year Ended
December 31, 2015 | | | Year Ended
December 31, 2014 | |
| INCREASE IN NET ASSETS FROM OPERATIONS: | | | | | | |
| Net investment income/(loss) | | $ | 136,308 | | | $ | (203,262 | ) |
| Net realized gain on investment transactions | | | 7,504,907 | | | | 5,751,819 | |
| Net change in unrealized depreciation on investments | | | (4,754,826 | ) | | | (2,173,381 | ) |
| Net Increase in Net Assets Resulting from Operations | | | 2,886,389 | | | | 3,375,176 | |
| | | | | | | | | |
| DISTRIBUTIONS TO SHAREHOLDERS: | | | | | | | | |
| From net investment income | | | (140,797 | ) | | | – | |
| From net realized gains on investments | | | (6,728,832 | ) | | | (6,039,228 | ) |
| Net Decrease in Net Assets from Distributions | | | (6,869,629 | ) | | | (6,039,228 | ) |
| | | | | | | | | |
| FUND SHARE TRANSACTIONS: | | | | | | | | |
| Proceeds from sale of shares | | | 2,446,581 | | | | 608,934 | |
| Reinvestment of distributions | | | 6,090,965 | | | | 5,439,311 | |
| Cost of shares redeemed | | | (12,942,348 | ) | | | (13,457,354 | ) |
| Net Decrease in Net Assets from Fund Share Transactions | | | (4,404,802 | ) | | | (7,409,109 | ) |
| | | | | | | | | |
| Net Decrease in Net Assets | | | (8,388,042 | ) | | | (10,073,161 | ) |
| | | | | | | | | |
| NET ASSETS: | | | | | | | | |
| Beginning of year | | | 65,981,050 | | | | 76,054,211 | |
| End of year* | | $ | 57,593,008 | | | $ | 65,981,050 | |
| *Includes accumulated undistributed net investment income: | | $ | – | | | $ | – | |
See accompanying notes which are an integral part of these financial statements.
| 14 | www.northeastinvestorsgrowthfund.com |
Intentionally Left Blank
Northeast Investors Growth Fund
| NET ASSET VALUE, BEGINNING OF YEAR INVESTMENT OPERATIONS: |
Net investment income/(loss)(a) |
| Net realized and unrealized gain/(loss) on investments |
| Total from Investment Operations |
| |
| LESS DISTRIBUTIONS TO SHAREHOLDERS |
| From net investment income |
| From net realized gains |
| Total Distributions |
| |
| NET ASSET VALUE, END OF YEAR |
| |
TOTAL RETURN(b) |
| |
| RATIOS AND SUPPLEMENTAL DATA: |
| |
| Net assets, end of year (in 000s) |
| Ratio to average daily net assets: |
| Expenses |
| Net investment income/(loss) |
| PORTFOLIO TURNOVER RATE |
| (a) | Average share method used to calculate per share data. |
| (b) | Total return represents the rate that the investor would have earned or lost on an investment in the Fund, assuming reinvestment of dividends. |
See accompanying notes which are an integral part of these financial statements.
| 16 | www.northeastinvestorsgrowthfund.com |
Financial Highlights
For a share outstanding through the years presented
Year Ended
December 31,
2015 | | | Year Ended
December 31,
2014 | | | Year Ended
December 31,
2013 | | | Year Ended
December 31,
2012 | | | Year Ended
December 31,
2011 | |
| $ | 16.58 | | | $ | 17.26 | | | $ | 16.67 | | | $ | 16.22 | | | $ | 17.60 | |
| | | | | | | | | | | | | | | | | | | |
| | 0.04 | | | | (0.05 | ) | | | 0.04 | | | | 0.08 | | | | 0.02 | |
| | 0.70 | | | | 1.01 | | | | 4.23 | | | | 1.94 | | | | (1.40 | ) |
| | 0.74 | | | | 0.96 | | | | 4.27 | | | | 2.02 | | | | (1.38 | ) |
| | | | | | | | | | | | | | | | | | | |
| | | | | | | | | | | | | | | | | | | |
| | (0.04 | ) | | | – | | | | (0.08 | ) | | | (0.10 | ) | | | – | |
| | (1.98 | ) | | | (1.64 | ) | | | (3.60 | ) | | | (1.47 | ) | | | – | |
| | (2.02 | ) | | | (1.64 | ) | | | (3.68 | ) | | | (1.57 | ) | | | – | |
| | | | | | | | | | | | | | | | | | | |
| $ | 15.30 | | | $ | 16.58 | | | $ | 17.26 | | | $ | 16.67 | | | $ | 16.22 | |
| | | | | | | | | | | | | | | | | | | |
| | 4.41 | % | | | 5.47 | % | | | 26.11 | % | | | 12.42 | % | | | -7.84 | % |
| | | | | | | | | | | | | | | | | | | |
| | | | | | | | | | | | | | | | | | | |
| $ | 57,593 | | | $ | 65,981 | | | $ | 76,054 | | | $ | 73,016 | | | $ | 76,191 | |
| | 1.30 | % | | | 1.25 | % | | | 1.23 | % | | | 1.38 | % | | | 1.40 | % |
| | 0.22 | % | | | (0.29 | )% | | | 0.22 | % | | | 0.44 | % | | | 0.14 | % |
| | 28 | % | | | 58 | % | | | 82 | % | | | 36 | % | | | 49 | % |
| Annual Report | December 31, 2015 | 17 |
| Northeast Investors Growth Fund | Notes to Financial Statements |
NOTE A–ORGANIZATION
Northeast Investors Growth Fund (the “Fund”) is a diversified, no-load, open-end, series-type management investment company registered under the Investment Company Act of 1940, as amended. The Fund presently consists of one portfolio and is organized as a Massachusetts business trust.
The Fund’s objective is to produce long-term capital appreciation for its shareholders. The Fund maintains a flexible investment policy which primarily targets common stocks of large domestic companies. The Fund emphasizes well-known companies which it believes to have strong management, solid financial fundamentals and which are established leaders in their industries. The Fund generally invests in companies with market capitalizations in excess of $10 billion.
NOTE B–SIGNIFICANT ACCOUNTING POLICIES
The Fund is considered an investment company for financial reporting purposes under accounting principles generally accepted in the United States of America (“U.S. GAAP”). Significant accounting policies of the Fund, which are in conformity with U.S. GAAP are as follows:
Use of Estimates: The preparation of financial statements in conformity with U.S. GAAP requires management to make estimates and assumptions that affect the reported amounts of assets and liabilities and disclosure of contingent assets and liabilities at the date of the financial statements and the reported amounts of revenues and expenses during the reporting period. Actual results could differ from those estimates.
Valuation of Investments: Investments in securities traded on national securities exchanges are valued based upon closing prices on the exchanges or last sales price. Securities traded in the over-the-counter market and listed securities with no sales on the date of valuation are valued at closing bid prices. Other short-term investments, when held by the Fund, are valued at cost plus earned discount or interest which approximates market value.
Securities and other assets for which market quotations are not readily available or are deemed unreliable (including restricted securities, if any) are valued at their fair value as determined in good faith under consistently applied procedures approved by the Board of Trustees. Methodologies and factors used to determine fair value of securities may include, but are not limited to, contractual restrictions, information of any recent sales, the analysis of the company’s financial statements, quotations or evaluated prices from broker-dealers and/or pricing services and information obtained from analysts. The Fund may use fair value pricing for foreign securities if a material event occurs that may effect the price of a security after the close of the foreign market or exchange (or on days the foreign market is closed) but before the Fund prices its portfolio, generally at 4:00 p.m. EST. Fair value pricing may also be used for securities acquired as a result of corporate restructurings or reorganizations as reliable market quotations for such issues may not be readily available. At December 31, 2015, there were no securities priced at fair value as determined in good faith.
Investment Transactions: Investment transactions are accounted for as of trade date. Realized gains and losses on investment transactions are determined on the identified cost basis.
| 18 | www.northeastinvestorsgrowthfund.com |
| Northeast Investors Growth Fund | Notes to Financial Statements |
Investment Income: Interest income is recognized on an accrual basis. Dividend income is recorded on the ex-dividend date, net of applicable withholding taxes.
Federal Income Taxes: No provision for federal income taxes is necessary since the Fund has elected to qualify under subchapter M of the Internal Revenue Code of 1986, as amended, and its policy is to distribute substantially all of its taxable income, including net realized capital gains, within the prescribed time periods.
As of and during the year ended December 31, 2015, the Fund did not have a liability for any unrecognized tax benefits. The Fund recognized interest and penalties, if any, related to unrecognized tax benefits as income tax expense in the Statement of Operations. During the year ended, the Fund did not incur any interest or penalties. The Fund is subject to examination by U.S. federal tax authorities for tax years 2012 through 2015.
Dividends and Distributions to Shareholders: Income and capital gain distributions are determined in accordance with income tax regulations which may differ from U.S. GAAP. Permanent book and tax differences relating to shareholder distributions will result in reclassifications to paid-in capital. The Fund’s distributions and dividend income are recorded on the ex-dividend date.
Indemnification: In the normal course of business, the Fund may enter into contracts that contain general indemnification clauses. The Fund’s maximum exposure under these arrangements is unknown, as this would involve future claims against the Fund that have not yet occurred. Based on experience, the Fund expects the risk of loss to be remote.
Net Asset Value: In determining the net asset value per share, rounding adjustments are made for fractions of a cent to the next higher cent.
Concentration of Credit Risk: The Fund places its cash with one banking institution, which is insured by Federal Deposit Insurance Corporation (FDIC). The FDIC limit is $250,000. At various times throughout the year, the amount on deposit may exceed the FDIC limit and subject the Fund to a credit risk. The Fund does not believe that such deposits are subject to any unusual risk associated with investment activities.
Subsequent Events: In accordance with U.S. GAAP, management has evaluated subsequent events through the date these financial statements were issued. All subsequent events determined to be relevant and material to these financial statements as a whole have been accordingly disclosed.
NOTE C–FUND ADMINISTRATION, ACCOUNTING, TRANSFER AGENCY, SHAREHOLDER SERVICING AND OTHER AGREEMENTS
ALPS Fund Services, Inc. (“ALPS”) serves as Fund administrator for which it is compensated by the Fund. ALPS also serves as fund accountant, transfer agent and shareholder servicing agent. ALPS carries out all functions related to the maintenance of shareholder accounts, acquisition and redemption of shares and mailings to shareholders. ALPS also determines the Fund’s Net Asset Value.
Union Bank serves as custodian of portfolio securities and other assets.
| Annual Report | December 31, 2015 | 19 |
| Northeast Investors Growth Fund | Notes to Financial Statements |
December 31, 2015
NOTE D–INVESTMENT ADVISORY AND SERVICE CONTRACT
Northeast Management & Research Company, Inc. (“NMR”) provides the Fund with the services of a Chief Compliance Officer and anti-money laundering officer. The Fund has an investment advisory and service contract with NMR (the “Advisor”). Under the contract, the Fund pays the Advisor an annual fee at a maximum rate of 1.00% of the first $10,000,000 of the Fund’s average daily net assets, 3/4 of 1.00% of the next $20,000,000 and 1/2 of 1.00% of the average daily net assets in excess of $30,000,000, in monthly installments on the basis of the average daily net assets during the month preceding payment.
Under the Fund’s Investment Advisory Agreement (the “Agreement”), personnel of the Advisor provide the Fund with advice and assistance in the choice of investments and the execution of securities transactions, and otherwise maintain the Fund’s organization. Compensation to officers of the Fund or Advisor for services rendered to the Fund or to the Advisor are paid by the Advisor. Messrs. John C. Emery, Michael Baldwin, and F. Washington Jarvis, the Fund's disinterested Trustees, are not officers or directors of the Advisor. The compensation of all disinterested Trustees of the Fund is borne by the Fund.
NOTE E–PURCHASES AND SALES OF INVESTMENTS
The cost of purchases and proceeds from sales of investments, other than short-term securities, aggregated $17,282,019 and $28,581,549, respectively, for the year ended December 31, 2015.
NOTE F–FUND SHARE TRANSACTIONS
Transactions in shares of beneficial interest for the years ended were as follows:
| | | 12/31/2015 | | | 12/31/2014 | |
| Shares sold | | | 140,977 | | | | 36,045 | |
| Shares reinvested | | | 396,032 | | | | 325,122 | |
| Shares redeemed | | | (753,248 | ) | | | (787,376 | ) |
| Net decrease in shares outstanding | | | (216,239 | ) | | | (426,209 | ) |
NOTE G–TAX BASIS INFORMATION
For the year ended December 31, 2015, the following reclassifications, which had no impact on results of operations or net assets, were recorded to reflect tax character:
| Paid-in Capital | | $ | – | |
| Accumulated Net Investment Income | | | 4,489 | |
| Accumulated Net Realized Gain on Investments | | | (4,489 | ) |
The tax character of distributions paid for the years ended December 31, 2015 and December 31, 2014 were as follows:
| Distributions Paid From: | | 2015 | | | 2014 | |
| Ordinary Income | | $ | 136,308 | | | $ | – | |
| Long Term Capital Gains | | | 6,733,321 | | | | 6,039,228 | |
| Total | | $ | 6,869,629 | | | $ | 6,039,228 | |
| 20 | www.northeastinvestorsgrowthfund.com |
| Northeast Investors Growth Fund | Notes to Financial Statements |
December 31, 2015
As of December 31, 2015 the components of distributable earnings on a tax basis were as follows:
| Accumulated net realized gain on investments | | $ | 744,449 | |
| Net unrealized appreciation on investments | | | 12,719,073 | |
| Total accumulated earnings - net | | $ | 13,463,522 | |
At Decemeber 31, 2015 the Fund’s aggregate security unrealized gains and losses based on cost for U.S. federal income tax purposes was as follows:
| Cost of investments for income tax purposes | | $ | 44,094,571 | |
| Aggregate gross appreciation | | $ | 14,005,520 | |
| Aggregate gross depreciation | | | (1,286,447 | ) |
| Net unrealized appreciation | | $ | 12,719,073 | |
NOTE H–FAIR VALUE MEASUREMENTS
Accounting Standards Codification 820 (“ASC 820”), “Fair Value Measurements and Disclosures” established a fair value hierarchy that distinguishes between market data obtained from independent sources (observable inputs) and the Fund’s own market assumptions (unobservable inputs). The inputs or methodologies used for valuing securities are not necessarily an indication of the risk associated with investing in those securities. The various inputs that may be used to determine the value of the Fund’s investments are summarized in the following fair value hierarchy:
| Level 1 - | Unadjusted quoted prices in active markets for identical, unrestricted assets or liabilities that the Fund has the ability to access at the measurement date; |
| Level 2 - | Quoted prices which are not active, quoted prices for similar assets or liabilities in active markets or input other than quoted prices that are observable (either directly or indirectly) for substantially the full term of the asset or liability; and |
| Level 3 - | Significant unobservable prices or inputs (including a Fund’s own assumptions in determining the fair value of investments) where there is little or no market activity for the asset or liability at the measurement date. |
The availability of observable inputs can vary from security to security and is affected by a wide variety of factors, including, for example, the type of security, whether the security is new and not yet established in the marketplace, the liquidity of markets, and other characteristics particular to the security. To the extent that valuation is based on models or inputs that are less observable or unobservable in the market, the determination of fair value requires more judgment. Accordingly, the degree of judgment exercised in determining fair value is greatest for instruments categorized in Level 3.
An investment level within the fair value hierarchy is based on the lowest level input, individually or in the aggregate, that is significant to fair value measurement. The valuation techniques used by the Fund to measure fair value during the year ended December 31, 2015, maximized the use of observable inputs and minimized the use of unobservable inputs.
| Annual Report | December 31, 2015 | 21 |
| Northeast Investors Growth Fund | Notes to Financial Statements |
The following table summarizes the Fund’s investments as of December 31, 2015, based on the inputs used to value them.
| | | Level 1 | | | Level 2 | | | Level 3 | | | Total | |
| Common Stocks | | $ | 56,813,644 | | | $ | – | | | $ | – | | | $ | 56,813,644 | |
| TOTAL | | $ | 56,813,644 | | | $ | – | | | $ | – | | | $ | 56,813,644 | |
For the year ended December 31, 2015, there have been no significant changes to the Fund’s fair value methodologies. Additionally, there were no transfers into or out of assigned levels during the year ended December 31, 2015. It is the Fund’s policy to recognize transfers at the end of the reporting period.
For the year ended December 31, 2015, the Fund did not have significant unobservable inputs (Level 3) used in determining fair value.
| 22 | www.northeastinvestorsgrowthfund.com |
| Northeast Investors Growth Fund | Report of Independent Registered
Public Accounting Firm |
Board of Directors and Shareholders
Northeast Investors Growth Fund
We have audited the accompanying statement of assets and liabilities of Northeast Investors Growth Fund (a Massachusetts trust) (the “Fund”), including the schedule of investments, as of December 31, 2015, and the related statements of operations for the year then ended, the statements of changes in net assets for each of the two years in the period then ended, and the financial highlights for each of the four years in the period then ended. These financial statements and financial highlights are the responsibility of the Fund’s management. Our responsibility is to express an opinion on these financial statements and financial highlights based on our audits. The financial highlights for the period ended December 31, 2011 was audited by other auditors. Those auditors expressed an unqualified opinion on those financial highlights in their report dated February 27, 2012.
We conducted our audits in accordance with the standards of the Public Company Accounting Oversight Board (United States). Those standards require that we plan and perform the audit to obtain reasonable assurance about whether the financial statements and financial highlights are free of material misstatement. We were not engaged to perform an audit of the Fund’s internal control over financial reporting. Our audits included consideration of internal control over financial reporting as a basis for designing audit procedures that are appropriate in the circumstances, but not for the purpose of expressing an opinion on the effectiveness of the Fund’s internal control over financial reporting. Accordingly, we express no such opinion. An audit also includes examining, on a test basis, evidence supporting the amounts and disclosures in the financial statements, assessing the accounting principles used and significant estimates made by management, as well as evaluating the overall financial statement presentation. Our procedures included confirmation of securities owned as of December 31, 2015, by correspondence with the custodian. We believe that our audits provide a reasonable basis for our opinion.
In our opinion, the financial statements and financial highlights referred to above present fairly, in all material respects, the financial position of Northeast Investors Growth Fund as of December 31, 2015, and the results of its operations for the year then ended, the changes in its net assets for each of the two years in the period then ended and the financial highlights for each of the four years in the period then ended in conformity with accounting principles generally accepted in the United States of America.
| Annual Report | December 31, 2015 | 23 |
| Northeast Investors Growth Fund | Additional Information |
December 31, 2015 (Unaudited)
1. PROXY VOTING POLICIES AND VOTING RECORD
A description of the policies and procedures that the Fund uses to vote proxies relating to portfolio securities is available without charge upon request by calling toll-free 1-855-755-6344, on the Fund’s website at www.northeastinvestorsgrowthfund.com or on the Securities and Exchange Commission’s (“SEC”) website at http://www.sec.gov. Information regarding how the Fund voted proxies relating to portfolio securities during the most recent 12-month period ended June 30th is available without charge upon request by calling toll-free 1-855-755-6344, or on the SEC’s website at http://www.sec.gov.
2. QUARTERLY PORTFOLIO HOLDINGS
The Fund files a complete listing of portfolio holdings with the SEC as of the first and third quarters of each fiscal year on Form N-Q. The filings are available upon request by calling 1-855-755-6344. Furthermore, you may obtain a copy of the filing on the SEC’s website at http://www.sec.gov. The Fund’s Form N-Q may also be reviewed and copied at the SEC’s Public Reference Room in Washington, D.C., and information on the operation of the Public Reference Room may be obtained by calling 1-800-SEC-0330.
3. TAX INFORMATION
The Fund designates the following for federal income tax purposes for distributions made during the calendar year ended December 31, 2015:
| Fund | Dividends Received Deduction | Qualified Dividend Income |
| Northeast Investors Growth Fund | 100% | 100% |
The Fund will notify shareholders in early 2016 of amounts paid to them by the Fund, if any, during the calendar year 2015.
Pursuant to Section 852(b)(3) of the Internal Revenue Code, Northeast Investors Growth Fund designated $6,733,321 as long-term capital gain dividends.
| 24 | www.northeastinvestorsgrowthfund.com |
| Northeast Investors Growth Fund | Trustees & Officers |
December 31, 2015 (Unaudited)
The Trustees of the Fund are William A. Oates Jr., John C. Emery, Michael Baldwin, and F. Washington Jarvis. Under Massachusetts law, the Trustees are generally responsible for overseeing the operation and management of the Fund. The table below provides certain information about the Fund’s Trustees and Officers. The mailing address for the Trustees and Officers of the Fund is 100 High Street, Suite 1000, Boston, MA 02110-2301.
| Name/Age/Service* | Position | Principal Occupation(s) and Other Directorships During the Past Five Years |
| Interested Trustees*** and Fund Officers |
William A. Oates, Jr.**
Age: 73
Years of Service: 35 | Trustee and President | Trustee and President of Northeast Investors Growth Fund; President and Director of Northeast Investment Management, Inc.; President and Director of Northeast Management & Research Co., Inc. |
Robert B. Minturn Age: 76 Years of Service: 35 | Clerk; Vice President; Chief Legal Officer | Officer of Northeast Investors Growth Fund; Officer of Northeast Investors Trust (until December 2014), Director and Officer of Northeast Investment Management, Inc. (until June 2015) |
John F. Francini, Jr Age: 47 Years of Service: 8 | Chief Financial Officer | Officer of Northeast Investors Growth Fund; Director and Officer of Northeast Investment Management, Inc. and Northeast Management & Research Co., Inc. |
Richard G. Manoogian Age: 52 Years of Service: 4 | Chief Compliance Officer | Chief Compliance Officer of Northeast Investors Growth Fund; Director and Chief Compliance Officer of Northeast Investment Management, Inc.; Chief Compliance Officer of Northeast Management & Research Co., Inc. |
Nancy M. Mulligan Age: 48 Years of Service: 8 | Vice President | Officer of Northeast Investors Growth Fund; Director and Officer of Northeast Investment Management, Inc. and Northeast Management & Research Co., Inc. |
Robert M. Kane Age: 40 Years of Service: 15 | Vice President | Officer of Northeast Investors Growth Fund (Chief Compliance Officer until Feb 2012); Officer of Northeast Investment Management, Inc. |
| * | The Trustees serve until their resignation or the appointment of a successor and the officers serve at the pleasure of the Trustees. |
| ** | Mr. Oates is an interested Trustee because of his affiliation with the Fund’s investment adviser. |
| *** | None of the Trustees are directors or Trustees of any other affiliated or unaffiliated registered investment companies nor do they hold directorships in other public companies. |
| Independent Trustees*** | |
Michael Baldwin Age: 75 Years of Service: 16 | Trustee | Partner, Baldwin Brothers, Registered Investment Advisor |
John C. Emery Age: 85 Years of Service: 35 | Trustee | Counsel, Law Firm of Sullivan & Worcester LLP; President of Boston Investment Company |
F. Washington Jarvis Age: 76 Years of Service: 12 | Trustee | Director, ELM Program, Yale Divinity School; Headmaster Emeritus, Roxbury Latin School |
| *** | None of the Trustees are directors or Trustees of any other affiliated or unaffiliated registered investment companies nor do they hold directorships in other public companies. |
| Annual Report | December 31, 2015 | 25 |
| TRUSTEES
William A. Oates, Jr.
Michael Baldwin
John C. Emery
F. Washington Jarvis
OFFICERS
William A. Oates, Jr., PresidentRobert B. Minturn, Vice President, Clerk & Chief Legal Officer
John F. Francini, Jr., Vice President & Chief Financial Officer
Richard G. Manoogian, Vice President & Chief Compliance Officer
Nancy M. Mulligan, Vice President
Robert M. Kane, Vice President
INVESTMENT ADVISOR
Northeast Management & Research Company, Inc.
100 High Street
Boston, Massachusetts 02110 CUSTODIAN
Union Bank
350 California Street, 6th Floor
San Francisco, CA 94104 LEGAL COUNSEL
Wilmer Cutler Pickering Hale and Dorr LLP
60 State Street
Boston, Massachusetts 02109
TRANSFER AGENT
ALPS Fund Services, Inc.
1290 Broadway Suite 1100
Denver, Colorado 80203
INDEPENDENT REGISTERED PUBLIC ACCOUNTING FIRM
Grant Thornton LLP
757 Third Avenue
New York, NY 10017 |
This report and the financial statements contained herein are submitted for the general information of the shareholders of the Fund. This report is not authorized for distribution to prospective investors in the Fund unless preceded or accompanied by an effective prospectus. Past performance is not predictive of future results. You may lose money by investing in the Fund. The information in this letter should not be construed as a recommendation to purchase or sell a particular security, and there is no assurance the securities described remain part of the Fund’s portfolio today.
Shares of the Fund are sold to investors at net asset value by Northeast Investors Growth Fund 100 High Street Boston, Massachusetts 02110 855-755-NEIG (6344) www.northeastinvestorsgrowthfund.com Must be preceded or accompanied by a prospectus. | |
Item 2. Code of Ethics
The registrant has adopted a code of ethics that applies to the registrant's principal executive officer and principal financial officer. A copy of the code of ethics is filed as an Exhibit to registrant's Report on this Form N-CSR for its fiscal year ended December 31, 2015. The registrant has not granted any waivers from any provisions of the code of ethics during the covered period.
Item 3. Audit Committee Financial Expert.
The registrant does not have an Audit Committee Financial Expert. Although the members of the registrant's Audit Committee have a variety of business and investment experience, none of them has been determined to meet the technical qualifications required in order to meet the definition of an Audit Committee Financial Expert under this Item. The registrant's trustee who is considered to be an "interested person" as defined in Section 2(a)(19) under the Investment Company of 1940, as amended, does possess such qualifications, but it has been determined that the Audit Committee should consist entirely of independent trustees. The Audit Committee, under its charter, has the ability to retain independent advisers if it deems it necessary or appropriate without the need to seek approval from the management of the Fund.
Item 4. Principal Accountant Fees and Services.
(a) Audit Fees. The aggregate fees billed for the registrant's fiscal years ended December 31, 2015 and December 31, 2014 for professional services rendered by the registrant's principal accountant for audit of its annual financial statements or services that are normally provided by such accountant in connection with statutory and regulatory filings were $40,000, and $40,000 respectively.
(b) Audit-Related Fees. The aggregate fees billed for the registrant's fiscal year ended December 31, 2015 and December 31, 2014 for assurance and related services by the registrant's principal accountant reasonably related to the performance of audit of the registrant's financial statements and not reported under Paragraph (a) of this Item were $0 and 0 respectively. Such services consisted of a report of the Fund's transfer agent internal controls pursuant to rule 17AD-13, semi-annual report review and a report on the Fund's anti-money laundering controls and policies.
(c) Tax Fees. The aggregate fees billed in the registrant's fiscal years ended December 31, 2015 and December 31, 2014 for professional services rendered by the registrant's principal accountant for tax matters were $4,300 and $4,000 respectively. Such services consisted of the preparation of the registrant's federal income and excise tax returns.
(d) All Other Fees. During the fiscal years ended December 31, 2015 and 2014 the aggregate fees billed for other services rendered by the registrant's principal accountant were $0 and $0.
(e) It is the registrant's policy that all audit and non-audit services provided by the registrant's principal accountant be approved in advance by the Audit Committee, and all of the services described in Paragraphs (a) - (d) of this item were so approved.
(f) The percentage of hours expended on the principal accountant's engagement to audit the registrant's financial statements for the most recent fiscal year that were attributed to work performed by persons other than the principal accountant's full-time, permanent employees was zero percent (0% ).
(g) No non-audit services were provided by the registrant's principal accountant to the registrant's investment adviser. There is no entity affiliated with registrant's investment adviser that provides ongoing services to the registrant.
(h) Not applicable to the registrant.
Item 5. Audit Committee of Listed Registrants.
Not applicable to the registrant.
Item 6. Schedule of Investments
| (a) | Schedule of Investments in securities of unaffiliated issuers as of the close of the reporting period is included as part of the Reports to Stockholders filed under Item 1 of Form N-CSR. |
Item 7. Disclosure of Proxy Voting Policies and Procedures for Closed-End Management Investment Companies.
Not applicable to the registrant.
Item 8. Portfolio Manager of Closed-End Management Investment Companies
Not applicable to the registrant.
Item 9. Purchase of Equity Securities by Closed-End Management Company and Affiliated Purchasers
Not applicable to the registrant.
Item 10. Submission of Matters to a Vote of Security Holders.
No material changes have been made with respect to procedures by which shareholders may recommend nominees for trustee during the covered period.
Item 11. Controls and Procedures.
| (a) | The registrant’s principal executive and principal financial officers, or persons performing similar functions, have concluded that the registrant’s disclosure controls and procedures (as defined in Rule 30a-3(c) under the Act (17 CFR 270.30a-3(c))) are effective, as of a date within 90 days of the filing date of the report that includes the disclosure required by this paragraph, based on their evaluation of these controls and procedures required by Rule 30a-3(b) under the Act (17 CFR 270.30a-3(b)) and Rules 13a-15(b) or 15d-15(b) under the Securities Exchange Act of 1934, as amended (17 CFR 240.13a-15(b) or 240.15d-15(b)). |
| (b) | No changes in the registrant’s internal control over financial reporting (as defined in Rule 30a-3(d) under the Act (17 CFR 270.30a-3(d)) occurred during the registrant’s second fiscal quarter of the period covered by this report that have materially affected, or are reasonably likely to materially affect, the registrant’s internal control over financial reporting. |
Item 12. Exhibits.
| (a)(1) | Code of ethics, or any amendment thereto, that is the subject of disclosure required by Item 2 is attached hereto. |
| (a)(2) | Certifications pursuant to Rule 30a-2(a) under the 1940 Act and Section 302 of the Sarbanes-Oxley Act of 2002 are attached hereto Exhibits 99.302(i) CERT. |
| (b) | Certifications pursuant to Rule 30a-2(b) under the 1940 Act and Section 906 of the Sarbanes-Oxley Act of 2002 are attached hereto Exhibit 99.906CERT. |
SIGNATURES
Pursuant to the requirements of the Securities Exchange Act of 1934 and the Investment Company Act of 1940, the Registrant has duly caused this report to be signed on its behalf by the undersigned, thereunto duly authorized.
| | Northeast Investors Growth Fund |
| | | |
| | By: | /s/ William A. Oates, Jr. |
| | | William A. Oates, Jr. President |
| | | (principal executive officer) |
| | | |
| | Date: | March 2, 2016 |
Pursuant to the requirements of the Securities Exchange Act of 1934 and the Investment Company Act of 1940, this report has been signed below by the following persons on behalf of the registrant and in the capacities and on the dates indicated.
| | By: | /s/ William A. Oates, Jr. |
| | | William A. Oates, Jr. President |
| | | (principal executive officer) |
| | | |
| | Date: | March 2, 2016 |
| | By: | /s/ John F. Francini, Jr. |
| | | John F. Francini, Jr. Chief Financial Officer |
| | | (principal financial officer) |
| | | |
| | Date: | March 2, 2016 |