SECURITIES AND EXCHANGE COMMISSION
Washington, D.C. 20549
FORM 10-K
[X] ANNUAL REPORT PURSUANT TO SECTION 13 OR 15(d) OF THE SECURITIES EXCHANGE ACT OF 1934
For the fiscal year ended December 31, 2019
or
[ ] TRANSITION REPORT PURSUANT TO SECTION 13 OR 15(d) OF THE SECURITIES EXCHANGE ACT OF 1934
For the Transition Period from _____ to _____
Commission File Number 000-09341
SECURITY NATIONAL FINANCIAL CORPORATION
(Exact name of registrant as specified in its charter)
UTAH | 87-0345941 |
| (State or other jurisdiction of incorporation or organization) | (I.R.S. Employer Identification No.) |
123 West Election Road, Draper, Utah | 84020 |
| (Address of principal executive offices) | (Zip Code) |
| | |
| Registrant’s telephone number, including area code: | (801) 264-1060 |
Securities registered pursuant to Section 12(b) of the Act:
Title of each class | Trading symbol | Name of exchange on which registered |
| Class A Common Stock | SNFCA | The Nasdaq Global Select Market |
Securities registered pursuant to Section 12(g) of the Act: None
Indicate by check mark if the registrant is a well-known seasoned issuer, as defined in Rule 405 of the Securities Act of 1933, as amended (“Securities Act”). [ ] Yes [X] No
Indicate by check mark if the registrant is not required to file reports pursuant to Section 13 or Section 15(d) of the Securities Act. [ ] Yes [X] No
Indicate by check mark whether the registrant (1) has filed all reports required to be filed by Section 13 or 15(d) of the Securities Exchange Act of 1934, as amended (“Exchange Act”) during the preceding 12 months (or for such shorter period that the registrant was required to file such reports), and (2) has been subject to such filing requirements for the past 90 days. [X] Yes [ ] No
Indicate by check mark whether the registrant has submitted electronically every Interactive Data File required to be submitted and posted pursuant to Rule 405 of Regulation S-T (§ 232.405 of this chapter) during the preceding 12 months (or for such shorter period that the registrant was required to submit such files). [X] Yes [ ] No
Indicate by check mark if disclosure of delinquent filers pursuant to Item 405 of Regulation S-K (§229.405 of this chapter) is not contained herein, and will not be contained, to the best of registrant’s knowledge, in definitive proxy or information statements incorporated by reference in Part III of this Form 10-K or any amendment to this Form 10-K. [ ]
Indicate by check mark whether the registrant is a large accelerated filer, an accelerated filer, a non-accelerated filer, a smaller reporting company, or an emerging growth company. See the definitions of “large accelerated filer,” “accelerated filer,” “smaller reporting company,” and “emerging growth company” in Rule 12b-2 of the Exchange Act.
Large accelerated filer [ ] | Accelerated filer [ ] |
| | |
Non-accelerated filer [ ] | Smaller reporting company [X] |
| | Emerging growth company [ ] |
If an emerging growth company, indicate by check mark if the registrant has elected not to use the extended transition period for complying with any new or revised financial accounting standards provided pursuant to Section 13(a) of the Exchange Act. [ ]
Indicate by check mark whether the registrant is a shell company (as defined in Rule 12b-2 of the Exchange Act). [ ] Yes [X] No
As of June 30, 2019, the aggregate market value of the registrant’s Class A common stock held by non-affiliates of the registrant was approximately $26,000,000 based on the $4.78 closing sale price of the Class A common stock as reported on The Nasdaq Stock Market.
As of March 30, 2020, there were outstanding 16,142,513 shares of Class A common stock, $2.00 par value per share, and 2,489,215 shares of Class C common stock, $2.00 par value per share.
Documents Incorporated by Reference
None.
Security National Financial Corporation
Form 10-K
For the Fiscal Year Ended December 31, 2019
TABLE OF CONTENTS
| | | Page |
| Part I | |
| | | |
Item 1. | Business | 3 |
| | | |
Item 2. | Properties | 11 |
| | | |
Item 3. | Legal Proceedings | 13 |
| | | |
Item 4. | Mine Safety Disclosures | 15 |
| | | |
| Part II | |
| | | |
Item 5. | Market for Registrant’s Common Equity, Related Stockholder Matters and Issuer Purchases of Equity Securities | 16 |
| | | |
Item 6. | Selected Financial Data | 18 |
| | | |
Item 7. | Management’s Discussion and Analysis of Financial Condition and Results of Operations | 18 |
| | | |
Item 7A. | Quantitative and Qualitative Disclosures About Market Risk | 29
|
| | | |
Item 8. | Financial Statements and Supplementary Data | 30 |
| | | |
Item 9. | Changes in and Disagreements with Accountants on Accounting and Financial Disclosure | 110 |
| | | |
Item 9A. | Controls and Procedures | 110 |
| | | |
Item 9B. | Other Information | 111 |
| | | |
| Part III | |
| | |
Item 10. | Directors, Executive Officers and Corporate Governance | 112 |
| | | |
Item 11. | Executive Compensation | 116 |
| | | |
Item 12. | Security Ownership of Certain Beneficial Owners and Management and Related Stockholder Matters | 126 |
| | | |
Item 13. | Certain Relationships and Related Transactions, and Director Independence | 128 |
| | | |
Item 14. | Principal Accounting Fees and Services | 129 |
| | | |
Part IV | | |
| | | |
Item 15. | Exhibits, Financial Statement Schedules | 129 |
PART I
Item 1. Business
Security National Financial Corporation (the “Company”) operates in three main business segments: life insurance, cemetery and mortuary, and mortgages. The life insurance segment is engaged in the business of selling and servicing selected lines of life insurance, annuity products, and accident and health insurance. These products are marketed in 40 states through a commissioned sales force of independent licensed insurance agents who may also sell insurance products of other companies. The cemetery and mortuary segment consists of eight mortuaries and five cemeteries in the state of Utah and one cemetery in the state of California. The Company also engages in pre-need selling of funeral, cemetery, mortuary, and cremation services through its Utah and California operations. Many of the insurance agents also sell pre-need funeral, cemetery, and cremation services. The mortgage segment originates and underwrites or otherwise purchases residential and commercial loans for new construction, existing homes, and other real estate projects. The mortgage segment operates through 77 retail offices and one wholesale office in 21 states, and is an approved mortgage lender in several other states.
The Company’s design and structure are that each business segment is related to the other business segments and contributes to the profitability of the other segments. The Company’s cemetery and mortuary segment provides a level of public awareness that assists in the sales and marketing of insurance and pre-need cemetery and funeral products. The Company’s insurance segment invests their assets (including, in part, pre-need funeral products and services) in investments authorized by the respective insurance departments of their states of domicile. The Company also pursues growth through acquisitions. The Company’s mortgage segment provides mortgage loans and other real estate investment opportunities.
The Company was organized as a holding company in 1979 when Security National Life Insurance Company (“Security National Life”) became a wholly owned subsidiary of the Company and the former stockholders of Security National Life became stockholders of the Company. Security National Life was formed in 1965 and has acquired or purchased significant blocks of business which include Capital Investors Life Insurance Company (1994), Civil Service Employees Life Insurance Company (1995), Southern Security Life Insurance Company (1998), Menlo Life Insurance Company (1999), Acadian Life Insurance Company (2002), Paramount Security Life Insurance Company (2004), Memorial Insurance Company of America (2005), Capital Reserve Life Insurance Company (2007), Southern Security Life Insurance Company, Inc. (2008), North America Life Insurance Company (2011, 2015), Trans-Western Life Insurance Company (2012), Mothe Life Insurance Company (2012), DLE Life Insurance Company (2012), American Republic Insurance Company (2015), First Guaranty Insurance Company (2016), and Kilpatrick Life Insurance Company (2019).
The cemetery and mortuary operations have also grown through the acquisition of other cemetery and mortuary companies. The cemetery and mortuary companies that the Company has acquired are Holladay Memorial Park, Inc. (1991), Cottonwood Mortuary, Inc. (1991), Deseret Memorial, Inc. (1991), Probst Family Funerals and Cremations L.L.C. (2019), and Heber Valley Funeral Home, Inc. (2019).
In 1993, the Company formed SecurityNational Mortgage Company (“SecurityNational Mortgage”) to originate and refinance residential mortgage loans. In 2012, the Company formed Green Street Mortgage Services, Inc. (now known as EverLEND Mortgage Company) (“EverLEND Mortgage”) also to originate and refinance residential mortgage loans.
See Note 15 of the Notes to Consolidated Financial Statements for additional information regarding business segments of the Company.
Life Insurance
Products
The Company, through Security National Life, issues and distributes selected lines of life insurance and annuities. The Company’s life insurance business includes funeral plans and interest-sensitive life insurance, as well as other traditional life, accident, and health insurance products. The Company places specific marketing emphasis on funeral plans through pre-need planning. The Company’s other insurance subsidiaries, Memorial Insurance Company of America (“Memorial Insurance”), Southern Security Life Insurance Company, Inc. (“Southern Security”), Trans-Western Life Insurance Company (“Trans-Western”), First Guaranty Insurance Company (“First Guaranty”), and Kilpatrick Life Insurance Company (“Kilpatrick”), service and maintain policies that were purchased prior to their acquisition by Security National Life.
A funeral plan is a small face value life insurance policy that generally has face coverage of up to $25,000. The Company believes that funeral plans represent a marketing niche that has lower competition because most insurance companies do not offer similar coverage. The purpose of the funeral plan policy is to pay the costs and expenses incurred at the time of a person’s death. On a per thousand-dollar cost of insurance basis, these policies can be more expensive to the policyholder than many types of non-burial insurance due to their low face amount, requiring the fixed cost of the policy administration to be distributed over a smaller policy size, and the simplified underwriting practices that result in higher mortality costs.
Markets and Distribution
The Company is licensed to sell insurance in 40 states. The Company, in marketing its life insurance products, seeks to locate, develop and service specific niche markets. The Company’s funeral plan policies are sold primarily to persons who range in age from 45 to 85 and have low to moderate income. A majority of the Company’s funeral plan premiums come from the states of Arkansas, California, Florida, Georgia, Louisiana, Mississippi, Texas, and Utah.
The Company sells its life insurance products through direct agents, brokers, and independent licensed agents who may also sell insurance products of other companies. The commissions on life insurance products range from approximately 50% to 120% of first year premiums. In those cases, where the Company utilizes its direct agents in selling such policies, those agents customarily receive advances against future commissions.
In some instances, funeral plan insurance is marketed in conjunction with the Company’s cemetery and mortuary sales force. When it is marketed by that group, the beneficiary is usually the Company’s cemeteries and mortuaries. Thus, death benefits that become payable under the policy are paid to the Company’s cemetery and mortuary subsidiaries to the extent of services performed and products purchased.
In marketing funeral plan insurance, the Company also seeks and obtains third-party endorsements from other cemeteries and mortuaries within its marketing areas. Typically, these cemeteries and mortuaries will provide letters of endorsement and may share in mailing and other lead-generating costs since these businesses are usually made the beneficiary of the policy. The following table summarizes the life insurance business for the five years ended December 31, 2019:
| | | 2019 | | | | | 2018 | | | 2017 | | | 2016 | | | | | 2015 | |
| Life Insurance | | | | | | | | | | | | | | | | | | | |
| Policy/Cert Count as of December 31 | | | 669,064 | | (1 | ) | | | 531,831 | | | | 533,065 | | | | 531,775 | | (2 | ) | | | 509,058 | |
| Insurance in force as of December 31 (omitted 000) | | $ | 2,877,402 | | (1 | ) | | $ | 1,838,488 | | | $ | 1,759,148 | | | $ | 1,672,081 | | (2 | ) | | $ | 2,862,803 | |
| Premiums Collected (omitted 000) | | $ | 78,253 | | (1 | ) | | $ | 74,965 | | | $ | 69,565 | | | $ | 65,220 | | (2 | ) | | $ | 55,780 | |
_____________
| (1) | Includes the acquisition of Kilpatrick |
| | |
| (2) | Includes the acquisition of First Guaranty and the termination of the reinsurance assumed from Servicemembers’ Group Life Insurance (“SGLI”) |
Underwriting
The factors considered in evaluating an application for ordinary life insurance coverage can include the applicant’s age, occupation, general health, and medical history. Upon receipt of a satisfactory (non-funeral plan insurance) application, which contains pertinent medical questions, the Company issues insurance based upon its medical limits and requirements subject to the following general non‑medical limits:
| Age Nearest | | Non‑Medical | |
| Birthday | | Limits | |
| 0‑50 | | $ | 100,000 | |
| 51‑up | | Medical information | |
| | | required (APS or exam) | |
When underwriting life insurance, the Company will sometimes issue policies with higher premium rates for substandard risks.
The Company’s funeral plan insurance is written on a simplified medical application with underwriting requirements being a completed application, a phone inspection on the applicant, and an intelliscript prescription history inquiry. There are several underwriting classes in which an applicant can be placed.
Annuities
Products
The Company’s annuity business includes single premium deferred annuities, flexible premium deferred annuities, and immediate annuities. A single premium deferred annuity is a contract where the individual remits a sum of money to the Company, which is retained on deposit until such time as the individual may wish to annuitize or surrender the contract for cash. A flexible premium deferred annuity gives the contract holder the right to make premium payments of varying amounts or to make no further premium payments after his initial payment. These single and flexible premium deferred annuities can have initial surrender charges. The surrender charges act as a deterrent to individuals who may wish to prematurely surrender their annuity contracts. An immediate annuity is a contract in which the individual remits a sum of money to the Company in return for the Company’s obligation to pay a series of payments on a periodic basis over a designated period of time, such as an individual’s life, or for such other period as may be designated.
Annuities have guaranteed interest rates that range from 1% to 6.5% per annum. Rates above the guaranteed interest rate credited are periodically modified by the Board of Directors at its discretion. In order for the Company to realize a profit on an annuity product, the Company must maintain an interest rate spread between its investment income and the interest rate credited to the annuities. Commissions, issuance expenses, and general and administrative expenses are deducted from this interest rate spread.
Markets and Distribution
The general market for the Company’s annuities is middle to older age individuals. A major source of annuity sales come from direct agents and are sold in conjunction with other insurance sales. If an individual does not qualify for a funeral plan, the agent will often sell that individual an annuity to fund final expenses.
The following table summarizes the annuity business for the five years ended December 31, 2019:
| | | 2019 | | | | | 2018 | | | 2017 | | | 2016 | | | | | 2015 | |
| Annuities Policy/Cert Count as of December 31 | | | 26,565 | | (1 | ) | | | 22,313 | | | | 22,729 | | | | 21,364 | | (2 | ) | | | 12,022 | |
| Deposits Collected (omitted 000) | | $ | 10,400 | | (1 | ) | | $ | 9,644 | | | $ | 10,353 | | | $ | 11,019 | | (2 | ) | | $ | 8,069 | |
_________
| (1) | Includes the acquisition of Kilpatrick |
| (2) | Includes the acquisition of First Guaranty |
Accident and Health
Products
With the acquisition of Capital Investors in 1994, the Company acquired a small block of accident and health policies. Since 1999, the Company has offered a low-cost comprehensive diver’s accident policy that provides worldwide coverage for medical expense reimbursement in the event of a diving accident. With the acquisition of Kilpatrick in 2019, the Company also acquired a small block of accident and health policies.
Markets and Distribution
The Company currently markets its diver’s accident policies through the internet.
The following table summarizes the accident and health insurance business for the five years ended December 31, 2019:
| | | 2019 | | | | | 2018 | | | 2017 | | | 2016 | | | 2015 | |
| Accident and Health Policy/Cert Count as of December 31 | | | 15,133 | | (1 | ) | | | 3,763 | | | | 4,069 | | | | 4,761 | | | | 5,185 | |
| Premiums Collected (omitted 000) | | $ | 110 | | (1 | ) | | $ | 98 | | | $ | 104 | | | $ | 113 | | | $ | 119 | |
________
| (1) | Includes the acquisition of Kilpatrick |
Reinsurance
The primary purpose of reinsurance is to enable an insurance company to issue an insurance policy in an amount larger than the risk the insurance company is willing to assume for itself. The insurance company remains obligated for the amounts reinsured (ceded) in the event the reinsurers do not meet their obligations.
The Company currently cedes and assumes certain risks with various authorized unaffiliated reinsurers pursuant to reinsurance treaties, which are generally renewed annually. The premiums paid by the Company are based on a number of factors, primarily including the age of the insured and the risk ceded to the reinsurer.
It is the Company’s policy to retain no more than $100,000 of ordinary insurance per insured life, with the excess risk being reinsured. The total amount of life insurance reinsured by other companies as of December 31, 2019, was $465,460,000, which represents approximately 16.2% of the Company’s life insurance in force on that date.
See “Management’s Discussion and Analysis of Results of Operations and Financial Condition” and “Notes to Consolidated Financial Statements” for additional disclosure and discussion regarding reinsurance.
Investments
The investments that support the Company’s life insurance and annuity obligations are determined by the investment committees of the Company’s subsidiaries and ratified by the full Board of Directors of the respective subsidiaries. A significant portion of the Company’s investments must meet statutory requirements governing the nature and quality of permitted investments by its insurance subsidiaries. The Company maintains a diversified investment portfolio consisting of common stocks, preferred stocks, municipal bonds, corporate bonds, mortgage loans, real estate, and other securities and investments.
See “Management’s Discussion and Analysis of Results of Operations and Financial Condition” and “Notes to Consolidated Financial Statements” for additional disclosure and discussion regarding investments.
Cemetery and Mortuary
Products
Through its cemetery and mortuary segment, the Company markets a variety of products and services both on a pre-need basis (prior to death) and an at-need basis (at the time of death). The products include: plots, interment vaults, mausoleum crypts, markers, caskets, urns and other death care related products. These services include: professional services of funeral directors, opening and closing of graves, use of chapels and viewing rooms, and use of automobiles and clothing. The Company has a mortuary at each of its cemeteries, other than Holladay Memorial Park and Singing Hills Memorial Park, and has six separate stand-alone mortuary facilities.
Markets and Distribution
The Company’s pre‑need cemetery and mortuary sales are marketed to persons of all ages but are generally purchased by persons 45 years of age and older. The Company is limited in its geographic distribution of these products to areas lying within an approximate 20-mile radius of its mortuaries and cemeteries. The Company’s at-need sales are similarly limited in geographic area.
The Company actively seeks to sell its cemetery and funeral products to customers on a pre‑need basis. The Company employs cemetery sales representatives on a commission basis to sell these products. Many of these pre-need cemetery and mortuary sales representatives are also licensed insurance salesmen and sell funeral plan insurance. In some instances, the Company’s cemetery and mortuary facilities are the named beneficiaries of the funeral plan policies.
Potential customers are located via telephone sales prospecting, responses to letters mailed by the pre-planning consultants, newspaper inserts, referrals, and door-to-door canvassing. The Company trains its sales representatives and helps generate leads for them.
Products
The Company, through its wholly owned subsidiaries, SecurityNational Mortgage and EverLEND Mortgage, are active in the residential real estate market. SecurityNational Mortgage is approved by the U.S. Department of Housing and Urban Development (HUD), the Federal National Mortgage Association (Fannie Mae), and other secondary market investors, to originate a variety of residential mortgage loan products, which are subsequently sold to investors. EverLEND Mortgage is approved by the U.S. Department of Housing and Urban Development (HUD), and other secondary market investors, to originate a variety of residential mortgage loan products, which are subsequently sold to investors. The Company uses internal and external funding sources to fund mortgage loans.
Security National Life originates and funds commercial real estate loans, residential construction loans, and land development loans for internal investment.
Markets and Distribution
The Company’s residential mortgage lending services are marketed primarily to real estate brokers and some independent mortgage loan originators. The Company has a strong retail origination presence in the Utah, Florida, Nevada, and Texas markets in addition to one wholesale branch office located in Utah, with sales representatives in these and other states. See “Management’s Discussion and Analysis of Results of Operations and Financial Condition” and “Notes to Consolidated Financial Statements” for additional disclosure and discussion regarding mortgage loans.
Recent Acquisitions and Other Business Activities
Acquisitions
Acquisition of Kilpatrick Life Insurance Company
On December 13, 2019, the Company, through its wholly-owned subsidiary, Security National Life, completed a stock purchase transaction with Kilpatrick, a Louisiana domiciled insurance company, and Kilpatrick’s shareholders, to purchase all the outstanding shares of common stock of Kilpatrick.
Under the terms of the transaction, as set forth in the Stock Purchase Agreement, dated October 11, 2019, the Company paid purchase consideration at the closing of the transaction equal to $23,779,940 subject to a $1,400,000 holdback that was deposited into an interest bearing escrow account to be held for a period of eighteen months from the closing date.
Acquisition of Probst Family Funerals and Cremations and Heber Valley Funeral Home
On February 15, 2019, the Company, through its wholly-owned subsidiary, Memorial Mortuary Inc., completed an asset purchase transaction with Probst Family Funerals and Cremations, LLC. (“Probst Family Funerals”) and Heber Valley Funeral Home, Inc. (“Heber Valley Funeral Home”). These funeral homes are both located in Heber Valley, a community situated about 45 miles southeast of Salt Lake City.
Under the terms of the transaction, as set forth in the Asset Purchase Agreement, dated February 15, 2019, the Company paid the net purchase price of $3,315,647 for the business and assets of Probst Family Funerals and Heber Valley Funeral Home, subject to a $150,000 holdback.
In August 2019, this escrow account was settled and $137,550 was paid to the prior owners.
Acquisition of Beta Capital Corp.
On June 1, 2018, the Company completed a stock purchase transaction with Beta Capital Corp. ("Beta Capital") and Ronald D. Maxson, the sole owner of all the outstanding shares of common stock of Beta Capital, to purchase all of the outstanding shares of common stock of Beta Capital. Beta Capital is engaged in the operation of a factoring business with the principal purpose of providing funding for funeral homes and mortuaries.
Under the terms of the transaction, as set forth in the Stock Purchase Agreement, dated June 1, 2018, the Company paid Mr. Maxson the purchase consideration at the closing of the transaction equal to the sum of (i) $890,000 in cash plus (ii) the accounts receivable value of $2,515,783, representing the total amount of the Company's outstanding receivables as of the closing date of June 1, 2018, for a total closing payment of $3,405,783. From the $3,405,783 closing payment, a holdback amount equal to $175,000 was deposited into an interest bearing escrow account to be held for a period of eighteen months from the closing date to pay off any uncollected accounts receivable and other liabilities of Beta Capital as of the closing date
. In November 2019, this escrow account was settled and $169,190 was paid to the prior owner.
The Company is capitalizing on the opportunity to develop commercial assets on its existing properties. The cost to acquire existing for-sale assets currently exceeds the replacement costs, thus creating the opportunity for development and redevelopment of the land that the Company currently owns. The Company has developed, or is in the process of developing, assets that have an initial development cost exceeding $100,000,000. The Company plans to continue its development endeavors as the market demands.
Center53 Development
In 2015, the Company broke ground and commenced development on the first phase of its new corporate campus. The anticipated project, comprising nearly 20 acres of land that is currently owned by the Company in the central valley of Salt Lake City, is envisioned to be a multi-year, phased development. At full development, the project will include nearly one million square-feet in six buildings, ranging from four to ten stories, and will be serviced by three parking structures with about 4,000 stalls. The first phase of the project includes a building and a parking garage consisting of nearly 200,000 square feet of office and retail space with 748 parking stalls. This phase of the campus was completed in July 2017 and is currently 71% leased. The Company continues to market this building to potential tenants. The second phase of the project includes a six story building of nearly 200,000 square feet and will be partially occupied by the Company. Construction preparation for the second phase began in March 2020, and the Company anticipates occupying a portion of the building in June 2021 as its corporate headquarters.
Sale of Dry Creek at East Village Apartments
On March 29, 2018, the Company through its wholly owned subsidiary, Security National Life, completed the sale of the Dry Creek at East Village (“Dry Creek”) apartments to a subsidiary of Dinapoli Capital Partners, LLC (“Dinapoli Capital”) pursuant to the terms of the Purchase and Sale Agreement, dated February 14, 2018, between Security National Life and Dinapoli Capital. The purchase price paid for the Dry Creek apartments was $57,000,000. From the proceeds that Security National Life received from the sale of the apartment complex, $26,802,904 was used to pay off an existing loan at Zions First National Bank, N.A., which was secured by a security interest in the apartment complex. A brokerage commission of $285,000 and legal fees and related costs were also paid from the purchase proceeds. The Company’s book basis in Dry Creek was approximately $34,250,000, and the Company recognized a gain of approximately $22,252,000 from the sale in the first quarter of 2018.
Regulation
The Company’s insurance subsidiaries are subject to comprehensive regulation in the jurisdictions in which they do business under statutes and regulations administered by state insurance commissioners. Such regulation relates to, among other things, prior approval of the acquisition of a controlling interest in an insurance company; standards of solvency which must be met and maintained; licensing of insurers and their agents; nature of and limitations on investments; deposits of securities for the benefit of policyholders; approval of policy forms and premium rates; periodic examinations of the affairs of insurance companies; annual and other reports required to be filed on the financial condition of insurers or for other purposes; and requirements regarding aggregate reserves for life policies and annuity contracts, policy claims, unearned premiums, and other matters. The Company’s insurance subsidiaries are subject to this type of regulation in any state in which they are licensed to do business. Such regulation could involve additional costs, restrict operations, or delay implementation of the Company’s business plans.
The Company’s life insurance subsidiaries are currently subject to regulation in Utah, Arkansas, Louisiana, Mississippi and Texas under insurance holding company legislation, and other states where applicable. Generally, intercompany transfers of assets and dividend payments from insurance subsidiaries are subject to prior notice of approval from the state insurance department, if they are deemed “extraordinary” under these statutes. The insurance subsidiaries are required, under state insurance laws, to file detailed annual reports with the supervisory agencies in each of the states in which they do business. Their business and accounts are also subject to examination by these agencies. The Company’s subsidiary, First Guaranty, completed an examination by Louisiana for the three year period ending December 31, 2016. The Company’s subsidiary, Security National Life, has also completed examinations by Arkansas, Mississippi, Texas and Utah for the four year period ending December 31, 2017. The Company’s newly acquired subsidiary, Kilpatrick Life, is currently under examination for the three year period ending December 31, 2018. The Texas Department of Banking also audits pre-need insurance policies that are issued in the state of Texas. Pre-need policies are life and annuity products sold as the funding mechanism for funeral plans through funeral homes by Security National agents. The Company is required to send the Texas Department of Banking an annual report that summarizes the number of policies in force and the face amount or death benefit for each policy. This annual report also indicates the number of new policies issued for that year, all death claims paid that year, and all premiums received.
The Company’s cemetery and mortuary subsidiaries are subject to the Federal Trade Commission’s comprehensive funeral industry rules and to state regulations in the various states where such operations are domiciled. The morticians must be licensed by the respective state in which they provide their services. Similarly, the mortuaries and cemeteries are governed and licensed by state statutes and city ordinances in Utah and California. Reports are required to be kept on file on a yearly basis which include financial information concerning the number of spaces sold and, where applicable, funds provided to the Endowment Care Trust Fund. Licenses are issued annually on the basis of such reports. The cemeteries maintain city or county licenses where they conduct business.
The Company’s mortgage subsidiaries are subject to the rules and regulations of the U.S. Department of Housing and Urban Development (HUD), and to various state licensing acts and regulations and the Consumer Financial Protection Bureau (CFPB). These regulations, among other things, specify minimum capital requirements, procedures for loan origination and underwriting, licensing of brokers and loan officers, quality review audits and the fees that can be charged to borrowers. Each year, the Company is required to have an audit completed for each mortgage subsidiary by an independent registered public accounting firm to verify compliance under some of these regulations. In addition to the government regulations, the Company must meet loan requirements, and underwriting guidelines of various investors who purchase the loans.
The Company’s insurance subsidiaries, Security National Life, First Guaranty and Kilpatrick, are taxed under the Life Insurance Company Tax Act of 1984. Under the act, life insurance companies are taxed at standard corporate rates on life insurance company taxable income. Life insurance company taxable income is gross income less general business deductions and reserves for future policyholder benefits (with modifications). The Company may be subject to the corporate Alternative Minimum Tax (AMT) for tax years ending prior to January 1, 2018. The Tax Cuts and Jobs Act (the “Tax Act”) repealed the corporate AMT for tax years beginning after December 31, 2017. Also, under the Tax Act, December 31, 2017 policyholder surplus account balances result in taxable income over a period of eight years.
Security National Life, First Guaranty and Kilpatrick calculate their life insurance taxable income after establishing a provision representing a portion of the costs of acquisition of such life insurance business. The effect of the provision is that a certain percentage of the Company’s premium income is characterized as deferred expenses and recognized over a five or ten-year period. The Tax Act changed this recognition period for amounts deferred after December 31, 2017 to a five or fifteen-year period.
The Company’s non‑life insurance company subsidiaries are taxed in general under the regular corporate tax provisions. The following subsidiaries are regulated as life insurance companies but do not meet the Internal Revenue Code definition of a life insurance company, so they are taxed as insurance companies other than life insurance companies: Memorial Insurance, Southern Security, and Trans-Western.
The life insurance industry is highly competitive. There are approximately 1,000 legal reserve life insurance companies in business in the United States. These insurance companies differentiate themselves through marketing techniques, product features, price, and customer service. The Company’s insurance subsidiaries compete with a large number of insurance companies, many of which have greater financial resources, a longer business history, and more diversified line of insurance products than the Company. In addition, such companies generally have a larger sales force. Further, the Company competes with mutual insurance companies which may have a competitive advantage because all profits accrue to policyholders. Because the Company is smaller by industry standards and lacks broad diversification of risk, it may be more vulnerable to losses than larger, better-established companies. The Company believes that its policies and rates for the markets it serves are generally competitive.
The cemetery and mortuary industry is also highly competitive. In the Utah and California markets where the Company competes, there are a number of cemeteries and mortuaries which have longer business histories, more established positions in the community, and stronger financial positions than the Company. In addition, some of the cemeteries with which the Company must compete for sales are owned by municipalities and, as a result, can offer lower prices than can the Company. The Company bears the cost of a pre‑need sales program that is not incurred by those competitors which do not have a pre‑need sales force. The Company believes that its products and prices are generally competitive with those in the industry.
The mortgage industry is highly competitive with a large number of mortgage companies and banks in the same geographic area in which the Company is operating. The mortgage industry in general is sensitive to changes in interest rates and the refinancing market is particularly vulnerable to changes in interest rates.
As of December 31, 2019, the Company had 1,125 full-time and 168 part-time employees.
Item 2. Properties
The following table sets forth the location of the Company’s office facilities and certain other information relating to these properties.
| Street | | City | State | Function | Owned / Leased | | Approximate Square
Footage | | | Lease
Amount | | Expiration | |
| 121 W. Election Rd., Suite 100 | | Draper | UT | Corporate Headquarters (1) | Owned | | | 14,145 | | | | N/A | | | | | | N/A | |
| 5300 S. 360 W. | | Salt Lake City | UT | Corporate Headquarters (1) | Owned | | | 36,000 | | | | N/A | | | | | | N/A | |
| 5201 S. Green St. | | Salt Lake City | UT | Mortgage and Insurance Operations | Owned | | | 28,448 | | | | N/A | | | | | | N/A | |
| 1044 River Oaks Dr. | | Flowood | MS | Insurance Operations | Owned | | | 5,522 | | | | N/A | | | | | | N/A | |
| 5239 Greenpine Dr. | | Murray | UT | Funeral Service Operations | Owned | | | 1,642 | | | | N/A | | | | | | N/A | |
| 1818 Marshall St. | | Shreveport | LA | Insurance Operations | Owned | | | 12,274 | | | | N/A | | | | | | N/A | |
| 812 Sheppard St. | | Minden | LA | Insurance Sales | Owned | | | 1,560 | | | | N/A | | | | | | N/A | |
| 909 Foisy Ave. | | Alexandria | LA | Insurance Sales | Owned | | | 8,059 | | | | N/A | | | | | | N/A | |
| 1550 N. Third St. | | Jena | LA | Insurance Sales | Owned | | | 1,737 | | | | N/A | | | | | | N/A | |
| 4455 South 700 East | | Salt Lake City | UT | Insurance Operations | Leased | | | 16,134 | | | $ | 22,520 | | / | | mo | | 6/30/2021 | |
| 1 Sanctuary Blvd. Suite 302A | | Mandeville | LA | Insurance Sales | Leased | | | 867 | | | $ | 1,382 | | / | | mo | | 6/30/2020 | |
| 79 E. Main Street | | Midway | UT | Funeral Service Sales | Leased | | | 4,476 | | | $ | 3,460 | | / | | mo | | 10/31/2022 | |
| 200 Market Way | | Rainbow City | AL | Fast Funding Operations | Leased | | | 12,850 | | | $ | 10,490 | | / | | mo | | 12/31/2025 | |
| 6000 Pelham Rd. | | Greenville | SC | Fast Funding Operations | Leased | | | 4,483 | | | $ | 4,109 | | / | | mo | | 8/31/2022 | |
| 4007 Seaboard Court, Suite 1 | | Portsmouth | VA | Fast Funding Operations | Leased | | | N/A | | | $ | 3,000 | | / | | mo | | 5/31/2020 | |
| 1819 S. Dobson Rd., Suite 202/203 | | Mesa | AZ | Mortgage Sales | Leased | | | 2,397 | | | $ | 2,447 | | / | | mo | | 7/31/2021 | |
| 17015 N. Scottsdale Rd., Suite 125 | | Scottsdale | AZ | Mortgage Sales | Leased | | | 6,070 | | | $ | 13,415 | | / | | mo | | 4/30/2020 | |
| 1930 S Alma School Rd., Suite B-201 | | Mesa | AZ | Mortgage Sales | Leased | | | 1,762 | | | $ | 1,909 | | / | | mo | | 9/14/2020 | |
| 4725 N. 19th Ave. | | Phoenix | AZ | Mortgage Sales | Leased | | | 600 | | | $ | 250 | | / | | mo | | month to month | |
| 77 E. Weldon Ave., Suite 220 | | Phoenix | AZ | Mortgage Sales | Leased | | | 1,500 | | | $ | 2,000 | | / | | mo | | month to month | |
| 5100 N. 99th Ave., Suite 101/103 | | Phoenix | AZ | Mortgage Sales | Leased | | | 2,540 | | | $ | 3,175 | | / | | mo | | month to month | |
| 2828 N. Central Ave., Suite 1006/1018 | | Phoenix | AZ | Mortgage Sales | Leased | | | 245 | | | $ | 2,075 | | / | | mo | | month to month | |
| 2999 Douglas Blvd. | | Roseville | CA | Mortgage Sales | Leased | | | 1,515 | | | $ | 3,485 | | / | | mo | | 6/30/2020 | |
| 1855 Gladys Ave., Suite 2 | | Signal Hill | CA | Mortgage Sales | Leased | | | 200 | | | $ | 100 | | / | | mo | | month to month | |
| 22775 Pine Lake Dr. | | Colfax | CA | Mortgage Sales | Leased | | | 200 | | | $ | 20 | | / | | mo | | month to month | |
| 40977 Oak Dr. | | Forest Falls | CA | Mortgage Sales | Leased | | | 250 | | | $ | - | | / | | mo | | month to month | |
| 5475 Tech Center Dr., Suite 100 | | Colorado Springs | CO | Mortgage Sales | Leased | | | 3,424 | | | $ | 3,852 | | / | | mo | | 7/31/2020 | |
| 8480 E. Orchard Rd., Suite 4200 | | Greenwood Village | CO | Mortgage Sales | Leased | | | 4,631 | | | $ | 9,841 | | / | | mo | | 5/31/2021 | |
| 1120 W. 122nd Ave., Suite 104 | | Denver | CO | Mortgage Sales | Leased | | | 2,088 | | | $ | 3,654 | | / | | mo | | 10/31/2021 | |
| 27 Main St., Suite C-104B | | Edwards | CO | Mortgage Sales | Leased | | | 680 | | | $ | 1,600 | | / | | mo | | month to month | |
| 1145 Town Park Ave., Suite 2215 | | Lake Mary | FL | Mortgage Sales | Leased | | | 9,390 | | | $ | 19,829 | | / | | mo | | 2/29/2020 | |
| 8191 College Parkway, Suite 201 | | Ft Myers | FL | Mortgage Sales | Leased | | | 4,676 | | | $ | 3,917 | | / | | mo | | 8/21/2021 | |
| 1545 S. Belcher Rd., Suite B | | Clearwater | FL | Mortgage Sales | Leased | | | N/A | | | $ | 3,073 | | / | | mo | | month to month | |
| 3689 Tampa Rd., Suite 324 | | Oldsmar | FL | Mortgage Sales | Leased | | | 2,553 | | | $ | 2,708 | | / | | mo | | 2/28/2020 | |
| 113th St. N. and 82nd Ave. N. | | Seminole | FL | Mortgage Sales | Leased | | | N/A | | | $ | 2,100 | | / | | mo | | 8/30/2020 | |
| 136 Parliament Loop | | Lake Mary | FL | Mortgage Sales | Leased | | | 1,527 | | | $ | 3,100 | | / | | mo | | 11/30/2022 | |
| 4370 Kukui Grove St., Suite 201 | | Lihue | HI | Mortgage Sales | Leased | | | 864 | | | $ | 1,331 | | / | | mo | | 2/28/2020 | |
| 116 N. 3rd St., Suite 12 | | Mccall | ID | Mortgage Sales | Leased | | | 480 | | | $ | 400 | | / | | mo | | month to month | |
| 7225-27 West Madison St. | | Forest Park | IL | Mortgage Sales | Leased | | | 1,800 | | | $ | 2,200 | | / | | mo | | 6/30/2020 | |
| 9963 Crosspoint Blvd Suites 101/102 | | Indianapolis | IN | Mortgage Sales | Leased | | | N/A | | | $ | 1,350 | | / | | mo | | month to month | |
| 568 Greenluster Dr. | | Covington | LA | Mortgage Sales | Leased | | | 150 | | | $ | 750 | | / | | mo | | month to month | |
| 4987 Fall Creek Rd. Suite 1 | | Branson | MO | Mortgage Sales | Leased | | | 700 | | | $ | 1,000 | | / | | mo | | month to month | |
| 7930 West Kenton Circle | | Huntersville | NC | Mortgage Sales | Sub-Leased | | | 951 | | | $ | 1,918 | | / | | mo | | 2/29/2020 | |
| 801 Cascade Pointe Lane, Suite 101 | | Raleigh | NC | Mortgage Sales | Sub-Leased | | | 2,000 | | | $ | 2,961 | | / | | mo | | 4/30/2020 | |
| 1980 Festival Plaza Dr., Suite 850 | | Las Vegas | NV | Mortgage Sales | Leased | | | 12,866 | | | $ | 43,615 | | / | | mo | | 5/31/2021 | |
| 2370 Corporate Circle, Suite 200/270 | | Henderson | NV | Mortgage Sales | Leased | | | 10,261 | | | $ | 18,297 | | / | | mo | | 4/30/2020 | |
| 8720 Orion Place, Suite 160 | | Colombus | OH | Mortgage Sales | Leased | | | 1,973 | | | $ | 1,726 | | / | | mo | | 6/30/2023 | |
| 10610 SE Washington | | Portland | OR | Mortgage Sales | Leased | | | 506 | | | $ | 600 | | / | | mo | | month to month | |
| 3311 NE MLK Jr Blvd., Suite 203 | | Portland | OR | Mortgage Sales | Leased | | | 1,400 | | | $ | 875 | | / | | mo | | month to month | |
| 10365 SE Sunnyside Rd., Suite 310 | | Clackamus | OR | Mortgage Sales | Leased | | | 1,288 | | | $ | 2,420 | | / | | mo | | 11/30/2022 | |
| 213 E. Butler, Suite E-1 | | Mauldin | SC | Mortgage Sales | Leased | | | 250 | | | $ | - | | / | | mo | | month to month | |
| 6263 Poplar Ave., Suite 900 | | Memphis | TN | Mortgage Sales | Leased | | | 1,680 | | | $ | 2,476 | | / | | mo | | 3/31/2020 | |
| 6640 Carothers Parkway, Suite 150 | | Franklin | TN | Mortgage Sales | Leased | | | 3,229 | | | $ | 8,199 | | / | | mo | | 3/31/2020 | |
| 208 Sunset Dr., Suites 403/404 | | Knoxville | TN | Mortgage Sales | Leased | | | 2,476 | | | $ | 3,817 | | / | | mo | | 10/31/2022 | |
| 6640 Carothers Parkway, Suite 110 | | Franklin | TN | Mortgage Sales | Leased | | | 2,102 | | | $ | 4,668 | | / | | mo | | 4/30/2020 | |
| 602 S Main St., Suite 200 | | Weatherford | TX | Mortgage Sales | Leased | | | 1,000 | | | $ | 1,865 | | / | | mo | | 3/1/2020 | |
| 52 Sugar Creek Center, Suite 150 | | Sugarland | TX | Mortgage Sales | Leased | | | 1,788 | | | $ | 3,994 | | / | | mo | | 3/31/2020 | |
| 1 Chisholm Trail Rd., Suite 210 | | Round Rock | TX | Mortgage Sales | Leased | | | 3,402 | | | $ | 4,961 | | / | | mo | | 12/31/2020 | |
| 3027 Marina Bay Dr., Suite 200 | | League City | TX | Mortgage Sales | Leased | | | 1,225 | | | $ | 2,118 | | / | | mo | | 3/31/2020 | |
| 11550 Fuqua, Suite 200 | | Houston | TX | Mortgage Sales | Leased | | | 1,865 | | | $ | 3,341 | | / | | mo | | 4/30/2020 | |
| 24668 Kingsland Blvd. | | Katy | TX | Mortgage Sales | Leased | | | 144 | | | $ | 500 | | / | | mo | | month to month | |
| 1848 Norwood Plaza, Suite 213 | | Hurst | TX | Mortgage Sales | Leased | | | 1,596 | | | $ | 1,031 | | / | | mo | | month to month | |
| 17347 Village Green Dr., Suite 102 | | Houston | TX | Mortgage Sales | Leased | | | 4,395 | | | $ | 8,970 | | / | | mo | | 12/1/2024 | |
| 4100 Alpha Rd., Suite 650 | | Farmers Branch | TX | Mortgage Sales | Leased | | | 2,935 | | | $ | 4,158 | | / | | mo | | 3/31/2020 | |
| 1626 Lee Trevino, Suite A | | El Paso | TX | Mortgage Sales | Leased | | | 4,200 | | | $ | 7,799 | | / | | mo | | 12/31/2022 | |
| 9737 Great Hills Trail, Suites 150, 200, 220 | | Austin | TX | Mortgage Sales | Sub-Leased | | | 19,891 | | | $ | 36,052 | | / | | mo | | 8/31/2024 | |
| 1213 East Alton Gloor Blvd., Suite H | | Brownsville | TX | Mortgage Sales | Leased | | | 2,000 | | | $ | 2,200 | | / | | mo | | 3/31/2020 | |
| 7920 Belt Line Rd., Suite 720 | | Dallas | TX | Mortgage Sales | Leased | | | 1,714 | | | $ | 2,143 | | / | | mo | | month to month | |
| 5020 Collinwood Ave., Suite 100 | | Fort Worth | TX | Mortgage Sales | Leased | | | 2,687 | | | $ | 5,150 | | / | | mo | | 1/31/2021 | |
| 240 North Adams St., Suite 4 | | Eagle Pass | TX | Mortgage Sales | Leased | | | 275 | | | $ | 1,015 | | / | | mo | | 12/31/2020 | |
| 3000 Joe DiMaggio Blvd., Bldg 12 Suite 42 | | Round Rock | TX | Mortgage Sales | Leased | | | 920 | | | $ | 1,750 | | / | | mo | | 5/15/2021 | |
| 2408 Jacaman Road, Suite F | | Laredo | TX | Mortgage Sales | Leased | | | N/A | | | $ | 900 | | / | | mo | | 6/1/2020 | |
| 1900 Country Club Dr., Suite 150 | | Mansfield | TX | Mortgage Sales | Leased | | | 175 | | | $ | 325 | | / | | mo | | month to month | |
| 3220 Gus Thomasson Rd. | | Mesquite | TX | Mortgage Sales | Leased | | | 130 | | | $ | 1,000 | | / | | mo | | month to month | |
| 722 Kiowa Dr. West | | Lake Kiowa | TX | Mortgage Sales | Leased | | | 150 | | | $ | - | | / | | mo | | month to month | |
| 1224 S. River Rd., Suites E3/B4 | | Saint George | UT | Mortgage Sales | Leased | | | 1,900 | | | $ | 1,869 | | / | | mo | | 5/31/2020 | |
| 1111 Brickyard Rd., Suite 107 | | Salt Lake City | UT | Mortgage Sales | Leased | | | 4,857 | | | $ | 4,408 | | / | | mo | | 1/31/2020 | |
| 170 S Interstate Plaza, Suite 230 | | Lehi | UT | Mortgage Sales | Leased | | | 1,927 | | | $ | 3,453 | | / | | mo | | 7/31/2021 | |
| 590 W. State Street | | Pleasant Grove | UT | Mortgage Sales | Leased | | | 250 | | | $ | 500 | | / | | mo | | month to month | |
| 5965 S. Redwood Rd. | | Taylorsville | UT | Mortgage Sales | Leased | | | 2,000 | | | $ | 600 | | / | | mo | | month to month | |
| 6575 S. Redwood Rd. | | Taylorsville | UT | Mortgage Sales | Leased | | | 3,323 | | | $ | 5,221 | | / | | mo | | 12/31/2022 | |
| 126 W. Sego Lily Dr., Suite 260 | | Sandy | UT | Mortgage Sales | Leased | | | 2,794 | | | $ | 5,672 | | / | | mo | | 8/31/2020 | |
| 75 Towne Ridge Parkway, Suite 100 | | Sandy | UT | Mortgage Sales | Leased | | | 6,867 | | | $ | 15,737 | | / | | mo | | 8/31/2023 | |
| 1145 S. 800 E. | | Orem | UT | Mortgage Sales | Leased | | | 2,581 | | | $ | 4,431 | | / | | mo | | 1/31/2020 | |
| 1133 North Main St., Suite 150 | | Layton | UT | Mortgage Sales | Sub-Leased | | | 300 | | | $ | 1,000 | | / | | mo | | month to month | |
| 497 S. Main | | Ephraim | UT | Mortgage Sales | Leased | | | 953 | | | $ | 765 | | / | | mo | | 9/30/2021 | |
| 6965 S. Union Park, Suites 100, 190, 260, 300, 460, 470, & 480 | | Midvale | UT | Mortgage Sales | Leased | | | 39,649 | | | $ | 77,726 | | / | | mo | | 6/30/2021 | |
| 11240 S. River Heights Dr. | | South Jordan | UT | Mortgage Sales | Leased | | | 3,403 | | | $ | 7,515 | | / | | mo | | 11/30/2024 | |
| 500 East Village Blvd. | | Stansbury Park | UT | Mortgage Sales | Leased | | | 1,950 | | | $ | 3,088 | | / | | mo | | 10/31/2024 | |
| 1350 E. 300 S. 3rd Floor | | Lehi | UT | Mortgage Sales | Leased | | | 15,446 | | | $ | 34,110 | | / | | mo | | 12/22/2026 | |
| 21430 Cedar Dr., Suite 200-202 | | Sterling | VA | Mortgage Sales | Leased | | | 4,000 | | | $ | 7,700 | | / | | mo | | 10/31/2022 | |
| 15640 NE Fourth Plain Blvd., Suite 220/221 | | Vancouver | WA | Mortgage Sales | Leased | | | 360 | | | $ | 425 | | / | | mo | | 9/30/2020 | |
| 5816 Ledgemont Ct. | | Fitchburg | WI | Mortgage Sales | Leased | | | 200 | | | $ | 250 | | / | | mo | | month to month | |
| 1508 24th Ave., Suite 23 | | Kenosha | WI | Mortgage Sales | Leased | | | 250 | | | $ | 150 | | / | | mo | | month to month | |
| 27903 99th St. | | Trevor | WI | Mortgage Sales | Leased | | | 300 | | | $ | 150 | | / | | mo | | month to month | |
| | | | | | | | | | | | | | | | | | | | | |
________
| (1) | The Company temporarily relocated its Corporate Headquarters from 5300 South 360 West, Salt Lake City, Utah to 121 W. Election Rd., Draper, Utah. The building at 5300 South 360 West was demolished in March 2020 as part of the second phase of the Center53 corporate campus development. The existing land will be used as the site to construct a building, which the Company anticipates occupying a part of the building in June 2021 as its new Corporate Headquarters. |
The Company believes the office facilities it occupies are in good operating condition and adequate for current operations. The Company will enter into additional leases or modify existing leases to meet market demand. Those leases will be month to month where possible. As leases expire, the Company will either renew or find comparable leases or acquire additional office space.
Item 2. Properties (Continued)
The following table summarizes the location and acreage of the six Company owned cemeteries, each of which includes one or more mausoleums:
| | | | | Net Saleable Acreage |
| Name of Cemetery | Location | Date Acquired | Developed Acreage (1) | Total Acreage (1) | Acres Sold as Cemetery Spaces (2) | Total Available Acreage (1) |
| Memorial Estates, Inc. | | | | | |
| Lakeview Cemetery | 1640 East Lakeview Drive
Bountiful, Utah | 1973 | 9 | 39 | 7 | 32 |
| | | | | | | |
| Mountain View Cemetery | 3115 East 7800 South
Salt Lake City, Utah | 1973 | 26 | 54 | 20 | 34 |
| | | | | | | |
| Redwood Cemetery (3) | 6500 South Redwood Road
West Jordan, Utah | 1973 | 28 | 71 | 35 | 36 |
| | | | | | | |
Deseret Memorial Inc.
Lake Hills Cemetery (3)(6) | | | | | |
| Lake Hills Cemetery | 10055 South State Street
Sandy, Utah | 1991 | 9 | 28 | 6 | 22 |
| | | | | | | |
| Holladay Memorial Park, Inc. | | | | | |
| Holladay Memorial Park (3) | 4900 South Memory Lane
Holladay, Utah | 1991 | 12 | 14 | 7 | 7 |
| | | | | | | |
| California Memorial Estates, Inc. | | | | | |
| Singing Hills Memorial Park (4) | 2800 Dehesa Road
El Cajon, California | 1995 | 8 | 97 | 6 | 91 |
_________
| The acreage represents estimates of acres that are based upon survey reports, title reports, appraisal reports, or the Company’s inspection of the cemeteries. The Company estimates that there are approximately 1,200 spaces per developed acre. |
| (2) | Includes both reserved and occupied spaces. |
| (3) | Includes two granite mausoleums. |
| Includes an open easement. |
Item 2. Properties (Continued)
The following table summarizes the location, square footage and the number of viewing rooms and chapels of the eight Company owned mortuaries:
| | | Date | Viewing | | Square |
| Name of Mortuary | Location | Acquired | Room(s) | Chapel(s) | Footage |
| Memorial Mortuary, Inc. | | | | | |
| Memorial Mortuary | 5850 South 900 East | | | | |
| | Murray, Utah | 1973 | 3 | 1 | 20,000 |
| | | | | | |
| Affordable Funerals and Cremations, St. George | 157 East Riverside Dr., No. 3A | 2016 | 1 | 1 | 2,360 |
| | St. George, Utah | | | | |
| | | | | | |
| Memorial Estates, Inc. | | | | | |
| Redwood Mortuary (1) | 6500 South Redwood Rd. | | | | |
| | West Jordan, Utah | 1973 | 2 | 1 | 10,000 |
| | | | | | |
| Mountain View Mortuary (1) | 3115 East 7800 South | | | | |
| | Salt Lake City, Utah | 1973 | 2 | 1 | 16,000 |
| | | | | | |
| Lakeview Mortuary (1) | 1640 East Lakeview Dr. | | | | |
| | Bountiful, Utah | 1973 | 0 | 1 | 5,500 |
| | | | | | |
| Lakehills Mortuary (1) | 10055 South State St. | | | | |
| | Sandy, Utah | 1991 | 2 | 1 | 18,000 |
| | | | | | |
| Cottonwood Mortuary, Inc. | | | | | |
| Cottonwood Mortuary (1) | 4670 South Highland Dr. | | | | |
| | Holladay, Utah | 1991 | 2 | 1 | 14,500 |
| | | | | | |
| SN Probst LLC | | | | | |
| Heber Valley Funeral Home | 288 North Main St. | | | | |
| | Heber City, Utah | 2019 | 1 | 1 | 5,900 |
| (1) | These funeral homes also provide burial niches at their respective locations. |
Item 3. Legal Proceedings
Lehman Brothers Holdings Litigation – Delaware and New York
In January 2014, Lehman Brothers Holdings Inc. (“Lehman Holdings”) entered into a settlement with the Federal National Mortgage Association (Fannie Mae) concerning the mortgage loan claims that Fannie Mae had asserted against Lehman Holdings, which were based on alleged breaches of certain representations and warranties by Lehman Holdings in the mortgage loans it had sold to Fannie Mae. Lehman Holdings had acquired these loans from Aurora Bank, FSB, formerly known as Lehman Brothers Bank, FSB, which in turn purchased the loans from residential mortgage loan originators, including SecurityNational Mortgage Company (“SecurityNational Mortgage”). A settlement based on similar circumstances was entered into between Lehman Holdings and the Federal Home Loan Mortgage Corporation (Freddie Mac) in February 2014.
Lehman Holdings filed a motion in May 2014 with the U.S. Bankruptcy Court of the Southern District of New York to require the mortgage loan originators, including SecurityNational Mortgage, to engage in non-binding mediations of the alleged indemnification claims against the mortgage loan originators relative to the Fannie Mae and Freddie Mac settlements with Lehman Holdings. The mediation was not successful in resolving any issues between SecurityNational Mortgage and Lehman Holdings.
On January 26, 2016, SecurityNational Mortgage filed a declaratory judgment action against Lehman Holdings in the Superior Court for the State of Delaware. In the Delaware action, SecurityNational Mortgage asserted its right to obtain a declaration of rights in that there are allegedly millions of dollars in dispute with Lehman Holdings pertaining to approximately 136 mortgage loans. SecurityNational Mortgage sought a declaratory judgment as to its rights as it contends that it has no liability to Lehman Holdings as a result of Lehman Holdings’ settlements with Fannie Mae and Freddie Mac. Lehman Holdings filed a motion in the Delaware court seeking to stay or dismiss the declaratory judgment action. On August 24, 2016, the Court ruled that it would exercise its discretion to decline jurisdiction over the action and granted Lehman Holdings’ motion to dismiss.
On February 3, 2016, Lehman Holdings filed an adversary proceeding against approximately 150 mortgage loan originators, including SecurityNational Mortgage, in the U.S. Bankruptcy Court of the Southern District of New York seeking a declaration of rights similar in nature to the declaration that SecurityNational Mortgage sought in its Delaware lawsuit, and for damages relating to the alleged obligations of the defendants under indemnification provisions of the alleged agreements, in amounts to be determined at trial, including interest, attorneys’ fees and costs incurred by Lehman Holdings in enforcing the obligations of the defendants. No response was required to be filed relative to the Complaint or the Amended Complaint dated March 7, 2016. A Case Management Order was entered on November 1, 2016.
On December 27, 2016, pursuant to the Case Management Order, Lehman Holdings filed a Second Amended Complaint against SecurityNational Mortgage, which eliminates the declaratory judgment claim but retains a similar claim for damages as in the Complaint. Many of the defendants, including SecurityNational Mortgage, filed a joint motion in the case asserting that the Bankruptcy Court does not have subject matter jurisdiction concerning the matter and that venue is improper. Lehman Holdings’ response memorandum was filed on May 31, 2017 and a reply memorandum of the defendants filing the motion was filed on July 14, 2017. A hearing on the motion was held on June 12, 2018.
On August 13, 2018, the Court issued its Memorandum Decision and Order (“Decision”) denying the motion. On August 27, 2018, a number of the defendants, including SecurityNational Mortgage, filed a joint motion with the United States District Court (Case No. 18-mc-00392(VEC)) requesting that the Bankruptcy Court’s Decision be treated as findings of fact and conclusions of law, and for the District Court to review the Decision de novo as to jurisdiction. Included with the motion were proposed objections to the Bankruptcy Court’s Decision. On September 18, 2018, Lehman Holdings filed its response to the joint motion, and defendants’ reply was filed on October 2, 2018.
On September 17, 2018, certain defendants, including SecurityNational Mortgage, also filed a notice of appeal, and thereafter a motion for leave to file an interlocutory appeal as to the Bankruptcy Court’s Decision pertaining to jurisdiction and improper venue as a “protective” appeal should the District Court decide not to treat the Decision as findings of fact and conclusions of law. Separately, certain other defendants also filed a notice of appeal and motion for leave to file an interlocutory appeal with respect to the Bankruptcy Court’s Decision concerning improper venue. Lehman Holdings filed its response on October 22, 2018, and defendants filed a joint reply to Lehman Holdings’ response on November 26, 2018. The motions to file appeals were consolidated before Valerie Caproni, U.S. District Court Judge, Case No. 18-cv-08986 (VEC). Case No. 18-mc-00392 (VEC) was also before Judge Caproni.
On May 8, 2019, Judge Caproni issued her Opinion and Order denying the motion for an interlocutory appeal of the bankruptcy court’s ruling relative to jurisdiction and venue. Further, the judge denied the motion for immediate de novo review of the bankruptcy court’s ruling indicating that de novo review can be left for the future.
On October 1, 2018, Lehman Holdings filed a motion for leave to file Third Amended Complaints against numerous defendants including SecurityNational Mortgage. In addition to the Fannie Mae and Freddie Mac related loans, the amendments and supplements include additional mortgage loans sold to Lehman Holdings that were packaged for securitization (“RMBS loans”). The RMBS loans had allegedly been sold by defendants to Lehman Bank that, in turn, sold them to Lehman Holdings. The allegations pertaining to the RMBS loans include, e.g., purported breaches of representations and warranties made to the securitization trusts by Lehman Holdings. Lehman Holdings asserts that it made representations and warranties purportedly based in part by representations and warranties made to Lehman Bank by loan originators, including SecurityNational Mortgage.
The alleged RMBS loans in dispute with SecurityNational Mortgage allegedly involve millions of dollars pertaining to approximately 577 mortgage loans in addition to the Fannie Mae and Freddie Mac related loans. Lehman Holdings also moved the Court to simultaneously allow alternative dispute resolution procedures to take place including potential mediation. Over objections, at a hearing on October 29, 2018, the Court granted Lehman Holdings’ motion to amend or supplement its complaints adding the RMBS loans, and also to mandate alternative dispute resolution procedures affecting many defendants, including SecurityNational Mortgage.
Instead of filing a Third Amended Complaint to include the RMBS loans referenced above, Lehman Holdings filed the matter against SecurityNational Mortgage as a new complaint ("RMBS Complaint") (United States Bankruptcy Court, Southern District of New York, Adversary Proceeding 18-01819) pertaining to the approximately 577 RMBS loans, in addition to the Second Amended Complaint already on file. The RMBS Complaint seeks alleged damages relating to obligations under alleged contractual indemnification provisions in an amount to be determined at trial, interest, costs and expenses incurred by LBHI in enforcing alleged obligations, including attorneys' fees and costs and any expert witness fees incurred in litigation; and such other relief as the Court deems just and proper. SecurityNational Mortgage denies any liability to Lehman Holdings and intends to vigorously protect and defend its position.
In response to a Court order, certain defendants referenced in the Second Amended Complaint and the RMBS Complaints negotiated with Lehman Holdings concerning an amended case management order pertaining to certain case procedures and management for both lawsuits including, but not limited to, timing for filing motions and answering the complaints, and provisions concerning discovery such as document production, taking depositions, and use of experts. At a hearing held on March 7, 2019, the Court considered differences of the parties as to the content of an amended case management order, and thereafter signed an amended case management order dated March 13, 2019. SecurityNational Mortgage filed an answer and amended answer in the Fannie Mae and Freddie Mac case, and in the RMBS case. Discovery is in process.
Lehman Holdings sent an Indemnification Alternative Dispute Resolution Notice to SecurityNational Mortgage dated August 1, 2019. SecurityNational Mortgage sent its Statement of Position to Lehman Brothers Holdings dated September 3, 2019 in response to the notice. Thereafter, Lehman Holdings sent its Reply dated October 2, 2019 to SecurityNational Mortgage. On January 9, 2020, SecurityNational Mortgage submitted further information to the mediator. Mediation was set to take place on January 23, 2020 in New York.
On January 15, 2020, SecurityNational Mortgage filed a motion to dismiss Lehman Holdings’ RMBS action in the Bankruptcy Court for lack of subject matter jurisdiction and standing. It was not filed in the Bankruptcy Court but in the United States District Court for the Southern District of New York. The District Court referred the matter to a magistrate judge for general pretrial, which “includes scheduling, discovery, non-dispositive pretrial motions, and settlement,” as well as for “a Report and Recommendation” as to the pending motion. The final disposition of the motion will be with the District Court judge. Lehman Holdings has asked the District Court to transfer the case to one of two other judges allegedly due to related matters. No action has been taken by the District Court on the request.
However, a briefing schedule is in place before the original assigned magistrate judge. Lehman Holdings’ response brief to SecurityNational Mortgage’s motion is due March 6, 2020, and SecurityNational Mortgage’s reply brief is due April 6, 2020. In view of SecurityNational Mortgage’s motion to dismiss, Lehman Holdings requested that the mediation set for January 23, 2020 be adjourned “pending resolution of your [SecurityNational Mortgage] motion by the court.” On January 17, 2020, the mediator adjourned the scheduled mediation without a date.
The Company is not a party to any other material legal proceedings outside the ordinary course of business or to any other legal proceedings, which if adversely determined, would have a material adverse effect on its financial condition or results of operation.
Item 4. Mine Safety Disclosures
Not applicable.
PART II
Item 5. Market for the Registrant’s Common Stock, Related Security Holder Matters, and Issuer Purchases of Equity Securities
The Company’s Class A common stock trades on The NASDAQ National Market under the symbol “SNFCA.” As of March 27, 2019, the closing stock price of the Class A common stock was $3.77 per share. The following were the high and low market closing stock prices for the Class A common stock by quarter as reported by NASDAQ since January 1, 2018:
| | | Price Range (1) | |
| | | High | | | Low | |
Period (Calendar Year) | | | | | | |
| 2018 | | | | | | |
| First Quarter | | $ | 4.90 | | | $ | 3.92 | |
| Second Quarter | | $ | 4.99 | | | $ | 4.67 | |
| Third Quarter | | $ | 5.03 | | | $ | 4.58 | |
| Fourth Quarter | | $ | 5.35 | | | $ | 4.68 | |
| | | | | | | | | |
| 2019 | | | | | | | | |
| First Quarter | | $ | 5.34 | | | $ | 4.50 | |
| Second Quarter | | $ | 5.38 | | | $ | 4.53 | |
| Third Quarter | | $ | 5.20 | | | $ | 4.55 | |
| Fourth Quarter | | $ | 5.74 | | | $ | 4.58 | |
| | | | | | | | | |
| 2020 | | | | | | | | |
| First Quarter (through March 27, 2020) | | $ | 6.25 | | | $ | 3.77
| |
________
| (1) | Stock prices have been adjusted retroactively for the effect of annual 5% stock dividends. |
The Class C common stock is not registered or traded on a national exchange. See Note 12 of the Notes to Consolidated Financial Statements.
The Company has never paid a cash dividend on its Class A or Class C common stock. The Company currently anticipates that all of its earnings will be retained for use in the operation and expansion of its business and does not intend to pay any cash dividends on its Class A or Class C common stock in the foreseeable future. Any future determination as to cash dividends will depend upon the earnings and financial position of the Company and such other factors as the Board of Directors may deem appropriate. A 5% stock dividend on Class A and Class C common stock has been paid each year from 1990 through 2019.
On September 7, 2018, the Board of Directors of the Company approved a Stock Repurchase Plan that authorized the repurchase of 300,000 shares of the Company's Class A Common Stock in the open market. The repurchased shares of Class A common stock will be held as treasury shares to be used as the Company's employer matching contribution to the Employee 401(k) Retirement Savings Plan. The following table shows the Company’s repurchase activity of its common stock during the three months ended December 31, 2019 under its Stock Repurchase Plan.
Period | | (a) Total Number of Class A Shares Purchased | | | (b) Average Price Paid per Class A Share | | | (c) Total Number of
Class A
Shares
Purchased as
Part of Publicly Announced
Plan or
Program | | | (d) Maximum
Number of
Class A
Shares that
May Yet Be Purchased
Under the
Plan or
Program | |
| 10/1/2019-10/31/2019 | | | 8,790 | | | $ | 5.01 | | | | - | | | | 182,007 | |
| 11/1/2019-11/30/2019 | | | 10,000 | | | $ | 5.36 | | | | - | | | | 172,007 | |
| 12/1/2019-12/31/2019 | | | 10,000 | | | $ | 5.73 | | | | - | | | | 162,007 | |
| | | | | | | | | | | | | | | | | |
| Total | | | 28,790 | | | $ | 5.41 | | | | - | | | | 162,007 | |
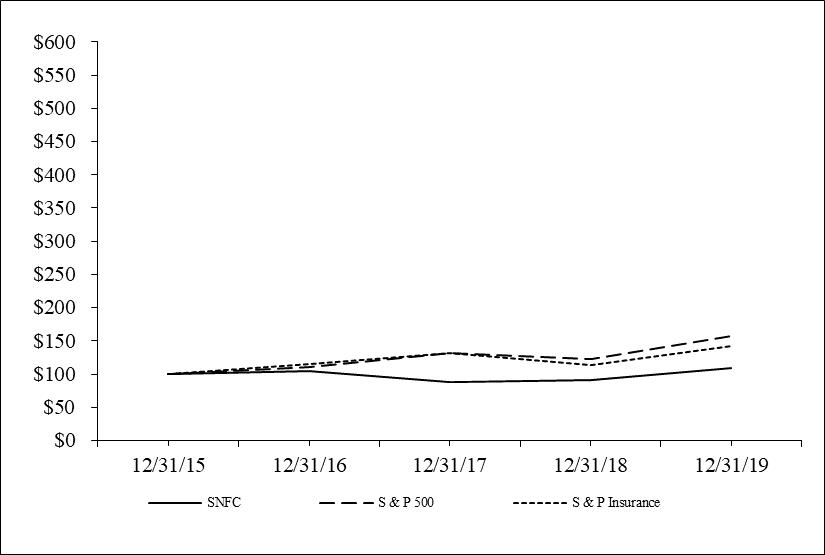
The graph below compares the cumulative total stockholder return of the Company’s Class A common stock with the cumulative total return on the Standard & Poor’s 500 Stock Index and the Standard & Poor’s Insurance Index for the period from December 31, 2015 through December 31, 2019. The graph assumes that the value of the investment in the Company’s Class A common stock and in each of the indexes was $100 at December 31, 2015 and that all dividends were reinvested.
The comparisons in the graph below are based on historical data and are not intended to forecast the possible future performance of the Company’s Class A common stock.
| | 12/31/15 | 12/31/16 | 12/31/17 | 12/31/18 | 12/31/19 |
| SNFC | 100 | 104 | 88 | 91 | 109 |
| S & P 500 | 100 | 110 | 131 | 123 | 158 |
| S & P Insurance | 100 | 115 | 131 | 113 | 143 |
The stock performance graph set forth above is required by the Securities and Exchange Commission and shall not be deemed to be incorporated by reference by any general statement incorporating by reference this Form 10-K into any filing under the Securities Act of 1933, as amended, or under the Securities Exchange Act of 1934, as amended, except to the extent that the Company specifically incorporates this information by reference, and shall not otherwise be deemed soliciting material or filed under such acts.
As of December 31, 2019, there were 2,647 record holders of Class A common stock and 64 record holders of Class C common stock.
Item 6. Selected Financial Data
As a smaller reporting company, the Company is not required to provide information typically disclosed under this item.
Item 7. Management’s Discussion and Analysis of Financial Condition and Results of Operations
Overview
The Company’s operations over the last several years generally reflect three trends or events which the Company expects to continue: (i) increased attention to “niche” insurance products, such as the Company’s funeral plan policies and traditional whole life products; (ii) emphasis on cemetery and mortuary business; and (iii) capitalizing on relatively low interest rates by originating mortgage loans.
Insurance Operations
The following table shows the condensed financial results for the Company’s insurance operations for the years ended December 31, 2019 and 2018. See Note 15 of the Notes to Consolidated Financial Statements.
| | | Years ended December 31
(in thousands of dollars) | |
| | | 2019 | | | 2018 | | | 2019 vs 2018 % Increase (Decrease) | |
| Revenues from external customers: | | | | | | | | | |
| Insurance premiums | | $ | 81,861 | | | $ | 75,929 | | | | 8 | % |
| Net investment income | | | 41,611 | | | | 38,720 | | | | 7 | % |
| Gains (losses) on investments and other assets | | | 138 | | | | 21,396 | | | | (99 | %) |
| Other | | | 2,129 | | | | 1,637 | | | | 30 | % |
| Total | | $ | 125,739 | | | $ | 137,682 | | | | (9 | %) |
| Intersegment revenue | | $ | 4,455 | | | $ | 3,973 | | | | 12 | % |
| Earnings before income taxes | | $ | 6,565 | | | $ | 30,124 | | | | (78 | %) |
Intersegment revenues for the Company’s insurance operations were primarily interest income from the warehouse lines provided to its mortgage lending affiliates to fund loans held for sale. Profitability in 2019 decreased due to the one-time gain of $22,252,000 on the sale of Dry Creek at East Village Apartments that was recognized in 2018, offset by increases in investment income, and increases in insurance premiums. These increases were partially offset by increases in benefits and expenses.
Cemetery and Mortuary Operations
The following table shows the condensed financial results for the Company’s cemetery and mortuary operations for the years ended December 31, 2019 and 2018. See Note 15 of the Notes to Consolidated Financial Statements.
| | | Years ended December 31
(in thousands of dollars) | |
| | | 2019 | | | 2018 | | | 2019 vs 2018 % Increase (Decrease) | |
| Revenues from external customers: | | | | | | | | | |
| Mortuary revenues | | $ | 6,541 | | | $ | 5,514 | | | | 19 | % |
| Cemetery revenues | | | 8,755 | | | | 8,213 | | | | 7 | % |
| Net investment income | | | 580 | | | | 283 | | | | 105 | % |
| Gains on investments and other assets | | | 530 | | | | 2,301 | | | | (77 | %) |
| Other | | | 95 | | | | 129 | | | | (26 | %) |
| Total | | $ | 16,501 | | | $ | 16,440 | | | | 0 | % |
| Earnings before income taxes | | $ | 2,660 | | | $ | 3,916 | | | | (32 | %) |
Included in net investment income was net rental income from residential and commercial properties purchased from Security National Life. Memorial Estates purchased these properties from financing provided by Security National Life. The rental income was offset by property insurance, taxes, maintenance expenses and depreciation. Memorial Estates recorded depreciation on these properties of $452,000 and $598,000 for the twelve months ended December 31, 2019 and 2018, respectively.
Profitability in 2019 has decreased due to a one-time gain on the sale of assets of Deseret Mortuary recognized in 2018, offset by increases in cemetery and mortuary revenues for 2019.
Mortgage Operations
The Company’s wholly owned subsidiaries, SecurityNational Mortgage and EverLEND Mortgage Company, are mortgage lenders incorporated under the laws of the State of Utah and approved and regulated by the Federal Housing Administration (FHA), a department of the U.S. Department of Housing and Urban Development (HUD), which originate mortgage loans that qualify for government insurance in the event of default by the borrower, in addition to various conventional mortgage loan products. SecurityNational Mortgage and EverLEND Mortgage originate and refinance mortgage loans on a retail basis. Mortgage loans originated or refinanced by the Company’s mortgage subsidiaries are funded through loan purchase agreements with Security National Life and unaffiliated financial institutions.
The Company’s mortgage subsidiaries receive fees from borrowers that are involved in mortgage loan originations and refinancings, and secondary fees earned from third party investors that purchase the mortgage loans originated by the mortgage subsidiaries. Mortgage loans originated by the mortgage subsidiaries are generally sold with mortgage servicing rights released to third-party investors or retained by SecurityNational Mortgage. SecurityNational Mortgage currently retains the mortgage servicing rights on approximately 19% of its loan origination volume. These mortgage loans are serviced by either SecurityNational Mortgage or an approved third-party sub-servicer.
For the twelve months ended December 31, 2019 and 2018, SecurityNational Mortgage originated 10,885 loans ($2,534,399,000 total volume) and 10,252 loans ($2,150,933,000 total volume), respectively. For the twelve months ended December 31, 2019 and 2018, EverLEND Mortgage originated 275 loans ($72,440,000 total volume) and 173 loans ($43,675,000 total volume), respectively.
The following table shows the condensed financial results for the Company’s mortgage operations for the years ended 2019 and 2018. See Note 15 of the Notes to Consolidated Financial Statements.
| | | Years ended December 31
(in thousands of dollars) | |
| | | 2019 | | | 2018 | | | 2019 vs 2018 % Increase (Decrease) | |
| Revenues from external customers: | | | | | | | | | |
| Income from loan originations | | $ | 38,394 | | | $ | 35,769 | | | | 7 | % |
| Secondary gains from investors | | | 93,582 | | | | 80,417 | | | | 16 | % |
| Net investment income | | | 829 | | | | 910 | | | | (9 | %) |
| Gains on investments and other assets | | | 60 | | | | 243 | | | | (75 | %) |
| Other | | | 7,956 | | | | 8,157 | | | | (2 | %) |
| Total | | $ | 140,821 | | | $ | 125,496 | | | | 12 | % |
| Earnings before income taxes | | $ | 4,718 | | | $ | (7,860 | ) | | | 160 | % |
Included in other revenues is service fee income. The increase in revenues for the Company’s mortgage operations for the twelve months ended December 31, 2019 as compared to December 31, 2018 was due to an increase in mortgage loan originations and refinancings, and subsequent sales into the secondary market.
Mortgage Loan Loss Settlements
Future loan losses can be extremely difficult to estimate. However, management believes that the Company’s reserve methodology and its current practice of property preservation allow it to estimate potential losses on loans sold. The estimated liability for indemnification losses is included in other liabilities and accrued expenses and, as of December 31, 2019 and 2018, the balances were $4,046,000 and $3,605,000, respectively.
Mortgage Loan Loss Litigation
For a description of the litigation involving SecurityNational Mortgage and Lehman Brothers holdings, see Part I, Item 3. Legal Proceedings.
Significant Accounting Policies
The following is a brief summary of the Company’s significant accounting policies and a review of the Company’s most critical accounting estimates. See Note 1 of the Notes to Consolidated Financial Statements.
Insurance Operations
In accordance with generally accepted accounting principles in the United States of America (“GAAP”), premiums and other considerations received for interest sensitive products are reflected as increases in liabilities for policyholder account balances and not as revenues. Revenues reported for these products consist of policy charges for the cost of insurance, administration charges, amortization of policy initiation fees and surrender charges assessed against policyholder account balances. Surrender benefits paid relating to these products are reflected as decreases in liabilities for policyholder account balances and not as expenses.
The Company receives investment income earned from the funds deposited into account balances, a portion of which is passed through to the policyholders in the form of interest credited. Interest credited to policyholder account balances and benefit claims in excess of policyholder account balances are reported as expenses in the consolidated financial statements.
Premiums and other considerations received for traditional life insurance products are recognized as revenues when due. Future policy benefits are recognized as expenses over the life of the policy by means of the provision for future policy benefits.
The costs related to acquiring new business, including certain costs of issuing policies and other variable selling expenses (principally commissions), defined as deferred policy acquisition costs, are capitalized and amortized into expense. For nonparticipating traditional life products, these costs are amortized over the premium paying period of the related policies, in proportion to the ratio of annual premium revenues to total anticipated premium revenues. Such anticipated premium revenues are estimated using the same assumptions used for computing liabilities for future policy benefits and are generally “locked in” at the date the policies are issued. For interest sensitive products, these costs are amortized generally in proportion to expected gross profits from surrender charges and investment, mortality and expense margins. This amortization is adjusted when the Company revises the estimate of current or future gross profits or margins. For example, deferred policy acquisition costs are amortized earlier than originally estimated when policy terminations are higher than originally estimated or when investments backing the related policyholder liabilities are sold at a gain prior to their anticipated maturity.
Death and other policyholder benefits reflect exposure to mortality risk and fluctuate from year to year on the level of claims incurred under insurance retention limits. The profitability of the Company is primarily affected by fluctuations in mortality, other policyholder benefits, expense levels, interest spreads (i.e., the difference between interest earned on investments and interest credited to policyholders) and persistency. The Company has the ability to mitigate adverse experience through sound underwriting, asset and liability duration matching, sound actuarial practices, adjustments to credited interest rates, policyholder dividends and cost of insurance charges.
Cemetery and Mortuary Operations
Pre-need sales of funeral services and caskets, including revenue and costs associated with the sales of pre-need funeral services and caskets, are deferred until the services are performed or the caskets are delivered.
Pre-need sales of cemetery interment rights (cemetery burial property), including revenue and costs associated with the sales of pre-need cemetery interment rights, are recognized in accordance with the retail land sales provisions of GAAP. Under GAAP, recognition of revenue and associated costs from constructed cemetery property must be deferred until a minimum percentage of the sales price has been collected. Revenues related to the pre-need sale of unconstructed cemetery property will be deferred until such property is constructed and meets the criteria of GAAP, described above.
Pre-need sales of cemetery merchandise (primarily markers and vaults), including revenue and costs associated with the sales of pre-need cemetery merchandise, are deferred until the merchandise is delivered, fulfilling the performance obligation.
Pre-need sales of cemetery services (primarily merchandise delivery and installation fees and burial opening and closing fees), including revenue and costs associated with the sales of pre-need cemetery services, are deferred until the services are performed.
Prearranged funeral and pre-need cemetery customer obtaining costs, including costs incurred related to obtaining new pre-need cemetery and prearranged funeral business are accounted for under the guidance of the provisions of GAAP. Obtaining costs, which include only costs that vary with and are primarily related to the acquisition of new pre-need cemetery and prearranged funeral business, are deferred until the merchandise is delivered or services are performed.
Revenues and costs for at‑need sales are recorded when a valid contract exists, the services are performed, collection is reasonably assured, and there are no significant company obligations remaining.
Mortgage Operations
Mortgage fee income consists of origination fees, processing fees, interest income and certain other income related to the origination and sale of mortgage loans. The Company has elected to use fair value accounting for all mortgage loans that are held for sale. Accordingly, all revenues and costs are now recognized when the mortgage loan is funded and any changes in fair value are shown as a component of mortgage fee income.
The Company, through its mortgage subsidiaries, sells mortgage loans to third-party investors without recourse, unless defects are identified in the representations and warranties made at loan sale. It may be required, however, to repurchase a loan or pay a fee instead of repurchase under certain events, which include the following:
| • | Failure to deliver original documents specified by the investor, |
| | |
| • | The existence of misrepresentation or fraud in the origination of the loan, |
| | |
| • | The loan becomes delinquent due to nonpayment during the first several months after it is sold, |
| | |
| • | Early pay-off of a loan, as defined by the agreements, |
| | |
| • | Excessive time to settle a loan, |
| | |
| • | Investor declines purchase, and |
| | |
| • | Discontinued product and expired commitment. |
Loan purchase commitments generally specify a date 30 to 45 days after delivery upon which the underlying loans should be settled. Depending on market conditions, these commitment settlement dates can be extended at a cost to the Company.
It is the Company’s policy to cure any documentation problems regarding such loans at a minimal cost for up to a six-month time period and to pursue efforts to enforce loan purchase commitments from third-party investors concerning the loans. The Company believes that six months allows adequate time to remedy any documentation issues, to enforce purchase commitments, and to exhaust other alternatives. Remedial methods include the following:
| • | Research reasons for rejection, |
| | |
| • | Provide additional documents, |
| | |
| • | Request investor exceptions, |
| | |
| • | Appeal rejection decision to purchase committee, and |
| | |
| • | Commit to secondary investors. |
Once purchase commitments have expired and other alternatives to remedy are exhausted, which could be earlier than the six-month time period, the loans are repurchased and transferred to mortgage loans held for investment at the lower of cost or fair value and the previously recorded sales revenue that was to be received from a third-party investor is written off against the loan loss reserve. Any loan that later becomes delinquent is evaluated by the Company at that time and any impairment is adjusted accordingly.
Determining lower of cost or market. Cost for loans held for sale is equal to the amount paid to the warehouse bank and the amount originally funded by the Company. Market value, while often difficult to determine, is based on the following guidelines:
| • | For loans that are committed, the Company uses the commitment price. |
| | |
| • | For loans that are non-committed that have an active market, the Company uses the market price. |
| | |
| • | For loans that are non-committed where there is no market but there is a similar product, the Company uses the market value for the similar product. |
| | |
| • | For loans that are non-committed where no active market exists, the Company determines that the unpaid principal balance best approximates the market value, after considering the fair value of the underlying real estate collateral, estimated future cash flows, and loan interest rate. |
The appraised value of the real estate underlying the original mortgage loan adds significance to the Company’s determination of fair value because, if the loan becomes delinquent, the Company has sufficient value to collect the unpaid principal balance or the carrying value of the loan, thus minimizing credit risk.
The majority of loans originated are sold to third-party investors. The amounts expected to be sold to investors are shown on the consolidated balance sheets as loans held for sale.
Use of Significant Accounting Estimates
The preparation of financial statements in conformity with GAAP requires management to make estimates and assumptions that affect reported amounts and disclosures. It is reasonably possible that actual experience could differ from the estimates and assumptions utilized which could have a material impact on the financial statements. The following is a summary of our significant accounting estimates, and critical issues that impact them:
Loan Commitments
The Company estimates the fair value of a mortgage loan commitment based on the change in estimated fair value of the underlying mortgage loan, quoted mortgage backed security (“MBS”) prices, estimates of the fair value of mortgage servicing rights, and an estimate of the probability that the mortgage loan will fund within the terms of the commitment
net of estimated commission expense. The change in fair value of the underlying mortgage loan is measured from the date the mortgage loan commitment is issued and is shown net of related expenses. Following issuance, the value of a loan commitment can be either positive or negative depending upon the change in value of the underlying mortgage loans. Fallout rates and other factors from the Company’s recent historical data are used to estimate the quantity and value of mortgage loans that will fund within the terms of the commitments.
Deferred Acquisition Costs
Amortization of deferred policy acquisition costs for interest sensitive products is dependent upon estimates of current and future gross profits or margins on this business. Key assumptions used include the following: yield on investments supporting the liabilities, amount of interest or dividends credited to the policies, amount of policy fees and charges, amount of expenses necessary to maintain the policies, amount of death and surrender benefits, and the length of time the policies will stay in force.
For nonparticipating traditional life products, these costs are amortized over the premium paying period of the related policies in proportion to the ratio of annual premium revenues to total anticipated premium revenues. Such anticipated premium revenues are estimated using the same assumption used for computing liabilities for future policy benefits and are generally “locked in” at the date the policies are issued.
Value of Business Acquired
Value of business acquired is the present value of estimated future profits of the acquired business and is amortized similar to deferred acquisition costs. The critical issues explained for deferred acquisition costs would also apply for value of business acquired.
Mortgage Loans Foreclosed to Real Estate Held for Investment
These properties are recorded at the lower of cost or fair value upon foreclosure. The Company believes that in an orderly market, fair value approximates the replacement cost of a home and the rental income provides a cash flow stream for investment analysis. The Company believes the highest and best use of the properties are as income producing assets since it is the Company’s intent to hold the properties as rental properties, matching the income from the investment in rental properties with the funds required for estimated future policy benefits. Accordingly, the fair value determination is generally weighted more heavily toward the rental analysis. The fair value is also estimated by obtaining an independent appraisal, which typically considers area comparables and property condition.
Future Policy Benefits
Reserves for future policy benefits for traditional life insurance products requires the use of many assumptions, including the duration of the policies, mortality experience, expenses, investment yield, lapse rates, surrender rates, and dividend crediting rates.
These assumptions are made based upon historical experience, industry standards and a best estimate of future results and, for traditional life products, include a provision for adverse deviation. For traditional life insurance, once established for a particular series of products, these assumptions are generally held constant.
Unearned Revenue
The universal life products the Company sells have significant policy initiation fees (front-end load) that are deferred and amortized into revenues over the estimated expected gross profits from surrender charges and investment, mortality and expense margins. The same issues that impact deferred acquisition costs would apply to unearned revenue.
Deferred Pre-need Cemetery and Funeral Contracts Revenues and Estimated Future Cost of Pre-need Sales
The revenue and cost associated with the sales of pre-need cemetery merchandise and funeral services are deferred until the merchandise is delivered or the service is performed.
The Company, through its cemetery and mortuary operations, provides a guaranteed funeral arrangement wherein a prospective customer can receive future goods and services at guaranteed prices. To accomplish this, the Company, through its life insurance operations, sells to the customer an increasing benefit life insurance policy that is assigned to the mortuaries. If, at the time of need, the policyholder or potential mortuary customer utilizes one of the Company’s facilities, the guaranteed funeral arrangement contract that has been assigned will provide the funeral goods and services at the contracted price. The increasing life insurance policy will cover the difference between the original contract prices and current prices. Risks may arise if the difference cannot be fully met by the life insurance policy.
Mortgage Servicing Rights
Mortgage Service Rights (“MSR”) arise from contractual agreements between the Company and third-party investors (or their agents) when mortgage loans are sold. Under these contracts, the Company is obligated to retain and provide loan servicing functions on the loans sold, in exchange for fees and other remuneration. The servicing functions typically performed include, among other responsibilities, collecting and remitting loan payments; responding to borrower inquiries; accounting for principal and interest; holding custodial (impound) funds for payment of property taxes and insurance premiums; counseling delinquent mortgagors; and supervising the acquisition of real estate owned and property dispositions. The Company initially accounts for MSRs at fair value and subsequently accounts for them using the amortization method. MSR amortization is determined by amortizing the MSR balance in proportion to, and over the period of the estimated future net servicing income of the underlying financial assets. The Company periodically assesses MSRs accounted for using the amortization method for impairment.
Mortgage Allowance for Loan Losses and Loan Loss Reserve
The Company provides for losses on its mortgage loans held for investment through an allowance for loan losses (a contra-asset account) and through the mortgage loan loss reserve (a liability account). The allowance for loan losses is an allowance for losses on the Company’s mortgage loans held for investment. The allowance is comprised of two components. The first component is an allowance for collectively evaluated impairment that is based upon the Company’s historical experience in collecting similar receivables. The second component is based upon individual evaluation of loans that are determined to be impaired.
Upon determining impairment, the Company establishes an individual impairment allowance based upon an assessment of the fair value of the underlying collateral. In addition, when a mortgage loan is past due more than 90 days, the Company does not accrue any interest income. When a loan becomes delinquent, the Company proceeds to foreclose on the real estate and all expenses for foreclosure are expensed as incurred. Once foreclosed, an adjustment for the lower of cost or fair value is made, if necessary, and the amount is classified as real estate held for investment. The Company will rent the properties until it is deemed desirable to sell them.
The mortgage loan loss reserve is an estimate of probable losses at the balance sheet date that the Company will realize in the future on mortgage loans sold to third-party investors. The Company may be required to reimburse third-party investors for costs associated with early payoff of loans within the first six months of such loans and to repurchase loans where there is a default in any of the first four monthly payments to the investors or, in lieu of repurchase, to pay a negotiated fee to the investors. The Company’s estimates are based upon historical loss experience and the best estimate of the probable loan loss liabilities.
Upon completion of a transfer that satisfies the conditions to be accounted for as a sale, the Company initially measures at fair value liabilities incurred in a sale relating to any guarantee or recourse provisions in the event of defects in the representations and warranties made at loan sale. The Company accrues a monthly allowance for indemnification losses to investors based on total production. This estimate is based on the Company’s historical experience and is included as a component of mortgage fee income. Subsequent updates to the recorded liability from changes in assumptions are recorded in selling, general and administrative expenses. The estimated liability for indemnification losses is included in other liabilities and accrued expenses.
The Company believes the allowance for loan losses and the loan loss reserve represent probable loan losses incurred as of the balance sheet date.
Deferred Tax Assets and Liabilities
Deferred tax assets and liabilities require various estimates and judgments and may be affected favorably or unfavorably by various internal and external factors. These estimates and judgments occur in the calculation of certain deferred tax assets and liabilities that arise from temporary differences in the recognition of revenues and expenses for tax and financial reporting purposes and in estimating the ultimate amount of deferred tax assets recoverable in future periods. Factors affecting the deferred tax assets and liabilities include, but are not limited to, changes in tax laws, regulations and/or rates, changing interpretations of existing tax laws or regulations, and changes to overall levels of pre-tax earnings. Changes in these estimates, judgments or factors may result in an increase or decrease to the Company’s deferred tax assets and liabilities with a related increase or decrease in the Company’s provision for income taxes.
Results of Consolidated Operations
2019 Compared to 2018
Total revenues increased by $3,442,000, or 1.2%, to $283,061,000 for 2019 from $279,619,000 for the fiscal year 2018. Contributing to this increase in total revenues was a $15,490,000 increase in mortgage fee income, a $5,932,000 increase in insurance premiums and other considerations, a $3,106,000 increase in net investment income, a $1,570,000 increase in net cemetery and mortuary sales, and a $257,000 increase in other revenues. This increase in total revenues was offset by a $23,213,000 decrease in gains on investments and other assets.
Insurance premiums and other considerations increased by $5,932,000, or 7.8%, to $81,861,000 for 2018, from $75,929,000 for the comparable period in 2018. This increase was primarily due to an increase in renewal premiums due to the growth of the Company in recent years, particularly in whole life products, which resulted in more premium paying business in force.
Net investment income increased by $3,106,000, or 7.8%, to $43,019,000 for 2019, from $39,913,000 for the comparable period in 2018. This increase was primarily attributable to a $1,315,000 increase in insurance assignment income, a $625,000 decrease in investment expenses, a $560,000 increase in interest income from cash and cash equivalents, a $408,000 increase in rental income from real estate held for investment, a $331,000 increase in fixed maturity securities income, a $145,000 increase in policy loan income, and a $76,000 increase in equity securities income. This increase was partially offset by a $311,000 decrease in interest from mortgage loans held for investment and a $43,000 decrease in income from other investments.
Net mortuary and cemetery sales increased by $1,570,000, or 11.4%, to $15,296,000 for 2019, from $13,726,000 for the comparable period in 2018. This increase was primarily due to a $1,019,000 increase in at-need sales in the mortuary operations and a $915,000 increase in at-need sales in the cemetery operations. This increase was partially offset by a $364,000 decrease in pre-need sales in the cemetery operations.
Gains on investments and other assets decreased by $23,213,000, or 97.0%, to $728,000 in gains for 2019, from $23,941,000 in gains for the comparable period in 2018. This decrease in gains on investments and other assets was primarily attributable to the $22,252,000 gain that was realized on the sale of Dry Creek at East Village Apartments in the first quarter of 2018 and an impairment loss of $2,769,000 recognized in 2019 on a commercial real estate property held for investment. The Company elected to conduct a review of the property’s value after it received an unsolicited offer to buy and also obtained an independent appraisal from an outside commercial real estate valuation firm. This decrease was also the result of a $1,556,000 gain that was realized on the sale of assets of Deseret Mortuary in the second quarter of 2018. This decrease was partially offset by a $2,570,000 increase in gains on equity securities mostly attributable to increases in the fair value of these securities. Due to the adoption of Accounting Standards Update (“ASU”) 2016-01 on January 1, 2018, these changes in fair value are now recognized in earnings instead of other comprehensive income. This decrease was also partially offset by a $443,000 increase in gains on fixed maturity securities and a $351,000 increase in gains on other assets.
Mortgage fee income increased by $15,790,000, or 13.6%, to $131,976,000 for 2019, from $116,186,000 for the comparable period in 2018. This increase was primarily due to $13,165,000 increase in secondary gains on loans sold to third-party investors from increased lending volumes, a $2,054,000 increase in other loan fees and interest income, a $505,000 decrease in the provision for loan loss reserve, and a net increase of $66,000 in the fair value of loans held for sale and loan commitments.
Other revenues increased by $257,000, or 2.6%, to $10,180,000 for 2019 from $9,923,000 for the comparable period in 2018. This increase was primarily due to a $630,000 increase in experience refunds on reinsurance due to the coinsurance agreement with Kilpatrick Life Insurance Company (“Kilpatrick”) prior to the acquisition of Kilpatrick by the Company. This increase was partially offset by a $349,000 decrease in mortgage loan servicing fee revenue.
Total benefits and expenses were $269,117,000, or 95.1% of total revenues for 2019, as compared to $253,438,000, or 90.6% of total revenues, for the comparable period in 2018.
Death benefits, surrenders and other policy benefits, and future policy benefits increased by an aggregate of $4,963,000, or 7.8%, to $68,480,000 for 2019, from $63,517,000 for the comparable period in 2018. This increase was primarily the result of a $5,292,000 increase in death benefits and a $434,000 increase in surrenders and other policy benefits. This increase was partially offset by a $763,000 decrease in future policy benefits.
Amortization of deferred policy and pre-need acquisition costs and value of business acquired increased by $3,003,000, or 25.8%, to $14,634,000 for 2019, from $11,631,000 for the comparable period in 2018. This increase was primarily due to an increase in the average outstanding balance of deferred policy and pre-need acquisition costs.
Selling, general and administrative expenses increased by $6,563,000, or 3.9%, to $175,737,000 for 2019, from $169,174,000 for the comparable period in 2018. This increase was primarily due to a $6,472,000 increase in commission expenses due to an increase in mortgage loan originations, a $3,908,000 increase in other expenses, and a $182,000 increase in advertising expenses. This increase was partially offset by a $3,148,000 decrease in personnel expenses due to the efforts of the Mortgage segment to reduce costs and restructure internal processes, a $550,000 decrease in rent and rent related expenses, a $156,000 decrease in depreciation on property and equipment, and a $145,000 decrease in costs related to funding mortgage loans.
Interest expense increased by $430,000, or 6.2%, to $7,387,000 for 2019, from $6,957,000 for the comparable period in 2018. This increase was primarily due to a $373,000 increase in interest expense on mortgage warehouse lines and a $163,000 increase in interest expense on bank loans for real estate held for investment. This increase was partially offset by a decrease of $105,000 in interest on funds withheld reinsurance.
Cost of goods and services sold of the cemeteries and mortuaries increased by $719,000, or 33.3%, to $2,878,000 for 2019, from $2,159,000 for the comparable period in 2018. This increase was primarily due to a $292,000 increase in costs related to cemetery at-need sales, a $268,000 increase in costs related to mortuary at-need sales, and a $159,000 increase in costs related to cemetery pre-need sales.
Income tax expense decreased by $1,444,000, or 32.1%, to $3,050,000 for 2019, from $4,494,00 for the comparable period in 2018. This decrease was primarily due to a decrease in earnings before income taxes for 2019 compared to 2018.
Risks
The following is a description of the most significant risks facing the Company and how it mitigates those risks:
Legal and Regulatory Risks. Changes in the legal or regulatory environment in which the Company operates may create additional expenses and risks not anticipated by the Company in developing and pricing its products. Regulatory initiatives designed to reduce insurer profits, new legal theories or insurance company insolvencies through guaranty fund assessments may create costs for the insurer beyond those recorded in the consolidated financial statements. In addition, changes in tax law with respect to mortgage interest deductions or other public policy or legislative changes may affect the Company’s mortgage sales. Also, the Company may be subject to further regulations in the cemetery and mortuary business. The Company mitigates these risks by offering a wide range of products and by diversifying its operations, thus reducing its exposure to any single product or jurisdiction, and also by employing underwriting practices that identify and minimize the adverse impact of such risks.
Mortgage Industry Risks. Developments in the mortgage industry and credit markets can adversely affect the Company’s ability to sell its mortgage loans to investors, which can impact the Company’s financial results by requiring it to assume the risk of holding and servicing any unsold loans.
The mortgage loan loss reserve is an estimate of probable losses at the balance sheet date that the Company could realize in the future on mortgage loans sold to third-party investors. The Company’s mortgage subsidiaries may be required to reimburse third-party investors for costs associated with early payoff of loans within the first six months of such loans and to repurchase loans where there is a default in any of the first four monthly payments to the investors or, in lieu of repurchase, to pay a negotiated fee to the investors. The Company’s estimates are based upon historical loss experience and the best estimate of the probable loan loss liabilities.
Upon completion of a transfer that satisfies the conditions to be accounted for as a sale, the Company initially measures at fair value liabilities incurred in a sale relating to any guarantee or recourse provisions. The initial reserve for loan losses in years ended December 31, 2019 and 2018 were $643,000 and $1,148,000, respectively, and the charge has been included in mortgage fee income. The estimated liability for indemnification losses is included in other liabilities and accrued expenses and, as of December 31, 2019 and 2018, the balances were $4,046,000 and $3,605,000, respectively. The Company believes the loan loss reserve represent probable loan losses incurred as of December 31, 2019. There is a risk, however, that future loan losses may exceed the loan loss reserve.
At various times third-party investors have asserted that SecurityNational Mortgage sold mortgage loans that allegedly contained borrower misrepresentations or experienced early payment defaults, or that were otherwise allegedly defective or not in compliance with loan purchase agreements involving SecurityNational Mortgage. As a result of these claims, third-party investors have made demands at times that SecurityNational Mortgage repurchase certain alleged defective mortgage loans that were sold to such investors or indemnify them against any losses related to such loans.
The total amount of potential claims by third-party investors is difficult to determine. The Company has reserved and accrued $4,046,000 as of December 31, 2019 to settle all such investor related claims. The Company believes that the reserve for mortgage loan losses, which includes provisions for probable losses and indemnification on loans held for sale, is reasonable based on available information. Moreover, the Company has successfully negotiated acceptable settlement terms with other third-party investors that asserted claims for mortgage loan losses against SecurityNational Mortgage.
SecurityNational Mortgage disagrees with the repurchase demands and notices of potential claims from third-party investors. Furthermore, SecurityNational Mortgage believes there is potential to resolve the alleged claims by the third-party investors on acceptable terms. If SecurityNational Mortgage is unable to resolve such claims on acceptable terms, legal action may ensue. In the event of legal action by any third-party investor, SecurityNational Mortgage believes it has significant defenses to any such action and intends to vigorously defend itself against such action.
As of December 31, 2019, the Company’s mortgage loans held for investment portfolio consisted of $8,895,000 in mortgage loans with delinquencies more than 90 days. Of this amount, $1,651,000 of the loans were in foreclosure proceedings. The Company has not received or recognized any interest income on the $8,895,000 in mortgage loans with delinquencies more than 90 days. During the twelve months ended December 31, 2019, the Company increased its allowance for loan losses by $105,000 and during the twelve months ended December 31, 2018, the Company decreased its allowance for loan losses by $415,000, which was charged to bad debt expense and included in selling, general and administrative expenses for the period. The allowances for loan losses as of December 31, 2019 and 2018 were $1,453,000 and $1,348,000, respectively.
Interest Rate Risk. The risk that interest rates will change, which may cause a decrease in the value of the Company’s investments or impair the ability of the Company to market its mortgage and cemetery and mortuary products. This change in rates may cause certain interest-sensitive products to become uncompetitive or may cause disintermediation. The Company mitigates this risk by charging fees for non-conformance with certain policy provisions, by offering products that transfer this risk to the purchaser, and by attempting to match the maturity schedule of its assets with the expected payouts of its liabilities. To the extent that liabilities come due more quickly than assets mature, the Company might have to borrow funds or sell assets prior to maturity and potentially recognize a loss on the sale.
Mortality and Morbidity Risks. The risk that the Company’s actuarial assumptions may differ from actual mortality and morbidity experiences may cause the Company’s products to be underpriced, may cause the Company to liquidate insurance or other claims earlier than anticipated, and other potentially adverse consequences to the business. The Company minimizes this risk through sound underwriting practices, asset and liability duration matching, and sound actuarial practices.
COVID-19. Since December 31, 2019, the outbreak of the novel strain of coronavirus, specifically identified as "COVID-19", has resulted in governments worldwide enacting emergency measures to combat the spread of the virus. These measures, which include the implementation of travel bans, self-imposed quarantine periods and social distancing, have caused material disruption to businesses globally resulting in an economic slowdown. Global equity markets have experienced significant volatility and weakness. Governments and central banks have reacted with significant monetary and fiscal interventions designed to stabilize economic conditions. The duration and impact of the COVID-19 outbreak is unknown at this time, as is the efficacy of the government and central bank interventions. It is not possible to reliably estimate the length and severity of these developments and the impact on the financial results and condition of the Company and its operating subsidiaries in future periods. Further, these uncertainties have the potential to negatively affect the risk of credit default for the issuers of the Company’s debt securities and individual borrowers with mortgage loans held by the Company.
Estimates. The preparation of financial statements in conformity with GAAP requires management to make estimates and assumptions that affect the amounts reported in the consolidated financial statements and accompanying notes. Actual results could differ from those estimates.
Material estimates that are particularly susceptible to significant changes in the near term are those used in determining the value of derivative assets and liabilities; those used in determining deferred acquisition costs and the value of business acquired; those used in determining the value of mortgage loans foreclosed to real estate held for investment; those used in determining the liability for future policy benefits and unearned revenue; those used in determining the estimated future costs for pre-need sales; those used in determining the value of mortgage servicing rights; those used in determining allowances for loan losses for mortgage loans held for investment; those used in determining loan loss reserve; and those used in determining deferred tax assets and liabilities. Although some variability is inherent in these estimates, management believes the amounts provided are fairly stated in all material respects.
Liquidity and Capital Resources
The Company’s life insurance subsidiaries and cemetery and mortuary subsidiaries realize cash flow from premiums, contract payments and sales on personal services rendered for cemetery and mortuary business, from interest and dividends on invested assets, and from the proceeds from the maturity of held to maturity investments or sale of other investments. The mortgage subsidiaries realize cash flow from fees generated by originating and refinancing mortgage loans and fees on mortgage loans held for sale that are sold to investors. The Company considers these sources of cash flow to be adequate to fund future policyholder and cemetery and mortuary liabilities, which generally are long-term, and adequate to pay current policyholder claims, annuity payments, expenses related to the issuance of new policies, the maintenance of existing policies, debt service, and to meet current operating expenses.
During the twelve months ended December 31, 2019, the Company's operations used cash of $75,602,000. This increase was primarily due to originations of mortgage loans held for sale. During the twelve months ended December 31, 2018, the Company’s operations provided cash of $7,009,000. This was primarily due to an increase in cash collected on loans held for sale.
The Company’s liability for future policy benefits is expected to be paid out over the long-term due to the Company’s market niche of selling funeral plans. Funeral plans are small face value life insurance that will pay the costs and expenses incurred at the time of a person’s death. A person generally will keep these policies in force and will not surrender them prior to a person’s death. Because of the long-term nature of these liabilities, the Company is able to hold to maturity its bonds, real estate and mortgage loans thus reducing the risk of liquidating these long-term investments as a result of any sudden changes in market values.
The Company attempts to match the duration of invested assets with its policyholder and cemetery and mortuary liabilities. The Company may sell investments other than those held to maturity in the portfolio to help in this timing. The Company purchases short-term investments on a temporary basis to meet the expectations of short-term requirements of the Company’s products. The Company’s investment philosophy is intended to provide a rate of return, which will persist during the expected duration of policyholder and cemetery and mortuary liabilities regardless of future interest rate movements.
The Company’s investment policy is also to invest predominantly in fixed maturity securities, real estate, mortgage loans, and warehousing of mortgage loans held for sale on a short-term basis before selling the loans to investors in accordance with the requirements and laws governing the life insurance subsidiaries. Bonds owned by the insurance subsidiaries amounted to $355,613,000 (at estimated fair value) and $231,976,000 (at amortized cost) as of December 31, 2019 and 2018, respectively. This represents 45.5% and 38.9% of the total investments as of December 31, 2019, and 2018, respectively. Generally, all bonds owned by the life insurance subsidiaries are rated by the National Association of Insurance Commissioners. Under this rating system, there are six categories used for rating bonds. At December 31, 2019, 2.2% (or $7,633,000) and at December 31, 2018, 3.6% (or $8,413,000) of the Company’s total bond investments were invested in bonds in rating categories three through six, which are considered non‑investment grade.
On December 31, 2019, the Company changed the classification of its bonds to available for sale from held to maturity. As a result, bonds available for sale are carried at estimated fair value instead of amortized cost. See Note 2 of the Notes to Consolidated Financial Statements for additional disclosures regarding the change in classification.
See Note 2 of the Notes to Consolidated Financial Statements for the schedule of the maturity of fixed maturity securities and for the schedule of principal payments for mortgage loans held for investment.
See Note 7 of the Notes to Consolidated Financial Statements for a description of the Company’s sources of liquidity.
If market conditions were to cause interest rates to change, the fair value of the Company’s fixed income portfolio, which includes bonds, preferred stocks and mortgage loans held for investment, could change by the following amounts based on the respective basis point swing (the change in the fair values were calculated using a modeling technique):
| | | -200 bps | | | -100 bps | | | +100 bps | | | +200 bps | |
Change in Fair Value (in thousands) | | $ | 52,282 | | | $ | 23,017 | | | $ | (14,014 | ) | | $ | 4,386 | |
The Company is subject to risk-based capital guidelines established by statutory regulators requiring minimum capital levels based on the perceived risk of assets, liabilities, disintermediation, and business risk. At December 31, 2019 and 2018, the capital levels of the life insurance subsidiaries exceeded the regulatory criteria.
The Company’s total capitalization of stockholders’ equity, and bank loans and other loans payable was $414,283,000 as of December 31, 2019, as compared to $359,172,000 as of December 31, 2018. Stockholders’ equity as a percent of total capitalization was 47.5% and 47.8% as of December 31, 2019 and December 31, 2018, respectively. Bank loans and other loans payable increased by $30,051,000 for the twelve months ended December 31, 2019 as compared to December 31, 2018, thus limiting the increase in the stockholders’ equity percentage.
Lapse rates measure the amount of insurance terminated during a particular period. The Company’s lapse rate for life insurance was 9.8% in 2019 as compared to a rate of 9.9% for 2018.
At December 31, 2019, the combined statutory capital and surplus of the Company’s life insurance subsidiaries was $74,140,000. The life insurance subsidiaries cannot pay a dividend to its parent company without the approval of state insurance regulatory authorities.
Forward-Looking Statements
The Private Securities Litigation Reform Act of 1995 provides a safe harbor for forward-looking statements to encourage companies to provide prospective information about their businesses without fear of litigation so long as those statements are identified as forward-looking and are accompanied by meaningful cautionary statements identifying important factors that could cause actual results to differ materially from those projected in such statements. The Company desires to take advantage of the “safe harbor” provisions of the act.
This Annual Report on Form 10-K contains forward-looking statements, together with related data and projections, about the Company’s projected financial results and its future plans and strategies. However, actual results and needs of the Company may vary materially from forward-looking statements and projections made from time to time by the Company on the basis of management’s then-current expectations. The business in which the Company is engaged involves changing and competitive markets, which may involve a high degree of risk, and there can be no assurance that forward-looking statements and projections will prove accurate.
Factors that may cause the Company’s actual results to differ materially from those contemplated or projected, forecast, estimated or budgeted in such forward looking statements include among others, the following possibilities: (i) heightened competition, including the intensification of price competition, the entry of new competitors, and the introduction of new products by new and existing competitors; (ii) adverse state and federal legislation or regulation, including decreases in rates, limitations on premium levels, increases in minimum capital and reserve requirements, benefit mandates and tax treatment of insurance products; (iii) fluctuations in interest rates causing a reduction of investment income or increase in interest expense and in the market value of interest rate sensitive investment; (iv) failure to obtain new customers, retain existing customers or reductions in policies in force by existing customers; (v) higher service, administrative, or general expenses due to the need for additional advertising, marketing, administrative or management information systems expenditures; (vi) loss or retirement of key executives or employees; (vii) increases in medical costs; (viii) changes in the Company’s liquidity due to changes in asset and liability matching; (ix) restrictions on insurance underwriting based on genetic testing and other criteria; (x) adverse changes in the ratings obtained by independent rating agencies; (xi) failure to maintain adequate reinsurance; (xii) possible claims relating to sales practices for insurance products and claim denials; (xiii) adverse trends in mortality and morbidity; (xiv) deterioration of real estate markets; and (xv) lawsuits in the ordinary course of business.
Off-Balance Sheet Agreements
At December 31, 2019, the Company was contingently liable under a standby letter of credit aggregating $625,405, to be used as collateral to cover any contingency related to additional risk assessments pertaining to the Company's captive insurance program. The Company does not expect any material losses to result from the issuance of the standby letter of credit because claims are not expected to exceed premiums paid.
The total of the Company’s unfunded residential construction loan and land development loan commitments as of December 31, 2019, was approximately $33,036,000.
In 2016, the Company, through its wholly-owned subsidiary 5300 Development, LLC, entered into a Construction Loan Agreement with a bank. Under the terms of this Agreement, the Company agrees to pay the bank the current outstanding principal up to $40,740,000 plus interest. These funds are being used for the construction of phase 1 of the Company’s new Center53 corporate campus development in Salt Lake City, Utah. As of December 31, 2019, the Company has used $33,913,000 of these funds.
The Company’s contractual obligations as of December 31, 2019, and the payments due by period are shown in the following table:
| | | Less than
1 year | | | 1-3 years | | | 4-5 years | | | over
5 years | | | Total | |
| Bank and other loans payable | | | 192,985,602 | | | | 5,408,387 | | | | 2,466,203 | | | | 16,712,420 | | | | 217,572,612 | |
| Non-cancelable operating leases | | | 4,241,547 | | | | 4,712,587 | | | | 2,445,058 | | | | 2,919,074 | | | | 14,318,266 | |
| Future policy benefits (1) | | | 8,630,570 | | | | 36,211,003 | | | | 50,924,810 | | | | 718,220,779 | | | | 813,987,162 | |
| | | $ | 205,857,719 | | | $ | 46,331,977 | | | $ | 55,836,071 | | | $ | 737,852,273 | | | $ | 1,045,878,040 | |
________
| (1) | Amounts represent the present value of future policy benefits, net of estimated future premiums. |
Casualty Insurance Program
In conjunction with the Company’s casualty insurance program, limited equity interests are held in a captive insurance entity. This program permits the Company to self-insure a portion of losses, to gain access to a wide array of safety-related services, to pool insurance risks and resources in order to obtain more competitive pricing for administration and reinsurance and to limit its risk of loss in any particular year. The maximum exposure to loss related to the Company’s involvement with this entity is limited to approximately $625,405, which is collateralized under a standby letter of credit issued on the insurance entity’s behalf. See Note 10, “Reinsurance, Commitments and Contingencies,” for additional discussion of commitments associated with the insurance program.
Item 7A. Quantitative and Qualitative Disclosures about Market Risk
As a smaller reporting company, the Company is not required to provide information typically disclosed under this item.
Item 8. Financial Statements and Supplementary Data
| INDEX TO CONSOLIDATED FINANCIAL STATEMENTS | |
| | | Page No. |
| Financial Statements: | |
| | |
| | Report of Independent Registered Public Accounting Firm | 31 |
| | | |
| | Consolidated Balance Sheets, December 31, 2019 and 2018 | 32 |
| | | |
| | Consolidated Statements of Earnings for the Years Ended December 31, 2019 and 2018 | 34 |
| | | |
| | Consolidated Statements of Comprehensive Income for the Years Ended December 31, 2019 and 2018 | 35 |
| | | |
| | Consolidated Statements of Stockholders’ Equity for the Years Ended December 31, 2019 and 2018 | 36 |
| | | |
| | Consolidated Statements of Cash Flows for the Years Ended December 31, 2019 and 2018 | 37 |
| | | |
| | Notes to Consolidated Financial Statements | 39
|

111 South Main Street Suite 1500 Salt Lake City, UT 84111 USA Tel: +1 801 328 4706 Fax: +1 801 366 7900 www.deloitte.com |
REPORT OF INDEPENDENT REGISTERED PUBLIC ACCOUNTING FIRM
To the Board of Directors and Stockholders of Security National Financial Corporation:
Opinion on the Financial Statements
We have audited the accompanying consolidated balance sheets of Security National Financial Corporation and subsidiaries (the “Company”) as of December 31, 2019 and 2018, the related consolidated statements of income, comprehensive income, stockholders’ equity, and cash flows for each of the years then ended, and the related notes and the schedules listed in the Index at Item 15 (collectively referred to as the “financial statements”). In our opinion, the financial statements present fairly, in all material respects, the financial position of the Company as of December 31, 2019 and 2018, and the results of its operations and its cash flows for each of the years then ended, in conformity with accounting principles generally accepted in the United States of America.
Basis for Opinion
These financial statements are the responsibility of the Company's management. Our responsibility is to express an opinion on the Company's financial statements based on our audits. We are a public accounting firm registered with the Public Company Accounting Oversight Board (United States) (PCAOB) and are required to be independent with respect to the Company in accordance with the U.S. federal securities laws and the applicable rules and regulations of the Securities and Exchange Commission and the PCAOB.
We conducted our audits in accordance with the standards of the PCAOB. Those standards require that we plan and perform the audit to obtain reasonable assurance about whether the financial statements are free of material misstatement, whether due to error or fraud. The Company is not required to have, nor were we engaged to perform, an audit of its internal control over financial reporting. As part of our audits, we are required to obtain an understanding of internal control over financial reporting but not for the purpose of expressing an opinion on the effectiveness of the Company’s internal control over financial reporting. Accordingly, we express no such opinion.
Our audits included performing procedures to assess the risks of material misstatement of the financial statements, whether due to error or fraud, and performing procedures that respond to those risks. Such procedures included examining, on a test basis, evidence regarding the amounts and disclosures in the financial statements. Our audits also included evaluating the accounting principles used and significant estimates made by management, as well as evaluating the overall presentation of the financial statements. We believe that our audits provide a reasonable basis for our opinion.
Salt Lake City, UT
March 30, 2020
We have served as the Company's auditor since 2017.
SECURITY NATIONAL FINANCIAL CORPORATION
AND SUBSIDIARIES
CONSOLIDATED BALANCE SHEETS
| | | December 31 | |
| Assets | | 2019 | | | 2018 | |
| Investments: | | | | | | |
| Fixed maturity securities, available for sale, at estimated fair value | | $ | 355,977,820 | | | $ | - | |
| Fixed maturity securities, held to maturity, at amortized cost | | | - | | | | 232,078,723 | |
| Equity securities, available for sale, at estimated fair value | | | 7,271,165 | | | | 5,558,611 | |
| Mortgage loans held for investment (net of allowances for loan losses of $1,453,037 and $1,347,972 for 2019 and 2018) | | | 236,694,546 | | | | 186,465,069 | |
| Real estate held for investment (net of accumulated depreciation of $12,788,739 and $16,739,578 for 2019 and 2018) | | | 102,756,946 | | | | 121,558,222 | |
| Real estate held for sale | | | 14,097,627 | | | | - | |
| Other investments and policy loans (net of allowances for doubtful accounts of $1,448,026 and $1,092,528 for 2019 and 2018) | | | 60,245,269 | | | | 46,617,655 | |
| Accrued investment income | | | 4,833,232 | | | | 3,566,146 | |
| Total investments | | | 781,876,605 | | | | 595,844,426 | |
| Cash and cash equivalents | | | 127,754,719 | | | | 142,199,942 | |
| Loans held for sale at estimated fair value | | | 213,457,632 | | | | 136,210,853 | |
| Receivables (net of allowances for doubtful accounts of $1,724,156 and $1,519,842 for 2019 and 2018) | | | 9,236,330 | | | | 8,935,343 | |
| Restricted assets (including $2,985,347 and $744,673 for 2019 and 2018 at estimated fair value) | | | 13,935,317 | | | | 10,981,562 | |
| Cemetery perpetual care trust investments (including $2,581,124 and $483,353 for 2019 and 2018 at estimated fair value) | | | 4,411,864 | | | | 4,335,869 | |
| Receivable from reinsurers | | | 15,747,768 | | | | 10,820,102 | |
| Cemetery land and improvements | | | 9,519,950 | | | | 9,878,427 | |
| Deferred policy and pre-need contract acquisition costs | | | 94,701,920 | | | | 89,362,096 | |
| Mortgage servicing rights, net | | | 17,155,529 | | | | 20,016,822 | |
| Property and equipment, net | | | 14,600,394 | | | | 7,010,778 | |
| Value of business acquired | | | 9,876,647 | | | | 5,765,190 | |
| Goodwill | | | 3,519,588 | | | | 2,765,570 | |
| Other | | | 18,649,812 | | | | 6,684,143 | |
| Total Assets | | $ | 1,334,444,075 | | | $ | 1,050,811,123 | |
See accompanying notes to consolidated financial statements.
SECURITY NATIONAL FINANCIAL CORPORATION
AND SUBSIDIARIES
CONSOLIDATED BALANCE SHEETS (Continued)
| | | December 31 | |
| Liabilities and Stockholders' Equity | | 2019 | | | 2018 | |
| Liabilities | | | | | | |
| Future policy benefits and unpaid claims | | $ | 825,600,918 | | | $ | 620,399,714 | |
| Unearned premium reserve | | | 3,621,697 | | | | 3,920,473 | |
| Bank and other loans payable | | | 217,572,612 | | | | 187,521,188 | |
| Deferred pre-need cemetery and mortuary contract revenues | | | 12,607,978 | | | | 12,508,625 | |
| Cemetery perpetual care obligation | | | 3,933,719 | | | | 3,821,979 | |
| Accounts payable | | | 5,056,983 | | | | 2,883,349 | |
| Other liabilities and accrued expenses | | | 50,652,591 | | | | 31,821,624 | |
| Income taxes | | | 18,686,972 | | | | 16,122,998 | |
| Total liabilities | | | 1,137,733,470 | | | | 878,999,950 | |
| Stockholders’ Equity | | | | | | | | |
| Preferred Stock: | | | | | | | | |
| Preferred stock - non-voting-$1.00 par value; 5,000,000 shares authorized; none issued or outstanding | | | - | | | | - | |
| Common Stock: | | | | | | | | |
| Class A: common stock - $2.00 par value; 20,000,000 shares authorized; issued 16,107,779 shares in 2019 and 15,304,798 shares in 2018 | | | 32,215,558 | | | | 30,609,596 | |
| Class B: non-voting common stock - $1.00 par value; 5,000,000 shares authorized; none issued or outstanding | | | - | | | | - | |
| Class C: convertible common stock - $2.00 par value; 3,000,000 shares authorized; issued 2,500,887 shares in 2019 and 2,193,643 shares in 2018 | | | 5,001,774 | | | | 4,387,286 | |
| Additional paid-in capital | | | 46,091,112 | | | | 41,821,778 | |
| Accumulated other comprehensive income, net of taxes | | | 13,726,514 | | | | (2,823 | ) |
| Retained earnings | | | 101,256,229 | | | | 95,201,732 | |
| Treasury stock, at cost - 490,823 Class A shares and -0- Class C shares in 2019; 302,541 Class A shares and -0- Class C shares in 2018 | | | (1,580,582 | ) | | | (206,396 | ) |
| Total stockholders’ equity | | | 196,710,605 | | | | 171,811,173 | |
| Total Liabilities and Stockholders’ Equity | | $ | 1,334,444,075 | | | $ | 1,050,811,123 | |
See accompanying notes to consolidated financial statements.
SECURITY NATIONAL FINANCIAL CORPORATION
AND SUBSIDIARIES
CONSOLIDATED STATEMENTS OF EARNINGS
| | | Years Ended December 31 | |
| | | 2019 | | | 2018 | |
Revenues: | | | | | | |
| Insurance premiums and other considerations | | $ | 81,860,610 | | | $ | 75,928,910 | |
| Net investment income | | | 43,019,473 | | | | 39,913,267 | |
| Net mortuary and cemetery sales | | | 15,296,235 | | | | 13,726,518 | |
| Gains on investments and other assets | | | 728,367 | | | | 23,941,179 | |
| Mortgage fee income | | | 131,976,082 | | | | 116,185,853 | |
| Other | | | 10,180,163 | | | | 9,923,000 | |
| Total revenues | | | 283,060,930 | | | | 279,618,727 | |
| | | | | | | | | |
| Benefits and expenses: | | | | | | | | |
| Death benefits | | | 41,591,057 | | | | 36,298,789 | |
| Surrenders and other policy benefits | | | 3,320,748 | | | | 2,886,298 | |
| Increase in future policy benefits | | | 23,568,497 | | | | 24,332,088 | |
| Amortization of deferred policy and pre-need acquisition costs and value of business acquired | | | 14,634,577 | | | | 11,631,346 | |
| Selling, general and administrative expenses: | | | | | | | | |
| Commissions | | | 56,762,891 | | | | 50,291,352 | |
| Personnel | | | 64,221,270 | | | | 67,368,952 | |
| Advertising | | | 4,784,558 | | | | 4,602,591 | |
| Rent and rent related | | | 7,055,456 | | | | 7,605,375 | |
| Depreciation on property and equipment | | | 1,711,369 | | | | 1,867,001 | |
| Costs related to funding mortgage loans | | | 6,278,954 | | | | 6,423,944 | |
| Other | | | 34,922,761 | | | | 31,014,999 | |
| Interest expense | | | 7,386,688 | | | | 6,956,707 | |
| Cost of goods and services sold – cemeteries and mortuaries | | | 2,878,169 | | | | 2,158,895 | |
| Total benefits and expenses | | | 269,116,995 | | | | 253,438,337 | |
| | | | | | | | | |
| Earnings before income taxes | | | 13,943,935 | | | | 26,180,390 | |
| Income tax expense | | | (3,050,416 | ) | | | (4,494,311 | ) |
| Net earnings | | $ | 10,893,519 | | | $ | 21,686,079 | |
| | | | | | | | | |
| Net earnings per Class A equivalent common share (1) | | $ | 0.60 | | | $ | 1.21 | |
| | | | | | | | | |
| Net earnings per Class A equivalent common share - assuming dilution (1) | | $ | 0.60 | | | $ | 1.19 | |
| | | | | | | | | |
| Weighted average Class A equivalent common shares outstanding (1) | | | 18,104,681 | | | | 17,968,062 | |
| | | | | | | | | |
| Weighted average Class A equivalent common shares outstanding-assuming dilution (1) | | | 18,229,116 | | | | 18,188,665 | |
_________
| (1) | Earnings per share amounts have been adjusted retroactively for the effect of annual stock dividends. The weighted-average shares outstanding includes the weighted-average Class A common shares and the weighted-average Class C common shares determined on an equivalent Class A common stock basis. Net earnings per common share represent net earnings per equivalent Class A common share. |
See accompanying notes to consolidated financial statements.
SECURITY NATIONAL FINANCIAL CORPORATION
AND SUBSIDIARIES
CONSOLIDATED STATEMENTS OF COMPREHENSIVE INCOME
| | | Years Ended December 31 | |
| | | 2019 | | | 2018 | |
| Net earnings | | $ | 10,893,519 | | | $ | 21,686,079 | |
| Other comprehensive income: | | | | | | | | |
| Unrealized gains on fixed maturity securities available for sale | | | 17,315,770 | | | | - | |
| Unrealized gains on restricted assets | | | 35,550 | | | | - | |
| Unrealized gains on cemetery perpetual care trust investments | | | 29,904 | | | | | |
| Foreign currency translation adjustments | | | 972 | | | | (3,761 | ) |
| Other comprehensive income, before income tax | | | 17,382,196 | | | | (3,761 | ) |
| Income tax benefit (expense) | | | (3,652,859 | ) | | | 938 | |
| Other comprehensive income (loss), net of income tax | | | 13,729,337 | | | | (2,823 | ) |
| Comprehensive income | | $ | 24,622,856 | | | $ | 21,683,256 | |
See accompanying notes to consolidated financial statements.
SECURITY NATIONAL FINANCIAL CORPORATION
AND SUBSIDIARIES
CONSOLIDATED STATEMENTS OF STOCKHOLDERS’ EQUITY
| | | Class A Common Stock | | | Class C Common Stock | | | Additional Paid-in Capital | | | Accumulated Other Comprehensive Income (Loss) | | | Retained
Earnings | | | Treasury
Stock | | | Total | |
| Balance at December 31, 2017 | | | 29,071,154 | | | | 4,178,748 | | | | 38,125,042 | | | | 603,170 | | | | 77,520,951 | | | | (931,075 | ) | | | 148,567,990 | |
| | | | | | | | | | | | | | | | | | | | | | | | | | | | | |
| Cumulative effect adjustment upon adoption of new accounting standard (ASU 2016-01) | | | | | | | | | | | | | | | (603,170 | ) | | | 603,170 | | | | | | | | - | |
| Net earnings | | | - | | | | - | | | | - | | | | - | | | | 21,686,079 | | | | - | | | | 21,686,079 | |
| Other comprehensive loss | | | - | | | | - | | | | - | | | | (2,823 | ) | | | - | | | | - | | | | (2,823 | ) |
| Stock based compensation expense | | | - | | | | - | | | | 237,123 | | | | - | | | | - | | | | - | | | | 237,123 | |
| Exercise of stock options | | | 76,946 | | | | - | | | | (19,534 | ) | | | - | | | | - | | | | - | | | | 57,412 | |
| Sale of treasury stock | | | - | | | | - | | | | 540,713 | | | | - | | | | - | | | | 940,200 | | | | 1,480,913 | |
| Purchase of treasury stock | | | - | | | | - | | | | - | | | | - | | | | - | | | | (215,521 | ) | | | (215,521 | ) |
| Stock dividends | | | 1,461,120 | | | | 208,914 | | | | 2,938,434 | | | | - | | | | (4,608,468 | ) | | | - | | | | - | |
| Conversion Class C to Class A | | | 376 | | | | (376 | ) | | | - | | | | - | | | | - | | | | - | | | | - | |
| Balance at December 31, 2018 | | | 30,609,596 | | | | 4,387,286 | | | | 41,821,778 | | | | (2,823 | ) | | | 95,201,732 | | | | (206,396 | ) | | | 171,811,173 | |
| | | | | | | | | | | | | | | | | | | | | | | | | | | | | |
| Net earnings | | | - | | | | - | | | | - | | | | - | | | | 10,893,519 | | | | - | | | | 10,893,519 | |
| Other comprehensive income | | | - | | | | - | | | | - | | | | 13,729,337 | | | | - | | | | - | | | | 13,729,337 | |
| Stock based compensation expense | | | - | | | | - | | | | 256,996 | | | | - | | | | - | | | | - | | | | 256,996 | |
| Exercise of stock options | | | 65,034 | | | | 382,886 | | | | 415,990 | | | | - | | | | - | | | | - | | | | 863,910 | |
| Sale of treasury stock | | | - | | | | - | | | | 529,858 | | | | - | | | | - | | | | 165,702 | | | | 695,560 | |
| Purchase of treasury stock | | | - | | | | - | | | | - | | | | - | | | | - | | | | (1,539,888 | ) | | | (1,539,888 | ) |
| Stock dividends | | | 1,534,356 | | | | 238,174 | | | | 3,066,490 | | | | - | | | | (4,839,022 | ) | | | - | | | | (2 | ) |
| Conversion Class C to Class A | | | 6,572 | | | | (6,572 | ) | | | - | | | | - | | | | - | | | | - | | | | - | |
| Balance at December 31, 2019 | | $ | 32,215,558 | | | $ | 5,001,774 | | | $ | 46,091,112 | | | $ | 13,726,514 | | | $ | 101,256,229 | | | $ | (1,580,582 | ) | | $ | 196,710,605 | |
See accompanying notes to consolidated financial statements.
SECURITY NATIONAL FINANCIAL CORPORATION
AND SUBSIDIARIES
CONSOLIDATED STATEMENTS OF CASH FLOWS
| | | Years Ended December 31 | |
| | | 2019 | | | 2018 | |
| Cash flows from operating activities: | | | | | | |
| Net earnings | | $ | 10,893,519 | | | $ | 21,686,079 | |
| Adjustments to reconcile net earnings to net cash provided by (used in) operating activities: | | | | | | | | |
| Gains on investments and other assets | | | (728,367 | ) | | | (23,941,179 | ) |
| Depreciation | | | 5,183,658 | | | | 5,456,185 | |
| Provision for loan losses and doubtful accounts | | | 1,202,688 | | | | 377,683 | |
| Net amortization of deferred fees and costs, premiums and discounts | | | (887,605 | ) | | | (1,110,363 | ) |
| Provision for deferred income taxes | | | (1,857,897 | ) | | | (2,605,401 | ) |
| Policy and pre-need acquisition costs deferred | | | (19,176,531 | ) | | | (19,544,569 | ) |
| Policy and pre-need acquisition costs amortized | | | 13,787,037 | | | | 10,807,777 | |
| Value of business acquired amortized | | | 847,540 | | | | 823,569 | |
| Mortgage servicing rights, additions | | | (4,194,502 | ) | | | (3,922,816 | ) |
| Amortization of mortgage servicing rights | | | 7,055,795 | | | | 5,282,931 | |
| Stock based compensation expense | | | 256,996 | | | | 237,123 | |
| Benefit plans funded with treasury stock | | | 695,560 | | | | 1,480,913 | |
| Net change in fair value of loans held for sale | | | (2,498,097 | ) | | | (3,736,209 | ) |
| Originations of loans held for sale | | | (2,606,839,175 | ) | | | (2,194,607,543 | ) |
| Proceeds from sales of loans held for sale | | | 2,580,875,055 | | | | 2,259,145,473 | |
| Net gains on sales of loans held for sale | | | (80,666,413 | ) | | | (74,426,183 | ) |
| Change in assets and liabilities: | | | | | | | | |
| Land and improvements held for sale | | | 358,477 | | | | 64,506 | |
| Future policy benefits and unpaid claims | | | 18,394,928 | | | | 21,710,347 | |
| Other operating assets and liabilities | | | 1,695,259 | | | | 3,830,947 | |
| Net cash provided by (used in) operating activities | | | (75,602,075 | ) | | | 7,009,270 | |
| Cash flows from investing activities: | | | | | | | | |
Purchases of fixed maturity securities | | | (110,601,438 | ) | | | (37,488,774 | ) |
| Calls and maturities of fixed maturity securities | | | 26,624,182 | | | | 32,993,161 | |
| Purchase of equity securities | | | (3,264,028 | ) | | | (3,354,274 | ) |
| Sales of equity securities | | | 2,639,729 | | | | 2,886,492 | |
| Net changes in restricted assets | | | (1,254,991 | ) | | | (241,665 | ) |
| Net changes in cemetery perpetual care trust investments | | | 299,897 | | | | 1,207,622 | |
| Mortgage loans held for investment, other investments and policy loans made | | | (572,171,590 | ) | | | (505,060,464 | ) |
| Payments received for mortgage loans held for investment, other investments and policy loans | | | 556,352,676 | | | | 535,354,544 | |
| Purchases of property and equipment | | | (1,839,293 | ) | | | (1,282,704 | ) |
| Sales of property and equipment | | | 54,496 | | | | 2,016,156 | |
| Purchases of real estate held for investment | | | (8,572,556 | ) | | | (29,193,332 | ) |
| Sales of real estate held for investment | | | 11,614,927 | | | | 68,875,269 | |
| Cash received for reinsurance assumed | | | 158,358,594 | | | | - | |
| Cash paid for purchase of subsidiaries, net of cash acquired | | | (20,141,074 | ) | | | (3,405,783 | ) |
| Net cash provided by investing activities | | | 38,099,531 | | | | 63,306,248 | |
SECURITY NATIONAL FINANCIAL CORPORATION
AND SUBSIDIARIES
CONSOLIDATED STATEMENTS OF CASH FLOWS (Continued)
| | | Years Ended December 31 | |
| | | 2019 | | | 2018 | |
| Cash flows from financing activities: | | | | | | |
| Investment contract receipts | | $ | 12,141,627 | | | $ | 11,571,551 | |
| Investment contract withdrawals | | | (16,911,841 | ) | | | (15,356,571 | ) |
| Proceeds from stock options exercised | | | 863,910 | | | | 57,412 | |
| Purchase of treasury stock | | | (1,539,888 | ) | | | (215,521 | ) |
| Repayment of bank loans | | | (236,790,722 | ) | | | (133,123,024 | ) |
| Proceeds from bank borrowings | | | 196,610,127 | | | | 162,653,177 | |
| Net change in warehouse line borrowings for loans held for sale | | | 69,928,331 | | | | (717,792 | ) |
| Net change in line of credit borrowings | | | - | | | | 1,250,000 | |
| Net cash provided by financing activities | | | 24,301,544 | | | | 26,119,232 | |
| Net change in cash, cash equivalents, restricted cash and restricted cash equivalents | | | (13,201,000 | ) | | | 96,434,750 | |
| Cash, cash equivalents, restricted cash and restricted cash equivalents at beginning of year | | | 150,936,673 | | | | 54,501,923 | |
| Cash, cash equivalents, restricted cash and restricted cash equivalents at end of year | | $ | 137,735,673 | | | $ | 150,936,673 | |
| | | | | | | | | |
| Supplemental Disclosure of Cash Flow Information: | | | | | | | | |
| Cash paid during the year for: | | | | | | | | |
| Interest (net of amount capitalized) | | $ | 7,284,078 | | | $ | 6,878,048 | |
| Income taxes | | | 4,861,318 | | | | 5,701,565 | |
| | | | | | | | | |
| Non Cash Investing and Financing Activities: | | | | | | | | |
| Transfer of loans held for sale to mortgage loans held for investment | | $ | 31,881,851 | | | $ | 10,827,797 | |
| Right-of-use assets obtained in exchange for operating lease liabilities | | | 16,544,406 | | | | - | |
| Transfer of real estate held for investment to property and equipment | | | 3,261,259 | | | | - | |
| Mortgage loans held for investment foreclosed into real estate held for investment | | | 1,704,015 | | | | 670,601 | |
| Accrued real estate construction costs and retainage | | | 590,256 | | | | 214,200 | |
| Right-of-use assets obtained in exchange for finance lease liabilities | | | 252,763 | | | | - | |
| Mortgage loans held for investment foreclosed into receivables | | | 155,347 | | | | - | |
See Note 20 regarding non cash transactions included in the acquisitions of Beta Capital Corporation, Probst Family Funerals and Cremations and Heber Valley Funeral Home and Kilpatrick Life Insurance Company
Reconciliation of cash, cash equivalents, restricted cash and restricted cash equivalents as shown in the consolidated statements of cash flows is presented in the table below:
| | | Years Ended December 31 | |
| | | 2019 | | | 2018 | |
| Cash and cash equivalents | | $ | 127,754,719 | | | $ | 142,199,942 | |
| Restricted assets | | | 8,674,214 | | | | 7,179,225 | |
| Cemetery perpetual care trust investments | | | 1,306,740 | | | | 1,557,506 | |
| Total cash, cash equivalents, restricted cash and restricted cash equivalents | | $ | 137,735,673 | | | $ | 150,936,673 | |
See accompanying notes to consolidated financial statements.
1)
Significant Accounting Policies
General Overview of Business
Security National Financial Corporation and its wholly owned subsidiaries (the “Company”) operate in three main business segments: life insurance, cemetery and mortuary, and mortgages. The life insurance segment is engaged in the business of selling and servicing selected lines of life insurance, annuity products and accident and health insurance marketed primarily in the Intermountain West, California and eleven southern states. The cemetery and mortuary segment of the Company consists of eight mortuaries and five cemeteries in Utah and one cemetery in California. The mortgage segment is an approved government and conventional lender that originates and underwrites residential and commercial loans for new construction, existing homes and real estate projects primarily in Florida, Nevada, Texas, and Utah.
Basis of Presentation
The accompanying consolidated financial statements have been prepared in accordance with generally accepted accounting principles in the United States of America (GAAP).
Principles of Consolidation
These consolidated financial statements include the financial statements of the Company and its majority owned subsidiaries. All intercompany transactions and accounts have been eliminated in consolidation.
Use of Estimates
Management of the Company has made a number of estimates and assumptions related to the reported amounts of assets and liabilities, reported amounts of revenues and expenses, and the disclosure of contingent assets and liabilities to prepare these financial statements in conformity with GAAP. Actual results could differ from those estimates.
Material estimates that are particularly susceptible to significant changes in the near term are those used in determining the value of derivative assets and liabilities; those used in determining deferred acquisition costs and the value of business acquired; those used in determining the value of mortgage loans foreclosed to real estate held for investment; those used in determining the liability for future policy benefits; those used in determining the value of mortgage servicing rights; those used in determining allowances for loan losses for mortgage loans held for investment; those used in determining loan loss reserve; and those used in determining deferred tax assets and liabilities. Although some variability is inherent in these estimates, management believes the amounts provided are fairly stated in all material respects.
Investments
The Company’s management determines the appropriate classifications of investments in fixed maturity securities and equity securities at the acquisition date and re-evaluates the classifications at each balance sheet date.
Fixed maturity securities available for sale are carried at estimated fair value. Changes in fair values are reported as unrealized gains or losses and are recorded in accumulated other comprehensive income. On December 31, 2019, the Company changed the classification of its bond and preferred stock investments to available for sale from held to maturity. As a result, securities available for sale are carried at estimated fair value instead of amortized cost.
Fixed maturity securities held to maturity are carried at cost, adjusted for amortization of premium or accretion of discount. Although the Company has the ability and intent to hold these investments to maturity, infrequent and unusual conditions could occur under which it would sell certain of these securities. Those conditions include unforeseen changes in asset quality, significant changes in tax laws, and changes in regulatory capital requirements or permissible investments.
Equity securities are carried at estimated fair value. Changes in fair values are reported as unrealized gains or losses and are recorded through net earnings.
Mortgage loans held for investment are carried at their unpaid principal balances adjusted for net deferred fees, net discounts, charge-offs and the related allowance for loan losses. Interest income is included in net investment income on the consolidated statements of earnings and is recognized when earned. The Company defers related material loan origination fees, net of related direct loan origination costs, and amortizes the net fees over the term of the loans. Origination fees are included in net investment income on the consolidated statements of earnings.
Mortgage loans are secured by the underlying property and require an appraisal at the time of underwriting and funding. Generally, the Company will fund a loan not to exceed 80% of the loan’s collateral fair market value. Amounts over 80% will require additional collateral or mortgage insurance by an approved third-party insurer.
Real estate held for investment is carried at cost, less accumulated depreciation provided on a straight‑line basis over the estimated useful lives of the properties, or is adjusted to a new basis for impairment in value, if any. Included are foreclosed properties which the Company intends to hold for investment purposes. These properties are recorded at the lower of cost or fair value upon foreclosure.
Real estate held for sale is carried at lower of cost or fair value. Depreciation is not recognized on real estate classified as held for sale.
Other investments and policy loans are carried at the aggregate unpaid balances, less allowances for losses.
Gains and losses on investments (except for equity securities carried at fair value through net earnings) arise when investments are sold (as determined on a specific identification basis) or are other than temporarily impaired. If in management’s judgment a decline in the value of an investment below cost is other than temporary, the cost of the investment is written down to fair value with a corresponding charge to earnings. Factors considered in judging whether an impairment is other than temporary include: the financial condition, business prospects and credit worthiness of the issuer, the length of time that fair value has been less than cost, the relative amount of the decline, and the Company’s ability and intent to hold the investment until the fair value recovers, which is not assured.
Cash and Cash Equivalents
The Company considers all highly liquid instruments purchased with an original maturity of three months or less to be cash equivalents. The Company maintains its cash in bank deposit accounts, which at times exceed federally insured limits. The Company has not experienced any losses in such accounts and believes it is not exposed to any significant credit risk on cash and cash equivalents.
Loans Held for Sale
Accounting Standards Codification (“ASC”) No. 825, “Financial Instruments”, allows for the option to report certain financial assets and liabilities at fair value initially and at subsequent measurement dates with changes in fair value included in earnings. The option may be applied instrument by instrument, but it is irrevocable. The Company elected the fair value option for loans held for sale. The Company believes the fair value option most closely aligns the timing of the recognition of gains and costs. These loans are intended for sale and the Company believes that the fair value is the best indicator of the resolution of these loans. Electing fair value also reduces certain timing differences and better matches changes in the fair value of these assets with changes in the fair value of the related derivatives used for these assets. See Note 3 and Note 17 to Consolidated Financial Statements for additional disclosures regarding loans held for sale.
Mortgage fee income consists of origination fees, processing fees, interest income and certain other income related to the origination of mortgage loans held for sale. All revenues and costs are recognized when the mortgage loan is funded and any changes in fair value are shown as a component of mortgage fee income. See Note 3 and Note 17 to Consolidated Financial Statements for additional disclosures regarding loans held for sale.
The Company, through its mortgage subsidiaries, sells mortgage loans to third-party investors without recourse unless defects are identified in the representations and warranties made at loan sale. It may be required, however, to repurchase a loan or pay a fee instead of repurchase under certain events, which include the following:
SECURITY NATIONAL FINANCIAL CORPORATION AND SUBSIDIARIES
Notes to Consolidated Financial Statements
Years Ended December 31, 2019 and 2018
1) Significant Accounting Policies (Continued)
| • | Failure to deliver original documents specified by the investor, |
| | |
| • | The existence of misrepresentation or fraud in the origination of the loan, |
| | |
| • | The loan becomes delinquent due to nonpayment during the first several months after it is sold, |
| | |
| • | Early pay-off of a loan, as defined by the agreements, |
| | |
| • | Excessive time to settle a loan, |
| | |
| • | Investor declines purchase, and |
| | |
| • | Discontinued product and expired commitment. |
Loan purchase commitments generally specify a date 30 to 45 days after delivery upon which the underlying loans should be settled. Depending on market conditions, these commitment settlement dates can be extended at a cost to the Company.
It is the Company's policy to cure any documentation problems regarding such loans at a minimal cost for up to a six-month time period and to pursue efforts to enforce loan purchase commitments from third-party investors concerning the loans. The Company believes that six months allows adequate time to remedy any documentation issues, to enforce purchase commitments, and to exhaust other alternatives. Remedial methods include the following:
| • | Research reasons for rejection, |
| | |
| • | Provide additional documents, |
| | |
| • | Request investor exceptions, |
| | |
| • | Appeal rejection decision to purchase committee, and |
| | |
| • | Commit to secondary investors. |
Once purchase commitments have expired and other alternatives to remedy are exhausted, which could be earlier than the six-month time period, the loans are repurchased and transferred to the long-term investment portfolio at the lower of cost or fair value and previously recorded mortgage fee income that was to be received from a third-party investor is written off against the loan loss reserve.
Determining Lower of Cost or Fair Value
Cost for loans held for sale is equal to the amount paid to the warehouse bank and the amount originally funded by the Company. Fair value is often difficult to determine, but is based on the following:
| • | For loans that are committed, the Company uses the commitment price. |
| | |
| • | For loans that are non-committed that have an active market, the Company uses the market price. |
| | |
| • | For loans that are non-committed where there is no market but there is a similar product, the Company uses the market value for the similar product. |
| | |
| • | For loans that are non-committed where no active market exists, the Company determines that the unpaid principal balance best approximates the market value, after considering the fair value of the underlying real estate collateral, estimated future cash flows, and the loan interest rate. |
The appraised value of the real estate underlying the original mortgage loan adds support to the Company’s determination of fair value because if the loan becomes delinquent, the Company has sufficient value to collect the unpaid principal balance or the carrying value of the loan, thus minimizing credit losses.
The majority of loans originated are sold to third-party investors. The amounts expected to be sold to investors are shown on the consolidated balance sheets as loans held for sale.
Loan Loss Reserve
The loan loss reserve is an estimate of probable losses at the balance sheet date that the Company will realize in the future on loans sold. The Company may be required to reimburse third-party investors for costs associated with early payoff of loans within the first six months of such loans and to repurchase loans where there is a default in any of the first four monthly payments to the investors or, in lieu of repurchase, to pay a negotiated fee to the investors. The Company’s estimates are based upon historical loss experience and the best estimate of the probable loan loss liabilities.
SECURITY NATIONAL FINANCIAL CORPORATION AND SUBSIDIARIES
Notes to Consolidated Financial Statements
Years Ended December 31, 2019 and 2018
1) Significant Accounting Policies (Continued)
Upon completion of a transfer that satisfies the conditions to be accounted for as a sale, the Company initially measures at fair value liabilities incurred in a sale relating to any guarantee or recourse provisions. The Company accrues a monthly allowance for indemnification losses to investors based on total production. This estimate is based on the Company’s historical experience and is included as a component of mortgage fee income. Subsequent updates to the recorded liability from changes in assumptions are recorded in selling, general and administrative expenses. The estimated liability for indemnification losses is included in other liabilities and accrued expenses.
The loan loss reserve analysis involves mortgage loans that have been sold to third-party investors, which were believed to have met investor underwriting guidelines at the time of sale, where the Company has received a demand from the investor. There are generally three types of demands: make whole, repurchase, or indemnification. These types of demands are more particularly described as follows:
Make whole demand – A make whole demand occurs when an investor forecloses on a property and then sells the property. The make whole amount is calculated as the difference between the original unpaid principal balance, accrued interest and fees, less the sale proceeds.
Repurchase demand – A repurchase demand usually occurs when there is a significant payment default, error in underwriting or detected loan fraud.
Indemnification demand – On certain loans the Company has negotiated a set fee that is to be paid in lieu of repurchase. The fee varies by investor and by loan product type.
The Company believes the allowance for loan losses and the loan loss reserve represent probable loan losses incurred as of the balance sheet date.
Additional information related to the Loan Loss Reserve is included in Note 3.
Restricted Assets
Restricted assets are assets held in a trust account for future mortuary services and merchandise and consist of cash and cash equivalents; participations in mortgage loans held for investment with Security National Life Insurance Company (“Security National Life”); mutual funds carried at estimated fair value; equity securities carried at estimated fair value; and a surplus note with Security National Life (which is eliminated in consolidation). Restricted assets also represents escrows held for borrowers and investors under servicing and appraisal agreements relating to mortgage loans, funds held by warehouse banks in accordance with loan purchase agreements and funds held in escrow for certain real estate construction development projects. Additionally, the Company elected to fund its medical benefit safe-harbor limit based on the qualified direct costs, and has included this amount as a component of restricted cash.
Cemetery Perpetual Care Trust Investments
Cemetery endowment care trusts have been set up for four of the six cemeteries owned by the Company. Of the six cemeteries owned by the Company, four cemeteries are endowment care properties. Under endowment care arrangements a portion of the price for each lot sold is withheld and invested in a portfolio of investments similar to those described in the prior paragraph. The earnings stream from the investments is designed to fund future maintenance and upkeep of the cemetery.
Cemetery Land and Improvements
The development of a cemetery involves not only the initial acquisition of raw land but the installation of roads, water lines, landscaping and other costs to establish a marketable cemetery lot. The costs of developing the cemetery are shown as an asset on the balance sheet. The amount on the balance sheet is reduced by the total cost assigned to the development of a particular lot when the criterion for recognizing a sale of that lot is met.
SECURITY NATIONAL FINANCIAL CORPORATION AND SUBSIDIARIES
Notes to Consolidated Financial Statements
Years Ended December 31, 2019 and 2018
1) Significant Accounting Policies (Continued)
Deferred Policy Acquisition Costs and Value of Business Acquired
Commissions and other costs, net of commission and expense allowances for reinsurance ceded, that vary with and are primarily related to the production of new insurance business have been deferred. Deferred policy acquisition costs (“DAC”) for traditional life insurance are amortized over the premium paying period of the related policies using assumptions consistent with those used in computing policy benefit reserves. For interest-sensitive insurance products, deferred policy acquisition costs are amortized generally in proportion to the present value of expected gross profits from surrender charges, investment, mortality and expense margins. This amortization is adjusted when estimates of current or future gross profits to be realized from a group of products are reevaluated. Deferred acquisition costs are written off when policies lapse or are surrendered.
When accounting for DAC, the Company considers internal replacements of insurance and investment contracts. An internal replacement is a modification in product benefits, features, rights or coverage that occurs by the exchange of a contract for a new contract, or by amendment, endorsement, or rider to contract, or by the election of a feature or coverage within a contract. Modifications that result in a replacement contract that is substantially changed from the replaced contract are accounted for as an extinguishment of the replaced contract. Unamortized DAC, unearned revenue liabilities and deferred sales inducements from the replaced contract are written-off. Modifications that result in a contract that is substantially unchanged from the replaced contract are accounted for as a continuation of the replaced contract.
Value of business acquired is the present value of estimated future profits of the acquired business and is amortized similar to deferred policy acquisition costs.
Mortgage Servicing Rights
Mortgage Servicing Rights (“MSR”) arise from contractual agreements between the Company and third-party investors (or their agents) when mortgage loans are sold. Under these contracts, the Company is obligated to retain and provide loan servicing functions on loans sold, in exchange for fees and other remuneration. The servicing functions typically performed include, among other responsibilities, collecting and remitting loan payments; responding to borrower inquiries; accounting for principal and interest, holding custodial (impound) funds for payment of property taxes and insurance premiums; counseling delinquent mortgagors; and supervising the acquisition of real estate owned and property dispositions.
The total residential mortgage loans serviced for others consist primarily of agency conforming fixed-rate mortgage loans. The value of MSRs is derived from the net cash flows associated with the servicing contracts. The Company receives a servicing fee of generally about 0.250% annually on the remaining outstanding principal balances of the loans. Based on the result of the cash flow analysis, an asset or liability is recorded for mortgage servicing rights. The servicing fees are collected from the monthly payments made by the mortgagors. The Company generally receives other remuneration including rights to various mortgagor-contracted fees such as late charges, and collateral reconveyance charges and the Company is generally entitled to retain the interest earned on funds held pending remittance of mortgagor principal, interest, tax and insurance payments. Contractual servicing fees and late fees are included in other revenues on the consolidated statements of earnings.
The Company’s subsequent accounting for MSRs is based on the class of MSRs. The Company has identified two classes of MSRs: MSRs backed by mortgage loans with initial term of 30 years and MSRs backed by mortgage loans with initial term of 15 years. The Company distinguishes between these classes of MSRs due to their differing sensitivities to change in value as the result of changes in market. After being initially recorded at fair value, MSRs backed by mortgage loans are accounted for using the amortization method. Amortization expense is included in other expenses on the consolidated statements of earnings. MSR amortization is determined by amortizing the MSR balance in proportion to, and over the period of the estimated future net servicing income of the underlying financial assets.
Interest rate risk, prepayment risk, and default risk are inherent risks in MSR valuation. Interest rate changes largely drive prepayment rates. Refinance activity generally increases as rates decline. A significant decrease in rates beyond expectation could cause a decline in the value of the MSR. On the contrary, if rates increase borrowers are less likely to refinance or prepay their mortgage, which extends the duration of the loan and MSR values are likely to rise. Because of these risks, discount rates and prepayment speeds are used to estimate the fair value.
SECURITY NATIONAL FINANCIAL CORPORATION AND SUBSIDIARIES
Notes to Consolidated Financial Statements
Years Ended December 31, 2019 and 2018
1) Significant Accounting Policies (Continued)
The Company periodically assesses MSRs for impairment. Impairment occurs when the current fair value of the MSR falls below the asset’s carrying value (carrying value is the amortized cost reduced by any related valuation allowance). If MSRs are impaired, the impairment is recognized in current period earnings and the carrying value of the MSRs is adjusted through a valuation allowance.
Management periodically reviews the various loan strata to determine whether the value of the MSRs in a given stratum is impaired and likely to recover. When management deems recovery of the value to be unlikely in the foreseeable future, a write-down of the cost of the MSRs for that stratum to its estimated recoverable value is charged to the valuation allowance.
Property and Equipment
Property and equipment are recorded at cost. Depreciation is calculated principally on the straight-line method over the estimated useful lives of the assets which range from three to forty years. Leasehold improvements paid for by the Company as a lessee are amortized over the lesser of the useful life or remaining lease terms.
Long-lived Assets
Long-lived assets to be held and used, including property and equipment and real estate held for investment, are reviewed for impairment whenever events or changes in circumstances indicate that the related carrying amount may not be recoverable. When required, impairment losses on assets to be held and used are recognized based on the fair value of the asset, and long-lived assets to be disposed of are reported at the lower of carrying amount or fair value less costs to sell. No impairment of long-lived assets has been recognized in the accompanying financial statements except for certain impairments of real estate held for investment as disclosed in Note 2.
Derivative Instruments
Mortgage Banking Derivatives
Loan Commitments
The Company is exposed to price risk due to the potential impact of changes in interest rates on the values of loan commitments from the time a loan commitment is made to an applicant to the time the loan that would result from the exercise of that loan commitment is funded. Managing price risk is complicated by the fact that the ultimate percentage of loan commitments that will be exercised (i.e., the number of loans that will be funded) fluctuates. The probability that a loan will not be funded or the loan application is denied or withdrawn within the terms of the commitment is driven by a number of factors, particularly the change, if any, in mortgage rates following the issuance of the loan commitment.
In general, the probability of funding increases if mortgage rates rise and decreases if mortgage rates fall. This is due primarily to the relative attractiveness of current mortgage rates compared to the applicant’s committed rate. The probability that a loan will not be funded within the terms of the mortgage loan commitment also is influenced by the source of the applications (retail, broker or correspondent channels), proximity to rate lock expiration, purpose for the loan (purchase or refinance), product type and the application approval status. The Company has developed fallout estimates using historical data that take into account all of the variables, as well as renegotiations of rate and point commitments that tend to occur when mortgage rates fall. These fallout estimates are used to estimate the number of loans that the Company expects to be funded within the terms of the loan commitments and are updated periodically to reflect the most current data.
The Company estimates the fair value of a loan commitment based on the change in estimated fair value of the underlying mortgage loan, quoted mortgage-backed securities (“MBS”) prices, estimates of the fair value of mortgage servicing rights, and an estimate of the probability that the mortgage loan will fund within the terms of the commitment. The change in fair value of the underlying mortgage loan is measured from the date the loan commitment is issued and is shown net of expenses. Following issuance, the value of a loan commitment can be either positive or negative depending upon the change in value of the underlying mortgage loans.
SECURITY NATIONAL FINANCIAL CORPORATION AND SUBSIDIARIES
Notes to Consolidated Financial Statements
Years Ended December 31, 2019 and 2018
1) Significant Accounting Policies (Continued)
Forward Sale Commitments
The Company utilizes forward commitments to economically hedge the price risk associated with its outstanding mortgage loan commitments. A forward commitment protects the Company from losses on sales of the loans arising from exercise of the loan commitments. Management expects these types of commitments will experience changes in fair value opposite to changes in fair value of the loan commitments, thereby reducing earnings volatility related to the recognition in earnings of changes in the values of the commitments.
The net changes in fair value of loan commitments and forward sale commitments are shown in current earnings as a component of mortgage fee income on the consolidated statements of earnings. Mortgage banking derivatives are shown in other assets and other liabilities and accrued expenses on the consolidated balance sheets.
Call and Put Option Derivatives
The Company uses a strategy of selling “out of the money” call options on its equity securities as a source of revenue. The options give the purchaser the right to buy from the Company specified equity securities at a set price up to a pre-determined date in the future. The Company uses the strategy of selling put options as a means of generating cash or purchasing equity securities at lower than current market prices. The Company receives an immediate payment of cash for the value of the option and establishes a liability for the fair value of the option. The liability for options is adjusted to fair value at each reporting date. In the event a call option is exercised, the Company sells the equity security at a favorable price enhanced by the value of the option that was sold. If the option expires unexercised, the Company recognizes a gain from the expired option. In the event a put option is exercised, the Company acquires an equity security at the strike price of the option reduced by the value received from the sale of the put option. The equity security is then treated as a normal equity security in the Company’s portfolio. The net changes in the fair value of call and put options are shown in current earnings as a component of realized gains (losses) on investments and other assets. Call and put options are shown in other liabilities and accrued expenses on the consolidated balance sheets.
Allowance for Doubtful Accounts and Loan Losses and Impaired Loans
The Company records an allowance and recognizes an expense for potential losses from mortgage loans held for investment, other investments and receivables in accordance with GAAP.
Receivables are the result of cemetery and mortuary operations, mortgage loan operations and life insurance operations. The allowance is based upon the Company’s historical experience for collectively evaluated impairment. Other allowances are based upon receivables individually evaluated for impairment. Collectability of the cemetery and mortuary receivables is significantly influenced by current economic conditions. The critical issues that impact recovery of mortgage loan operations are interest rate risk, loan underwriting, new regulations and the overall economy.
The Company provides for losses on its mortgage loans held for investment through an allowance for loan losses (a contra-asset account). The allowance is comprised of two components. The first component is an allowance for collectively evaluated impairment that is based upon the Company’s historical experience in collecting similar receivables. The second component is based upon individual evaluation of loans that are determined to be impaired. Upon determining impairment, the Company establishes an individual impairment allowance based upon an assessment of the fair value of the underlying collateral. See the schedules in Note 2 for additional information. In addition, when a mortgage loan is past due more than 90 days, the Company does not accrue any interest income. When a loan becomes delinquent, the Company proceeds to foreclose on the real estate and all expenses for foreclosure are expensed as incurred. Once foreclosed, an adjustment for the lower of cost or fair value is made, if necessary, and the amount is classified as real estate held for investment. The Company will rent the properties until it is deemed desirable to sell them.
The allowance for losses on mortgage loans held for investment could change based on changes in the value of the underlying collateral, the performance status of the loans, or the Company’s actual collection experience. The actual losses could change, in the near term, from the established allowance, based upon the occurrence or non-occurrence of these events. For purposes of determining the allowance for losses, the Company has segmented its mortgage loans held for investment by loan type. The Company’s loan types are commercial, residential, and residential construction. The inherent risks within the portfolio vary depending upon the loan type as follows:
SECURITY NATIONAL FINANCIAL CORPORATION AND SUBSIDIARIES
Notes to Consolidated Financial Statements
Years Ended December 31, 2019 and 2018
1) Significant Accounting Policies (Continued)
Commercial - Underwritten in accordance with the Company’s policies to determine the borrower’s ability to repay the obligation as agreed. Commercial loans are made primarily based on the underlying collateral supporting the loan. Accordingly, the repayment of a commercial loan depends primarily on the collateral and its ability to generate income and secondary on the borrower’s (or guarantors) ability to repay.
Residential – Secured by family dwelling units. These loans are secured by first and second mortgages on the unit. The borrower’s ability to repay is sensitive to the life events and general economic condition of the region. Where loan to values exceed 80%, the loan is generally guaranteed by private mortgage insurance, FHA or VA.
Residential construction (including land acquisition and development) – Underwritten in accordance with the Company’s underwriting policies which include a financial analysis of the builders, borrowers (guarantors), construction cost estimates, and independent appraisal valuations. These loans will rely on the value associated with the project upon completion. These cost and valuation estimates may be inaccurate. Construction loans generally involve the disbursement of substantial funds over a short period of time with repayment substantially dependent upon the success of the completed project and the ability of the borrower to secure long-term financing. Additionally, land is underwritten according to the Company’s policies, which include independent appraisal valuations as well as the estimated value associated with the land upon completion of development into finished lots. These cost and valuation estimates may be inaccurate. These loans are considered to be of a higher risk than other mortgage loans due to their ultimate repayment being sensitive to general economic conditions, availability of long-term or construction financing, and interest rate sensitivity.
Future Policy Benefits and Unpaid Claims
Future policy benefit reserves for traditional life insurance are computed using a net level method, including assumptions as to investment yields, mortality, morbidity, withdrawals, and other assumptions based on the life insurance subsidiaries’ experience, modified as necessary to give effect to anticipated trends and to include provisions for possible unfavorable deviations. Such liabilities are, for some plans, graded to equal statutory values or cash values at or prior to maturity, which are deemed a reasonable equivalent for GAAP. The range of assumed interest rates for all traditional life insurance policy reserves was 4% to 10%. Benefit reserves for traditional limited-payment life insurance policies include the deferred portion of the premiums received during the premium-paying period. Deferred premiums are recognized as income over the life of the policies. Policy benefit claims are charged to expense in the period the claims are incurred. Increases in future policy benefits are charged to expense.
Future policy benefit reserves for interest-sensitive insurance products are computed under a retrospective deposit method and represent policy account balances before applicable surrender charges. Policy benefits and claims that are charged to expense include benefit claims incurred in the period in excess of related policy account balances. Interest crediting rates for interest-sensitive insurance products ranged from 3% to 6.5%.
The Company records an unpaid claims liability for claims in the course of settlement equal to the death benefit amount less any reinsurance recoverable amount for claims reported. There is also an unpaid claims liability for claims incurred but not reported. This liability is based on the historical experience of the net amount of claims that were reported in reporting periods subsequent to the reporting period when claims were incurred.
Participating Insurance
Participating business constituted 2% of insurance in force for the years ended 2019 and 2018. The provision for policyholders’ dividends included in policyholder obligations is based on dividend scales anticipated by management. Amounts to be paid are determined by the Board of Directors.
SECURITY NATIONAL FINANCIAL CORPORATION AND SUBSIDIARIES
Notes to Consolidated Financial Statements
Years Ended December 31, 2019 and 2018
1) Significant Accounting Policies (Continued)
Recognition of Insurance Premiums and Other Considerations
Premiums and other consideration for traditional life insurance products (which include those products with fixed and guaranteed premiums and benefits and consist principally of whole life insurance policies, limited payment life insurance policies, and certain annuities with life contingencies) are recognized as revenues when due from policyholders. Premiums and other consideration for interest-sensitive insurance policies (which include universal life policies, interest-sensitive life policies, deferred annuities, and annuities without life contingencies) are recognized when earned and consist of amounts assessed against policyholder account balances during the period for policy administration charges and surrender charges.
Reinsurance
The Company follows the procedure of reinsuring risks in excess of $100,000 to provide for greater diversification of business to allow management to control exposure to potential losses arising from large risks, and provide additional capacity for growth. The Company remains liable for amounts ceded in the event the reinsurers are unable to meet their obligations.
The Company entered into coinsurance agreements with unaffiliated insurance companies under which the Company assumed 100% of the risk for certain life insurance policies and certain other policy-related liabilities of the insurance company.
Reinsurance premiums, commissions, expense reimbursements, and reserves related to reinsured business are accounted for on a basis consistent with those used in accounting for the original policies issued and the terms of the reinsurance contracts. Expense allowances received in connection with reinsurance ceded are accounted for as a reduction of the related policy acquisition costs and are deferred and amortized accordingly.
Pre-need Sales and Costs
Pre-need contract sales of funeral services and caskets - revenue and costs associated with the sales of pre-need funeral services and caskets are deferred until the performance obligations are fulfilled (services are performed or the caskets are delivered).
Sales of cemetery interment rights (cemetery burial property) - revenue and costs associated with the sale of cemetery interment rights are recognized in accordance with the retail land sales provisions based on GAAP. Under GAAP, recognition of revenue and associated costs from constructed cemetery property must be deferred until 10% of the sales price has been collected.
Pre-need contract sales of cemetery merchandise (primarily markers and vaults) - revenue and costs associated with the sale of pre-need cemetery merchandise is deferred until the merchandise is delivered.
Pre-need contract sales of cemetery services (primarily merchandise delivery, installation fees and burial opening and closing fees) - revenue and costs associated with the sales of pre-need cemetery services are deferred until the services are performed.
Prearranged funeral and pre-need cemetery customer acquisition costs - costs incurred related to obtaining new pre-need contract cemetery and prearranged funeral services are accounted for under the guidance of the provisions based on GAAP. Obtaining costs, which include only costs that vary with and are primarily related to the acquisition of new pre-need cemetery and prearranged funeral services, are deferred until the merchandise is delivered or services are performed.
Revenues and costs for at‑need sales are recorded when a valid contract exists, the services are performed, collection is reasonably assured and there are no significant obligations remaining.
The Company, through its cemetery and mortuary operations, provides guaranteed funeral arrangements wherein a prospective customer can receive future goods and services at guaranteed prices. To accomplish this, the Company, through its life insurance operations, sells to the customer an increasing benefit life insurance policy that is assigned to the mortuaries. If, at the time of need, the policyholder/potential mortuary customer utilizes one of the Company’s facilities, the guaranteed funeral arrangement contract that has been assigned will provide the funeral goods and services at the contracted price. The increasing life insurance policy will cover the difference between the original contract prices and current prices. Risks may arise if the difference cannot be fully met by the life insurance policy. However, management believes that given current inflation rates and related price increases of goods and services, the risk of exposure is minimal.
SECURITY NATIONAL FINANCIAL CORPORATION AND SUBSIDIARIES
Notes to Consolidated Financial Statements
Years Ended December 31, 2019 and 2018
1) Significant Accounting Policies (Continued)
Goodwill
Previous acquisitions have been accounted for as purchases under which assets acquired and liabilities assumed were recorded at their fair values with the excess purchase price recognized as goodwill. The Company evaluates annually or when changes in circumstances warrant the recoverability of goodwill and if there is a decrease in value, the related impairment is recognized as a charge against income. No impairment of goodwill has been recognized in the accompanying financial statements.
Other Intangibles (trade name and customer lists)
Other intangibles are recognized apart from goodwill whenever an acquired intangible asset arises from contractual or other legal rights, or whenever it is capable of being separated or divided from the acquired entity and sold, transferred, licensed, rented, or exchanged, either individually or in combination with a related contract, asset, or liability. The Company engaged a valuation firm to analyze the value of the Kilpatrick Life name in conjunction with its acquisition. The value of the trade name is included in Other Assets and was determined using the income approach, relying on a relief from the royalty method.
Income Taxes
Income taxes include taxes currently payable plus deferred taxes. Deferred tax assets and liabilities are recognized for the future tax consequences attributable to the temporary differences in the financial reporting basis and tax basis of assets and liabilities and operating loss carry-forwards. Deferred tax assets are measured using enacted tax rates expected to apply to taxable income in the years in which these temporary differences are expected to be recovered or settled.
Liabilities are established for uncertain tax positions expected to be taken in income tax returns when such positions are judged to meet the “more-likely-than-not” threshold based on the technical merits of the positions. Estimated interest and penalties related to uncertain tax penalties are included as a component of other expenses.
Earnings Per Common Share
The Company computes earnings per share which requires presentation of basic and diluted earnings per share. Basic earnings per equivalent Class A common share are computed by dividing net earnings by the weighted-average number of Class A common shares outstanding during each year presented, after the effect of the assumed conversion of Class C common stock to Class A common stock. Diluted earnings per share is computed by dividing net earnings by the weighted-average number of common shares outstanding during the year used to compute basic earnings per share plus dilutive potential incremental shares. Basic and diluted earnings per share amounts have been adjusted retroactively for the effect of annual stock dividends.
Stock Based Compensation
The cost of employee services received in exchange for an award of equity instruments is recognized in the financial statements and is measured based on the fair value on the grant date of the award. The fair value of stock options is calculated using the Black Scholes Option Pricing Model. Stock option compensation expense is recognized over the period during which an employee is required to provide service in exchange for the award and is included in personnel expenses on the consolidated statements of earnings.
Concentration of Credit Risk
For a description of the geographic concentration risk regarding mortgage loans held for investment and real estate held for investment, refer to Note 2 of the Notes to Consolidated Financial Statements.
SECURITY NATIONAL FINANCIAL CORPORATION AND SUBSIDIARIES
Notes to Consolidated Financial Statements
Years Ended December 31, 2019 and 2018
1) Significant Accounting Policies (Continued)
Advertising
The Company expenses advertising costs as incurred.
Recent Accounting Pronouncements
Accounting Standards Adopted in 2019
ASU No. 2016-02: “Leases (Topic 842)” - Issued in February 2016, ASU 2016-02 supersedes the requirements in Accounting Standards Codification (“ASC”) Topic 840, “Leases”, and was issued to increase transparency and comparability among organizations. The new standard sets forth the principles for the recognition, measurement, presentation, and disclosure of leases for both lessees and lessors. ASU 2016-02 requires lessees to classify leases as either finance or operating leases and to record on the balance sheet right-of-use assets and lease liabilities, equal to the present value of the remaining lease payments. The lease classification will determine whether the lease expense is recognized based on an effective interest rate method or a straight-line basis over the term of the leases. The FASB further clarified ASU 2016-02 and provided targeted improvements by issuing ASU 2018-01, ASU 2018-10, ASU 2018-11 and ASU 2018-20.
The Company adopted this standard on January 1, 2019 using the modified retrospective transition method with no cumulative-effect adjustment to the opening balance of retained earnings. Under this transition method, the application date was the beginning of the reporting period, January 1, 2019, in which the Company first applied the standard. Under this transition option, the Company will apply the legacy guidance in ASC 840, “Leases”, including its disclosure requirements, in the comparative periods presented in the year of adoption. The Company has made an accounting policy election not to apply the recognition requirements to short-term leases, which are leases that, at the commencement date, have a lease term of 12 months or less and do not include an option to purchase the underlying assets that the lessee is reasonably certain to exercise. The new authoritative guidance allows for certain practical expedients to be utilized to assist with the implementation of the new standard. The Company has elected the transition package of practical expedients which allows the Company to not reassess whether any expired or existing contracts are or contain leases, to not reassess the lease classification for any expired or existing leases and to not reassess initial direct costs for any existing leases.
The Company implemented a third-party lease accounting system to assist with the measurement of the lease liabilities and the related right-of-use assets. The Company compiled an inventory of its leases, determined the appropriate discount rates and has determined the impact of this standard which is not material to the Company’s results of operations, but has an effect on the balance sheet presentation for leased assets and obligations. The Company recognized a right-of-use asset and related lease liability for approximately $12,076,000 on January 1, 2019. This standard did not impact the Company’s accounting for leases where the Company is the lessor.
Accounting Standards Issued But Not Yet Adopted
ASU No. 2016-13: “Financial Instruments – Credit Losses (Topic 326)” – Issued in September 2016, ASU 2016-13 amends guidance on reporting credit losses for assets held at amortized cost basis (such as mortgage loans and held to maturity debt securities) and available for sale debt securities. For assets held at amortized cost basis, Topic 326 eliminates the probable initial recognition threshold in current GAAP and, instead, requires an entity to reflect its current estimate of all expected credit losses. The allowance for credit losses is a valuation account that is deducted from the amortized cost basis of the financial assets to present the net amount expected to be collected. For available for sale debt securities, credit losses should be measured in a manner similar to current GAAP; however, Topic 326 will require that credit losses be presented as an allowance rather than as a write-down. In October 2019, the FASB proposed an update to ASU No. 2016-13 that would make the ASU effective for the Company on January 1, 2023. The Company is in the process of evaluating the potential impact of this standard, especially as it relates to mortgage loans held for investment.
ASU No. 2018-13: “Fair Value Measurement (Topic 820): Disclosure Framework-Changes to the Disclosure Requirements for Fair Value Measurement” – Issued in August 2018, ASU 2018-13 modifies the disclosure requirements of Topic 820 by removing, modifying or adding certain disclosures. Among the changes, entities will no longer be required to disclose the amount of and reasons for transfers between Level 1 and Level 2 of the fair value hierarchy, but will be required to disclose the range and weighted average used to develop significant unobservable inputs for Level 3 fair value measurements. ASU 2018-13 does not change the fair value measurements already required or permitted by existing standards. This new authoritative guidance will be effective for the Company on January 1, 2020. The adoption of this standard will not materially impact the Company’s financial statements.
ASU No. 2018-12: “Financial Services – Insurance (Topic 944): Targeted Improvements to the Accounting for Long-Duration Contracts” – Issued in August 2018, ASU 2018-12 is intended to improve the timeliness of recognizing changes in the liability for future policy benefits on traditional long-duration contracts by requiring that assumptions be updated after contract inception and by modifying the rate used to discount future cash flows. The ASU will simplify and improve the accounting for certain market-based options or guarantees associated with deposit or account balance contracts, simplify amortization of deferred acquisition costs while improving and expanding required disclosures. In October 2019, the FASB proposed an update to ASU No. 2018-12 that would make the ASU effective for the Company on January 1, 2024. The Company is in the process of evaluating the potential impact of this standard.
The Company has reviewed other recent accounting pronouncements and has determined that they will not significantly impact the Company’s results of operations or financial position.
SECURITY NATIONAL FINANCIAL CORPORATION
2) Investments
The Company’s investments as of December 31, 2019 are summarized as follows:
| | | Amortized Cost | | | Gross
Unrealized Gains | | | Gross
Unrealized
Losses | | | Estimated
Fair Value | |
December 31, 2019: | | | | | | | | | | | | |
| Fixed maturity securities available for sale at estimated fair value: | | | | | | | | | | | | |
| U.S. Treasury securities and obligations of U.S. Government agencies | | $ | 142,740,641 | | | $ | 632,185 | | | $ | (25,215 | ) | | $ | 143,347,611 | |
| | | | | | | | | | | | | | | | | |
| Obligations of states and political subdivisions | | | 7,450,366 | | | | 87,812 | | | | (9,026 | ) | | | 7,529,152 | |
| | | | | | | | | | | | | | | | | |
| Corporate securities including public utilities | | | 156,599,184 | | | | 16,768,449 | | | | (463,413 | ) | | | 172,904,220 | |
| | | | | | | | | | | | | | | | | |
| Mortgage-backed securities | | | 31,475,280 | | | | 597,395 | | | | (240,177 | ) | | | 31,832,498 | |
| | | | | | | | | | | | | | | | | |
| Redeemable preferred stock | | | 364,339 | | | | - | | | | - | | | | 364,339 | |
| | | | | | | | | | | | | | | | | |
| Total fixed maturity securities available for sale | | $ | 338,629,810 | | | $ | 18,085,841 | | | $ | (737,831 | ) | | $ | 355,977,820 | |
| | | | | | | | | | | | | | | | | |
| Equity securities at estimated fair value: | | | | | | | | | | | | | | | | |
| | | | | | | | | | | | | | | | | |
| Common stock: | | | | | | | | | | | | | | | | |
| | | | | | | | | | | | | | | | | |
| Industrial, miscellaneous and all other | | $ | 6,900,537 | | | $ | 1,139,799 | | | $ | (769,171 | ) | | $ | 7,271,165 | |
| | | | | | | | | | | | | | | | | |
| Total equity securities at estimated fair value | | $ | 6,900,537 | | | $ | 1,139,799 | | | $ | (769,171 | ) | | $ | 7,271,165 | |
| | | | | | | | | | | | | | | | | |
| Mortgage loans held for investment at amortized cost: | | | | | | | | | | | | | | | | |
| Residential | | $ | 113,043,965 | | | | | | | | | | | | | |
| Residential construction | | | 89,430,237 | | | | | | | | | | | | | |
| Commercial | | | 38,718,220 | | | | | | | | | | | | | |
| Less: Unamortized deferred loan fees, net | | | (2,391,567 | ) | | | | | | | | | | | | |
| Less: Allowance for loan losses | | | (1,453,037 | ) | | | | | | | | | | | | |
| Less: Net discounts | | | (653,272 | ) | | | | | | | | | | | | |
| | | | | | | | | | | | | | | | | |
| Total mortgage loans held for investment | | $ | 236,694,546 | | | | | | | | | | | | | |
| | | | | | | | | | | | | | | | | |
| Real estate held for investment - net of accumulated depreciation: | | | | | | | | | | | | | | | | |
| Residential | | $ | 12,530,306 | | | | | | | | | | | | | |
| Commercial | | | 90,226,640 | | | | | | | | | | | | | |
| | | | | | | | | | | | | | | | | |
| Total real estate held for investment | | $ | 102,756,946 | | | | | | | | | | | | | |
| | | | | | | | | | | | | | | | | |
| Real estate held for sale: | | | | | | | | | | | | | | | | |
| Residential | | $ | 8,021,306 | | | | | | | | | | | | | |
| Commercial | | | 6,076,321 | | | | | | | | | | | | | |
| | | | | | | | | | | | | | | | | |
| Total real estate held for sale | | $ | 14,097,627 | | | | | | | | | | | | | |
| | | | | | | | | | | | | | | | | |
| Other investments and policy loans at amortized cost: | | | | | | | | | | | | | | | | |
| Policy loans | | $ | 14,762,805 | | | | | | �� | | | | | | | |
| Insurance assignments | | | 41,062,965 | | | | | | | | | | | | | |
| Federal Home Loan Bank stock (1) | | | 894,300 | | | | | | | | | | | | | |
| Other investments | | | 4,973,225 | | | | | | | | | | | | | |
| Less: Allowance for doubtful accounts | | | (1,448,026 | ) | | | | | | | | | | | | |
| | | | | | | | | | | | | | | | | |
| Total policy loans and other investments | | $ | 60,245,269 | | | | | | | | | | | | | |
| | | | | | | | | | | | | | | | | |
| Accrued investment income | | $ | 4,833,232 | | | | | | | | | | | | | |
| | | | | | | | | | | | | | | | | |
| Total investments | | $ | 781,876,605 | | | | | | | | | | | | | |
________
| (1) | Includes $894,300 of Membership stock and $-0- of Activity stock due to short-term borrowings. |
SECURITY NATIONAL FINANCIAL CORPORATION
The Company’s investments as of December 31, 2018 are summarized as follows:
| | | Amortized Cost | | | Gross Unrealized Gains | | | Gross Unrealized Losses | | | Estimated Fair Value | |
December 31, 2018: | | | | | | | | | | | | |
| Fixed maturity securities held to maturity at amortized cost: | | | | | | | | | | | | |
| U.S. Treasury securities and obligations of U.S. Government agencies | | $ | 52,017,683 | | | $ | 264,891 | | | $ | (727,798 | ) | | $ | 51,554,776 | |
| | | | | | | | | | | | | | | | | |
| Obligations of states and political subdivisions | | | 6,959,237 | | | | 32,274 | | | | (111,271 | ) | | | 6,880,240 | |
| | | | | | | | | | | | | | | | | |
| Corporate securities including public utilities | | | 157,639,860 | | | | 7,002,864 | | | | (3,704,137 | ) | | | 160,938,587 | |
| | | | | | | | | | | | | | | | | |
| Mortgage-backed securities | | | 15,358,746 | | | | 227,398 | | | | (308,864 | ) | | | 15,277,280 | |
| | | | | | | | | | | | | | | | | |
| Redeemable preferred stock | | | 103,197 | | | | 1,903 | | | | (5,125 | ) | | | 99,975 | |
| | | | | | | | | | | | | | | | | |
| Total fixed maturity securities held to maturity | | $ | 232,078,723 | | | $ | 7,529,330 | | | $ | (4,857,195 | ) | | $ | 234,750,858 | |
| | | | | | | | | | | | | | | | | |
| Equity securities at estimated fair value: | | | | | | | | | | | | | | | | |
| | | | | | | | | | | | | | | | | |
| Common stock: | | | | | | | | | | | | | | | | |
| | | | | | | | | | | | | | | | | |
| Industrial, miscellaneous and all other | | $ | 6,312,158 | | | $ | 422,528 | | | $ | (1,176,075 | ) | | $ | 5,558,611 | |
| | | | | | | | | | | | | | | | | |
| Total equity securities at estimated fair value | | $ | 6,312,158 | | | $ | 422,528 | | | $ | (1,176,075 | ) | | $ | 5,558,611 | |
| | | | | | | | | | | | | | | | | |
| Mortgage loans held for investment at amortized cost: | | | | | | | | | | | | | | | | |
| Residential | | $ | 89,935,600 | | | | | | | | | | | | | |
| Residential construction | | | 71,366,544 | | | | | | | | | | | | | |
| Commercial | | | 27,785,927 | | | | | | | | | | | | | |
| Less: Unamortized deferred loan fees, net | | | (1,275,030 | ) | | | | | | | | | | | | |
| Less: Allowance for loan losses | | | (1,347,972 | ) | | | | | | | | | | | | |
| | | | | | | | | | | | | | | | | |
| Total mortgage loans held for investment | | $ | 186,465,069 | | | | | | | | | | | | | |
| | | | | | | | | | | | | | | | | |
| Real estate held for investment - net of accumulated depreciation: | | | | | | | | | | | | | | | | |
| Residential | | $ | 29,507,431 | | | | | | | | | | | | | |
| Commercial | | | 92,050,791 | | | | | | | | | | | | | |
| | | | | | | | | | | | | | | | | |
| Total real estate held for investment | | $ | 121,558,222 | | | | | | | | | | | | | |
| | | | | | | | | | | | | | | | | |
| Other investments and policy loans at amortized cost: | | | | | | | | | | | | | | | | |
| Policy loans | | $ | 6,424,325 | | | | | | | | | | | | | |
| Insurance assignments | | | 35,239,396 | | | | | | | | | | | | | |
| Federal Home Loan Bank stock (1) | | | 2,548,700 | | | | | | | | | | | | | |
| Other investments | | | 3,497,762 | | | | | | | | | | | | | |
| Less: Allowance for doubtful accounts | | | (1,092,528 | ) | | | | | | | | | | | | |
| | | | | | | | | | | | | | | | | |
| Total policy loans and other investments | | $ | 46,617,655 | | | | | | | | | | | | | |
| | | | | | | | | | | | | | | | | |
| Accrued investment income | | $ | 3,566,146 | | | | | | | | | | | | | |
| | | | | | | | | | | | | | | | | |
| Total investments | | $ | 595,844,426 | | | | | | | | | | | | | |
_________
| (1) | Includes $708,700 of Membership stock and $1,840,000 of Activity stock due to short-term borrowings. |
SECURITY NATIONAL FINANCIAL CORPORATION
Fixed Maturity Securities
On December 31, 2019, the Company changed the classification of its bond and preferred stock investments from held to maturity to available for sale based on the Company’s need to be able to respond proactively to market risks in managing its portfolio. Such investments are carried at fair value with any unrealized gains and losses reported as a component of other accumulated comprehensive income or loss. At the date of the transfer, the carrying value of the Company’s held to maturity securities was $338,629,810, and net unrealized gains of $17,315,770 were recognized in accumulated other comprehensive income.
The following tables summarize unrealized losses on fixed maturities securities that were carried at estimated fair value at December 31, 2019 and carried at amortized cost at December 31, 2018. The unrealized losses were primarily related to interest rate fluctuations. The tables set forth unrealized losses by duration with the fair value of the related fixed maturity securities:
| | | Unrealized Losses for Less than Twelve Months | | | Fair Value | | | Unrealized Losses for More than Twelve Months | | | Fair Value | | | Total Unrealized Loss | | | Fair Value | |
At December 31, 2019 | | | | | | | | | | | | | | | | | | |
U.S. Treasury Securities and Obligations of U.S. Government Agencies | | $ | 20,211 | | | $ | 30,629,288 | | | $ | 5,004 | | | $ | 10,000,400 | | | $ | 25,215 | | | $ | 40,629,688 | |
| Obligations of States and Political Subdivisions | | | 9,026 | | | | 3,062,889 | | | | - | | | | - | | | | 9,026 | | | | 3,062,889 | |
| Corporate Securities | | | 118,746 | | | | 7,184,311 | | | | 344,667 | | | | 3,950,509 | | | | 463,413 | | | | 11,134,820 | |
| Mortgage and other asset-backed securities | | | 205,470 | | | | 13,266,443 | | | | 34,707 | | | | 502,769 | | | | 240,177 | | | | 13,769,212 | |
| Total unrealized losses | | $ | 353,453 | | | $ | 54,142,931 | | | $ | 384,378 | | | $ | 14,453,678 | | | $ | 737,831 | | | $ | 68,596,609 | |
| | | | | | | | | | | | | | | | | | | | | | | | | |
At December 31, 2018 | | | | | | | | | | | | | | | | | | | | | | | | |
U.S. Treasury Securities and Obligations of U.S. Government Agencies | | $ | 10,519 | | | $ | 695,863 | | | $ | 717,279 | | | $ | 39,930,052 | | | $ | 727,798 | | | $ | 40,625,915 | |
| Obligations of States and Political Subdivisions | | | 6,643 | | | | 1,791,257 | | | | 104,628 | | | | 2,889,517 | | | | 111,271 | | | | 4,680,774 | |
| Corporate Securities | | | 2,514,549 | | | | 61,090,431 | | | | 1,189,588 | | | | 11,767,349 | | | | 3,704,137 | | | | 72,857,780 | |
| Mortgage and other asset-backed securities | | | 79,896 | | | | 1,705,296 | | | | 228,968 | | | | 2,690,065 | | | | 308,864 | | | | 4,395,361 | |
| Redeemable preferred stock | | | 5,125 | | | | 90,000 | | | | - | | | | - | | | | 5,125 | | | | 90,000 | |
| Total unrealized losses | | $ | 2,616,732 | | | $ | 65,372,847 | | | $ | 2,240,463 | | | $ | 57,276,983 | | | $ | 4,857,195 | | | $ | 122,649,830 | |
There were 93 securities with fair value of 98.9% of amortized cost at December 31, 2019. There were 361 securities with fair value of 96.2% of amortized cost at December 31, 2018. No credit losses have been recognized for the years ended December 31, 2019 and 2018.
On a quarterly basis, the Company evaluates its fixed maturity securities classified as available for sale or held to maturity. This evaluation includes a review of current ratings by the National Association of Insurance Commissions (“NAIC”). Securities with a rating of 1 or 2 are considered investment grade and are not reviewed for impairment. Securities with ratings of 3 to 5 are evaluated for impairment. Securities with a rating of 6 are automatically determined to be impaired and are written down. The evaluation involves an analysis of the securities in relation to historical values, interest payment history, projected earnings and revenue growth rates as well as a review of the reason for a downgrade in the NAIC rating. Based on the analysis of a security that is rated 3 to 5, a determination is made whether the security will likely make interest and principal payments in accordance with the terms of the financial instrument. If it is unlikely that the security will meet contractual obligations, the loss is considered to be other than temporary, the security is written down to the new anticipated market value and an impairment loss is recognized. Impairment losses are treated as credit losses as the Company holds fixed maturity securities to maturity unless the underlying conditions have changed in the financial instrument to require an impairment.
The fair values of fixed maturity securities are based on quoted market prices, when available. For fixed maturity securities not actively traded, fair values are estimated using values obtained from independent pricing services, or in the case of private placements, are estimated by discounting expected future cash flows using a current market value applicable to the coupon rate, credit and maturity of the investments.
SECURITY NATIONAL FINANCIAL CORPORATION
The amortized cost and estimated fair value of fixed maturity securities at December 31, 2019, by contractual maturity, are shown below. Expected maturities may differ from contractual maturities because certain borrowers may have the right to call or prepay obligations with or without call or prepayment penalties.
| | | Amortized | | | Estimated Fair | |
| | | Cost | | | Value | |
Due in 1 year | | $ | 104,805,927 | | | $ | 104,845,243 | |
Due in 2-5 years | | | 67,412,618 | | | | 69,126,500 | |
Due in 5-10 years | | | 71,110,341 | | | | 76,249,550 | |
Due in more than 10 years | | | 63,461,305 | | | | 73,559,690 | |
Mortgage-backed securities | | | 31,475,280 | | | | 31,832,498 | |
Redeemable preferred stock | | | 364,339 | | | | 364,339 | |
Total held to maturity | | $ | 338,629,810 | | | $ | 355,977,820 | |
The Company is a member of the Federal Home Loan Bank of Des Moines and Dallas (“FHLB”). The Company pledged a total of $60,000,000, par value, of United States Treasury fixed maturity securities with the FHLB at December 31, 2019. These securities are used as collateral on any cash borrowings from the FHLB. As of December 31, 2019, the Company did not have any outstanding amounts owed to the FHLB and its estimated maximum borrowing capacity was $57,727,738.
Investment Related Earnings
The Company’s net realized gains and losses from sales, calls, and maturities, and other than temporary impairments from investments and other assets for the years ended December 31 are summarized as follows:
| | | 2019 | | | 2018 | | | |
| Fixed maturity securities held to maturity: | | | | | | | | |
| Gross realized gains | | $ | 459,286 | | | $ | 522,937 | | | |
| Gross realized losses | | | (162,649 | ) | | | (669,303 | ) | | |
| | | | | | | | | | | |
| Equity securities: | | | | | | | | | | |
| Gains (losses) on securities sold | | | 256,520 | | | | (173,413 | ) | | |
| Unrealized gains (losses) on securities held at the end of the period | | | 1,086,116 | | | | (1,053,756 | ) | | |
| | | | | | | | | | | |
| Other assets: | | | | | | | | | | |
| Gross realized gains | | | 2,844,673 | | | | 26,553,814 | | (1 | ) |
| Gross realized losses | | | (3,755,579 | ) | | | (1,239,100 | ) | | |
| Total | | $ | 728,367 | | | $ | 23,941,179 | | | |
________
| (1) | Includes a one-time gain of $22,252,000 from the sale of Dry Creek at East Village Apartments. |
The net realized gains and losses on the sale of securities are recorded on the trade date, and the cost of the securities sold is determined using the specific identification method.
The carrying amount of held to maturity securities sold was $4,950,041 and $5,808,244, for the years ended December 31, 2019 and 2018, respectively. The net realized gain related to these sales was $43,039, for the year ended December 31, 2019, and the net realized loss related to these sales was $268,823, for the year ended December 31, 2018.
SECURITY NATIONAL FINANCIAL CORPORATION
Major categories of net investment income for the years ended December 31, were as follows:
| | | 2019 | | | 2018 | |
| Fixed maturity securities | | $ | 10,372,559 | | | $ | 10,041,349 | |
| Equity securities | | | 309,918 | | | | 233,555 | |
| Mortgage loans held for investment | | | 18,405,010 | | | | 18,716,226 | |
| Real estate held for investment and sale | | | 8,782,959 | | | | 8,375,257 | |
| Policy loans | | | 554,969 | | | | 409,589 | |
| Insurance assignments | | | 16,086,059 | | | | 14,771,336 | |
| Other investments | | | 184,439 | | | | 227,930 | |
| Cash and cash equivalents | | | 1,824,443 | | | | 1,264,611 | |
| Gross investment income | | | 56,520,356 | | | | 54,039,853 | |
| Investment expenses | | | (13,500,883 | ) | | | (14,126,586 | ) |
| Net investment income | | $ | 43,019,473 | | | $ | 39,913,267 | |
Net investment income includes net investment income earned by the restricted assets of the cemeteries and mortuaries of $448,754 and $386,659 for the years ended December 31, 2019 and 2018, respectively.
Net investment income on real estate consists primarily of rental revenue.
Investment expenses consist primarily of depreciation, property taxes, operating expenses of real estate and an estimated portion of administrative expenses relating to investment activities.
Securities on deposit for regulatory authorities as required by law amounted to $9,633,818 and $9,220,520 at December 31, 2019 and 2018, respectively. The restricted securities are included in various assets under investments on the accompanying consolidated balance sheets.
There were no investments, aggregated by issuer, in excess of 10% of shareholders’ equity (before net unrealized gains and losses on equity securities) at December 31, 2019, other than investments issued or guaranteed by the United States Government.
Real Estate Held for Investment and Held for Sale
The Company continues to strategically deploy resources into real estate to match the income and yield durations of its primary obligations. The sources for these real estate assets come through its various business segments in the form of acquisition, development and mortgage foreclosures. The Company reports real estate held for investment and held for sale pursuant to the accounting policy discussed in Note 1 of the Notes to Consolidated Financial Statements.
Commercial Real Estate Held for Investment and Held for Sale
The Company owns and manages commercial real estate assets as a means of generating investment income. These assets are acquired in accordance with the Company’s goals and objectives for risk-adjusted returns. Due diligence is conducted on each asset using internal and third-party reports. Geographic locations and asset classes of the investment activity is determined by senior management under the direction of the Board of Directors.
The Company employs full-time employees to attend to the day-to-day operations of those assets within the greater Salt Lake area and close surrounding markets. The Company utilizes third-party property managers when the geographic boundary does not warrant full-time staff or through strategic lease-up periods. The Company generally looks to acquire assets in regions that are high growth regions for employment and population and assets that provide operational efficiencies.
SECURITY NATIONAL FINANCIAL CORPORATION
The Company currently owns and operates 16 commercial properties in 5 states. These properties include industrial warehouses, office buildings, retail centers, and includes the redevelopment and expansion of its corporate campus (“Center53”) in Salt Lake City, Utah. The Company also holds undeveloped land that may be used for future commercial developments. The Company does use debt in strategic cases to leverage established yields or to acquire a higher quality or different class of asset. See Note 20 regarding commercial real estate held for investment in Louisiana acquired with the acquisition of Kilpatrick Life Insurance Company.
The aggregated net ending balance of commercial real estate that serves as collateral for bank borrowings was approximately $87,815,000 and $84,880,000 as of December 31, 2019 and 2018, respectively. The associated bank loan carrying values totaled approximately $54,917,000 and $52,237,000 as of December 31, 2019 and 2018, respectively.
During the years ended December 31, 2019 and 2018, the Company recorded impairment losses on commercial real estate held for investment of $2,768,979 and $-0-, respectively. The impairment loss of $2,768,979 recognized relates to an office building in Kansas held by the life insurance segment for which the Company received an unsolicited bid from a potential buyer that was significantly below the building’s carrying value. Although management did not consider the offer as representative of fair value, the Company evaluated the unsolicited bid as a potential impairment indicator. The Company performed an impairment analysis internally and obtained an independent appraisal from an outside commercial real estate valuation firm, concluding that the fair value of the building was less than its carrying value. This office building was recently listed for sale and is included in commercial real estate held for sale. This impairment loss is included in gains (losses) on investments and other assets on the consolidated statements of earnings.
The Company’s commercial real estate held for investment for the years ended December 31, is summarized as follows:
| | | Net Ending Balance | | | | | Total Square Footage | |
| | | 2019 | | | | | 2018 | | | | | 2019 | | | 2018 | |
| Arizona | | $ | - | | | | | $ | 4,000 | | (1 | ) | | | - | | | | - | |
| Kansas | | | - | | | | | | 6,861,898 | | | | | | - | | | | 222,679 | |
| Louisiana | | | 6,009,079 | | | | | | 467,694 | | | | | | 125,114 | | | | 7,063 | |
| Mississippi | | | 2,951,478 | | | | | | 3,329,948 | | | | | | 21,521 | | | | 33,821 | |
| New Mexico | | | - | | | | | | 7,000 | | (1 | ) | | | - | | | | - | |
| Texas | | | - | | | | | | 300,000 | | (2 | ) | | | - | | | | - | |
| Utah | | | 81,266,083 | | (3 | ) | | | 81,080,251 | | | | | | 465,230 | | | | 502,129 | |
| | | | | | | | | | | | | | | | | | | | | |
| | | $ | 90,226,640 | | | | | $ | 92,050,791 | | | | | | 611,865 | | | | 765,692 | |
________
| (1) | |
| (2) | Improved commercial pad |
| (3) | Includes Center53 phase 1 completed in July 2017 |
SECURITY NATIONAL FINANCIAL CORPORATION
The Company’s commercial real estate held for sale for the years ended December 31, is summarized as follows:
| | | Net Ending Balance | | | Total Square Footage | |
| | | 2019 | | | | | 2018 | | | 2019 | | | 2018 | |
| Arizona | | $ | 2,500 | | (1 | ) | | $ | - | | | | - | | | | - | |
| Kansas | | | 4,800,000 | | | | | | - | | | | 222,679 | | | | - | |
| Mississippi | | | 318,322 | | | | | | - | | | | 12,300 | | | | - | |
| Nevada | | | 655,499 | | | | | | - | | | | 4,800 | | | | - | |
| Texas | | | 300,000 | | (2 | ) | | | - | | | | - | | | | - | |
| | | | | | | | | | | | | | | | | | | |
| | | $ | 6,076,321 | | | | | $ | - | | | | 239,779 | | | | - | |
_________
| (1) | |
| (2) | Improved commercial pad |
These properties are all actively being marketed with the assistance of commercial real estate brokers in the markets where the properties are located. The Company expects these properties to sell within the coming 12 months.
Residential Real Estate Held for Investment and Held for Sale
The Company owns a portfolio of residential homes primarily as a result of loan foreclosures. The strategy has been to lease these homes to produce cash flow, and allow time for the economic fundamentals to return to the various markets. As an orderly and active market for these homes returns, the Company has the option to dispose or to continue and hold them for cash flow and acceptable returns. The Company also invests in residential subdivision developments.
The Company established Security National Real Estate Services (“SNRE”) to manage the residential portfolio. SNRE cultivates and maintains the preferred vendor relationships necessary to manage costs and quality of work performed on the portfolio of homes across the country.
As of December 31, 2019, SNRE manages 38 residential properties in 6 states across the United States.
During the years ended December 31, 2019 and 2018, the Company recorded impairment losses on residential real estate held for investment of $700,134 and $486,457, respectively. These impairment losses are included in gains (losses) on investments and other assets on the consolidated statements of earnings.
The net ending balance of foreclosed residential real estate included in residential real estate held for investment is approximately $12,434,000 and $23,532,000 as of December 31, 2019 and 2018, respectively.
SECURITY NATIONAL FINANCIAL CORPORATION
The Company’s residential real estate held for investment for the years ended December 31, is summarized as follows:
| | | Net Ending Balance | | | |
| | | 2019 | | | | | 2018 | | | |
| California | | $ | - | | | | | $ | 2,644,321 | | | |
| Florida | | | 2,487,723 | | | | | | 6,534,277 | | | |
| Nevada | | | 293,516 | | | | | | - | | | |
| Ohio | | | - | | | | | | 10,000 | | | |
| Oklahoma | | | - | | | | | | - | | | |
| Tennessee | | | - | | | | | | 105,260 | | | |
| Texas | | | - | | | | | | 139,174 | | | |
| Utah | | | 9,462,886 | | (1 | ) | | | 19,598,218 | | (1 | ) |
| Washington | | | 286,181 | | | | | | 476,181 | | | |
| | | $ | 12,530,306 | | | | | $ | 29,507,431 | | | |
________
| (1) | Includes subdivision developments |
The Company’s residential real estate held for sale for the years ended December 31, is summarized as follows:
| | | Net Ending Balance | |
| | | 2019 | | | 2018 | |
| California | | | 640,452 | | | | - | |
| Florida | | | 1,300,641 | | | | - | |
| Ohio | | | 10,000 | | | | - | |
| Utah | | | 5,880,213 | | | | - | |
| Washington | | | 190,000 | | | | - | |
| | | $ | 8,021,306 | | | $ | - | |
These properties are all actively being marketed with the assistance of residential real estate brokers in the markets where the properties are located. The Company expects these properties to sell within the coming 12 months.
SECURITY NATIONAL FINANCIAL CORPORATION
Real Estate Owned and Occupied by the Company
The primary business units of the Company occupy a portion of the commercial real estate owned by the Company. As of December 31, 2019, real estate owned and occupied by the Company is summarized as follows:
| Location | | Business Segment | | Approximate Square Footage | | Square Footage Occupied
by the
Company |
| 121 W. Election Rd., Draper, UT | | Corporate Offices, Life Insurance and Cemetery/Mortuary Operations | | 78,979 | | 18% |
| 5201 Green Street, Salt Lake City, UT (1) | | Life Insurance and Mortgage Operations | | 39,157 | | 73% |
| 1044 River Oaks Dr., Flowood, MS | | Life Insurance Operations | | 19,694 | | 28% |
| 1818 Marshall Street, Shreveport, LA (1)(2) | | Life Insurance Operations | | 12,274 | | 100% |
| 909 Foisy Street, Alexandria, LA (1)(2) | | Life Insurance Sales | | 8,059 | | 100% |
| 812 Sheppard Street, Minden, LA (1)(2) | | Life Insurance Sales | | 1,560 | | 100% |
| 1550 N 3rd Street, Jena, LA (1)(2) | | Life Insurance Sales | | 1,737 | | 100% |
__________
| (1) | Included in property and equipment on the consolidated balance sheets |
| (2) | See Note 20 regarding the acquisition of Kilpatrick Life Insurance Company. |
Mortgage Loans Held for Investment
The Company reports mortgage loans held for investment pursuant to the accounting policy discussed in Note 1 of the Notes to Consolidated Financial Statements.
Mortgage loans consist of first and second mortgages. The mortgage loans bear interest at rates ranging from 2.0 % to 10.5%, maturity dates range from nine months to 30 years and are secured by real estate. Concentrations of credit risk arise when a number of mortgage loan debtors have similar economic characteristics that would cause their ability to meet contractual obligations to be similarly affected by changes in economic conditions. Although the Company has a diversified mortgage loan portfolio consisting of residential mortgages, commercial loans and residential construction loans and requires collateral on all real estate exposures, a substantial portion of its debtors’ ability to honor obligations is reliant on the economic stability of the geographic region in which the debtors do business. At December 31, 2019, the Company had 48%, 16%, 10%, 6%, 6% and 5% of its mortgage loans from borrowers located in the states of Utah, Florida, Texas, California, Nevada and Arizona, respectively.
SECURITY NATIONAL FINANCIAL CORPORATION
The Company establishes a valuation allowance for credit losses in its portfolio. The following is a summary of the allowance for loan losses as a contra-asset account for the periods presented:
| Allowance for Credit Losses and Recorded Investment in Mortgage Loans Held for Investment | |
| Years Ended December 31 | |
| | | | | | | | | | | | | |
| | | Commercial | | | Residential | | | Residential Construction | | | Total | |
2019 | | | | | | | | | | | | |
| Allowance for credit losses: | | | | | | | | | | | | |
| Beginning balance | | $ | 187,129 | | | $ | 1,125,623 | | | $ | 35,220 | | | $ | 1,347,972 | |
| Charge-offs | | | - | | | | (32,692 | ) | | | - | | | | (32,692 | ) |
| Provision | | | - | | | | 129,775 | | | | 7,982 | | | | 137,757 | |
| Ending balance | | $ | 187,129 | | | $ | 1,222,706 | | | $ | 43,202 | | | $ | 1,453,037 | |
| | | | | | | | | | | | | | | | | |
| Ending balance: individually evaluated for impairment | | $ | - | | | $ | 195,993 | | | $ | - | | | $ | 195,993 | |
| | | | | | | | | | | | | | | | | |
| Ending balance: collectively evaluated for impairment | | $ | 187,129 | | | $ | 1,026,713 | | | $ | 43,202 | | | $ | 1,257,044 | |
| | | | | | | | | | | | | | | | | |
| Mortgage loans: | | | | | | | | | | | | | | | | |
| Ending balance | | $ | 38,718,220 | | | $ | 113,043,965 | | | $ | 89,430,237 | | | $ | 241,192,422 | |
| | | | | | | | | | | | | | | | | |
| Ending balance: individually evaluated for impairment | | $ | 4,488,719 | | | $ | 3,752,207 | | | $ | 655,000 | | | $ | 8,895,926 | |
| | | | | | | | | | | | | | | | | |
| Ending balance: collectively evaluated for impairment | | $ | 34,229,501 | | | $ | 109,291,758 | | | $ | 88,775,237 | | | $ | 232,296,496 | |
2018 | | | | | | | | | | | | |
| Allowance for credit losses: | | | | | | | | | | | | |
| Beginning balance | | $ | 187,129 | | | $ | 1,546,447 | | | $ | 35,220 | | | $ | 1,768,796 | |
| Charge-offs | | | - | | | | (5,725 | ) | | | - | | | | (5,725 | ) |
| Provision | | | - | | | | (415,099 | ) | | | - | | | | (415,099 | ) |
| Ending balance | | $ | 187,129 | | | $ | 1,125,623 | | | $ | 35,220 | | | $ | 1,347,972 | |
| | | | | | | | | | | | | | | | | |
| Ending balance: individually evaluated for impairment | | $ | - | | | $ | 74,185 | | | $ | - | | | $ | 74,185 | |
| | | | | | | | | | | | | | | | | |
| Ending balance: collectively evaluated for impairment | | $ | 187,129 | | | $ | 1,051,438 | | | $ | 35,220 | | | $ | 1,273,787 | |
| | | | | | | | | | | | | | | | | |
| Mortgage loans: | | | | | | | | | | | | | | | | |
| Ending balance | | $ | 27,785,927 | | | $ | 89,935,600 | | | $ | 71,366,544 | | | $ | 189,088,071 | |
| | | | | | | | | | | | | | | | | |
| Ending balance: individually evaluated for impairment | | $ | 196,182 | | | $ | 2,939,651 | | | $ | 502,991 | | | $ | 3,638,824 | |
| | | | | | | | | | | | | | | | | |
| Ending balance: collectively evaluated for impairment | | $ | 27,589,745 | | | $ | 86,995,949 | | | $ | 70,863,553 | | | $ | 185,449,247 | |
SECURITY NATIONAL FINANCIAL CORPORATION
The following is a summary of the aging of mortgage loans held for investment for the periods presented.
| Age Analysis of Past Due Mortgage Loans Held for Investment | |
| Years Ended December 31 | |
| | | | | | | | | | | | | | | | | | | | | | | | | | | | | | | | | | |
| | | 30-59 Days Past Due | | | 60-89 Days Past Due | | | Greater Than 90 Days (1) | | | In Process of Foreclosure (1) | | | Total Past Due | | | Current | | | Total Mortgage Loans | | | Allowance for Loan
Losses | | | Unamortized deferred loan fees, net | | | Unamortized discounts, net | | | Net Mortgage Loans | |
2019 | | | | | | | | | | | | | | | | | | | | | | | | | | | | | | | | | |
| Commercial | | $ | 1,872,000 | | | $ | - | | | $ | 4,488,719 | | | $ | - | | | $ | 6,360,719 | | | $ | 32,357,501 | | | $ | 38,718,220 | | | $ | (187,129 | ) | | $ | (88,918 | ) | | $ | (653,272 | ) | | $ | 37,788,901 | |
| Residential | | | 10,609,296 | | | | 4,085,767 | | | | 2,100,742 | | | | 1,651,465 | | | | 18,447,270 | | | | 94,596,695 | | | | 113,043,965 | | | | (1,222,706 | ) | | | (1,567,581 | ) | | | - | | | | 110,253,678 | |
Residential
Construction | | | - | | | | - | | | | 655,000 | | | | - | | | | 655,000 | | | | 88,775,237 | | | | 89,430,237 | | | | (43,202 | ) | | | (735,068 | ) | | | - | | | | 88,651,967 | |
| | | | | | | | | | | | | | | | | | | | | | | | | | | | | | | | | | | | | | | | | | | | | |
| Total | | $ | 12,481,296 | | | $ | 4,085,767 | | | $ | 7,244,461 | | | $ | 1,651,465 | | | $ | 25,462,989 | | | $ | 215,729,433 | | | $ | 241,192,422 | | | $ | (1,453,037 | ) | | $ | (2,391,567 | ) | | $ | (653,272 | ) | | $ | 236,694,546 | |
| | | | | | | | | | | | | | | | | | | | | | | | | | | | | | | | | | | | | | | | | | | | | |
2018 | | | | | | | | | | | | | | | | | | | | | | | | | | | | | | | | | | | | | | | | | | | | |
| Commercial | | $ | 4,588,424 | | | $ | - | | | $ | 196,182 | | | $ | - | | | $ | 4,784,606 | | | $ | 23,001,321 | | | $ | 27,785,927 | | | $ | (187,129 | ) | | $ | 32,003 | | | $ | - | | | $ | 27,630,801 | |
| Residential | | | 9,899,380 | | | | 2,312,252 | | | | 1,715,362 | | | | 1,224,289 | | | | 15,151,283 | | | | 74,784,317 | | | | 89,935,600 | | | | (1,125,623 | ) | | | (862,411 | ) | | | - | | | | 87,947,566 | |
Residential
Construction | | | - | | | | - | | | | - | | | | 502,991 | | | | 502,991 | | | | 70,863,553 | | | | 71,366,544 | | | | (35,220 | ) | | | (444,622 | ) | | | - | | | | 70,886,702 | |
| | | | | | | | | | | | | | | | | | | | | | | | | | | | | | | | | | | | | | | | | | | | | |
| Total | | $ | 14,487,804 | | | $ | 2,312,252 | | | $ | 1,911,544 | | | $ | 1,727,280 | | | $ | 20,438,880 | | | $ | 168,649,191 | | | $ | 189,088,071 | | | $ | (1,347,972 | ) | | $ | (1,275,030 | ) | | $ | - | | | $ | 186,465,069 | |
_________
| (1) | There was not any interest income recognized on loans past due greater than 90 days or in foreclosure. |
SECURITY NATIONAL FINANCIAL CORPORATION
Impaired Mortgage Loans Held for Investment
Impaired mortgage loans held for investment include loans with a related specific valuation allowance or loans whose carrying amount has been reduced to the expected collectible amount because the impairment has been considered other than temporary. The recorded investment in and unpaid principal balance of impaired loans along with the related loan specific allowance for losses, if
any, for each reporting period and the average recorded investment and interest income recognized during the time the loans were impaired were as follows:
| Impaired Loans | |
| Years Ended December 31 | |
| | |
| | | Recorded Investment | | | Unpaid Principal Balance | | | Related Allowance | | | Average Recorded Investment | | | Interest Income Recognized | |
2019 | | | | | | | | | | | | | | | |
| With no related allowance recorded: | | | | | | | | | | | | | | | |
| Commercial | | $ | 4,488,719 | | | $ | 4,488,719 | | | $ | - | | | $ | 1,499,043 | | | $ | - | |
| Residential | | | 2,254,189 | | | | 2,254,189 | | | | - | | | | 3,367,151 | | | | - | |
| Residential construction | | | 655,000 | | | | 655,000 | | | | - | | | | 1,457,278 | | | | - | |
| | | | | | | | | | | | | | | | | | | | | |
| With an allowance recorded: | | | | | | | | | | | | | | | | | | | | |
| Commercial | | $ | - | | | $ | - | | | $ | - | | | $ | - | | | $ | - | |
| Residential | | | 1,498,018 | | | | 1,498,018 | | | | 195,993 | | | | 665,270 | | | | - | |
| Residential construction | | | - | | | | - | | | | - | | | | - | | | | - | |
| | | | | | | | | | | | | | | | | | | | | |
| Total: | | | | | | | | | | | | | | | | | | | | |
| Commercial | | $ | 4,488,719 | | | $ | 4,488,719 | | | $ | - | | | $ | 1,499,043 | | | $ | - | |
| Residential | | | 3,752,207 | | | | 3,752,207 | | | | 195,993 | | | | 4,032,421 | | | | - | |
| Residential construction | | | 655,000 | | | | 655,000 | | | | - | | | | 1,457,278 | | | | - | |
| | | | | | | | | | | | | | | | | | | | | |
2018 | | | | | | | | | | | | | | | | | | | | |
| With no related allowance recorded: | | | | | | | | | | | | | | | | | | | | |
| Commercial | | $ | 196,182 | | | $ | 196,182 | | | $ | - | | | $ | 98,023 | | | $ | - | |
| Residential | | | 1,612,164 | | | | 1,612,164 | | | | - | | | | 2,423,135 | | | | - | |
| Residential construction | | | 502,991 | | | | 502,991 | | | | - | | | | 675,950 | | | | - | |
| | | | | | | | | | | | | | | | | | | | | |
| With an allowance recorded: | | | | | | | | | | | | | | | | | | | | |
| Commercial | | $ | - | | | $ | - | | | $ | - | | | $ | - | | | $ | - | |
| Residential | | | 1,327,487 | | | | 1,327,487 | | | | 74,185 | | | | 1,543,416 | | | | - | |
| Residential construction | | | - | | | | - | | | | - | | | | - | | | | - | |
| | | | | | | | | | | | | | | | | | | | | |
| Total: | | | | | | | | | | | | | | | | | | | | |
| Commercial | | $ | 196,182 | | | $ | 196,182 | | | $ | - | | | $ | 98,023 | | | $ | - | |
| Residential | | | 2,939,651 | | | | 2,939,651 | | | | 74,185 | | | | 3,966,551 | | | | - | |
| Residential construction | | | 502,991 | | | | 502,991 | | | | - | | | | 675,950 | | | | - | |
Credit Risk Profile Based on Performance Status
The Company’s mortgage loan held for investment portfolio is monitored based on performance of the loans. Monitoring a mortgage loan increases when the loan is delinquent or earlier if there is an indication of impairment. The Company defines non-performing mortgage loans as loans 90 days or greater delinquent or on non-accrual status.
SECURITY NATIONAL FINANCIAL CORPORATION
The Company’s performing and non-performing mortgage loans held for investment were as follows:
| Mortgage Loans Held for Investment Credit Exposure | |
| Credit Risk Profile Based on Payment Activity | |
| Years Ended December 31 | |
| | | | | | | | | | | | | | | | | | | | | | | | | |
| | | Commercial | | | Residential | | | Residential Construction | | | Total | |
| | | 2019 | | | 2018 | | | 2019 | | | 2018 | | | 2019 | | | 2018 | | | 2019 | | | 2018 | |
| | | | | | | | | | | | | | | | | | | | | | | | | |
| Performing | | $ | 34,229,501 | | | $ | 27,589,745 | | | $ | 109,291,758 | | | $ | 86,995,949 | | | $ | 88,775,237 | | | $ | 70,863,553 | | | $ | 232,296,496 | | | $ | 185,449,247 | |
| Non-performing | | | 4,488,719 | | | | 196,182 | | | | 3,752,207 | | | | 2,939,651 | | | | 655,000 | | | | 502,991 | | | | 8,895,926 | | | | 3,638,824 | |
| | | | | | | | | | | | | | | | | | | | | | | | | | | | | | | | | |
| Total | | $ | 38,718,220 | | | $ | 27,785,927 | | | $ | 113,043,965 | | | $ | 89,935,600 | | | $ | 89,430,237 | | | $ | 71,366,544 | | | $ | 241,192,422 | | | $ | 189,088,071 | |
Non-Accrual Mortgage Loans Held for Investment
Once a loan is past due 90 days, it is the policy of the Company to end the accrual of interest income on the loan and write off any income that had been accrued. Payments received for loans on a non-accrual status are recognized on a cash basis. Interest income recognized from any payments received for loans on a non-accrual status was immaterial. Accrual of interest resumes if a loan is brought current. Interest not accrued on these loans totals approximately $203,000 and $151,000 as of December 31, 2019 and 2018, respectively.
The following is a summary of mortgage loans held for investment on a non-accrual status for the periods presented.
| | | Mortgage Loans on Non-accrual Status Years Ended December 31 | |
| | | 2019 | | | 2018 | |
| Commercial | | $ | 4,488,719 | | | $ | 196,182 | |
| Residential | | | 3,752,207 | | | | 2,939,651 | |
| Residential construction | | | 655,000 | | | | 502,991 | |
| Total | | $ | 8,895,926 | | | $ | 3,638,824 | |
Principal Amounts Due
The amortized cost and contractual payments on mortgage loans held for investment by category as of December 31, 2019 are shown below. Expected principal payments may differ from contractual obligations because certain borrowers may elect to pay off mortgage obligations with or without early payment penalties.
| | | | | | Principal | | | Principal | | | Principal | |
| | | | | | Amounts | | | Amounts | | | Amounts | |
| | | | | | Due in | | | Due in | | | Due | |
| | | Total | | | 1 Year | | | 2-5 Years | | | Thereafter | |
| Residential | | $ | 113,043,965 | | | $ | 6,234,913 | | | $ | 27,161,628 | | | $ | 79,647,424 | |
| Residential Construction | | | 89,430,237 | | | $ | 60,376,688 | | | $ | 29,053,549 | | | | - | |
| Commercial | | | 38,718,220 | | | | 24,175,464 | | | | 4,020,999 | | | | 10,521,757 | |
| Total | | $ | 241,192,422 | | | $ | 90,787,065 | | | $ | 60,236,176 | | | $ | 90,169,181 | |
3) Loans Held for Sale
The Company has elected the fair value option for loans held for sale as disclosed in Note 1. Interest income is recorded based on the contractual terms of the loan and in accordance with the Company’s policy on mortgage loans held for investment and is included in mortgage fee income on the consolidated statement of earnings. There are five loans with an aggregate unpaid principal balance of $1,130,028 that are 90 or more days past due and on a nonaccrual status as of December 31, 2019. See Note 17 of the Notes to Consolidated Financial Statements for additional disclosures regarding loans held for sale.
The following is a summary of the aggregate fair value and the aggregate unpaid principal balance of loans held for sale for the periods presented:
| | | As of December 31 2019 | | | As of December 31 2018 | |
| | | | | | | |
| Aggregate fair value | | $ | 213,457,632 | | | $ | 136,210,853 | |
| Unpaid principal balance | | | 206,417,122 | | | | 131,663,946 | |
| Unrealized gain | | | 7,040,510 | | | | 4,546,907 | |
Mortgage fee income consists of origination fees, processing fees, interest income and certain other income related to the origination and sale of mortgage loans held for sale.
Major categories of mortgage fee income for loans held for sale for the years ended December 31, were as follows:
| | | 2019 | | | 2018 | |
| Loan fees | | $ | 28,660,966 | | | $ | 27,429,237 | |
| Interest income | | | 6,978,930 | | | | 6,156,796 | |
| Secondary gains | | | 93,581,956 | | | | 80,416,718 | |
| Change in fair value of loan commitments | | | 899,417 | | | | (404,773 | ) |
| Change in fair value of loans held for sale | | | 2,498,097 | | | | 3,736,209 | |
| Provision for loan loss reserve | | | (643,284 | ) | | | (1,148,334 | ) |
| Mortgage fee income | | $ | 131,976,082 | | | $ | 116,185,853 | |
Loan Loss Reserve
When a repurchase demand corresponding to a mortgage loan previously held for sale and sold to a third-party investor is received from a third-party investor, the relevant data is reviewed and captured so that an estimated future loss can be calculated. The key factors that are used in the estimated loss calculation are as follows: (i) lien position, (ii) payment status, (iii) claim type, (iv) unpaid principal balance, (v) interest rate, and (vi) validity of the demand. Other data is captured and is useful for management purposes; the actual estimated loss is generally based on these key factors. The Company conducts its own review upon the receipt of a repurchase demand. In many instances, the Company is able to resolve the issues relating to the repurchase demand by the third-party investor without having to make any payments to the investor.
SECURITY NATIONAL FINANCIAL CORPORATION
The following is a summary of the loan loss reserve which is included in other liabilities and accrued expenses:
| | | December 31 | |
| | | 2019 | | | 2018 | |
| Balance, beginning of period | | $ | 3,604,869 | | | $ | 2,571,524 | |
| Provision for current loan originations (1) | | | 643,284 | | | | 1,148,334 | |
| Charge-offs, net of recaptured amounts | | | (201,865 | ) | | | (114,989 | ) |
| Balance, at December 31 | | $ | 4,046,288 | | | $ | 3,604,869 | |
__________
| (1) | Included in Mortgage fee income |
The Company maintains reserves for estimated losses on current production volumes. The Company also retains loss reserves for loans that the Company originated between 2005 and 2007, in which the possibility of an investor claim or potential settlement may still exist. During 2019, reserves were added at a rate of 2.5 basis points per loan originated, the equivalent of $250 per $1,000,000 in loans originated. During 2018, reserves were added at an average rate of 5.0 basis points per loan originated.
Based on the Company’s best estimate for potential loan losses and considering published industry data, loss reserve basis points are established to create an adequate reserve. The reserve is intended to cover both expected losses on recent period loan production and possible losses on earlier loans that were sold. The strong housing market over the last several years has reduced the Company’s exposure to losses on more recent loan production, but exposure still remains on older loans.
During the period from 2006 to 2019, over $60 million has been reserved for loan losses. A large majority of that reserve has been used to settle investor claims or potential claims on alternative documentation loans originated between 2005 to 2007. As the time since the origination of these loans has increased, estimating the potential of a claim being made, when it might be made, the validity of the claim, and the amount of such claim becomes more difficult. However, because some loans remain from the original 2005 to 2007 time period that have not been settled, the Company still includes a reserve for the potential of future loan demands and potential settlements of such loans. As of December 31, 2019, the loan loss reserve includes an estimate of approximately $3,000,000 for remaining losses still to be settled on loans from this time period with a general reserve for more recent loan production. Thus, the Company believes that the final loan loss reserve as of December 31, 2019, represents its best estimate for adequate loss reserves on loans sold.
The Company believes that actual loan loss experience could change in the near-term from the established reserve based upon claims that could be asserted by a third-party investor. The Company believes there is potential to resolve any alleged claims by a third-party investor on acceptable terms. If the Company is unable to resolve such claims on acceptable terms, legal action may ensue. In the event of legal action by any third-party investor, the Company believes it has significant defenses to any such action and intends to vigorously defend itself against such action.
SECURITY NATIONAL FINANCIAL CORPORATION
4) Receivables
Receivables consist of the following:
| | | December 31 | |
| | | 2019 | | | 2018 | |
| Trade contracts | | $ | 2,795,471 | | | $ | 2,816,225 | |
| Receivables from sales agents | | | 2,962,571 | | | | 3,079,688 | |
| Other | | | 5,202,444 | | | | 4,559,272 | |
| Total receivables | | | 10,960,486 | | | | 10,455,185 | |
| Allowance for doubtful accounts | | | (1,724,156 | ) | | | (1,519,842 | ) |
| Net receivables | | $ | 9,236,330 | | | $ | 8,935,343 | |
5) Value of Business Acquired, Intangible Assets and Goodwill
Information with regard to value of business acquired was as follows:
| | | December 31 | |
| | | 2019 | | | | | 2018 | |
| Balance at beginning of year | | $ | 5,765,190 | | | | | $ | 6,588,759 | |
| Value of business acquired | | | 4,962,831 | | (1 | ) | | | - | |
| Imputed interest at 7% included in earnings | | | 472,916 | | | | | | 421,122 | |
| Amortization included in earnings | | | (1,320,456 | ) | | | | | (1,244,691 | ) |
| Shadow amortization included in other comprehensive income | | | (3,834 | ) | | | | | - | |
| Net amortization | | | (851,374 | ) | | | | | (823,569 | ) |
| Balance at end of year | | $ | 9,876,647 | | | | | $ | 5,765,190 | |
_________
| (1) | See Note 20 regarding the acquisition of Kilpatrick Life Insurance Company |
Presuming no additional acquisitions, net amortization charged to income is expected to approximate $1,194,000, $1,065,000, $985,000, $916,000, and $845,000 for the years 2020 through 2025. Actual amortization may vary based on changes in assumptions or experience. As of December 31, 2019, value of business acquired is being amortized over a weighted average life of 6.8 years.
The carrying value of the Company’s intangible assets were as follows:
| | | | December 31 | | | |
| | | | | 2019
| | | | | | 2018
| | | |
| Intangible asset - customer lists | 15 years | | $ | 890,000 | | (1 | ) | | $ | 890,000 | | (1 | ) |
| Intangible asset - trade name | 15 years | | $ | 610,000 | | (2 | ) | | $ | - | | | |
| Less accumulated amortization | | | | (98,222 | ) | | | | | (34,611 | ) | | |
| Balance at end of year | | | $ | 1,401,778 | | | | | $ | 855,389 | | | |
_________
| (1) | See Note 20 regarding the acquisition of Beta Capital Corp. |
(2)
| See Note 20 regarding the acquisition of Kilpatrick Life Insurance Company |
SECURITY NATIONAL FINANCIAL CORPORATION
Information regarding goodwill by segment was as follows:
| | | Life Insurance | | | Cemetery/Mortuary | | | | | Total | |
| Balance at January 1, 2018: | | | | | | | | | | | |
| Goodwill | | $ | 2,765,570 | | | $ | - | | | | | $ | 2,765,570 | |
| Accumulated impairment | | | - | | | | - | | | | | | - | |
| Total goodwill, net | | | 2,765,570 | | | | - | | | | | | 2,765,570 | |
| | | | | | | | | | | | | | | |
| Balance at December 31, 2018: | | | | | | | | | | | | | | |
| Goodwill | | | 2,765,570 | | | | - | | | | | | 2,765,570 | |
| Accumulated impairment | | | - | | | | - | | | | | | - | |
| Total goodwill, net | | | 2,765,570 | | | | - | | | | | | 2,765,570 | |
| | | | | | | | | | | | | | | |
| Acquisition | | | - | | | | 754,018 | | (1 | ) | | | 754,018 | |
| | | | | | | | | | | | | | | |
| Balance at December 31, 2019: | | | | | | | | | | | | | | |
| Goodwill | | | 2,765,570 | | | | 754,018 | | | | | | 3,519,588 | |
| Accumulated impairment | | | - | | | | - | | | | | | - | |
| Total goodwill, net | | $ | 2,765,570 | | | $ | 754,018 | | | | | $ | 3,519,588 | |
_________
| (1) | See Note 20 regarding the acquisition of Probst Family Funerals and Cremations and Heber Valley Funeral Home |
Goodwill of $3,519,588 is not amortized but is tested annually for impairment. The annual impairment tests resulted in no impairment of goodwill for the years ended December 31, 2019 and 2018.
6) Property and Equipment
The cost of property and equipment is summarized below:
| | | December 31 | |
| | | 2019 | | | 2018 | |
| Land and buildings | | $ | 15,131,301 | | | $ | 7,775,922 | |
| Furniture and equipment | | | 18,987,984 | | | | 16,731,457 | |
| | | | 34,119,285 | | | | 24,507,379 | |
| Less accumulated depreciation | | | (19,518,891 | ) | | | (17,496,601 | ) |
| Total | | $ | 14,600,394 | | | $ | 7,010,778 | |
Depreciation expense for the years ended December 31, 2019 and 2018 was $1,711,369 and $1,867,001, respectively. During 2019, the Company transferred $3,261,259 from real estate held for investment to property and equipment. This transfer is shown as a non cash item on the consolidated statements of cash flows. See Note 20 for additional information regarding property and equipment acquired through acquisitions.
SECURITY NATIONAL FINANCIAL CORPORATION
7) Bank and Other Loans Payable
Bank and other loans payable are summarized as follows:
| | | December 31 | |
| | | 2019 | | | 2018 | |
| 2.25% above the monthly LIBOR rate plus 1/16th of the monthly LIBOR rate note payable in monthly principal payments of $13,167 plus interest, collateralized by real property with a book value of approximately $4,244,000, due September 2021. | | $ | 2,659,769 | | | $ | 2,817,775 | |
| | | | | | | | | |
| 4.27% fixed note payable in monthly installments of $53,881 including principal and interest, collateralized by shares of Security National Life Insurance Company stock, due December 2021. | | | 1,238,619 | | | | 1,817,905 | |
| | | | | | | | | |
| Prime rate note payable in monthly installments of $75,108 including principal and interest, collateralized by shares of Security National Life Insurance Company stock, due December 2024. | | | 4,000,000 | | | | - | |
| | | | | | | | | |
| 4.40% fixed note payable in monthly installments of $46,825 including principal and interest, collateralized by real property with a book value of approximately $12,923,000, due January 2026. | | | 7,247,651 | | | | 7,492,140 | |
| | | | | | | | | |
| 4.329% fixed note payable in monthly installments of $9,775 including principal and interest, collateralized by real property with a book value of approximately $3,261,000, due September 2025. | | | 1,896,450 | | | | 1,929,725 | |
| | | | | | | | | |
| 2.5% above the monthly LIBOR rate plus 1/16th of the monthly LIBOR rate construction loan payable in monthly principal payments of $113,000 plus interest, collateralized by real property with a book value of approximately $49,378,000, due August 2020. | | | 33,811,559 | | | | 30,796,861 | |
| | | | | | | | | |
| 4.7865% fixed interest only note payable in monthly installments, collateralized by real property with a book value of approximately $18,009,000, due June 2028. | | | 9,200,000 | | | | 9,200,000 | |
| | | | | | | | | |
| 1 month LIBOR rate plus 3% loan purchase agreement with a warehouse line availability of $100,000,000, matures June 2020. | | | 88,509,536 | | | | 60,438,156 | |
| | | | | | | | | |
| 1 month LIBOR rate plus 3% loan purchase agreement with a warehouse line availability of $100,000,000, matures September 2020. | | | 67,537,600 | | | | 25,680,649 | |
| | | | | | | | | |
| Other short-term borrowings (1) | | | 1,250,000 | | | | 47,250,000 | |
| | | | | | | | | |
| Finance lease liabilities | | | 153,439 | | | | - | |
| | | | | | | | | |
| Other loans payable | | | 67,989 | | | | 97,977 | |
| Total bank and other loans | | | 217,572,612 | | | | 187,521,188 | |
| | | | | | | | | |
| Less current installments | | | 192,985,602 | | | | 165,219,632 | |
| Bank and other loans, excluding current installments | | $ | 24,587,010 | | | $ | 22,301,556 | |
________
| (1) | Federal Home Loan Bank and Revolving Lines of Credit |
SECURITY NATIONAL FINANCIAL CORPORATION
Federal Home Loan Bank Membership
The Federal Home Loan Banks (“the FHLBs”) are a group of cooperatives that lending institutions use to finance housing and economic development in local communities. The Company is a member of the FHLB based in Des Moines, Iowa and based in Dallas, Texas. As a member of the FHLB, the Company is required to maintain a minimum investment in capital stock of the FHLB and may pledge collateral to the bank for advances of funds to be used in its operations.
Federal Home Loan Bank of Des Moines
At December 31, 2019, the amount available for borrowings from the FHLB of Des Moines was approximately $57,727,738, compared with $534,579 at December 31, 2018. United States Treasury fixed maturity securities with an estimated fair value of $59,877,900 at December 31, 2019 have been pledged at the FHLB of Des Moines as collateral for current and potential borrowings compared with $49,342,210 at December 31, 2018. At December 31, 2019, the Company had no outstanding FHLB borrowings. At December 31, 2019, the Company’s total investment in FHLB stock was $806,500 compared with $2,548,700 at December 31, 2018. The Company’s decreased investment in FHLB stock was a result of its decrease in short-term FHLB borrowings during 2019.
Federal Home Loan Bank of Dallas
The membership of the FHLB of Dallas was acquired with the acquisition of Kilpatrick Life Insurance Company. See Note 20 regarding this acquisition. At December 31, 2019, the Company’s total investment in FHLB stock was $87,800. The Company does not have any collateral pledged at the FHLB of Dallas or any outstanding borrowings.
Revolving Lines of Credit
The Company has a $2,000,000 revolving line-of-credit with a bank with interest payable at the prime rate minus .75%, secured by the capital stock of Security National Life and maturing September 30, 2020, renewable annually. At December 31, 2019, the Company was contingently liable under a standby letter of credit aggregating $625,405, to be used as collateral to cover any contingency related to additional risk assessments pertaining to the Company's captive insurance program. The Company does not expect any material losses to result from the issuance of the standby letter of credit. The standby letter of credit will draw on the line of credit if necessary. The Company does not expect any material losses to result from the issuance of the standby letter of credit because claims are not expected to exceed premiums paid. As of December 31, 2019, there were no amounts outstanding under the revolving line-of-credit.
The Company also has a $2,500,000 revolving line-of-credit with a bank with interest payable at the overnight LIBOR rate plus 2.25% maturing September 30, 2020. As of December 31, 2019, there was $1,250,000 outstanding under the revolving line-of-credit.
Debt Covenants for Mortgage Warehouse Lines of Credit
The Company, through its subsidiary SecurityNational Mortgage, has a $100,000,000 line of credit with Wells Fargo Bank N.A. The agreement charges interest at the 1-Month LIBOR rate plus 2.1% and matures on June 16, 2020. SecurityNational Mortgage is required to comply with covenants for adjusted tangible net worth, unrestricted cash balance, the ratio of indebtedness to adjusted tangible net worth, and the liquidity overhead coverage ratio, and a quarterly gross profit of at least $1.
The Company, through its subsidiary SecurityNational Mortgage, also uses a line of credit with Texas Capital Bank N.A. This agreement with the bank allows SecurityNational Mortgage to borrow up to $100,000,000 for the sole purpose of funding mortgage loans. SecurityNational Mortgage is currently approved to borrow $30,000,000 of the $100,000,000 available. The agreement charges interest at the 1-Month LIBOR rate plus 3% and matures on September 9, 2020. The Company is required to comply with covenants for adjusted tangible net worth, unrestricted cash balance, and minimum combined pre-tax income (excluding any changes in the fair value of mortgage servicing rights) of at least $1 on a rolling four-quarter basis.
SECURITY NATIONAL FINANCIAL CORPORATION
The agreements for both warehouse lines include cross default provisions in that a covenant violation under one agreement constitutes a covenant violation under the other agreement. As of December 31, 2019, the Company had approximately $67,538,000 and $88,510,000 outstanding on the Texas Capital Bank and Wells Fargo warehouse lines, respectively, and was in compliance with all debt covenants.
The following tabulation shows the combined maturities of bank and other loans payable:
| 2019 | | $ | 192,985,602 | |
| 2020 | | | 4,256,684 | |
| 2021 | | | 1,151,703 | |
| 2022 | | | 1,218,742 | |
| 2023 | | | 1,247,461 | |
| Thereafter | | | 16,712,420 | |
| Total | | $ | 217,572,612 | |
Interest expense in 2019 and 2018 was $7,386,688 and $6,956,707, respectively.
Interest paid in 2019 and 2018 was $7,284,078 and $6,878,048, respectively.
8) Cemetery Perpetual Care Trust Investments and Obligation and Restricted Assets
State law requires the Company to pay into endowment care trusts a portion of the proceeds from the sale of certain cemetery property interment rights for cemeteries that have established an endowment care trust. These endowment care trusts are defined as variable interest entities pursuant to GAAP. Also, management has determined that the Company is the primary beneficiary of these trusts, as it absorbs both a majority of the losses and returns associated with the trusts. The Company has consolidated cemetery endowment care trust investments with a corresponding amount recorded as Cemetery Perpetual Care Obligation in the accompanying consolidated balance sheets.
The components of the cemetery perpetual care investments and obligation are as follows:
| | | December 31 | |
| | | 2019 | | | 2018 | |
| Cash and cash equivalents | | $ | 1,306,740 | | | $ | 1,557,506 | |
| Fixed maturity securities, available for sale, at estimated fair value | | | 975,673 | | | | 990,390 | |
| Equity securities, at estimated fair value | | | 1,605,451 | | | | 483,353 | |
| Commerical mortgage loans held for investment | | | 524,000 | | | | - | |
| Real estate held for investment | | | - | | | | 1,304,620 | |
| Note receivables from Cottonwood Mortuary, Singing Hills | | | | | | | | |
| Cemetery and Memorial Estates eliminated in consolidation | | | 1,541,120 | | | | 1,606,155 | |
| Total cemetery perpetual care trust investments | | | 5,952,984 | | | | 5,942,024 | |
| Cemetery perpetual care obligation | | | (3,933,719 | ) | | | (3,821,979 | ) |
| Trust investments in excess of trust obligations | | $ | 2,019,265 | | | $ | 2,120,045 | |
The Company has also established certain restricted assets to provide for future merchandise and service obligations incurred in connection with its pre-need sales for its cemetery and mortuary segment.
Restricted cash also represents escrows held for borrowers and investors under servicing and appraisal agreements relating to mortgage loans, funds held by warehouse banks in accordance with loan purchase agreements and funds held in escrow for certain real estate construction development projects. Additionally, the Company elected to fund its medical benefit safe-harbor limit based on 35% of the qualified direct costs for the preceding year, and has included this amount as a component of restricted cash. These restricted cash items are for the Company’s life insurance and mortgage segments.
Restricted assets are summarized as follows:
| | | December 31 | |
| | | 2019 | | | 2018 | |
| Cash and cash equivalents (1) | | $ | 8,674,214 | | | $ | 7,179,225 | |
| Mutual funds, at estimated fair value | | | - | | | | 677,795 | |
| Fixed maturity securities, available for sale, at estimated fair value | | | 1,008,867 | | | | 1,258,397 | |
| Equity securities, at estimated fair value | | | 1,976,480 | | | | 66,878 | |
| Participating interests in mortgage loans held for investment with Security National Life | | | 2,275,756 | | | | 1,799,267 | |
| Total | | $ | 13,935,317 | | | $ | 10,981,562 | |
_________
| (1) | Including cash and cash equivalents of $7,170,092 and $5,668,580 as of December 31, 2019 and 2018, respectively, for the life insurance and mortgage segments. |
A surplus note receivable in the amount of $4,000,000 at December 31, 2019 and 2018, from Security National Life, was eliminated in consolidation.
See Notes 1 and 17 for additional information regarding restricted assets.
SECURITY NATIONAL FINANCIAL CORPORATION
9) Income Taxes
The Company’s income tax liability is summarized as follows:
| | | December 31 | |
| | | 2019 | | | 2018 | |
| Current | | $ | 1,410,153 | | | $ | 473,800 | |
| Deferred | | | 17,276,819 | | | | 15,649,198 | |
| Total | | $ | 18,686,972 | | | $ | 16,122,998 | |
Significant components of the Company’s deferred tax (assets) and liabilities are approximately as follows:
| | | December 31 | |
| | | 2019 | | | 2018 | |
| Assets | | | | | | |
| Future policy benefits | | $ | (12,450,229 | ) | | $ | (8,293,592 | ) |
| Loan loss reserve | | | (1,053,256 | ) | | | (938,496 | ) |
| Unearned premium | | | (760,556 | ) | | | (823,299 | ) |
| Available for sale securities | | | - | | | | (366,279 | ) |
| Net operating loss | | | (438,420 | ) | | | (593,272 | ) |
| Deferred compensation | | | (1,996,865 | ) | | | (1,677,118 | ) |
| Deposit obligations | | | (619,633 | ) | | | (610,769 | ) |
| Other | | | (1,020,718 | ) | | | (185,557 | ) |
| Less: Valuation allowance | | | 2,439,394 | | | | -
| |
| Total deferred tax assets | | | (15,900,283 | ) | | | (13,488,382 | ) |
| | | | | | | | | |
| Liabilities | | | | | | | | |
| Deferred policy acquisition costs | | | 15,536,717 | | | | 15,255,960 | |
| Basis difference in property and equipment | | | 3,638,512 | | | | 4,309,162 | |
| Value of business acquired | | | 2,074,096 | | | | 1,210,690 | |
| Deferred gains | | | 5,169,104 | | | | 6,267,373 | |
| Trusts | | | 1,064,387 | | | | 1,064,387 | |
| Tax on unrealized appreciation | | | 5,694,286 | | | | 1,030,008 | |
| Total deferred tax liabilities | | | 33,177,102 | | | | 29,137,580 | |
| Net deferred tax liability | | $ | 17,276,819 | | | $ | 15,649,198 | |
The valuation allowance relates to differences between recorded deferred tax assets and liabilities and ultimate anticipated realization. For the year ended December 31, 2019, the Company has recorded a valuation allowance related to Kilpatrick Life Insurance Company that was acquired in December 2019. See Note 20 regarding the acquisition.
The Company paid $4,861,318 and $5,701,565 in income taxes for the years ended December 31, 2019 and 2018, respectively.
SECURITY NATIONAL FINANCIAL CORPORATION
The Company’s income tax expense is summarized as follows for the years ended December 31:
| | | 2019 | | | 2018 | |
| Current | | | | | | |
| Federal | | $ | 4,404,041 | | | $ | 6,933,145 | |
| State | | | 504,272 | | | | 166,567 | |
| | | | 4,908,313 | | | | 7,099,712 | |
| Deferred | | | | | | | | |
| Federal | | | (1,551,725 | ) | | | (1,838,947 | ) |
| State | | | (306,172 | ) | | | (766,454 | ) |
| | | | (1,857,897 | ) | | | (2,605,401 | ) |
| | | | | | | | | |
| Total | | $ | 3,050,416 | | | $ | 4,494,311 | |
The reconciliation of income tax expense at the U.S. federal statutory rates is as follows:
| | | 2019 | | | 2018 | |
| Computed expense at statutory rate | | $ | 2,928,226 | | | $ | 5,497,882 | |
| State tax expense, net of federal tax benefit | | | 156,499 | | | | (473,911 | ) |
| Change in valuation allowance | | | 194,364 | | | | - | |
| Other, net | | | (228,673 | ) | | | (529,660 | ) |
| Income tax expense | | $ | 3,050,416 | | | $ | 4,494,311 | |
The Company’s overall effective tax rate for the years ended December 31, 2019 and 2018 was 21.9% and 17.2%, respectively. The Company’s effective tax rates differ from the U.S. federal statutory corporate income tax rate of 21% partially due to its provision for state income taxes and an increase to the valuation allowance related to Kilpatrick Life Insurance Company that increased the effective income tax rate when compared to the prior year.
At December 31, 2019, the Company had no significant unrecognized tax benefits. As of December 31, 2019, the Company does not expect any material changes to the estimated amount of unrecognized tax benefits in the next twelve months. Federal and state income tax returns for 2016 through 2019 are subject to examination by taxing authorities.
Net Operating Losses and Tax Credit Carryforwards:
Year of Expiration | | | |
| 2020 | | $ | 114,601 | |
| 2021 | | | 17,101 | |
| 2022 | | | - | |
| 2023 | | | - | |
| 2024 | | | - | |
| Thereafter up through 2037 | | | 1,701,126 | |
| | | | | |
| | | $ | 1,832,828 | |
10) Reinsurance, Commitments and Contingencies
The Company follows the procedure of reinsuring risks in excess of a specified limit, which ranged from $25,000 to $100,000 during the years 2019 and 2018. The Company is liable for these amounts in the event such reinsurers are unable to pay their portion of the claims. The Company has also assumed insurance from other companies having insurance in force amounting to approximately $99,000,000 and approximately $103,000,000 at December 31, 2019 and 2018, respectively.
Mortgage Loan Loss Settlements
Future loan losses can be extremely difficult to estimate. However, the Company believes that its reserve methodology and its current practice of property preservation allow it to estimate potential losses on loans sold. The estimated liability for indemnification losses is included in other liabilities and accrued expenses and, as of December 31, 2019 and 2018, the balances were $4,046,000 and $3,605,000, respectively.
During the period from 2006 to 2019, over $60 million has been reserved for loan losses. A large majority of that reserve has been used to settle investor claims or potential claims on alternative documentation loans originated between 2005 to 2007. As the time since the origination of these loans has increased, estimating the potential of a claim being made, when it might be made, the validity of the claim, and the amount of such claim becomes more difficult. However, because some loans remain from the original 2005 to 2007 time period that have not been settled, the Company still includes a reserve for the potential of future loan demands and potential settlements of such loans. As of December 31, 2019, the loan loss reserve includes an estimate of approximately $3,000,000 for remaining losses still to be settled on loans from this time period with a general reserve for more recent loan production. Thus, the Company believes that the final loan loss reserve as of December 31, 2019, represents its best estimate for adequate loss reserves on loans sold.
Mortgage Loan Loss Litigation
Lehman Brothers Holdings Litigation – Delaware and New York
In January 2014, Lehman Brothers Holdings Inc. (“Lehman Holdings”) entered into a settlement with the Federal National Mortgage Association (Fannie Mae) concerning the mortgage loan claims that Fannie Mae had asserted against Lehman Holdings, which were based on alleged breaches of certain representations and warranties by Lehman Holdings in the mortgage loans it had sold to Fannie Mae. Lehman Holdings had acquired these loans from Aurora Bank, FSB, formerly known as Lehman Brothers Bank, FSB, which in turn purchased the loans from residential mortgage loan originators, including SecurityNational Mortgage Company (“SecurityNational Mortgage”). A settlement based on similar circumstances was entered into between Lehman Holdings and the Federal Home Loan Mortgage Corporation (Freddie Mac) in February 2014.
Lehman Holdings filed a motion in May 2014 with the U.S. Bankruptcy Court of the Southern District of New York to require the mortgage loan originators, including SecurityNational Mortgage, to engage in non-binding mediations of the alleged indemnification claims against the mortgage loan originators relative to the Fannie Mae and Freddie Mac settlements with Lehman Holdings. The mediation was not successful in resolving any issues between SecurityNational Mortgage and Lehman Holdings.
On January 26, 2016, SecurityNational Mortgage filed a declaratory judgment action against Lehman Holdings in the Superior Court for the State of Delaware. In the Delaware action, SecurityNational Mortgage asserted its right to obtain a declaration of rights in that there are allegedly millions of dollars in dispute with Lehman Holdings pertaining to approximately 136 mortgage loans. SecurityNational Mortgage sought a declaratory judgment as to its rights as it contends that it has no liability to Lehman Holdings as a result of Lehman Holdings’ settlements with Fannie Mae and Freddie Mac. Lehman Holdings filed a motion in the Delaware court seeking to stay or dismiss the declaratory judgment action. On August 24, 2016, the Court ruled that it would exercise its discretion to decline jurisdiction over the action and granted Lehman Holdings’ motion to dismiss.
SECURITY NATIONAL FINANCIAL CORPORATION
On February 3, 2016, Lehman Holdings filed an adversary proceeding against approximately 150 mortgage loan originators, including SecurityNational Mortgage, in the U.S. Bankruptcy Court of the Southern District of New York seeking a declaration of rights similar in nature to the declaration that SecurityNational Mortgage sought in its Delaware lawsuit, and for damages relating to the alleged obligations of the defendants under indemnification provisions of the alleged agreements, in amounts to be determined at trial, including interest, attorneys’ fees and costs incurred by Lehman Holdings in enforcing the obligations of the defendants. No response was required to be filed relative to the Complaint or the Amended Complaint dated March 7, 2016. A Case Management Order was entered on November 1, 2016.
On December 27, 2016, pursuant to the Case Management Order, Lehman Holdings filed a Second Amended Complaint against SecurityNational Mortgage, which eliminates the declaratory judgment claim but retains a similar claim for damages as in the Complaint. Many of the defendants, including SecurityNational Mortgage, filed a joint motion in the case asserting that the Bankruptcy Court does not have subject matter jurisdiction concerning the matter and that venue is improper. Lehman Holdings’ response memorandum was filed on May 31, 2017 and a reply memorandum of the defendants filing the motion was filed on July 14, 2017. A hearing on the motion was held on June 12, 2018.
On August 13, 2018, the Court issued its Memorandum Decision and Order (“Decision”) denying the motion. On August 27, 2018, a number of the defendants, including SecurityNational Mortgage, filed a joint motion with the United States District Court (Case No. 18-mc-00392(VEC)) requesting that the Bankruptcy Court’s Decision be treated as findings of fact and conclusions of law, and for the District Court to review the Decision de novo as to jurisdiction. Included with the motion were proposed objections to the Bankruptcy Court’s Decision. On September 18, 2018, Lehman Holdings filed its response to the joint motion, and defendants’ reply was filed on October 2, 2018.
On September 17, 2018, certain defendants, including SecurityNational Mortgage, also filed a notice of appeal, and thereafter a motion for leave to file an interlocutory appeal as to the Bankruptcy Court’s Decision pertaining to jurisdiction and improper venue as a “protective” appeal should the District Court decide not to treat the Decision as findings of fact and conclusions of law. Separately, certain other defendants also filed a notice of appeal and motion for leave to file an interlocutory appeal with respect to the Bankruptcy Court’s Decision concerning improper venue. Lehman Holdings filed its response on October 22, 2018, and defendants filed a joint reply to Lehman Holdings’ response on November 26, 2018. The motions to file appeals were consolidated before Valerie Caproni, U.S. District Court Judge, Case No. 18-cv-08986 (VEC). Case No. 18-mc-00392 (VEC) was also before Judge Caproni.
On October 1, 2018, Lehman Holdings filed a motion for leave to file Third Amended Complaints against numerous defendants including SecurityNational Mortgage. In addition to the Fannie Mae and Freddie Mac related loans, the amendments and supplements include additional mortgage loans sold to Lehman Holdings that were packaged for securitization (“RMBS loans”). The RMBS loans had allegedly been sold by defendants to Lehman Bank that, in turn, sold them to Lehman Holdings. The allegations pertaining to the RMBS loans include, e.g., purported breaches of representations and warranties made to the securitization trusts by Lehman Holdings. Lehman Holdings asserts that it made representations and warranties purportedly based in part by representations and warranties made to Lehman Bank by loan originators, including SecurityNational Mortgage.
On May 8, 2019, Judge Caproni issued her Opinion and Order denying the motion for an interlocutory appeal of the bankruptcy court’s ruling relative to jurisdiction and venue. Further, the judge denied the motion for immediate de novo review of the bankruptcy court’s ruling indicating that de novo review can be left for the future.
The alleged RMBS loans in dispute with SecurityNational Mortgage allegedly involve millions of dollars pertaining to approximately 577 mortgage loans in addition to the Fannie Mae and Freddie Mac related loans. Lehman Holdings also moved the Court to simultaneously allow alternative dispute resolution procedures to take place including potential mediation. Over objections, at a hearing on October 29, 2018, the Court granted Lehman Holdings’ motion to amend or supplement its complaints adding the RMBS loans, and also to mandate alternative dispute resolution procedures affecting many defendants, including SecurityNational Mortgage.
SECURITY NATIONAL FINANCIAL CORPORATION
Instead of filing a Third Amended Complaint to include the RMBS loans referenced above, Lehman Holdings filed the matter against SecurityNational Mortgage as a new complaint ("RMBS Complaint") (United States Bankruptcy Court, Southern District of New York, Adversary Proceeding 18-01819) pertaining to the approximately 577 RMBS loans, in addition to the Second Amended Complaint already on file. The RMBS Complaint seeks alleged damages relating to obligations under alleged contractual indemnification provisions in an amount to be determined at trial, interest, costs and expenses incurred by LBHI in enforcing alleged obligations, including attorneys' fees and costs and any expert witness fees incurred in litigation; and such other relief as the Court deems just and proper. SecurityNational Mortgage denies any liability to Lehman Holdings and intends to vigorously protect and defend its position.
In response to a Court order, certain defendants referenced in the Second Amended Complaint and the RMBS Complaints negotiated with Lehman Holdings concerning an amended case management order pertaining to certain case procedures and management for both lawsuits including, but not limited to, timing for filing motions and answering the complaints, and provisions concerning discovery such as document production, taking depositions, and use of experts. At a hearing held on March 7, 2019, the Court considered differences of the parties as to the content of an amended case management order, and thereafter signed an amended case management order dated March 13, 2019. SecurityNational Mortgage filed an answer and amended answer in the Fannie Mae and Freddie Mac case, and in the RMBS case. Discovery is in process.
Lehman Holdings sent an Indemnification Alternative Dispute Resolution Notice to SecurityNational Mortgage dated August 1, 2019. SecurityNational Mortgage sent its Statement of Position to Lehman Brothers Holdings dated September 3, 2019 in response to the notice. Thereafter, Lehman Holdings sent its Reply dated October 2, 2019 to SecurityNational Mortgage. On January 9, 2020, SecurityNational Mortgage submitted further information to the mediator. Mediation was set to take place on January 23, 2020 in New York.
On January 15, 2020, SecurityNational Mortgage filed a motion to dismiss Lehman Holdings’ RMBS action in the Bankruptcy Court for lack of subject matter jurisdiction and standing. It was not filed in the Bankruptcy Court but in the United States District Court for the Southern District of New York. The District Court referred the matter to a magistrate judge for general pretrial, which “includes scheduling, discovery, non-dispositive pretrial motions, and settlement,” as well as for “a Report and Recommendation” as to the pending motion. The final disposition of the motion will be with the District Court judge. Lehman Holdings has asked the District Court to transfer the case to one of two other judges allegedly due to related matters. No action has been taken by the District Court on the request.
However, a briefing schedule is in place before the original assigned magistrate judge. Lehman Holdings’ response brief to SecurityNational Mortgage’s motion is due March 6, 2020, and SecurityNational Mortgage’s reply brief is due April 6, 2020. In view of SecurityNational Mortgage’s motion to dismiss, Lehman Holdings requested that the mediation set for January 23, 2020 be adjourned “pending resolution of your [SecurityNational Mortgage] motion by the court.” On January 17, 2020, the mediator adjourned the scheduled mediation without a date.
Non-Cancelable Leases
The Company leases office space and equipment under various non-cancelable agreements. See Note 24 regarding leases.
Other Contingencies and Commitments
The Company has entered into commitments to fund construction and land development loans and has also provided financing for land acquisition and development. As of December 31, 2019, the Company’s commitments were approximately $123,601,000, for these loans of which $90,566,000 had been funded. The Company will advance funds once the work has been completed and an independent inspection is made. The maximum loan commitment ranges between 50% and 80% of appraised value. The Company receives fees and interest for these loans and the interest rate is generally fixed 5.50% to 8.00% per annum. Maturities range between six and eighteen months.
SECURITY NATIONAL FINANCIAL CORPORATION
The Company belongs to a captive insurance group for certain casualty insurance, worker compensation and liability programs. Insurance reserves are maintained relative to these programs. The level of exposure from catastrophic events is limited by the purchase of stop-loss and aggregate liability reinsurance coverage. When estimating the insurance liabilities and related reserves, the captive insurance management considers a number of factors, which include historical claims experience, demographic factors, severity factors and valuations provided by independent third-party actuaries. If actual claims or adverse development of loss reserves occurs and exceed these estimates, additional reserves may be required. The estimation process contains uncertainty since captive insurance management must use judgment to estimate the ultimate cost that will be incurred to settle reported claims and unreported claims for incidents incurred but not reported as of the balance sheet date.
The Company is a defendant in various other legal actions arising from the normal conduct of business. Management believes that none of the actions will have a material effect on the Company’s financial position or results of operations. Based on management’s assessment and legal counsel’s representations concerning the likelihood of unfavorable outcomes, no amounts have been accrued for the above claims in the consolidated financial statements.
The Company is not a party to any other material legal proceedings outside the ordinary course of business or to any other legal proceedings, which, if adversely determined, would have a material adverse effect on its financial condition or results of operations.
11) Retirement Plans
The Company and its subsidiaries have a noncontributory Employee Stock Ownership Plan (“ESOP”) for all eligible employees. Eligible employees are primarily those with more than one year of service, who work in excess of 1,000 hours per year. Contributions, which may be in cash or stock of the Company, are determined annually by the Board of Directors.
The Company’s contributions are allocated to eligible employees based on the ratio of each eligible employee’s compensation to total compensation for all eligible employees during each year. The Company did not make any contributions for the years ended December 31, 2019 and 2018. On November 25, 2019, the Company distributed a “Notice of Intent to Terminate” the ESOP Plan to all current plan participants. The Company also filed Form 5310 “Application for Determination for Terminating Plan”, with the IRS on December 6, 2019. The Company is awaiting approval of its application from the IRS prior to its final distribution of the ESOP Plan assets to the participants. At December 31, 2019, the ESOP held 495,618 shares of Class A and 307,491 shares of Class C common stock of the Company. All shares held by the ESOP have been allocated to the participating employees and all shares held by the ESOP are considered outstanding for purposes of computing earnings per share.
The Company has three 401(k) savings plans covering all eligible employees, as defined above, which includes employer participation in accordance with the provisions of Section 401(k) of the Internal Revenue Code. The plans allow participants to make pretax contributions up to a maximum of $19,000 and $18,500 for the years 2019 and 2018, respectively or the statutory limits.
Beginning January 1, 2008, the Company elected to be a “Safe Harbor” Plan for its matching 401(k) contributions. The Company matched 100% of up to 3% of an employee’s total annual compensation and matched 50% of 4% to 5% of an employee’s annual compensation. The match was in Company stock. The Company’s contribution for the years ended December 31, 2019 and 2018 was $695,560 and $1,480,913, respectively under the “Safe Harbor” plan.
In 2001, the Company’s Board of Directors adopted a Non-Qualified Deferred Compensation Plan, and this plan was amended in 2005. Under the terms of the Plan, the Company will provide deferred compensation for a select group of management or highly compensated employees, within the meaning of Sections 201(2), 301(a)(3) and 401(a)(1) of the Employee Retirement Income Security Act of 1974, as amended. The Board has appointed a Committee of the Company to be the Plan Administrator and to determine the employees who are eligible to participate in the plan. The employees who participate may elect to defer a portion of their compensation into the plan. The Company may contribute into the plan at the discretion of the Company’s Board of Directors. The Company did not make any contributions for 2019 and 2018.
Effective December 4, 2018, the Board members approved a motion to extend Mr. Quist’s employment agreement, dated December 4, 2012, for an additional four-year term ending December 2022. In the event of disability, Mr. Quist’s salary would be continued for up to five years at 75% of its current level of compensation.
In the event of a sale or merger of the Company and Mr. Quist is not retained in his current position, the Company would be obligated to continue paying Mr. Quist’s current compensation and benefits for seven years following the merger or sale. The agreement further provides that Mr. Quist is entitled to receive annual retirement benefits beginning (i) one month from the date of his retirement (to commence no sooner than age 65), (ii) five years following complete disability, or (iii) upon termination of his employment without cause. These retirement benefits are to be paid for a period of twenty years in annual installments in the amount equal to 75% of his then current level of compensation. In the event that Mr. Quist dies prior to receiving all retirement benefits thereunder, the remaining benefits are to be paid to his heirs. The Company expensed $660,000 and $660,000 during the years ended December 31, 2019 and 2018, respectively, to cover the present value of anticipated retirement benefits under the employment agreement. The liability accrued was $5,722,837 and $5,191,670 as of December 31, 2019 and 2018, respectively.
The Company, through its wholly owned subsidiary, SecurityNational Mortgage, also has an employment agreement with its former Vice President of Mortgage Operations and President of SecurityNational Mortgage, who retired from the Company on December 31, 2015. Under the terms of the employment agreement, this individual is entitled to receive retirement benefits from the Company for a period of ten years in an amount equal to 50% of his rate of compensation at the time of his retirement, which was $267,685 for the year ended December 31, 2015. Such retirement payments are paid monthly during the ten-year period. In the event that this individual dies prior to receiving all of his retirement benefits under his employment agreement, the remaining benefits will be made to his heirs. The company paid $133,843 and $133,843 in retirement compensation to this individual during the years ended December 31, 2019 and 2018, respectively. The liability accrued was $803,055 and $841,591 as of December 31, 2019 and 2018, respectively and is included in Other liabilities and accrued expenses on the consolidated balance sheets.
SECURITY NATIONAL FINANCIAL CORPORATION
12) Capital Stock
The Company has one class of preferred stock of $1.00 par value, 5,000,000 shares authorized, of which none are issued. The preferred stock is non-voting.
The Company has two classes of common stock with shares outstanding, Class A common shares and Class C common shares. Class C shares have 10 votes per share on all matters except for the election of one third of the directors who are elected solely by the Class A shares. Class C shares are convertible into Class A shares at any time on a one to one ratio. The decrease in treasury stock was the result of treasury stock being used to fund the company’s 401(k) Plans.
Stockholders of both Class A and Class C common stock have received 5% stock dividends in the years 1990 through 2019, as authorized by the Company’s Board of Directors.
The Company has Class B common stock of $1.00 par value, 5,000,000 shares authorized, of which none are issued. Class B shares are non-voting stock except to any proposed amendment to the Articles of Incorporation which would affect Class B common stock.
The following table summarizes the activity in shares of capital stock for the two-year period ended December 31, 2019:
| | | Class A | | | Class C | |
| Outstanding shares at December 31, 2017 | | | 14,535,577 | | | | 2,089,374 | |
| | | | | | | | | |
| Exercise of stock options | | | 38,473 | | | | - | |
| Stock dividends | | | 730,560 | | | | 104,457 | |
| Conversion of Class C to Class A | | | 188 | | | | (188 | ) |
| | | | | | | | | |
| Outstanding shares at December 31, 2018 | | | 15,304,798 | | | | 2,193,643 | |
| | | | | | | | | |
| Exercise of stock options | | | 32,517 | | | | 191,443 | |
| Stock dividends | | | 767,178 | | | | 119,087 | |
| Conversion of Class C to Class A | | | 3,286 | | | | (3,286 | ) |
| | | | | | | | | |
| Outstanding shares at December 31, 2019 | | | 16,107,779 | | | | 2,500,887 | |
Earnings per share amounts have been retroactively adjusted for the effect of annual stock dividends. In accordance with GAAP, the basic and diluted earnings per share amounts were calculated as follows:
| | | 2019 | | | 2018 | |
| Numerator: | | | | | | |
| Net earnings | | $ | 10,893,519 | | | $ | 21,686,079 | |
| | | | | | | | | |
| Denominator: | | | | | | | | |
| | | | | | | | |
Denominator for basic earnings per share-weighted-average shares | | | 18,104,681 | | | | 17,968,062 | |
| | | | | | | | | |
| Effect of dilutive securities | | | | | | | | |
| Employee stock options | | | 124,435 | | | | 220,603 | |
| Dilutive potential common shares | | | 124,435 | | | | 220,603 | |
| | | | | | | | |
Denominator for diluted earnings per share-adjusted weighted-average shares and assumed conversions | | | 18,229,116 | | | | 18,188,665 | |
| | | | | | | | | |
| Basic earnings per share | | $ | 0.60 | | | $ | 1.21 | |
| Diluted earnings per share | | $ | 0.60 | | | $ | 1.19 | |
For the years ended December 31, 2019 and 2018, there were 382,289 and 862,915 of anti-dilutive employee stock option shares, respectively, that were not included in the computation of diluted net earnings per common share as their effect would be anti-dilutive.
SECURITY NATIONAL FINANCIAL CORPORATION
13) Stock Compensation Plans
The Company has two fixed option plans (the “2013 Plan” and the “2014 Director Plan”). Compensation expense for options issued of $256,996 and $237,123 has been recognized under these plans for the years ended December 31, 2019 and 2018, respectively, and is included in personnel expenses on the consolidated statements of earnings. As of December 31, 2019, the total unrecognized compensation expense related to the options issued in December 2019 was $230,446, which is expected to be recognized over the vesting period of one year.
The fair value of each option granted is estimated on the date of grant using the Black Scholes Option Pricing Model. The Company estimates the expected life of the options using the simplified method. Future volatility is estimated based upon the weighted historical volatility of the Company’s Class A common stock over a period equal to the expected life of the options. The risk-free interest rate for the expected life of the options is based upon the Federal Reserve Board’s daily interest rates in effect at the time of the grant.
The following table summarizes the assumptions used in estimating the fair value of each option granted along with the weighted-average fair value of the options granted:
| | | | | | | Assumptions | |
| Grant Date | Plan | | Weighted-Average Fair Value of Each Option | | | Expected Dividend Yield | | | Underlying stock FMV | | | Weighted-Average Volatility | | | Weighted-Average
Risk-Free
Interest Rate | | | Weighted-Average Expected Life (years) | |
| December 6, 2019 | All Plans | | $ | 0.96 | | | | 5 | % | | $ | 5.19 | | | | 32.79 | % | | | 1.64 | % | | | 4.83 | |
| | | | | | | | | | | | | | | | | | | | | | | | | | |
| January 17, 2019 | All Plans | | $ | 1.12 | | | | 5 | % | | $ | 4.98 | | | | 36.04 | % | | | 2.56 | % | | | 5.31 | |
| | | | | | | | | | | | | | | | | | | | | | | | | | |
| November 30, 2018 | All Plans | | $ | 1.12 | | | | 5 | % | | $ | 4.91 | | | | 34.61 | % | | | 2.86 | % | | | 4.56 | |
| | | Number of
Class A Shares | | | Weighted Average Exercise Price | | | Number of
Class C Shares | | | Weighted Average Exercise Price | |
| Outstanding at January 1, 2018 | | | 880,426 | | | $ | 4.35 | | | | 523,603 | | | $ | 5.24 | |
| Adjustment for the effect of stock dividends | | | 48,168 | | | | | | | | 27,491 | | | | | |
| Granted | | | 142,000 | | | | | | | | 90,000 | | | | | |
| Exercised | | | (42,211 | ) | | | | | | | - | | | | | |
| Cancelled | | | (17,109 | ) | | | | | | | (63,814 | ) | | | | |
| | | | | | | | | | | | | | | | | |
| Outstanding at December 31, 2018 | | | 1,011,274 | | | $ | 4.49 | | | | 577,280 | | | $ | 5.15 | |
| Adjustment for the effect of stock dividends | | | 51,018 | | | | | | | | 28,295 | | | | | |
| Granted | | | 81,000 | | | | | | | | 180,000 | | | | | |
| Exercised | | | (45,834 | ) | | | | | | | (191,443 | ) | | | | |
| Cancelled | | | (11,405 | ) | | | | | | | - | | | | | |
| | | | | | | | | | | | | | | | | |
| Outstanding at December 31, 2019 | | | 1,086,053 | | | $ | 4.41 | | | | 594,132 | | | $ | 5.36 | |
| | | | | | | | | | | | | | | | | |
| Exercisable at end of year | | | 1,002,603 | | | $ | 4.34 | | | | 405,132 | | | $ | 5.40 | |
| | | | | | | | | | | | | | | | | |
| Available options for future grant | | | 205,664 | | | | | | | | - | | | | | |
| | | | | | | | | | | | | | | | |
Weighted average contractual term of options outstanding at December 31, 2019 | | 5.62 years | | | | | | | 5.82 years | | | | | |
| | | | | | | | | | | | | | | | |
Weighted average contractual term of options exercisable at December 31, 2019 | | 5.26 years | | | | | | | 4.54 years | | | | | |
| | | | | | | | | | | | | | | | |
Aggregated intrinsic value of options outstanding at December 31, 2019 (1) | | $ | 1,291,602 | | | | | | | $ | 2,177,223 | | | | | |
| | | | | | | | | | | | | | | | |
Aggregated intrinsic value of options exercisable at December 31, 2019 (1) | | $ | 1,259,786 | | | | | | | $ | 159,028 | | | | | |
_________
| (1) | The Company used a stock price of $5.57 as of December 31, 2019 to derive intrinsic value. |
The total intrinsic value (which is the amount by which the fair value of the underlying stock exceeds the exercise price of an option on the exercise date) of stock options exercised during the years ended December 31, 2019 and 2018 was $271,220 and $123,154, respectively.
14)
Statutory Financial Information and Dividend Limitations
The Company’s insurance subsidiaries prepare their statutory-basis financial statements in conformity with accounting practices prescribed or permitted by the insurance department of the applicable state of domicile. Prescribed statutory accounting practices include a variety of publications of the NAIC, as well as state laws, regulations and general administrative rules. Permitted statutory accounting practices encompass all accounting practices not so prescribed.
All states require domiciled insurance companies to prepare statutory-basis financial statements in conformity with the NAIC Accounting Practices and Procedures Manual, subject to any deviations prescribed or permitted by the applicable insurance commissioner and/or director. Statutory accounting practices differ from GAAP primarily since they require charging policy acquisition and certain sales inducement costs to expense as incurred, establishing life insurance reserves based on different actuarial assumptions, and valuing certain investments and establishing deferred taxes on a different basis.
Statutory net income and capital and surplus of the Company’s insurance subsidiaries, determined in accordance with statutory accounting practices prescribed or permitted by insurance regulatory authorities are as follows:
| | | Statutory Net Income | | | Statutory Capital and Surplus | |
| | | 2019 | | | | | 2018 | | | 2019 | | | 2018 | |
| Amounts by insurance subsidiary: | | | | | | | | | | | | | | |
| Security National Life Insurance Company | | $ | 3,589,552 | | | | | $ | 17,963,528 | | | $ | 49,390,181 | | | $ | 47,184,064 | |
| Kilpatrick Life Insurance Company | | | 12,752,100 | | (1 | ) | | | - | | | | 15,208,071 | | | | - | |
| First Guaranty Insurance Company | | | 1,078,733 | | | | | | 1,042,683 | | | | 6,352,670 | | | | 5,786,369 | |
| Memorial Insurance Company of America | | | (107 | ) | | | | | 94 | | | | 1,088,559 | | | | 1,088,880 | |
| Southern Security Life Insurance Company, Inc. | | | 87 | | | | | | 68 | | | | 1,588,396 | | | | 1,586,915 | |
| Trans-Western Life Insurance Company | | | 3,773 | | | | | | 5,460 | | | | 512,163 | | | | 508,390 | |
| Total | | $ | 17,424,138 | | | | | $ | 19,011,833 | | | $ | 74,140,040 | | | $ | 56,154,618 | |
_________
| (1) | Includes 12 months even though Kilpatrick Life Insurance Company wasn't acquired by the Company until December 2019. |
The Utah, Arkansas, Louisiana, Mississippi and Texas Insurance Departments impose minimum risk-based capital (RBC) requirements that were developed by the NAIC on insurance enterprises. The formulas for determining the RBC specify various factors that are applied to financial balances or various levels of activity based on the perceived degree of risk. Regulatory compliance is determined by a ratio (the Ratio) of the enterprise’s regulatory total adjusted capital, as defined by the NAIC, to its authorized control level, as defined by the NAIC. Enterprises below specific trigger points or ratios are classified within certain levels, each of which requires specified corrective action. The life insurance subsidiaries each have a ratio that is greater than the first level of regulatory action as of December 31, 2019.
Generally, the net assets of the life insurance subsidiaries available for transfer to the Company are limited to the amounts of the life insurance subsidiaries net assets, as determined in accordance with statutory accounting practices, that exceed minimum statutory capital requirements. Additional requirements must be met depending on the state, and payments of such amounts as dividends are subject to approval by regulatory authorities.
Under the Utah Insurance Code, Security National Life Insurance Company is permitted to pay a stockholder dividend to the Company as long as the Company provides the Utah Insurance Commissioner (the “Utah Commissioner”) with at least 30 days notice and the aggregate amount of all such dividends in any 12 month period does not exceed the lesser of: (i) 10% of its surplus to policyholders as of the end of the immediately preceding calendar year, or (ii) net gain from operations, not including realized capital gains, for the immediately preceding calendar year, not including pro rata distributions of the Company’s own securities. In determining whether a dividend is extraordinary, the Company may include carryforward net income from the previous two calendar years, excluding realized capital gains less dividends paid in the second and immediately preceding calendar years. Security National Life Insurance Company will be permitted to pay a dividend to the Company in excess of the lesser of such two amounts only if it files notice of its intention to declare such a dividend and the amount thereof with the Utah Commissioner and the Utah Commissioner either approves the distribution of the dividend or does not disapprove the distribution within 30 days of its filing. In all cases, a dividend may not be paid that would reduce the insurer’s total adjusted capital below the insurer’s company action level risk-based capital, as defined for statutory reporting purposes. Amounts available to be paid as dividends in the next 12 months totals approximately $4,795,000.
Under the Louisiana Insurance Code, First Guaranty Insurance Company and Kilpatrick Life Insurance Company are permitted to pay a stockholder dividend to Security National Life as long as their capital has been (i) fully paid in cash, (ii) is unimpaired, (iii) has a surplus beyond its capital stock and (iv) has a surplus beyond its minimum required surplus. In 2018, First Guaranty Insurance Company paid to Security National Life a cash dividend of $500,000 and Kilpatrick Life Insurance Company paid a cash dividend of $3,000,000. Amounts available to be paid as dividends at December 31, 2019 totaled approximately $2,453,000 for First Guaranty Insurance Company and totaled approximately $11,508,000 for Kilpatrick Life Insurance Company.
15) Business Segment Information
Description of Products and Services by Segment
The Company has three reportable business segments: life insurance, cemetery and mortuary, and mortgage. The Company’s life insurance segment consists of life insurance premiums and operating expenses from the sale of insurance products sold by the Company’s independent agency force and net investment income derived from investing policyholder and segment surplus funds. The Company’s cemetery and mortuary segment consists of revenues and operating expenses from the sale of at-need cemetery and mortuary merchandise and services at its mortuaries and cemeteries, pre-need sales of cemetery spaces after collection of 10% or more of the purchase price and the net investment income from investing segment surplus funds. The Company’s mortgage segment consists of fee income and expenses from the originations of residential mortgage loans and interest earned and interest expenses from warehousing pre-sold loans before the funds are received from financial institutional investors.
Measurement of Segment Profit or Loss and Segment Assets
The accounting policies of the reportable segments are the same as those described in the Significant Accounting Principles. Intersegment revenues are recorded at cost plus an agreed upon intercompany profit, and are eliminated upon consolidation.
Factors Management Used to Identify the Enterprise’s Reportable Segments
The Company’s reportable segments are business units that are managed separately due to the different products provided and the need to report separately to the various regulatory jurisdictions. The Company regularly reviews the quantitative thresholds and other criteria to determine when other business segments may need to be reported.
SECURITY NATIONAL FINANCIAL CORPORATION
| | | 2019 | |
| | | Life | | | Cemetery/ | | | | | | Intercompany | | | | |
| | | Insurance | | | Mortuary | | | Mortgage | | | Eliminations | | | Consolidated | |
| Revenues: | | | | | | | | | | | | | | | |
| From external sources: | | | | | | | | | | | | | | | |
| Revenue from customers | | $ | 81,860,610 | | | $ | 15,296,235 | | | $ | 131,976,082 | | | $ | - | | | $ | 229,132,927 | |
| Net investment income | | | 41,610,831 | | | | 579,995 | | | | 828,647 | | | | - | | | | 43,019,473 | |
| Gains on investments and other assets | | | 138,330 | | �� | | 530,098 | | | | 59,939 | | | | - | | | | 728,367 | |
| Other revenues | | | 2,128,961 | | | | 95,197 | | | | 7,956,005 | | | | - | | | | 10,180,163 | |
| Intersegment revenues: | | | | | | | | | | | | | | | | | | | | |
| Net investment income | | | 4,455,034 | | | | 443,548 | | | | 508,637 | | | | (5,407,219 | ) | | | - | |
| Total revenues | | | 130,193,766 | | | | 16,945,073 | | | | 141,329,310 | | | | (5,407,219 | ) | | | 283,060,930 | |
| Expenses: | | | | | | | | | | | | | | | | | | | | |
| Death, surrenders and other policy benefits | | | 44,911,805 | | | | - | | | | - | | | | - | | | | 44,911,805 | |
| Increase in future policy benefits | | | 23,568,497 | | | | - | | | | - | | | | - | | | | 23,568,497 | |
| Amortization of deferred policy and pre-need acquisition costs and value of business acquired | | | 14,199,152 | | | | 435,425 | | | | - | | | | - | | | | 14,634,577 | |
| Selling, general and administrative expenses: | | | | | | | | | | | | | | | | | | | | |
| Commissions | | | 3,632,780 | | | | 1,084,079 | | | | 52,046,032 | | | | - | | | | 56,762,891 | |
| Personnel | | | 20,311,591 | | | | 5,177,810 | | | | 38,731,869 | | | | - | | | | 64,221,270 | |
| Advertising | | | 595,118 | | | | 368,173 | | | | 3,821,267 | | | | - | | | | 4,784,558 | |
| Rent and rent related | | | 451,380 | | | | 47,525 | | | | 6,556,551 | | | | - | | | | 7,055,456 | |
| Depreciation on property and equipment | | | 477,247 | | | | 428,633 | | | | 805,489 | | | | - | | | | 1,711,369 | |
| Cost related to funding mortgage loans | | | - | | | | - | | | | 6,278,954 | | | | - | | | | 6,278,954 | |
| Intersegment | | | 412,853 | | | | 180,594 | | | | 544,463 | | | | (1,137,910 | ) | | | - | |
| Other | | | 11,769,097 | | | | 3,241,023 | | | | 19,912,641 | | | | - | | | | 34,922,761 | |
| Interest expense: | | | | | | | | | | | | | | | | | | | | |
| Intersegment | | | 490,756 | | | | 154,615 | | | | 3,623,938 | | | | (4,269,309 | ) | | | - | |
| Other | | | 2,808,081 | | | | 288,768 | | | | 4,289,839 | | | | - | | | | 7,386,688 | |
| Costs of goods and services sold-mortuaries and cemeteries | | | - | | | | 2,878,169 | | | | - | | | | - | | | | 2,878,169 | |
| Total benefits and expenses | | | 123,628,357 | | | | 14,284,814 | | | | 136,611,043 | | | | (5,407,219 | ) | | | 269,116,995 | |
| Earnings before income taxes | | $ | 6,565,409 | | | $ | 2,660,259 | | | $ | 4,718,267 | | | $ | - | | | $ | 13,943,935 | |
| Income tax benefit (expense) | | | (1,085,848 | ) | | | (649,144 | ) | | | (1,315,424 | ) | | | - | | | | (3,050,416 | ) |
| Net earnings | | $ | 5,479,561 | | | $ | 2,011,115 | | | $ | 3,402,843 | | | $ | - | | | $ | 10,893,519 | |
| | | | | | | | | | | | | | | | | | | | | |
| Identifiable assets | | $ | 1,110,641,526 | | | $ | 81,014,182 | | | $ | 249,970,323 | | | $ | (110,701,544 | ) | | $ | 1,330,924,487 | |
| | | | | | | | | | | | | | | | | | | | | |
| Goodwill | | $ | 2,765,570 | | | $ | 754,018 | | | $ | - | | | $ | - | | | $ | 3,519,588 | |
| | | 2018 | |
| | | Life | | | Cemetery/ | | | | | | Intercompany | | | | |
| | | Insurance | | | Mortuary | | | Mortgage | | | Eliminations | | | Consolidated | |
| Revenues: | | | | | | | | | | | | | | | |
| From external sources: | | | | | | | | | | | | | | | |
| Revenue from customers | | $ | 75,928,910 | | | $ | 13,726,518 | | | $ | 116,185,853 | | | $ | - | | | $ | 205,841,281 | |
| Net investment income | | | 38,720,365 | | | | 283,343 | | | | 909,559 | | | | - | | | | 39,913,267 | |
| Gains on investments and other assets | | | 21,396,282 | | | | 2,301,342 | | | | 243,555 | | | | - | | | | 23,941,179 | |
| Other revenues | | | 1,636,901 | | | | 128,797 | | | | 8,157,302 | | | | - | | | | 9,923,000 | |
| Intersegment revenues: | | | | | | | | | | | | | | | | | | | | |
| Net investment income | | | 3,972,532 | | | | 429,312 | | | | 503,794 | | | | (4,905,638 | ) | | | - | |
| Total revenues | | | 141,654,990 | | | | 16,869,312 | | | | 126,000,063 | | | | (4,905,638 | ) | | | 279,618,727 | |
| Expenses: | | | | | | | | | | | | | | | | | | | | |
| Death, surrenders and other policy benefits | | | 39,185,087 | | | | - | | | | - | | | | - | | | | 39,185,087 | |
| Increase in future policy benefits | | | 24,332,088 | | | | - | | | | - | | | | - | | | | 24,332,088 | |
| Amortization of deferred policy and pre-need acquisition costs and value of business acquired | | | 11,270,579 | | | | 360,767 | | | | - | | | | - | | | | 11,631,346 | |
| Selling, general and administrative expenses: | | | | | | | | | | | | | | | | | | | | |
| Commissions | | | 3,242,745 | | | | 1,222,642 | | | | 45,825,965 | | | | - | | | | 50,291,352 | |
| Personnel | | | 18,489,063 | | | | 4,773,866 | | | | 44,106,023 | | | | - | | | | 67,368,952 | |
| Advertising | | | 566,154 | | | | 333,852 | | | | 3,702,585 | | | | - | | | | 4,602,591 | |
| Rent and rent related | | | 321,701 | | | | 33,138 | | | | 7,250,536 | | | | - | | | | 7,605,375 | |
| Depreciation on property and equipment | | | 400,686 | | | | 372,469 | | | | 1,093,846 | | | | - | | | | 1,867,001 | |
| Cost related to funding mortgage loans | | | - | | | | - | | | | 6,423,944 | | | | - | | | | 6,423,944 | |
| Intersegment | | | 402,213 | | | | 182,009 | | | | 531,370 | | | | (1,115,592 | ) | | | - | |
| Other | | | 10,094,626 | | | | 3,046,902 | | | | 17,873,471 | | | | - | | | | 31,014,999 | |
| Interest expense: | | | | | | | | | | | | | | | | | | | | |
| Intersegment | | | 481,587 | | | | 173,807 | | | | 3,134,652 | | | | (3,790,046 | ) | | | - | |
| Other | | | 2,744,841 | | | | 294,535 | | | | 3,917,331 | | | | - | | | | 6,956,707 | |
| Costs of goods and services sold-mortuaries and cemeteries | | | - | | | | 2,158,895 | | | | - | | | | - | | | | 2,158,895 | |
| Total benefits and expenses | | | 111,531,370 | | | | 12,952,882 | | | | 133,859,723 | | | | (4,905,638 | ) | | | 253,438,337 | |
| Earnings before income taxes | | $ | 30,123,620 | | | $ | 3,916,430 | | | $ | (7,859,660 | ) | | $ | - | | | $ | 26,180,390 | |
| Income tax benefit (expense) | | | (5,275,662 | ) | | | (946,820 | ) | | | 1,728,171 | | | | - | | | | (4,494,311 | ) |
| Net earnings | | $ | 24,847,958 | | | $ | 2,969,610 | | | $ | (6,131,489 | ) | | $ | - | | | $ | 21,686,079 | |
| | | | | | | | | | | | | | | | | | | | | |
| Identifiable assets | | $ | 928,251,387 | | | $ | 90,639,130 | | | $ | 159,680,649 | | | $ | (130,525,613 | ) | | $ | 1,048,045,553 | |
| | | | | | | | | | | | | | | | | | | | | |
| Goodwill | | $ | 2,765,570 | | | $ | - | | | $ | - | | | $ | - | | | $ | 2,765,570 | |
16) Related Party Transactions
The Company’s Board of Directors has a written procedure, which requires disclosure to the Board of any material interest or any affiliation on the part of any of its officers, directors or employees that is in conflict or may be in conflict with the interests of the Company. The Company and its Board of Directors is unaware of any related party transactions that require disclosure as of December 31, 2019.
17) Fair Value of Financial Instruments
GAAP defines fair value as the exchange price that would be received for an asset or paid to transfer a liability (an exit price) in the principal or most advantageous market for the asset or liability in an orderly transaction between market participants. GAAP also specifies a fair value hierarchy based upon the observability of inputs used in valuation techniques. Observable inputs (highest level) reflect market data obtained from independent sources, while unobservable inputs (lowest level) reflect internally developed market assumptions. Fair value measurements are classified under the following hierarchy:
Level 1: Financial assets and financial liabilities whose values are based on unadjusted quoted prices for identical assets or liabilities in an active market that the Company can access.
Level 2: Financial assets and financial liabilities whose values are based on the following:
| a) | Quoted prices for similar assets or liabilities in active markets; |
| | |
| b) | Quoted prices for identical or similar assets or liabilities in non-active markets; or |
| | |
| c) | Valuation models whose inputs are observable, directly or indirectly, for substantially the full term of the asset or liability. |
Level 3: Financial assets and financial liabilities whose values are based on prices or valuation techniques that require inputs that are both unobservable and significant to the overall fair value measurement. These inputs may reflect the Company’s estimates of the assumptions that market participants would use in valuing the financial assets and financial liabilities.
The Company utilizes a combination of third-party valuation service providers, brokers, and internal valuation models to determine fair value.
The following methods and assumptions were used by the Company in estimating the fair value disclosures related to significant financial instruments:
The items shown under Level 1 and Level 2 are valued as follows:
Fixed Maturity Securities Available for Sale: The fair values of fixed maturity securities are based on quoted market prices, when available. For fixed maturity securities not actively traded, fair values are estimated using values obtained from independent pricing services, or in the case of private placements (considered Level 3 investments), are estimated by discounting expected future cash flows using a current market value applicable to the coupon rate, credit and maturity of the investments.
Equity Securities: The fair values for equity securities are based on quoted market prices.
Loans Held for Sale: The Company elected the fair value option for loans held for sale. The fair value is based on quoted market prices, when available. When a quoted market price is not readily available, the Company uses the market price from its last sale of similar assets.
Restricted Assets: A portion of these assets include mutual funds, equity securities and fixed maturity securities that have quoted market prices that are used to determine fair value. Also included are cash and cash equivalents and participations in mortgage loans. The carrying amounts reported in the accompanying consolidated balance sheets for these financial instruments approximate their fair values due to their short-term nature.
Cemetery Perpetual Care Trust Investments: A portion of these assets include equity securities and fixed maturity securities that have quoted market prices that are used to determine fair value. Also included are cash and cash equivalents. The carrying amounts reported in the accompanying consolidated balance sheets for these financial instruments approximate their fair values due to their short-term nature
Loan Commitments and Forward Sale Commitments: The Company’s mortgage segment enters into loan commitments with potential borrowers and forward sale commitments to sell loans to third-party investors. The Company also uses a hedging strategy for these transactions. A loan commitment binds the Company to lend funds to a qualified borrower at a specified interest rate and within a specified period of time, generally up to 30 days after issuance of the loan commitment. Loan commitments are defined to be derivatives under GAAP and are recognized at fair value on the consolidated balance sheets with changes in their fair values recorded in current earnings.
The Company estimates the fair value of a loan commitment based on the change in estimated fair value of the underlying mortgage loan, quoted MBS prices, estimates of the fair value of mortgage servicing rights, and an estimate of the probability that the mortgage loan will fund within the terms of the commitment. The change in fair value of the underlying mortgage loan is measured from the date the loan commitment is issued. Following issuance, the value of a mortgage loan commitment can be either positive or negative depending upon the change in value of the underlying mortgage loans. Fallout rates and other factors from the Company’s recent historical data are used to estimate the quantity and value of mortgage loans that will fund within the terms of the commitments.
Call and Put Options: The Company uses quoted market prices to value its call and put options.
Additionally
, there were no transfers between Level 1 and Level 2 in the fair value hierarchy.
The items shown under Level 3 are valued as follows:
Impaired Mortgage Loans Held for Investment: The Company believes that the fair value of these nonperforming loans will approximate the unpaid principal balance expected to be recovered based on the fair value of the underlying collateral. For residential and commercial properties, the collateral value is estimated by obtaining an independent appraisal.
The appraisal typically considers area comparables and property condition as well as potential rental income that could be generated (particularly for commercial properties). For residential construction loans, the collateral is typically incomplete, so fair value is estimated as the replacement cost using data from a provider of building cost information to the real estate construction.
Impaired Real Estate Held for Investment:
The Company believes that in an orderly market, fair value will approximate the replacement cost of a home and the rental income provides a cash flow stream for investment analysis. The Company believes the highest and best use of the properties are as income producing assets since it is the Company’s intent to hold the properties as rental properties, matching the income from the investment in rental properties with the funds required for future estimated policy claims.
It should be noted that for replacement cost, when determining the fair value of real estate held for investment, the Company uses a provider of building cost information to the real estate construction industry. For the investment analysis, the Company used market data based upon its real estate operation experience and projected the present value of the net rental income over seven years. The Company also considers area comparables and property condition when determining fair value.
In addition to this analysis performed by the Company, the Company depreciates Real Estate Held for Investment. This depreciation reduces the book value of these properties and lessens the exposure to the Company from further deterioration in real estate values.
Mortgage Servicing Rights: The Company initially recognizes MSRs at their estimated fair values derived from the net cash flows associated with the servicing contracts, where the Company assumes the obligation to service the loan in the sale transaction.
SECURITY NATIONAL FINANCIAL CORPORATION
AND SUBSIDIARIES
Notes to Consolidated Financial Statements
Years Ended December 31, 2019 and 2018
17) Fair Value of Financial Instruments (Continued)
The following table summarizes Level 1, 2 and 3 financial assets and financial liabilities measured at fair value on a recurring basis by their classification in the consolidated balance sheet at December 31, 2019.
| | | Total | | | Quoted Prices in Active Markets for Identical Assets
(Level 1) | | | Significant Observable Inputs
(Level 2) | | | Significant Unobservable Inputs
(Level 3) | |
| Assets accounted for at fair value on a recurring basis | | | | | | | | | | | | |
| Fixed maturity securities available for sale | | $ | 355,977,820 | | | $ | - | | | $ | 352,761,438 | | | $ | 3,216,382 | |
| Equity securities | | | 7,271,165 | | | | 7,271,165 | | | | - | | | | - | |
| Loans held for sale | | | 213,457,632 | | | | - | | | | - | | | | 213,457,632 | |
| Restricted assets (1) | | | 1,008,867 | | | | - | | | | 1,008,867 | | | | - | |
| Restricted assets (2) | | | 1,976,480 | | | | 1,976,480 | | | | - | | | | - | |
| Cemetery perpetual care trust investments (1) | | | 975,673 | | | | - | | | | 975,673 | | | | - | |
| Cemetery perpetual care trust investments (2) | | | 1,605,451 | | | | 1,605,451 | | | | - | | | | - | |
| Derivatives - loan commitments (3) | | | 2,722,580 | | | | - | | | | - | | | | 2,722,580 | |
| Total assets accounted for at fair value on a recurring basis | | $ | 584,995,668 | | | $ | 10,853,096 | | | $ | 354,745,978 | | | $ | 219,396,594 | |
| | | | | | | | | | | | | | | | | |
| Liabilities accounted for at fair value on a recurring basis | | | | | | | | | | | | | | | | |
| Derivatives - call options (4) | | $ | (62,265 | ) | | $ | (62,265 | ) | | $ | - | | | $ | - | |
| Derivatives - put options (4) | | | (22,282 | ) | | | (22,282 | ) | | | - | | | | - | |
| Derivatives - loan commitments (4) | | | (231,347 | ) | | | - | | | | - | | | | (231,347 | ) |
| Total liabilities accounted for at fair value on a recurring basis | | $ | (315,894 | ) | | $ | (84,547 | ) | | $ | - | | | $ | (231,347 | ) |
__________
| (1) | Fixed maturity securities available for sale |
| (2) | Mutual funds and equity securities |
| (3) | Included in other assets on the consolidated balance sheets |
| (4) | Included in other liabilities and accrued expenses on the consolidated balance sheets |
For Level 3 assets and liabilities measured at fair value on a recurring basis as of December 31, 2019, the significant unobservable inputs used in the fair value measurements were as follows:
| | | Fair | | | Significant | | Range of Inputs | | | | |
| | | Value at | | Valuation | Unobservable | | Minimum | | | Maximum | | | Weighted | |
| | | 12/31/2019 | | Technique | Input(s) | | Value | | | Value | | | Average | |
| Loans held for sale | | $ | 213,457,632 | | Market approach | Investor contract pricing as a percentage of unpaid principal balance | | | 98.0 | % | | | 109.0 | % | | | 103.0 | % |
| | | | | | | | | | | | | | | | | | | |
| Derivatives - loan commitments (net) | | | 2,491,233 | | Market approach | Fall-out factor | | | 1.0 | % | | | 92.0 | % | | | 81.0 | % |
| | | | | | | Initial-Value | | | N/A | | | | N/A | | | | N/A | |
| | | | | | | Servicing | | 0 bps | | | 318 bps | | | 79 bps | |
| | | | | | | | | | | | | | | | | | | |
| Fixed maturity securities available for sale | | | 3,216,382 | | Broker quotes | Pricing quotes | | $ | 95.02 | | | $ | 115.80 | | | $ | 107.98 | |
SECURITY NATIONAL FINANCIAL CORPORATION
AND SUBSIDIARIES
Notes to Consolidated Financial Statements
Years Ended December 31, 2019 and 2018
17) Fair Value of Financial Instruments (Continued)
Following is a summary of changes in the consolidated balance sheet line items measured using level 3 inputs:
| | | Net Derivatives Loan Commitments | | | Loans Held for Sale | | | Fixed Maturity Securities Available for Sale | |
| | | | | | | | | | |
| Balance - December 31, 2018 | | $ | 1,591,816 | | | $ | 136,210,853 | | | $ | - | |
| Originations/purchases | | | - | | | | 2,606,839,175 | | | | - | |
| Sales | | | - | | | | (2,580,875,055 | ) | | | - | |
| Transfer to mortgage loans held for investment | | | - | | | | (31,881,851 | ) | | | - | |
| Transfer from fixed maturity securities held to maturity | | | - | | | | | | | | 3,216,382 | |
| Total gains (losses): | | | | | | | | | | | | |
| Included in earnings (1) | | | 899,417 | | | | 83,164,510 | | | | - | |
| | | | | | | | | | | | | |
| Balance - December 31, 2019 | | $ | 2,491,233 | | | $ | 213,457,632 | | | $ | 3,216,382 | |
___________
| (1) | As a component of mortgage fee income on the consolidated statements of earnings |
The following tables summarize Level 1, 2 and 3 financial assets and financial liabilities measured at fair value on a nonrecurring basis by their classification in the consolidated balance sheet at December 31, 2019.
| | | Total | | | Quoted Prices in Active Markets for Identical Assets
(Level 1) | | | Significant Observable Inputs
(Level 2) | | | Significant Unobservable Inputs
(Level 3) | |
| Assets accounted for at fair value on a nonrecurring basis | | | | | | | | | | | | |
| Impaired mortgage loans held for investment | | $ | 1,302,025 | | | $ | - | | | $ | - | | | $ | 1,302,025 | |
| Impaired real estate held for investment | | | 8,375,884 | | | | - | | | | - | | | | 8,375,884 | |
| Total assets accounted for at fair value on a nonrecurring basis | | $ | 9,677,909 | | | $ | - | | | $ | - | | | $ | 9,677,909 | |
SECURITY NATIONAL FINANCIAL CORPORATION
AND SUBSIDIARIES
Notes to Consolidated Financial Statements
Years Ended December 31, 2019 and 2018
17) Fair Value of Financial Instruments (Continued)
The following table summarizes Level 1, 2 and 3 financial assets and financial liabilities measured at fair value on a recurring basis by their classification in the consolidated balance sheet at December 31, 2018.
| | | Total | | | Quoted Prices in Active Markets for Identical Assets
(Level 1) | | | Significant Observable Inputs
(Level 2) | | | Significant Unobservable Inputs
(Level 3) | |
| Assets accounted for at fair value on a recurring basis | | | | | | | | | | | | |
| Equity securities | | $ | 5,558,611 | | | $ | 5,558,611 | | | $ | - | | | $ | - | |
| Loans held for sale | | | 136,210,853 | | | | - | | | | - | | | | 136,210,853 | |
| Restricted assets (1) | | | 744,673 | | | | 744,673 | | | | - | | | | - | |
| Cemetery perpetual care trust investments (1) | | | 483,353 | | | | 483,353 | | | | - | | | | - | |
| Derivatives - loan commitments (2) | | | 1,969,967 | | | | - | | | | - | | | | 1,969,967 | |
| Total assets accounted for at fair value on a recurring basis | | $ | 144,967,457 | | | $ | 6,786,637 | | | $ | - | | | $ | 138,180,820 | |
| | | | | | | | | | | | | | | | | |
| Liabilities accounted for at fair value on a recurring basis | | | | | | | | | | | | | | | | |
| Derivatives - call options (3) | | $ | (4,629 | ) | | $ | (4,629 | ) | | $ | - | | | $ | - | |
| Derivatives - put options (3) | | | (296,053 | ) | | | (296,053 | ) | | | - | | | | - | |
| Derivatives - loan commitments (3) | | | (378,151 | ) | | | - | | | | - | | | | (378,151 | ) |
| Total liabilities accounted for at fair value on a recurring basis | | $ | (678,833 | ) | | $ | (300,682 | ) | | $ | - | | | $ | (378,151 | ) |
__________
| (1) | Mutual funds and equity securities |
| (2) | Included in other assets on the consolidated balance sheets |
| (3) | Included in other liabilities and accrued expenses on the consolidated balance sheets |
Following is a summary of changes in the consolidated balance sheet line items measured using level 3 inputs:
| | | Net Derivatives Loan Commitments | | | Loans Held for Sale | |
| | | | | | | |
| Balance - December 31, 2017 | | $ | 1,996,589 | | | $ | 133,414,188 | |
| Originations | | | | | | | 2,194,607,543 | |
| Sales | | | | | | | (2,259,145,473 | ) |
| Transfer to mortgage loans held for investment | | | | | | | (10,827,797 | ) |
| Total gains (losses): | | | | | | | | |
| Included in earnings (1) | | | (404,773 | ) | | | 78,162,392 | |
| | | | | | | | | |
| Balance - December 31, 2018 | | $ | 1,591,816 | | | $ | 136,210,853 | |
_________
| (1) | As a component of mortgage fee income on the consolidated statements of earnings |
SECURITY NATIONAL FINANCIAL CORPORATION
AND SUBSIDIARIES
Notes to Consolidated Financial Statements
Years Ended December 31, 2019 and 2018
17) Fair Value of Financial Instruments (Continued)
The following tables summarize Level 1, 2 and 3 financial assets and financial liabilities measured at fair value on a nonrecurring basis by their classification in the consolidated balance sheet at December 31, 2018.
| | | Total | | | Quoted Prices in Active Markets for Identical Assets
(Level 1) | | | Significant Observable Inputs
(Level 2) | | | Significant Unobservable Inputs
(Level 3) | |
| Assets accounted for at fair value on a nonrecurring basis | | | | | | | | | | | | |
| Impaired mortgage loans held for investment | | $ | 1,253,302 | | | $ | - | | | $ | - | | | $ | 1,253,302 | |
| Impaired real estate held for investment | | | 1,611,384 | | | | - | | | | - | | | | 1,611,384 | |
| Total assets accounted for at fair value on a nonrecurring basis | | $ | 2,864,686 | | | $ | - | | | $ | - | | | $ | 2,864,686 | |
Fair Value of Financial Instruments Carried at Other Than Fair Value
ASC 825, Financial Instruments, requires disclosure of fair value information about financial instruments, whether or not recognized in the balance sheet, for which it is practicable to estimate that value.
Management uses its best judgment in estimating the fair value of the Company’s financial instruments; however, there are inherent limitations in any estimation technique. Therefore, for substantially all financial instruments, the fair value estimates presented herein are not necessarily indicative of the amounts the Company could have realized in a sales transaction at December 31, 2019 and 2018.
The carrying values and estimated fair values for such financial instruments, and their corresponding placement in the fair value hierarchy, are summarized as follows as of December 31, 2019:
| | | Carrying Value | | | Level 1 | | | Level 2 | | | Level 3 | | | Total Estimated Fair Value | |
| Assets | | | | | | | | | | | | | | | |
| Mortgage loans held for investment | | | | | | | | | | | | | | | |
| Residential | | $ | 110,253,678 | | | $ | - | | | $ | - | | | $ | 115,320,638 | | | $ | 115,320,638 | |
| Residential construction | | | 88,651,967 | | | | - | | | | - | | | | 88,651,967 | | | | 88,651,967 | |
| Commercial | | | 37,788,901 | | | | - | | | | - | | | | 39,289,462 | | | | 39,289,462 | |
| Mortgage loans held for investment, net | | $ | 236,694,546 | | | $ | - | | | $ | - | | | $ | 243,262,067 | | | $ | 243,262,067 | |
| Policy loans | | | 14,762,805 | | | | - | | | | - | | | | 14,762,805 | | | | 14,762,805 | |
| Insurance assignments, net (1) | | | 39,614,939 | | | | - | | | | - | | | | 39,614,939 | | | | 39,614,939 | |
| Restricted assets (2) | | | 2,275,756 | | | | - | | | | - | | | | 2,289,679 | | | | 2,289,679 | |
| Cemetery perpetual care trust investments (2) | | | 524,000 | | | | - | | | | - | | | | 536,553 | | | | 536,553 | |
| Mortgage servicing rights, net | | | 17,155,529 | | | | - | | | | - | | | | 22,784,571 | | | | 22,784,571 | |
| | | | | | | | | | | | | | | | | | | | | |
| Liabilities | | | | | | | | | | | | | | | | | | | | |
| Bank and other loans payable | | $ | (217,572,612 | ) | | $ | - | | | $ | - | | | $ | (217,572,612 | ) | | $ | (217,572,612 | ) |
| Policyholder account balances (3) | | | (45,154,180 | ) | | | - | | | | - | | | | (41,828,469 | ) | | | (41,828,469 | ) |
| Future policy benefits - annuities (3) | | | (113,579,830 | ) | | | - | | | | - | | | | (117,304,614 | ) | | | (117,304,614 | ) |
_________
| (1) | Included in other investments and policy loans on the consolidated balance sheets |
| (2) | Mortgage loans held for investment |
| (3) | Included in future policy benefits and unpaid claims on the consolidated balance sheets |
SECURITY NATIONAL FINANCIAL CORPORATION
AND SUBSIDIARIES
Notes to Consolidated Financial Statements
Years Ended December 31, 2019 and 2018
17) Fair Value of Financial Instruments (Continued)
The carrying values and estimated fair values for such financial instruments, and their corresponding placement in the fair value hierarchy, are summarized as follows as of December 31, 2018:
| | | Carrying Value | | | Level 1 | | | Level 2 | | | Level 3 | | | Total Estimated Fair Value | |
| Assets | | | | | | | | | | | | | | | |
| Fixed maturity securities, held to maturity | | $ | 232,078,723 | | | $ | - | | | $ | 229,668,844 | | | $ | 5,082,014 | | | $ | 234,750,858 | |
| Mortgage loans held for investment | | | | | | | | | | | | | | | | | | | | |
| Residential | | | 87,947,566 | | | | - | | | | - | | | | 92,503,553 | | | | 92,503,553 | |
| Residential construction | | | 70,886,702 | | | | - | | | | - | | | | 70,886,702 | | | | 70,886,702 | |
| Commercial | | | 27,630,801 | | | | - | | | | - | | | | 28,359,205 | | | | 28,359,205 | |
| Mortgage loans held for investment, net | | $ | 186,465,069 | | | $ | - | | | $ | - | | | $ | 191,749,460 | | | $ | 191,749,460 | |
| Policy loans | | | 6,424,325 | | | | - | | | | - | | | | 6,424,325 | | | | 6,424,325 | |
| Insurance assignments, net (1) | | | 34,146,868 | | | | - | | | | - | | | | 34,168,868 | | | | 34,168,868 | |
| Restricted assets (2) | | | 1,258,397 | | | | - | | | | 1,271,687 | | | | - | | | | 1,271,687 | |
| Restricted assets (3) | | | 1,799,268 | | | | - | | | | - | | | | 1,810,185 | | | | 1,810,185 | |
| Cemetery perpetual care trust investments (2) | | | 990,390 | | | | - | | | | 983,410 | | | | - | | | | 983,410 | |
| Mortgage servicing rights, net | | | 20,016,822 | | | | - | | | | - | | | | 28,885,316 | | | | 28,885,316 | |
| | | | | | | | | | | | | | | | | | | | | |
| Liabilities | | | | | | | | | | | | | | | | | | | | |
| Bank and other loans payable | | $ | (187,521,188 | ) | | $ | - | | | $ | - | | | $ | (187,521,188 | ) | | $ | (187,521,188 | ) |
| Policyholder account balances (4) | | | (46,479,853 | ) | | | - | | | | - | | | | (37,348,289 | ) | | | (37,348,289 | ) |
| Future policy benefits - annuities (4) | | | (98,137,615 | ) | | | - | | | | - | | | | (97,641,146 | ) | | | (97,641,146 | ) |
_________
| (1) | Included in other investments and policy loans on the consolidated balance sheets |
| (2) | Fixed maturity securities held to maturity |
| (3) | Participation in mortgage loans held for investment |
(4)
| Included in future policy benefits and unpaid claims on the consolidated balance sheets |
The methods, assumptions and significant valuation techniques and inputs used to estimate the fair value of financial instruments are summarized as follows:
Fixed Maturity Securities Held to Maturity: The fair values of fixed maturity securities are based on quoted market prices, when available. For fixed maturity securities not actively traded, fair values are estimated using values obtained from independent pricing services, or in the case of private placements, are estimated by discounting expected future cash flows using a current market value applicable to the coupon rate, credit and maturity of the investments.
Mortgage Loans Held for Investment: The estimated fair value of the Company’s mortgage loans held for investment is determined using various methods. The Company’s mortgage loans are grouped into three categories: Residential, Residential Construction and Commercial. When estimating the expected future cash flows, it is assumed that all loans will be held to maturity, and any loans that are non-performing are evaluated individually for impairment.
Residential – The estimated fair value of mortgage loans is determined through a combination of discounted cash flows (estimating expected future cash flows of interest payments and discounting them using current interest rates from single family mortgages) and considering pricing of similar loans that were sold recently.
Residential Construction – These loans are primarily short in maturity. Accordingly, the estimated fair value is determined to be the carrying value.
Commercial – The estimated fair value is determined by estimating expected future cash flows of interest payments and discounting them using current interest rates for commercial mortgages.
Policy Loans: The carrying amounts reported in the accompanying consolidated balance sheet for these financial instruments approximate their fair values because they are fully collateralized by the cash surrender value of the underlying insurance policies.
SECURITY NATIONAL FINANCIAL CORPORATION
AND SUBSIDIARIES
Notes to Consolidated Financial Statements
Years Ended December 31, 2019 and 2018
17) Fair Value of Financial Instruments (Continued)
Insurance Assignments, Net:
These investments are short in maturity. Accordingly, the carrying amounts reported in the accompanying consolidated balance sheet for these financial instruments approximate their fair values.
Bank and Other Loans Payable: The carrying amounts reported in the accompanying consolidated balance sheet for these financial instruments approximate their fair values due to their relatively short-term maturities and variable interest rates.
Policyholder Account Balances and Future Policy Benefits-Annuities: Future policy benefit reserves for interest-sensitive insurance products are computed under a retrospective deposit method and represent policy account balances before applicable surrender charges. Policy benefits and claims that are charged to expense include benefit claims incurred in the period in excess of related policy account balances. Interest crediting rates for interest-sensitive insurance products ranged from 1.5% to 6.5%. The fair values for these investment-type insurance contracts are estimated based on the present value of liability cash flows.
The fair values for the Company’s insurance contracts other than investment-type contracts are not required to be disclosed. However, the fair values of liabilities under all insurance contracts are taken into consideration in the Company’s overall management of interest rate risk, such that the Company’s exposure to changing interest rates is minimized through the matching of investment maturities with amounts due under insurance contracts.
18) Accumulated Other Comprehensive Income
The following summarizes the changes in accumulated other comprehensive income:
| | | December 31 | |
| | | 2019 | | | 2018 | |
| Cumulative effect adjustment upon adoption of new accounting standard (ASU 2016-01) for equity securities | | $ | - | | | $ | (603,170 | ) |
| | | | | | | | | |
| Unrealized gains on fixed maturity securities available for sale | | | 17,315,770 | | | | - | |
| Reclassification adjustment for net realized gains in net income | | | - | | | | - | |
| Net unrealized gains before taxes | | | 17,315,770 | | | | - | |
| Tax expense | | | (3,636,311 | ) | | | - | |
| Net | | | 13,679,459 | | | | - | |
| Unrealized gains on restricted assets (1) | | | 35,550 | | | | - | |
| Tax expense | | | (8,856 | ) | | | - | |
| Net | | | 26,694 | | | | - | |
| Unrealized gains on cemetery perpetual care trust investments (1) | | | 29,904 | | | | - | |
| Tax expense | | | (7,449 | ) | | | - | |
| Net | | | 22,455 | | | | - | |
| Unrealized gains for foreign currency translations adjustments | | | 972 | | | | (3,761 | ) |
| Tax expense | | | (243 | ) | | | 938 | |
| Net | | | 729 | | | | (2,823 | ) |
| Other comprehensive income changes | | $ | 13,729,337 | | | $ | (605,993 | ) |
______
| (1) | Fixed maturity securities available for sale |
The following is the accumulated balances of other comprehensive income as of December 31, 2019:
| | | Beginning Balance December 31, 2018 | | | Change for the period | | | Ending Balance December 31,
2019 | |
| Unrealized gains on fixed maturity securities available for sale | | $ | - | | | $ | 13,679,459 | | | $ | 13,679,459 | |
| Unrealized gains on restricted assets (1) | | | - | | | | 26,694 | | | | 26,694 | |
| Unrealized gains on cemetery perpetual care trust investments (1) | | | - | | | | 22,455 | | | | 22,455 | |
| Foreign currency translation adjustments | | | (2,823 | ) | | | 729 | | | | (2,094 | ) |
| Other comprehensive income (loss) | | $ | (2,823 | ) | | $ | 13,729,337 | | | $ | 13,726,514 | |
_______
| (1) | Fixed maturity securities available for sale |
The following is the accumulated balances of other comprehensive income as of December 31, 2018:
| | | Beginning Balance December 31, 2017 | | | Change for the period | | | | | Ending Balance December 31,
2018 | |
| Unrealized gains on equity securities, restricted assets and cemetery perpetual care trust investments | | $ | 603,170 | | | $ | (603,170 | ) | | (1 | ) | | $ | - | |
| Foreign currency translation adjustments | | | - | | | | (2,823 | ) | | | | | | (2,823 | ) |
| Other comprehensive income (loss) | | $ | 603,170 | | | $ | (605,993 | ) | | | | | $ | (2,823 | ) |
__________
| (1) | Cumulative effect adjustment upon adoption of new accounting standard (ASU 2016-01) |
19) Derivative Instruments
The following table shows the fair value and notional amounts of derivative instruments as of December 31, 2019 and 2018.
| | Fair Values and Notional Amounts of Derivative Instruments | |
| | | |
| | | | December 31, 2019 | | | December 31, 2018 | |
| | Balance Sheet Location | | Notional Amount | | | Asset Fair Value | | | Liability Fair Value | | | Notional Amount | | | Asset Fair Value | | | Liability Fair Value | |
| Derivatives not designated as hedging instruments: | | | | | | | | | | | | | | | | | | | |
| Loan commitments | Other assets and Other liabilities | | $ | 224,202,514 | | | $ | 2,722,580 | | | $ | 231,347 | | | $ | 93,758,218 | | | $ | 1,969,967 | | | $ | 378,151 | |
| Call options | Other liabilities | | | 1,813,500 | | | | -- | | | | 62,265 | | | | 805,500 | | | | -- | | | | 4,629 | |
| Put options | Other liabilities | | | 1,573,100 | | | | -- | | | | 22,282 | | | | 4,861,700 | | | | -- | | | | 296,053 | |
| Total | | | $ | 225,326,654 | | | $ | 2,722,580 | | | $ | 315,894 | | | $ | 99,425,418 | | | $ | 1,969,967 | | | $ | 678,833 | |
The following table shows the gain (loss) on derivatives for the periods presented. There were no gains or losses reclassified from accumulated other comprehensive income into income or gains or losses recognized in income on derivatives ineffective portion or any amounts excluded from effective testing.
| | | | Net Amount Gain (Loss) | |
| | | | Years ended December 31 | |
| Derivative | Classification | | 2019 | | | 2018 | |
| Loan commitments | Mortgage fee income | | $ | 899,417 | | | $ | (404,773 | ) |
| | | | | | | | | | |
| Call and put options | Gains on investments and other assets | | $ | 626,208 | | | $ | 187,786 | |
20) Acquisitions
Kilpatrick Life Insurance Company
On December 13, 2019, the Company, through its wholly owned subsidiary, Security National Life Insurance Company (“Security National Life”) completed a stock purchase transaction with Kilpatrick Life Insurance Company, a Louisiana domiciled life insurance company (“Kilpatrick Life”) and its shareholders, which resulted in the purchase of all the outstanding shares of common stock of Kilpatrick Life. The closing of the transaction was subject to approval by the Louisiana Department of Insurance of the change of control of Kilpatrick Life, which was received on December 12, 2019. Under the terms of the transaction, the total Purchase Price that Security National Life paid for all the shares held by the Kilpatrick shareholders was $23,779,940 subject to a $1,400,000 holdback, as agreed with the shareholders.
Kilpatrick Life has been in operation since 1932 and provides life insurance products and services through insurance plans such as permanent and term life insurance, asset protection plans, graded whole life insurance, and annuities. Additionally, it provides insurance services for emergencies and pre‐arranged funeral services. Kilpatrick Life is based in Shreveport, Louisiana with additional offices in Jena, Alexandria, Minden, and Arcadia, Louisiana.
Kilpatrick Life employs a staff of almost 120 associates in four offices in Louisiana and is licensed to operate in Louisiana, Texas, Arkansas, Oklahoma, and Mississippi with the home office located in Shreveport, LA. It is the mission of Kilpatrick Life to continue providing the utmost service and protection for its policyholders for generations to come.
Prior to the stock purchase transaction, Security National life and Kilpatrick Life entered into a coinsurance agreement, effective October 1, 2019. After the effective date, Security National Life, as coinsurer, agreed to be responsible for and was obligated with respect to 100% of the contractual liabilities under the Kilpatrick Life’s life insurance policies in accordance with the terms and conditions of the policies and applicable law. Unless otherwise directed by Security National Life, as coinsurer, Kilpatrick Life continued to administer the policies on behalf of Security National Life, as coinsurer, for the duration of the coinsurance agreement.
As part of the coinsurance agreement, effective October 1, 2019, Security National Life acquired the following assets and assumed the following contractual liabilities.
| Other investments and policy loans | | $ | 9,124,459 | |
| Real estate held for investment | | | 2,850,000 | |
| Mortgage loans held for investment | | | 200,000 | |
| Receivables | | | 131,258 | |
| Total assets acquired | | | 12,305,717 | |
| | | | | |
| Future policy benefits and unpaid claims | | | (165,404,970 | ) |
| Other liabilities and accrued expenses | | | (5,259,341 | ) |
| Total liabilities assumed | | | (170,664,311 | ) |
| Cash received for reinsurance assumed | | $ | 158,358,594 | |
Contemporaneous with the stock purchase transaction, both Kilpatrick Life and Security National Life, as coinsurer, agreed terminate the coinsurance agreement, to require the recapture of the life insurance policies by Kilpatrick Life and provided notification to the Louisiana Department of Insurance. The final settlement and transfer of the coinsurance trust assets from Security National Life back to Kilpatrick Life occurred shortly thereafter.
The estimated fair values of the assets acquired and liabilities assumed as of the date of acquisition, on December 13, 2019, are shown in the following table. At the time of acquisition some of these assets and liabilities became intercompany items, and the Company has eliminated them for consolidation.
| Fixed maturity securities, available for sale | | $ | 22,766,520 | | | |
| Fixed maturity securities, held to maturity | | | 16,436 | | | |
| Mortgage loans held for investment | | | 8,011,660 | | | |
| Real estate held for investment | | | 2,708,557 | | | |
| Other investments | | | 446,655 | | | |
| Accrued investment income | | | 183,527 | | | |
| Total investments | | | 34,133,355 | | | |
| | | | | | | |
| Cash and cash equivalents | | | 6,900,654 | | | |
| Receivables, net | | | 5,407,736 | | (1 | ) |
| Receivables from reinsurers | | | 168,105,064 | | (1 | ) |
| Property and equipment, net | | | 1,498,245 | | | |
| Value of business acquired | | | 4,962,831 | | | |
| Deferred taxes | | | 167,344 | | | |
| Other | | | 712,323 | | | |
| Total assets acquired | | | 221,887,552 | | | |
| | | | | | | |
| Future policy benefits and unpaid claims | | | (189,071,407 | ) | | |
| Accounts payable | | | (283,304 | ) | | |
| Other liabilities and accrued expenses | | | (7,870,944 | ) | | |
| Income taxes | | | (881,957 | ) | | |
| Total liabilities assumed | | | (198,107,612 | ) | | |
| Fair value of net assets acquired/consideration paid | | $ | 23,779,940 | | | |
| | | | | | | |
| Fair value of net assets acquired/consideration paid, net of cash acquired | | $ | 16,879,286 | | | |
_________
| (1) | Receivable from reinsurers of $162,907,008 and receivables, net of $5,000,000 were settled with the recapture of the coinsurance agreement by Kilpatrick Life from Security National Life. |
Kilpatrick Life’s revenues and net loss since the date of acquisition were $1,461,011 and $848,031, respectively.
Probst Family Funerals and Cremations and Heber Valley Funeral Home
On February 15, 2019, the Company, through its wholly-owned subsidiary, Memorial Mortuary Inc., completed an asset purchase transaction with Probst Family Funerals and Cremations, LLC. (“Probst Family Funerals”) and Heber Valley Funeral Home, Inc. (“Heber Valley Funeral Home”). These funeral homes are both located in Heber Valley, a community situated about 45 miles southeast of Salt Lake City.
Under the terms of the transaction, as set forth in the Asset Purchase Agreement, dated February 15, 2019, Memorial Mortuary Inc. paid a net purchase price of $3,315,647 for the business and assets of Probst Family Funerals and Heber Valley Funeral Home, subject to a $150,000 holdback. In August 2019, this escrow account was settled and $137,550 was paid to the prior owners.
The estimated fair values of the assets acquired and liabilities assumed as of the date of acquisition were as follows:
| Cash | | $ | 53,859 | |
| Property and equipment | | | 2,475,526 | |
| Receivables | | | 13,620 | |
| Goodwill | | | 754,018 | |
| Other | | | 21,800 | |
| Total assets acquired | | | 3,318,823 | |
| | | | | |
| Bank and other loans payable | | | (3,176 | ) |
| Total liabilities assumed | | | (3,176 | ) |
| Fair value of net assets acquired/consideration paid | | $ | 3,315,647 | |
| | | | | |
| Fair value of net assets acquired/consideration paid, net of cash acquired | | $ | 3,261,788 | |
Probst Family Funerals and Heber Valley Funeral Home’s revenues and net earnings since the date of acquisition were $796,992 and $97,400, respectively.
Beta Capital Corp.
On June 1, 2018, the Company completed a stock purchase transaction with Beta Capital Corp. ("Beta Capital") and Ronald D. Maxson ("Maxson"), the sole owner of all the outstanding shares of common stock of Beta Capital, to purchase all of the outstanding shares of common stock of Beta Capital. Beta Capital is engaged in the operation of a factoring business with the principal purpose of providing funding for funeral homes and mortuaries.
Under the terms of the transaction, as set forth in the Stock Purchase Agreement, dated June 1, 2018, by and among the Company, Beta Capital and Maxson, the Company paid Maxson the purchase consideration at the closing of the transaction equal to the sum of (i) $890,000 in cash plus (ii) the accounts receivable value of $2,515,783, representing the total amount of the Company's outstanding receivables as of the closing date of June 1, 2018, for a total closing payment of $3,405,783. From the $3,405,783 closing payment, a holdback amount equal to $175,000 was deposited into an interest bearing escrow account. In November 2019, this escrow account was settled and $169,190 was paid to the prior owner.
The estimated fair values of the assets acquired at the date of acquisition were as follows:
| Other investments - insurance assignments | | $ | 2,515,783 | |
| Other - customer list intangible asset | | | 890,000 | |
| Total assets acquired | | | 3,405,783 | |
| Fair value of net assets acquired/consideration paid | | $ | 3,405,783 | |
21) Mortgage Servicing Rights
The Company reports MSRs pursuant to the accounting policy discussed in Note 1 of the Notes to Consolidated Financial Statements.
The following table presents the MSR activity for the periods presented.
| | | December 31 | |
| | | 2019 | | | 2018 | |
| Amortized cost: | | | | | | |
| Balance before valuation allowance at beginning of year | | $ | 20,016,822 | | | $ | 21,376,937 | |
| MSR additions resulting from loan sales | | | 4,194,502 | | | | 3,922,816 | |
| Amortization (1) | | | (7,055,795 | ) | | | (5,282,931 | ) |
| Application of valuation allowance to write down MSRs with other than temporary impairment | | | - | | | | - | |
| Balance before valuation allowance at year end | | $ | 17,155,529 | | | $ | 20,016,822 | |
| | | | | | | | | |
| Valuation allowance for impairment of MSRs: | | | | | | | | |
| Balance at beginning of year | | $ | - | | | $ | - | |
| Additions | | | - | | | | - | |
| Application of valuation allowance to write down MSRs with other than temporary impairment | | | - | | | | - | |
| Balance at year end | | $ | - | | | $ | - | |
| | | | | | | | | |
| Mortgage servicing rights, net | | $ | 17,155,529 | | | $ | 20,016,822 | |
| | | | | | | | | |
| Estimated fair value of MSRs at year end | | $ | 22,784,571 | | | $ | 28,885,316 | |
_________
| (1) | Included in other expenses on the consolidated statements of earnings |
The following table summarizes the Company’s estimate of future amortization of its existing MSRs carried at amortized cost. This projection was developed using the assumptions made by management in its December 31, 2019 valuation of MSRs. The assumptions underlying the following estimate will change as market conditions and portfolio composition and behavior change, causing both actual and projected amortization levels to change over time. Therefore, the following estimates will change in a manner and amount not presently determinable by management.
| | | Estimated MSR Amortization | |
| 2020 | | $ | 2,999,452 | |
| 2021 | | | 2,376,277 | |
| 2022 | | | 1,971,249 | |
| 2023 | | | 1,631,010 | |
| 2024 | | | 1,359,492 | |
| Thereafter | | | 6,818,049 | |
| Total | | $ | 17,155,529 | |
During the years ended December 31, 2019 and 2018, the Company collected the following contractual servicing fee income and late fee income as reported in other revenues on the consolidated statements of earnings:
| | | 2019 | | | 2018 | |
| Contractual servicing fees | | $ | 7,212,164 | | | $ | 7,561,226 | |
| Late fees | | | 365,477 | | | | 319,244 | |
| Total | | $ | 7,577,641 | | | $ | 7,880,470 | |
The following is a summary of the unpaid principal balances (“UPB”) of the servicing portfolio for the periods presented:
| | | Years Ended December 31 | |
| | | 2019 | | | 2018 | |
| Servicing UPB | | $ | 2,804,139,415 | | | $ | 2,941,231,563 | |
The following key assumptions were used in determining MSR value:
| | Prepayment
Speeds | Average
Life(Years) | Discount
Rate |
| December 31, 2019 | 15.30 | 5.27 | 9.51 |
| December 31, 2018 | 11.70 | 6.33 | 9.51 |
22) Future Policy Benefits and Unpaid Claims
The Company reports future policy benefits and unpaid claims pursuant to the accounting policy discussed in Note 1 of the Notes to Consolidated Financial Statements.
The following table provides information regarding future policy benefits and unpaid claims and the related receivable from reinsurers.
| | | Years Ended
September 30 | |
| | | 2019 | | | 2018 | |
| Life | | $ | 654,585,723 | | | $ | 466,232,621 | |
| Annuities | | | 113,579,831 | | | | 98,137,615 | |
| Policyholder account balances | | | 45,154,180 | | | | 46,479,853 | |
| Accident and health | | | 667,428 | | | | 482,693 | |
| Other policyholder funds | | | 4,530,227 | | | | 4,431,296 | |
| Reported but unpaid claims | | | 4,891,922 | | | | 3,365,872 | |
| Incurred but not reported claims | | | 2,191,607 | | | | 1,269,764 | |
| | | | | | | | | |
| Gross future policy benefits and unpaid claims | | $ | 825,600,918 | | | $ | 620,399,714 | |
| | | | | | | | | |
Receivable from reinsurers | | | | | | | | |
| | | | | | | | | |
| Life | | | 11,040,398 | | | | 6,702,328 | |
| Annuities | | | 4,038,007 | | | | 4,078,666 | |
| Accident and health | | | 90,113 | | | | - | |
| Reported but unpaid claims | | | 569,250 | | | | 33,108 | |
| Incurred but not reported claims | | | 10,000 | | | | 6,000 | |
| | | | | | | | | |
| Total receivable from reinsurers | | | 15,747,768 | | | | 10,820,102 | |
| | | | | | | | | |
| Net future policy benefits and unpaid claims | | $ | 809,853,150 | | | $ | 609,579,612 | |
_________
| (1) | Included in Depreciation on property and equipment on the consolidated statements of earnings |
| (2) | Included in Interest expense on the consolidated statements of earnings |
| (3) | Included in Rent and rent related expenses on the consolidated statements of earnings |
(4)
| Includes leases with a term of 12 months or less |
The following table presents the maturity analysis of the Company’s lease liabilities.
| | | Finance Leases | | | Operating Leases | |
| Lease payments due in: | | | | | | |
| 2020 | | $ | 62,756 | | | $ | 4,241,547 | |
| 2021 | | | 45,086 | | | | 2,932,404 | |
| 2022 | | | 32,646 | | | | 1,780,183 | |
| 2023 | | | 25,408 | | | | 1,383,538 | |
| 2024 | | | 2,542 | | | | 1,061,520 | |
| Thereafter | | | - | | | | 2,919,074 | |
| Total undiscounted lease payments | | | 168,438 | | | | 14,318,266 | |
| Less: Discount on cash flows | | | (14,999 | ) | | | (2,912,290 | ) |
| Present value of lease liabilities | | $ | 153,439 | | | $ | 11,405,976 | |
The following table presents the Company’s right-of-use assets and lease liabilities for the period presented:
| | Year Ended December 31 | |
| | Balance Sheet Location | | 2019 | |
Operating Leases | | | | |
| Right-of-use assets | Other assets | | $ | 11,267,247 | |
| | | | | | |
| Lease liabilities | Other liabilities and accrued expenses | | $ | 11,405,976 | |
| | | | | | |
Finance Leases | | | | | |
| Right-of-use assets | | | $ | 248,565 | |
| Accumulated amortization | | | | (98,351 | ) |
| Right-of-use assets, net | Property and equipment, net | | $ | 150,214 | |
| | | | | | |
| Lease liabilities | Bank and other loans payable | | $ | 153,439 | |
The Company is also a lessor and has operating lease agreements with various tenants that lease its commercial and residential properties. See Note 2 for information about the Company’s real estate held for investment.
25) Quarterly Financial Data (Unaudited)
| | | 2019 | |
| | | Three Months Ended | |
| | | March 31 | | | June 30 | | | September 30 | | | December 31 | |
| Revenues | | $ | 61,493,835 | | | $ | 68,445,182 | | | $ | 75,379,659 | | | $ | 77,742,254 | |
| Benefits and expenses | | | 59,061,676 | | | | 63,821,339 | | | | 70,619,837 | | | | 75,614,143 | |
| Earnings before income taxes | | | 2,432,159 | | | | 4,623,843 | | | | 4,759,822 | | | | 2,128,111 | |
| Income tax expense | | | (501,841 | ) | | | (1,143,789 | ) | | | (1,142,408 | ) | | | (262,378 | ) |
| Net earnings | | | 1,930,318 | | | | 3,480,054 | | | | 3,617,414 | | | | 1,865,733 | |
| Net earnings per common share (1) | | $ | 0.11 | | | $ | 0.19 | | | $ | 0.20 | | | $ | 0.10 | |
| Net earnings per common share assuming dilution (1) | | $ | 0.11 | | | $ | 0.19 | | | $ | 0.20 | | | $ | 0.10 | |
| | | 2018 | |
| | | Three Months Ended | |
| | | March 31 | | | June 30 | | | September 30 | | | December 31 | |
| Revenues | | $ | 82,076,109 | | | $ | 68,865,126 | | | $ | 67,223,093 | | | $ | 61,454,399 | |
| Benefits and expenses | | | 60,888,928 | | | | 64,702,895 | | | | 65,011,295 | | | | 62,835,219 | |
| Earnings before income taxes | | | 21,187,181 | | | | 4,162,231 | | | | 2,211,798 | | | | (1,380,820 | ) |
| Income tax expense | | | (4,261,258 | ) | | | (924,014 | ) | | | (198,052 | ) | | | 889,013 | |
| Net earnings | | | 16,925,923 | | | | 3,238,217 | | | | 2,013,746 | | | | (491,807 | ) |
| Net earnings per common share (1) | | $ | 0.95 | | | $ | 0.18 | | | $ | 0.11 | | | $ | (0.03 | ) |
| Net earnings per common share assuming dilution (1) | | $ | 0.94 | | | $ | 0.18 | | | $ | 0.11 | | | $ | (0.03 | ) |
___________
| (1) | Earnings per share amounts have been adjusted retroactively for the effect of annual stock dividends. |
26) Subsequent Events
COVID-19
Since December 31, 2019, the outbreak of the novel strain of coronavirus, specifically identified as "COVID-19", has resulted in governments worldwide enacting emergency measures to combat the spread of the virus. These measures, which include the implementation of travel bans, self-imposed quarantine periods and social distancing, have caused material disruption to businesses globally resulting in an economic slowdown. Global equity markets have experienced significant volatility and weakness. Governments and central banks have reacted with significant monetary and fiscal interventions designed to stabilize economic conditions. The duration and impact of the COVID-19 outbreak is unknown at this time, as is the efficacy of the government and central bank interventions. It is not possible to reliably estimate the length and severity of these developments and the impact on the financial results and condition of the Company and its operating subsidiaries in future periods. Further, these uncertainties have the potential to negatively affect the risk of credit default for the issuers of the Company’s debt securities and individual borrowers with mortgage loans held by the Company.
Item 9. Changes in and Disagreements with Accountants on Accounting and Financial Disclosure
None
Item 9A. Controls and Procedures
Under the supervision and with the participation of the Company’s management, including the Chief Executive Officer and Chief Financial Officer, the Company has evaluated the effectiveness of its disclosure controls and procedures as required by Exchange Act Rule 13a-15(b) as of the end of the period covered by this report. Based on that evaluation, the Chief Executive Officer and Chief Financial Officer have concluded that these disclosure controls and procedures are effective.
(a) Management’s annual report on internal control over financial reporting.
Management is responsible for establishing and maintaining adequate internal control over financial reporting. The Company's internal control over financial reporting is a process that is designed to provide reasonable assurance regarding the reliability of financial reporting and the preparation of financial statements for external purposes in accordance with generally accepted accounting principles (“GAAP”), and includes those policies and procedures that:
| • | Pertain to the maintenance of records that, in reasonable detail, accurately and fairly reflect the transactions and dispositions of assets of the Company, |
| | |
| • | Provide reasonable assurance that transactions are recorded as necessary to permit preparation of financial statements in accordance with GAAP, and that receipts and expenditures are being made only in accordance with authorizations of management and the Board of Directors of the Company, and provide reasonable assurance regarding prevention or timely detection of unauthorized acquisition, use, or disposition of the Company's assets that could have a material effect on the financial statements. |
As disclosed in Item 8: Financial Statements, the Company acquired Kilpatrick Life in December 2019. Prior to the acquisition, the Company identified a material weakness in Kilpatrick Life’s internal control over financial reporting. The material weakness identified had not been remediated as of December 31, 2019. Specifically, the Company determined that Kilpatrick Life’s controls related to Change Management and Segregation of Duties for the Policy Administration System did not operate effectively. As a result of the control deficiency, a risk exists that inappropriate system changes could potentially result in a material misstatement of Kilpatrick Life’s financial information, which is consolidated with the Company’s 2019 year-end results. Prior to the closing of the acquisition, the Company’s management developed and initiated a plan to remediate these internal control deficiencies
As of March 30, 2020, management has not fully assessed Kilpatrick Life’s internal controls over financial reporting and is currently testing new and revised internal controls for design and operating effectiveness. The Securities and Exchange Commission permits companies to exclude acquisitions from their assessment of internal control over financial reporting during the first year of an acquisition, and management has elected to exclude Kilpatrick Life from our assessment. Kilpatrick Life accounted for approximately 15% of total assets as of December 31, 2019. Management has performed additional analysis and procedures to conclude that it believes the consolidated financial statements included in this Form 10-K present fairly, in all material respects, the Company’s financial position, results of operations, comprehensive income (loss) and cash flows for the periods presented in conformity with U.S. GAAP.
Because of its inherent limitations, internal control over financial reporting may not prevent or detect misstatements. Also, projections of any evaluation of effectiveness to future periods are subject to the risk that controls may become inadequate because of changes in conditions, or that the degree of compliance with the policies and procedures may deteriorate.
Management performed an assessment of the effectiveness of the Company's internal control over financial reporting as of December 31, 2019 based on the framework in “Internal Control-Integrated Framework (2013)” issued by the Committee of Sponsoring Organizations of the Treadway Commission. The objective of this assessment was to determine whether the Company's internal control over financial reporting was effective as of December 31, 2019. Based on that assessment management believes that due to the acquisition of Kilpatrick Life on December 13, 2019, the Company’s internal control over financial reporting was not effective as of December 31, 2019.
This annual report on internal control over financial reporting does not include an attestation report of the Company’s registered public accounting firm regarding internal control over financial reporting. Management’s report was not subject to attestation by the Company’s registered public accounting firm pursuant to rules of the Securities and Exchange Commission that permit the Company to provide only management’s report in this annual report.
(b) Changes in internal control over financial reporting.
There have been significant changes in the Company’s internal control over financial reporting (as defined in Rule 13a-15(f) under the Securities and Exchange Act of 1934, as amended) in the first quarter of 2020 that are reasonably likely to materially affect, the Company’s internal control over financial reporting in future reporting periods. These changes are a direct result of remediation efforts undertaken by the Company to address the material weakness in Kilpatrick Life’s financial reporting as discussed above.
Remediation Efforts to Address the Material Weakness
The Company implemented controls to remediate the underlying causes that gave rise to the material weakness.
The following controls have been implemented by management:
| • | Execution of a formal consultant agreement with the former system developer. |
| | |
| • | Creation of unique login credentials for system users. |
| | |
| • | Implementation of system change control processes, including the installation of a third-party database logging software. |
In addition to the steps taken above, the Company will also transition Kilpatrick Life’s policies to its own Policy Administration System, which has appropriate controls in place.
The Company is committed to continuous improvement of its internal control processes and will continue to diligently review its financial reporting controls and procedures as it works to remedy Kilpatrick Life’s material weakness in internal controls.
Item 9B. Other Information
None
PART III
Item 10. Directors, Executive Officers and Corporate Governance
The Company’s Board of Directors consists of eight persons, five of whom are not employees of the Company. There are no family relationships between or among any of the directors and executive officers, except that S. Andrew Quist and Adam G. Quist are sons of Scott M. Quist, and Jason G. Overbaugh is a nephew of Scott M. Quist. The following table sets forth certain information with respect to the directors and executive officers of the Company.
| Name | | Age | | Position with the Company |
| | | | |
|
| Scott M. Quist | | 66 | | Chairman of the Board, President, Chief Executive Officer, and Director |
| | | | | |
| Garrett S. Sill | | 49 | | Chief Financial Officer and Treasurer |
| | | | | |
| Jason G. Overbaugh | | 45 | | Vice President, National Marketing Director of Life Insurance and Director |
| | | | | |
| S. Andrew Quist | | 39 | | Vice President, General Counsel, and Director |
| | | | | |
| Jeffrey R. Stephens | | 66 | | Senior General Counsel and Secretary |
| | | | | |
| Stephen C. Johnson | | 63 | | Vice President - Mortgage Operations |
| | | | | |
| Adam G. Quist | | 34 | | Vice President - Memorial Services, Assistant Secretary, and General Counsel |
| | | | | |
| John L. Cook | | 65 | | Director |
| | | | | |
| Gilbert A. Fuller | | 79 | | Director |
| | | | | |
| Robert G. Hunter | | 60 | | Director |
| | | | | |
| H. Craig Moody | | 68 | | Director |
| | | | | |
| Norman G. Wilbur | | 81 | | Director |
Directors
The following is a description of the business experience of each of the Company’s directors.
Scott M. Quist has served as Chairman of the Board and Chief Executive Officer of the Company since 2012. Mr. Quist also serves as the Company’s President, a position he has held since 2002. He has additionally served as a director of the Company since 1986. From 1993 to 2013, Mr. Quist served as Treasurer and a director of the National Alliance of Life Companies (NALC), a national trade association of over 200 life insurance companies, and as its President from 1990 to 2000. From 1986 to 1991, Mr. Quist was Treasurer and a director of The National Association of Life Companies, a trade association of 642 insurance companies until its merger with the American Council of Life Companies. Mr. Quist has been a member of the Board of Governors of the Forum 500 Section (representing small insurance companies) of the American Council of Life Insurance. He has also served as a regional director of Key Bank of Utah since 1993. Mr. Quist holds a B.S. degree in Accounting from Brigham Young University and received his law degree also from Brigham Young University. Mr. Quist’s significant expertise and deep understanding of the technical, organizational and strategic business aspects of the insurance industry, his management expertise, his 18 year tenure as President of the Company and 33 year tenure as a director, and his years of business and leadership experience led the Board of Directors to conclude that Mr. Quist should serve as Chairman of the Board, President, and Chief Executive Officer of the Company.
Jason G. Overbaugh has served as a director of the Company since 2013. Mr. Overbaugh has also served as a Vice President and the Assistant Secretary of the Company from 2002 to 2013. Mr. Overbaugh has additionally served as Vice President and National Marketing Director of Security National Life Insurance Company since 2006. From 2003 to 2006, he served as a Vice President of Security National Life Insurance Company with responsibilities as an investment manager over construction lending and commercial real estate investments. From 2000 to 2003, he served as a Vice President of Memorial Estates, Inc., with responsibilities over operations and sales. Mr. Overbaugh has served since 2007 as a director of the LOMA Life Insurance Council, a trade association of life insurance companies. He is also a member of the NFDA Trade Association. Mr. Overbaugh received a B.S. degree in Finance from the University of Utah. Mr. Overbaugh’s expertise in insurance and marketing, and his 23 years of experience with the Company in its insurance, real estate, and mortuary and cemetery operations led the Board of Directors to conclude that he should serve as a director of the Company.
S. Andrew Quist has served as a director of the Company since 2013. Mr. Quist has also served as a Vice President of the Company since 2010. In addition, from 2007 to December 2017, he served as the Company’s Associate General Counsel and since December 2017 as the Company’s General Counsel, where his responsibilities have included the Company’s regulatory matters and acquisitions. In addition, Mr. Quist has served as Executive Vice President and Chief Operating Officer since 2010, and as Vice President from 2008 to 2010, of C&J Financial, LLC, which funds the purchase of funeral and burial policies from funeral homes after the death of the insureds. Mr. Quist has also served since 2013 as a director of the National Alliance of Life Companies (NALC), a national trade association of over 200 life insurance companies. From 2014 to 2016, he served as President of the NALC. Mr. Quist previously served as President of the Utah Life Convention, a consortium of Utah domestic life insurers. Mr. Quist holds a B.S. degree in Accounting from Brigham Young University and received his law degree from the University of Southern California. Mr. Quist is a member of the State Bar of California. Mr. Quist’s expertise in insurance, legal and regulatory matters led the Board of Directors to conclude that he should serve as a director of the Company.
John L. Cook has served as a director of the Company since 2013. Mr. Cook has served since 1982 as co-owner and operator of Cook Brothers Painting, Inc., a company that provides painting services for contractors and builders of residential and commercial properties. In addition, Mr. Cook attended the University of Utah. As a director, Mr. Cook advised the Board concerning the Company’s investments in commercial and residential real estate projects. Moreover, Mr. Cook’s extensive background in construction and building is important as the Company continues to acquire new real estate holdings and develop its current portfolio of undeveloped land. Mr. Cook’s years of experience in the construction industry and with construction projects led the Board of Directors to conclude that he should serve as a director of the Company.
Gilbert A. Fuller has served as a director of the Company since 2012. From 2006 until his retirement in 2008, Mr. Fuller served as Executive Vice President, Chief Financial Officer and Secretary of USANA Health Sciences, Inc., a multinational manufacturer and direct seller of nutritional supplements. Mr. Fuller joined USANA in 1996 as the Vice President of Finance and served in that role until 1999 when he was appointed as its Senior Vice President. Mr. Fuller has served as a member of the Board of Directors of USANA since 2008. Mr. Fuller received a B.S. degree in Accounting and an M.B.A. degree from the University of Utah. Mr. Fuller’s accounting, finance and corporate strategy expertise and his years of financial, accounting and business experience with public and private companies, including USANA Health Sciences, Inc., which is listed on the New York Stock Exchange, where he served as an executive officer and continues to serve as a director, led the Board of Directors to conclude that he should serve as a director of the Company.
Robert G. Hunter, M.D. has served as a director of the Company since 1998. Dr. Hunter is currently a practicing physician in private practice. Dr. Hunter is Department Head of Otolaryngology, Head and Neck Surgery at Intermountain Medical Center and a past President of the medical staff of the Intermountain Medical Center. He is also a delegate to the Utah Medical Association and has served as a delegate representing the State of Utah to the American Medical Association. Dr. Hunter holds a B.S. degree in Microbiology from the University of Utah and received his medical degree from the University of Utah College of Medicine. Dr. Hunter’s medical expertise and experience, and his administrative and leadership experience from serving in a number of administrative positions in the medical profession led the Board of Directors to conclude that he should serve as a director of the Company.
H. Craig Moody has served as a director of the Company since 1995. Mr. Moody is owner of Moody & Associates, a political consulting and real estate company. He is a former Speaker and House Majority Leader of the House of Representatives of the State of Utah. From 1989 to 1992, Mr. Moody was Co-Chairman of the Utah Legislative Audit Committee. Mr. Moody holds a B.S. degree in Political Science from the University of Utah. Mr. Moody’s real estate and governmental affairs expertise and years of business and leadership experience led the Board of Directors to conclude that he should serve as a director of the Company.
Norman G. Wilbur has served as a director of the Company since 1998. Mr. Wilbur worked for J.C. Penny's regional offices in budget and analysis. His final position was Manager of Planning and Reporting for J.C. Penny's stores. After 36 years with J.C. Penny's, Mr. Wilbur opted for early retirement in 1997. Mr. Wilbur holds a B.S. degree in Accounting from the University of Utah. Mr. Wilbur’s financial expertise and business experience from a successful career at JC Penny’s led the Board of Directors to conclude that he should serve as a director of the Company. In addition, the Board of Directors’ determination that Mr. Wilbur is the Audit Committee “financial expert” lends further support to his financial acumen and qualification for serving as a director of the Company.
The Board of Directors, Board Committees, and Meetings
The Company's Bylaws provide that the Board of Directors shall consist of not less than five or more than twelve members. The term of office of each director is for a period of one year or until the election and qualification of his successor. A director is not required to be a resident of the State of Utah or a stockholder of the Company. The Board of Directors held a total of five meetings during the fiscal year ended December 31, 2019. Each of the directors attended 75% or more of the meetings of the Board of Directors during 2019.
The size of the Board of Directors of the Company is eight members. A majority of the Board of Directors must qualify as "independent" as that term is defined in Rule 4200 of the listing standards of the Nasdaq Stock Market. The Board of Directors has affirmatively determined that five of the eight members of the Board of Directors, namely Messrs. John L. Cook, Gilbert A. Fuller, Robert G. Hunter, M.D., H. Craig Moody and Norman G. Wilbur, are independent under the listing standards of the Nasdaq Stock Market.
There are four committees of the Board of Directors, which meet periodically during the year: the Audit Committee, the Compensation Committee, the Executive Committee, and the Nominating and Corporate Governance Committee.
The Audit Committee directs the auditing activities of the Company's internal auditors and outside public accounting firm and approves the services of the outside public accounting firm. The Audit Committee consists of Messrs. John L. Cook, Gilbert A. Fuller, H. Craig Moody, and Norman G. Wilbur (Chairman of the committee). During 2019, the Audit Committee met on three occasions.
The Compensation Committee is responsible for recommending to the Board of Directors for approval the annual compensation of each executive officer of the Company and the executive officers of the Company's subsidiaries, developing policy in the areas of compensation and fringe benefits, contributions under the Employee Stock Ownership Plan, contributions under the 401(k) Retirement Savings Plans, Non-Qualified Deferred Compensation Plan, granting of options under the stock option plans, and creating other employee compensation plans. The Compensation Committee consists of Messrs. John L. Cook, Gilbert A. Fuller, Robert G. Hunter, M.D., H. Craig Moody and Norman G. Wilbur (Chairman of the committee). During 2019, the Compensation Committee met on two occasions.
The Executive Committee reviews Company policy, major investment activities and other pertinent transactions of the Company. The Executive Committee consists of Messrs. Gilbert A. Fuller, H. Craig Moody, S. Andrew Quist and Scott M. Quist (Chairman of the committee). During 2019, the Executive Committee met on one occasion.
The Nominating and Corporate Governance Committee identifies individuals qualified to become Board members consistent with criteria approved by the Board, recommends to the Board the persons to be nominated by the Board for election as directors at a meeting of stockholders, and develops and recommends to the Board a set of corporate governance principles. The Nominating and Corporate Governance Committee consists of Messrs. John L. Cook, Gilbert A. Fuller, Robert G. Hunter, M.D., H. Craig Moody (Chairman of the committee), and Norman G. Wilbur. The Nominating and Corporate Governance Committee is composed solely of independent directors, as defined in the listing standards of the Nasdaq Stock Market. During 2019, the Nominating and Corporate Governance Committee met on two occasions.
Director Nominating Process
The process for identifying and evaluating nominees for directors include the following steps: (1) the Nominating and Corporate Governance Committee, Chairman of the Board or other board members identify a need to fill vacancies or add newly created directorships; (2) the Chairman of the Nominating and Corporate Governance Committee initiates a search and seeks input from board members and senior management and, if necessary, obtains advice from legal or other advisors (but does not hire an outside search firm); (3) director candidates, including any candidates properly proposed by stockholders in accordance with the Company's Bylaws, are identified and presented to the Nominating and Corporate Governance Committee; (4) initial interviews with candidates are conducted by the Chairman of the Nominating and Corporate Governance Committee; (5) the Nominating and Corporate Governance Committee meets to consider and approve final candidate(s) and conduct further interviews as necessary; and (6) the Nominating and Corporate Governance Committee makes recommendations to the board for inclusion in the slate of directors at the annual meeting. The evaluation process will be the same whether the nominee is recommended by a stockholder or by a member of the Board of Directors.
Meetings of Non-Management Directors
The Company's independent directors meet regularly in executive session without management. The Board of Directors has designated a lead director to preside at executive sessions of independent directors. Mr. H. Craig Moody is currently the lead director.
Executive Officers
Garrett S. Sill has served as Chief Financial Officer and Treasurer since 2013. From 2011 to 2013, Mr. Sill served as Vice President and Assistant Treasurer of Security National Life Insurance Company, a wholly owned subsidiary of the Company. From 2002 to 2011, Mr. Sill was Chief Financial Officer and Treasurer of SecurityNational Mortgage, a wholly owned subsidiary of the Company. Mr. Sill is a certified public accountant, having been licensed since 2002. He holds a B.A. degree in Accounting from Weber State University and a Master’s degree in Business Administration from the University of Utah. Mr. Sill also serves as a member of the Advisory Council of the School of Accounting and Taxation at Weber State University.
Jeffrey R. Stephens has served as Senior General Counsel of the Company since 2017, as General Counsel from 2006 to 2017, and as Secretary of the Company since 2008. Mr. Stephens was in private practice from 1981 to 2006 in the states of Washington and Utah. Mr. Stephens holds a B.A. degree in Geography from the University of Utah and received his law degree from Brigham Young University. Mr. Stephens is a member of the Utah State Bar Association and the Washington State Bar Association.
Stephen C. Johnson began serving as the Vice President of Mortgage Operations of the Company and as the President of SecurityNational Mortgage in 2016. Prior to Mr. Johnson’s appointment as President of SecurityNational Mortgage, Mr. Johnson served as Executive Vice President and Chief Operating Officer of SecurityNational Mortgage. Mr. Johnson has over 30 years of experience at the executive management level in the mortgage banking industry. Mr. Johnson holds a B.A. degree in International Relations from Brigham Young University and Master's degree in International Management and Finance from the American Graduate School of International Management (Thunderbird).
Adam G. Quist has served as Vice President – Memorial Services and Assistant Secretary of the Company since 2015. From 2015 to 2017, he also served as the Company’s Associate General Counsel. Since 2017, Mr. Quist has served as the Company’s General Counsel. Mr. Quist has also served since 2015 as Vice President of Memorial Estates, Inc. (“Memorial Estates”) and since 2016 as Chief Operating Officer of Memorial Estates. Additionally, Mr. Quist has further served since 2015 as Vice President of Memorial Mortuary, Inc. (“Memorial Mortuary”) and since 2016 as Chief Operating Officer of Memorial Mortuary. Both Memorial Estates and Memorial Mortuary are wholly owned subsidiaries of the Company. Mr. Quist hold a B.S. degree and a Master’s degree in Accounting with an emphasis on taxation from Brigham Young University. He received his law degree from the University of Utah. Mr. Quist is a member of the Utah State Bar.
The Board of Directors of the Company has a written procedure, which requires disclosure to the board of any material interest or any affiliation on the part of any of its officers, directors or employees that is in conflict or may be in conflict with the Company’s interests.
All executive officers and directors of the Company hold office until the next Annual Meeting of Stockholders and until their successors have been elected and qualified.
Corporate Governance Guidelines. The Board of Directors has adopted the Security National Financial Corporation Corporate Governance Guidelines. These guidelines outline the functions of the board, director qualifications and responsibilities, and various processes and procedures designed to insure effective and responsive governance. The Board of Directors has also adopted a written committee charter for its Audit Committee and Compensation Committee. The guidelines and committee charters are reviewed from time to time in response to regulatory requirements and best practices and are revised accordingly. The full text of the guidelines and the committee charters are available on the Company’s website at www.securitynational.com. A copy of the Corporate Governance Guidelines may also be obtained at no charge by written request to the attention of Jeffrey R. Stephens, Secretary, Security National Financial Corporation, 121 West Election Road., Suite 100, Draper, Utah 84020.
Code of Business Conduct and Ethics. All of the Company’s officers, employees, and directors are required to comply with the Company’s Code of Business Conduct and Ethics to help ensure that the Company’s business is conducted in accordance with appropriate standards of ethical behavior. The Company’s Code of Business Conduct and Ethics covers all areas of professional conduct, including customer relationships, conflicts of interest, insider trading, financial disclosures, intellectual property, and confidential information, as well as requiring adherence to all laws and regulations applicable to the Company’s business. Employees are required to report any violations or suspected violations of the Code. The Code includes an anti-retaliation statement. The full text of the Code of Business Conduct and Ethics is available on the Company’s website at www.securitynational.com. A copy of the Code of Business Conduct and Ethics may also be obtained at no charge by written request to the attention of Jeffrey R. Stephens, Secretary, Security National Financial Corporation, 121 West Election Road., Suite 100, Draper, Utah 84020.
Item 11. Executive Compensation
The following table sets forth, for each of the last two fiscal years, the compensation received by the Company’s Chief Executive Officer, the Company’s Chief Financial Officer, and the Company’s three other most highly compensated executive officers who were serving as executive officers at the end of 2019 (collectively, the “Named Executive Officers”).
SUMMARY COMPENSATION TABLE
Name and
Principal Position | Year | | Salary
($) | | | Bonus ($) | | | Options Awards
($) | | | Non-Equity Incentive Plan Compensation
($) | | | Change in Pension Value Non-qualified Deferred Compensation Earnings (1)
($) | | | All Other Compensation (2)
($) | | | Total
($) | |
Scott M. Quist
Chairman of the | 2019 | | $ | 528,498 | | | $ | 151,300 | | | | -- | | | | -- | | | | -- | | | $ | 48,012 | | | $ | 727,810 | |
Board, President
and Chief Executive Officer | 2018 | | | 489,174 | | | | 124,500 | | | | -- | | | | -- | | | | -- | | | | 47,221 | | | | 660,895 | |
| | | | | | | | | | | | | | | | | | | | | | | | | | | | | | |
Garrett S. Sill
Chief Financial | 2019 | | $ | 223,373 | | | $ | 36,200 | | | | -- | | | | -- | | | | -- | | | $ | 31,534 | | | $ | 291,107 | |
| Officer and Treasurer | 2018 | | | 214,165 | | | | 25,457 | | | | -- | | | | -- | | | | -- | | | | 27,107 | | | | 266,729 | |
| | | | | | | | | | | | | | | | | | | | | | | | | | | | | | |
Stephen C. Johnson
Vice President of | 2019 | | $ | 325,841 | | | $ | 87,617 | | | | -- | | | | -- | | | | -- | | | $ | 8,279 | | | $ | 421,737 | |
Mortgage
Operations | 2018 | | | 361,284 | | | | 17,900 | | | | -- | | | | -- | | | | -- | | | | 18,257 | | | | 397,441 | |
| | | | | | | | | | | | | | | | | | | | | | | | | | | | | | |
S. Andrew Quist
Vice President and | 2019 | | $ | 245,440 | | | $ | 92,325 | | | | -- | | | | -- | | | | -- | | | $ | 31,279 | | | $ | 369,044 | |
| General Counsel | 2018 | | | 221,228 | | | | 41,075 | | | | -- | | | | -- | | | | -- | | | | 27,163 | | | | 289,466 | |
| | | | | | | | | | | | | | | | | | | | | | | | | | | | | | |
Jeffrey R. Stephens
Senior General | 2019 | | $ | 197,205 | | | $ | 15,875 | | | | -- | | | | -- | | | | -- | | | $ | 23,201 | | | $ | 236,281 | |
Counsel and
Secretary | 2018 | | | 190,250 | | | | 13,525 | | | | -- | | | | -- | | | | -- | | | | 24,434 | | | | 228,209 | |
_____________
(1) | The amounts indicated under “Change in Pension Value and Non-Qualified Deferred Compensation Earnings” consist of amounts that the Company contributed into a trust for the benefit of the Named Executive Officers under the Company’s Non-Qualified Deferred Compensation Plan. |
(2) | The amounts indicated under “All Other Compensation” consist of the following amounts that the Company paid for the benefit of the Named Executive Officers: |
| | a) | payments related to the operation of automobiles for Scott M. Quist ($7,200 for each of the years 2019 and 2018); and Garrett S. Sill, Stephen C. Johnson, S. Andrew Quist, and Jeffrey R. Stephens ($-0- for each of the years 2019 and 2018). However, such payments do not include the furnishing of an automobile by the Company to Scott M. Quist, nor the payment of insurance and property taxes with respect to the automobile operated by such executive officer; |
| | b) | group life insurance premiums that the Company paid to a group life insurance plan for Scott M. Quist, Garrett S. Sill, Stephen C. Johnson, S. Andrew Quist, and Jeffrey R. Stephens ($176 for 2019 and $178 for 2018); |
| | c) | life insurance premiums that the Company paid for the benefit of Scott M. Quist ($14,934 for each of the years 2019 and 2018); and Garrett S. Sill, Stephen C. Johnson, S. Andrew Quist, and Jeffrey R. Stephens ($-0- for each of the years 2019 and 2018); |
| | d) | medical insurance premiums that the Company paid to a medical insurance plan for Scott M. Quist ($14,251 for 2019 and $13,658 for 2018); Garrett S. Sill ($20,508 for 2019 and $19,657 for 2018); Stephen C. Johnson ($7,652 for 2019 and $6,790 for 2018); S. Andrew Quist ($20,508 for 2019 and $19,654 for 2018); and Jeffrey R. Stephens ($14,251 for 2019 and $18,140 for 2018); |
| | e) | long term disability insurance premiums that the Company paid to a provider of such insurance for Scott M. Quist, Garrett S. Sill, Stephen C. Johnson, S. Andrew Quist, and Jeffrey R. Stephens ($251 for each of the years 2019 and 2018); |
| | f) | contributions that the Company made to defined contribution plans for Scott M. Quist ($11,200 for 2019 and $11,000 for 2018); Garrett S. Sill ($10,599 for 2019 and $9,248 for 2018); Stephen C. Johnson ($-0- for 2019 and $10,838 for 2018); S. Andrew Quist ($10,344 for 2019 and $7,080 for 2018); and Jeffrey R. Stephens ($8,523 for 2019 and $5,865 for 2018); and |
| | g) | contributions that the Company made to health savings accounts for Scott M. Quist, Garrett S. Sill, S. Andrew Quist and Jeffrey R. Stephens ($-0- for each of the years 2019 and 2018); and Stephen C. Johnson ($200 for each of the years 2019 and 2018); |
SUPPLEMENTAL ALL OTHER COMPENSATION TABLE
The following table sets forth all other compensation provided the Named Executive Officers for fiscal years 2019 and 2018.
| Name of Executive Officer | | Year | | Perks and Other Personal
Benefits | | | Tax Reimbursements | | | Discounted Securities Purchases | | | Payments/ Accruals on Termination Plans | | | Registrant Contributions to Defined Contribution Plans | | | Insurance Premiums | | | Dividends or Earnings on Stock or Option Awards | | | Other (1) | |
| Scott M. Quist | | 2019 | | $ | 7,200 | | | | - | | | | - | | | | - | | | $ | 11,200 | | | $ | 29,612 | | | | - | | | | - | |
| | | 2018 | | | 7,200 | | | | - | | | | - | | | | - | | | | 11,000 | | | | 29,021 | | | | - | | | | - | |
| | | | | | | | | | | | | | | | | | | | | | | | | | | | | | | | | | | |
| Garrett S. Sill | | 2019 | | | - | | | | - | | | | - | | | | - | | | $ | 10,599 | | | $ | 20,935 | | | | - | | | | - | |
| | 2018 | | | - | | | | - | | | | - | | | | - | | | | 7,021 | | | | 20,086 | | | | - | | | | - | |
| | | | | | | | | | | | | | | | | | | | | | | | | | | | | | | | | | | |
| Stephen C. Johnson | | 2019 | | | - | | | | - | | | | - | | | | - | | | $ | - | | | $ | 8,279 | | | | - | | | | - | |
| | | 2018 | | | - | | | | - | | | | - | | | | - | | | | 10,838 | | | | 7,419 | | | | - | | | | - | |
| | | | | | | | | | | | | | | | | | | | | | | | | | | | | | | | | | | |
| S. Andrew Quist | | 2019 | | | - | | | | - | | | | - | | | | - | | | $ | 1,034 | | | $ | 20,935 | | | | - | | | | - | |
| | | 2018 | | | - | | | | - | | | | - | | | | - | | | | 7,080 | | | | 20,083 | | | | - | | | | - | |
| | | | | | | | | | | | | | | | | | | | | | | | | | | | | | | | | | | |
| Jeffrey R. Stephens | | 2019 | | | - | | | | - | | | | - | | | | - | | | $ | 8,523 | | | $ | 14,678 | | | | - | | | | - | |
| | | 2018 | | | - | | | | - | | | | - | | | | - | | | | 5,865 | | | | 18,569 | | | | - | | | | - | |
GRANTS OF PLAN-BASED AWARDS
The following table sets forth certain information regarding options granted to the Named Executive Officers during the fiscal year ended December 31, 2019.
| Name of |
| | Estimated Future Payouts Under Equity Incentive Plan Awards | | | All Other Awards: Number of Securities Underlying | | | | | Exercise or Base Price of Option | | | | | Closing Price on Grant | | | | | Grant Date Fair Value of Stock and Option | |
Executive Officer | Grant Date | | Threshold
($) | | | Target
($) | | | Maximum
($) | | | Options
(#) | | | | | Awards
($/Sh) | | | | | Date ($/Sh) | | | | | Awards
($) | |
| Scott M. Quist | 12/6/19 | | | -- | | | | -- | | | | -- | | | | 52,500 | | (1 | ) | | $ | 5.44 | | (2 | ) | | | 5.19 | | (2 | ) | | $ | 40,006 | |
| | | | | | | | | | | | | | | | | | | | | | | | | | | | | | | | | | | | |
| Garrett S. Sill | 12/6/19 | | | -- | | | | -- | | | | -- | | | | 26,250 | | (1 | ) | | | 5.19 | | (2 | ) | | | 5.19 | | (2 | ) | | | 24,900 | |
| | | | | | | | | | | | | | | | | | | | | | | | | | | | | | | | | | | | |
| Stephen C. Johnson | 12/6/19 | | | -- | | | | -- | | | | -- | | | | 10,500 | | (1 | ) | | | 5.19 | | (2 | ) | | | 5.19 | | (2 | ) | | | 9,960 | |
| | | | | | | | | | | | | | | | | | | | | | | | | | | | | | | | | | | | |
| S. Andrew Quist | 12/6/19 | | | -- | | | | -- | | | | -- | | | | 42,000 | | (1 | ) | | | 5.19 | | (2 | ) | | | 5.19 | | (2 | ) | | | 39,839 | |
| | | | | | | | | | | | | | | | | | | | | | | | | | | | | | | | | | | | |
| Jeffrey R. Stephens | 12/6/19 | | | -- | | | | -- | | | | -- | | | | 7,875 | | (1 | ) | | | 5.19 | | (2 | ) | | | 5.19 | | (2 | ) | | | 7,470 | |
__________________
| (1) | The stock options have been adjusted for the 5% annual stock dividend declared on December 6, 2019 and paid on February 7, 2020. |
| (2) | Prices have been adjusted for the effect of the 5% annual stock dividend declared on December 6, 2019 and paid on February 7, 2020. |
OUTSTANDING EQUITY AWARDS
The following table sets forth information concerning outstanding equity awards held by Named Executive Officers at December 31, 2019.
| | Option Awards | | Stock Awards | |
| Name of Executive Officer | Option Grant Date | | Number of Securities Underlying Unexercised Options Exercisable (1)
(#) | | | | Number of Securities Underlying Unexercised Options Unexercisable (1)
(#) | | | | Option Exercise Price (2)
($) | | Option Expiration Date | | Stock Award Grant
Date | | Number of Shares or Units of Stock That Have Not Vested
(#) | | Market Value of Shares or Units of Stock That Have Not Vested
($) | | Equity Incentive Plan Awards: Number of Unearned Shares, Units or Other Rights That Have Not Vested
(#) | | Equity Incentive Plan Awards: Market or Payout Value of Unearned Shares, Units or Other Rights That Have Not Vested
($) | |
| Scott M. Quist | 12/4/15 | | 127,629 | | (3 | ) | | -- | | | | | 5.72 | | 12/04/20 | | | -- | | | -- | | | -- | | | -- | | | -- | |
| | 12/2/16 | | 97,241 | | (4 | ) | | -- | | | | | 6.30 | | 12/02/21 | | | -- | | | -- | | | -- | | | -- | | | -- | |
| | 12/1/17 | | 86,822 | | | | | -- | | | | | 4.77 | | 12/02/22 | | | -- | | | -- | | | -- | | | -- | | | -- | |
| | 11/30/18 | | 77,175 | | | | | -- | | | | | 5.48 | | 11/30/23 | | | -- | | | -- | | | -- | | | -- | | | -- | |
| | 12/6/19 | | -- | | | | | 52,500 | | (7)(8) |
| | 5.44 | | 12/06/24 | | | -- | | | -- | | | -- | | | -- | | | -- | |
| | | | | | | | | | | | | | | | | | | | | | | | | | | | | | | | |
| Garrett S. Sill | 12/6/13 | | 5,629 | | | | | -- | | | | $ | 3.38 | | 12/06/23 | | | -- | | | -- | | | -- | | | -- | | | -- | |
| | 7/2/14 | | 5,361 | | | | | -- | | | | | 3.16 | | 07/02/24 | | | -- | | | -- | | | -- | | | -- | | | -- | |
| | 12/5/14 | | 10,721 | | | | | -- | | | | | 3.70 | | 12/05/24 | | | -- | | | -- | | | -- | | | -- | | | -- | |
| | 12/4/15 | | 12,763 | | | | | -- | | | | | 5.20 | | 12/04/25 | | | -- | | | -- | | | -- | | | -- | | | -- | |
| | 12/2/16 | | 12,155 | | | | | -- | | | | | 5.73 | | 12/02/26 | | | -- | | | -- | | | -- | | | -- | | | -- | |
| | 12/1/17 | | 17,365 | | (5 | ) | | -- | | | | | 4.33 | | 12/01/27 | | | -- | | | -- | | | -- | | | -- | | | -- | |
| | 11/30/18 | | 22,050 | | (6 | ) | | -- | | | | | 4.98 | | 11/30/28 | | | -- | | | -- | | | -- | | | -- | | | -- | |
| | 12/6/19 | | -- | | | | | 26,250 | | (7)(8) |
| | 5.19 | | 12/06/29 | | | -- | | | -- | | | -- | | | -- | | | -- | |
| | | | | | | | | | | | | | | | | | | | | | | | | | | | | | | | |
| Stephen C. Johnson | 4/13/12 | | 4,432 | | | | | -- | | | | $ | 1.04 | | 04/13/22 | | | -- | | | -- | | | -- | | | -- | | | -- | |
| | 12/6/13 | | 4,221 | | | | | -- | | | | | 3.38 | | 12/06/23 | | | -- | | | -- | | | -- | | | -- | | | -- | |
| | 7/2/14 | | 4,020 | | | | | -- | | | | | 3.16 | | 07/02/24 | | | -- | | | -- | | | -- | | | -- | | | -- | |
| | 12/5/14 | | 8,041 | | | | | -- | | | | | 3.70 | | 12/05/24 | | | -- | | | -- | | | -- | | | -- | | | -- | |
| | 12/4/15 | | 12,763 | | | | | -- | | | | | 5.20 | | 12/04/25 | | | -- | | | -- | | | -- | | | -- | | | -- | |
| | 12/2/16 | | 6,078 | | | | | -- | | | | | 5.73 | | 12/02/26 | | | -- | | | -- | | | -- | | | -- | | | -- | |
| | 12/1/17 | | 11,576 | | | | | -- | | | | | 4.33 | | 12/01/27 | | | -- | | | -- | | | -- | | | -- | | | -- | |
| | 12/6/19 | | -- | | | | | 10,500 | | (8 | ) | | 5.19 | | 12/06/29 | | | -- | | | -- | | | -- | | | -- | | | -- | |
| | | | | | | | | | | | | | | | | | | | | | | | | | | | | | | | |
| S. Andrew Quist | 4/13/12 | | 22,162 | | | | | -- | | | | $ | 1.04 | | 04/13/22 | | | -- | | | -- | | | -- | | | -- | | | -- | |
| | 12/6/13 | | 14,071 | | | | | -- | | | | | 3.38 | | 12/06/23 | | | -- | | | -- | | | -- | | | -- | | | -- | |
| | 7/2/14 | | 13,401 | | | | | -- | | | | | 3.16 | | 07/02/24 | | | -- | | | -- | | | -- | | | -- | | | -- | |
| | 12/5/14 | | 26,803 | | | | | -- | | | | | 3.70 | | 12/05/24 | | | -- | | | -- | | | -- | | | -- | | | -- | |
| | 12/4/15 | | 25,527 | | | | | -- | | | | | 5.20 | | 12/04/25 | | | -- | | | -- | | | -- | | | -- | | | -- | |
| | 12/2/16 | | 24,311 | | | | | -- | | | | | 5.73 | | 12/02/26 | | | -- | | | -- | | | -- | | | -- | | | -- | |
| | 12/1/17 | | 23,153 | | (5 | ) | | -- | | | | | 4.33 | | 12/01/27 | | | -- | | | -- | | | -- | | | -- | | | -- | |
| | 11/30/18 | | 27,563 | | (6 | ) | | -- | | | | | 4.98 | | 11/30/28 | | | -- | | | -- | | | -- | | | -- | | | -- | |
| | 12/6/19 | | -- | | | | | 42,000 | | (7)(8) |
| | 5.19 | | 12/06/29 | | | -- | | | -- | | | -- | | | -- | | | -- | |
| | | | | | | | | | | | | | | | | | | | | | | | | | | | | | | | |
| Jeffrey R. Stephens | 4/13/12 | | 3,695 | | | | | -- | | | | $ | 1.04 | | 04/13/22 | | | -- | | | -- | | | -- | | | -- | | | -- | |
| | 12/6/13 | | 3,519 | | | | | -- | | | | | 3.38 | | 12/06/23 | | | -- | | | -- | | | -- | | | -- | | | -- | |
| | 7/2/14 | | 3,351 | | | | | -- | | | | | 3.16 | | 07/02/24 | | | -- | | | -- | | | -- | | | -- | | | -- | |
| | 12/5/14 | | 6,701 | | | | | -- | | | | | 3.70 | | 12/05/24 | | | -- | | | -- | | | -- | | | -- | | | -- | |
| | 12/4/15 | | 6,382 | | | | | -- | | | | | 5.20 | | 12/04/25 | | | -- | | | -- | | | -- | | | -- | | | -- | |
| | 12/2/16 | | 6,078 | | | | | -- | | | | | 5.73 | | 12/02/26 | | | -- | | | -- | | | -- | | | -- | | | -- | |
| | 12/1/17 | | 5,789 | | | | | -- | | | | | 4.33 | | 12/01/27 | | | -- | | | -- | | | -- | | | -- | | | -- | |
| | 11/30/18 | | 8,269 | | | | | -- | | | | | 4.98 | | 11/30/28 | | | -- | | | -- | | | -- | | | -- | | | -- | |
| | 12/6/19 | | -- | | | | | 7,875 | | (8 | ) | | 5.19 | | 12/06/29 | | | -- | | | -- | | | -- | | | -- | | | -- | |
________________
| (1) | Except for options granted to Scott M. Quist that have five-year terms, such grants have ten year terms. The vesting of any unvested shares is subject to the recipient’s continuous employment. This reflects the equivalent of Class A common shares. |
| (2) | Exercise prices have been adjusted for the effect of annual stock dividends. |
| (3) | On December 4, 2015, Scott Quist was granted stock options to purchase 100,000 shares of Class A common stock at an exercise price of $5.72 per share or 100,000 shares of Class C common stock at an exercise price of $5.72 per share, or any combination thereof. |
| (4) | On December 2, 2016, Scott Quist was granted stock options to purchase 80,000 shares of Class A common stock at an exercise price of $6.30 per share or 80,000 shares of Class C common stock at an exercise price of $6.30 per share, or any combination thereof. |
| (5) | On December 1, 2017, Garrett S. Sill was granted stock options to purchase 15,000 shares of Class A common stock at an exercise price of $4.33 per share or 15,000 shares of Class C common stock at an exercise price of $4.33 per share, or any combination thereof. Also, on December 1, 2017, S. Andrew Quist was granted stock options to purchase 20,000 shares of Class A common stock at an exercise price of $4.33 per share or 20,000 shares of Class C common stock at an exercise price of $4.33 per share, or any combination thereof. |
| (6) | On November 30, 2018, Garrett S. Sill was granted stock options to purchase 20,000 shares of Class A common stock at an exercise price of $4.98 per share or 20,000 shares of Class C common stock at an exercise price of $4.98 per share, or any combination thereof. Also, on November 30, 2018, S. Andrew Quist was granted stock options to purchase 25,000 shares of Class A common stock at an exercise price of $4.98 per share or 20,000 shares of Class C common stock at an exercise price of $4.98 per share, or any combination thereof. |
| (7) | On December 6, 2019, Scott M. Quist was granted stock options to purchase 50,000 shares of Class A common stock at an exercise price of $5.44 per share or 50,000 shares of Class C common stock at an exercise price of $5.44 per share, or any combination thereof. Also, on December 6, 2019, Garrett S. Sill was granted stock options to purchase 25,000 shares of Class A common stock at an exercise price of $5.19 per share or 25,000 shares of Class C common stock at an exercise price of $5.19 per share, or any combination thereof. Also, on December 6, 2019, S. Andrew Quist was granted stock options to purchase 40,000 shares of Class A common stock at an exercise price of $5.19 per share or 40,000 shares of Class C common stock at an exercise price of $5.19 per share, or any combination thereof. |
| (8) | Stock options vest at the rate of 25% of the total number of shares subject to the options on March 1, 2020 and 25% of the total number of shares on the last day of each three month period thereafter. |
OPTION AWARDS VESTING SCHEDULE
The following table sets forth the vesting schedule of unexercisable options reported in the “Number of Securities Underlying Unexercised Options – Unexercisable” column of the table above.
| Grant Date | | Vesting |
| 4/13/12 | | These options vested 25% per quarter over a one year period after the grant date. |
| 12/06/13 | | These options vested 25% per quarter over a one year period after the grant date. |
| 07/02/14 | | These options vested 25% per quarter over a one year period after the grant date. |
| 12/05/14 | | These options vested 25% per quarter over a one year period after the grant date. |
| 12/04/15 | | These options vested 25% per quarter over a one year period after the grant date. |
| 12/02/16 | | These options vested 25% per quarter over a one year period after the grant date. |
| 12/01/17 | | These options vested 25% per quarter over a one year period after the grant date. |
| 11/30/18 | | These options vested 25% per quarter over a one year period after the grant date. |
| 12/06/19 | | These options vest 25% per quarter over a one year period after the grant date. |
OPTION EXERCISES AND STOCK VESTED
The following table sets forth all stock options exercised and value received upon exercise, and all stock awards vested and value realized upon vesting, by the Named Executive Officers during the year ended December 31, 2019.
| | | Option Awards | | | Stock Awards | |
| | | Number of Shares Acquired on Exercise | | | Value Realized on Exercise | | | Number of Shares Acquired on Vesting | | | Value Realized on Vesting | |
Name of Executive Officer | | | (#) |
| | ($) | | | | (#) |
| | ($) | |
| Scott M. Quist | | | 191,443 | | | $ | 208,673 | | | | -- | | | | -- | |
| Garrett S. Sill | | | -- | | | | -- | | | | -- | | | | -- | |
| Stephen C. Johnson | | | -- | | | | -- | | | | -- | | | | -- | |
| S. Andrew Quist | | | -- | | | | -- | | | | -- | | | | -- | |
| Jeffrey R. Stephens | | | -- | | | | -- | | | | -- | | | | -- | |
PENSION BENEFITS
The following table sets forth the present value as of December 31, 2019 of the benefit of the Named Executive Officers under the defined benefit pension plan.
Name of
Executive Officer | Plan Name | | Number of Years Credited Service
(#) | | | Present Value of Accumulated Benefit
($) | | | Payments During Last Fiscal Year
($) | |
| Scott M. Quist | None | | | -- | | | | -- | | | | -- | |
| Garrett S. Sill | None | | | -- | | | | -- | | | | -- | |
| Stephen C. Johnson | None | | | -- | | | | -- | | | | -- | |
| S. Andrew Quist | None | | | -- | | | | -- | | | | -- | |
| Jeffrey R.Stephens | None | | | -- | | | | -- | | | | -- | |
EQUITY COMPENSATION PLAN INFORMATION
The following table sets forth certain information as of December 31, 2019 with respect to compensation plans (including individual compensation arrangements) under which the Company’s equity securities are authorized for issuance, aggregated as follows:
| • | All compensation plans previously approved by security holders; and |
| | |
| • | All compensation plans previously approved by security holders; and |
| | | A |
| | B |
| | C |
|
Plan Category | | Number of Securities to be Issued upon Exercise of Outstanding Options, Warrants and Rights | | | Weighted Average Exercise Price of Outstanding Options, Warrants and Rights | | | Number of Securities Remaining Available for Future Issuance under Equity Compensation Plans (Excluding Securities Reflected in Column A) | |
| Equity compensation plans approved by stockholders (1) | | | 1,680,185 | (2) | | $ | 4.41 | (2) | | | 205,664 | (3) |
| Equity compensation plans not approved by stockholders | | | 0 | | | | - | | | | 0 | |
__________
| (1) | This reflects the 2013 Stock Option Plan (the "2013 Plan") and the 2014 Director Stock Option Plan (the "2014 Director Plan"). The 2013 Plan was approved by the stockholders at the annual stockholders meeting held on July 12, 2013, which reserved 450,000 shares of Class A common stock of which 150,000 shares of Class A common stock could be issued in place of up to 150,000 shares of Class C common stock for issuance thereunder. The 2014 Director Plan was approved by stockholders at the annual stockholders meeting held on July 2, 2014, which reserved 150,000 shares of Class A common stock for issuance thereunder. The 2013 Plan was amended by the stockholders at the annual stockholders meeting held on July 1, 2015 to authorize an additional 450,000 shares of Class A common stock to be available for issuance under the Plan, of which up to 200,000 Class A common shares may be issued as up to 200,000 shares of Class C common stock. The 2013 Plan was further amended by the stockholders at the annual stockholders meeting held on June 29, 2017 to authorize an additional 500,000 shares of Class A common stock to be available for issuance under the Plan, of which up to 250,000 Class A common shares may be issued in place of up to 250,000 shares of Class C common stock. |
| (2) | The weighted average exercise prices reflect solely the shares of Class A common stock that will be issued upon exercise of outstanding options. |
| (3) | This number includes 188,054 shares of Class A common stock available for future issuance under the 2013 Plan, and 17,610 shares of Class A common stock available for future issuance under the 2014 Director Plan. |
Employment Agreement with Scott M. Quist
On December 4, 2012, the Company entered into an employment agreement with Scott M. Quist, Chairman of the Board, President, and Chief Executive Officer of the Company. The agreement was for a six-year term beginning on December 4, 2012 and ending on December 4, 2018. Under the terms of the Agreement, the Board of Directors may, in its sole discretion, extend the term of the agreement for an additional four-year term provided that Mr. Quist has continued to perform his duties with usual and customary care, diligence and prudence commensurate with his position with the Company. In addition, Mr. Quist is required to perform such additional duties as may be assigned to him from time to time by the Company’s Board of Directors.
Effective December 4, 2018, the Board members approved a motion to extend Mr. Quist’s employment agreement for an additional four-year term ending December 2022. Mr. Quist abstained from voting on the motion to extend his employment agreement for the additional four-year term. Under the terms of the agreement, Mr. Quist is to devote his full time to the Company, serving as Chairman of the Board, President and Chief Executive Officer at not less than his current salary and benefits. The Company also agrees to maintain a group term life insurance policy of not less than $1,000,000 and a whole life insurance policy in the amount of $500,000 on Mr. Quist’s life. In the event of disability, Mr. Quist’s salary would be continued for up to five years at 75% of its current level of compensation.
In the event of a sale or merger of the Company and Mr. Quist is not retained in his current position, the Company would be obligated to continue paying Mr. Quist’s current compensation and benefits for seven years following the merger or sale. The employment agreement further provides that Mr. Quist is entitled to receive annual retirement benefits beginning (i) one month from the date of his retirement (to commence no sooner than age 65), (ii) five years following complete disability, or (iii) upon termination of his employment without cause. These retirement benefits are to be paid for a period of twenty years in annual installments in the amount equal to 75% of his then current level of compensation. In the event that Mr. Quist dies prior to receiving all retirement benefits thereunder, the remaining benefits are to be paid to his heirs. The Company expensed $660,000 and $660,000 during the years ended December 31, 2019 and 2018, respectively, to cover the present value of anticipated retirement benefits under the employment agreement. The liability accrued was $5,851,670 and $5,191,670 as of December 31, 2019 and 2018, respectively.
Director Compensation
Directors of the Company (but not including directors who are employees) are currently paid a director’s fee of $21,600 per year by the Company for their services and are reimbursed for their expenses in attending board and committee meetings. An additional fee of $750 is paid to each audit committee member for each audit committee meeting attended. Each director is provided with an annual grant of stock options to purchase 1,000 shares of Class A common stock, which occurred under the 2000 Director Stock Option Plan for years 2000 to 2005, under the 2006 Director Stock Option Plan and under the 2014 Director Plan for years 2006 to 2019. During 2019 each director was granted additional stock options to purchase 1,000 shares of Class A common stock.
DIRECTOR COMPENSATION
The following table sets forth the compensation of the Company’s non-employee directors for fiscal 2019.
| Name | | Fees Earned or Paid in Cash
($) | | | Stock Awards ($) | | | Option Awards ($) | | | Non-Equity Incentive Plan Compensation ($) | | | Change in Pension Value and Nonqualified Deferred Compensation Earnings | | | All Other Compensation ($) | | | Total
($) | |
| John L. Cook (1) | | $ | 23,850 | | | | -- | | | $ | 5,976 | | | | -- | | | | -- | | | | -- | | | $ | 29,826 | |
| Gilbert A. Fuller (2) | | | 23,850 | | | | -- | | | | 5,976 | | | | -- | | | | -- | | | | -- | | | | 29,826 | |
| Robert G. Hunter, M.D. (3) | | | 21,600 | | | | -- | | | | 5,976 | | | | -- | | | | -- | | | | -- | | | | 27,576 | |
| H. Craig Moody (4) | | | 23,850 | | | | -- | | | | 5,976 | | | | -- | | | | -- | | | | -- | | | | 29,826 | |
| Norman G. Wilbur (5) | | | 23,850 | | | | -- | | | | 5,976 | | | | -- | | | | -- | | | | -- | | | | 29,826 | |
_______________________
| (1) | Mr. Cook has options to purchase 45,289 shares of the Company’s Class A common stock. |
| (2) | Mr. Fuller has options to purchase 46,767 shares of the Company’s Class A common stock. |
| (3) | Dr. Hunter has options to purchase 73,239 shares of the Company’s Class A common stock. |
| (4) | Mr. Moody has options to purchase 72,773 shares of the Company’s Class A common stock. |
| (5) | Mr. Wilbur has options to purchase 30,505 shares of the Company’s Class A common stock. |
Employee 401(k) Retirement Savings Plan
In 1995, the Company’s Board of Directors adopted a 401(k) Retirement Savings Plan. Under the terms of the 401(k) plan, effective as of January 1, 1995, the Company made discretionary employer matching contributions to its employees who choose to participate in the plan. The plan allowed the board to determine the amount of the contribution at the end of each year. During the period from January 1, 1995 to December 31, 2007 the Board had adopted a contribution formula specifying that such discretionary employer matching contributions would equal 50% of the participating employee’s contribution to the plan to purchase the Company’s stock up to a maximum discretionary employee contribution of 1/2 of 1% of participating employees’ compensation, as defined by the plan.
All persons who have completed at least one year’s service with the Company and satisfy other plan requirements are eligible to participate in the 401(k) plan. All Company matching contributions are invested in the Company’s Class A common stock. Also, the Company may contribute at the discretion of the Company’s Board of Directors an Employer Profit Sharing Contribution to the 401(k) plan. The Employer Profit Sharing Contribution is to be divided among three different classes of participants in the plan based upon the participant’s title in the Company. All amounts contributed to the plan are deposited into a trust fund administered by an independent trustee.
Beginning January 1, 2008, the Company elected to be a “Safe Harbor” Plan for its matching 401(k) contributions. The Company will match 100% of up to 3% of an employee’s total annual compensation and 50% of 4% to 5% of an employee’s annual compensation. The match is in shares of the Company’s Class A common stock. The Company’s contribution for 2019 and 2018 was $695,560 and $1,480,913 respectively, under the “Safe Harbor” plan.
Stock Repurchase Plan
On September 7, 2018, the Board approved the Security National Financial Stock Repurchase Plan that authorized the repurchase of 300,000 shares of the Company's Class A Common Stock in the open market. The repurchased shares of Class A common stock will be held as treasury shares to be used as the Company's employer matching contribution to the Employee 401(k) Retirement Savings Plan.
Employee Stock Ownership Plan (ESOP)
Effective January 1, 1980, the Company adopted an employee stock ownership plan (the “ESOP Plan”) for the benefit of career employees of the Company and its subsidiaries. Under the ESOP Plan, the Company used discretionary power to make contributions on behalf of all eligible employees into a trust created under the ESOP Plan. Employees became eligible to participate in the ESOP Plan when they attained the age of 19 and completed one year of service (a twelve month period in which the Employee completes at least 1,040 hours of service).
The Company’s contributions under the ESOP Plan were allocated to eligible employees on the same ratio that each eligible employee’s compensation bears to total compensation for all eligible employees during each year. Benefits under the ESOP Plan vested as follows: 20% after the second year of eligible service by an employee and an additional 20% each year thereafter of eligible service until 100% vested. Benefits under the ESOP Plan will be paid out in one lump sum or in installments in the event the employee becomes disabled, reaches the age of 65, or is terminated by the Company or demonstrates financial hardship.
On November 25, 2019, the Company distributed a “Notice of Intent to Terminate” the ESOP Plan to all current plan participants. The Company also filed Form 5310 “Application for Determination for Terminating Plan”, with the IRS on December 6, 2019. The Company is awaiting approval of its application from the IRS prior to its final distribution of the ESOP Plan assets to the participants. At December 31, 2019, the ESOP Plan had 495,618 shares of SNFC Class A and 307,491 shares of Class C Stock. The trustees of the trust fund under the ESOP Plan are Scott M. Quist (Chairman), S. Andrew Quist, and Robert G. Hunter, who each serve as a director of the Company.
Non-Qualified Deferred Compensation Plan
In 2001, the Company’s Board of Directors adopted a Non-Qualified Deferred Compensation Plan, and this plan was amended in 2005 and later in 2019. Under the terms of the plan, the Company will provide deferred compensation for a select group of management or highly compensated employees, within the meaning of Sections 201(2), 301(a)(3) and 401(a)(1) of the Employee Retirement Income Security Act of 1974, as amended. The board has appointed a committee of the Company to be the plan administrator and to determine the employees who are eligible to participate in the plan. The employees who participate may elect to defer a portion of their compensation into the plan. The Company may contribute into the plan at the discretion of the Company’s Board of Directors. The Company did not make any contributions for 2019 and 2018. The investment committees of the Company’s Non-Qualified Deferred Compensation Plan consists of Scott M. Quist, Stephen C. Johnson, and Garrett S. Sill.
NON-QUALIFIED DEFERRED COMPENSATION
The following table sets forth contributions to the non-qualified deferred compensation account of the Named Executive Officers in fiscal 2019 and the aggregate balance of deferred compensation of the Named Executive Officers at December 31, 2019.
| | | Executive | | | Registrant | | | Aggregate | | | Aggregate | | | Aggregate | |
| | | Contributions | | | Contributions | | | Earnings | | | Withdrawals | | | Balance | |
| | | In Last FY | | | In Last FY | | | in last FY | | | Distributions | | | at last FYE | |
Name | | ($) | | | ($) | | | ($) | | | ($) | | | ($) | |
| | | | | | | | | | | | | | | | |
| Scott M. Quist | | | -- | | | | -- | | | | -- | | | | -- | | | $ | 566,241 | |
| Garrett S. Sill | | | -- | | | | -- | | | | -- | | | | -- | | | | -- | |
| Stephen C. Johnson | | | -- | | | | -- | | | | -- | | | | -- | | | $ | 37,319 | |
| S. Andrew Quist | | | -- | | | | -- | | | | -- | | | | -- | | | | -- | |
| Jeffrey R. Stephens | | | -- | | | | -- | | | | -- | | | | -- | | | | -- | |
2013 Stock Option Plan
On August 24, 2013, the Company adopted the Security National Financial Corporation 2013 Stock Option Plan (the “2013 Plan”), which reserved 450,000 shares of Class A common stock to be made available for issuance thereunder, of which up to 150,000 shares of Class C common stock could be issued in place of up to 150,000 shares of Class A common stock. The 2013 Plan provides for the grant of options and the award or sale of stock to officers, directors, and employees of the Company. Both “incentive stock options”, as defined under Section 422A of the Internal Revenue Code of 1986 and “non-qualified options” may be granted under the 2013 Plan.
On July 1, 2015, the stockholders approved an amendment to the 2013 Plan to authorize an additional 450,000 shares of Class A common stock under the Plan, of which up to 200,000 Class C common stock may be issued in place of up to 200,000 shares of Class A common stock. On June 29, 2017, the stockholders approved an amendment to the 2013 Plan to authorize an additional 500,000 shares of Class A common stock under the Plan, of which up to 250,000 Class C common stock may be issued in place of up to 250,000 shares of Class A common stock.
The 2013 Plan is to be administered by the Board of Directors or by a committee designated by the Board. The terms of options granted or stock awards or sales affected under the 2013 Plan are to be determined by the Board of Directors or its committee. No options may be exercised for a term of more than ten years from the date of the grant. Options intended as incentive stock options may be issued only to employees, and must meet certain conditions imposed by the Internal Revenue Code, including a requirement that the option exercise price be no less than the fair market value of the option shares on the date of grant. The 2013 Plan provides that the exercise price for non-qualified options will not be less than at least 50% of the fair market value of the stock subject to such option as of the date of grant of such options, as determined by the Company’s Board of Directors.
The 2013 Plan also provides that if the shares of common stock shall be subdivided or combined into a greater or smaller number of shares or if the Company shall issue any shares of common stock as a stock dividend on its outstanding common stock, the number of shares of common stock deliverable upon the exercise of options shall be increased or decreased proportionately, an appropriate adjustments shall be made in the purchase prices to reflect such subdivision, combination or stock dividend. In addition, the number of shares of common stock reserved for purposes of the plan shall be adjusted by the same proportion. No options may be exercised for a term of more than ten years from the date of grant.
On December 4, 2015, the Board of Directors approved a resolution to amend the Company’s 2013 Stock Option Plan to include additional equity incentive awards. These additional incentive awards in the plan consist of Stock Appreciation Rights (SARs), Restricted Stock Units (RSUs) and Performance Share Awards. Stock Appreciation Rights are awards that entitle the recipient to receive cash or stock equal to the excess of the Company’s stock price on the date the SAR is exercised. Restricted Stock Units entitle the recipient to receive RSUs that require the Company on the distribution dates to transfer to the recipient one unrestricted, fully transferable share of stock for each RSU scheduled to be paid out on that date. Performance Share Awards entitle the recipient to receive stock based on the Company meeting certain performance goals.
The 2013 Plan has a term of ten years. The Board of Directors may amend or terminate the 2013 Plan at any time, from time to time, subject to approval of certain modifications to the 2013 Plan by the stockholders of the Company as may be required by law or the 2013 Plan.
2014 Director Stock Option Plan
On May 16, 2014, the Company adopted the 2014 Director Stock Option Plan (the “2014 Director Plan”). The 2014 Director Plan provides for the grant by the Company of options to purchase up to an aggregate of 150,000 shares of Class A common stock for issuance there under. The 2014 Director Plan provides that each member of the Company’s Board of Directors who is not an employee or paid consultant of the Company is automatically eligible to receive options to purchase the Company’s Class A common stock under the plan. The 2014 Director Plan replaces the Company’s 2006 Director Plan, which was terminated on July 2, 2014.
In addition, the 2014 Director Plan provides that beginning on December 7, 2014, and on each anniversary date thereof during the term plan, each outside director shall automatically receive an option to purchase 1,000 shares of Class A common stock. Also, each new outside director who joins the Board after the effective date shall be granted an option to purchase 1,000 shares of Class A common stock upon the date which such person first becomes an outside director and an annual grant of an option to purchase 1,000 shares of Class A common stock on each anniversary date thereof during the term of the 2014 Director Plan. The options granted to outside directors shall vest in four equal quarterly installments over a one year period from the date of grant, until such shares are fully vested. The primary purposes of the 2014 Director Plan are to enhance the Company’s ability to attract and retain well-qualified persons for service as directors and to provide incentives to such directors to continue their association with the Company.
In the event of a merger of the Company with or into another company, or a consolidation, acquisition of stock or assets or other change in control transaction involving the Company, each option granted under the 2014 Director Plan becomes exercisable in full, unless such option is assumed by the successor corporation. In the event the transaction is not approved by a majority of the “Continuing Directors” (as defined in the 2014 Director Plan), each option becomes fully vested and exercisable in full immediately prior to the consummation of such transaction, whether or not assumed by the successor corporation.
Stock Purchase Plan
On September 11, 2015, the Board approved the Security National Financial Corporation Stock Purchase Plan for the mutual benefit of the Company and its stockholders. Under the terms of the Plan, the Company has the option to purchase shares of Class A common stock from its officers and directors who exercise the stock options granted to them under any of the Company’s stock option plans with the proceeds from such purchase to be used to pay the taxes owed by such officers and directors as a result of the exercise of their stock options. Additionally, the officers and directors who exercise their stock options may, in their discretion, request that the Company purchase shares of their Class A common stock with the proceeds from such sale to be used to pay the taxes owed by such officers and directors as a result of the exercise of their stock options.
The Company is authorized under the plan to purchase no more than 60,000 shares of Class A common stock in any calendar year to pay the taxes owed by the officers and directors who exercise their stock options under the Stock Purchase Plan. The Company’s purchase price for the Class A common stock under the Stock Purchase Plan shall be equal to the closing sales price of the Company’s Class A common stock as reported by The Nasdaq National Market on the day that the applicable stock options are exercised by such officers and directors. The Company may only purchase shares of Class A common stock from the officers and directors exercising their stock options under the Stock Purchase Plan during the “Trading Window” as defined in the Company’s Insider Trading Policy and Guidelines.
Compliance with Section 16(a) of the Securities Exchange Act of 1934
Section 16(a) of the Securities Exchange Act of 1934, as amended, requires the Company’s executive officers, directors and persons who own more than 10% of a registered class of the Company’s equity securities to file reports of ownership and periodic changes in ownership of the Company’s Class A and Class C common stock with the Securities and Exchange Commission. Such persons are also required to furnish the Company with copies of all Section 16(a) reports they file.
Based solely on its review of the copies of stock reports received by the Company with respect to fiscal 2019, or written representations from certain reporting persons, the Company believes that its directors, executive officers and greater than 10% beneficial owners complied with all Section 16(a) filing requirements applicable to them, except that each of the executive officers and directors, through an oversight, filed one late Form 4 report disclosing the granting of stock options on December 6, 2019.
Item 12 - Security Ownership of Certain Beneficial Owners and Management and Related Stockholder Matters
The following table sets forth security ownership information of the Company’s Class A and Class C common stock as of March 31, 2020, (i) for persons who own beneficially more than 5% of the Company’s outstanding Class A or Class C common stock, (ii) for each director of the Company, and (iii) for all executive officers and directors of the Company as a group.
| | | Class A
Common Stock | | | Class C
Common Stock | | | Class A and
Class C
Common Stock | |
| | | | | | | | | | | | | | | | | | | |
| | | Amount | | | Percent | | | Amount | | | Percent | | | Amount | | | Percent | |
| | | Beneficially | | | of | | | Beneficially | | | of | | | Beneficially | | | of | |
Name and Address (1) | | Owned | | | Class | | | Owned | | | Class | | | Owned | | | Class | |
| | | | | | | | | | | | | | | | | | |
George R. and Shirley C. Quist Family Partnership, Ltd. (2) | | | 1,443,659 | | | | 9.2 | % | | | 856,553 | | | | 34.4 | % | | | 2,300,212 | | | | 12.6 | % |
401(k) Retirement Savings Plan (3) | | | 2,132,195 | | | | 13.6 | % | | | - | | | | - | | | | 2,132,195 | | | | 11.7 | % |
Scott M. Quist (4)(5)(6)(7)(8) | | | 517,812 | | | | 3.3 | % | | | 1,495,547 | | | | 54.8 | % | | | 2,013,359 | | | | 10.8 | % |
| M3 Funds, LLC (9) | | | 1,073,409 | | | | 6.7 | % | | | - | | | | - | | | | 1,073,409 | | | | 5.8 | % |
Non-Qualified Deferred Compensation Plan (10) | | | 931,140 | | | | 5.9 | % | | | - | | | | - | | | | 931,140 | | | | 5.1 | % |
Employee Stock Ownership Plan (ESOP) (11) | | | 520,399 | | | | 3.3 | % | | | 322,866 | | | | 13.0 | % | | | 843,265 | | | | 4.6 | % |
Jason G. Overbaugh (12) | | | 270,581 | | | | 1.7 | % | | | 58,591 | | | | 2.3 | % | | | 329,172 | | | | 1.8 | % |
S. Andrew Quist (6)(13) | | | 207,657 | | | | 1.3 | % | | | 61,216 | | | | 2.4 | % | | | 268,873 | | | | 1.5 | % |
Associated Investors (14) | | | 85,087 | | | | * | | | | 132,853 | | | | 5.3 | % | | | 217,940 | | | | 1.2 | % |
| Estate of George R. Quist | | | 128,061 | | | | * | | | | 79,539 | | | | 3.2 | % | | | 207,600 | | | | 1.2 | % |
Garrett S. Sill (5)(7)(15) | | | 120,079 | | | | * | | | | 45,977 | | | | 1.8 | % | | | 166,056 | | | | * | |
Jeffrey R. Stephens (16) | | | 136,755 | | | | * | | | | - | | | | - | | | | 136,755 | | | | * | |
| Adam G. Quist (17) | | | 57,624 | | | | * | | | | 48,602 | | | | 1.9 | % | | | 106,226 | | | | * | |
H. Craig Moody (18) | | | 104,481 | | | | * | | | | - | | | | - | | | | 104,481 | | | | * | |
| Stephen C. Johnson(5)(7)(19) | | | 85,722 | | | | * | | | | - | | | | - | | | | 85,722 | | | | * | |
Robert G. Hunter, M.D. (6)(20) | | | 80,901 | | | | * | | | | - | | | | - | | | | 80,901 | | | | * | |
Gilbert A. Fuller (21) | | | 42,745 | | | | * | | | | - | | | | - | | | | 42,745 | | | | * | |
John L. Cook (22) | | | 40,563 | | | | * | | | | - | | | | - | | | | 40,563 | | | | * | |
Norman G. Wilbur (23) | | | 26,462 | | | | * | | | | - | | | | - | | | | 26,462 | | | | * | |
All directors and executive officers (12 persons)
| | | 1,691,382 | | | | 10.3 | % | | | 1,709,933 | | | | 59.4 | % | | | 3,401,315 | | | | 17.5 | % |
* Less than 1%
________
| (1) | Unless otherwise indicated, the address of each listed stockholder is c/o Security National Financial Corporation, 121 West Election Road, Suite 100, Draper, Utah 84020. |
| (2) | This stock is owned by the George R. and Shirley C. Quist Family Partnership, Ltd., of which Scott M. Quist is the managing general partner and, accordingly, exercises sole voting and investment powers with respect to such shares. |
| (3) | The investment committee of the 401(k) Retirement Savings Plan consists of Scott M. Quist, Stephen C. Johnson and Garrett S. Sill, who exercise shared voting and investment powers with respect to such shares. |
| (4) | Mr. Scott Quist is the Company’s Chairman of the Board, President, and Chief Executive Officer. Includes options to purchase 163,997 shares of Class A common stock and 237,995 shares of Class C common stock that are currently exercisable or will become exercisable within 60 days of March 31, 2020. Mr. Quist’s options to purchase 237,995 shares of Class C common stock may also, at Mr. Quist’s election, consist of options to purchase 237,995 shares of Class A common stock, or any combination thereof. Mr. Quist has elected to purchase Class C common shares with such options to the extent there are sufficient authorized but unissued Class C common shares available for issuance with respect to such options. Otherwise, Mr. Quist will elect to purchase shares of Class A common stock with respect to such options. |
| (5) | Does not include 2,132,195 shares of Class A common stock owned by the Company’s 401(k) Retirement Savings Plan, of which Scott M. Quist, Stephen C. Johnson and Garrett S. Sill are members of the investment committee and, accordingly, exercise shared voting and investment powers with respect to such shares. |
| (6) | Does not include 520,399 shares of Class A common stock and 322,866 shares of Class C common stock owned by the Company’s Employee Stock Ownership Plan (ESOP), of which Scott M. Quist, S. Andrew Quist and Robert G. Hunter are the trustees and, accordingly, exercise shared voting and investment powers with respect to such shares. |
| (7) | Does not include 931,140 shares of Class A common stock owned by the Company’s Non-Qualified Deferred Compensation Plan, of which Scott M. Quist, Stephen C. Johnson and Garrett S. Sill are members of the investment committee and, accordingly, exercise shared voting and investment powers with respect to such shares. |
| (8) | Does not include 85,087 shares of Class A common stock and 132,853 shares of Class C common stock owned by Associated Investors, a Utah general partnership, of which Scott M. Quist is the managing partner and, accordingly, exercises sole voting and investment powers with respect to such shares. |
| (9) | Based solely on the Schedule 13G/A filed on February 12, 2020, Jason A. Stock, Manager of M3 Partners, LP, a Delaware limited partnership, and M3 Funds, LLC, a Delaware limited liability company, General Partner of M3 Partners, LP; Jason A. Stock, Manager of M3 Funds, LLC; Jason A. Stock, Managing Director of M3F, Inc., a Utah corporation; Jason A. Stock, individually, and William C. Waller, individually, exercise shared voting and investment powers with respect to 1,073,409 shares of the Company’s Class A common stock, or 6.7% of the outstanding shares of the Company’s Class A common stock. The address of all entities and individuals filing the Schedule 13G/A is 10 Exchange Place, Suite 510, Salt Lake City, Utah 84111. |
| (10) | The investment committee of the Company’s Non-Qualified Deferred Compensation Plan consists of Scott M. Quist, Stephen C. Johnson, and Garrett S. Sill, who exercise shared voting and investment powers with respect to such shares. |
| (11) | The trustees of the Employee Stock Ownership Plan (ESOP) consist of Scott M. Quist, S. Andrew Quist, and Robert G. Hunter who exercise shared voting and investment powers with respect to such shares. |
| (12) | Mr. Overbaugh is the Company’s Vice President, National Marketing Director of Life Insurance, and a director. Includes options to purchase 104,113 shares of Class A common stock and options to purchase 58,591 shares of Class C common stock that are currently exercisable or will become exercisable within 60 days of March 31, 2020. The options to purchase 58,591 shares of Class C common stock may also, at Mr. Overbaugh’s election, consist of options to purchase 58,591 shares of Class A common stock, or any combination thereof. Mr. Overbaugh has elected to purchase Class C common shares with such options to the extent there are sufficient authorized but unissued Class C common shares available for issuance with respect to such options. Otherwise, Mr. Overbaugh will elect to purchase shares of Class A common stock with respect to such options. |
| (13) | Mr. Andrew Quist is the Company’s Vice President, General Counsel, and a director. Includes options to purchase 126,275 shares of Class A common stock and options to purchase 61,216 shares of Class C common stock that are currently exercisable or will become exercisable within 60 days of March 31, 2020. The options to purchase 61,216 shares of Class C common stock may also, at Mr. Quist’s election, consist of options to purchase 61,216 shares of Class A common stock, or any combination thereof. Mr. Andrew Quist has elected to purchase Class C common shares with such options to the extent there are sufficient authorized but unissued Class C common shares available for issuance with respect to such options. Otherwise, Mr. Quist will elect to purchase shares of Class A common stock with respect to such options. |
| (14) | The managing general partner of Associated Investors is Scott M. Quist, who exercises sole voting and investment powers with respect to such shares. |
| (15) | Mr. Sill is the Company’s Chief Financial Officer and Treasurer. Includes options to purchase 46,629 shares of Class A common stock and options to purchase 45,977 shares of Class C common stock that are currently exercisable or will become exercisable within 60 days of March 31, 2020. The options to purchase 45,977 shares of Class C common stock may also, at Mr. Sill’s election, consist of options to purchase 45,977 shares of Class A common stock, or any combination thereof. Mr. Sill has elected to purchase Class C common shares with such options to the extent there are sufficient authorized but unissued Class C common shares available for issuance with respect to such options. Otherwise, Mr. Sill will elect to purchase shares of Class A common stock with respect to such options. |
| (16) | Mr. Stephens is the Company’s Senior General Counsel and Secretary. Includes options to purchase 45,752 shares of Class A common stock granted to Mr. Stephens that are currently exercisable or will become exercisable within 60 days of March 31, 2020. |
| (17) | Mr. Adam Quist is the Vice President – Memorial Services, Assistant Secretary, and General Counsel of the Company. Includes options to purchase 23,770 shares of Class A common stock and options to purchase 48,602 shares of Class C common stock that are currently exercisable or will become exercisable within 60 days of March 31, 2020. The options to purchase 48,602 shares of Class C common stock may also, at Mr. Quist’s election, consist of options to purchase 48,602 shares of Class A common stock, or any combination thereof. Mr. Adam Quist has elected to purchase Class C common shares with such options to the extent there are sufficient authorized but unissued Class C common shares available for issuance with respect to such options. Otherwise, Mr. Quist will elect to purchase shares of Class A common stock with respect to such options. |
| (18) | Mr. Moody is a director of the Company. Includes options to purchase 58,738 shares of Class A common stock granted to Mr. Moody that are currently exercisable or will become exercisable within 60 days of March 31, 2020. |
| (19) | Mr. Johnson is the Company’s Vice President of Mortgage Operations. Includes options to purchase 53,756 shares of Class A common stock granted to Mr. Johnson that are currently exercisable or will become exercisable within 60 days of March 31, 2020. |
| (20) | Dr. Hunter is a director of the Company. Includes options to purchase 68,513 shares of Class A common stock granted to Dr. Hunter that are currently exercisable or will become exercisable within 60 days of March 31, 2020. |
| (21) | Mr. Fuller is a director of the Company. Includes options to purchase 42,041 shares of Class A common stock granted to Mr. Fuller that are currently exercisable or will become exercisable within 60 days of March 31, 2020. |
| (22) | Mr. Cook is a director of the Company. Includes options to purchase 40,563 shares of Class A common stock granted to Mr. Cook that are currently exercisable or will become exercisable within 60 days of March 31, 2020. |
| (23) | Mr. Wilbur is a director of the Company. Includes options to purchase 25,779 shares of Class A common stock granted to Mr. Wilbur that are currently exercisable or will become exercisable within 60 days of March 31, 2020. |
The Company’s executive officers and directors, as a group, own beneficially approximately 17.5% of the outstanding shares of the Company’s Class A and Class C common stock.
Item 13. Certain Relationships and Related Transactions and Director Independence
The Company’s Board of Directors has a written procedure, which requires disclosure to the Board of any material interest or any affiliation on the part of any of its officers, directors or employees that is in conflict or may be in conflict with the interests of the Company.
Item 14. Principal Accounting Fees and Services
The following table summarizes the fees of the Company’s current independent auditors, billed to the Company for each of the last two fiscal years for audit and other services. All of these fees were reviewed and approved by the Audit Committee of the Board of Directors:
Fee Category | | 2019 | | | 2018 | |
| Audit Fees (1) | | $ | 917,200 | | | $ | 778,738 | |
| Audit-Related Fees (2) | | | 26,250 | | | | 25,500 | |
| Tax Fees (3) | | | 92,350 | | | | 90,800 | |
| All Other Fees (4) | | | - | | | | - | |
| | | $ | 1,035,800 | | | $ | 895,038 | |
_____________
| (1) | Audit fees consist of aggregate fees billed for professional services rendered for the audit of the Company’s annual financial statements and review of the interim financial statements included in quarterly reports or services that are normally provided by the independent auditor in connection with statutory and regulatory filings for the years ended December 31, 2019 and 2018. |
| (2) | Audit related fees consist of aggregate fees billed for assurance and related services that are reasonably related to the performance of the audit or review of the Company’s financial statements and are not reported under “Audit Fees”. These fees include review of registration statements, and audits of the Company’s ESOP and 401(k) Plans. |
| (3) | Tax fees consist of aggregate fees billed for professional services for tax compliance, tax advice, and tax planning. |
| (4) | All other fees consist of aggregate fees billed for products and services by the independent auditors, other than those disclosed above. |
PART IV
Item 15. Exhibits, Financial Statement Schedules
(a)(1) Financial Statements
See “Index to Consolidated Financial Statements” under Item 8 above.
(a)(2) Financial Statement Schedules
II. Condensed Balance Sheets as of December 31, 2019 and 2018 and Condensed
Statement of Earnings and Cash Flows for the years ended 2019 and 2018
IV. Reinsurance
V. Valuation and Qualifying Accounts
All other schedules to the consolidated financial statements required by Article 7 of Regulation S‑X are not required under the related instructions or are inapplicable and therefore have been omitted.
(a)(3) Exhibits
The following Exhibits are filed herewith pursuant to Rule 601 of Regulation S‑K or are incorporated by reference to previous filings.
3.1 | |
| | |
3.2 | |
| | |
4.1 | Specimen Class A Stock Certificate (1) |
| | |
4.2 | Specimen Class C Stock Certificate (1) |
| | |
4.3 | Specimen Preferred Stock Certificate and Certificate of Designation of Preferred Stock (1) |
| | |
10.1 | Employee Stock Ownership Plan, as amended and restated (ESOP) and Trust Agreement (1) |
| | |
10.2 | |
| | |
10.3 | |
| | |
10.4 | |
| | |
10.5 | |
| | |
10.6 | |
| | |
10.7 | |
| | |
10.8 | |
| | |
10.9 | |
| | |
10.10 | |
14 | |
| | |
21 | |
| | |
23.1 | |
| | |
23.2 | |
| | |
31.1 | |
| | |
31.2 | |
| | |
32.1 | |
| | |
32.2 | |
| | |
101.xml | Instance Document |
| | |
101.xsd | Taxonomy Extension Schema Document |
| | |
101.cal | Taxonomy Extension Calculation Linkbase Document |
| | |
101.def | Taxonomy Extension Definition Linkbase Document |
| | |
101.lab | Taxonomy Extension Label Linkbase Document |
| | |
101.pre | Taxonomy Extension Presentation Linkbase Document |
_______
(1) | Incorporated by reference from Registration Statement on Form S‑1, as filed on June 29, 1987 |
(2) | Incorporated by reference from Schedule 14A Definitive Proxy Statement, as filed on June 2, 2014, related to Company’s Annual Meeting of Stockholders |
(3) | Incorporated by reference from Report on Form 10-Q, as filed on November 13, 2015 |
(4) | Incorporated by reference from Report on Form 10-Q, as filed on August 15, 2016 |
(5) | Incorporated by reference from Registration Statement on Form S-8, as filed on September 7, 2016 |
| Incorporated by reference from Report on Form 10-K, as filed on March 31, 2017 |
(7) | Incorporated by reference from Report on Form 8-K, as filed on June 6, 2018 |
(8) | Incorporated by reference from Report on Form 10-Q, as filed on November 13, 2018 |
(9) | Incorporated by reference from Report on Form 8-K, as filed on February 28, 2019 |
(10) | Incorporated by reference from Report on Form 10-Q, as filed on May 15, 2019 |
(11) | Incorporated by reference from Report on Form 8-K, as filed on November 12, 2019 |
(12) | Incorporated by reference from Report on Form 8-K/A, as filed on February 26, 2020 |
SIGNATURES
Pursuant to the requirements of Section 13 or 15(d) of the Securities Exchange Act of 1934, the Registrant has duly caused this report to be signed on its behalf by the undersigned, thereunto duly authorized.
| | | SECURITY NATIONAL FINANCIAL CORPORATION |
| | | |
| | | |
Dated: March 30, 2020 | By: | /s/ Scott M. Quist |
| | | Scott M. Quist |
| | | Chairman of the Board, President and Chief Executive Officer |
Pursuant to the requirements of the Securities Exchange Act of 1934, this report has been signed below by the following persons on behalf of the Registrant and in the capacities and on the dates indicated:
SIGNATURE | TITLE | DATE |
| | | |
/s/ Scott M. Quist | Chairman of the Board, President | |
Scott M. Quist | and Chief Executive Officer | |
| | (Principal Executive Officer) | March 30, 2020 |
| | | |
/s/ Garrett S. Sill | Chief Financial Officer and | |
Garrett S. Sill | Treasurer (Principal Financial | |
| | and Accounting Officer) | March 30, 2020 |
| | | |
/s/ Jason G. Overbaugh | Vice President and Director | March 30, 2020 |
Jason G. Overbaugh | | |
| | | |
/s/ S. Andrew Quist | Vice President and Director | March 30, 2020 |
S. Andrew Quist | | |
| | | |
/s/ John L. Cook | Director | March 30, 2020 |
John L. Cook | | |
| | | |
/s/ Gilbert A. Fuller | Director | March 30, 2020 |
Gilbert A. Fuller | | |
| | | |
/s/ Robert G. Hunter | Director | March 30, 2020 |
Robert G. Hunter | | |
| | | |
/s/ H. Craig Moody | Director | March 30, 2020 |
H. Craig Moody | | |
| | | |
/s/ Norman G. Wilbur | Director | March 30, 2020 |
Norman G. Wilbur | | |
Schedule II
SECURITY NATIONAL FINANCIAL CORPORATION
(Parent Company Only)
Condensed Financial Information
Condensed Balance Sheets
| | | December 31 | |
| | | 2019 | | | 2018 | |
| Assets | | | | | | |
| | | | | | | |
| Mortgage loans held for investment | | $ | 2,952,000 | | | $ | 2,179,000 | |
| Accrued investment income | | | 192,608 | | | | - | |
| Cash | | | 1,432,830 | | | | 6,217,897 | |
| Investment in subsidiaries (equity method) | | | 188,187,440 | | | | 166,020,225 | |
| Receivable from affiliates | | | 13,190,260 | | | | 13,136,647 | |
| Restricted cash | | | 3,180,382 | | | | 3,265,075 | |
| Property and equipment, at cost, net of accumulated depreciation of $1,659,613 for 2019 and $1,659,613 for 2018 | | | - | | | | - | |
| Other | | | 2,422 | | | | - | |
| Total assets | | $ | 209,137,942 | | | $ | 190,818,844 | |
See accompanying notes to condensed financial statements.
Schedule II (Continued)
SECURITY NATIONAL FINANCIAL CORPORATION
(Parent Company Only)
Condensed Financial Information
Condensed Balance Sheets (Continued)
| | | December 31 | |
| | | 2019 | | | 2018 | |
| Liabilities and Stockholders’ Equity Liabilities | | | | | | |
| Bank and other loans payable: | | | | | | |
| Current installments | | $ | 1,334,798 | | | $ | 579,286 | |
| Long-term | | | 3,903,821 | | | | 1,238,619 | |
| Advances from affiliated companies | | | 640,774 | | | | 9,089,255 | |
| Other liabilities and accrued expenses | | | 1,847,705 | | | | 1,892,261 | |
| Income taxes | | | 4,700,239 | | | | 6,208,250 | |
| Total liabilities | | | 12,427,337 | | | | 19,007,671 | |
| | | | | | | | | |
| Stockholders’ Equity | | | | | | | | |
| Preferred stock - non-voting - $1.00 par value; 5,000,000 shares authorized; none issued or outstanding | | | - | | | | - | |
| Class A common stock $2.00 par value; 20,000,000 shares authorized; issued 16,107,779 shares in 2019 and 15,304,798 shares in 2018 | | | 32,215,558 | | | | 30,609,596 | |
| Class B non-voting common stock-$1.00 par value; 5,000,000 shares authorized; none issued or outstanding | | | - | | | | - | |
| Class C convertible common stock, $2.00 par value; 3,000,000 shares authorized; issued 2,500,887 shares in 2019 and 2,193,643 shares in 2018 | | | 5,001,774 | | | | 4,387,286 | |
| Additional paid-in capital | | | 46,091,112 | | | | 41,821,778 | |
| Accumulated other comprehensive income, net of taxes | | | 13,726,514 | | | | (2,823 | ) |
| Retained Earnings | | | 101,256,229 | | | | 95,201,732 | |
| Treasury stock at cost - 490,823 Class A shares and -0- Class C shares in 2019; 302,541 Class A shares and -0- Class C shares in 2018, held by affiliated companies | | | (1,580,582 | ) | | | (206,396 | ) |
| Total stockholders’ equity | | | 196,710,605 | | | | 171,811,173 | |
| Total Liabilities and Stockholders’ Equity | | $ | 209,137,942 | | | $ | 190,818,844 | |
See accompanying notes to condensed financial statements.
Schedule II (Continued)
SECURITY NATIONAL FINANCIAL CORPORATION
(Parent Company Only)
Condensed Financial Information
Condensed Statements of Earnings
| | | Years Ended December 31 | |
| | | 2019 | | | 2018 | |
| Revenue | | | | | | |
| Net investment income | | $ | 260,022 | | | $ | 186,464 | |
| Fees from affiliates | | | 1,152,480 | | | | 1,151,763 | |
| Other Income | | | 23,864 | | | | 48,219 | |
| Total revenue | | | 1,436,366 | | | | 1,386,446 | |
| | | | | | | | | |
| Benefits and Expenses: | | | | | | | | |
| General and administrative expenses | | | 1,100,010 | | | | 570,869 | |
| Interest expense | | | 68,821 | | | | 90,793 | |
| Total benefits and expenses | | | 1,168,831 | | | | 661,662 | |
| | | | | | | | | |
| Earnings before income taxes, and earnings of subsidiaries | | | 267,535 | | | | 724,784 | |
| Income tax benefit | | | 304,548 | | | | 20,793 | |
| Equity in earnings of subsidiaries | | | 10,321,436 | | | | 20,940,502 | |
| | | | | | | | | |
| Net earnings | | $ | 10,893,519 | | | $ | 21,686,079 | |
See accompanying notes to condensed financial statements.
Schedule II (Continued)
SECURITY NATIONAL FINANCIAL CORPORATION
(Parent Company Only)
Condensed Financial Information
Condensed Statements of Cash Flow
| | | Years Ended December 31 | |
| | | 2019 | | | 2018 | |
| Cash flows from operating activities: | | | | | | |
| Net earnings | | $ | 10,893,519 | | | $ | 21,686,079 | |
| Adjustments to reconcile net earnings to net cash provided by operating activities: | | | | | | | | |
| Undistributed earnings of affiliates | | | 10,321,436 | | | | 20,940,502 | |
| Provision for deferred and other income taxes | | | (1,508,011 | ) | | | (21,034 | ) |
| Stock based compensation expense | | | 256,996 | | | | 237,123 | |
| Benefit plans funded with treasury stock | | | 695,560 | | | | 1,480,913 | |
| Change in assets and liabilities: | | | | | | | | |
| Other assets | | | (2,422 | ) | | | - | |
| Other liabilities | | | (44,558 | ) | | | 752,154 | |
| | | | | | | | | |
| Net cash provided by operating activities | | | 20,612,520 | | | | 45,075,737 | |
| | | | - | | | | - | |
| Cash flows from investing activities: | | | | | | | | |
| Investment in subsidiaries | | | (18,759,314 | ) | | | (40,644,827 | ) |
| Mortgage loans held for investment made | | | (2,593,000 | ) | | | (3,893,000 | ) |
| Payments received for mortgage loans held for investment | | | 1,820,000 | | | | 3,439,000 | |
| | | | | | | | | |
| Net cash used in investing activities | | | (19,532,314 | ) | | | (41,098,827 | ) |
| | | | | | | | | |
| Cash flows from financing activities: | | | | | | | | |
| Advances to affiliates | | | (8,694,702 | ) | | | 1,889,398 | |
| Purchase of treasury stock | | | (1,539,888 | ) | | | (215,521 | ) |
| Proceeds from stock options exercised | | | 863,910 | | | | 57,412 | |
| Repayment of bank loans | | | (579,286 | ) | | | (640,204 | ) |
| Proceeds from borrowing on bank loans | | | 4,000,000 | | | | - | |
| | | | | | | | | |
| Net cash provided by (used in) financing activities | | | (5,949,966 | ) | | | 1,091,085 | |
| | | | | | | | | |
| Net change in cash, cash equivalents, restricted cash and restricted cash equivalents | | | (4,869,760 | ) | | | 5,067,995 | |
| Cash, cash equivalents, restricted cash and restricted cash equivalents at beginning of year | | | 9,482,972 | | | | 4,414,977 | |
| Cash, cash equivalents, restricted cash and restricted cash equivalents at end of year | | $ | 4,613,212 | | | $ | 9,482,972 | |
See accompanying notes to condensed financial statements.
Schedule II (Continued)
SECURITY NATIONAL FINANCIAL CORPORATION
(Parent Company Only)
Condensed Financial Information
Notes to Condensed Financial Statements
1) Bank and Other Loans Payable
| | | December 31 | |
| | | 2019 | | | 2018 | |
| | | | | | | |
| 4.27% fixed note payable in monthly installments of $53,881 including principal and interest, collateralized by shares of Security National Life Insurance Company stock, due December 2021. | | $ | 1,238,619 | | | $ | 1,817,905 | |
| | | | | | | | | |
| Prime rate note payable in monthly installements of $75,108 including principal and interest, collateralized by shares of Security National Life Insurance Company stock, due December 2024 | | | 4,000,000 | | | | - | |
| | | | | | | | | |
| Total bank and other loans | | | 5,238,619 | | | | 1,817,905 | |
| | | | | | | | | |
| Less current installments | | | 1,334,798 | | | | 579,286 | |
| | | | | | | | | |
| Bank and other loans, excluding current installments | | $ | 3,903,821 | | | $ | 1,238,619 | |
The Company has a $2,000,000 revolving line-of-credit with a bank with interest payable at the prime rate minus .75%, secured by the capital stock of Security National Life and maturing September 30, 2020, renewable annually. At December 31, 2019, the Company was contingently liable under a standby letter of credit aggregating $625,405, to be used as collateral to cover any contingency related to additional risk assessments pertaining to the Company's captive insurance program. The Company does not expect any material losses to result from the issuance of the standby letter of credit. This standby letter of credit will draw on the line of credit if necessary. The Company does not expect any material losses to result from the issuance of the standby letter of credit because claims are not expected to exceed premiums paid. As of December 31, 2019, there were no amounts outstanding under the revolving line-of-credit.
The following tabulation shows the combined maturities of bank and other loans payable:
| 2020 | | $ | 1,334,798 | |
| 2021 | | | 1,394,369 | |
| 2022 | | | 797,923 | |
| 2023 | | | 837,210 | |
| 2024 | | | 874,319 | |
| Thereafter | | | - | |
| Total | | $ | 5,238,619 | |
Schedule II (Continued)
SECURITY NATIONAL FINANCIAL CORPORATION
(Parent Company Only)
Condensed Financial Information
Notes to Condensed Financial Statements
2) Advances from Affiliated Companies
| | | December 31 | |
| | | 2019 | | | 2018 | |
| Non-interest bearing advances from affiliates: | | | | | | |
| Cemetery and Mortuary subsidiary | | $ | 638,418 | | | $ | 1,459,841 | |
| Life insurance subsidiaries | | | 2,356 | | | | 7,629,414 | |
| | | $ | 640,774 | | | $ | 9,089,255 | |
3) Dividends and Capital Contributions
In 2019, SecurityNational Mortgage Company paid cash dividends of $1,199,865 and declared cash dividends of $2,435,605 to be paid to the registrant at a future date to be determined by the Board of Directors. In 2018, SecurityNational Mortgage Company, a wholly owned subsidiary of the Registrant, paid to the registrant cash dividends of $204,886 and declared cash dividends of $3,195,841 to be paid to the registrant at a future date to be determined by the Board of Directors.
In 2019, the Company made capital contributions to its subsidiaries in the amounts of $2,983,493 to Memorial Estates, Inc., $37,430 to Memorial Mortuary, Inc., $160,799 to Greer Wilson Funeral Home, Inc., $150,000 to Beta Capital Corp., $550,000 to C&J Financial, LLC and $4,000,000 to Security National Life.
Schedule IV
SECURITY NATIONAL FINANCIAL CORPORATION
AND SUBSIDIARIES
Reinsurance
| | | | | | | | | | | | | | | Percentage | |
| | | | | | Ceded to | | | Assumed | | | | | | of Amount | |
| | | Direct | | | Other | | | from Other | | | Net | | | Assumed | |
| | | Amount | | | Companies | | | Companies | | | Amount | | | to Net | |
2019 | | | | | | | | | | | | | | | |
| Life Insurance in force ($000) | | $ | 2,778,103 | | | $ | 465,460 | | | $ | 99,299 | | | $ | 2,411,942 | | | | 4.1 | % |
| | | | | | | | | | | | | | | | | | | | | |
| Premiums: | | | | | | | | | | | | | | | | | | | | |
| Life Insurance | | $ | 81,825,194 | | | $ | 547,762 | | | $ | 472,886 | | | $ | 81,750,318 | | | | 0.6 | % |
| Accident and Health Insurance | | | 110,282 | | | | - | | | | 10 | | | | 110,292 | | | | 0.0 | % |
| Total premiums | | $ | 81,935,476 | | | $ | 547,762 | | | $ | 472,896 | | | $ | 81,860,610 | | | | 0.6 | % |
| | | | | | | | | | | | | | | | | | | | | |
2018 | | | | | | | | | | | | | | | | | | | | |
| Life Insurance in force ($000) | | $ | 1,735,888 | | | $ | 56,707 | | | $ | 102,600 | | | $ | 1,781,781 | | | | 5.8 | % |
| | | | | | | | | | | | | | | | | | | | | |
| Premiums: | | | | | | | | | | | | | | | | | | | | |
| Life Insurance | | $ | 75,754,594 | | | $ | 432,647 | | | $ | 510,514 | | | $ | 75,832,461 | | | | 0.7 | % |
| Accident and Health Insurance | | | 96,437 | | | | - | | | | 12 | | | | 96,449 | | | | 0.0 | % |
| Total premiums | | $ | 75,851,031 | | | $ | 432,647 | | | $ | 510,526 | | | $ | 75,928,910 | | | | 0.7 | % |
Schedule V
SECURITY NATIONAL FINANCIAL CORPORATION
AND SUBSIDIARIES
Valuation and Qualifying Accounts
| | | | | | Additions | | | Deductions | | | | | | | |
| | | Balance at | | | Charged to | | | Disposals | | | | | | Balance | |
| | | Beginning | | | Costs and | | | and | | | | | | at End of | |
| | | of Year | | | Expenses | | | Write-offs | | | Reclassifications | | | Year | |
For the Year Ended December 31, 2019 | | | | | | | | | | | | | | | |
| | | | | | | | | | | | | | | |
Accumulated depreciation on real estate held for investment | | $ | 16,739,578 | | | $ | 3,472,289 | | | $ | (2,093,633 | ) | | $ | (5,329,495 | ) | | $ | 12,788,739 | |
| | | | | | | | | | | | | | | | | | | | |
Allowance for losses on mortgage loans held for investment | | | 1,347,972 | | | | 137,757 | | | | (32,692 | ) | | | - | | | | 1,453,037 | |
| | | | | | | | | | | | | | | | | | | | | |
Accumulated depreciation on property and equipment | | | 17,496,601 | | | | 1,711,369 | | | | (69,878 | ) | | | 380,799 | | | | 19,518,891 | |
| | | | | | | | | | | | | | | | | | | | |
Allowance for doubtful accounts on receivables | | | 1,519,842 | | | | 267,374 | | | | (63,060 | ) | | | - | | | | 1,724,156 | |
| | | | | | | | | | | | | | | | | | | | | |
Allowance for doubtful accounts on other investments | | | 1,092,528 | | | | 797,557 | | | | (442,059 | ) | | | - | | | | 1,448,026 | |
| | | | | | | | | | | | | | | | | | | | | |
For the Year Ended December 31, 2018 | | | | | | | | | | | | | | | | | | | | |
| | | | | | | | | | | | | | | | | | | | |
Accumulated depreciation on real estate held for investment | | $ | 18,788,869 | | | $ | 3,589,184 | | | $ | (5,638,475 | ) | | $ | - | | | $ | 16,739,578 | |
| | | | | | | | | | | | | | | | | | | | |
Allowance for losses on mortgage loans held for investment | | | 1,768,796 | | | | (415,099 | ) | | | (5,725 | ) | | | - | | | | 1,347,972 | |
| | | | | | | | | | | | | | | | | | | | | |
Accumulated depreciation on property and equipment | | | 17,572,326 | | | | 1,867,001 | | | | (1,942,726 | ) | | | - | | | | 17,496,601 | |
| | | | | | | | | | | | | | | | | | | | |
Allowance for doubtful accounts on receivables | | | 1,544,518 | | | | 71,326 | | | | (96,002 | ) | | | - | | | | 1,519,842 | |
| | | | | | | | | | | | | | | | | | | | |
Allowance for doubtful accounts on other investments | | | 846,641 | | | | 721,456 | | | | (475,569 | ) | | | - | | | | 1,092,528 | |
140