UNITED STATES
SECURITIES AND EXCHANGE COMMISSION
Washington, D.C. 20549
FORM N-CSR
CERTIFIED SHAREHOLDER REPORT OF
REGISTERED MANAGEMENT INVESTMENT COMPANIES
Investment Company Act file number 811-03090
MFS SERIES TRUST VII
(Exact name of registrant as specified in charter)
500 Boylston Street, Boston, Massachusetts 02116
(Address of principal executive offices) (Zip code)
Susan S. Newton
Massachusetts Financial Services Company
500 Boylston Street
Boston, Massachusetts 02116
(Name and address of agents for service)
Registrant’s telephone number, including area code: (617) 954-5000
Date of fiscal year end: July 31
Date of reporting period: January 31, 2012
| ITEM 1. | REPORTS TO STOCKHOLDERS. |

MFS® Asia Pacific ex-Japan Fund

SEMIANNUAL REPORT
January 31, 2012
AJX-SEM
MFS® ASIA PACIFIC EX-JAPAN FUND
The report is prepared for the general information of shareholders.
It is authorized for distribution to prospective investors only when preceded or accompanied by a current prospectus.
NOT FDIC INSURED Ÿ MAY LOSE VALUE Ÿ NO BANK GUARANTEE

LETTER FROM THE CHAIRMAN AND CEO
Dear Shareholders:
We are indeed living through some volatile times. Economic uncertainty is everywhere, as it seems no place in the world has been unmoved by crisis. Over the past year, we have seen a devastating earthquake and tsunami that have led to disruptions in the Japanese markets and supply chains. Protests have changed the face of the Middle East and left in their wake lingering tensions and questions about oil supplies. We have seen debt limits tested in Europe and the United States and policymakers grappling to craft often unpopular monetary and fiscal responses as consumers and businesses struggle with what appears to be a slowing global economy. And now, as the US economy begins to regain its footing, we see the economies of the eurozone heading toward recession as the region’s leaders continue to address sovereign debt crises.
When markets become volatile, managing risk becomes a top priority for investors and their advisors. At MFS® risk management is foremost in our minds in all market climates. Our analysts and portfolio managers keep risks firmly in mind when evaluating securities. Additionally, we have a team of quantitative analysts that measures and assesses the risk profiles of our portfolios and securities on an ongoing basis. The chief investment risk officer, who oversees the team, reports directly to the firm’s president and chief investment officer so the risk associated with each portfolio can be assessed objectively and independently.
As always, we continue to be mindful of the many economic challenges faced at the local, national, and international levels. It is in times such as these that we want to remind investors of the merits of maintaining a long-term view, adhering to basic investing principles such as asset allocation and diversification, and working closely with their advisors to research and identify appropriate investment opportunities.
Respectfully,

Robert J. Manning
Chairman and Chief Executive Officer
MFS Investment Management®
March 19, 2012
The opinions expressed in this letter are subject to change, may not be relied upon for investment advice, and no forecasts can be guaranteed.
1
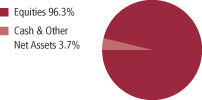
PORTFOLIO COMPOSITION
Portfolio structure
| | | | |
| Top ten holdings | | | | |
Taiwan Semiconductor
Manufacturing Co. Ltd. | | | 5.0% | |
| Samsung Electronics Co. Ltd. | | | 4.3% | |
| Westpac Banking Corp. | | | 3.7% | |
| China Unicom (Hong Kong) Ltd. | | | 3.5% | |
| Rio Tinto PLC | | | 3.4% | |
| Sands China Ltd. | | | 3.3% | |
| Spark Infrastructure Group, IEU | | | 2.9% | |
| AIA Group Ltd. | | | 2.7% | |
| China Construction Bank | | | 2.6% | |
| National Australia Bank Ltd. | | | 2.6% | |
| Equity sectors (a) | | | | |
| Financial Services | | | 31.1% | |
| Basic Materials | | | 15.9% | |
| Technology | | | 12.8% | |
| Utilities & Communications | | | 8.4% | |
| Energy | | | 7.4% | |
| Special Products & Services | | | 3.8% | |
| Leisure | | | 3.8% | |
| Retailing | | | 3.8% | |
| Industrial Goods & Services | | | 3.8% | |
| Consumer Staples | | | 2.5% | |
| Autos & Housing | | | 2.1% | |
| Health Care | | | 0.9% | |
| |
| Issuer country weightings (x) | | | | |
| Australia | | | 22.4% | |
| China | | | 18.7% | |
| Hong Kong | | | 14.9% | |
| South Korea | | | 8.9% | |
| Taiwan | | | 8.6% | |
| India | | | 8.5% | |
| United States | | | 4.9% | |
| United Kingdom | | | 3.4% | |
| Singapore | | | 2.9% | |
| Other Countries | | | 6.8% | |
2
Portfolio Composition – continued
| | | | |
| Currency exposure weightings (y) | |
| Hong Kong Dollar | | | 32.9% | |
| Australian Dollar | | | 22.4% | |
| United States Dollar | | | 13.4% | |
| South Korean Won | | | 8.9% | |
| Taiwan Dollar | | | 8.6% | |
| British Pound Sterling | | | 3.4% | |
| Singapore Dollar | | | 2.9% | |
| Indonesian Rupiah | | | 2.8% | |
| Thailand Baht | | | 2.2% | |
| Other Currencies | | | 2.5% | |
| (a) | The sectors depicted are economic aggregates made up of several underlying industry categories. The fund may invest between 25% and 35% of its total assets in any industry that represents 20% or more of the Asia Pacific market excluding Japan as a whole, as measured by an index determined by the adviser to be an appropriate measure of the Asia Pacific market excluding Japan. As of January 31, 2012, the fund did not have more than 25% of its total assets invested in any one industry. |
| (x) | Represents the portfolio’s exposure to issuer countries as a percentage of a portfolio’s net assets. |
| (y) | Represents the portfolio’s exposure to a particular currency as a percentage of a portfolio’s net assets. |
Percentages are based on net assets as of 1/31/12.
The portfolio is actively managed and current holdings may be different.
3
EXPENSE TABLE
Fund expenses borne by the shareholders during the period,
August 1, 2011 through January 31, 2012
As a shareholder of the fund, you incur two types of costs: (1) transaction costs, including sales charges (loads) on certain purchase or redemption payments, and (2) ongoing costs, including management fees; distribution and service (12b-1) fees; and other fund expenses. This example is intended to help you understand your ongoing costs (in dollars) of investing in the fund and to compare these costs with the ongoing costs of investing in other mutual funds.
The example is based on an investment of $1,000 invested at the beginning of the period and held for the entire period August 1, 2011 through January 31, 2012.
Actual Expenses
The first line for each share class in the following table provides information about actual account values and actual expenses. You may use the information in this line, together with the amount you invested, to estimate the expenses that you paid over the period. Simply divide your account value by $1,000 (for example, an $8,600 account value divided by $1,000 = 8.6), then multiply the result by the number in the first line under the heading entitled “Expenses Paid During Period” to estimate the expenses you paid on your account during this period.
Hypothetical Example for Comparison Purposes
The second line for each share class in the following table provides information about hypothetical account values and hypothetical expenses based on the fund’s actual expense ratio and an assumed rate of return of 5% per year before expenses, which is not the fund’s actual return. The hypothetical account values and expenses may not be used to estimate the actual ending account balance or expenses you paid for the period. You may use this information to compare the ongoing costs of investing in the fund and other funds. To do so, compare this 5% hypothetical example with the 5% hypothetical examples that appear in the shareholder reports of the other funds.
Please note that the expenses shown in the table are meant to highlight your ongoing costs only and do not reflect any transactional costs, such as sales charges (loads). Therefore, the second line for each share class in the table is useful in comparing ongoing costs only, and will not help you determine the relative total costs of owning different funds. In addition, if these transactional costs were included, your costs would have been higher.
4
Expense Table – continued
| | | | | | | | | | | | |
Share
Class | | | | Annualized
Expense
Ratio | | Beginning
Account Value
8/01/11 | | Ending
Account Value
1/31/12 | | Expenses
Paid During
Period (p)
8/01/11-1/31/12 | |
| A | | Actual | | 1.70% | | $1,000.00 | | $920.43 | | | $8.21 | |
| | Hypothetical (h) | | 1.70% | | $1,000.00 | | $1,016.59 | | | $8.62 | |
| B | | Actual | | 2.45% | | $1,000.00 | | $916.65 | | | $11.80 | |
| | Hypothetical (h) | | 2.45% | | $1,000.00 | | $1,012.82 | | | $12.40 | |
| C | | Actual | | 2.45% | | $1,000.00 | | $917.31 | | | $11.81 | |
| | Hypothetical (h) | | 2.45% | | $1,000.00 | | $1,012.82 | | | $12.40 | |
| I | | Actual | | 1.45% | | $1,000.00 | | $921.54 | | | $7.00 | |
| | Hypothetical (h) | | 1.45% | | $1,000.00 | | $1,017.85 | | | $7.35 | |
| (h) | 5% class return per year before expenses. |
| (p) | Expenses paid is equal to each class’ annualized expense ratio, as shown above, multiplied by the average account value over the period, multiplied by the number of days in the period, divided by the number of days in the year. Expenses paid do not include any applicable sales charges (loads). If these transaction costs had been included, your costs would have been higher. |
5
PORTFOLIO OF INVESTMENTS
1/31/12 (unaudited)
The Portfolio of Investments is a complete list of all securities owned by your fund. It is categorized by broad-based asset classes.
| | | | | | | | |
| Common Stocks - 88.6% | | | | | | | | |
| Issuer | | Shares/Par | | | Value ($) | |
| | | | | | | | |
| Apparel Manufacturers - 2.4% | | | | | | | | |
| Li & Fung Ltd. | | | 16,000 | | | $ | 34,985 | |
| Samsonite International S.A. (a) | | | 7,800 | | | | 12,351 | |
| Stella International Holdings Ltd. | | | 5,500 | | | | 12,624 | |
| | | | | | | | |
| | | | | | | $ | 59,960 | |
| Automotive - 2.1% | | | | | | | | |
| Guangzhou Automobile Group Co. Ltd., “H” | | | 16,000 | | | $ | 17,351 | |
| Kia Motors Corp. | | | 280 | | | | 16,825 | |
| Mando Corp. | | | 120 | | | | 19,442 | |
| | | | | | | | |
| | | | | | | $ | 53,618 | |
| Brokerage & Asset Managers - 1.4% | | | | | | | | |
| Computershare Ltd. | | | 3,532 | | | $ | 28,686 | |
| Hong Kong Exchanges & Clearing Ltd. | | | 400 | | | | 6,942 | |
| | | | | | | | |
| | | | | | | $ | 35,628 | |
| Business Services - 1.3% | | | | | | | | |
| Cognizant Technology Solutions Corp., “A” (a) | | | 460 | | | $ | 33,005 | |
| | |
| Chemicals - 1.3% | | | | | | | | |
| Nufarm Ltd. (a) | | | 6,679 | | | $ | 32,334 | |
| | |
| Computer Software - Systems - 2.9% | | | | | | | | |
| Asustek Computer, Inc. | | | 4,660 | | | $ | 36,855 | |
| Hon Hai Precision Industry Co. Ltd. | | | 11,800 | | | | 38,007 | |
| | | | | | | | |
| | | | | | | $ | 74,862 | |
| Conglomerates - 2.5% | | | | | | | | |
| Hutchison Whampoa Ltd. | | | 5,000 | | | $ | 47,548 | |
| Wesfarmers Ltd. | | | 535 | | | | 17,210 | |
| | | | | | | | |
| | | | | | | $ | 64,758 | |
| Consumer Products - 1.2% | | | | | | | | |
| Hengan International Group Co. Ltd. | | | 3,500 | | | $ | 31,298 | |
| | |
| Containers - 0.8% | | | | | | | | |
| Brambles Ltd. | | | 2,565 | | | $ | 19,797 | |
6
Portfolio of Investments (unaudited) – continued
| | | | | | | | |
| Issuer | | Shares/Par | | | Value ($) | |
| | | | | | | | |
| Common Stocks - continued | | | | | | | | |
| Electronics - 9.3% | | | | | | | | |
| Samsung Electronics Co. Ltd. | | | 111 | | | $ | 109,384 | |
| Taiwan Semiconductor Manufacturing Co. Ltd. | | | 48,000 | | | | 127,351 | |
| | | | | | | | |
| | | | | | | $ | 236,735 | |
| Energy - Independent - 2.9% | | | | | | | | |
| China Shenhua Energy Co. Ltd. | | | 3,000 | | | $ | 13,191 | |
| CNOOC Ltd. | | | 17,000 | | | | 34,941 | |
| Oil Search Ltd. | | | 3,500 | | | | 24,524 | |
| | | | | | | | |
| | | | | | | $ | 72,656 | |
| Energy - Integrated - 1.1% | | | | | | | | |
| China Petroleum & Chemical Corp. | | | 24,000 | | | $ | 29,152 | |
| | |
| Engineering - Construction - 2.3% | | | | | | | | |
| Hyundai Development Co. Ltd. (a) | | | 600 | | | $ | 12,124 | |
| Keppel Corp. Ltd. | | | 5,300 | | | | 45,717 | |
| | | | | | | | |
| | | | | | | $ | 57,841 | |
| Food & Beverages - 0.8% | | | | | | | | |
| Want Want China Holdings Ltd. | | | 22,000 | | | $ | 20,396 | |
| | |
| Food & Drug Stores - 1.4% | | | | | | | | |
| CP All PLC | | | 8,900 | | | $ | 16,836 | |
| Dairy Farm International Holdings Ltd. | | | 1,800 | | | | 17,658 | |
| | | | | | | | |
| | | | | | | $ | 34,494 | |
| Gaming & Lodging - 3.3% | | | | | | | | |
| Sands China Ltd. (a) | | | 24,800 | | | $ | 83,943 | |
| | |
| Insurance - 5.3% | | | | | | | | |
| AIA Group Ltd. | | | 20,200 | | | $ | 67,461 | |
| China Pacific Insurance (Group) Co. Ltd. | | | 8,600 | | | | 28,610 | |
| QBE Insurance Group Ltd. | | | 3,132 | | | | 38,106 | |
| | | | | | | | |
| | | | | | | $ | 134,177 | |
| Machinery & Tools - 1.3% | | | | | | | | |
| Sinotruk (Hong Kong) Ltd. | | | 23,000 | | | $ | 12,990 | |
| T.K. Corp. (a) | | | 885 | | | | 19,538 | |
| | | | | | | | |
| | | | | | | $ | 32,528 | |
| Major Banks - 9.1% | | | | | | | | |
| BOC Hong Kong Holdings Ltd. | | | 6,500 | | | $ | 17,182 | |
| Industrial & Commercial Bank Of China Ltd. | | | 77,000 | | | | 53,913 | |
7
Portfolio of Investments (unaudited) – continued
| | | | | | | | |
| Issuer | | Shares/Par | | | Value ($) | |
| | | | | | | | |
| Common Stocks - continued | | | | | | | | |
| Major Banks - continued | | | | | | | | |
| National Australia Bank Ltd. | | | 2,581 | | | $ | 65,352 | |
| Westpac Banking Corp. | | | 4,190 | | | | 94,082 | |
| | | | | | | | |
| | | | | | | $ | 230,529 | |
| Medical Equipment - 0.9% | | | | | | | | |
| Fisher & Paykel Healthcare Corp. Ltd. | | | 13,591 | | | $ | 23,902 | |
| | |
| Metals & Mining - 8.0% | | | | | | | | |
| BHP Billiton Ltd. | | | 979 | | | $ | 38,955 | |
| Iluka Resources Ltd. | | | 2,979 | | | | 57,940 | |
| Maanshan Iron & Steel Co. Ltd. | | | 62,000 | | | | 21,425 | |
| Rio Tinto PLC | | | 1,430 | | | | 85,742 | |
| | | | | | | | |
| | | | | | | $ | 204,062 | |
| Network & Telecom - 0.6% | | | | | | | | |
| HTC Corp. | | | 1,000 | | | $ | 16,409 | |
| | |
| Other Banks & Diversified Financials - 8.2% | | | | | | | | |
| China Construction Bank (a) | | | 82,500 | | | $ | 66,061 | |
| CIMB Group Holdings Berhad | | | 8,900 | | | | 20,217 | |
| ICICI Bank Ltd., ADR | | | 560 | | | | 20,278 | |
| PT Bank Negara Indonesia Tbk | | | 32,697 | | | | 13,184 | |
| PT Bank Rakyat Indonesia (Persero) Tbk | | | 37,000 | | | | 28,192 | |
| Shinhan Financial Group Co. Ltd. (a) | | | 660 | | | | 26,292 | |
| Siam Commercial Bank Public Co. Ltd. | | | 5,500 | | | | 21,520 | |
| United Overseas Bank Ltd. | | | 1,000 | | | | 13,785 | |
| | | | | | | | |
| | | | | | | $ | 209,529 | |
| Precious Metals & Minerals - 2.1% | | | | | | | | |
| Newcrest Mining Ltd. | | | 1,508 | | | $ | 53,985 | |
| | |
| Real Estate - 5.6% | | | | | | | | |
| BWP Trust, REIT | | | 13,307 | | | $ | 24,652 | |
| CapitaMall Trust, REIT | | | 10,000 | | | | 13,595 | |
| China Overseas Land & Investment Ltd. | | | 14,000 | | | | 26,103 | |
| Hang Lung Properties Ltd. | | | 11,000 | | | | 37,800 | |
| Sun Hung Kai Properties Ltd. | | | 3,000 | | | | 41,546 | |
| | | | | | | | |
| | | | | | | $ | 143,696 | |
| Restaurants - 0.5% | | | | | | | | |
| Ajisen (China) Holdings Ltd. | | | 10,000 | | | $ | 11,515 | |
8
Portfolio of Investments (unaudited) – continued
| | | | | | | | | | | | | | |
| Issuer | | | | | | | Shares/Par | | | Value ($) | |
| | | | | | | | | | | | | | |
| Common Stocks - continued | | | | | | | | | | | | | | |
| Specialty Chemicals - 1.6% | | | | | | | | | | | | | | |
| LG Chem Ltd. | | | | | | | | | 70 | | | $ | 23,305 | |
| PTT Global Chemical PLC (a) | | | | | | | | | 8,538 | | | | 18,360 | |
| | | | | | | | | | | | | | |
| | | | | | | | | | | | | $ | 41,665 | |
| Telecommunications - Wireless - 0.1% | | | | | | | | | |
| PT Indosat Tbk | | | | | | | | | 5,000 | | | $ | 3,031 | |
| | | | |
| Telephone Services - 4.6% | | | | | | | | | | | | | | |
| China Unicom (Hong Kong) Ltd. | | | | | | | | | 48,000 | | | $ | 88,383 | |
| PT XL Axiata Tbk | | | | | | | | | 55,500 | | | | 27,627 | |
| | | | | | | | | | | | | | |
| | | | | | | | | | | | | $ | 116,010 | |
| Utilities - Electric Power - 3.7% | | | | | | | | | | | | | | |
| China Resources Power Holdings Co. Ltd. | | | | | | | | | 10,000 | | | $ | 19,522 | |
| Spark Infrastructure Group, IEU (n) | | | | | | | | | 51,836 | | | | 73,467 | |
| | | | | | | | | | | | | | |
| | | | | | | | | | | | | $ | 92,989 | |
| Total Common Stocks (Identified Cost, $2,070,396) | | | | | | | $ | 2,254,504 | |
| | | | |
| | | | | First Exercise | | | | | | | |
| Warrants - 7.7% | | | | | | | | | | | | | | |
| Energy - Independent - 3.4% | | | | | | | | | | | | | | |
Merrill Lynch (Oil & Natural Gas Corp.
- Zero Strike Warrant (1 share for 1 warrant)) (a)(n) | | | | | 5/23/11 | | | | 6,087 | | | $ | 33,984 | |
Merrill Lynch (Reliance Holdings USA
- Zero Strike Warrant (1 share for 1 warrant)) (a)(n) | | | | | 9/22/16 | | | | 3,115 | | | | 51,477 | |
| | | | | | | | | | | | | | |
| | | | | | | | | | | | | $ | 85,461 | |
| Machinery & Tools - 0.2% | | | | | | | | | | | | | | |
Merrill Lynch (BEML Limited - Zero Strike
Warrant (1 share for 1 warrant)) (a)(n) | | | | | 9/15/10 | | | | 478 | | | $ | 5,127 | |
| | | | |
| Metals & Mining - 2.1% | | | | | | | | | | | | | | |
| Deutsche Bank (MOIL Limited - Zero Strike Warrant (1 share for 1 warrant)) (a)(n) | | | | | 7/05/11 | | | | 4,342 | | | $ | 23,056 | |
Deutsche Bank (Steel Authority of India
- Zero Strike Warrant (1 share for 1 warrant)) (a)(z) | | | | | 7/25/11 | | | | 15,030 | | | | 30,893 | |
| | | | | | | | | | | | | | |
| | | | | | | | | | | | | $ | 53,949 | |
9
Portfolio of Investments (unaudited) – continued
| | | | | | | | | | | | | | |
| Issuer | | | | First Exercise | | | Shares/Par | | | Value ($) | |
| | | | | | | | | | | | | | |
| Warrants - continued | | | | | | | | | | | | | | |
| Other Banks & Diversified Financials - 1.5% | | | | | | | | | | | | |
| Deutsche Bank (Federal Bank LTD - Zero Strike Warrant (1 share for 1 warrant)) (a)(n) | | | | | 7/22/11 | | | | 1,269 | | | $ | 10,236 | |
| Deutsche Bank (Housing Development Finance Authority - Zero Strike Warrant (1 share for 1 warrant)) (a)(n) | | | | | 9/15/10 | | | | 2,836 | | | | 28,220 | |
| | | | | | | | | | | | | | |
| | | | | | | | | | | | | $ | 38,456 | |
| Tobacco - 0.5% | | | | | | | | | | | | |
| Deutsche Bank (ITC Limited - Zero Strike Warrant (1 share for 1 warrant)) (a)(z) | | | | | 7/11/11 | | | | 3,290 | | | $ | 13,568 | |
| Total Warrants (Identified Cost, $198,920) | | | | | | | $ | 196,561 | |
| | | | |
| Money Market Funds - 3.5% | | | | | | | | | | | | | | |
MFS Institutional Money Market Portfolio, 0.08%,
at Cost and Net Asset Value (v) | | | | | | | 88,304 | | | $ | 88,304 | |
| Total Investments (Identified Cost, $2,357,620) | | | | | | | $ | 2,539,369 | |
| | |
| Other Assets, Less Liabilities - 0.2% | | | | | | | | 3,973 | |
| Net Assets - 100.0% | | | | | | | | | | | | $ | 2,543,342 | |
| (a) | Non-income producing security. |
| (n) | Securities exempt from registration under Rule 144A of the Securities Act of 1933. These securities may be sold in the ordinary course of business in transactions exempt from registration, normally to qualified institutional buyers. At period end, the aggregate value of these securities was $225,567, representing 8.9% of net assets. |
| (v) | Underlying affiliated fund that is available only to investment companies managed by MFS. The rate quoted for the MFS Institutional Money Market Portfolio is the annualized seven-day yield of the fund at period end. |
| (z) | Restricted securities are not registered under the Securities Act of 1933 and are subject to legal restrictions on resale. These securities generally may be resold in transactions exempt from registration or to the public if the securities are subsequently registered. Disposal of these securities may involve time-consuming negotiations and prompt sale at an acceptable price may be difficult. The fund holds the following restricted securities: |
| | | | | | | | | | |
| Restricted Securities | | Acquisition
Date | | Cost | | | Value | |
| Deutsche Bank (ITC Limited - Zero Strike Warrant) | | 7/11/11 | | | $13,725 | | | | $13,568 | |
| Deutsche Bank (Steel Authority of India - Zero Strike Warrant) | | 7/25/11-10/12/11 | | | 35,882 | | | | 30,893 | |
| Total Restricted Securities | | | | | | | | | $44,461 | |
| % of Net assets | | | | | | | | | 1.7% | |
10
Portfolio of Investments (unaudited) – continued
The following abbreviations are used in this report and are defined:
| ADR | | American Depository Receipt |
| IEU | | International Equity Unit |
| PLC | | Public Limited Company |
| REIT | | Real Estate Investment Trust |
See Notes to Financial Statements
11
Financial Statements
STATEMENT OF ASSETS AND LIABILITIES
At 1/31/12 (unaudited)
This statement represents your fund’s balance sheet, which details the assets and liabilities comprising the total value of the fund.
| | | | |
| Assets | | | | |
Investments- | | | | |
Non-affiliated issuers, at value (identified cost, $2,269,316) | | | $2,451,065 | |
Underlying affiliated funds, at cost and value | | | 88,304 | |
Total investments, at value (identified cost, $2,357,620) | | | $2,539,369 | |
Receivables for | | | | |
Investments sold | | | 34,019 | |
Fund shares sold | | | 7,647 | |
Dividends | | | 665 | |
Receivable from investment adviser | | | 22,373 | |
Other assets | | | 108 | |
Total assets | | | $2,604,181 | |
| Liabilities | | | | |
Payables for investments purchased | | | $11,078 | |
Payable to affiliates | | | | |
Shareholder servicing costs | | | 168 | |
Distribution and service fees | | | 43 | |
Payable for independent Trustees’ compensation | | | 165 | |
Accrued expenses and other liabilities | | | 49,385 | |
Total liabilities | | | $60,839 | |
Net assets | | | $2,543,342 | |
| Net assets consist of | | | | |
Paid-in capital | | | $2,543,726 | |
Unrealized appreciation (depreciation) on investments and translation of assets and liabilities in foreign currencies (net of $985 deferred country tax) | | | 180,818 | |
Accumulated distributions in excess of net realized gain on investments and
foreign currency transactions | | | (182,441 | ) |
Undistributed net investment income | | | 1,239 | |
Net assets | | | $2,543,342 | |
Shares of beneficial interest outstanding | | | 246,115 | |
| | | | | | | | | | | | |
| | | Net assets | | | Shares
outstanding | | | Net asset value
per share (a) | |
Class A | | | $1,357,467 | | | | 131,361 | | | | $10.33 | |
Class B | | | 260,581 | | | | 25,349 | | | | 10.28 | |
Class C | | | 181,224 | | | | 17,601 | | | | 10.30 | |
Class I | | | 744,070 | | | | 71,804 | | | | 10.36 | |
| (a) | Maximum offering price per share was equal to the net asset value per share for all share classes, except for Class A, for which the maximum offering price per share was $10.96 [100 / 94.25 x $10.33]. On sales of $50,000 or more, the maximum offering price of Class A shares is reduced. A contingent deferred sales charge may be imposed on redemptions of Class A, Class B, and Class C shares. Redemption price per share was equal to the net asset value per share for Class I. |
See Notes to Financial Statements
12
Financial Statements
STATEMENT OF OPERATIONS
Six months ended 1/31/12 (unaudited)
This statement describes how much your fund earned in investment income and accrued in expenses. It also describes any gains and/or losses generated by fund operations.
| | | | |
| Net investment income | | | | |
Income | | | | |
Dividends | | | $21,061 | |
Interest | | | 1,175 | |
Dividends from underlying affiliated funds | | | 35 | |
Foreign taxes withheld | | | (541 | ) |
Total investment income | | | $21,730 | |
Expenses | | | | |
Management fee | | | $11,289 | |
Distribution and service fees | | | 3,290 | |
Shareholder servicing costs | | | 1,811 | |
Administrative services fee | | | 8,818 | |
Independent Trustees’ compensation | | | 638 | |
Custodian fee | | | 38,857 | |
Shareholder communications | | | 3,990 | |
Audit and tax fees | | | 22,560 | |
Legal fees | | | 618 | |
Registration fees | | | 28,739 | |
Miscellaneous | | | 6,610 | |
Total expenses | | | $127,220 | |
Reduction of expenses by investment adviser | | | (108,357 | ) |
Net expenses | | | $18,863 | |
Net investment income | | | $2,867 | |
Realized and unrealized gain (loss) on investments
and foreign currency transactions | | | | |
Realized gain (loss) (identified cost basis) | | | | |
Investment transactions (net of $9 country tax) | | | $(175,650 | ) |
Foreign currency transactions | | | (1,240 | ) |
Net realized gain (loss) on investments
and foreign currency transactions | | | $(176,890 | ) |
Change in unrealized appreciation (depreciation) | | | | |
Investments (net of $305 decrease in deferred country tax) | | | $40,486 | |
Translation of assets and liabilities in foreign currencies | | | 76 | |
Net unrealized gain (loss) on investments
and foreign currency translation | | | $40,562 | |
Net realized and unrealized gain (loss) on investments
and foreign currency | | | $(136,328 | ) |
Change in net assets from operations | | | $(133,461 | ) |
See Notes to Financial Statements
13
Financial Statements
STATEMENTS OF CHANGES IN NET ASSETS
These statements describe the increases and/or decreases in net assets resulting from operations, any distributions, and any shareholder transactions.
| | | | | | | | |
| Change in net assets | | Six months ended
1/31/12
(unaudited) | | | Period ended
7/31/11 (c) | |
| From operations | | | | | | | | |
Net investment income | | | $2,867 | | | | $10,560 | |
Net realized gain (loss) on investments and foreign
currency transactions | | | (176,890 | ) | | | 32,022 | |
Net unrealized gain (loss) on investments and foreign
currency translation | | | 40,562 | | | | 140,256 | |
Change in net assets from operations | | | $(133,461 | ) | | | $182,838 | |
| Distributions declared to shareholders | | | | | | | | |
From net investment income | | | $(13,001 | ) | | | $— | |
From net realized gain on investments | | | (33,001 | ) | | | (3,759 | ) |
Total distributions declared to shareholders | | | $(46,002 | ) | | | $(3,759 | ) |
Change in net assets from fund share transactions | | | $671,364 | | | | $1,872,362 | |
Total change in net assets | | | $491,901 | | | | $2,051,441 | |
| Net assets | | | | | | | | |
At beginning of period | | | 2,051,441 | | | | — | |
At end of period (including undistributed net investment income of $1,239 and $11,373, respectively) | | | $2,543,342 | | | | $2,051,441 | |
| (c) | For the period from the commencement of the fund’s investment operations, September 15, 2010, through the stated period end. |
See Notes to Financial Statements
14
Financial Statements
FINANCIAL HIGHLIGHTS
The financial highlights table is intended to help you understand the fund’s financial performance for the semiannual period and the past 5 fiscal years (or life of a particular share class, if shorter). Certain information reflects financial results for a single fund share. The total returns in the table represent the rate by which an investor would have earned (or lost) on an investment in the fund share class (assuming reinvestment of all distributions) held for the entire period.
| | | | | | | | |
| Class A | | Six months
ended
1/31/12
| | | Period
ended
7/31/11 (c) | |
| | | (unaudited) | | | | |
Net asset value, beginning of period | | | $11.47 | | | | $10.00 | |
| Income (loss) from investment operations | | | | | | | | |
Net investment income (d) | | | $0.01 | | | | $0.10 | |
Net realized and unrealized gain (loss) on investments and foreign currency | | | (0.95 | ) | | | 1.40 | |
Total from investment operations | | | $(0.94 | ) | | | $1.50 | |
| Less distributions declared to shareholders | | | | | | | | |
From net investment income | | | $(0.06 | ) | | | $— | |
From net realized gain on investments | | | (0.14 | ) | | | (0.03 | ) |
Total distributions declared to shareholders | | | $(0.20 | ) | | | $(0.03 | ) |
Net asset value, end of period (x) | | | $10.33 | | | | $11.47 | |
Total return (%) (r)(s)(t)(x) | | | (7.96 | )(n) | | | 15.02 | (n) |
| Ratios (%) (to average net assets) and Supplemental data: | | | | | | | | |
Expenses before expense reductions (f) | | | 11.72 | (a) | | | 13.12 | (a) |
Expenses after expense reductions (f) | | | 1.70 | (a) | | | 1.70 | (a) |
Net investment income | | | 0.16 | (a) | | | 0.99 | (a) |
Portfolio turnover | | | 61 | | | | 76 | |
Net assets at end of period (000 omitted) | | | $1,357 | | | | $787 | |
See Notes to Financial Statements
15
Financial Highlights – continued
| | | | | | | | |
| Class B | | Six months
ended
1/31/12 | | | Period
ended
7/31/11 (c) | |
| | | (unaudited) | | | | |
Net asset value, beginning of period | | | $11.40 | | | | $10.00 | |
| Income (loss) from investment operations | | | | | | | | |
Net investment income (loss) (d) | | | $(0.02 | ) | | | $0.02 | |
Net realized and unrealized gain (loss) on investments and foreign currency | | | (0.95 | ) | | | 1.41 | |
Total from investment operations | | | $(0.97 | ) | | | $1.43 | |
| Less distributions declared to shareholders | | | | | | | | |
From net investment income | | | $(0.01 | ) | | | $— | |
From net realized gain on investments | | | (0.14 | ) | | | (0.03 | ) |
Total distributions declared to shareholders | | | $(0.15 | ) | | | $(0.03 | ) |
Net asset value, end of period (x) | | | $10.28 | | | | $11.40 | |
Total return (%) (r)(s)(t)(x) | | | (8.33 | )(n) | | | 14.32 | (n) |
| Ratios (%) (to average net assets) and Supplemental data: | | | | | | | | |
Expenses before expense reductions (f) | | | 12.62 | (a) | | | 14.27 | (a) |
Expenses after expense reductions (f) | | | 2.45 | (a) | | | 2.45 | (a) |
Net investment income (loss) | | | (0.40 | )(a) | | | 0.18 | (a) |
Portfolio turnover | | | 61 | | | | 76 | |
Net assets at end of period (000 omitted) | | | $261 | | | | $258 | |
| | |
| Class C | | Six months
ended
1/31/12 | | | Period
ended
7/31/11 (c) | |
| | | (unaudited) | | | | |
Net asset value, beginning of period | | | $11.40 | | | | $10.00 | |
| Income (loss) from investment operations | | | | | | | | |
Net investment income (loss) (d) | | | $(0.01 | ) | | | $0.01 | |
Net realized and unrealized gain (loss) on investments and foreign currency | | | (0.95 | ) | | | 1.42 | |
Total from investment operations | | | $(0.96 | ) | | | $1.43 | |
| Less distributions declared to shareholders | | | | | | | | |
From net realized gain on investments | | | $(0.14 | ) | | | $(0.03 | ) |
Net asset value, end of period (x) | | | $10.30 | | | | $11.40 | |
Total return (%) (r)(s)(t)(x) | | | (8.27 | )(n) | | | 14.32 | (n) |
| Ratios (%) (to average net assets) and Supplemental data: | | | | | | | | |
Expenses before expense reductions (f) | | | 12.63 | (a) | | | 14.88 | (a) |
Expenses after expense reductions (f) | | | 2.45 | (a) | | | 2.45 | (a) |
Net investment income (loss) | | | (0.19 | )(a) | | | 0.05 | (a) |
Portfolio turnover | | | 61 | | | | 76 | |
Net assets at end of period (000 omitted) | | | $181 | | | | $197 | |
See Notes to Financial Statements
16
Financial Highlights – continued
| | | | | | | | |
| Class I | | Six months
ended
1/31/12 | | | Period
ended
7/31/11 (c) | |
| | | (unaudited) | | | | |
Net asset value, beginning of period | | | $11.50 | | | | $10.00 | |
| Income (loss) from investment operations | | | | | | | | |
Net investment income (d) | | | $0.04 | | | | $0.08 | |
Net realized and unrealized gain (loss) on investments and foreign currency | | | (0.97 | ) | | | 1.45 | |
Total from investment operations | | | $(0.93 | ) | | | $1.53 | |
| Less distributions declared to shareholders | | | | | | | | |
From net investment income | | | $(0.07 | ) | | | $— | |
From net realized gain on investments | | | (0.14 | ) | | | (0.03 | ) |
Total distributions declared to shareholders | | | $(0.21 | ) | | | $(0.03 | ) |
Net asset value, end of period (x) | | | $10.36 | | | | $11.50 | |
Total return (%) (r)(s)(x) | | | (7.85 | )(n) | | | 15.32 | (n) |
| Ratios (%) (to average net assets) and Supplemental data: | | | | | | | | |
Expenses before expense reductions (f) | | | 11.58 | (a) | | | 15.22 | (a) |
Expenses after expense reductions (f) | | | 1.45 | (a) | | | 1.45 | (a) |
Net investment income | | | 0.74 | (a) | | | 0.83 | (a) |
Portfolio turnover | | | 61 | | | | 76 | |
Net assets at end of period (000 omitted) | | | $744 | | | | $810 | |
| (c) | For the period from the commencement of the fund’s investment operations, September 15, 2010, through the stated period end. |
| (d) | Per share data is based on average shares outstanding. |
| (f) | Ratios do not reflect reductions from fees paid indirectly, if applicable. |
| (r) | Certain expenses have been reduced without which performance would have been lower. |
| (s) | From time to time the fund may receive proceeds from litigation settlements, without which performance would be lower. |
| (t) | Total returns do not include any applicable sales charges. |
| (x) | The net asset values per share and total returns have been calculated on net assets which include adjustments made in accordance with U.S. generally accepted accounting principles required at period end for financial reporting purposes. |
See Notes to Financial Statements
17
NOTES TO FINANCIAL STATEMENTS
(unaudited)
| (1) | | Business and Organization |
MFS Asia Pacific ex-Japan Fund (the fund) is a series of MFS Series Trust VII (the trust). The trust is organized as a Massachusetts business trust and is registered under the Investment Company Act of 1940, as amended, as an open-end management investment company.
| (2) | | Significant Accounting Policies |
General – The preparation of financial statements in conformity with U.S. generally accepted accounting principles requires management to make estimates and assumptions that affect the reported amounts of assets and liabilities, and disclosure of contingent assets and liabilities at the date of the financial statements and the reported amounts of revenues and expenses during the reporting period. Actual results could differ from those estimates. In the preparation of these financial statements, management has evaluated subsequent events occurring after the date of the fund’s Statement of Assets and Liabilities through the date that the financial statements were issued. The fund invests in foreign securities, including securities of emerging market issuers. Investments in foreign securities are vulnerable to the effects of changes in the relative values of the local currency and the U.S. dollar and to the effects of changes in each country’s legal, political, and economic environment. The markets of emerging markets countries are generally more volatile than the markets of developed countries with more mature economies. All of the risks of investing in foreign securities previously described are heightened when investing in emerging markets countries. The fund’s performance could be closely tied to the market, currency, economic, political, regulatory, geopolitical, or other conditions in the countries or regions in which the fund invests and could be more volatile than the performance of more geographically-diversified funds.
The fund may invest between 25% and 35% of its total assets in the securities of issuers in any particular industry if, at the time of investment, that industry represents 20% or more of the Asia Pacific market excluding Japan as a whole, as measured by an index determined by MFS to be an appropriate measure of the Asia Pacific market excluding Japan. At January 31, 2012, the fund did not have more than 25% of its assets invested in any one industry.
In December 2011, the Financial Accounting Standards Board issued Accounting Standards Update 2011-11, Balance Sheet (Topic 210) – Disclosures about Offsetting Assets and Liabilities (“ASU 2011-11”). Effective for annual reporting periods beginning on or after January 1, 2013 and interim periods within those annual periods, ASU 2011-11 is intended to enhance disclosure requirements on the offsetting of financial assets and liabilities. Although still
18
Notes to Financial Statements (unaudited) – continued
evaluating the potential impacts of ASU 2011-11 to the fund, management expects that the impact of the fund’s adoption will be limited to additional financial statement disclosures.
Investment Valuations – Equity securities, including restricted equity securities, are generally valued at the last sale or official closing price as provided by a third-party pricing service on the market or exchange on which they are primarily traded. Equity securities, for which there were no sales reported that day, are generally valued at the last quoted daily bid quotation as provided by a third-party pricing service on the market or exchange on which such securities are primarily traded. Short-term instruments with a maturity at issuance of 60 days or less generally are valued at amortized cost, which approximates market value. Open-end investment companies are generally valued at net asset value per share. Securities and other assets generally valued on the basis of information from a third-party pricing service may also be valued at a broker/dealer bid quotation. Values obtained from third-party pricing services can utilize both transaction data and market information such as yield, quality, coupon rate, maturity, type of issue, trading characteristics, and other market data. The values of foreign securities and other assets and liabilities expressed in foreign currencies are converted to U.S. dollars using the mean of bid and asked prices for rates provided by a third-party pricing service.
The Board of Trustees has delegated primary responsibility for determining or causing to be determined the value of the fund’s investments (including any fair valuation) to the adviser pursuant to valuation policies and procedures approved by the Board. If the adviser determines that reliable market quotations are not readily available, investments are valued at fair value as determined in good faith by the adviser in accordance with such procedures under the oversight of the Board of Trustees. Under the fund’s valuation policies and procedures, market quotations are not considered to be readily available for most types of debt instruments and floating rate loans and many types of derivatives. These investments are generally valued at fair value based on information from third-party pricing services. In addition, investments may be valued at fair value if the adviser determines that an investment’s value has been materially affected by events occurring after the close of the exchange or market on which the investment is principally traded (such as foreign exchange or market) and prior to the determination of the fund’s net asset value, or after the halting of trading of a specific security where trading does not resume prior to the close of the exchange or market on which the security is principally traded. Events that occur on a frequent basis after foreign markets close (such as developments in foreign markets and significant movements in the U.S. markets) and prior to the determination of the fund’s net asset value may be deemed to have a material effect on the value of securities traded in foreign markets. Accordingly, the fund’s foreign equity
19
Notes to Financial Statements (unaudited) – continued
securities may often be valued at fair value. The adviser generally relies on third-party pricing services or other information (such as the correlation with price movements of similar securities in the same or other markets; the type, cost and investment characteristics of the security; the business and financial condition of the issuer; and trading and other market data) to assist in determining whether to fair value and at what value to fair value an investment. The value of an investment for purposes of calculating the fund’s net asset value can differ depending on the source and method used to determine value. When fair valuation is used, the value of an investment used to determine the fund’s net asset value may differ from quoted or published prices for the same investment. There can be no assurance that the fund could obtain the fair value assigned to an investment if it were to sell the investment at the same time at which the fund determines its net asset value per share.
Various inputs are used in determining the value of the fund’s assets or liabilities. These inputs are categorized into three broad levels. In certain cases, the inputs used to measure fair value may fall into different levels of the fair value hierarchy. In such cases, an investment’s level within the fair value hierarchy is based on the lowest level of input that is significant to the fair value measurement. The fund’s assessment of the significance of a particular input to the fair value measurement in its entirety requires judgment, and considers factors specific to the investment. Level 1 includes unadjusted quoted prices in active markets for identical assets or liabilities. Level 2 includes other significant observable market-based inputs (including quoted prices for similar securities, interest rates, prepayment speed, and credit risk). Level 3 includes unobservable inputs, which may include the adviser’s own assumptions in determining the fair value of investments. The following is a summary of the levels used as of January 31, 2012 in valuing the fund’s assets or liabilities:
| | | | | | | | | | | | | | | | |
| Investments at Value | | Level 1 | | | Level 2 | | | Level 3 | | | Total | |
| Equity Securities: | | | | | | | | | | | | | | | | |
Australia | | | $569,089 | | | | $ — | | | | $— | | | | $569,089 | |
China | | | 474,852 | | | | — | | | | — | | | | 474,852 | |
Hong Kong | | | 380,044 | | | | — | | | | — | | | | 380,044 | |
South Korea | | | 226,911 | | | | — | | | | — | | | | 226,911 | |
Taiwan | | | 218,622 | | | | — | | | | — | | | | 218,622 | |
India | | | 20,275 | | | | 196,561 | | | | — | | | | 216,836 | |
United Kingdom | | | 85,742 | | | | — | | | | — | | | | 85,742 | |
Singapore | | | 73,097 | | | | — | | | | — | | | | 73,097 | |
Indonesia | | | 72,034 | | | | — | | | | — | | | | 72,034 | |
Other Countries | | | 77,122 | | | | 56,716 | | | | — | | | | 133,838 | |
Mutual Funds | | | 88,304 | | | | — | | | | — | | | | 88,304 | |
| Total Investments | | | $2,286,092 | | | | $253,277 | | | | $— | | | | $2,539,369 | |
20
Notes to Financial Statements (unaudited) – continued
For further information regarding security characteristics, see the Portfolio of Investments.
Foreign Currency Translation – Purchases and sales of foreign investments, income, and expenses are converted into U.S. dollars based upon currency exchange rates prevailing on the respective dates of such transactions or on the reporting date for foreign denominated receivables and payables. Gains and losses attributable to foreign currency exchange rates on sales of securities are recorded for financial statement purposes as net realized gains and losses on investments. Gains and losses attributable to foreign exchange rate movements on receivables, payables, income and expenses are recorded for financial statement purposes as foreign currency transaction gains and losses. That portion of both realized and unrealized gains and losses on investments that results from fluctuations in foreign currency exchange rates is not separately disclosed.
Zero Strike Warrants – The fund invested in low exercise price call warrants (zero strike warrants). Zero strike warrants are issued by banks or broker-dealers and allow the fund to gain exposure to common stocks in markets that place restrictions on investments by foreign investors and may or may not be traded on an exchange. Income received from zero strike warrants is recorded as dividend income in the Statement of Operations. Risks associated with zero strike warrants include the potential inability of the counterparty to fulfill their obligations under the warrant, inability to transfer or liquidate the warrants and potential delays or an inability to redeem before expiration under certain market conditions.
Indemnifications – Under the fund’s organizational documents, its officers and Trustees may be indemnified against certain liabilities and expenses arising out of the performance of their duties to the fund. Additionally, in the normal course of business, the fund enters into agreements with service providers that may contain indemnification clauses. The fund’s maximum exposure under these agreements is unknown as this would involve future claims that may be made against the fund that have not yet occurred.
Investment Transactions and Income – Investment transactions are recorded on the trade date. Interest income is recorded on the accrual basis. Dividends received in cash are recorded on the ex-dividend date. Certain dividends from foreign securities will be recorded when the fund is informed of the dividend if such information is obtained subsequent to the ex-dividend date. Dividend and interest payments received in additional securities are recorded on the ex-dividend or ex-interest date in an amount equal to the value of the security on such date.
The fund may receive proceeds from litigation settlements. Any proceeds received from litigation involving portfolio holdings are reflected in the
21
Notes to Financial Statements (unaudited) – continued
Statement of Operations in realized gain/loss if the security has been disposed of by the fund or in unrealized gain/loss if the security is still held by the fund. Any other proceeds from litigation not related to portfolio holdings are reflected as other income in the Statement of Operations.
Fees Paid Indirectly – The fund’s custody fee may be reduced according to an arrangement that measures the value of cash deposited with the custodian by the fund. For the six months ended January 31, 2012, custody fees were not reduced.
Tax Matters and Distributions – The fund intends to qualify as a regulated investment company, as defined under Subchapter M of the Internal Revenue Code, and to distribute all of its taxable income, including realized capital gains. As a result, no provision for federal income tax is required. The fund’s federal tax returns remain subject to examination by the Internal Revenue Service. Foreign taxes have been accrued by the fund in the accompanying financial statements.
Distributions to shareholders are recorded on the ex-dividend date. Income and capital gain distributions are determined in accordance with income tax regulations, which may differ from U.S. generally accepted accounting principles. Certain capital accounts in the financial statements are periodically adjusted for permanent differences in order to reflect their tax character. These adjustments have no impact on net assets or net asset value per share. Temporary differences which arise from recognizing certain items of income, expense, gain or loss in different periods for financial statement and tax purposes will reverse at some time in the future. Distributions in excess of net investment income or net realized gains are temporary overdistributions for financial statement purposes resulting from differences in the recognition or classification of income or distributions for financial statement and tax purposes.
Book/tax differences primarily relate to passive foreign investment company adjustments, wash sale loss deferrals, and foreign taxes.
The tax character of distributions made during the current period will be determined at fiscal year end. The tax character of distributions declared to shareholders for the last fiscal year is as follows:
| | | | |
| | | 7/31/11 | |
Ordinary income (including any
short-term capital gains | | | $3,759 | |
The federal tax cost and the tax basis components of distributable earnings were as follows:
| | | | |
| As of 1/31/12 | | | |
| Cost of investments | | | $2,362,514 | |
| Gross appreciation | | | 245,195 | |
22
Notes to Financial Statements (unaudited) – continued
| | | | |
| As of 1/31/12 | | | |
| Gross depreciation | | | (68,340 | ) |
| Net unrealized appreciation (depreciation) | | | $176,855 | |
| |
| As of 7/31/11 | | | |
| Undistributed ordinary income | | | 44,841 | |
| Other temporary differences | | | (2,436 | ) |
| Net unrealized appreciation (depreciation) | | | 136,674 | |
The aggregate cost above includes prior fiscal year end tax adjustments, if applicable.
Multiple Classes of Shares of Beneficial Interest – The fund offers multiple classes of shares, which differ in their respective distribution, and service fees. The fund’s income, realized and unrealized gain (loss), and common expenses are allocated to shareholders based on the daily net assets of each class. Dividends are declared separately for each class. Differences in per share dividend rates are generally due to differences in separate class expenses. Class B shares will convert to Class A shares approximately eight years after purchase. The fund’s distributions declared to shareholders as reported on the Statements of Changes in Net Assets are presented by class as follows:
| | | | | | | | | | | | | | | | |
| | | From net investment
income | | | From net realized gain on
investments | |
| | | Six months ended
1/31/12 | | | Period ended
7/31/11 (c) | | | Six months ended
1/31/12 | | | Period ended
7/31/11 (c) | |
| Class A | | | $7,697 | | | | $— | | | | $17,343 | | | | $1,007 | |
| Class B | | | 274 | | | | — | | | | 3,397 | | | | 333 | |
| Class C | | | — | | | | — | | | | 2,400 | | | | 317 | |
| Class I | | | 5,030 | | | | — | | | | 9,861 | | | | 2,102 | |
| Total | | | $13,001 | | | | $— | | | | $33,001 | | | | $3,759 | |
| (c) | For the period from the commencement of the fund’s investment operations, September 15, 2010, through the stated period end. |
| (3) | | Transactions with Affiliates |
Investment Adviser – The fund has an investment advisory agreement with MFS to provide overall investment management and related administrative services and facilities to the fund. The management fee is computed daily and paid monthly at the following annual rates:
| | | | |
| First $1 billion of average daily net assets | | | 1.05 | % |
| Next $1.5 billion of average daily net assets | | | 0.95 | % |
| Average daily net assets in excess of $2.5 billion | | | 0.90 | % |
The management fee incurred for the six months ended January 31, 2012 was equivalent to an annual effective rate of 1.05% of the fund’s average daily net assets.
The investment adviser has agreed in writing to pay a portion of the fund’s total annual operating expenses, exclusive of interest, taxes, extraordinary
23
Notes to Financial Statements (unaudited) – continued
expenses, brokerage and transaction costs, and investment-related expenses, such that total annual fund operating expenses do not exceed the following rates annually of each class’ average daily net assets:
| | | | | | | | | | | | |
| Class A | | Class B | | | Class C | | | Class I | |
| 1.70% | | | 2.45% | | | | 2.45% | | | | 1.45% | |
This written agreement will continue until modified by the fund’s Board of Trustees, but such agreement will continue at least until November 30, 2012. For the six months ended January 31, 2012, this reduction amounted to $108,354 and is reflected as a reduction of total expenses in the Statement of Operations.
Distributor – MFS Fund Distributors, Inc. (MFD), a wholly-owned subsidiary of MFS, as distributor, received $871 for the six months ended January 31, 2012, as its portion of the initial sales charge on sales of Class A shares of the fund.
The Board of Trustees has adopted a distribution plan for certain class shares pursuant to Rule 12b-1 of the Investment Company Act of 1940.
The fund’s distribution plan provides that the fund will pay MFD for services provided by MFD and financial intermediaries in connection with the distribution and servicing of certain share classes. One component of the plan is a distribution fee paid to MFD and another component of the plan is a service fee paid to MFD. MFD may subsequently pay all, or a portion, of the distribution and/or service fees to financial intermediaries.
Distribution Plan Fee Table:
| | | | | | | | | | | | | | | | | | | | |
| | | Distribution
Fee Rate (d) | | | Service
Fee Rate (d) | | | Total
Distribution
Plan (d) | | | Annual
Effective
Rate (e) | | | Distribution
and Service
Fee | |
| Class A | | | — | | | | 0.25% | | | | 0.25% | | | | 0.25% | | | | $1,273 | |
| Class B | | | 0.75% | | | | 0.25% | | | | 1.00% | | | | 1.00% | | | | 1,154 | |
| Class C | | | 0.75% | | | | 0.25% | | | | 1.00% | | | | 1.00% | | | | 863 | |
| Total Distribution and Service Fees | | | | | | | | | | | | | | | | $3,290 | |
| (d) | In accordance with the distribution plan for certain classes, the fund pays distribution and/or service fees equal to these annual percentage rates of each class’ average daily net assets. The distribution and service fee rates disclosed by class represent the current rates in effect at the end of the reporting period. |
| (e) | The annual effective rates represent actual fees incurred under the distribution plan for the six months ended January 31, 2012 based on each class’ average daily net assets. |
Certain Class A shares are subject to a contingent deferred sales charge (CDSC) in the event of a shareholder redemption within 24 months of purchase. Class C shares are subject to a CDSC in the event of a shareholder redemption within 12 months of purchase. Class B shares are subject to a CDSC in the event of a shareholder redemption within six years of purchase. All contingent
24
Notes to Financial Statements (unaudited) – continued
deferred sales charges are paid to MFD and during the six months ended January 31, 2012, were as follows:
| | | | |
| | | Amount | |
| Class A | | | $18 | |
| Class B | | | — | |
| Class C | | | — | |
Shareholder Servicing Agent – MFS Service Center, Inc. (MFSC), a wholly-owned subsidiary of MFS, receives a fee from the fund for its services as shareholder servicing agent calculated as a percentage of the average daily net assets of the fund as determined periodically under the supervision of the fund’s Board of Trustees. For the six months ended January 31, 2012, the fee was $911, which equated to 0.0848% annually of the fund’s average daily net assets. MFSC also receives payment from the fund for out-of-pocket expenses, sub-accounting and other shareholder servicing costs which may be paid to affiliated and unaffiliated service providers. For the six months ended January 31, 2012, these out-of-pocket expenses, sub-accounting and other shareholder servicing costs amounted to $900.
Administrator – MFS provides certain financial, legal, shareholder communications, compliance, and other administrative services to the fund. Under an administrative services agreement, the fund partially reimburses MFS the costs incurred to provide these services. The fund is charged an annual fixed amount of $17,500 plus a fee based on average daily net assets. The administrative services fee incurred for the six months ended January 31, 2012 was equivalent to an annual effective rate of 0.8210% of the fund’s average daily net assets.
Trustees’ and Officers’ Compensation – The fund pays compensation to independent Trustees in the form of a retainer, attendance fees, and additional compensation to Board and Committee chairpersons. The fund does not pay compensation directly to Trustees or officers of the fund who are also officers of the investment adviser, all of whom receive remuneration for their services to the fund from MFS. Certain officers and Trustees of the fund are officers or directors of MFS, MFD, and MFSC.
Other – This fund and certain other funds managed by MFS (the funds) have entered into services agreements (the Agreements) which provide for payment of fees by the funds to Tarantino LLC and Griffin Compliance LLC in return for the provision of services of an Independent Chief Compliance Officer (ICCO) and Assistant ICCO, respectively, for the funds. The ICCO and Assistant ICCO are officers of the funds and the sole members of Tarantino LLC and Griffin Compliance LLC, respectively. The funds can terminate the Agreements with Tarantino LLC and Griffin Compliance LLC at any time under the terms of the Agreements. For the six months ended January 31, 2012, the aggregate fees
25
Notes to Financial Statements (unaudited) – continued
paid by the fund to Tarantino LLC and Griffin Compliance LLC were $11 and are included in miscellaneous expense on the Statement of Operations. MFS has agreed to reimburse the fund for a portion of the payments made by the fund in the amount of $3, which is shown as a reduction of total expenses in the Statement of Operations. Additionally, MFS has agreed to bear all expenses associated with office space, other administrative support, and supplies provided to the ICCO and Assistant ICCO.
The fund invests in the MFS Institutional Money Market Portfolio which is managed by MFS and seeks a high level of current income consistent with preservation of capital and liquidity. Income earned on this investment is included in dividends from underlying affiliated funds on the Statement of Operations. This money market fund does not pay a management fee to MFS.
On September 14, 2010, MFS purchased 10,000 shares each of Class A, Class B, and Class C and 70,000 shares of Class I for an aggregate amount of $1,000,000.
Purchases and sales of investments, other than U.S. Government securities, purchased option transactions, and short-term obligations, aggregated $1,839,904 and $1,270,576, respectively.
| (5) | | Shares of Beneficial Interest |
The fund’s Declaration of Trust permits the Trustees to issue an unlimited number of full and fractional shares of beneficial interest. Transactions in fund shares were as follows:
| | | | | | | | | | | | | | | | |
| | | Six months ended
1/31/12 | | | Period ended
7/31/11 (c) | |
| | | Shares | | | Amount | | | Shares | | | Amount | |
| Shares sold | | | | | | | | | | | | | | | | |
Class A | | | 65,083 | | | | $631,210 | | | | 78,843 | | | | $859,856 | |
Class B | | | 5,119 | | | | 53,547 | | | | 24,509 | | | | 264,252 | |
Class C | | | 1,650 | | | | 16,639 | | | | 21,174 | | | | 224,721 | |
Class I | | | 63,528 | | | | 662,350 | | | | 70,288 | | | | 703,316 | |
| | | 135,380 | | | | $1,363,746 | | | | 194,814 | | | | $2,052,145 | |
Shares issued to shareholders in
reinvestment of distributions | | | | | | | | | | | | | | | | |
Class A | | | 2,697 | | | | $24,838 | | | | 93 | | | | $1,007 | |
Class B | | | 400 | | | | 3,671 | | | | 31 | | | | 333 | |
Class C | | | 261 | | | | 2,400 | | | | 29 | | | | 317 | |
Class I | | | 1,612 | | | | 14,891 | | | | 194 | | | | 2,102 | |
| | | 4,970 | | | | $45,800 | | | | 347 | | | | $3,759 | |
| Shares reacquired | | | | | | | | | | | | | | | | |
Class A | | | (4,995 | ) | | | $(49,776 | ) | | | (10,360 | ) | | | $(117,384 | ) |
Class B | | | (2,814 | ) | | | (27,206 | ) | | | (1,896 | ) | | | (21,109 | ) |
Class C | | | (1,564 | ) | | | (16,939 | ) | | | (3,949 | ) | | | (44,347 | ) |
26
Notes to Financial Statements (unaudited) – continued
| | | | | | | | | | | | | | | | |
| | | Six months ended
1/31/12 | | | Period ended
7/31/11 (c) | |
| | | Shares | | | Amount | | | Shares | | | Amount | |
Class I | | | (63,757 | ) | | | (644,261 | ) | | | (61 | ) | | | (702 | ) |
| | | (73,130 | ) | | | $(738,182 | ) | | | (16,266 | ) | | | $(183,542 | ) |
| Net change | | | | | | | | | | | | | | | | |
Class A | | | 62,785 | | | | $606,272 | | | | 68,576 | | | | $743,479 | |
Class B | | | 2,705 | | | | 30,012 | | | | 22,644 | | | | 243,476 | |
Class C | | | 347 | | | | 2,100 | | | | 17,254 | | | | 180,691 | |
Class I | | | 1,383 | | | | 32,980 | | | | 70,421 | | | | 704,716 | |
| | | 67,220 | | | | $671,364 | | | | 178,895 | | | | $1,872,362 | |
| (c) | For the period from the commencement of the fund’s investment operations, September 15, 2010, through the stated period end. |
The fund and certain other funds managed by MFS participate in a $1.1 billion unsecured committed line of credit, subject to a $1 billion sublimit, provided by a syndication of banks under a credit agreement. Borrowings may be made for temporary financing needs. Interest is charged to each fund, based on its borrowings, generally at a rate equal to the higher of the Federal Reserve funds rate or one month LIBOR plus an agreed upon spread. A commitment fee, based on the average daily, unused portion of the committed line of credit, is allocated among the participating funds at the end of each calendar quarter. In addition, the fund and other funds managed by MFS have established unsecured uncommitted borrowing arrangements with certain banks for temporary financing needs. Interest is charged to each fund, based on its borrowings, at a rate equal to the Federal Reserve funds rate plus an agreed upon spread. For the six months ended January 31, 2012, the fund’s commitment fee and interest expense were $8 and $0, respectively, and are included in miscellaneous expense on the Statement of Operations.
| (7) | | Transactions in Underlying Affiliated Funds-Affiliated Issuers |
An affiliated issuer may be considered one in which the fund owns 5% or more of the outstanding voting securities, or a company which is under common control. For the purposes of this report, the fund assumes the following to be affiliated issuers:
| | | | | | | | | | | | | | | | |
| Underlying Affiliated Funds | | Beginning
Shares/Par
Amount | | | Acquisitions
Shares/Par
Amount | | | Dispositions
Shares/Par
Amount | | | Ending
Shares/Par
Amount | |
MFS Institutional Money
Market Portfolio | | | 116,427 | | | | 2,038,810 | | | | (2,066,933 | ) | | | 88,304 | |
| | | | |
| Underlying Affiliated Funds | | Realized
Gain (Loss) | | | Capital Gain
Distributions | | | Dividend
Income | | | Ending
Value | |
MFS Institutional Money
Market Portfolio | | | $— | | | | $— | | | | $35 | | | | $88,304 | |
27
BOARD REVIEW OF INVESTMENT ADVISORY AGREEMENT
A discussion regarding the Board’s approval of the fund’s Investment Advisory Agreement with MFS is available by clicking on the fund’s name under “Mutual Funds” in the “Products and Performance” section of the MFS Web site (mfs.com).
PROXY VOTING POLICIES AND INFORMATION
A general description of the MFS funds’ proxy voting policies and procedures is available without charge, upon request, by calling
1-800-225-2606, by visiting the Proxy Voting section of mfs.com or by visiting the SEC’s Web site at http://www.sec.gov.
Information regarding how the fund voted proxies relating to portfolio securities during the most recent twelve-month period ended June 30 is available without charge by visiting the Proxy Voting section of mfs.com or by visiting the SEC’s Web site at http://www.sec.gov.
QUARTERLY PORTFOLIO DISCLOSURE
The fund will file a complete schedule of portfolio holdings with the Securities and Exchange Commission (the Commission) for the first and third quarters of each fiscal year on Form N-Q. A shareholder can obtain the quarterly portfolio holdings report at mfs.com. The fund’s Form N-Q is also available on the EDGAR database on the Commission’s Internet Web site at http://www.sec.gov, and may be reviewed and copied at the:
Public Reference Room
Securities and Exchange Commission
100 F Street, NE, Room 1580
Washington, D.C. 20549
Information on the operation of the Public Reference Room may be obtained by calling the Commission at 1-800-SEC-0330. Copies of the fund’s Form N-Q also may be obtained, upon payment of a duplicating fee, by electronic request at the following e-mail address: publicinfo@sec.gov or by writing the Public Reference Section at the above address.
FURTHER INFORMATION
From time to time, MFS may post important information about the fund or the MFS funds on the MFS web site (mfs.com). This information is available by visiting the “News & Commentary” section of mfs.com or by clicking on the fund’s name under “Mutual Funds” in the “Products and Performance” section of mfs.com.
28
PROVISION OF FINANCIAL REPORTS AND SUMMARY PROSPECTUSES
The fund produces financial reports every six months and updates its summary prospectus and prospectus annually. To avoid sending duplicate copies of materials to households, only one copy of the fund’s annual and semiannual report and summary prospectus may be mailed to shareholders having the same last name and residential address on the fund’s records. However, any shareholder may contact MFSC (please see back cover for address and telephone number) to request that copies of these reports and summary prospectuses be sent personally to that shareholder.
29
Save paper with eDelivery.
MFS® will send you prospectuses, reports, and proxies directly via e-mail so you will get information faster with less mailbox clutter.
To sign up:
1. Go to mfs.com.
2. Log in via MFS® Access.
3. Select eDelivery.
If you own your MFS fund shares through a financial institution or a retirement plan, MFS® TALK, MFS® Access, or eDelivery may not be available to you.

Web site
mfs.com
MFS TALK
1-800-637-8255
24 hours a day
Account service and literature
Shareholders
1-800-225-2606
Financial advisors
1-800-343-2829
Retirement plan services
1-800-637-1255
Mailing address
MFS Service Center, Inc.
P.O. Box 55824
Boston, MA 02205-5824
Overnight mail
MFS Service Center, Inc.
c/o Boston Financial Data Services
30 Dan Road
Canton, MA 02021-2809

MFS® European Equity Fund

SEMIANNUAL REPORT
January 31, 2012
EEQ-SEM
MFS® EUROPEAN EQUITY FUND
The report is prepared for the general information of shareholders.
It is authorized for distribution to prospective investors only when preceded or accompanied by a current prospectus.
NOT FDIC INSURED Ÿ MAY LOSE VALUE Ÿ NO BANK GUARANTEE

LETTER FROM THE CHAIRMAN AND CEO
Dear Shareholders:
We are indeed living through some volatile times. Economic uncertainty is everywhere, as it seems no place in the world has been unmoved by crisis. Over the past year, we have seen a devastating earthquake and tsunami that have led to disruptions in the Japanese markets and supply chains. Protests have changed the face of the Middle East and left in their wake lingering tensions and questions about oil supplies. We have seen debt limits tested in Europe and the United States and policymakers grappling to craft often unpopular monetary and fiscal responses as consumers and businesses struggle with what appears to be a slowing global economy. And now, as the US economy begins to regain its footing, we see the economies of the eurozone heading toward recession as the region’s leaders continue to address sovereign debt crises.
When markets become volatile, managing risk becomes a top priority for investors and their advisors. At MFS® risk management is foremost in our minds in all market climates. Our analysts and portfolio managers keep risks firmly in mind when evaluating securities. Additionally, we have a team of quantitative analysts that measures and assesses the risk profiles of our portfolios and securities on an ongoing basis. The chief investment risk officer, who oversees the team, reports directly to the firm’s president and chief investment officer so the risk associated with each portfolio can be assessed objectively and independently.
As always, we continue to be mindful of the many economic challenges faced at the local, national, and international levels. It is in times such as these that we want to remind investors of the merits of maintaining a long-term view, adhering to basic investing principles such as asset allocation and diversification, and working closely with their advisors to research and identify appropriate investment opportunities.
Respectfully,

Robert J. Manning
Chairman and Chief Executive Officer
MFS Investment Management®
March 19, 2012
The opinions expressed in this letter are subject to change, may not be relied upon for investment advice, and no forecasts can be guaranteed.
1
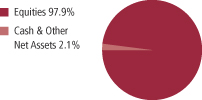
PORTFOLIO COMPOSITION
Portfolio structure
| | | | |
| Top ten holdings | | | | |
| Nestle S.A. | | | 4.8% | |
| Royal Dutch Shell PLC, “A” | | | 4.3% | |
| Roche Holding AG | | | 3.6% | |
| Vodafone Group PLC | | | 3.3% | |
| Linde AG | | | 3.2% | |
| Novartis AG | | | 3.0% | |
| Bayer AG | | | 2.9% | |
| Groupe Danone | | | 2.7% | |
| Akzo Nobel N.V. | | | 2.6% | |
| BP PLC | | | 2.3% | |
| |
| Equity sectors (a) | | | | |
| Financial Services | | | 16.6% | |
| Consumer Staples | | | 12.2% | |
| Health Care | | | 11.3% | |
| Energy | | | 10.6% | |
| Basic Materials | | | 10.5% | |
| Utilities & Communications | | | 8.4% | |
| Industrial Goods & Services | | | 6.6% | |
| Special Products & Services | | | 5.6% | |
| Retailing | | | 4.9% | |
| Leisure | | | 4.0% | |
| Technology | | | 3.8% | |
| Autos & Housing | | | 2.7% | |
| Transportation | | | 0.7% | |
| | | | |
| Issuer country weightings (x) | | | | |
| United Kingdom | | | 28.6% | |
| Switzerland | | | 18.4% | |
| Germany | | | 15.2% | |
| France | | | 13.1% | |
| Netherlands | | | 8.1% | |
| Spain | | | 3.0% | |
| United States | | | 2.4% | |
| Denmark | | | 2.4% | |
| Sweden | | | 2.4% | |
| Other Countries | | | 6.4% | |
| |
| Currency exposure weightings (y) | | | | |
| Euro | | | 43.5% | |
| British Pound Sterling | | | 28.6% | |
| Swiss Franc | | | 18.4% | |
| United States Dollar | | | 2.4% | |
| Danish Krone | | | 2.4% | |
| Swedish Krona | | | 2.4% | |
| Czech Koruna | | | 1.5% | |
| Hong Kong Dollar | | | 0.4% | |
| Canadian Dollar | | | 0.4% | |
2
Portfolio Composition – continued
| (a) | The sectors depicted are economic aggregates made up of several underlying industry categories. The fund may invest between 25% and 35% of its total assets in any industry that represents 20% or more of the European market, as measured by an index determined by the adviser to be an appropriate measure of the European market. As of January 31, 2012, the fund did not have more than 25% of its total assets invested in any one industry. |
| (x) | Represents the portfolio’s exposure to issuer countries as a percentage of a portfolio’s net assets. |
| (y) | Represents the portfolio’s exposure to a particular currency as a percentage of a portfolio’s net assets. |
Percentages are based on net assets as of 1/31/12.
The portfolio is actively managed and current holdings may be different.
3
EXPENSE TABLE
Fund expenses borne by the shareholders during the period,
August 1, 2011 through January 31, 2012
As a shareholder of the fund, you incur two types of costs: (1) transaction costs, including sales charges (loads) on certain purchase or redemption payments, and (2) ongoing costs, including management fees; distribution and service (12b-1) fees; and other fund expenses. This example is intended to help you understand your ongoing costs (in dollars) of investing in the fund and to compare these costs with the ongoing costs of investing in other mutual funds.
The example is based on an investment of $1,000 invested at the beginning of the period and held for the entire period August 1, 2011 through January 31, 2012.
Actual Expenses
The first line for each share class in the following table provides information about actual account values and actual expenses. You may use the information in this line, together with the amount you invested, to estimate the expenses that you paid over the period. Simply divide your account value by $1,000 (for example, an $8,600 account value divided by $1,000 = 8.6), then multiply the result by the number in the first line under the heading entitled “Expenses Paid During Period” to estimate the expenses you paid on your account during this period.
Hypothetical Example for Comparison Purposes
The second line for each share class in the following table provides information about hypothetical account values and hypothetical expenses based on the fund’s actual expense ratio and an assumed rate of return of 5% per year before expenses, which is not the fund’s actual return. The hypothetical account values and expenses may not be used to estimate the actual ending account balance or expenses you paid for the period. You may use this information to compare the ongoing costs of investing in the fund and other funds. To do so, compare this 5% hypothetical example with the 5% hypothetical examples that appear in the shareholder reports of the other funds.
Please note that the expenses shown in the table are meant to highlight your ongoing costs only and do not reflect any transactional costs, such as sales charges (loads). Therefore, the second line for each share class in the table is useful in comparing ongoing costs only, and will not help you determine the relative total costs of owning different funds. In addition, if these transactional costs were included, your costs would have been higher.
4
Expense Table – continued
| | | | | | | | | | | | | | | | | | |
Share
Class | | | | Annualized
Expense
Ratio | | | Beginning
Account Value
8/01/11 | | | Ending
Account Value
1/31/12 | | | Expenses
Paid During
Period (p)
8/01/11-1/31/12 | |
| A | | Actual | | | 1.55% | | | | $1,000.00 | | | | $885.66 | | | | $7.35 | |
| | Hypothetical (h) | | | 1.55% | | | | $1,000.00 | | | | $1,017.34 | | | | $7.86 | |
| B | | Actual | | | 2.30% | | | | $1,000.00 | | | | $881.80 | | | | $10.88 | |
| | Hypothetical (h) | | | 2.30% | | | | $1,000.00 | | | | $1,013.57 | | | | $11.64 | |
| C | | Actual | | | 2.30% | | | | $1,000.00 | | | | $881.74 | | | | $10.88 | |
| | Hypothetical (h) | | | 2.30% | | | | $1,000.00 | | | | $1,013.57 | | | | $11.64 | |
| I | | Actual | | | 1.30% | | | | $1,000.00 | | | | $886.98 | | | | $6.17 | |
| | Hypothetical (h) | | | 1.30% | | | | $1,000.00 | | | | $1,018.60 | | | | $6.60 | |
| (h) | 5% class return per year before expenses. |
| (p) | Expenses paid is equal to each class’ annualized expense ratio, as shown above, multiplied by the average account value over the period, multiplied by the number of days in the period, divided by the number of days in the year. Expenses paid do not include any applicable sales charges (loads). If these transaction costs had been included, your costs would have been higher. |
5
PORTFOLIO OF INVESTMENTS
1/31/12 (unaudited)
The Portfolio of Investments is a complete list of all securities owned by your fund. It is categorized by
broad-based asset classes.
| | | | | | | | |
| Common Stocks - 97.9% | | | | | | | | |
| Issuer | | Shares/Par | | | Value ($) | |
| | | | | | | | |
| Alcoholic Beverages - 1.9% | | | | | | | | |
| Heineken N.V. | | | 677 | | | $ | 31,278 | |
| | |
| Apparel Manufacturers - 2.8% | | | | | | | | |
| Compagnie Financiere Richemont S.A. | | | 262 | | | $ | 14,829 | |
| LVMH Moet Hennessy Louis Vuitton S.A. | | | 196 | | | | 31,688 | |
| | | | | | | | |
| | | | | | | $ | 46,517 | |
| Automotive - 0.8% | | | | | | | | |
| GKN PLC | | | 3,848 | | | $ | 12,709 | |
| | |
| Broadcasting - 2.1% | | | | | | | | |
| Publicis Groupe | | | 677 | | | $ | 34,058 | |
| | |
| Brokerage & Asset Managers - 0.7% | | | | | | | | |
| Deutsche Boerse AG (a) | | | 202 | | | $ | 11,890 | |
| | |
| Business Services - 5.6% | | | | | | | | |
| Adecco S.A. | | | 228 | | | $ | 10,807 | |
| Amadeus Holdings AG | | | 1,261 | | | | 21,608 | |
| Brenntag AG | | | 153 | | | | 15,999 | |
| Compass Group PLC | | | 1,890 | | | | 17,542 | |
| Experian Group Ltd. | | | 1,007 | | | | 13,639 | |
| MITIE Group PLC | | | 3,477 | | | | 13,944 | |
| | | | | | | | |
| | | | | | | $ | 93,539 | |
| Cable TV - 0.3% | | | | | | | | |
| Virgin Media, Inc. | | | 208 | | | $ | 4,959 | |
| | |
| Computer Software - 1.5% | | | | | | | | |
| Dassault Systemes S.A. | | | 290 | | | $ | 24,042 | |
| | |
| Construction - 1.9% | | | | | | | | |
| Bellway PLC | | | 1,044 | | | $ | 12,125 | |
| BUZZI UNICEM S.p.A (a) | | | 880 | | | | 9,335 | |
| Geberit AG | | | 50 | | | | 10,326 | |
| | | | | | | | |
| | | | | | | $ | 31,786 | |
6
Portfolio of Investments (unaudited) – continued
| | | | | | | | |
| Issuer | | Shares/Par | | | Value ($) | |
| | | | | | | | |
| Common Stocks - continued | | | | | | | | |
| Consumer Products - 2.6% | | | | | | | | |
| Beiersdorf AG | | | 176 | | | $ | 10,567 | |
| Reckitt Benckiser Group PLC | | | 615 | | | | 32,717 | |
| | | | | | | | |
| | | | | | | $ | 43,284 | |
| Electrical Equipment - 4.8% | | | | | | | | |
| Legrand S.A. | | | 504 | | | $ | 17,385 | |
| Pfeiffer Vacuum Technology AG | | | 173 | | | | 17,796 | |
| Schneider Electric S.A. | | | 223 | | | | 13,850 | |
| Siemens AG | | | 330 | | | | 31,140 | |
| | | | | | | | |
| | | | | | | $ | 80,171 | |
| Electronics - 1.0% | | | | | | | | |
| ASM International N.V. | | | 389 | | | $ | 12,861 | |
| Infineon Technologies AG | | | 397 | | | | 3,623 | |
| | | | | | | | |
| | | | | | | $ | 16,484 | |
| Energy - Independent - 1.8% | | | | | | | | |
| Bankers Petroleum Ltd. (a) | | | 1,173 | | | $ | 6,270 | |
| Cairn Energy PLC (a) | | | 3,582 | | | | 15,906 | |
| Fuchs Petrolub AG, IPS | | | 176 | | | | 8,150 | |
| | | | | | | | |
| | | | | | | $ | 30,326 | |
| Energy - Integrated - 8.2% | | | | | | | | |
| BG Group PLC | | | 1,018 | | | $ | 22,859 | |
| BP PLC | | | 5,316 | | | | 39,443 | |
| Royal Dutch Shell PLC, “A” | | | 2,077 | | | | 73,330 | |
| | | | | | | | |
| | | | | | | $ | 135,632 | |
| Food & Beverages - 7.7% | | | | | | | | |
| Groupe Danone | | | 732 | | | $ | 45,179 | |
| Nestle S.A. | | | 1,430 | | | | 81,947 | |
| | | | | | | | |
| | | | | | | $ | 127,126 | |
| Food & Drug Stores - 0.8% | | | | | | | | |
| Jeronimo Martins SGPS S.A. (a) | | | 799 | | | $ | 13,341 | |
| | |
| Insurance - 5.5% | | | | | | | | |
| Hiscox Ltd. | | | 3,382 | | | $ | 20,305 | |
| ING Groep N.V. (a) | | | 3,190 | | | | 29,034 | |
| Swiss Re Ltd. | | | 525 | | | | 28,477 | |
| Zurich Financial Services AG | | | 57 | | | | 13,685 | |
| | | | | | | | |
| | | | | | | $ | 91,501 | |
7
Portfolio of Investments (unaudited) – continued
| | | | | | | | |
| Issuer | | Shares/Par | | | Value ($) | |
| | | | | | | | |
| Common Stocks - continued | | | | | | | | |
| Machinery & Tools - 1.8% | | | | | | | | |
| Atlas Copco AB, “A” | | | 746 | | | $ | 17,733 | |
| Schindler Holding AG | | | 107 | | | | 12,426 | |
| | | | | | | | |
| | | | | | | $ | 30,159 | |
| Major Banks - 9.2% | | | | | | | | |
| Banco Santander S.A. | | | 2,156 | | | $ | 16,780 | |
| Barclays PLC | | | 4,783 | | | | 16,020 | |
| BNP Paribas | | | 807 | | | | 34,170 | |
| Credit Suisse Group AG | | | 275 | | | | 7,134 | |
| Danske Bank A.S. (a) | | | 908 | | | | 13,260 | |
| Erste Group Bank AG | | | 451 | | | | 9,905 | |
| HSBC Holdings PLC | | | 4,607 | | | | 38,455 | |
| Julius Baer Group Ltd. | | | 212 | | | | 8,614 | |
| KBC Group N.V. | | | 464 | | | | 8,797 | |
| | | | | | | | |
| | | | | | | $ | 153,135 | |
| Medical & Health Technology & Services - 0.9% | | | | | | | | |
| RHÖN-KLINIKUM AG | | | 750 | | | $ | 15,545 | |
| | |
| Metals & Mining - 1.7% | | | | | | | | |
| Rio Tinto PLC | | | 465 | | | $ | 27,881 | |
| | |
| Network & Telecom - 1.3% | | | | | | | | |
| Ericsson, Inc., “B” | | | 2,302 | | | $ | 21,404 | |
| | |
| Oil Services - 0.6% | | | | | | | | |
| AMEC PLC | | | 277 | | | $ | 4,382 | |
| Technip | | | 53 | | | | 4,972 | |
| | | | | | | | |
| | | | | | | $ | 9,354 | |
| Other Banks & Diversified Financials - 0.6% | | | | | | | | |
| Komercni Banka A.S. | | | 55 | | | $ | 10,509 | |
| | |
| Pharmaceuticals - 10.4% | | | | | | | | |
| Bayer AG | | | 694 | | | $ | 48,603 | |
| Novartis AG | | | 927 | | | | 50,152 | |
| Roche Holding AG | | | 356 | | | | 60,255 | |
| Sanofi | | | 171 | | | | 12,631 | |
| | | | | | | | |
| | | | | | | $ | 171,641 | |
| Real Estate - 0.6% | | | | | | | | |
| GSW Immobilien AG (a) | | | 320 | | | $ | 9,916 | |
8
Portfolio of Investments (unaudited) – continued
| | | | | | | | |
| Issuer | | Shares/Par | | | Value ($) | |
| | | | | | | | |
| Common Stocks - continued | | | | | | | | |
| Restaurants - 1.6% | | | | | | | | |
| Domino’s Pizza UK & IRL PLC | | | 1,835 | | | $ | 13,232 | |
| Whitbread PLC | | | 496 | | | | 12,849 | |
| | | | | | | | |
| | | | | | | $ | 26,081 | |
| Specialty Chemicals - 8.8% | | | | | | | | |
| Akzo Nobel N.V. | | | 859 | | | $ | 44,686 | |
| Croda International PLC | | | 516 | | | | 15,734 | |
| Linde AG | | | 336 | | | | 53,312 | |
| Sika AG | | | 3 | | | | 6,192 | |
| Symrise AG | | | 881 | | | | 25,093 | |
| | | | | | | | |
| | | | | | | $ | 145,017 | |
| Specialty Stores - 1.3% | | | | | | | | |
| Esprit Holdings Ltd. | | | 4,300 | | | $ | 6,343 | |
| Industria de Diseno Textil S.A. | | | 126 | | | | 10,993 | |
| Kingfisher PLC | | | 1,081 | | | | 4,356 | |
| | | | | | | | |
| | | | | | | $ | 21,692 | |
| Telecommunications - Wireless - 3.4% | | | | | | | | |
| Vodafone Group PLC | | | 20,839 | | | $ | 56,087 | |
| | |
| Telephone Services - 2.8% | | | | | | | | |
| Royal KPN N.V. | | | 1,436 | | | $ | 15,741 | |
| TDC A.S. | | | 1,933 | | | | 15,067 | |
| Telecom Italia S.p.A. | | | 6,357 | | | | 6,465 | |
| Telecom Italia S.p.A. | | | 11,617 | | | | 9,718 | |
| | | | | | | | |
| | | | | | | $ | 46,991 | |
| Trucking - 0.7% | | | | | | | | |
| DSV A.S. | | | 555 | | | $ | 11,337 | |
| | |
| Utilities - Electric Power - 2.2% | | | | | | | | |
| CEZ A.S. | | | 348 | | | $ | 14,057 | |
| Fortum Oyj | | | 520 | | | | 11,427 | |
| International Power PLC | | | 2,216 | | | | 11,712 | |
| | | | | | | | |
| | | | | | | $ | 37,196 | |
| Total Common Stocks (Identified Cost, $1,650,476) | | | | | | $ | 1,622,588 | |
9
Portfolio of Investments (unaudited) – continued
| | | | | | | | |
| Money Market Funds - 4.1% | | | | | | | | |
| Issuer | | Shares/Par | | | Value ($) | |
| | | | | | | | |
MFS Institutional Money Market Portfolio, 0.08%,
at Cost and Net Asset Value (v) | | | 68,282 | | | $ | 68,282 | |
| Total Investments (Identified Cost, $1,718,758) | | | | | | $ | 1,690,870 | |
| | |
| Other Assets, Less Liabilities - (2.0)% | | | | | | | (32,683 | ) |
| Net Assets - 100.0% | | | | | | $ | 1,658,187 | |
| (a) | Non-income producing security. |
| (v) | Underlying affiliated fund that is available only to investment companies managed by MFS. The rate quoted for the MFS Institutional Money Market Portfolio is the annualized seven-day yield of the fund at period end. |
The following abbreviations are used in this report and are defined:
| IPS | | International Preference Stock |
| PLC | | Public Limited Company |
See Notes to Financial Statements
10
Financial Statements
STATEMENT OF ASSETS AND LIABILITIES
At 1/31/12 (unaudited)
This statement represents your fund’s balance sheet, which details the assets and liabilities comprising the total value of the fund.
| | | | |
| Assets | | | | |
Investments- | | | | |
Non-affiliated issuers, at value (identified cost, $1,650,476) | | | $1,622,588 | |
Underlying affiliated funds, at cost and value | | | 68,282 | |
Total investments, at value (identified cost, $1,718,758) | | | $1,690,870 | |
Receivables for | | | | |
Investments sold | | | 345 | |
Dividends | | | 5,300 | |
Receivable from investment adviser | | | 16,725 | |
Other assets | | | 104 | |
Total assets | | | $1,713,344 | |
| Liabilities | | | | |
Payables for | | | | |
Investments purchased | | | $2,165 | |
Fund shares reacquired | | | 5,050 | |
Payable to affiliates | | | | |
Shareholder servicing costs | | | 82 | |
Distribution and service fees | | | 22 | |
Payable for independent Trustees’ compensation | | | 166 | |
Accrued expenses and other liabilities | | | 47,672 | |
Total liabilities | | | $55,157 | |
Net assets | | | $1,658,187 | |
| Net assets consist of | | | | |
Paid-in capital | | | $1,796,055 | |
Unrealized appreciation (depreciation) on investments
and translation of assets and liabilities in foreign currencies | | | (27,957 | ) |
Accumulated distributions in excess of net realized gain on investments
and foreign currency transactions | | | (109,452 | ) |
Accumulated distributions in excess of net investment income | | | (459 | ) |
Net assets | | | $1,658,187 | |
Shares of beneficial interest outstanding | | | 167,622 | |
| | | | | | | | | | | | |
| | | Net assets | | | Shares
outstanding | | | Net asset value
per share (a) | |
Class A | | | $579,903 | | | | 58,658 | | | | $9.89 | |
Class B | | | 122,984 | | | | 12,455 | | | | 9.87 | |
Class C | | | 132,569 | | | | 13,452 | | | | 9.85 | |
Class I | | | 822,731 | | | | 83,057 | | | | 9.91 | |
| (a) | Maximum offering price per share was equal to the net asset value per share for all share classes, except for Class A, for which the maximum offering price per share was $10.49 [100 / 94.25 x $9.89]. On sales of $50,000 or more, the maximum offering price of Class A shares is reduced. A contingent deferred sales charge may be imposed on redemptions of Class A, Class B, and Class C shares. Redemption price per share was equal to the net asset value per share for Class I. |
See Notes to Financial Statements
11
Financial Statements
STATEMENT OF OPERATIONS
Six months ended 1/31/12 (unaudited)
This statement describes how much your fund earned in investment income and accrued in expenses. It also describes any gains and/or losses generated by fund operations.
| | | | |
| Net investment loss | | | | |
Income | | | | |
Dividends | | | $13,606 | |
Dividends from underlying affiliated funds | | | 14 | |
Foreign taxes withheld | | | (648 | ) |
Total investment income | | | $12,972 | |
Expenses | | | | |
Management fee | | | $7,576 | |
Distribution and service fees | | | 2,186 | |
Shareholder servicing costs | | | 1,531 | |
Administrative services fee | | | 8,818 | |
Independent Trustees’ compensation | | | 638 | |
Custodian fee | | | 24,149 | |
Shareholder communications | | | 3,823 | |
Audit and tax fees | | | 24,621 | |
Legal fees | | | 550 | |
Registration fees | | | 29,598 | |
Miscellaneous | | | 6,379 | |
Total expenses | | | $109,869 | |
Reduction of expenses by investment adviser | | | (96,742 | ) |
Net expenses | | | $13,127 | |
Net investment loss | | | $(155 | ) |
Realized and unrealized gain (loss) on investments
and foreign currency transactions | | | | |
Realized gain (loss) (identified cost basis) | | | | |
Investment transactions | | | $(103,079 | ) |
Foreign currency transactions | | | 1 | |
Net realized gain (loss) on investments
and foreign currency transactions | | | $(103,078 | ) |
Change in unrealized appreciation (depreciation) | | | | |
Investments | | | $(130,811 | ) |
Translation of assets and liabilities in foreign currencies | | | (285 | ) |
Net unrealized gain (loss) on investments
and foreign currency translation | | | $(131,096 | ) |
Net realized and unrealized gain (loss) on investments
and foreign currency | | | $(234,174 | ) |
Change in net assets from operations | | | $(234,329 | ) |
See Notes to Financial Statements
12
Financial Statements
STATEMENTS OF CHANGES IN NET ASSETS
These statements describe the increases and/or decreases in net assets resulting from operations, any distributions, and any shareholder transactions.
| | | | | | | | |
| | | Six months ended
1/31/12 | | | Period ended
7/31/11 (c) | |
| Change in net assets | | (unaudited) | | | | |
| From operations | | | | | | | | |
Net investment income (loss) | | | $(155 | ) | | | $23,428 | |
Net realized gain (loss) on investments and
foreign currency transactions | | | (103,078 | ) | | | 12,946 | |
Net unrealized gain (loss) on investments and
foreign currency translation | | | (131,096 | ) | | | 103,139 | |
Change in net assets from operations | | | $(234,329 | ) | | | $139,513 | |
| Distributions declared to shareholders | | | | | | | | |
From net investment income | | | $(22,701 | ) | | | $— | |
From net realized gain on investments | | | (20,351 | ) | | | — | |
Total distributions declared to shareholders | | | $(43,052 | ) | | | $— | |
Change in net assets from fund share transactions | | | $(42,103 | ) | | | $1,838,158 | |
Total change in net assets | | | $(319,484 | ) | | | $1,977,671 | |
| Net assets | | | | | | | | |
At beginning of period | | | 1,977,671 | | | | — | |
At end of period (including accumulated distributions in excess of net investment income of $459 and undistributed net investment income of $22,397, respectively) | | | $1,658,187 | | | | $1,977,671 | |
| (c) | For the period from the commencement of the fund’s investment operations, September 15, 2010, through the stated period end. |
See Notes to Financial Statements
13
Financial Statements
FINANCIAL HIGHLIGHTS
The financial highlights table is intended to help you understand the fund’s financial performance for the semiannual period and the past 5 fiscal years (or life of a particular share class, if shorter). Certain information reflects financial results for a single fund share. The total returns in the table represent the rate by which an investor would have earned (or lost) on an investment in the fund share class (assuming reinvestment of all distributions) held for the entire period.
| | | | | | | | |
| Class A | | Six months
ended
1/31/12 | | | Period
ended
7/31/11 (c) | |
| | | (unaudited) | | | | |
Net asset value, beginning of period | | | $11.48 | | | | $10.00 | |
| Income (loss) from investment operations | | | | | | | | |
Net investment income (d) | | | $0.00 | (w) | | | $0.25 | |
Net realized and unrealized gain (loss)
on investments and foreign currency | | | (1.33 | ) | | | 1.23 | |
Total from investment operations | | | $(1.33 | ) | | | $1.48 | |
| Less distributions declared to shareholders | | | | | | | | |
From net investment income | | | $(0.14 | ) | | | $— | |
From net realized gain on investments | | | (0.12 | ) | | | — | |
Total distributions declared to shareholders | | | $(0.26 | ) | | | $— | |
Net asset value, end of period (x) | | | $9.89 | | | | $11.48 | |
Total return (%) (r)(s)(t)(x) | | | (11.43 | )(n) | | | 14.80 | (n) |
Ratios (%) (to average net assets)
and Supplemental data: | | | | | | | | |
Expenses before expense reductions (f) | | | 13.04 | (a) | | | 13.74 | (a) |
Expenses after expense reductions (f) | | | 1.55 | (a) | | | 1.55 | (a) |
Net investment income | | | 0.01 | (a) | | | 2.50 | (a) |
Portfolio turnover | | | 26 | | | | 26 | |
Net assets at end of period (000 omitted) | | | $580 | | | | $790 | |
See Notes to Financial Statements
14
Financial Highlights – continued
| | | | | | | | |
| Class B | | Six months
ended
1/31/12 | | | Period
ended
7/31/11 (c) | |
| | | (unaudited) | | | | |
Net asset value, beginning of period | | | $11.40 | | | | $10.00 | |
| Income (loss) from investment operations | | | | | | | | |
Net investment income (loss) (d) | | | $(0.04 | ) | | | $0.15 | |
Net realized and unrealized gain (loss)
on investments and foreign currency | | | (1.32 | ) | | | 1.25 | |
Total from investment operations | | | $(1.36 | ) | | | $1.40 | |
| Less distributions declared to shareholders | | | | | | | | |
From net investment income | | | $(0.05 | ) | | | $— | |
From net realized gain on investments | | | (0.12 | ) | | | — | |
Total distributions declared to shareholders | | | $(0.17 | ) | | | $— | |
Net asset value, end of period (x) | | | $9.87 | | | | $11.40 | |
Total return (%) (r)(s)(t)(x) | | | (11.82 | )(n) | | | 14.00 | (n) |
Ratios (%) (to average net assets)
and Supplemental data: | | | | | | | | |
Expenses before expense reductions (f) | | | 13.88 | (a) | | | 14.34 | (a) |
Expenses after expense reductions (f) | | | 2.30 | (a) | | | 2.30 | (a) |
Net investment income (loss) | | | (0.79 | )(a) | | | 1.54 | (a) |
Portfolio turnover | | | 26 | | | | 26 | |
Net assets at end of period (000 omitted) | | | $123 | | | | $166 | |
See Notes to Financial Statements
15
Financial Highlights – continued
| | | | | | | | |
| Class C | | Six months
ended
1/31/12 | | | Period
ended
7/31/11 (c) | |
| | | (unaudited) | | | | |
Net asset value, beginning of period | | | $11.40 | | | | $10.00 | |
| Income (loss) from investment operations | | | | | | | | |
Net investment income (loss) (d) | | | $(0.04 | ) | | | $0.11 | |
Net realized and unrealized gain (loss)
on investments and foreign currency | | | (1.32 | ) | | | 1.29 | |
Total from investment operations | | | $(1.36 | ) | | | $1.40 | |
| Less distributions declared to shareholders | | | | | | | | |
From net investment income | | | $(0.07 | ) | | | $— | |
From net realized gain on investments | | | (0.12 | ) | | | — | |
Total distributions declared to shareholders | | | $(0.19 | ) | | | $— | |
Net asset value, end of period (x) | | | $9.85 | | | | $11.40 | |
Total return (%) (r)(s)(t)(x) | | | (11.83 | )(n) | | | 14.00 | (n) |
Ratios (%) (to average net assets)
and Supplemental data: | | | | | | | | |
Expenses before expense reductions (f) | | | 13.82 | (a) | | | 14.71 | (a) |
Expenses after expense reductions (f) | | | 2.30 | (a) | | | 2.30 | (a) |
Net investment income (loss) | | | (0.75 | )(a) | | | 1.08 | (a) |
Portfolio turnover | | | 26 | | | | 26 | |
Net assets at end of period (000 omitted) | | | $133 | | | | $180 | |
See Notes to Financial Statements
16
Financial Highlights – continued
| | | | | | | | |
| Class I | | Six months
ended
1/31/12 | | | Period
ended
7/31/11 (c) | |
| | | (unaudited) | | | | |
Net asset value, beginning of period | | | $11.50 | | | | $10.00 | |
| Income (loss) from investment operations | | | | | | | | |
Net investment income (d) | | | $0.01 | | | | $0.18 | |
Net realized and unrealized gain (loss)
on investments and foreign currency | | | (1.33 | ) | | | 1.32 | |
Total from investment operations | | | $(1.32 | ) | | | $1.50 | |
| Less distributions declared to shareholders | | | | | | | | |
From net investment income | | | $(0.15 | ) | | | $— | |
From net realized gain on investments | | | (0.12 | ) | | | — | |
Total distributions declared to shareholders | | | $(0.27 | ) | | | $— | |
Net asset value, end of period (x) | | | $9.91 | | | | $11.50 | |
Total return (%) (r)(s)(x) | | | (11.30 | )(n) | | | 15.00 | (n) |
Ratios (%) (to average net assets)
and Supplemental data: | | | | | | | | |
Expenses before expense reductions (f) | | | 12.77 | (a) | | | 13.90 | (a) |
Expenses after expense reductions (f) | | | 1.30 | (a) | | | 1.30 | (a) |
Net investment income | | | 0.23 | (a) | | | 1.83 | (a) |
Portfolio turnover | | | 26 | | | | 26 | |
Net assets at end of period (000 omitted) | | | $823 | | | | $842 | |
| (c) | For the period from the commencement of the fund’s investment operations, September 15, 2010, through the stated period end. |
| (d) | Per share data is based on average shares outstanding. |
| (f) | Ratios do not reflect reductions from fees paid indirectly, if applicable. |
| (r) | Certain expenses have been reduced without which performance would have been lower. |
| (s) | From time to time the fund may receive proceeds from litigation settlements, without which performance would be lower. |
| (t) | Total returns do not include any applicable sales charges. |
| (w) | Per share amount was less than $0.01. |
| (x) | The net asset values per share and total returns have been calculated on net asset values which include adjustments made in accordance with U.S. generally accepted accounting principles required at period end for financial reporting purposes. |
See Notes to Financial Statements
17
NOTES TO FINANCIAL STATEMENTS
(unaudited)
| (1) | | Business and Organization |
MFS European Equity Fund (the fund) is a series of MFS Series Trust VII (the trust). The trust is organized as a Massachusetts business trust and is registered under the Investment Company Act of 1940, as amended, as an open-end management investment company.
| (2) | | Significant Accounting Policies |
General – The preparation of financial statements in conformity with U.S. generally accepted accounting principles requires management to make estimates and assumptions that affect the reported amounts of assets and liabilities, and disclosure of contingent assets and liabilities at the date of the financial statements and the reported amounts of revenues and expenses during the reporting period. Actual results could differ from those estimates. In the preparation of these financial statements, management has evaluated subsequent events occurring after the date of the fund’s Statement of Assets and Liabilities through the date that the financial statements were issued. The fund invests in foreign securities. Investments in foreign securities are vulnerable to the effects of changes in the relative values of the local currency and the U.S. dollar and to the effects of changes in each country’s legal, political, and economic environment. The fund’s performance could be closely tied to the market, currency, economic, political, regulatory, geopolitical, or other conditions in the countries or regions in which the fund invests and could be more volatile than the performance of more geographically-diversified funds.
The fund may invest between 25% and 35% of its total assets in the securities of issuers in any particular industry if, at the time of investment, that industry represents 20% or more of the European market as a whole, as measured by an index determined by MFS to be an appropriate measure of the European market. At January 31, 2012, the fund did not have more than 25% of its assets invested in any one industry.
In December 2011, the Financial Accounting Standards Board issued Accounting Standards Update 2011-11, Balance Sheet (Topic 210) – Disclosures about Offsetting Assets and Liabilities (“ASU 2011-11”). Effective for annual reporting periods beginning on or after January 1, 2013 and interim periods within those annual periods, ASU 2011-11 is intended to enhance disclosure requirements on the offsetting of financial assets and liabilities. Although still evaluating the potential impacts of ASU 2011-11 to the fund, management expects that the impact of the fund’s adoption will be limited to additional financial statement disclosures.
Investment Valuations – Equity securities, including restricted equity securities, are generally valued at the last sale or official closing price as
18
Notes to Financial Statements (unaudited) – continued
provided by a third-party pricing service on the market or exchange on which they are primarily traded. Equity securities, for which there were no sales reported that day, are generally valued at the last quoted daily bid quotation as provided by a third-party pricing service on the market or exchange on which such securities are primarily traded. Short-term instruments with a maturity at issuance of 60 days or less generally are valued at amortized cost, which approximates market value. Open-end investment companies are generally valued at net asset value per share. Securities and other assets generally valued on the basis of information from a third-party pricing service may also be valued at a broker/dealer bid quotation. Values obtained from third-party pricing services can utilize both transaction data and market information such as yield, quality, coupon rate, maturity, type of issue, trading characteristics, and other market data. The values of foreign securities and other assets and liabilities expressed in foreign currencies are converted to U.S. dollars using the mean of bid and asked prices for rates provided by a third-party pricing service.
The Board of Trustees has delegated primary responsibility for determining or causing to be determined the value of the fund’s investments (including any fair valuation) to the adviser pursuant to valuation policies and procedures approved by the Board. If the adviser determines that reliable market quotations are not readily available, investments are valued at fair value as determined in good faith by the adviser in accordance with such procedures under the oversight of the Board of Trustees. Under the fund’s valuation policies and procedures, market quotations are not considered to be readily available for most types of debt instruments and floating rate loans and many types of derivatives. These investments are generally valued at fair value based on information from third-party pricing services. In addition, investments may be valued at fair value if the adviser determines that an investment’s value has been materially affected by events occurring after the close of the exchange or market on which the investment is principally traded (such as foreign exchange or market) and prior to the determination of the fund’s net asset value, or after the halting of trading of a specific security where trading does not resume prior to the close of the exchange or market on which the security is principally traded. Events that occur on a frequent basis after foreign markets close (such as developments in foreign markets and significant movements in the U.S. markets) and prior to the determination of the fund’s net asset value may be deemed to have a material effect on the value of securities traded in foreign markets. Accordingly, the fund’s foreign equity securities may often be valued at fair value. The adviser generally relies on third-party pricing services or other information (such as the correlation with price movements of similar securities in the same or other markets; the type, cost and investment characteristics of the security; the business and financial
19
Notes to Financial Statements (unaudited) – continued
condition of the issuer; and trading and other market data) to assist in determining whether to fair value and at what value to fair value an investment. The value of an investment for purposes of calculating the fund’s net asset value can differ depending on the source and method used to determine value. When fair valuation is used, the value of an investment used to determine the fund’s net asset value may differ from quoted or published prices for the same investment. There can be no assurance that the fund could obtain the fair value assigned to an investment if it were to sell the investment at the same time at which the fund determines its net asset value per share.
Various inputs are used in determining the value of the fund’s assets or liabilities. These inputs are categorized into three broad levels. In certain cases, the inputs used to measure fair value may fall into different levels of the fair value hierarchy. In such cases, an investment’s level within the fair value hierarchy is based on the lowest level of input that is significant to the fair value measurement. The fund’s assessment of the significance of a particular input to the fair value measurement in its entirety requires judgment, and considers factors specific to the investment. Level 1 includes unadjusted quoted prices in active markets for identical assets or liabilities. Level 2 includes other significant observable market-based inputs (including quoted prices for similar securities, interest rates, prepayment speed, and credit risk). Level 3 includes unobservable inputs, which may include the adviser’s own assumptions in determining the fair value of investments. The following is a summary of the levels used as of January 31, 2012 in valuing the fund’s assets or liabilities:
| | | | | | | | | | | | | | | | |
| Investments at Value | | Level 1 | | | Level 2 | | | Level 3 | | | Total | |
| Equity Securities | | | $1,622,588 | | | | $— | | | | $— | | | | $1,622,588 | |
| Mutual Funds | | | 68,282 | | | | — | | | | — | | | | 68,282 | |
| Total Investments | | | $1,690,870 | | | | $— | | | | $— | | | | $1,690,870 | |
For further information regarding security characteristics, see the Portfolio of Investments.
Of the level 1 investments presented above, equity investments amounting to $1,198,999 would have been considered level 2 investments at the beginning of the period. The primary reason for changes in the classifications between levels 1 and 2 occurs when foreign equity securities are fair valued using other observable market-based inputs in place of the closing exchange price due to events occurring after the close of the exchange or market on which the investment is principally traded. The fund’s foreign equity securities may often be valued at fair value.
Foreign Currency Translation – Purchases and sales of foreign investments, income, and expenses are converted into U.S. dollars based upon currency exchange rates prevailing on the respective dates of such transactions or on the
20
Notes to Financial Statements (unaudited) – continued
reporting date for foreign denominated receivables and payables. Gains and losses attributable to foreign currency exchange rates on sales of securities are recorded for financial statement purposes as net realized gains and losses on investments. Gains and losses attributable to foreign exchange rate movements on receivables, payables, income and expenses are recorded for financial statement purposes as foreign currency transaction gains and losses. That portion of both realized and unrealized gains and losses on investments that results from fluctuations in foreign currency exchange rates is not separately disclosed.
Indemnifications – Under the fund’s organizational documents, its officers and Trustees may be indemnified against certain liabilities and expenses arising out of the performance of their duties to the fund. Additionally, in the normal course of business, the fund enters into agreements with service providers that may contain indemnification clauses. The fund’s maximum exposure under these agreements is unknown as this would involve future claims that may be made against the fund that have not yet occurred.
Investment Transactions and Income – Investment transactions are recorded on the trade date. Dividends received in cash are recorded on the ex-dividend date. Certain dividends from foreign securities will be recorded when the fund is informed of the dividend if such information is obtained subsequent to the ex-dividend date. Dividend and interest payments received in additional securities are recorded on the ex-dividend or ex-interest date in an amount equal to the value of the security on such date.
The fund may receive proceeds from litigation settlements. Any proceeds received from litigation involving portfolio holdings are reflected in the Statement of Operations in realized gain/loss if the security has been disposed of by the fund or in unrealized gain/loss if the security is still held by the fund. Any other proceeds from litigation not related to portfolio holdings are reflected as other income in the Statement of Operations.
Fees Paid Indirectly – The fund’s custody fee may be reduced according to an arrangement that measures the value of cash deposited with the custodian by the fund. For the six months ended January 31, 2012, custody fees were not reduced.
Tax Matters and Distributions – The fund intends to qualify as a regulated investment company, as defined under Subchapter M of the Internal Revenue Code, and to distribute all of its taxable income, including realized capital gains. As a result, no provision for federal income tax is required. The fund’s federal tax returns remain subject to examination by the Internal Revenue Service. Foreign taxes have been accrued by the fund in the accompanying financial statements.
Distributions to shareholders are recorded on the ex-dividend date. Income and capital gain distributions are determined in accordance with income tax
21
Notes to Financial Statements (unaudited) – continued
regulations, which may differ from U.S. generally accepted accounting principles. Certain capital accounts in the financial statements are periodically adjusted for permanent differences in order to reflect their tax character. These adjustments have no impact on net assets or net asset value per share. Temporary differences which arise from recognizing certain items of income, expense, gain or loss in different periods for financial statement and tax purposes will reverse at some time in the future. Distributions in excess of net investment income or net realized gains are temporary overdistributions for financial statement purposes resulting from differences in the recognition or classification of income or distributions for financial statement and tax purposes.
Book/tax differences primarily relate to wash sale loss deferrals.
The tax character of distributions made during the current period will be determined at fiscal year end. The fund declared no distributions for year ended July 31, 2011.
The federal tax cost and the tax basis components of distributable earnings were as follows:
| | | | |
| As of 1/31/12 | | | |
| Cost of investments | | | $1,724,973 | |
| Gross appreciation | | | 85,268 | |
| Gross depreciation | | | (119,371 | ) |
| Net unrealized appreciation (depreciation) | | | $(34,103 | ) |
| |
| As of 7/31/11 | | | |
| Undistributed ordinary income | | | 42,851 | |
| Other temporary differences | | | (46 | ) |
| Net unrealized appreciation (depreciation) | | | 96,708 | |
The aggregate cost above includes prior fiscal year end tax adjustments, if applicable.
Multiple Classes of Shares of Beneficial Interest – The fund offers multiple classes of shares, which differ in their respective distribution and service fees. The fund’s income, realized and unrealized gain (loss), and common expenses are allocated to shareholders based on the daily net assets of each class. Dividends are declared separately for each class. Differences in per share dividend rates are generally due to differences in separate class expenses. Class B shares will convert to Class A shares approximately eight years after
22
Notes to Financial Statements (unaudited) – continued
purchase. The fund’s distributions declared to shareholders as reported on the Statements of Changes in Net Assets are presented by class as follows:
| | | | | | | | | | | | | | | | |
| | | From net investment
income | | | From net realized gain on
investments | |
| | | Six months ended
1/31/12 | | | Period ended
7/31/11 (c) | | | Six months ended
1/31/12 | | | Period ended
7/31/11 (c) | |
| Class A | | | $8,861 | | | | $— | | | | $7,557 | | | | $— | |
| Class B | | | 657 | | | | — | | | | 1,519 | | | | — | |
| Class C | | | 1,000 | | | | — | | | | 1,713 | | | | — | |
| Class I | | | 12,183 | | | | — | | | | 9,562 | | | | — | |
| Total | | | $22,701 | | | | $— | | | | $20,351 | | | | $— | |
| (c) | For the period from the commencement of the fund’s investment operations, September 15, 2010, through the stated period end. |
| (3) | | Transactions with Affiliates |
Investment Adviser – The fund has an investment advisory agreement with MFS to provide overall investment management and related administrative services and facilities to the fund. The management fee is computed daily and paid monthly at the following annual rates:
| | | | |
| First $1 billion of average daily net assets | | | 0.90 | % |
| Next $1.5 billion of average daily net assets | | | 0.80 | % |
| Average daily net assets in excess of $2.5 billion | | | 0.75 | % |
The management fee incurred for the six months ended January 31, 2012 was equivalent to an annual effective rate of 0.90% of the fund’s average daily net assets.
The investment adviser has agreed in writing to pay a portion of the fund’s total annual operating expenses, exclusive of interest, taxes, extraordinary expenses, brokerage and transaction costs, and investment-related expenses, such that total annual fund operating expenses do not exceed following rates annually of each class’ average daily net assets.
| | | | | | | | | | | | |
| Class A | | Class B | | | Class C | | | Class I | |
| 1.55% | | | 2.30% | | | | 2.30% | | | | 1.30% | |
This written agreement will continue until modified by the fund’s Board of Trustees, but such agreement will continue at least until November 30, 2012. For the six months ended January 31, 2012, this reduction amounted to $96,740 and is reflected as a reduction of total expenses in the Statement of Operations.
Distributor – MFS Fund Distributors, Inc. (MFD), a wholly-owned subsidiary of MFS, as distributor, received $211 for the six months ended January 31, 2012, as its portion of the initial sales charge on sales of Class A shares of the fund.
The Board of Trustees has adopted a distribution plan for certain class shares pursuant to Rule 12b-1 of the Investment Company Act of 1940.
23
Notes to Financial Statements (unaudited) – continued
The fund’s distribution plan provides that the fund will pay MFD for services provided by MFD and financial intermediaries in connection with the distribution and servicing of certain share classes. One component of the plan is a distribution fee paid to MFD and another component of the plan is a service fee paid to MFD. MFD may subsequently pay all, or a portion, of the distribution and/or service fees to financial intermediaries.
Distribution Plan Fee Table:
| | | | | | | | | | | | | | | | | | | | |
| | | Distribution
Fee Rate (d) | | | Service
Fee Rate (d) | | | Total
Distribution
Plan (d) | | | Annual
Effective
Rate (e) | | | Distribution
and Service
Fee | |
| Class A | | | — | | | | 0.25% | | | | 0.25% | | | | 0.25% | | | | $800 | |
| Class B | | | 0.75% | | | | 0.25% | | | | 1.00% | | | | 1.00% | | | | 673 | |
| Class C | | | 0.75% | | | | 0.25% | | | | 1.00% | | | | 1.00% | | | | 713 | |
| Total Distribution and Service Fees | | | | | | | | | | | | $2,186 | |
| (d) | In accordance with the distribution plan for certain classes, the fund pays distribution and/or service fees equal to these annual percentage rates of each class’ average daily net assets. The distribution and service fee rates disclosed by class represent the current rates in effect at the end of the reporting period. |
| (e) | The annual effective rates represent actual fees incurred under the distribution plan for the six months ended January 31, 2012 based on each class’ average daily net assets. |
Certain Class A shares are subject to a contingent deferred sales charge (CDSC) in the event of a shareholder redemption within 24 months of purchase. Class C shares are subject to a CDSC in the event of a shareholder redemption within 12 months of purchase. Class B shares are subject to a CDSC in the event of a shareholder redemption within six years of purchase. All contingent deferred sales charges are paid to MFD and during the six months ended January 31, 2012, were as follows:
| | | | |
| | | Amount | |
| Class A | | | $— | |
| Class B | | | 12 | |
| Class C | | | 26 | |
Shareholder Servicing Agent – MFS Service Center, Inc. (MFSC), a wholly-owned subsidiary of MFS, receives a fee from the fund for its services as shareholder servicing agent calculated as a percentage of the average daily net assets of the fund as determined periodically under the supervision of the fund’s Board of Trustees. For the six months ended January 31, 2012, the fee was $842 which equated to 0.10% annually of the fund’s average daily net assets. MFSC also receives payment from the fund for out-of-pocket expenses, sub-accounting and other shareholder servicing costs which may be paid to affiliated and unaffiliated service providers. For the six months ended January 31, 2012, these out-of-pocket expenses, sub-accounting and other shareholder servicing costs amounted to $689.
Administrator – MFS provides certain financial, legal, shareholder communications, compliance, and other administrative services to the fund.
24
Notes to Financial Statements (unaudited) – continued
Under an administrative services agreement, the fund partially reimburses MFS the costs incurred to provide these services. The fund is charged an annual fixed amount of $17,500 plus a fee based on average daily net assets. The administrative services fee incurred for the six months ended January 31, 2012 was equivalent to an annual effective rate of 1.0475% of the fund’s average daily net assets.
Trustees’ and Officers’ Compensation – The fund pays compensation to independent Trustees in the form of a retainer, attendance fees, and additional compensation to Board and Committee chairpersons. The fund does not pay compensation directly to Trustees or officers of the fund who are also officers of the investment adviser, all of whom receive remuneration for their services to the fund from MFS. Certain officers and Trustees of the fund are officers or directors of MFS, MFD, and MFSC.
Other – This fund and certain other funds managed by MFS (the funds) have entered into services agreements (the Agreements) which provide for payment of fees by the funds to Tarantino LLC and Griffin Compliance LLC in return for the provision of services of an Independent Chief Compliance Officer (ICCO) and Assistant ICCO, respectively, for the funds. The ICCO and Assistant ICCO are officers of the funds and the sole members of Tarantino LLC and Griffin Compliance LLC, respectively. The funds can terminate the Agreements with Tarantino LLC and Griffin Compliance LLC at any time under the terms of the Agreements. For the six months ended January 31, 2012, the aggregate fees paid by the fund to Tarantino LLC and Griffin Compliance LLC were $9 and are included in miscellaneous expense on the Statement of Operations. MFS has agreed to reimburse the fund for a portion of the payments made by the fund in the amount of $2, which is shown as a reduction of total expenses in the Statement of Operations. Additionally, MFS has agreed to bear all expenses associated with office space, other administrative support, and supplies provided to the ICCO and Assistant ICCO.
The fund invests in the MFS Institutional Money Market Portfolio which is managed by MFS and seeks a high level of current income consistent with preservation of capital and liquidity. Income earned on this investment is included in dividends from underlying affiliated funds on the Statement of Operations. This money market fund does not pay a management fee to MFS.
On September 14, 2010, MFS purchased 10,000 shares each of Class A, Class B, and Class C and 70,000 shares of Class I for an aggregate amount of $1,000,000.
Purchases and sales of investments, other than U.S. Government securities, purchased option transactions, and short-term obligations, aggregated $434,494 and $460,515, respectively.
25
Notes to Financial Statements (unaudited) – continued
| (5) | | Shares of Beneficial Interest |
The fund’s Declaration of Trust permits the Trustees to issue an unlimited number of full and fractional shares of beneficial interest. Transactions in fund shares were as follows:
| | | | | | | | | | | | | | | | |
| | | Six months ended
1/31/12 | | | Period ended
7/31/11 (c) | |
| | | Shares | | | Amount | | | Shares | | | Amount | |
| Shares sold | | | | | | | | | | | | | | | | |
Class A | | | 21,847 | | | | $215,739 | | | | 81,544 | | | | $925,860 | |
Class B | | | 5,955 | | | | 55,930 | | | | 20,071 | | | | 214,854 | |
Class C | | | 522 | | | | 5,090 | | | | 17,297 | | | | 184,996 | |
Class I | | | 9,410 | | | | 95,377 | | | | 74,032 | | | | 747,407 | |
| | | 37,734 | | | | $372,136 | | | | 192,944 | | | | $2,073,117 | |
Shares issued to shareholders in
reinvestment of distributions | | | | | | | | | | | | | | | | |
Class A | | | 1,771 | | | | $16,149 | | | | — | | | | $— | |
Class B | | | 238 | | | | 2,176 | | | | — | | | | — | |
Class C | | | 298 | | | | 2,713 | | | | — | | | | — | |
Class I | | | 2,342 | | | | 21,405 | | | | — | | | | — | |
| | | 4,649 | | | | $42,443 | | | | — | | | | $— | |
| Shares reacquired | | | | | | | | | | | | | | | | |
Class A | | | (33,784 | ) | | | $(331,484 | ) | | | (12,720 | ) | | | $(143,993 | ) |
Class B | | | (8,304 | ) | | | (75,616 | ) | | | (5,505 | ) | | | (63,682 | ) |
Class C | | | (3,178 | ) | | | (30,713 | ) | | | (1,487 | ) | | | (17,561 | ) |
Class I | | | (1,886 | ) | | | (18,869 | )�� | | | (841 | ) | | | (9,723 | ) |
| | | (47,152 | ) | | | $(456,682 | ) | | | (20,553 | ) | | | $(234,959 | ) |
| Net change | | | | | | | | | | | | | | | | |
Class A | | | (10,166 | ) | | | $(99,596 | ) | | | 68,824 | | | | $781,867 | |
Class B | | | (2,111 | ) | | | (17,510 | ) | | | 14,566 | | | | 151,172 | |
Class C | | | (2,358 | ) | | | (22,910 | ) | | | 15,810 | | | | 167,435 | |
Class I | | | 9,866 | | | | 97,913 | | | | 73,191 | | | | 737,684 | |
| | | (4,769 | ) | | | $(42,103 | ) | | | 172,391 | | | | $1,838,158 | |
| (c) | For the period from the commencement of the fund’s investment operations, September 15, 2010, through the stated period end. |
The fund and certain other funds managed by MFS participate in a $1.1 billion unsecured committed line of credit, subject to a $1 billion sublimit, provided by a syndication of banks under a credit agreement. Borrowings may be made for temporary financing needs. Interest is charged to each fund, based on its borrowings, generally at a rate equal to the higher of the Federal Reserve funds rate or one month LIBOR plus an agreed upon spread. A commitment fee, based on the average daily, unused portion of the committed line of credit, is allocated among the participating funds at the end of each calendar quarter. In
26
Notes to Financial Statements (unaudited) – continued
addition, the fund and other funds managed by MFS have established unsecured uncommitted borrowing arrangements with certain banks for temporary financing needs. Interest is charged to each fund, based on its borrowings, at a rate equal to the Federal Reserve funds rate plus an agreed upon spread. For the six months ended January 31, 2012, the fund’s commitment fee and interest expense were $5 and $0, respectively, and are included in miscellaneous expense on the Statement of Operations.
| (7) | | Transactions in Underlying Affiliated Funds-Affiliated Issuers |
An affiliated issuer may be considered one in which the fund owns 5% or more of the outstanding voting securities, or a company which is under common control. For the purposes of this report, the fund assumes the following to be affiliated issuers:
| | | | | | | | | | | | | | | | |
| Underlying Affiliated Funds | | Beginning
Shares/Par
Amount | | | Acquisitions
Shares/Par
Amount | | | Dispositions
Shares/Par
Amount | | | Ending
Shares/Par
Amount | |
| MFS Institutional Money Market Portfolio | | | 53,611 | | | | 560,920 | | | | (546,249 | ) | | | 68,282 | |
| | | | |
| Underlying Affiliated Funds | | Realized
Gain (Loss) | | | Capital Gain
Distributions | | | Dividend
Income | | | Ending
Value | |
| MFS Institutional Money Market Portfolio | | | $— | | | | $— | | | | $14 | | | | $68,282 | |
27
BOARD REVIEW OF INVESTMENT ADVISORY AGREEMENT
A discussion regarding the Board’s approval of the fund’s Investment Advisory Agreement with MFS is available by clicking on the fund’s name under “Mutual Funds” in the “Products and Performance” section of the MFS Web site (mfs.com).
PROXY VOTING POLICIES AND INFORMATION
A general description of the MFS funds’ proxy voting policies and procedures is available without charge, upon request, by calling
1-800-225-2606, by visiting the Proxy Voting section of mfs.com or by visiting the SEC’s Web site at http://www.sec.gov.
Information regarding how the fund voted proxies relating to portfolio securities during the most recent twelve-month period ended June 30 is available without charge by visiting the Proxy Voting section of mfs.com or by visiting the SEC’s Web site at http://www.sec.gov.
QUARTERLY PORTFOLIO DISCLOSURE
The fund will file a complete schedule of portfolio holdings with the Securities and Exchange Commission (the Commission) for the first and third quarters of each fiscal year on Form N-Q. A shareholder can obtain the quarterly portfolio holdings report at mfs.com. The fund’s Form N-Q is also available on the EDGAR database on the Commission’s Internet Web site at http://www.sec.gov, and may be reviewed and copied at the:
Public Reference Room
Securities and Exchange Commission
100 F Street, NE, Room 1580
Washington, D.C. 20549
Information on the operation of the Public Reference Room may be obtained by calling the Commission at 1-800-SEC-0330. Copies of the fund’s Form N-Q also may be obtained, upon payment of a duplicating fee, by electronic request at the following e-mail address: publicinfo@sec.gov or by writing the Public Reference Section at the above address.
FURTHER INFORMATION
From time to time, MFS may post important information about the fund or the MFS funds on the MFS web site (mfs.com). This information is available by visiting the “News & Commentary” section of mfs.com or by clicking on the fund’s name under “Mutual Funds” in the “Products and Performance” section of mfs.com.
28
PROVISION OF FINANCIAL REPORTS AND SUMMARY PROSPECTUSES
The fund produces financial reports every six months and updates its summary prospectus and prospectus annually. To avoid sending duplicate copies of materials to households, only one copy of the fund’s annual and semiannual report and summary prospectus may be mailed to shareholders having the same last name and residential address on the fund’s records. However, any shareholder may contact MFSC (please see back cover for address and telephone number) to request that copies of these reports and summary prospectuses be sent personally to that shareholder.
29
Save paper with eDelivery.
MFS® will send you prospectuses, reports, and proxies directly via e-mail so you will get information faster with less mailbox clutter.
To sign up:
1. Go to mfs.com.
2. Log in via MFS® Access.
3. Select eDelivery.
If you own your MFS fund shares through a financial institution or a retirement plan, MFS® TALK, MFS® Access, or eDelivery may not be available to you.

Web site
mfs.com
MFS TALK
1-800-637-8255
24 hours a day
Account service and literature
Shareholders
1-800-225-2606
Financial advisors
1-800-343-2829
Retirement plan services
1-800-637-1255
Mailing address
MFS Service Center, Inc.
P.O. Box 55824
Boston, MA 02205-5824
Overnight mail
MFS Service Center, Inc.
c/o Boston Financial Data Services
30 Dan Road
Canton, MA 02021-2809

MFS® Latin American Equity Fund

SEMIANNUAL REPORT
January 31, 2012
LEQ-SEM
MFS® LATIN AMERICAN EQUITY FUND
The report is prepared for the general information of shareholders.
It is authorized for distribution to prospective investors only when preceded or accompanied by a current prospectus.
NOT FDIC INSURED Ÿ MAY LOSE VALUE Ÿ NO BANK GUARANTEE

LETTER FROM THE CHAIRMAN AND CEO
Dear Shareholders:
We are indeed living through some volatile times. Economic uncertainty is everywhere, as it seems no place in the world has been unmoved by crisis. Over the past year, we have seen a devastating earthquake and tsunami that have led to disruptions in the Japanese markets and supply chains. Protests have changed the face of the Middle East and left in their wake lingering tensions and questions about oil supplies. We have seen debt limits tested in Europe and the United States and policymakers grappling to craft often unpopular monetary and fiscal responses as consumers and businesses struggle with what appears to be a slowing global economy. And now, as the US economy begins to regain its footing, we see the economies of the eurozone heading toward recession as the region’s leaders continue to address sovereign debt crises.
When markets become volatile, managing risk becomes a top priority for investors and their advisors. At MFS® risk management is foremost in our minds in all market climates. Our analysts and portfolio managers keep risks firmly in mind when evaluating securities. Additionally, we have a team of quantitative analysts that measures and assesses the risk profiles of our portfolios and securities on an ongoing basis. The chief investment risk officer, who oversees the team, reports directly to the firm’s president and chief investment officer so the risk associated with each portfolio can be assessed objectively and independently.
As always, we continue to be mindful of the many economic challenges faced at the local, national, and international levels. It is in times such as these that we want to remind investors of the merits of maintaining a long-term view, adhering to basic investing principles such as asset allocation and diversification, and working closely with their advisors to research and identify appropriate investment opportunities.
Respectfully,

Robert J. Manning
Chairman and Chief Executive Officer
MFS Investment Management®
March 19, 2012
The opinions expressed in this letter are subject to change, may not be relied upon for investment advice, and no forecasts can be guaranteed.
1
PORTFOLIO COMPOSITION
Portfolio structure
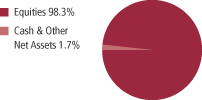
| | | | |
| Top ten holdings | | | | |
| Vale S.A., ADR | | | 6.2% | |
| Petroleo Brasileiro S.A., ADR | | | 4.9% | |
| America Movil S.A.B. de C.V., “L”, ADR | | | 4.1% | |
| BM&F Bovespa S.A. | | | 4.0% | |
| Anhanguera Educacional Participacoes S.A. | | | 3.9% | |
| Credicorp Ltd. | | | 3.1% | |
| Itau Unibanco Multiplo S.A., ADR | | | 3.0% | |
| Banco Santander S.A., IEU | | | 3.0% | |
| Brazil Insurance Participacoes e Administracao S.A. | | | 2.9% | |
| Brasil Brokers Participacoes | | | 2.7% | |
| | | | |
| Equity sectors (a) | | | | |
| Financial Services | | | 23.7% | |
| Basic Materials | | | 14.7% | |
| Special Products & Services | | | 12.8% | |
| Utilities & Communications | | | 10.9% | |
| Energy | | | 8.6% | |
| Consumer Staples | | | 8.2% | |
| Health Care | | | 6.3% | |
| Autos & Housing | | | 3.9% | |
| Retailing | | | 3.7% | |
| Transportation | | | 2.4% | |
| Technology | | | 1.5% | |
| Industrial Goods & Services | | | 1.0% | |
| Leisure | | | 0.6% | |
| |
| Issuer country weightings (x) | | | | |
| Brazil | | | 68.6% | |
| Mexico | | | 16.5% | |
| Argentina | | | 4.5% | |
| Chile | | | 3.5% | |
| Peru | | | 3.1% | |
| United States | | | 1.7% | |
| Panama | | | 1.5% | |
| Colombia | | | 0.6% | |
| |
| Currency exposure weightings (y) | | | | |
| Brazilian Real | | | 65.7% | |
| Mexican Peso | | | 16.5% | |
| United States Dollar | | | 11.0% | |
| Chilean Peso | | | 3.5% | |
| Euro | | | 2.7% | |
| Colombian Peso | | | 0.6% | |
| (a) | The sectors depicted are economic aggregates made up of several underlying industry categories. The fund may invest between 25% and 35% of its total assets in the securities of issuers in any particular industry if, at the time of investment, that industry represents 20% or more of the Latin American market as a whole, as measured by an index determined by MFS to be an appropriate measure of the Latin American market. At January 31, 2012, the fund did not have more than 25% of its assets invested in any one industry. |
| (x) | Represents the portfolio’s exposure to issuer countries as a percentage of a portfolio’s net assets. |
| (y) | Represents the portfolio’s exposure to a particular currency as a percentage of a portfolio’s net assets. |
Percentages are based on net assets as of 1/31/12.
The portfolio is actively managed and current holdings may be different.
2
EXPENSE TABLE
Fund expenses borne by the shareholders during the period,
August 1, 2011 through January 31, 2012
As a shareholder of the fund, you incur two types of costs: (1) transaction costs, including sales charges (loads) on certain purchase or redemption payments, and (2) ongoing costs, including management fees; distribution and service (12b-1) fees; and other fund expenses. This example is intended to help you understand your ongoing costs (in dollars) of investing in the fund and to compare these costs with the ongoing costs of investing in other mutual funds.
The example is based on an investment of $1,000 invested at the beginning of the period and held for the entire period August 1, 2011 through January 31, 2012.
Actual Expenses
The first line for each share class in the following table provides information about actual account values and actual expenses. You may use the information in this line, together with the amount you invested, to estimate the expenses that you paid over the period. Simply divide your account value by $1,000 (for example, an $8,600 account value divided by $1,000 = 8.6), then multiply the result by the number in the first line under the heading entitled “Expenses Paid During Period” to estimate the expenses you paid on your account during this period.
Hypothetical Example for Comparison Purposes
The second line for each share class in the following table provides information about hypothetical account values and hypothetical expenses based on the fund’s actual expense ratio and an assumed rate of return of 5% per year before expenses, which is not the fund’s actual return. The hypothetical account values and expenses may not be used to estimate the actual ending account balance or expenses you paid for the period. You may use this information to compare the ongoing costs of investing in the fund and other funds. To do so, compare this 5% hypothetical example with the 5% hypothetical examples that appear in the shareholder reports of the other funds.
Please note that the expenses shown in the table are meant to highlight your ongoing costs only and do not reflect any transactional costs, such as sales charges (loads). Therefore, the second line for each share class in the table is useful in comparing ongoing costs only, and will not help you determine the relative total costs of owning different funds. In addition, if these transactional costs were included, your costs would have been higher.
3
Expense Table – continued
| | | | | | | | | | | | | | | | | | |
Share
Class | | | | Annualized
Expense
Ratio | | | Beginning
Account Value
8/01/11 | | | Ending
Account Value
1/31/12 | | | Expenses
Paid During
Period (p)
8/01/11-1/31/12 | |
| A | | Actual | | | 1.65% | | | | $1,000.00 | | | | $931.99 | | | | $8.01 | |
| | Hypothetical (h) | | | 1.65% | | | | $1,000.00 | | | | $1,016.84 | | | | $8.36 | |
| B | | Actual | | | 2.40% | | | | $1,000.00 | | | | $927.17 | | | | $11.63 | |
| | Hypothetical (h) | | | 2.40% | | | | $1,000.00 | | | | $1,013.07 | | | | $12.14 | |
| C | | Actual | | | 2.40% | | | | $1,000.00 | | | | $929.05 | | | | $11.64 | |
| | Hypothetical (h) | | | 2.40% | | | | $1,000.00 | | | | $1,013.07 | | | | $12.14 | |
| I | | Actual | | | 1.40% | | | | $1,000.00 | | | | $932.79 | | | | $6.80 | |
| | Hypothetical (h) | | | 1.40% | | | | $1,000.00 | | | | $1,018.10 | | | | $7.10 | |
| (h) | 5% class return per year before expenses. |
| (p) | Expenses paid is equal to each class’ annualized expense ratio, as shown above, multiplied by the average account value over the period, multiplied by the number of days in the period, divided by the number of days in the year. Expenses paid do not include any applicable sales charges (loads). If these transaction costs had been included, your costs would have been higher. |
4
PORTFOLIO OF INVESTMENTS
1/31/12 (unaudited)
The Portfolio of Investments is a complete list of all securities owned by your fund. It is categorized by
broad-based asset classes.
| | | | | | | | |
| Common Stocks - 98.3% | | | | | | | | |
| Issuer | | Shares/Par | | | Value ($) | |
| | | | | | | | |
| Aerospace - 1.0% | | | | | | | | |
| Embraer S.A., ADR | | | 1,246 | | | $ | 34,165 | |
| | |
| Airlines - 2.4% | | | | | | | | |
| Copa Holdings S.A., “A” | | | 742 | | | $ | 50,557 | |
| Grupo Aeroportuario del Sureste S.A. de C.V., ADR | | | 509 | | | | 33,528 | |
| | | | | | | | |
| | | | | | | $ | 84,085 | |
| Alcoholic Beverages - 3.6% | | | | | | | | |
| Companhia de Bebidas das Americas, ADR | | | 2,549 | | | $ | 92,758 | |
| Compania Cervecerías Unidas S.A., ADR | | | 502 | | | | 31,455 | |
| | | | | | | | |
| | | | | | | $ | 124,213 | |
| Apparel Manufacturers - 2.9% | | | | | | | | |
| Arezzo Industria e Comercio S.A. | | | 2,418 | | | $ | 40,466 | |
| Cia.Hering S.A. | | | 2,500 | | | | 60,096 | |
| | | | | | | | |
| | | | | | | $ | 100,562 | |
| Broadcasting - 0.6% | | | | | | | | |
| Grupo Televisa S.A., ADR | | | 1,103 | | | $ | 21,751 | |
| | |
| Brokerage & Asset Managers - 7.1% | | | | | | | | |
| BM&F Bovespa S.A. | | | 21,900 | | | $ | 137,752 | |
| Bolsa Mexicana de Valores S.A. de C.V. | | | 34,900 | | | | 65,173 | |
| CETIP S.A. - Balcao Organizado de Ativos e Derivativos | | | 2,800 | | | | 43,189 | |
| | | | | | | | |
| | | | | | | $ | 246,114 | |
| Business Services - 4.6% | | | | | | | | |
| Cielo S.A. | | | 1,653 | | | $ | 49,244 | |
| LPS Brasil - Consultoria de Imoveis S.A. | | | 2,400 | | | | 44,176 | |
| Multiplus S.A. | | | 1,341 | | | | 23,578 | |
| Qualicorp S.A. (a) | | | 1,700 | | | | 16,823 | |
| Redecard S.A. | | | 1,400 | | | | 25,240 | |
| | | | | | | | |
| | | | | | | $ | 159,061 | |
| Computer Software - 1.5% | | | | | | | | |
| Totvs S.A. | | | 3,000 | | | $ | 51,580 | |
5
Portfolio of Investments (unaudited) – continued
| | | | | | | | |
| Issuer | | Shares/Par | | | Value ($) | |
| | | | | | | | |
| Common Stocks - continued | | | | | | | | |
| Conglomerates - 0.6% | | | | | | | | |
| Alfa S.A de C.V., “A” | | | 1,493 | | | $ | 19,605 | |
| | |
| Construction - 3.9% | | | | | | | | |
| Corporacion GEO S.A.B. de C.V., “B” (a) | | | 11,910 | | | $ | 18,906 | |
| Corporacion Moctezuma S.A. de C.V. | | | 7,800 | | | | 17,953 | |
| PDG Realty S.A. | | | 10,500 | | | | 42,548 | |
| Urbi Desarrollos Urbanos S.A. de C.V. (a) | | | 38,530 | | | | 54,895 | |
| | | | | | | | |
| | | | | | | $ | 134,302 | |
| Consumer Products - 1.2% | | | | | | | | |
| Kimberly-Clark de Mexico S.A. de C.V., “A” | | | 5,050 | | | $ | 28,648 | |
| Natura Cosmeticos S.A. | | | 590 | | | | 12,636 | |
| | | | | | | | |
| | | | | | | $ | 41,284 | |
| Consumer Services - 7.6% | | | | | | | | |
| Anhanguera Educacional Participacoes S.A. | | | 10,200 | | | $ | 137,191 | |
| Kroton Educacional S.A. (a) | | | 3,183 | | | | 37,346 | |
| Kroton Educacional S.A., IEU (a) | | | 7,600 | | | | 89,606 | |
| | | | | | | | |
| | | | | | | $ | 264,143 | |
| Containers - 1.0% | | | | | | | | |
| Industria Klabin de Papel e Celulose, IPS | | | 7,800 | | | $ | 36,161 | |
| | |
| Energy - Independent - 1.0% | | | | | | | | |
| Ultrapar Participacoes S.A. | | | 1,800 | | | $ | 36,418 | |
| | |
| Energy - Integrated - 4.9% | | | | | | | | |
| Petroleo Brasileiro S.A., ADR | | | 5,574 | | | $ | 170,286 | |
| | |
| Food & Beverages - 3.4% | | | | | | | | |
| Embotelladoras Arca S.A. de C.V. | | | 7,895 | | | $ | 36,549 | |
| M. Dias Branco S.A. Industria e Comercio de Alimentos | | | 3,100 | | | | 82,113 | |
| | | | | | | | |
| | | | | | | $ | 118,662 | |
| General Merchandise - 0.8% | | | | | | | | |
| Lojas Renner S.A. | | | 800 | | | $ | 27,015 | |
| | |
| Health Maintenance Organizations - 1.0% | | | | | | | | |
| OdontoPrev S.A. | | | 2,000 | | | $ | 33,425 | |
| | |
| Insurance - 2.9% | | | | | | | | |
| Brazil Insurance Participacoes e Administracao S.A. | | | 8,900 | | | $ | 100,859 | |
6
Portfolio of Investments (unaudited) – continued
| | | | | | | | |
| Issuer | | Shares/Par | | | Value ($) | |
| | | | | | | | |
| Common Stocks - continued | | | | | | | | |
| Medical & Health Technology & Services - 3.2% | | | | | | | | |
| Diagnosticos da America S.A. | | | 7,700 | | | $ | 74,038 | |
| Fleury S.A. | | | 2,800 | | | | 36,619 | |
| | | | | | | | |
| | | | | | | $ | 110,657 | |
| Metals & Mining - 13.3% | | | | | | | | |
| Companhia Siderurgica Nacional S.A., ADR | | | 6,002 | | | $ | 61,641 | |
| Gerdau S.A., ADR | | | 8,291 | | | | 78,765 | |
| Grupo Mexico S.A.B. de C.V., “B” | | | 15,037 | | | | 47,889 | |
| Ternium S.A., ADR | | | 2,658 | | | | 60,257 | |
| Vale S.A., ADR | | | 8,476 | | | | 214,443 | |
| | | | | | | | |
| | | | | | | $ | 462,995 | |
| Oil Services - 2.7% | | | | | | | | |
| Tenaris S.A., ADR | | | 2,419 | | | $ | 94,970 | |
| | |
| Other Banks & Diversified Financials - 11.0% | | | | | | | | |
| Banco Santander Chile, ADR | | | 204 | | | $ | 16,626 | |
| Banco Santander S.A., IEU | | | 11,100 | | | | 102,919 | |
| Bancolombia S.A., ADR | | | 325 | | | | 20,153 | |
| Credicorp Ltd. | | | 946 | | | | 107,522 | |
| CSU Cardsystem S.A. | | | 11,390 | | | | 28,618 | |
| Itau Unibanco Multiplo S.A., ADR | | | 5,282 | | | | 105,429 | |
| | | | | | | | |
| | | | | | | $ | 381,267 | |
| Pharmaceuticals - 2.1% | | | | | | | | |
| Genomma Lab Internacional S.A., “B” (a) | | | 32,900 | | | $ | 72,165 | |
| | |
| Real Estate - 2.7% | | | | | | | | |
| Brasil Brokers Participacoes | | | 24,400 | | | $ | 95,243 | |
| | |
| Specialty Chemicals - 0.4% | | | | | | | | |
| Mexichem S.A.B de C.V. | | | 4,400 | | | $ | 15,215 | |
| | |
| Telecommunications - Wireless - 5.7% | | | | | | | | |
| America Movil S.A.B. de C.V., “L”, ADR | | | 6,072 | | | $ | 140,931 | |
| TIM Participacoes S.A., ADR | | | 1,994 | | | | 57,527 | |
| | | | | | | | |
| | | | | | | $ | 198,458 | |
| Telephone Services - 0.4% | | | | | | | | |
| Empresa Nacional de Telecomunicaciones S.A. | | | 784 | | | $ | 14,353 | |
7
Portfolio of Investments (unaudited) – continued
| | | | | | | | |
| Issuer | | Shares/Par | | | Value ($) | |
| | | | | | | | |
| Common Stocks - continued | | | | | | | | |
| Utilities - Electric Power - 4.8% | | | | | | | | |
| Aguas Andinas S.A. | | | 43,825 | | | $ | 26,040 | |
| Eletropaulo Metropolitana S.A., IPS | | | 1,780 | | | | 36,890 | |
| Enersis S.A., ADR | | | 1,892 | | | | 34,643 | |
| Equatorial Energia S.A. | | | 3,600 | | | | 25,343 | |
| Tractebel Energia S.A. | | | 2,530 | | | | 43,933 | |
| | | | | | | | |
| | | | | | | $ | 166,849 | |
| Total Common Stocks (Identified Cost, $3,356,569) | | | | | | $ | 3,415,863 | |
| | |
| Money Market Funds - 1.9% | | | | | | | | |
MFS Institutional Money Market Portfolio, 0.08%,
at Cost and Net Asset Value (v) | | | 65,839 | | | $ | 65,839 | |
| Total Investments (Identified Cost, $3,422,408) | | | | | | $ | 3,481,702 | |
| | |
| Other Assets, Less Liabilities - (0.2)% | | | | | | | (7,350 | ) |
| Net Assets - 100.0% | | | | | | $ | 3,474,352 | |
| (a) | Non-income producing security. |
| (v) | Underlying affiliated fund that is available only to investment companies managed by MFS. The rate quoted for the MFS Institutional Money Market Portfolio is the annualized seven-day yield of the fund at period end. |
The following abbreviations are used in this report and are defined:
| ADR | | American Depository Receipt |
| IEU | | International Equity Unit |
| IPS | | International Preference Stock |
See Notes to Financial Statements
8
Financial Statements
STATEMENT OF ASSETS AND LIABILITIES
At 1/31/12 (unaudited)
This statement represents your fund’s balance sheet, which details the assets and liabilities comprising the total value of the fund.
| | | | |
| Assets | | | | |
Investments- | | | | |
Non-affiliated issuers, at value (identified cost, $3,356,569) | | | $3,415,863 | |
Underlying affiliated funds, at cost and value | | | 65,839 | |
Total investments, at value (identified cost, $3,422,408) | | | $3,481,702 | |
Foreign currency, at value (identified cost, $1,977) | | | 1,970 | |
Receivables for | | | | |
Investments sold | | | 24,781 | |
Fund shares sold | | | 32,180 | |
Interest and dividends | | | 7,569 | |
Receivable from investment adviser | | | 24,724 | |
Other assets | | | 146 | |
Total assets | | | $3,573,072 | |
| Liabilities | | | | |
Payables for | | | | |
Investments purchased | | | $60,115 | |
Payable to affiliates | | | | |
Shareholder servicing costs | | | 26 | |
Distribution and service fees | | | 71 | |
Payable for independent Trustees’ compensation | | | 166 | |
Accrued expenses and other liabilities | | | 38,342 | |
Total liabilities | | | $98,720 | |
Net assets | | | $3,474,352 | |
| Net assets consist of | | | | |
Paid-in capital | | | $3,613,496 | |
Unrealized appreciation (depreciation) on investments and translation of assets and liabilities in foreign currencies | | | 59,539 | |
Accumulated distributions in excess of net realized gain on investments and foreign currency transactions | | | (211,249 | ) |
Undistributed net investment income | | | 12,566 | |
Net assets | | | $3,474,352 | |
Shares of beneficial interest outstanding | | | 351,925 | |
| | | | | | | | | | | | |
| | | Net assets | | | Shares
outstanding | | | Net asset value
per share (a) | |
Class A | | | $1,849,118 | | | | 186,941 | | | | $9.89 | |
Class B | | | 606,605 | | | | 61,945 | | | | 9.79 | |
Class C | | | 258,812 | | | | 26,385 | | | | 9.81 | |
Class I | | | 759,817 | | | | 76,654 | | | | 9.91 | |
| (a) | Maximum offering price per share was equal to the net asset value per share for all share classes, except for Class A, for which the maximum offering price per share was $10.49 [100 / 94.25 x $9.89]. On sales of $50,000 or more, the maximum offering price of Class A shares is reduced. A contingent deferred sales charge may be imposed on redemptions of Class A, Class B, and Class C shares. Redemption price per share was equal to the net asset value per share for Class I. |
See Notes to Financial Statements
9
Financial Statements
STATEMENT OF OPERATIONS
Six months ended 1/31/12 (unaudited)
This statement describes how much your fund earned in investment income and accrued in expenses. It also describes any gains and/or losses generated by fund operations.
| | | | |
| Net investment income | | | | |
Income | | | | |
Dividends | | | $42,030 | |
Dividends from underlying affiliated funds | | | 22 | |
Foreign taxes withheld | | | (2,395 | ) |
Total investment income | | | $39,657 | |
Expenses | | | | |
Management fee | | | $15,803 | |
Distribution and service fees | | | 5,813 | |
Shareholder servicing costs | | | 2,471 | |
Administrative services fee | | | 8,818 | |
Independent Trustees’ compensation | | | 640 | |
Custodian fee | | | 38,379 | |
Shareholder communications | | | 3,951 | |
Audit and tax fees | | | 24,584 | |
Legal fees | | | 1,065 | |
Registration fees | | | 30,250 | |
Miscellaneous | | | 6,332 | |
Total expenses | | | $138,106 | |
Fees paid indirectly | | | (1 | ) |
Reduction of expenses by investment adviser | | | (111,304 | ) |
Net expenses | | | $26,801 | |
Net investment income | | | $12,856 | |
Realized and unrealized gain (loss) on investments
and foreign currency transactions | | | | |
Realized gain (loss) (identified cost basis) | | | | |
Investment transactions | | | $(167,254 | ) |
Foreign currency transactions | | | (10,707 | ) |
Net realized gain (loss) on investments and foreign currency transactions | | | $(177,961 | ) |
Change in unrealized appreciation (depreciation) | | | | |
Investments | | | $(5,167 | ) |
Translation of assets and liabilities in foreign currencies | | | 155 | |
Net unrealized gain (loss) on investments and foreign currency translation | | | $(5,012 | ) |
Net realized and unrealized gain (loss) on investments and foreign currency | | | $(182,973 | ) |
Change in net assets from operations | | | $(170,117 | ) |
See Notes to Financial Statements
10
Financial Statements
STATEMENTS OF CHANGES IN NET ASSETS
These statements describe the increases and/or decreases in net assets resulting from operations, any distributions, and any shareholder transactions.
| | | | | | | | |
| | | Six months ended
1/31/12 | | | Period ended
7/31/11 (c) | |
| Change in net assets | | (unaudited) | | | | |
| From operations | | | | | | | | |
Net investment income | | | $12,856 | | | | $36,169 | |
Net realized gain (loss) on investments and foreign
currency transactions | | | (177,961 | ) | | | (27,435 | ) |
Net unrealized gain (loss) on investments and foreign
currency translation | | | (5,012 | ) | | | 64,551 | |
Change in net assets from operations | | | $(170,117 | ) | | | $73,285 | |
| Distributions declared to shareholders | | | | | | | | |
From net investment income | | | $(2,610 | ) | | | $ — | |
From net realized gain on investments | | | (39,702 | ) | | | — | |
Total distributions declared to shareholders | | | $(42,312 | ) | | | $ — | |
Change in net assets from fund share transactions | | | $584,853 | | | | $3,028,643 | |
Total change in net assets | | | $372,424 | | | | $3,101,928 | |
| Net assets | | | | | | | | |
At beginning of period | | | 3,101,928 | | | | — | |
At end of period (including undistributed net investment income of $12,566 and $2,320, respectively) | | | $3,474,352 | | | | $3,101,928 | |
| (c) | For the period from the commencement of the fund’s investment operations, September 15, 2010, through the stated period end. |
See Notes to Financial Statements
11
Financial Statements
FINANCIAL HIGHLIGHTS
The financial highlights table is intended to help you understand the fund’s financial performance for the semiannual period and the past 5 fiscal years (or life of a particular share class, if shorter). Certain information reflects financial results for a single fund share. The total returns in the table represent the rate by which an investor would have earned (or lost) on an investment in the fund share class (assuming reinvestment of all distributions) held for the entire period.
| | | | | | | | |
| Class A | | Six months
ended
1/31/12 | | | Period
ended
7/31/11 (c) | |
| | | (unaudited) | | | | |
Net asset value, beginning of period | | | $10.77 | | | | $10.00 | |
| Income (loss) from investment operations | | | | | | | | |
Net investment income (d) | | | $0.04 | | | | $0.18 | |
Net realized and unrealized gain (loss)
on investments and foreign currency | | | (0.79 | ) | | | 0.59 | (g) |
Total from investment operations | | | $(0.75 | ) | | | $0.77 | |
| Less distributions declared to shareholders | | | | | | | | |
From net investment income | | | $(0.01 | ) | | | $— | |
From net realized gain on investments | | | (0.12 | ) | | | — | |
Total distributions declared to shareholders | | | $(0.13 | ) | | | $— | |
Net asset value, end of period (x) | | | $9.89 | | | | $10.77 | |
Total return (%) (r)(s)(t)(x) | | | (6.80 | )(n) | | | 7.70 | (n) |
Ratios (%) (to average net assets)
and Supplemental data: | | | | | | | | |
Expenses before expense reductions (f) | | | 9.04 | (a) | | | 9.38 | (a) |
Expenses after expense reductions (f) | | | 1.65 | (a) | | | 1.65 | (a) |
Net investment income | | | 0.94 | (a)(l) | | | 1.83 | (a) |
Portfolio turnover | | | 24 | | | | 30 | |
Net assets at end of period (000 omitted) | | | $1,849 | | | | $1,490 | |
See Notes to Financial Statements
12
Financial Highlights – continued
| | | | | | | | |
| Class B | | Six months
ended
1/31/12 | | | Period
ended
7/31/11 (c) | |
| | | (unaudited) | | | | |
Net asset value, beginning of period | | | $10.71 | | | | $10.00 | |
| Income (loss) from investment operations | | | | | | | | |
Net investment income (d) | | | $0.01 | | | | $0.12 | |
Net realized and unrealized gain (loss)
on investments and foreign currency | | | (0.81 | ) | | | 0.59 | (g) |
Total from investment operations | | | $(0.80 | ) | | | $0.71 | |
| Less distributions declared to shareholders | | | | | | | | |
From net realized gain on investments | | | $(0.12 | ) | | | $— | |
Net asset value, end of period (x) | | | $9.79 | | | | $10.71 | |
Total return (%) (r)(s)(t)(x) | | | (7.28 | )(n) | | | 7.10 | (n) |
Ratios (%) (to average net assets)
and Supplemental data: | | | | | | | | |
Expenses before expense reductions (f) | | | 9.83 | (a) | | | 9.76 | (a) |
Expenses after expense reductions (f) | | | 2.40 | (a) | | | 2.40 | (a) |
Net investment income | | | 0.29 | (a)(l) | | | 1.26 | (a) |
Portfolio turnover | | | 24 | | | | 30 | |
Net assets at end of period (000 omitted) | | | $607 | | | | $542 | |
| | |
| Class C | | Six months
ended
1/31/12 | | | Period
ended
7/31/11 (c) | |
| | | (unaudited) | | | | |
Net asset value, beginning of period | | | $10.71 | | | | $10.00 | |
| Income (loss) from investment operations | | | | | | | | |
Net investment income (d) | | | $0.01 | | | | $0.12 | |
Net realized and unrealized gain (loss)
on investments and foreign currency | | | (0.79 | ) | | | 0.59 | (g) |
Total from investment operations | | | $(0.78 | ) | | | $0.71 | |
| Less distributions declared to shareholders | | | | | | | | |
From net realized gain on investments | | | $(0.12 | ) | | | $— | |
Net asset value, end of period (x) | | | $9.81 | | | | $10.71 | |
Total return (%) (r)(s)(t)(x) | | | (7.10 | )(n) | | | 7.10 | (n) |
Ratios (%) (to average net assets)
and Supplemental data: | | | | | | | | |
Expenses before expense reductions (f) | | | 9.79 | (a) | | | 10.51 | (a) |
Expenses after expense reductions (f) | | | 2.40 | (a) | | | 2.40 | (a) |
Net investment income | | | 0.26 | (a)(l) | | | 1.25 | (a) |
Portfolio turnover | | | 24 | | | | 30 | |
Net assets at end of period (000 omitted) | | | $259 | | | | $263 | |
See Notes to Financial Statements
13
Financial Highlights – continued
| | | | | | | | |
| Class I | | Six months
ended
1/31/12 | | | Period
ended
7/31/11 (c) | |
| | | (unaudited) | | | | |
Net asset value, beginning of period | | | $10.80 | | | | $10.00 | |
| Income (loss) from investment operations | | | | | | | | |
Net investment income (d) | | | $0.06 | | | | $0.18 | |
Net realized and unrealized gain (loss)
on investments and foreign currency | | | (0.81 | ) | | | 0.62 | (g) |
Total from investment operations | | | $(0.75 | ) | | | $0.80 | |
| Less distributions declared to shareholders | | | | | | | | |
From net investment income | | | $(0.02 | ) | | | $— | |
From net realized gain on investments | | | (0.12 | ) | | | — | |
Total distributions declared to shareholders | | | $(0.14 | ) | | | $— | |
Net asset value, end of period (x) | | | $9.91 | | | | $10.80 | |
Total return (%) (r)(s)(x) | | | (6.72 | )(n) | | | 8.00 | (n) |
Ratios (%) (to average net assets)
and Supplemental data: | | | | | | | | |
Expenses before expense reductions (f) | | | 8.79 | (a) | | | 10.71 | (a) |
Expenses after expense reductions (f) | | | 1.40 | (a) | | | 1.40 | (a) |
Net investment income | | | 1.31 | (a)(l) | | | 1.93 | (a) |
Portfolio turnover | | | 24 | | | | 30 | |
Net assets at end of period (000 omitted) | | | $760 | | | | $807 | |
| (c) | For the period from the commencement of the fund’s investment operations, September 15, 2010, through the stated period end. |
| (d) | Per share data is based on average shares outstanding. |
| (f) | Ratios do not reflect reductions from fees paid indirectly, if applicable. |
| (g) | The per share amount varies from the net realized and unrealized gain/loss for the period because of the timing of sales of fund shares and the per share amount of realized and unrealized gains and losses at such time. |
| (l) | Recognition of net investment income by the fund may be affected by the timing of the declaration of dividends by companies in which the fund invests and the actual annual net investment income ratio may differ. |
| (r) | Certain expenses have been reduced without which performance would have been lower. |
| (s) | From time to time the fund may receive proceeds from litigation settlements, without which performance would be lower. |
| (t) | Total returns do not include any applicable sales charges. |
| (x) | The net asset values per share and total returns have been calculated on net assets which include adjustments made in accordance with U.S. generally accepted accounting principles required at period end for financial reporting purposes. |
See Notes to Financial Statements
14
NOTES TO FINANCIAL STATEMENTS
(unaudited)
| (1) | | Business and Organization |
MFS Latin American Equity Fund (the fund) is a series of MFS Series Trust VII (the trust). The trust is organized as a Massachusetts business trust and is registered under the Investment Company Act of 1940, as amended, as an open-end management investment company.
| (2) | | Significant Accounting Policies |
General – The preparation of financial statements in conformity with U.S. generally accepted accounting principles requires management to make estimates and assumptions that affect the reported amounts of assets and liabilities, and disclosure of contingent assets and liabilities at the date of the financial statements and the reported amounts of revenues and expenses during the reporting period. Actual results could differ from those estimates. In the preparation of these financial statements, management has evaluated subsequent events occurring after the date of the fund’s Statement of Assets and Liabilities through the date that the financial statements were issued. The fund invests in foreign securities, including securities of emerging market issuers. Investments in foreign securities are vulnerable to the effects of changes in the relative values of the local currency and the U.S. dollar and to the effects of changes in each country’s legal, political, and economic environment. The markets of emerging markets countries are generally more volatile than the markets of developed countries with more mature economies. All of the risks of investing in foreign securities previously described are heightened when investing in emerging markets countries. The fund’s performance could be closely tied to the market, currency, economic, political, regulatory, geopolitical, or other conditions in the countries or regions in which the fund invests and could be more volatile than the performance of more geographically-diversified funds.
The fund may invest between 25% and 35% of its total assets in the securities of issuers in any particular industry if, at the time of investment, that industry represents 20% or more of the Latin American market as a whole, as measured by an index determined by MFS to be an appropriate measure of the Latin American market. At January 31, 2012, the fund did not have more than 25% of its assets invested in any one industry.
In December 2011, the Financial Accounting Standards Board issued Accounting Standards Update 2011-11, Balance Sheet (Topic 210) – Disclosures about Offsetting Assets and Liabilities (“ASU 2011-11”). Effective for annual reporting periods beginning on or after January 1, 2013 and interim periods within those annual periods, ASU 2011-11 is intended to enhance disclosure requirements on the offsetting of financial assets and liabilities. Although still
15
Notes to Financial Statements (unaudited) – continued
evaluating the potential impacts of ASU 2011-11 to the fund, management expects that the impact of the fund’s adoption will be limited to additional financial statement disclosures.
Investment Valuations – Equity securities, including restricted equity securities, are generally valued at the last sale or official closing price as provided by a third-party pricing service on the market or exchange on which they are primarily traded. Equity securities, for which there were no sales reported that day, are generally valued at the last quoted daily bid quotation as provided by a third-party pricing service on the market or exchange on which such securities are primarily traded. Short-term instruments with a maturity at issuance of 60 days or less generally are valued at amortized cost, which approximates market value. Open-end investment companies are generally valued at net asset value per share. Securities and other assets generally valued on the basis of information from a third-party pricing service may also be valued at a broker/dealer bid quotation. Values obtained from third-party pricing services can utilize both transaction data and market information such as yield, quality, coupon rate, maturity, type of issue, trading characteristics, and other market data. The values of foreign securities and other assets and liabilities expressed in foreign currencies are converted to U.S. dollars using the mean of bid and asked prices for rates provided by a third-party pricing service.
The Board of Trustees has delegated primary responsibility for determining or causing to be determined the value of the fund’s investments (including any fair valuation) to the adviser pursuant to valuation policies and procedures approved by the Board. If the adviser determines that reliable market quotations are not readily available, investments are valued at fair value as determined in good faith by the adviser in accordance with such procedures under the oversight of the Board of Trustees. Under the fund’s valuation policies and procedures, market quotations are not considered to be readily available for most types of debt instruments and floating rate loans and many types of derivatives. These investments are generally valued at fair value based on information from third-party pricing services. In addition, investments may be valued at fair value if the adviser determines that an investment’s value has been materially affected by events occurring after the close of the exchange or market on which the investment is principally traded (such as foreign exchange or market) and prior to the determination of the fund’s net asset value, or after the halting of trading of a specific security where trading does not resume prior to the close of the exchange or market on which the security is principally traded. Events that occur on a frequent basis after foreign markets close (such as developments in foreign markets and significant movements in the U.S. markets) and prior to the determination of the fund’s
16
Notes to Financial Statements (unaudited) – continued
net asset value may be deemed to have a material effect on the value of securities traded in foreign markets. Accordingly, the fund’s foreign equity securities may often be valued at fair value. The adviser generally relies on third-party pricing services or other information (such as the correlation with price movements of similar securities in the same or other markets; the type, cost and investment characteristics of the security; the business and financial condition of the issuer; and trading and other market data) to assist in determining whether to fair value and at what value to fair value an investment. The value of an investment for purposes of calculating the fund’s net asset value can differ depending on the source and method used to determine value. When fair valuation is used, the value of an investment used to determine the fund’s net asset value may differ from quoted or published prices for the same investment. There can be no assurance that the fund could obtain the fair value assigned to an investment if it were to sell the investment at the same time at which the fund determines its net asset value per share.
Various inputs are used in determining the value of the fund’s assets or liabilities. These inputs are categorized into three broad levels. In certain cases, the inputs used to measure fair value may fall into different levels of the fair value hierarchy. In such cases, an investment’s level within the fair value hierarchy is based on the lowest level of input that is significant to the fair value measurement. The fund’s assessment of the significance of a particular input to the fair value measurement in its entirety requires judgment, and considers factors specific to the investment. Level 1 includes unadjusted quoted prices in active markets for identical assets or liabilities. Level 2 includes other significant observable market-based inputs (including quoted prices for similar securities, interest rates, prepayment speed, and credit risk). Level 3 includes unobservable inputs, which may include the adviser’s own assumptions in determining the fair value of investments. The following is a summary of the levels used as of January 31, 2012 in valuing the fund’s assets or liabilities:
| | | | | | | | | | | | | | | | |
| Investments at Value | | Level 1 | | | Level 2 | | | Level 3 | | | Total | |
| Equity Securities | | | $3,415,863 | | | | $— | | | | $— | | | | $3,415,863 | |
| Mutual Funds | | | 65,839 | | | | — | | | | — | | | | 65,839 | |
| Total Investments | | | $3,481,702 | | | | $— | | | | $— | | | | $3,481,702 | |
For further information regarding security characteristics, see the Portfolio of Investments.
Foreign Currency Translation – Purchases and sales of foreign investments, income, and expenses are converted into U.S. dollars based upon currency exchange rates prevailing on the respective dates of such transactions or on the reporting date for foreign denominated receivables and payables. Gains and losses attributable to foreign currency exchange rates on sales of securities are recorded
17
Notes to Financial Statements (unaudited) – continued
for financial statement purposes as net realized gains and losses on investments. Gains and losses attributable to foreign exchange rate movements on receivables, payables, income and expenses are recorded for financial statement purposes as foreign currency transaction gains and losses. That portion of both realized and unrealized gains and losses on investments that results from fluctuations in foreign currency exchange rates is not separately disclosed.
Indemnifications – Under the fund’s organizational documents, its officers and Trustees may be indemnified against certain liabilities and expenses arising out of the performance of their duties to the fund. Additionally, in the normal course of business, the fund enters into agreements with service providers that may contain indemnification clauses. The fund’s maximum exposure under these agreements is unknown as this would involve future claims that may be made against the fund that have not yet occurred.
Investment Transactions and Income – Investment transactions are recorded on the trade date. Dividends received in cash are recorded on the ex-dividend date. Certain dividends from foreign securities will be recorded when the fund is informed of the dividend if such information is obtained subsequent to the ex-dividend date. Dividend and interest payments received in additional securities are recorded on the ex-dividend or ex-interest date in an amount equal to the value of the security on such date.
The fund may receive proceeds from litigation settlements. Any proceeds received from litigation involving portfolio holdings are reflected in the Statement of Operations in realized gain/loss if the security has been disposed of by the fund or in unrealized gain/loss if the security is still held by the fund. Any other proceeds from litigation not related to portfolio holdings are reflected as other income in the Statement of Operations.
Fees Paid Indirectly – The fund’s custody fee may be reduced according to an arrangement that measures the value of cash deposited with the custodian by the fund. This amount, for the six months ended January 31, 2012, is shown as a reduction of total expenses on the Statement of Operations.
Tax Matters and Distributions – The fund intends to qualify as a regulated investment company, as defined under Subchapter M of the Internal Revenue Code, and to distribute all of its taxable income, including realized capital gains. As a result, no provision for federal income tax is required. The fund’s federal tax returns remain subject to examination by the Internal Revenue Service. Foreign taxes have been accrued by the fund in the accompanying financial statements.
Distributions to shareholders are recorded on the ex-dividend date. Income and capital gain distributions are determined in accordance with income tax regulations, which may differ from U.S. generally accepted accounting
18
Notes to Financial Statements (unaudited) – continued
principles. Certain capital accounts in the financial statements are periodically adjusted for permanent differences in order to reflect their tax character. These adjustments have no impact on net assets or net asset value per share. Temporary differences which arise from recognizing certain items of income, expense, gain or loss in different periods for financial statement and tax purposes will reverse at some time in the future. Distributions in excess of net investment income or net realized gains are temporary overdistributions for financial statement purposes resulting from differences in the recognition or classification of income or distributions for financial statement and tax purposes.
Book/tax differences primarily relate to wash sale loss deferrals.
The tax character of distributions made during the current period will be determined at fiscal year end. The fund declared no distributions for the period ended July 31, 2011.
The federal tax cost and the tax basis components of distributable earnings were as follows:
| | | | |
| As of 1/31/12 | | | |
| Cost of investments | | | $3,455,307 | |
| Gross appreciation | | | 236,897 | |
| Gross depreciation | | | (210,502 | ) |
| Net unrealized appreciation (depreciation) | | | $26,395 | |
| |
| As of 7/31/11 | | | |
| Undistributed ordinary income | | | 41,848 | |
| Other temporary differences | | | (125 | ) |
| Net unrealized appreciation (depreciation) | | | 31,562 | |
The aggregate cost above includes prior fiscal year end tax adjustments, if applicable.
Multiple Classes of Shares of Beneficial Interest – The fund offers multiple classes of shares, which differ in their respective distribution and service fees. The fund’s income, realized and unrealized gain (loss), and common expenses are allocated to shareholders based on the daily net assets of each class. Dividends are declared separately for each class. Differences in per share dividend rates are generally due to differences in separate class expenses. Class B shares will convert to Class A shares approximately eight years after
19
Notes to Financial Statements (unaudited) – continued
purchase. The fund’s distributions declared to shareholders as reported on the Statements of Changes in Net Assets are presented by class as follows:
| | | | | | | | | | | | | | | | |
| | | From net investment
income | | | From net realized gain on
investments | |
| | | Six months ended
1/31/12 | | | Period ended
7/31/11 (c) | | | Six months ended
1/31/12 | | | Period ended
7/31/11 (c) | |
| Class A | | | $1,064 | | | | $— | | | | $20,008 | | | | $— | |
| Class B | | | — | | | | — | | | | 7,490 | | | | — | |
| Class C | | | — | | | | — | | | | 3,161 | | | | — | |
| Class I | | | 1,546 | | | | — | | | | 9,043 | | | | — | |
| Total | | | $2,610 | | | | $— | | | | $39,702 | | | | $— | |
| (c) | For the period from the commencement of the fund’s investment operations, September 15, 2010, through the stated period end. |
| (3) | | Transactions with Affiliates |
Investment Adviser – The fund has an investment advisory agreement with MFS to provide overall investment management and related administrative services and facilities to the fund. The management fee is computed daily and paid monthly at the following annual rates:
| | | | |
| First $1 billion of average daily net assets | | | 1.05 | % |
| Next $1.5 billion of average daily net assets | | | 0.95 | % |
| Average daily net assets in excess of $2.5 billion | | | 0.90 | % |
The management fee incurred for the six months ended January 31, 2012 was equivalent to an annual effective rate of 1.05% of the fund’s average daily net assets.
The investment adviser has agreed in writing to pay a portion of the fund’s total annual operating expenses, exclusive of interest, taxes, extraordinary expenses, brokerage and transaction costs, and investment-related expenses, such that total annual fund operating expenses do not exceed the following rates annually of each class’ average daily net assets.
| | | | | | | | | | | | |
| Class A | | Class B | | | Class C | | | Class I | |
| 1.65% | | | 2.40% | | | | 2.40% | | | | 1.40% | |
This written agreement will continue until modified by the fund’s Board of Trustees, but such agreement will continue at least until November 30, 2012. For the six months ended January 31, 2012, this reduction amounted to $111,300 and is reflected as a reduction of total expenses in the Statement of Operations.
Distributor – MFS Fund Distributors, Inc. (MFD), a wholly-owned subsidiary of MFS, as distributor, received $1,491 for the six months ended January 31, 2012, as its portion of the initial sales charge on sales of Class A shares of the fund.
20
Notes to Financial Statements (unaudited) – continued
The Board of Trustees has adopted a distribution plan for certain class shares pursuant to Rule 12b-1 of the Investment Company Act of 1940.
The fund’s distribution plan provides that the fund will pay MFD for services provided by MFD and financial intermediaries in connection with the distribution and servicing of certain share classes. One component of the plan is a distribution fee paid to MFD and another component of the plan is a service fee paid to MFD. MFD may subsequently pay all, or a portion, of the distribution and/or service fees to financial intermediaries.
Distribution Plan Fee Table:
| | | | | | | | | | | | | | | | | | | | |
| | | Distribution
Fee Rate (d) | | | Service
Fee Rate (d) | | | Total
Distribution
Plan (d) | | | Annual
Effective
Rate (e) | | | Distribution
and Service
Fee | |
| Class A | | | — | | | | 0.25% | | | | 0.25% | | | | 0.25% | | | | $1,926 | |
| Class B | | | 0.75% | | | | 0.25% | | | | 1.00% | | | | 1.00% | | | | 2,688 | |
| Class C | | | 0.75% | | | | 0.25% | | | | 1.00% | | | | 1.00% | | | | 1,199 | |
| Total Distribution and Service Fees | | | | | | | | | | | | $5,813 | |
| (d) | In accordance with the distribution plan for certain classes, the fund pays distribution and/or service fees equal to these annual percentage rates of each class’ average daily net assets. The distribution and service fee rates disclosed by class represent the current rates in effect at the end of the reporting period. |
| (e) | The annual effective rates represent actual fees incurred under the distribution plan for the six months ended January 31, 2012 based on each class’ average daily net assets. |
Certain Class A shares are subject to a contingent deferred sales charge (CDSC) in the event of a shareholder redemption within 24 months of purchase. Class C shares are subject to a CDSC in the event of a shareholder redemption within 12 months of purchase. Class B shares are subject to a CDSC in the event of a shareholder redemption within six years of purchase. All contingent deferred sales charges are paid to MFD and during the six months ended January 31, 2012, were as follows:
| | | | |
| | | Amount | |
| Class A | | | $— | |
| Class B | | | 303 | |
| Class C | | | 234 | |
Shareholder Servicing Agent – MFS Service Center, Inc. (MFSC), a wholly-owned subsidiary of MFS, receives a fee from the fund for its services as shareholder servicing agent calculated as a percentage of the average daily net assets of the fund as determined periodically under the supervision of the fund’s Board of Trustees. For the six months ended January 31, 2012, the fee was $954, which equated to 0.0634% annually of the fund’s average daily net assets. MFSC also receives payment from the fund for out-of-pocket expenses, sub-accounting and other shareholder servicing costs which may be paid to affiliated and unaffiliated service providers. For the six months ended January 31, 2012, these out-of-pocket expenses, sub-accounting and other shareholder servicing costs amounted to $1,517.
21
Notes to Financial Statements (unaudited) – continued
Administrator – MFS provides certain financial, legal, shareholder communications, compliance, and other administrative services to the fund. Under an administrative services agreement, the fund partially reimburses MFS the costs incurred to provide these services. The fund is charged an annual fixed amount of $17,500 plus a fee based on average daily net assets. The administrative services fee incurred for the six months ended January 31, 2012 was equivalent to an annual effective rate of 0.5864% of the fund’s average daily net assets.
Trustees’ and Officers’ Compensation – The fund pays compensation to independent Trustees in the form of a retainer, attendance fees, and additional compensation to Board and Committee chairpersons. The fund does not pay compensation directly to Trustees or officers of the fund who are also officers of the investment adviser, all of whom receive remuneration for their services to the fund from MFS. Certain officers and Trustees of the fund are officers or directors of MFS, MFD, and MFSC.
Other – This fund and certain other funds managed by MFS (the funds) have entered into services agreements (the Agreements) which provide for payment of fees by the funds to Tarantino LLC and Griffin Compliance LLC in return for the provision of services of an Independent Chief Compliance Officer (ICCO) and Assistant ICCO, respectively, for the funds. The ICCO and Assistant ICCO are officers of the funds and the sole members of Tarantino LLC and Griffin Compliance LLC, respectively. The funds can terminate the Agreements with Tarantino LLC and Griffin Compliance LLC at any time under the terms of the Agreements. For the six months ended January 31, 2012, the aggregate fees paid by the fund to Tarantino LLC and Griffin Compliance LLC were $16 and are included in miscellaneous expense on the Statement of Operations. MFS has agreed to reimburse the fund for a portion of the payments made by the fund in the amount of $4, which is shown as a reduction of total expenses in the Statement of Operations. Additionally, MFS has agreed to bear all expenses associated with office space, other administrative support, and supplies provided to the ICCO and Assistant ICCO.
The fund invests in the MFS Institutional Money Market Portfolio which is managed by MFS and seeks a high level of current income consistent with preservation of capital and liquidity. Income earned on this investment is included in dividends from underlying affiliated funds on the Statement of Operations. This money market fund does not pay a management fee to MFS.
On September 14, 2010, MFS purchased 10,000 shares each of Class A, Class B, and Class C and 70,000 shares of Class I for an aggregate amount of $1,000,000. On December 23, 2010, MFS redeemed 9,099 shares of Class I for $100,000.
22
Notes to Financial Statements (unaudited) – continued
Purchases and sales of investments, other than U.S. Government securities, purchased option transactions, and short-term obligations, aggregated $1,268,310 and $742,131, respectively.
| (5) | | Shares of Beneficial Interest |
The fund’s Declaration of Trust permits the Trustees to issue an unlimited number of full and fractional shares of beneficial interest. Transactions in fund shares were as follows:
| | | | | | | | | | | | | | | | |
| | | Six months ended
1/31/12 | | | Period ended
7/31/11 (c) | |
| | | Shares | | | Amount | | | Shares | | | Amount | |
| Shares sold | | | | | | | | | | | | | | | | |
Class A | | | 89,720 | | | | $843,501 | | | | 168,184 | | | | $1,807,372 | |
Class B | | | 21,214 | | | | 195,515 | | | | 54,890 | | | | 590,443 | |
Class C | | | 7,324 | | | | 68,723 | | | | 28,486 | | | | 301,603 | |
Class I | | | 1,707 | | | | 16,000 | | | | 84,044 | | | | 853,555 | |
| | | 119,965 | | | | $1,123,739 | | | | 335,604 | | | | $3,552,973 | |
| Shares issued to shareholders in reinvestment of distributions | | | | | | | | | | | | | | | | |
Class A | | | 2,380 | | | | $20,350 | | | | — | | | | $— | |
Class B | | | 786 | | | | 6,657 | | | | — | | | | — | |
Class C | | | 373 | | | | 3,161 | | | | — | | | | — | |
Class I | | | 1,237 | | | | 10,589 | | | | — | | | | — | |
| | | 4,776 | | | | $40,757 | | | | — | | | | $— | |
| Shares reacquired | | | | | | | | | | | | | | | | |
Class A | | | (43,496 | ) | | | $(415,600 | ) | | | (29,847 | ) | | | $(332,257 | ) |
Class B | | | (10,673 | ) | | | (100,600 | ) | | | (4,272 | ) | | | (46,468 | ) |
Class C | | | (5,883 | ) | | | (53,979 | ) | | | (3,915 | ) | | | (42,605 | ) |
Class I | | | (968 | ) | | | (9,464 | ) | | | (9,366 | ) | | | (103,000 | ) |
| | | (61,020 | ) | | | $(579,643 | ) | | | (47,400 | ) | | | $(524,330 | ) |
| Net change | | | | | | | | | | | | | | | | |
Class A | | | 48,604 | | | | $448,251 | | | | 138,337 | | | | $1,475,115 | |
Class B | | | 11,327 | | | | 101,572 | | | | 50,618 | | | | 543,975 | |
Class C | | | 1,814 | | | | 17,905 | | | | 24,571 | | | | 258,998 | |
Class I | | | 1,976 | | | | 17,125 | | | | 74,678 | | | | 750,555 | |
| | | 63,721 | | | | $584,853 | | | | 288,204 | | | | $3,028,643 | |
| (c) | For the period from the commencement of the fund’s investment operations, September 15, 2010, through the stated period end. |
The fund and certain other funds managed by MFS participate in a $1.1 billion unsecured committed line of credit, subject to a $1 billion sublimit, provided by a syndication of banks under a credit agreement. Borrowings may be made
23
Notes to Financial Statements (unaudited) – continued
for temporary financing needs. Interest is charged to each fund, based on its borrowings, generally at a rate equal to the higher of the Federal Reserve funds rate or one month LIBOR plus an agreed upon spread. A commitment fee, based on the average daily, unused portion of the committed line of credit, is allocated among the participating funds at the end of each calendar quarter. In addition, the fund and other funds managed by MFS have established unsecured uncommitted borrowing arrangements with certain banks for temporary financing needs. Interest is charged to each fund, based on its borrowings, at a rate equal to the Federal Reserve funds rate plus an agreed upon spread. For the six months ended January 31, 2012, the fund’s commitment fee and interest expense were $10 and $0, respectively, and are included in miscellaneous expense on the Statement of Operations.
| (7) | | Transactions in Underlying Affiliated Funds-Affiliated Issuers |
An affiliated issuer may be considered one in which the fund owns 5% or more of the outstanding voting securities, or a company which is under common control. For the purposes of this report, the fund assumes the following to be affiliated issuers:
| | | | | | | | | | | | | | | | |
| Underlying Affiliated Funds | | Beginning
Shares/Par
Amount | | | Acquisitions
Shares/Par
Amount | | | Dispositions
Shares/Par
Amount | | | Ending
Shares/Par
Amount | |
MFS Institutional Money
Market Portfolio | | | 57,086 | | | | 1,000,263 | | | | (991,510 | ) | | | 65,839 | |
| | | | |
| Underlying Affiliated Funds | | Realized
Gain (Loss) | | | Capital Gain
Distributions | | | Dividend
Income | | | Ending
Value | |
MFS Institutional Money
Market Portfolio | | | $— | | | | $— | | | | $22 | | | | $65,839 | |
24
BOARD REVIEW OF INVESTMENT ADVISORY AGREEMENT
A discussion regarding the Board’s approval of the fund’s Investment Advisory Agreement with MFS is available by clicking on the fund’s name under “Mutual Funds” in the “Products and Performance” section of the MFS Web site (mfs.com).
PROXY VOTING POLICIES AND INFORMATION
A general description of the MFS funds’ proxy voting policies and procedures is available without charge, upon request, by calling
1-800-225-2606, by visiting the Proxy Voting section of mfs.com or by visiting the SEC’s Web site at http://www.sec.gov.
Information regarding how the fund voted proxies relating to portfolio securities during the most recent twelve-month period ended June 30 is available without charge by visiting the Proxy Voting section of mfs.com or by visiting the SEC’s Web site at http://www.sec.gov.
QUARTERLY PORTFOLIO DISCLOSURE
The fund will file a complete schedule of portfolio holdings with the Securities and Exchange Commission (the Commission) for the first and third quarters of each fiscal year on Form N-Q. A shareholder can obtain the quarterly portfolio holdings report at mfs.com. The fund’s Form N-Q is also available on the EDGAR database on the Commission’s Internet Web site at http://www.sec.gov, and may be reviewed and copied at the:
Public Reference Room
Securities and Exchange Commission
100 F Street, NE, Room 1580
Washington, D.C. 20549
Information on the operation of the Public Reference Room may be obtained by calling the Commission at 1-800-SEC-0330. Copies of the fund’s Form N-Q also may be obtained, upon payment of a duplicating fee, by electronic request at the following e-mail address: publicinfo@sec.gov or by writing the Public Reference Section at the above address.
FURTHER INFORMATION
From time to time, MFS may post important information about the fund or the MFS funds on the MFS web site (mfs.com). This information is available by visiting the “News & Commentary” section of mfs.com or by clicking on the fund’s name under “Mutual Funds” in the “Products and Performance” section of mfs.com.
25
PROVISION OF FINANCIAL REPORTS AND SUMMARY PROSPECTUSES
The fund produces financial reports every six months and updates its summary prospectus and prospectus annually. To avoid sending duplicate copies of materials to households, only one copy of the fund’s annual and semiannual report and summary prospectus may be mailed to shareholders having the same last name and residential address on the fund’s records. However, any shareholder may contact MFSC (please see back cover for address and telephone number) to request that copies of these reports and summary prospectuses be sent personally to that shareholder.
26
Save paper with eDelivery.
MFS® will send you prospectuses, reports, and proxies directly via e-mail so you will get information faster with less mailbox clutter.
To sign up:
1. Go to mfs.com.
2. Log in via MFS® Access.
3. Select eDelivery.
If you own your MFS fund shares through a financial institution or a retirement plan, MFS® TALK, MFS® Access, or eDelivery may not be available to you.

Web site
mfs.com
MFS TALK
1-800-637-8255
24 hours a day
Account service and literature
Shareholders
1-800-225-2606
Financial advisors
1-800-343-2829
Retirement plan services
1-800-637-1255
Mailing address
MFS Service Center, Inc.
P.O. Box 55824
Boston, MA 02205-5824
Overnight mail
MFS Service Center, Inc.
c/o Boston Financial Data Services
30 Dan Road
Canton, MA 02021-2809
During the period covered by this report, the Registrant has not amended any provision in its Code of Ethics (the “Code”) that relates to an element of the Code’s definitions enumerated in paragraph (b) of Item 2 of this Form N-CSR. During the period covered by this report, the Registrant did not grant a waiver, including an implicit waiver, from any provision of the Code.
| ITEM 3. | AUDIT COMMITTEE FINANCIAL EXPERT. |
Not applicable for semi-annual reports.
| ITEM 4. | PRINCIPAL ACCOUNTANT FEES AND SERVICES. |
Not applicable for semi-annual reports.
| ITEM 5. | AUDIT COMMITTEE OF LISTED REGISTRANTS. |
Not applicable to the Registrant.
A schedule of investments for each series of the Registrant is included as part of the report to shareholders of such series under Item 1 of this Form N-CSR.
| ITEM 7. | DISCLOSURE OF PROXY VOTING POLICIES AND PROCEDURES FOR CLOSED-END MANAGEMENT INVESTMENT COMPANIES. |
Not applicable to the Registrant.
| ITEM 8. | PORTFOLIO MANAGERS OF CLOSED-END MANAGEMENT INVESTMENT COMPANIES. |
Not applicable to the Registrant.
| ITEM 9. | PURCHASES OF EQUITY SECURITIES BY CLOSED-END MANAGEMENT INVESTMENT COMPANY AND AFFILIATED PURCHASERS. |
Not applicable to the Registrant.
| ITEM 10. | SUBMISSION OF MATTERS TO A VOTE OF SECURITY HOLDERS. |
There were no material changes to the procedures by which shareholders may send recommendations to the Board for nominees to the Registrant’s Board since the Registrant last provided disclosure as to such procedures in response to the requirements of Item 407 (c)(2)(iv) of Regulation S-K or this Item.
| ITEM 11. | CONTROLS AND PROCEDURES. |
| (a) | Based upon their evaluation of the effectiveness of the registrant’s disclosure controls and procedures (as defined in Rule 30a-3(c) under the Investment Company Act of 1940 (the “Act”)) as conducted within 90 days of the filing date of this report on Form N-CSR, the registrant’s principal financial officer and principal executive officer have concluded that those disclosure controls and procedures provide reasonable assurance that the material information required to be disclosed by the registrant on this report is recorded, processed, summarized and reported within the time periods specified in the Securities and Exchange Commission’s rules and forms. |
| (b) | There were no changes in the registrant’s internal controls over financial reporting (as defined in Rule 30a-3(d) under the Act) that occurred during the second fiscal quarter of the period covered by the report that have materially affected, or are reasonably likely to materially affect, the registrant’s internal control over financial reporting. |
| (a) | File the exhibits listed below as part of this form. Letter or number the exhibits in the sequence indicated. |
| | (1) | Any code of ethics, or amendment thereto, that is the subject of the disclosure required by Item 2, to the extent that the registrant intends to satisfy the Item 2 requirements through filing of an exhibit. |
| | (2) | A separate certification for each principal executive officer and principal financial officer of the registrant as required by Rule 30a-2 under the Act (17 CFR 270.30a-2): Attached hereto. |
| (b) | If the report is filed under Section 13(a) or 15(d) of the Exchange Act, provide the certifications required by Rule 30a-2(b) under the Act (17 CFR 270.30a-2(b)), Rule 13a-14(b) or Rule 15d-14(b) under the Exchange Act (17 CFR 240.13a-14(b) or 240.15d-14(b)) and Section 1350 of Chapter 63 of Title 18 of the United States Code (18 U.S.C. 1350) as an exhibit. A certification furnished pursuant to this paragraph will not be deemed “filed” for the purposes of Section 18 of the Exchange Act (15 U.S.C. 78r), or otherwise subject to the liability of that section. Such certification will not be deemed to be incorporated by reference into any filing under the Securities Act of 1933 or the Exchange Act, except to the extent that the registrant specifically incorporates it by reference: Attached hereto. |
Notice
A copy of the Amended and Restated Declaration of Trust, as amended, of the Registrant is on file with the Secretary of State of The Commonwealth of Massachusetts and notice is hereby given that this instrument is executed on behalf of the Registrant by an officer of the Registrant as an officer and not individually and the obligations of or arising out of this instrument are not binding upon any of the Trustees or shareholders individually, but are binding only upon the assets and property of the respective constituent series of the Registrant.
SIGNATURES
Pursuant to the requirements of the Securities Exchange Act of 1934 and the Investment Company Act of 1940, the registrant has duly caused this report to be signed on its behalf by the undersigned, thereunto duly authorized.
(Registrant) MFS SERIES TRUST VII
| | |
| By (Signature and Title)* | | JOHN M. CORCORAN |
| | John M. Corcoran, President |
Date: March 19, 2012
Pursuant to the requirements of the Securities Exchange Act of 1934 and the Investment Company Act of 1940, this report has been signed below by the following persons on behalf of the registrant and in the capacities and on the dates indicated.
| | |
| By (Signature and Title)* | | JOHN M. CORCORAN |
| | John M. Corcoran, President (Principal Executive Officer) |
Date: March 19, 2012
| | |
| By (Signature and Title)* | | DAVID L. DILORENZO |
| | David L. DiLorenzo, Treasurer (Principal Financial Officer and Accounting Officer) |
Date: March 19, 2012
| * | Print name and title of each signing officer under his or her signature. |