UNITED STATES
SECURITIES AND EXCHANGE COMMISSION
Washington, D.C. 20549
FORM N-CSR
CERTIFIED SHAREHOLDER REPORT OF
REGISTERED MANAGEMENT INVESTMENT COMPANIES
Investment Company Act file number 811-03090
MFS SERIES TRUST VII
(Exact name of registrant as specified in charter)
111 Huntington Avenue, Boston, Massachusetts 02199
(Address of principal executive offices) (Zip code)
Susan S. Newton
Massachusetts Financial Services Company
111 Huntington Avenue
Boston, Massachusetts 02199
(Name and address of agents for service)
Registrant’s telephone number, including area code: (617) 954-5000
Date of fiscal year end: July 31
Date of reporting period: January 31, 2014
| ITEM 1. | REPORTS TO STOCKHOLDERS. |
SEMIANNUAL REPORT
January 31, 2014

MFS® ASIA PACIFIC
EX-JAPAN FUND

AJX-SEM
MFS® ASIA PACIFIC EX-JAPAN FUND
CONTENTS
The report is prepared for the general information of shareholders. It is authorized for distribution to prospective investors only when preceded or accompanied by a current prospectus.
NOT FDIC INSURED Ÿ MAY LOSE VALUE Ÿ NO BANK GUARANTEE

LETTER FROM THE CHAIRMAN AND CEO
Dear Shareholders:
It’s a new year, and with it a more sober mood has arrived. During 2013, stocks delivered robust gains across many countries, global regions and economic sectors. It’s too early to draw conclusions for all of 2014, but several weak economic reports have weighed on investors’ minds.
Additionally, concerns have risen that China could stumble as it shifts to a consumer-driven economy, and the U.S. Federal Reserve has started to taper its bond-buying stimulus program, thereby reducing global liquidity. These potential headwinds from the world’s two largest economies have helped cause a flight from emerging markets such as Argentina, Russia, India, Turkey and South Africa. Compounding concerns, some of these countries face their own economic and political challenges. The widespread volatility resulting from all this is a reminder of how interconnected the global economy is.
On the brighter side, U.S. economic reports have remained fairly positive and other major developed markets, including Germany,
Japan and the United Kingdom, have continued to release reasonably strong data. Even the economies of some of the eurozone’s weaker links, including Greece, Portugal and Italy, appear to be growing after a prolonged slump.
In uncertain times such as these, it is particularly important to remember that managing risk should always be a top priority. At MFS®, active risk management is an integral part of our collaborative process. Our global team of investment professionals shares ideas and evaluates opportunities that span continents, investment disciplines and asset classes. Our goal is to build better insights, and ultimately better results, for our clients.
We understand and appreciate the economic challenges investors face, and believe in the value of maintaining a long-term view and applying proven principles, such as asset allocation and diversification. We are confident that our unique approach can serve investors well as they work with their financial advisors to identify and pursue the most suitable opportunities.
Respectfully,

Robert J. Manning
Chairman and Chief Executive Officer
MFS Investment Management®
March 18, 2014
The opinions expressed in this letter are subject to change, may not be relied upon for investment advice, and no forecasts can be guaranteed.
1
PORTFOLIO COMPOSITION
Portfolio structure
| | | | |
| Top ten holdings | | | | |
| Sands China Ltd. | | | 3.7% | |
| Rio Tinto PLC | | | 3.6% | |
| Commonwealth Bank of Australia | | | 3.5% | |
| China Unicom (Hong Kong) Ltd. | | | 3.4% | |
| AIA Group Ltd. | | | 3.3% | |
| Taiwan Semiconductor Manufacturing Co. Ltd. | | | 3.0% | |
| Westpac Banking Corp. | | | 2.8% | |
| Cognizant Technology Solutions Corp., “A” | | | 2.8% | |
| DBS Group Holdings Ltd. | | | 2.8% | |
| Hutchison Whampoa Ltd. | | | 2.6% | |
| |
| Equity sectors (a) | | | | |
| Financial Services | | | 35.9% | |
| Technology | | | 11.6% | |
| Basic Materials | | | 11.1% | |
| Utilities & Communications | | | 9.0% | |
| Leisure | | | 6.3% | |
| Energy | | | 5.7% | |
| Special Products & Services | | | 5.5% | |
| Autos & Housing | | | 4.5% | |
| Consumer Staples | | | 3.4% | |
| Retailing | | | 3.3% | |
| Health Care | | | 2.1% | |
| Industrial Goods & Services | | | 0.7% | |
| | | | |
| Issuer country weightings (x) | |
| China | | | 18.4% | |
| Hong Kong | | | 18.0% | |
| Australia | | | 16.7% | |
| India | | | 9.9% | |
| South Korea | | | 9.5% | |
| Taiwan | | | 8.8% | |
| United States | | | 3.8% | |
| United Kingdom | | | 3.6% | |
| Singapore | | | 2.8% | |
| Other Countries | | | 8.5% | |
|
| Currency exposure weightings (y) | |
| Hong Kong Dollar | | | 36.4% | |
| Australian Dollar | | | 16.7% | |
| Indian Rupee | | | 9.9% | |
| South Korean Won | | | 9.5% | |
| Taiwan Dollar | | | 8.8% | |
| United States Dollar | | | 3.8% | |
| British Pound Sterling | | | 3.6% | |
| Singapore Dollar | | | 2.8% | |
| Thailand Baht | | | 2.6% | |
| Other Currencies | | | 5.9% | |
2
Portfolio Composition – continued
| (a) | The sectors depicted are economic aggregates made up of several underlying industry categories. The fund may invest between 25% and 35% of its total assets in any industry that represents 20% or more of the Asia Pacific market excluding Japan as a whole, as measured by an index determined by the adviser to be an appropriate measure of the Asia Pacific market excluding Japan. As of January 31, 2014, the fund did not have more than 25% of its total assets invested in any one industry. |
| (x) | Represents the portfolio’s exposure to issuer countries as a percentage of a portfolio’s net assets. For purposes of this presentation, United States includes Cash & Other. |
| (y) | Represents the portfolio’s exposure to a particular currency as a percentage of a portfolio’s net assets. For purposes of this presentation, United States Dollar includes Cash & Other. |
Percentages are based on net assets as of 1/31/14.
The portfolio is actively managed and current holdings may be different.
3
EXPENSE TABLE
Fund expenses borne by the shareholders during the period, August 1, 2013 through January 31, 2014
As a shareholder of the fund, you incur two types of costs: (1) transaction costs, including sales charges (loads) on certain purchase or redemption payments, and (2) ongoing costs, including management fees; distribution and service (12b-1) fees; and other fund expenses. This example is intended to help you understand your ongoing costs (in dollars) of investing in the fund and to compare these costs with the ongoing costs of investing in other mutual funds.
The example is based on an investment of $1,000 invested at the beginning of the period and held for the entire period August 1, 2013 through January 31, 2014.
Actual Expenses
The first line for each share class in the following table provides information about actual account values and actual expenses. You may use the information in this line, together with the amount you invested, to estimate the expenses that you paid over the period. Simply divide your account value by $1,000 (for example, an $8,600 account value divided by $1,000 = 8.6), then multiply the result by the number in the first line under the heading entitled “Expenses Paid During Period” to estimate the expenses you paid on your account during this period.
Hypothetical Example for Comparison Purposes
The second line for each share class in the following table provides information about hypothetical account values and hypothetical expenses based on the fund’s actual expense ratio and an assumed rate of return of 5% per year before expenses, which is not the fund’s actual return. The hypothetical account values and expenses may not be used to estimate the actual ending account balance or expenses you paid for the period. You may use this information to compare the ongoing costs of investing in the fund and other funds. To do so, compare this 5% hypothetical example with the 5% hypothetical examples that appear in the shareholder reports of the other funds.
Please note that the expenses shown in the table are meant to highlight your ongoing costs only and do not reflect any transactional costs, such as sales charges (loads). Therefore, the second line for each share class in the table is useful in comparing ongoing costs only, and will not help you determine the relative total costs of owning different funds. In addition, if these transactional costs were included, your costs would have been higher.
4
Expense Table – continued
| | | | | | | | | | | | | | | | | | |
Share
Class | | | | Annualized
Expense Ratio | | | Beginning
Account Value
8/01/13 | | | Ending Account Value
1/31/14 | | | Expenses Paid During
Period (p) 8/01/13-1/31/14 | |
| A | | Actual | | | 1.63% | | | | $1,000.00 | | | | $1,024.79 | | | | $8.32 | |
| | Hypothetical (h) | | | 1.63% | | | | $1,000.00 | | | | $1,016.99 | | | | $8.29 | |
| B | | Actual | | | 2.44% | | | | $1,000.00 | | | | $1,019.67 | | | | $12.42 | |
| | Hypothetical (h) | | | 2.44% | | | | $1,000.00 | | | | $1,012.91 | | | | $12.38 | |
| C | | Actual | | | 2.45% | | | | $1,000.00 | | | | $1,020.16 | | | | $12.48 | |
| | Hypothetical (h) | | | 2.45% | | | | $1,000.00 | | | | $1,012.85 | | | | $12.43 | |
| I | | Actual | | | 1.45% | | | | $1,000.00 | | | | $1,024.82 | | | | $7.40 | |
| | Hypothetical (h) | | | 1.45% | | | | $1,000.00 | | | | $1,017.90 | | | | $7.38 | |
| (h) | 5% class return per year before expenses. |
| (p) | Expenses paid are equal to each class’s annualized expense ratio, as shown above, multiplied by the average account value over the period, multiplied by the number of days in the period, divided by the number of days in the year. Expenses paid do not include any applicable sales charges (loads). If these transaction costs had been included, your costs would have been higher. |
Notes to Expense Table
Each class with a Rule 12b-1 service fee is subject to a rebate of a portion of such fee. Such rebates are included in the expense ratios above and are outside of the expense limitation arrangement. For Class A and Class B shares, this rebate reduced the expense ratio above by 0.07% and 0.02%, respectively. See Note 3 in the Notes to Financial Statements for additional information.
5
PORTFOLIO OF INVESTMENTS
1/31/14 (unaudited)
The Portfolio of Investments is a complete list of all securities owned by your fund. It is categorized by broad-based asset classes.
| | | | | | | | |
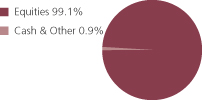
| Common Stocks - 99.1% | | | | | | | | |
| Issuer | | Shares/Par | | | Value ($) | |
| Apparel Manufacturers - 2.5% | | | | | | | | |
| Li & Fung Ltd. | | | 58,000 | | | $ | 79,865 | |
| | |
| Automotive - 4.5% | | | | | | | | |
| Exide Industries Ltd. | | | 16,719 | | | $ | 26,787 | |
| Guangzhou Automobile Group Co. Ltd., “H” | | | 64,000 | | | | 62,774 | |
| Kia Motors Corp. | | | 1,150 | | | | 57,577 | |
| | | | | | | | |
| | | | | | | $ | 147,138 | |
| Brokerage & Asset Managers - 1.6% | | | | | | | | |
| Computershare Ltd. | | | 5,471 | | | $ | 53,296 | |
| | |
| Business Services - 2.8% | | | | | | | | |
| Cognizant Technology Solutions Corp., “A” (a) | | | 952 | | | $ | 92,268 | |
| | |
| Cable TV - 1.1% | | | | | | | | |
| Astro Malaysia Holdings Berhad | | | 25,900 | | | $ | 22,754 | |
| Dish TV India Ltd. (a) | | | 15,665 | | | | 11,928 | |
| | | | | | | | |
| | | | | | | $ | 34,682 | |
| Chemicals - 0.4% | | | | | | | | |
| UPL Ltd. | | | 4,540 | | | $ | 13,591 | |
| | |
| Computer Software - Systems - 3.5% | | | | | | | | |
| Asustek Computer, Inc. | | | 3,660 | | | $ | 33,783 | |
| Hon Hai Precision Industry Co. Ltd. | | | 26,948 | | | | 75,297 | |
| Recall Holdings Ltd. (a) | | | 1,155 | | | | 4,538 | |
| | | | | | | | |
| | | | | | | $ | 113,618 | |
| Conglomerates - 2.6% | | | | | | | | |
| Hutchison Whampoa Ltd. | | | 7,000 | | | $ | 86,017 | |
| | |
| Containers - 1.4% | | | | | | | | |
| Brambles Ltd. | | | 5,775 | | | $ | 45,320 | |
| | |
| Electronics - 6.8% | | | | | | | | |
| Media Tek, Inc. | | | 3,000 | | | $ | 39,612 | |
| Samsung Electronics Co. Ltd. | | | 70 | | | | 82,834 | |
| Taiwan Semiconductor Manufacturing Co. Ltd. | | | 29,000 | | | | 99,448 | |
| | | | | | | | |
| | | | | | | $ | 221,894 | |
6
Portfolio of Investments (unaudited) – continued
| | | | | | | | |
| Issuer | | Shares/Par | | | Value ($) | |
| | | | | | | | |
| Common Stocks - continued | | | | | | | | |
| Energy - Independent - 5.7% | | | | | | | | |
| China Shenhua Energy Co. Ltd. | | | 10,500 | | | $ | 26,817 | |
| CNOOC Ltd. | | | 17,000 | | | | 26,285 | |
| Oil Search Ltd. | | | 8,657 | | | | 60,837 | |
| Reliance Industries Ltd. | | | 5,458 | | | | 72,403 | |
| | | | | | | | |
| | | | | | | $ | 186,342 | |
| Food & Beverages - 2.7% | | | | | | | | |
| China Huishan Dairy Holdings Co. Ltd. (a) | | | 136,000 | | | $ | 45,019 | |
| Shenguan Holdings Group Ltd. | | | 48,000 | | | | 21,107 | |
| Want Want China Holdings Ltd. | | | 16,000 | | | | 21,427 | |
| | | | | | | | |
| | | | | | | $ | 87,553 | |
| Food & Drug Stores - 0.9% | | | | | | | | |
| Wumart Stores, Inc. | | | 22,000 | | | $ | 28,041 | |
| | |
| Gaming & Lodging - 5.2% | | | | | | | | |
| Melco International Development Ltd. | | | 14,000 | | | $ | 50,942 | |
| Sands China Ltd. | | | 15,600 | | | | 120,465 | |
| | | | | | | | |
| | | | | | | $ | 171,407 | |
| Insurance - 7.1% | | | | | | | | |
| AIA Group Ltd. | | | 23,600 | | | $ | 108,837 | |
| Austbrokers Holdings Ltd. | | | 3,180 | | | | 31,420 | |
| China Pacific Insurance (Group) Co. Ltd | | | 9,800 | | | | 35,092 | |
| Samsung Life Insurance Co. Ltd. | | | 240 | | | | 22,988 | |
| Suncorp Group Ltd. | | | 3,037 | | | | 32,372 | |
| | | | | | | | |
| | | | | | | $ | 230,709 | |
| Internet - 1.3% | | | | | | | | |
| Naver Corp. (a) | | | 66 | | | $ | 41,767 | |
| | |
| Machinery & Tools - 0.7% | | | | | | | | |
| T.K. Corp. (a) | | | 1,304 | | | $ | 23,975 | |
| | |
| Major Banks - 10.7% | | | | | | | | |
| Australia & New Zealand Banking Group Ltd. | | | 1,550 | | | $ | 40,702 | |
| BOC Hong Kong Holdings Ltd. | | | 16,000 | | | | 48,341 | |
| Commonwealth Bank of Australia | | | 1,746 | | | | 113,424 | |
| Industrial & Commercial Bank of China Ltd. | | | 90,000 | | | | 55,166 | |
| Westpac Banking Corp. | | | 3,420 | | | | 92,394 | |
| | | | | | | | |
| | | | | | | $ | 350,027 | |
| Medical Equipment - 2.1% | | | | | | | | |
| Fisher & Paykel Healthcare Corp. Ltd. | | | 20,544 | | | $ | 67,278 | |
7
Portfolio of Investments (unaudited) – continued
| | | | | | | | |
| Issuer | | Shares/Par | | | Value ($) | |
| | | | | | | | |
| Common Stocks - continued | | | | | | | | |
| Metals & Mining - 7.5% | | | | | | | | |
| Iluka Resources Ltd. | | | 6,748 | | | $ | 51,612 | |
| MOIL Ltd. | | | 6,292 | | | | 22,098 | |
| Rio Tinto PLC | | | 2,208 | | | | 117,730 | |
| Steel Authority of India Ltd. | | | 53,291 | | | | 54,619 | |
| | | | | | | | |
| | | | | | | $ | 246,059 | |
| Natural Gas - Distribution - 2.0% | | | | | | | | |
| China Resources Gas Group Ltd. | | | 16,000 | | | $ | 49,370 | |
| Hong Kong & China Gas Co. Ltd. | | | 7,350 | | | | 15,032 | |
| | | | | | | | |
| | | | | | | $ | 64,402 | |
| Natural Gas - Pipeline - 0.6% | | | | | | | | |
| APA Group | | | 3,801 | | | $ | 19,904 | |
| | |
| Other Banks & Diversified Financials - 14.1% | | | | | | | | |
| BDO Unibank, Inc. | | | 18,730 | | | $ | 32,649 | |
| China Construction Bank | | | 91,500 | | | | 62,880 | |
| DBS Group Holdings Ltd. | | | 7,000 | | | | 90,385 | |
| E.Sun Financial Holding Co. Ltd. | | | 63,000 | | | | 39,002 | |
| Federal Bank Ltd. | | | 22,926 | | | | 28,475 | |
| Hana Financial Group, Inc. | | | 650 | | | | 24,661 | |
| HDFC Bank Ltd. | | | 4,188 | | | | 41,400 | |
| ICICI Bank Ltd., ADR | | | 869 | | | | 27,956 | |
| Kasikornbank PLC | | | 16,700 | | | | 86,004 | |
| PT Bank Rakyat Indonesia (Persero) Tbk | | | 41,500 | | | | 28,386 | |
| | | | | | | | |
| | | | | | | $ | 461,798 | |
| Real Estate - 2.4% | | | | | | | | |
| China Overseas Land & Investment Ltd. | | | 6,000 | | | $ | 16,068 | |
| Hang Lung Properties Ltd. | | | 16,000 | | | | 43,935 | |
| IGB Trust, REIT | | | 47,900 | | | | 17,319 | |
| | | | | | | | |
| | | | | | | $ | 77,322 | |
| Specialty Chemicals - 1.8% | | | | | | | | |
| LG Chem Ltd. | | | 240 | | | $ | 57,850 | |
| | |
| Telephone Services - 4.1% | | | | | | | | |
| China Unicom (Hong Kong) Ltd. | | | 84,000 | | | $ | 109,565 | |
| PT XL Axiata Tbk | | | 59,000 | | | | 23,436 | |
| | | | | | | | |
| | | | | | | $ | 133,001 | |
| Tobacco - 0.7% | | | | | | | | |
| ITC Ltd. | | | 4,734 | | | $ | 24,419 | |
8
Portfolio of Investments (unaudited) – continued
| | | | | | | | |
| Issuer | | Shares/Par | | | Value ($) | |
| Common Stocks - continued | | | | | | | | |
| Utilities - Electric Power - 2.3% | | | | | | | | |
| Cheung Kong Infrastructure Holdings Ltd. | | | 6,000 | | | $ | 35,279 | |
| China Longyuan Electric Power Group Corp. | | | 34,000 | | | | 40,495 | |
| | | | | | | | |
| | | | | | | $ | 75,774 | |
| Total Common Stocks (Identified Cost, $2,965,855) | | | | | | $ | 3,235,317 | |
| | |
| Money Market Funds - 2.3% | | | | | | | | |
MFS Institutional Money Market Portfolio, 0.09%,
at Cost and Net Asset Value (v) | | | 74,285 | | | $ | 74,285 | |
| Total Investments (Identified Cost, $3,040,140) | | | | | | $ | 3,309,602 | |
| | |
| Other Assets, Less Liabilities - (1.4)% | | | | | | | (43,279 | ) |
| Net Assets - 100.0% | | | | | | $ | 3,266,323 | |
| (a) | Non-income producing security. |
| (v) | Underlying affiliated fund that is available only to investment companies managed by MFS. The rate quoted for the MFS Institutional Money Market Portfolio is the annualized seven-day yield of the fund at period end. |
The following abbreviations are used in this report and are defined:
| ADR | | American Depositary Receipt |
| PLC | | Public Limited Company |
| REIT | | Real Estate Investment Trust |
See Notes to Financial Statements
9
Financial Statements
STATEMENT OF ASSETS AND LIABILITIES
At 1/31/14 (unaudited)
This statement represents your fund’s balance sheet, which details the assets and liabilities comprising the total value of the fund.
| | | | |
| Assets | | | | |
Investments- | | | | |
Non-affiliated issuers, at value (identified cost, $2,965,855) | | | $3,235,317 | |
Underlying affiliated funds, at cost and value | | | 74,285 | |
Total investments, at value (identified cost, $3,040,140) | | | $3,309,602 | |
Receivables for | | | | |
Investments sold | | | 17,548 | |
Fund shares sold | | | 948 | |
Dividends | | | 3,141 | |
Receivable from investment adviser | | | 21,091 | |
Receivable from distributor | | | 56 | |
Other assets | | | 124 | |
Total assets | | | $3,352,510 | |
| Liabilities | | | | |
Payable for fund shares reacquired | | | $12,980 | |
Payable to affiliates | | | | |
Shareholder servicing costs | | | 1,244 | |
Payable for independent Trustees’ compensation | | | 139 | |
Deferred country tax expense payable | | | 6,071 | |
Accrued expenses and other liabilities | | | 65,753 | |
Total liabilities | | | $86,187 | |
Net assets | | | $3,266,323 | |
| Net assets consist of | | | | |
Paid-in capital | | | $3,292,722 | |
Unrealized appreciation (depreciation) on investments and translation of assets and liabilities in foreign currencies (net of $118 deferred country tax) | | | 269,343 | |
Accumulated net realized gain (loss) on investments and foreign currency | | | (297,560 | ) |
Undistributed net investment income | | | 1,818 | |
Net assets | | | $3,266,323 | |
Shares of beneficial interest outstanding | | | 308,639 | |
| | | | | | | | | | | | |
| | | Net assets | | | Shares
outstanding | | | Net asset value
per share (a) | |
Class A | | | $1,785,942 | | | | 168,710 | | | | $10.59 | |
Class B | | | 309,824 | | | | 29,455 | | | | 10.52 | |
Class C | | | 276,047 | | | | 26,245 | | | | 10.52 | |
Class I | | | 894,510 | | | | 84,229 | | | | 10.62 | |
| (a) | Maximum offering price per share was equal to the net asset value per share for all share classes, except for Class A, for which the maximum offering price per share was $11.24 [100 / 94.25 x $10.59]. On sales of $50,000 or more, the maximum offering price of Class A shares is reduced. A contingent deferred sales charge may be imposed on redemptions of Class A, Class B, and Class C shares. Redemption price per share was equal to the net asset value per share for Class I. |
See Notes to Financial Statements
10
Financial Statements
STATEMENT OF OPERATIONS
Six months ended 1/31/14 (unaudited)
This statement describes how much your fund earned in investment income and accrued in expenses. It also describes any gains and/or losses generated by fund operations.
| | | | |
| Net investment income | | | | |
Income | | | | |
Dividends | | | $34,036 | |
Dividends from underlying affiliated funds | | | 41 | |
Foreign taxes withheld | | | (1,421 | ) |
Total investment income | | | $32,656 | |
Expenses | | | | |
Management fee | | | $18,141 | |
Distribution and service fees | | | 5,597 | |
Shareholder servicing costs | | | 2,641 | |
Administrative services fee | | | 8,823 | |
Independent Trustees’ compensation | | | 550 | |
Custodian fee | | | 33,736 | |
Shareholder communications | | | 5,301 | |
Audit and tax fees | | | 31,915 | |
Legal fees | | | 1,654 | |
Registration fees | | | 27,686 | |
Miscellaneous | | | 5,740 | |
Total expenses | | | $141,784 | |
Reduction of expenses by investment adviser and distributor | | | (111,756 | ) |
Net expenses | | | $30,028 | |
Net investment income | | | $2,628 | |
| Realized and unrealized gain (loss) on investments and foreign currency | | | | |
Realized gain (loss) (identified cost basis) | | | | |
Investments (net of $231 country tax) | | | $20,925 | |
Foreign currency | | | (1,147 | ) |
Net realized gain (loss) on investments and foreign currency | | | $19,778 | |
Change in unrealized appreciation (depreciation) | | | | |
Investments (net of $21 increase in deferred country tax) | | | $54,223 | |
Translation of assets and liabilities in foreign currencies | | | 35 | |
Net unrealized gain (loss) on investments and foreign currency translation | | | $54,258 | |
Net realized and unrealized gain (loss) on investments and foreign currency | | | $74,036 | |
Change in net assets from operations | | | $76,664 | |
See Notes to Financial Statements
11
Financial Statements
STATEMENTS OF CHANGES IN NET ASSETS
These statements describe the increases and/or decreases in net assets resulting from operations, any distributions, and any shareholder transactions.
| | | | | | | | |
| | | Six months ended
1/31/14 | | | Year ended
7/31/13 | |
| Change in net assets | | (unaudited) | | | | |
| From operations | | | | | | | | |
Net investment income | | | $2,628 | | | | $34,291 | |
Net realized gain (loss) on investments and foreign currency | | | 19,778 | | | | (115,958 | ) |
Net unrealized gain (loss) on investments and foreign currency translation | | | 54,258 | | | | 173,477 | |
Change in net assets from operations | | | $76,664 | | | | $91,810 | |
| Distributions declared to shareholders | | | | | | | | |
From net investment income | | | $(32,001 | ) | | | $(32,000 | ) |
Change in net assets from fund share transactions | | | $6,801 | | | | $394,500 | |
Total change in net assets | | | $51,464 | | | | $454,310 | |
| Net assets | | | | | | | | |
At beginning of period | | | 3,214,859 | | | | 2,760,549 | |
At end of period (including undistributed net investment income of $1,818 and $31,191, respectively) | | | $3,266,323 | | | | $3,214,859 | |
See Notes to Financial Statements
12
Financial Statements
FINANCIAL HIGHLIGHTS
The financial highlights table is intended to help you understand the fund’s financial performance for the semiannual period and the past 5 fiscal years (or life of a particular share class, if shorter). Certain information reflects financial results for a single fund share. The total returns in the table represent the rate by which an investor would have earned (or lost) on an investment in the fund share class (assuming reinvestment of all distributions) held for the entire period.
| | | | | | | | | | | | | | | | |
| | | Six months
ended
1/31/14 (unaudited) | | | Years
ended 7/31 | | | Period
ended | |
| Class A | | | 2013 | | | 2012 | | | 7/31/11 (c) | |
| | | | | | | | | | | |
Net asset value, beginning of period | | | $10.45 | | | | $9.88 | | | | $11.47 | | | | $10.00 | |
| Income (loss) from investment operations | |
Net investment income (d) | | | $0.01 | | | | $0.14 | | | | $0.13 | | | | $0.10 | |
Net realized and unrealized gain (loss) on
investments and foreign currency | | | 0.24 | | | | 0.55 | | | | (1.52 | ) | | | 1.40 | |
Total from investment operations | | | $0.25 | | | | $0.69 | | | | $(1.39 | ) | | | $1.50 | |
| Less distributions declared to shareholders | |
From net investment income | | | $(0.11 | ) | | | $(0.12 | ) | | | $(0.06 | ) | | | $— | |
From net realized gain on investments | | | — | | | | — | | | | (0.14 | ) | | | (0.03 | ) |
Total distributions declared to shareholders | | | $(0.11 | ) | | | $(0.12 | ) | | | $(0.20 | ) | | | $(0.03 | ) |
Net asset value, end of period (x) | | | $10.59 | | | | $10.45 | | | | $9.88 | | | | $11.47 | |
Total return (%) (r)(s)(t)(x) | | | 2.38 | (n) | | | 6.95 | | | | (11.97 | ) | | | 15.02 | (n) |
Ratios (%) (to average net assets)
and Supplemental data: | |
Expenses before expense reductions (f) | | | 8.13 | (a) | | | 8.07 | | | | 10.84 | | | | 13.12 | (a) |
Expenses after expense reductions (f) | | | 1.63 | (a) | | | 1.66 | | | | 1.70 | | | | 1.70 | (a) |
Net investment income | | | 0.25 | (a)(l) | | | 1.25 | | | | 1.27 | | | | 0.99 | (a) |
Portfolio turnover | | | 25 | (n) | | | 74 | | | | 86 | | | | 76 | (n) |
Net assets at end of period (000 omitted) | | | $1,786 | | | | $1,731 | | | | $1,461 | | | | $787 | |
See Notes to Financial Statements
13
Financial Highlights – continued
| | | | | | | | | | | | | | | | |
| | | Six months
ended
1/31/14 | | | Years
ended 7/31 | | | Period
ended | |
| Class B | | | 2013 | | | 2012 | | | 7/31/11 (c) | |
| | | (unaudited) | | | | | | | | | | |
Net asset value, beginning of period | | | $10.35 | | | | $9.80 | | | | $11.40 | | | | $10.00 | |
| Income (loss) from investment operations | |
Net investment income (loss) (d) | | | $(0.03 | ) | | | $0.03 | | | | $0.06 | | | | $0.02 | |
Net realized and unrealized gain (loss) on
investments and foreign currency | | | 0.24 | | | | 0.56 | | | | (1.51 | ) | | | 1.41 | |
Total from investment operations | | | $0.21 | | | | $0.59 | | | | $(1.45 | ) | | | $1.43 | |
| Less distributions declared to shareholders | |
From net investment income | | | $(0.04 | ) | | | $(0.04 | ) | | | $(0.01 | ) | | | $— | |
From net realized gain on investments | | | — | | | | — | | | | (0.14 | ) | | | (0.03 | ) |
Total distributions declared to shareholders | | | $(0.04 | ) | | | $(0.04 | ) | | | $(0.15 | ) | | | $(0.03 | ) |
Net asset value, end of period (x) | | | $10.52 | | | | $10.35 | | | | $9.80 | | | | $11.40 | |
Total return (%) (r)(s)(t)(x) | | | 1.97 | (n) | | | 5.99 | | | | (12.61 | ) | | | 14.32 | (n) |
Ratios (%) (to average net assets)
and Supplemental data: | |
Expenses before expense reductions (f) | | | 8.88 | (a) | | | 8.97 | | | | 11.64 | | | | 14.27 | (a) |
Expenses after expense reductions (f) | | | 2.44 | (a) | | | 2.44 | | | | 2.45 | | | | 2.45 | (a) |
Net investment income (loss) | | | (0.52 | )(a)(l) | | | 0.27 | | | | 0.61 | | | | 0.18 | (a) |
Portfolio turnover | | | 25 | (n) | | | 74 | | | | 86 | | | | 76 | (n) |
Net assets at end of period (000 omitted) | | | $310 | | | | $338 | | | | $294 | | | | $258 | |
See Notes to Financial Statements
14
Financial Highlights – continued
| | | | | | | | | | | | | | | | |
| | | Six months
ended
1/31/14 | | | Years
ended 7/31 | | | Period
ended | |
| Class C | | | 2013 | | | 2012 | | | 7/31/11 (c) | |
| | | (unaudited) | | | | | | | | | | |
Net asset value, beginning of period | | | $10.34 | | | | $9.81 | | | | $11.40 | | | | $10.00 | |
| Income (loss) from investment operations | |
Net investment income (loss) (d) | | | $(0.03 | ) | | | $0.01 | | | | $0.08 | | | | $0.01 | |
Net realized and unrealized gain (loss) on
investments and foreign currency | | | 0.23 | | | | 0.59 | | | | (1.53 | ) | | | 1.42 | |
Total from investment operations | | | $0.20 | | | | $0.60 | | | | $(1.45 | ) | | | $1.43 | |
| Less distributions declared to shareholders | |
From net investment income | | | $(0.02 | ) | | | $(0.07 | ) | | | $— | | | | $— | |
From net realized gain on investments | | | — | | | | — | | | | (0.14 | ) | | | (0.03 | ) |
Total distributions declared to shareholders | | | $(0.02 | ) | | | $(0.07 | ) | | | $(0.14 | ) | | | $(0.03 | ) |
Net asset value, end of period (x) | | | $10.52 | | | | $10.34 | | | | $9.81 | | | | $11.40 | |
Total return (%) (r)(s)(t)(x) | | | 1.92 | (n) | | | 6.10 | | | | (12.63 | ) | | | 14.32 | (n) |
Ratios (%) (to average net assets)
and Supplemental data: | |
Expenses before expense reductions (f) | | | 8.88 | (a) | | | 9.03 | | | | 11.69 | | | | 14.87 | (a) |
Expenses after expense reductions (f) | | | 2.45 | (a) | | | 2.45 | | | | 2.45 | | | | 2.45 | (a) |
Net investment income (loss) | | | (0.56 | )(a)(l) | | | 0.12 | | | | 0.76 | | | | 0.05 | (a) |
Portfolio turnover | | | 25 | (n) | | | 74 | | | | 86 | | | | 76 | (n) |
Net assets at end of period (000 omitted) | | | $276 | | | | $286 | | | | $292 | | | | $197 | |
See Notes to Financial Statements
15
Financial Highlights – continued
| | | | | | | | | | | | | | | | |
| | | Six months
ended
1/31/14 | | | Years
ended 7/31 | | | Period
ended | |
| Class I | | | 2013 | | | 2012 | | | 7/31/11 (c) | |
| | | (unaudited) | | | | | | | | | | |
Net asset value, beginning of period | | | $10.49 | | | | $9.93 | | | | $11.50 | | | | $10.00 | |
| Income (loss) from investment operations | |
Net investment income (d) | | | $0.02 | | | | $0.13 | | | | $0.16 | | | | $0.08 | |
Net realized and unrealized gain (loss) on
investments and foreign currency | | | 0.25 | | | | 0.57 | | | | (1.52 | ) | | | 1.45 | |
Total from investment operations | | | $0.27 | | | | $0.70 | | | | $(1.36 | ) | | | $1.53 | |
| Less distributions declared to shareholders | |
From net investment income | | | $(0.14 | ) | | | $(0.14 | ) | | | $(0.07 | ) | | | $— | |
From net realized gain on investments | | | — | | | | — | | | | (0.14 | ) | | | (0.03 | ) |
Total distributions declared to shareholders | | | $(0.14 | ) | | | $(0.14 | ) | | | $(0.21 | ) | | | $(0.03 | ) |
Net asset value, end of period (x) | | | $10.62 | | | | $10.49 | | | | $9.93 | | | | $11.50 | |
Total return (%) (r)(s)(x) | | | 2.48 | (n) | | | 7.00 | | | | (11.67 | ) | | | 15.32 | (n) |
Ratios (%) (to average net assets)
and Supplemental data: | |
Expenses before expense reductions (f) | | | 7.89 | (a) | | | 7.99 | | | | 10.75 | | | | 15.22 | (a) |
Expenses after expense reductions (f) | | | 1.45 | (a) | | | 1.45 | | | | 1.45 | | | | 1.45 | (a) |
Net investment income | | | 0.44 | (a)(l) | | | 1.22 | | | | 1.55 | | | | 0.83 | (a) |
Portfolio turnover | | | 25 | (n) | | | 74 | | | | 86 | | | | 76 | (n) |
Net assets at end of period (000 omitted) | | | $895 | | | | $860 | | | | $713 | | | | $810 | |
| (c) | For the period from the commencement of the fund’s investment operations, September 15, 2010, through the stated period end. |
| (d) | Per share data is based on average shares outstanding. |
| (f) | Ratios do not reflect reductions from fees paid indirectly, if applicable. |
| (l) | Recognition of net investment income by the fund may be affected by the timing of the declaration of dividends by companies in which the fund invests and the actual annual net investment income ratio may differ. |
| (r) | Certain expenses have been reduced without which performance would have been lower. |
| (s) | From time to time the fund may receive proceeds from litigation settlements, without which performance would be lower. |
| (t) | Total returns do not include any applicable sales charges. |
| (x) | The net asset values per share and total returns have been calculated on net assets which include adjustments made in accordance with U.S. generally accepted accounting principles required at period end for financial reporting purposes. |
See Notes to Financial Statements
16
NOTES TO FINANCIAL STATEMENTS
(unaudited)
(1) Business and Organization
MFS Asia Pacific ex-Japan Fund (the fund) is a series of MFS Series Trust VII (the trust). The trust is organized as a Massachusetts business trust and is registered under the Investment Company Act of 1940, as amended, as an open-end management investment company.
(2) Significant Accounting Policies
General – The preparation of financial statements in conformity with U.S. generally accepted accounting principles requires management to make estimates and assumptions that affect the reported amounts of assets and liabilities, and disclosure of contingent assets and liabilities at the date of the financial statements and the reported amounts of increases and decreases in net assets from operations during the reporting period. Actual results could differ from those estimates. In the preparation of these financial statements, management has evaluated subsequent events occurring after the date of the fund’s Statement of Assets and Liabilities through the date that the financial statements were issued. The fund invests in foreign securities, including securities of emerging market issuers. Investments in foreign securities are vulnerable to the effects of changes in the relative values of the local currency and the U.S. dollar and to the effects of changes in each country’s legal, political, and economic environment. The markets of emerging markets countries are generally more volatile than the markets of developed countries with more mature economies. All of the risks of investing in foreign securities previously described are heightened when investing in emerging markets countries. The fund’s performance could be closely tied to the market, currency, economic, political, regulatory, geopolitical, or other conditions in the countries or regions in which the fund invests and could be more volatile than the performance of more geographically-diversified funds.
The fund may invest between 25% and 35% of its total assets in the securities of issuers in any particular industry if, at the time of investment, that industry represents 20% or more of the Asia Pacific market excluding Japan as a whole, as measured by an index determined by MFS to be an appropriate measure of the Asia Pacific market excluding Japan. At January 31, 2014, the fund did not have more than 25% of its assets invested in any one industry.
In this reporting period, the fund adopted the disclosure provisions of the Financial Accounting Standards Board (FASB) Accounting Standards Update 2011-11 (“ASU 2011-11”), Balance Sheet (Topic 210) – Disclosures about Offsetting Assets and Liabilities along with the related scope clarification provisions of FASB Accounting Standards Update 2013-01 (“ASU 2013-01”) entitled Balance Sheet (Topic 210) – Clarifying the Scope of Disclosures about Offsetting Assets and Liabilities. ASU 2011-11 is intended to enhance disclosures on the offsetting of financial assets and liabilities by requiring entities to disclose both gross and net information about financial instruments and transactions that are either offset in the statement of financial position or subject to a an enforceable Master Netting Agreement or similar arrangement. ASU 2013-01 limits the scope of ASU 2011-11’s disclosure requirements on offsetting to financial assets and financial liabilities related to derivatives, repurchase and reverse repurchase agreements, and securities lending and securities borrowing transactions.
17
Notes to Financial Statements (unaudited) – continued
The disclosures required by ASU 2011-11, to the extent applicable to the fund, have been included in the fund’s Significant Accounting Policies note under the captions for each of the fund’s in-scope financial instruments and transactions.
In June 2013, FASB issued Accounting Standards Update 2013-08 (“ASU 2013-08”) Financial Services – Investment Companies (Topic 946) – Amendments to the Scope, Measurement, and Disclosure Requirements which is effective for interim and annual reporting periods in fiscal years that begin after December 15, 2013. ASU 2013-08 sets forth a methodology for determining whether an entity should be characterized as an investment company and prescribes fair value accounting for an investment company’s non-controlling ownership interest in another investment company. FASB has determined that a fund registered under the Investment Company Act of 1940 automatically meets ASU 2013-08’s criteria for an investment company. Although still evaluating the potential impacts of ASU 2013-08 to the fund, management expects that the impact of the fund’s adoption will be limited to additional financial statement disclosures.
Investment Valuations – Equity securities, including restricted equity securities, are generally valued at the last sale or official closing price as provided by a third-party pricing service on the market or exchange on which they are primarily traded. Equity securities, for which there were no sales reported that day, are generally valued at the last quoted daily bid quotation as provided by a third-party pricing service on the market or exchange on which such securities are primarily traded. Short-term instruments with a maturity at issuance of 60 days or less generally are valued at amortized cost, which approximates market value. Open-end investment companies are generally valued at net asset value per share. Securities and other assets generally valued on the basis of information from a third-party pricing service may also be valued at a broker/dealer bid quotation. Values obtained from third-party pricing services can utilize both transaction data and market information such as yield, quality, coupon rate, maturity, type of issue, trading characteristics, and other market data. The values of foreign securities and other assets and liabilities expressed in foreign currencies are converted to U.S. dollars using the mean of bid and asked prices for rates provided by a third-party pricing service.
The Board of Trustees has delegated primary responsibility for determining or causing to be determined the value of the fund’s investments (including any fair valuation) to the adviser pursuant to valuation policies and procedures approved by the Board. If the adviser determines that reliable market quotations are not readily available, investments are valued at fair value as determined in good faith by the adviser in accordance with such procedures under the oversight of the Board of Trustees. Under the fund’s valuation policies and procedures, market quotations are not considered to be readily available for most types of debt instruments and floating rate loans and many types of derivatives. These investments are generally valued at fair value based on information from third-party pricing services. In addition, investments may be valued at fair value if the adviser determines that an investment’s value has been materially affected by events occurring after the close of the exchange or market on which the investment is principally traded (such as foreign exchange or market) and prior to the determination of the fund’s net asset value, or after the halting of trading of a specific security where trading does not resume prior to the close of the exchange or market on which the
18
Notes to Financial Statements (unaudited) – continued
security is principally traded. Events that occur on a frequent basis after foreign markets close (such as developments in foreign markets and significant movements in the U.S. markets) and prior to the determination of the fund’s net asset value may be deemed to have a material effect on the value of securities traded in foreign markets. Accordingly, the fund’s foreign equity securities may often be valued at fair value. The adviser generally relies on third-party pricing services or other information (such as the correlation with price movements of similar securities in the same or other markets; the type, cost and investment characteristics of the security; the business and financial condition of the issuer; and trading and other market data) to assist in determining whether to fair value and at what value to fair value an investment. The value of an investment for purposes of calculating the fund’s net asset value can differ depending on the source and method used to determine value. When fair valuation is used, the value of an investment used to determine the fund’s net asset value may differ from quoted or published prices for the same investment. There can be no assurance that the fund could obtain the fair value assigned to an investment if it were to sell the investment at the same time at which the fund determines its net asset value per share.
Various inputs are used in determining the value of the fund’s assets or liabilities. These inputs are categorized into three broad levels. In certain cases, the inputs used to measure fair value may fall into different levels of the fair value hierarchy. In such cases, an investment’s level within the fair value hierarchy is based on the lowest level of input that is significant to the fair value measurement. The fund’s assessment of the significance of a particular input to the fair value measurement in its entirety requires judgment, and considers factors specific to the investment. Level 1 includes unadjusted quoted prices in active markets for identical assets or liabilities. Level 2 includes other significant observable market-based inputs (including quoted prices for similar securities, interest rates, prepayment speed, and credit risk). Level 3 includes unobservable inputs, which may include the adviser’s own assumptions in determining the fair value of investments. The following is a summary of the levels used as of January 31, 2014 in valuing the fund’s assets or liabilities:
| | | | | | | | | | | | | | | | |
| Investments at Value | | Level 1 | | | Level 2 | | | Level 3 | | | Total | |
| Equity Securities: | | | | | | | | | | | | | | | | |
China | | | $45,019 | | | | $555,086 | | | | $— | | | | $600,105 | |
Hong Kong | | | 86,221 | | | | 502,492 | | | | — | | | | 588,713 | |
Australia | | | 334,986 | | | | 210,834 | | | | — | | | | 545,820 | |
India | | | 122,457 | | | | 201,219 | | | | — | | | | 323,676 | |
South Korea | | | — | | | | 311,652 | | | | — | | | | 311,652 | |
Taiwan | | | — | | | | 287,142 | | | | — | | | | 287,142 | |
United Kingdom | | | 117,730 | | | | — | | | | — | | | | 117,730 | |
United States | | | 92,268 | | | | — | | | | — | | | | 92,268 | |
Singapore | | | — | | | | 90,385 | | | | — | | | | 90,385 | |
Other Countries | | | 249,441 | | | | 28,385 | | | | — | | | | 277,826 | |
| Mutual Funds | | | 74,285 | | | | — | | | | — | | | | 74,285 | |
| Total Investments | | | $1,122,407 | | | | $2,187,195 | | | | $— | | | | $3,309,602 | |
For further information regarding security characteristics, see the Portfolio of Investments.
19
Notes to Financial Statements (unaudited) – continued
Of the level 2 investments presented above, equity investments amounting to $2,010,332 would have been considered level 1 investments at the beginning of the period. The primary reason for changes in the classifications between levels 1 and 2 occurs when foreign equity securities are fair valued using other observable market-based inputs in place of the closing exchange price due to events occurring after the close of the exchange or market on which the investment is principally traded. The fund’s foreign equity securities may often be valued at fair value.
The following is a reconciliation of level 3 assets for which significant unobservable inputs were used to determine fair value. The fund’s policy is to recognize transfers between the levels as of the end of the period. The table presents the activity of level 3 securities held at the beginning and the end of the period.
| | | | |
| | | Equity Securities | |
| Balance as of 7/31/13 | | | $22,656 | |
Change in unrealized appreciation | | | 19,111 | |
Transfers out of level 3 | | | (41,767 | ) |
| Balance as of 1/31/14 | | | $— | |
Foreign Currency Translation – Purchases and sales of foreign investments, income, and expenses are converted into U.S. dollars based upon currency exchange rates prevailing on the respective dates of such transactions or on the reporting date for foreign denominated receivables and payables. Gains and losses attributable to foreign currency exchange rates on sales of securities are recorded for financial statement purposes as net realized gains and losses on investments. Gains and losses attributable to foreign exchange rate movements on receivables, payables, income and expenses are recorded for financial statement purposes as foreign currency transaction gains and losses. That portion of both realized and unrealized gains and losses on investments that results from fluctuations in foreign currency exchange rates is not separately disclosed.
Indemnifications – Under the fund’s organizational documents, its officers and Trustees may be indemnified against certain liabilities and expenses arising out of the performance of their duties to the fund. Additionally, in the normal course of business, the fund enters into agreements with service providers that may contain indemnification clauses. The fund’s maximum exposure under these agreements is unknown as this would involve future claims that may be made against the fund that have not yet occurred.
Investment Transactions and Income – Investment transactions are recorded on the trade date. Dividends received in cash are recorded on the ex-dividend date. Certain dividends from foreign securities will be recorded when the fund is informed of the dividend if such information is obtained subsequent to the ex-dividend date. Dividend payments received in additional securities are recorded on the ex-dividend date in an amount equal to the value of the security on such date.
The fund may receive proceeds from litigation settlements. Any proceeds received from litigation involving portfolio holdings are reflected in the Statement of Operations in realized gain/loss if the security has been disposed of by the fund or in unrealized gain/loss if the security is still held by the fund. Any other proceeds from litigation not related to portfolio holdings are reflected as other income in the Statement of Operations.
20
Notes to Financial Statements (unaudited) – continued
Fees Paid Indirectly – The fund’s custody fee may be reduced according to an arrangement that measures the value of cash deposited with the custodian by the fund. For the six months ended January 31, 2014, custody fees were not reduced.
Tax Matters and Distributions – The fund intends to qualify as a regulated investment company, as defined under Subchapter M of the Internal Revenue Code, and to distribute all of its taxable income, including realized capital gains. As a result, no provision for federal income tax is required. The fund’s federal tax returns, when filed, will remain subject to examination by the Internal Revenue Service for a three year period. Management has analyzed the fund’s tax positions taken on federal and state tax returns for all open tax years and does not believe that there are any uncertain tax positions that require recognition of a tax liability. Foreign taxes, if any, have been accrued by the fund in the accompanying financial statements in accordance with the applicable foreign tax law. Foreign income taxes may be withheld by certain countries in which the fund invests. Additionally, capital gains realized by the fund on securities issued in or by certain foreign countries may be subject to capital gains tax imposed by those countries.
Distributions to shareholders are recorded on the ex-dividend date. Income and capital gain distributions are determined in accordance with income tax regulations, which may differ from U.S. generally accepted accounting principles. Certain capital accounts in the financial statements are periodically adjusted for permanent differences in order to reflect their tax character. These adjustments have no impact on net assets or net asset value per share. Temporary differences which arise from recognizing certain items of income, expense, gain or loss in different periods for financial statement and tax purposes will reverse at some time in the future. Distributions in excess of net investment income or net realized gains are temporary overdistributions for financial statement purposes resulting from differences in the recognition or classification of income or distributions for financial statement and tax purposes.
Book/tax differences primarily relate to wash sale loss deferrals.
The tax character of distributions made during the current period will be determined at fiscal year end. The tax character of distributions declared to shareholders for the last fiscal year is as follows:
| | | | |
| | | 7/31/13 | |
Ordinary income (including any
short-term capital gains) | | | $32,000 | |
21
Notes to Financial Statements (unaudited) – continued
The federal tax cost and the tax basis components of distributable earnings were as follows:
| | | | |
| As of 1/31/14 | | | |
| Cost of investments | | | $3,168,199 | |
| Gross appreciation | | | 325,915 | |
| Gross depreciation | | | (184,512 | ) |
| Net unrealized appreciation (depreciation) | | | $141,403 | |
| |
| As of 7/31/13 | | | |
| Undistributed ordinary income | | | 31,433 | |
| Capital loss carryforwards | | | (77,167 | ) |
| Post-October capital loss deferral | | | (112,112 | ) |
| Other temporary differences | | | (375 | ) |
| Net unrealized appreciation (depreciation) | | | 87,159 | |
The aggregate cost above includes prior fiscal year end tax adjustments, if applicable.
As of July 31, 2013, the fund had capital loss carryforwards available to offset future realized gains. Such losses are characterized as follows:
| | | | |
| Short-Term | | | $(68,231 | ) |
| Long-Term | | | (8,936 | ) |
| Total | | | $(77,167 | ) |
Under the Regulated Investment Company Modernization Act of 2010 (the “Act”), the above net capital losses may be carried forward indefinitely, and their character is retained as short-term and/or long-term losses. Previously, net capital losses were carried forward for eight years and treated as short-term losses.
Multiple Classes of Shares of Beneficial Interest – The fund offers multiple classes of shares, which differ in their respective distribution and service fees. The fund’s income, realized and unrealized gain (loss), and common expenses are allocated to shareholders based on the daily net assets of each class. Dividends are declared separately for each class. Differences in per share dividend rates are generally due to differences in separate class expenses. Class B shares will convert to Class A shares approximately eight years after purchase. The fund’s distributions declared to shareholders as reported in the Statements of Changes in Net Assets are presented by class as follows:
| | | | | | | | |
| | | From net investment
income | |
| | | Six months
ended
1/31/14 | | | Year
ended
7/31/13 | |
| Class A | | | $19,040 | | | | $18,636 | |
| Class B | | | 1,098 | | | | 1,013 | |
| Class C | | | 518 | | | | 2,147 | |
| Class I | | | 11,345 | | | | 10,204 | |
| Total | | | $32,001 | | | | $32,000 | |
22
Notes to Financial Statements (unaudited) – continued
(3) Transactions with Affiliates
Investment Adviser – The fund has an investment advisory agreement with MFS to provide overall investment management and related administrative services and facilities to the fund. The management fee is computed daily and paid monthly at the following annual rates:
| | | | |
| First $1 billion of average daily net assets | | | 1.05 | % |
| Next $1.5 billion of average daily net assets | | | 0.95 | % |
| Average daily net assets in excess of $2.5 billion | | | 0.90 | % |
MFS has agreed in writing to reduce its management fee by a specified amount if certain MFS mutual fund assets exceed thresholds agreed to by MFS and the fund’s Board of Trustees. For the six months ended January 31, 2014, this management fee reduction amounted to $34, which is included in the reduction of total expenses in the Statement of Operations. The management fee incurred for the six months ended January 31, 2014 was equivalent to an annual effective rate of 1.05% of the fund’s average daily net assets.
The investment adviser has agreed in writing to pay a portion of the fund’s total annual operating expenses, exclusive of interest, taxes, extraordinary expenses, brokerage and transaction costs, and investment-related expenses, such that total fund operating expenses do not exceed the following rates annually of each class’s average daily net assets:
| | | | | | | | | | | | | | |
| Class A | | | Class B | | | Class C | | | Class I | |
| | 1.70% | | | | 2.45 | % | | | 2.45 | % | | | 1.45 | % |
This written agreement will continue until modified by the fund’s Board of Trustees, but such agreement will continue at least until November 30, 2014. For the six months ended January 31, 2014, this reduction amounted to $111,050 and is included in the reduction of total expenses in the Statement of Operations.
Distributor – MFS Fund Distributors, Inc. (MFD), a wholly-owned subsidiary of MFS, as distributor, received $1,760 for the six months ended January 31, 2014, as its portion of the initial sales charge on sales of Class A shares of the fund.
The Board of Trustees has adopted a distribution plan for certain class shares pursuant to Rule 12b-1 of the Investment Company Act of 1940.
The fund’s distribution plan provides that the fund will pay MFD for services provided by MFD and financial intermediaries in connection with the distribution and servicing of certain share classes. One component of the plan is a distribution fee paid to MFD and another component of the plan is a service fee paid to MFD. MFD may subsequently pay all, or a portion, of the distribution and/or service fees to financial intermediaries.
Distribution Plan Fee Table:
| | | | | | | | | | | | | | | | | | | | |
| | | Distribution
Fee Rate (d) | | | Service
Fee Rate (d) | | | Total
Distribution
Plan (d) | | | Annual
Effective
Rate (e) | | | Distribution
and Service
Fee | |
| Class A | | | — | | | | 0.25% | | | | 0.25% | | | | 0.18% | | | | $2,336 | |
| Class B | | | 0.75% | | | | 0.25% | | | | 1.00% | | | | 0.98% | | | | 1,737 | |
| Class C | | | 0.75% | | | | 0.25% | | | | 1.00% | | | | 1.00% | | | | 1,524 | |
| Total Distribution and Service Fees | | | | $5,597 | |
23
Notes to Financial Statements (unaudited) – continued
| (d) | In accordance with the distribution plan for certain classes, the fund pays distribution and/or service fees equal to these annual percentage rates of each class’s average daily net assets. The distribution and service fee rates disclosed by class represent the current rates in effect at the end of the reporting period. Any rate changes, if applicable, are detailed below. |
| (e) | The annual effective rates represent actual fees incurred under the distribution plan for the six months ended January 31, 2014 based on each class’s average daily net assets. MFD has voluntarily agreed to rebate a portion of each class’s 0.25% service fee attributable to accounts for which MFD retains the 0.25% service fee except for accounts attributable to MFS or its affiliates’ seed money. For the six months ended January 31, 2014, this rebate amounted to $640, and $30 for Class A, and Class B, respectively, and is included in the reduction of total expenses in the Statement of Operations. |
Certain Class A shares are subject to a contingent deferred sales charge (CDSC) in the event of a shareholder redemption within 18 months of purchase for shares purchased on or after August 1, 2012, and within 24 months of purchase for shares purchased prior to August 1, 2012. Class C shares are subject to a CDSC in the event of a shareholder redemption within 12 months of purchase. Class B shares are subject to a CDSC in the event of a shareholder redemption within six years of purchase. All contingent deferred sales charges are paid to MFD and during the six months ended January 31, 2014, were as follows:
| | | | |
| | | Amount | |
| Class A | | | $— | |
| Class B | | | 220 | |
| Class C | | | 6 | |
Shareholder Servicing Agent – MFS Service Center, Inc. (MFSC), a wholly-owned subsidiary of MFS, receives a fee from the fund for its services as shareholder servicing agent calculated as a percentage of the average daily net assets of the fund as determined periodically under the supervision of the fund’s Board of Trustees. For the six months ended January 31, 2014, the fee was $777, which equated to 0.0450% annually of the fund’s average daily net assets. MFSC also receives payment from the fund for out-of-pocket expenses, sub-accounting and other shareholder servicing costs which may be paid to affiliated and unaffiliated service providers. For the six months ended January 31, 2014, these out-of-pocket expenses, sub-accounting and other shareholder servicing costs amounted to $1,864.
Administrator – MFS provides certain financial, legal, shareholder communications, compliance, and other administrative services to the fund. Under an administrative services agreement, the fund partially reimburses MFS the costs incurred to provide these services. The fund is charged an annual fixed amount of $17,500 plus a fee based on average daily net assets. The administrative services fee incurred for the six months ended January 31, 2014 was equivalent to an annual effective rate of 0.5106% of the fund’s average daily net assets.
Trustees’ and Officers’ Compensation – The fund pays compensation to independent Trustees in the form of a retainer, attendance fees, and additional compensation to Board and Committee chairpersons. The fund does not pay compensation directly to Trustees or officers of the fund who are also officers of the investment adviser, all of whom receive remuneration for their services to the fund from MFS. Certain officers and Trustees of the fund are officers or directors of MFS, MFD, and MFSC.
24
Notes to Financial Statements (unaudited) – continued
Other – This fund and certain other funds managed by MFS (the funds) have entered into services agreements (the Agreements) which provide for payment of fees by the funds to Tarantino LLC and Griffin Compliance LLC in return for the provision of services of an Independent Chief Compliance Officer (ICCO) and Assistant ICCO, respectively, for the funds. The ICCO and Assistant ICCO are officers of the funds and the sole members of Tarantino LLC and Griffin Compliance LLC, respectively. The funds can terminate the Agreements with Tarantino LLC and Griffin Compliance LLC at any time under the terms of the Agreements. For the six months ended January 31, 2014, the aggregate fees paid by the fund to Tarantino LLC and Griffin Compliance LLC were $8 and are included in “Miscellaneous” expense in the Statement of Operations. MFS has agreed to reimburse the fund for a portion of the payments made by the fund in the amount of $2, which is included in the reduction of total expenses in the Statement of Operations. Additionally, MFS has agreed to bear all expenses associated with office space, other administrative support, and supplies provided to the ICCO and Assistant ICCO.
The fund invests in the MFS Institutional Money Market Portfolio which is managed by MFS and seeks current income consistent with preservation of capital and liquidity. Income earned on this investment is included in “Dividends from underlying affiliated funds” in the Statement of Operations. This money market fund does not pay a management fee to MFS.
On September 11, 2013, MFS redeemed 10,360 shares of Class A for an aggregate amount of $103,561.
At January 31, 2014, MFS held 87% of the outstanding shares of Class I.
(4) Portfolio Securities
Purchases and sales of investments, other than short-term obligations, aggregated $836,072 and $817,315, respectively.
(5) Shares of Beneficial Interest
The fund’s Declaration of Trust permits the Trustees to issue an unlimited number of full and fractional shares of beneficial interest. Transactions in fund shares were as follows:
| | | | | | | | | | | | | | | | |
| | | Six months ended
1/31/14 | | | Year ended
7/31/13 | |
| | | Shares | | | Amount | | | Shares | | | Amount | |
| Shares sold | | | | | | | | | | | | | | | | |
Class A | | | 44,061 | | | | $487,514 | | | | 175,493 | | | | $1,941,750 | |
Class B | | | 267 | | | | 2,928 | | | | 10,141 | | | | 112,740 | |
Class C | | | 2,004 | | | | 22,050 | | | | 11,479 | | | | 125,643 | |
Class I | | | 1,452 | | | | 15,314 | | | | 9,265 | | | | 104,328 | |
| | | 47,784 | | | | $527,806 | | | | 206,378 | | | | $2,284,461 | |
25
Notes to Financial Statements (unaudited) – continued
| | | | | | | | | | | | | | | | |
| | | Six months ended
1/31/14 | | | Year ended
7/31/13 | |
| | | Shares | | | Amount | | | Shares | | | Amount | |
Shares issued to shareholders in
reinvestment of distributions | | | | | | | | | | | | | | | | |
Class A | | | 1,722 | | | | $19,040 | | | | 1,694 | | | | $18,608 | |
Class B | | | 98 | | | | 1,081 | | | | 91 | | | | 993 | |
Class C | | | 47 | | | | 518 | | | | 197 | | | | 2,147 | |
Class I | | | 1,023 | | | | 11,345 | | | | 926 | | | | 10,204 | |
| | | 2,890 | | | | $31,984 | | | | 2,908 | | | | $31,952 | |
| | | | |
| Shares reacquired | | | | | | | | | | | | | | | | |
Class A | | | (42,769 | ) | | | $(473,422 | ) | | | (159,368 | ) | | | $(1,692,781 | ) |
Class B | | | (3,565 | ) | | | (38,675 | ) | | | (7,596 | ) | | | (79,006 | ) |
Class C | | | (3,433 | ) | | | (38,251 | ) | | | (13,832 | ) | | | (150,126 | ) |
Class I | | | (241 | ) | | | (2,641 | ) | | | — | | | | — | |
| | | (50,008 | ) | | | $(552,989 | ) | | | (180,796 | ) | | | $(1,921,913 | ) |
| | | | |
| Net change | | | | | | | | | | | | | | | | |
Class A | | | 3,014 | | | | $33,132 | | | | 17,819 | | | | $267,577 | |
Class B | | | (3,200 | ) | | | (34,666 | ) | | | 2,636 | | | | 34,727 | |
Class C | | | (1,382 | ) | | | (15,683 | ) | | | (2,156 | ) | | | (22,336 | ) |
Class I | | | 2,234 | | | | 24,018 | | | | 10,191 | | | | 114,532 | |
| | | 666 | | | | $6,801 | | | | 28,490 | | | | $394,500 | |
(6) Line of Credit
The fund and certain other funds managed by MFS participate in a $1.1 billion unsecured committed line of credit, subject to a $1 billion sublimit, provided by a syndication of banks under a credit agreement. Borrowings may be made for temporary financing needs. Interest is charged to each fund, based on its borrowings, generally at a rate equal to the higher of the Federal Reserve funds rate or one month LIBOR plus an agreed upon spread. A commitment fee, based on the average daily, unused portion of the committed line of credit, is allocated among the participating funds at the end of each calendar quarter. In addition, the fund and other funds managed by MFS have established unsecured uncommitted borrowing arrangements with certain banks for temporary financing needs. Interest is charged to each fund, based on its borrowings, at a rate equal to the Federal Reserve funds rate plus an agreed upon spread. For the six months ended January 31, 2014, the fund’s commitment fee and interest expense were $9 and $0, respectively, and are included in “Miscellaneous” expense in the Statement of Operations.
26
Notes to Financial Statements (unaudited) – continued
(7) Transactions in Underlying Affiliated Funds-Affiliated Issuers
An affiliated issuer may be considered one in which the fund owns 5% or more of the outstanding voting securities, or a company which is under common control. For the purposes of this report, the fund assumes the following to be an affiliated issuer:
| | | | | | | | | | | | | | | | |
| Underlying Affiliated Fund | | Beginning
Shares/Par
Amount | | | Acquisitions
Shares/Par
Amount | | | Dispositions
Shares/Par
Amount | | | Ending
Shares/Par
Amount | |
| MFS Institutional Money Market Portfolio | | | 121,523 | | | | 707,570 | | | | (754,808 | ) | | | 74,285 | |
| | | | |
| Underlying Affiliated Fund | | Realized
Gain (Loss) | | | Capital Gain
Distributions | | | Dividend
Income | | | Ending
Value | |
| MFS Institutional Money Market Portfolio | | | $— | | | | $— | | | | $41 | | | | $74,285 | |
27
BOARD REVIEW OF INVESTMENT ADVISORY AGREEMENT
A discussion regarding the Board’s most recent review and renewal of the fund’s Investment Advisory Agreement with MFS is available by clicking on the fund’s name under “Mutual Funds” in the “Products” section of the MFS Web site (mfs.com).
PROXY VOTING POLICIES AND INFORMATION
A general description of the MFS funds’ proxy voting policies and procedures is available without charge, upon request, by calling 1-800-225-2606, by visiting the Proxy Voting section of mfs.com or by visiting the SEC’s Web site at http://www.sec.gov.
Information regarding how the fund voted proxies relating to portfolio securities during the most recent twelve-month period ended June 30 is available without charge by visiting the Proxy Voting section of mfs.com or by visiting the SEC’s Web site at http://www.sec.gov.
QUARTERLY PORTFOLIO DISCLOSURE
The fund will file a complete schedule of portfolio holdings with the Securities and Exchange Commission (the Commission) for the first and third quarters of each fiscal year on Form N-Q. A shareholder can obtain the quarterly portfolio holdings report at mfs.com. The fund’s Form N-Q is also available on the EDGAR database on the Commission’s Internet Web site at http://www.sec.gov, and may be reviewed and copied at the:
Public Reference Room
Securities and Exchange Commission
100 F Street, NE, Room 1580
Washington, D.C. 20549
Information on the operation of the Public Reference Room may be obtained by calling the Commission at 1-800-SEC-0330. Copies of the fund’s Form N-Q also may be obtained, upon payment of a duplicating fee, by electronic request at the following e-mail address: publicinfo@sec.gov, or by writing the Public Reference Section at the above address.
FURTHER INFORMATION
From time to time, MFS may post important information about the fund or the MFS funds on the MFS web site (mfs.com). This information is available by visiting the “Commentary & Announcements” and “Market Outlooks” sections of mfs.com or by clicking on the fund’s name under “Mutual Funds” in the “Products” section of mfs.com.
PROVISION OF FINANCIAL REPORTS AND SUMMARY PROSPECTUSES
The fund produces financial reports every six months and updates its summary prospectus and prospectus annually. To avoid sending duplicate copies of materials to households, only one copy of the fund’s annual and semiannual report and summary prospectus may be mailed to shareholders having the same last name and residential address on the fund’s records. However, any shareholder may contact MFSC (please see back cover for address and telephone number) to request that copies of these reports and summary prospectuses be sent personally to that shareholder.
28
Save paper with eDelivery.

| MFS® will send you prospectuses, |
reports, and proxies directly via e-mail so you will get information faster with less mailbox clutter.
To sign up:
1. Go to mfs.com.
2. Log in via MFS® Access.
3. Select eDelivery.
If you own your MFS fund shares through a financial institution or a retirement plan, MFS® TALK, MFS® Access, or eDelivery may not be available to you.
CONTACT
WEB SITE
mfs.com
MFS TALK
1-800-637-8255
24 hours a day
ACCOUNT SERVICE AND LITERATURE
Shareholders
1-800-225-2606
Financial advisors
1-800-343-2829
Retirement plan services
1-800-637-1255
MAILING ADDRESS
MFS Service Center, Inc.
P.O. Box 55824
Boston, MA 02205-5824
OVERNIGHT MAIL
MFS Service Center, Inc.
c/o Boston Financial Data Services
30 Dan Road
Canton, MA 02021-2809
SEMIANNUAL REPORT
January 31, 2014

MFS® EUROPEAN EQUITY FUND

EEQ-SEM
MFS® EUROPEAN EQUITY FUND
CONTENTS
The report is prepared for the general information of shareholders. It is authorized for distribution to prospective investors only when preceded or accompanied by a current prospectus.
NOT FDIC INSURED Ÿ MAY LOSE VALUE Ÿ NO BANK GUARANTEE

LETTER FROM THE CHAIRMAN AND CEO
Dear Shareholders:
It’s a new year, and with it a more sober mood has arrived. During 2013, stocks delivered robust gains across many countries, global regions and economic sectors. It’s too early to draw conclusions for all of 2014, but several weak economic reports have weighed on investors’ minds.
Additionally, concerns have risen that China could stumble as it shifts to a consumer-driven economy, and the U.S. Federal Reserve has started to taper its bond-buying stimulus program, thereby reducing global liquidity. These potential headwinds from the world’s two largest economies have helped cause a flight from emerging markets such as Argentina, Russia, India, Turkey and South Africa. Compounding concerns, some of these countries face their own economic and political challenges. The widespread volatility resulting from all this is a reminder of how interconnected the global economy is.
On the brighter side, U.S. economic reports have remained fairly positive and other major developed markets, including Germany,
Japan and the United Kingdom, have continued to release reasonably strong data. Even the economies of some of the eurozone’s weaker links, including Greece, Portugal and Italy, appear to be growing after a prolonged slump.
In uncertain times such as these, it is particularly important to remember that managing risk should always be a top priority. At MFS®, active risk management is an integral part of our collaborative process. Our global team of investment professionals shares ideas and evaluates opportunities that span continents, investment disciplines and asset classes. Our goal is to build better insights, and ultimately better results, for our clients.
We understand and appreciate the economic challenges investors face, and believe in the value of maintaining a long-term view and applying proven principles, such as asset allocation and diversification. We are confident that our unique approach can serve investors well as they work with their financial advisors to identify and pursue the most suitable opportunities.
Respectfully,

Robert J. Manning
Chairman and Chief Executive Officer
MFS Investment Management®
March 18, 2014
The opinions expressed in this letter are subject to change, may not be relied upon for investment advice, and no forecasts can be guaranteed.
1
PORTFOLIO COMPOSITION
Portfolio structure
| | | | |
| Top ten holdings | | | | |
| Novartis AG | | | 4.0% | |
| Nestle S.A. | | | 3.7% | |
| Royal Dutch Shell PLC, “A” | | | 3.4% | |
| Vodafone Group PLC | | | 3.3% | |
| Linde AG | | | 2.7% | |
| Groupe Danone | | | 2.5% | |
| Bayer AG | | | 2.4% | |
| Akzo Nobel N.V. | | | 2.4% | |
| UBS AG | | | 2.3% | |
| GlaxoSmithKline PLC | | | 2.3% | |
| |
| Equity sectors (a) | | | | |
| Financial Services | | | 16.6% | |
| Consumer Staples | | | 12.9% | |
| Health Care | | | 11.0% | |
| Basic Materials | | | 9.8% | |
| Utilities & Communications | | | 8.4% | |
| Energy | | | 6.7% | |
| Industrial Goods & Services | | | 6.6% | |
| Retailing | | | 5.7% | |
| Leisure | | | 5.3% | |
| Special Products & Services | | | 5.1% | |
| Technology | | | 4.8% | |
| Autos & Housing | | | 3.5% | |
| Transportation | | | 0.8% | |
| | | | |
| Issuer country weightings (x) | |
| United Kingdom | | | 33.7% | |
| Switzerland | | | 15.5% | |
| France | | | 14.0% | |
| Germany | | | 12.2% | |
| Netherlands | | | 4.7% | |
| United States | | | 3.6% | |
| Sweden | | | 3.5% | |
| Denmark | | | 3.1% | |
| Belgium | | | 2.8% | |
| Other Countries | | | 6.9% | |
|
| Currency exposure weightings (y) | |
| Euro | | | 39.6% | |
| British Pound Sterling | | | 33.7% | |
| Swiss Franc | | | 15.5% | |
| United States Dollar | | | 3.6% | |
| Swedish Krona | | | 3.5% | |
| Danish Krone | | | 3.1% | |
| Hong Kong Dollar | | | 0.5% | |
| Turkish Lira | | | 0.3% | |
| Canadian Dollar | | | 0.2% | |
2
Portfolio Composition – continued
| (a) | The sectors depicted are economic aggregates made up of several underlying industry categories. The fund may invest between 25% and 35% of its total assets in any industry that represents 20% or more of the European market as a whole, as measured by an index determined by the adviser to be an appropriate measure of the European market. As of January 31, 2014, the fund did not have more than 25% of its total assets invested in any one industry. |
| (x) | Represents the portfolio’s exposure to issuer countries as a percentage of a portfolio’s net assets. For purposes of this presentation, United States includes Cash & Other. |
| (y) | Represents the portfolio’s exposure to a particular currency as a percentage of a portfolio’s net assets. For purposes of this presentation, United States Dollar includes Cash & Other. |
Percentages are based on net assets as of 1/31/14.
The portfolio is actively managed and current holdings may be different.
3
EXPENSE TABLE
Fund expenses borne by the shareholders during the period, August 1, 2013 through January 31, 2014
As a shareholder of the fund, you incur two types of costs: (1) transaction costs, including sales charges (loads) on certain purchase or redemption payments, and (2) ongoing costs, including management fees; distribution and service (12b-1) fees; and other fund expenses. This example is intended to help you understand your ongoing costs (in dollars) of investing in the fund and to compare these costs with the ongoing costs of investing in other mutual funds.
The example is based on an investment of $1,000 invested at the beginning of the period and held for the entire period August 1, 2013 through January 31, 2014.
Actual Expenses
The first line for each share class in the following table provides information about actual account values and actual expenses. You may use the information in this line, together with the amount you invested, to estimate the expenses that you paid over the period. Simply divide your account value by $1,000 (for example, an $8,600 account value divided by $1,000 = 8.6), then multiply the result by the number in the first line under the heading entitled “Expenses Paid During Period” to estimate the expenses you paid on your account during this period.
Hypothetical Example for Comparison Purposes
The second line for each share class in the following table provides information about hypothetical account values and hypothetical expenses based on the fund’s actual expense ratio and an assumed rate of return of 5% per year before expenses, which is not the fund’s actual return. The hypothetical account values and expenses may not be used to estimate the actual ending account balance or expenses you paid for the period. You may use this information to compare the ongoing costs of investing in the fund and other funds. To do so, compare this 5% hypothetical example with the 5% hypothetical examples that appear in the shareholder reports of the other funds.
Please note that the expenses shown in the table are meant to highlight your ongoing costs only and do not reflect any transactional costs, such as sales charges (loads). Therefore, the second line for each share class in the table is useful in comparing ongoing costs only, and will not help you determine the relative total costs of owning different funds. In addition, if these transactional costs were included, your costs would have been higher.
4
Expense Table – continued
| | | | | | | | | | | | | | | | | | |
Share
Class | | | | Annualized
Expense
Ratio | | | Beginning
Account Value
8/01/13 | | | Ending
Account Value
1/31/14 | | | Expenses Paid During Period (p) 8/01/13-1/31/14 | |
| A | | Actual | | | 1.55% | | | | $1,000.00 | | | | $1,063.39 | | | | $8.06 | |
| | Hypothetical (h) | | | 1.55% | | | | $1,000.00 | | | | $1,017.39 | | | | $7.88 | |
| B | | Actual | | | 2.30% | | | | $1,000.00 | | | | $1,058.92 | | | | $11.94 | |
| | Hypothetical (h) | | | 2.30% | | | | $1,000.00 | | | | $1,013.61 | | | | $11.67 | |
| C | | Actual | | | 2.30% | | | | $1,000.00 | | | | $1,058.99 | | | | $11.94 | |
| | Hypothetical (h) | | | 2.30% | | | | $1,000.00 | | | | $1,013.61 | | | | $11.67 | |
| I | | Actual | | | 1.30% | | | | $1,000.00 | | | | $1,065.20 | | | | $6.77 | |
| | Hypothetical (h) | | | 1.30% | | | | $1,000.00 | | | | $1,018.65 | | | | $6.61 | |
| (h) | 5% class return per year before expenses. |
| (p) | Expenses paid are equal to each class’s annualized expense ratio, as shown above, multiplied by the average account value over the period, multiplied by the number of days in the period, divided by the number of days in the year. Expenses paid do not include any applicable sales charges (loads). If these transaction costs had been included, your costs would have been higher. |
5
PORTFOLIO OF INVESTMENTS
1/31/14 (unaudited)
The Portfolio of Investments is a complete list of all securities owned by your fund. It is categorized by broad-based asset classes.
| | | | | | | | |
| Common Stocks - 97.2% | | | | | | | | |
| Issuer | | Shares/Par | | | Value ($) | |
| Airlines - 0.8% | | | | | | | | |
| Stagecoach Group PLC | | | 22,835 | | | $ | 136,568 | |
| | |
| Alcoholic Beverages - 2.4% | | | | | | | | |
| Heineken N.V. | | | 1,677 | | | $ | 102,368 | |
| Pernod Ricard S.A. | | | 3,041 | | | | 326,635 | |
| | | | | | | | |
| | | | | | | $ | 429,003 | |
| Apparel Manufacturers - 2.9% | | | | | | | | |
| Burberry Group PLC | | | 4,434 | | | $ | 105,545 | |
| Compagnie Financiere Richemont S.A. | | | 1,540 | | | | 142,934 | |
| LVMH Moet Hennessy Louis Vuitton S.A. | | | 1,490 | | | | 265,564 | |
| | | | | | | | |
| | | | | | | $ | 514,043 | |
| Automotive - 1.9% | | | | | | | | |
| Autoliv, Inc., SDR | | | 1,374 | | | $ | 124,368 | |
| D’Ieteren S.A. | | | 4,220 | | | | 202,333 | |
| | | | | | | | |
| | | | | | | $ | 326,701 | |
| Broadcasting - 1.8% | | | | | | | | |
| Publicis Groupe | | | 3,567 | | | $ | 316,455 | |
| | |
| Brokerage & Asset Managers - 1.3% | | | | | | | | |
| IG Group Holdings PLC | | | 21,432 | | | $ | 220,729 | |
| | |
| Business Services - 5.1% | | | | | | | | |
| Adecco S.A. | | | 1,654 | | | $ | 130,164 | |
| Brenntag AG | | | 1,039 | | | | 179,366 | |
| Compass Group PLC | | | 18,439 | | | | 275,990 | |
| Experian Group Ltd. | | | 7,389 | | | | 126,326 | |
| MITIE Group PLC | | | 34,420 | | | | 180,500 | |
| | | | | | | | |
| | | | | | | $ | 892,346 | |
| Computer Software - 1.2% | | | | | | | | |
| Dassault Systemes S.A. | | | 809 | | | $ | 95,918 | |
| Fidessa Group PLC | | | 3,011 | | | | 114,488 | |
| | | | | | | | |
| | | | | | | $ | 210,406 | |
6
Portfolio of Investments (unaudited) – continued
| | | | | | | | |
| Issuer | | Shares/Par | | | Value ($) | |
| Common Stocks - continued | | | | | | | | |
| Construction - 1.7% | | | | | | | | |
| Bellway PLC | | | 6,565 | | | $ | 167,711 | |
| BUZZI UNICEM S.p.A | | | 6,674 | | | | 121,967 | |
| | | | | | | | |
| | | | | | | $ | 289,678 | |
| Consumer Products - 1.7% | | | | | | | | |
| Reckitt Benckiser Group PLC | | | 3,930 | | | $ | 294,794 | |
| | |
| Electrical Equipment - 5.0% | | | | | | | | |
| IMI PLC | | | 4,320 | | | $ | 106,312 | |
| Legrand S.A. | | | 2,105 | | | | 111,815 | |
| Pfeiffer Vacuum Technology AG | | | 1,050 | | | | 124,761 | |
| Schneider Electric S.A. | | | 2,682 | | | | 216,635 | |
| Siemens AG | | | 2,503 | | | | 317,190 | |
| | | | | | | | |
| | | | | | | $ | 876,713 | |
| Electronics - 1.7% | | | | | | | | |
| ASM International N.V. | | | 3,255 | | | $ | 109,092 | |
| Infineon Technologies AG | | | 17,542 | | | | 181,133 | |
| | | | | | | | |
| | | | | | | $ | 290,225 | |
| Energy - Independent - 0.9% | | | | | | | | |
| Bankers Petroleum Ltd. (a) | | | 8,657 | | | $ | 33,268 | |
| Cairn Energy PLC (a) | | | 13,977 | | | | 49,538 | |
| Galp Energia SGPS S.A. | | | 5,246 | | | | 81,224 | |
| | | | | | | | |
| | | | | | | $ | 164,030 | |
| Energy - Integrated - 4.6% | | | | | | | | |
| BG Group PLC | | | 12,503 | | | $ | 210,059 | |
| Royal Dutch Shell PLC, “A” | | | 17,450 | | | | 603,411 | |
| | | | | | | | |
| | | | | | | $ | 813,470 | |
| Food & Beverages - 8.2% | | | | | | | | |
| Chr. Hansen Holding A.S. | | | 2,368 | | | $ | 91,469 | |
| Groupe Danone | | | 6,619 | | | | 437,470 | |
| Nestle S.A. | | | 8,950 | | | | 649,545 | |
| Tate & Lyle PLC | | | 20,120 | | | | 250,545 | |
| | | | | | | | |
| | | | | | | $ | 1,429,029 | |
| Food & Drug Stores - 0.9% | | | | | | | | |
| Jeronimo Martins SGPS S.A. | | | 9,683 | | | $ | 165,920 | |
| | |
| Gaming & Lodging - 1.6% | | | | | | | | |
| Betfair Group PLC | | | 8,430 | | | $ | 146,341 | |
| Paddy Power PLC | | | 1,704 | | | | 134,926 | |
| | | | | | | | |
| | | | | | | $ | 281,267 | |
7
Portfolio of Investments (unaudited) – continued
| | | | | | | | |
| Issuer | | Shares/Par | | | Value ($) | |
| Common Stocks - continued | | | | | | | | |
| General Merchandise - 0.3% | | | | | | | | |
| BIM Birlesik Magazalar A.S. | | | 2,967 | | | $ | 50,662 | |
| | |
| Insurance - 2.8% | | | | | | | | |
| Beazley PLC | | | 27,264 | | | $ | 114,513 | |
| Delta Lloyd N.V. | | | 7,610 | | | | 195,881 | |
| Hiscox Ltd. | | | 16,497 | | | | 173,022 | |
| | | | | | | | |
| | | | | | | $ | 483,416 | |
| Machinery & Tools - 1.6% | | | | | | | | |
| Atlas Copco AB, “A” | | | 6,706 | | | $ | 182,200 | |
| Schindler Holding AG | | | 665 | | | | 96,451 | |
| | | | | | | | |
| | | | | | | $ | 278,651 | |
| Major Banks - 4.7% | | | | | | | | |
| BNP Paribas | | | 3,059 | | | $ | 237,020 | |
| HSBC Holdings PLC | | | 38,500 | | | | 396,829 | |
| Royal Bank of Scotland Group PLC (a) | | | 34,031 | | | | 190,208 | |
| | | | | | | | |
| | | | | | | $ | 824,057 | |
| Medical Equipment - 0.6% | | | | | | | | |
| Sonova Holding AG | | | 814 | | | $ | 111,867 | |
| | |
| Metals & Mining - 1.8% | | | | | | | | |
| Rio Tinto PLC | | | 5,897 | | | $ | 314,427 | |
| | |
| Natural Gas - Distribution - 3.1% | | | | | | | | |
| Centrica PLC | | | 25,289 | | | $ | 129,374 | |
| GDF Suez | | | 14,074 | | | | 311,014 | |
| Snam S.p.A. | | | 18,040 | | | | 99,025 | |
| | | | | | | | |
| | | | | | | $ | 539,413 | |
| Network & Telecom - 1.9% | | | | | | | | |
| Ericsson, Inc., “B” | | | 27,025 | | | $ | 330,006 | |
| | |
| Oil Services - 1.1% | | | | | | | | |
| Saipem S.p.A. | | | 2,530 | | | $ | 59,372 | |
| Technip | | | 1,500 | | | | 127,958 | |
| | | | | | | | |
| | | | | | | $ | 187,330 | |
| Other Banks & Diversified Financials - 6.8% | | | | | | | | |
| Erste Group Bank AG | | | 3,510 | | | $ | 127,840 | |
| Julius Baer Group Ltd. | | | 1,911 | | | | 92,847 | |
| Jyske Bank (a) | | | 3,722 | | | | 190,325 | |
| KBC Group N.V. | | | 4,759 | | | | 281,482 | |
8
Portfolio of Investments (unaudited) – continued
| | | | | | | | |
| Issuer | | Shares/Par | | | Value ($) | |
| Common Stocks - continued | | | | | | | | |
| Other Banks & Diversified Financials - continued | | | | | | | | |
| Sydbank A/S (a) | | | 3,778 | | | $ | 96,082 | |
| UBS AG | | | 20,437 | | | | 405,517 | |
| | | | | | | | |
| | | | | | | $ | 1,194,093 | |
| Pharmaceuticals - 10.3% | | | | | | | | |
| Bayer AG | | | 3,224 | | | $ | 425,646 | |
| GlaxoSmithKline PLC | | | 15,759 | | | | 405,173 | |
| Novartis AG | | | 8,899 | | | | 704,735 | |
| Roche Holding AG | | | 979 | | | | 269,194 | |
| | | | | | | | |
| | | | | | | $ | 1,804,748 | |
| Real Estate - 1.1% | | | | | | | | |
| GAFGAH S.A. (a) | | | 6,350 | | | $ | 91,295 | |
| LEG Immobilien AG | | | 1,690 | | | | 100,620 | |
| | | | | | | | |
| | | | | | | $ | 191,915 | |
| Restaurants - 1.9% | | | | | | | | |
| Domino’s Pizza UK & IRL PLC | | | 5,961 | | | $ | 51,789 | |
| Whitbread PLC | | | 4,607 | | | | 284,080 | |
| | | | | | | | |
| | | | | | | $ | 335,869 | |
| Specialty Chemicals - 8.0% | | | | | | | | |
| Akzo Nobel N.V. | | | 5,822 | | | $ | 419,382 | |
| Croda International PLC | | | 3,567 | | | | 141,435 | |
| Linde AG | | | 2,466 | | | | 467,288 | |
| Sika AG | | | 36 | | | | 118,643 | |
| Symrise AG | | | 5,656 | | | | 257,720 | |
| | | | | | | | |
| | | | | | | $ | 1,404,468 | |
| Specialty Stores - 1.6% | | | | | | | | |
| Esprit Holdings Ltd. (a) | | | 45,148 | | | $ | 85,134 | |
| Industria de Diseno Textil S.A. | | | 1,265 | | | | 188,866 | |
| | | | | | | | |
| | | | | | | $ | 274,000 | |
| Telecommunications - Wireless - 3.3% | | | | | | | | |
| Vodafone Group PLC | | | 156,232 | | | $ | 581,848 | |
| | |
| Telephone Services - 2.0% | | | | | | | | |
| British Telecom Group, PLC | | | 21,790 | | | $ | 137,300 | |
| TDC A.S. | | | 17,229 | | | | 161,938 | |
| Telecom Italia S.p.A. | | | 65,672 | | | | 55,357 | |
| | | | | | | | |
| | | | | | | $ | 354,595 | |
9
Portfolio of Investments (unaudited) – continued
| | | | | | | | |
| Issuer | | Shares/Par | | | Value ($) | |
| Common Stocks - continued | | | | | | | | |
| Tobacco - 0.6% | | | | | | | | |
| Swedish Match AB | | | 3,658 | | | $ | 107,204 | |
| Total Common Stocks (Identified Cost, $16,353,005) | | | | | | $ | 17,019,946 | |
| | |
| Money Market Funds - 3.6% | | | | | | | | |
MFS Institutional Money Market Portfolio, 0.09%,
at Cost and Net Asset Value (v) | | | 634,482 | | | $ | 634,482 | |
| Total Investments (Identified Cost, $16,987,487) | | | | | | $ | 17,654,428 | |
| | |
| Other Assets, Less Liabilities - (0.8)% | | | | | | | (137,294 | ) |
| Net Assets - 100.0% | | | | | | $ | 17,517,134 | |
| (a) | Non-income producing security. |
| (v) | Underlying affiliated fund that is available only to investment companies managed by MFS. The rate quoted for the MFS Institutional Money Market Portfolio is the annualized seven-day yield of the fund at period end. |
The following abbreviations are used in this report and are defined:
| PLC | | Public Limited Company |
| SDR | | Swedish Depository Receipt |
See Notes to Financial Statements
10
Financial Statements
STATEMENT OF ASSETS AND LIABILITIES
At 1/31/14 (unaudited)
This statement represents your fund’s balance sheet, which details the assets and liabilities comprising the total value of the fund.
| | | | |
| Assets | | | | |
Investments- | | | | |
Non-affiliated issuers, at value (identified cost, $16,353,005) | | | $17,019,946 | |
Underlying affiliated funds, at cost and value | | | 634,482 | |
Total investments, at value (identified cost, $16,987,487) | | | $17,654,428 | |
Receivables for | | | | |
Investments sold | | | 21,137 | |
Fund shares sold | | | 145,370 | |
Dividends | | | 22,392 | |
Receivable from investment adviser | | | 24,466 | |
Other assets | | | 189 | |
Total assets | | | $17,867,982 | |
| Liabilities | | | | |
Payables for | | | | |
Investments purchased | | | $260,688 | |
Fund shares reacquired | | | 28,412 | |
Payable to affiliates | | | | |
Shareholder servicing costs | | | 674 | |
Distribution and service fees | | | 253 | |
Payable for independent Trustees’ compensation | | | 133 | |
Accrued expenses and other liabilities | | | 60,688 | |
Total liabilities | | | $350,848 | |
Net assets | | | $17,517,134 | |
| Net assets consist of | | | | |
Paid-in capital | | | $16,957,708 | |
Unrealized appreciation (depreciation) on investments and translation of assets and liabilities in foreign currencies | | | 666,901 | |
Accumulated net realized gain (loss) on investments and foreign currency | | | (93,077 | ) |
Accumulated distributions in excess of net investment income | | | (14,398 | ) |
Net assets | | | $17,517,134 | |
Shares of beneficial interest outstanding | | | 1,289,987 | |
| | | | | | | | | | | | |
| | | Net assets | | | Shares
outstanding | | | Net asset value
per share (a) | |
Class A | | | $7,736,725 | | | | 569,608 | | | | $13.58 | |
Class B | | | 506,707 | | | | 37,580 | | | | 13.48 | |
Class C | | | 2,146,823 | | | | 160,274 | | | | 13.39 | |
Class I | | | 7,126,879 | | | | 522,525 | | | | 13.64 | |
| (a) | Maximum offering price per share was equal to the net asset value per share for all share classes, except for Class A, for which the maximum offering price per share was $14.41 [100 / 94.25 x $13.58]. On sales of $50,000 or more, the maximum offering price of Class A shares is reduced. A contingent deferred sales charge may be imposed on redemptions of Class A, Class B, and Class C shares. Redemption price per share was equal to the net asset value per share for Class I. |
See Notes to Financial Statements
11
Financial Statements
STATEMENT OF OPERATIONS
Six months ended 1/31/14 (unaudited)
This statement describes how much your fund earned in investment income and accrued in expenses. It also describes any gains and/or losses generated by fund operations.
| | | | |
| Net investment loss | | | | |
Income | | | | |
Dividends | | | $68,079 | |
Dividends from underlying affiliated funds | | | 196 | |
Foreign taxes withheld | | | (5,301 | ) |
Total investment income | | | $62,974 | |
Expenses | | | | |
Management fee | | | $44,039 | |
Distribution and service fees | | | 13,648 | |
Shareholder servicing costs | | | 3,818 | |
Administrative services fee | | | 8,823 | |
Independent Trustees’ compensation | | | 550 | |
Custodian fee | | | 41,082 | |
Shareholder communications | | | 5,141 | |
Audit and tax fees | | | 26,912 | |
Legal fees | | | 2,702 | |
Registration fees | | | 27,188 | |
Miscellaneous | | | 5,637 | |
Total expenses | | | $179,540 | |
Reduction of expenses by investment adviser and distributor | | | (102,343 | ) |
Net expenses | | | $77,197 | |
Net investment loss | | | $(14,223 | ) |
| Realized and unrealized gain (loss) on investments and foreign currency | |
Realized gain (loss) (identified cost basis) | | | | |
Investments | | | $88,354 | |
Foreign currency | | | 2,876 | |
Net realized gain (loss) on investments and foreign currency | | | $91,230 | |
Change in unrealized appreciation (depreciation) | | | | |
Investments | | | $100,981 | |
Translation of assets and liabilities in foreign currencies | | | (149 | ) |
Net unrealized gain (loss) on investments and foreign currency translation | | | $100,832 | |
Net realized and unrealized gain (loss) on investments and foreign currency | | | $192,062 | |
Change in net assets from operations | | | $177,839 | |
See Notes to Financial Statements
12
Financial Statements
STATEMENTS OF CHANGES IN NET ASSETS
These statements describe the increases and/or decreases in net assets resulting from operations, any distributions, and any shareholder transactions.
| | | | | | | | |
| Change in net assets | | Six months ended
1/31/14
(unaudited) | | | Year ended
7/31/13 | |
| From operations | | | | | | | | |
Net investment income (loss) | | | $(14,223 | ) | | | $41,930 | |
Net realized gain (loss) on investments and foreign currency | | | 91,230 | | | | (46,353 | ) |
Net unrealized gain (loss) on investments and foreign currency translation | | | 100,832 | | | | 578,701 | |
Change in net assets from operations | | | $177,839 | | | | $574,278 | |
| Distributions declared to shareholders | | | | | | | | |
From net investment income | | | $(41,501 | ) | | | $(26,201 | ) |
Change in net assets from fund share transactions | | | $13,665,259 | | | | $1,451,227 | |
Total change in net assets | | | $13,801,597 | | | | $1,999,304 | |
| Net assets | | | | | | | | |
At beginning of period | | | 3,715,537 | | | | 1,716,233 | |
At end of period (including accumulated distributions in excess of net investment income of $14,398 and undistributed net investment income of $41,326, respectively) | | | $17,517,134 | | | | $3,715,537 | |
See Notes to Financial Statements
13
Financial Statements
FINANCIAL HIGHLIGHTS
The financial highlights table is intended to help you understand the fund’s financial performance for the semiannual period and the past 5 fiscal years (or life of a particular share class, if shorter). Certain information reflects financial results for a single fund share. The total returns in the table represent the rate by which an investor would have earned (or lost) on an investment in the fund share class (assuming reinvestment of all distributions) held for the entire period.
| | | | | | | | | | | | | | | | |
| | | Six months
ended
1/31/14
(unaudited) | | | Years
ended 7/31 | | | Period
ended 7/31/11 (c) | |
| Class A | | | 2013 | | | 2012 | | |
| | | | | | | | | | | |
Net asset value, beginning of period | | | $12.82 | | | | $10.03 | | | | $11.48 | | | | $10.00 | |
| Income (loss) from investment operations | | | | | | | | | | | | | |
Net investment income (loss) (d) | | | $(0.01 | ) | | | $0.20 | | | | $0.16 | | | | $0.25 | |
Net realized and unrealized gain (loss) on
investments and foreign currency | | | 0.82 | | | | 2.73 | | | | (1.35 | ) | | | 1.23 | |
Total from investment operations | | | $0.81 | | | | $2.93 | | | | $(1.19 | ) | | | $1.48 | |
| Less distributions declared to shareholders | | | | | | | | | | | | | |
From net investment income | | | $(0.05 | ) | | | $(0.14 | ) | | | $(0.14 | ) | | | $— | |
From net realized gain on investments | | | — | | | | — | | | | (0.12 | ) | | | — | |
Total distributions declared to shareholders | | | $(0.05 | ) | | | $(0.14 | ) | | | $(0.26 | ) | | | $— | |
Net asset value, end of period (x) | | | $13.58 | | | | $12.82 | | | | $10.03 | | | | $11.48 | |
Total return (%) (r)(s)(t)(x) | | | 6.34 | (n) | | | 29.33 | | | | (10.18 | ) | | | 14.80 | (n) |
Ratios (%) (to average net assets)
and Supplemental data: | | | | | | | | | | | | | | | | |
Expenses before expense reductions (f) | | | 3.65 | (a) | | | 8.83 | | | | 13.52 | | | | 13.74 | (a) |
Expenses after expense reductions (f) | | | 1.55 | (a) | | | 1.55 | | | | 1.55 | | | | 1.55 | (a) |
Net investment income (loss) | | | (0.20 | )(a)(l) | | | 1.69 | | | | 1.57 | | | | 2.50 | (a) |
Portfolio turnover | | | 14 | (n) | | | 88 | | | | 56 | | | | 26 | |
Net assets at end of period (000 omitted) | | | $7,737 | | | | $1,796 | | | | $596 | | | | $790 | |
See Notes to Financial Statements
14
Financial Highlights – continued
| | | | | | | | | | | | | | | | |
| | | Six months
ended
1/31/14
(unaudited) | | | Years
ended 7/31 | | | Period
ended 7/31/11 (c) | |
| Class B | | | 2013 | | | 2012 | | |
| | | | | | | | | | | |
Net asset value, beginning of period | | | $12.73 | | | | $9.98 | | | | $11.40 | | | | $10.00 | |
| Income (loss) from investment operations | | | | | | | | | | | | | |
Net investment income (loss) (d) | | | $(0.06 | ) | | | $0.11 | | | | $0.08 | | | | $0.15 | |
Net realized and unrealized gain (loss) on
investments and foreign currency | | | 0.81 | | | | 2.71 | | | | (1.33 | ) | | | 1.25 | |
Total from investment operations | | | $0.75 | | | | $2.82 | | | | $(1.25 | ) | | | $1.40 | |
| Less distributions declared to shareholders | | | | | | | | | | | | | |
From net investment income | | | $— | | | | $(0.07 | ) | | | $(0.05 | ) | | | $— | |
From net realized gain on investments | | | — | | | | — | | | | (0.12 | ) | | | — | |
Total distributions declared to shareholders | | | $— | | | | $(0.07 | ) | | | $(0.17 | ) | | | $— | |
Net asset value, end of period (x) | | | $13.48 | | | | $12.73 | | | | $9.98 | | | | $11.40 | |
Total return (%) (r)(s)(t)(x) | | | 5.89 | (n) | | | 28.37 | | | | (10.84 | ) | | | 14.00 | (n) |
Ratios (%) (to average net assets)
and Supplemental data: | | | | | | | | | | | | | |
Expenses before expense reductions (f) | | | 4.61 | (a) | | | 9.83 | | | | 14.36 | | | | 14.34 | (a) |
Expenses after expense reductions (f) | | | 2.30 | (a) | | | 2.30 | | | | 2.30 | | | | 2.30 | (a) |
Net investment income (loss) | | | (0.88 | )(a)(l) | | | 0.90 | | | | 0.81 | | | | 1.54 | (a) |
Portfolio turnover | | | 14 | (n) | | | 88 | | | | 56 | | | | 26 | |
Net assets at end of period (000 omitted) | | | $507 | | | | $267 | | | | $148 | | | | $166 | |
See Notes to Financial Statements
15
Financial Highlights – continued
| | | | | | | | | | | | | | | | |
| | | Six months
ended
1/31/14
(unaudited) | | | Years
ended 7/31 | | | Period
ended 7/31/11 (c) | |
| Class C | | | 2013 | | | 2012 | | |
| | | | | | | | | | | |
Net asset value, beginning of period | | | $12.68 | | | | $9.96 | | | | $11.40 | | | | $10.00 | |
| Income (loss) from investment operations | | | | | | | | | | | | | |
Net investment income (loss) (d) | | | $(0.08 | ) | | | $0.11 | | | | $0.08 | | | | $0.11 | |
Net realized and unrealized gain (loss) on
investments and foreign currency | | | 0.83 | | | | 2.70 | | | | (1.33 | ) | | | 1.29 | |
Total from investment operations | | | $0.75 | | | | $2.81 | | | | $(1.25 | ) | | | $1.40 | |
| Less distributions declared to shareholders | | | | | | | | | | | | | |
From net investment income | | | $(0.04 | ) | | | $(0.09 | ) | | | $(0.07 | ) | | | $— | |
From net realized gain on investments | | | — | | | | — | | | | (0.12 | ) | | | — | |
Total distributions declared to shareholders | | | $(0.04 | ) | | | $(0.09 | ) | | | $(0.19 | ) | | | $— | |
Net asset value, end of period (x) | | | $13.39 | | | | $12.68 | | | | $9.96 | | | | $11.40 | |
Total return (%) (r)(s)(t)(x) | | | 5.90 | (n) | | | 28.35 | | | | (10.84 | ) | | | 14.00 | (n) |
Ratios (%) (to average net assets)
and Supplemental data: | | | | | | | | | | | | | |
Expenses before expense reductions (f) | | | 4.29 | (a) | | | 9.64 | | | | 14.31 | | | | 14.71 | (a) |
Expenses after expense reductions (f) | | | 2.30 | (a) | | | 2.30 | | | | 2.30 | | | | 2.30 | (a) |
Net investment income (loss) | | | (1.10 | )(a)(l) | | | 0.91 | | | | 0.83 | | | | 1.08 | (a) |
Portfolio turnover | | | 14 | (n) | | | 88 | | | | 56 | | | | 26 | |
Net assets at end of period (000 omitted) | | | $2,147 | | | | $339 | | | | $141 | | | | $180 | |
See Notes to Financial Statements
16
Financial Highlights – continued
| | | | | | | | | | | | | | | | |
| | | Six months
ended
1/31/14
(unaudited) | | | Years
ended 7/31 | | | Period
ended 7/31/11 (c) | |
| Class I | | | 2013 | | | 2012 | | |
| | | | | | | | | | | |
Net asset value, beginning of period | | | $12.86 | | | | $10.06 | | | | $11.50 | | | | $10.00 | |
| Income (loss) from investment operations | | | | | | | | | | | | | |
Net investment income (loss) (d) | | | $(0.01 | ) | | | $0.22 | | | | $0.19 | | | | $0.18 | |
Net realized and unrealized gain (loss) on
investments and foreign currency | | | 0.85 | | | | 2.74 | | | | (1.36 | ) | | | 1.32 | |
Total from investment operations | | | $0.84 | | | | $2.96 | | | | $(1.17 | ) | | | $1.50 | |
| Less distributions declared to shareholders | | | | | | | | | | | | | |
From net investment income | | | $(0.06 | ) | | | $(0.16 | ) | | | $(0.15 | ) | | | $— | |
From net realized gain on investments | | | — | | | | — | | | | (0.12 | ) | | | — | |
Total distributions declared to shareholders | | | $(0.06 | ) | | | $(0.16 | ) | | | $(0.27 | ) | | | $— | |
Net asset value, end of period (x) | | | $13.64 | | | | $12.86 | | | | $10.06 | | | | $11.50 | |
Total return (%) (r)(s)(x) | | | 6.52 | (n) | | | 29.60 | | | | (9.96 | ) | | | 15.00 | (n) |
Ratios (%) (to average net assets)
and Supplemental data: | | | | | | | | | | | | | | | | |
Expenses before expense reductions (f) | | | 3.38 | (a) | | | 8.89 | | | | 13.29 | | | | 13.90 | (a) |
Expenses after expense reductions (f) | | | 1.30 | (a) | | | 1.30 | | | | 1.30 | | | | 1.30 | (a) |
Net investment income (loss) | | | (0.08 | )(a)(l) | | | 1.85 | | | | 1.88 | | | | 1.83 | (a) |
Portfolio turnover | | | 14 | (n) | | | 88 | | | | 56 | | | | 26 | |
Net assets at end of period (000 omitted) | | | $7,127 | | | | $1,314 | | | | $832 | | | | $842 | |
| (c) | For the period from the commencement of the fund’s investment operations, September 15, 2010, through the stated period end. |
| (d) | Per share data is based on average shares outstanding. |
| (f) | Ratios do not reflect reductions from fees paid indirectly, if applicable. |
| (l) | Recognition of net investment income by the fund may be affected by the timing of the declaration of dividends by companies in which the fund invests and the actual annual net investment income ratio may differ. |
| (r) | Certain expenses have been reduced without which performance would have been lower. |
| (s) | From time to time the fund may receive proceeds from litigation settlements, without which performance would be lower. |
| (t) | Total returns do not include any applicable sales charges. |
| (x) | The net asset values per share and total returns have been calculated on net asset values which include adjustments made in accordance with U.S. generally accepted accounting principles required at period end for financial reporting purposes. |
See Notes to Financial Statements
17
NOTES TO FINANCIAL STATEMENTS
(unaudited)
(1) Business and Organization
MFS European Equity Fund (the fund) is a series of MFS Series Trust VII (the trust). The trust is organized as a Massachusetts business trust and is registered under the Investment Company Act of 1940, as amended, as an open-end management investment company.
(2) Significant Accounting Policies
General – The preparation of financial statements in conformity with U.S. generally accepted accounting principles requires management to make estimates and assumptions that affect the reported amounts of assets and liabilities, and disclosure of contingent assets and liabilities at the date of the financial statements and the reported amounts of increases and decreases in net assets from operations during the reporting period. Actual results could differ from those estimates. In the preparation of these financial statements, management has evaluated subsequent events occurring after the date of the fund’s Statement of Assets and Liabilities through the date that the financial statements were issued. The fund invests in foreign securities. Investments in foreign securities are vulnerable to the effects of changes in the relative values of the local currency and the U.S. dollar and to the effects of changes in each country’s legal, political, and economic environment. The fund’s performance could be closely tied to the market, currency, economic, political, regulatory, geopolitical, or other conditions in the countries or regions in which the fund invests and could be more volatile than the performance of more geographically-diversified funds.
The fund may invest between 25% and 35% of its total assets in the securities of issuers in any particular industry if, at the time of investment, that industry represents 20% or more of the European market as a whole, as measured by an index determined by MFS to be an appropriate measure of the European market. At January 31, 2014, the fund did not have more than 25% of its assets invested in any one industry.
In this reporting period, the fund adopted the disclosure provisions of the Financial Accounting Standards Board (FASB) Accounting Standards Update 2011-11 (“ASU 2011-11”), Balance Sheet (Topic 210) – Disclosures about Offsetting Assets and Liabilities along with the related scope clarification provisions of FASB Accounting Standards Update 2013-01 (“ASU 2013-01”) entitled Balance Sheet (Topic 210) – Clarifying the Scope of Disclosures about Offsetting Assets and Liabilities. ASU 2011-11 is intended to enhance disclosures on the offsetting of financial assets and liabilities by requiring entities to disclose both gross and net information about financial instruments and transactions that are either offset in the statement of financial position or subject to an enforceable Master Netting Agreement or similar arrangement. ASU 2013-01 limits the scope of ASU 2011-11’s disclosure requirements on offsetting to financial assets and financial liabilities related to derivatives, repurchase and reverse repurchase agreements, and securities lending and securities borrowing transactions. The disclosures required by ASU 2011-11, to the extent applicable to the fund, have been included in the fund’s Significant Accounting Policies note under the captions for each of the fund’s in-scope financial instruments and transactions.
In June 2013, FASB issued Accounting Standards Update 2013-08 (“ASU 2013-08”) Financial Services – Investment Companies (Topic 946) – Amendments to the Scope,
18
Notes to Financial Statements (unaudited) – continued
Measurement, and Disclosure Requirements, which is effective for interim and annual reporting periods in fiscal years that begin after December 15, 2013. ASU 2013-08 sets forth a methodology for determining whether an entity should be characterized as an investment company and prescribes fair value accounting for an investment company’s non-controlling ownership interest in another investment company. FASB has determined that a fund registered under the Investment Company Act of 1940 automatically meets ASU 2013-08’s criteria for an investment company. Although still evaluating the potential impacts of ASU 2013-08 to the fund, management expects that the impact of the fund’s adoption will be limited to additional financial statement disclosures.
Investment Valuations – Equity securities, including restricted equity securities, are generally valued at the last sale or official closing price as provided by a third-party pricing service on the market or exchange on which they are primarily traded. Equity securities, for which there were no sales reported that day, are generally valued at the last quoted daily bid quotation as provided by a third-party pricing service on the market or exchange on which such securities are primarily traded. Short-term instruments with a maturity at issuance of 60 days or less generally are valued at amortized cost, which approximates market value. Open-end investment companies are generally valued at net asset value per share. Securities and other assets generally valued on the basis of information from a third-party pricing service may also be valued at a broker/dealer bid quotation. Values obtained from third-party pricing services can utilize both transaction data and market information such as yield, quality, coupon rate, maturity, type of issue, trading characteristics, and other market data. The values of foreign securities and other assets and liabilities expressed in foreign currencies are converted to U.S. dollars using the mean of bid and asked prices for rates provided by a third-party pricing service.
The Board of Trustees has delegated primary responsibility for determining or causing to be determined the value of the fund’s investments (including any fair valuation) to the adviser pursuant to valuation policies and procedures approved by the Board. If the adviser determines that reliable market quotations are not readily available, investments are valued at fair value as determined in good faith by the adviser in accordance with such procedures under the oversight of the Board of Trustees. Under the fund’s valuation policies and procedures, market quotations are not considered to be readily available for most types of debt instruments and floating rate loans and many types of derivatives. These investments are generally valued at fair value based on information from third-party pricing services. In addition, investments may be valued at fair value if the adviser determines that an investment’s value has been materially affected by events occurring after the close of the exchange or market on which the investment is principally traded (such as foreign exchange or market) and prior to the determination of the fund’s net asset value, or after the halting of trading of a specific security where trading does not resume prior to the close of the exchange or market on which the security is principally traded. Events that occur on a frequent basis after foreign markets close (such as developments in foreign markets and significant movements in the U.S. markets) and prior to the determination of the fund’s net asset value may be deemed to have a material effect on the value of securities traded in foreign markets. Accordingly, the fund’s foreign equity securities may often be valued at fair value. The
19
Notes to Financial Statements (unaudited) – continued
adviser generally relies on third-party pricing services or other information (such as the correlation with price movements of similar securities in the same or other markets; the type, cost and investment characteristics of the security; the business and financial condition of the issuer; and trading and other market data) to assist in determining whether to fair value and at what value to fair value an investment. The value of an investment for purposes of calculating the fund’s net asset value can differ depending on the source and method used to determine value. When fair valuation is used, the value of an investment used to determine the fund’s net asset value may differ from quoted or published prices for the same investment. There can be no assurance that the fund could obtain the fair value assigned to an investment if it were to sell the investment at the same time at which the fund determines its net asset value per share.
Various inputs are used in determining the value of the fund’s assets or liabilities. These inputs are categorized into three broad levels. In certain cases, the inputs used to measure fair value may fall into different levels of the fair value hierarchy. In such cases, an investment’s level within the fair value hierarchy is based on the lowest level of input that is significant to the fair value measurement. The fund’s assessment of the significance of a particular input to the fair value measurement in its entirety requires judgment, and considers factors specific to the investment. Level 1 includes unadjusted quoted prices in active markets for identical assets or liabilities. Level 2 includes other significant observable market-based inputs (including quoted prices for similar securities, interest rates, prepayment speed, and credit risk). Level 3 includes unobservable inputs, which may include the adviser’s own assumptions in determining the fair value of investments. The following is a summary of the levels used as of January 31, 2014 in valuing the fund’s assets or liabilities:
| | | | | | | | | | | | | | | | |
| Investments at Value | | Level 1 | | | Level 2 | | | Level 3 | | | Total | |
| Equity Securities | | | $17,019,946 | | | | $— | | | | $— | | | | $17,019,946 | |
| Mutual Funds | | | 634,482 | | | | — | | | | — | | | | 634,482 | |
| Total Investments | | | $17,654,428 | | | | $— | | | | $— | | | | $17,654,428 | |
For further information regarding security characteristics, see the Portfolio of Investments.
Foreign Currency Translation – Purchases and sales of foreign investments, income, and expenses are converted into U.S. dollars based upon currency exchange rates prevailing on the respective dates of such transactions or on the reporting date for foreign denominated receivables and payables. Gains and losses attributable to foreign currency exchange rates on sales of securities are recorded for financial statement purposes as net realized gains and losses on investments. Gains and losses attributable to foreign exchange rate movements on receivables, payables, income and expenses are recorded for financial statement purposes as foreign currency transaction gains and losses. That portion of both realized and unrealized gains and losses on investments that results from fluctuations in foreign currency exchange rates is not separately disclosed.
Indemnifications – Under the fund’s organizational documents, its officers and Trustees may be indemnified against certain liabilities and expenses arising out of the performance of their duties to the fund. Additionally, in the normal course of business,
20
Notes to Financial Statements (unaudited) – continued
the fund enters into agreements with service providers that may contain indemnification clauses. The fund’s maximum exposure under these agreements is unknown as this would involve future claims that may be made against the fund that have not yet occurred.
Investment Transactions and Income – Investment transactions are recorded on the trade date. Dividends received in cash are recorded on the ex-dividend date. Certain dividends from foreign securities will be recorded when the fund is informed of the dividend if such information is obtained subsequent to the ex-dividend date. Dividend payments received in additional securities are recorded on the ex-dividend date in an amount equal to the value of the security on such date.
The fund may receive proceeds from litigation settlements. Any proceeds received from litigation involving portfolio holdings are reflected in the Statement of Operations in realized gain/loss if the security has been disposed of by the fund or in unrealized gain/loss if the security is still held by the fund. Any other proceeds from litigation not related to portfolio holdings are reflected as other income in the Statement of Operations.
Fees Paid Indirectly – The fund’s custody fee may be reduced according to an arrangement that measures the value of cash deposited with the custodian by the fund. For the six months ended January 31, 2014, custody fees were not reduced.
Tax Matters and Distributions – The fund intends to qualify as a regulated investment company, as defined under Subchapter M of the Internal Revenue Code, and to distribute all of its taxable income, including realized capital gains. As a result, no provision for federal income tax is required. The fund’s federal tax returns, when filed, will remain subject to examination by the Internal Revenue Service for a three year period. Management has analyzed the fund’s tax positions taken on federal and state tax returns for all open tax years and does not believe that there are any uncertain tax positions that require recognition of a tax liability. Foreign taxes, if any, have been accrued by the fund in the accompanying financial statements in accordance with the applicable foreign tax law. Foreign income taxes may be withheld by certain countries in which the fund invests. Additionally, capital gains realized by the fund on securities issued in or by certain foreign countries may be subject to capital gains tax imposed by those countries.
Distributions to shareholders are recorded on the ex-dividend date. Income and capital gain distributions are determined in accordance with income tax regulations, which may differ from U.S. generally accepted accounting principles. Certain capital accounts in the financial statements are periodically adjusted for permanent differences in order to reflect their tax character. These adjustments have no impact on net assets or net asset value per share. Temporary differences which arise from recognizing certain items of income, expense, gain or loss in different periods for financial statement and tax purposes will reverse at some time in the future. Distributions in excess of net investment income or net realized gains are temporary overdistributions for financial statement purposes resulting from differences in the recognition or classification of income or distributions for financial statement and tax purposes.
Book/tax differences primarily relate to wash sale loss deferrals.
21
Notes to Financial Statements (unaudited) – continued
The tax character of distributions made during the current period will be determined at fiscal year end. The tax character of distributions declared to shareholders for the last fiscal year is as follows:
| | | | |
| | | 7/31/13 | |
Ordinary income (including any
short-term capital gains) | | | $26,201 | |
The federal tax cost and the tax basis components of distributable earnings were as follows:
| | | | |
| As of 1/31/14 | | | |
| Cost of investments | | | $17,124,974 | |
| Gross appreciation | | | 903,893 | |
| Gross depreciation | | | (374,439 | ) |
| Net unrealized appreciation (depreciation) | | | $529,454 | |
| |
| As of 7/31/13 | | | |
| Undistributed ordinary income | | | 41,326 | |
Capital loss carryforwards | | | (46,820 | ) |
| Other temporary differences | | | 109 | |
| Net unrealized appreciation (depreciation) | | | 428,473 | |
The aggregate cost above includes prior fiscal year end tax adjustments, if applicable.
As of July 31, 2013, the fund had capital loss carryforwards available to offset future realized gains. Such losses are characterized as follows:
| | | | |
| Short-Term | | | $(20,027 | ) |
| Long-Term | | | (26,793 | ) |
| Total | | | $(46,820 | ) |
Under the Regulated Investment Company Modernization Act of 2010 (the “Act”), the above net capital losses may be carried forward indefinitely, and their character is retained as short-term and/or long-term losses. Previously, net capital losses were carried forward for eight years and treated as short-term losses.
Multiple Classes of Shares of Beneficial Interest – The fund offers multiple classes of shares, which differ in their respective distribution and service fees. The fund’s income, realized and unrealized gain (loss), and common expenses are allocated to shareholders based on the daily net assets of each class. Dividends are declared separately for each class. Differences in per share dividend rates are generally due to differences in separate class expenses. Class B shares will convert to Class A shares approximately eight years after purchase. The fund’s distributions declared to
22
Notes to Financial Statements (unaudited) – continued
shareholders as reported in the Statements of Changes in Net Assets are presented by class as follows:
| | | | | | | | |
| | | From net investment
income | |
| | | Six months
ended
1/31/14 | | | Year ended
7/31/13 | |
| Class A | | | $23,578 | | | | $9,546 | |
| Class B | | | — | | | | 1,170 | |
| Class C | | | 5,025 | | | | 2,024 | |
| Class I | | | 12,898 | | | | 13,461 | |
| Total | | | $41,501 | | | | $26,201 | |
(3) Transactions with Affiliates
Investment Adviser – The fund has an investment advisory agreement with MFS to provide overall investment management and related administrative services and facilities to the fund. The management fee is computed daily and paid monthly at the following annual rates:
| | | | |
| First $1 billion of average daily net assets | | | 0.90 | % |
| Next $1.5 billion of average daily net assets | | | 0.80 | % |
| Average daily net assets in excess of $2.5 billion | | | 0.75 | % |
MFS has agreed in writing to reduce its management fee by a specified amount if certain MFS mutual fund assets exceed thresholds agreed to by MFS and the fund’s Board of Trustees. For the six months ended January 31, 2014, this management fee reduction amounted to $109, which is included in the reduction of total expenses in the Statement of Operations. The management fee incurred for the six months ended January 31, 2014 was equivalent to an annual effective rate of 0.90% of the fund’s average daily net assets.
The investment adviser has agreed in writing to pay a portion of the fund’s total annual operating expenses, exclusive of interest, taxes, extraordinary expenses, brokerage and transaction costs, and investment-related expenses, such that total fund operating expenses do not exceed the following rates annually of each class’s average daily net assets:
| | | | | | | | | | | | | | |
| Class A | | | Class B | | | Class C | | | Class I | |
| | 1.55% | | | | 2.30 | % | | | 2.30 | % | | | 1.30 | % |
This written agreement will continue until modified by the fund’s Board of Trustees, but such agreement will continue at least until November 30, 2014. For the six months ended January 31, 2014, this reduction amounted to $102,144 and is included in the reduction of total expenses in the Statement of Operations.
Distributor – MFS Fund Distributors, Inc. (MFD), a wholly-owned subsidiary of MFS, as distributor, received $20,862 for the six months ended January 31, 2014, as its portion of the initial sales charge on sales of Class A shares of the fund.
The Board of Trustees has adopted a distribution plan for certain class shares pursuant to Rule 12b-1 of the Investment Company Act of 1940.
23
Notes to Financial Statements (unaudited) – continued
The fund’s distribution plan provides that the fund will pay MFD for services provided by MFD and financial intermediaries in connection with the distribution and servicing of certain share classes. One component of the plan is a distribution fee paid to MFD and another component of the plan is a service fee paid to MFD. MFD may subsequently pay all, or a portion, of the distribution and/or service fees to financial intermediaries.
Distribution Plan Fee Table:
| | | | | | | | | | | | | | | | | | | | |
| | | Distribution
Fee Rate (d) | | | Service
Fee Rate (d) | | | Total
Distribution
Plan (d) | | | Annual
Effective
Rate (e) | | | Distribution
and Service
Fee | |
| Class A | | | — | | | | 0.25% | | | | 0.25% | | | | 0.25% | | | | $5,937 | |
| Class B | | | 0.75% | | | | 0.25% | | | | 1.00% | | | | 1.00% | | | | 1,976 | |
| Class C | | | 0.75% | | | | 0.25% | | | | 1.00% | | | | 1.00% | | | | 5,735 | |
| Total Distribution and Service Fees | | | | | | | | | | | | $13,648 | |
| (d) | In accordance with the distribution plan for certain classes, the fund pays distribution and/or service fees equal to these annual percentage rates of each class’s average daily net assets. The distribution and service fee rates disclosed by class represent the current rates in effect at the end of the reporting period. Any rate changes, if applicable, are detailed below. |
| (e) | MFD has voluntarily agreed to rebates a portion of each class’s 0.25% service fee attributable to accounts for which MFD retains the 0.25% service fee except for accounts attributable to MFS or its affiliates’ seed money. For the six months ended January 31, 2014, this rebate amounted to $85 for Class A and is included in the reduction of total expenses in the Statement of Operations. |
Certain Class A shares are subject to a contingent deferred sales charge (CDSC) in the event of a shareholder redemption within 18 months of purchase for shares purchased on or after August 1, 2012, and within 24 months of purchase for shares purchased prior to August 1, 2012. Class C shares are subject to a CDSC in the event of a shareholder redemption within 12 months of purchase. Class B shares are subject to a CDSC in the event of a shareholder redemption within six years of purchase. All contingent deferred sales charges are paid to MFD and during the six months ended January 31, 2014, were as follows:
| | | | |
| | | Amount | |
| Class A | | | $— | |
| Class B | | | 150 | |
| Class C | | | 36 | |
Shareholder Servicing Agent – MFS Service Center, Inc. (MFSC), a wholly-owned subsidiary of MFS, receives a fee from the fund for its services as shareholder servicing agent calculated as a percentage of the average daily net assets of the fund as determined periodically under the supervision of the fund’s Board of Trustees. For the six months ended January 31, 2014, the fee was $1,372, which equated to 0.0280% annually of the fund’s average daily net assets. MFSC also receives payment from the fund for out-of-pocket expenses, sub-accounting and other shareholder servicing costs which may be paid to affiliated and unaffiliated service providers. For the six months ended January 31, 2014, these out-of-pocket expenses, sub-accounting and other shareholder servicing costs amounted to $2,446.
Administrator – MFS provides certain financial, legal, shareholder communications, compliance, and other administrative services to the fund. Under an administrative
24
Notes to Financial Statements (unaudited) – continued
services agreement, the fund partially reimburses MFS the costs incurred to provide these services. The fund is charged an annual fixed amount of $17,500 plus a fee based on average daily net assets. The administrative services fee incurred for the six months ended January 31, 2014 was equivalent to an annual effective rate of 0.1803% of the fund’s average daily net assets.
Trustees’ and Officers’ Compensation – The fund pays compensation to independent Trustees in the form of a retainer, attendance fees, and additional compensation to Board and Committee chairpersons. The fund does not pay compensation directly to Trustees or officers of the fund who are also officers of the investment adviser, all of whom receive remuneration for their services to the fund from MFS. Certain officers and Trustees of the fund are officers or directors of MFS, MFD, and MFSC.
Other – This fund and certain other funds managed by MFS (the funds) have entered into services agreements (the Agreements) which provide for payment of fees by the funds to Tarantino LLC and Griffin Compliance LLC in return for the provision of services of an Independent Chief Compliance Officer (ICCO) and Assistant ICCO, respectively, for the funds. The ICCO and Assistant ICCO are officers of the funds and the sole members of Tarantino LLC and Griffin Compliance LLC, respectively. The funds can terminate the Agreements with Tarantino LLC and Griffin Compliance LLC at any time under the terms of the Agreements. For the six months ended January 31, 2014, the aggregate fees paid by the fund to Tarantino LLC and Griffin Compliance LLC were $11 and are included in “Miscellaneous” expense in the Statement of Operations. MFS has agreed to reimburse the fund for a portion of the payments made by the fund in the amount of $5, which is included in the reduction of total expenses in the Statement of Operations. Additionally, MFS has agreed to bear all expenses associated with office space, other administrative support, and supplies provided to the ICCO and Assistant ICCO.
The fund invests in the MFS Institutional Money Market Portfolio which is managed by MFS and seeks current income consistent with preservation of capital and liquidity. Income earned on this investment is included in “Dividends from underlying affiliated funds” in the Statement of Operations. This money market fund does not pay a management fee to MFS.
(4) Portfolio Securities
Purchases and sales of investments, other than short-term obligations, aggregated $14,590,664 and $1,388,643, respectively.
25
Notes to Financial Statements (unaudited) – continued
(5) Shares of Beneficial Interest
The fund’s Declaration of Trust permits the Trustees to issue an unlimited number of full and fractional shares of beneficial interest. Transactions in fund shares were as follows:
| | | | | | | | | | | | | | | | |
| | | Six months ended
1/31/14 | | | Year ended
7/31/13 | |
| | | Shares | | | Amount | | | Shares | | | Amount | |
| Shares sold | | | | | | | | | | | | | | | | |
Class A | | | 514,909 | | | | $7,022,713 | | | | 209,795 | | | | $2,489,417 | |
Class B | | | 17,481 | | | | 235,423 | | | | 6,705 | | | | 79,659 | |
Class C | | | 144,016 | | | | 1,956,822 | | | | 32,342 | | | | 381,751 | |
Class I | | | 434,494 | | | | 5,957,442 | | | | 33,064 | | | | 403,085 | |
| | | 1,110,900 | | | | $15,172,400 | | | | 281,906 | | | | $3,353,912 | |
| | | | |
| Shares issued to shareholders in reinvestment of distributions | | | | | | | | | | | | | | | | |
Class A | | | 1,741 | | | | $23,577 | | | | 826 | | | | $9,546 | |
Class B | | | — | | | | — | | | | 101 | | | | 1,170 | |
Class C | | | 372 | | | | 4,968 | | | | 176 | | | | 2,024 | |
Class I | | | 949 | | | | 12,898 | | | | 1,163 | | | | 13,461 | |
| | | 3,062 | | | | $41,443 | | | | 2,266 | | | | $26,201 | |
| | | | |
| Shares reacquired | | | | | | | | | | | | | | | | |
Class A | | | (87,089 | ) | | | $(1,184,640 | ) | | | (130,014 | ) | | | $(1,503,347 | ) |
Class B | | | (880 | ) | | | (11,838 | ) | | | (638 | ) | | | (7,561 | ) |
Class C | | | (10,861 | ) | | | (148,134 | ) | | | (19,889 | ) | | | (237,171 | ) |
Class I | | | (15,026 | ) | | | (203,972 | ) | | | (14,834 | ) | | | (180,807 | ) |
| | | (113,856 | ) | | | $(1,548,584 | ) | | | (165,375 | ) | | | $(1,928,886 | ) |
| | | | |
| Net change | | | | | | | | | | | | | | | | |
Class A | | | 429,561 | | | | $5,861,650 | | | | 80,607 | | | | $995,616 | |
Class B | | | 16,601 | | | | 223,585 | | | | 6,168 | | | | 73,268 | |
Class C | | | 133,527 | | | | 1,813,656 | | | | 12,629 | | | | 146,604 | |
Class I | | | 420,417 | | | | 5,766,368 | | | | 19,393 | | | | 235,739 | |
| | | 1,000,106 | | | | $13,665,259 | | | | 118,797 | | | | $1,451,227 | |
(6) Line of Credit
The fund and certain other funds managed by MFS participate in a $1.1 billion unsecured committed line of credit, subject to a $1 billion sublimit, provided by a syndication of banks under a credit agreement. Borrowings may be made for temporary financing needs. Interest is charged to each fund, based on its borrowings, generally at a rate equal to the higher of the Federal Reserve funds rate or one month LIBOR plus an agreed upon spread. A commitment fee, based on the average daily, unused portion of the committed line of credit, is allocated among the participating funds at the end of each calendar quarter. In addition, the fund and other funds managed by MFS have established unsecured uncommitted borrowing arrangements with certain banks for temporary financing needs. Interest is charged to each fund, based on its borrowings, at a rate equal to the Federal Reserve funds rate plus an
26
Notes to Financial Statements (unaudited) – continued
agreed upon spread. For the six months ended January 31, 2014, the fund’s commitment fee and interest expense were $9 and $0, respectively, and are included in “Miscellaneous” expense in the Statement of Operations.
(7) Transactions in Underlying Affiliated Funds-Affiliated Issuers
An affiliated issuer may be considered one in which the fund owns 5% or more of the outstanding voting securities, or a company which is under common control. For the purposes of this report, the fund assumes the following to be an affiliated issuer:
| | | | | | | | | | | | | | | | |
| Underlying Affiliated Fund | | Beginning
Shares/Par
Amount | | | Acquisitions
Shares/Par
Amount | | | Dispositions
Shares/Par
Amount | | | Ending
Shares/Par
Amount | |
| MFS Institutional Money Market Portfolio | | | 183,852 | | | | 9,318,212 | | | | (8,867,582 | ) | | | 634,482 | |
| | | | |
| Underlying Affiliated Fund | | Realized
Gain (Loss) | | | Capital Gain
Distributions | | | Dividend
Income | | | Ending
Value | |
| MFS Institutional Money Market Portfolio | | | $— | | | | $— | | | | $196 | | | | $634,482 | |
27
BOARD REVIEW OF INVESTMENT ADVISORY AGREEMENT
A discussion regarding the Board’s most recent review and renewal of the fund’s Investment Advisory Agreement with MFS is available by clicking on the fund’s name under “Mutual Funds” in the “Products” section of the MFS Web site (mfs.com).
PROXY VOTING POLICIES AND INFORMATION
A general description of the MFS funds’ proxy voting policies and procedures is available without charge, upon request, by calling 1-800-225-2606, by visiting the Proxy Voting section of mfs.com or by visiting the SEC’s Web site at http://www.sec.gov.
Information regarding how the fund voted proxies relating to portfolio securities during the most recent twelve-month period ended June 30 is available without charge by visiting the Proxy Voting section of mfs.com or by visiting the SEC’s Web site at http://www.sec.gov.
QUARTERLY PORTFOLIO DISCLOSURE
The fund will file a complete schedule of portfolio holdings with the Securities and Exchange Commission (the Commission) for the first and third quarters of each fiscal year on Form N-Q. A shareholder can obtain the quarterly portfolio holdings report at mfs.com. The fund’s Form N-Q is also available on the EDGAR database on the Commission’s Internet Web site at http://www.sec.gov, and may be reviewed and copied at the:
Public Reference Room
Securities and Exchange Commission
100 F Street, NE, Room 1580
Washington, D.C. 20549
Information on the operation of the Public Reference Room may be obtained by calling the Commission at 1-800-SEC-0330. Copies of the fund’s Form N-Q also may be obtained, upon payment of a duplicating fee, by electronic request at the following e-mail address: publicinfo@sec.gov, or by writing the Public Reference Section at the above address.
FURTHER INFORMATION
From time to time, MFS may post important information about the fund or the MFS funds on the MFS web site (mfs.com). This information is available by visiting the “Commentary & Announcements” and “Market Outlooks” sections of mfs.com or by clicking on the fund’s name under “Mutual Funds” in the “Products” section of mfs.com.
PROVISION OF FINANCIAL REPORTS AND SUMMARY PROSPECTUSES
The fund produces financial reports every six months and updates its summary prospectus and prospectus annually. To avoid sending duplicate copies of materials to households, only one copy of the fund’s annual and semiannual report and summary prospectus may be mailed to shareholders having the same last name and residential address on the fund’s records. However, any shareholder may contact MFSC (please see back cover for address and telephone number) to request that copies of these reports and summary prospectuses be sent personally to that shareholder.
28
Save paper with eDelivery.

| MFS® will send you prospectuses, |
reports, and proxies directly via e-mail so you will get information faster with less mailbox clutter.
To sign up:
1. Go to mfs.com.
2. Log in via MFS® Access.
3. Select eDelivery.
If you own your MFS fund shares through a financial institution or a retirement plan, MFS® TALK, MFS® Access, or eDelivery may not be available to you.
CONTACT
WEB SITE
mfs.com
MFS TALK
1-800-637-8255
24 hours a day
ACCOUNT SERVICE AND LITERATURE
Shareholders
1-800-225-2606
Financial advisors
1-800-343-2829
Retirement plan services
1-800-637-1255
MAILING ADDRESS
MFS Service Center, Inc.
P.O. Box 55824
Boston, MA 02205-5824
OVERNIGHT MAIL
MFS Service Center, Inc.
c/o Boston Financial Data Services
30 Dan Road
Canton, MA 02021-2809
SEMIANNUAL REPORT
January 31, 2014

MFS® LATIN AMERICAN
EQUITY FUND

LEQ-SEM
MFS® LATIN AMERICAN EQUITY FUND
CONTENTS
The report is prepared for the general information of shareholders. It is authorized for distribution to prospective investors only when preceded or accompanied by a current prospectus.
NOT FDIC INSURED Ÿ MAY LOSE VALUE Ÿ NO BANK GUARANTEE

LETTER FROM THE CHAIRMAN AND CEO
Dear Shareholders:
It’s a new year, and with it a more sober mood has arrived. During 2013, stocks delivered robust gains across many countries, global regions and economic sectors. It’s too early to draw conclusions for all of 2014, but several weak economic reports have weighed on investors’ minds.
Additionally, concerns have risen that China could stumble as it shifts to a consumer-driven economy, and the U.S. Federal Reserve has started to taper its bond-buying stimulus program, thereby reducing global liquidity. These potential headwinds from the world’s two largest economies have helped cause a flight from emerging markets such as Argentina, Russia, India, Turkey and South Africa. Compounding concerns, some of these countries face their own economic and political challenges. The widespread volatility resulting from all this is a reminder of how interconnected the global economy is.
On the brighter side, U.S. economic reports have remained fairly positive and other major developed markets, including Germany,
Japan and the United Kingdom, have continued to release reasonably strong data. Even the economies of some of the eurozone’s weaker links, including Greece, Portugal and Italy, appear to be growing after a prolonged slump.
In uncertain times such as these, it is particularly important to remember that managing risk should always be a top priority. At MFS®, active risk management is an integral part of our collaborative process. Our global team of investment professionals shares ideas and evaluates opportunities that span continents, investment disciplines and asset classes. Our goal is to build better insights, and ultimately better results, for our clients.
We understand and appreciate the economic challenges investors face, and believe in the value of maintaining a long-term view and applying proven principles, such as asset allocation and diversification. We are confident that our unique approach can serve investors well as they work with their financial advisors to identify and pursue the most suitable opportunities.
Respectfully,

Robert J. Manning
Chairman and Chief Executive Officer
MFS Investment Management®
March 18, 2014
The opinions expressed in this letter are subject to change, may not be relied upon for investment advice, and no forecasts can be guaranteed.
1
PORTFOLIO COMPOSITION
Portfolio structure
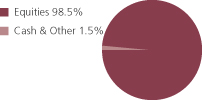
| | | | |
| Top ten holdings | | | | |
| Vale S.A., ADR | | | 5.8% | |
| Petroleo Brasileiro S.A., ADR | | | 4.1% | |
| Itau Unibanco Holding S.A., ADR | | | 3.8% | |
America Movil S.A.B. de C.V.,
“L”, ADR | | | 3.3% | |
| Kroton Educacional S.A. | | | 3.3% | |
| Credicorp Ltd. | | | 3.0% | |
| Gerdau S.A., ADR | | | 2.9% | |
| BM&F Bovespa S.A. | | | 2.9% | |
| AmBev S.A., ADR | | | 2.8% | |
| Estacio Participacoes S.A. | | | 2.8% | |
| | | | |
| Equity sectors (a) | | | | |
| Financial Services | | | 25.7% | |
| Basic Materials | | | 15.1% | |
| Special Products & Services | | | 11.4% | |
| Utilities & Communications | | | 10.4% | |
| Consumer Staples | | | 9.7% | |
| Energy | | | 7.9% | |
| Health Care | | | 5.1% | |
| Retailing | | | 3.5% | |
| Transportation | | | 3.3% | |
| Industrial Goods & Services | | | 2.8% | |
| Technology | | | 1.7% | |
| Leisure | | | 1.1% | |
| Autos & Housing | | | 0.8% | |
| |
| Issuer country weightings (x) | | | | |
| Brazil | | | 65.0% | |
| Mexico | | | 23.4% | |
| Peru | | | 3.0% | |
| Italy | | | 2.5% | |
| Chile | | | 2.4% | |
| United States | | | 1.5% | |
| Argentina | | | 1.3% | |
| Panama | | | 0.9% | |
|
| Currency exposure weightings (y) | |
| Brazilian Real | | | 65.0% | |
| Mexican Peso | | | 23.4% | |
| United States Dollar | | | 5.4% | |
| Euro | | | 3.8% | |
| Chilean Peso | | | 2.4% | |
2
Portfolio Composition – continued
| (a) | The sectors depicted are economic aggregates made up of several underlying industry categories. The fund may invest between 25% and 35% of its total assets in the securities of issuers in any particular industry if, at the time of investment, that industry represents 20% or more of the Latin American market as a whole, as measured by an index determined by MFS to be an appropriate measure of the Latin American market. At January 31, 2014, the fund did not have more than 25% of its assets invested in any one industry. |
| (x) | Represents the portfolio’s exposure to issuer countries as a percentage of a portfolio’s net assets. For purposes of this presentation, United States includes Cash & Other. |
| (y) | Represents the portfolio’s exposure to a particular currency as a percentage of a portfolio’s net assets. For purposes of this presentation, United States Dollar includes Cash & Other. |
Percentages are based on net assets as of 1/31/14.
The portfolio is actively managed and current holdings may be different.
3
EXPENSE TABLE
Fund expenses borne by the shareholders during the period, August 1, 2013 through January 31, 2014
As a shareholder of the fund, you incur two types of costs: (1) transaction costs, including sales charges (loads) on certain purchase or redemption payments, and (2) ongoing costs, including management fees; distribution and service (12b-1) fees; and other fund expenses. This example is intended to help you understand your ongoing costs (in dollars) of investing in the fund and to compare these costs with the ongoing costs of investing in other mutual funds.
The example is based on an investment of $1,000 invested at the beginning of the period and held for the entire period August 1, 2013 through January 31, 2014.
Actual Expenses
The first line for each share class in the following table provides information about actual account values and actual expenses. You may use the information in this line, together with the amount you invested, to estimate the expenses that you paid over the period. Simply divide your account value by $1,000 (for example, an $8,600 account value divided by $1,000 = 8.6), then multiply the result by the number in the first line under the heading entitled “Expenses Paid During Period” to estimate the expenses you paid on your account during this period.
Hypothetical Example for Comparison Purposes
The second line for each share class in the following table provides information about hypothetical account values and hypothetical expenses based on the fund’s actual expense ratio and an assumed rate of return of 5% per year before expenses, which is not the fund’s actual return. The hypothetical account values and expenses may not be used to estimate the actual ending account balance or expenses you paid for the period. You may use this information to compare the ongoing costs of investing in the fund and other funds. To do so, compare this 5% hypothetical example with the 5% hypothetical examples that appear in the shareholder reports of the other funds.
Please note that the expenses shown in the table are meant to highlight your ongoing costs only and do not reflect any transactional costs, such as sales charges (loads). Therefore, the second line for each share class in the table is useful in comparing ongoing costs only, and will not help you determine the relative total costs of owning different funds. In addition, if these transactional costs were included, your costs would have been higher.
4
Expense Table – continued
| | | | | | | | | | | | | | | | | | |
Share
Class | | | | Annualized
Expense Ratio | | | Beginning
Account Value
8/01/13 | | | Ending Account Value
1/31/14 | | | Expenses Paid During Period (p) 8/01/13-1/31/14 | |
| A | | Actual | | | 1.62% | | | | $1,000.00 | | | | $917.50 | | | | $7.83 | |
| | Hypothetical (h) | | | 1.62% | | | | $1,000.00 | | | | $1,017.04 | | | | $8.24 | |
| B | | Actual | | | 2.40% | | | | $1,000.00 | | | | $914.06 | | | | $11.58 | |
| | Hypothetical (h) | | | 2.40% | | | | $1,000.00 | | | | $1,013.11 | | | | $12.18 | |
| C | | Actual | | | 2.40% | | | | $1,000.00 | | | | $913.88 | | | | $11.58 | |
| | Hypothetical (h) | | | 2.40% | | | | $1,000.00 | | | | $1,013.11 | | | | $12.18 | |
| I | | Actual | | | 1.40% | | | | $1,000.00 | | | | $918.78 | | | | $6.77 | |
| | Hypothetical (h) | | | 1.40% | | | | $1,000.00 | | | | $1,018.15 | | | | $7.12 | |
| (h) | 5% class return per year before expenses. |
| (p) | Expenses paid are equal to each class’s annualized expense ratio, as shown above, multiplied by the average account value over the period, multiplied by the number of days in the period, divided by the number of days in the year. Expenses paid do not include any applicable sales charges (loads). If these transaction costs had been included, your costs would have been higher. |
Notes to Expense Table
Each class with a Rule 12b-1 service fee is subject to a rebate of a portion of such fee. Such rebates are included in the expense ratios above and are outside of the expense limitation arrangement. For Class A shares, this rebate reduced the expense ratio above by 0.03%. See Note 3 in the Notes to Financial Statements for additional information.
5
PORTFOLIO OF INVESTMENTS
1/31/14 (unaudited)
The Portfolio of Investments is a complete list of all securities owned by your fund. It is categorized by broad-based asset classes.
| | | | | | | | |
| Common Stocks - 98.5% | | | | | | | | |
| Issuer | | Shares/Par | | | Value ($) | |
| | | | | | | | |
| Aerospace - 0.7% | | | | | | | | |
| Embraer S.A., ADR | | | 886 | | | $ | 27,191 | |
| | |
| Airlines - 2.1% | | | | | | | | |
| Controladora Vuela Compania de Aviacion S.A.B. de C.V., ADR (a) | | | 4,150 | | | $ | 48,306 | |
| Copa Holdings S.A., “A” | | | 262 | | | | 34,243 | |
| | | | | | | | |
| | | | | | | $ | 82,549 | |
| Alcoholic Beverages - 3.8% | | | | | | | | |
| AmBev S.A., ADR | | | 16,515 | | | $ | 108,008 | |
| Compania Cervecerias Unidas S.A., ADR | | | 1,872 | | | | 40,061 | |
| | | | | | | | |
| | | | | | | $ | 148,069 | |
| Apparel Manufacturers - 2.2% | | | | | | | | |
| Arezzo Industria e Comercio S.A. | | | 1,828 | | | $ | 19,695 | |
| Cia. Hering S.A. | | | 6,000 | | | | 66,632 | |
| | | | | | | | |
| | | | | | | $ | 86,327 | |
| Broadcasting - 1.1% | | | | | | | | |
| Grupo Televisa S.A., ADR | | | 1,433 | | | $ | 41,643 | |
| | |
| Brokerage & Asset Managers - 5.9% | | | | | | | | |
| BM&F Bovespa S.A. | | | 27,745 | | | $ | 110,256 | |
| Bolsa Mexicana de Valores S.A. de C.V. | | | 34,400 | | | | 69,628 | |
| CETIP S.A. - Balcao Organizado de Ativos e Derivativos | | | 5,102 | | | | 48,837 | |
| | | | | | | | |
| | | | | | | $ | 228,721 | |
| Business Services - 1.6% | | | | | | | | |
| LPS Brasil - Consultoria de Imoveis S.A. | | | 6,600 | | | $ | 34,460 | |
| Multiplus S.A. | | | 2,500 | | | | 26,831 | |
| | | | | | | | |
| | | | | | | $ | 61,291 | |
| Computer Software - 0.9% | | | | | | | | |
| Totvs S.A. | | | 2,800 | | | $ | 36,792 | |
| | |
| Computer Software - Systems - 0.8% | | | | | | | | |
| Linx S.A. | | | 1,700 | | | $ | 30,890 | |
| | |
| Conglomerates - 0.8% | | | | | | | | |
| Alfa S.A de C.V., “A” | | | 11,600 | | | $ | 32,699 | |
6
Portfolio of Investments (unaudited) – continued
| | | | | | | | |
| Issuer | | Shares/Par | | | Value ($) | |
| | | | | | | | |
| Common Stocks - continued | | | | | | | | |
| Construction - 0.8% | | | | | | | | |
| Duratex S.A. | | | 6,200 | | | $ | 30,444 | |
| | |
| Consumer Products - 0.8% | | | | | | | | |
| Kimberly-Clark de Mexico S.A. de C.V., “A” | | | 12,350 | | | $ | 31,489 | |
| | |
| Consumer Services - 9.0% | | | | | | | | |
| Abril Educacao S.A., IEU | | | 2,840 | | | $ | 33,869 | |
| Anhanguera Educacional Participacoes S.A. | | | 15,500 | | | | 81,571 | |
| Estacio Participacoes S.A. | | | 13,750 | | | | 106,604 | |
| Kroton Educacional S.A. | | | 8,234 | | | | 125,834 | |
| | | | | | | | |
| | | | | | | $ | 347,878 | |
| Energy - Independent - 1.4% | | | | | | | | |
| Ultrapar Participacoes S.A. | | | 2,400 | | | $ | 53,007 | |
| | |
| Energy - Integrated - 4.1% | | | | | | | | |
| Petroleo Brasileiro S.A., ADR | | | 14,024 | | | $ | 157,209 | |
| | |
| Engineering - Construction - 2.1% | | | | | | | | |
| Mills Estruturas e Servicos de Engenharia S.A. | | | 4,200 | | | $ | 48,714 | |
| Promotora y Operadora de Infraestructura S.A.B. de C.V. (a) | | | 2,600 | | | | 31,616 | |
| | | | | | | | |
| | | | | | | $ | 80,330 | |
| Food & Beverages - 5.0% | | | | | | | | |
| Arca Continental S.A.B de C.V. | | | 13,895 | | | $ | 76,291 | |
| BRF S.A. | | | 1,600 | | | | 28,668 | |
| M. Dias Branco S.A. Industria e Comercio de Alimentos | | | 2,600 | | | | 88,895 | |
| | | | | | | | |
| | | | | | | $ | 193,854 | |
| Food & Drug Stores - 0.8% | | | | | | | | |
| Brazil Pharma S.A. (a) | | | 14,700 | | | $ | 30,579 | |
| | |
| Forest & Paper Products - 1.5% | | | | | | | | |
| Fibria Celulose S.A. (a) | | | 5,100 | | | $ | 57,166 | |
| | |
| General Merchandise - 0.5% | | | | | | | | |
| Lojas Renner S.A. | | | 800 | | | $ | 18,375 | |
| | |
| Health Maintenance Organizations - 2.7% | | | | | | | | |
| OdontoPrev S.A. | | | 17,300 | | | $ | 64,519 | |
| Qualicorp S.A. (a) | | | 4,800 | | | | 40,755 | |
| | | | | | | | |
| | | | | | | $ | 105,274 | |
7
Portfolio of Investments (unaudited) – continued
| | | | | | | | |
| Issuer | | Shares/Par | | | Value ($) | |
| | | | | | | | |
| Common Stocks - continued | | | | | | | | |
| Insurance - 2.4% | | | | | | | | |
| Brasil Insurance Participacoes e Administracao S.A. | | | 11,600 | | | $ | 91,089 | |
| | |
| Metals & Mining - 13.7% | | | | | | | | |
| Gerdau S.A., ADR | | | 16,001 | | | $ | 112,807 | |
| Grupo Mexico S.A.B. de C.V., “B” | | | 31,437 | | | | 101,758 | |
| Ternium S.A., ADR | | | 1,738 | | | | 51,758 | |
| Usinas Siderurgicas de Minas Gerais S.A., IPS (a) | | | 7,800 | | | | 38,463 | |
| Vale S.A., ADR | | | 16,386 | | | | 222,850 | |
| | | | | | | | |
| | | | | | | $ | 527,636 | |
| Oil Services - 2.5% | | | | | | | | |
| Tenaris S.A., ADR | | | 2,179 | | | $ | 96,922 | |
| | |
| Other Banks & Diversified Financials - 11.6% | | | | | | | | |
| Banco Santander Chile, ADR | | | 679 | | | $ | 13,227 | |
| Banco Santander S.A., IEU | | | 14,400 | | | | 67,189 | |
| Credicorp Ltd. | | | 881 | | | | 116,222 | |
| Gentera S.A.B. de C.V. | | | 13,000 | | | | 23,329 | |
| Grupo Financiero Banorte S.A. de C.V. | | | 12,900 | | | | 81,428 | |
| Itau Unibanco Holding S.A., ADR | | | 11,959 | | | | 146,378 | |
| | | | | | | | |
| | | | | | | $ | 447,773 | |
| Pharmaceuticals - 2.4% | | | | | | | | |
| Genomma Lab Internacional S.A., “B” (a) | | | 36,900 | | | $ | 91,298 | |
| | |
| Railroad & Shipping - 1.1% | | | | | | | | |
| All America Latina Logistica S.A. | | | 8,600 | | | $ | 23,556 | |
| CCR S.A. | | | 3,140 | | | | 20,220 | |
| | | | | | | | |
| | | | | | | $ | 43,776 | |
| Real Estate - 5.8% | | | | | | | | |
| Brasil Brokers Participacoes | | | 23,400 | | | $ | 49,258 | |
| Concentradora Fibra Danhos S.A. de C.V., REIT (a) | | | 21,200 | | | | 40,057 | |
| Concentradora Fibra Hotelera Mexicana S.A. de C.V., REIT | | | 28,800 | | | | 46,493 | |
| Macquarie Mexico Real Estate S.A. de C.V., REIT | | | 32,100 | | | | 58,708 | |
| Multiplan Empreendimentos Imobiliarios S.A. | | | 1,626 | | | | 29,384 | |
| | | | | | | | |
| | | | | | | $ | 223,900 | |
| Telecommunications - Wireless - 4.0% | | | | | | | | |
| America Movil S.A.B. de C.V., “L”, ADR | | | 6,082 | | | $ | 129,303 | |
| TIM Participacoes S.A., ADR | | | 974 | | | | 25,353 | |
| | | | | | | | |
| | | | | | | $ | 154,656 | |
| Telephone Services - 1.2% | | | | | | | | |
| Telefonica Brasil S.A., ADR | | | 2,500 | | | $ | 47,500 | |
8
Portfolio of Investments (unaudited) – continued
| | | | | | | | |
| Issuer | | Shares/Par | | | Value ($) | |
| | | | | | | | |
| Common Stocks - continued | | | | | | | | |
| Utilities - Electric Power - 4.2% | | | | | | | | |
| Alupar Investimento S.A., IEU (a) | | | 7,500 | | | $ | 48,451 | |
| Energias do Brasil S.A. | | | 18,200 | | | | 72,777 | |
| Tractebel Energia S.A. | | | 2,830 | | | | 40,458 | |
| | | | | | | | |
| | | | | | | $ | 161,686 | |
| Utilities - Water - 1.0% | | | | | | | | |
| Aguas Andinas S.A. | | | 58,905 | | | $ | 37,649 | |
| Total Common Stocks (Identified Cost, $4,002,566) | | | | | | $ | 3,805,662 | |
| | |
| Money Market Funds - 1.6% | | | | | | | | |
MFS Institutional Money Market Portfolio, 0.09%,
at Cost and Net Asset Value (v) | | | 63,742 | | | $ | 63,742 | |
| Total Investments (Identified Cost, $4,066,308) | | | | | | $ | 3,869,404 | |
| | |
| Other Assets, Less Liabilities - (0.1)% | | | | | | | (4,492 | ) |
| Net Assets - 100.0% | | | | | | $ | 3,864,912 | |
| (a) | Non-income producing security. |
| (v) | Underlying affiliated fund that is available only to investment companies managed by MFS. The rate quoted for the MFS Institutional Money Market Portfolio is the annualized seven-day yield of the fund at period end. |
The following abbreviations are used in this report and are defined:
| ADR | | American Depositary Receipt |
| IEU | | International Equity Unit |
| IPS | | International Preference Stock |
| REIT | | Real Estate Investment Trust |
See Notes to Financial Statements
9
Financial Statements
STATEMENT OF ASSETS AND LIABILITIES
At 1/31/14 (unaudited)
This statement represents your fund’s balance sheet, which details the assets and liabilities comprising the total value of the fund.
| | | | |
| Assets | | | | |
Investments- | | | | |
Non-affiliated issuers, at value (identified cost, $4,002,566) | | | $3,805,662 | |
Underlying affiliated funds, at cost and value | | | 63,742 | |
Total investments, at value (identified cost, $4,066,308) | | | $3,869,404 | |
Cash | | | 916 | |
Foreign currency, at value (identified cost, $95) | | | 95 | |
Receivables for | | | | |
Fund shares sold | | | 14,813 | |
Interest and dividends | | | 7,177 | |
Receivable from investment adviser | | | 24,595 | |
Other assets | | | 126 | |
Total assets | | | $3,917,126 | |
| Liabilities | | | | |
Payable for fund shares reacquired | | | $1,288 | |
Payable to affiliates | | | | |
Shareholder servicing costs | | | 2,462 | |
Distribution and service fees | | | 26 | |
Payable for independent Trustees’ compensation | | | 139 | |
Deferred country tax expense payable | | | 2,342 | |
Accrued expenses and other liabilities | | | 45,957 | |
Total liabilities | | | $52,214 | |
Net assets | | | $3,864,912 | |
| Net assets consist of | | | | |
Paid-in capital | | | $4,899,823 | |
Unrealized appreciation (depreciation) on investments and translation of assets and liabilities in foreign currencies (net of $22 deferred country tax) | | | (197,151 | ) |
Accumulated net realized gain (loss) on investments and foreign currency | | | (852,535 | ) |
Undistributed net investment income | | | 14,775 | |
Net assets | | | $3,864,912 | |
Shares of beneficial interest outstanding | | | 469,144 | |
| | | | | | | | | | | | |
| | | Net assets | | | Shares
outstanding | | | Net asset value
per share (a) | |
Class A | | | $2,339,017 | | | | 283,148 | | | | $8.26 | |
Class B | | | 287,446 | | | | 35,157 | | | | 8.18 | |
Class C | | | 663,130 | | | | 81,357 | | | | 8.15 | |
Class I | �� | | 575,319 | | | | 69,482 | | | | 8.28 | |
| (a) | Maximum offering price per share was equal to the net asset value per share for all share classes, except for Class A, for which the maximum offering price per share was $8.76 [100 / 94.25 x $8.26]. On sales of $50,000 or more, the maximum offering price of Class A shares is reduced. A contingent deferred sales charge may be imposed on redemptions of Class A, Class B, and Class C shares. Redemption price per share was equal to the net asset value per share for Class I. |
See Notes to Financial Statements
10
Financial Statements
STATEMENT OF OPERATIONS
Six months ended 1/31/14 (unaudited)
This statement describes how much your fund earned in investment income and accrued in expenses. It also describes any gains and/or losses generated by fund operations.
| | | | |
| Net investment income | | | | |
Income | | | | |
Dividends | | | $55,205 | |
Dividends from underlying affiliated funds | | | 23 | |
Foreign taxes withheld | | | (2,377 | ) |
Total investment income | | | $52,851 | |
Expenses | | | | |
Management fee | | | $21,768 | |
Distribution and service fees | | | 7,891 | |
Shareholder servicing costs | | | 4,286 | |
Administrative services fee | | | 8,823 | |
Independent Trustees’ compensation | | | 550 | |
Custodian fee | | | 33,254 | |
Shareholder communications | | | 5,709 | |
Audit and tax fees | | | 26,912 | |
Legal fees | | | 2,123 | |
Registration fees | | | 28,000 | |
Miscellaneous | | | 5,551 | |
Total expenses | | | $144,867 | |
Reduction of expenses by investment adviser and distributor | | | (108,257 | ) |
Net expenses | | | $36,610 | |
Net investment income | | | $16,241 | |
| Realized and unrealized gain (loss) on investments and foreign currency | | | | |
Realized gain (loss) (identified cost basis) | | | | |
Investments | | | $(201,664 | ) |
Foreign currency | | | (1,263 | ) |
Net realized gain (loss) on investments and foreign currency | | | $(202,927 | ) |
Change in unrealized appreciation (depreciation) | | | | |
Investments (net of $2,799 decrease in deferred country tax) | | | $(152,114 | ) |
Translation of assets and liabilities in foreign currencies | | | 491 | |
Net unrealized gain (loss) on investments and foreign currency translation | | | $(151,623 | ) |
Net realized and unrealized gain (loss) on investments and foreign currency | | | $(354,550 | ) |
Change in net assets from operations | | | $(338,309 | ) |
See Notes to Financial Statements
11
Financial Statements
STATEMENTS OF CHANGES IN NET ASSETS
These statements describe the increases and/or decreases in net assets resulting from operations, any distributions, and any shareholder transactions.
| | | | | | | | |
| | | Six months ended
1/31/14 | | | Year ended
7/31/13 | |
| Change in net assets | | (unaudited) | | | | |
| From operations | | | | | | | | |
Net investment income | | | $16,241 | | | | $31,203 | |
Net realized gain (loss) on investments and foreign currency | | | (202,927 | ) | | | (269,771 | ) |
Net unrealized gain (loss) on investments and foreign currency translation | | | (151,623 | ) | | | 90,213 | |
Change in net assets from operations | | | $(338,309 | ) | | | $(148,355 | ) |
| Distributions declared to shareholders | | | | | | | | |
From net investment income | | | $(29,002 | ) | | | $(41,001 | ) |
Change in net assets from fund share transactions | | | $(122,069 | ) | | | $612,159 | |
Total change in net assets | | | $(489,380 | ) | | | $422,803 | |
| Net assets | | | | | | | | |
At beginning of period | | | 4,354,292 | | | | 3,931,489 | |
At end of period (including undistributed net investment income of $14,775 and $27,536, respectively) | | | $3,864,912 | | | | $4,354,292 | |
See Notes to Financial Statements
12
Financial Statements
FINANCIAL HIGHLIGHTS
The financial highlights table is intended to help you understand the fund’s financial performance for the semiannual period and the past 5 fiscal years (or life of a particular share class, if shorter). Certain information reflects financial results for a single fund share. The total returns in the table represent the rate by which an investor would have earned (or lost) on an investment in the fund share class (assuming reinvestment of all distributions) held for the entire period.
| | | | | | | | | | | | | | | | |
| | | Six months
ended
1/31/14 | | | Years
ended 7/31 | | | Period
ended
7/31/11 (c) | |
| Class A | | | 2013 | | | 2012 | | |
| | | (unaudited) | | | | | | | | | | |
Net asset value, beginning of period | | | $9.06 | | | | $9.23 | | | | $10.77 | | | | $10.00 | |
| Income (loss) from investment operations | | | | | | | | | | | | | |
Net investment income (d) | | | $0.04 | | | | $0.08 | | | | $0.15 | | | | $0.18 | |
Net realized and unrealized gain (loss)
on investments and foreign currency | | | (0.76 | ) | | | (0.14 | ) | | | (1.56 | ) | | | 0.59 | (g) |
Total from investment operations | | | $(0.72 | ) | | | $(0.06 | ) | | | $(1.41 | ) | | | $0.77 | |
| Less distributions declared to shareholders | | | | | | | | | | | | | |
From net investment income | | | $(0.08 | ) | | | $(0.11 | ) | | | $(0.01 | ) | | | $— | |
From net realized gain on investments | | | — | | | | — | | | | (0.12 | ) | | | — | |
Total distributions declared to shareholders | | | $(0.08 | ) | | | $(0.11 | ) | | | $(0.13 | ) | | | $— | |
Net asset value, end of period (x) | | | $8.26 | | | | $9.06 | | | | $9.23 | | | | $10.77 | |
Total return (%) (r)(s)(t)(x) | | | (8.05 | )(n) | | | (0.80 | ) | | | (13.02 | ) | | | 7.70 | (n) |
Ratios (%) (to average net assets)
and Supplemental data: | | | | | | | | | | | | | | | | |
Expenses before expense reductions (f) | | | 6.88 | (a) | | | 5.95 | | | | 8.56 | | | | 9.38 | (a) |
Expenses after expense reductions (f) | | | 1.62 | (a) | | | 1.63 | | | | 1.65 | | | | 1.65 | (a) |
Net investment income | | | 0.93 | (a)(l) | | | 0.76 | | | | 1.55 | | | | 1.83 | (a) |
Portfolio turnover | | | 39 | (n) | | | 49 | | | | 56 | | | | 30 | (n) |
Net assets at end of period (000 omitted) | | | $2,339 | | | | $2,226 | | | | $2,132 | | | | $1,490 | |
See Notes to Financial Statements
13
Financial Highlights – continued
| | | | | | | | | | | | | | | | |
| | | Six months
ended
1/31/14 | | | Years
ended 7/31 | | | Period
ended
7/31/11 (c) | |
| Class B | | | 2013 | | | 2012 | | |
| | | (unaudited) | | | | | | | | | | |
Net asset value, beginning of period | | | $8.94 | | | | $9.11 | | | | $10.71 | | | | $10.00 | |
| Income (loss) from investment operations | | | | | | | | | | | | | |
Net investment income (loss) (d) | | | $0.01 | | | | $(0.01 | ) | | | $0.07 | | | | $0.12 | |
Net realized and unrealized gain (loss)
on investments and foreign currency | | | (0.77 | ) | | | (0.13 | ) | | | (1.55 | ) | | | 0.59 | (g) |
Total from investment operations | | | $(0.76 | ) | | | $(0.14 | ) | | | $(1.48 | ) | | | $0.71 | |
| Less distributions declared to shareholders | | | | | | | | | | | | | |
From net investment income | | | $— | | | | $(0.03 | ) | | | $— | | | | $— | |
From net realized gain on investments | | | — | | | | — | | | | (0.12 | ) | | | — | |
Total distributions declared to shareholders | | | $— | | | | $(0.03 | ) | | | $(0.12 | ) | | | $— | |
Net asset value, end of period (x) | | | $8.18 | | | | $8.94 | | | | $9.11 | | | | $10.71 | |
Total return (%) (r)(s)(t)(x) | | | (8.50 | )(n) | | | (1.55 | ) | | | (13.72 | ) | | | 7.10 | (n) |
Ratios (%) (to average net assets)
and Supplemental data: | | | | | | | | | | | | | | | | |
Expenses before expense reductions (f) | | | 7.56 | (a) | | | 6.77 | | | | 9.37 | | | | 9.76 | (a) |
Expenses after expense reductions (f) | | | 2.40 | (a) | | | 2.40 | | | | 2.40 | | | | 2.40 | (a) |
Net investment income (loss) | | | 0.13 | (a)(l) | | | (0.08 | ) | | | 0.80 | | | | 1.26 | (a) |
Portfolio turnover | | | 39 | (n) | | | 49 | | | | 56 | | | | 30 | (n) |
Net assets at end of period (000 omitted) | | | $287 | | | | $431 | | | | $562 | | | | $542 | |
See Notes to Financial Statements
14
Financial Highlights – continued
| | | | | | | | | | | | | | | | |
| | | Six months
ended
1/31/14 | | | Years
ended 7/31 | | | Period
ended
7/31/11 (c) | |
| Class C | | | 2013 | | | 2012 | | |
| | | (unaudited) | | | | | | | | | | |
Net asset value, beginning of period | | | $8.93 | | | | $9.12 | | | | $10.71 | | | | $10.00 | |
| Income (loss) from investment operations | | | | | | | | | | | | | |
Net investment income (d) | | | $0.01 | | | | $0.00 | (w) | | | $0.08 | | | | $0.12 | |
Net realized and unrealized gain (loss)
on investments and foreign currency | | | (0.77 | ) | | | (0.13 | ) | | | (1.55 | ) | | | 0.59 | (g) |
Total from investment operations | | | $(0.76 | ) | | | $(0.13 | ) | | | $(1.47 | ) | | | $0.71 | |
| Less distributions declared to shareholders | | | | | | | | | | | | | |
From net investment income | | | $(0.02 | ) | | | $(0.06 | ) | | | $— | | | | $— | |
From net realized gain on investments | | | — | | | | — | | | | (0.12 | ) | | | — | |
Total distributions declared to shareholders | | | $(0.02 | ) | | | $(0.06 | ) | | | $(0.12 | ) | | | $— | |
Net asset value, end of period (x) | | | $8.15 | | | | $8.93 | | | | $9.12 | | | | $10.71 | |
Total return (%) (r)(s)(t)(x) | | | (8.51 | )(n) | | | (1.45 | ) | | | (13.63 | ) | | | 7.10 | (n) |
Ratios (%) (to average net assets)
and Supplemental data: | | | | | | | | | | | | | | | | |
Expenses before expense reductions (f) | | | 7.70 | (a) | | | 6.68 | | | | 9.33 | | | | 10.51 | (a) |
Expenses after expense reductions (f) | | | 2.40 | (a) | | | 2.40 | | | | 2.40 | | | | 2.40 | (a) |
Net investment income | | | 0.22 | (a)(l) | | | 0.02 | | | | 0.82 | | | | 1.25 | (a) |
Portfolio turnover | | | 39 | (n) | | | 49 | | | | 56 | | | | 30 | (n) |
Net assets at end of period (000 omitted) | | | $663 | | | | $504 | | | | $355 | | | | $263 | |
See Notes to Financial Statements
15
Financial Highlights – continued
| | | | | | | | | | | | | | | | |
| | | Six months
ended
1/31/14 | | | Years
ended 7/31 | | | Period
ended
7/31/11 (c) | |
| Class I | | | 2013 | | | 2012 | | |
| | | (unaudited) | | | | | | | | | | |
Net asset value, beginning of period | | | $9.10 | | | | $9.27 | | | | $10.80 | | | | $10.00 | |
| Income (loss) from investment operations | | | | | | | | | | | | | |
Net investment income (d) | | | $0.05 | | | | $0.12 | | | | $0.19 | | | | $0.18 | |
Net realized and unrealized gain (loss)
on investments and foreign currency | | | (0.77 | ) | | | (0.16 | ) | | | (1.58 | ) | | | 0.62 | (g) |
Total from investment operations | | | $(0.72 | ) | | | $(0.04 | ) | | | $(1.39 | ) | | | $0.80 | |
| Less distributions declared to shareholders | | | | | | | | | | | | | |
From net investment income | | | $(0.10 | ) | | | $(0.13 | ) | | | $(0.02 | ) | | | $— | |
From net realized gain on investments | | | — | | | | — | | | | (0.12 | ) | | | — | |
Total distributions declared to shareholders | | | $(0.10 | ) | | | $(0.13 | ) | | | $(0.14 | ) | | | $— | |
Net asset value, end of period (x) | | | $8.28 | | | | $9.10 | | | | $9.27 | | | | $10.80 | |
Total return (%) (r)(s)(x) | | | (8.03 | )(n) | | | (0.60 | ) | | | (12.74 | ) | | | 8.00 | (n) |
Ratios (%) (to average net assets)
and Supplemental data: | | | | | | | | | | | | | | | | |
Expenses before expense reductions (f) | | | 6.49 | (a) | | | 5.61 | | | | 8.31 | | | | 10.71 | (a) |
Expenses after expense reductions (f) | | | 1.40 | (a) | | | 1.40 | | | | 1.40 | | | | 1.40 | (a) |
Net investment income | | | 1.07 | (a)(l) | | | 1.17 | | | | 1.98 | | | | 1.93 | (a) |
Portfolio turnover | | | 39 | (n) | | | 49 | | | | 56 | | | | 30 | (n) |
Net assets at end of period (000 omitted) | | | $575 | | | | $1,193 | | | | $883 | | | | $807 | |
| (c) | For the period from the commencement of the fund’s investment operations, September 15, 2010, through the stated period end. |
| (d) | Per share data is based on average shares outstanding. |
| (f) | Ratios do not reflect reductions from fees paid indirectly, if applicable. |
| (g) | The per share amount varies from the net realized and unrealized gain/loss for the period because of the timing of sales of fund shares and the per share amount of realized and unrealized gains and losses at such time. |
| (l) | Recognition of net investment income by the fund may be affected by the timing of the declaration of dividends by companies in which the fund invests and the actual annual net investment income ratio may differ. |
| (r) | Certain expenses have been reduced without which performance would have been lower. |
| (s) | From time to time the fund may receive proceeds from litigation settlements, without which performance would be lower. |
| (t) | Total returns do not include any applicable sales charges. |
| (w) | Per share amount was less than $0.01. |
| (x) | The net asset values per share and total returns have been calculated on net assets which include adjustments made in accordance with U.S. generally accepted accounting principles required at period end for financial reporting purposes. |
See Notes to Financial Statements
16
NOTES TO FINANCIAL STATEMENTS
(unaudited)
(1) Business and Organization
MFS Latin American Equity Fund (the fund) is a series of MFS Series Trust VII (the trust). The trust is organized as a Massachusetts business trust and is registered under the Investment Company Act of 1940, as amended, as an open-end management investment company.
(2) Significant Accounting Policies
General – The preparation of financial statements in conformity with U.S. generally accepted accounting principles requires management to make estimates and assumptions that affect the reported amounts of assets and liabilities, and disclosure of contingent assets and liabilities at the date of the financial statements and the reported amounts of increases and decreases in net assets from operations during the reporting period. Actual results could differ from those estimates. In the preparation of these financial statements, management has evaluated subsequent events occurring after the date of the fund’s Statement of Assets and Liabilities through the date that the financial statements were issued. The fund invests in foreign securities, including securities of emerging market issuers. Investments in foreign securities are vulnerable to the effects of changes in the relative values of the local currency and the U.S. dollar and to the effects of changes in each country’s legal, political, and economic environment. The markets of emerging markets countries are generally more volatile than the markets of developed countries with more mature economies. All of the risks of investing in foreign securities previously described are heightened when investing in emerging markets countries. The fund’s performance could be closely tied to the market, currency, economic, political, regulatory, geopolitical, or other conditions in the countries or regions in which the fund invests and could be more volatile than the performance of more geographically-diversified funds.
The fund may invest between 25% and 35% of its total assets in the securities of issuers in any particular industry if, at the time of investment, that industry represents 20% or more of the Latin American market as a whole, as measured by an index determined by MFS to be an appropriate measure of the Latin American market. At January 31, 2014, the fund did not have more than 25% of its assets invested in any one industry.
In this reporting period, the fund adopted the disclosure provisions of the Financial Accounting Standards Board (FASB) Accounting Standards Update 2011-11 (“ASU 2011-11”), Balance Sheet (Topic 210) – Disclosures about Offsetting Assets and Liabilities along with the related scope clarification provisions of FASB Accounting Standards Update 2013-01 (“ASU 2013-01”) entitled Balance Sheet (Topic 210) –Clarifying the Scope of Disclosures about Offsetting Assets and Liabilities. ASU 2011-11 is intended to enhance disclosures on the offsetting of financial assets and liabilities by requiring entities to disclose both gross and net information about financial instruments and transactions that are either offset in the statement of financial position or subject to an enforceable Master Netting Agreement or similar arrangement. ASU 2013-01 limits the scope of ASU 2011-11’s disclosure requirements on offsetting to financial assets and financial liabilities related to derivatives, repurchase and reverse
17
Notes to Financial Statements (unaudited) – continued
repurchase agreements, and securities lending and securities borrowing transactions. The disclosures required by ASU 2011-11, to the extent applicable to the fund, have been included in the fund’s Significant Accounting Policies note under the captions for each of the fund’s in-scope financial instruments and transactions.
In June 2013, FASB issued Accounting Standards Update 2013-08 (“ASU 2013-08”) Financial Services – Investment Companies (Topic 946) – Amendments to the Scope, Measurement, and Disclosure Requirements which is effective for interim and annual reporting periods in fiscal years that begin after December 15, 2013. ASU 2013-08 sets forth a methodology for determining whether an entity should be characterized as an investment company and prescribes fair value accounting for an investment company’s non-controlling ownership interest in another investment company. FASB has determined that a fund registered under the Investment Company Act of 1940 automatically meets ASU 2013-08’s criteria for an investment company. Although still evaluating the potential impacts of ASU 2013-08 to the fund, management expects that the impact of the fund’s adoption will be limited to additional financial statement disclosures.
Investment Valuations – Equity securities, including restricted equity securities, are generally valued at the last sale or official closing price as provided by a third-party pricing service on the market or exchange on which they are primarily traded. Equity securities, for which there were no sales reported that day, are generally valued at the last quoted daily bid quotation as provided by a third-party pricing service on the market or exchange on which such securities are primarily traded. Short-term instruments with a maturity at issuance of 60 days or less generally are valued at amortized cost, which approximates market value. Open-end investment companies are generally valued at net asset value per share. Securities and other assets generally valued on the basis of information from a third-party pricing service may also be valued at a broker/dealer bid quotation. Values obtained from third-party pricing services can utilize both transaction data and market information such as yield, quality, coupon rate, maturity, type of issue, trading characteristics, and other market data. The values of foreign securities and other assets and liabilities expressed in foreign currencies are converted to U.S. dollars using the mean of bid and asked prices for rates provided by a third-party pricing service.
The Board of Trustees has delegated primary responsibility for determining or causing to be determined the value of the fund’s investments (including any fair valuation) to the adviser pursuant to valuation policies and procedures approved by the Board. If the adviser determines that reliable market quotations are not readily available, investments are valued at fair value as determined in good faith by the adviser in accordance with such procedures under the oversight of the Board of Trustees. Under the fund’s valuation policies and procedures, market quotations are not considered to be readily available for most types of debt instruments and floating rate loans and many types of derivatives. These investments are generally valued at fair value based on information from third-party pricing services. In addition, investments may be valued at fair value if the adviser determines that an investment’s value has been materially affected by events occurring after the close of the exchange or market on which the investment is principally traded (such as foreign exchange or market) and prior to the determination of the fund’s net asset value, or after the halting of trading of a specific security where
18
Notes to Financial Statements (unaudited) – continued
trading does not resume prior to the close of the exchange or market on which the security is principally traded. Events that occur on a frequent basis after foreign markets close (such as developments in foreign markets and significant movements in the U.S. markets) and prior to the determination of the fund’s net asset value may be deemed to have a material effect on the value of securities traded in foreign markets. Accordingly, the fund’s foreign equity securities may often be valued at fair value. The adviser generally relies on third-party pricing services or other information (such as the correlation with price movements of similar securities in the same or other markets; the type, cost and investment characteristics of the security; the business and financial condition of the issuer; and trading and other market data) to assist in determining whether to fair value and at what value to fair value an investment. The value of an investment for purposes of calculating the fund’s net asset value can differ depending on the source and method used to determine value. When fair valuation is used, the value of an investment used to determine the fund’s net asset value may differ from quoted or published prices for the same investment. There can be no assurance that the fund could obtain the fair value assigned to an investment if it were to sell the investment at the same time at which the fund determines its net asset value per share.
Various inputs are used in determining the value of the fund’s assets or liabilities. These inputs are categorized into three broad levels. In certain cases, the inputs used to measure fair value may fall into different levels of the fair value hierarchy. In such cases, an investment’s level within the fair value hierarchy is based on the lowest level of input that is significant to the fair value measurement. The fund’s assessment of the significance of a particular input to the fair value measurement in its entirety requires judgment, and considers factors specific to the investment. Level 1 includes unadjusted quoted prices in active markets for identical assets or liabilities. Level 2 includes other significant observable market-based inputs (including quoted prices for similar securities, interest rates, prepayment speed, and credit risk). Level 3 includes unobservable inputs, which may include the adviser’s own assumptions in determining the fair value of investments. The following is a summary of the levels used as of January 31, 2014 in valuing the fund’s assets or liabilities:
| | | | | | | | | | | | | | | | |
| Investments at Value | | Level 1 | | | Level 2 | | | Level 3 | | | Total | |
| Equity Securities | | | $3,805,662 | | | | $— | | | | $— | | | | $3,805,662 | |
| Mutual Funds | | | 63,742 | | | | — | | | | — | | | | 63,742 | |
| Total Investments | | | $3,869,404 | | | | $— | | | | $— | | | | $3,869,404 | |
For further information regarding security characteristics, see the Portfolio of Investments.
Foreign Currency Translation – Purchases and sales of foreign investments, income, and expenses are converted into U.S. dollars based upon currency exchange rates prevailing on the respective dates of such transactions or on the reporting date for foreign denominated receivables and payables. Gains and losses attributable to foreign currency exchange rates on sales of securities are recorded for financial statement purposes as net realized gains and losses on investments. Gains and losses attributable to foreign exchange rate movements on receivables, payables, income and expenses are recorded for financial statement purposes as foreign currency transaction gains and
19
Notes to Financial Statements (unaudited) – continued
losses. That portion of both realized and unrealized gains and losses on investments that results from fluctuations in foreign currency exchange rates is not separately disclosed.
Indemnifications – Under the fund’s organizational documents, its officers and Trustees may be indemnified against certain liabilities and expenses arising out of the performance of their duties to the fund. Additionally, in the normal course of business, the fund enters into agreements with service providers that may contain indemnification clauses. The fund’s maximum exposure under these agreements is unknown as this would involve future claims that may be made against the fund that have not yet occurred.
Investment Transactions and Income – Investment transactions are recorded on the trade date. Dividends received in cash are recorded on the ex-dividend date. Certain dividends from foreign securities will be recorded when the fund is informed of the dividend if such information is obtained subsequent to the ex-dividend date. Dividend payments received in additional securities are recorded on the ex-dividend date in an amount equal to the value of the security on such date.
The fund may receive proceeds from litigation settlements. Any proceeds received from litigation involving portfolio holdings are reflected in the Statement of Operations in realized gain/loss if the security has been disposed of by the fund or in unrealized gain/loss if the security is still held by the fund. Any other proceeds from litigation not related to portfolio holdings are reflected as other income in the Statement of Operations.
Fees Paid Indirectly – The fund’s custody fee may be reduced according to an arrangement that measures the value of cash deposited with the custodian by the fund. For the six months ended January 31, 2014, custody fees were not reduced.
Tax Matters and Distributions – The fund intends to qualify as a regulated investment company, as defined under Subchapter M of the Internal Revenue Code, and to distribute all of its taxable income, including realized capital gains. As a result, no provision for federal income tax is required. The fund’s federal tax returns, when filed, will remain subject to examination by the Internal Revenue Service for a three year period. Management has analyzed the fund’s tax positions taken on federal and state tax returns for all open tax years and does not believe that there are any uncertain tax positions that require recognition of a tax liability. Foreign taxes, if any, have been accrued by the fund in the accompanying financial statements in accordance with the applicable foreign tax law. Foreign income taxes may be withheld by certain countries in which the fund invests. Additionally, capital gains realized by the fund on securities issued in or by certain foreign countries may be subject to capital gains tax imposed by those countries.
Distributions to shareholders are recorded on the ex-dividend date. Income and capital gain distributions are determined in accordance with income tax regulations, which may differ from U.S. generally accepted accounting principles. Certain capital accounts in the financial statements are periodically adjusted for permanent differences in order to reflect their tax character. These adjustments have no impact on net assets or net asset value per share. Temporary differences which arise from recognizing certain items of income, expense, gain or loss in different periods for financial statement and tax
20
Notes to Financial Statements (unaudited) – continued
purposes will reverse at some time in the future. Distributions in excess of net investment income or net realized gains are temporary overdistributions for financial statement purposes resulting from differences in the recognition or classification of income or distributions for financial statement and tax purposes.
Book/tax differences primarily relate to wash sale loss deferrals.
The tax character of distributions made during the current period will be determined at fiscal year end. The tax character of distributions declared to shareholders for the last fiscal year is as follows:
| | | | |
| | | 7/31/13 | |
Ordinary income (including any
short-term capital gains) | | | $41,001 | |
The federal tax cost and the tax basis components of distributable earnings were as follows:
| | | | |
| As of 1/31/14 | | | |
| Cost of investments | | | $4,432,875 | |
| Gross appreciation | | | 397,469 | |
| Gross depreciation | | | (960,940 | ) |
| Net unrealized appreciation (depreciation) | | | $(563,471 | ) |
| |
| As of 7/31/13 | | | |
| Undistributed ordinary income | | | 27,693 | |
| Capital loss carryforwards | | | (171,695 | ) |
| Post-October capital loss deferrals | | | (106,378 | ) |
| Other temporary differences | | | (8,662 | ) |
| Net unrealized appreciation (depreciation) | | | (408,558 | ) |
As of July 31, 2013, the fund had capital loss carryforwards available to offset future realized gains. Such losses are characterized as follows:
| | | | |
| Short-Term | | | $(73,346 | ) |
| Long-Term | | | (98,349 | ) |
| Total | | | $(171,695 | ) |
Under the Regulated Investment Company Modernization Act of 2010 (the “Act”), the above net capital losses may be carried forward indefinitely, and their character is retained as short-term and/or long-term losses. Previously, net capital losses were carried forward for eight years and treated as short-term losses.
Multiple Classes of Shares of Beneficial Interest – The fund offers multiple classes of shares, which differ in their respective distribution and service fees. The fund’s income, realized and unrealized gain (loss), and common expenses are allocated to shareholders based on the daily net assets of each class. Dividends are declared separately for each class. Differences in per share dividend rates are generally due to differences in separate class expenses. Class B shares will convert to Class A shares
21
Notes to Financial Statements (unaudited) – continued
approximately eight years after purchase. The fund’s distributions declared to shareholders as reported in the Statements of Changes in Net Assets are presented by class as follows:
| | | | | | | | |
| | | From net investment
income | |
| | | Six months
ended
1/31/14 | | | Year
ended
7/31/13 | |
| Class A | | | $21,570 | | | | $25,388 | |
| Class B | | | — | | | | 1,943 | |
| Class C | | | 1,338 | | | | 2,981 | |
| Class I | | | 6,094 | | | | 10,689 | |
| Total | | | $29,002 | | | | $41,001 | |
(3) Transactions with Affiliates
Investment Adviser – The fund has an investment advisory agreement with MFS to provide overall investment management and related administrative services and facilities to the fund. The management fee is computed daily and paid monthly at the following annual rates:
| | | | |
| First $1 billion of average daily net assets | | | 1.05 | % |
| Next $1.5 billion of average daily net assets | | | 0.95 | % |
| Average daily net assets in excess of $2.5 billion | | | 0.90 | % |
MFS has agreed in writing to reduce its management fee by a specified amount if certain MFS mutual fund assets exceed thresholds agreed to by MFS and the fund’s Board of Trustees. For the six months ended January 31, 2014 this management fee reduction amounted to $39, which is included in the reduction of total expenses in the Statement of Operations. The management fee incurred for the six months ended January 31, 2014 was equivalent to an annual effective rate of 1.05% of the fund’s average daily net assets.
The investment adviser has agreed in writing to pay a portion of the fund’s total annual operating expenses, exclusive of interest, taxes, extraordinary expenses, brokerage and transaction costs, and investment-related expenses, such that total fund operating expenses do not exceed the following rates annually of each class’s average daily net assets:
| | | | | | | | | | | | | | |
| Class A | | | Class B | | | Class C | | | Class I | |
| | 1.65% | | | | 2.40 | % | | | 2.40 | % | | | 1.40 | % |
This written agreement will continue until modified by the fund’s Board of Trustees, but such agreement will continue at least until November 30, 2014. For the six months ended January 31, 2014, this reduction amounted to $107,863 and is included in the reduction of total expenses in the Statement of Operations.
Distributor – MFS Fund Distributors, Inc. (MFD), a wholly-owned subsidiary of MFS, as distributor, received $1,999 for the six months ended January 31, 2014, as its portion of the initial sales charge on sales of Class A shares of the fund.
The Board of Trustees has adopted a distribution plan for certain class shares pursuant to Rule 12b-1 of the Investment Company Act of 1940.
22
Notes to Financial Statements (unaudited) – continued
The fund’s distribution plan provides that the fund will pay MFD for services provided by MFD and financial intermediaries in connection with the distribution and servicing of certain share classes. One component of the plan is a distribution fee paid to MFD and another component of the plan is a service fee paid to MFD. MFD may subsequently pay all, or a portion, of the distribution and/or service fees to financial intermediaries.
Distribution Plan Fee Table:
| | | | | | | | | | | | | | | | | | | | |
| | | Distribution
Fee Rate (d) | | | Service
Fee Rate (d) | | | Total
Distribution
Plan (d) | | | Annual
Effective
Rate (e) | | | Distribution
and Service
Fee | |
| Class A | | | — | | | | 0.25% | | | | 0.25% | | | | 0.22% | | | | $3,096 | |
| Class B | | | 0.75% | | | | 0.25% | | | | 1.00% | | | | 1.00% | | | | 1,860 | |
| Class C | | | 0.75% | | | | 0.25% | | | | 1.00% | | | | 1.00% | | | | 2,935 | |
| Total Distribution and Service Fees | | | | | | | | $7,891 | |
| (d) | In accordance with the distribution plan for certain classes, the fund pays distribution and/or service fees equal to these annual percentage rates of each class’s average daily net assets. The distribution and service fee rates disclosed by class represent the current rates in effect at the end of the reporting period. Any rate changes, if applicable, are detailed below. |
| (e) | The annual effective rates represent actual fees incurred under the distribution plan for the six months ended January 31, 2014 based on each class’s average daily net assets. MFD has voluntarily agreed to rebate a portion of each class’s 0.25% service fee attributable to accounts for which MFD retains the 0.25% service fee except for accounts attributable to MFS or its affiliates’ seed money. For the six months ended January 31, 2014, this rebate amounted to $353 for Class A and is included in the reduction of total expenses in the Statement of Operations. |
Certain Class A shares are subject to a contingent deferred sales charge (CDSC) in the event of a shareholder redemption within 18 months of purchase for shares purchased on or after August 1, 2012, and within 24 months of purchase for shares purchased prior to August 1, 2012. Class C shares are subject to a CDSC in the event of a shareholder redemption within 12 months of purchase. Class B shares are subject to a CDSC in the event of a shareholder redemption within six years of purchase. All contingent deferred sales charges are paid to MFD and during the six months ended January 31, 2014, were as follows:
| | | | |
| | | Amount | |
| Class A | | | $— | |
| Class B | | | 1,612 | |
| Class C | | | 1,621 | |
Shareholder Servicing Agent – MFS Service Center, Inc. (MFSC), a wholly-owned subsidiary of MFS, receives a fee from the fund for its services as shareholder servicing agent calculated as a percentage of the average daily net assets of the fund as determined periodically under the supervision of the fund’s Board of Trustees. For the six months ended January 31, 2014, the fee was $1,106, which equated to 0.0534% annually of the fund’s average daily net assets. MFSC also receives payment from the fund for out-of-pocket expenses, sub-accounting and other shareholder servicing costs which may be paid to affiliated and unaffiliated service providers. For the six months ended January 31, 2014, these out-of-pocket expenses, sub-accounting and other shareholder servicing costs amounted to $3,180.
23
Notes to Financial Statements (unaudited) – continued
Administrator – MFS provides certain financial, legal, shareholder communications, compliance, and other administrative services to the fund. Under an administrative services agreement, the fund partially reimburses MFS the costs incurred to provide these services. The fund is charged an annual fixed amount of $17,500 plus a fee based on average daily net assets. The administrative services fee incurred for the six months ended January 31, 2014 was equivalent to an annual effective rate of 0.4259% of the fund’s average daily net assets.
Trustees’ and Officers’ Compensation – The fund pays compensation to independent Trustees in the form of a retainer, attendance fees, and additional compensation to Board and Committee chairpersons. The fund does not pay compensation directly to Trustees or officers of the fund who are also officers of the investment adviser, all of whom receive remuneration for their services to the fund from MFS. Certain officers and Trustees of the fund are officers or directors of MFS, MFD, and MFSC.
Other – This fund and certain other funds managed by MFS (the funds) have entered into services agreements (the Agreements) which provide for payment of fees by the funds to Tarantino LLC and Griffin Compliance LLC in return for the provision of services of an Independent Chief Compliance Officer (ICCO) and Assistant ICCO, respectively, for the funds. The ICCO and Assistant ICCO are officers of the funds and the sole members of Tarantino LLC and Griffin Compliance LLC, respectively. The funds can terminate the Agreements with Tarantino LLC and Griffin Compliance LLC at any time under the terms of the Agreements. For the six months ended January 31, 2014, the aggregate fees paid by the fund to Tarantino LLC and Griffin Compliance LLC were $9 and are included in “Miscellaneous” expense in the Statement of Operations. MFS has agreed to reimburse the fund for a portion of the payments made by the fund in the amount of $2, which is included in the reduction of total expenses in the Statement of Operations. Additionally, MFS has agreed to bear all expenses associated with office space, other administrative support, and supplies provided to the ICCO and Assistant ICCO.
The fund invests in the MFS Institutional Money Market Portfolio which is managed by MFS and seeks current income consistent with preservation of capital and liquidity. Income earned on this investment is included in “Dividends from underlying affiliated funds” in the Statement of Operations. This money market fund does not pay a management fee to MFS.
On September 11, 2013, MFS redeemed 10,255 shares of Class A and 62,684 shares of Class I for an aggregate amount of $681,672.
(4) Portfolio Securities
Purchases and sales of investments, other than short-term obligations, aggregated $1,600,341 and $1,754,181, respectively.
24
Notes to Financial Statements (unaudited) – continued
(5) Shares of Beneficial Interest
The fund’s Declaration of Trust permits the Trustees to issue an unlimited number of full and fractional shares of beneficial interest. Transactions in fund shares were as follows:
| | | | | | | | | | | | | | | | |
| | | Six months ended
1/31/14 | | | Year ended
7/31/13 | |
| | | Shares | | | Amount | | | Shares | | | Amount | |
| Shares sold | | | | | | | | | | | | | | | | |
Class A | | | 108,114 | | | | $1,005,179 | | | | 138,615 | | | | $1,383,132 | |
Class B | | | 7,499 | | | | 69,787 | | | | 20,131 | | | | 197,237 | |
Class C | | | 39,912 | | | | 362,714 | | | | 34,109 | | | | 338,601 | |
Class I | | | 22,229 | | | | 203,956 | | | | 71,124 | | | | 730,587 | |
| | | 177,754 | | | | $1,641,636 | | | | 263,979 | | | | $2,649,557 | |
| | | | |
| Shares issued to shareholders in reinvestment of distributions | | | | | | | | | | | | | | | | |
Class A | | | 2,343 | | | | $21,318 | | | | 2,500 | | | | $25,124 | |
Class B | | | — | | | | — | | | | 195 | | | | 1,943 | |
Class C | | | 149 | | | | 1,338 | | | | 300 | | | | 2,981 | |
Class I | | | 616 | | | | 5,627 | | | | 1,061 | | | | 10,689 | |
| | | 3,108 | | | | $28,283 | | | | 4,056 | | | | $40,737 | |
| | | | |
| Shares reacquired | | | | | | | | | | | | | | | | |
Class A | | | (72,905 | ) | | | $(679,706 | ) | | | (126,368 | ) | | | $(1,234,347 | ) |
Class B | | | (20,582 | ) | | | (186,969 | ) | | | (33,774 | ) | | | (335,118 | ) |
Class C | | | (15,145 | ) | | | (133,354 | ) | | | (16,879 | ) | | | (160,697 | ) |
Class I | | | (84,489 | ) | | | (791,959 | ) | | | (36,324 | ) | | | (347,973 | ) |
| | | (193,121 | ) | | | $(1,791,988 | ) | | | (213,345 | ) | | | $(2,078,135 | ) |
| | | | |
| Net change | | | | | | | | | | | | | | | | |
Class A | | | 37,552 | | | | $346,791 | | | | 14,747 | | | | $173,909 | |
Class B | | | (13,083 | ) | | | (117,182 | ) | | | (13,448 | ) | | | (135,938 | ) |
Class C | | | 24,916 | | | | 230,698 | | | | 17,530 | | | | 180,885 | |
Class I | | | (61,644 | ) | | | (582,376 | ) | | | 35,861 | | | | 393,303 | |
| | | (12,259 | ) | | | $(122,069 | ) | | | 54,690 | | | | $612,159 | |
(6) Line of Credit
The fund and certain other funds managed by MFS participate in a $1.1 billion unsecured committed line of credit, subject to a $1 billion sublimit, provided by a syndication of banks under a credit agreement. Borrowings may be made for temporary financing needs. Interest is charged to each fund, based on its borrowings, generally at a rate equal to the higher of the Federal Reserve funds rate or one month LIBOR plus an agreed upon spread. A commitment fee, based on the average daily, unused portion of the committed line of credit, is allocated among the participating funds at the end of each calendar quarter. In addition, the fund and other funds managed by MFS have established unsecured uncommitted borrowing arrangements with certain banks for temporary financing needs. Interest is charged to each fund,
25
Notes to Financial Statements (unaudited) – continued
based on its borrowings, at a rate equal to the Federal Reserve funds rate plus an agreed upon spread. For the six months ended January 31, 2014, the fund’s commitment fee and interest expense were $11 and $0, respectively, and are included in “Miscellaneous” expense in the Statement of Operations.
(7) Transactions in Underlying Affiliated Funds-Affiliated Issuers
An affiliated issuer may be considered one in which the fund owns 5% or more of the outstanding voting securities, or a company which is under common control. For the purposes of this report, the fund assumes the following to be an affiliated issuer:
| | | | | | | | | | | | | | | | |
| Underlying Affiliated Fund | | Beginning Shares/Par Amount | | | Acquisitions Shares/Par Amount | | | Dispositions Shares/Par Amount | | | Ending Shares/Par Amount | |
| MFS Institutional Money Market Portfolio | | | 87,088 | | | | 1,064,361 | | | | (1,087,707 | ) | | | 63,742 | |
| | | | |
| Underlying Affiliated Fund | | Realized Gain (Loss) | | | Capital Gain Distributions | | | Dividend Income | | | Ending Value | |
| MFS Institutional Money Market Portfolio | | | $— | | | | $— | | | | $23 | | | | $63,742 | |
26
BOARD REVIEW OF INVESTMENT ADVISORY AGREEMENT
A discussion regarding the Board’s most recent review and renewal of the fund’s Investment Advisory Agreement with MFS is available by clicking on the fund’s name under “Mutual Funds” in the “Products” section of the MFS Web site (mfs.com).
PROXY VOTING POLICIES AND INFORMATION
A general description of the MFS funds’ proxy voting policies and procedures is available without charge, upon request, by calling 1-800-225-2606, by visiting the Proxy Voting section of mfs.com or by visiting the SEC’s Web site at http://www.sec.gov.
Information regarding how the fund voted proxies relating to portfolio securities during the most recent twelve-month period ended June 30 is available without charge by visiting the Proxy Voting section of mfs.com or by visiting the SEC’s Web site at http://www.sec.gov.
QUARTERLY PORTFOLIO DISCLOSURE
The fund will file a complete schedule of portfolio holdings with the Securities and Exchange Commission (the Commission) for the first and third quarters of each fiscal year on Form N-Q. A shareholder can obtain the quarterly portfolio holdings report at mfs.com. The fund’s Form N-Q is also available on the EDGAR database on the Commission’s Internet Web site at http://www.sec.gov, and may be reviewed and copied at the:
Public Reference Room
Securities and Exchange Commission
100 F Street, NE, Room 1580
Washington, D.C. 20549
Information on the operation of the Public Reference Room may be obtained by calling the Commission at 1-800-SEC-0330. Copies of the fund’s Form N-Q also may be obtained, upon payment of a duplicating fee, by electronic request at the following e-mail address: publicinfo@sec.gov, or by writing the Public Reference Section at the above address.
FURTHER INFORMATION
From time to time, MFS may post important information about the fund or the MFS funds on the MFS web site (mfs.com). This information is available by visiting the “Commentary & Announcements” and “Market Outlooks” sections of mfs.com or by clicking on the fund’s name under “Mutual Funds” in the “Products” section of mfs.com.
PROVISION OF FINANCIAL REPORTS AND SUMMARY PROSPECTUSES
The fund produces financial reports every six months and updates its summary prospectus and prospectus annually. To avoid sending duplicate copies of materials to households, only one copy of the fund’s annual and semiannual report and summary prospectus may be mailed to shareholders having the same last name and residential address on the fund’s records. However, any shareholder may contact MFSC (please see back cover for address and telephone number) to request that copies of these reports and summary prospectuses be sent personally to that shareholder.
27
Save paper with eDelivery.

| MFS® will send you prospectuses, |
reports, and proxies directly via e-mail so you will get information faster with less mailbox clutter.
To sign up:
1. Go to mfs.com.
2. Log in via MFS® Access.
3. Select eDelivery.
If you own your MFS fund shares through a financial institution or a retirement plan, MFS® TALK, MFS® Access, or eDelivery may not be available to you.
CONTACT
WEB SITE
mfs.com
MFS TALK
1-800-637-8255
24 hours a day
ACCOUNT SERVICE AND LITERATURE
Shareholders
1-800-225-2606
Financial advisors
1-800-343-2829
Retirement plan services
1-800-637-1255
MAILING ADDRESS
MFS Service Center, Inc.
P.O. Box 55824
Boston, MA 02205-5824
OVERNIGHT MAIL
MFS Service Center, Inc.
c/o Boston Financial Data Services
30 Dan Road
Canton, MA 02021-2809
SEMIANNUAL REPORT
January 31, 2014

MFS® EQUITY INCOME FUND

EQI-SEM
MFS® EQUITY INCOME FUND
CONTENTS
The report is prepared for the general information of shareholders. It is authorized for distribution to prospective investors only when preceded or accompanied by a current prospectus.
NOT FDIC INSURED Ÿ MAY LOSE VALUE Ÿ NO BANK GUARANTEE

LETTER FROM THE CHAIRMAN AND CEO
Dear Shareholders:
It’s a new year, and with it a more sober mood has arrived. During 2013, stocks delivered robust gains across many countries, global regions and economic sectors. It’s too early to draw conclusions for all of 2014, but several weak economic reports have weighed on investors’ minds.
Additionally, concerns have risen that China could stumble as it shifts to a consumer-driven economy, and the U.S. Federal Reserve has started to taper its bond-buying stimulus program, thereby reducing global liquidity. These potential headwinds from the world’s two largest economies have helped cause a flight from emerging markets such as Argentina, Russia, India, Turkey and South Africa. Compounding concerns, some of these countries face their own economic and political challenges. The widespread volatility resulting from all this is a reminder of how interconnected the global economy is.
On the brighter side, U.S. economic reports have remained fairly positive and other major developed markets, including Germany,
Japan and the United Kingdom, have continued to release reasonably strong data. Even the economies of some of the eurozone’s weaker links, including Greece, Portugal and Italy, appear to be growing after a prolonged slump.
In uncertain times such as these, it is particularly important to remember that managing risk should always be a top priority. At MFS®, active risk management is an integral part of our collaborative process. Our global team of investment professionals shares ideas and evaluates opportunities that span continents, investment disciplines and asset classes. Our goal is to build better insights, and ultimately better results, for our clients.
We understand and appreciate the economic challenges investors face, and believe in the value of maintaining a long-term view and applying proven principles, such as asset allocation and diversification. We are confident that our unique approach can serve investors well as they work with their financial advisors to identify and pursue the most suitable opportunities.
Respectfully,

Robert J. Manning
Chairman and Chief Executive Officer
MFS Investment Management®
March 18, 2014
The opinions expressed in this letter are subject to change, may not be relied upon for investment advice, and no forecasts can be guaranteed.
1
PORTFOLIO COMPOSITION
Portfolio structure

| | | | |
| Top ten holdings | | | | |
| Exxon Mobil Corp. | | | 3.6% | |
| JPMorgan Chase & Co. | | | 3.0% | |
| Wells Fargo & Co. | | | 3.0% | |
| Pfizer, Inc. | | | 2.8% | |
| Lockheed Martin Corp. | | | 2.2% | |
| Philip Morris International, Inc. | | | 2.2% | |
| Hewlett-Packard Co. | | | 2.2% | |
| Bristol-Myers Squibb Co. | | | 2.1% | |
| Delphi Automotive PLC | | | 2.0% | |
| MetLife, Inc. | | | 1.9% | |
| | | | |
| Equity sectors | | | | |
| Financial Services | | | 19.2% | |
| Technology | | | 14.9% | |
| Utilities & Communications | | | 11.2% | |
| Health Care | | | 10.6% | |
| Energy | | | 10.5% | |
| Consumer Staples | | | 9.2% | |
| Retailing | | | 5.6% | |
| Industrial Goods & Services | | | 5.2% | |
| Leisure | | | 5.1% | |
| Autos & Housing | | | 5.0% | |
| Basic Materials | | | 2.7% | |
| Transportation | | | 0.5% | |
Percentages are based on net assets as of 1/31/14.
The portfolio is actively managed and current holdings may be different.
2
EXPENSE TABLE
Fund expenses borne by the shareholders during the period, August 1, 2013 through January 31, 2014
As a shareholder of the fund, you incur two types of costs: (1) transaction costs, including sales charges (loads) on certain purchase or redemption payments, and (2) ongoing costs, including management fees; distribution and service (12b-1) fees; and other fund expenses. This example is intended to help you understand your ongoing costs (in dollars) of investing in the fund and to compare these costs with the ongoing costs of investing in other mutual funds.
The example is based on an investment of $1,000 invested at the beginning of the period and held for the entire period August 1, 2013 through January 31, 2014.
Actual Expenses
The first line for each share class in the following table provides information about actual account values and actual expenses. You may use the information in this line, together with the amount you invested, to estimate the expenses that you paid over the period. Simply divide your account value by $1,000 (for example, an $8,600 account value divided by $1,000 = 8.6), then multiply the result by the number in the first line under the heading entitled “Expenses Paid During Period” to estimate the expenses you paid on your account during this period.
Hypothetical Example for Comparison Purposes
The second line for each share class in the following table provides information about hypothetical account values and hypothetical expenses based on the fund’s actual expense ratio and an assumed rate of return of 5% per year before expenses, which is not the fund’s actual return. The hypothetical account values and expenses may not be used to estimate the actual ending account balance or expenses you paid for the period. You may use this information to compare the ongoing costs of investing in the fund and other funds. To do so, compare this 5% hypothetical example with the 5% hypothetical examples that appear in the shareholder reports of the other funds.
Please note that the expenses shown in the table are meant to highlight your ongoing costs only and do not reflect any transactional costs, such as sales charges (loads). Therefore, the second line for each share class in the table is useful in comparing ongoing costs only, and will not help you determine the relative total costs of owning different funds. In addition, if these transactional costs were included, your costs would have been higher.
3
Expense Table – continued
| | | | | | | | | | | | | | | | | | |
Share
Class | | | | Annualized Expense Ratio | | | Beginning Account Value 8/01/13 | | | Ending Account Value 1/31/14 | | | Expenses Paid During Period (p) 8/01/13-1/31/14 | |
| A | | Actual | | | 1.25% | | | | $1,000.00 | | | | $1,066.79 | | | | $6.51 | |
| | Hypothetical (h) | | | 1.25% | | | | $1,000.00 | | | | $1,018.90 | | | | $6.36 | |
| B | | Actual | | | 2.00% | | | | $1,000.00 | | | | $1,062.68 | | | | $10.40 | |
| | Hypothetical (h) | | | 2.00% | | | | $1,000.00 | | | | $1,015.12 | | | | $10.16 | |
| C | | Actual | | | 2.00% | | | | $1,000.00 | | | | $1,062.33 | | | | $10.40 | |
| | Hypothetical (h) | | | 2.00% | | | | $1,000.00 | | | | $1,015.12 | | | | $10.16 | |
| I | | Actual | | | 1.00% | | | | $1,000.00 | | | | $1,067.94 | | | | $5.21 | |
| | Hypothetical (h) | | | 1.00% | | | | $1,000.00 | | | | $1,020.16 | | | | $5.09 | |
| R1 | | Actual | | | 2.00% | | | | $1,000.00 | | | | $1,062.49 | | | | $10.40 | |
| | Hypothetical (h) | | | 2.00% | | | | $1,000.00 | | | | $1,015.12 | | | | $10.16 | |
| R2 | | Actual | | | 1.50% | | | | $1,000.00 | | | | $1,065.17 | | | | $7.81 | |
| | Hypothetical (h) | | | 1.50% | | | | $1,000.00 | | | | $1,017.64 | | | | $7.63 | |
| R3 | | Actual | | | 1.25% | | | | $1,000.00 | | | | $1,066.54 | | | | $6.51 | |
| | Hypothetical (h) | | | 1.25% | | | | $1,000.00 | | | | $1,018.90 | | | | $6.36 | |
| R4 | | Actual | | | 1.00% | | | | $1,000.00 | | | | $1,067.85 | | | | $5.21 | |
| | Hypothetical (h) | | | 1.00% | | | | $1,000.00 | | | | $1,020.16 | | | | $5.09 | |
| R5 | | Actual | | | 0.95% | | | | $1,000.00 | | | | $1,069.86 | | | | $4.96 | |
| | Hypothetical (h) | | | 0.95% | | | | $1,000.00 | | | | $1,020.42 | | | | $4.84 | |
| (h) | 5% class return per year before expenses. |
| (p) | Expenses paid are equal to each class’s annualized expense ratio, as shown above, multiplied by the average account value over the period, multiplied by the number of days in the period, divided by the number of days in the year. Expenses paid do not include any applicable sales charges (loads). If these transaction costs had been included, your costs would have been higher. |
4
PORTFOLIO OF INVESTMENTS
1/31/14 (unaudited)
The Portfolio of Investments is a complete list of all securities owned by your fund. It is categorized by broad-based asset classes.
| | | | | | | | |
| Common Stocks - 99.1% | | | | | | | | |
| Issuer | | Shares/Par | | | Value ($) | |
| Aerospace - 2.9% | | | | | | | | |
| Lockheed Martin Corp. | | | 6,840 | | | $ | 1,032,224 | |
| Northrop Grumman Corp. | | | 2,630 | | | | 303,896 | |
| | | | | | | | |
| | | | | | | $ | 1,336,120 | |
| Airlines - 0.5% | | | | | | | | |
| Copa Holdings S.A., “A” | | | 1,611 | | | $ | 210,558 | |
| | |
| Apparel Manufacturers - 0.6% | | | | | | | | |
| Hanesbrands, Inc. | | | 3,700 | | | $ | 263,218 | |
| | |
| Automotive - 5.1% | | | | | | | | |
| Delphi Automotive PLC | | | 15,370 | | | $ | 935,879 | |
| General Motors Co. | | | 19,366 | | | | 698,725 | |
| Magna International, Inc. | | | 8,100 | | | | 688,000 | |
| | | | | | | | |
| | | | | | | $ | 2,322,604 | |
| Cable TV - 3.7% | | | | | | | | |
| Comcast Corp., “Special A” | | | 15,590 | | | $ | 816,137 | |
| Time Warner Cable, Inc. | | | 6,720 | | | | 895,574 | |
| | | | | | | | |
| | | | | | | $ | 1,711,711 | |
| Chemicals - 0.6% | | | | | | | | |
| LyondellBasell Industries N.V., “A” | | | 3,470 | | | $ | 273,297 | |
| | |
| Computer Software - 3.4% | | | | | | | | |
| CA, Inc. | | | 10,640 | | | $ | 341,331 | |
| Microsoft Corp. | | | 17,470 | | | | 661,239 | |
| Symantec Corp. | | | 26,480 | | | | 566,937 | |
| | | | | | | | |
| | | | | | | $ | 1,569,507 | |
| Computer Software - Systems - 4.0% | | | | | | | | |
| Apple, Inc. | | | 589 | | | $ | 294,853 | |
| Canon, Inc. | | | 5,900 | | | | 172,689 | |
| Hewlett-Packard Co. | | | 34,330 | | | | 995,570 | |
| Western Digital Corp. | | | 4,490 | | | | 386,903 | |
| | | | | | | | |
| | | | | | | $ | 1,850,015 | |
| Consumer Products - 1.3% | | | | | | | | |
| Procter & Gamble Co. | | | 7,850 | | | $ | 601,467 | |
5
Portfolio of Investments (unaudited) – continued
| | | | | | | | |
| Issuer | | Shares/Par | | | Value ($) | |
| Common Stocks - continued | | | | | | | | |
| Containers - 0.5% | | | | | | | | |
| Packaging Corp. of America | | | 3,170 | | | $ | 204,782 | |
| | |
| Electrical Equipment - 0.8% | | | | | | | | |
| Siemens AG | | | 3,034 | | | $ | 384,480 | |
| | |
| Electronics - 3.5% | | | | | | | | |
| Hoya Corp. | | | 7,900 | | | $ | 218,296 | |
| Intel Corp. | | | 9,600 | | | | 235,584 | |
| Microchip Technology, Inc. | | | 19,650 | | | | 881,499 | |
| Taiwan Semiconductor Manufacturing Co. Ltd., ADR | | | 16,710 | | | | 282,733 | |
| | | | | | | | |
| | | | | | | $ | 1,618,112 | |
| Energy - Independent - 2.6% | | | | | | | | |
| Marathon Petroleum Corp. | | | 4,410 | | | $ | 383,891 | |
| Valero Energy Corp. | | | 16,010 | | | | 818,111 | |
| | | | | | | | |
| | | | | | | $ | 1,202,002 | |
| Energy - Integrated - 7.5% | | | | | | | | |
| Chevron Corp. | | | 7,343 | | | $ | 819,699 | |
| Exxon Mobil Corp. | | | 18,080 | | | | 1,666,253 | |
| Petroleo Brasileiro S.A., ADR | | | 24,560 | | | | 292,264 | |
| Royal Dutch Shell PLC, “A” | | | 19,637 | | | | 679,036 | |
| | | | | | | | |
| | | | | | | $ | 3,457,252 | |
| Entertainment - 0.3% | | | | | | | | |
| Regal Entertainment Group, “A” | | | 7,620 | | | $ | 148,590 | |
| | |
| Food & Beverages - 1.7% | | | | | | | | |
| General Mills, Inc. | | | 5,530 | | | $ | 265,551 | |
| Ingredion, Inc. | | | 2,790 | | | | 173,817 | |
| Tyson Foods, Inc., “A” | | | 8,700 | | | | 325,380 | |
| | | | | | | | |
| | | | | | | $ | 764,748 | |
| Food & Drug Stores - 2.7% | | | | | | | | |
| CVS Caremark Corp. | | | 9,240 | | | $ | 625,733 | |
| Kroger Co. | | | 17,420 | | | | 628,862 | |
| | | | | | | | |
| | | | | | | $ | 1,254,595 | |
| Gaming & Lodging - 0.8% | | | | | | | | |
| Wynn Resorts Ltd. | | | 1,768 | | | $ | 384,399 | |
| | |
| General Merchandise - 1.9% | | | | | | | | |
| Macy’s, Inc. | | | 13,650 | | | $ | 726,180 | |
| Target Corp. | | | 2,360 | | | | 133,670 | |
| | | | | | | | |
| | | | | | | $ | 859,850 | |
6
Portfolio of Investments (unaudited) – continued
| | | | | | | | |
| Issuer | | Shares/Par | | | Value ($) | |
| Common Stocks - continued | | | | | | | | |
| Insurance - 7.4% | | | | | | | | |
| American International Group, Inc. | | | 7,980 | | | $ | 382,721 | |
| Delta Lloyd N.V. | | | 21,500 | | | | 553,409 | |
| Everest Re Group Ltd. | | | 2,334 | | | | 337,870 | |
| MetLife, Inc. | | | 18,280 | | | | 896,634 | |
| Prudential Financial, Inc. | | | 1,880 | | | | 158,653 | |
| Validus Holdings Ltd. | | | 15,850 | | | | 569,332 | |
| Zurich Insurance Group AG | | | 1,671 | | | | 485,275 | |
| | | | | | | | |
| | | | | | | $ | 3,383,894 | |
| Internet - 4.0% | | | | | | | | |
| Facebook, Inc., “A “ (a) | | | 7,030 | | | $ | 439,867 | |
| Google, Inc., “A” (a) | | | 618 | | | | 729,839 | |
| Yahoo!, Inc. (a) | | | 18,830 | | | | 678,257 | |
| | | | | | | | |
| | | | | | | $ | 1,847,963 | |
| Machinery & Tools - 1.5% | | | | | | | | |
| Cummins, Inc. | | | 5,496 | | | $ | 697,882 | |
| | |
| Major Banks - 8.2% | | | | | | | | |
| BOC Hong Kong Holdings Ltd. | | | 51,500 | | | $ | 155,598 | |
| HSBC Holdings PLC | | | 19,187 | | | | 197,765 | |
| JPMorgan Chase & Co. | | | 25,120 | | | | 1,390,643 | |
| Mizuho Financial Group, Inc. | | | 180,500 | | | | 380,462 | |
| Sumitomo Mitsui Financial Group, Inc. | | | 6,700 | | | | 309,953 | |
| Wells Fargo & Co. | | | 30,010 | | | | 1,360,653 | |
| | | | | | | | |
| | | | | | | $ | 3,795,074 | |
| Medical Equipment - 0.6% | | | | | | | | |
| Abbott Laboratories | | | 6,900 | | | $ | 252,954 | |
| | |
| Metals & Mining - 1.7% | | | | | | | | |
| Rio Tinto Ltd. | | | 6,350 | | | $ | 338,581 | |
| Vale S.A., ADR | | | 30,890 | | | | 420,104 | |
| | | | | | | | |
| | | | | | | $ | 758,685 | |
| Natural Gas - Distribution - 1.0% | | | | | | | | |
| GDF SUEZ | | | 21,281 | | | $ | 470,277 | |
| | |
| Oil Services - 0.4% | | | | | | | | |
| Transocean, Inc. | | | 4,150 | | | $ | 179,612 | |
| | |
| Other Banks & Diversified Financials - 0.7% | | | | | | | | |
| Discover Financial Services | | | 3,300 | | | $ | 177,045 | |
| Fifth Third Bancorp | | | 7,250 | | | | 152,395 | |
| | | | | | | | |
| | | | | | | $ | 329,440 | |
7
Portfolio of Investments (unaudited) – continued
| | | | | | | | |
| Issuer | | Shares/Par | | | Value ($) | |
| Common Stocks - continued | | | | | | | | |
| Pharmaceuticals - 10.0% | | | | | | | | |
| AbbVie, Inc. | | | 4,350 | | | $ | 214,150 | |
| Bristol-Myers Squibb Co. | | | 19,530 | | | | 975,914 | |
| Eli Lilly & Co. | | | 12,700 | | | | 685,927 | |
| Johnson & Johnson | | | 9,370 | | | | 828,964 | |
| Merck & Co., Inc. | | | 11,620 | | | | 615,511 | |
| Pfizer, Inc. | | | 42,750 | | | | 1,299,600 | |
| | | | | | | | |
| | | | | | | $ | 4,620,066 | |
| Real Estate - 2.9% | | | | | | | | |
| American Capital Agency Corp., REIT | | | 4,080 | | | $ | 85,476 | |
| Annaly Mortgage Management, Inc., REIT | | | 25,730 | | | | 277,112 | |
| Corio N.V., REIT | | | 5,652 | | | | 240,501 | |
| Digital Realty Trust, Inc., REIT | | | 10,310 | | | | 525,707 | |
| EPR Properties, REIT | | | 3,610 | | | | 184,399 | |
| | | | | | | | |
| | | | | | | $ | 1,313,195 | |
| Restaurants - 0.2% | | | | | | | | |
| ARAMARK Holdings Corp. (a) | | | 4,250 | | | $ | 105,018 | |
| | |
| Specialty Stores - 0.4% | | | | | | | | |
| Best Buy Co., Inc. | | | 8,130 | | | $ | 191,380 | |
| | |
| Telecommunications - Wireless - 0.4% | | | | | | | | |
| Tele2 AB, “B” | | | 15,918 | | | $ | 175,425 | |
| | |
| Telephone Services - 5.0% | | | | | | | | |
| Bezeq - The Israel Telecommunication Corp. Ltd. | | | 61,920 | | | $ | 94,928 | |
| CenturyLink, Inc. | | | 11,000 | | | | 317,460 | |
| Frontier Communications Corp. | | | 145,610 | | | | 684,367 | |
| TDC A.S. | | | 40,074 | | | | 376,663 | |
| Telecom Italia S.p.A. - Savings Shares | | | 224,498 | | | | 189,238 | |
| Telefonica Brasil S.A., ADR | | | 10,400 | | | | 197,600 | |
| Verizon Communications, Inc. | | | 9,540 | | | | 458,111 | |
| | | | | | | | |
| | | | | | | $ | 2,318,367 | |
| Tobacco - 6.2% | | | | | | | | |
| Altria Group, Inc. | | | 17,820 | | | $ | 627,620 | |
| Japan Tobacco, Inc. | | | 10,900 | | | | 336,664 | |
| Lorillard, Inc. | | | 18,200 | | | | 895,804 | |
| Philip Morris International, Inc. | | | 12,920 | | | | 1,009,569 | |
| | | | | | | | |
| | | | | | | $ | 2,869,657 | |
8
Portfolio of Investments (unaudited) – continued
| | | | | | | | |
| Issuer | | Shares/Par | | | Value ($) | |
| Common Stocks - continued | | | | | | | | |
| Utilities - Electric Power - 4.1% | | | | | | | | |
| American Electric Power Co., Inc. | | | 11,680 | | | $ | 570,101 | |
| Companhia Energetica de Minas Gerais, IPS | | | 69,835 | | | | 403,107 | |
| E.ON AG | | | 24,544 | | | | 445,890 | |
| PG&E Corp. | | | 7,250 | | | | 305,588 | |
| PPL Corp. | | | 6,233 | | | | 190,543 | |
| | | | | | | | |
| | | | | | | $ | 1,915,229 | |
| Total Common Stocks (Identified Cost, $41,986,704) | | | | | | $ | 45,641,425 | |
| | |
| Convertible Preferred Stocks - 0.6% | | | | | | | | |
| Utilities - Electric Power - 0.6% | | | | | | | | |
| PPL Corp., 8.75% (Identified Cost, $299,822) | | | 5,540 | | | $ | 285,365 | |
| | |
| Money Market Funds - 1.0% | | | | | | | | |
MFS Institutional Money Market Portfolio, 0.09%,
at Cost and Net Asset Value (v) | | | 465,654 | | | $ | 465,654 | |
| Total Investments (Identified Cost, $42,752,180) | | | | | | $ | 46,392,444 | |
| | |
| Other Assets, Less Liabilities - (0.7)% | | | | | | | (349,602 | ) |
| Net Assets - 100.0% | | | | | | $ | 46,042,842 | |
| (a) | Non-income producing security. |
| (v) | Underlying affiliated fund that is available only to investment companies managed by MFS. The rate quoted for the MFS Institutional Money Market Portfolio is the annualized seven-day yield of the fund at period end. |
The following abbreviations are used in this report and are defined:
| ADR | | American Depositary Receipt |
| IPS | | International Preference Stock |
| PLC | | Public Limited Company |
| REIT | | Real Estate Investment Trust |
See Notes to Financial Statements
9
Financial Statements
STATEMENT OF ASSETS AND LIABILITIES
At 1/31/14 (unaudited)
This statement represents your fund’s balance sheet, which details the assets and liabilities comprising the total value of the fund.
| | | | |
| Assets | | | | |
Investments- | | | | |
Non-affiliated issuers, at value (identified cost, $42,286,526) | | | $45,926,790 | |
Underlying affiliated funds, at cost and value | | | 465,654 | |
Total investments, at value (identified cost, $42,752,180) | | | $46,392,444 | |
Receivables for | | | | |
Fund shares sold | | | 618,937 | |
Dividends | | | 38,450 | |
Receivable from investment adviser | | | 20,510 | |
Other assets | | | 41,876 | |
Total assets | | | $47,112,217 | |
| Liabilities | | | | |
Payable for fund shares reacquired | | | $1,032,130 | |
Payable to affiliates | | | | |
Shareholder servicing costs | | | 251 | |
Distribution and service fees | | | 1,014 | |
Payable for independent Trustees’ compensation | | | 111 | |
Accrued expenses and other liabilities | | | 35,869 | |
Total liabilities | | | $1,069,375 | |
Net assets | | | $46,042,842 | |
| Net assets consist of | | | | |
Paid-in capital | | | $42,479,929 | |
Unrealized appreciation (depreciation) on investments and translation of assets and liabilities in foreign currencies | | | 3,640,325 | |
Accumulated distributions in excess of net realized gain on investments and foreign currency | | | (79,691 | ) |
Undistributed net investment income | | | 2,279 | |
Net assets | | | $46,042,842 | |
Shares of beneficial interest outstanding | | | 3,767,563 | |
10
Statement of Assets and Liabilities (unaudited) – continued
| | | | | | | | | | | | |
| | | Net assets | | | Shares
outstanding | | | Net asset value
per share (a) | |
Class A | | | $34,717,683 | | | | 2,839,565 | | | | $12.23 | |
Class B | | | 1,752,708 | | | | 143,781 | | | | 12.19 | |
Class C | | | 7,746,870 | | | | 634,998 | | | | 12.20 | |
Class I | | | 1,344,419 | | | | 109,893 | | | | 12.23 | |
Class R1 | | | 98,506 | | | | 8,058 | | | | 12.22 | |
Class R2 | | | 100,824 | | | | 8,244 | | | | 12.23 | |
Class R3 | | | 101,811 | | | | 8,322 | | | | 12.23 | |
Class R4 | | | 98,620 | | | | 8,060 | | | | 12.24 | |
Class R5 | | | 81,401 | | | | 6,642 | | | | 12.26 | |
| (a) | Maximum offering price per share was equal to the net asset value per share for all share classes, except for Class A, for which the maximum offering price per share was $12.98 [100 / 94.25 x $12.23]. On sales of $50,000 or more, the maximum offering price of Class A shares is reduced. A contingent deferred sales charge may be imposed on redemptions of Class A, Class B, and Class C shares. Redemption price per share was equal to the net asset value per share for Classes I, R1, R2, R3, R4, and R5. |
See Notes to Financial Statements
11
Financial Statements
STATEMENT OF OPERATIONS
Six months ended 1/31/14 (unaudited)
This statement describes how much your fund earned in investment income and accrued in expenses. It also describes any gains and/or losses generated by fund operations.
| | | | |
| Net investment income | | | | |
Income | | | | |
Dividends | | | $585,743 | |
Dividends from underlying affiliated funds | | | 287 | |
Foreign taxes withheld | | | (15,015 | ) |
Total investment income | | | $571,015 | |
Expenses | | | | |
Management fee | | | $145,308 | |
Distribution and service fees | | | 75,652 | |
Shareholder servicing costs | | | 13,601 | |
Administrative services fee | | | 8,823 | |
Independent Trustees’ compensation | | | 572 | |
Custodian fee | | | 41,090 | |
Shareholder communications | | | 5,901 | |
Audit and tax fees | | | 18,575 | |
Legal fees | | | 187 | |
Registration fees | | | 53,615 | |
Miscellaneous | | | 7,101 | |
Total expenses | | | $370,425 | |
Reduction of expenses by investment adviser and distributor | | | (101,421 | ) |
Net expenses | | | $269,004 | |
Net investment income | | | $302,011 | |
| Realized and unrealized gain (loss) on investments and foreign currency | |
Realized gain (loss) (identified cost basis) | | | | |
Investments | | | $121,106 | |
Foreign currency | | | (4,136 | ) |
Net realized gain (loss) on investments and foreign currency | | | $116,970 | |
Change in unrealized appreciation (depreciation) | | | | |
Investments | | | $1,927,728 | |
Translation of assets and liabilities in foreign currencies | | | 248 | |
Net unrealized gain (loss) on investments and foreign currency translation | | | $1,927,976 | |
Net realized and unrealized gain (loss) on investments and foreign currency | | | $2,044,946 | |
Change in net assets from operations | | | $2,346,957 | |
See Notes to Financial Statements
12
Financial Statements
STATEMENTS OF CHANGES IN NET ASSETS
These statements describe the increases and/or decreases in net assets resulting from operations, any distributions, and any shareholder transactions.
| | | | | | | | |
| | | Six months ended
1/31/14 | | | Period ended
7/31/13 (c) | |
| Change in net assets | | (unaudited) | | | | |
| From operations | | | | | | | | |
Net investment income | | | $302,011 | | | | $142,996 | |
Net realized gain (loss) on investments and foreign currency | | | 116,970 | | | | 97,355 | |
Net unrealized gain (loss) on investments and foreign currency translation | | | 1,927,976 | | | | 1,712,349 | |
Change in net assets from operations | | | $2,346,957 | | | | $1,952,700 | |
| Distributions declared to shareholders | | | | | | | | |
From net investment income | | | $(314,353 | ) | | | $(127,225 | ) |
From net realized gain on investments | | | (295,005 | ) | | | — | |
Total distributions declared to shareholders | | | $(609,358 | ) | | | $(127,225 | ) |
Change in net assets from fund share transactions | | | $17,199,185 | | | | $25,280,583 | |
Total change in net assets | | | $18,936,784 | | | | $27,106,058 | |
| Net assets | | | | | | | | |
At beginning of period | | | 27,106,058 | | | | — | |
At end of period (including undistributed net investment income of $2,279 and $14,621, respectively) | | | $46,042,842 | | | | $27,106,058 | |
| (c) | For the period from the commencement of the fund’s investment operations, September 27, 2012, through the stated period end. |
See Notes to Financial Statements
13
Financial Statements
FINANCIAL HIGHLIGHTS
The financial highlights table is intended to help you understand the fund’s financial performance for the semiannual period and the past 5 fiscal years (or life of a particular share class, if shorter). Certain information reflects financial results for a single fund share. The total returns in the table represent the rate by which an investor would have earned (or lost) on an investment in the fund share class (assuming reinvestment of all distributions) held for the entire period.
| | | | | | | | |
| | | Six months
ended
1/31/14 (unaudited) | | | Period ended 7/31/13 (c) | |
| Class A | | |
| | | | | |
Net asset value, beginning of period | | | $11.64 | | | | $10.00 | |
| Income (loss) from investment operations | |
Net investment income (d) | | | $0.10 | | | | $0.17 | |
Net realized and unrealized gain (loss) on investments and foreign currency | | | 0.67 | | | | 1.62 | |
Total from investment operations | | | $0.77 | | | | $1.79 | |
| Less distributions declared to shareholders | |
From net investment income | | | $(0.10 | ) | | | $(0.15 | ) |
From net realized gain on investments | | | (0.08 | ) | | | — | |
Total distributions declared to shareholders | | | $(0.18 | ) | | | $(0.15 | ) |
Net asset value, end of period (x) | | | $12.23 | | | | $11.64 | |
Total return (%) (r)(s)(t)(x) | | | 6.68 | (n) | | | 18.04 | (n) |
Ratios (%) (to average net assets)
and Supplemental data: | |
Expenses before expense reductions (f) | | | 1.77 | (a) | | | 2.32 | (a) |
Expenses after expense reductions (f) | | | 1.25 | (a) | | | 1.24 | (a) |
Net investment income | | | 1.67 | (a) | | | 1.85 | (a) |
Portfolio turnover | | | 16 | (n) | | | 39 | (n) |
Net assets at end of period (000 omitted) | | | $34,718 | | | | $18,922 | |
See Notes to Financial Statements
14
Financial Highlights – continued
| | | | | | | | |
| | | Six months
ended
1/31/14 (unaudited) | | | Period ended 7/31/13 (c) | |
| Class B | | |
| | | | | |
Net asset value, beginning of period | | | $11.61 | | | | $10.00 | |
| Income (loss) from investment operations | |
Net investment income (d) | | | $0.06 | | | | $0.09 | |
Net realized and unrealized gain (loss) on investments and foreign currency | | | 0.66 | | | | 1.62 | |
Total from investment operations | | | $0.72 | | | | $1.71 | |
| Less distributions declared to shareholders | |
From net investment income | | | $(0.06 | ) | | | $(0.10 | ) |
From net realized gain on investments | | | (0.08 | ) | | | — | |
Total distributions declared to shareholders | | | $(0.14 | ) | | | $(0.10 | ) |
Net asset value, end of period (x) | | | $12.19 | | | | $11.61 | |
Total return (%) (r)(s)(t)(x) | | | 6.27 | (n) | | | 17.24 | (n) |
Ratios (%) (to average net assets)
and Supplemental data: | |
Expenses before expense reductions (f) | | | 2.52 | (a) | | | 3.49 | (a) |
Expenses after expense reductions (f) | | | 2.00 | (a) | | | 2.00 | (a) |
Net investment income | | | 0.91 | (a) | | | 1.01 | (a) |
Portfolio turnover | | | 16 | (n) | | | 39 | (n) |
Net assets at end of period (000 omitted) | | | $1,753 | | | | $811 | |
See Notes to Financial Statements
15
Financial Highlights – continued
| | | | | | | | |
| | | Six months
ended
1/31/14 (unaudited) | | | Period ended 7/31/13 (c) | |
| Class C | | |
| | | | | |
Net asset value, beginning of period | | | $11.62 | | | | $10.00 | |
| Income (loss) from investment operations | |
Net investment income (d) | | | $0.06 | | | | $0.10 | |
Net realized and unrealized gain (loss) on investments and foreign currency | | | 0.66 | | | | 1.63 | |
Total from investment operations | | | $0.72 | | | | $1.73 | |
| Less distributions declared to shareholders | |
From net investment income | | | $(0.06 | ) | | | $(0.11 | ) |
From net realized gain on investments | | | (0.08 | ) | | | — | |
Total distributions declared to shareholders | | | $(0.14 | ) | | | $(0.11 | ) |
Net asset value, end of period (x) | | | $12.20 | | | | $11.62 | |
Total return (%) (r)(s)(t)(x) | | | 6.23 | (n) | | | 17.41 | (n) |
Ratios (%) (to average net assets)
and Supplemental data: | |
Expenses before expense reductions (f) | | | 2.52 | (a) | | | 3.06 | (a) |
Expenses after expense reductions (f) | | | 2.00 | (a) | | | 2.00 | (a) |
Net investment income | | | 0.93 | (a) | | | 1.06 | (a) |
Portfolio turnover | | | 16 | (n) | | | 39 | (n) |
Net assets at end of period (000 omitted) | | | $7,747 | | | | $4,740 | |
See Notes to Financial Statements
16
Financial Highlights – continued
| | | | | | | | |
| | | Six months
ended
1/31/14 | | | Period ended 7/31/13 (c) | |
| Class I | | |
| | | (unaudited) | | | | |
Net asset value, beginning of period | | | $11.64 | | | | $10.00 | |
| Income (loss) from investment operations | |
Net investment income (d) | | | $0.11 | | | | $0.18 | |
Net realized and unrealized gain (loss) on investments and foreign currency | | | 0.68 | | | | 1.62 | |
Total from investment operations | | | $0.79 | | | | $1.80 | |
| Less distributions declared to shareholders | |
From net investment income | | | $(0.12 | ) | | | $(0.16 | ) |
From net realized gain on investments | | | (0.08 | ) | | | — | |
Total distributions declared to shareholders | | | $(0.20 | ) | | | $(0.16 | ) |
Net asset value, end of period (x) | | | $12.23 | | | | $11.64 | |
Total return (%) (r)(s)(x) | | | 6.79 | (n) | | | 18.18 | (n) |
Ratios (%) (to average net assets)
and Supplemental data: | |
Expenses before expense reductions (f) | | | 1.52 | (a) | | | 2.90 | (a) |
Expenses after expense reductions (f) | | | 1.00 | (a) | | | 1.00 | (a) |
Net investment income | | | 1.87 | (a) | | | 2.02 | (a) |
Portfolio turnover | | | 16 | (n) | | | 39 | (n) |
Net assets at end of period (000 omitted) | | | $1,344 | | | | $507 | |
See Notes to Financial Statements
17
Financial Highlights – continued
| | | | | | | | |
| | | Six months
ended
1/31/14 | | | Period ended 7/31/13 (c) | |
| Class R1 | | |
| | | (unaudited) | | | | |
Net asset value, beginning of period | | | $11.63 | | | | $10.00 | |
| Income (loss) from investment operations | |
Net investment income (d) | | | $0.07 | | | | $0.12 | |
Net realized and unrealized gain (loss) on investments and foreign currency | | | 0.65 | | | | 1.59 | |
Total from investment operations | | | $0.72 | | | | $1.71 | |
| Less distributions declared to shareholders | |
From net investment income | | | $(0.05 | ) | | | $(0.08 | ) |
From net realized gain on investments | | | (0.08 | ) | | | — | |
Total distributions declared to shareholders | | | $(0.13 | ) | | | $(0.08 | ) |
Net asset value, end of period (x) | | | $12.22 | | | | $11.63 | |
Total return (%) (r)(s)(x) | | | 6.25 | (n) | | | 17.22 | (n) |
Ratios (%) (to average net assets)
and Supplemental data: | |
Expenses before expense reductions (f) | | | 2.53 | (a) | | | 4.64 | (a) |
Expenses after expense reductions (f) | | | 2.00 | (a) | | | 2.00 | (a) |
Net investment income | | | 1.12 | (a) | | | 1.32 | (a) |
Portfolio turnover | | | 16 | (n) | | | 39 | (n) |
Net assets at end of period (000 omitted) | | | $99 | | | | $117 | |
See Notes to Financial Statements
18
Financial Highlights – continued
| | | | | | | | |
| | | Six months
ended
1/31/14 | | | Period ended 7/31/13 (c) | |
| Class R2 | | |
| | | (unaudited) | | | | |
Net asset value, beginning of period | | | $11.64 | | | | $10.00 | |
| Income (loss) from investment operations | |
Net investment income (d) | | | $0.10 | | | | $0.16 | |
Net realized and unrealized gain (loss) on investments and foreign currency | | | 0.66 | | | | 1.60 | |
Total from investment operations | | | $0.76 | | | | $1.76 | |
| Less distributions declared to shareholders | |
From net investment income | | | $(0.09 | ) | | | $(0.12 | ) |
From net realized gain on investments | | | (0.08 | ) | | | — | |
Total distributions declared to shareholders | | | $(0.17 | ) | | | $(0.12 | ) |
Net asset value, end of period (x) | | | $12.23 | | | | $11.64 | |
Total return (%) (r)(s)(x) | | | 6.52 | (n) | | | 17.75 | (n) |
Ratios (%) (to average net assets)
and Supplemental data: | |
Expenses before expense reductions (f) | | | 2.03 | (a) | | | 4.14 | (a) |
Expenses after expense reductions (f) | | | 1.50 | (a) | | | 1.50 | (a) |
Net investment income | | | 1.62 | (a) | | | 1.82 | (a) |
Portfolio turnover | | | 16 | (n) | | | 39 | (n) |
Net assets at end of period (000 omitted) | | | $101 | | | | $118 | |
See Notes to Financial Statements
19
Financial Highlights – continued
| | | | | | | | |
| | | Six months
ended
1/31/14 (unaudited) | | | Period ended 7/31/13 (c) | |
| Class R3 | | |
| | | | | |
Net asset value, beginning of period | | | $11.64 | | | | $10.00 | |
| Income (loss) from investment operations | |
Net investment income (d) | | | $0.11 | | | | $0.18 | |
Net realized and unrealized gain (loss) on investments and foreign currency | | | 0.66 | | | | 1.60 | |
Total from investment operations | | | $0.77 | | | | $1.78 | |
| Less distributions declared to shareholders | |
From net investment income | | | $(0.10 | ) | | | $(0.14 | ) |
From net realized gain on investments | | | (0.08 | ) | | | — | |
Total distributions declared to shareholders | | | $(0.18 | ) | | | $(0.14 | ) |
Net asset value, end of period (x) | | | $12.23 | | | | $11.64 | |
Total return (%) (r)(s)(x) | | | 6.65 | (n) | | | 17.96 | (n) |
Ratios (%) (to average net assets)
and Supplemental data: | |
Expenses before expense reductions (f) | | | 1.78 | (a) | | | 3.89 | (a) |
Expenses after expense reductions (f) | | | 1.25 | (a) | | | 1.25 | (a) |
Net investment income | | | 1.87 | (a) | | | 2.06 | (a) |
Portfolio turnover | | | 16 | (n) | | | 39 | (n) |
Net assets at end of period (000 omitted) | | | $102 | | | | $118 | |
See Notes to Financial Statements
20
Financial Highlights – continued
| | | | | | | | |
| | | Six months
ended
1/31/14 (unaudited) | | | Period ended 7/31/13 (c) | |
| Class R4 | | |
| | | | | |
Net asset value, beginning of period | | | $11.64 | | | | $10.00 | |
| Income (loss) from investment operations | |
Net investment income (d) | | | $0.13 | | | | $0.21 | |
Net realized and unrealized gain (loss) on investments and foreign currency | | | 0.67 | | | | 1.59 | |
Total from investment operations | | | $0.80 | | | | $1.80 | |
| Less distributions declared to shareholders | |
From net investment income | | | $(0.12 | ) | | | $(0.16 | ) |
From net realized gain on investments | | | (0.08 | ) | | | — | |
Total distributions declared to shareholders | | | $(0.20 | ) | | | $(0.16 | ) |
Net asset value, end of period (x) | | | $12.24 | | | | $11.64 | |
Total return (%) (r)(s)(x) | | | 6.88 | (n) | | | 18.18 | (n) |
Ratios (%) (to average net assets)
and Supplemental data: | |
Expenses before expense reductions (f) | | | 1.53 | (a) | | | 3.64 | (a) |
Expenses after expense reductions (f) | | | 1.00 | (a) | | | 1.00 | (a) |
Net investment income | | | 2.13 | (a) | | | 2.32 | (a) |
Portfolio turnover | | | 16 | (n) | | | 39 | (n) |
Net assets at end of period (000 omitted) | | | $99 | | | | $118 | |
See Notes to Financial Statements
21
Financial Highlights – continued
| | | | | | | | |
| | | Six months
ended
1/31/14 (unaudited) | | | Period ended 7/31/13 (c) | |
| Class R5 | | |
| | | | | |
Net asset value, beginning of period | | | $11.65 | | | | $10.00 | |
| Income (loss) from investment operations | |
Net investment income (d) | | | $0.16 | | | | $0.21 | |
Net realized and unrealized gain (loss) on investments and foreign currency | | | 0.65 | | | | 1.60 | |
Total from investment operations | | | $0.81 | | | | $1.81 | |
| Less distributions declared to shareholders | |
From net investment income | | | $(0.12 | ) | | | $(0.16 | ) |
From net realized gain on investments | | | (0.08 | ) | | | — | |
Total distributions declared to shareholders | | | $(0.20 | ) | | | $(0.16 | ) |
Net asset value, end of period (x) | | | $12.26 | | | | $11.65 | |
Total return (%) (r)(s)(x) | | | 6.99 | (n) | | | 18.30 | (n) |
Ratios (%) (to average net assets)
and Supplemental data: | |
Expenses before expense reductions (f) | | | 1.50 | (a) | | | 3.61 | (a) |
Expenses after expense reductions (f) | | | 0.95 | (a) | | | 0.96 | (a) |
Net investment income | | | 2.62 | (a) | | | 2.35 | (a) |
Portfolio turnover | | | 16 | (n) | | | 39 | (n) |
Net assets at end of period (000 omitted) | | | $81 | | | | $1,656 | |
| (c) | For the period from the commencement of the fund’s investment operations, September 27, 2012, through the stated period end. |
| (d) | Per share data is based on average shares outstanding. |
| (f) | Ratios do not reflect reductions from fees paid indirectly, if applicable. |
| (r) | Certain expenses have been reduced without which performance would have been lower. |
| (s) | From time to time the fund may receive proceeds from litigation settlements, without which performance would be lower. |
| (t) | Total returns do not include any applicable sales charges. |
| (x) | The net asset values per share and total returns have been calculated on net assets which include adjustments made in accordance with U.S. generally accepted accounting principles required at period end for financial reporting purposes. |
See Notes to Financial Statements
22
NOTES TO FINANCIAL STATEMENTS
(unaudited)
(1) Business and Organization
MFS Equity Income Fund (the fund) is a series of MFS Series Trust VII (the trust). The trust is organized as a Massachusetts business trust and is registered under the Investment Company Act of 1940, as amended, as an open-end management investment company.
(2) Significant Accounting Policies
General – The preparation of financial statements in conformity with U.S. generally accepted accounting principles requires management to make estimates and assumptions that affect the reported amounts of assets and liabilities, and disclosure of contingent assets and liabilities at the date of the financial statements and the reported amounts of increases and decreases in net assets from operations during the reporting period. Actual results could differ from those estimates. In the preparation of these financial statements, management has evaluated subsequent events occurring after the date of the fund’s Statement of Assets and Liabilities through the date that the financial statements were issued. The fund invests in foreign securities. Investments in foreign securities are vulnerable to the effects of changes in the relative values of the local currency and the U.S. dollar and to the effects of changes in each country’s legal, political, and economic environment.
In this reporting period, the fund adopted the disclosure provisions of the Financial Accounting Standards Board (FASB) Accounting Standards Update 2011-11 (“ASU 2011-11”), Balance Sheet (Topic 210) – Disclosures about Offsetting Assets and Liabilities along with the related scope clarification provisions of FASB Accounting Standards Update 2013-01 (“ASU 2013-01”) entitled Balance Sheet (Topic 210) – Clarifying the Scope of Disclosures about Offsetting Assets and Liabilities. ASU 2011-11 is intended to enhance disclosures on the offsetting of financial assets and liabilities by requiring entities to disclose both gross and net information about financial instruments and transactions that are either offset in the statement of financial position or subject to an enforceable Master Netting Agreement or similar arrangement. ASU 2013-01 limits the scope of ASU 2011-11’s disclosure requirements on offsetting to financial assets and financial liabilities related to derivatives, repurchase and reverse repurchase agreements, and securities lending and securities borrowing transactions. The disclosures required by ASU 2011-11, to the extent applicable to the fund, have been included in the fund’s Significant Accounting Policies note under the captions for each of the fund’s in-scope financial instruments and transactions.
In June 2013, FASB issued Accounting Standards Update 2013-08 (“ASU 2013-08”) Financial Services – Investment Companies (Topic 946) – Amendments to the Scope, Measurement, and Disclosure Requirements which is effective for interim and annual reporting periods in fiscal years that begin after December 15, 2013. ASU 2013-08 sets forth a methodology for determining whether an entity should be characterized as an investment company and prescribes fair value accounting for an investment company’s non-controlling ownership interest in another investment company. FASB has determined that a fund registered under the Investment Company Act of 1940 automatically meets ASU 2013-08’s criteria for an investment company. Although still
23
Notes to Financial Statements (unaudited) – continued
evaluating the potential impacts of ASU 2013-08 to the fund, management expects that the impact of the fund’s adoption will be limited to additional financial statement disclosures.
Investment Valuations – Equity securities, including restricted equity securities, are generally valued at the last sale or official closing price as provided by a third-party pricing service on the market or exchange on which they are primarily traded. Equity securities, for which there were no sales reported that day, are generally valued at the last quoted daily bid quotation as provided by a third-party pricing service on the market or exchange on which such securities are primarily traded. Short-term instruments with a maturity at issuance of 60 days or less generally are valued at amortized cost, which approximates market value. Open-end investment companies are generally valued at net asset value per share. Securities and other assets generally valued on the basis of information from a third-party pricing service may also be valued at a broker/dealer bid quotation. Values obtained from third-party pricing services can utilize both transaction data and market information such as yield, quality, coupon rate, maturity, type of issue, trading characteristics, and other market data. The values of foreign securities and other assets and liabilities expressed in foreign currencies are converted to U.S. dollars using the mean of bid and asked prices for rates provided by a third-party pricing service.
The Board of Trustees has delegated primary responsibility for determining or causing to be determined the value of the fund’s investments (including any fair valuation) to the adviser pursuant to valuation policies and procedures approved by the Board. If the adviser determines that reliable market quotations are not readily available, investments are valued at fair value as determined in good faith by the adviser in accordance with such procedures under the oversight of the Board of Trustees. Under the fund’s valuation policies and procedures, market quotations are not considered to be readily available for most types of debt instruments and floating rate loans and many types of derivatives. These investments are generally valued at fair value based on information from third-party pricing services. In addition, investments may be valued at fair value if the adviser determines that an investment’s value has been materially affected by events occurring after the close of the exchange or market on which the investment is principally traded (such as foreign exchange or market) and prior to the determination of the fund’s net asset value, or after the halting of trading of a specific security where trading does not resume prior to the close of the exchange or market on which the security is principally traded. Events that occur on a frequent basis after foreign markets close (such as developments in foreign markets and significant movements in the U.S. markets) and prior to the determination of the fund’s net asset value may be deemed to have a material effect on the value of securities traded in foreign markets. Accordingly, the fund’s foreign equity securities may often be valued at fair value. The adviser generally relies on third-party pricing services or other information (such as the correlation with price movements of similar securities in the same or other markets; the type, cost and investment characteristics of the security; the business and financial condition of the issuer; and trading and other market data) to assist in determining whether to fair value and at what value to fair value an investment. The value of an investment for purposes of calculating the fund’s net asset value can differ depending on the source and method used to determine value. When fair valuation is used, the
24
Notes to Financial Statements (unaudited) – continued
value of an investment used to determine the fund’s net asset value may differ from quoted or published prices for the same investment. There can be no assurance that the fund could obtain the fair value assigned to an investment if it were to sell the investment at the same time at which the fund determines its net asset value per share.
Various inputs are used in determining the value of the fund’s assets or liabilities. These inputs are categorized into three broad levels. In certain cases, the inputs used to measure fair value may fall into different levels of the fair value hierarchy. In such cases, an investment’s level within the fair value hierarchy is based on the lowest level of input that is significant to the fair value measurement. The fund’s assessment of the significance of a particular input to the fair value measurement in its entirety requires judgment, and considers factors specific to the investment. Level 1 includes unadjusted quoted prices in active markets for identical assets or liabilities. Level 2 includes other significant observable market-based inputs (including quoted prices for similar securities, interest rates, prepayment speed, and credit risk). Level 3 includes unobservable inputs, which may include the adviser’s own assumptions in determining the fair value of investments. The following is a summary of the levels used as of January 31, 2014 in valuing the fund’s assets or liabilities:
| | | | | | | | | | | | | | | | |
| Investments at Value | | Level 1 | | | Level 2 | | | Level 3 | | | Total | |
| Equity Securities: | | | | | | | | | | | | | | | | |
United States | | | $37,227,296 | | | | $— | | | | $— | | | | $37,227,296 | |
Japan | | | — | | | | 1,418,063 | | | | — | | | | 1,418,063 | |
Brazil | | | 1,313,075 | | | | — | | | | — | | | | 1,313,075 | |
United Kingdom | | | 1,215,382 | | | | — | | | | — | | | | 1,215,382 | |
Germany | | | 830,370 | | | | — | | | | — | | | | 830,370 | |
Netherlands | | | 793,909 | | | | — | | | | — | | | | 793,909 | |
Canada | | | 688,000 | | | | — | | | | — | | | | 688,000 | |
Switzerland | | | 485,275 | | | | — | | | | — | | | | 485,275 | |
France | | | 470,277 | | | | — | | | | — | | | | 470,277 | |
Other Countries | | | 1,329,545 | | | | 155,598 | | | | — | | | | 1,485,143 | |
| Mutual Funds | | | 465,654 | | | | — | | | | — | | | | 465,654 | |
| Total Investments | | | $44,818,783 | | | | $1,573,661 | | | | $— | | | | $46,392,444 | |
For further information regarding security characteristics, see the Portfolio of Investments.
Of the level 2 investments presented above, equity investments amounting to $1,236,997 would have been considered level 1 investments at the beginning of the period. The primary reason for changes in the classifications between levels 1 and 2 occurs when foreign equity securities are fair valued using other observable market-based inputs in place of the closing exchange price due to events occurring after the close of the exchange or market on which the investment is principally traded. The fund’s foreign equity securities may often be valued at fair value. The fund’s policy is to recognize transfers between the levels as of the end of the period.
Foreign Currency Translation – Purchases and sales of foreign investments, income, and expenses are converted into U.S. dollars based upon currency exchange rates prevailing on the respective dates of such transactions or on the reporting date for foreign denominated receivables and payables. Gains and losses attributable to foreign
25
Notes to Financial Statements (unaudited) – continued
currency exchange rates on sales of securities are recorded for financial statement purposes as net realized gains and losses on investments. Gains and losses attributable to foreign exchange rate movements on receivables, payables, income and expenses are recorded for financial statement purposes as foreign currency transaction gains and losses. That portion of both realized and unrealized gains and losses on investments that results from fluctuations in foreign currency exchange rates is not separately disclosed.
Indemnifications – Under the fund’s organizational documents, its officers and Trustees may be indemnified against certain liabilities and expenses arising out of the performance of their duties to the fund. Additionally, in the normal course of business, the fund enters into agreements with service providers that may contain indemnification clauses. The fund’s maximum exposure under these agreements is unknown as this would involve future claims that may be made against the fund that have not yet occurred.
Investment Transactions and Income – Investment transactions are recorded on the trade date. Dividends received in cash are recorded on the ex-dividend date. Certain dividends from foreign securities will be recorded when the fund is informed of the dividend if such information is obtained subsequent to the ex-dividend date. Dividend payments received in additional securities are recorded on the ex-dividend date in an amount equal to the value of the security on such date.
The fund may receive proceeds from litigation settlements. Any proceeds received from litigation involving portfolio holdings are reflected in the Statement of Operations in realized gain/loss if the security has been disposed of by the fund or in unrealized gain/loss if the security is still held by the fund. Any other proceeds from litigation not related to portfolio holdings are reflected as other income in the Statement of Operations.
Fees Paid Indirectly – The fund’s custody fee may be reduced according to an arrangement that measures the value of cash deposited with the custodian by the fund. For the six months ended January 31, 2014, custody fees were not reduced.
Tax Matters and Distributions – The fund intends to qualify as a regulated investment company, as defined under Subchapter M of the Internal Revenue Code, and to distribute all of its taxable income, including realized capital gains. As a result, no provision for federal income tax is required. The fund’s federal tax returns, when filed, will remain subject to examination by the Internal Revenue Service for a three year period. Management has analyzed the fund’s tax positions taken on federal and state tax returns for all open tax years and does not believe that there are any uncertain tax positions that require recognition of a tax liability. Foreign taxes, if any, have been accrued by the fund in the accompanying financial statements in accordance with the applicable foreign tax law. Foreign income taxes may be withheld by certain countries in which the fund invests. Additionally, capital gains realized by the fund on securities issued in or by certain foreign countries may be subject to capital gains tax imposed by those countries.
Distributions to shareholders are recorded on the ex-dividend date. Income and capital gain distributions are determined in accordance with income tax regulations, which may differ from U.S. generally accepted accounting principles. Certain capital accounts
26
Notes to Financial Statements (unaudited) – continued
in the financial statements are periodically adjusted for permanent differences in order to reflect their tax character. These adjustments have no impact on net assets or net asset value per share. Temporary differences which arise from recognizing certain items of income, expense, gain or loss in different periods for financial statement and tax purposes will reverse at some time in the future. Distributions in excess of net investment income or net realized gains are temporary overdistributions for financial statement purposes resulting from differences in the recognition or classification of income or distributions for financial statement and tax purposes.
Book/tax differences primarily relate to wash sale loss deferrals.
The tax character of distributions made during the current period will be determined at fiscal year end. The tax character of distributions declared to shareholders for the last fiscal year is as follows:
| | | | |
| | | 7/31/13 | |
Ordinary income (including any
short-term capital gains) | | | $127,225 | |
The federal tax cost and the tax basis components of distributable earnings were as follows:
| | | | |
| As of 1/31/14 | | | |
| Cost of investments | | | $42,829,868 | |
| Gross appreciation | | | 4,450,821 | |
| Gross depreciation | | | (888,245 | ) |
| Net unrealized appreciation (depreciation) | | | $3,562,576 | |
| |
| As of 7/31/13 | | | |
| Undistributed ordinary income | | | 190,653 | |
| Other temporary differences | | | (187 | ) |
| Net unrealized appreciation (depreciation) | | | 1,634,848 | |
The aggregate cost above includes prior fiscal year end tax adjustments, if applicable.
Multiple Classes of Shares of Beneficial Interest – The fund offers multiple classes of shares, which differ in their respective distribution and service fees. The fund’s income, realized and unrealized gain (loss), and common expenses are allocated to shareholders based on the daily net assets of each class. Dividends are declared separately for each class. Differences in per share dividend rates are generally due to differences in separate class expenses. Class B shares will convert to Class A shares
27
Notes to Financial Statements (unaudited) – continued
approximately eight years after purchase. The fund’s distributions declared to shareholders as reported in the Statements of Changes in Net Assets are presented by class as follows:
| | | | | | | | | | | | | | | | |
| | | From net investment
income | | | From net realized gain on
investments | |
| | | Six months
ended
1/31/14 | | | Period
ended
7/31/13 (c) | | | Six months
ended
1/31/14 | | | Period
ended
7/31/13 (c) | |
| Class A | | | $246,616 | | | | $78,620 | | | | $215,877 | | | | $— | |
| Class B | | | 7,203 | | | | 2,873 | | | | 10,415 | | | | — | |
| Class C | | | 32,771 | | | | 14,890 | | | | 47,540 | | | | — | |
| Class I | | | 7,173 | | | | 3,146 | | | | 5,917 | | | | — | |
| Class R1 | | | 545 | | | | 821 | | | | 838 | | | | — | |
| Class R2 | | | 870 | | | | 1,210 | | | | 857 | | | | — | |
| Class R3 | | | 1,047 | | | | 1,405 | | | | 865 | | | | — | |
| Class R4 | | | 1,180 | | | | 1,600 | | | | 846 | | | | — | |
| Class R5 | | | 16,948 | | | | 22,660 | | | | 11,850 | | | | — | |
| Total | | | $314,353 | | | | $127,225 | | | | $295,005 | | | | $— | |
| (c) | For the period from the commencement of the fund’s investment operations, September 27, 2012, through the stated period end. |
(3) Transactions with Affiliates
Investment Adviser – The fund has an investment advisory agreement with MFS to provide overall investment management and related administrative services and facilities to the fund. The management fee is computed daily and paid monthly at the following annual rates:
| | | | |
| First $1 billion of average daily net assets | | | 0.75 | % |
| Next $1.5 billion of average daily net assets | | | 0.65 | % |
| Average daily net assets in excess of $2.5 billion | | | 0.60 | % |
MFS has agreed in writing to reduce its management fee by a specified amount if certain MFS mutual fund assets exceed thresholds agreed to by MFS and the fund’s Board of Trustees. For the six months ended January 31, 2014, this management fee reduction amounted to $396, which is included in the reduction of total expenses in the Statement of Operations. The management fee incurred for the six months ended January 31, 2014 was equivalent to an annual effective rate of 0.75% of the fund’s average daily net assets.
The investment adviser has agreed in writing to pay a portion of the fund’s total annual operating expenses, exclusive of interest, taxes, extraordinary expenses, brokerage and transaction costs, and investment-related expenses, such that total fund operating expenses do not exceed the following rates annually of each class’s average daily net assets:
| | | | | | | | | | | | | | | | | | | | | | | | | | | | | | | | |
| Classes | |
| A | | B | | | C | | | I | | | R1 | | | R2 | | | R3 | | | R4 | | | R5 | |
| 1.25% | | | 2.00% | | | | 2.00% | | | | 1.00% | | | | 2.00% | | | | 1.50% | | | | 1.25% | | | | 1.00% | | | | 0.97% | |
This written agreement will continue until modified by the fund’s Board of Trustees, but such agreement will continue at least until November 30, 2014. For the six months
28
Notes to Financial Statements (unaudited) – continued
ended January 31, 2014, this reduction amounted to $100,731 and is included in the reduction of total expenses in the Statement of Operations.
Distributor – MFS Fund Distributors, Inc. (MFD), a wholly-owned subsidiary of MFS, as distributor, received $65,415 for the six months ended January 31, 2014, as its portion of the initial sales charge on sales of Class A shares of the fund.
The Board of Trustees has adopted a distribution plan for certain class shares pursuant to Rule 12b-1 of the Investment Company Act of 1940.
The fund’s distribution plan provides that the fund will pay MFD for services provided by MFD and financial intermediaries in connection with the distribution and servicing of certain share classes. One component of the plan is a distribution fee paid to MFD and another component of the plan is a service fee paid to MFD. MFD may subsequently pay all, or a portion, of the distribution and/or service fees to financial intermediaries.
Distribution Plan Fee Table:
| | | | | | | | | | | | | | | | | | | | |
| | | Distribution
Fee Rate (d) | | | Service
Fee Rate (d) | | | Total
Distribution
Plan (d) | | | Annual
Effective
Rate (e) | | | Distribution
and Service
Fee | |
| Class A | | | — | | | | 0.25% | | | | 0.25% | | | | 0.25% | | | | $35,527 | |
| Class B | | | 0.75% | | | | 0.25% | | | | 1.00% | | | | 1.00% | | | | 6,616 | |
| Class C | | | 0.75% | | | | 0.25% | | | | 1.00% | | | | 1.00% | | | | 32,491 | |
| Class R1 | | | 0.75% | | | | 0.25% | | | | 1.00% | | | | 1.00% | | | | 577 | |
| Class R2 | | | 0.25% | | | | 0.25% | | | | 0.50% | | | | 0.50% | | | | 292 | |
| Class R3 | | | — | | | | 0.25% | | | | 0.25% | | | | 0.25% | | | | 149 | |
| Total Distribution and Service Fees | | | | | | | | | | | | | | | | $75,652 | |
| (d) | In accordance with the distribution plan for certain classes, the fund pays distribution and/or service fees equal to these annual percentage rates of each class’s average daily net assets. The distribution and service fee rates disclosed by class represent the current rates in effect at the end of the reporting period. Any rate changes, if applicable, are detailed below. |
| (e) | The annual effective rates represent actual fees incurred under the distribution plan for the six months ended January 31, 2014 based on each class’s average daily net assets. MFD has voluntarily agreed to rebate a portion of each class’s 0.25% service fee attributable to accounts for which MFD retains the 0.25% service fee except for accounts attributable to MFS or its affiliates’ seed money. For the six months ended January 31, 2014, this rebate amounted to $275 for Class A and is included in the reduction of total expenses in the Statement of Operations. |
Certain Class A shares are subject to a contingent deferred sales charge (CDSC) in the event of a shareholder redemption within 18 months of purchase. Class C shares are subject to a CDSC in the event of a shareholder redemption within 12 months of purchase. Class B shares are subject to a CDSC in the event of a shareholder redemption within six years of purchase. All contingent deferred sales charges are paid to MFD and during the six months ended January 31, 2014, were as follows:
| | | | |
| | | Amount | |
| Class A | | | $6,650 | |
| Class B | | | 206 | |
| Class C | | | 376 | |
29
Notes to Financial Statements (unaudited) – continued
Shareholder Servicing Agent – MFS Service Center, Inc. (MFSC), a wholly-owned subsidiary of MFS, receives a fee from the fund for its services as shareholder servicing agent calculated as a percentage of the average daily net assets of the fund as determined periodically under the supervision of the fund’s Board of Trustees. For the six months ended January 31, 2014, the fee was $2,633, which equated to 0.0136% annually of the fund’s average daily net assets. MFSC also receives payment from the fund for out-of-pocket expenses, sub-accounting and other shareholder servicing costs which may be paid to affiliated and unaffiliated service providers. Class R5 shares do not incur sub-accounting fees. For the six months ended January 31, 2014, these out-of-pocket expenses, sub-accounting and other shareholder servicing costs amounted to $10,968.
Administrator – MFS provides certain financial, legal, shareholder communications, compliance, and other administrative services to the fund. Under an administrative services agreement, the fund partially reimburses MFS the costs incurred to provide these services. The fund is charged an annual fixed amount of $17,500 plus a fee based on average daily net assets. The administrative services fee incurred for the six months ended January 31, 2014 was equivalent to an annual effective rate of 0.0455% of the fund’s average daily net assets.
Trustees’ and Officers’ Compensation – The fund pays compensation to independent Trustees in the form of a retainer, attendance fees, and additional compensation to Board and Committee chairpersons. The fund does not pay compensation directly to Trustees or officers of the fund who are also officers of the investment adviser, all of whom receive remuneration for their services to the fund from MFS. Certain officers and Trustees of the fund are officers or directors of MFS, MFD, and MFSC.
Other – This fund and certain other funds managed by MFS (the funds) have entered into services agreements (the Agreements) which provide for payment of fees by the funds to Tarantino LLC and Griffin Compliance LLC in return for the provision of services of an Independent Chief Compliance Officer (ICCO) and Assistant ICCO, respectively, for the funds. The ICCO and Assistant ICCO are officers of the funds and the sole members of Tarantino LLC and Griffin Compliance LLC, respectively. The funds can terminate the Agreements with Tarantino LLC and Griffin Compliance LLC at any time under the terms of the Agreements. For the six months ended January 31, 2014, the aggregate fees paid by the fund to Tarantino LLC and Griffin Compliance LLC were $63 and are included in “Miscellaneous” expense in the Statement of Operations. MFS has agreed to reimburse the fund for a portion of the payments made by the fund in the amount of $19, which is included in the reduction of total expenses in the Statement of Operations. Additionally, MFS has agreed to bear all expenses associated with office space, other administrative support, and supplies provided to the ICCO and Assistant ICCO.
The fund invests in the MFS Institutional Money Market Portfolio which is managed by MFS and seeks current income consistent with preservation of capital and liquidity. Income earned on this investment is included in “Dividends from underlying affiliated funds” in the Statement of Operations. This money market fund does not pay a management fee to MFS.
30
Notes to Financial Statements (unaudited) – continued
On September 26, 2012, MFS purchased 10,000 shares each of Class A, Class B, Class C, Class I, Class R1, Class R2, Class R3, and Class R4 and 140,000 shares of Class R5 for an aggregate amount of $2,200,000.
On September 11, 2013, MFS redeemed 10,094 shares of Class A and 10,069 shares of Class C for an aggregate amount of $234,395.
On December 11, 2013, MFS redeemed 2,140 shares of Class B, 2,262 shares of Class I, 2,133 shares of Class R1, 2,200 shares of Class R2, 2,226 shares of Class R3, 2,259 shares of Class R4, and 137,883 shares of Class R5 for an aggregate amount of $1,849,420.
At January 31, 2014, MFS held 100%, 98%, 97%, 100%, and 100% of the outstanding shares of Class R1, Class R2, Class R3, Class R4, and Class R5, respectively.
(4) Portfolio Securities
Purchases and sales of investments, other than short-term obligations, aggregated $23,143,891 and $5,983,238, respectively.
(5) Shares of Beneficial Interest
The fund’s Declaration of Trust permits the Trustees to issue an unlimited number of full and fractional shares of beneficial interest. Transactions in fund shares were as follows:
| | | | | | | | | | | | | | | | |
| | | Six months ended
1/31/14 | | | Period ended
7/31/13 (c) | |
| | | Shares | | | Amount | | | Shares | | | Amount | |
| Shares sold | | | | | | | | | | | | | | | | |
Class A | | | 1,465,882 | | | | $17,587,584 | | | | 1,773,673 | | | | $19,435,882 | |
Class B | | | 89,680 | | | | 1,079,234 | | | | 71,052 | | | | 772,908 | |
Class C | | | 284,523 | | | | 3,412,104 | | | | 419,314 | | | | 4,592,618 | |
Class I | | | 76,646 | | | | 928,076 | | | | 100,671 | | | | 1,032,111 | |
Class R1 | | | — | | | | — | | | | 10,000 | | | | 100,000 | |
Class R2 | | | 188 | | | | 2,206 | | | | 10,000 | | | | 100,000 | |
Class R3 | | | 257 | | | | 3,028 | | | | 10,000 | | | | 100,000 | |
Class R4 | | | — | | | | — | | | | 10,000 | | | | 100,000 | |
Class R5 | | | — | | | | — | | | | 140,000 | | | | 1,400,000 | |
| | | 1,917,176 | | | | $23,012,232 | | | | 2,544,710 | | | | $27,633,519 | |
| | | | |
| Shares issued to shareholders in reinvestment of distributions | | | | | | | | | | | | | | | | |
Class A | | | 37,263 | | | | $455,227 | | | | 7,031 | | | | $76,867 | |
Class B | | | 1,205 | | | | 14,737 | | | | 215 | | | | 2,297 | |
Class C | | | 6,294 | | | | 76,953 | | | | 1,333 | | | | 14,549 | |
Class I | | | 1,071 | | | | 13,090 | | | | 293 | | | | 3,146 | |
Class R1 | | | 113 | | | | 1,383 | | | | 79 | | | | 821 | |
Class R2 | | | 141 | | | | 1,726 | | | | 116 | | | | 1,210 | |
Class R3 | | | 157 | | | | 1,912 | | | | 134 | | | | 1,405 | |
Class R4 | | | 166 | | | | 2,026 | | | | 153 | | | | 1,600 | |
Class R5 | | | 2,364 | | | | 28,798 | | | | 2,161 | | | | 22,660 | |
| | | 48,774 | | | | $595,852 | | | | 11,515 | | | | $124,555 | |
31
Notes to Financial Statements (unaudited) – continued
| | | | | | | | | | | | | | | | |
| | | Six months ended
1/31/14 | | | Period ended
7/31/13 (c) | |
| | | Shares | | | Amount | | | Shares | | | Amount | |
| Shares reacquired | | | | | | | | | | | | | | | | |
Class A | | | (289,713 | ) | | | $(3,504,589 | ) | | | (154,571 | ) | | | $(1,739,941 | ) |
Class B | | | (16,974 | ) | | | (206,939 | ) | | | (1,397 | ) | | | (15,408 | ) |
Class C | | | (63,889 | ) | | | (766,747 | ) | | | (12,577 | ) | | | (138,555 | ) |
Class I | | | (11,330 | ) | | | (135,468 | ) | | | (57,458 | ) | | | (583,587 | ) |
Class R1 | | | (2,134 | ) | | | (26,114 | ) | | | — | | | | — | |
Class R2 | | | (2,201 | ) | | | (26,938 | ) | | | — | | | | — | |
Class R3 | | | (2,226 | ) | | | (27,249 | ) | | | — | | | | — | |
Class R4 | | | (2,259 | ) | | | (27,655 | ) | | | — | | | | — | |
Class R5 | | | (137,883 | ) | | | (1,687,200 | ) | | | — | | | | — | |
| | | (528,609 | ) | | | $(6,408,899 | ) | | | (226,003 | ) | | | $(2,477,491 | ) |
| | | | |
| Net change | | | | | | | | | | | | | | | | |
Class A | | | 1,213,432 | | | | $14,538,222 | | | | 1,626,133 | | | | $17,772,808 | |
Class B | | | 73,911 | | | | 887,032 | | | | 69,870 | | | | 759,797 | |
Class C | | | 226,928 | | | | 2,722,310 | | | | 408,070 | | | | 4,468,612 | |
Class I | | | 66,387 | | | | 805,698 | | | | 43,506 | | | | 451,670 | |
Class R1 | | | (2,021 | ) | | | (24,731 | ) | | | 10,079 | | | | 100,821 | |
Class R2 | | | (1,872 | ) | | | (23,006 | ) | | | 10,116 | | | | 101,210 | |
Class R3 | | | (1,812 | ) | | | (22,309 | ) | | | 10,134 | | | | 101,405 | |
Class R4 | | | (2,093 | ) | | | (25,629 | ) | | | 10,153 | | | | 101,600 | |
Class R5 | | | (135,519 | ) | | | (1,658,402 | ) | | | 142,161 | | | | 1,422,660 | |
| | | 1,437,341 | | | | $17,199,185 | | | | 2,330,222 | | | | $25,280,583 | |
| (c) | For the period from the commencement of the fund’s investment operations, September 27, 2012, through the stated period end. |
(6) Line of Credit
The fund and certain other funds managed by MFS participate in a $1.1 billion unsecured committed line of credit, subject to a $1 billion sublimit, provided by a syndication of banks under a credit agreement. Borrowings may be made for temporary financing needs. Interest is charged to each fund, based on its borrowings, generally at a rate equal to the higher of the Federal Reserve funds rate or one month LIBOR plus an agreed upon spread. A commitment fee, based on the average daily, unused portion of the committed line of credit, is allocated among the participating funds at the end of each calendar quarter. In addition, the fund and other funds managed by MFS have established unsecured uncommitted borrowing arrangements with certain banks for temporary financing needs. Interest is charged to each fund, based on its borrowings, at a rate equal to the Federal Reserve funds rate plus an agreed upon spread. For the six months ended January 31, 2014, the fund’s commitment fee and interest expense were $35 and $0, respectively, and are included in “Miscellaneous” expense in the Statement of Operations.
32
Notes to Financial Statements (unaudited) – continued
(7) Transactions in Underlying Affiliated Funds-Affiliated Issuers
An affiliated issuer may be considered one in which the fund owns 5% or more of the outstanding voting securities, or a company which is under common control. For the purposes of this report, the fund assumes the following to be an affiliated issuer:
| | | | | | | | | | | | | | | | |
| Underlying Affiliated Fund | | Beginning
Shares/Par
Amount | | | Acquisitions
Shares/Par
Amount | | | Dispositions
Shares/Par
Amount | | | Ending
Shares/Par
Amount | |
| MFS Institutional Money Market Portfolio | | | 723,940 | | | | 13,429,663 | | | | (13,687,949 | ) | | | 465,654 | |
| | | | |
| Underlying Affiliated Fund | | Realized
Gain (Loss) | | | Capital Gain
Distributions | | | Dividend
Income | | | Ending
Value | |
| MFS Institutional Money Market Portfolio | | | $— | | | | $— | | | | $287 | | | | $465,654 | |
33
BOARD REVIEW OF INVESTMENT ADVISORY AGREEMENT
A discussion regarding the Board’s approval of the fund’s Investment Advisory Agreement with MFS is available by clicking on the fund’s name under “Mutual Funds” in the “Products” section of the MFS Web site (mfs.com).
PROXY VOTING POLICIES AND INFORMATION
A general description of the MFS funds’ proxy voting policies and procedures is available without charge, upon request, by calling 1-800-225-2606, by visiting the Proxy Voting section of mfs.com or by visiting the SEC’s Web site at http://www.sec.gov.
Information regarding how the fund voted proxies relating to portfolio securities during the most recent twelve-month period ended June 30 is available without charge by visiting the Proxy Voting section of mfs.com or by visiting the SEC’s Web site at http://www.sec.gov.
QUARTERLY PORTFOLIO DISCLOSURE
The fund will file a complete schedule of portfolio holdings with the Securities and Exchange Commission (the Commission) for the first and third quarters of each fiscal year on Form N-Q. A shareholder can obtain the quarterly portfolio holdings report at mfs.com. The fund’s Form N-Q is also available on the EDGAR database on the Commission’s Internet Web site at http://www.sec.gov, and may be reviewed and copied at the:
Public Reference Room
Securities and Exchange Commission
100 F Street, NE, Room 1580
Washington, D.C. 20549
Information on the operation of the Public Reference Room may be obtained by calling the Commission at 1-800-SEC-0330. Copies of the fund’s Form N-Q also may be obtained, upon payment of a duplicating fee, by electronic request at the following e-mail address: publicinfo@sec.gov, or by writing the Public Reference Section at the above address.
FURTHER INFORMATION
From time to time, MFS may post important information about the fund or the MFS funds on the MFS web site (mfs.com). This information is available by visiting the “Commentary & Announcements” and “Market Outlooks” sections of mfs.com or by clicking on the fund’s name under “Mutual Funds” in the “Products” section of mfs.com.
PROVISION OF FINANCIAL REPORTS AND SUMMARY PROSPECTUSES
The fund produces financial reports every six months and updates its summary prospectus and prospectus annually. To avoid sending duplicate copies of materials to households, only one copy of the fund’s annual and semiannual report and summary prospectus may be mailed to shareholders having the same last name and residential address on the fund’s records. However, any shareholder may contact MFSC (please see back cover for address and telephone number) to request that copies of these reports and summary prospectuses be sent personally to that shareholder.
34
Save paper with eDelivery.

| MFS® will send you prospectuses, |
reports, and proxies directly via e-mail so you will get information faster with less mailbox clutter.
To sign up:
1. Go to mfs.com.
2. Log in via MFS® Access.
3. Select eDelivery.
If you own your MFS fund shares through a financial institution or a retirement plan, MFS® TALK, MFS® Access, or eDelivery may not be available to you.
CONTACT
WEB SITE
mfs.com
MFS TALK
1-800-637-8255
24 hours a day
ACCOUNT SERVICE AND LITERATURE
Shareholders
1-800-225-2606
Financial advisors
1-800-343-2829
Retirement plan services
1-800-637-1255
MAILING ADDRESS
MFS Service Center, Inc.
P.O. Box 55824
Boston, MA 02205-5824
OVERNIGHT MAIL
MFS Service Center, Inc.
c/o Boston Financial Data Services
30 Dan Road
Canton, MA 02021-2809
During the period covered by this report, the Registrant has not amended any provision in its Code of Ethics (the “Code”) that relates to an element of the Code’s definitions enumerated in paragraph (b) of Item 2 of this Form N-CSR. During the period covered by this report, the Registrant did not grant a waiver, including an implicit waiver, from any provision of the Code.
| ITEM 3. | AUDIT COMMITTEE FINANCIAL EXPERT. |
Not applicable for semi-annual reports.
| ITEM 4. | PRINCIPAL ACCOUNTANT FEES AND SERVICES. |
Not applicable for semi-annual reports.
| ITEM 5. | AUDIT COMMITTEE OF LISTED REGISTRANTS. |
Not applicable to the Registrant.
A schedule of investments for each series of the Registrant is included as part of the report to shareholders of such series under Item 1 of this Form N-CSR.
| ITEM 7. | DISCLOSURE OF PROXY VOTING POLICIES AND PROCEDURES FOR CLOSED-END MANAGEMENT INVESTMENT COMPANIES. |
Not applicable to the Registrant.
| ITEM 8. | PORTFOLIO MANAGERS OF CLOSED-END MANAGEMENT INVESTMENT COMPANIES. |
Not applicable to the Registrant.
| ITEM 9. | PURCHASES OF EQUITY SECURITIES BY CLOSED-END MANAGEMENT INVESTMENT COMPANY AND AFFILIATED PURCHASERS. |
Not applicable to the Registrant.
| ITEM 10. | SUBMISSION OF MATTERS TO A VOTE OF SECURITY HOLDERS. |
There were no material changes to the procedures by which shareholders may send recommendations to the Board for nominees to the Registrant’s Board since the Registrant last provided disclosure as to such procedures in response to the requirements of Item 407 (c)(2)(iv) of Regulation S-K or this Item.
| ITEM 11. | CONTROLS AND PROCEDURES. |
| (a) | Based upon their evaluation of the effectiveness of the registrant’s disclosure controls and procedures (as defined in Rule 30a-3(c) under the Investment Company Act of 1940 (the “Act”)) as conducted within 90 days of the filing date of this report on Form N-CSR, the registrant’s principal financial officer and principal executive officer have concluded that those disclosure controls and procedures provide reasonable assurance that the material information required to be disclosed by the registrant on this report is recorded, processed, summarized and reported within the time periods specified in the Securities and Exchange Commission’s rules and forms. |
| (b) | There were no changes in the registrant’s internal controls over financial reporting (as defined in Rule 30a-3(d) under the Act) that occurred during the second fiscal quarter of the period covered by the report that have materially affected, or are reasonably likely to materially affect, the registrant’s internal control over financial reporting. |
| (a) | File the exhibits listed below as part of this form. Letter or number the exhibits in the sequence indicated. |
| | (1) | Any code of ethics, or amendment thereto, that is the subject of the disclosure required by Item 2, to the extent that the registrant intends to satisfy the Item 2 requirements through filing of an exhibit. |
| | (2) | A separate certification for each principal executive officer and principal financial officer of the registrant as required by Rule 30a-2 under the Act (17 CFR 270.30a-2): Attached hereto. |
| (b) | If the report is filed under Section 13(a) or 15(d) of the Exchange Act, provide the certifications required by Rule 30a-2(b) under the Act (17 CFR 270.30a-2(b)), Rule 13a-14(b) or Rule 15d-14(b) under the Exchange Act (17 CFR 240.13a-14(b) or 240.15d-14(b)) and Section 1350 of Chapter 63 of Title 18 of the United States Code (18 U.S.C. 1350) as an exhibit. A certification furnished pursuant to this paragraph will not be deemed “filed” for the purposes of Section 18 of the Exchange Act (15 U.S.C. 78r), or otherwise subject to the liability of that section. Such certification will not be deemed to be incorporated by reference into any filing under the Securities Act of 1933 or the Exchange Act, except to the extent that the registrant specifically incorporates it by reference: Attached hereto. |
Notice
A copy of the Amended and Restated Declaration of Trust, as amended, of the Registrant is on file with the Secretary of State of The Commonwealth of Massachusetts and notice is hereby given that this instrument is executed on behalf of the Registrant by an officer of the Registrant as an officer and not individually and the obligations of or arising out of this instrument are not binding upon any of the Trustees or shareholders individually, but are binding only upon the assets and property of the respective constituent series of the Registrant.
SIGNATURES
Pursuant to the requirements of the Securities Exchange Act of 1934 and the Investment Company Act of 1940, the registrant has duly caused this report to be signed on its behalf by the undersigned, thereunto duly authorized.
(Registrant) MFS SERIES TRUST VII
| | |
| By (Signature and Title)* | | JOHN M. CORCORAN |
| | John M. Corcoran, President |
Date: March 18, 2014
Pursuant to the requirements of the Securities Exchange Act of 1934 and the Investment Company Act of 1940, this report has been signed below by the following persons on behalf of the registrant and in the capacities and on the dates indicated.
| | |
| By (Signature and Title)* | | JOHN M. CORCORAN |
| | John M. Corcoran, President (Principal Executive Officer) |
Date: March 18, 2014
| | |
| By (Signature and Title)* | | DAVID L. DILORENZO |
| | David L. DiLorenzo, Treasurer (Principal Financial Officer and Accounting Officer) |
Date: March 18, 2014
| * | Print name and title of each signing officer under his or her signature. |