UNITED STATES
SECURITIES AND EXCHANGE COMMISSION
Washington, D.C. 20549
FORM N-CSR
CERTIFIED SHAREHOLDER REPORT OF REGISTERED MANAGEMENT
INVESTMENT COMPANIES
Investment Company Act file number 811-03091
Name of Fund: BlackRock Series Fund, Inc.
BlackRock Balanced Capital Portfolio
BlackRock Capital Appreciation Portfolio
BlackRock Global Allocation Portfolio
BlackRock High Yield Portfolio
BlackRock Large Cap Core Portfolio
BlackRock Money Market Portfolio
BlackRock Total Return Portfolio
BlackRock U.S. Government Bond Portfolio
Fund Address: 100 Bellevue Parkway, Wilmington, DE 19809
Name and address of agent for service: John M. Perlowski, Chief Executive Officer, BlackRock Series Fund, Inc., 55 East 52nd Street, New York, NY 10055
Registrant’s telephone number, including area code: (800) 456-4587
Date of fiscal year end: 12/31/2011
Date of reporting period: 12/31/2011
Item 1 – Report to Stockholders
| |
 | December 31, 2011 |
Annual Report
BlackRock Series Fund, Inc.
} BlackRock Balanced Capital Portfolio
} BlackRock Capital Appreciation Portfolio
} BlackRock Global Allocation Portfolio
} BlackRock High Yield Portfolio
} BlackRock Large Cap Core Portfolio
} BlackRock Money Market Portfolio
} BlackRock Total Return Portfolio
} BlackRock U.S. Government Bond Portfolio
Dear Shareholder
Investors endured a very difficult environment in 2011. Financial markets were extremely volatile as a number of high-profile global events drove frequent about-face changes in investor sentiment. As the year progressed, news flow increasingly influenced trading decisions, to the point where company fundamentals were largely ignored. In the end, lower-risk assets won the “risk on — risk off” trading tug-of-war that characterized 2011’s market activity.
Early in the year, political turmoil swept across the Middle East/North Africa region and prices of oil and other commodities soared. Natural disasters in Japan disrupted global supply chains and concerns mounted regarding US debt and deficit issues. Nevertheless, equities, commodities and high yield bonds outpaced the less risky asset classes as investors chose to focus on the continuing stream of strong corporate earnings and positive economic data.
Markets reversed sharply in May, however, when the heightened possibility of Greece defaulting on its debt rekindled fears about sovereign debt problems spreading across Europe. Concurrently, economic indicators signaled that the recovery had slowed in the United States and other developed nations. Confidence was further shaken by the prolonged debt ceiling debate in Washington, DC. On August 5th, Standard & Poor’s downgraded the US government’s credit rating and turmoil erupted in financial markets around the world. Extraordinary levels of volatility persisted in the months that followed as Greece teetered on the brink of default, debt problems escalated in Italy and Spain, and exposure to European sovereign bonds stressed banks globally. Late in the summer, economic data out of the United States and Europe grew increasingly bleak while China and other emerging economies began to show signs of slowing growth. By the end of the third quarter, equity markets had fallen nearly 20% from their April peak while safe-haven assets such as US Treasuries and gold had rallied to historical highs.
October brought enough positive economic data to assuage fears of a global double-dip recession. Additionally, after months of deliberation, European leaders began to show signs of progress toward stemming the region’s debt crisis. These encouraging developments brought investors back from the sidelines and risk assets rallied through the month. However, a lack of definitive details about Europe’s rescue plan soon raised doubts among investors and thwarted the rally at the end of October. The last two months of the year saw political instability in Greece, unsustainable yields on Italian bonds, and US policymakers bickering over budget issues. Global central bank actions and improving economic data energized investors, but confidence was easily tempered by sobering news flow that resurrected uncertainty about the ability of Europe’s leaders to ultimately contain the debt crisis.
Most equity markets failed to fully recover their late-summer losses, although US large cap stocks managed to finish the year with a marginal gain given their perceived safety and stronger US economic data. Conditions were worse overseas, and international markets experienced some significant downturns. Dividend-paying stocks performed relatively well as investors sought yield in the low interest rate environment. Fixed income securities benefited from declining yields and delivered positive returns for the year. US Treasury bonds outperformed other fixed income classes despite their quality rating downgrade, while municipal bonds also delivered superior results. Continued low short-term interest rates kept yields on money market securities near their all-time lows.
Many of the themes that caused uncertainty in 2011 are likely to persist well into 2012. While the investment landscape appears treacherous, BlackRock is working for you. We have a roadmap to show you the way.
Sincerely,

Rob Kapito
President, BlackRock Advisors, LLC

“While the investment landscape appears treacherous, BlackRock is working for you. We have a roadmap to show you the way.”
Rob Kapito
President, BlackRock Advisors, LLC
Total Returns as of December 31, 2011
| | 6-month | 12- month |
| US large cap equities | (3.69 | )% | 2.11 | % |
| (S&P 500® Index) | | | | |
| US small cap equities | (9.77 | ) | (4.18 | ) |
| (Russell 2000® Index) | | | | |
| International equities | (16.31 | ) | (12.14 | ) |
| (MSCI Europe, Australasia, | | | | |
| Far East Index) | | | | |
| Emerging market equities | (19.13 | ) | (18.42 | ) |
| (MSCI Emerging Markets Index) | | | | |
| 3-month Treasury bill | 0.02 | | 0.10 | |
| (BofA Merrill Lynch 3-Month | | | | |
| Treasury Bill Index) | | | | |
| US Treasury securities | 13.46 | | 17.15 | |
| (BofA Merrill Lynch 10-Year | | | | |
| US Treasury Index) | | | | |
| US investment grade bonds | 4.98 | | 7.84 | |
| (Barclays Capital | | | | |
| US Aggregate Bond Index) | | | | |
| Tax-exempt municipal bonds | 5.78 | | 10.62 | |
| (S&P Municipal Bond Index) | | | | |
| US high yield bonds | (0.02 | ) | 4.96 | |
| (Barclays Capital US | | | | |
| Corporate High Yield 2% | | | | |
| Issuer Capped Index) | | | | |
Past performance is no guarantee of future results. Index performance is shown for illustrative purposes only. You cannot invest directly in an index.
| | THIS PAGE NOT PART OF YOUR FUND REPORT | 3 |
Fund Summary as of December 31, 2011
BlackRock Balanced Capital Portfolio
Investment Objective
BlackRock Balanced Capital Portfolio’s (the “Portfolio”) investment objective is to seek high total investment return.
At its meeting on November 8-9, 2011, the Board of Directors (the “Board”) of BlackRock Series Fund, Inc. approved a change in the Portfolio’s non-fundamental investment policies. The Board approved a proposal to eliminate the Portfolio’s non-fundamental policy that had prevented the Portfolio from investing in securities of foreign issuers if at the time of acquisition more than 25% of the Portfolio’s total assets would be invested in such securities. These changes are effective on February 27, 2012.
Portfolio Management Commentary
How did the Portfolio perform?
| • | | For the 12-month period ended December 31, 2011, the Portfolio returned 4.58%, outperforming its blended benchmark (60% Russell 1000® Index/40% Barclays Capital US Aggregate Bond Index), which returned 4.34% for the same period. The Barclays Capital US Aggregate Bond Index advanced 7.84%, while the Russell 1000® Index gained only 1.50%. |
What factors influenced performance?
| • | | From an asset class perspective, the Portfolio benefited from its allocation decisions during the year. Early in 2011, the Portfolio was overweight in equities versus fixed income, which had a positive impact as equities advanced. Later in the year, the Portfolio benefited from a tactical move to an underweight equity position. |
| • | | In the equity portion of the Portfolio, stock selection produced mixed results. Security selection in the biotechnology and health care providers & services industries added value, though selection within the telecommunications services, industrials and utilities sectors hindered performance. |
| • | | The Portfolio’s sector overweight in health care had a positive impact on performance as well as an underweight to the financials sector, particularly with respect to diversified financial service companies. In materials, an emphasis on the chemicals and paper & forest products industries also contributed positively. |
| • | | In the fixed income portion of the Portfolio, a short duration stance had a negative impact as interest rates declined over the period. An overweight in non-government spread sectors (securities driven by movements in credit risk) and corresponding underweight in government owned/government-related sectors also hurt performance as spread sectors broadly underperformed the government sectors during the period. Additionally, within investment grade corporate credit, relative value trading in US financials and industrials detracted from returns. |
| • | | A high quality bias within the Portfolio’s allocation to spread sectors benefited performance, as did out-of-benchmark exposures to high yield debt and non-agency residential mortgage-backed securities (“MBS”). Relative value trading within securitized products such as agency MBS and asset-backed securities (“ABS”) also helped performance. |
| • | | As part of its investment strategy, the Portfolio uses derivatives as a means to hedge and/or take outright views on interest rates, credit risk and/or foreign exchange positions. During the period, the Portfolio held short positions in US Treasury futures in order to reduce the overall duration profile of the Portfolio. These positions hurt performance as the US Treasury market broadly rallied on the year. Options strategies in the interest rate and foreign exchange markets also detracted from performance, as did interest rate swaps used to manage duration and yield curve positioning. |
Describe recent portfolio activity.
| • | | During the 12-month period, the Portfolio moved to a more cautious stance and reduced exposure to equities in favor of fixed income. Within equities, the Portfolio increased exposure to consumer staples, energy and health care, and reduced its weightings in consumer discretionary, industrials and financials. In fixed income, the Portfolio maintained a short duration bias for most of the year, and increased the overall quality and liquidity of its holdings. The Portfolio tactically traded investment grade credits in industrials and financials. The Portfolio slightly reduced exposure to non-agency residential MBS and commercial mortgage-backed securities (“CMBS”) and added to agency MBS and US Treasury holdings later in the period. |
Describe portfolio positioning at period end.
| • | | Relative to the blended benchmark, the Portfolio ended the period slightly underweight in equities and slightly overweight in fixed income. Within equities, the Portfolio’s largest sector overweights relative to the Russell 1000® Index were in health care, information technology and consumer discretionary. Financials remained the Portfolio’s most significant underweight, followed by industrials and energy. The fixed income segment was underweight relative to the Barclays Capital US Aggregate Bond Index in government sectors in favor of spread sectors. More specifically, the Portfolio was overweight in investment grade corporate credit, CMBS and ABS, as well as agency MBS, while it was underweight in US Treasuries and agency debentures. The Portfolio also held out-of-index allocations to nonagency residential MBS and high yield corporate credit. The Portfolio ended the period with a shorter duration relative to the Barclays Capital US Aggregate Bond Index. |
| 4 | BLACKROCK SERIES FUND, INC. | DECEMBER 31, 2011 |
BlackRock Capital Appreciation Portfolio
Investment Objective
BlackRock Capital Appreciation Portfolio’s (the “Portfolio”) investment objective is to seek long-term growth of capital.
Portfolio Management Commentary
How did the Portfolio perform?
| • | | For the 12-month period ended December 31, 2011, the Portfolio returned (8.66)%, underperforming its benchmark, the Russell 1000® Growth Index, and the broad-market S&P 500® Index, which returned 2.64% and 2.11%, respectively. The following discussion of relative performance pertains to the Russell 1000® Growth Index. |
What factors influenced performance?
| • | | Stock prices were volatile and highly correlated as investor sentiment shifted in response to macro news and global events in 2011. Against this backdrop, the Portfolio’s emphasis on company fundamentals and bias toward opportunistic stocks of higher-growth companies were not rewarded. Key areas of weakness included the information technology (“IT”), energy, health care and industrials sectors. In IT, semiconductor-related companies including Broadcom Corp., Cree, Inc., and Micron Technology, Inc. were among the most notable individual detractors. An underweight position (relative to the Russell 1000® Growth Index) in International Business Machines Corp. and positions in Salesforce.com, Inc. and communications equipment maker Alcatel-Lucent also weighed on results. In the energy sector, coal producer Alpha Natural Resources, Inc. was the greatest laggard. An underweight to Exxon Mobil Corp., a strong performer in the energy sector, also hindered returns. Weakness in health care was largely attributable to the Portfolio’s position in biotechnology firm Dendreon Corp., which released surprisingly disappointing sales results and lowered revenue expectations for its new prostate cancer drug. In industrials, share prices of Delta Air Lines, Inc. and United Continental Holdings, Inc. were negatively impacted by concerns about slowing economic growth and a spike in crude oil prices stemming from political unrest in the Middle East and North Africa. Lackluster performance from cyclical companies including staffing firm Manpower, Inc., construction & mining equipment maker Terex Corp. and truck manufacturer PACCAR, Inc. also hampered results. |
| • | | Portfolio performance benefited from an underweight in the cyclically sensitive materials sector, which was the worst performing sector in the benchmark Russell 1000® Growth Index. A number of individual holdings also added value across various sectors. Apple, Inc. (IT), the Portfolio’s largest holding, was a strong positive contributor on solid iPhone, iPad and personal computer sales. Coal producer Massey Energy Corp. (energy) was another standout performer as shares surged higher following news that the company would be acquired. A position in Starbucks Corp. (consumer discretionary) also benefited Portfolio results. Other key contributors included Whole Foods Market, Inc. (consumer staples), heath care technology company Cerner Corp. (health care) and Boeing Co. (industrials). |
Describe recent portfolio activity.
| • | | At the beginning of the 12-month period, the Portfolio’s holdings reflected a bias toward cyclically sensitive companies and an emphasis on opportunistic stocks. This positioning was moderated over the course of the year as the broader economic outlook became more uncertain. At the sector level, the most notable portfolio changes included increased exposure to energy, where the Portfolio established new positions in exploration & production companies Exxon Mobil Corp. and Range Resources Corp., and consumer staples, where new positions included PepsiCo, Inc. and Wal-Mart Stores, Inc. The Portfolio’s allocations to the IT, industrials and consumer discretionary sectors were reduced during the period. |
Describe portfolio positioning at period end.
| • | | At period end, the most notable sector positioning as compared to the benchmark Russell 1000® Growth Index included overweights in IT and telecommunication services, and underweights in materials, consumer staples and financials. Within IT, the Portfolio was particularly overweight in communications equipment, internet software & services and semiconductor-related names. |
| BLACKROCK SERIES FUND, INC. | DECEMBER 31, 2011 | 5 |
BlackRock Global Allocation Portfolio
Investment Objective
BlackRock Global Allocation Portfolio’s (the “Portfolio”) investment objective is to seek high total investment return.
Portfolio Management Commentary
How did the Portfolio perform?
| • | | For the 12-month period ended December 31, 2011, the Portfolio returned (3.39)%, and underperformed its Reference Benchmark, which returned 0.77%, and outperformed the FTSE World Index, which returned (6.48)%. The Reference Benchmark is comprised as follows: 36% S&P 500® Index; 24% FTSE World Index (Ex-US); 24% BofA Merrill Lynch Current 5-Year US Treasury Index; and 16% Citigroup Non-US Dollar World Government Bond Index. The Portfolio invests in both equities and bonds, and therefore, the Reference Benchmark provides a truer representation of the Portfolio’s composition and a more comparable means for measurement. The following discussion of relative performance pertains to the Reference Benchmark. |
What factors influenced performance?
| • | | Within the equity segment of the Portfolio, stock selection in the United States, Canada and Brazil detracted from relative performance, as did overweight exposure to Russia and India. An overweight in Japan also detracted, although this was partially offset by positive results from stock selection within the country. From a sector perspective, stock selection in energy and consumer discretionary, as well as an underweight and stock selection in consumer staples, had a negative impact. An overweight in materials also weighed on returns, although this was partially offset by good stock selection (led by gold-related securities) in the sector. More broadly, an underweight relative to the Reference Benchmark in fixed income detracted from performance. Within fixed income, security selection in the United States weighed on returns. |
| • | | Contributing positively to performance was a sector overweight and stock selection in telecommunications services (“telecom”) in the equity portion of the Portfolio. |
| • | | The Portfolio’s cash position helped mitigate portfolio volatility and served as a source of funds for new investments. In addition, the Portfolio’s cash position helped keep overall portfolio duration (sensitivity to interest rates) relatively low. The Portfolio’s cash position contributed modestly to performance. |
| • | | The Portfolio uses derivatives, including options, futures, swaps and forward contracts, both to enhance returns of the Portfolio and to hedge (or protect) against adverse movements in currency exchange rates, interest rates and movements in the securities markets. During the period, the Portfolio’s use of derivatives had a positive impact on the absolute performance of the Portfolio. |
Describe recent portfolio activity.
| • | | During the 12-month period, the Portfolio’s overall equity allocation decreased from 65% to 64% of net assets. Within equities, the Portfolio decreased exposure to the United States, Asia and Brazil, and increased exposure to Europe. On a sector basis, the Portfolio decreased its weightings in financials, and increased its weightings in IT, utilities, consumer discretionary, health care and telecom. The Portfolio’s allocation to fixed income increased from 25% to 26% of net assets. The Portfolio increased its weightings in Australian sovereign bonds, nominal US Treasury securities and UK gilts, and decreased exposure to US-denominated foreign corporate bonds, US convertible bonds and US-denominated foreign convertible bonds. |
Describe portfolio positioning at period end.
| • | | Relative to its Reference Benchmark, the Portfolio ended the period overweight in equities and significantly underweight in fixed income with 10% of net assets in cash and cash equivalents. Within the equity segment, the Portfolio was underweight in the United States and Europe, while it was overweight in Asia, particularly in Japan, and Brazil. On a sector basis, the Portfolio was overweight in materials, energy, telecom, IT and health care; while it was underweight in consumer staples, financials, consumer discretionary and industrials. Within fixed income, the Portfolio was underweight in nominal US Treasuries, sovereign debt in Asia, particularly in Japan, and Europe, and overweight sovereign debt in Brazil. In addition, the Portfolio was overweight in convertible bonds and corporate debt. |
| • | | With respect to currency exposure, the Portfolio was underweight in the euro, Japanese yen, US dollar and British pound sterling. The Portfolio was overweight in the Brazilian real, Singapore dollar, Canadian dollar and Russian ruble, as well as several small Asian currencies, including the Malaysian ringgit and Hong Kong dollar. |
| 6 | BLACKROCK SERIES FUND, INC. | DECEMBER 31, 2011 |
BlackRock High Yield Portfolio
Investment Objective
BlackRock High Yield Portfolio’s (the “Portfolio”) investment objective is to seek to maximize total return, consistent with income generation and prudent investment management.
On March 18, 2011, the Board of Directors (the “Board”) of BlackRock Series Fund, Inc. approved a proposal to change the Portfolio’s investment objective from a primary objective of “to seek a high level of current income” and a secondary objective of “to seek capital appreciation when consistent with its primary objective” to “to seek to maximize total return, consistent with income generation and prudent investment management.” In addition, the Board approved a change in the name of the Portfolio from “BlackRock High Income Portfolio” to “BlackRock High Yield Portfolio.” These changes were effective on October 1, 2011.
Portfolio Management Commentary
How did the Portfolio perform?
| • | | For the 12-month period ended December 31, 2011, the Portfolio returned 2.04%, underperforming its benchmark, the Barclays Capital U.S. Corporate High Yield 2% Issuer Capped Index, which returned 4.96%. |
What factors influenced performance?
| • | | The Portfolio’s underweight to names in the higher range of the non-investment grade quality spectrum detracted from performance as higher-quality issues outperformed their lower-rated counterparts amid mounting macroeconomic weakness during the period. Security selection in the automotive, consumer service and non-captive diversified financial sectors also had a negative impact. The Portfolio’s allocations to convertible bonds and preferred securities hindered returns as these assets underperformed high yield bonds during the period. Additionally, the Portfolio held cash as collateral for credit default swap (“CDS”) positions. While holding cash created a drag on returns, this effect was partially offset by positive performance from the CDS transactions. |
| • | | Contributing positively to performance for the period was strong security selection among issues in the middle of the non-investment grade quality range. Additionally, security selection in the independent energy, media (non-cable), electric and wirelines sectors had a positive impact. |
Describe recent portfolio activity.
| • | | During the 12-month period, the Portfolio’s positioning grew more conservative as the outlook for global growth deteriorated. The Portfolio sought more resilient, higher-quality issues paying attractive yields while reducing exposure to lower-quality and higher-beta (i.e. higher sensitivity to market movements) issues with greater economic sensitivity. From a sector perspective, the Portfolio increased exposure to electric names while reducing exposure to packaging. |
Describe portfolio positioning at period end.
| • | | As of period end, the Portfolio was overweight relative to the Barclays Capital U.S. Corporate High Yield 2% Issuer Capped Index in the wireless, chemicals and independent energy sectors, and underweight in more consumer-related segments, such as technology, gaming and building materials. |
| BLACKROCK SERIES FUND, INC. | DECEMBER 31, 2011 | 7 |
BlackRock Large Cap Core Portfolio
Investment Objective
BlackRock Large Cap Core Portfolio’s (the “Portfolio”) investment objective is to seek long-term growth of capital and income, and moderate current income.
Portfolio Management Commentary
How did the Portfolio perform?
| • | | For the 12-month period ended December 31, 2011, the Portfolio returned 2.61%, outperforming its benchmark, the Russell 1000® Index, which returned 1.50%. |
What factors influenced performance?
| • | | The Portfolio’s outperformance was attributable to a substantial sector underweight in financials, especially diversified financial services and capital markets names. These industries underperformed as macroeconomic and regulatory uncertainties continued to plague the sector. In health care, stock selection and a considerable sector overweight aided relative results. Stock selection in biotechnology was particularly rewarding, owing largely to positive pipeline developments for select holdings. Holdings in the health care providers & services industry also enhanced returns as a combination of benign utilization trends and controlled pricing resulted in stellar earnings reports and a positive outlook for health maintenance organizations — a segment in which the Portfolio was overweight. Stock selection in materials also had a positive impact. The Portfolio’s emphasis on the chemicals and paper & forest products industries, which are among the more economically sensitive areas within the sector, was especially beneficial as improving commodity prices and moderately better macroeconomic conditions (most notably in the US) in the later part of the reporting period translated to favorable financial results for these stocks. |
| • | | Detracting from Portfolio performance during the period was stock selection in the telecommunication services sector, where a preference for wireless carriers hurt returns. This segment struggled in the second half of the year on a surprising uptick in the competitive environment and customer churn rates. At the same time, the Portfolio’s lack of exposure to large-cap integrated carriers hindered returns, as these companies generally exhibit stable earnings and cash flows and attractive dividend yields, which made them appealing to equity investors seeking relative stability in the volatile 12-month period. |
| • | | In the utilities sector, the Portfolio’s preference for the more economically sensitive independent power producers (“IPPs”) in lieu of traditional regulated utility companies had a negative impact as IPPs suffered when electricity rates fell due to plunging natural gas prices. Meanwhile, the regulated utility market saw margins increase amid falling borrowing costs, with stocks also benefiting from increased demand for dividend-paying stocks during the period. |
Describe recent portfolio activity.
| • | | During the 12-month period, the Portfolio increased exposure to the health care, consumer staples and energy sectors, and reduced its weightings in consumer discretionary, materials and IT. |
Describe portfolio positioning at period end.
| • | | As of period end, the Portfolio continued to maintain a balance between domestic cyclical holdings and more dependable growth names. The Portfolio’s largest sector overweights relative to the Russell 1000® Index were in health care, IT and consumer discretionary. Financials remained the Portfolio’s most significant underweight, followed by industrials and energy. |
| 8 | BLACKROCK SERIES FUND, INC. | DECEMBER 31, 2011 |
BlackRock Money Market Portfolio
Investment Objective
BlackRock Money Market Portfolio’s (the “Portfolio”) investment objective is to seek to preserve capital, to maintain liquidity and achieve the highest possible current income consistent with the foregoing.
Money Market Overview for the Year Ended December 31, 2011
Throughout the 12-month period ended December 31, 2011, the Federal Open Market Committee (“FOMC”) maintained its target range for the federal funds rate at 0.00% to 0.25%. In June 2011, the FOMC completed its program under which it purchased $600 billion of longer-term US Treasury securities for the purpose of keeping interest rates low. Following its August 9th meeting, the FOMC announced its intention to keep rates low through mid-2013. At its September 21st meeting, the FOMC noted that recent data indicates that economic growth remained slow and inflation had moderated since earlier in the year. Considering these conditions, the FOMC announced its intention to extend the average duration of the US Treasury security portfolio by purchasing an additional $400 billion of long-term Treasury bonds and selling an equal amount of short-term Treasury securities before the end of June 2012. Known as “Operation Twist,” this policy action is designed to put downward pressure on long-term interest rates and make overall conditions more accommodative for economic growth.
In Europe, the sovereign debt crisis escalated in mid-2011 as fiscal problems spread from the peripheral countries of Greece, Portugal and Ireland to the larger nations of Italy and Spain, and ultimately to the core European economies of France and Germany. To help support bank liquidity, the US Federal Reserve Bank lengthened the term of its US dollar liquidity swap facilities with the European Central Bank (“ECB”), the Bank of Canada, the Bank of England and the Swiss National Bank to August 1, 2012. Later in the period, the aforementioned central banks along with the Bank of Japan agreed to reduce the interest rate on loans made through US dollar liquidity swap lines by fifty basis points, thus making it less expensive for banks around the world to borrow US dollars.
In December, the ECB expanded its long-term refinancing operations (“LTRO”) by allowing Euro-zone banks to access loans with maturities of three years against a broader set of eligible collateral. In its first 3-year allotment, 523 banks borrowed C489 billion from the ECB. The second 3-year LTRO is scheduled for February 2012.
London Interbank Offered Rates (“LIBOR”) moved higher by as much as 0.35% during the 12-month period, due in large part to ongoing concerns about European sovereign debt risk. The slope of the LIBOR curve, as measured from one month to one year, steepened to 0.83% at the end of December, from 0.52% a year earlier.
In the short-term tax-exempt market, yields continued to trade at or near historic lows in the 12-month period ended December 31, 2011. The benchmark Securities Industry and Financial Markets Association (“SIFMA”) Index, which represents the average rate on seven-day, high-quality, tax-exempt variable rate demand obligations (as calculated by Municipal Market Data), averaged 0.18% for the period, four basis points lower than the previous 12 months. Longer dated 1-year note levels also moved lower falling by 12 basis points to finish 2011 in the 25 basis points range. The zero interest rate policy by the Federal Reserve and continued strong demand by non-traditional buyers, especially in the variable rate space, were important contributing factors to these lower yields.
Against this rate backdrop, municipal money funds continued to experience outflows in 2011 with total assets falling by 11.5% to $290 billion. Funds were conservative with respect to duration and maintained ample short-term liquidity that positioned weighted average maturities for much of the year in the 30- to 35-day range out of a maximum of 60 days.
The credit outlook for municipals improved in 2011 as tax receipts trended higher and state and local governments were proactive in addressing structural budget imbalances. While this resulted in significant progress with respect to deficit reduction it also contributed to a meaningful decrease in the amount of new issuance on the short end of the curve. For 2011, variable rate supply was down 20% while note issuance fell by 14% over the same period. This trend is expected to continue in 2012 as municipalities look to limit spending further in the face of diminishing stimulus from the federal government.
Past performance is no guarantee of future results. Index performance is shown for illustrative purposes only. You cannot invest directly in an index.
| BLACKROCK SERIES FUND, INC. | DECEMBER 31, 2011 | 9 |
BlackRock Total Return Portfolio
Investment Objective
BlackRock Total Return Portfolio’s (the “Portfolio”) investment objective is to seek to maximize total return, consistent with income generation and prudent investment management.
At its meeting on November 8-9, 2011, the Board of Directors (the “Board”) of BlackRock Series Fund, Inc. approved a change in the Portfolio’s non-fundamental investment policies. The Board approved a proposal to eliminate the Portfolio’s non-fundamental policy that had restricted investment in certain types of foreign securities if the Portfolio holds over 10% of its total assets in equity securities of foreign issuers. These changes are effective on February 27, 2012.
Portfolio Management Commentary
How did the Portfolio perform?
| • | | For the 12-month period ended December 31, 2011, the Portfolio returned 6.34%, underperforming its benchmark, the Barclays Capital US Aggregate Bond Index, which returned 7.84%. |
What factors influenced performance?
| • | | The Portfolio maintained a shorter duration bias (lower sensitivity to interest rates) relative to its benchmark index throughout most of the period. While this duration stance was beneficial in the earlier half of the period, the overall impact on performance for the 12-month period was negative as interest rates declined to historically low levels in the latter half due to fears of a global economic slowdown and persistent sovereign debt problems in Europe. |
| • | | Throughout the 12-month period, the Portfolio was overweight relative to its benchmark index in non-government spread sectors (securities driven by movements in credit risk) and underweight in government-owned/government-related sectors. Spread sectors performed well in the earlier part of the period and toward year-end amid improving economic fundamentals and accommodative monetary policy. However, volatility dominated the markets for most of the year and caused periods in which investor sentiment switched to “risk off” mode, resulting in spread sectors dramatically underperforming US Treasury securities. On balance, the Portfolio’s sector allocation had a negative impact on performance for the period as a whole. Additionally, within investment grade corporate credit, relative value trading in US financials and industrials was a net detractor from performance for the year. |
| • | | Relative to the benchmark index, the Portfolio maintained a high quality bias within its allocation to non-government spread sectors, which benefited relative performance as lower-quality securities struggled during periods of risk aversion. Allocations outside of the benchmark index in high yield and non-agency MBS benefited performance, primarily due to a strong rally in the fourth quarter. Also contributing positively to performance was relative value trading within securitized products, such as agency MBS and ABS. |
| • | | The Portfolio held derivatives during the period as a part of its investment strategy. Derivatives are used by the portfolio management team as a means to hedge and/or take outright views on interest rates, credit risk and/or foreign exchange positions in the Portfolio. During the period, the use of US Treasury futures had a material impact on performance. The Portfolio held short positions in US Treasury futures over the course of the year in order to reduce the overall duration profile of the Portfolio. These positions served as a drag on performance as the US Treasury market broadly rallied on the year. Options strategies in the interest rate and foreign exchange markets also detracted from performance, as did interest rate swaps used to manage duration and yield curve positioning. |
Describe recent portfolio activity.
| • | | While portfolio duration was actively managed throughout the 12-month period, the Portfolio maintained a short duration bias for most of the year. Also during the period, the Portfolio’s quality profile and level of liquidity was increased in an effort to limit portfolio volatility from exogenous factors, mostly emanating from Europe. Portfolio management tactically traded investment grade credits, cautiously seeking to take advantage of relative value opportunities in industrials and financials. Exposure to non-agency residential MBS and CMBS was slightly reduced during the period. In order to increase portfolio liquidity, the Portfolio added to its agency MBS and US Treasury holdings during the latter half of the period. |
| • | | Toward period end, the Portfolio adopted a cautiously optimistic stance on corporate credit, which resulted in an increase in investment grade credit exposure and a reduction in US Treasuries exposure. Our sector allocation decisions combined with our macro views of the market resulted in an overall reduction of the portfolio’s duration. Although portfolio management |
| 10 | BLACKROCK SERIES FUND, INC. | DECEMBER 31, 2011 |
BlackRock Total Return Portfolio
Portfolio Management Commentary (concluded)
expects volatility to be present for some time, a moderating of risks out of Europe would likely shift investors toward risk assets. Additionally, higher yields offered by spread sectors may serve as an offset to potentially higher interest rates in 2012.
Describe portfolio positioning at period end.
| • | | At period end, the Portfolio was generally underweight relative to the Barclays Capital US Aggregate Bond Index in government-owned/government-related sectors in favor of non-government spread sectors. Within spread sectors, the Portfolio was most significantly overweight in investment grade corporate credit, CMBS and ABS. Within the government sectors, the Portfolio was underweight in US Treasuries and agency debentures, while it was overweight in agency MBS. The Portfolio also held out-of-index allocations to non-agency residential MBS and high yield corporate credit. High yield corporate credit represents one of the Portfolio’s highest-conviction investment allocations and therefore represents a significant risk position and return opportunity for the Portfolio. The Portfolio ended the period with a shorter duration relative to the benchmark index. |
| BLACKROCK SERIES FUND, INC. | DECEMBER 31, 2011 | 11 |
BlackRock U.S. Government Bond Portfolio
Investment Objective
BlackRock U.S. Government Bond Portfolio’s (the “Portfolio”) investment objective is to seek to maximize total return, consistent with income generation and prudent investment management.
On March 18, 2011, the Board of Directors (the “Board”) of BlackRock Series Fund, Inc. approved a proposal to change the Portfolio’s investment objective from “to seek the highest current income consistent with the protection of capital afforded by investing in intermediate term debt securities issued or guaranteed by the US government or its agencies” to “to seek to maximize total return, consistent with income generation and prudent investment management.” In addition, the Board approved a change in the name of the Portfolio from “BlackRock Government Income Portfolio” to “BlackRock U.S. Government Bond Portfolio.” These changes were effective on October 1, 2011.
Portfolio Management Commentary
| • | | Effective October 1, 2011, the Portfolio changed its primary benchmark from a 50%/50% blend of the Barclays Capital Mortgage-Backed Securities Index and the BofA Merrill Lynch 10-Year Treasury Index to the Barclays Capital US Government/Mortgage Index. The Barclays Capital US Government/Mortgage Index provides a closer representation of the Portfolio’s investable universe than the blended benchmark and more accurately reflects the investment strategy of the Portfolio. |
How did the Portfolio perform?
| • | | For the 12-month period, the Portfolio returned 6.54%, underperforming the Barclays Capital US Government/Mortgage Index and its former blended benchmark, which returned 7.74% and 11.61%, respectively. The following discussion of relative performance pertains to the Barclays Capital US Government/Mortgage Index. |
What factors influenced performance?
| • | | At the beginning of the period, interest rate markets saw increased volatility on signs of an economic recovery and anticipated changes in monetary policy, which drove US Treasury yields higher. However, markets reversed mid-second quarter when economic data weakened and concerns about sovereign debt problems in peripheral European countries resurfaced. Amid heightened uncertainty, Treasury rates moved lower across the yield curve. In the Portfolio, duration management was the largest detractor from performance for the period, while modest exposure to CMBS detracted later in the period. |
| • | | Contributing positively to performance was security selection within the agency MBS space as well as exposure to mortgage derivative securities. An overweight to agency MBS also benefited performance in the first half of the year as the sector strengthened on increased demand from investors seeking relative stability in a volatile market environment. This positioning contributed positively to Portfolio performance in the fourth quarter when the agency MBS sector benefited from increasing support from the US Federal Reserve. |
| • | | The Portfolio held derivatives during the period as a part of its investment strategy. Derivatives are used by the portfolio management team as a means to hedge and/or take outright views on interest rates in the Portfolio. During the period, the use of options strategies in the interest rate market as well as the use of interest rate swaps to manage portfolio duration detracted from performance. The Portfolio also used futures contracts as a means of exposure to the US Treasury market, which resulted in a sustained cash balance; cash did not have a material impact on performance. |
Describe recent portfolio activity.
| • | | During the 12-month period, portfolio management actively managed risk given the economic backdrop. Early in the period, the Portfolio moved to an underweight position in US Treasuries and tactically traded exposure to the space thereafter. The Portfolio also added exposure to select US Treasury Inflation-Protected issues. In the agency MBS space, the Portfolio tactically traded with a focus on purchasing lower-coupon issues as they offered attractive carry (income). The Portfolio took profits on these holdings following the sector’s strong performance in the fourth quarter. Additionally, the Portfolio added modest exposure to CMBS. The Portfolio actively managed duration throughout the 12 months. |
Describe portfolio positioning at period end.
| • | | As of period end, within government-related sectors, the Portfolio was underweight US Treasuries in favor of agency MBS, which offer attractive carry. With respect to non-government spread sectors, the Portfolio held modest out-of-index exposure to CMBS. The Portfolio ended the period with modestly short duration versus the benchmark. |
The views expressed reflect the opinions of BlackRock as of the date of this report and are subject to change based on changes in market, economic or other conditions. These views are not intended to be a forecast of future events and are no guarantee of future results.
| 12 | BLACKROCK SERIES FUND, INC. | DECEMBER 31, 2011 |
Performance Information
As of December 31, 2011
| | Standardized
30-Day Yield | 6-Month
Total
Returns1 | Average Annual Total Returns1 |
| |
| | 1 Year | 5 Years | 10 Years |
| BlackRock Balanced Capital Portfolio | —2 | | (3.37 | )% | 4.58 | % | 0.96 | % | 3.67 | % |
| BlackRock Capital Appreciation Portfolio | —2 | | (10.97 | ) | (8.66 | ) | 2.01 | | 2.16 | |
| BlackRock Global Allocation Portfolio | —2 | | (6.80 | ) | (3.39 | ) | 4.08 | | 8.48 | |
| BlackRock High Yield Portfolio | 6.98 | % | (2.34 | ) | 2.04 | | 5.97 | | 7.18 | |
| BlackRock Large Cap Core Portfolio | —2 | | (8.60 | ) | 2.61 | | (1.38 | ) | 4.39 | |
| BlackRock Total Return Portfolio | 4.05 | | 3.77 | | 6.34 | | 5.00 | | 5.06 | |
| BlackRock U.S. Government Bond Portfolio | 1.97 | | 5.17 | | 6.54 | | 5.19 | | 4.95 | |
| 1 | | Cumulative and average annual total investment returns are based on changes in net asset value for the periods shown, and assume reinvestment of all dividends and capital gains distributions at net asset value on the ex-dividend/payable date. Insurance-related fees and expenses are not reflected in these returns. |
| 2 | | Yields are not applicable for this type of fund. |
| Yields | 7-Day
SEC Yield | 7-Day
Yield |
| |
| BlackRock Money Market Portfolio | 0.00 | % | 0.00 | % |
The 7-Day SEC Yield may differ from the 7-Day Yield shown above due to the fact that the 7-Day SEC Yield excludes distributed capital gains.
Past performance is not indicative of future results.
| BLACKROCK SERIES FUND, INC. | DECEMBER 31, 2011 | 13 |
Total Investment Return Based on a $10,000 Investment
BlackRock Balanced Capital Portfolio
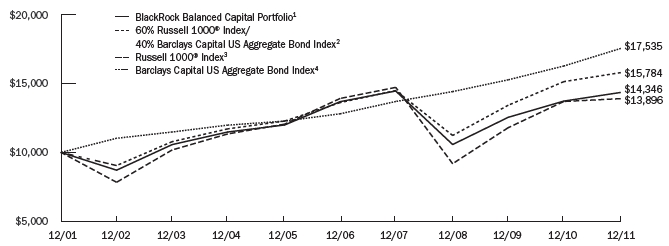
| 1 | | Assuming transaction costs and other operating expenses, including investment advisory fees, if any. Does not include insurance-related fees and expenses. BlackRock Balanced Capital Portfolio invests in US and foreign equity and fixed income securities of any maturity. |
| 2 | | The Portfolio compares its performance to that of a customized weighted index comprised of the returns of the Russell 1000® Index (60%) and Barclays Capital US Aggregate Bond Index (40%). |
| 3 | | This unmanaged broad-based index measures the performance of the 1,000 largest companies in the Russell 3000® Index, which represents approximately 91% of the total market capitalization of the Russell 3000® Index. |
| 4 | | This unmanaged market-weighted index is comprised of investment-grade corporate bonds, rated BBB or better, mortgages and US Treasury and government agency issues with at least one year to maturity. |
Past performance is not indicative of future results.
| 14 | BLACKROCK SERIES FUND, INC. | DECEMBER 31, 2011 |
Total Investment Return Based on a $10,000 Investment (continued)
BlackRock Capital Appreciation Portfolio

| 1 | | Assuming transaction costs and other operating expenses, including investment advisory fees, if any. Does not include insurance-related fees and expenses. BlackRock Capital Appreciation Portfolio invests primarily in a diversified portfolio consisting of primarily common stock of US companies that Portfolio management believes have shown above-average growth rates in earnings over the long term. |
| 2 | | This unmanaged index covers 500 industrial, utility, transportation and financial companies of the US markets (mostly New York Stock Exchange (“NYSE”) issues), representing about 75% of NYSE market capitalization and 30% of NYSE issues. |
| 3 | | This unmanaged broad-based index is a subset of the Russell 1000® Index consisting of those Russell 1000® securities with a greater-than-average growth orientation. |
Past performance is not indicative of future results.
BlackRock Global Allocation Portfolio

| 4 | | Assuming transaction costs and other operating expenses, including investment advisory fees, if any. Does not include insurance-related fees and expenses. BlackRock Global Allocation Portfolio invests in a portfolio of equity, debt and money market securities. |
| 5 | | This unmanaged market capitalization-weighted index is comprised of 2,458 equities from 35 countries in 4 regions including the United States. |
| 6 | | The Reference Benchmark is an unmanaged weighted index comprised as follows: 36% S&P 500® Index; 24% FTSE World Index (Ex-US); 24% BofA Merrill Lynch Current 5-Year US Treasury Index; and 16% Citigroup Non-US Dollar World Government Bond Index. |
Past performance is not indicative of future results.
| BLACKROCK SERIES FUND, INC. | DECEMBER 31, 2011 | 15 |
Total Investment Return Based on a $10,000 Investment (continued)
BlackRock High Yield Portfolio
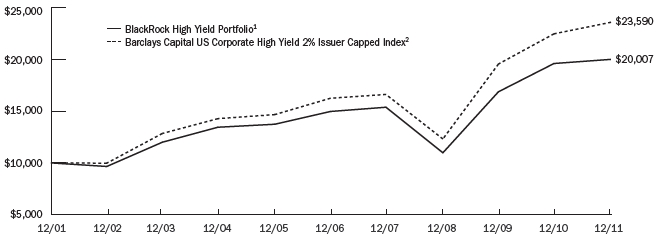
| 1 | | Assuming transaction costs and other operating expenses, including investment advisory fees, if any. Does not include insurance-related fees and expenses. BlackRock High Yield Portfolio invests primarily in non-investment grade bonds with maturities of ten years or less. The Portfolio’s total returns prior to October 1, 2011 are the returns of the Portfolio when it followed a different investment objective and different investment strategies under the name “BlackRock High Income Portfolio”. |
| 2 | | This unmanaged index is comprised of issues that meet the following criteria: at least $150 million par value outstanding; maximum credit rating of Ba1; at least one year to maturity; and no issuer represents more than 2% of the index. |
Past performance is not indicative of future results.
BlackRock Large Cap Core Portfolio
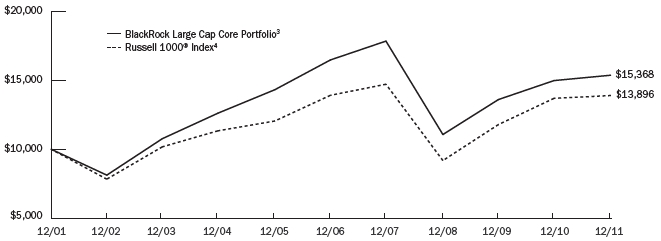
| 3 | | Assuming transaction costs and other operating expenses, including investment advisory fees, if any. Does not include insurance-related fees and expenses. Under normal circumstances, BlackRock Large Cap Core Portfolio invests at least 80% of its assets in a diversified portfolio of equity securities, primarily common stocks, of large cap companies included at the time of purchase in the Russell 1000® Index. |
| 4 | | This unmanaged broad-based index measures the performance of the 1,000 largest companies in the Russell 3000® Index, which represents approximately 91% of the total market capitalization of the Russell 3000® Index. |
Past performance is not indicative of future results.
| 16 | BLACKROCK SERIES FUND, INC. | DECEMBER 31, 2011 |
Total Investment Return Based on a $10,000 Investment (concluded)
BlackRock Total Return Portfolio
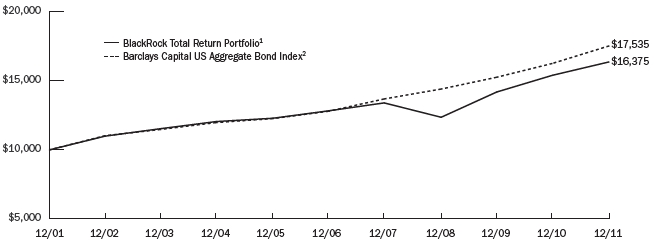
| 1 | | Assuming transaction costs and other operating expenses, including investment advisory fees, if any. Does not include insurance-related fees and expenses. BlackRock Total Return Portfolio, under normal circumstances, will invest at least 80%, and typically invests 90% or more, of its assets in fixed-income securities such as corporate bonds and notes, mortgage-backed securities, asset-backed securities, convertible securities, preferred securities and government obligations. |
| 2 | | This unmanaged market-weighted index is comprised of investment-grade corporate bonds, rated BBB or better, mortgages and US Treasury and government agency issues with at least one year to maturity. |
Past performance is not indicative of future results.
BlackRock U.S. Government Bond Portfolio
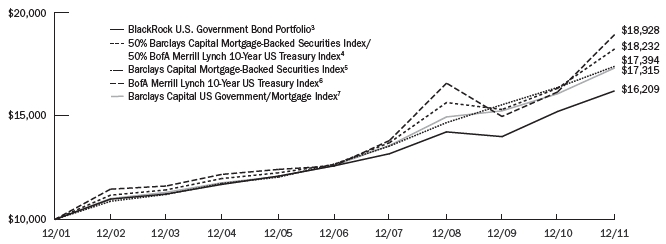
| 3 | | Assuming transaction costs and other operating expenses, including investment advisory fees, if any. Does not include insurance-related fees and expenses. Under normal circumstances, BlackRock U.S. Government Bond Portfolio invests at least 80% of its assets in bonds that are issued or guaranteed by the US government and its agencies. The Portfolio’s total returns prior to October 1, 2011 are the returns of the Portfolio when it followed a different investment objective and different investment strategies under the name “BlackRock Government Income Portfolio”. |
| 4 | | The composite index is comprised of the returns of the Barclays Capital Mortgage-Backed Securities Index (50%) and the BofA Merrill Lynch 10-Year US Treasury Index (50%). |
| 5 | | The Barclays Capital Mortgage-Backed Securities Index is a widely recognized unmanaged index that includes the mortgage-backed pass through securities of Ginnie Mae, Fannie Mae and Freddie Mac that meet certain maturity and liquidity criteria. |
| 6 | | The BofA Merrill Lynch 10-Year US Treasury Index is a widely recognized unmanaged one security index that consists of the current “on-the-run” 10-Year Treasury issue. |
| 7 | | This index measures debt issued by the US Government, and its agencies, as well as mortgage-backed pass-through securities of GNMA, Fannie Mae and Freddie Mac. Effective October 1, 2011, the Portfolio uses this index as its benchmark rather than the BofA Merrill Lynch 10-Year Treasury Index and a composite 50% Barclays Capital Mortgage-Backed Securities Index / 50% BofA Merrill Lynch 10-Year Treasury Index because Portfolio management believes it is more representative of the industry standard benchmark for funds with similar strategies. |
Past performance is not indicative of future results.
| BLACKROCK SERIES FUND, INC. | DECEMBER 31, 2011 | 17 |
Disclosure of Expenses
Shareholders of each Portfolio may incur the following charges: (a) expenses related to transactions, including sales charges and exchange fees; and (b) operating expenses including investment advisory fees and other Portfolio expenses. The expense example below (which is based on a hypothetical investment of $1,000 invested on July 1, 2011 and held through December 31, 2011) is intended to assist shareholders both in calculating expenses based on an investment in each Portfolio and in comparing these expenses with similar costs of investing in other mutual funds.
The table provides information about actual account values and actual expenses. In order to estimate the expenses a shareholder paid during the period covered by this report, shareholders can divide their account value by $1,000 and then multiply the result by the number corresponding to their Portfolio under the heading entitled “Expenses Paid During the Period.”
The table also provides information about hypothetical account values and hypothetical expenses based on each Portfolio’s actual expense ratio and an assumed rate of return of 5% per year before expenses. In order to assist shareholders in comparing the ongoing expenses of investing in each Portfolio and other funds, compare the 5% hypothetical example with the 5% hypothetical examples that appear in other funds’ shareholder reports.
The expenses shown in the table are intended to highlight shareholders’ ongoing costs only and do not reflect any transactional expenses, such as sales charges or exchange fees, if any. Therefore, the hypothetical example is useful in comparing ongoing expenses only, and will not help shareholders determine the relative total expenses of owning different funds. If these transactional expenses were included, shareholder expenses would have been higher.
| Actual | Beginning
Account Value
July 1, 2011 | Ending
Account Value
December 31, 2011 | Expenses
Paid During
the Period1 | Annualized
Expense
Ratio |
| BlackRock Balanced Capital Portfolio (excluding interest expense) | $1,000.00 | $ 966.30 | $2.22 | 0.45% |
| BlackRock Balanced Capital Portfolio (including interest expense) | $1,000.00 | $ 966.30 | $2.22 | 0.45% |
| BlackRock Capital Appreciation Portfolio | $1,000.00 | $ 890.30 | $2.19 | 0.46% |
| BlackRock Global Allocation Portfolio | $1,000.00 | $ 932.00 | $2.33 | 0.48% |
| BlackRock High Yield Portfolio (excluding interest expense) | $1,000.00 | $ 976.60 | $2.50 | 0.50% |
| BlackRock High Yield Portfolio (including interest expense) | $1,000.00 | $ 976.60 | $2.50 | 0.50% |
| BlackRock Large Cap Core Portfolio | $1,000.00 | $ 914.00 | $2.22 | 0.46% |
| BlackRock Money Market Portfolio | $1,000.00 | $1,000.00 | $1.31 | 0.26% |
| BlackRock Total Return Portfolio (excluding interest expense) | $1,000.00 | $1,037.70 | $2.53 | 0.49% |
| BlackRock Total Return Portfolio (including interest expense) | $1,000.00 | $1,037.70 | $2.79 | 0.54% |
| BlackRock U.S. Government Bond Portfolio (excluding interest expense) | $1,000.00 | $1,051.70 | $2.55 | 0.49% |
| BlackRock U.S. Government Bond Portfolio (including interest expense) | $1,000.00 | $1,051.70 | $2.55 | 0.49% |
| |
| Hypothetical (5% annual return before expenses)2 | | | | |
| BlackRock Balanced Capital Portfolio (excluding interest expense) | $1,000.00 | $1,022.88 | $2.29 | 0.45% |
| BlackRock Balanced Capital Portfolio (including interest expense) | $1,000.00 | $1,022.88 | $2.29 | 0.45% |
| BlackRock Capital Appreciation Portfolio | $1,000.00 | $1,022.89 | $2.35 | 0.46% |
| BlackRock Global Allocation Portfolio | $1,000.00 | $1,022.72 | $2.44 | 0.48% |
| BlackRock High Yield Portfolio (excluding interest expense) | $1,000.00 | $1,022.81 | $2.56 | 0.50% |
| BlackRock High Yield Portfolio (including interest expense) | $1,000.00 | $1,022.81 | $2.56 | 0.50% |
| BlackRock Large Cap Core Portfolio | $1,000.00 | $1,022.89 | $2.35 | 0.46% |
| BlackRock Money Market Portfolio | $1,000.00 | $1,023.89 | $1.33 | 0.26% |
| BlackRock Total Return Portfolio (excluding interest expense) | $1,000.00 | $1,022.86 | $2.51 | 0.49% |
| BlackRock Total Return Portfolio (including interest expense) | $1,000.00 | $1,022.61 | $2.77 | 0.54% |
| BlackRock U.S. Government Bond Portfolio (excluding interest expense) | $1,000.00 | $1,022.86 | $2.51 | 0.49% |
| BlackRock U.S. Government Bond Portfolio (including interest expense) | $1,000.00 | $1,022.86 | $2.51 | 0.49% |
| 1 | | Expenses for each Portfolio are equal to the annualized expense ratio, multiplied by the average account value over the period, multiplied by 184/365 (to reflect the one-half year period shown). |
| 2 | | Hypothetical 5% annual return before expenses is calculated by pro rating the number of days in the most recent fiscal half year divided by 365. |
| 18 | BLACKROCK SERIES FUND, INC. | DECEMBER 31, 2011 |
Portfolio Information as of December 31, 2011
| Portfolio Composition for BlackRock Balanced Capital Portfolio | Percent of
Long-Term
Investments |
| Common Stocks | 50 | % |
| US Government Sponsored Agency Securities | 20 | |
| Corporate Bonds | 12 | |
| US Treasury Obligations | 10 | |
| Non-Agency Mortgage-Backed Securities | 5 | |
| Asset-Backed Securities | 2 | |
| Foreign Agency Obligations | 1 | |
| |
| |
| Sector Allocations for BlackRock Capital Appreciation Portfolio | Percent of
Long-Term
Investments |
| Information Technology | 32 | % |
| Consumer Discretionary | 16 | |
| Industrials | 12 | |
| Consumer Staples | 11 | |
| Energy | 10 | |
| Health Care | 10 | |
| Telecommunication Services | 3 | |
| Materials | 3 | |
| Financials | 3 | |
For Portfolio compliance purposes, the Portfolio’s sector classifications refer to any one or more of the sector sub-classifications used by one or more widely recognized market indexes or ratings group indexes, and/or as defined by Portfolio management. These definitions may not apply for purposes of this report, which may combine sector sub-classifications for reporting ease.
| Portfolio Composition for BlackRock Global Allocation Portfolio | Percent of
Net Assets | Reference
Benchmark4
Percentages |
| US Equities | 34 | %1 | 36 | % |
| European Equities | 11 | 1 | 12 | |
| Asian-Pacific Equities | 13 | 1 | 8 | |
| Other Equities | 6 | | 4 | |
| Total Equities | 64 | 2 | 60 | |
| US Dollar Denominated Fixed Income Securities | 14 | | 24 | |
| US Issuers | 11 | | — | |
| Non-US Issuers | 3 | | — | |
| Non-US Dollar Denominated Fixed Income Securities | 12 | | 16 | |
| Total Fixed Income Securities | 26 | | 40 | |
| Cash & Cash Equivalents3 | 10 | | — | |
| 1 | | Includes value of financial futures contracts. |
| 2 | | Includes preferred stock. |
| 3 | | Cash & Cash Equivalents are reduced by the market (or nominal) value of long financial futures contracts. |
| 4 | | The Reference Benchmark is an unmanaged weighted index comprised as follows: 36% S&P 500® Index; 24% FTSE World Index (Excluding US Equities); 24% BofA Merrill Lynch Current 5-Year US Treasury Index; and 16% Citigroup Non-US Dollar World Government Bond Index. |
| BLACKROCK SERIES FUND, INC. | DECEMBER 31, 2011 | 19 |
Portfolio Information as of December 31, 2011 (concluded)
| Credit Quality Allocations for BlackRock High Yield Portfolio1 | Percent of
Corporate Bond
Investments |
| BBB/Baa | 4 | % |
| BB/Ba | 41 | |
| B | 45 | |
| CCC/Caa | 7 | |
| Not Rated | 3 | |
| 1 | | Using the higher of Standard & Poor’s (“S&P’s”) or Moody’s Investors Service ratings. |
| Sector Allocations for BlackRock Large Cap Core Portfolio | Percent of
Long-Term
Investments |
| Information Technology | 22 | % |
| Health Care | 22 | |
| Consumer Discretionary | 15 | |
| Consumer Staples | 10 | |
| Energy | 10 | |
| Industrials | 8 | |
| Financials | 4 | |
| Materials | 4 | |
| Utilities | 4 | |
| Telecommunication Services | 1 | |
For Portfolio compliance purposes, the Portfolio’s sector classifications refer to any one or more of the sector sub-classifications used by one or more widely recognized market indexes or ratings group indexes, and/or as defined by Portfolio management. These definitions may not apply for purposes of this report, which may combine sector sub-classifications for reporting ease.
| Portfolio Composition for BlackRock Money Market Portfolio | Percent of
Net Assets |
| Commercial Paper | 44 | % |
| Certificates of Deposit | 16 | |
| US Government Sponsored Agency Obligations | 14 | |
| Municipal Bonds | 14 | |
| US Treasury Obligations | 8 | |
| Repurchase Agreements | 2 | |
| Corporate Notes | 1 | |
| Other Assets Less Liabilities | 1 | |
| |
| |
| Portfolio Composition for BlackRock Total Return Portfolio | Percent of
Long-Term
Investments |
| US Government Sponsored Agency Securities | 40 | % |
| Corporate Bonds | 25 | |
| US Treasury Obligations | 21 | |
| Non-Agency Mortgage-Backed Securities | 7 | |
| Asset-Backed Securities | 3 | |
| Foreign Agency Obligations | 3 | |
| Preferred Securities | 1 | |
| |
| |
| Portfolio Composition for BlackRock U.S. Government Bond Portfolio | Percent of
Long-Term
Investments |
| US Government Sponsored Agency Securities | 70 | % |
| US Treasury Obligations | 25 | |
| Corporate Bonds | 4 | |
| Foreign Agency Obligations | 1 | |
| 20 | BLACKROCK SERIES FUND, INC. | DECEMBER 31, 2011 |
The Benefits and Risks of Leveraging
Certain Portfolios may utilize leverage to seek to enhance their yield and net asset value (“NAV”). However, these objectives cannot be achieved in all interest rate environments.
The Portfolios may utilize leverage by entering into reverse repurchase agreements and treasury roll transactions. In general, the concept of leveraging is based on the premise that the financing cost of assets to be obtained from leverage, which will be based on short-term interest rates, will normally be lower than the income earned by each Portfolio on its longer-term portfolio investments. To the extent that the total assets of each Portfolio (including the assets obtained from leverage) are invested in higher-yielding portfolio investments, each Portfolio’s shareholders will benefit from the incremental net income.
The interest earned on securities purchased with the proceeds from leverage is paid to shareholders in the form of dividends, and the value of these portfolio holdings is reflected in the per share NAV. However, in order to benefit shareholders, the yield curve must be positively sloped; that is, short-term interest rates must be lower than long-term interest rates. If the yield curve becomes negatively sloped, meaning short-term interest rates exceed long-term interest rates, income to shareholders will be lower than if the Portfolios had not used leverage.
If short-term interest rates rise, narrowing the differential between short-term and long-term interest rates, the incremental net income pickup will be reduced or eliminated completely. Furthermore, if prevailing short-term interest rates rise above long-term interest rates, the yield curve has a negative slope. In this case, the Portfolios pay higher short-term interest rates whereas the Portfolios’ total portfolio earns income based on lower long-term interest rates.
Furthermore, the value of the Portfolios’ portfolio investments generally varies inversely with the direction of long-term interest rates, although other factors can influence the value of portfolio investments. Changes in interest rates can influence the Portfolios’ NAV positively or negatively in addition to the impact on Portfolio performance from leverage.
The use of leverage may enhance opportunities for increased income to the Portfolios, but as described above, it also creates risks as short- or long-term interest rates fluctuate. Leverage also will generally cause greater changes in the Portfolios’ NAV and dividend rates than comparable portfolios without leverage. If the income derived from securities purchased with assets received from leverage exceeds the cost of leverage, each Portfolio’s net income will be greater than if leverage had not been used. Conversely, if the income from the securities purchased is not sufficient to cover the cost of leverage, each Portfolio’s net income will be less than if leverage had not been used, and therefore the amount available for distribution to shareholders will be reduced. Each Portfolio may be required to sell portfolio securities at inopportune times or at distressed values in order to comply with regulatory requirements applicable to the use of leverage or as required by the terms of leverage instruments, which may cause a Portfolio to incur losses. The use of leverage may limit a Portfolio’s ability to invest in certain types of securities or use certain types of hedging strategies. Each Portfolio will incur expenses in connection with the use of leverage, all of which are borne by shareholders and may reduce income.
Derivative Financial Instruments
Certain Portfolios may invest in various derivative financial instruments, including financial futures contracts, foreign currency exchange contracts, options and swaps as specified in Note 2 of the Notes to Financial Statements, which may constitute forms of economic leverage. Such derivative financial instruments are used to obtain exposure to a market without owning or taking physical custody of securities or to hedge market, equity, credit, interest rate, foreign currency exchange rate and/or other risks. Derivative financial instruments involve risks, including the imperfect correlation between the value of a derivative financial instrument and the underlying asset, possible default of the counterparty to the transaction or illiquidity of the derivative financial instrument. The Portfolios’ ability to use a derivative financial instrument successfully depends on the investment advisor’s ability to predict pertinent market movements accurately, which cannot be assured. The use of derivative financial instruments may result in losses greater than if they had not been used, may require a Portfolio to sell or purchase portfolio investments at inopportune times or for distressed values, may limit the amount of appreciation a Portfolio can realize on an investment, may result in lower dividends paid to shareholders or may cause a Portfolio to hold an investment that it might otherwise sell. The Portfolios’ investments in these instruments are discussed in detail in the Notes to Financial Statements.
| BLACKROCK SERIES FUND, INC. | DECEMBER 31, 2011 | 21 |
| BlackRock Balanced Capital Portfolio | |
| Schedule of Investments December 31, 2011 | (Percentages shown are based on Net Assets) |
| Common Stocks | Shares | | Value |
| Aerospace & Defense—2.7% | | | |
| General Dynamics Corp. | 51,000 | $ | 3,386,910 |
| L-3 Communications Holdings, Inc. | 46,000 | | 3,067,280 |
| Lockheed Martin Corp. | 44,000 | | 3,559,600 |
| Northrop Grumman Corp. | 57,000 | | 3,333,360 |
| | | | 13,347,150 |
| Airlines—0.5% | | | |
| Southwest Airlines Co. | 309,000 | | 2,645,040 |
| Beverages—1.3% | | | |
| The Coca-Cola Co. | 1,000 | | 69,970 |
| Coca-Cola Enterprises, Inc. | 120,000 | | 3,093,600 |
| Dr. Pepper Snapple Group, Inc. | 84,000 | | 3,316,320 |
| | | | 6,479,890 |
| Biotechnology—2.2% | | | |
| Amgen, Inc. | 65,000 | | 4,173,650 |
| Biogen Idec, Inc. (a) | 30,000 | | 3,301,500 |
| Gilead Sciences, Inc. (a) | 89,000 | | 3,642,770 |
| | | | 11,117,920 |
| Chemicals—1.2% | | | |
| CF Industries Holdings, Inc. | 23,000 | | 3,334,540 |
| LyondellBasell Industries NV, Class A | 88,000 | | 2,859,120 |
| | | | 6,193,660 |
| Communications Equipment—0.6% | | | |
| Motorola Solutions, Inc. | 69,000 | | 3,194,010 |
| Computers & Peripherals—3.6% | | | |
| Apple, Inc. (a) | 14,000 | | 5,670,000 |
| Dell, Inc. (a) | 231,000 | | 3,379,530 |
| Lexmark International, Inc., Class A | 45,000 | | 1,488,150 |
| QLogic Corp. (a) | 117,000 | | 1,755,000 |
| Seagate Technology Plc | 161,000 | | 2,640,400 |
| Western Digital Corp. (a) | 94,000 | | 2,909,300 |
| | | | 17,842,380 |
| Construction & Engineering—0.6% | | | |
| Chicago Bridge & Iron Co. NV | 40,000 | | 1,512,000 |
| Fluor Corp. | 26,000 | | 1,306,500 |
| | | | 2,818,500 |
| Consumer Finance—0.9% | | | |
| Capital One Financial Corp. | 32,000 | | 1,353,280 |
| Discover Financial Services, Inc. | 128,000 | | 3,072,000 |
| | | | 4,425,280 |
| Containers & Packaging—0.2% | | | |
| Sealed Air Corp. | 58,000 | | 998,180 |
| Diversified Consumer Services—1.6% | | | |
| Apollo Group, Inc., Class A (a) | 60,000 | | 3,232,200 |
| ITT Educational Services, Inc. (a) | 39,000 | | 2,218,710 |
| Weight Watchers International, Inc. | 43,000 | | 2,365,430 |
| | | | 7,816,340 |
| Common Stocks | Shares | | Value |
| Diversified Telecommunication Services—0.5% | | | |
| AT&T, Inc. | 41,000 | $ | 1,239,840 |
| Level 3 Communications, Inc. (a) | 88,267 | | 1,499,656 |
| | | | 2,739,496 |
| Food & Staples Retailing—1.3% | | | |
| The Kroger Co. | 143,000 | | 3,463,460 |
| Safeway, Inc. | 145,000 | | 3,050,800 |
| | | | 6,514,260 |
| Food Products—0.6% | | | |
| ConAgra Foods, Inc. | 123,000 | | 3,247,200 |
| Health Care Providers & Services—5.2% | | | |
| Aetna, Inc. | 78,000 | | 3,290,820 |
| AmerisourceBergen Corp. | 82,000 | | 3,049,580 |
| Cardinal Health, Inc. | 73,000 | | 2,964,530 |
| Cigna Corp. | 53,000 | | 2,226,000 |
| Humana, Inc. | 39,000 | | 3,416,790 |
| McKesson Corp. | 44,000 | | 3,428,040 |
| UnitedHealth Group, Inc. | 82,000 | | 4,155,760 |
| WellPoint, Inc. | 51,000 | | 3,378,750 |
| | | | 25,910,270 |
| Household Products—0.3% | | | |
| The Procter & Gamble Co. | 21,000 | | 1,400,910 |
| Independent Power Producers & Energy Traders—1.6% | | |
| The AES Corp. (a) | 256,000 | | 3,031,040 |
| Constellation Energy Group, Inc. | 77,000 | | 3,054,590 |
| NRG Energy, Inc. (a) | 92,000 | | 1,667,040 |
| | | | 7,752,670 |
| Industrial Conglomerates—1.0% | | | |
| General Electric Co. | 78,000 | | 1,396,980 |
| Tyco International Ltd. | 75,000 | | 3,503,250 |
| | | | 4,900,230 |
| Insurance—1.5% | | | |
| ACE Ltd. | 32,000 | | 2,243,840 |
| Arch Capital Group Ltd. (a) | 17,000 | | 632,910 |
| Assurant, Inc. | 47,000 | | 1,929,820 |
| Unum Group | 126,000 | | 2,654,820 |
| | | | 7,461,390 |
| Internet & Catalog Retail—0.6% | | | |
| Expedia, Inc. | 55,000 | | 1,596,100 |
| TripAdvisor, Inc. (a) | 55,000 | | 1,386,550 |
| | | | 2,982,650 |
| Internet Software & Services—0.1% | | | |
| Google, Inc., Class A (a) | 1,000 | | 645,900 |
| IT Services—1.1% | | | |
| International Business Machines Corp. | 13,000 | | 2,390,440 |
| The Western Union Co. | 173,000 | | 3,158,980 |
| | | | 5,549,420 |
Portfolio Abbreviations
To simplify the listings of portfolio holdings in the Schedules of Investments, the names and descriptions of many of the securities have been abbreviated according to the following list:
| ADR | American Depositary Receipts | INR | Indian Rupee |
| AMT | Alternative Minimum Tax (subject to) | JPY | Japanese Yen |
| AUD | Australian Dollar | KRW | South Korean Won |
| BRL | Brazilian Real | LIBOR | London Interbank Offered Rate |
| CAD | Canadian Dollar | LOC | Letter of Credit |
| CHF | Swiss Franc | MosPrime | Moscow Prime Offered Rate |
| CNH | Chinese Renminbi (offshore) | MSCI | Morgan Stanley Capital International |
| CNY | Chinese Renminbi | MXN | Mexican New Peso |
| COP | Certificates of Participation | MYR | Malaysian Ringgit |
| EGP | Egyptian Pound | NOK | Norwegian Krone |
| EUR | Euro | RB | Revenue Bonds |
| EURIBOR | Euro Interbank Offered Rate | SGD | Singapore Dollar |
| FKA | Formerly Known As | SPDR | Standard and Poor’s Depositary Receipts |
| FLOATS | Floating Rate Securities | TBA | To Be Announced |
| GBP | British Pound | THB | Thai Baht |
| GDR | Global Depositary Receipts | TWD | Taiwan Dollar |
| GO | General Obligation Bonds | USD | US Dollar |
| HAD | Housing Development Authority | VRDN | Variable Rate Demand Notes |
| HFA | Housing Finance Agency | ZAR | South African Rand |
| IDR | Indonesian Rupiah | | |
See Notes to Financial Statements.
| 22 | BLACKROCK SERIES FUND, INC. | DECEMBER 31, 2011 |
| BlackRock Balanced Capital Portfolio | |
| Schedule of Investments (continued) | (Percentages shown are based on Net Assets) |
| Common Stocks | Shares | | Value |
| Leisure Equipment & Products—0.5% | | | |
| Polaris Industries, Inc. | 47,000 | $ | 2,631,060 |
| Life Sciences Tools & Services—0.5% | | | |
| Agilent Technologies, Inc. (a) | 73,000 | | 2,549,890 |
| Machinery—0.1% | | | |
| AGCO Corp. (a) | 13,000 | | 558,610 |
| Media—2.2% | | | |
| CBS Corp., Class B | 123,000 | | 3,338,220 |
| DISH Network Corp., Class A | 105,000 | | 2,990,400 |
| Gannett Co., Inc. | 137,000 | | 1,831,690 |
| Time Warner Cable, Inc. | 48,000 | | 3,051,360 |
| | | | 11,211,670 |
| Multi-Utilities—0.6% | | | |
| Ameren Corp. | 94,000 | | 3,114,220 |
| Oil, Gas & Consumable Fuels—5.3% | | | |
| Chevron Corp. | 20,000 | | 2,128,000 |
| ConocoPhillips | 26,000 | | 1,894,620 |
| Exxon Mobil Corp. | 76,000 | | 6,441,760 |
| HollyFrontier Corp. | 130,000 | | 3,042,000 |
| Marathon Oil Corp. | 125,000 | | 3,658,750 |
| Murphy Oil Corp. | 51,000 | | 2,842,740 |
| Tesoro Corp. (a) | 135,000 | | 3,153,600 |
| Valero Energy Corp. | 151,000 | | 3,178,550 |
| | | | 26,340,020 |
| Paper & Forest Products—1.0% | | | |
| International Paper Co. | 109,000 | | 3,226,400 |
| MeadWestvaco Corp. | 55,000 | | 1,647,250 |
| | | | 4,873,650 |
| Personal Products—0.6% | | | |
| Herbalife Ltd. | 59,000 | | 3,048,530 |
| Pharmaceuticals—4.7% | | | |
| Abbott Laboratories | 77,000 | | 4,329,710 |
| Bristol-Myers Squibb Co. | 128,000 | | 4,510,720 |
| Eli Lilly & Co. | 92,000 | | 3,823,520 |
| Forest Laboratories, Inc. (a) | 99,000 | | 2,995,740 |
| Johnson & Johnson | 18,000 | | 1,180,440 |
| Pfizer, Inc. | 310,000 | | 6,708,400 |
| | | | 23,548,530 |
| Semiconductors & Semiconductor Equipment—5.0% | | |
| Applied Materials, Inc. | 262,000 | | 2,806,020 |
| Avago Technologies Ltd. | 96,000 | | 2,770,560 |
| KLA-Tencor Corp. | 63,000 | | 3,039,750 |
| Marvell Technology Group Ltd. (a) | 126,000 | | 1,745,100 |
| Maxim Integrated Products, Inc. | 118,000 | | 3,072,720 |
| Novellus Systems, Inc. (a) | 71,000 | | 2,931,590 |
| NVIDIA Corp. (a) | 196,000 | | 2,716,560 |
| Teradyne, Inc. (a) | 204,000 | | 2,780,520 |
| Xilinx, Inc. | 96,000 | | 3,077,760 |
| | | | 24,940,580 |
| Software—2.2% | | | |
| Activision Blizzard, Inc. | 245,000 | | 3,018,400 |
| Fortinet, Inc. (a) | 27,000 | | 588,870 |
| Microsoft Corp. | 169,000 | | 4,387,240 |
| Symantec Corp. (a) | 191,000 | | 2,989,150 |
| | | | 10,983,660 |
| Specialty Retail—3.1% | | | |
| AutoZone, Inc. (a) | 8,000 | | 2,599,760 |
| Best Buy Co., Inc. | 131,000 | | 3,061,470 |
| Foot Locker, Inc. | 34,000 | | 810,560 |
| GameStop Corp., Class A (a) | 122,000 | | 2,943,860 |
| Limited Brands, Inc. | 73,000 | | 2,945,550 |
| Common Stocks | | Shares | | Value |
| Specialty Retail (concluded) | | | | | |
| Williams-Sonoma, Inc. | | 75,000 | | $ | 2,887,500 |
| | | | | | | 15,248,700 |
| Textiles, Apparel & Luxury Goods—0.3% | | | | |
| Coach, Inc. | | 24,000 | | | 1,464,960 |
| Tobacco—1.9% | | | | | |
| Lorillard, Inc. | | 29,000 | | | 3,306,000 |
| Philip Morris International, Inc. | | 78,000 | | | 6,121,440 |
| | | | | | | 9,427,440 |
| Wireless Telecommunication Services—0.5% | | | | | |
| MetroPCS Communications, Inc. (a) | | 282,000 | | | 2,447,760 |
| Total Common Stocks—57.7% | | | | | 288,372,026 |
| |
| Fixed Income Securities | | | | | |
| | | | Par | | |
| Asset-Backed Securities | | (000) | | |
| 321 Henderson Receivables I LLC (b): | | | | | |
| Series 2010-1A, Class A, 5.56%, | | | | | |
| 7/15/59 | | USD | 680 | | | 735,189 |
| Series 2010-3A, Class A, 3.82%, | | | | | |
| 12/15/48 | | | 463 | | | 456,081 |
| AmeriCredit Automobile Receivables Trust: | | | | | |
| Series 2011-2, Class C, 3.19%, | | | | | |
| 10/12/16 | | | 545 | | | 545,871 |
| Series 2011-5, Class C, 3.44%, | | | | | |
| 10/08/17 | | | 230 | | | 230,481 |
| Carrington Mortgage Loan Trust, | | | | | |
| Series 2006-NC5, Class A1, 0.34%, | | | | | |
| 1/25/37 (c)(d) | | 105 | | | 104,095 |
| Citibank Omni Master Trust (b): | | | | | |
| Series 2009-A8, Class A8, 2.38%, | | | | | |
| 5/16/16 (d) | | 1,365 | | | 1,373,384 |
| Series 2009-A17, Class A17, 4.90%, | | | | | |
| 11/15/18 | | | 260 | | | 282,785 |
| DT Auto Owner Trust (b): | | | | | |
| Series 2011-2A, Class B, 2.12%, | | | | | |
| 2/16/16 | | | 250 | | | 249,747 |
| Series 2011-3A, Class C, 4.03%, | | | | | |
| 2/15/17 | | | 255 | | | 254,492 |
| Globaldrive BV, Series 2008-2, | | | | | |
| Class A, 4.00%, 10/20/16 | EUR | 151 | | | 195,955 |
| Morgan Stanley ABS Capital I, | | | | | |
| Series 2005-HE1, Class A2MZ, | | | | | |
| 0.59%, 12/25/34 (d) | USD | 78 | | | 65,748 |
| Nelnet Student Loan Trust, Series 2006-1, | | | | | |
| Class A5, 0.61%, 8/23/27 (d) | | 285 | | | 263,520 |
| New Century Home Equity Loan Trust, | | | | | |
| Series 2005-2, Class A2MZ, 0.55%, | | | | | |
| 6/25/35 (d) | | 231 | | | 216,845 |
| RAAC, Series 2005-SP2, Class 2A, 0.59%, | | | | | |
| 6/25/44 (d) | | 551 | | | 351,143 |
| Santander Consumer Acquired | | | | | |
| Receivables Trust (b): | | | | | |
| Series 2011-S1A, Class B, 1.66%, | | | | | |
| 8/15/16 | | | 303 | | | 300,678 |
| Series 2011-S1A, Class C, 2.01%, | | | | | |
| 8/15/16 | | | 254 | | | 249,456 |
| Series 2011-WO, Class C, 3.19%, | | | | | |
| 10/15/15 | | | 316 | | | 319,128 |
See Notes to Financial Statements.
| BLACKROCK SERIES FUND, INC. | DECEMBER 31, 2011 | 23 |
| BlackRock Balanced Capital Portfolio | |
| Schedule of Investments (continued) | (Percentages shown are based on Net Assets) |
| | | | Par | | |
| Asset-Backed Securities | | (000) | | Value |
| Santander Drive Auto Receivables Trust: | | | | | |
| Series 2010-2, Class B, 2.24%, | | | | | |
| 12/15/14 | | USD | 430 | | $ | 428,873 |
| Series 2010-2, Class C, 3.89%, | | | | | |
| 7/17/17 | | | 505 | | | 505,291 |
| Series 2010-B, Class B, 2.10%, | | | | | |
| 9/15/14 (b) | | 360 | | | 359,345 |
| Series 2010-B, Class C, 3.02%, | | | | | |
| 10/17/16 (b) | | 380 | | | 376,713 |
| Series 2011-S1A, Class B, 1.48%, | | | | | |
| 5/15/17 (b) | | 270 | | | 266,980 |
| Series 2011-S1A, Class D, 3.10%, | | | | | |
| 5/15/17 (b) | | 234 | | | 232,309 |
| Scholar Funding Trust, Series 2011-A, | | | | | |
| Class A, 1.32%, 10/28/43 (b)(d) | | 314 | | | 300,523 |
| SLM Student Loan Trust (d): | | | | | |
| Series 2004-B, Class A2, 0.75%, 6/15/21 | | 405 | | | 388,500 |
| Series 2008-5, Class A3, 1.72%, 1/25/18 | | 195 | | | 198,046 |
| Series 2008-5, Class A4, 2.12%, 7/25/23 | | 195 | | | 200,123 |
| Soundview Home Equity Loan Trust, | | | | | |
| Series 2005-OPT3, Class A4, 0.59%, | | | | | |
| 11/25/35 (d) | | 993 | | | 910,190 |
| Structured Asset Investment Loan Trust (d): | | | | | |
| Series 2003-BC6, Class M1, 1.42%, | | | | | |
| 7/25/33 | | | 1,033 | | | 803,185 |
| Series 2003-BC7, Class M1, 1.42%, | | | | | |
| 7/25/33 | | | 782 | | | 602,043 |
| Series 2004-8, Class M4, 1.79%, | | | | | |
| 9/25/34 | | | 104 | | | 47,635 |
| Structured Asset Securities Corp. (d): | | | | | |
| Series 2004-23XS, Class 2A1, 0.59%, | | | | | |
| 1/25/35 | | | 212 | | | 136,203 |
| Series 2005-GEL2, Class A, 0.57%, | | | | | |
| 4/25/35 | | | 67 | | | 60,173 |
| Total Asset-Backed Securities—2.4% | | | | | 12,010,730 |
| |
| |
| Corporate Bonds | | | | | |
| Auto Components—0.0% | | | | | |
| BorgWarner, Inc., 4.63%, 9/15/20 | | 140 | | | 148,767 |
| Capital Markets—0.7% | | | | | |
| CDP Financial, Inc., 3.00%, 11/25/14 (b) | | 515 | | | 535,557 |
| Credit Suisse AG: | | | | | |
| 2.60%, 5/27/16 (b) | | 350 | | | 354,686 |
| 5.40%, 1/14/20 | | | 140 | | | 132,043 |
| Credit Suisse Group Finance US, Inc., | | | | | |
| 3.63%, 9/14/20 | | EUR | 50 | | | 55,267 |
| The Goldman Sachs Group, Inc., 5.25%, | | | | | |
| 7/27/21 | | USD | 310 | | | 302,417 |
| Lehman Brothers Holdings, Inc., 6.75%, | | | | | |
| 12/28/17 (a)(e) | | 490 | | | 49 |
| Morgan Stanley: | | | | | |
| 2.95%, 5/14/13 (d) | | 529 | | | 507,958 |
| 4.20%, 11/20/14 | | | 400 | | | 385,777 |
| 4.00%, 7/24/15 | | | 210 | | | 196,928 |
| 5.63%, 9/23/19 | | | 345 | | | 319,497 |
| 5.50%, 7/28/21 | | | 580 | | | 536,288 |
| | | | | | | 3,326,467 |
| Chemicals—0.2% | | | | | |
| CF Industries, Inc., 7.13%, 5/01/20 | | 435 | | | 514,387 |
| The Dow Chemical Co., 4.13%, 11/15/21 | | 200 | | | 205,144 |
| Lyondell Chemical Co., 11.00%, 5/01/18 | | 340 | | | 370,978 |
| | | | Par | | |
| Corporate Bonds | | (000) | | Value |
| Chemicals (concluded) | | | | | |
| LyondellBasell Industries NV, 6.00%, | | | | | |
| 11/15/21 (b) | USD | 135 | | $ | 140,063 |
| | | | | | | 1,230,572 |
| Commercial Banks—1.6% | | | | | |
| ABN Amro Bank NV, 6.38%, 4/27/21 | EUR | 100 | | | 117,911 |
| CIT Group, Inc.: | | | | | |
| 7.00%, 5/01/17 | | USD | 286 | | | 285,702 |
| 7.00%, 5/02/17 (b) | | 50 | | | 49,937 |
| Commerzbank AG, 6.38%, 3/22/19 | EUR | 100 | | | 91,761 |
| Corporacion Andina de Fomento, 6.88%, | | | | | |
| 3/15/12 | | USD | 435 | | | 438,690 |
| DnB NOR Boligkreditt (b): | | | | | |
| 2.10%, 10/14/16 | | | 2,070 | | | 2,053,227 |
| 2.90%, 3/29/17 | | | 1,455 | | | 1,479,147 |
| Eksportfinans ASA, 5.50%, 5/25/16 | | 200 | | | 184,413 |
| HSBC Bank Brasil SA—Banco Multiplo, | | | | | |
| 4.00%, 5/11/16 (b) | | 760 | | | 754,300 |
| HSBC Bank Plc, 3.10%, 5/24/16 (b) | | 430 | | | 430,025 |
| HSBC Holdings Plc, 6.10%, 1/14/42 | | 175 | | | 198,356 |
| Sparebanken 1 Boligkreditt (b): | | | | | |
| 1.25%, 10/25/14 | | | 805 | | | 799,272 |
| 2.63%, 5/27/17 | | | 1,030 | | | 1,038,927 |
| | | | | | | 7,921,668 |
| Construction Materials—0.0% | | | | | |
| Inversiones CMPC SA, 4.75%, | | | | | |
| 1/19/18 (b) | | 120 | | | 125,192 |
| Lafarge SA, 7.13%, 7/15/36 | | 90 | | | 79,464 |
| | | | | | | 204,656 |
| Consumer Finance—0.2% | | | | | |
| Credit Acceptance Corp., 9.13%, | | | | | |
| 2/01/17 (b) | | 415 | | | 432,638 |
| Ford Motor Credit Co. LLC, 6.63%, | | | | | |
| 8/15/17 | | | 190 | | | 206,826 |
| SLM Corp., 6.25%, 1/25/16 | | 367 | | | 356,900 |
| | | | | | | 996,364 |
| Diversified Financial Services—1.6% | | | | | |
| Capital One Financial Corp.: | | | | | |
| 3.15%, 7/15/16 | | | 1,105 | | | 1,109,728 |
| 4.75%, 7/15/21 | | | 435 | | | 447,664 |
| Citigroup, Inc.: | | | | | |
| 5.00%, 9/15/14 | | | 165 | | | 163,302 |
| 4.59%, 12/15/15 | | | 2,030 | | | 2,042,986 |
| General Electric Capital Corp.: | | | | | |
| 0.51%, 4/10/12 (d) | | 590 | | | 590,103 |
| 5.50%, 1/08/20 | | | 160 | | | 176,047 |
| JPMorgan Chase & Co.: | | | | | |
| 3.15%, 7/05/16 | | | 610 | | | 612,855 |
| 4.63%, 5/10/21 | | | 710 | | | 734,600 |
| JPMorgan Chase Bank NA: | | | | | |
| 6.00%, 7/05/17 | | | 570 | | | 611,612 |
| Series BKNT, 6.00%, 10/01/17 | | 605 | | | 650,801 |
| Reynolds Group Issuer, Inc. (b): | | | | | |
| 7.88%, 8/15/19 | | | 410 | | | 428,450 |
| 6.88%, 2/15/21 | | | 320 | | | 318,400 |
| | | | | | | 7,886,548 |
| Diversified Telecommunication Services—0.4% | | | | |
| GTE Corp., 6.84%, 4/15/18 | | 293 | | | 350,960 |
| Level 3 Financing, Inc.: | | | | | |
| 8.75%, 2/15/17 | | | 25 | | | 25,438 |
| 8.13%, 7/01/19 (b) | | 233 | | | 229,505 |
| Telefonica Emisiones SAU, 4.95%, 1/15/15 | | 625 | | | 621,713 |
See Notes to Financial Statements.
| 24 | BLACKROCK SERIES FUND, INC. | DECEMBER 31, 2011 |
| BlackRock Balanced Capital Portfolio | |
| Schedule of Investments (continued) | (Percentages shown are based on Net Assets) |
| | | | Par | | |
| Corporate Bonds | | (000) | | Value |
| Diversified Telecommunication Services (concluded) | | |
| Verizon Communications, Inc.: | | | | | |
| 6.10%, 4/15/18 | | USD | 127 | | $ | 152,573 |
| 3.50%, 11/01/21 | | | 290 | | | 301,925 |
| 6.40%, 2/15/38 | | | 313 | | | 397,323 |
| | | | | | | 2,079,437 |
| Electric Utilities—1.0% | | | | | |
| Alabama Power Co., 3.95%, 6/01/21 | | 280 | | | 307,121 |
| The Cleveland Electric Illuminating Co.: | | | | | |
| 8.88%, 11/15/18 | | | 85 | | | 114,055 |
| 5.95%, 12/15/36 | | | 136 | | | 144,939 |
| Constellation Energy Group, Inc., | | | | | |
| 7.60%, 4/01/32 | | | 100 | | | 128,863 |
| Duke Energy Carolinas LLC, 4.25%, | | | | | |
| 12/15/41 | | | 205 | | | 214,480 |
| Florida Power & Light Co., 5.95%, | | | | | |
| 2/01/38 | | | 325 | | | 426,128 |
| Georgia Power Co., 3.00%, 4/15/16 | | 445 | | | 471,846 |
| Hydro-Quebec: | | | | | |
| 9.40%, 2/01/21 | | | 245 | | | 373,200 |
| 8.40%, 1/15/22 | | | 412 | | | 602,445 |
| 8.05%, 7/07/24 | | | 1,180 | | | 1,754,781 |
| Jersey Central Power & Light Co., 7.35%, | | | | | |
| 2/01/19 | | | 135 | | | 169,505 |
| Trans-Allegheny Interstate Line Co., 4.00%, | | | | | |
| 1/15/15 (b) | | 140 | | | 145,933 |
| | | | | | | 4,853,296 |
| Energy Equipment & Services—0.4% | | | | |
| Ensco Plc: | | | | | |
| 3.25%, 3/15/16 | | | 90 | | | 91,813 |
| 4.70%, 3/15/21 | | | 200 | | | 208,281 |
| MEG Energy Corp., 6.50%, 3/15/21 (b) | | 555 | | | 567,488 |
| Peabody Energy Corp., 6.25%, 11/15/21 (b) | 665 | | | 688,275 |
| Pride International, Inc., 6.88%, 8/15/20 | | 125 | | | 146,554 |
| Transocean, Inc.: | | | | | |
| 6.50%, 11/15/20 | | | 225 | | | 232,423 |
| 6.38%, 12/15/21 | | | 150 | | | 159,432 |
| | | | | | | 2,094,266 |
| Food Products—0.1% | | | | | |
| Kraft Foods, Inc.: | | | | | |
| 6.50%, 8/11/17 | | | 165 | | | 196,278 |
| 5.38%, 2/10/20 | | | 250 | | | 288,463 |
| Sara Lee Corp., 4.10%, 9/15/20 | | 177 | | | 178,631 |
| | | | | | | 663,372 |
| Health Care Equipment & Supplies—0.2% | | | | |
| Boston Scientific Corp., 5.50%, 11/15/15 | | 723 | | | 801,461 |
| CareFusion Corp., 6.38%, 8/01/19 | | 180 | | | 212,553 |
| | | | | | | 1,014,014 |
| Health Care Providers & Services—0.3% | | | | |
| HCA, Inc.: | | | | | |
| 6.50%, 2/15/20 | | | 475 | | | 492,812 |
| 7.25%, 9/15/20 | | | 215 | | | 226,825 |
| Tenet Healthcare Corp.: | | | | | |
| 6.25%, 11/01/18 (b) | | 280 | | | 284,900 |
| 8.88%, 7/01/19 | | | 340 | | | 381,650 |
| UnitedHealth Group, Inc., 3.38%, 11/15/21 | 90 | | | 93,082 |
| | | | | | | 1,479,269 |
| Hotels, Restaurants & Leisure—0.1% | | | | |
| MGM Resorts International: | | | | | |
| 10.38%, 5/15/14 | | | 230 | | | 262,775 |
| 11.13%, 11/15/17 | | | 310 | | | 353,400 |
| | | | | | | 616,175 |
| | | | | Par | | |
| Corporate Bonds | | (000) | | Value |
| Independent Power Producers & Energy Traders—0.1% | | |
| Energy Future Intermediate Holding Co. | | | | | |
| LLC, 10.00%, 12/01/20 | USD | 655 | | $ | 691,025 |
| Insurance—1.2% | | | | | |
| Allianz Finance II BV, 5.75%, 7/08/41 | | 100 | | | 110,119 |
| American International Group, Inc., 5.45%, | | | | | |
| 5/18/17 | | | 210 | | | 200,684 |
| AXA SA, 5.25%, 4/16/40 | EUR | 100 | | | 94,448 |
| Fairfax Financial Holdings, Ltd., 5.80%, | | | | | |
| 5/15/21 (b) | | 460 | | | 438,471 |
| Hartford Financial Services Group, Inc., | | | | | |
| 6.00%, 1/15/19 | | | 200 | | | 205,258 |
| Hartford Life Global Funding Trusts, 0.73%, | | | | | |
| 6/16/14 (d) | | 1,050 | | | 993,336 |
| ING Verzekeringen NV, 3.27%, 6/21/21 | | 40 | | | 43,590 |
| Lincoln National Corp., 7.00%, 6/15/40 | USD | 180 | | | 203,497 |
| Manulife Financial Corp., 3.40%, 9/17/15 | | 400 | | | 402,231 |
| Metropolitan Life Global Funding I (b): | | | | | |
| 2.88%, 9/17/12 | | | 675 | | | 683,824 |
| 2.50%, 1/11/13 | | | 1,440 | | | 1,457,446 |
| 5.13%, 6/10/14 | | | 375 | | | 403,773 |
| Prudential Financial, Inc.: | | | | | |
| 4.75%, 9/17/15 | | | 480 | | | 506,829 |
| 5.38%, 6/21/20 | | | 340 | | | 363,878 |
| | | | | | | | 6,107,384 |
| IT Services—0.1% | | | | | |
| First Data Corp. (b): | | | | | |
| 7.38%, 6/15/19 | | | 340 | | | 319,600 |
| 8.25%, 1/15/21 | | | 45 | | | 40,275 |
| | | | | | | | 359,875 |
| Life Sciences Tools & Services—0.0% | | | | | |
| Life Technologies Corp., 5.00%, 1/15/21 | | 54 | | | 56,503 |
| Machinery—0.1% | | | | | |
| Joy Global, Inc., 5.13%, 10/15/21 | | 125 | | | 133,432 |
| Navistar International Corp., 3.00%, | | | | | |
| 10/15/14 (f) | | 110 | | | 118,525 |
| | | | | | | | 251,957 |
| Media—1.1% | | | | | |
| CBS Corp.: | | | | | |
| 4.63%, 5/15/18 | | | 90 | | | 93,575 |
| 8.88%, 5/15/19 | | | 155 | | | 199,081 |
| 5.75%, 4/15/20 | | | 140 | | | 157,399 |
| CCH II LLC, 13.50%, 11/30/16 | | 550 | | | 635,250 |
| Cox Communications, Inc., 8.38%, | | | | | |
| 3/01/39 (b) | | 623 | | | 834,172 |
| Clear Channel Worldwide Holdings, Inc.: | | | | | |
| 9.25%, 12/15/17 | | 111 | | | 119,325 |
| Series B, 9.25%, 12/15/17 | | 453 | | | 489,240 |
| Comcast Cable Communications | | | | | |
| Holdings, Inc., 9.46%, 11/15/22 | | 100 | | | 142,490 |
| Comcast Corp.: | | | | | |
| 5.88%, 2/15/18 | | | 328 | | | 379,256 |
| 6.45%, 3/15/37 | | | 113 | | | 136,983 |
| CSC Holdings, Inc., 8.50%, 4/15/14 | | 169 | | | 186,956 |
| DIRECTV Holdings LLC, 3.13%, 2/15/16 | | 136 | | | 137,767 |
| NBC Universal Media LLC: | | | | | |
| 5.15%, 4/30/20 | | | 510 | | | 567,821 |
| 4.38%, 4/01/21 | | | 490 | | | 517,120 |
| News America, Inc., 6.40%, 12/15/35 | | 15 | | | 16,437 |
| Time Warner Cable, Inc.: | | | | | |
| 5.88%, 11/15/40 | | 235 | | | 254,331 |
| 5.50%, 9/01/41 | | | 290 | | | 305,602 |
See Notes to Financial Statements.
| BLACKROCK SERIES FUND, INC. | DECEMBER 31, 2011 | 25 |
| BlackRock Balanced Capital Portfolio | |
| Schedule of Investments (continued) | (Percentages shown are based on Net Assets) |
| | | | Par | | |
| Corporate Bonds | | (000) | | Value |
| Media (concluded) | | | | | |
| Time Warner, Inc.: | | | | | |
| 4.70%, 1/15/21 | | USD | 110 | | $ | 118,439 |
| 6.10%, 7/15/40 | | | 70 | | | 82,063 |
| Virgin Media Secured Finance Plc, 6.50%, | | | | | |
| 1/15/18 | | | 295 | | | 313,438 |
| | | | | | | 5,686,745 |
| Metals & Mining—0.5% | | | | | |
| AngloGold Ashanti Holdings Plc, 5.38%, | | | | | |
| 4/15/20 | | | 180 | | | 178,822 |
| Barrick Gold Corp., 2.90%, 5/30/16 | | 1,299 | | | 1,333,220 |
| Barrick North America Finance LLC, 4.40%, | | | | | |
| 5/30/21 | | | 10 | | | 10,830 |
| Cliffs Natural Resources, Inc., 4.88%, | | | | | |
| 4/01/21 | | | 230 | | | 229,171 |
| Newcrest Finance Property Ltd., 4.45%, | | | | | |
| 11/15/21 (b) | | 295 | | | 290,979 |
| Novelis, Inc., 8.75%, 12/15/20 | | 345 | | | 370,012 |
| | | | | | | 2,413,034 |
| Multi-Utilities—0.1% | | | | | |
| Dominion Resources, Inc., 1.95%, | | | | | |
| 8/15/16 | | | 365 | | | 366,798 |
| Multiline Retail—0.3% | | | | | |
| Dollar General Corp., 11.88%, 7/15/17 (c) | | 440 | | | 486,200 |
| Macy’s Retail Holdings, Inc.: | | | | | |
| 5.90%, 12/01/16 | | | 490 | | | 547,562 |
| 7.45%, 7/15/17 | | | 353 | | | 412,159 |
| | | | | | | 1,445,921 |
| Oil, Gas & Consumable Fuels—2.2% | | | | | |
| Anadarko Petroleum Corp.: | | | | | |
| 5.95%, 9/15/16 | | | 719 | | | 815,022 |
| 6.38%, 9/15/17 | | | 547 | | | 634,046 |
| Arch Coal, Inc., 7.25%, 10/01/20 | | 460 | | | 470,350 |
| BP Capital Markets Plc, 3.13%, 10/01/15 | | 180 | | | 188,536 |
| Chesapeake Energy Corp., 6.63%, | | | | | |
| 8/15/20 | | | 260 | | | 278,850 |
| Consol Energy, Inc.: | | | | | |
| 8.00%, 4/01/17 | | | 154 | | | 168,630 |
| 8.25%, 4/01/20 | | | 116 | | | 128,180 |
| El Paso Corp., 6.50%, 9/15/20 | | 210 | | | 227,009 |
| El Paso Pipeline Partners Operating Co. LLC, | | | | | |
| 6.50%, 4/01/20 | | | 340 | | | 374,723 |
| Enterprise Products Operating LLC: | | | | | |
| 6.13%, 10/15/39 | | | 250 | | | 279,242 |
| Series L, 6.30%, 9/15/17 | | 350 | | | 409,895 |
| KeySpan Gas East Corp., 5.82%, | | | | | |
| 4/01/41 (b) | | 235 | | | 286,697 |
| Kinder Morgan Energy Partners LP: | | | | | |
| 5.95%, 2/15/18 | | | 400 | | | 456,978 |
| 6.55%, 9/15/40 | | | 60 | | | 67,213 |
| 6.38%, 3/01/41 | | | 80 | | | 90,180 |
| Kinder Morgan Finance Co., ULC, 5.70%, | | | | | |
| 1/05/16 | | | 295 | | | 301,637 |
| Marathon Petroleum Corp., 6.50%, | | | | | |
| 3/01/41 | | | 396 | | | 448,757 |
| MidAmerican Energy Holdings Co., 5.95%, | | | | | |
| 5/15/37 | | | 500 | | | 590,852 |
| Nexen, Inc., 7.50%, 7/30/39 | | 540 | | | 647,347 |
| Petrobras International Finance Co.: | | | | | |
| 3.88%, 1/27/16 | | | 740 | | | 762,356 |
| 5.88%, 3/01/18 | | | 260 | | | 284,536 |
| 5.75%, 1/20/20 | | | 755 | | | 807,941 |
| Plains Exploration & Production Co., | | | | | |
| 10.00%, 3/01/16 | | | 65 | | | 71,987 |
| | | | Par | | |
| Corporate Bonds | | (000) | | Value |
| Oil, Gas & Consumable Fuels (concluded) | | | | |
| Range Resources Corp.: | | | | | |
| 7.25%, 5/01/18 | | USD | 485 | | $ | 518,950 |
| 5.75%, 6/01/21 | | | 65 | | | 70,363 |
| Rockies Express Pipeline LLC (b): | | | | | |
| 3.90%, 4/15/15 | | | 478 | | | 472,356 |
| 6.85%, 7/15/18 | | | 112 | | | 115,718 |
| Western Gas Partners LP, 5.38%, 6/01/21 | 410 | | | 434,670 |
| Williams Partners LP, 4.13%, 11/15/20 | | 245 | | | 251,437 |
| Woodside Finance, Ltd., 4.60%, | | | | | |
| 5/10/21 (b) | | 110 | | | 112,317 |
| | | | | | | 10,766,775 |
| Paper & Forest Products—0.1% | | | | | |
| International Paper Co.: | | | | | |
| 4.75%, 2/15/22 | | | 240 | | | 255,109 |
| 6.00%, 11/15/41 | | | 180 | | | 195,410 |
| | | | | | | 450,519 |
| Pharmaceuticals—0.1% | | | | | |
| Teva Pharmaceutical Finance Co. BV, | | | | | |
| Series 2, 3.65%, 11/10/21 | | 115 | | | 116,971 |
| Teva Pharmaceutical Finance II BV, | | | | | |
| 3.00%, 6/15/15 | | | 290 | | | 301,995 |
| Teva Pharmaceutical Finance IV BV, | | | | | |
| 3.65%, 11/10/21 | | | 285 | | | 289,883 |
| | | | | | | 708,849 |
| Real Estate Investment Trusts (REITs)—0.2% | | | | |
| ERP Operating LP, 4.63%, 12/15/21 | | 290 | | | 295,728 |
| Hospitality Properties Trust, 5.63%, | | | | | |
| 3/15/17 | | | 171 | | | 173,187 |
| Mack-Cali Realty LP, 7.75%, 8/15/19 | | 125 | | | 148,954 |
| Ventas Realty LP, 4.75%, 6/01/21 | | 165 | | | 159,249 |
| Vornado Realty LP, 5.00%, 1/15/22 | | 455 | | | 458,771 |
| | | | | | | 1,235,889 |
| Real Estate Management & Development—0.1% | | | | |
| Realogy Corp., 7.88%, 2/15/19 (b) | | 410 | | | 356,700 |
| WEA Finance LLC, 4.63%, 5/10/21 (b) | | 170 | | | 166,854 |
| | | | | | | 523,554 |
| Road & Rail—0.1% | | | | | |
| Burlington Northern Santa Fe LLC, | | | | | |
| 5.75%, 5/01/40 | | | 571 | | | 683,151 |
| Software—0.1% | | | | | |
| Oracle Corp., 5.38%, 7/15/40 | | 235 | | | 286,295 |
| Specialty Retail—0.1% | | | | | |
| QVC, Inc., 7.50%, 10/01/19 (b) | | 240 | | | 257,400 |
| Thrifts & Mortgage Finance—0.2% | | | | | |
| Northern Rock Plc, 5.63%, 6/22/17 (b) | | 200 | | | 210,300 |
| Radian Group, Inc.: | | | | | |
| 5.63%, 2/15/13 | | | 720 | | | 465,300 |
| 5.38%, 6/15/15 | | | 720 | | | 333,000 |
| | | | | | | 1,008,600 |
| Wireless Telecommunication Services—0.6% | | | | |
| America Movil SAB de CV, 2.38%, | | | | | |
| 9/08/16 | | | 480 | | | 478,663 |
| Cricket Communications, Inc., 7.75%, | | | | | |
| 5/15/16 | | | 251 | | | 259,157 |
| Crown Castle Towers LLC, 6.11%, | | | | | |
| 1/15/40 (b) | | 920 | | | 1,015,072 |
| Intelsat Jackson Holdings SA, 7.25%, | | | | | |
| 4/01/19 (b) | | 208 | | | 211,120 |
| MetroPCS Wireless, Inc., 7.88%, | | | | | |
| 9/01/18 | | | 15 | | | 15,206 |
See Notes to Financial Statements.
| 26 | BLACKROCK SERIES FUND, INC. | DECEMBER 31, 2011 |
| BlackRock Balanced Capital Portfolio | |
| Schedule of Investments (continued) | (Percentages shown are based on Net Assets) |
| Corporate Bonds | | Par
(000) | | Value |
| Wireless Telecommunication Services (concluded) | | | | |
| SBA Tower Trust, 5.10%, 4/15/42 (b) | USD | 220 | | $ | 229,075 |
| Sprint Capital Corp., 6.88%, 11/15/28 | | 100 | | | 71,375 |
| Sprint Nextel Corp., 9.00%, 11/15/18 (b) | | 520 | | | 546,000 |
| | | | | | | 2,825,668 |
| Total Corporate Bonds—14.1% | | | | | 70,640,813 |
| |
| |
| Foreign Agency Obligations | | | | | |
| Brazilian Government International Bond, | | | | | |
| 7.13%, 1/20/37 | | | 100 | | | 138,000 |
| Hellenic Republic Government Bond, | | | | | |
| 4.60%, 9/20/40 | | EUR | 90 | | | 19,919 |
| Indonesia Government International Bond, | | | | | |
| 4.88%, 5/05/21 | | USD | 200 | | | 214,000 |
| Italy Buoni Poliennali Del Tesoro, 4.75%, | | | | | |
| 9/15/16 | | EUR | 1,755 | | | 2,152,881 |
| Kreditanstalt fuer Wiederaufbau, 1.38%, | | | | | |
| 7/15/13 | | USD | 335 | | | 338,045 |
| Mexico Government International Bond: | | | | | |
| 6.38%, 1/16/13 | | | 157 | | | 164,065 |
| 5.63%, 1/15/17 | | | 190 | | | 218,500 |
| 5.13%, 1/15/20 | | | 555 | | | 634,087 |
| Peruvian Government International Bond, | | | | | |
| 6.55%, 3/14/37 | | | 70 | | | 88,900 |
| Poland Government International Bond: | | | | | |
| 6.38%, 7/15/19 | | | 70 | | | 77,525 |
| 5.13%, 4/21/21 | | | 535 | | | 544,362 |
| Russia Government International Bond, | | | | | |
| 7.50%, 3/31/30 (g) | | 501 | | | 581,786 |
| South Africa Government International Bond, | | | | | |
| 5.50%, 3/09/20 | | | 300 | | | 336,000 |
| Turkey Government International Bond: | | | | | |
| 7.00%, 3/11/19 | | | 140 | | | 155,050 |
| 5.63%, 3/30/21 | | | 410 | | | 414,613 |
| Total Foreign Agency Obligations—1.2% | | | | 6,077,733 |
| |
| |
| Non-Agency Mortgage-Backed Securities | | | | |
| Collateralized Mortgage Obligations—1.0% | | | | |
| Countrywide Alternative Loan Trust, | | | | | |
| Series 2006-0A21, Class A1, 0.47%, | | | | | |
| 3/20/47 (d) | | 2,204 | | | 975,488 |
| Countrywide Home Loan Mortgage | | | | | |
| Pass-Through Trust: | | | | | |
| Series 2006-0A5, Class 2A1, 0.49%, | | | | | |
| 4/25/46 (d) | | 237 | | | 118,768 |
| Series 2006-0A5, Class 3A1, 0.49%, | | | | | |
| 4/25/46 (d) | | 382 | | | 208,053 |
| Series 2007-J3, Class A10, 6.00%, | | | | | |
| 7/25/37 | | | 1,117 | | | 902,050 |
| Credit Suisse Mortgage Capital | | | | | |
| Certificates (b)(d): | | | | | |
| Series 2011-2R, Class 2A1, 2.73%, | | | | | |
| 7/27/36 | | | 729 | | | 707,948 |
| Series 2011-5R, Class 2A1, 3.90%, | | | | | |
| 8/26/46 | | | 543 | | | 455,983 |
| First Horizon Asset Securities, Inc., | | | | | |
| Series 2005-AR3, Class 3A1, 5.53%, | | | | | |
| 8/25/35 (d) | | 164 | | | 133,827 |
| | | | Par | | |
| Non-Agency Mortgage-Backed Securities | (000) | | Value |
| Collateralized Mortgage Obligations (concluded) | | | | |
| Impac Secured Assets CMN Owner Trust, | | | | | |
| Series 2004-3, Class 1A4, 1.09%, | | | | | |
| 11/25/34 (d) | USD | 94 | | $ | 83,307 |
| JPMorgan Mortgage Trust: | | | | | |
| Series 2006-S2, Class 2A2, 5.88%, | | | | | |
| 7/25/36 | | | 57 | | | 53,692 |
| Series 2007-S1, Class 1A2, 5.50%, | | | | | |
| 3/25/22 | | | 54 | | | 49,489 |
| Residential Accredit Loans, Inc., | | | | | |
| Series 2006-Q02, Class A1, 0.51%, | | | | | |
| 2/25/46 (d) | | 291 | | | 90,723 |
| WaMu Mortgage Pass-Through Certificates, | | | | | |
| Series 2007-0A4, Class 1A, 0.98%, | | | | | |
| 5/25/47 (d) | | 863 | | | 492,816 |
| Wells Fargo Mortgage-Backed Securities Trust, | | | | |
| Series 2006-AR18, Class 2A1, 5.39%, | | | | | |
| 11/25/36 (d) | | 1,129 | | | 834,745 |
| | | | | | | 5,106,889 |
| Commercial Mortgage-Backed Securities—3.9% | | | | |
| Banc of America Merrill Lynch Commercial | | | | | |
| Mortgage, Inc.: | | | | | |
| Series 2003-2, Class A3, 4.87%, | | | | | |
| 3/11/41 (d) | | 1,779 | | | 1,810,732 |
| Series 2006-5, Class AAB, 5.38%, | | | | | |
| 9/10/47 | | | 968 | | | 1,005,050 |
| Series 2006-5, Class AM, 5.45%, | | | | | |
| 9/10/47 | | | 60 | | | 56,483 |
| Series 2007-1, Class A4, 5.45%, | | | | | |
| 1/15/49 | | | 320 | | | 347,663 |
| Series 2007-3, Class A4, 5.62%, | | | | | |
| 6/10/49 (d) | | 280 | | | 300,243 |
| Bear Stearns Commercial Mortgage Securities: | | | | |
| Series 2005-PW10, Class AM, 5.45%, | | | | | |
| 12/11/40 (d) | | 70 | | | 66,382 |
| Series 2007-PW17, Class A3, 5.74%, | | | | | |
| 6/11/50 | | | 590 | | | 619,594 |
| Citigroup Commercial Mortgage Trust, | | | | | |
| Series 2008-C7, Class A4, 6.07%, | | | | | |
| 12/10/49 (d) | | 930 | | | 1,032,943 |
| Citigroup/Deutsche Bank Commercial | | | | | |
| Mortgage Trust, Series 2006-CD3, | | | | | |
| Class AM, 5.65%, 10/15/48 | | 250 | | | 234,653 |
| CS First Boston Mortgage Securities Corp., | | | | | |
| Series 2002-CP5, Class A1, 4.11%, | | | | | |
| 12/15/35 | | | 144 | | | 144,344 |
| DBRR Trust, Series 2011-C32, Class A3A, | | | | | |
| 5.74%, 6/17/49 (b)(d) | | 205 | | | 219,660 |
| Extended Stay America Trust, | | | | | |
| Series 2010-ESHA (b): | | | | | |
| Class C, 4.86%, 11/05/27 | | 385 | | | 389,776 |
| Class D, 5.50%, 11/05/27 | | 680 | | | 682,493 |
| GMAC Commercial Mortgage Securities, Inc.: | | | | |
| Series 2004-C3, Class AAB, 4.70%, | | | | | |
| 12/10/41 | | | 1,673 | | | 1,731,409 |
| Series 2006-C1, Class AM, 5.29%, | | | | | |
| 11/10/45 (d) | | 110 | | | 109,668 |
| GS Mortgage Securities Corp. II, | | | | | |
| Series 2007-GG10, Class A4, 5.79%, | | | | | |
| 8/10/45 (d) | | 1,475 | | | 1,601,829 |
| Greenwich Capital Commercial Funding Corp.: | | | | |
| Series 2006-GG7, Class AJ, 5.88%, | | | | | |
| 7/10/38 (d) | | 160 | | | 112,000 |
See Notes to Financial Statements.
| BLACKROCK SERIES FUND, INC. | DECEMBER 31, 2011 | 27 |
| BlackRock Balanced Capital Portfolio | |
| Schedule of Investments (continued) | (Percentages shown are based on Net Assets) |
| Non-Agency Mortgage-Backed Securities | Par
(000) | | Value |
| Commercial Mortgage-Backed Securities (concluded) | | |
| Greenwich Capital Commercial Funding | | | | | |
| Corp. (concluded): | | | | | |
| Series 2007-GG9, Class A4, 5.44%, | | | | | |
| 3/10/39 | | USD | 65 | | $ | 70,355 |
| JPMorgan Chase Commercial Mortgage | | | | | |
| Securities Corp.: | | | | | |
| Series 2004-CB8, Class A1A, 4.16%, | | | | | |
| 1/12/39 (b) | | 512 | | | 527,248 |
| Series 2004-LN2, Class A2, 5.12%, | | | | | |
| 7/15/41 | | | 480 | | | 507,464 |
| Series 2006-CB14, Class AM, 5.45%, | | | | | |
| 12/12/44 (d) | | 180 | | | 177,943 |
| Series 2007-CB18, Class A3, 5.45%, | | | | | |
| 6/12/47 | | | 455 | | | 478,224 |
| LB-UBS Commercial Mortgage Trust: | | | | | |
| Series 2004-C7, Class A1A, 4.48%, | | | | | |
| 10/15/29 | | | 745 | | | 770,556 |
| Series 2006-C4, Class AM, 5.89%, | | | | | |
| 6/15/38 (d) | | 80 | | | 81,505 |
| Series 2006-C7, Class AM, 5.38%, | | | | | |
| 11/15/38 | | | 80 | | | 77,371 |
| Series 2007-C6, Class A4, 5.86%, | | | | | |
| 7/15/40 (d) | | 235 | | | 257,418 |
| Series 2007-C7, Class A3, 5.87%, | | | | | |
| 9/15/45 (d) | | 430 | | | 471,627 |
| Merrill Lynch/Countrywide Commercial | | | | | |
| Mortgage Trust, Series 2007-9, Class A4, | | | | |
| 5.70%, 9/12/49 | | | 680 | | | 723,741 |
| Morgan Stanley Capital I: | | | | | |
| Series 1998-WF2, Class G, 6.34%, | | | | | |
| 7/15/30 (b)(d) | | 270 | | | 283,092 |
| Series 2003-IQ4, Class A2, 4.07%, | | | | | |
| 5/15/40 | | | 1,412 | | | 1,444,476 |
| Series 2007-HQ12, Class A2, 5.60%, | | | | | |
| 4/12/49 (d) | | 81 | | | 83,140 |
| Series 2007-HQ12, Class A2FL, 0.53%, | | | | |
| 4/12/49 | | | 150 | | | 143,013 |
| Series 2007-HQ12, Class A2FX, 5.60%, | | | | |
| 4/12/49 (d) | | 238 | | | 242,279 |
| RBSCF Trust, Series 2010-RR3, | | | | | |
| Class WBTA, 5.90%, 2/16/51 (b)(d) | | 1,010 | | | 1,113,572 |
| Wachovia Bank Commercial Mortgage Trust, | | | | |
| Series 2005-C20, Class A6A, 5.11%, | | | | | |
| 7/15/42 (d) | | 1,361 | | | 1,378,546 |
| | | | | | | 19,296,492 |
| Interest Only Commercial Mortgage-Backed Securities—0.1% | |
| Morgan Stanley Reremic Trust (b): | | | | | |
| Series 2009-IO, Class B, 10.38%, | | | | | |
| 7/17/56 (h) | | 380 | | | 319,200 |
| Series 2011-IO, Class A, 2.50%, | | | | | |
| 3/23/51 | | | 193 | | | 192,924 |
| | | | | | | 512,124 |
| Total Non-Agency Mortgage-Backed Securities—5.0% | | 24,915,505 |
| |
| |
| Taxable Municipal Bonds | | | | | |
| New York City Municipal Water Finance | | | | | |
| Authority, RB, Second General | | | | | |
| Resolution, Series EE: | | | | | |
| 5.38%, 6/15/43 | | | 215 | | | 238,265 |
| 5.50%, 6/15/43 | | | 255 | | | 286,210 |
| Total Taxable Municipal Bonds—0.1% | | | | 524,475 |
| | | | Par | | |
| US Government Sponsored Agency Securities | (000) | | Value |
| Agency Obligations—0.7% | | | | | |
| Fannie Mae: | | | | | |
| 5.25%, 8/01/12 | | USD | 1,050 | | $ | 1,079,039 |
| 4.50%, 10/09/19 (h) | | 650 | | | 499,762 |
| Federal Home Loan Bank of Chicago, 5.63%, | | | | |
| 6/13/16 | | | 450 | | | 510,070 |
| Tennessee Valley Authority, 5.25%, 9/15/39 | 975 | | | 1,244,598 |
| | | | | | | 3,333,469 |
| Collateralized Mortgage Obligations—0.1% | | | | |
| Freddie Mac Mortgage-Backed Securities: | | | | | |
| Series 3068, Class VA, 5.50%, | | | | | |
| 10/15/16 | | | 91 | | | 90,681 |
| Series K013, Class A2, 3.97%, | | | | | |
| 1/25/21 (d) | | 570 | | | 626,695 |
| | | | | | | 717,376 |
| Federal Deposit Insurance Corporation Guaranteed—0.1% | | |
| General Electric Capital Corp., 2.13%, | | | | | |
| 12/21/12 | | | 410 | | | 417,627 |
| Interest Only Collateralized Mortgage Obligations—0.4% | | |
| Fannie Mae Mortgage-Backed Securities (d): | | | | |
| Series 2010-123, Class SE, 5.73%, | | | | | |
| 11/25/40 | | | 1,615 | | | 180,549 |
| Series 2010-149, Class SJ, 6.24%, | | | | | |
| 1/25/41 | | | 1,866 | | | 283,178 |
| Series 2011-55, Class SH, 6.27%, | | | | | |
| 6/25/41 | | | 1,788 | | | 275,406 |
| Freddie Mac Mortgage-Backed Securities: | | | | | |
| Series 3716, Class PI, 4.50%, | | | | | |
| 4/15/38 | | | 1,360 | | | 182,872 |
| Series 3780, Class SM, 6.22%, | | | | | |
| 12/15/40 (d) | | 1,674 | | | 249,006 |
| Ginnie Mae Mortgage-Backed Securities (d): | | | | |
| Series 2010-26, Class QS, 5.97%, | | | | | |
| 2/20/40 | | | 3,972 | | | 682,711 |
| Series 2010-42, Class DS, 5.42%, | | | | | |
| 4/20/40 | | | 866 | | | 112,132 |
| Series 2011-80, Class KS, 6.39%, | | | | | |
| 6/20/41 | | | 1,134 | | | 156,258 |
| | | | | | | 2,122,112 |
| Mortgage-Backed Securities—22.1% | | | | | |
| Fannie Mae Mortgage-Backed Securities: | | | | | |
| 3.09%, 3/01/41 (d) | | 243 | | | 253,716 |
| 3.15%, 3/01/41 (d) | | 316 | | | 328,737 |
| 3.32%, 12/01/40 (d) | | 411 | | | 428,258 |
| 3.50%, 10/01/26—1/01/42 (i) | | 17,361 | | | 17,902,532 |
| 4.00%, 9/01/24—1/01/42 (i) | | 25,743 | | | 27,198,950 |
| 4.50%, 1/01/27—1/01/42 (i)(j) | | 19,485 | | | 20,791,391 |
| 4.79%, 8/01/38 (d) | | 630 | | | 672,845 |
| 5.00%, 7/01/34—1/01/42 (i) | | 4,925 | | | 5,324,239 |
| 5.50%, 6/01/33—1/01/39 | | | 9,104 | | | 9,940,536 |
| 6.00%, 12/01/27—1/01/42 (i) | | 6,598 | | | 7,264,291 |
| 6.50%, 7/01/37—10/01/39 | | | 2,486 | | | 2,781,631 |
| Freddie Mac Mortgage-Backed Securities: | | | | | |
| 3.05%, 2/01/41 (d) | | 348 | | | 363,940 |
| 4.50%, 1/01/42 (i) | | 300 | | | 317,859 |
| 5.00%, 1/01/42 (i) | | 1,700 | | | 1,826,703 |
| 5.50%, 1/01/42 (i) | | 100 | | | 108,500 |
| 6.00%, 1/01/34 | | | 438 | | | 487,483 |
| Ginnie Mae Mortgage-Backed Securities: | | | | | |
| 4.00%, 1/01/42 (i) | | 2,000 | | | 2,145,312 |
| 4.50%, 1/15/42 (i) | | 3,600 | | | 3,922,312 |
| 5.00%, 1/15/42 (i) | | 3,900 | | | 4,319,859 |
See Notes to Financial Statements.
| 28 | BLACKROCK SERIES FUND, INC. | DECEMBER 31, 2011 |
| BlackRock Balanced Capital Portfolio | |
| Schedule of Investments (continued) | (Percentages shown are based on Net Assets) |
| US Government Sponsored Agency Securities | Par
(000) | Value |
| Mortgage-Backed Securities (concluded) | | | | |
| Ginnie Mae Mortgage-Backed Securities (concluded): | | | | |
| 5.50%, 1/01/42 (i) | USD | 1,800 | | $ | 2,020,219 |
| 6.00%, 1/01/42 (i) | | 1,700 | | | 1,924,187 |
| 7.50%, 3/15/32 | | | 9 | | | 10,428 |
| | | | | | | 110,333,928 |
| Total US Government Sponsored Agency Securities—23.4% | | 116,924,512 |
| |
| |
| US Treasury Obligations | | | | | |
| US Treasury Bonds: | | | | | |
| 8.13%, 5/15/21 | | | 1,810 | | | 2,816,248 |
| 8.13%, 8/15/21 | | | 490 | | | 767,463 |
| 6.25%, 8/15/23 (k) | | 1,800 | | | 2,576,250 |
| 3.50%, 2/15/39 (l) | | 3,635 | | | 4,088,808 |
| 4.38%, 5/15/40 | | | 334 | | | 433,887 |
| 2.13%, 2/15/41 | | | 1,608 | | | 2,171,902 |
| 4.75%, 2/15/41 | | | 1,679 | | | 2,313,872 |
| 4.38%, 5/15/41 | | | 430 | | | 560,277 |
| 3.13%, 11/15/41 (l) | | 9,985 | | | 10,460,845 |
| US Treasury Notes: | | | | | |
| 0.50%, 8/15/14 | | | 595 | | | 597,696 |
| 0.25%, 12/15/14 (l) | | 3,995 | | | 3,981,892 |
| 2.50%, 4/30/15 | | | 610 | | | 650,985 |
| 0.88%, 11/30/16 (l) | | 11,665 | | | 11,700,543 |
| 2.25%, 7/31/18 | | | 1,275 | | | 1,356,082 |
| 2.63%, 8/15/20 | | | 570 | | | 614,754 |
| 2.00%, 11/15/21 (l) | | 10,055 | | | 10,169,687 |
| Total US Treasury Obligations—11.1% | | | | 55,261,191 |
| Total Fixed Income Securities—57.3% | | | | 286,354,959 |
| |
| |
| Preferred Securities | | | | | |
| Capital Trusts | | | | | |
| Capital Markets—0.1% | | | | | |
| Credit Suisse Guernsey Ltd., 5.86% (d)(m) | | 424 | | | 344,500 |
| Lehman Brothers Holdings Capital Trust VII, | | | | |
| 5.86% (a)(e)(m) | | 130 | | | 13 |
| State Street Capital Trust IV, 1.55%, | | | | | |
| 6/01/77 (d) | | 40 | | | 26,330 |
| | | | | | | 370,843 |
| Commercial Banks—0.1% | | | | | |
| ABN AMRO North America Holding | | | | | |
| Preferred Capital Repackaging | | | | | |
| Trust I, 6.52% (b)(d)(m) | | 360 | | | 245,250 |
| Barclays Bank Plc, 5.93% (b)(d)(m) | | 100 | | | 83,000 |
| Fifth Third Capital Trust IV, 6.50%, | | | | | |
| 4/15/67 (d) | | 295 | | | 289,100 |
| JPMorgan Chase Capital XXV, Series Y, | | | | | |
| 6.80%, 10/01/37 | | | 125 | | | 125,469 |
| | | | | | | 742,819 |
| Consumer Finance—0.1% | | | | | |
| Capital One Capital VI, 8.88%, 5/15/40 | | 305 | | | 316,557 |
| Insurance—0.1% | | | | | |
| American International Group, Inc., 8.18%, | | | | | |
| 5/15/68 (d) | | 65 | | | 57,850 |
| Metlife Capital Trust IV, 7.88%, | | | | | |
| 12/15/67 (b) | | 100 | | | 103,750 |
| Capital Trusts | | | Par
(000) | | Value |
| Insurance (concluded) | | | | | | |
| Swiss Re Capital I LP, 6.85% (b)(d)(m) | | USD | 300 | | $ | 254,957 |
| XL Group Plc, Series E, 6.50% (d)(m) | | | 215 | | | 168,238 |
| | | | | | | 584,795 |
| Total Capital Trusts—0.4% | | | | | | 2,015,014 |
| |
| |
| Preferred Stocks | | | Shares | | |
| Thrifts & Mortgage Finance—0.0% | | | | | | |
| Fannie Mae, 8.25% (a)(d)(m) | | | 10,000 | | | 13,800 |
| Freddie Mac, Series Z, 8.38% (a)(d)(m) | | | 10,000 | | | 13,300 |
| Total Preferred Stocks—0.0% | | | | | | 27,100 |
| |
| |
| Trust Preferreds | | | | | | |
| Commercial Banks—0.0% | | | | | | |
| Citigroup Capital XIII, 7.88%, 10/30/40 | | | 9 | | | 228,624 |
| Total Preferred Securities—0.4% | | | | | | 2,270,738 |
| Total Long-Term Investments | | | | | | |
| (Cost—$558,052,964)—115.4% | | | | | | 576,997,723 |
| |
| |
| Short-Term Securities | | | | | | |
| BlackRock Liquidity Funds, TempFund, | | | | | | |
| Institutional Class, 0.10% (n)(o) | | | 953,832 | | | 953,832 |
| Total Short-Term Securities | | | | | | |
| (Cost—$953,832)—0.2% | | | | | | 953,832 |
| |
| |
| Options Purchased | | | Contracts | |
| Exchange-Traded Call Options—0.0% | | | | | | |
| 10-Year US Treasury Note: | | | | | | |
| Strike Price USD 133, Expires 1/27/12 | | | 49 | | | 8,422 |
| Strike Price USD 132, Expires 1/27/12 | | | 19 | | | 7,718 |
| | | | | | | 16,140 |
| Exchange-Traded Put Options—0.0% | | | | | | |
| 10-Year US Treasury Note: | | | | | | |
| Strike Price USD 127, Expires 1/27/12 | | | 50 | | | 2,344 |
| Strike Price USD 128, Expires 1/27/12 | | | 26 | | | 2,437 |
| Eurodollar Future Option, | | | | | | |
| Strike Price USD 99, Expires 1/13/12 | | | 60 | | | 375 |
| Eurodollar 1-Year Mid-Curve Options, | | | | | | |
| Strike Price USD 99, Expires 3/16/12 | | | 131 | | | 13,100 |
| | | | | | | 18,256 |
| |
| | | | Notional
Amount
(000) | | |
| Over-the-Counter Call Options—0.0% | | | | | | |
| EUR Call Option, Strike Price USD 1.45, | | | | | | |
| Expires 2/17/12, Broker Citibank NA | | EUR | 4,550 | | | 1,119 |
| Over-the-Counter Call Swaptions—0.1% | | | | |
| Receive a fixed rate of 1.76% and pay a | | | | | | |
| floating rate based on 3-month LIBOR, | | | | | | |
| Expires 1/26/12, Broker Deutsche Bank AG | | | 5,100 | | | 103,011 |
| Sold credit default protection on Dow Jones | | | | | | |
| CDX North America High Yield Index Series | | | | | | |
| 17,Strike Price USD 92, Expires 1/18/12, | | | | | | |
| Broker Morgan Stanley Capital Services Inc. (p) | 2,425 | (q) | | 45,175 |
| | | | | | | 148,186 |
See Notes to Financial Statements.
| BLACKROCK SERIES FUND, INC. | DECEMBER 31, 2011 | 29 |
| BlackRock Balanced Capital Portfolio | |
| Schedule of Investments (continued) | (Percentages shown are based on Net Assets) |
| Options Purchased | | Notional
Amount
(000) | | Value |
| Over-the-Counter Put Swaptions—0.0% | | | | | |
| Pay a fixed rate of 2.70% and receive a | | | | | | |
| floating rate based on 3-month LIBOR, | | | | | | |
| Expires 1/27/12, Broker Citibank NA | USD | 5,200 | | $ | 630 | |
| Pay a fixed rate of 2.75% and receive a | | | | | | |
| floating rate based on 3-month LIBOR, | | | | | | |
| Expires 5/11/12, Broker JPMorgan | | | | | | |
| Chase Bank | | 2,100 | | | 10,818 | |
| Pay a fixed rate of 2.85% and receive a | | | | | | |
| floating rate based on 3-month LIBOR, | | | | | | |
| Expires 1/13/12, Broker Bank of | | | | | | |
| America NA | | 2,800 | | | 1 | |
| Pay a fixed rate of 2.85% and receive a | | | | | | |
| floating rate based on 3-month LIBOR, | | | | | | |
| Expires 2/24/12, Broker Bank of | | | | | | |
| America NA | | 1,700 | | | 850 | |
| Pay a fixed rate of 1.76% and receive a | | | | | | |
| floating rate based on 3-month LIBOR, | | | | | | |
| Expires 1/26/12, Broker Deutsche Bank AG | 5,100 | | | 1 | |
| Pay a fixed rate of 2.50% and receive a | | | | | | |
| floating rate based on 3-month LIBOR, | | | | | | |
| Expires 1/26/12, Broker Deutsche Bank AG | 2,500 | | | — | |
| Pay a fixed rate of 2.95% and receive a | | | | | | |
| floating rate based on 3-month LIBOR, | | | | | | |
| Expires 6/14/12, Broker Deutsche Bank AG | 700 | | | 25,668 | |
| Pay a fixed rate of 3.50% and receive a | | | | | | |
| floating rate based on a 6-month EURIBOR, | | | | | |
| Expires 11/08/12, Broker Citibank NA | | 2,300 | | | 58,791 | |
| | | | | | 96,759 | |
| Total Options Purchased | | | | | | |
| (Cost—$528,545)—0.1% | | | | | 280,460 | |
| Total Investments Before TBA Sale | | | | | | |
| Commitments and Options Written | | | | | | |
| (Cost—$559,535,341)—115.7% | | | | | 578,232,015 | |
| |
| |
| | | Par | | | |
| TBA Sale Commitments (i) | | (000) | | | |
| Fannie Mae Mortgage-Backed Securities: | | | | | | |
| 3.50%, 1/01/42 | | 10,200 | | | (10,490,062 | ) |
| 4.00%, 1/01/42 | | 20,300 | | | (21,280,954 | ) |
| 5.50%, 1/01/42 | | 8,400 | | | (9,131,984 | ) |
| Total TBA Sale Commitments | | | | | | |
| (Proceeds $40,621,980)—(8.2)% | | | | | (40,903,000 | ) |
| |
| |
| | | Notional | | | |
| | | Amount | | | |
| Options Written | | (000) | | | |
| Over-the-Counter Call Swaptions—(0.1)% | | | | | |
| Pay a fixed rate of 2.56% and receive a | | | | | | |
| floating rate based on 3-month LIBOR, | | | | | | |
| Expires 12/19/13, Broker Deutsche | | | | | | |
| Bank AG | | 1,200 | | | (60,403 | ) |
| Pay a fixed rate of 2.60% and receive a | | | | | | |
| floating rate based on 3-month LIBOR, | | | | | | |
| Expires 12/16/13, Broker JPMorgan | | | | | | |
| Chase Bank | | 1,300 | | | (68,361 | ) |
| Pay a fixed rate of 2.08% and receive a | | | | | | |
| floating rate based on 3-month LIBOR, | | | | | | |
| Expires 2/07/12, Broker Goldman Sachs | | | | | |
| Bank USA | | 4,600 | | | (122,091 | ) |
| | | | | | (250,855 | ) |
| | | Notional | | | |
| | | Amount | | | |
| Options Written | | (000) | | Value |
| Over-the-Counter Put Swaptions—0.0% | | | | | |
| Receive a fixed rate of 2.56% and pay a | | | | | | |
| floating rate based on 3-month LIBOR, | | | | | | |
| Expires 12/19/13, Broker Deutsche | | | | | | |
| Bank AG | USD | 1,200 | | $ | (59,592 | ) |
| Receive a fixed rate of 2.60% and pay a | | | | | | |
| floating rate based on 3-month LIBOR, | | | | | | |
| Expires 12/16/13, Broker JPMorgan | | | | | | |
| Chase Bank | | 1,300 | | | (61,852 | ) |
| Receive a fixed rate of 2.08% and pay a | | | | | | |
| floating rate based on 3-month LIBOR, | | | | | | |
| Expires 2/07/12, Broker Goldman Sachs | | | | | |
| Bank USA | | 4,600 | | | — | |
| Sold credit default protection on Dow Jones | | | | | |
| CDX North America High Yield Index Series | | | | | |
| 17, Strike Price USD 82, Expires 1/18/12, | | | | | |
| Broker Morgan Stanley Capital Services Inc. (p) | 1,819 | (q) | | (313 | ) |
| | | | | | (121,757 | ) |
| Total Options Written | | | | | | |
| (Premiums Received—$361,474)—(0.1)% | | | | (372,612 | ) |
| Total Investments, Net of TBA Sale | | | | | | |
| Commitments and Options Written—107.4% | | | | 536,956,403 | |
| Liabilities in Excess of Other Assets—(7.4)% | | | | (37,104,976 | ) |
| Net Assets—100.0% | | | | $ | 499,851,427 | |
| | | | | | | |
| (a) | | Non-income producing security. |
| (b) | | Security exempt from registration pursuant to Rule 144A under the Securities Act of 1933. These securities may be resold in transactions exempt from registration to qualified institutional investors. |
| (c) | | Represents a payment-in-kind security which may pay interest in additional par. |
| (d) | | Variable rate security. Rate shown is as of report date. |
| (e) | | Issuer filed for bankruptcy and/or is in default of interest payments. |
| (g) | | Represents a step-up bond that pays an initial coupon rate for the first period and then a higher coupon rate for the following periods. Rate shown is as of report date. |
| (h) | | Represents a zero-coupon bond. Rate shown reflects the current yield as of report date. |
| (i) | | Represents or includes a TBA transaction. Unsettled TBA transactions as of December 31, 2011 were as follows: |
| Counterparty | Value | | Unrealized
Appreciation
(Depreciation) | |
| Banc of America Securities | $ | (2,262,563 | ) | | $ | (24,492 | ) |
| BNP Paribas | $ | 4,964,578 | | | $ | 31,453 | |
| Citigroup Global Markets | $ | 7,866,719 | | | $ | 10,203 | |
| Credit Suisse Securities (USA) LLC | $ | 2,315,859 | | | $ | 2,965 | |
| Deutsche Bank AG | $ | (16,294,298 | ) | | $ | (108,399 | ) |
| Goldman Sachs & Co. | $ | (804,313 | ) | | $ | (26,500 | ) |
| Greenwich Capital Markets | $ | (5,217,000 | ) | | $ | (17,250 | ) |
| JP Morgan Securities, Inc | $ | 13,082,656 | | | $ | 37,438 | |
| Morgan Stanley & Co., Inc. | $ | 1,181,984 | | | $ | 8,250 | |
| UBS Securities, Inc. | $ | (2,056,875 | ) | | $ | (25,000 | ) |
| (j) | | All or a portion of security has been pledged as collateral in connection with swaps. |
| (k) | | All or a portion of security has been pledged as collateral in connection with open financial futures contracts. |
| (l) | | All or a portion of security has been pledged as collateral in connection with open reverse repurchase agreements. |
| (m) | | Security is perpetual in nature and has no stated maturity date. |
See Notes to Financial Statements.
| 30 | BLACKROCK SERIES FUND, INC. | DECEMBER 31, 2011 |
BlackRock Balanced Capital Portfolio
Schedule of Investments (continued)
| (n) | | Investments in companies considered to be an affiliate of the Portfolio during the year, for purposes of Section 2(a)(3) of the Investment Company Act of 1940, as amended, were as follows: |
| Affiliate | Shares
Held at
December 31,
2010 | | Net
Activity | Shares
Held at
December 31,
2011 | | Income | |
| BlackRock Liquidity | | | | | | | | |
| Funds, TempFund, | | | | | | | | |
| Institutional Class | | 1,381,817 | | | (427,985 | ) | | 953,832 | | | $5,652 | |
| (o) | | Represents the current yield as of report date. |
| (p) | | Rated B+ using Standard & Poor’s (“S&P’s”) rating of the underlying securities. |
| (q) | | The maximum potential amount the Portfolio may pay should a negative credit event take place as defined under the terms of the agreement. |
| • | | For Portfolio compliance purposes, the Portfolio’s industry classifications refer to any one or more of the industry sub-classifications used by one or more widely recognized market indexes or rating group indexes, and/or as defined by Portfolio management. These definitions may not apply for purposes of this report, which may combine such industry sub-classifications for reporting ease. |
| • | | Reverse repurchase agreements outstanding as of December 31, 2011 were as follows: |
| Counterparty | Interest Rate | Trade Date | Maturity Date | Net Closing Amount | Face Amount |
| BNP Paribas Securities Corp. | 0.05 | % | 12/30/11 | 1/03/12 | $ | 10,446,879 | $ | 10,446,806 |
| Credit Suisse Securities (USA) LLC | 0.03 | % | 12/30/11 | 1/03/12 | | 6,067,525 | | 6,067,500 |
| Credit Suisse Securities (USA) LLC | (0.08 | )% | 12/30/11 | 1/03/12 | | 3,979,577 | | 3,980,019 |
| Deutsche Bank Securities, Inc. | (0.07 | )% | 12/30/11 | 1/03/12 | | 11,678,445 | | 11,679,581 |
| Merrill Lynch, Pierce, Fenner & Smith | 0.08 | % | 10/26/11 | Open | | 3,562,428 | | 3,561,907 |
| Total | | | | | $ | 35,734,854 | $ | 35,735,813 |
| • | | Financial futures contracts purchased as of December 31, 2011 were as follows: |
| Contracts | Issue | Exchange | Expiration | Notional Value | Unrealized
Appreciation
(Depreciation) |
| 22 | Euro-Bund 8.5 to 10.5-Year Bond | | | | | | | | |
| | Futures Put Options, Strike Price | | | | | | | | |
| | EUR 133 | Eurex | January 2012 | $ | 2,847 | | $ | (20,079 | ) |
| 13 | 2-Year US Treasury Note | Chicago Board of Trade | March 2012 | $ | 2,867,109 | | | 788 | |
| 64 | 3-Month EURIBOR | NYSE Liffe | March 2012 | $ | 20,484,360 | | | 19,873 | |
| 44 | 30-Year US Treasury Bond | Chicago Board of Trade | March 2012 | $ | 6,371,750 | | | 117,589 | |
| 2 | 90-Day Euro-Dollar | Chicago Mercantile | September 2013 | $ | 496,050 | | | (181 | ) |
| 9 | 3-Month EURIBOR | NYSE Liffe | March 2014 | $ | 2,875,080 | | | 9,288 | |
| 9 | 3-Month EURIBOR | NYSE Liffe | June 2014 | $ | 2,871,440 | | | 10,113 | |
| 9 | 3-Month EURIBOR | NYSE Liffe | September 2014 | $ | 2,867,363 | | | 10,970 | |
| 9 | 3-Month EURIBOR | NYSE Liffe | December 2014 | $ | 2,862,704 | | | 11,132 | |
| 96 | 90-Day Euro-Dollar | Chicago Mercantile | December 2014 | $ | 23,667,600 | | | 54,543 | |
| 95 | 90-Day Euro-Dollar | Chicago Mercantile | March 2015 | $ | 23,387,813 | | | 66,408 | |
| Total | | | | | | | $ | 280,444 | |
| • | | Financial futures contracts sold as of December 31, 2011 were as follows: |
| Contracts | Issue | Exchange | Expiration | Notional Value | Unrealized
Appreciation
(Depreciation) |
| 1 | Euro-Bund | Eurex | March 2012 | $ | 179,953 | | $ | (5,618 | ) |
| 184 | Euro-Schatz | Eurex | March 2012 | $ | 26,276,597 | | | (68,132 | ) |
| 1 | German Euro-BOBL | Eurex | March 2012 | $ | 161,924 | | | (2,784 | ) |
| 12 | 90-Day Euro-Dollar | Chicago Mercantile | March 2012 | $ | 2,980,650 | | | 1,005 | |
| 175 | 10-Year US Treasury Note | Chicago Board of Trade | March 2012 | $ | 22,946,875 | | | (179,926 | ) |
| 87 | Ultra Long Term US Treasury Bond | Chicago Board of Trade | March 2012 | $ | 13,936,313 | | | (94,360 | ) |
| 70 | 5-Year US Treasury Note | Chicago Board of Trade | March 2012 | $ | 8,628,047 | | | (9,061 | ) |
| 4 | 90-Day Euro-Dollar | Chicago Mercantile | June 2012 | $ | 992,950 | | | 314 | |
| 1 | 90-Day Euro-Dollar | Chicago Mercantile | September 2012 | $ | 248,163 | | | 22 | |
| 4 | 90-Day Euro-Dollar | Chicago Mercantile | March 2013 | $ | 992,500 | | | 727 | |
| 7 | 90-Day Euro-Dollar | Chicago Mercantile | March 2014 | $ | 1,733,725 | | | (757 | ) |
| 8 | 90-Day Euro-Dollar | Chicago Mercantile | June 2014 | $ | 1,978,700 | | | (2,050 | ) |
| 6 | 90-Day Euro-Dollar | Chicago Mercantile | September 2014 | $ | 1,481,700 | | | (693 | ) |
| Total | | | | | | | $ | (361,313 | ) |
| • | | Foreign currency exchange contracts as of December 31, 2011 were as follows: |
| Currency Purchased | Currency Sold | Counterparty | Settlement Date | Unrealized
Appreciation
(Depreciation) |
| EUR | 650,000 | USD | 875,402 | Deutsche Bank AG | 1/25/12 | $ | (34,032 | ) |
| EUR | 800,000 | USD | 1,066,682 | Royal Bank of Scotland Plc | 1/25/12 | | (31,150 | ) |
| USD | 2,904,741 | EUR | 2,124,500 | Citibank NA | 1/25/12 | | 154,755 | |
| USD | 2,404,003 | EUR | 1,766,000 | Royal Bank of Scotland Plc | 1/25/12 | | 118,064 | |
| Total | | | | | | $ | 207,637 | |
See Notes to Financial Statements.
| BLACKROCK SERIES FUND, INC. | DECEMBER 31, 2011 | 31 |
BlackRock Balanced Capital Portfolio
Schedule of Investments (continued)
| • | | Credit default swaps on single-name issues—buy protection outstanding as of December 31, 2011 were as follows: |
| Issuer | Pay
Fixed Rate | Counterparty | Expiration Date | Notional
Amount
(000) | Unrealized
Appreciation
(Depreciation) |
| Radian Group, Inc. | 5.00 | % | Citibank NA | 3/20/13 | $ | 720 | | $ | 228,809 | |
| Eastman Chemical Co. | 0.68 | % | Morgan Stanley & Co., Inc. | 9/20/13 | $ | 690 | | | (3,830 | ) |
| Radian Group, Inc. | 5.00 | % | Citibank NA | 6/20/15 | $ | 720 | | | 297,806 | |
| Sara Lee Corp. | 1.00 | % | JPMorgan Chase Bank NA | 3/20/17 | $ | 242 | | | (705 | ) |
| Total | | | | | | | | $ | 522,080 | |
| • | | Credit default swaps on single-name issues—sold protection outstanding as of December 31, 2011 were as follows: |
| Issuer | Receive
Fixed Rate | Counterparty | Expiration Date | Credit
Rating1 | Notional
Amount
(000)2 | Unrealized
Appreciation
(Depreciation) |
| Aviva USA Corp. | 1.00 | % | Deutsche Bank AG | 5/25/12 | BBB+ | $ | 710 | $ | (855 | ) |
| Assured Guaranty Corp. | 5.00 | % | Citibank NA | 12/20/14 | A+ | $ | 90 | | 1,083 | |
| Assured Guaranty Corp. | 5.00 | % | Citibank NA | 12/20/14 | A+ | $ | 2 | | 45 | |
| Assured Guaranty Corp. | 5.00 | % | Citibank NA | 3/20/15 | A+ | $ | 10 | | 224 | |
| MetLife, Inc. | 1.00 | % | Credit Suisse Securities (USA) LLC | 9/20/16 | A- | $ | 235 | | (1,630 | ) |
| MetLife, Inc. | 1.00 | % | Deutsche Bank AG | 9/20/16 | A- | $ | 220 | | (3,156 | ) |
| MetLife, Inc. | 1.00 | % | Morgan Stanley & Co., Inc. | 9/20/16 | A- | $ | 165 | | (4,006 | ) |
| MetLife, Inc. | 1.00 | % | Morgan Stanley & Co., Inc. | 9/20/16 | A- | $ | 270 | | (4,287 | ) |
| Assured Guaranty Corp. | 5.00 | % | Citibank NA | 12/20/16 | A+ | $ | 146 | | 5,715 | |
| MetLife, Inc. | 1.00 | % | Citibank NA | 12/20/16 | A- | $ | 175 | | (3,643 | ) |
| MetLife, Inc. | 1.00 | % | Citibank NA | 12/20/16 | A- | $ | 1,050 | | (28,264 | ) |
| Total | | | | | | | | $ | (38,774 | ) |
| 2 | | The maximum potential amount the Portfolio may pay should a negative credit event take place as defined under the terms of the agreement. |
| • | | Credit default swaps on traded indexes—buy protection outstanding as of December 31, 2011 were as follows: |
| Index | Pay
Fixed Rate | Counterparty | Expiration Date | Notional
Amount
(000) | Unrealized
Appreciation
(Depreciation) |
| Dow Jones CDX Emerging | | | | | | | | | | |
| Markets Series 14 | 5.00 | % | Morgan Stanley & Co., Inc. | 12/20/15 | $ | 510 | | $ | 10,651 | |
| Dow Jones CDX North America | | | | | | | | | | |
| Investment Grade Index Series 16 | 1.00 | % | Credit Suisse Securities (USA) LLC | 6/20/16 | $ | 230 | | | (673 | ) |
| Dow Jones CDX North America | | | | | | | | | | |
| Investment Grade Index Series 16 | 1.00 | % | JPMorgan Chase Bank NA | 6/20/16 | $ | 13 | | | (11 | ) |
| Dow Jones CDX North America | | | | | | | | | | |
| Investment Grade Index Series 16 | 1.00 | % | Morgan Stanley & Co., Inc. | 6/20/16 | $ | 872 | | | (7,383 | ) |
| Dow Jones CDX North America | | | | | | | | | | |
| Investment Grade Index Series 17 | 1.00 | % | Citibank NA | 12/20/16 | $ | 1,295 | | | (6,841 | ) |
| Dow Jones CDX North America | | | | | | | | | | |
| Investment Grade Index Series 17 | 1.00 | % | Deutsche Bank AG | 12/20/16 | $ | 1,780 | | | (9,998 | ) |
| Dow Jones CDX North America | | | | | | | | | | |
| Investment Grade Index Series 17 | 1.00 | % | Morgan Stanley & Co., Inc. | 12/20/16 | $ | 2,270 | | | (4,992 | ) |
| MCDX North America Series 16 | 1.00 | % | Morgan Stanley & Co., Inc. | 6/20/21 | $ | 1,120 | | | 49,553 | |
| Total | | | | | | | | $ | 30,306 | |
| • | | Credit default swaps on traded indexes—sold protection outstanding as of December 31, 2011 were as follows: |
| Index | Receive
Fixed Rate | Counterparty | Expiration
Date | Credit
Rating3 | Notional
Amount
(000)4 | (Depreciation) |
| Dow Jones CDX North America | | | | | | | | | | |
| High Yield Index Series 17 | 5.00 | % | Credit Suisse Securities (USA) LLC | 12/20/16 | B+ | $ | 613 | $ | 3,137 | |
| MCDX North America Series 14 | 0.00 | % | Goldman Sachs International | 6/20/20 | AA | $ | 560 | | (25,795 | ) |
| Markit CMBX North America | | | | | | | | | | |
| AAA Index Series 3 | 0.08 | % | Morgan Stanley & Co., Inc. | 12/13/49 | A+ | $ | 310 | | 6,785 | |
| Markit CMBX North America | | | | | | | | | | |
| AAA Index Series 4 | 0.35 | % | Morgan Stanley & Co., Inc. | 2/17/51 | A- | $ | 310 | | 5,946 | |
| Total | | | | | | | | $ | (9,927 | ) |
| 3 | | Using S&P’s rating of the underlying securities. |
| 4 | | The maximum potential amount the Portfolio may pay should a negative credit event take place as defined under the terms of the agreement. |
See Notes to Financial Statements.
| 32 | BLACKROCK SERIES FUND, INC. | DECEMBER 31, 2011 |
BlackRock Balanced Capital Portfolio
Schedule of Investments (continued)
| • | | Interest rate swaps outstanding as of December 31, 2011 were as follows: |
| Fixed Rate | Floating Rate | Counterparty | Expiration Date | Notional
Amount
(000) | Unrealized
Appreciation
(Depreciation) |
| 0.92 | %1 | 3-month LIBOR | Deutsche Bank AG | 2/28/13 | USD | 4,600 | | $ | (11,955 | ) |
| 1.24 | %2 | 6-month EURIBOR | Citibank NA | 12/13/13 | EUR | 23,610 | | | 24,444 | |
| 1.32 | %1 | 3-month LIBOR | Citibank NA | 12/17/13 | USD | 1,400 | | | (16,215 | ) |
| 1.41 | %1 | 3-month LIBOR | Deutsche Bank AG | 12/20/13 | USD | 2,300 | | | (30,750 | ) |
| 0.73 | %2 | 3-month LIBOR | Bank of America NA | 12/22/13 | USD | 5,700 | | | 661 | |
| 0.73 | %2 | 3-month LIBOR | Citibank NA | 12/22/13 | USD | 1,000 | | | 141 | |
| 0.74 | %2 | 3-month LIBOR | Deutsche Bank AG | 12/22/13 | USD | 2,700 | | | 445 | |
| 0.74 | %2 | 3-month LIBOR | Deutsche Bank AG | 12/22/13 | USD | 5,300 | | | 1,394 | |
| 1.26 | %1 | 3-month LIBOR | Deutsche Bank AG | 12/24/13 | USD | 2,200 | | | (22,765 | ) |
| 0.80 | %2 | 3-month LIBOR | Citibank NA | 8/09/14 | USD | 1,200 | | | 878 | |
| 1.25 | %1 | 3-month LIBOR | Deutsche Bank AG | 10/05/16 | USD | 500 | | | (1,612 | ) |
| 2.57 | %2 | 3-month LIBOR | Deutsche Bank AG | 10/27/20 | USD | 300 | | | 16,487 | |
| 3.27 | %1 | 3-month LIBOR | Deutsche Bank AG | 5/16/21 | USD | 550 | | | (62,435 | ) |
| 2.69 | %1 | 3-month LIBOR | Citibank NA | 8/09/21 | USD | 300 | | | (18,634 | ) |
| 2.35 | %2 | 3-month LIBOR | Deutsche Bank AG | 8/12/21 | USD | 900 | | | 28,844 | |
| 2.38 | %2 | 3-month LIBOR | Deutsche Bank AG | 10/19/21 | USD | 600 | | | 19,960 | |
| 2.26 | %1 | 3-month LIBOR | Citibank NA | 12/05/21 | USD | 600 | | | (12,646 | ) |
| 2.24 | %1 | 3-month LIBOR | Credit Suisse Securities (USA) LLC | 12/05/21 | USD | 1,900 | | | (37,920 | ) |
| 2.20 | %1 | 3-month LIBOR | Deutsche Bank AG | 12/12/21 | USD | 600 | | | (9,593 | ) |
| 2.20 | %2 | 3-month LIBOR | JPMorgan Chase Bank NA | 12/12/21 | USD | 600 | | | (244 | ) |
| 2.03 | %2 | 3-month LIBOR | Deutsche Bank AG | 12/21/21 | USD | 900 | | | 153 | |
| 2.19 | %1 | 3-month LIBOR | Deutsche Bank AG | 12/29/21 | USD | 1,100 | | | (15,461 | ) |
| 3.00 | %1 | 3-month LIBOR | UBS AG | 1/03/22 | USD | 1,400 | | | (110,512 | ) |
| 2.58 | %1 | 6-month EURIBOR | Deutsche Bank AG | 11/11/41 | EUR | 200 | | | (1,298 | ) |
| 2.68 | %1 | 6-month EURIBOR | Deutsche Bank AG | 11/18/41 | EUR | 430 | | | (14,579 | ) |
| Total | | | | | | | $ | (273,212 | ) |
| 1 | | Portfolio pays a fixed rate and receives floating rate. |
| 2 | | Portfolio pays a floating rate and receives fixed rate. |
| • | | Total return swaps outstanding as of December 31, 2011 were as follows: |
| Reference Entity | Fund Pays/Receives
the Total Return of
the Reference Entity | Fixed Rate/
Floating Rate | Counterparty | Expiration Date | Notional
Amount
(000) | Unrealized
Appreciation
(Depreciation) |
Consumer Price Index
for All Urban Consumers | | | | | | | | | | | |
| Pays | 2.18 | %3 | Bank of America NA | 10/06/21 | $ | 1,095 | | $ | (10,616 | ) |
| Gross return on the Markit | | | | | | | | | | | |
| IOS 5.00%, 30-year, fixed rate | | | | | | | | | | | |
| Fannie Mae residential | | | | | | | | | | | |
| mortgage-backed securities pool | Receives | 1-month LIBOR | Bank of America NA | 1/12/39 | $ | 432 | | | (5,864 | ) |
| Gross return on the Markit | | | | | | | | | | | |
| IOS 5.00%, 30-year, fixed rate | | | | | | | | | | | |
| Fannie Mae residential | | | | | | | | | | | |
| mortgage-backed securities pool | Pays | 1-month LIBOR | JPMorgan Chase Bank NA | 1/12/39 | $ | 118 | | | 127 | |
| Gross return on the Markit | | | | | | | | | | | |
| IOS 5.00%, 30-year, fixed rate | | | | | | | | | | | |
| Fannie Mae residential | | | | | | | | | | | |
| mortgage-backed securities pool | Pays | 1-month LIBOR | JPMorgan Chase Bank NA | 1/12/39 | $ | 314 | | | (1,479 | ) |
| Gross return on the Markit | | | | | | | | | | | |
| IOS 5.50%, 30-year, fixed rate | | | | | | | | | | | |
| Fannie Mae residential | | | | | | | | | | | |
| mortgage-backed securities pool | Pays | 1-month LIBOR | JPMorgan Chase Bank NA | 1/12/39 | $ | 398 | | | 5,551 | |
| Gross return on the Markit | | | | | | | | | | | |
| IOS 6.00%, 30-year, fixed rate | | | | | | | | | | | |
| Fannie Mae residential | | | | | | | | | | | |
| mortgage-backed securities pool | Pays | 1-month LIBOR | Royal Bank of Scotland Plc | 1/12/39 | $ | 370 | | | 6,810 | |
| Total | | | | | | | | | $ | (5,471 | ) |
| 3 Net | | payment made at termination. |
See Notes to Financial Statements.
| BLACKROCK SERIES FUND, INC. | DECEMBER 31, 2011 | 33 |
BlackRock Balanced Capital Portfolio
Schedule of Investments (concluded)
| • | | Fair Value Measurements—Various inputs are used in determining the fair value of investments and derivative financial instruments. These inputs are categorized into a disclosure hierarchy consisting of three broad levels for financial statement purposes as follows: |
| • | | Level 1—unadjusted price quotations in active markets/exchanges for identical assets and liabilities |
| • | | Level 2—other observable inputs (including, but not limited to: quoted prices for similar assets or liabilities in markets that are active, quoted prices for identical or similar assets or liabilities in markets that are not active, inputs other than quoted prices that are observable for the assets or liabilities (such as interest rates, yield curves, volatilities, prepayment speeds, loss severities, credit risks and default rates) or other market-corroborated inputs) |
| • | | Level 3—unobservable inputs based on the best information available in the circumstances, to the extent observable inputs are not available (including the Portfolio’s own assumptions used in determining the fair value of investments and derivative financial instruments) |
Changes in valuation techniques may result in transfers in or out of an assigned level within the disclosure hierarchy. The categorization of a value determined for investments and derivative financial instruments is based on the pricing transparency of the investment and derivative financial instrument and does not necessarily correspond to the Portfolio’s perceived risk of investing in those securities. For information about the Portfolio’s policy regarding valuation of investments and derivative financial instruments and other significant accounting policies, please refer to Note 1 of the Notes to Financial Statements.
The following tables summarize the inputs used as of December 31, 2011 in determining the fair valuation of the Portfolio’s investments and derivative financial instruments:
| Valuation Inputs | Level 1 | Level 2 | Level 3 | Total |
| Assets: | | | | | | | | | | | | |
| Investments: | | | | | | | | | | | | |
| Long Term Investments: | | | | | | | | | | | | |
| Common Stocks | $ | 288,372,026 | | | — | | | — | | $ | 288,372,026 | |
| Asset-Backed Securities | | — | | $ | 9,704,449 | | $ | 2,306,281 | | | 12,010,730 | |
| Corporate Bonds | | — | | | 70,640,813 | | | — | | | 70,640,813 | |
| Foreign Agency Obligations | | — | | | 6,077,733 | | | — | | | 6,077,733 | |
| Non-Agency Mortgage-Backed Securities | | — | | | 23,997,583 | | | 917,922 | | | 24,915,505 | |
| Taxable Municipal Bonds | | — | | | 524,475 | | | — | | | 524,475 | |
| US Government Sponsored Agency Securities | | — | | | 116,924,512 | | | — | | | 116,924,512 | |
| US Treasury Obligations | | — | | | 55,261,191 | | | — | | | 55,261,191 | |
| Preferred Securities | | 255,724 | | | 2,015,014 | | | — | | | 2,270,738 | |
| Short-Term Securities | | 953,832 | | | — | | | — | | | 953,832 | |
| Liabilities: | | | | | | | | | | | | |
| Investments: | | | | | | | | | | | | |
| Long Term Investments: | | | | | | | | | | | | |
| TBA Sale Commitments | | — | | | (40,903,000 | ) | | — | | | (40,903,000 | ) |
| Total | $ | 289,581,582 | | $ | 244,242,770 | | $ | 3,224,203 | | $ | 537,048,555 | |
| |
| Valuation Inputs | Level 1 | Level 2 | Level 3 | Total |
| Derivatives Financial Instruments1 | | | | | | | | | | | | |
| Assets: | | | | | | | | | | | | |
| Credit contracts | | — | | $ | 654,929 | | | — | | $ | 654,929 | |
| Foreign currency exchange contracts | | — | | | 273,938 | | | — | | | 273,938 | |
| Interest rate contracts | $ | 343,168 | | | 299,665 | | | — | | | 642,833 | |
| Liabilities: | | | | | | | | | | | | |
| Credit contracts | | — | | | (79,732 | ) | $ | (26,650 | ) | | (106,382 | ) |
| Foreign currency exchange contracts | | — | | | (65,182 | ) | | — | | | (65,182 | ) |
| Interest rate contracts | | (389,641 | ) | | (740,261 | ) | | — | | | (1,129,902 | ) |
| Other contracts | | — | | | (10,616 | ) | | — | | | (10,616 | ) |
| Total | $ | (46,473 | ) | $ | 332,741 | | $ | (26,650 | ) | $ | 259,618 | |
| 1 | | Derivative financial instruments are swaps, financial futures contracts, foreign currency exchange contracts and options. Swaps, financial futures contacts and foreign currency exchange contracts are valued at the unrealized appreciation/depreciation on the instrument and options are shown at value. |
See Notes to Financial Statements.
| 34 | BLACKROCK SERIES FUND, INC. | DECEMBER 31, 2011 |
| BlackRock Capital Appreciation Portfolio | |
| Schedule of Investments December 31, 2011 | (Percentages shown are based on Net Assets) |
| Common Stocks | Shares | | Value |
| Aerospace & Defense—6.9% | | | | |
| The Boeing Co. | 76,810 | | $ | 5,634,013 |
| Precision Castparts Corp. | 10,940 | | | 1,802,803 |
| United Technologies Corp. | 23,380 | | | 1,708,844 |
| | | | | 9,145,660 |
| Auto Components—1.3% | | | | |
| BorgWarner, Inc. (a) | 8,740 | | | 557,088 |
| Johnson Controls, Inc. | 38,160 | | | 1,192,881 |
| | | | | 1,749,969 |
| Automobiles—0.7% | | | | |
| Tesla Motors, Inc. (a)(b) | 32,290 | | | 922,202 |
| Beverages—4.3% | | | | |
| The Coca-Cola Co. | 54,780 | | | 3,832,957 |
| PepsiCo, Inc. | 27,050 | | | 1,794,767 |
| | | | | 5,627,724 |
| Biotechnology—1.4% | | | | |
| Biogen Idec, Inc. (a) | 17,260 | | | 1,899,463 |
| Capital Markets—1.6% | | | | |
| Jefferies Group, Inc. | 77,550 | | | 1,066,313 |
| Morgan Stanley | 65,970 | | | 998,126 |
| | | | | 2,064,439 |
| Chemicals—2.2% | | | | |
| Celanese Corp., Series A | 31,310 | | | 1,386,094 |
| Monsanto Co. | 17,160 | | | 1,202,401 |
| Potash Corp. of Saskatchewan, Inc. | 6,500 | | | 268,320 |
| | | | | 2,856,815 |
| Commercial Banks—1.2% | | | | |
| Wells Fargo & Co. | 56,610 | | | 1,560,172 |
| Communications Equipment—4.6% | | | | |
| Cisco Systems, Inc. | 64,600 | | | 1,167,968 |
| QUALCOMM, Inc. | 89,890 | | | 4,916,983 |
| | | | | 6,084,951 |
| Computers & Peripherals—8.2% | | | | |
| Apple, Inc. (a) | 24,330 | | | 9,853,650 |
| SanDisk Corp. (a) | 20,440 | | | 1,005,852 |
| | | | | 10,859,502 |
| Diversified Consumer Services—1.9% | | | | |
| Apollo Group, Inc., Class A (a) | 45,190 | | | 2,434,385 |
| Diversified Telecommunication Services—1.9% | | | | |
| Verizon Communications, Inc. | 61,090 | | | 2,450,931 |
| Energy Equipment & Services—3.7% | | | | |
| Halliburton Co. | 29,910 | | | 1,032,194 |
| National Oilwell Varco, Inc. | 20,830 | | | 1,416,232 |
| Schlumberger Ltd. | 35,520 | | | 2,426,371 |
| | | | | 4,874,797 |
| Food & Staples Retailing—2.8% | | | | |
| Wal-Mart Stores, Inc. | 39,560 | | | 2,364,105 |
| Whole Foods Market, Inc. | 19,220 | | | 1,337,328 |
| | | | | 3,701,433 |
| Food Products—0.2% | | | | |
| Green Mountain Coffee Roasters, Inc. (a)(b) | 6,010 | | | 269,549 |
| Health Care Equipment & Supplies—0.5% | | | | |
| Stryker Corp. | 13,700 | | | 681,027 |
| Health Care Providers & Services—2.2% | | | | |
| AmerisourceBergen Corp. | 51,620 | | | 1,919,748 |
| Cardinal Health, Inc. | 25,550 | | | 1,037,585 |
| | | | | 2,957,333 |
| Common Stocks | Shares | | Value |
| Health Care Technology—1.6% | | | | |
| Cerner Corp. (a) | 35,270 | | $ | 2,160,288 |
| Hotels, Restaurants & Leisure—3.3% | | | | |
| Chipotle Mexican Grill, Inc. (a) | 2,410 | | | 813,954 |
| Las Vegas Sands Corp. (a) | 40,940 | | | 1,749,366 |
| Starbucks Corp. | 39,400 | | | 1,812,794 |
| | | | | 4,376,114 |
| Household Durables—1.2% | | | | |
| Stanley Black & Decker, Inc. | 22,960 | | | 1,552,096 |
| Household Products—3.5% | | | | |
| The Procter & Gamble Co. | 69,020 | | | 4,604,324 |
| Internet & Catalog Retail—2.3% | | | | |
| Amazon.com, Inc. (a) | 17,710 | | | 3,065,601 |
| Internet Software & Services—5.2% | | | | |
| Google, Inc., Class A (a) | 6,740 | | | 4,353,366 |
| Rackspace Hosting, Inc. (a)(b) | 24,850 | | | 1,068,798 |
| eBay, Inc. (a) | 49,030 | | | 1,487,080 |
| | | | | 6,909,244 |
| IT Services—3.6% | | | | |
| Accenture Plc | 21,350 | | | 1,136,460 |
| International Business Machines Corp. | 6,150 | | | 1,130,862 |
| VeriFone Systems, Inc. (a)(b) | 32,000 | | | 1,136,640 |
| Visa, Inc., Class A | 13,430 | | | 1,363,548 |
| | | | | 4,767,510 |
| Machinery—4.4% | | | | |
| Danaher Corp. | 74,040 | | | 3,482,841 |
| Eaton Corp. | 39,400 | | | 1,715,082 |
| Terex Corp. (a)(b) | 48,680 | | | 657,667 |
| | | | | 5,855,590 |
| Media—1.1% | | | | |
| Comcast Corp., Class A | 62,550 | | | 1,483,061 |
| Metals & Mining—0.6% | | | | |
| Freeport-McMoRan Copper & Gold, Inc., Class B | 22,860 | | | 841,019 |
| Oil, Gas & Consumable Fuels—6.8% | | | | |
| Alpha Natural Resources, Inc. (a) | 37,560 | | | 767,351 |
| Anadarko Petroleum Corp. | 33,060 | | | 2,523,470 |
| Exxon Mobil Corp. | 40,820 | | | 3,459,903 |
| Range Resources Corp. | 35,510 | | | 2,199,489 |
| | | | | 8,950,213 |
| Pharmaceuticals—4.3% | | | | |
| Allergan, Inc. | 17,580 | | | 1,542,469 |
| Johnson & Johnson | 26,870 | | | 1,762,135 |
| Pfizer, Inc. | 77,800 | | | 1,683,592 |
| Valeant Pharmaceuticals International, Inc. (a) | 15,760 | | | 735,834 |
| | | | | 5,724,030 |
| Professional Services—0.6% | | | | |
| Manpower, Inc. | 21,510 | | | 768,983 |
| Semiconductors & Semiconductor Equipment—3.9% | | | |
| Avago Technologies Ltd. | 20,790 | | | 599,999 |
| Broadcom Corp., Class A (a) | 35,320 | | | 1,036,995 |
| Marvell Technology Group Ltd. (a) | 87,750 | | | 1,215,338 |
| NXP Semiconductors NV (a) | 43,370 | | | 666,597 |
| Texas Instruments, Inc. | 22,050 | | | 641,876 |
| Xilinx, Inc. | 32,500 | | | 1,041,950 |
| | | | | 5,202,755 |
| Software—6.3% | | | | |
| Check Point Software Technologies Ltd. (a) | 35,850 | | | 1,883,559 |
| Microsoft Corp. | 50,200 | | | 1,303,192 |
See Notes to Financial Statements.
| BLACKROCK SERIES FUND, INC. | DECEMBER 31, 2011 | 35 |
| BlackRock Capital Appreciation Portfolio | |
| Schedule of Investments (concluded) | (Percentages shown are based on Net Assets) |
| Common Stocks | Shares | | Value |
| Software (concluded) | | | | | | |
| Oracle Corp. | | 33,920 | | $ | 870,048 | |
| Red Hat, Inc. (a) | | 40,650 | | | 1,678,438 | |
| Salesforce.com, Inc. (a) | | 16,960 | | | 1,720,762 | |
| VMware, Inc. (a) | | 9,830 | | | 817,758 | |
| | | | | | 8,273,757 | |
| Specialty Retail—2.7% | | | | | | |
| Home Depot, Inc. | | 53,650 | | | 2,255,446 | |
| Tiffany & Co. | | 20,200 | | | 1,338,452 | |
| | | | | | 3,593,898 | |
| Textiles, Apparel & Luxury Goods—1.1% | | | | | | |
| Coach, Inc. | | 20,270 | | | 1,237,281 | |
| Michael Kors Holdings Ltd. (a) | | 7,600 | | | 207,100 | |
| | | | | | 1,444,381 | |
| Wireless Telecommunication Services—1.0% | | | | | | |
| American Tower Corp., Class A (a) | | 17,230 | | | 1,033,972 | |
| NII Holdings, Inc. (a) | | 14,960 | | | 318,648 | |
| | | | | | 1,352,620 | |
| Total Long-Term Investments | | | | | | |
| (Cost—$116,494,258)—99.1% | | | | | 131,065,836 | |
| |
| |
| Short-Term Securities | | | | | | |
| BlackRock Liquidity Funds, TempFund, | | | | | | |
| Institutional Class, 0.10%, (c)(d) | | 1,156,840 | | | 1,156,840 | |
| |
| | Beneficial
Interest
(000) | | | |
| | | | |
| | | | |
| BlackRock Liquidity Series LLC, | | | | | | |
| Money Market Series, 0.22%, (c)(d)(e) | $ | 3,662 | | | 3,662,039 | |
| Total Short-Term Securities | | | | | | |
| (Cost—$4,818,879)—3.6% | | | | | 4,818,879 | |
| Total Investments | | | | | | |
| (Cost—$121,313,137)—102.7% | | | | | 135,884,715 | |
| Liabilities in Excess of Other Assets—(2.7)% | | | | | (3,574,421 | ) |
| Net Assets—100.0% | | | | $ | 132,310,294 | |
| | | | | | | |
| (a) | | Non-income producing security. |
| (b) | | Security, or a portion of security, is on loan. |
| (c) | | Investments in companies considered to be an affiliate of the Portfolio during the year, for purposes of Section 2(a)(3) of the Investment Company Act of 1940, as amended, were as follows: |
| Affiliate | Shares/
Beneficial
Interest Held at
December 31,
2010 | Net
Activity | Shares/
Beneficial
Interest Held at
December 31,
2011 | Income |
| BlackRock Liquidity | | | | | | | | | | | | |
| Funds, TempFund, | | | | | | | | | | | | |
| Institutional Class | | 1,127,148 | | | 29,692 | | | 1,156,840 | | $ | 1,232 | |
| BlackRock Liquidity | | | | | | | | | | | | |
| Series, LLC Money | | | | | | | | | | | | |
| Market Series | $ | 1,292,500 | | $ | 2,369,539 | | $ | 3,662,039 | | $ | 21,776 | |
| (d) | | Represents the current yield as of report date. |
| (e) | | Security was purchased with the cash collateral from loaned securities. |
| • | | For Portfolio compliance purposes, the Portfolio’s industry classifications refer to any one or more of the industry sub-classifications used by one or more widely recognized market indexes or rating group indexes and/or as defined by Portfolio management. These definitions may not apply for purposes of this report, which may combine industry sub-classifications for reporting ease. |
| • | | Fair Value Measurements—Various inputs are used in determining the fair value of investments. These inputs are categorized into a disclosure hierarchy consisting of three broad levels for financial statement purposes as follows: |
| • | | Level 1—unadjusted price quotations in active markets/exchanges for identical assets and liabilities |
| • | | Level 2—other observable inputs (including, but not limited to: quoted prices for similar assets or liabilities in markets that are active, quoted prices for identical or similar assets or liabilities in markets that are not active, inputs other than quoted prices that are observable for the assets or liabilities (such as interest rates, yield curves, volatilities, prepayment speeds, loss severities, credit risks and default rates) or other market-corroborated inputs) |
| • | | Level 3—unobservable inputs based on the best information available in the circumstances, to the extent observable inputs are not available (including the Portfolio’s own assumptions used in determining the fair value of investments) |
Changes in valuation techniques may result in transfers in or out of an assigned level within the disclosure hierarchy. The categorization of a value determined for investments is based on the pricing transparency of the investment and does not necessarily correspond to Portfolio’s perceived risk of investing in those securities. For information about the Portfolio’s policy regarding valuation of investments and other significant accounting policies, please refer to Note 1 of the Notes to Financial Statements.
The following table summarizes the inputs used as of December 31, 2011 in determining the fair valuation of Portfolio’s investments:
| Valuation Inputs | Level 1 | Level 2 | Level 3 | Total |
| Assets: | | | | | | | | | | | | |
| Investments: | | | | | | | | | | | | |
| Long-Term Investments1 | $ | 131,065,836 | | | — | | | — | | $ | 131,065,836 | |
| Short-Term Securities | | 1,156,840 | | $ | 3,662,039 | | | — | | | 4,818,879 | |
| Total | $ | 132,222,676 | | $ | 3,662,039 | | | — | | $ | 135,884,715 | |
| 1 | | See above Schedule of Investments for values in each industry. |
See Notes to Financial Statements.
| 36 | BLACKROCK SERIES FUND, INC. | DECEMBER 31, 2011 |
| BlackRock Global Allocation Portfolio | |
| Consolidated Schedule of Investments December 31, 2011 | (Percentages shown are based on Net Assets) |
| Common Stocks | Shares | | Value |
| Argentina—0.1% | | | | |
| Banco Macro SA—ADR | 1,091 | | $ | 21,275 |
| Cresud SA Sponsored—ADR | 2,940 | | | 33,487 |
| IRSA Inversiones y | | | | |
| Representaciones SA—ADR | 3,436 | | | 35,631 |
| Pampa Energia SA—ADR | 3,600 | | | 38,700 |
| Telecom Argentina SA—ADR | 1,091 | | | 19,507 |
| Tenaris SA—ADR | 4,444 | | | 165,228 |
| | | | | 313,828 |
| Australia—1.1% | | | | |
| Asciano Ltd. | 27,207 | | | 125,026 |
| BHP Billiton Ltd. | 23,870 | | | 842,578 |
| CSL Ltd. | 8,971 | | | 292,480 |
| Newcrest Mining Ltd. | 24,593 | | | 749,474 |
| Orica Ltd. | 6,726 | | | 166,428 |
| Rio Tinto Ltd. | 9,787 | | | 603,360 |
| Telstra Corp. Ltd. | 45,144 | | | 153,536 |
| | | | | 2,932,882 |
| Austria—0.0% | | | | |
| Telekom Austria AG | 5,158 | | | 61,707 |
| Belgium—0.1% | | | | |
| RHJ International (a) | 24,918 | | | 112,991 |
| RHJ International—ADR | 5,827 | | | 26,551 |
| | | | | 139,542 |
| Brazil—1.8% | | | | |
| All America Latina Logistica SA | 13,130 | | | 65,465 |
| Cia Brasileira de Distribuicao Grupo | | | | |
| Pao de Acucar, Preference Shares | 12,558 | | | 451,085 |
| Cia Energetica de Minas Gerais—ADR | 7,551 | | | 134,332 |
| Cosan Ltd. | 31,553 | | | 345,821 |
| Cyrela Brazil Realty SA | 24,877 | | | 197,922 |
| Hypermarcas SA | 71,283 | | | 324,839 |
| Itau Unibanco Holding SA, | | | | |
| Preference Shares | 11,172 | | | 203,585 |
| MRV Engenharia e Participacoes SA | 29,185 | | | 167,420 |
| OGX Petroleo e Gas Participacoes SA (a) | 12,100 | | | 88,354 |
| Petroleo Brasileiro SA—ADR | 66,283 | | | 1,556,988 |
| Qualicorp SA (a) | 19,337 | | | 173,647 |
| SLC Agricola SA | 20,065 | | | 166,738 |
| Telefonica Brasil—ADR | 25,486 | | | 696,532 |
| Usinas Siderurgicas de Minas Gerais SA, | | | | |
| Preference ‘A’ Shares | 5,870 | | | 31,942 |
| Vale SA, Preference ‘A’ Shares | 18,777 | | | 380,724 |
| | | | | 4,985,394 |
| Canada—2.6% | | | | |
| Agnico-Eagle Mines Ltd. | 8,135 | | | 295,463 |
| Alamos Gold, Inc. | 15,617 | | | 269,034 |
| Bank of Nova Scotia | 2,351 | | | 117,302 |
| Barrick Gold Corp. | 17,397 | | | 787,214 |
| BCE, Inc. | 658 | | | 27,419 |
| Brookfield Asset Management, Inc., Class A | 7,684 | | | 211,156 |
| Canadian Natural Resources Ltd. | 9,972 | | | 372,654 |
| Canadian Pacific Railway Ltd. | 3,739 | | | 253,018 |
| Canadian Pacific Railway Ltd. | 595 | | | 40,305 |
| Detour Gold Corp. (a) | 5,715 | | | 141,087 |
| Eldorado Gold Corp. | 35,724 | | | 491,632 |
| Goldcorp, Inc. | 28,938 | | | 1,280,507 |
| IAMGOLD Corp. | 18,482 | | | 292,940 |
| IAMGOLD Corp., International African | | | | |
| Mining Gold Corp. | 11,683 | | | 185,552 |
| Katanga Mining Ltd. (a) | 35,641 | | | 40,932 |
| Kinross Gold Corp. | 11,251 | | | 128,261 |
| Common Stocks | Shares | | Value |
| Canada (concluded) | | | | |
| Kinross Gold Corp. | 28,247 | | $ | 322,466 |
| Osisko Mining Corp. (a) | 13,319 | | | 128,647 |
| Potash Corp. of Saskatchewan, Inc. | 5,627 | | | 232,283 |
| Rogers Communications, Inc., Class B | 5,333 | | | 205,374 |
| Rogers Communications, Inc., Class B | 837 | | | 32,248 |
| Silver Wheaton Corp. | 12,688 | | | 367,444 |
| Sino-Forest Corp. (a) | 13,958 | | | 137 |
| Suncor Energy, Inc. | 14,939 | | | 430,830 |
| Talisman Energy, Inc. | 12,600 | | | 160,538 |
| Teck Resources Ltd., Class B | 1,095 | | | 38,533 |
| TELUS Corp. | 2,136 | | | 120,853 |
| The Toronto-Dominion Bank | 500 | | | 37,443 |
| Valeant Pharmaceuticals International, | | | | |
| Inc. (a)(b) | 3,100 | | | 144,739 |
| | | | | 7,156,011 |
| Chile—0.1% | | | | |
| Sociedad Quimica y Minera de | | | | |
| Chile SA—ADR | 2,480 | | | 133,548 |
| China—1.2% | | | | |
| Beijing Enterprises Holdings Ltd. | 110,920 | | | 664,084 |
| Chaoda Modern Agriculture | | | | |
| Holdings Ltd. (c) | 715,816 | | | 20,043 |
| China BlueChemical Ltd. | 171,000 | | | 129,177 |
| China Life Insurance Co. Ltd.—ADR | 1,913 | | | 70,724 |
| China Mobile Ltd. | 20,000 | | | 194,312 |
| China Shenhua Energy Co. Ltd., | | | | |
| Class H | 36,479 | | | 157,745 |
| China Telecom Corp. Ltd. | 183,400 | | | 104,315 |
| China Unicom Ltd. (b) | 75,500 | | | 159,166 |
| CSR Corp. Ltd. | 56,200 | | | 31,973 |
| Dongfang Electric Corp. Ltd. | 39,000 | | | 115,220 |
| Dongfeng Motor Group Co. Ltd., | | | | |
| Class H | 49,800 | | | 85,033 |
| Guangshen Railway Co. Ltd. | 228,000 | | | 80,590 |
| Guangzhou Automobile Group Co. Ltd. | 123,633 | | | 102,854 |
| Haitian International Holdings Ltd. | 54,800 | | | 46,887 |
| Huaneng Power International, Inc. | 212,300 | | | 112,471 |
| Jiangsu Expressway Co. Ltd. | 97,200 | | | 89,203 |
| Mindray Medical International Ltd.—ADR | 1,462 | | | 37,486 |
| Ping An Insurance Group Co. of China Ltd. | 10,994 | | | 72,129 |
| Shanghai Electric Group Co. Ltd. | 259,000 | | | 119,437 |
| Shanghai Pharmaceuticals Holding | | | | |
| Co. Ltd. (a) | 69,300 | | | 112,055 |
| Sinopharm Group Co. | 83,500 | | | 200,108 |
| Tianjin Development Holdings Ltd. (a) | 473,979 | | | 244,063 |
| Tianjin Port Development Holdings Ltd. | 718,200 | | | 93,925 |
| Zhongsheng Group Holdings Ltd. | 87,196 | | | 144,768 |
| | | | | 3,187,768 |
| Egypt—0.1% | | | | |
| Telecom Egypt | 64,820 | | | 142,298 |
| France—1.4% | | | | |
| Atos Origin SA | 1,470 | | | 64,223 |
| AXA SA | 22,124 | | | 285,980 |
| BNP Paribas SA | 12,564 | | | 489,235 |
| Essilor International SA | 6,220 | | | 438,458 |
| France Telecom SA | 13,326 | | | 208,574 |
| LVMH Moet Hennessy Louis Vuitton SA | 2,331 | | | 328,355 |
| Sanofi-Aventis | 5,069 | | | 370,532 |
| Sanofi-Aventis—ADR | 863 | | | 31,534 |
| Societe Generale SA | 7,200 | | | 158,944 |
| Technip SA | 1,204 | | | 112,875 |
See Notes to Financial Statements.
| BLACKROCK SERIES FUND, INC. | DECEMBER 31, 2011 | 37 |
| BlackRock Global Allocation Portfolio | |
| Consolidated Schedule of Investments (continued) | (Percentages shown are based on Net Assets) |
| Common Stocks | Shares | | Value |
| France (concluded) | | | | |
| Total SA | 11,959 | | $ | 610,242 |
| Total SA—ADR | 12,409 | | | 634,224 |
| Vivendi SA | 6,293 | | | 137,373 |
| | | �� | | 3,870,549 |
| Germany—2.2% | | | | |
| Allianz AG, Registered Shares | 3,025 | | | 288,900 |
| BASF SE | 16,010 | | | 1,114,591 |
| Bayer AG, Registered Shares | 7,848 | | | 501,200 |
| Bayerische Motoren Werke AG | 2,822 | | | 188,645 |
| Beiersdorf AG (b) | 779 | | | 44,145 |
| Daimler AG | 7,772 | | | 340,480 |
| Deutsche Bank AG | 1,400 | | | 53,004 |
| Deutsche Bank AG, Registered Shares | 3,747 | | | 142,015 |
| Deutsche Telekom AG—ADR | 1,578 | | | 18,068 |
| Deutsche Telekom AG, Registered Shares | 36,937 | | | 423,700 |
| Fresenius Medical Care AG | 7,369 | | | 500,533 |
| Infineon Technologies AG | 23,511 | | | 176,580 |
| Kabel Deutschland Holding AG (a) | 4,049 | | | 205,266 |
| Lanxess AG | 5,000 | | | 258,233 |
| Muenchener Rueckversicherungs AG, | | | | |
| Registered Shares | 1,046 | | | 128,180 |
| Siemens AG | 9,883 | | | 945,564 |
| SMA Solar Technology AG (c) | 796 | | | 44,369 |
| Volkswagen AG, Preference Shares | 3,918 | | | 585,785 |
| | | | | 5,959,258 |
| Hong Kong—0.7% | | | | |
| AIA Group Ltd. | 34,700 | | | 108,018 |
| Cheung Kong Holdings Ltd. | 14,000 | | | 166,073 |
| Cheung Kong Infrastructure Holdings Ltd. | 27,000 | | | 157,865 |
| China Resources Gas Group Ltd. | 84,000 | | | 119,790 |
| China Resources Power Holdings Co. Ltd. | 104,000 | | | 200,241 |
| Hutchison Whampoa Ltd. | 25,270 | | | 210,874 |
| The Link Real Estate Investment Trust | 143,964 | | | 529,455 |
| Mongolian Mining Corp. (a) | 78,107 | | | 58,559 |
| Wharf Holdings Ltd. | 36,925 | | | 166,446 |
| Yuanda China Holdings Ltd. (a) | 729,226 | | | 96,398 |
| | | | | 1,813,719 |
| India—0.4% | | | | |
| Adani Enterprises Ltd. | 20,425 | | | 112,804 |
| Adani Power Ltd. (a) | 90,751 | | | 106,592 |
| Bharat Heavy Electricals Ltd. | 51,929 | | | 233,293 |
| Housing Development Finance Corp. | 31,925 | | | 391,529 |
| Larsen & Toubro Ltd. | 4,070 | | | 76,129 |
| Reliance Industries Ltd. | 15,861 | | | 206,620 |
| | | | | 1,126,967 |
| Indonesia—0.1% | | | | |
| Bumi Resources Tbk PT | 798,834 | | | 190,863 |
| Telekomunikasi Indonesia Tbk PT | 93,100 | | | 72,206 |
| | | | | 263,069 |
| Ireland—0.1% | | | | |
| Covidien Plc | 4,095 | | | 184,316 |
| Israel—0.2% | | | | |
| Check Point Software Technologies Ltd. (a) | 758 | | | 39,825 |
| Teva Pharmaceutical Industries—ADR | 15,639 | | | 631,190 |
| | | | | 671,015 |
| Italy—0.5% | | | | |
| Assicurazioni Generali SpA | 4,997 | | | 75,012 |
| Eni SpA | 27,095 | | | 558,635 |
| Fiat Industrial SpA (a) | 42,231 | | | 359,784 |
| Intesa Sanpaolo SpA | 99,833 | | | 166,273 |
| Telecom Italia SpA | 71,451 | | | 76,371 |
| | | | | 1,236,075 |
| Common Stocks | Shares | | Value |
| Japan—6.8% | | | | |
| Aisin Seiki Co. Ltd. | 4,520 | | $ | 128,097 |
| Asahi Kasei Corp. | 29,900 | | | 180,192 |
| Astellas Pharma, Inc. | 3,890 | | | 157,962 |
| Bridgestone Corp. | 11,800 | | | 267,249 |
| Canon, Inc. | 11,431 | | | 503,047 |
| Daihatsu Motor Co. Ltd. | 11,900 | | | 211,615 |
| Daiwa House Industry Co. Ltd. | 11,370 | | | 135,925 |
| Denso Corp. | 6,130 | | | 168,396 |
| East Japan Railway Co. | 11,527 | | | 734,712 |
| Fanuc Ltd. | 1,500 | | | 228,798 |
| Fuji Heavy Industries Ltd. | 71,260 | | | 427,405 |
| Futaba Industrial Co. Ltd. | 10,970 | | | 61,573 |
| Hitachi Chemical Co. Ltd. | 9,500 | | | 166,295 |
| Hitachi Ltd. | 28,200 | | | 146,696 |
| Honda Motor Co. Ltd. | 16,540 | | | 503,823 |
| Hoya Corp. | 16,001 | | | 344,007 |
| Inpex Corp. | 92 | | | 579,253 |
| JGC Corp. | 16,580 | | | 398,064 |
| JSR Corp. | 6,500 | | | 119,796 |
| Kao Corp. | 2,100 | | | 57,301 |
| KDDI Corp. | 67 | | | 430,294 |
| Kinden Corp. | 11,740 | | | 98,969 |
| Kirin Holdings Co. Ltd. | 22,790 | | | 276,915 |
| Komatsu Ltd. | 7,700 | | | 179,548 |
| Kubota Corp. | 54,880 | | | 459,266 |
| Kuraray Co. Ltd. | 15,820 | | | 224,512 |
| Kyowa Hakko Kirin Co. Ltd. | 20,870 | | | 254,755 |
| Marubeni Corp. | 40,000 | | | 243,471 |
| Mitsubishi Corp. | 38,690 | | | 779,788 |
| Mitsubishi Tanabe Pharma Corp. | 8,000 | | | 126,385 |
| Mitsubishi UFJ Financial Group, Inc. | 59,120 | | | 250,283 |
| Mitsui & Co. Ltd. | 46,020 | | | 713,275 |
| Mitsui Fudosan Co. Ltd. | 7,000 | | | 102,072 |
| MS&AD Insurance Group Holdings, Inc. | 18,215 | | | 336,223 |
| Murata Manufacturing Co. Ltd. | 5,140 | | | 263,228 |
| NGK Insulators Ltd. | 200 | | | 2,368 |
| Nintendo Co. Ltd. | 2,100 | | | 288,313 |
| Nippon Building Fund, Inc. | 4 | | | 32,736 |
| Nippon Electric Glass Co. | 18,440 | | | 181,528 |
| Nippon Telegraph & Telephone Corp. | 9,810 | | | 499,426 |
| NKSJ Holdings, Inc. | 12,787 | | | 250,139 |
| NTT DoCoMo, Inc. | 612 | | | 1,123,644 |
| NTT Urban Development Corp. | 53 | | | 36,043 |
| Okumura Corp. | 38,270 | | | 156,827 |
| Rinnai Corp. | 2,650 | | | 189,753 |
| Rohm Co. Ltd. | 3,260 | | | 151,593 |
| Shin-Etsu Chemical Co. Ltd. | 12,820 | | | 629,715 |
| Sony Financial Holdings, Inc. | 7,700 | | | 113,561 |
| Sumitomo Chemical Co. Ltd. | 112,930 | | | 410,027 |
| Sumitomo Electric Industries Ltd. | 8,500 | | | 92,027 |
| Sumitomo Mitsui Financial Group, Inc. | 6,700 | | | 185,810 |
| Suzuki Motor Corp. | 32,261 | | | 664,256 |
| TDK Corp. | 4,260 | | | 187,880 |
| Terumo Corp. | 3,200 | | | 150,430 |
| Toda Corp. | 38,000 | | | 138,369 |
| Toho Co. Ltd. | 6,500 | | | 115,752 |
| Tokio Marine Holdings, Inc. | 29,602 | | | 655,501 |
| Tokyo Gas Co. Ltd. | 100,581 | | | 463,534 |
| Toyota Industries Corp. | 16,514 | | | 446,799 |
| Toyota Motor Corp. | 8,000 | | | 264,537 |
| Ube Industries Ltd. | 91,600 | | | 250,370 |
| West Japan Railway Co. | 5,500 | | | 238,983 |
| Yahoo! Japan Corp. | 479 | | | 154,101 |
| Yamada Denki Co. Ltd. | 2,500 | | | 170,298 |
| | | | | 18,503,510 |
See Notes to Financial Statements.
| 38 | BLACKROCK SERIES FUND, INC. | DECEMBER 31, 2011 |
| BlackRock Global Allocation Portfolio | |
| Consolidated Schedule of Investments (continued) | (Percentages shown are based on Net Assets) |
| Common Stocks | Shares | | Value |
| Kazakhstan—0.1% | | | | |
| KazMunaiGas Exploration Production—GDR | 20,124 | | $ | 300,854 |
| Luxembourg—0.0% | | | | |
| Millicom International Cellular SA | 412 | | | 41,159 |
| Malaysia—0.5% | | | | |
| Axiata Group Bhd | 335,551 | | | 544,117 |
| British American Tobacco Malaysia Bhd | 6,700 | | | 105,475 |
| IOI Corp. Bhd | 31,461 | | | 53,340 |
| Telekom Malaysia Bhd | 255,414 | | | 399,823 |
| YTL Power International Bhd | 232,803 | | | 130,698 |
| | | | | 1,233,453 |
| Mexico—0.2% | | | | |
| America Movil, SA de CV—ADR | 16,153 | | | 365,058 |
| Fomento Economico Mexicano, | | | | |
| SA de CV—ADR | 1,633 | | | 113,836 |
| | | | | 478,894 |
| Netherlands—0.4% | | | | |
| ASML Holding NV | 1,000 | | | 41,790 |
| ASML Holding NV | 3,644 | | | 152,215 |
| CNH Global NV (a) | 1,126 | | | 40,525 |
| ING Groep NV CVA (a) | 39,529 | | | 282,695 |
| Koninklijke Philips Electronics NV | 17,447 | | | 366,068 |
| LyondellBasell Industries NV, Class A | 900 | | | 29,241 |
| Unilever NV (b) | 6,291 | | | 216,307 |
| Unilever NV—ADR | 2,228 | | | 76,576 |
| | | | | 1,205,417 |
| Norway—0.2% | | | | |
| DnB NOR ASA | 24,320 | | | 237,042 |
| Statoil ASA | 13,029 | | | 333,676 |
| Telenor ASA | 3,464 | | | 56,684 |
| | | | | 627,402 |
| Philippines—0.0% | | | | |
| Philippine Long Distance Telephone Co.—ADR | 2,078 | | | 119,734 |
| Poland—0.0% | | | | |
| Powszechny Zaklad Ubezpieczen SA | 430 | | | 38,368 |
| Portugal—0.0% | | | | |
| Zon Multimedia Servicos de | | | | |
| Telecomunicacoes e Multimedia SGPS SA | 23,673 | | | 71,020 |
| Russia—0.8% | | | | |
| Federal Hydrogenerating Co. | 1,051,194 | | | 25,966 |
| Federal Hydrogenerating Co.—ADR | 116,707 | | | 355,956 |
| Kuzbassrazrezugol (a) | 284,562 | | | 56,628 |
| LSR Group—GDR (c)(d) | 27,343 | | | 87,224 |
| LSR Group—GDR | 14,240 | | | 48,017 |
| Magnitogorsk Iron & Steel Works—GDR | 21,036 | | | 102,382 |
| Novorossiysk Commercial Sea Port—GDR | 20,548 | | | 153,905 |
| OAO Rosneft Oil Co.—GDR | 38,639 | | | 255,018 |
| Polyus Gold Co. ZAO—ADR (a) | 124,734 | | | 367,965 |
| Sberbank | 226,533 | | | 509,699 |
| Uralkali—GDR | 500 | | | 18,000 |
| VimpelCom Ltd.—ADR | 16,000 | | | 151,520 |
| | | | | 2,132,280 |
| Singapore—0.8% | | | | |
| CapitaLand Ltd. | 109,700 | | | 186,693 |
| DBS Group Holdings Ltd. | 11,510 | | | 102,166 |
| Fraser and Neave Ltd. | 54,700 | | | 261,124 |
| Global Logistic Properties Ltd. (a) | 71,900 | | | 97,199 |
| Keppel Corp. Ltd. | 46,450 | | | 332,481 |
| M1 Ltd. | 62,900 | | | 121,285 |
| Noble Group Ltd. | 46,787 | | | 40,651 |
| Oversea-Chinese Banking Corp. | 50,400 | | | 303,955 |
| Common Stocks | Shares | | Value |
| Singapore (concluded) | | | | |
| Raffles Medical Group Ltd. | 49,300 | | $ | 80,601 |
| Sembcorp Marine Ltd. | 28,000 | | | 82,289 |
| Singapore Press Holdings Ltd. | 20,370 | | | 57,901 |
| Singapore Telecommunications Ltd. | 145,300 | | | 346,068 |
| United Overseas Bank Ltd. | 6,680 | | | 78,614 |
| | | | | 2,091,027 |
| South Africa—0.3% | | | | |
| AngloGold Ashanti Ltd.—ADR | 1,308 | | | 55,525 |
| Harmony Gold Mining Co. Ltd.—ADR | 6,630 | | | 77,173 |
| Life Healthcare Group Holdings Ltd. | 49,899 | | | 127,494 |
| Randgold Resources Ltd.—ADR | 4,661 | | | 475,888 |
| | | | | 736,080 |
| South Korea—0.8% | | | | |
| Cheil Industries, Inc. (a) | 1,630 | | | 143,142 |
| Hyundai Motor Co. (a)(c) | 1,479 | | | 273,952 |
| KT Corp. (a) | 970 | | | 30,079 |
| KT Corp.—ADR | 12,260 | | | 191,746 |
| KT&G Corp. (a) | 3,994 | | | 282,215 |
| LG Corp. (a) | 2,380 | | | 127,086 |
| Mando Corp. (a) | 304 | | | 54,463 |
| POSCO | 400 | | | 131,944 |
| POSCO—ADR | 1,752 | | | 143,839 |
| Samsung Electronics Co. Ltd. | 888 | | | 816,816 |
| Samsung Fine Chemicals Co. Ltd. (a) | 2,110 | | | 111,922 |
| | | | | 2,307,204 |
| Spain—0.2% | | | | |
| Repsol YPF SA | 7,504 | | | 229,587 |
| Telefonica SA | 20,269 | | | 349,197 |
| Telefonica SA—ADR | 3,861 | | | 66,371 |
| | | | | 645,155 |
| Sweden—0.1% | | | | |
| Nordea Bank AB | 10,600 | | | 81,701 |
| SKF AB, Class B | 4,000 | | | 84,322 |
| Swedbank AB, Class A | 4,900 | | | 63,232 |
| | | | | 229,255 |
| Switzerland—1.0% | | | | |
| Compagnie Financiere Richemont SA | 2,640 | | | 132,799 |
| Garmin Ltd. | 1,091 | | | 43,433 |
| Nestle SA, Registered Shares | 14,489 | | | 832,009 |
| Novartis AG, Registered Shares | 9,314 | | | 531,765 |
| Roche Holding AG | 2,080 | | | 351,766 |
| Swisscom AG | 635 | | | 240,175 |
| TE Connectivity Ltd. | 1,258 | | | 38,759 |
| Transocean Ltd. | 3,401 | | | 130,564 |
| UBS AG (a) | 22,456 | | | 266,388 |
| Zurich Financial Services AG (a) | 850 | | | 191,511 |
| | | | | 2,759,169 |
| Taiwan—0.6% | | | | |
| Cheng Shin Rubber Industry Co. Ltd. | 50,500 | | | 109,147 |
| Chunghwa Telecom Co. Ltd. | 57,732 | | | 190,721 |
| Chunghwa Telecom Co. Ltd.—ADR | 11,246 | | | 374,267 |
| Far EasTone Telecommunications Co. Ltd. | 95,000 | | | 178,457 |
| HON HAI Precision Industry Co. Ltd. | 38,812 | | | 106,141 |
| HTC Corp. | 16,277 | | | 266,792 |
| Taiwan Semiconductor Manufacturing Co. Ltd. | 97,192 | | | 242,844 |
| Yulon Motor Co. Ltd. | 80,000 | | | 137,181 |
| | | | | 1,605,550 |
| Thailand—0.3% | | | | |
| Hana Microelectronics PCL | 17,777 | | | 10,649 |
| PTT Chemical PCL (a) | 148,752 | | | 287,603 |
| PTT Public Company THB10 | 19,279 | | | 194,318 |
| Siam Commercial Bank PCL | 66,546 | | | 242,561 |
| | | | | 735,131 |
See Notes to Financial Statements.
| BLACKROCK SERIES FUND, INC. | DECEMBER 31, 2011 | 39 |
| BlackRock Global Allocation Portfolio | |
| Consolidated Schedule of Investments (continued) | (Percentages shown are based on Net Assets) |
| Common Stocks | Shares | | Value |
| Turkey—0.2% | | | | |
| BIM Birlesik Magazalar AS | 5,212 | | $ | 144,331 |
| Tupras Turkiye Petrol Rafinerileri AS | 6,490 | | | 136,695 |
| Turk Telekomunikasyon AS | 35,085 | | | 129,850 |
| Turkcell Iletisim Hizmet AS (a) | 15,982 | | | 75,320 |
| Turkiye Garanti Bankasi AS | 46,796 | | | 145,483 |
| | | | | 631,679 |
| United Kingdom—3.1% | | | | |
| Amlin Plc | 8,967 | | | 43,672 |
| Anglo American Plc | 7,993 | | | 295,263 |
| Antofagasta Plc | 19,772 | | | 373,939 |
| AstraZeneca Plc—ADR | 896 | | | 41,476 |
| BG Group Plc | 47,599 | | | 1,016,888 |
| BHP Billiton Plc | 8,703 | | | 254,438 |
| BP Plc | 51,683 | | | 368,153 |
| BP Plc—ADR | 11,587 | | | 495,228 |
| British American Tobacco Plc | 4,088 | | | 193,936 |
| British Sky Broadcasting Group Plc | 4,890 | | | 55,635 |
| BT Group Plc | 125,552 | | | 372,159 |
| Diageo Plc—ADR | 8,190 | | | 715,970 |
| GlaxoSmithKline Plc—ADR | 929 | | | 42,390 |
| Glencore International Plc | 20,015 | | | 122,210 |
| Guinness Peat Group Plc | 199,046 | | | 90,573 |
| HSBC Holdings Plc | 51,304 | | | 391,657 |
| International Power Plc | 101,578 | | | 531,148 |
| Lloyds Banking Group Plc (a) | 242,204 | | | 97,289 |
| National Grid Plc | 56,795 | | | 548,968 |
| Petropavlovsk Plc | 3,425 | | | 32,776 |
| Rio Tinto Plc | 7,043 | | | 344,026 |
| Royal Dutch Shell Plc—ADR | 6,965 | | | 509,072 |
| Scottish & Southern Energy Plc | 23,784 | | | 476,091 |
| Unilever Plc | 3,961 | | | 132,828 |
| Unilever Plc—ADR | 2,499 | | | 83,766 |
| Vallares Plc (a) | 17,667 | | | 212,636 |
| Vodafone Group Plc | 138,546 | | | 386,281 |
| Vodafone Group Plc—ADR | 10,784 | | | 302,275 |
| | | | | 8,530,743 |
| United States—33.9% | | | | |
| 3M Co. | 4,499 | | | 367,703 |
| Abbott Laboratories | 9,657 | | | 543,013 |
| Accenture Plc, Class A | 681 | | | 36,250 |
| ACE Ltd. (b) | 11,682 | | | 819,142 |
| Activision Blizzard, Inc. (b) | 50,361 | | | 620,448 |
| Adobe Systems, Inc. (a) | 1,673 | | | 47,296 |
| The AES Corp. (a)(b) | 30,513 | | | 361,274 |
| Aetna, Inc. | 15,762 | | | 664,999 |
| Agilent Technologies, Inc. (a) | 8,915 | | | 311,401 |
| Albemarle Corp. | 650 | | | 33,482 |
| Alcoa, Inc. | 43,183 | | | 373,533 |
| Alliance Data Systems Corp. (a) | 400 | | | 41,536 |
| Alliance Resource Partners LP | 2,102 | | | 158,869 |
| The Allstate Corp. | 2,940 | | | 80,585 |
| Altera Corp. | 929 | | | 34,466 |
| Altria Group, Inc. | 11,098 | | | 329,056 |
| Amdocs Ltd. (a) | 1,150 | | | 32,810 |
| Ameren Corp. | 1,300 | | | 43,069 |
| American Eagle Outfitters, Inc. (b) | 22,800 | | | 348,612 |
| American Electric Power Co., Inc. | 5,163 | | | 213,284 |
| American Express Co. | 2,900 | | | 136,793 |
| American Tower Corp., Class A | 6,578 | | | 394,746 |
| American Water Works Co., Inc. | 5,618 | | | 178,989 |
| Ameriprise Financial, Inc. | 550 | | | 27,302 |
| AmerisourceBergen Corp. | 6,541 | | | 243,260 |
| Amgen, Inc. | 666 | | | 42,764 |
| Common Stocks | Shares | | Value |
| United States (continued) | | | | |
| Anadarko Petroleum Corp. | 6,059 | | $ | 462,483 |
| Analog Devices, Inc. | 875 | | | 31,308 |
| Apache Corp. | 4,217 | | | 381,976 |
| Apple, Inc. (a)(b) | 7,631 | | | 3,090,555 |
| Arch Capital Group Ltd. (a) | 4,089 | | | 152,233 |
| Arrow Electronics, Inc. (a) | 820 | | | 30,676 |
| AT&T, Inc. | 58,684 | | | 1,774,604 |
| Autoliv, Inc. | 433 | | | 23,161 |
| Axis Capital Holdings Ltd. | 932 | | | 29,787 |
| Baker Hughes, Inc. | 2,778 | | | 135,122 |
| Bank of America Corp. | 90,668 | | | 504,114 |
| The Bank of New York Mellon Corp. | 27,750 | | | 552,502 |
| Baxter International, Inc. | 614 | | | 30,381 |
| Becton Dickinson & Co. | 436 | | | 32,578 |
| Biogen Idec, Inc. (a) | 509 | | | 56,015 |
| BMC Software, Inc. (a) | 820 | | | 26,880 |
| Boeing Co. | 8,918 | | | 654,135 |
| BorgWarner, Inc. (a) | 2,182 | | | 139,081 |
| Bristol-Myers Squibb Co. | 31,357 | | | 1,105,021 |
| CA, Inc. | 21,948 | | | 443,679 |
| Calpine Corp. (a)(b) | 17,051 | | | 278,443 |
| Capital One Financial Corp. | 658 | | | 27,827 |
| Cardinal Health, Inc. | 819 | | | 33,260 |
| Celgene Corp. (a) | 2,580 | | | 174,408 |
| CenturyLink, Inc. | 10,316 | | | 383,755 |
| Chevron Corp. | 20,973 | | | 2,231,527 |
| Chubb Corp. | 4,755 | | | 329,141 |
| Cigna Corp. | 4,971 | | | 208,782 |
| Cisco Systems, Inc. (b) | 65,544 | | | 1,185,036 |
| Citigroup, Inc. | 36,569 | | | 962,130 |
| CMS Energy Corp. | 8,741 | | | 193,001 |
| CNA Financial Corp. | 766 | | | 20,491 |
| Coach, Inc. | 604 | | | 36,868 |
| The Coca-Cola Co. | 3,344 | | | 233,980 |
| Coca-Cola Enterprises, Inc. | 1,308 | | | 33,720 |
| Cognizant Technology Solutions Corp. (a) | 1,287 | | | 82,767 |
| Colgate-Palmolive Co. (b) | 6,062 | | | 560,068 |
| Comcast Corp., Class A | 33,827 | | | 802,038 |
| ConAgra Foods, Inc. | 4,896 | | | 129,254 |
| ConocoPhillips | 598 | | | 43,576 |
| Consol Energy, Inc. | 31,747 | | | 1,165,115 |
| Consolidated Edison, Inc. | 3,275 | | | 203,148 |
| Constellation Brands, Inc., Class A (a) | 3,997 | | | 82,618 |
| Constellation Energy Group, Inc. | 712 | | | 28,245 |
| Corning, Inc. (b) | 72,727 | | | 943,996 |
| Coventry Health Care, Inc. (a) | 983 | | | 29,854 |
| Crown Castle International Corp. (a) | 1,304 | | | 58,419 |
| Crown Holdings, Inc. (a) | 3,675 | | | 123,407 |
| CVS Caremark Corp. | 12,053 | | | 491,521 |
| DaVita, Inc. (a) | 3,394 | | | 257,299 |
| Dell, Inc. (a)(b) | 23,485 | | | 343,586 |
| Devon Energy Corp. | 6,717 | | | 416,454 |
| Diamond Offshore Drilling, Inc. | 659 | | | 36,416 |
| Discover Financial Services | 11,841 | | | 284,184 |
| DISH Network Corp., Class A | 3,660 | | | 104,237 |
| Dominion Resources, Inc. | 3,692 | | | 195,971 |
| The Dow Chemical Co. | 12,768 | | | 367,208 |
| Dr. Pepper Snapple Group, Inc. | 3,403 | | | 134,350 |
| E.I. du Pont de Nemours & Co. | 8,808 | | | 403,230 |
| Eastman Chemical Co. | 866 | | | 33,826 |
| eBay, Inc. (a) | 6,468 | | | 196,174 |
| Edison International | 820 | | | 33,948 |
| El Paso Corp. (b) | 3,100 | | | 82,367 |
See Notes to Financial Statements.
| 40 | BLACKROCK SERIES FUND, INC. | DECEMBER 31, 2011 |
| BlackRock Global Allocation Portfolio | |
| Consolidated Schedule of Investments (continued) | (Percentages shown are based on Net Assets) |
| Common Stocks | Shares | | Value |
| United States (continued) | | | | |
| Electronic Arts, Inc. (a) | 12,041 | | $ | 248,045 |
| Eli Lilly & Co. | 4,361 | | | 181,243 |
| EMC Corp. (a)(b) | 17,940 | | | 386,428 |
| Endurance Specialty Holdings Ltd. | 4,709 | | | 180,119 |
| Entergy Corp. | 3,005 | | | 219,515 |
| EOG Resources, Inc. (b) | 2,824 | | | 278,192 |
| Exelon Corp. | 8,045 | | | 348,912 |
| Expedia, Inc. | 425 | | | 12,334 |
| Exxon Mobil Corp. | 44,040 | | | 3,732,830 |
| Fidelity National Financial, Inc., Class A | 19,438 | | | 309,647 |
| Fidelity National Information Services, Inc. | 643 | | | 17,097 |
| First Solar, Inc. (a)(c) | 3,000 | | | 101,280 |
| Fluor Corp. | 550 | | | 27,638 |
| FMC Corp. | 9,296 | | | 799,828 |
| Ford Motor Co. | 33,696 | | | 362,569 |
| Freeport-McMoRan Copper & Gold, | | | | |
| Inc., Class B | 10,567 | | | 388,760 |
| Freescale Semiconductor Holdings I Ltd. (a) | 22,023 | | | 278,591 |
| General Dynamics Corp. | 4,623 | | | 307,013 |
| General Electric Co. | 93,610 | | | 1,676,555 |
| General Mills, Inc. (b) | 10,660 | | | 430,771 |
| General Motors Co. (a) | 15,745 | | | 319,151 |
| Gilead Sciences, Inc. (a) | 7,907 | | | 323,634 |
| The Goldman Sachs Group, Inc. | 5,507 | | | 497,998 |
| Google, Inc., Class A (a)(b) | 2,436 | | | 1,573,412 |
| H.J. Heinz Co. | 2,379 | | | 128,561 |
| Halliburton Co. | 12,085 | | | 417,053 |
| Harris Corp. | 550 | | | 19,822 |
| HCA Holdings, Inc. (a) | 11,967 | | | 263,633 |
| HealthSouth Corp. (a) | 8,754 | | | 154,683 |
| Helmerich & Payne, Inc. | 805 | | | 46,980 |
| Herbalife Ltd. | 800 | | | 41,336 |
| Hess Corp. | 4,805 | | | 272,924 |
| Hewlett-Packard Co. | 21,685 | | | 558,606 |
| Hologic, Inc. (a) | 16,431 | | | 287,707 |
| Humana, Inc. | 4,585 | | | 401,692 |
| Intel Corp. | 32,910 | | | 798,067 |
| International Business Machines Corp. (b) | 10,248 | | | 1,884,402 |
| International Game Technology | 10,469 | | | 180,067 |
| International Paper Co. | 4,721 | | | 139,742 |
| Intuit, Inc. | 712 | | | 37,444 |
| ITC Holdings Corp. | 1,983 | | | 150,470 |
| Johnson & Johnson | 26,456 | | | 1,734,984 |
| Johnson Controls, Inc. | 5,610 | | | 175,369 |
| JPMorgan Chase & Co. | 36,731 | | | 1,221,306 |
| KBR, Inc. | 9,461 | | | 263,678 |
| KLA-Tencor Corp. | 712 | | | 34,354 |
| Kraft Foods, Inc. | 61 | | | 2,279 |
| The Kroger Co. | 1,578 | | | 38,219 |
| L-3 Communications Holdings, Inc. | 633 | | | 42,208 |
| Lear Corp. | 1,000 | | | 39,800 |
| Liberty Global, Inc. (a) | 675 | | | 27,695 |
| Life Technologies Corp. (a) | 6,113 | | | 237,857 |
| Limited Brands, Inc. | 1,011 | | | 40,794 |
| Lincoln National Corp. | 1,199 | | | 23,285 |
| Lorillard, Inc. | 1,659 | | | 189,126 |
| Macy’s, Inc. | 983 | | | 31,633 |
| Marathon Oil Corp. | 13,255 | | | 387,974 |
| Marathon Petroleum Corp. | 17,423 | | | 580,012 |
| Marvell Technology Group Ltd. (a) | 9,266 | | | 128,334 |
| MasterCard, Inc., Class A (b) | 758 | | | 282,598 |
| Mattel, Inc. | 8,691 | | | 241,262 |
| McDermott International, Inc. (a) | 14,755 | | | 169,830 |
| Common Stocks | Shares | | Value |
| United States (continued) | | | | |
| McDonald’s Corp. | 4,181 | | $ | 419,480 |
| The McGraw-Hill Cos., Inc. | 629 | | | 28,286 |
| McKesson Corp. | 4,814 | | | 375,059 |
| Mead Johnson Nutrition Co. | 7,985 | | | 548,809 |
| Medco Health Solutions, Inc. (a) | 6,053 | | | 338,363 |
| Medtronic, Inc. | 14,366 | | | 549,499 |
| Merck & Co., Inc. | 29,840 | | | 1,124,968 |
| MetLife, Inc. | 5,650 | | | 176,167 |
| MetroPCS Communications, Inc. (a) | 12,014 | | | 104,282 |
| Mettler-Toledo International, Inc. (a) | 987 | | | 145,790 |
| Microsoft Corp. | 92,595 | | | 2,403,766 |
| Morgan Stanley | 21,820 | | | 330,137 |
| Motorola Mobility Holdings, Inc. (a) | 5,758 | | | 223,410 |
| Motorola Solutions, Inc. | 3,803 | | | 176,041 |
| Murphy Oil Corp. | 787 | | | 43,867 |
| Mylan, Inc. (a) | 14,640 | | | 314,174 |
| National Oilwell Varco, Inc. | 11,800 | | | 802,282 |
| NetApp, Inc. (a)(b) | 7,800 | | | 282,906 |
| Newmont Mining Corp. | 19,315 | | | 1,159,093 |
| NextEra Energy, Inc. | 10,358 | | | 630,595 |
| Northern Trust Corp. | 3,903 | | | 154,793 |
| NRG Energy, Inc. (a)(b) | 8,111 | | | 146,971 |
| Occidental Petroleum Corp. | 13,506 | | | 1,265,512 |
| Oracle Corp. (b) | 70,180 | | | 1,800,117 |
| PACCAR, Inc. | 3,226 | | | 120,878 |
| Pall Corp. | 2,290 | | | 130,873 |
| Parker Hannifin Corp. | 533 | | | 40,641 |
| PerkinElmer, Inc. | 6,658 | | | 133,160 |
| Perrigo Co. | 2,628 | | | 255,704 |
| Pfizer, Inc. | 70,284 | | | 1,520,946 |
| PG&E Corp. (b) | 6,228 | | | 256,718 |
| Philip Morris International, Inc. | 7,849 | | | 615,990 |
| Platinum Underwriters Holdings Ltd. | 2,214 | | | 75,520 |
| Polycom, Inc. (a)(b) | 13,045 | | | 212,633 |
| PPG Industries, Inc. | 388 | | | 32,394 |
| PPL Corp. | 11,188 | | | 329,151 |
| Praxair, Inc. | 1,575 | | | 168,367 |
| Precision Castparts Corp. | 2,190 | | | 360,890 |
| Principal Financial Group, Inc. | 2,674 | | | 65,780 |
| The Procter & Gamble Co. | 10,702 | | | 713,930 |
| The Progressive Corp. | 6,317 | | | 123,245 |
| Prudential Financial, Inc. | 3,000 | | | 150,360 |
| Pulte Group, Inc. (a) | 29,280 | | | 184,757 |
| QEP Resources, Inc. | 14,416 | | | 422,389 |
| QUALCOMM, Inc. (b) | 23,504 | | | 1,285,669 |
| Quicksilver Resources, Inc. (a) | 30,916 | | | 207,446 |
| Ralph Lauren Corp. | 200 | | | 27,616 |
| Reinsurance Group of America, Inc. | 550 | | | 28,738 |
| RenaissanceRe Holdings Ltd. | 2,230 | | | 165,845 |
| Ross Stores, Inc. | 558 | | | 26,522 |
| Ryder System, Inc. | 804 | | | 42,725 |
| SanDisk Corp. (a)(b) | 5,954 | | | 292,996 |
| Sara Lee Corp. (b) | 29,202 | | | 552,502 |
| Schlumberger Ltd. | 13,248 | | | 904,971 |
| Seagate Technology Plc (b) | 12,400 | | | 203,360 |
| Simon Property Group, Inc. | 1,578 | | | 203,467 |
| SM Energy Co. | 5,064 | | | 370,178 |
| The Southern Co. (b) | 13,168 | | | 609,547 |
| Spirit AeroSystems Holdings, Inc., Class A (a) | 13,613 | | | 282,878 |
| The St. Joe Co. (a) | 49,213 | | | 721,463 |
| State Street Corp. | 12,450 | | | 501,859 |
| Symantec Corp. (a)(b) | 17,393 | | | 272,200 |
| Teradata Corp. (a) | 988 | | | 47,928 |
See Notes to Financial Statements.
| BLACKROCK SERIES FUND, INC. | DECEMBER 31, 2011 | 41 |
| BlackRock Global Allocation Portfolio | |
| Consolidated Schedule of Investments (continued) | (Percentages shown are based on Net Assets) |
| Common Stocks | | Shares | | Value |
| United States (concluded) | | | | | |
| Texas Instruments, Inc. | | 8,829 | | $ | 257,012 |
| Thermo Fisher Scientific, Inc. (a) | | 5,607 | | | 252,147 |
| Time Warner Cable, Inc. | | 2,764 | | | 175,707 |
| Torchmark Corp. | | 793 | | | 34,408 |
| The Travelers Cos., Inc. | | 10,349 | | | 612,350 |
| U.S. Bancorp | | 25,357 | | | 685,907 |
| Union Pacific Corp. | | 9,830 | | | 1,041,390 |
| United Technologies Corp. (b) | | 6,590 | | | 481,663 |
| UnitedHealth Group, Inc. | | 7,892 | | | 399,967 |
| Unum Group | | 732 | | | 15,423 |
| Urban Outfitters, Inc. (a) | | 928 | | | 25,576 |
| Valero Energy Corp. | | 11,947 | | | 251,484 |
| Validus Holdings Ltd. | | 3,327 | | | 104,801 |
| Vanguard Health Systems, Inc. (a) | | 7,154 | | | 73,114 |
| Verizon Communications, Inc. | | 22,917 | | | 919,430 |
| Vertex Pharmaceuticals, Inc. (a)(b) | | 8,812 | | | 292,647 |
| Viacom, Inc., Class B | | 4,747 | | | 215,561 |
| Visa, Inc., Class A | | 5,524 | | | 560,852 |
| Wal-Mart Stores, Inc. | | 16,431 | | | 981,917 |
| Walgreen Co. | | 866 | | | 28,630 |
| Walt Disney Co. | | 8,598 | | | 322,425 |
| Waters Corp. (a) | | 3,611 | | | 267,395 |
| Weatherford International Ltd. (a) | | 12,414 | | | 181,741 |
| WellPoint, Inc. | | 9,254 | | | 613,077 |
| Wells Fargo & Co. | | 32,041 | | | 883,050 |
| Western Digital Corp. (a) | | 5,524 | | | 170,968 |
| The Western Union Co. | | 1,587 | | | 28,979 |
| Whiting Petroleum Corp. (a)(b) | | 12,388 | | | 578,396 |
| Wyndham Worldwide Corp. | | 766 | | | 28,978 |
| Xerox Corp. | | 31,038 | | | 247,062 |
| XL Group Plc | | 33,455 | | | 661,405 |
| | | | | | 92,384,031 |
| Total Common Stocks—63.0% | | | | | 171,585,061 |
| |
| |
| Fixed Income Securities | | | | | |
| Corporate Bonds | | Par
(000) | | |
| Argentina—0.0% | | | | | |
| Empresa Distribuidora Y Comercializadora | | | | | |
| Norte, 9.75%, 10/25/22 (d) | USD | 25 | | | 20,500 |
| Australia—0.1% | | | | | |
| TFS Corp. Ltd., 11.00%, 7/15/18 (d) | | 336 | | | 335,672 |
| Brazil—0.2% | | | | | |
| Odebrecht Drilling Norbe VIII/IX Ltd., 6.35%, | | | | | |
| 6/30/21 (d) | | 158 | | | 162,513 |
| OGX Petroleo e Gas Participacoes SA, | | | | | |
| 8.50%, 6/01/18 (d) | | 282 | | | 276,360 |
| | | | | | 438,873 |
| Canada—0.1% | | | | | |
| PetroBakken Energy Ltd., 3.13%, | | | | | |
| 2/08/16 (e) | | 200 | | | 185,000 |
| Viterra, Inc., 5.95%, 8/01/20 (d) | | 92 | | | 94,020 |
| | | | | | 279,020 |
| Chile—0.1% | | | | | |
| Inversiones Alsacia SA, 8.00%, 8/18/18 (d) | | 164 | | | 123,049 |
| China—0.2% | | | | | |
| Celestial Nutrifoods Ltd., 0.00%, | | | | | |
| 6/12/11 (a)(f)(g) | SGD | 400 | | | 46,259 |
| Corporate Bonds | | Par
(000) | | Value |
| China (concluded) | | | | | |
| China Milk Products Group Ltd., | | | | | |
| 0.00%, 1/05/12 (a)(f)(g) | USD | 300 | | $ | 39,000 |
| China Petroleum & Chemical Corp., | | | | | |
| Series SINO, 3.03%, 4/24/14 (e)(g) | HKD | 2,490 | | | 367,091 |
| | | | | | | 452,350 |
| Hong Kong—0.0% | | | | | |
| FU JI Food and Catering Services | | | | | |
| Holdings Ltd., 0.00%, 10/18/10 (a)(f)(g) | CNY | 1,900 | | | 18,112 |
| India—0.4% | | | | | |
| REI Agro Ltd.: | | | | | |
| 5.50%, 11/13/14 (d)(e) | USD | 220 | | | 176,550 |
| 5.50%, 11/13/14 | | | 152 | | | 121,980 |
| Suzlon Energy Ltd. (e)(g): | | | | | |
| 113.73%, 6/12/12 | | | 115 | | | 136,850 |
| 41.24%, 10/11/12 | | | 217 | | | 235,988 |
| 12.73%, 7/25/14 | | | 179 | | | 141,410 |
| Tata Steel Ltd., 1.00%, 9/05/12 (e) | | 100 | | | 120,250 |
| | | | | | | 933,028 |
| Ireland—0.1% | | | | | |
| Bank of Ireland Mortgage Bank: | | | | | |
| 4.63%, 9/16/15 | | EUR | 69 | | | 74,568 |
| 3.25%, 6/22/16 | | | 100 | | | 100,196 |
| Ono Finance II Plc, 10.88%, 7/15/19 (d) | USD | 150 | | | 133,500 |
| | | | | | | 308,264 |
| Luxembourg—0.2% | | | | | |
| Intelsat Jackson Holdings SA, 7.50%, | | | | | |
| 4/01/21 (d) | | 226 | | | 228,543 |
| Subsea 7 SA, Series ACY, 2.25%, | | | | | |
| 10/11/13 (e) | | 100 | | | 106,650 |
| TNK-BP Finance SA (d): | | | | | |
| 7.50%, 7/18/16 | | | 100 | | | 105,500 |
| 6.63%, 3/20/17 | | | 202 | | | 205,030 |
| | | | | | | 645,723 |
| Malaysia—0.3% | | | | | |
| Johor Corp., Series P3, 1.00%, 7/31/12 | MYR | 1,741 | | | 735,943 |
| Paka Capital Ltd., 4.67%, 3/12/13 (e)(g) | USD | 100 | | | 98,955 |
| | | | | | | 834,898 |
| Mexico—0.1% | | | | | |
| BBVA Bancomer SA, 6.50%, 3/10/21 (d) | | 165 | | | 159,019 |
| Petroleos Mexicanos, 6.00%, 3/05/20 | | 160 | | | 177,648 |
| | | | | | | 336,667 |
| Netherlands—0.3% | | | | | |
| Bio City Development Co. BV, 8.00%, | | | | | |
| 7/06/18 | | | 800 | | | 800,000 |
| Singapore—1.0% | | | | | |
| CapitaLand Ltd.: | | | | | |
| 2.10%, 11/15/16 (e) | SGD | 250 | | | 187,846 |
| 3.13%, 3/05/18 | | | 750 | | | 585,993 |
| 2.95%, 6/20/22 | | | 750 | | | 530,170 |
| Keppel Land Ltd., 2.50%, 6/23/13 (e) | | 200 | | | 153,232 |
| Olam International Ltd., 6.00%, | | | | | |
| 10/15/16 (e) | USD | 400 | | | 419,000 |
| Wilmar International Ltd., 4.08%, | | | | | |
| 12/18/12 (e)(g) | | 200 | | | 238,000 |
| Yanlord Land Group Ltd., 9.50%, | | | | | |
| 5/04/17 (d) | | 130 | | | 100,425 |
| Ying Li International Real Estate Ltd., | | | | | |
| 4.00%, 3/03/15 | | SGD | 750 | | | 491,500 |
| | | | | | | 2,706,166 |
See Notes to Financial Statements.
| 42 | BLACKROCK SERIES FUND, INC. | DECEMBER 31, 2011 |
| BlackRock Global Allocation Portfolio | |
| Consolidated Schedule of Investments (continued) | (Percentages shown are based on Net Assets) |
| Corporate Bonds | | Par
(000) | | Value |
| South Korea—0.5% | | | | | |
| Hyundai Capital Services, Inc., 4.38%, | | | | | |
| 7/27/16 (d) | USD | 200 | | $ | 203,972 |
| Hyundai Motor Manufacturing Czech sro, | | | | | |
| 4.50%, 4/15/15 (d) | | 100 | | | 102,389 |
| Korea Electric Power Corp.: | | | | | |
| 5.13%, 4/23/34 | | | 66 | | | 69,066 |
| 7.95%, 4/01/96 (h) | | 61 | | | 44,426 |
| Zeus Cayman, 2.38%, 8/19/13 (e)(g) | JPY | 42,000 | | | 539,542 |
| Zeus Cayman II, 1.34%, 8/18/16 (e)(g) | | 28,000 | | | 344,398 |
| | | | | | | 1,303,793 |
| Switzerland—0.1% | | | | | |
| Credit Suisse/Nassau, 10.25%, 7/17/22 | IDR | 1,418,390 | | | 208,411 |
| United Arab Emirates—0.4% | | | | | |
| Dana Gas Sukuk Ltd., 7.50%, 10/31/12 | USD | 1,220 | | | 981,033 |
| Pyrus Ltd., 7.50%, 12/20/15 (d) | | 200 | | | 187,500 |
| | | | | | | 1,168,533 |
| United Kingdom—0.3% | | | | | |
| Anglo American Plc, Series AAL, 4.00%, | | | | | |
| 5/07/14 (e) | | 100 | | | 141,550 |
| Essar Energy Plc, 4.25%, 2/01/16 | | 200 | | | 120,000 |
| Lloyds TSB Bank Plc, 13.00% (a)(f)(i) | GBP | 355 | | | 584,394 |
| Petropavlovsk 2010 Ltd., 4.00%, | | | | | |
| 2/18/15 (e) | USD | 100 | | | 84,750 |
| | | | | | | 930,694 |
| United States—1.8% | | | | | |
| 3D Systems Corp., 5.50%, 12/15/16 (d) | | 145 | | | 135,082 |
| Advanced Micro Devices, Inc., 6.00%, | | | | | |
| 5/01/15 (e) | | 164 | | | 160,105 |
| Ally Financial, Inc., 4.50%, 2/11/14 | | 127 | | | 122,555 |
| Amylin Pharmaceuticals, Inc., 3.00%, | | | | | |
| 6/15/14 (e) | | 182 | | | 161,980 |
| Building Materials Corp. of America, 6.88%, | | | | | |
| 8/15/18 (d) | | 38 | | | 39,900 |
| Calpine Corp. (d): | | | | | |
| 7.88%, 7/31/20 | | | 61 | | | 65,728 |
| 7.50%, 2/15/21 | | | 25 | | | 26,750 |
| Capsugel Finance Co. SCA, 9.88%, | | | | | |
| 8/01/19 (d) | EUR | 100 | | | 130,719 |
| CF Industries, Inc., 7.13%, 5/01/20 | USD | 87 | | | 102,878 |
| Consol Energy, Inc., 8.00%, 4/01/17 | | 295 | | | 323,025 |
| Crown Cork & Seal Co., Inc., 7.50%, | | | | | |
| 12/15/96 | | | 82 | | | 67,240 |
| DaVita, Inc.: | | | | | |
| 6.38%, 11/01/18 | | | 218 | | | 223,177 |
| 6.63%, 11/01/20 | | | 50 | | | 51,375 |
| DJO Finance LLC, 9.75%, 10/15/17 | | 12 | | | 9,330 |
| EH Holding Corp. (d): | | | | | |
| 6.50%, 6/15/19 | | | 202 | | | 210,585 |
| 7.63%, 6/15/21 | | | 58 | | | 60,900 |
| Electronic Arts, Inc., 0.75%, 7/15/16 (d)(e) | | 227 | | | 220,474 |
| Ford Motor Credit Co. LLC, 7.00%, 4/15/15 | | 100 | | | 107,500 |
| Gilead Sciences, Inc., Series B, 0.63%, | | | | | |
| 5/01/13 (e) | | 290 | | | 335,312 |
| The Hertz Corp., 7.50%, 10/15/18 | | 16 | | | 16,720 |
| Hologic, Inc., 2.00%, 12/15/37 (e)(j) | | 480 | | | 525,000 |
| HSBC Finance Corp., 6.68%, 1/15/21 | | 45 | | | 46,548 |
| Linn Energy LLC, 7.75%, 2/01/21 | | 146 | | | 151,840 |
| Morgan Stanley, 3.80%, 4/29/16 | | 178 | | | 163,994 |
| Mylan, Inc., 3.75%, 9/15/15 (e) | | 265 | | | 462,756 |
| NRG Energy, Inc., 8.25%, 9/01/20 | | 41 | | | 41,205 |
| | | | Par | | |
| Corporate Bonds | | (000) | | Value |
| United States (concluded) | | | | | |
| Phibro Animal Health Corp., 9.25%, | | | | | |
| 7/01/18 (d) | USD | 18 | | $ | 15,615 |
| Reliance Holdings USA, Inc., 4.50%, | | | | | |
| 10/19/20 (d) | | 250 | | | 227,151 |
| SM Energy Co., 3.50%, 4/01/27 (e) | | 148 | | | 202,020 |
| SunGard Data Systems, Inc., 7.38%, | | | | | |
| 11/15/18 | | | 174 | | | 178,132 |
| Take-Two Interactive Software, Inc. (e): | | | | | |
| 4.38%, 6/01/14 | | | 5 | | | 7,188 |
| 1.75%, 12/01/16 (d) | | 126 | | | 122,377 |
| Texas Industries, Inc., 9.25%, 8/15/20 | | 237 | | | 212,115 |
| Valeant Pharmaceuticals International, | | | | | |
| 6.75%, 10/01/17 (d) | | 58 | | | 57,928 |
| | | | | | | 4,985,204 |
| Total Corporate Bonds—6.2% | | | | | 16,828,957 |
| |
| |
| Floating Rate Loan Interests (k) | | | | | |
| Mexico—0.1% | | | | | |
| Financiera URBI, SA, Term Loan, 3.53%, | | | | | |
| 4/12/12 | | | 230,000 | | | 227,700 |
| United States—0.2% | | | | | |
| Obsidian Natural Gas Trust, Term Loan, | | | | | |
| 7.00%, 11/02/15 | | | 342,103 | | | 340,392 |
| Vodafone Americas Finance 2, Inc., Term | | | | | |
| Loan, 6.25%, 7/11/16 | | 242,964 | | | 241,142 |
| | | | | | | 581,534 |
| Total Floating Rate Loan Interests—0.3% | | | | 809,234 |
| |
| |
| Foreign Agency Obligations | | | | | |
| Australia Government Bond: | | | | | |
| 4.75%, 11/15/12 | | AUD | 941 | | | 972,811 |
| 5.50%, 12/15/13 | | | 794 | | | 847,787 |
| 5.75%, 5/15/21 | | | 1,250 | | | 1,486,921 |
| Series 123, 5.75%, 4/15/12 | | 941 | | | 967,287 |
| Brazil Notas do Tesouro Nacional: | | | | | |
| Series B, 6.00%, 5/15/15 | BRL | 360 | | | 419,331 |
| Series F, 10.00%, 1/01/17 | | 3,757 | | | 1,826,916 |
| Series F, 10.00%, 1/01/21 | | 3,843 | | | 1,807,429 |
| Bundesrepublik Deutschland: | | | | | |
| 4.25%, 7/04/17 | | EUR | 2,109 | | | 3,207,027 |
| 3.50%, 7/04/19 | | | 1,695 | | | 2,508,793 |
| Canadian Government Bond: | | | | | |
| 4.00%, 6/01/16 | | CAD | 344 | | | 377,514 |
| 3.50%, 6/01/20 | | | 386 | | | 427,644 |
| Hong Kong Government Bond: | | | | | |
| 4.13%, 2/22/13 | | HKD | 1,750 | | | 235,320 |
| 2.03%, 3/18/13 | | | 5,650 | | | 742,685 |
| 1.67%, 3/24/14 | | | 1,250 | | | 165,500 |
| 3.51%, 12/08/14 | | | 2,900 | | | 405,798 |
| 1.69%, 12/22/14 | | | 1,450 | | | 192,762 |
| Malaysia Government Bond, Series 0108, | | | | | |
| 3.46%, 7/31/13 | | MYR | 1,095 | | | 348,240 |
| Poland Government Bond, 3.00%, | | | | | |
| 8/24/16 | | PLN | 625 | | | 236,741 |
| United Kingdom Gilt: | | | | | |
| 4.00%, 9/07/16 | | GBP | 259 | | | 460,277 |
| 4.75%, 3/07/20 | | | 1,863 | | | 3,576,786 |
| 4.25%, 12/07/40 | | | 518 | | | 989,518 |
| Total Foreign Agency Obligations—8.1% | | | | 22,203,087 |
See Notes to Financial Statements.
| BLACKROCK SERIES FUND, INC. | DECEMBER 31, 2011 | 43 |
| BlackRock Global Allocation Portfolio | |
| Consolidated Schedule of Investments (continued) | (Percentages shown are based on Net Assets) |
| Non-Agency Mortgage-Backed Securities | Par
(000) | | Value |
| Commercial Mortgage-Backed Securities—0.1% | | | | |
| Banc of America Large Loan, Inc., | | | | | |
| Series 2010-HLTN, Class HLTN, 2.03%, | | | | | |
| 11/15/15 (d)(k) | USD | 272 | | $ | 246,207 |
| Total Non-Agency Mortgage-Backed Securities—0.1% | | 246,207 |
| |
| |
| US Treasury Obligations | | | | | |
| US Treasury Notes: | | | | | |
| 0.63%, 7/31/12 | | | 1,030 | | | 1,033,586 |
| 2.25%, 1/31/15 | | | 2,081 | | | 2,198,324 |
| 2.38%, 2/28/15 (l) | | 2,111 | | | 2,239,486 |
| 2.50%, 3/31/15 | | | 2,574 | | | 2,744,528 |
| 2.25%, 3/31/16 | | | 2,863 | | | 3,053,260 |
| 1.38%, 9/30/18 | | | 1,526 | | | 1,534,629 |
| 1.75%, 10/31/18 | | | 184 | | | 189,479 |
| 3.50%, 5/15/20 (l) | | 4,797 | | | 5,517,850 |
| 2.63%, 8/15/20 | | | 3,571 | | | 3,851,057 |
| Total US Treasury Obligations—8.2% | | | | 22,362,199 |
| Total Fixed Income Securities—22.9% | | | | 62,449,684 |
| |
| |
| Investment Companies | | Shares | | |
| United States—2.2% | | | | | |
| ETFS Gold Trust (a) | | 7,617 | | | 1,180,102 |
| ETFS Palladium Trust (a) | | 2,578 | | | 166,461 |
| ETFS Platinum Trust (a) | | 2,291 | | | 315,746 |
| iShares Gold Trust (a)(m) | | 66,631 | | | 1,014,790 |
| iShares Silver Trust (a)(m) | | 2,485 | | | 66,946 |
| SPDR Gold Shares (a) | | 20,881 | | | 3,173,703 |
| | | | | | | 5,917,748 |
| Vietnam—0.0% | | | | | |
| Vietnam Enterprise Investments Ltd., | | | | | |
| R Shares (a) | | 17,258 | | | 34,516 |
| Vinaland Ltd. (a) | | 85,819 | | | 57,284 |
| | | | | | | 91,800 |
| Total Investment Companies—2.2% | | | | | 6,009,548 |
| |
| |
| Preferred Securities | | Par
(000) | | |
| Capital Trusts | | | | | |
| Switzerland—0.1% | | | | | |
| Credit Suisse Group Guernsey I Ltd., 7.88%, | | | | | |
| 2/24/41 (k) | USD | 174 | | | 156,078 |
| United States—0.0% | | | | | |
| BAC Capital Trust XI, 6.63%, 5/23/36 | | 39 | | | 34,205 |
| Deutsche Bank Capital Funding Trust, | | | | | |
| 5.63% (d)(i)(k) | | 39 | | | 27,885 |
| JPMorgan Chase Capital XXV, Series Y, | | | | | |
| 6.80%, 10/01/37 | | | 25 | | | 25,094 |
| | | | | | | 87,184 |
| Total Capital Trusts—0.1% | | | | | 243,262 |
| Preferred Stocks | | Shares | | Value |
| Switzerland—0.0% | | | | | |
| UBS AG, 9.38% | | 8,677 | | $ | 118,658 |
| United Kingdom—0.1% | | | | | |
| HSBC Holdings Plc, 8.00% | | 6,606 | | | 172,152 |
| United States—0.7% | | | | | |
| Bunge, Ltd., 4.88% (e) | | 230 | | | 21,620 |
| Chesapeake Energy Corp., 5.75% (d)(e) | | 602 | | | 589,960 |
| Crown Castle International Corp., 6.25% | | 1,310 | | | 80,729 |
| General Motors Co., 4.75% (e) | | 8,083 | | | 276,843 |
| Health Care Reit, Inc., 6.50% (e) | | 3,386 | | | 173,262 |
| PPL Corp. (e): | | | | | |
| 8.75%, | | 4 | | | 222,538 |
| 9.50%, | | 4 | | | 203,629 |
| SandRidge Energy, Inc., 6.50% | | 1,624 | | | 193,459 |
| Wells Fargo & Co., Series L, 7.50% (e) | | 125 | | | 131,750 |
| | | | | | 1,893,790 |
| Total Preferred Stocks—0.8% | | | | | 2,184,600 |
| |
| |
| Trust Preferreds | | | | | |
| United States—0.2% | | | | | |
| Citigroup Capital XIII, 7.88%, 10/30/40 (i) | | 7,251 | | | 186,582 |
| GMAC Capital Trust I, Series 2, 8.13%, | | | | | |
| 2/15/40 (i) | | 15,282 | | | 291,587 |
| Omnicare Capital, 4.00%, 6/15/33 (i) | | 2,166 | | | 97,971 |
| Wachovia Capital Trust IV, 6.38%, 3/01/67 | | 750 | | | 18,848 |
| Total Trust Preferreds—0.2% | | | | | 594,988 |
| Total Preferred Securities—1.1% | | | | | 3,022,850 |
| |
| |
| Warrants (n) | | | | | |
| Australia—0.0% | | | | | |
| TFS Corp., Ltd. (Expires 7/15/18) | | 124,320 | | | — |
| Canada—0.0% | | | | | |
| Kinross Gold Corp. (Expires 9/13/13) | | 3,427 | | | 3,229 |
| United States—0.0% | | | | | |
| Ford Motor Co. (Expires 1/01/13) | | 15,447 | | | 37,073 |
| Total Warrants—0.0% | | | | | 40,302 |
| Total Long-Term Investments | | | | | |
| (Cost—$263,340,567)—89.2% | | | | | 243,107,445 |
| |
| |
| Short-Term Securities | | | | | |
| Foreign Agency Obligations | | Par
(000) | | |
| Bank Negara Malaysia Monetary | | | | | |
| Notes (o): | | | | | |
| Series 5711, 2.81%, 3/01/12 | MYR | 957 | | | 300,491 |
| Series 5611, 2.82%, 4/03/12 | | 1,829 | | | 572,771 |
| Japan Treasury Discount Bill (o): | | | | | |
| Series 220, 0.10%, 3/09/12 | JPY | 70,000 | | | 909,286 |
| Series 235, 0.10%, 5/14/12 | | 50,000 | | | 649,373 |
| Malaysia Government Bond, Series 0109, | | | | | |
| 2.51%, 8/27/12 | MYR | 2,844 | | | 894,734 |
| Mexico Cetes, 4.40%, 2/09/12 (o) | MXN | 7,122 | | | 507,978 |
| Singapore Treasury Bill, Series 91, 0.31%, | | | | | |
| 2/02/12 (o) | SGD | 676 | | | 521,027 |
| Total Foreign Agency Obligations—1.6% | | | | 4,355,660 |
See Notes to Financial Statements.
| 44 | BLACKROCK SERIES FUND, INC. | DECEMBER 31, 2011 |
| BlackRock Global Allocation Portfolio | |
| Consolidated Schedule of Investments (continued) | (Percentages shown are based on Net Assets) |
| Money Market Funds | | Shares | | Value |
| |
| BlackRock Liquidity Funds, TempFund, | | | | | |
| Institutional Class, 0.10%, (m)(p) | | 140,603 | | $ | 140,603 |
| |
| | | Beneficial
Interest
(000) | | |
| BlackRock Liquidity Series, LLC Money | | | | | |
| Market Series, 0.22% (m)(p)(q) | USD | 155 | | | 155,028 |
| Total Money Market Funds—0.1% | | | | | 295,631 |
| |
| |
| Time Deposits | | Par
(000) | | |
| Australia—0.0% | | | | | |
| JPMorgan Chase, New York, 2.98% | AUD | 68 | | | 69,150 |
| Canada—0.1% | | | | | |
| Brown Brothers Harriman & Co., 0.17% | CAD | 92 | | | 89,865 |
| South Africa—0.0% | | | | | |
| Brown Brothers Harriman & Co., 4.49% | ZAR | 40 | | | 4,984 |
| Total Time Deposits—0.1% | | | | | 163,999 |
| |
| |
| US Treasury Obligations | | | | | |
| US Treasury Bills (o): | | | | | |
| 0.01%, 2/09/12 | USD | 3,025 | | | 3,024,955 |
| 0.01%, 2/16/12 | | 425 | | | 424,994 |
| 0.02%, 2/23/12 | | 705 | | | 704,984 |
| 0.01%, 3/01/12 | | 3,550 | | | 3,549,896 |
| 0.04%, 3/08/12 | | 1,900 | | | 1,899,932 |
| 0.03%, 3/15/12 | | 1,900 | | | 1,899,924 |
| 0.02%, 3/22/12 | | 2,275 | | | 2,274,913 |
| 0.02%, 3/29/12 | | 420 | | | 419,980 |
| 0.03%, 4/12/12 | | 4,400 | | | 4,399,784 |
| 0.02%, 5/17/12 | | 1,700 | | | 1,699,777 |
| 0.03%, 5/24/12 | | 1,800 | | | 1,799,734 |
| 0.04%, 5/31/12 | | 900 | | | 899,851 |
| 0.05%, 6/28/12 | | 750 | | | 749,779 |
| Total US Treasury Obligations—8.7% | | | | | 23,748,503 |
| Total Short-Term Securities | | | | | |
| (Cost—$28,721,468)—10.5% | | | | | 28,563,793 |
| |
| |
| Options Purchased | | Contracts | | |
| Exchange-Traded Call Options—0.1% | | | | | |
| Quicksilver Resources, Inc., Strike Price | | | | | |
| USD 9, Expires 3/17/12 | | 70 | | | 1,400 |
| S&P 500 Index: | | | | | |
| Strike Price USD 1,265, Expires 2/18/12 | | 41 | | | 141,245 |
| Strike Price USD 1,350, Expires 2/18/12 | | 17 | | | 8,500 |
| SPDR Financial Select Sector, Strike Price | | | | | |
| USD 14, Expires 1/21/12 | | 14 | | | 91 |
| | | | | | 151,236 |
| Exchange-Traded Put Options—0.0% | | | | | |
| ConocoPhillips, Strike Price USD 70, | | | | | |
| Expires 5/19/12 | | 74 | | | 28,675 |
| S&P 500 Index: | | | | | |
| Strike Price USD 1,015, Expires 1/21/12 | | 7 | | | 105 |
| Strike Price USD 1,165, Expires 1/21/12 | | 7 | | | 3,010 |
| SPDR Gold Trust, Strike Price USD 125, | | | | | |
| Expires 1/21/12 | | 37 | | | 148 |
| | | | | | 31,938 |
| Options Purchased | Contracts | | Value |
| Over-the-Counter Call Options—0.0% | | | | |
| Deutsche Borse AG German Stock Index, | | | | |
| Strike Price USD 3,319.87, Expires | | | | |
| 9/21/12, Broker Goldman Sachs | | | | |
| International | 112 | | $ | 28,422 |
| MSCI Europe Excluding United Kingdom Index: | | | | |
| Strike Price USD 99.43, Expires | | | | |
| 7/12/12, Broker Credit Suisse | | | | |
| International | 10,020 | | | 9,763 |
| Strike Price USD 104.71, Expires | | | | |
| 6/15/12, Broker Goldman Sachs | | | | |
| Bank USA | 7,234 | | | 2,460 |
| Strike Price USD 102.90, Expires | | | | |
| 6/15/12, Broker Deutsche Bank AG | 3,381 | | | 1,312 |
| Strike Price USD 86.70, Expires | | | | |
| 9/21/12, Broker JPMorgan Chase | | | | |
| Bank NA | 4,701 | | | 29,238 |
| S&P 500 Index: | | | | |
| Strike Price USD 1,373.88, Expires | | | | |
| 2/10/12, Broker JPMorgan Chase | | | | |
| Bank NA | 949 | | | 1,443 |
| Strike Price USD 1,355, Expires 2/24/12, | | | | |
| Broker Bank of America NA | 259 | | | 1,455 |
| Strike Price USD 1,282, Expires 2/24/12, | | | | |
| Broker Bank of America NA | 156 | | | 6,171 |
| Taiwan Taiex Index: | | | | |
| Strike Price USD 8,807.55, Expires | | | | |
| 9/18/13, Broker Credit Suisse | | | | |
| International | 494 | | | 3,053 |
| Strike Price USD 8,807.55, Expires | | | | |
| 6/19/13, Broker Credit Suisse | | | | |
| International | 988 | | | 7,232 |
| Strike Price USD 8,646.24, Expires | | | | |
| 9/18/13, Broker Credit Suisse | | | | |
| International | 828 | | | 3,933 |
| Strike Price USD 8,646.11, Expires | | | | |
| 12/18/13, Broker JPMorgan Chase | | | | |
| Bank NA | 1,653 | | | 10,607 |
| Strike Price USD 9,041.74, Expires | | | | |
| 9/19/12, Broker JPMorgan Chase | | | | |
| Bank NA | 985 | | | 1,445 |
| Strike Price USD 9,047.46, Expires | | | | |
| 9/19/12, Broker Citibank NA | 1,482 | | | 2,171 |
| Strike Price USD 8,818.93, Expires | | | | |
| 3/20/13, Broker Citibank NA | 1,003 | | | 4,956 |
| Tokyo Stock Price Index: | | | | |
| Strike Price JPY 825, Expires 6/08/12, | | | | |
| Broker Morgan Stanley International | 89,908 | | | 5,362 |
| Strike Price JPY 825.55, Expires | | | | |
| 6/08/12, Broker Deutsche Bank AG | 92,263 | | | 5,109 |
| | | | | 124,132 |
| Over-the-Counter Put Options—0.1% | | | | |
| Russell 2000 Index: | | | | |
| Strike Price USD 711.04, Expires | | | | |
| 6/12/12, Broker Credit Suisse | | | | |
| International | 620 | | | 41,633 |
| Strike Price USD 716.06, Expires | | | | |
| 9/13/12, Broker Bank of America NA | 734 | | | 53,955 |
| Strike Price USD 701.68, Expires | | | | |
| 5/18/12, Broker Morgan Stanley | | | | |
| International | 374 | | | 17,075 |
| Strike Price USD 641.52, Expires | | | | |
| 3/16/12, Broker Goldman Sachs | | | | |
| International | 828 | | | 12,478 |
See Notes to Financial Statements.
| BLACKROCK SERIES FUND, INC. | DECEMBER 31, 2011 | 45 |
| BlackRock Global Allocation Portfolio | |
| Consolidated Schedule of Investments (continued) | (Percentages shown are based on Net Assets) |
| Options Purchased | Contracts | | Value |
| Over-the-Counter Put Options (concluded) | | | | | |
| Russell 2000 Index (concluded): | | | | | |
| Strike Price USD 703.15, Expires | | | | | |
| 4/20/12, Broker Goldman Sachs | | | | | |
| International | 450 | | $ | 17,725 | |
| S&P/ASX 200 Index, Strike Price | | | | | |
| AUD 3,969.10, Expires 2/16/12, | | | | | |
| Broker JPMorgan Chase Bank NA | 218 | | | 20,613 | |
| | | | | 163,479 | |
| Total Options Purchased | | | | | |
| (Cost—$1,024,791)—0.2% | | | | 470,785 | |
| Total Investments Before Structured Options | | | | | |
| and Options Written | | | | | |
| (Cost—$293,086,826)—99.9% | | | | 272,142,023 | |
| |
| |
| Over-the-Counter Structured Options | Units | | | | |
| S&P 500 Index, Initial Reference | | | | | |
| Strike Price 1,300.35, One written | | | | | |
| put strike 1,131.30, One call | | | | | |
| strike 1,379.67, Expires 3/16/12, | | | | | |
| Broker JPMorgan Chase Bank NA | 874 | | | (12,525 | ) |
| Taiwan Taiex Index: | | | | | |
| Initial Reference Strike Price 8,775.89, | | | | | |
| One written put strike 7,345.42, | | | | | |
| 1.45 calls strike 8,775.89, | | | | | |
| Expires 12/19/12, Broker Citibank NA | 1,073 | | | (35,825 | ) |
| Initial Reference Strike Price | | | | | |
| TWD 8,571.82, One written put | | | | | |
| strike USD 243.41, One call strike | | | | | |
| USD 290.81, Expires 12/19/12, | | | | | |
| Broker Citibank NA | 1,080 | | | (30,966 | ) |
| Total Over-the-Counter Structured Options | | | | | |
| (Cost $0)—0.0% | | | | (79,316 | ) |
| |
| |
| Options Written | Contracts | | | | |
| Exchange-Traded Call Options—(0.2)% | | | | | |
| ACE Ltd., Strike Price USD 75, | | | | | |
| Expires 1/21/12 | 20 | | | (100 | ) |
| Activision Blizzard, Inc., Strike Price | | | | | |
| USD 12.50, Expires 1/19/13 | 65 | | | (9,068 | ) |
| AES Corp.: | | | | | |
| Strike Price USD 11, Expires 1/21/12 | 21 | | | (1,890 | ) |
| Strike Price USD 12, Expires 2/18/12 | 23 | | | (920 | ) |
| American Eagle Outfitters, Strike Price | | | | | |
| USD 17, Expires 1/19/13 | 133 | | | (18,620 | ) |
| Apple, Inc., Strike Price USD 450, | | | | | |
| Expires 1/19/13 | 16 | | | (63,360 | ) |
| Calpine Corp., Strike Price USD 15, | | | | | |
| Expires 1/21/12 | 19 | | | (2,660 | ) |
| Cisco Systems, Inc., Strike Price USD 20, | | | | | |
| Expires 1/19/13 | 55 | | | (8,580 | ) |
| Colgate Palmolive Co., Strike Price USD 92.50, | | | | | |
| Expires 1/21/12 | 20 | | | (2,510 | ) |
| Corning, Inc.: | | | | | |
| Strike Price USD 15, Expires 1/19/13 | 59 | | | (7,523 | ) |
| Strike Price USD 17.50, Expires 1/19/13 | 297 | | | (18,711 | ) |
| Dell, Inc., Strike Price USD 15, | | | | | |
| Expires 1/19/13 | 32 | | | (6,464 | ) |
| El Paso Corp., Strike Price USD 19, | | | | | |
| Expires 1/21/12 | 31 | | | (23,560 | ) |
| Options Written | Contracts | | Value |
| Exchange-Traded Call Options (concluded) | | | | | |
| EMC Corp., Strike Price USD 25, | | | | | |
| Expires 1/19/13 | 41 | | $ | (5,966 | ) |
| EOG Resources, Inc., Strike Price USD 100, | | | | | |
| Expires 1/21/12 | 21 | | | (5,450 | ) |
| General Mills, Inc., Strike Price USD 42, | | | | | |
| Expires 4/21/12 | 48 | | | (2,856 | ) |
| Google, Inc., Class A, Strike Price USD 590, | | | | | |
| Expires 1/19/13 | 5 | | | (56,125 | ) |
| International Business Machines Corp., | | | | | |
| Strike Price USD 200, Expires 1/19/13 | 14 | | | (14,210 | ) |
| MasterCard, Inc., Class A, Strike Price | | | | | |
| USD 435, Expires 7/21/12 | 4 | | | (5,110 | ) |
| NetApp, Inc., Strike Price USD 42, | | | | | |
| Expires 1/19/13 | 78 | | | (27,885 | ) |
| NRG Energy, Inc.: | | | | | |
| Strike Price USD 24, Expires 1/21/12 | 15 | | | (37 | ) |
| Strike Price USD 24, Expires 3/17/12 | 11 | | | (55 | ) |
| Oracle Corp., Strike Price USD 30, | | | | | |
| Expires 1/19/13 | 113 | | | (21,527 | ) |
| Polycom, Inc., Strike Price USD 32.50, | | | | | |
| Expires 1/21/12 | 35 | | | (87 | ) |
| QUALCOMM, Inc., Strike Price USD 65, | | | | | |
| Expires 4/21/12 | 25 | | | (1,187 | ) |
| SanDisk Corp.: | | | | | |
| Strike Price USD 50, Expires 1/19/13 | 40 | | | (33,300 | ) |
| Strike Price USD 50, Expires 1/21/12 | 5 | | | (692 | ) |
| Sara Lee Corp., Strike Price USD 19, | | | | | |
| Expires 1/21/12 | 292 | | | (8,760 | ) |
| Seagate Technology: | | | | | |
| Strike Price USD 17.50, Expires 1/19/13 | 40 | | | (9,780 | ) |
| Strike Price USD 17.50, Expires 1/21/12 | 48 | | | (1,776 | ) |
| Southern Co., Strike Price USD 42, | | | | | |
| Expires 1/21/12 | 8 | | | (3,500 | ) |
| Symantec Corp., Strike Price USD 17.50, | | | | | |
| Expires 1/21/12 | 67 | | | (301 | ) |
| United Technologies Corp., Strike Price | | | | | |
| USD 80, Expires 1/21/12 | 22 | | | (99 | ) |
| Valeant Pharmaceuticals International, Inc., | | | | | |
| Strike Price USD 50, Expires 1/19/13 | 16 | | | (12,080 | ) |
| Vertex Pharmaceuticals, Inc.: | | | | | |
| Strike Price USD 40, Expires 1/19/13 | 42 | | | (19,110 | ) |
| Strike Price USD 35, Expires 7/21/12 | 46 | | | (20,010 | ) |
| Whiting Petroleum Corp., Strike Price | | | | | |
| USD 55, Expires 1/21/12 | 29 | | | (290 | ) |
| | | | | (414,159 | ) |
| Exchange-Traded Put Options—0.0% | | | | | |
| CME Group, Inc., Strike Price USD 250, | | | | | |
| Expires 1/21/12 | 2 | | | (1,990 | ) |
| ConocoPhillips, Strike Price USD 55, | | | | | |
| Expires 5/19/12 | 74 | | | (5,994 | ) |
| Quicksilver Resources, Inc., Strike | | | | | |
| Price USD 6, Expires 3/17/12 | 70 | | | (3,150 | ) |
| S&P 500 Index, Strike Price USD 1,090, | | | | | |
| Expires 1/21/12 | 14 | | | (1,400 | ) |
| SPDR Financial Select Sector, Strike | | | | | |
| Price USD 12, Expires 1/21/12 | 14 | | | (147 | ) |
| SPDR Gold Trust, Strike Price USD 105, | | | | | |
| Expires 1/21/12 | 35 | | | (53 | ) |
| Time Warner Cable, Strike Price USD 60, | | | | | |
| Expires 1/21/12 | 13 | | | (650 | ) |
| | | | | (13,384 | ) |
See Notes to Financial Statements.
| 46 | BLACKROCK SERIES FUND, INC. | DECEMBER 31, 2011 |
| BlackRock Global Allocation Portfolio | |
| Consolidated Schedule of Investments (continued) | (Percentages shown are based on Net Assets) |
| Options Written | Contracts | | Value |
| Over-the-Counter Call Options—0.0% | | | | | |
| American Eagle Outfitters, Strike Price | | | | | |
| USD 16, Expires 1/18/13, Broker | | | | | |
| Morgan Stanley & Co. | 4,884 | | $ | (8,220 | ) |
| Beiersdorf AG, Strike Price EUR 48, Expires | | | | | |
| 3/16/12, Broker Deutsche Bank AG | 579 | | | (155 | ) |
| China Unicom (Hong Kong) Ltd.: | | | | | |
| Strike Price HKD 18.76, Expires | | | | | |
| 1/31/12, Broker Citibank NA | 20,809 | | | (74 | ) |
| Strike Price HKD 18.75, Expires | | | | | |
| 2/28/12, Broker Citibank NA | 27,858 | | | (438 | ) |
| MSCI Europe Excluding United Kingdom | | | | | |
| Index, Strike Price USD 113.85, | | | | | |
| Expires 7/12/12, Broker Credit | | | | | |
| Suisse International | 10,020 | | | (514 | ) |
| PG&E Corp., Strike Price USD 43, Expires | | | | | |
| 1/20/12, Broker Deutsche Bank AG | 595 | | | (168 | ) |
| Russell 2000 Index: | | | | | |
| Strike Price USD 804.63, | | | | | |
| Expires 6/12/12, Broker Credit | | | | | |
| Suisse International | 620 | | | (11,682 | ) |
| Strike Price USD 833.69, | | | | | |
| Expires 9/13/12, Broker Bank | | | | | |
| of America NA | 734 | | | (26,207 | ) |
| Strike Price USD 771.17, | | | | | |
| Expires 4/20/12, Broker Goldman | | | | | |
| Sachs International | 450 | | | (15,543 | ) |
| Strike Price USD 786.96, | | | | | |
| Expires 5/18/12, Broker Morgan | | | | | |
| Stanley International | 374 | | | (12,601 | ) |
| Strike Price USD 748.89, | | | | | |
| Expires 3/16/12, Broker Goldman | | | | | |
| Sachs International | 828 | | | (30,620 | ) |
| Unilever NV CVA, Strike Price EUR 26, | | | | | |
| Expires 6/15/12, Broker Morgan | | | | | |
| Stanley International | 6,287 | | | (12,504 | ) |
| | | | | (118,726 | ) |
| Over-the-Counter Put Options—(0.3)% | | | | | |
| American Eagle Outfitters: | | | | | |
| Strike Price USD 12, Expires 3/16/12, | | | | | |
| Broker Bank of America NA | 19,393 | | | (1,301 | ) |
| Strike Price USD 11.75, Expires | | | | | |
| 3/16/12, Broker Bank of America NA | 7,733 | | | (376 | ) |
| Beiersdorf AG, Strike Price EUR 38, | | | | | |
| Expires 1/20/12, Broker JPMorgan | | | | | |
| Chase Bank NA | 1,512 | | | (1 | ) |
| Deutsche Borse AG German Stock | | | | | |
| Index, Strike Price USD 3,003.69, | | | | | |
| Expires 9/21/12, Broker Goldman | | | | | |
| Sachs International | 80 | | | (18,169 | ) |
| MSCI Europe Excluding United Kingdom Index: | | | | | |
| Strike Price USD 99.84, Expires 6/15/12, | | | | | |
| Broker Goldman Sachs Bank USA | 7,234 | | | (118,493 | ) |
| Strike Price USD 98.12, Expires 6/15/12, | | | | | |
| Broker Deutsche Bank AG | 3,381 | | | (48,352 | ) |
| Strike Price USD 92.97, Expires 7/12/12, | | | | | |
| Broker Credit Suisse International | 10,020 | | | (113,719 | ) |
| Strike Price USD 78.44, Expires 9/21/12, | | | | | |
| Broker JPMorgan Chase Bank NA | 3,220 | | | (17,966 | ) |
| Russell 2000 Index: | | | | | |
| Strike Price USD 540.23, Expires 3/16/12, | | | | | |
| Broker Goldman Sachs International | 828 | | | (3,444 | ) |
| Options Written | | Contracts | | Value |
| Over-the-Counter Put Options (concluded) | | | | | |
| Russell 2000 Index (concluded): | | | | | | |
| Strike Price USD 616.72, Expires 6/12/12, | | | | | |
| Broker Credit Suisse International | | 620 | | $ | (7,384 | ) |
| Strike Price USD 621.07, Expires | | | | | | |
| 9/13/12, Broker Bank of America NA | | 734 | | | (30,684 | ) |
| Strike Price USD 609.88, Expires | | | | | | |
| 4/20/12, Broker Goldman Sachs | | | | | | |
| International | | 450 | | | (7,470 | ) |
| Strike Price USD 611.72, Expires | | | | | | |
| 5/18/12, Broker Morgan Stanley | | | | | | |
| International | | 374 | | | (8,193 | ) |
| S&P 500 Index, Strike Price USD 950, | | | | | | |
| Expires 2/24/12, Broker Bank of | | | | | | |
| America NA | | 156 | | | (425 | ) |
| S&P/ASX 200 Index: | | | | | | |
| Strike Price AUD 3,342.40, Expires | | | | | | |
| 2/16/12, JPMorgan Chase Bank NA | | 109 | | | (1,421 | ) |
| Strike Price AUD 3,551.30, Expires | | | | | | |
| 2/16/12, JPMorgan Chase Bank NA | | 109 | | | (2,687 | ) |
| Taiwan Taiex Index: | | | | | | |
| Strike Price USD 7,608.62, | | | | | | |
| Expires 9/19/12, Broker JPMorgan | | | | | | |
| Chase Bank NA | | 985 | | | (39,289 | ) |
| Strike Price USD 7,758.20, | | | | | | |
| Expires 9/19/12, Broker Citibank NA | | 1,482 | | | (65,506 | ) |
| Strike Price USD 7,557.82, | | | | | | |
| Expires 3/20/13, Broker Citibank NA | | 1,003 | | | (45,318 | ) |
| Strike Price USD 6,957.96, | | | | | | |
| Expires 9/18/13, Broker Credit | | | | | | |
| Suisse International | | 494 | | | (21,884 | ) |
| Strike Price USD 7,574.49, | | | | | | |
| Expires 6/19/13, Broker Credit | | | | | | |
| Suisse International | | 988 | | | (49,222 | ) |
| Strike Price USD 7,176.38, | | | | | | |
| Expires 9/18/13, Broker Credit | | | | | | |
| Suisse International | | 502 | | | (24,758 | ) |
| Strike Price USD 7,180.59, | | | | | | |
| Expires 12/18/13, Broker JPMorgan | | | | | | |
| Chase Bank NA | | 1,002 | | | (51,631 | ) |
| Tokyo Stock Price Index: | | | | | | |
| Strike Price JPY 675.45, Expires | | | | | | |
| 6/08/12, Broker Deutsche Bank AG | | 50,694 | | | (14,621 | ) |
| Strike Price JPY 675, Expires 6/08/12, | | | | | | |
| Broker Morgan Stanley International | | 49,400 | | | (14,414 | ) |
| | | | | | (706,728 | ) |
| |
| | | Notional
Amount
(000) | | | |
| Over-the-Counter Put Swaptions—0.0% | | | | | |
| Receive a fixed rate of 3.15% and pay | | | | | | |
| a floating rate based on 3-month | | | | | | |
| LIBOR, expiring 4/30/13, Broker Morgan | | | | | | |
| Stanley & Co., Inc. | JPY | 124,318 | | | (4,616 | ) |
| Total Options Written | | | | | | |
| (Premiums Received—$1,275,307)—(0.5)% | | | | (1,257,613 | ) |
| Total Investments, Net of Structured | | | | | | |
| Options and Options Written—99.4% | | | | | 270,805,094 | |
| Other Assets Less Liabilities—0.6% | | | | | 1,747,549 | |
| Net Assets—100.0% | | | | $ | 272,552,643 | |
See Notes to Financial Statements.
| BLACKROCK SERIES FUND, INC. | DECEMBER 31, 2011 | 47 |
BlackRock Global Allocation Portfolio
Consolidated Schedule of Investments (continued)
| (a) | | Non-income producing security. |
| (b) | | All or a portion of the security has been pledged as collateral in connection with outstanding options written. |
| (c) | | Security, or a portion of security, is on loan. |
| (d) | | Security exempt from registration pursuant to Rule 144A under the Securities Act of 1933. These securities may be resold in transactions exempt from registration to qualified institutional investors. |
| (f) | | Issuer filed for bankruptcy and/or is in default of interest payments. |
| (g) | | Represents a zero-coupon bond. Rate shown reflects the current yield as of report date. |
| (h) | | Represents a step-up bond that pays an initial coupon rate for the first period and then a higher coupon rate for the following periods. Rate shown is as of report date. |
| (i) | | Security is perpetual in nature and has no stated maturity date. |
| (j) | | Represents a step-down bond that pays an initial coupon rate for the first period and then a lower coupon rate for the following periods. Rate shown is as of report date. |
| (k) | | Variable rate security. Rate shown is as of report date. |
| (l) | | All or a portion of security has been pledged as collateral in connection with open financial futures contracts. |
| (m) | | Investments in companies considered to be an affiliate of the Portfolio during the year, for purposes of Section 2(a)(3) of the Investment Company Act of 1940, as amended, were as follows: |
| Affiliate | Shares/
Beneficial
Interest
Held at
December 31,
2010 | | Shares/
Beneficial
Interest
Purchased | Shares/
Beneficial
Interest
Sold | Shares/
Beneficial
Interest
Held at
December 31,
2011 | | Value at
December 31,
2011 | Realized
Gain (Loss) | Income |
| BlackRock Liquidity Funds, TempFund, Institutional Class | 14,597 | | | 126,006 | 1 | — | | | 140,603 | | $ | 140,603 | $ | 2 | | $ | 380 |
| BlackRock Liquidity Series, LLC Money Market Series | — | | $ | 155,028 | 1 | — | | $ | 155,028 | | $ | 155,028 | | — | | $ | 1,310 |
| iShares Dow Jones US Telecommunications Sector Index Fund | 5,555 | | | 3,700 | | (9,255 | ) | | — | | | — | | — | | $ | 1,759 |
| iShares Gold Trust | — | | | 142,968 | | 76,337 | | | 66,631 | | $ | 1,014,790 | $ | 287,549 | | | — |
| iShares MSCI Brazil (Free) Index Fund | 5,780 | | | — | | (5,780 | ) | | — | | | — | $ | (16,190 | ) | $ | 1,147 |
| iShares MSCI South Korea Index Fund | — | | | 4,900 | | (4,900 | ) | | — | | | — | $ | 32,693 | | | — |
| iShares Silver Trust | 28,577 | | | — | | (26,092 | ) | | 2,485 | | $ | 66,946 | $ | 317,075 | | | — |
| 1 | | Represents net shares/beneficial interest purchased. |
| (n) | | Warrants entitle the Portfolio to purchase a predetermined number of shares of common stock and are non-income producing. The purchase price and number of shares are subject to adjustment under certain conditions until the expiration date, if any. |
| (o) | | Rates shown are discount rates or a range of discount rates paid at the time of purchase. |
| (p) | | Represents the current yield as of report date. |
| (q) | | Security was purchased with the cash collateral from loaned securities. |
| • | | Financial futures contracts purchased as of December 31, 2011 were as follows: |
| Contracts | Issue | Exchange | Expiration | Notional Value | Unrealized
Appreciation |
| 16 | CAC 40 Index | Euronext Paris | January 2012 | EUR | 506,480 | $ | 17,695 |
| 3 | DAX Index | Eurex | March 2012 | EUR | 442,500 | | 16,055 |
| Total | | | | | | $ | 33,750 |
| • | | Financial futures contracts sold as of December 31, 2011 were as follows: |
| Contracts | Issue | Exchange | Expiration | Notional Value | Unrealized
Appreciation
(Depreciation) |
| 3 | MSCI Taiwan Index | Stock Exchange of Singapore | January 2012 | USD | 76,050 | $ | 18 | |
| 2 | Nikkei 225 Index | Chicago Mercantile | March 2012 | JPY | 8,405,000 | | 1,532 | |
| 9 | S&P 500 Index | Chicago Mercantile | March 2012 | USD | 2,818,350 | | (28,024 | ) |
| 8 | DJ Euro Stoxx 50 Index | Eurex Mercantile | March 2012 | EUR | 184,640 | | (13,494 | ) |
| 25 | Russell 2000 E-Mini Index | Chicago 2012 | March | USD | 1,847,000 | | (29,099 | ) |
| Total | | | | | | $ | (69,067 | ) |
| • | | Foreign currency exchange contracts as of December 31, 2011 were as follows: |
| Currency Purchased | Currency Sold | Counterparty | Settlement Date | Unrealized
Appreciation
(Depreciation) |
| USD | 38,180 | AUD | 37,899 | Deutsche Bank Securities Inc. | 1/03/12 | $ | (584 | ) |
| USD | 22,159 | BRL | 41,459 | Brown Brothers Harriman | 1/03/12 | | (68 | ) |
| USD | 26,241 | CAD | 26,860 | Deutsche Bank Securities Inc. | 1/03/12 | | (125 | ) |
| USD | 51,521 | CHF | 48,667 | Brown Brothers Harriman | 1/03/12 | | (292 | ) |
| USD | 127,393 | EUR | 98,804 | Credit Suisse Securities (USA) LLC | 1/03/12 | | (484 | ) |
| USD | 74,852 | GBP | 48,544 | Brown Brothers Harriman | 1/03/12 | | (536 | ) |
| USD | 14,028 | INR | 746,967 | Brown Brothers Harriman | 1/03/12 | | (38 | ) |
| USD | 64,730 | KRW | 74,688,654 | Brown Brothers Harriman | 1/03/12 | | (104 | ) |
| USD | 15,933 | MYR | 50,547 | Brown Brothers Harriman | 1/03/12 | | (13 | ) |
| USD | 7,707 | NOK | 46,421 | Goldman Sachs & Co. | 1/03/12 | | (55 | ) |
| USD | 30,725 | SGD | 40,050 | Brown Brothers Harriman | 1/03/12 | | (153 | ) |
See Notes to Financial Statements.
| 48 | BLACKROCK SERIES FUND, INC. | DECEMBER 31, 2011 |
BlackRock Global Allocation Portfolio
Consolidated Schedule of Investments (continued)
| • | | Foreign currency exchange contracts as of December 31, 2011 were as follows (concluded): |
| Currency Purchased | Currency Sold | Counterparty | Settlement Date | Unrealized
Appreciation
(Depreciation) |
| USD | 33,561 | TWD | 1,015,529 | Brown Brothers Harriman | 1/03/12 | $ | 22 | |
| USD | 89,697 | CAD | 91,546 | Brown Brothers Harriman | 1/04/12 | | (164 | ) |
| USD | 2,799 | EGP | 16,907 | Brown Brothers Harriman | 1/04/12 | | (5 | ) |
| USD | 199,817 | JPY | 15,543,397 | Credit Suisse Securities (USA) LLC | 1/04/12 | | (2,124 | ) |
| USD | 1,018 | MYR | 3,220 | Brown Brothers Harriman | 1/04/12 | | 2 | |
| USD | 8,944 | THB | 283,359 | Brown Brothers Harriman | 1/04/12 | | (36 | ) |
| USD | 6,261 | JPY | 483,040 | Brown Brothers Harriman | 1/05/12 | | (14 | ) |
| USD | 118 | THB | 3,757 | Brown Brothers Harriman | 1/05/12 | | (1 | ) |
| USD | 2,506 | ZAR | 20,520 | Goldman Sachs & Co. | 1/05/12 | | (36 | ) |
| CHF | 208,714 | EUR | 170,216 | Credit Suisse Securities (USA) LLC | 1/06/12 | | 1,904 | |
| CHF | 937,542 | EUR | 764,645 | UBS AG | 1/06/12 | | 8,508 | |
| NOK | 3,047,743 | USD | 527,921 | Deutsche Bank Securities Inc. | 1/06/12 | | (18,370 | ) |
| NOK | 3,711,708 | USD | 643,322 | UBS AG | 1/06/12 | | (22,762 | ) |
| CAD | 300,777 | USD | 291,847 | Credit Suisse Securities (USA) LLC | 1/12/12 | | 3,335 | |
| CAD | 278,092 | USD | 269,731 | Deutsche Bank Securities Inc. | 1/12/12 | | 3,188 | |
| USD | 898,740 | GBP | 571,100 | JPMorgan Chase Bank NA | 1/12/12 | | 11,883 | |
| AUD | 177,582 | USD | 176,942 | Deutsche Bank Securities Inc. | 1/13/12 | | 4,503 | |
| CHF | 144,933 | EUR | 117,165 | UBS AG | 1/13/12 | | 2,673 | |
| USD | 181,000 | AUD | 177,582 | Deutsche Bank Securities Inc. | 1/13/12 | | (445 | ) |
| EUR | 473,737 | USD | 619,676 | UBS AG | 1/19/12 | | (6,486 | ) |
| SGD | 556,635 | USD | 428,349 | HSBC Securities | 1/19/12 | | 786 | |
| JPY | 37,201,851 | USD | 478,505 | Deutsche Bank Securities Inc. | 1/27/12 | | 4,979 | |
| JPY | 80,358,837 | USD | 1,033,727 | UBS AG | 1/27/12 | | 10,635 | |
| KRW | 249,105,880 | USD | 214,932 | Deutsche Bank Securities Inc. | 1/27/12 | | 960 | |
| USD | 724,984 | GBP | 467,250 | JPMorgan Chase Bank NA | 1/27/12 | | (512 | ) |
| TWD | 9,221,560 | USD | 305,350 | HSBC Securities | 2/03/12 | | (609 | ) |
| USD | 571,408 | MXN | 7,122,318 | Citibank NA | 2/09/12 | | 62,493 | |
| USD | 308,531 | MYR | 957,000 | HSBC Securities | 3/01/12 | | 7,652 | |
| USD | 913,004 | JPY | 70,000,000 | UBS AG | 3/09/12 | | 2,540 | |
| CNY | 6,683,994 | USD | 1,045,143 | Credit Suisse Securities (USA) LLC | 3/12/12 | | 15,652 | |
| SGD | 544,095 | USD | 449,257 | JPMorgan Chase Bank NA | 3/12/12 | | (29,799 | ) |
| USD | 589,278 | MYR | 1,829,000 | HSBC Securities | 4/03/12 | | 14,835 | |
| CNH | 5,824,418 | USD | 911,245 | UBS AG | 4/11/12 | | 845 | |
| USD | 988,887 | AUD | 968,054 | Credit Suisse Securities (USA) LLC | 4/16/12 | | 9,664 | |
| JPY | 30,000,000 | USD | 387,097 | Credit Suisse Securities (USA) LLC | 5/14/12 | | 3,727 | |
| USD | 1,045,711 | JPY | 80,000,000 | Credit Suisse Securities (USA) LLC | 5/14/12 | | 3,514 | |
| USD | 22,978 | AUD | 22,348 | Goldman Sachs & Co. | 5/15/12 | | 431 | |
| AUD | 1,739,000 | USD | 1,697,351 | JPMorgan Chase Bank NA | 11/15/12 | | 30,543 | |
| USD | 974,891 | AUD | 963,363 | Goldman Sachs & Co. | 11/15/12 | | 17,681 | |
| USD | 1,699,525 | AUD | 1,739,000 | JPMorgan Chase Bank NA | 11/15/12 | | (28,370 | ) |
| Total | | | | | | $ | 110,770 | |
| • | | Interest rate swaps outstanding as of December 31, 2011 were as follows: |
| Fixed Rate | Floating Rate | Counterparty | Expiration Date | Notional
Amount (000) | Unrealized
Appreciation
(Depreciation) |
| 0.65 | %1 | 3-Month LIBOR | Morgan Stanley & Co., Inc. | 7/25/13 | $ | 17 | $ | 15 | |
| 0.65 | %1 | 3-Month LIBOR | Morgan Stanley & Co., Inc. | 7/25/13 | $ | 10 | | 42 | |
| 1.63 | %2 | 3-Month LIBOR | UBS AG | 9/12/15 | $ | 3,948 | | 7,518 | |
| 1.57 | %2 | 3-Month LIBOR | UBS AG | 9/15/15 | $ | 3,785 | | 4,741 | |
| 1.56 | %2 | 3-Month LIBOR | Bank of America NA | 9/23/15 | $ | 3,820 | | 3,931 | |
| 1.84 | %1 | 3-Month LIBOR | Morgan Stanley & Co., Inc. | 7/25/16 | $ | 93 | | (2,879 | ) |
| 1.84 | %1 | 3-Month LIBOR | Morgan Stanley & Co., Inc. | 7/25/16 | $ | 58 | | (294 | ) |
| Total | | | | | | $ | 13,074 | |
| 1 | | Portfolio pays a fixed interest rate and receives floating rate. |
| 2 | | Portfolio pays a floating interest rate and receives fixed rate. |
| • | | Cross-currency swaps outstanding as of December 31, 2011 were as follows: |
| Fixed Rate | Floating Rate | Counterparty | Expiration Date | Notional
Amount (000) | Unrealized
Appreciation |
| IDR 8.25%3 | 6-Month LIBOR | Credit Suisse International | 6/03/18 | IDR 1,709,190 | | $561 |
| 3 | | Portfolio pays a floating rate and receives fixed interest rate. |
See Notes to Financial Statements.
| BLACKROCK SERIES FUND, INC. | DECEMBER 31, 2011 | 49 |
BlackRock Global Allocation Portfolio
Consolidated Schedule of Investments (continued)
| • | | Total return swaps outstanding as of December 31, 2011 were as follows: |
| Reference Entity | Portfolio Pays/
Receives Amount on
the Reference Entity | Fixed Amount/
Floating Rate | Counterparty | Expiration
Date | Notional
Amount/Contract
Amount (000) | Unrealized
Appreciation
(Depreciation) |
| Return on the MSCI Daily Total | | | | | | | | | |
| Return Net Emerging Markets | | | | | | | | | |
| USD Index | Receives | 3-month LIBOR plus 0.38% | BNP Paribas SA | 1/11/12 | USD | 921 | $ | 3,481 | |
| HSCEI Dividend Point Index | | | | | | | | | |
| Futures December 2012 | Receives | HKD 1,100,125 | Citibank NA | 12/31/12 | HKD | 651 | | (7,696 | ) |
| SGX Nikkei Stock Average | | | | | | | | | |
| Dividend Point Index Futures | | | | | | | | | |
| December 2012 | Receives | JPY 1,088,036 | Citibank NA | 3/29/13 | JPY | 51 | | 5,363 | |
| SGX Nikkei Stock Average | | | | | | | | | |
| Dividend Point Index Futures | | | | | | | | | |
| December 2013 | Receives | JPY 14,748,300 | Citibank NA | 3/31/14 | JPY | 91 | | 5,776 | |
| Total | | | | | | | $ | 6,924 | |
| • | | Fair Value Measurements—Various inputs are used in determining the fair value of investments and derivative financial instruments. These inputs are categorized into a disclosure hierarchy consisting of three broad levels for financial statement purposes as follows: |
| • | | Level 1—unadjusted price quotations in active markets/exchanges for identical assets and liabilities |
| • | | Level 2—other observable inputs (including, but not limited to: quoted prices for similar assets or liabilities in markets that are active, quoted prices for identical or similar assets or liabilities in markets that are not active, inputs other than quoted prices that are observable for the assets or liabilities (such as interest rates, yield curves, volatilities, prepayment speeds, loss severities, credit risks and default rates) or other market-corroborated inputs) |
| • | | Level 3—unobservable inputs based on the best information available in the circumstances, to the extent observable inputs are not available (including the Portfolio’s own assumptions used in determining the fair value of investments and derivative financial instruments) |
Changes in valuation techniques may result in transfers in or out of an assigned level within the disclosure hierarchy. The categorization of a value determined for investments and derivative financial instruments is based on the pricing transparency of the investment and derivative financial instrument and does not necessarily correspond to the Portfolio’s perceived risk of investing in those securities. For information about the Portfolio’s policy regarding valuation of investments and derivative financial instruments and other significant accounting policies, please refer to Note 1 of the Notes to Financial Statements.
The following tables summarize the inputs used as of December 31, 2011 in determining the fair valuation of the Portfolio’s investments and derivative financial instruments:
| Valuation Inputs | Level 1 | Level 2 | Level 3 | Total |
| Assets: | | | | | | | | |
| Investments: | | | | | | | | |
| Long-Term Investments: | | | | | | | | |
| Common Stocks: | | | | | | | | |
| Argentina | $ | 313,828 | | — | | — | $ | 313,828 |
| Australia | | — | $ | 2,932,882 | | — | | 2,932,882 |
| Austria | | — | | 61,707 | | — | | 61,707 |
| Belgium | | — | | 139,542 | | — | | 139,542 |
| Brazil | | 4,985,394 | | — | | — | | 4,985,394 |
| Canada | | 7,155,874 | | — | $ | 137 | | 7,156,011 |
| Chile | | 133,548 | | — | | — | | 133,548 |
| China | | 108,210 | | 3,079,558 | | — | | 3,187,768 |
| Egypt | | — | | 142,298 | | — | | 142,298 |
| France | | 665,758 | | 3,204,791 | | — | | 3,870,549 |
| Germany | | 71,072 | | 5,888,186 | | — | | 5,959,258 |
| Hong Kong | | — | | 1,813,719 | | — | | 1,813,719 |
| India | | — | | 1,126,967 | | — | | 1,126,967 |
| Indonesia | | — | | 263,069 | | — | | 263,069 |
| Ireland | | 184,316 | | — | | — | | 184,316 |
| Israel | | 671,015 | | — | | — | | 671,015 |
| Italy | | — | | 1,236,075 | | — | | 1,236,075 |
| Japan | | — | | 18,503,510 | | — | | 18,503,510 |
| Kazakhstan | | 300,854 | | — | | — | | 300,854 |
| Luxembourg | | — | | 41,159 | | — | | 41,159 |
| Malaysia | | — | | 1,233,453 | | — | | 1,233,453 |
| Mexico | | 478,894 | | — | | — | | 478,894 |
| Netherlands | | 188,132 | | 1,017,285 | | — | | 1,205,417 |
| Norway | | — | | 627,402 | | — | | 627,402 |
| Philippines | | 119,734 | | — | | — | | 119,734 |
| Poland | | — | | 38,368 | | — | | 38,368 |
| Portugal | | — | | 71,020 | | — | | 71,020 |
| Russia | | 2,043,889 | | 88,391 | | — | | 2,132,280 |
| Singapore | | — | | 2,091,027 | | — | | 2,091,027 |
| South Africa | | 608,586 | | 127,494 | | — | | 736,080 |
See Notes to Financial Statements.
| 50 | BLACKROCK SERIES FUND, INC. | DECEMBER 31, 2011 |
BlackRock Global Allocation Portfolio
Consolidated Schedule of Investments (continued)
| Valuation Inputs | Level 1 | Level 2 | Level 3 | Total |
| Assets (concluded): | | | | | | | | | | | | |
| Investments: (concluded) | | | | | | | | | | | | |
| Long-Term Investments: (concluded) | | | | | | | | | | | | |
| Common Stocks: (concluded) | | | | | | | | | | | | |
| South Korea | $ | 749,744 | | $ | 1,557,460 | | | — | | $ | 2,307,204 | |
| Spain | | 66,371 | | | 578,784 | | | — | | | 645,155 | |
| Sweden | | — | | | 229,255 | | | — | | | 229,255 | |
| Switzerland | | 212,756 | | | 2,546,413 | | | — | | | 2,759,169 | |
| Taiwan | | 374,267 | | | 1,231,283 | | | — | | | 1,605,550 | |
| Thailand | | 735,131 | | | — | | | — | | | 735,131 | |
| Turkey | | — | | | 631,679 | | | — | | | 631,679 | |
| United Kingdom | | 2,402,813 | | | 6,127,930 | | | — | | | 8,530,743 | |
| United States | | 92,384,031 | | | — | | | — | | | 92,384,031 | |
| Corporate Bonds | | — | | | 14,562,702 | | | 2,266,255 | | | 16,828,957 | |
| Floating Rate Loan Interests | | — | | | — | | | 809,234 | | | 809,234 | |
| Foreign Agency Obligations | | — | | | 22,203,087 | | | — | | | 22,203,087 | |
| Non-Agency Mortgage-Backed Securities | | — | | | 246,207 | | | — | | | 246,207 | |
| US Treasury Obligations | | — | | | 22,362,199 | | | — | | | 22,362,199 | |
| Investment Companies | | 5,975,032 | | | 34,516 | | | — | | | 6,009,548 | |
| Preferred Securities | | 1,796,782 | | | 1,226,068 | | | — | | | 3,022,850 | |
| Warrants | | 40,302 | | | — | | | — | | | 40,302 | |
| Short-Term Securities: | | | | | | | | | | | | |
| Foreign Agency Obligations | | — | | | 4,355,660 | | | — | | | 4,355,660 | |
| Money Market Funds | | 140,603 | | | 155,028 | | | — | | | 295,631 | |
| Time Deposits | | — | | | 163,999 | | | — | | | 163,999 | |
| US Treasury Obligations | | — | | | 23,748,503 | | | — | | | 23,748,503 | |
| Total | $ | 122,906,936 | | $ | 145,688,676 | | $ | 3,075,626 | | $ | 271,671,238 | |
| |
| Valuation Inputs | Level 1 | Level 2 | Level 3 | Total |
| Derivative Financial Instruments1 | | | | | | | | | | | | |
| Assets: | | | | | | | | | | | | |
| Equity contracts | $ | 218,474 | | $ | 20,791 | | $ | 281,440 | | $ | 520,705 | |
| Foreign currency exchange contracts | | — | | | 223,516 | | | — | | | 223,516 | |
| Interest rate contracts | | — | | | 16,247 | | | — | | | 16,247 | |
| Liabilities: | | | | | | | | | | | | |
| Equity contracts | | (498,160 | ) | | (30,846 | ) | | (881,620 | ) | | (1,410,626 | ) |
| Foreign currency exchange contracts | | — | | | (112,185 | ) | | — | | | (112,185 | ) |
| Interest rate contracts | | — | | | (7,789 | ) | | — | | | (7,789 | ) |
| Total | $ | (279,686 | ) | $ | 109,734 | | $ | (600,180 | ) | $ | (770,132 | ) |
| 1 | | Derivative financial instruments are swaps, financial futures contracts, foreign currency exchange contracts and options. Swaps, financial futures contracts and foreign currency exchange contracts are valued at the unrealized appreciation/depreciation on the instrument and options are shown at value. |
The following table is a reconciliation of Level 3 investments for which significant unobservable inputs were used in determining fair value:
| | Asset-Backed
Securities | Common
Stocks | Corporate
Bonds | Floating
Rate Loan
Interests | Foreign
Agency
Obligations | Total |
| Assets | | | | | | | | | | | | | | | | | | |
| Balance, as of December 31, 2010 | $ | 50,000 | | $ | 12,065 | | $ | 2,636,487 | | $ | 1,095,888 | | $ | 7,487,993 | | $ | 11,282,433 | |
| Accrued discounts/premiums | | 332 | | | — | | | (14,954 | ) | | 1,590 | | | — | | | (13,032 | ) |
| Net realized gain (loss) | | (47,952 | ) | | (384,708 | ) | | (343,240 | ) | | 25,997 | | | (4,725 | ) | | (754,628 | ) |
Net change in unrealized
appreciation/depreciation2 | | 47,119 | | | (349,002 | ) | | 36,967 | | | (17,241 | ) | | (1,050 | ) | | (283,207 | ) |
| Purchases | | — | | | 133,107 | | | 2,268,990 | | | 677,700 | | | — | | | 3,079,797 | |
| Sales | | (49,499 | ) | | (55,003 | ) | | (1,859,099 | ) | | (974,700 | ) | | (65,275 | ) | | (3,003,576 | ) |
| Transfers in3 | | — | | | 643,678 | | | 204,674 | | | — | | | — | | | 848,352 | |
| Transfers out3 | | — | | | — | | | (663,570 | ) | | — | | | (7,416,943 | ) | | (8,080,513 | ) |
| Balance, as of December 31, 2011 | $ | — | | $ | 137 | | $ | 2,266,255 | | $ | 809,234 | | | — | | $ | 3,075,626 | |
| 2 | | Included in the related net change in unrealized appreciation/depreciation on the Statements of Operations. The change in unrealized appreciation/depreciation on the securities still held at December 31, 2011 was $(520,438). |
| 3 | | The Portfolio’s policy is to recognize transfers in and transfers out as of the beginning of the period of the event or the change in circumstances that caused the transfer. |
See Notes to Financial Statements.
| BLACKROCK SERIES FUND, INC. | DECEMBER 31, 2011 | 51 |
BlackRock Global Allocation Portfolio
Consolidated Schedule of Investments (concluded)
The following table is a reconciliation of Level 3 derivative financial instruments for which significant unobservable inputs were used to determine fair value:
| | Equity Contracts |
| | Assets | Liabilities |
| Balance, as of December 31, 2010 | $ | 293,346 | | $ | (114,070 | ) |
| Accrued discounts/premium | | — | | | — | |
| Net realized gain (loss) | | 157,657 | | | 139,820 | |
| Net change in unrealized appreciation/depreciation1 | | (561,314 | ) | | (251,747 | ) |
| Purchases | | 654,267 | | | — | |
| Issuances2 | | — | | | (626,254 | ) |
| Sales | | (196,814 | ) | | (29,369 | ) |
| Settlements3 | | — | | | — | |
| Transfers in4 | | — | | | — | |
| Transfers out4 | | (65,702 | ) | | — | |
| Balance, as of December 31, 2011 | $ | 281,440 | | $ | (881,620 | ) |
| 1 | | Included in the related net change in unrealized appreciation/depreciation on the Statements of Operations. The change in unrealized appreciation/depreciation on derivative financial instruments still held at December 31, 2011 was $628,194. |
| 2 | | Issuances represent upfront cash received on certain derivative financial instruments. |
| 3 | | Settlements represent periodic contractual cash flows and/or cash flows to terminate certain derivative financial instruments. |
| 4 | | The Portfolio’s policy is to recognize transfers in and transfers out as of the beginning of the period of the event or the change in circumstances that caused the transfer. |
A reconciliation of Level 3 investments and derivative financial instruments is presented when the Portfolio had a significant amount of Level 3 investments and derivatives at the beginning and/or end of the period in relation to net assets.
See Notes to Financial Statements.
| 52 | BLACKROCK SERIES FUND, INC. | DECEMBER 31, 2011 |
| BlackRock High Yield Portfolio | |
| Schedule of Investments December 31, 2011 | (Percentages shown are based on Net Assets) |
| Common Stocks (a) | | Shares | | Value |
| Auto Components—2.0% | | | | | |
| Delphi Automotive Plc | | | | | |
| (90-day lock)(acquired 11/17/11, | | | | | |
| cost $99,035) (b) | | 31,108 | | $ | 642,147 |
| Delphi Automotive Plc | | | | | |
| (180-day lock)(acquired 11/17/11, | | | | | |
| cost $225,191) (b) | | 13,332 | | | 282,385 |
| | | | | | | 924,532 |
| Electrical Equipment—0.0% | | | | | |
| Medis Technologies Ltd. | | 14,935 | | | 52 |
| Hotels, Restaurants & Leisure—0.0% | | | | | |
| Travelport Worldwide Ltd. | | 15,059 | | | 7,530 |
| Paper & Forest Products—0.1% | | | | | |
| Ainsworth Lumber Co. Ltd. | | 15,671 | | | 15,075 |
| Ainsworth Lumber Co. Ltd. (c) | | 13,864 | | | 13,337 |
| | | | | | | 28,412 |
| Software—0.0% | | | | | |
| Bankruptcy Management Solutions, Inc. | | 117 | | | 2 |
| Total Common Stocks—2.1% | | | | | 960,528 |
| |
| |
| Corporate Bonds | Par
(000) | | |
| Aerospace & Defense—0.5% | | | | | |
| Huntington Ingalls Industries, Inc. (c): | | | | | |
| 6.88%, 3/15/18 | | $ | 50 | | | 49,000 |
| 7.13%, 3/15/21 | | | 100 | | | 98,000 |
| Kratos Defense & Security Solutions, Inc., | | | | | |
| 10.00%, 6/01/17 | | | 84 | | | 86,100 |
| | | | | | | 233,100 |
| Air Freight & Logistics—0.5% | | | | | |
| National Air Cargo Group, Inc.: | | | | | |
| Series 1, 12.38%, 9/02/15 | | 125 | | | 128,021 |
| Series 2, 12.38%, 8/16/15 | | 126 | | | 129,384 |
| | | | | | | 257,405 |
| Airlines—0.9% | | | | | |
| Air Canada, 9.25%, 8/01/15 (c) | | 130 | | | 113,750 |
| American Airlines Pass-Through Trust, | | | | | |
| Series 2011-2, Class A, 8.63%, | | | | | |
| 4/15/23 | | | 63 | | | 64,260 |
| Delta Air Lines, Inc., Series B, 9.75%, | | | | | |
| 12/17/16 | | | 39 | | | 40,289 |
| United Air Lines, Inc., 12.75%, 7/15/12 | | 196 | | | 206,237 |
| | | | | | | 424,536 |
| Auto Components—2.2% | | | | | |
| Allison Transmission, Inc., 11.00%, | | | | | |
| 11/01/15 (c) | | 106 | | | 111,830 |
| B-Corp Merger Sub, Inc., 8.25%, | | | | | |
| 6/01/19 (c) | | 50 | | | 47,000 |
| Delphi Corp., 6.13%, 5/15/21 (c) | | 60 | | | 61,800 |
| Ford Motor Co., 7.45%, 7/16/31 | | 370 | | | 444,000 |
| Icahn Enterprises LP: | | | | | |
| 4.00%, 8/15/13 (c)(d)(e) | | 50 | | | 47,000 |
| 8.00%, 1/15/18 | | | 230 | | | 239,200 |
| International Automotive Components | | | | | |
| Group SL, 9.13%, 6/01/18 (c) | | 10 | | | 8,950 |
| Titan International, Inc., 7.88%, | | | | | |
| 10/01/17 | | | 85 | | | 88,400 |
| | | | | | | 1,048,180 |
| Corporate Bonds | Par
(000) | | Value |
| Beverages—0.1% | | | | | |
| Cott Beverages, Inc., 8.13%, 9/01/18 | $ | 53 | | $ | 57,240 |
| Biotechnology—0.2% | | | | | |
| Illumina, Inc., 0.25%, | | | | | |
| 3/15/16 (c)(e) | | 50 | | | 40,063 |
| QHP Royalty Sub LLC, 10.25%, 3/15/15 (c) | | 44 | | | 44,045 |
| | | | | | | 84,108 |
| Building Products—0.6% | | | | | |
| Building Materials Corp. of America (c): | | | | | |
| 7.00%, 2/15/20 | | | 50 | | | 53,750 |
| 6.75%, 5/01/21 | | | 140 | | | 147,000 |
| Momentive Performance Materials, Inc.: | | | | | |
| 11.50%, 12/01/16 | | | 90 | | | 67,050 |
| 9.00%, 1/15/21 | | | 25 | | | 19,000 |
| | | | | | | 286,800 |
| Capital Markets—1.0% | | | | | |
| American Capital Ltd., 7.96%, 12/31/13 (f) | | 90 | | | 90,915 |
| E*Trade Financial Corp.: | | | | | |
| 12.50%, 11/30/17 | | | 205 | | | 231,650 |
| 3.52%, 8/31/19 (c)(e)(g) | | 37 | | | 28,860 |
| Series A, 4.07%, 8/31/19 (g) | | 1 | | | 780 |
| KKR Group Finance Co., 6.38%, 9/29/20 (c) | | 120 | | | 123,233 |
| | | | | | | 475,438 |
| Chemicals—3.4% | | | | | |
| American Pacific Corp., 9.00%, 2/01/15 | | 120 | | | 116,700 |
| Celanese US Holdings LLC: | | | | | |
| 6.63%, 10/15/18 | | | 110 | | | 116,875 |
| 5.88%, 6/15/21 | | | 145 | | | 149,712 |
| Chemtura Corp., 7.88%, 9/01/18 | | 110 | | | 113,300 |
| Hexion US Finance Corp., 9.00%, 11/15/20 | | 115 | | | 94,875 |
| Kinove German Bondco GmbH, 9.63%, 6/15/18 (c) | | 200 | | | 190,000 |
| Koppers, Inc., 7.88%, 12/01/19 | | 135 | | | 143,100 |
| KRATON Polymers LLC, 6.75%, 3/01/19 | | 25 | | | 23,500 |
| Lyondell Chemical Co., 11.00%, 5/01/18 | | 210 | | | 229,425 |
| LyondellBasell Industries NV, 6.00%, 11/15/21 (c) | | 35 | | | 36,312 |
| Nexeo Solutions LLC, 8.38%, 3/01/18 (c) | | 35 | | | 34,825 |
| NOVA Chemicals Corp., 8.63%, 11/01/19 | | 140 | | | 154,350 |
| PolyOne Corp., 7.38%, 9/15/20 | | 40 | | | 41,300 |
| Solutia, Inc.: | | | | | |
| 8.75%, 11/01/17 | | | 15 | | | 16,388 |
| 7.88%, 3/15/20 | | | 130 | | | 141,375 |
| TPC Group LLC, 8.25%, 10/01/17 | | 10 | | | 10,000 |
| | | | | | | 1,612,037 |
| Commercial Banks—2.2% | | | | | |
| CIT Group, Inc.: | | | | | |
| 7.00%, 5/01/15 | | | 130 | | | 130,260 |
| 7.00%, 5/02/16 (c) | | 283 | | | 282,646 |
| 7.00%, 5/01/17 | | | 200 | | | 199,934 |
| 7.00%, 5/02/17 (c) | | 310 | | | 309,612 |
| 6.63%, 4/01/18 (c) | | 70 | | | 72,450 |
| Eksportfinans ASA, 0.78%, 4/05/13 (c) | | 15 | | | 13,583 |
| | | | | | | 1,008,485 |
| Commercial Services & Supplies—2.4% | | | | | |
| ACCO Brands Corp., 10.63%, 3/15/15 | | 40 | | | 44,500 |
| ARAMARK Corp.: | | | | | |
| 3.93%, 2/01/15 (d) | | 110 | | | 106,150 |
| 8.50%, 2/01/15 | | | 26 | | | 26,650 |
| Aviation Capital Group Corp., 6.75%, 4/06/21 (c) | | 110 | | | 103,640 |
| Brickman Group Holdings, Inc., 9.13%, 11/01/18 (c) | | 3 | | | 2,670 |
| Casella Waste Systems, Inc., 7.75%, 2/15/19 | | 96 | | | 93,840 |
| Clean Harbors, Inc., 7.63%, 8/15/16 | | 50 | | | 53,125 |
| International Lease Finance Corp., 8.63%, 9/15/15 | | 30 | | | 30,750 |
See Notes to Financial Statements.
| BLACKROCK SERIES FUND, INC. | DECEMBER 31, 2011 | 53 |
| BlackRock High Yield Portfolio | |
| Schedule of Investments (continued) | (Percentages shown are based on Net Assets) |
| Corporate Bonds | Par
(000) | | Value |
| Commercial Services & Supplies (concluded) | | | | | |
| Iron Mountain, Inc., 7.75%, 10/01/19 | $ | 50 | | $ | 52,813 |
| Mobile Mini, Inc., 7.88%, 12/01/20 | | 100 | | | 100,500 |
| RSC Equipment Rental, Inc.: | | | | | |
| 9.50%, 12/01/14 | | 10 | | | 10,275 |
| 10.00%, 7/15/17 (c) | | 125 | | | 145,625 |
| 8.25%, 2/01/21 | | 187 | | | 189,337 |
| WCA Waste Corp., 7.50%, 6/15/19 (c) | | 120 | | | 121,200 |
| West Corp., 8.63%, 10/01/18 | | 25 | | | 25,250 |
| | | | | | 1,106,325 |
| Communications Equipment—0.2% | | | | | |
| Avaya, Inc., 9.75%, 11/01/15 | | 50 | | | 45,000 |
| EH Holding Corp., 6.50%, 6/15/19 (c) | | 70 | | | 72,975 |
| | | | | | 117,975 |
| Construction & Engineering—0.1% | | | | | |
| Boart Longyear Management Ltd., 7.00%, 4/01/21 (c) | | 45 | | | 45,675 |
| Consumer Finance—1.1% | | | | | |
| Credit Acceptance Corp.: | | | | | |
| 9.13%, 2/01/17 | | 70 | | | 73,150 |
| 9.13%, 2/01/17 (c) | | 5 | | | 5,212 |
| Ford Motor Credit Co. LLC, 7.00%, 4/15/15 | | 350 | | | 376,250 |
| Springleaf Finance Corp. (FKA AGFS Funding Co.), | | | | | |
| 6.90%, 12/15/17 | | 100 | | | 72,000 |
| | | | | | 526,612 |
| Containers & Packaging—1.1% | | | | | |
| Ball Corp., 6.75%, 9/15/20 | | 75 | | | 81,563 |
| Berry Plastics Corp., 8.25%, 11/15/15 | | 40 | | | 42,600 |
| Cascades, Inc., 7.75%, 12/15/17 | | 100 | | | 99,000 |
| Crown Americas LLC, 6.25%, 2/01/21 | | 75 | | | 78,375 |
| Graphic Packaging International, Inc., 7.88%, 10/01/18 | | 70 | | | 74,550 |
| Greif, Inc., 7.75%, 8/01/19 | | 50 | | | 54,000 |
| Pregis Corp., 12.38%, 10/15/13 | | 10 | | | 9,550 |
| Rock-Tenn Co., 9.25%, 3/15/16 | | 35 | | | 37,100 |
| Sealed Air Corp., 8.38%, 9/15/21 (c) | | 40 | | | 44,200 |
| | | | | | 520,938 |
| Diversified Financial Services—3.0% | | | | | |
| Ally Financial, Inc.: | | | | | |
| 8.00%, 3/15/20 | | 60 | | | 61,500 |
| 8.00%, 11/01/31 | | 400 | | | 386,000 |
| Axcan Intermediate Holdings, Inc., 12.75%, 3/01/16 | | 90 | | | 94,950 |
| DPL, Inc., 7.25%, 10/15/21 (c) | | 160 | | | 172,800 |
| General Motors Financial Co., Inc., 6.75%, 6/01/18 (c) | | 20 | | | 20,400 |
| Lehman Brothers Holdings, Inc. (a)(h): | | | | | |
| 5.75%, 5/17/13 | | 110 | | | 28,187 |
| 8.80%, 3/01/15 | | 30 | | | 7,688 |
| Leucadia National Corp., 8.13%, 9/15/15 | | 144 | | | 151,380 |
| Reynolds Group Issuer, Inc. (c): | | | | | |
| 8.75%, 10/15/16 | | 115 | | | 121,037 |
| 7.88%, 8/15/19 | | 140 | | | 146,300 |
| 6.88%, 2/15/21 | | 100 | | | 99,500 |
| WMG Acquisition Corp. (c): | | | | | |
| 9.50%, 6/15/16 | | 20 | | | 21,700 |
| 11.50%, 10/01/18 | | 110 | | | 109,175 |
| | | | | | 1,420,617 |
| Diversified Telecommunication Services—2.2% | | | | | |
| Broadview Networks Holdings, Inc., 11.38%, 9/01/12 | | 165 | | | 132,000 |
| GCI, Inc., 6.75%, 6/01/21 | | 56 | | | 54,600 |
| ITC Deltacom, Inc., 10.50%, 4/01/16 | | 60 | | | 61,350 |
| Level 3 Financing, Inc.: | | | | | |
| 8.75%, 2/15/17 | | 90 | | | 91,575 |
| 8.13%, 7/01/19 (c) | | 520 | | | 512,200 |
| Corporate Bonds | Par
(000) | | Value |
| Diversified Telecommunication Services (concluded) | | |
| Qwest Communications International, Inc., | | | | | |
| Series B, 7.50%, 2/15/14 | $ | 40 | | $ | 40,151 |
| tw telecom Holdings, Inc., 8.00%, 3/01/18 | | 30 | | | 31,950 |
| Windstream Corp., 7.88%, 11/01/17 | | 100 | | | 108,250 |
| | | | | | | 1,032,076 |
| Electric Utilities—0.6% | | | | | |
| FPL Energy National Wind Portfolio, LLC, 6.13%, | | | | | |
| 3/25/19 (c) | | 122 | | | 119,617 |
| IPALCO Enterprises, Inc., 7.25%, 4/01/16 (c) | | 145 | | | 156,600 |
| | | | | | | 276,217 |
| Energy Equipment & Services—3.7% | | | | | |
| Antero Resources Finance Corp., 7.25%, 8/01/19 (c) | | 30 | | | 30,750 |
| Calfrac Holdings LP, 7.50%, 12/01/20 (c) | | 120 | | | 117,000 |
| Cie Generale de Geophysique—Veritas, 6.50%, 6/01/21 | | 80 | | | 77,600 |
| Compagnie Generale de Geophysique—Veritas, | | | | | |
| 9.50%, 5/15/16 | | | 75 | | | 81,000 |
| Exterran Holdings, Inc., 7.25%, 12/01/18 | | 40 | | | 38,000 |
| Forbes Energy Services Ltd., 9.00%, 6/15/19 | | 70 | | | 65,450 |
| Frac Tech Services LLC, 7.63%, 11/15/18 (c) | | 265 | | | 277,587 |
| Key Energy Services, Inc., 6.75%, 3/01/21 | | 50 | | | 50,000 |
| MEG Energy Corp., 6.50%, 3/15/21 (c) | | 220 | | | 224,950 |
| Oil States International, Inc., 6.50%, 6/01/19 | | 145 | | | 148,263 |
| Peabody Energy Corp., 6.25%, 11/15/21 (c) | | 495 | | | 512,325 |
| Transocean, Inc., 6.38%, 12/15/21 | | 120 | | | 127,546 |
| | | | | | | 1,750,471 |
| Food Products—0.2% | | | | | |
| Darling International, Inc., 8.50%, 12/15/18 | | 45 | | | 49,950 |
| JBS USA LLC, 11.63%, 5/01/14 | | 20 | | | 22,675 |
| | | | | | | 72,625 |
| Gas Utilities—0.1% | | | | | |
| Targa Resources Partners LP, 6.88%, 2/01/21 (c) | | 60 | | | 60,750 |
| Health Care Equipment & Supplies—0.8% | | | | | |
| Biomet, Inc.: | | | | | |
| 10.00%, 10/15/17 | | | 30 | | | 32,400 |
| 10.38%, 10/15/17 (i) | | 20 | | | 21,650 |
| DJO Finance LLC, 10.88%, 11/15/14 | | 205 | | | 191,162 |
| ExamWorks Group, Inc., 9.00%, 7/15/19 (c) | | 4 | | | 3,620 |
| Fresenius US Finance II, Inc., 9.00%, 7/15/15 (c) | | 45 | | | 50,456 |
| Teleflex, Inc., 6.88%, 6/01/19 | | 55 | | | 57,338 |
| | | | | | | 356,626 |
| Health Care Providers & Services—4.5% | | | | | |
| Aviv Healthcare Properties LP, 7.75%, 2/15/19 | | 40 | | | 39,200 |
| Fresenius Medical Care US Finance, Inc., 6.50%, | | | | | |
| 9/15/18 (c) | | 167 | | | 174,932 |
| HCA, Inc.: | | | | | |
| 6.50%, 2/15/20 | | | 240 | | | 249,000 |
| 7.88%, 2/15/20 | | | 160 | | | 172,800 |
| 7.25%, 9/15/20 | | | 435 | | | 458,925 |
| 7.50%, 2/15/22 | | | 100 | | | 102,250 |
| Health Management Associates, Inc., 7.38%, 1/15/20 (c) | 125 | | | 130,000 |
| IASIS Healthcare LLC, 8.38%, 5/15/19 | | 135 | | | 117,788 |
| INC Research LLC, 11.50%, 7/15/19 (c) | | 75 | | | 67,125 |
| inVentiv Health, Inc. (c): | | | | | |
| 10.00%, 8/15/18 | | | 50 | | | 45,750 |
| 10.00%, 8/15/18 | | | 15 | | | 13,725 |
| Omnicare, Inc., 7.75%, 6/01/20 | | 150 | | | 161,062 |
| Symbion, Inc., 8.00%, 6/15/16 | | 65 | | | 60,044 |
| Tenet Healthcare Corp.: | | | | | |
| 10.00%, 5/01/18 | | | 102 | | | 116,535 |
| 6.25%, 11/01/18 (c) | | 80 | | | 81,400 |
| 8.88%, 7/01/19 | | | 105 | | | 117,863 |
| | | | | | | 2,108,399 |
See Notes to Financial Statements.
| 54 | BLACKROCK SERIES FUND, INC. | DECEMBER 31, 2011 |
| BlackRock High Yield Portfolio | |
| Schedule of Investments (continued) | (Percentages shown are based on Net Assets) |
| Corporate Bonds | Par
(000) | | Value |
| Health Care Technology—1.0% | | | | | |
| IMS Health, Inc., 12.50%, 3/01/18 (c) | $ | 415 | | $ | 466,875 |
| Hotels, Restaurants & Leisure—1.6% | | | | | |
| Diamond Resorts Corp., 12.00%, 8/15/18 | | 230 | | | 226,550 |
| El Dorado Resorts LLC, 8.63%, 6/15/19 (c) | | 25 | | | 22,312 |
| Fontainebleau Las Vegas Holdings LLC, 11.00%, | | | | | |
| 6/15/15 (a)(c)(h) | | 25 | | | 16 |
| HRP Myrtle Beach Operations LLC, 4/01/12 (c)(h) | | 250 | | | 25 |
| MGM Resorts International: | | | | | |
| 13.00%, 11/15/13 | | | 50 | | | 59,375 |
| 10.38%, 5/15/14 | | | 125 | | | 142,812 |
| 4.25%, 4/15/15 (e) | | 30 | | | 28,462 |
| 11.13%, 11/15/17 | | | 115 | | | 131,100 |
| Travelport LLC: | | | | | |
| 5.15%, 9/01/14 (d) | | 30 | | | 14,700 |
| 9.88%, 9/01/14 | | | 10 | | | 5,950 |
| 9.00%, 3/01/16 | | | 20 | | | 11,050 |
| 6.58%, 12/01/16 (c)(i) | | 79 | | | 55,776 |
| Tropicana Entertainment LLC, 9.63%, 12/15/14 (h) | | 15 | | | 2 |
| Waterford Gaming LLC, 8.63%, 9/15/14 (c) | | 94 | | | 46,882 |
| | | | | | | 745,012 |
| Household Durables—1.8% | | | | | |
| Ashton Woods USA LLC, 6/30/15 (c)(f) | | 234 | | | 177,840 |
| Beazer Homes USA, Inc., 12.00%, 10/15/17 | | 240 | | | 255,000 |
| Jarden Corp., 7.50%, 5/01/17 | | 120 | | | 127,200 |
| Pulte Group, Inc., 6.38%, 5/15/33 | | 10 | | | 6,925 |
| Ryland Group, Inc., 6.63%, 5/01/20 | | 105 | | | 98,175 |
| Standard Pacific Corp.: | | | | | |
| 10.75%, 9/15/16 | | | 100 | | | 105,000 |
| 8.38%, 1/15/21 | | | 75 | | | 70,594 |
| | | | | | | 840,734 |
| Household Products—0.3% | | | | | |
| Spectrum Brands Holdings, Inc., 9.50%, 6/15/18 (c) | | 110 | | | 120,313 |
| Independent Power Producers & Energy Traders—3.0% | | |
| AES Corp.: | | | | | |
| 7.75%, 10/15/15 | | | 90 | | | 97,875 |
| 9.75%, 4/15/16 | | | 35 | | | 40,075 |
| Calpine Corp. (c): | | | | | |
| 7.25%, 10/15/17 | | | 85 | | | 89,250 |
| 7.50%, 2/15/21 | | | 40 | | | 42,800 |
| 7.88%, 1/15/23 | | | 95 | | | 102,125 |
| Energy Future Intermediate Holding Co. LLC, 10.00%, | | | | | |
| 12/01/20 | | | 735 | | | 775,425 |
| NRG Energy, Inc.: | | | | | |
| 7.38%, 1/15/17 | | | 55 | | | 57,062 |
| 7.63%, 1/15/18 | | | 190 | | | 190,000 |
| | | | | | | 1,394,612 |
| Industrial Conglomerates—1.4% | | | | | |
| Sequa Corp. (c): | | | | | |
| 11.75%, 12/01/15 | | | 230 | | | 244,950 |
| 13.50%, 12/01/15 | | | 387 | | | 414,227 |
| | | | | | | 659,177 |
| Insurance—0.5% | | | | | |
| CNO Financial Group, Inc., 9.00%, 1/15/18 (c) | | 60 | | | 63,300 |
| Genworth Financial, Inc., 7.63%, 9/24/21 | | 80 | | | 74,800 |
| MPL 2 Acquisition Canco, Inc., 9.88%, 8/15/18 (c) | | 45 | | | 39,375 |
| USI Holdings Corp., 4.33%, 11/15/14 (c)(d) | | 60 | | | 54,750 |
| | | | | | | 232,225 |
| | | | Par | | |
| Corporate Bonds | | (000) | | Value |
| IT Services—1.5% | | | | | |
| Eagle Parent, Inc., 8.63%, 5/01/19 (c) | $ | 100 | | $ | 95,500 |
| First Data Corp.: | | | | | |
| 7.38%, 6/15/19 (c) | | 215 | | | 202,100 |
| 8.25%, 1/15/21 (c) | | 175 | | | 156,625 |
| 12.63%, 1/15/21 | | | 123 | | | 107,010 |
| SunGard Data Systems, Inc.: | | | | | |
| 7.38%, 11/15/18 | | | 40 | | | 40,950 |
| 7.63%, 11/15/20 | | | 100 | | | 102,750 |
| | | | | | | 704,935 |
| Machinery—0.5% | | | | | |
| Navistar International Corp., 3.00%, 10/15/14 (e) | | 200 | | | 215,500 |
| SPX Corp., 6.88%, 9/01/17 | | 30 | | | 32,400 |
| | | | | | | 247,900 |
| Media—8.5% | | | | | |
| AMC Networks, Inc., 7.75%, 7/15/21 (c) | | 70 | | | 76,125 |
| Affinion Group, Inc., 7.88%, 12/15/18 | | 115 | | | 97,175 |
| CCH II LLC, 13.50%, 11/30/16 | | 207 | | | 239,196 |
| CCO Holdings LLC: | | | | | |
| 7.88%, 4/30/18 | | | 50 | | | 53,313 |
| 7.38%, 6/01/20 | | | 40 | | | 42,200 |
| 6.50%, 4/30/21 | | | 139 | | | 140,737 |
| Cengage Learning Acquisitions, Inc., 10.50%, | | | | | |
| 1/15/15 (c) | | 10 | | | 7,175 |
| Checkout Holding Corp., 10.69%, 11/15/15 (c)(g) | | 115 | | | 60,950 |
| Cinemark USA, Inc., 8.63%, 6/15/19 | | 40 | | | 43,500 |
| Clear Channel Worldwide Holdings, Inc., Series B, | | | | | |
| 9.25%, 12/15/17 | | | 954 | | | 1,030,320 |
| DISH DBS Corp., 6.75%, 6/01/21 | | 150 | | | 161,625 |
| Gray Television, Inc., 10.50%, 6/29/15 | | 110 | | | 103,950 |
| Harland Clarke Holdings Corp.: | | | | | |
| 6.00%, 5/15/15 (d) | | 40 | | | 26,500 |
| 9.50%, 5/15/15 | | | 35 | | | 25,550 |
| Intelsat Jackson Holdings SA, 11.25%, 6/15/16 | | 140 | | | 147,087 |
| Intelsat Luxemburg SA (i): | | | | | |
| 11.50%, 2/04/17 (c) | | 70 | | | 67,550 |
| 11.50%, 2/04/17 | | | 140 | | | 135,100 |
| Interactive Data Corp., 10.25%, 8/01/18 | | 130 | | | 142,350 |
| Kabel BW Erste Beteiligungs GmbH, 7.50%, 3/15/19 (c) | 230 | | | 241,500 |
| Live Nation Entertainment, Inc., 8.13%, 5/15/18 (c) | 120 | | | 120,900 |
| NAI Entertainment Holdings LLC, 8.25%, 12/15/17 (c) | 125 | | | 132,187 |
| Nielsen Finance LLC: | | | | | |
| 11.63%, 2/01/14 | | | 26 | | | 29,868 |
| 7.75%, 10/15/18 | | | 220 | | | 237,600 |
| ProQuest LLC, 9.00%, 10/15/18 (c) | | 90 | | | 72,900 |
| ProtoStar I Ltd., 7.40%, 10/15/12 (a)(c)(e)(h) | | 163 | | | 82 |
| Unitymedia Hessen GmbH & Co. KG, 8.13%, | | | | | |
| 12/01/17 (c) | | 500 | | | 528,125 |
| | | | | | | 3,963,565 |
| Metals & Mining—1.7% | | | | | |
| Goldcorp, Inc., 2.00%, 8/01/14 (e) | | 115 | | | 140,731 |
| Newmont Mining Corp., Series A, 1.25%, 7/15/14 (e) | 85 | | | 118,150 |
| Novelis, Inc., 8.75%, 12/15/20 | | 405 | | | 434,363 |
| Taseko Mines Ltd., 7.75%, 4/15/19 | | 90 | | | 81,225 |
| | | | | | | 774,469 |
| Multiline Retail—0.5% | | | | | |
| Dollar General Corp., 11.88%, 7/15/17 (i) | | 193 | | | 213,265 |
| Oil, Gas & Consumable Fuels—10.2% | | | | | |
| Alpha Natural Resources, Inc., 6.25%, 6/01/21 | | 40 | | | 38,800 |
See Notes to Financial Statements.
| BLACKROCK SERIES FUND, INC. | DECEMBER 31, 2011 | 55 |
| BlackRock High Yield Portfolio | |
| Schedule of Investments (continued) | (Percentages shown are based on Net Assets) |
| Corporate Bonds | Par
(000) | | Value |
| Oil, Gas & Consumable Fuels (continued) | | | | | |
| Arch Coal, Inc.: | | | | | |
| 8.75%, 8/01/16 | | $ | 35 | | $ | 38,238 |
| 7.25%, 10/01/20 | | | 40 | | | 40,900 |
| 7.25%, 6/15/21 (c) | | 50 | | | 51,375 |
| Bill Barrett Corp., 9.88%, 7/15/16 | | 5 | | | 5,500 |
| Carrizo Oil & Gas, Inc., 8.63%, 10/15/18 | | 25 | | | 25,250 |
| Chesapeake Energy Corp.: | | | | | |
| 9.50%, 2/15/15 | | | 10 | | | 11,450 |
| 6.63%, 8/15/20 | | | 36 | | | 38,610 |
| 2.25%, 12/15/38 (e) | | 90 | | | 74,250 |
| Chesapeake Midstream Partners LP, 5.88%, | | | | | |
| 4/15/21 (c) | | 65 | | | 65,000 |
| Chesapeake Oilfield Operating LLC, 6.63%, | | | | | |
| 11/15/19 (c) | | 85 | | | 88,400 |
| Coffeyville Resources LLC, 9.00%, 4/01/15 (c) | | 133 | | | 140,980 |
| Concho Resources, Inc.: | | | | | |
| 7.00%, 1/15/21 | | | 80 | | | 85,900 |
| 6.50%, 1/15/22 | | | 35 | | | 36,575 |
| Consol Energy, Inc., 8.25%, 4/01/20 | | 215 | | | 237,575 |
| Continental Resources, Inc., 7.13%, 4/01/21 | | 60 | | | 65,100 |
| Copano Energy LLC, 7.13%, 4/01/21 | | 65 | | | 65,650 |
| Crosstex Energy LP, 8.88%, 2/15/18 | | 25 | | | 27,313 |
| Denbury Resources, Inc., 8.25%, 2/15/20 | | 115 | | | 128,513 |
| El Paso Corp.: | | | | | |
| 7.25%, 6/01/18 | | | 90 | | | 98,541 |
| 6.50%, 9/15/20 | | | 115 | | | 124,314 |
| Energy XXI Gulf Coast, Inc.: | | | | | |
| 9.25%, 12/15/17 | | | 105 | | | 113,925 |
| 7.75%, 6/15/19 | | | 85 | | | 86,700 |
| Forest Oil Corp., 8.50%, 2/15/14 | | 60 | | | 65,400 |
| Hilcorp Energy I LP (c): | | | | | |
| 8.00%, 2/15/20 | | | 130 | | | 139,100 |
| 7.63%, 4/15/21 | | | 145 | | | 151,887 |
| Kodiak Oil & Gas Corp., 8.13%, 12/01/19 (c) | | 65 | | | 67,356 |
| Laredo Petroleum, Inc., 9.50%, 2/15/19 (c) | | 40 | | | 42,400 |
| Linn Energy LLC: | | | | | |
| 6.50%, 5/15/19 (c) | | 15 | | | 14,888 |
| 7.75%, 2/01/21 | | | 80 | | | 83,200 |
| MarkWest Energy Partners LP: | | | | | |
| 6.75%, 11/01/20 | | | 50 | | | 52,375 |
| 6.25%, 6/15/22 | | | 85 | | | 88,825 |
| Newfield Exploration Co., 5.75%, 1/30/22 | | 95 | | | 102,600 |
| Niska Gas Storage US LLC, 8.88%, 3/15/18 | | 145 | | | 141,737 |
| Oasis Petroleum, Inc.: | | | | | |
| 7.25%, 2/01/19 | | | 50 | | | 51,750 |
| 6.50%, 11/01/21 | | | 50 | | | 49,625 |
| OGX Petroleo e Gas Participacoes SA, 8.50%, | | | | | |
| 6/01/18 (c) | | 550 | | | 539,000 |
| Petrohawk Energy Corp.: | | | | | |
| 10.50%, 8/01/14 | | | 140 | | | 155,750 |
| 7.88%, 6/01/15 | | | 85 | | | 90,525 |
| Petroleum Geo-Services ASA, 7.38%, 12/15/18 (c) | | 110 | | | 112,200 |
| Pioneer Natural Resources Co.: | | | | | |
| 6.65%, 3/15/17 | | | 20 | | | 22,129 |
| 6.88%, 5/01/18 | | | 65 | | | 73,513 |
| 7.50%, 1/15/20 | | | 35 | | | 41,049 |
| 7.20%, 1/15/28 | | | 15 | | | 17,149 |
| Plains Exploration & Production Co.: | | | | | |
| 6.63%, 5/01/21 | | | 130 | | | 136,500 |
| 6.75%, 2/01/22 | | | 125 | | | 130,938 |
| Precision Drilling Corp., 6.50%, 12/15/21 (c) | | 55 | | | 56,100 |
| | | | Par | | |
| Corporate Bonds | | (000) | | Value |
| Oil, Gas & Consumable Fuels (concluded) | | | | | |
| Range Resources Corp.: | | | | | |
| 7.25%, 5/01/18 | | $ | 100 | | $ | 107,000 |
| 6.75%, 8/01/20 | | | 30 | | | 33,300 |
| 5.75%, 6/01/21 | | | 150 | | | 162,375 |
| SandRidge Energy, Inc., 7.50%, 3/15/21 | | 230 | | | 228,275 |
| SM Energy Co. (c): | | | | | |
| 6.63%, 2/15/19 | | | 20 | | | 20,800 |
| 6.50%, 11/15/21 | | | 70 | | | 72,100 |
| Whiting Petroleum Corp., 6.50%, 10/01/18 | | 30 | | | 31,350 |
| | | | | | | 4,770,055 |
| Paper & Forest Products—2.0% | | | | | |
| Ainsworth Lumber Co. Ltd., 11.00%, 7/29/15 (c)(i) | 136 | | | 88,599 |
| Boise Cascade LLC, 7.13%, 10/15/14 | | 150 | | | 149,062 |
| Boise Paper Holdings LLC: | | | | | |
| 9.00%, 11/01/17 | | | 90 | | | 96,750 |
| 8.00%, 4/01/20 | | | 100 | | | 105,750 |
| Clearwater Paper Corp.: | | | | | |
| 10.63%, 6/15/16 | | | 80 | | | 89,200 |
| 7.13%, 11/01/18 | | | 60 | | | 62,400 |
| Longview Fibre Paper & Packaging, Inc., 8.00%, | | | | | |
| 6/01/16 (c) | | 65 | | | 65,000 |
| NewPage Corp., 11.38%, 12/31/14 (a)(h) | | 332 | | | 245,265 |
| Sappi Papier Holding GmbH, 6.63%, 4/15/21 (c) | | 25 | | | 21,438 |
| Verso Paper Holdings LLC, Series B, 4.18%, 8/01/14 (d) | 15 | | | 9,450 |
| | | | | | | 932,914 |
| Pharmaceuticals—0.6% | | | | | |
| Jaguar Holding Co. II, 9.50%, 12/01/19 (c) | | 80 | | | 84,000 |
| Valeant Pharmaceuticals International (c): | | | | | |
| 6.50%, 7/15/16 | | | 200 | | | 199,750 |
| 7.25%, 7/15/22 | | | 20 | | | 19,400 |
| | | | | | | 303,150 |
| Professional Services—0.1% | | | | | |
| FTI Consulting, Inc., 7.75%, 10/01/16 | | 35 | | | 36,225 |
| Real Estate Investment Trusts (REITs)—0.6% | | | | |
| FelCor Lodging LP, 6.75%, 6/01/19 | | 232 | | | 222,720 |
| Rouse Co. LP, 6.75%, 5/01/13 (c) | | 65 | | | 65,569 |
| | | | | | | 288,289 |
| Real Estate Management & Development—1.7% | | | | |
| Forest City Enterprises, Inc., 7.63%, 6/01/15 | | 150 | | | 147,375 |
| Realogy Corp.: | | | | | |
| 11.50%, 4/15/17 | | | 125 | | | 97,500 |
| 12.00%, 4/15/17 | | | 20 | | | 15,400 |
| 7.88%, 2/15/19 (c) | | 380 | | | 330,600 |
| Shea Homes LP, 8.63%, 5/15/19 (c) | | 235 | | | 219,725 |
| | | | | | | 810,600 |
| Road & Rail—0.8% | | | | | |
| Avis Budget Car Rental LLC, 8.25%, 1/15/19 | | 15 | | | 14,888 |
| Florida East Coast Railway Corp., 8.13%, 2/01/17 | | 80 | | | 79,000 |
| The Hertz Corp.: | | | | | |
| 7.50%, 10/15/18 | | | 100 | | | 104,500 |
| 6.75%, 4/15/19 | | | 40 | | | 40,100 |
| 7.38%, 1/15/21 | | | 120 | | | 121,950 |
| | | | | | | 360,438 |
| Semiconductors & Semiconductor Equipment—0.2% | | |
| Spansion LLC, 7.88%, 11/15/17 | | 90 | | | 81,900 |
| Specialty Retail—1.0% | | | | | |
| Asbury Automotive Group, Inc., 8.38%, 11/15/20 | | 70 | | | 71,750 |
| United Auto Group, Inc., 7.75%, 12/15/16 | | 230 | | | 235,750 |
| Sally Holdings LLC, 6.88%, 11/15/19 (c) | | 60 | | | 62,700 |
| Toys ‘R’ US-Delaware, Inc., 7.38%, 9/01/16 (c) | | 80 | | | 80,200 |
| | | | | | | 450,400 |
See Notes to Financial Statements.
| 56 | BLACKROCK SERIES FUND, INC. | DECEMBER 31, 2011 |
| BlackRock High Yield Portfolio | |
| Schedule of Investments (continued) | (Percentages shown are based on Net Assets) |
| Corporate Bonds | Par
(000) | | Value |
| Textiles, Apparel & Luxury Goods—0.2% | | | | | |
| Phillips-Van Heusen Corp., 7.38%, 5/15/20 | $ | 90 | | $ | 97,650 |
| Trading Companies & Distributors—0.1% | | | | | |
| Interline Brands, Inc., 7.00%, 11/15/18 | | 50 | | | 51,750 |
| Transportation Infrastructure—0.3% | | | | | |
| Aguila 3 SA, 7.88%, 1/31/18 (c) | | 150 | | | 145,500 |
| Wireless Telecommunication Services—4.4% | | | | |
| Cricket Communications, Inc., 7.75%, 5/15/16 | | 120 | | | 123,900 |
| Crown Castle International Corp., 7.13%, 11/01/19 | 90 | | | 97,200 |
| Digicel Group Ltd. (c): | | | | | |
| 9.13%, 1/15/15 | | 118 | | | 115,640 |
| 8.25%, 9/01/17 | | 240 | | | 241,200 |
| 10.50%, 4/15/18 | | 100 | | | 100,500 |
| MetroPCS Wireless, Inc., 6.63%, 11/15/20 | | 220 | | | 205,150 |
| NII Capital Corp., 7.63%, 4/01/21 | | 142 | | | 140,935 |
| Sprint Capital Corp., 6.88%, 11/15/28 | | 320 | | | 228,400 |
| Sprint Nextel Corp., 9.00%, 11/15/18 (c) | | 510 | | | 535,500 |
| iPCS, Inc., 2.55%, 5/01/13 (d) | | 285 | | | 264,337 |
| | | | | | 2,052,762 |
| Total Corporate Bonds—76.1% | | | | | 35,627,350 |
| |
| |
| Floating Rate Loan Interests (d) | | | | | |
| Capital Markets—0.1% | | | | | |
| Nuveen Investments, Inc. Incremental Term Loan | | | | | |
| (First Lien), 1.00%, 5/13/17 | | 65 | | | 63,916 |
| Chemicals—0.1% | | | | | |
| Styron Sarl, Term Loan B, 6.00%, 8/02/17 | | 44 | | | 38,279 |
| Commercial Services & Supplies—0.5% | | | | | |
| AWAS Finance Luxembourg Sarl, Term Loan B, | | | | | |
| 5.25%, 6/10/16 | | 41 | | | 40,710 |
| Volume Services America, Inc. (Centerplate), | | | | | |
| Term Loan B, 10.50%—10.75%, 9/16/16 | | 198 | | | 196,846 |
| | | | | | 237,556 |
| Communications Equipment—0.0% | | | | | |
| Avaya, Inc., Term Loan B, 3.26%, 10/24/14 | | 15 | | | 14,231 |
| Consumer Finance—0.4% | | | | | |
| Springleaf Finance Corp. (FKA AGFS Funding Co.), | | | | | |
| Term Loan, 5.50%, 5/10/17 | | 240 | | | 208,450 |
| Diversified Consumer Services—0.1% | | | | | |
| ServiceMaster Co.: | | | | | |
| Closing Date Term Loan, 2.78%—3.03%, 7/24/14 | 4 | | | 3,431 |
| Delayed Draw Term Loan, 2.80%, 7/24/14 | | 36 | | | 34,452 |
| | | | | | 37,883 |
| Diversified Telecommunication Services—0.2% | | | | |
| Level 3 Financing, Inc., Term Loan B-3, 5.75%, 8/31/18 | 75 | | | 73,819 |
| Electronic Equipment, Instruments & Components—0.0% | | |
| CDW LLC (FKA CDW Corp.), Non-Extended Term Loan, | | | | |
| 3.78%, 10/10/14 | | 20 | | | 19,331 |
| Energy Equipment & Services—1.5% | | | | | |
| Dynegy Holdings, Inc.: | | | | | |
| Coal Co. Term Loan, 9.25%, 8/04/16 | | 282 | | | 283,150 |
| Gas Co. Term Loan, 9.25%, 8/04/16 | | 416 | | | 420,798 |
| | | | | | 703,948 |
| Floating Rate Loan Interests (d) | Par
(000) | | Value |
| Food Products—0.4% | | | | | |
| Advance Pierre Foods, Term Loan (Second Lien), | | | | | |
| 11.25%, 9/29/17 | | $ | 165 | �� | $ | 163,969 |
| Health Care Equipment & Supplies—0.3% | | | | | |
| Capital Safety Group Ltd., Term Loan B, 1.00%, | | | | | |
| 12/14/18 | | | 125 | | | 124,219 |
| Health Care Providers & Services—0.4% | | | | | |
| Community Health Systems, Inc.: | | | | | |
| Non-Extended Delayed Draw Term Loan, 2.55%, | | | | |
| 7/25/14 | | | 1 | | | 705 |
| Non-Extended Term Loan, 2.55%—2.77%, | | | | | |
| 7/25/14 | | | 14 | | | 13,751 |
| Harden Healthcare LLC: | | | | | |
| Add-on Term Loan, 7.75%, 3/02/15 | | 112 | | | 109,371 |
| Tranche A Term Loan, 8.50%, 3/02/15 | | 49 | | | 48,388 |
| | | | | | | 172,215 |
| Hotels, Restaurants & Leisure—0.2% | | | | | |
| Caesars Entertainment Operating Co., Inc., | | | | | |
| Term Loan B-3, 3.00%—3.58%, 1/28/15 | | 64 | | | 55,208 |
| Travelport LLC (FKA Travelport, Inc.): (a) | | | | | |
| Extended Tranche A Term Loan, 6.00%, 9/28/12 | 36 | | | 17,883 |
| Extended Tranche B Term Loan, 13.87%, 12/01/16 | 108 | | | 19,507 |
| | | | | | | 92,598 |
| Independent Power Producers & Energy Traders—0.5% | | |
| Texas Competitive Electric Holdings Co. LLC (TXU), | | | | | |
| Extended Term Loan, 4.78%, 10/10/17 (a) | | 367 | | | 231,915 |
| Industrial Conglomerates—0.2% | | | | | |
| Sequa Corp., Incremental Term Loan, 6.25%, 12/03/14 | 85 | | | 85,638 |
| Media—1.4% | | | | | |
| Clear Channel Communication, Term Loan C, 3.95%, | | | | |
| 1/28/16 (a) | | 25 | | | 17,875 |
| Intelsat Jackson Holdings SA (FKA Intelsat Jackson | | | | | |
| Holdings, Ltd.), Tranche B Term Loan, 5.25%, | | | | | |
| 4/02/18 | | | 423 | | | 418,927 |
| Newsday LLC, Fixed Rate Term Loan, 10.50%, 8/01/13 | 200 | | | 206,000 |
| | | | | | | 642,802 |
| Paper & Forest Products—0.2% | | | | | |
| NewPage Corp., DIP Term Loan, 8.00%, 3/07/13 | | 100 | | | 100,583 |
| Pharmaceuticals—0.2% | | | | | |
| Pharmaceutical Products Development, Inc., | | | | | |
| Term Loan B, 6.25%, 12/05/18 | | 75 | | | 74,450 |
| Real Estate Investment Trusts (REITs)—0.3% | | | | |
| iStar Financial, Inc., Term Loan A, 5.00%, 6/28/13 | 144 | | | 142,715 |
| Real Estate Management & Development—0.2% | | | | |
| Realogy Corp.: | | | | | |
| Extended Synthetic Letter of Credit, 4.44%, | | | | | |
| 10/10/16 | | | 15 | | | 13,534 |
| Extended Term Loan B, 4.69%, 10/10/16 | | 107 | | | 95,401 |
| | | | | | | 108,935 |
| Specialty Retail—0.0% | | | | | |
| Claire’s Stores, Inc., Term Loan B, 3.05%—3.18%, | | | | | |
| 5/29/14 | | | 24 | | | 20,890 |
| Wireless Telecommunication Services—0.8% | | | | |
| Vodafone Americas Finance 2, Inc., Initial Loan, | | | | | |
| 6.88%, 8/11/15 (i) | | 385 | | | 384,200 |
| Total Floating Rate Loan Interests—8.0% | | | | | 3,742,542 |
See Notes to Financial Statements.
| BLACKROCK SERIES FUND, INC. | DECEMBER 31, 2011 | 57 |
| BlackRock High Yield Portfolio | |
| Schedule of Investments (continued) | (Percentages shown are based on Net Assets) |
| Other Interests (a)(j) | Beneficial
Interest
(000) | | Value |
| Auto Components—0.0% | | | | | | |
| Lear Corp. Escrow | $ | | 100 | | $ | 1,000 |
| Lear Corp. Escrow | | | 150 | | | 1,500 |
| | | | | | | 2,500 |
| Household Durables—0.1% | | | | | | |
| Stanley Martin, Class B Membership Units | | | | | | |
| (acquired 4/03/06, cost $48,824) (b) | | | — | (k) | | 42,865 |
| Total Other Interests—0.1% | | | | | | 45,365 |
| |
| |
| Preferred Securities | | | | | | |
| Capital Trusts | | Par
(000) | | |
| Insurance—0.2% | | | | | | |
| Genworth Financial, Inc., 6.15%, 11/15/66 (d) | | | 165 | | | 89,100 |
| Total Capital Trusts—0.2% | | | | | | 89,100 |
| |
| |
| Preferred Stocks | | Shares | | |
| Auto Components—0.8% | | | | | | |
| Dana Holding Corp., 4.00% (c) | | | 3,380 | | | 361,660 |
| Diversified Financial Services—0.8% | | | | | | |
| Ally Financial, Inc., 7.00% (c) | | | 520 | | | 372,759 |
| Real Estate Investment Trusts (REITs)—0.0% | | | | | | |
| MPG Office Trust, Inc., Series A, 7.63% (a) | | | 1,788 | | | 22,332 |
| Thrifts & Mortgage Finance—0.1% | | | | | | |
| Fannie Mae, Series O, 0.00% (a)(d) | | | 10,000 | | | 20,000 |
| Freddie Mac, Series Z, 8.38% (a)(d) | | | 15,157 | | | 20,159 |
| | | | | | | 40,159 |
| Total Preferred Stocks—1.7% | | | | | | 796,910 |
| |
| |
| Trust Preferred | | | | | | |
| Diversified Financial Services—0.3% | | | | | | |
| GMAC Capital Trust I, Series 2, 8.13%, 2/15/40 | | | 8,370 | | | 159,608 |
| Total Preferred Securities—2.2% | | | | | | 1,045,618 |
| |
| |
| Warrants (l) | | | | | | |
| Media—0.1% | | | | | | |
| Cumulus Media, Inc. (Expires 3/26/19) | | | 11,780 | | | 37,378 |
| Software—0.0% | | | | | | |
| Bankruptcy Management Solutions, Inc. | | | | | | |
| (Expires 9/29/17) | | | 78 | | | 1 |
| Total Warrants—0.1% | | | | | | 37,379 |
| Total Long-Term Investments | | | | | | |
| (Cost—$41,953,404)—88.6% | | | | | | 41,458,782 |
| Short-Term Securities | Shares | Value |
| BlackRock Liquidity Funds, TempFund, | | | | | |
| Institutional Class, 0.10%, (m)(n) | 5,383,394 | | $ | 5,383,394 | |
| Total Short-Term Securities | | | | | |
| (Cost—$5,383,394)—11.5% | | | | 5,383,394 | |
| Total Investments (Cost—$47,336,798)—100.1% | | 46,842,176 | |
| Liabilities in Excess of Other Assets—(0.1)% | | | | (38,238 | ) |
| Net Assets—100.0% | | | $ | 46,803,938 | |
| | | | | | |
| (a) | | Non-income producing security. |
| (b) | | Restricted security as to resale. As of report date the Portfolio held 2.1% of its net assets, with a current value of $967,397 and an original cost of $373,050 in these securities. |
| (c) | | Security exempt from registration pursuant to Rule 144A under the Securities Act of 1933. These securities may be resold in transactions exempt from registration to qualified institutional investors. |
| (d) | | Variable rate security. Rate shown is as of report date. |
| (f) | | Represents a step-up bond that pays an initial coupon rate for the first period and then a higher coupon rate for the following periods. Rate shown is as of report date. |
| (g) | | Represents a zero-coupon bond. Rate shown reflects the current yield as of report date. |
| (h) | | Issuer filed for bankruptcy and/or is in default of interest payments. |
| (i) | | Represents a payment-in-kind security which may pay interest/dividends in additional par/shares. |
| (j) | | Other interests represent beneficial interests in liquidation trusts and other reorganization or private entities. |
| (k) | | Amount is less than $500. |
| (l) | | Warrants entitle the Portfolio to purchase a predetermined number of shares of common stock and are non-income producing. The purchase price and number of shares are subject to adjustment under certain conditions until the expiration date, if any. |
| (m) | | Investments in companies considered to be an affiliate of the Portfolio during the year, for purposes of Section 2(a)(3) of the Investment Company Act of 1940, as amended, were as follows: |
| Affiliate | Shares
Held at
December 31,
2010 | Net
Activity | Shares
Held at
December 31,
2011 | Realized
Gain | Income |
| BlackRock Liquidity | | | | | | |
| Funds, TempFund, | | | | | | |
| Institutional Class | 516,144 | 4,867,250 | 5,383,394 | $83 | $1,417 |
| (n) | | Represents the current yield as of report date. |
| • | | For Portfolio compliance purposes, the Portfolio’s industry classifications refer to any one or more of the industry sub-classifications used by one or more widely recognized market indexes or rating group indexes and/or as defined by Portfolio management. These definitions may not apply for purposes of this report, which may combine industry sub-classifications for reporting ease. |
See Notes to Financial Statements.
| 58 | BLACKROCK SERIES FUND, INC. | DECEMBER 31, 2011 |
BlackRock High Yield Portfolio
Schedule of Investments (concluded)
| • | | Credit default swaps on single-name issuer—buy protection outstanding as of December 31, 2011 were as follows: |
| Issuer | Pay Fixed Rate | Counterparty | Expiration Date | Notional Amount
(000) | Unrealized
Depreciation |
| MGM Resorts International | 5.00 | % | Deutsche Bank AG | 6/20/15 | $ | 15 | | $ | (242 | ) |
| MGM Resorts International | 5.00 | % | Deutsche Bank AG | 6/20/15 | $ | 15 | | | (94 | ) |
| Total | | | | | | | | $ | (336 | ) |
| • | | Credit default swaps on traded indexes—sold protection outstanding as of December 31, 2011 were as follows: |
| Index | Receive
Fixed Rate | Counterparty | Expiration
Date | Credit
Rating1 | Notional
Amount
(000)2 | Unrealized
Appreciation |
| Dow Jones CDX North America | | | | | | | | | |
| High Yield Index Series 17 | 5.00 | % | Credit Suisse International | 12/20/16 | B+ | $ | 3,920 | $ | 46,662 |
| 1 | | Using S&P’s rating of the underlying securities. |
| 2 | | The maximum potential amount the Portfolio may pay should a negative credit event take place as defined under the terms of agreement. |
| • | | Fair Value Measurements—Various inputs are used in determining the fair value of investments and derivative financial instruments. These inputs are categorized into a disclosure hierarchy consisting of three broad levels for financial statement purposes as follows: |
| • | | Level 1—unadjusted price quotations in active markets/exchanges for identical assets and liabilities |
| • | | Level 2—other observable inputs (including, but not limited to: quoted prices for similar assets or liabilities in markets that are active, quoted prices for identical or similar assets or liabilities in markets that are not active, inputs other than quoted prices that are observable for the assets or liabilities (such as interest rates, yield curves, volatilities, prepayment speeds, loss severities, credit risks and default rates) or other market-corroborated inputs) |
| • | | Level 3—unobservable inputs based on the best information available in the circumstances, to the extent observable inputs are not available (including the Portfolio’s own assumptions used in determining the fair value of investments and derivative financial instruments) |
Changes in valuation techniques may result in transfers in or out of an assigned level within the disclosure hierarchy. The categorization of a value determined for investments and derivative financial instruments is based on the pricing transparency of the investment and derivative financial instrument and does not necessarily correspond to Portfolio’s perceived risk of investing in those securities. For information about the Portfolio’s policy regarding valuation of investments and derivative financial instruments and other significant accounting policies, please refer to Note 1 of the Notes to Financial Statements.
The following tables summarize the inputs used as of December 31, 2011 in determining the fair valuation of Portfolio’s investments and derivative financial instruments:
| Valuation Inputs | Level 1 | Level 2 | Level 3 | Total |
| Assets: | | | | | | | | | | | | |
| Investments: | | | | | | | | | | | | |
| Long-Term Investments:1 |
| Common Stocks | $ | 28,464 | | $ | 924,532 | | $ | 7,532 | | $ | 960,528 | |
| Corporate Bonds | | — | | | 35,369,836 | | | 257,514 | | | 35,627,350 | |
| Floating Rate Loan | | | | | | | | | | | | |
| Interests | | — | | | 3,077,555 | | | 664,987 | | | 3,742,542 | |
| Other Interests | | — | | | — | | | 45,365 | | | 45,365 | |
| Preferred Securities | | 222,099 | | | 823,519 | | | — | | | 1,045,618 | |
| Warrants | | — | | | 37,378 | | | 1 | | | 37,379 | |
| Short-Term Securities | | 5,383,394 | | | — | | | — | | | 5,383,394 | |
| Total | $ | 5,633,957 | | $ | 40,232,820 | | $ | 975,399 | | $ | 46,842,176 | |
| | | | | | | | | | | | | |
| Valuation Inputs | Level 1 | Level 2 | Level 3 | Total |
| Derivative Financial | | | | | | | | | | | | |
| Instruments2 |
| Assets: | | | | | | | | | | | | |
| Credit contracts | | — | | $ | 46,662 | | | — | | $ | 46,662 | |
| Liabilities: | | | | | | | | | | | | |
| Credit contracts | | — | | | (336 | ) | | — | | | (336 | ) |
| Total | | — | | $ | 46,326 | | | — | | $ | 46,326 | |
| 1 | | See above Schedule of Investments for values in each industry. |
| 2 | | Derivative financial instruments are swaps, which are valued at the unrealized appreciation/depreciation on the instrument. |
The following table is a reconciliation of Level 3 investments for which significant unobservable inputs were used to determine fair value:
| | Common
Stocks | Corporate
Bonds | Floating Rate
Loan Interests | Other
Interests | Warrants | Unfunded
Loan
Commitments | Total |
| Balance, as of December 31, 2010 | | — | | $ | 359,107 | | $ | 1,457,114 | | $ | 35,225 | | $ | 1 | $ | (1,289 | ) | $ | 1,850,158 | |
| Accrued discounts/premiums | | — | | | 1,284 | | | 4,275 | | | — | | | — | | — | | | 5,559 | |
| Net realized gain (loss) | | — | | | 7,094 | | | 17,030 | | | — | | | — | | — | | | 24,124 | |
Net change in unrealized
appreciation/depreciation4 | $ | (407 | ) | | 15,275 | | | (33,099 | ) | | 11,952 | | | — | | 1,289 | | | (4,990 | ) |
| Purchases | | 7,530 | | | — | | | 165,470 | | | — | | | — | | — | | | 173,000 | |
| Sales | | — | | | (58,684 | ) | | (751,980 | ) | | (1,812 | ) | | — | | — | | | (812,476 | ) |
| Transfers in5 | | 409 | | | 8 | | | — | | | — | | | — | | — | | | 417 | |
| Transfers out5 | | — | | | (66,570 | ) | | (193,823 | ) | | — | | | — | | — | | | (260,393 | ) |
| Balance, as of December 31, 2011 | $ | 7,532 | | $ | 257,514 | | $ | 664,987 | | $ | 45,365 | | $ | 1 | | — | | $ | 975,399 | |
| 4 | | Included in the related net change in unrealized appreciation/depreciation on the Statements of Operations. The change in unrealized appreciation/depreciation on the securities still held at December 31, 2011 was $469. |
| 5 | | The Portfolio’s policy is to recognize transfers in and transfers out as of the beginning of the period of the event or the change in circumstances that caused the transfer. |
See Notes to Financial Statements.
| BLACKROCK SERIES FUND, INC. | DECEMBER 31, 2011 | 59 |
| BlackRock Large Cap Core Portfolio | |
| Schedule of Investments December 31, 2011 | (Percentages shown are based on Net Assets) |
| Common Stocks | Shares | | Value |
| Aerospace & Defense—4.7% | | | | |
| General Dynamics Corp. | 27,000 | | $ | 1,793,070 |
| L-3 Communications Holdings, Inc. | 24,000 | | | 1,600,320 |
| Lockheed Martin Corp. | 23,000 | | | 1,860,700 |
| Northrop Grumman Corp. | 30,000 | | | 1,754,400 |
| | | | | 7,008,490 |
| Airlines—0.5% | | | | |
| Southwest Airlines Co. | 84,000 | | | 719,040 |
| Beverages—2.2% | | | | |
| Coca-Cola Enterprises, Inc. | 63,000 | | | 1,624,140 |
| Dr. Pepper Snapple Group, Inc. | 44,000 | | | 1,737,120 |
| | | | | 3,361,260 |
| Biotechnology—4.0% | | | | |
| Amgen, Inc. | 34,000 | | | 2,183,140 |
| Biogen Idec, Inc. (a) | 17,000 | | | 1,870,850 |
| Gilead Sciences, Inc. (a) | 47,000 | | | 1,923,710 |
| | | | | 5,977,700 |
| Chemicals—1.9% | | | | |
| CF Industries Holdings, Inc. | 12,000 | | | 1,739,760 |
| LyondellBasell Industries NV, Class A | 35,000 | | | 1,137,150 |
| | | | | 2,876,910 |
| Communications Equipment—1.1% | | | | |
| Motorola Solutions, Inc. | 36,000 | | | 1,666,440 |
| Computers & Peripherals—6.3% | | | | |
| Apple, Inc. (a) | 8,000 | | | 3,240,000 |
| Dell, Inc. (a) | 120,000 | | | 1,755,600 |
| Lexmark International, Inc., Class A | 46,000 | | | 1,521,220 |
| Seagate Technology Plc | 84,000 | | | 1,377,600 |
| Western Digital Corp. (a) | 49,000 | | | 1,516,550 |
| | | | | 9,410,970 |
| Construction & Engineering—1.0% | | | | |
| Chicago Bridge & Iron Co. NV | 40,000 | | | 1,512,000 |
| Consumer Finance—2.1% | | | | |
| Capital One Financial Corp. | 38,000 | | | 1,607,020 |
| Discover Financial Services, Inc. | 67,000 | | | 1,608,000 |
| | | | | 3,215,020 |
| Diversified Consumer Services—2.8% | | | | |
| Apollo Group, Inc., Class A (a) | 32,000 | | | 1,723,840 |
| ITT Educational Services, Inc. (a)(b) | 21,000 | | | 1,194,690 |
| Weight Watchers International, Inc. | 23,000 | | | 1,265,230 |
| | | | | 4,183,760 |
| Diversified Financial Services—0.6% | | | | |
| Moody’s Corp. | 26,000 | | | 875,680 |
| Diversified Telecommunication Services—0.4% | | | | |
| AT&T, Inc. | 21,000 | | | 635,040 |
| Energy Equipment & Services—0.9% | | | | |
| Unit Corp. (a) | 30,000 | | | 1,392,000 |
| Food & Staples Retailing—2.2% | | | | |
| The Kroger Co. | 68,000 | | | 1,646,960 |
| Safeway, Inc. | 76,000 | | | 1,599,040 |
| | | | | 3,246,000 |
| Food Products—1.1% | | | | |
| ConAgra Foods, Inc. | 64,000 | | | 1,689,600 |
| Health Care Equipment & Supplies—0.4% | | | | |
| Hill-Rom Holdings, Inc. | 19,000 | | | 640,110 |
| Health Care Providers & Services—9.0% | | | | |
| Aetna, Inc. | 39,000 | | | 1,645,410 |
| AmerisourceBergen Corp. | 43,000 | | | 1,599,170 |
| Cardinal Health, Inc. | 38,000 | | | 1,543,180 |
| Cigna Corp. | 7,000 | | | 294,000 |
| Common Stocks | Shares | | Value |
| Health Care Providers & Services (concluded) | | | | |
| Coventry Health Care, Inc. (a) | 47,000 | | $ | 1,427,390 |
| Health Management Associates, Inc., Class A (a) | 131,000 | | | 965,470 |
| Humana, Inc. | 4,000 | | | 350,440 |
| McKesson Corp. | 23,000 | | | 1,791,930 |
| UnitedHealth Group, Inc. | 42,000 | | | 2,128,560 |
| WellPoint, Inc. | 26,000 | | | 1,722,500 |
| | | | | 13,468,050 |
| Household Products—0.5% | | | | |
| The Procter & Gamble Co. | 11,000 | | | 733,810 |
| Independent Power Producers & Energy Traders—2.9% | | |
| The AES Corp. (a) | 133,000 | | | 1,574,720 |
| Constellation Energy Group, Inc. | 40,000 | | | 1,586,800 |
| NRG Energy, Inc. (a) | 67,000 | | | 1,214,040 |
| | | | | 4,375,560 |
| Industrial Conglomerates—1.7% | | | | |
| General Electric Co. | 41,000 | | | 734,310 |
| Tyco International Ltd. | 39,000 | | | 1,821,690 |
| | | | | 2,556,000 |
| Insurance—1.5% | | | | |
| Arch Capital Group Ltd. (a) | 14,000 | | | 521,220 |
| Assurant, Inc. | 15,000 | | | 615,900 |
| Unum Group | 51,000 | | | 1,074,570 |
| | | | | 2,211,690 |
| Internet & Catalog Retail—1.0% | | | | |
| Expedia, Inc. | 28,500 | | | 827,070 |
| TripAdvisor, Inc. (a) | 28,500 | | | 718,485 |
| | | | | 1,545,555 |
| Internet Software & Services—0.4% | | | | |
| Google, Inc., Class A (a) | 1,000 | | | 645,900 |
| IT Services—2.0% | | | | |
| International Business Machines Corp. | 7,000 | | | 1,287,160 |
| The Western Union Co. | 90,000 | | | 1,643,400 |
| | | | | 2,930,560 |
| Leisure Equipment & Products—1.0% | | | | |
| Polaris Industries, Inc. | 26,000 | | | 1,455,480 |
| Life Sciences Tools & Services—0.9% | | | | |
| Agilent Technologies, Inc. (a) | 38,000 | | | 1,327,340 |
| Media—2.3% | | | | |
| CBS Corp., Class B | 64,000 | | | 1,736,960 |
| Time Warner Cable, Inc. | 27,000 | | | 1,716,390 |
| | | | | 3,453,350 |
| Multi-Utilities—1.1% | | | | |
| Ameren Corp. | 51,000 | | | 1,689,630 |
| Multiline Retail—1.6% | | | | |
| Dillard’s, Inc., Class A | 18,000 | | | 807,840 |
| Nordstrom, Inc. | 31,000 | | | 1,541,010 |
| | | | | 2,348,850 |
| Oil, Gas & Consumable Fuels—8.5% | | | | |
| Chevron Corp. | 10,000 | | | 1,064,000 |
| Exxon Mobil Corp. | 40,000 | | | 3,390,400 |
| HollyFrontier Corp. | 66,000 | | | 1,544,400 |
| Marathon Oil Corp. | 65,000 | | | 1,902,550 |
| Murphy Oil Corp. | 27,000 | | | 1,504,980 |
| Tesoro Corp. (a)(b) | 71,000 | | | 1,658,560 |
| Valero Energy Corp. | 78,000 | | | 1,641,900 |
| | | | | 12,706,790 |
| Paper & Forest Products—2.2% | | | | |
| International Paper Co. | 57,000 | | | 1,687,200 |
| MeadWestvaco Corp. | 52,000 | | | 1,557,400 |
| | | | | 3,244,600 |
See Notes to Financial Statements.
| 60 | BLACKROCK SERIES FUND, INC. | DECEMBER 31, 2011 |
| BlackRock Large Cap Core Portfolio | |
| Schedule of Investments (concluded) | (Percentages shown are based on Net Assets) |
| Common Stocks | Shares | | Value |
| Personal Products—1.1% | | | | | | |
| Herbalife Ltd. | | 31,000 | | $ | 1,601,770 | |
| Pharmaceuticals—7.5% | | | | | | |
| Abbott Laboratories | | 23,000 | | | 1,293,290 | |
| Bristol-Myers Squibb Co. | | 67,000 | | | 2,361,080 | |
| Eli Lilly & Co. | | 48,000 | | | 1,994,880 | |
| Forest Laboratories, Inc. (a) | | 52,000 | | | 1,573,520 | |
| Johnson & Johnson | | 9,000 | | | 590,220 | |
| Pfizer, Inc. | | 161,000 | | | 3,484,040 | |
| | | | | | 11,297,030 | |
| Semiconductors & Semiconductor Equipment—9.0% | | | |
| Applied Materials, Inc. | | 137,000 | | | 1,467,270 | |
| Avago Technologies Ltd. | | 50,000 | | | 1,443,000 | |
| KLA-Tencor Corp. | | 33,000 | | | 1,592,250 | |
| Marvell Technology Group Ltd. (a) | | 97,000 | | | 1,343,450 | |
| Maxim Integrated Products, Inc. | | 62,000 | | | 1,614,480 | |
| Novellus Systems, Inc. (a) | | 37,000 | | | 1,527,730 | |
| NVIDIA Corp. (a) | | 102,000 | | | 1,413,720 | |
| Teradyne, Inc. (a)(b) | | 107,000 | | | 1,458,410 | |
| Xilinx, Inc. | | 50,000 | | | 1,603,000 | |
| | | | | | 13,463,310 | |
| Software—3.6% | | | | | | |
| Activision Blizzard, Inc. | | 127,000 | | | 1,564,640 | |
| Microsoft Corp. | | 87,000 | | | 2,258,520 | |
| Symantec Corp. (a) | | 100,000 | | | 1,565,000 | |
| | | | | | 5,388,160 | |
| Specialty Retail—4.8% | | | | | | |
| AutoZone, Inc. (a) | | 2,000 | | | 649,940 | |
| Best Buy Co., Inc. | | 68,000 | | | 1,589,160 | |
| Foot Locker, Inc. | | 17,000 | | | 405,280 | |
| GameStop Corp., Class A (a)(b) | | 64,000 | | | 1,544,320 | |
| Limited Brands, Inc. | | 38,000 | | | 1,533,300 | |
| Williams-Sonoma, Inc. | | 39,000 | | | 1,501,500 | |
| | | | | | 7,223,500 | |
| Textiles, Apparel & Luxury Goods—1.1% | | | | | | |
| Coach, Inc. | | 28,000 | | | 1,709,120 | |
| Tobacco—3.3% | | | | | | |
| Lorillard, Inc. | | 15,000 | | | 1,710,000 | |
| Philip Morris International, Inc. | | 41,000 | | | 3,217,680 | |
| | | | | | 4,927,680 | |
| Wireless Telecommunication Services—0.9% | | | | | | |
| MetroPCS Communications, Inc. (a) | | 156,000 | | | 1,354,080 | |
| Total Long-Term Investments | | | | | | |
| (Cost—$139,091,863)—100.1% | | | | | 150,067,835 | |
| |
| |
| Short-Term Securities | Beneficial
Interest
(000) | | | |
| BlackRock Liquidity Series, LLC Money | | | | | | |
| Market Series, 0.22% (c)(d)(e) | $ | 5,241 | | | 5,240,782 | |
| Total Short-Term Securities | | | | | | |
| (Cost—$5,240,782)—3.5% | | | | | 5,240,782 | |
| Total Investments | | | | | | |
| (Cost—$144,332,645)—103.6% | | | | | 155,308,617 | |
| Liabilities in Excess of Other Assets—(3.6)% | | | | | (5,358,488 | ) |
| Net Assets—100.0% | | | | $ | 149,950,129 | |
| (a) | | Non-income producing security. |
| (b) | | Security, or a portion of security, is on loan. |
| (c) | | Represents the current yield as of report date. |
| (d) | | Investments in companies considered to be an affiliate of the Portfolio during the year, for purposes of Section 2(a)(3) of the Investment Company Act of 1940, as amended, were as follows: |
| Affiliate | Beneficial
Interest
Held at
December 31,
2010 | Net
Activity | Beneficial
Interest
Held at
December 31,
2011 | Income |
| BlackRock Liquidity Funds, | | | | | | | |
| TempFund, Institutional Class | — | | — | | — | $ | 120 |
| BlackRock Liquidity Series LLC, | | | | | | | |
| Money Market Series | — | $ | 5,240,782 | $ | 5,240,782 | $ | 9,657 |
| (e) | | Security was purchased with the cash collateral from loaned securities. |
| • | | For Portfolio compliance purposes, the Portfolio’s industry classifications refer to any one or more of the industry sub-classifications used by one or more widely recognized market indexes or rating group indexes and/or as defined by Portfolio management. These definitions may not apply for purposes of this report, which may combine industry sub-classifications for reporting ease. |
| • | | Fair Value Measurements—Various inputs are used in determining the fair value of investments. These inputs are categorized into a disclosure hierarchy consisting of three broad levels for financial statement purposes as follows: |
| • | | Level 1—unadjusted price quotations in active markets/exchanges for identical assets and liabilities |
| • | | Level 2—other observable inputs (including, but not limited to: quoted prices for similar assets or liabilities in markets that are active, quoted prices for identical or similar assets or liabilities in markets that are not active, inputs other than quoted prices that are observable for the assets or liabilities (such as interest rates, yield curves, volatilities, prepayment speeds, loss severities, credit risks and default rates) or other market-corroborated inputs) |
| • | | Level 3—unobservable inputs based on the best information available in the circumstances, to the extent observable inputs are not available (including the Portfolio’s own assumptions used in determining the fair value of investments) |
Changes in valuation techniques may result in transfers in or out of an assigned level within the disclosure hierarchy. The categorization of a value determined for investments is based on the pricing transparency of the investment and does not necessarily correspond to the Portfolio’s perceived risk of investing in those securities. For information about the Portfolio’s policy regarding valuation of investments and other significant accounting policies, please refer to Note 1 of the Notes to Financial Statements.
The following table summarizes the inputs used as of December 31, 2011 in determining the fair valuation of the Portfolio’s investments:
| Valuation Inputs | | Level 1 | | | Level 2 | | | Level 3 | | | Total | |
| Assets: | | | | | | | | | | | | |
| Investments: | | | | | | | | | | | | |
| Long-Term Investments1 | $ | 150,067,835 | | | — | | | — | | $ | 150,067,835 | |
| Short-Term Securities | | — | | $ | 5,240,782 | | | — | | | 5,240,782 | |
| Total | $ | 150,067,835 | | $ | 5,240,782 | | | — | | $ | 155,308,617 | |
| 1 | | See above Schedule of Investments for values in each industry. |
See Notes to Financial Statements.
| BLACKROCK SERIES FUND, INC. | DECEMBER 31, 2011 | 61 |
| BlackRock Money Market Portfolio | |
| Schedule of Investments December 31, 2011 | (Percentages shown are based on Net Assets) |
| Certificates of Deposit (a) | Par
(000) | | Value |
| Yankee—16.1% | | | |
| Bank of Montreal, Chicago: | | | |
| 0.37%, 1/25/12 (b) | $1,000 | $ | 1,000,000 |
| 0.23%, 3/01/12 | 2,000 | | 2,000,000 |
| Bank Of Nova Scotia, Houston, 0.28%, | | | |
| 2/21/12 | 2,000 | | 2,000,000 |
| Bank of Tokyo-Mitsubishi UFJ Ltd., NY, | | | |
| 0.41%, 2/07/12 | 2,000 | | 2,000,000 |
| Credit Suisse, NY, 0.40%, 1/26/12 | 2,000 | | 2,000,000 |
| Mizuho Corporate Bank, Ltd., NY, 0.20%, | | | |
| 1/31/12 | 3,000 | | 3,000,000 |
| National Australia Bank, NY: | | | |
| 0.32%, 1/19/12 | 2,000 | | 2,000,000 |
| 0.37%, 2/10/12 (b) | 1,000 | | 1,000,000 |
| 0.32%, 2/21/12 | 2,000 | | 2,000,000 |
| Rabobank Nederland NV, NY: | | | |
| 0.24%, 1/17/12 | 2,000 | | 2,000,000 |
| 0.43%, 3/01/12 | 2,000 | | 2,000,000 |
| Sumitomo Mitsui Banking Corp., NY, 0.35%, | | | |
| 1/12/12 | 3,000 | | 3,000,000 |
| Sumitomo Trust & Banking Co Ltd., NY, | | | |
| 0.23%, 1/06/12 | 2,000 | | 2,000,000 |
| Toronto-Dominion Bank, NY: | | | |
| 0.36%, 1/12/12 (b) | 1,000 | | 1,000,000 |
| 0.28%, 1/20/12 | 2,355 | | 2,355,000 |
| 0.37%, 4/17/12 | 2,000 | | 2,000,000 |
| Total Certificates of Deposit—16.1% | | | 31,355,000 |
| |
| Commercial Paper | | | |
| Amsterdam Funding Corp., 0.32%, 1/05/12 (c) | 3,000 | | 2,999,893 |
| Bank of Tokyo-Mitsubishi UFJ Ltd., 0.33%, | | | |
| 1/06/12 (c) | 3,000 | | 2,999,862 |
| Cancara Asset Securitisation LLC, 0.31%, | | | |
| 1/13/12 (c) | 4,000 | | 3,999,587 |
| Chariot Funding LLC, 0.14%, 1/12/12 (c) | 7,500 | | 7,499,679 |
| Commonwealth Bank of Australia, 0.34%, | | | |
| 2/15/12 (c) | 3,000 | | 2,998,725 |
| CRC Funding LLC, 0.32%, 1/19/12 (c) | 2,215 | | 2,214,646 |
| Credit Suisse NY, 0.35%, 1/12/12 (c) | 3,000 | | 2,999,679 |
| Deutsche Bank Financial LLC, 0.44%, | | | |
| 1/10/12 (c) | 2,000 | | 1,999,780 |
| Fairway Finance Corp., 0.31%, 4/13/12 (b) | 3,000 | | 3,000,000 |
| Govco LLC, 0.31%, 1/27/12 (c) | 2,000 | | 1,999,552 |
| Grampian Funding LLC, 0.31%, 1/10/12 (c) | 2,000 | | 1,999,845 |
| ING (U.S.) Funding LLC, 0.26%, 1/18/12 (c) | 4,200 | | 4,199,484 |
| Kells Funding LLC, 0.50%, 2/10/12 (b) | 2,000 | | 2,000,000 |
| JPMorgan Chase & Co., 0.31%, 3/16/12 (b) | 1,000 | | 1,000,000 |
| MetLife Short Term Funding LLC, 0.34%, | | | |
| 1/17/12 (c) | 2,215 | | 2,214,665 |
| Mizuho Funding LLC, 0.21%, 1/18/12 (c) | 2,200 | | 2,199,782 |
| Nordea North America, Inc. (c): | | | |
| 0.43%, 2/16/12 | 3,000 | | 2,998,352 |
| 0.37%, 1/23/12 | 805 | | 804,818 |
| RBS Holdings USA, Inc., 0.25%, 1/06/12 (c) | | | 3,000 |
| 2,999,896 | | | |
| Salisbury Receivables Co., 0.29%, 1/30/12 (c) | 2,500 | | 2,499,416 |
| Solitaire Funding LLC, 0.39%, 1/23/12 (c) | 1,500 | | 1,499,642 |
| State Street Corp., 0.22%, 3/05/12 (c) | 3,000 | | 2,998,827 |
| Sumitomo Mitsui Banking Corp., 0.40%, | | | |
| 2/10/12 (c) | 1,000 | | 999,556 |
| Commercial Paper | Par
(000) | | Value |
| Thames Asset Global Securitization No . 1 Inc. (c): | | | |
| 0.32%, 1/06/12 | $3,000 | $ | 2,999,867 |
| 0.25%, 1/12/12 | 3,000 | | 2,999,771 |
| UBS Finance (Delaware) LLC, 0.48%, | | | |
| 2/13/12 (c) | 2,000 | | 1,998,853 |
| Victory Receivables Corp. (c): | | | |
| 0.35%, 1/04/12 | 3,000 | | 2,999,912 |
| 0.35%, 1/06/12 | 4,000 | | 3,999,806 |
| 0.37%, 1/12/12 | 2,215 | | 2,214,750 |
| Westpac Banking Corp. (b): | | | |
| 0.35%, 1/06/12 | 2,500 | | 2,500,000 |
| 0.42%, 1/13/12 | 2,500 | | 2,500,000 |
| Westpac Securities NZ Ltd., 0.32%, | | | |
| 2/22/12 (c) | 3,000 | | 2,998,613 |
| Total Commercial Paper—44.3% | | | 86,337,258 |
| |
| Corporate Notes | | | |
| JPMorgan Chase Bank NA, 0.43%, | | | |
| 1/16/13 (b) | 2,310 | | 2,310,000 |
| Total Corporate Notes—1.2% | | | 2,310,000 |
| |
| Municipal Bonds (d) | | | |
| Brazos River Harbor TX Nav. District, RB, | | | |
| VRDN, Joint Venture Project, AMT | | | |
| (JPMorgan Chase Bank LOC), 0.09%, | | | |
| 1/03/12 | 2,100 | | 2,100,000 |
| California HFA, RB, VRDN, AMT Home | | | |
| Mortgage, Series U (Freddie Mac LOC, | | | |
| Fannie Mae LOC), 0.09%, 1/06/12 | 1,300 | | 1,300,000 |
| City & County of San Francisco California, | | | |
| COP, FLOATS, VRDN, Series B001 (Morgan | | | |
| Stanley Bank Liquidity Facility), 0.34%, | | | |
| 1/06/12 (e) | 1,300 | | 1,300,000 |
| City of Houston Texas, Refunding RB, VRDN, | | | |
| First Lien, Series B-3 (Sumitomo Mitsui | | | |
| Banking LOC), 0.07%, 1/06/12 | 3,000 | | 3,000,000 |
| Colorado Housing & Finance Authority, RB, | | | |
| VRDN, Class I, Series A-3, AMT (Fannie Mae | | | |
| LOC, Freddie Mac LOC), 0.11%, 1/06/12 | 2,500 | | 2,500,000 |
| County of Catawba North Carolina, RB, VRDN, | | | |
| Catawba Valley Medical Center (Branch | | | |
| Banking & Trust LOC), 0.31%, 1/06/12 | 4,285 | | 4,285,000 |
| County of Pitkin Colorado, Refunding RB, VRDN, | | | |
| Aspen Skiing Co. Project, Series A (JPMorgan | | | |
| Chase & Co. LOC), 0.07%, 1/03/12 | 2,000 | | 2,000,000 |
| Michigan State HDA, Refunding RB, VRDN, | | | |
| Series D (Fannie Mae LOC, Freddie Mac LOC), | | | |
| 0.09%, 1/06/12 | 1,465 | | 1,465,000 |
| New York City Industrial Development Agency, RB, | | | |
| VRDN, New York Law School Project, Series A | | | |
| (JPMorgan Chase Bank LOC), 0.06%, 1/06/12 | 1,875 | | 1,875,000 |
| Rhode Island Housing & Mortgage Finance Corp., | | | |
| RB, VRDN, Groves at Johnston Project, AMT | | | |
| (Freddie Mac LOC), 0.10%, 1/06/12 | 3,600 | | 3,600,000 |
| State of California, GO, VRDN, Series C-4 (JPMorgan | | | |
| Chase & Co. LOC), 0.04%, 1/03/12 | 3,300 | | 3,300,000 |
| Total Municipal Bonds—13.7% | | | 26,725,000 |
See Notes to Financial Statements.
| 62 | BLACKROCK SERIES FUND, INC. | DECEMBER 31, 2011 |
| BlackRock Money Market Portfolio | |
| Schedule of Investments (concluded) | (Percentages shown are based on Net Assets) |
| US Government Sponsored Agency Obligations | Par
(000) | Value |
| Fannie Mae Discount Notes, 0.16%, | | |
| 8/01/12 (c) | $2,590 | $ 2,587,548 |
| Fannie Mae Variable Rate Notes (b): | | |
| 0.30%, 7/26/12 | 2,500 | 2,499,717 |
| 0.33%, 9/17/12 | 2,500 | 2,499,640 |
| 0.34%, 12/20/12 | 1,500 | 1,499,706 |
| Federal Home Loan Bank Bonds, 0.17%, | | |
| 4/23/12 | 2,000 | 1,999,645 |
| Federal Home Loan Bank Discount | | |
| Notes (c): | | |
| 0.16%, 4/12/12 | 1,900 | 1,899,139 |
| 0.16%, 8/14/12 | 1,840 | 1,838,152 |
| Freddie Mac Discount Notes, 0.14%, | | |
| 1/23/12 (c) | 1,000 | 999,914 |
| Freddie Mac Variable Rate Notes (b): | | |
| 0.28%, 4/03/12 | 2,000 | 1,999,793 |
| 0.27%, 11/02/12 | 2,000 | 1,998,985 |
| 0.28%, 1/24/13 | 500 | 499,785 |
| 0.32%, 9/03/13 | 2,000 | 1,999,324 |
| 0.28%, 9/13/13 | 5,000 | 4,994,843 |
| Total US Government Sponsored | | |
| Agency Obligations—14.0% | | 27,316,191 |
| |
| US Treasury Obligations | | |
| US Treasury Notes: | | |
| 0.88%, 1/31/12 | 4,725 | 4,727,682 |
| 4.63%, 7/31/12 | 2,500 | 2,565,644 |
| 0.38%—4.13%, 8/31/12 | 5,800 | 5,884,064 |
| 4.25%, 9/30/12 | 3,000 | 3,092,603 |
| Total US Treasury Obligations—8.3% | | 16,269,993 |
| |
| Repurchase Agreements | | |
| Deutsche Bank Securities, Inc., 0.05%, | | |
| 1/03/12 (Purchased on 12/30/11 to | | |
| be repurchased at $4,015,022, | | |
| collateralized by Freddie Mac Medium | | |
| Term Notes, 3.15% due 10/28/20, par | | |
| and fair values of $4,067,000 and | | |
| $4,095,896, respectively) | 4,015 | 4,015,000 |
| Total Repurchase Agreements—2.0% | | 4,015,000 |
| Total Investments (Cost—$194,328,442*)—99.6% | | 194,328,442 |
| Other Assets Less Liabilities—0.4% | | 732,621 |
| Net Assets—100.0% | | $195,061,063 |
| * | | Cost for federal income tax purposes. |
| (a) | | Issuer is a US branch of foreign domiciled bank. |
| (b) | | Variable rate security. Rate shown is as of report date. |
| (c) | | Rates shown are discount rates or a range of discount rates paid at the time of purchase. |
| (d) | | Variable rate security. Rate shown is as of report date and maturity shown is the date the principal owed can be recovered through demand. |
| (e) | | Security exempt from registration pursuant to Rule 144A under the Securities Act of 1933. These securities may be resold in transactions exempt from registration to qualified institutional investors. |
| • | | Fair Value Measurements—Various inputs are used in determining the fair value of investments. These inputs are categorized into a disclosure hierarchy consisting of three broad levels for financial statement purposes as follows: |
| • | | Level 1—unadjusted price quotations in active markets/exchanges for identical assets and liabilities |
| • | | Level 2—other observable inputs (including, but not limited to: quoted prices for similar assets or liabilities in markets that are active, quoted prices for identical or similar assets or liabilities in markets that are not active, inputs other than quoted prices that are observable for the assets or liabilities (such as interest rates, yield curves, volatilities, prepayment speeds, loss severities, credit risks and default rates) or other market-corroborated inputs) |
| • | | Level 3—unobservable inputs based on the best information available in the circumstances, to the extent observable inputs are not available (including the Portfolio’s own assumptions used in determining the fair value of investments) |
Changes in valuation techniques may result in transfers in or out of an assigned level within the disclosure hierarchy. The categorization of a value determined for investments is based on the pricing transparency of the investment and does not necessarily correspond to the Portfolio’s perceived risk of investing in those securities. For information about the Portfolio’s policy regarding valuation of investments and other significant accounting policies, please refer to Note 1 of the Notes to Financial Statements.
The following table summarizes the inputs used as of December 31, 2011 in determining the fair valuation of the Portfolio’s investments:
| Valuation Inputs | Level 1 | Level 2 | Level 3 | Total |
| Assets: | | | | |
| Investments: | | | | |
| Short-Term Securities1 | — | $194,328,442 | — | $194,328,442 |
| 1 | | See above Schedule of Investments for values in each security type. |
See Notes to Financial Statements.
| BLACKROCK SERIES FUND, INC. | DECEMBER 31, 2011 | 63 |
| BlackRock Total Return Portfolio | |
| Schedule of Investments December 31, 2011 | (Percentages shown are based on Net Assets) |
| Asset-Backed Securities | | Par
(000) | | Value |
| 321 Henderson Receivables I LLC, | | | | |
| Series 2010-1A, Class A, 5.56%, 7/15/59 (a) | USD | 442 | $ | 477,395 |
| ACE Securities Corp., Series 2003-OP1, | | | | |
| Class A2, 1.01%, 12/25/33 (b) | | 23 | | 17,351 |
| AmeriCredit Automobile Receivables Trust: | | | | |
| Series 2011-2, Class C, 3.19%, 10/12/16 | | 215 | | 215,344 |
| Series 2011-5, Class C, 3.44%, 10/08/17 | | 90 | | 90,188 |
| Citibank Omni Master Trust (a): | | | | |
| Series 2009-A8, Class A8, 2.38%, 5/16/16 (b) | | 630 | | 633,869 |
| Series 2009-A17, Class A17, 4.90%, 11/15/18 | | 250 | | 271,908 |
| Countrywide Asset-Backed Certificates (b): | | | | |
| Series 2003-BC3, Class A2, 0.91%, 9/25/33 | | 28 | | 22,689 |
| Series 2004-5, Class A, 0.74%, 10/25/34 | | 44 | | 37,608 |
| Morgan Stanley ABS Capital I, Series 2005-HE1, | | | | |
| Class A2MZ, 0.59%, 12/25/34 (b) | | 35 | | 29,101 |
| Nelnet Student Loan Trust, Series 2006-1, | | | | |
| Class A5, 0.61%, 8/23/27 (b) | | 130 | | 120,202 |
| New Century Home Equity Loan Trust, | | | | |
| Series 2005-2, Class A2MZ, 0.55%, 6/25/35 (b) | | 103 | | 96,376 |
| Option One Mortgage Loan Trust, Series 2003-4, | | | | |
| Class A2, 0.93%, 7/25/33 (b) | | 72 | | 56,773 |
| RAAC, Series 2005-SP2, Class 2A, 0.59%, | | | | |
| 6/25/44 (b) | | 249 | | 158,358 |
| Residential Asset Securities Corp., Series | | | | |
| 2003-KS5, Class AIIB, 0.87%, 7/25/33 (b) | | 32 | | 19,942 |
| Scholar Funding Trust, Series 2011-A, | | | | |
| Class A, 1.32%, 10/28/43 (a)(b) | | 132 | | 126,783 |
| Santander Consumer Acquired Receivables Trust (a): | | | | |
| Series 2011-S1A, Class B, 1.66%, 8/15/16 | | 128 | | 126,601 |
| Series 2011-S1A, Class C, 2.01%, 8/15/16 | | 108 | | 105,830 |
| Series 2011-WO, Class C, 3.19%, 10/15/15 | | 140 | | 141,386 |
| Santander Drive Auto Receivables Trust: | | | | |
| Series 2010-2, Class B, 2.24%, 12/15/14 | | 210 | | 209,450 |
| Series 2010-2, Class C, 3.89%, 7/17/17 | | 250 | | 250,144 |
| Series 2010-B, Class B, 2.10%, 9/15/14 (a) | | 175 | | 174,682 |
| Series 2010-B, Class C, 3.02%, 0/17/16 (a) | | 185 | | 183,400 |
| Series 2011-S1A, Class B, 1.48%, 5/15/17 (a) | | 95 | | 93,581 |
| Series 2011-S1A, Class D, 3.10%, 5/15/17 (a) | | 103 | | 102,489 |
| SLM Student Loan Trust (b): | | | | |
| Series 2008-5, Class A3, 1.72%, 1/25/18 | | 105 | | 106,640 |
| Series 2008-5, Class A4, 2.12%, 7/25/23 | | 125 | | 128,284 |
| Structured Asset Securities Corp. (b): | | | | |
| Series 2004-23XS, Class 2A1, | | | | |
| 0.59%, 1/25/35 | | 95 | | 61,292 |
| Series 2005-GEL2, Class A, | | | | |
| 0.57%, 4/25/35 | | 28 | | 25,336 |
| Total Asset-Backed Securities—4.8% | | | | 4,083,002 |
| |
| Corporate Bonds | | | | |
| Auto Components—0.1% | | | | |
| BorgWarner, Inc., 4.63%, 9/15/20 | | 65 | | 69,070 |
| Capital Markets—1.6% | | | | |
| The Bear Stearns Cos., Inc., 6.95%, 8/10/12 | | 95 | | 98,518 |
| CDP Financial, Inc., 3.00%, 11/25/14 (a) | | 270 | | 280,777 |
| Credit Suisse AG, 5.40%, 1/14/20 | | 60 | | 56,590 |
| The Goldman Sachs Group, Inc., 5.25%, 7/27/21 | | 120 | | 117,065 |
| Lehman Brothers Holdings, Inc. (c)(d): | | | | |
| 6.50%, 7/19/17 | | 150 | | 15 |
| 6.75%, 12/28/17 | | 325 | | 32 |
| Corporate Bonds | | Par
(000) | | Value |
| Capital Markets (concluded) | | | | |
| Morgan Stanley: | | | | |
| 2.95%, 5/14/13 (b) | USD | 480 | $ | 460,907 |
| 5.63%, 9/23/19 | | 100 | | 92,608 |
| 5.50%, 7/28/21 | | 230 | | 212,666 |
| | | | | 1,319,178 |
| Chemicals—0.4% | | | | |
| CF Industries, Inc., 7.13%, 5/01/20 | | 185 | | 218,762 |
| The Dow Chemical Co., 4.13%, 11/15/21 | | 80 | | 82,058 |
| LyondellBasell Industries NV, 6.00%, 11/15/21 (a) | 50 | | 51,875 |
| | | | | 352,695 |
| Commercial Banks—4.2% | | | | |
| CIT Group, Inc.: | | | | |
| 7.00%, 5/01/17 | | 124 | | 124,499 |
| 7.00%, 5/02/17 (a) | | 20 | | 19,975 |
| Commerzbank AG, 6.38%, 3/22/19 | | 100 | | 91,761 |
| Corporacion Andina de Fomento, 6.88%, 3/15/12 | 220 | | 221,866 |
| DnB NOR Boligkreditt (a): | | | | |
| 2.10%, 10/14/16 | | 960 | | 952,221 |
| 2.90%, 3/29/17 | | 610 | | 620,124 |
| Eksportfinans ASA, 5.50%, 5/25/16 | | 155 | | 142,920 |
| HSBC Bank Brasil SA—Banco Multiplo, 4.00%, | | | | |
| 5/11/16 (a) | | 330 | | 327,525 |
| HSBC Bank Plc, 3.10%, 5/24/16 (a) | | 160 | | 160,009 |
| HSBC Holdings Plc, 6.10%, 1/14/42 | | 70 | | 79,343 |
| Sparebanken 1 Boligkreditt (a): | | | | |
| 1.25%, 10/25/14 | | 385 | | 382,260 |
| 2.63%, 5/27/17 | | 390 | | 393,380 |
| | | | | 3,515,883 |
| Construction Materials—0.2% | | | | |
| Inversiones CMPC SA, 4.75%, 1/19/18 (a) | | 100 | | 104,327 |
| Lafarge SA, 7.13%, 7/15/36 | | 40 | | 35,317 |
| | | | | 139,644 |
| Consumer Finance—0.5% | | | | |
| Credit Acceptance Corp., 9.13%, 2/01/17 (a) | | 175 | | 182,437 |
| Ford Motor Credit Co. LLC, 6.63%, 8/15/17 | | 100 | | 108,856 |
| SLM Corp., 6.25%, 1/25/16 | | 162 | | 157,542 |
| | | | | 448,835 |
| Diversified Financial Services—3.2% | | | | |
| Capital One Financial Corp.: | | | | |
| 3.15%, 7/15/16 | | 420 | | 421,797 |
| 4.75%, 7/15/21 | | 175 | | 180,095 |
| Citigroup, Inc.: | | | | |
| 5.00%, 9/15/14 | | 65 | | 64,331 |
| 4.59%, 12/15/15 | | 560 | | 563,582 |
| General Electric Capital Corp., 5.50%, 1/08/20 | | 175 | | 192,551 |
| JPMorgan Chase & Co.: | | | | |
| 3.15%, 7/05/16 | | 130 | | 130,609 |
| 4.63%, 5/10/21 | | 280 | | 289,702 |
| JPMorgan Chase Bank NA, 6.00%, 7/05/17 | | 450 | | 482,851 |
| Reynolds Group Issuer, Inc. (a): | | | | |
| 7.88%, 8/15/19 | | 200 | | 209,000 |
| 6.88%, 2/15/21 | | 130 | | 129,350 |
| | | | | 2,663,868 |
| Diversified Telecommunication Services—1.2% | | | |
| GTE Corp., 6.84%, 4/15/18 | | 270 | | 323,411 |
| Level 3 Financing, Inc.: | | | | |
| 8.75%, 2/15/17 | | 16 | | 16,280 |
| 8.13%, 7/01/19 (a) | | 105 | | 103,425 |
See Notes to Financial Statements.
| 64 | BLACKROCK SERIES FUND, INC. | DECEMBER 31, 2011 |
| BlackRock Total Return Portfolio | |
| Schedule of Investments (continued) | (Percentages shown are based on Net Assets) |
| Corporate Bonds | | Par
(000) | | Value |
| Diversified Telecommunication Services (concluded) | | |
| Telefonica Emisiones SAU, 4.95%, 1/15/15 | USD | 275 | $ | 273,554 |
| Verizon Communications, Inc.: | | | | |
| 3.50%, 11/01/21 | | 110 | | 114,523 |
| 6.40%, 2/15/38 | | 160 | | 203,104 |
| | | | | 1,034,297 |
| Electric Utilities—2.3% | | | | |
| Alabama Power Co., 3.95%, 6/01/21 | | 105 | | 115,170 |
| The Cleveland Electric Illuminating Co.: | | | | |
| 8.88%, 11/15/18 | | 13 | | 17,444 |
| 5.95%, 12/15/36 | | 56 | | 59,681 |
| Duke Energy Carolinas LLC, 4.25%, 12/15/41 | | 75 | | 78,468 |
| Florida Power & Light Co., 5.95%, 2/01/38 | | 225 | | 295,012 |
| Georgia Power Co., 3.00%, 4/15/16 | | 190 | | 201,462 |
| Hydro-Quebec: | | | | |
| 9.40%, 2/01/21 | | 90 | | 137,094 |
| 8.40%, 1/15/22 | | 170 | | 248,582 |
| 8.05%, 7/07/24 | | 445 | | 661,760 |
| Jersey Central Power & Light Co., 7.35%, 2/01/19 | 55 | | 69,058 |
| Trans-Allegheny Interstate Line Co., 4.00%, | | | | |
| 1/15/15 (a) | | 60 | | 62,543 |
| | | | | 1,946,274 |
| Energy Equipment & Services—1.0% | | | | |
| Ensco Plc: | | | | |
| 3.25%, 3/15/16 | | 40 | | 40,806 |
| 4.70%, 3/15/21 | | 84 | | 87,478 |
| MEG Energy Corp., 6.50%, 3/15/21 (a) | | 235 | | 240,287 |
| Peabody Energy Corp., 6.25%, 11/15/21 (a) | | 260 | | 269,100 |
| Pride International, Inc., 6.88%, 8/15/20 | | 55 | | 64,484 |
| Transocean, Inc.: | | | | |
| 6.50%, 11/15/20 | | 75 | | 77,474 |
| 6.38%, 12/15/21 | | 50 | | 53,144 |
| | | | | 832,773 |
| Food Products—0.4% | | | | |
| Kraft Foods, Inc.: | | | | |
| 6.50%, 8/11/17 | | 75 | | 89,217 |
| 5.38%, 2/10/20 | | 150 | | 173,078 |
| Sara Lee Corp., 4.10%, 9/15/20 | | 65 | | 65,599 |
| | | | | 327,894 |
| Health Care Equipment & Supplies—0.6% | | | |
| Boston Scientific Corp., 6.25%, 11/15/15 | | 280 | | 310,386 |
| CareFusion Corp., 6.38%, 8/01/19 | | 150 | | 177,127 |
| | | | | 487,513 |
| Health Care Providers & Services—0.9% | | | |
| HCA, Inc.: | | | | |
| 6.50%, 2/15/20 | | 183 | | 189,863 |
| 7.25%, 9/15/20 | | 225 | | 237,375 |
| Tenet Healthcare Corp.: | | | | |
| 6.25%, 11/01/18 (a) | | 110 | | 111,925 |
| 8.88%, 7/01/19 | | 140 | | 157,150 |
| UnitedHealth Group, Inc., 3.38%, 11/15/21 | | 35 | | 36,198 |
| | | | | 732,511 |
| Hotels, Restaurants & Leisure—0.3% | | | | |
| MGM Resorts International: | | | | |
| 10.38%, 5/15/14 | | 90 | | 102,825 |
| 11.13%, 11/15/17 | | 120 | | 136,800 |
| | | | | 239,625 |
| Independent Power Producers & Energy Traders—0.3% | | |
| Constellation Energy Group, Inc., 7.60%, 4/01/32 | 25 | | 32,216 |
| Energy Future Intermediate Holding Co. LLC, | | | | |
| 10.00%, 12/01/20 | | 230 | | 242,650 |
| | | | | 274,866 |
| Corporate Bonds | | Par
(000) | | Value |
| Insurance—2.8% | | | | |
| Allianz Finance II BV, 5.75%, 7/08/41 (b) | USD | 100 | $ | 110,120 |
| American International Group, Inc., 5.45%, | | | | |
| 5/18/17 | | 85 | | 81,229 |
| AXA SA, 5.25%, 4/16/40 (b) | | 50 | | 47,224 |
| Fairfax Financial Holdings, Ltd., 5.80%, 5/15/21 (a) | 190 | | 181,107 |
| Hartford Financial Services Group, Inc., 6.00%, | | | | |
| 1/15/19 | | 80 | | 82,103 |
| Hartford Life Global Funding Trusts, 0.73%, | | | | |
| 6/16/14 (b) | | 550 | | 520,319 |
| ING Verzekeringen NV, 3.27%, 6/21/21 (b) | | 20 | | 21,795 |
| Lincoln National Corp., 7.00%, 6/15/40 | | 70 | | 79,138 |
| Manulife Financial Corp., 3.40%, 9/17/15 | | 190 | | 191,060 |
| Metropolitan Life Global Funding I (a): | | | | |
| 2.88%, 9/17/12 | | 150 | | 151,961 |
| 2.50%, 1/11/13 | | 690 | | 698,359 |
| Prudential Financial, Inc.: | | | | |
| 5.38%, 6/21/20 | | 110 | | 117,725 |
| 4.50%, 11/15/20 | | 110 | | 110,610 |
| | | | | 2,392,750 |
| IT Services—0.2% | | | | |
| First Data Corp. (a): | | | | |
| 7.38%, 6/15/19 | | 145 | | 136,300 |
| 8.25%, 1/15/21 | | 10 | | 8,950 |
| | | | | 145,250 |
| Life Sciences Tools & Services—0.0% | | | | |
| Life Technologies Corp., 5.00%, 1/15/21 | | 25 | | 26,159 |
| Machinery—0.1% | | | | |
| Joy Global, Inc., 5.13%, 10/15/21 | | 50 | | 53,373 |
| Navistar International Corp., 3.00%, 10/15/14 (e) | 40 | | 43,100 |
| | | | | 96,473 |
| Media—3.1% | | | | |
| CBS Corp.: | | | | |
| 4.63%, 5/15/18 | | 35 | | 36,390 |
| 8.88%, 5/15/19 | | 80 | | 102,751 |
| 5.75%, 4/15/20 | | 60 | | 67,457 |
| CCH II LLC, 13.50%, 11/30/16 | | 330 | | 381,150 |
| Cox Communications, Inc., 8.38%, 3/01/39 (a) | | 150 | | 200,844 |
| Clear Channel Worldwide Holdings, Inc.: | | | | |
| 9.25%, 12/15/17 | | 53 | | 56,975 |
| Series B, 9.25%, 12/15/17 | | 393 | | 424,440 |
| Comcast Cable Communications Holdings, Inc., | | | | |
| 9.46%, 11/15/22 | | 75 | | 106,867 |
| Comcast Corp.: | | | | |
| 5.88%, 2/15/18 | | 152 | | 175,753 |
| 6.45%, 3/15/37 | | 95 | | 115,163 |
| CSC Holdings, Inc., 8.50%, 4/15/14 | | 61 | | 67,481 |
| DIRECTV Holdings LLC, 3.13%, 2/15/16 | | 56 | | 56,728 |
| NBC Universal Media LLC: | | | | |
| 5.15%, 4/30/20 | | 246 | | 273,890 |
| 4.38%, 4/01/21 | | 30 | | 31,661 |
| News America, Inc., 6.40%, 12/15/35 | | 5 | | 5,479 |
| Time Warner Cable, Inc.: | | | | |
| 5.88%, 11/15/40 | | 115 | | 124,460 |
| 5.50%, 9/01/41 | | 110 | | 115,918 |
| Time Warner, Inc.: | | | | |
| 4.70%, 1/15/21 | | 50 | | 53,836 |
| 6.10%, 7/15/40 | | 30 | | 35,170 |
| Virgin Media Secured Finance Plc, 6.50%, 1/15/18 | 150 | | 159,375 |
| | | | | 2,591,788 |
See Notes to Financial Statements.
| BLACKROCK SERIES FUND, INC. | DECEMBER 31, 2011 | 65 |
| BlackRock Total Return Portfolio | |
| Schedule of Investments (continued) | (Percentages shown are based on Net Assets) |
| Corporate Bonds | | Par
(000) | | Value |
| Metals & Mining—1.2% | | | | |
| AngloGold Ashanti Holdings Plc, 5.38%, | | | | |
| 4/15/20 | USD | 75 | $ | 74,509 |
| Barrick Gold Corp., 2.90%, 5/30/16 | | 494 | | 507,013 |
| Barrick North America Finance LLC, 4.40%, 5/30/21 | 5 | | 5,415 |
| Cliffs Natural Resources, Inc., 4.88%, 4/01/21 | | 120 | | 119,568 |
| Newcrest Finance Property, Ltd., 4.45%, | | | | |
| 11/15/21 (a) | | 115 | | 113,433 |
| Novelis, Inc., 8.75%, 12/15/20 | | 145 | | 155,512 |
| | | | | 975,450 |
| Multi-Utilities—0.2% | | | | |
| Dominion Resources, Inc., 1.95%, 8/15/16 | | 145 | | 145,714 |
| Multiline Retail—0.7% | | | | |
| Dollar General Corp., 11.88%, 7/15/17 (f) | | 185 | | 204,425 |
| Macy’s Retail Holdings, Inc.: | | | | |
| 5.90%, 12/01/16 | | 195 | | 217,907 |
| 7.45%, 7/15/17 | | 122 | | 142,446 |
| | | | | 564,778 |
| Oil, Gas & Consumable Fuels—5.1% | | | | |
| Anadarko Petroleum Corp.: | | | | |
| 5.95%, 9/15/16 | | 304 | | 344,599 |
| 6.38%, 9/15/17 | | 189 | | 219,076 |
| Arch Coal, Inc., 7.25%, 10/01/20 | | 220 | | 224,950 |
| BP Capital Markets Plc, 3.13%, 10/01/15 | | 80 | | 83,794 |
| Chesapeake Energy Corp., 6.63%, 8/15/20 | | 130 | | 139,425 |
| Consol Energy, Inc.: | | | | |
| 8.00%, 4/01/17 | | 59 | | 64,605 |
| 8.25%, 4/01/20 | | 21 | | 23,205 |
| El Paso Corp., 6.50%, 9/15/20 | | 90 | | 97,289 |
| El Paso Pipeline Partners Operating Co. LLC, | | | | |
| 6.50%, 4/01/20 | | 135 | | 148,787 |
| Enterprise Products Operating LLC: | | | | |
| 6.13%, 10/15/39 | | 100 | | 111,697 |
| Series L, 6.30%, 9/15/17 | | 125 | | 146,391 |
| KeySpan Gas East Corp., 5.82%, 4/01/41 (a) | | 60 | | 73,199 |
| Kinder Morgan Energy Partners LP: | | | | |
| 5.95%, 2/15/18 | | 50 | | 57,122 |
| 6.55%, 9/15/40 | | 25 | | 28,005 |
| 6.38%, 3/01/41 | | 40 | | 45,090 |
| Kinder Morgan Finance Co., ULC, 5.70%, 1/05/16 | 115 | | 117,588 |
| Marathon Petroleum Corp., 6.50%, 3/01/41 | | 151 | | 171,117 |
| MidAmerican Energy Holdings Co., 5.95%, 5/15/37 | 250 | | 295,426 |
| Nexen, Inc., 7.50%, 7/30/39 | | 210 | | 251,746 |
| Petrobras International Finance Co.: | | | | |
| 3.88%, 1/27/16 | | 330 | | 339,970 |
| 5.88%, 3/01/18 | | 20 | | 21,887 |
| 5.75%, 1/20/20 | | 460 | | 492,255 |
| Plains Exploration & Production Co., 10.00%, | | | | |
| 3/01/16 | | 25 | | 27,688 |
| Range Resources Corp.: | | | | |
| 7.25%, 5/01/18 | | 185 | | 197,950 |
| 5.75%, 6/01/21 | | 25 | | 27,063 |
| Rockies Express Pipeline LLC (a): | | | | |
| 3.90%, 4/15/15 | | 210 | | 207,520 |
| 6.85%, 7/15/18 | | 50 | | 51,660 |
| Western Gas Partners LP, 5.38%, 6/01/21 | | 170 | | 180,229 |
| Williams Partners LP, 4.13%, 11/15/20 | | 105 | | 107,759 |
| Woodside Finance, Ltd., 4.60%, 5/10/21 (a) | | 50 | | 51,053 |
| | | | | 4,348,145 |
| Corporate Bonds | | Par
(000) | | Value |
| Paper & Forest Products—0.2% | | | | |
| International Paper Co.: | | | | |
| 4.75%, 2/15/22 | USD | 90 | $ | 95,666 |
| 6.00%, 11/15/41 | | 70 | | 75,993 |
| | | | | 171,659 |
| Pharmaceuticals—0.3% | | | | |
| Teva Pharmaceutical Finance Co. BV, Series 2, | | | | |
| 3.65%, 11/10/21 | | 45 | | 45,771 |
| Teva Pharmaceutical Finance II BV, 3.00%, | | | | |
| 6/15/15 | | 120 | | 124,963 |
| Teva Pharmaceutical Finance IV BV, 3.65%, | | | | |
| 11/10/21 | | 110 | | 111,885 |
| | | | | 282,619 |
| Real Estate Investment Trusts (REITs)—0.6% | | | |
| ERP Operating LP, 4.63%, 12/15/21 | | 110 | | 112,173 |
| Hospitality Properties Trust, 5.63%, 3/15/17 | | 86 | | 87,100 |
| Mack-Cali Realty LP, 7.75%, 8/15/19 | | 75 | | 89,372 |
| Ventas Realty LP, 4.75%, 6/01/21 | | 65 | | 62,735 |
| Vornado Realty LP, 5.00%, 1/15/22 | | 175 | | 176,450 |
| | | | | 527,830 |
| Real Estate Management & Development—0.2% | | | |
| Realogy Corp., 7.88%, 2/15/19 (a) | | 105 | | 91,350 |
| WEA Finance LLC, 4.63%, 5/10/21 (a) | | 70 | | 68,705 |
| | | | | 160,055 |
| Road & Rail—0.3% | | | | |
| Burlington Northern Santa Fe LLC, 5.75%, 5/01/40 | | 240 | | 287,139 |
| Software—0.1% | | | | |
| Oracle Corp., 5.38%, 7/15/40 | | 100 | | 121,828 |
| Specialty Retail—0.1% | | | | |
| QVC, Inc., 7.50%, 10/01/19 (a) | | 90 | | 96,525 |
| Thrifts & Mortgage Finance—0.4% | | | | |
| Radian Group, Inc.: | | | | |
| 5.63%, 2/15/13 | | 340 | | 219,725 |
| 5.38%, 6/15/15 | | 340 | | 157,250 |
| | | | | 376,975 |
| Wireless Telecommunication Services—1.4% | | | |
| America Movil SAB de CV, 2.38%, 9/08/16 | | 205 | | 204,429 |
| Cricket Communications, Inc., 7.75%, 5/15/16 | | 110 | | 113,575 |
| Crown Castle Towers LLC, 6.11%, 1/15/20 (a) | | 385 | | 424,786 |
| Intelsat Jackson Holdings SA, 7.25%, 4/01/19 (a) | | 84 | | 85,260 |
| MetroPCS Wireless, Inc., 7.88%, 9/01/18 | | 3 | | 3,041 |
| SBA Tower Trust, 5.10%, 4/15/17 (a) | | 80 | | 83,300 |
| Sprint Capital Corp., 6.88%, 11/15/28 | | 47 | | 33,546 |
| Sprint Nextel Corp., 9.00%, 11/15/18 (a) | | 200 | | 210,000 |
| | | | | 1,157,937 |
| Total Corporate Bonds—34.2% | | | | 28,854,000 |
| |
| Foreign Agency Obligations | | | | |
| Brazilian Government International Bond, | | | | |
| 7.13%, 1/20/37 | | 100 | | 138,000 |
| Hellenic Republic Government Bond, 4.60%, | | | | |
| 9/20/40 | EUR | 40 | | 8,853 |
| Indonesia Government International Bond: | | | | |
| 4.88%, 5/05/21 (a) | USD | 230 | | 246,100 |
| 4.88%, 5/05/21 | | 200 | | 214,000 |
See Notes to Financial Statements.
| 66 | BLACKROCK SERIES FUND, INC. | DECEMBER 31, 2011 |
| BlackRock Total Return Portfolio | |
| Schedule of Investments (continued) | (Percentages shown are based on Net Assets) |
| Foreign Agency Obligations | | Par
(000) | | Value |
| Italy Buoni Poliennali Del Tesoro, 4.75%, 9/15/16 | USD | 680 | $ | 834,165 |
| Kreditanstalt fuer Wiederaufbau, 1.38%, 7/15/13 | | 160 | | 161,454 |
| Mexico Government International Bond: | | | | |
| 6.38%, 1/16/13 | | 130 | | 135,850 |
| 5.63%, 1/15/17 | | 90 | | 103,500 |
| 5.13%, 1/15/20 | | 190 | | 217,075 |
| Poland Government International Bond: | | | | |
| 6.38%, 7/15/19 | | 60 | | 66,450 |
| 5.13%, 4/21/21 | | 205 | | 208,587 |
| Russia Government International Bond, 7.50%, | | | | |
| 3/31/30 (g) | | 230 | | 266,652 |
| South Africa Government International Bond, | | | | |
| 5.50%, 3/09/20 | | 300 | | 336,000 |
| Turkey Government International Bond, 7.00%, | | | | |
| 3/11/19 | | 100 | | 110,750 |
| Total Foreign Agency Obligations—3.6% | | | | 3,047,436 |
| |
| Non-Agency Mortgage-Backed Securities | | | | |
| Collateralized Mortgage Obligations—2.3% | | | | |
| Countrywide Home Loan Mortgage Pass-Through Trust: | | | | |
| Series 2006-0A5, Class 2A1, 0.49%, | | | | |
| 4/25/46 (b) | | 119 | | 59,384 |
| Series 2006-0A5, Class 3A1, 0.49%, | | | | |
| 4/25/46 (b) | | 201 | | 109,228 |
| Series 2007-J3, Class A10, 6.00%, 7/25/37 | | 479 | | 386,593 |
| Credit Suisse Mortgage Capital Certificates: | | | | |
| Series 2006-8, Class 3A1, 6.00%, 10/25/21 | | 93 | | 73,253 |
| Series 2010-RR2, Class 2A, 5.79%, | | | | |
| 9/15/39 (a)(b) | | 250 | | 278,940 |
| Series 2011-2R, Class 1A1, 4.47%, | | | | |
| 3/27/37 (a)(b) | | 146 | | 135,712 |
| Series 2011-2R, Class 2A1, 2.73%, | | | | |
| 7/27/36 (a)(b) | | 351 | | 340,984 |
| First Horizon Asset Securities, Inc., Series 2005-AR3, | | | | |
| Class 3A1, 5.53%, 8/25/35 (b) | | 95 | | 77,479 |
| Impac Secured Assets CMN Owner Trust, Series | | | | |
| 2004-3, Class 1A4, 1.09%, 11/25/34 (b) | | 42 | | 37,344 |
| IndyMac INDA Mortgage Loan Trust, Series | | | | |
| 2007-AR7, Class 1A1, 5.73%, 11/25/37 (b) | | 157 | | 112,492 |
| JPMorgan Mortgage Trust: | | | | |
| Series 2006-S2, Class 2A2, 5.88%, 7/25/36 | | 29 | | 26,846 |
| Series 2007-S1, Class 1A2, 5.50%, 3/25/22 | | 27 | | 24,744 |
| Residential Accredit Loans, Inc., Series 2006-Q02, | | | | |
| Class A1, 0.51%, 2/25/46 (b) | | 146 | | 45,362 |
| Structured Adjustable Rate Mortgage Loan Trust, | | | | |
| Series 2007-3, Class 3A1, 5.22%, 4/25/47 (b) | | 367 | | 220,114 |
| | | | | 1,928,475 |
| Commercial Mortgage-Backed Securities—7.9% | | | | |
| Banc of America Large Loan, Inc., Series 2010-UB4, | | | | |
| Class A4A, 5.01%, 12/20/41 (a)(b) | | 190 | | 199,139 |
| Banc of America Merrill Lynch Commercial | | | | |
| Mortgage, Inc.: | | | | |
| Series 2003-2, Class A3, 4.87%, 3/11/41 (b) | | 711 | | 723,335 |
| Series 2006-5, Class AAB, 5.38%, 9/10/47 | | 375 | | 389,211 |
| Series 2006-5, Class AM, 5.45%, 9/10/47 | | 30 | | 28,241 |
| Series 2007-3, Class A4, 5.62%, 6/10/49 (b) | | 290 | | 310,966 |
| Bear Stearns Commercial Mortgage Securities: | | | | |
| Series 2005-PW10, Class AM, 5.45%, | | | | |
| 12/11/40 (b) | | 30 | | 28,449 |
| Non-Agency Mortgage-Backed Securities | | Par
(000) | | Value |
| Commercial Mortgage-Backed Securities (concluded) | | |
| Bear Stearns Commercial Mortgage Securities | | | | |
| (concluded): | | | | |
| Series 2006-PW11, Class A4, 5.44%, | | | | |
| 3/11/39 (b) | USD | 825 | $ | 914,598 |
| Series 2007-PW17, Class A3, 5.74%, | | | | |
| 6/11/50 | | 230 | | 241,537 |
| Citigroup/Deutsche Bank Commercial Mortgage Trust, | | | |
| Series 2006-CD3, Class A5, 5.62%, 10/15/48 | 60 | | 65,730 |
| CS First Boston Mortgage Securities Corp., Series | | | |
| 2002-CP5, Class A1, 4.11%, 12/15/35 | | 51 | | 50,788 |
| Extended Stay America Trust, Series 2010-ESHA (a): | | | |
| Class C, 4.86%, 11/05/27 | | 285 | | 288,535 |
| Class D, 5.50%, 11/05/27 | | 165 | | 165,605 |
| GMAC Commercial Mortgage Securities, Inc.: | | | | |
| Series 2003-C3, Class A3, 4.65%, 4/10/40 | 53 | | 53,159 |
| Series 2006-C1, Class AM, 5.29%, | | | | |
| 11/10/45 (b) | | 50 | | 49,849 |
| Greenwich Capital Commercial Funding Corp.: | | | | |
| Series 2006-GG7, Class AJ, 5.88%, | | | | |
| 7/10/38 (b) | | 70 | | 49,000 |
| Series 2007-GG9, Class A4, 5.44%, 3/10/39 | 45 | | 48,707 |
| GS Mortgage Securities Corp. II, Series 2007-GG10, | | | |
| Class A4, 5.79%, 8/10/45 (b) | | 185 | | 200,907 |
| JPMorgan Chase Commercial Mortgage | | | | |
| Securities Corp.: | | | | |
| Series 2004-LN2, Class A2, 5.12%, 7/15/41 | 190 | | 200,871 |
| Series 2006-CB14, Class AM, 5.45%, | | | | |
| 12/12/44 (b) | | 80 | | 79,086 |
| Series 2007-CB18, Class A3, 5.45%, 6/12/47 | 220 | | 231,398 |
| LB-UBS Commercial Mortgage Trust: | | | | |
| Series 2006-C4, Class AM, 5.89%, | | | | |
| 6/15/38 (b) | | 40 | | 40,753 |
| Series 2006-C7, Class AM, 5.38%, 11/15/38 | 40 | | 38,686 |
| Merrill Lynch Mortgage Trust, Series 2004-KEY2, | | | | |
| Class A4, 4.86%, 8/12/39 (b) | | 300 | | 319,025 |
| Morgan Stanley Capital I: | | | | |
| Series 1998-WF2, Class G, 6.34%, | | | | |
| 7/15/30 (a)(b) | | 130 | | 136,303 |
| Series 2004-HQ4, Class A7, 4.97%, 4/14/40 | 250 | | 263,968 |
| Series 2007-HQ12, Class A2, 5.60%, | | | | |
| 4/12/49 (b) | | 45 | | 46,189 |
| Series 2007-HQ12, Class A2FL, 0.53%, | | | | |
| 4/12/49 (b) | | 77 | | 73,230 |
| Series 2007-HQ12, Class A2FX, 5.60%, | | | | |
| 4/12/49 (b) | | 99 | | 101,333 |
| RBSCF Trust, Series 2010-RR3, Class WBTA, | | | | |
| 5.90%, 2/16/51 (a)(b) | | 380 | | 418,968 |
| Wachovia Bank Commercial Mortgage Trust (b): | | | | |
| Series 2005-C20, Class A6A, 5.11%, 7/15/42 | 552 | | 559,648 |
| Series 2007-C33, Class A4, 5.90%, 2/15/51 | 280 | | 303,165 |
| | | | | 6,620,379 |
| Interest Only Commercial Mortgage-Backed Securities—0.2% | |
| Morgan Stanley Reremic Trust (a): | | | | |
| Series 2009-IO, Class B, 0.00%, 7/17/56 | | 150 | | 126,000 |
| Series 2011-IO, Class A, 2.50%, 3/23/51 | | 80 | | 79,385 |
| | | | | 205,385 |
| Total Non-Agency Mortgage-Backed Securities—10.4% | | 8,754,239 |
See Notes to Financial Statements.
| BLACKROCK SERIES FUND, INC. | DECEMBER 31, 2011 | 67 |
| BlackRock Total Return Portfolio | |
| Schedule of Investments (continued) | (Percentages shown are based on Net Assets) |
| Preferred Securities | | Par
(000) | | Value |
| Capital Trusts | | | | |
| Capital Markets—0.2% | | | | |
| Credit Suisse Guernsey Ltd., 5.86% (b)(h) | USD | 180 | $ | 146,250 |
| Lehman Brothers Holdings Capital Trust VII, | | | | |
| 5.86% (c)(d)(h) | | 55 | | 6 |
| State Street Capital Trust IV, 1.55%, 6/01/77 (b) | | 20 | | 13,165 |
| | | | | 159,421 |
| Commercial Banks—0.3% | | | | |
| ABN AMRO North America Holding Preferred Capital | | | | |
| Repackaging Trust I, 6.52% (a)(b)(h) | | 150 | | 102,187 |
| Fifth Third Capital Trust IV, 6.50%, 4/15/67 (b) | | 120 | | 117,600 |
| JPMorgan Chase Capital XXV, Series Y, 6.80%, | | | | |
| 10/01/37 | | 50 | | 50,188 |
| | | | | 269,975 |
| Consumer Finance—0.2% | | | | |
| Capital One Capital VI, 8.88%, 5/15/40 | | 120 | | 124,547 |
| Insurance—0.2% | | | | |
| American International Group, Inc., 8.18%, | | | | |
| 5/15/68 (b) | | 25 | | 22,250 |
| Swiss Re Capital I LP, 6.85% (a)(b)(h) | | 125 | | 106,232 |
| XL Group Plc, Series E, 6.50% (b)(h) | | 90 | | 70,425 |
| | | | | 198,907 |
| Total Capital Trusts—0.9% | | | | 752,850 |
| |
| Trust Preferreds | | Shares | | |
| Commercial Banks—0.1% | | | | |
| Citigroup Capital XIII, 7.88% (b) | | 3,417 | | 87,888 |
| Total Preferred Securities—1.0% | | | | 840,738 |
| |
| Taxable Municipal Bonds | | Par
(000) | | |
| New York City Municipal Water Finance | | | | |
| Authority, RB, Second General Resolution, | | | | |
| Series EE: | | | | |
| 5.38%, 6/15/43 | USD | 95 | | 105,280 |
| 5.50%, 6/15/43 | | 115 | | 129,075 |
| Total Taxable Municipal Bonds—0.3% | | | | 234,355 |
| |
| US Government Sponsored Agency Securities | | | |
| Agency Obligations—1.7% | | | | |
| Fannie Mae, 10/09/19 (i) | | 275 | | 211,438 |
| Federal Home Loan Bank of Chicago, 5.63%, | | | | |
| 6/13/16 | | 550 | | 623,418 |
| Tennessee Valley Authority, 5.25%, 9/15/39(j) | | 450 | | 574,430 |
| | | | | 1,409,286 |
| Collateralized Mortgage Obligations—0.3% | | | | |
| Freddie Mac Mortgage-Backed Securities: | | | | |
| Series 3068, Class VA, 5.50%, 10/15/16 | | 36 | | 36,450 |
| Series K013, Class A2, 3.97%, 1/25/21 (b) | | 220 | | 241,882 |
| | | | | 278,332 |
| Federal Deposit Insurance Corporation Guaranteed—0.3% | |
| General Electric Capital Corp., 2.13%, 12/21/12 | | 195 | | 198,628 |
| US Government Sponsored Agency Securities | Par
(000) | | Value |
| Interest Only Collateralized Mortgage Obligations—1.0% | | |
| Fannie Mae Mortgage-Backed Securities (b): | | | | |
| Series 2010-123, Class SE, 5.73%, | | | | |
| 11/25/40 | USD | 624 | $ | 69,778 |
| Series 2010-149, Class SJ, 6.24%, 1/25/41 | 679 | | 102,974 |
| Series 2011-55, Class SH, 6.27%, 6/25/41 | 715 | | 110,162 |
| Freddie Mac Mortgage-Backed Securities: | | | | |
| Series 3716, Class PI, 4.50%, 4/15/38 | | 544 | | 73,149 |
| Series 3780, Class SM, 6.22%, 12/15/40 (b) | 670 | | 99,602 |
| Ginnie Mae Mortgage-Backed Securities (b): | | | | |
| Series 2010-26, Class QS, 5.97%, 2/20/40 | 1,554 | | 267,148 |
| Series 2010-42, Class DS, 5.42%, 4/20/40 | 346 | | 44,853 |
| Series 2011-80, Class KS, 6.39%, 6/20/41 | 436 | | 60,099 |
| | | | | 827,765 |
| Mortgage-Backed Securities—51.3% | | | | |
| Fannie Mae Mortgage-Backed Securities: | | | | |
| 3.07%, 3/01/41 (b) | | 81 | | 84,572 |
| 3.15%, 3/01/41 (b) | | 160 | | 166,449 |
| 3.32%, 12/01/40 (b) | | 193 | | 200,746 |
| 3.50%, 10/01/26-1/15/42 (j)(k) | | 6,586 | | 6,791,436 |
| 4.00%, 9/01/24-1/15/42 (j)(k) | | 9,711 | | 10,260,320 |
| 4.50%, 1/15/27-1/15/42 (j)(k) | | 7,600 | | 8,112,524 |
| 4.80%, 8/01/38 (b) | | 326 | | 348,438 |
| 5.00%, 7/01/34-1/15/42 (j)(k) | | 1,687 | | 1,823,855 |
| 5.50%, 6/01/33-1/01/39 (l) | | 3,840 | | 4,192,346 |
| 6.00%, 2/01/17-1/15/42 (k) | | 2,710 | | 2,984,434 |
| 6.50%, 7/01/37-10/01/39 | | 977 | | 1,093,739 |
| 7.00%, 2/01/16 | | 28 | | 30,308 |
| Freddie Mac Mortgage-Backed Securities: | | | | |
| 3.05%, 2/01/41 (b) | | 174 | | 181,970 |
| 4.50%, 1/15/42 (j)(k) | | 100 | | 105,953 |
| 4.95%, 4/01/38 (b) | | 262 | | 278,382 |
| 5.00%, 1/15/42 (k) | | 900 | | 967,078 |
| 5.50%, 1/15/42 (k) | | 100 | | 108,500 |
| 6.00%, 6/01/35 | | 108 | | 118,747 |
| Ginnie Mae Mortgage-Backed Securities (k): | | | | |
| 4.00%, 1/15/42 | | 700 | | 750,859 |
| 4.50%, 1/15/42 | | 1,400 | | 1,525,344 |
| 5.00%, 1/15/42 | | 1,500 | | 1,661,484 |
| 5.50%, 5/20/36-1/15/42 | | 729 | | 817,768 |
| 6.00%, 1/15/42 | | 600 | | 679,125 |
| | | | | 43,284,377 |
| Total US Government Sponsored Agency Securities—54.6% | | 45,998,388 |
| |
| US Treasury Obligations | | | | |
| US Treasury Bonds: | | | | |
| 8.13%, 5/15/21 (j) | | 930 | | 1,447,022 |
| 8.13%, 8/15/21 | | 210 | | 328,913 |
| 6.25%, 8/15/23 (j) | | 920 | | 1,316,750 |
| 3.50%, 2/15/39 (j) | | 1,135 | | 1,276,698 |
| 4.25%, 5/15/39 | | 440 | | 559,763 |
| 4.38%, 5/15/40 | | 171 | | 222,140 |
| 2.13%, 2/15/41 | | 626 | | 844,878 |
| 4.75%, 2/15/41 | | 730 | | 1,006,031 |
| 4.38%, 5/15/41 | | 185 | | 241,049 |
| 3.13%, 11/15/41 (j) | | 4,305 | | 4,510,159 |
| US Treasury Notes: | | | | |
| 0.13%, 9/30/13 | | 415 | | 414,173 |
| 0.50%, 8/15/14 | | 2,365 | | 2,375,716 |
| 0.25%, 12/15/14 (j) | | 1,115 | | 1,111,342 |
See Notes to Financial Statements.
| 68 | BLACKROCK SERIES FUND, INC. | DECEMBER 31, 2011 |
| BlackRock Total Return Portfolio | |
| Schedule of Investments (continued) | (Percentages shown are based on Net Assets) |
| US Treasury Obligations | | Par
(000) | | Value |
| US Treasury Notes (concluded): | | | | |
| 2.50%, 4/30/15 (m) | USD | 305 | $ | 325,492 |
| 0.88%, 11/30/16 (i) | | 4,185 | | 4,197,752 |
| 2.25%, 7/31/18 | | 620 | | 659,428 |
| 2.63%, 8/15/20 | | 270 | | 291,199 |
| 2.00%, 11/15/21 (i) | | 3,040 | | 3,074,674 |
| Total US Treasury Obligations—28.7% | | | | 24,203,179 |
| Total Long-Term Investments | | | | |
| (Cost—$114,401,126)—137.6% | | | | 116,015,337 |
| |
| Options Purchased | | Contracts | | |
| Exchange-Traded Call Options—0.0% | | | | |
| 10-Year US Treasury Note: | | | | |
| Strike Price USD 132.00, Expires 1/27/12 | | 8 | | 3,250 |
| Strike Price USD 133.00, Expires 1/27/12 | | 19 | | 3,266 |
| | | | | 6,516 |
| Exchange-Traded Put Options—0.0% | | | | |
| 10-Year US Treasury Note: | | | | |
| Strike Price USD 127.00, Expires 1/27/12 | | 21 | | 984 |
| Strike Price USD 128.00, Expires 1/27/12 | | 10 | | 938 |
| Eurodollar 1-year Mid-Curve Options: | | | | |
| Strike Price USD 99.00, Expires 1/13/12 | | 23 | | 144 |
| Strike Price USD 99.00, Expires 3/16/12 | | 51 | | 5,100 |
| | | | | 7,166 |
| | | Notional
Amount
(000) | | |
| Over-the-Counter Call Options—0.0% | | | | |
| EUR Call Option, Strike Price USD 1.45, | | | | |
| Expires 2/17/12, Broker Citibank NA | USD | 1,775 | | 436 |
| Over-the-Counter Call Swaptions—0.1% | | | | |
| Sold credit default protection on Dow Jones CDX | | | | |
| North America High Yield Index Series 17, Strike | | | | |
| Price USD 92, Expires 1/18/12, Broker Morgan | | | | |
| Stanley Capital Services Inc. (n) | | 945 (o) | | 17,604 |
| Receive a fixed rate of 1.76% and pay a floating | | | | |
| rate based on 3-month LIBOR, Expires 1/26/12, | | | | |
| Broker Deutsche Bank AG | | 2,300 | | 46,456 |
| | | | | 64,060 |
| Over-the-Counter Put Swaptions—0.0% | | | | |
| Pay a fixed rate of 2.85% and receive a floating | | | | |
| rate based on 3-month LIBOR, Expires 1/13/12, | | | | |
| Broker Bank of America NA | | 1,100 | | — |
| Pay a fixed rate of 1.76% and receive a floating | | | | |
| rate based on 3-month LIBOR, Expires 1/26/12, | | | | |
| Broker Deutsche Bank AG | | 2,300 | | — |
| Pay a fixed rate of 2.50% and receive a floating | | | | |
| rate based on 3-month LIBOR, Expires 1/26/12, | | | | |
| Broker Deutsche Bank AG | | 1,100 | | — |
| Pay a fixed rate of 2.70% and receive a floating | | | | |
| rate based on 3-month LIBOR, Expires 1/27/12, | | | | |
| Broker Citibank NA | | 2,000 | | 243 |
| Pay a fixed rate of 2.85% and receive a floating | | | | |
| rate based on 3-month LIBOR, Expires 2/24/12, | | | | |
| Broker Bank of America NA | | 700 | | 350 |
| Options Purchased | | Notional
Amount
(000) | | Value |
| Over-the-Counter Put Swaptions (concluded) | | | |
| Pay a fixed rate of 2.75% and receive a floating | | | | |
| rate based on 3-month LIBOR, Expires 5/11/12, | | | | |
| Broker JPMorgan Chase Bank | USD | 800 | $ | 4,121 |
| Pay a fixed rate of 2.95% and receive a floating | | | | |
| rate based on 3-month LIBOR, Expires 6/14/12, | | | | |
| Broker Deutsche Bank AG | | 300 | | 11,001 |
| Pay a fixed rate of 3.50% and receive a floating | | | | |
| rate based on a 6-month EURIBOR, | | | | |
| Expires 11/08/12, Broker Citibank NA | | 900 | | 23,005 |
| | | | | 38,720 |
| Total Options Purchased | | | | |
| (Cost—$213,854)—0.1% | | | | 116,898 |
| Total Investments Before TBA Sale Commitments | | |
| and Options Written | | | | |
| (Cost—$114,614,980)—137.7% | | | | 116,132,235 |
| |
| TBA Sale Commitments (k) | | Par
(000) | | |
| Fannie Mae Mortgage-Backed Securities: | | | | |
| 3.50%, 1/15/42 | | 3,700 | | (3,805,219) |
| 4.00%, 1/15/42 | | 7,500 | | (7,862,047) |
| 5.50%, 1/15/42 | | 3,600 | | (3,913,563) |
| Total TBA Sale Commitments | | | | |
| (Proceeds—$15,476,156)—(18.5)% | | | | (15,580,829) |
| |
| Options Written | | Notional
Amount
(000) | | |
| Over-the-Counter Call Swaptions—(0.2)% | | | | |
| Pay a fixed rate of 2.08% and receive a floating | | | | |
| rate based on 3-month LIBOR, Expires 2/07/12, | | | | |
| Broker Goldman Sachs Bank USA | | 2,000 | | (53,083) |
| Pay a fixed rate of 2.60% and receive a floating | | | | |
| rate based on 3-month LIBOR, Expires 12/16/13, | | | | |
| Broker JPMorgan Chase Bank | | 500 | | (26,293) |
| Pay a fixed rate of 2.56% and receive a floating | | | | |
| rate based on 3-month LIBOR, Expires 12/19/13, | | | | |
| Broker Deutsche Bank AG | | 500 | | (25,168) |
| Pay a fixed rate of 3.88% and receive a floating rate | | | | |
| based on 3-month LIBOR, Expires 6/09/14, | | | | |
| Broker JPMorgan Chase Bank | | 1,100 | | (94,749) |
| | | | | (199,293) |
| Over-the-Counter Put Swaptions—(0.1)% | | | | |
| Sold credit default protection on Dow Jones CDX | | | | |
| North America High Yield Index Series 17, Strike | | | | |
| Price USD 82, Expires 1/18/12, Broker Morgan | | | | |
| Stanley Capital Services Inc. (n) | | 709 (o) | | (122) |
| Receive a fixed rate of 2.08% and pay a floating | | | | |
| rate based on 3-month LIBOR, Expires 2/07/12, | | | | |
| Broker Goldman Sachs Bank USA | | 2,000 | | — |
| Receive a fixed rate of 2.60% and pay a floating | | | | |
| rate based on 3-month LIBOR, Expires 12/16/13, | | | | |
| Broker JPMorgan Chase Bank | | 500 | | (23,789) |
| Receive a fixed rate of 2.56% and pay a floating | | | | |
| rate based on 3-month LIBOR, Expires 12/19/13, | | | | |
| Broker Deutsche Bank AG | | 500 | | (24,830) |
See Notes to Financial Statements.
| BLACKROCK SERIES FUND, INC. | DECEMBER 31, 2011 | 69 |
| BlackRock Total Return Portfolio | |
| Schedule of Investments (continued) | (Percentages shown are based on Net Assets) |
| Options Written | | Notional
Amount
(000) | | Value |
| Over-the-Counter Put Swaptions (concluded) | | | | |
| Receive a fixed rate of 3.88% and pay a floating | | | | |
| rate based on 3-month LIBOR, Expires 6/09/14, | | | | |
| Broker JPMorgan Chase Bank | USD | 1,100 | $ | (9,154 | ) |
| | | | | (57,895 | ) |
| Total Options Written | | | | | |
| (Premiums Received—$221,469)—(0.3)% | | | (257,188 | ) |
| Total Investments, Net of TBA Sale Commitments | | | |
| and Options Written—118.9% | | | | 100,294,218 | |
| Liabilities in Excess of Other Assets—(18.9)% | | | (15,962,513 | ) |
| Net Assets—100.0% | | | $ | 84,331,705 | |
| (a) | | Security exempt from registration pursuant to Rule 144A under the Securities Act of 1933. These securities may be resold in transactions exempt from registration to qualified institutional investors. |
| (b) | | Variable rate security. Rate shown is as of report date. |
| (c) | | Issuer filed for bankruptcy and/or is in default of interest payments. |
| (d) | | Non-income producing security. |
| (f) | | Represents a payment-in-kind security which may pay interest/dividends in additional par/shares. |
| (g) | | Represents a step-up bond that pays an initial coupon rate for the first period and then a higher coupon rate for the following periods. Rate shown is as of report date. |
| (h) | | Security is perpetual in nature and has no stated maturity date. |
| (i) | | Represents a zero-coupon bond. Rate shown reflects the current yield as of report date. |
| (j) | | All or a portion of security has been pledged as collateral in connection with open reverse repurchase agreements. |
| (k) | | Represents or includes a TBA transaction. Unsettled TBA transactions as of December 31, 2011 were as follows: |
| Counterparty | Value | Unrealized
Appreciation
(Depreciation) |
| Banc of America Securities | $ | (822,750 | ) | $ | (8,906 | ) |
| BNP Paribas | $ | 1,661,484 | | $ | 10,547 | |
| Citigroup Global Markets, Inc. | $ | 2,990,109 | | $ | 3,672 | |
| Credit Suisse Securities (USA) LLC | $ | 121,594 | | $ | (1,281 | ) |
| Deutsche Bank Securities, Inc. | $ | (6,162,875 | ) | $ | (41,000 | ) |
| Goldman Sachs & Co. | $ | (299,313 | ) | $ | (10,813 | ) |
| Greenwich Capital Markets | $ | (1,956,375 | ) | $ | (6,469 | ) |
| JP Morgan Securities, Inc. | $ | 4,830,500 | | $ | 13,313 | |
| Morgan Stanley & Co. | $ | 967,078 | | $ | 6,750 | |
| UBS Securities | $ | (617,063 | ) | $ | (7,500 | ) |
| (l) | | All or a portion of security has been pledged as collateral in connection with swaps. |
| (m) | | All or a portion of security has been pledged as collateral in connection with open financial futures contracts. |
| (n) | | Rated B+ using S&P’s rating of the underlying securities. |
| (o) | | The maximum potential amount the Portfolio may pay should a negative credit event take place as defined under the terms of agreement. |
| • | | For Portfolio compliance purposes, the Portfolio’s industry classifications refer to any one or more of the industry sub-classifications used by one or more widely recognized market indexes or rating group indexes, and/or as defined by Portfolio management. This definition may not apply for purposes of this report, which may combine such industry sub-classifications for reporting ease. |
| • | | Reverse repurchase agreements outstanding as of December 31, 2011 were as follows: |
| Counterparty | Interest Rate | Trade Date | Maturity Date | Net Closing
Amount | Face Amount |
| Barclays Capital, Inc. | 0.06 | % | 10/27/11 | Open | $ | 1,440,494 | $ | 1,440,338 |
| Barclays Capital, Inc. | 0.07 | % | 10/27/11 | Open | | 1,280,112 | | 1,279,950 |
| BNP Paribas Securities Corp. | 0.05 | % | 12/30/11 | 1/03/12 | | 4,504,131 | | 4,504,106 |
| Credit Suisse Securities (USA) LLC | 0.17 | % | 11/29/11 | Open | | 571,586 | | 571,500 |
| Credit Suisse Securities (USA) LLC | 0.03 | % | 12/30/11 | 1/03/12 | | 3,033,760 | | 3,033,750 |
| Credit Suisse Securities LLC | (0.08 | )% | 12/30/11 | 1/03/12 | | 1,110,809 | | 1,110,819 |
| Deutsche Bank AG | (0.70 | )% | 12/30/11 | 1/03/12 | | 4,189,905 | | 4,190,231 |
| Merrill Lynch Pierce, Fenner, & Smith, Inc. | 0.08 | % | 10/26/11 | Open | | 1,216,047 | | 1,215,869 |
| Total | | | | | $ | 17,346,844 | $ | 17,346,563 |
| • | | Financial futures contracts purchased as of December 31, 2011 were as follows: |
| Contracts | Issue | Exchange | Expiration | Notional Value | Unrealized
Appreciation
(Depreciation) |
| 25 | 3-month EURIBOR | NYSE Liffe | March 2012 | $ | 8,001,703 | $ | 7,795 | |
| 23 | 30-Year US Treasury Bond | Chicago Board of Trade | March 2012 | $ | 3,330,688 | | 67,129 | |
| 2 | 90-Day Euro-Dollar | Chicago Mercantile | December 2012 | $ | 496,225 | | (393 | ) |
| 1 | 90-Day Euro-Dollar | Chicago Mercantile | June 2013 | $ | 248,088 | | (65 | ) |
| 2 | 90-Day Euro-Dollar | Chicago Mercantile | September 2013 | $ | 496,050 | | 1,744 | |
| 3 | 90-Day Euro-Dollar | Chicago Mercantile | December 2013 | $ | 743,663 | | 2,377 | |
| 39 | 90-Day Euro-Dollar | Chicago Mercantile | December 2014 | $ | 9,614,963 | | 22,196 | |
| 39 | 90-Day Euro-Dollar | Chicago Mercantile | March 2015 | $ | 9,601,313 | | 27,040 | |
| Total | | | | | | $ | 127,823 | |
See Notes to Financial Statements.
| 70 | BLACKROCK SERIES FUND, INC. | DECEMBER 31, 2011 |
| BlackRock Total Return Portfolio |
| Schedule of Investments (continued) |
| • | | Financial futures contracts sold as of December 31, 2011 were as follows: |
| Contracts | Issue | Exchange | Expiration | Notional Value | Unrealized
Appreciation
(Depreciation) |
| 2 | 2-Year US Treasury Note | Chicago Board of Trade | March 2012 | $ | 441,094 | $ | 90 | |
| 46 | 5-Year US Treasury Note | Chicago Board of Trade | March 2012 | $ | 5,669,859 | | (6,362 | ) |
| 52 | 10-Year US Treasury Note | Chicago Board of Trade | March 2012 | $ | 6,818,500 | | (41,013 | ) |
| 46 | Ultra Long Term US Treasury Bond | Chicago Board of Trade | March 2012 | $ | 7,368,625 | | (48,244 | ) |
| 72 | Euro-Schatz Future | Eurex | March 2012 | $ | 10,282,147 | | (26,661 | ) |
| 7 | 90-Day Euro-Dollar | Chicago Mercantile | March 2012 | $ | 1,738,713 | | 394 | |
| 3 | 90-Day Euro-Dollar | Chicago Mercantile | June 2012 | $ | 744,713 | | 204 | |
| 4 | 90-Day Euro-Dollar | Chicago Mercantile | September 2012 | $ | 992,650 | | 514 | |
| 2 | 90-Day Euro-Dollar | Chicago Mercantile | March 2013 | $ | 496,250 | | 320 | |
| Total | | | | | | $ | (120,758 | ) |
| • | | Foreign currency exchange contracts as of December 31, 2011 were as follows: |
| Currency Purchased | Currency Sold | Counterparty | Settlement Date | Unrealized
Appreciation
(Depreciation) |
| EUR | 255,000 | USD | 343,427 | Deutsche Bank AG | 1/25/12 | $ | (13,351 | ) |
| EUR | 300,000 | USD | 400,006 | Royal Bank of Scotland Plc | 1/25/12 | | (11,681 | ) |
| USD | 994,566 | EUR | 728,000 | Citibank NA | 1/25/12 | | 52,231 | |
| USD | 939,276 | EUR | 690,000 | Royal Bank of Scotland Plc | 1/25/12 | | 46,129 | |
| Total | | | | | | $ | 73,328 | |
| • | | Credit default swaps on single-name issuer—buy protection outstanding as of December 31, 2011 were as follows: |
| Issuer | Pay
Fixed Rate | Counterparty | Expiration Date | Notional
Amount (000) | Unrealized
Appreciation
(Depreciation) |
| Radian Group, Inc. | 5.00 | % | Citibank NA | 3/20/13 | $ | 340 | $ | 108,221 | |
| Eastman Chemical Co. | 0.68 | % | Morgan Stanley & Co., Inc. | 9/20/13 | $ | 285 | | (1,566 | ) |
| Radian Group, Inc. | 5.00 | % | Citibank NA | 6/20/15 | $ | 340 | | 140,805 | |
| Sara Lee Corp. | 1.00 | % | JP Morgan Securities, Inc. | 3/20/17 | $ | 92 | | (262 | ) |
| Total | | | | | | | $ | 247,198 | |
| • | | Credit default swaps on single-name issuer—sold protection outstanding as of December 31, 2011 were as follows: |
| Issuer | Receive
Fixed Rate | Counterparty | Expiration Date | Credit Rating1 | Notional
Amount
(000)2 | Unrealized
Appreciation
(Depreciation) |
| Aviva USA Corp. | 1.00 | % | Deutsche Bank AG | 5/25/12 | BBB+ | $ | 270 | $ | (362 | ) |
| Assured Guaranty Corp. | 5.00 | % | Citibank NA | 12/20/14 | AA- | $ | 35 | | 392 | |
| Assured Guaranty Corp. | 5.00 | % | Citibank NA | 12/20/14 | AA- | $ | 1 | | 21 | |
| Assured Guaranty Corp. | 5.00 | % | Citibank NA | 3/20/15 | AA- | $ | 5 | | 117 | |
| Assured Guaranty Corp. | 5.00 | % | Citibank NA | 12/20/16 | AA- | $ | 50 | | 1,917 | |
| MetLife, Inc. | 1.00 | % | Credit Suisse Securities (USA) LLC | 9/20/16 | A- | $ | 100 | | (717 | ) |
| MetLife, Inc. | 1.00 | % | Deutsche Bank AG | 9/20/16 | A- | $ | 80 | | (1,165 | ) |
| MetLife, Inc. | 1.00 | % | Morgan Stanley & Co., Inc. | 9/20/16 | A- | $ | 60 | | (1,469 | ) |
| MetLife, Inc. | 1.00 | % | Morgan Stanley, Inc. | 9/20/16 | A- | $ | 110 | | (1,771 | ) |
| MetLife, Inc. | 1.00 | % | Citibank NA | 12/20/16 | A- | $ | 425 | | (11,525 | ) |
| MetLife, Inc. | 1.00 | % | Citibank NA | 12/20/16 | A- | $ | 50 | | (1,052 | ) |
| Total | | | | | | | | $ | (15,614 | ) |
| 2 | | The maximum potential amount the Portfolio may pay should a negative credit event take place as defined under the terms of agreement. |
| • | | Credit default swaps on traded indexes—buy protection outstanding as of December 31, 2011 were as follows: |
| Index | Pay
Fixed Rate | Counterparty | Expiration Date | | Notional
Amount
(000) | Unrealized
Appreciation
(Depreciation) |
| Dow Jones CDX Emerging | | | | | | | | | |
| Markets Series 14 | 5.00 | % | Morgan Stanley & Co., Inc. | 12/20/15 | $ | 240 | $ | 5,063 | |
| Dow Jones CDX North America | | | Credit Suisse Securities (USA) | 6/20/16 | $ | 88 | | (247 | ) |
| Investment Grade Index Series 16 | 1.00 | % | LLC | | | | | | |
| Dow Jones CDX North America | | | | | | | | | |
| Investment Grade Index Series 16 | 1.00 | % | JPMorgan Chase Bank NA | 6/20/16 | $ | 5 | | (4 | ) |
| Dow Jones CDX North America | | | | | | | | | |
| Investment Grade Index Series 16 | 1.00 | % | Morgan Stanley & Co., Inc. | 6/20/16 | $ | 336 | | (2,807 | ) |
| Dow Jones CDX North America | | | | | | | | | |
| Investment Grade Index Series 17 | 1.00 | % | Citibank NA | 12/20/16 | $ | 495 | | (2,562 | ) |
| Dow Jones CDX North America | | | | | | | | | |
| Investment Grade Index Series 17 | 1.00 | % | Deutsche Bank AG | 12/20/16 | $ | 696 | | (3,834 | ) |
See Notes to Financial Statements.
| BLACKROCK SERIES FUND, INC. | DECEMBER 31, 2011 | 71 |
| BlackRock Total Return Portfolio |
| Schedule of Investments (continued) |
| • | | Credit default swaps on traded indexes—buy protection outstanding as of December 31, 2011 were as follows (concluded): |
| Index | Pay
Fixed Rate | Counterparty | Expiration Date | Notional
Amount
(000) | Unrealized
Appreciation
(Depreciation) |
| Dow Jones CDX North America | | | | | | | | | |
| Investment Grade Index Series 17 | 1.00 | % | Morgan Stanley & Co., Inc. | 12/20/16 | $ | 890 | $ | (1,866 | ) |
| MCDX North America Series 16 | 1.00 | % | Morgan Stanley & Co., Inc. | 6/20/21 | $ | 540 | | 23,951 | |
| Total | | | | | | | $ | 17,694 | |
| • | | Credit default swaps on traded indexes—sold protection outstanding as of December 31, 2011 were as follows: |
| Index | Receive
Fixed Rate | Counterparty | Expiration Date | Credit Rating1 | Notional
Amount
(000)2 | Unrealized
Appreciation
(Depreciation) |
| Dow Jones CDX North America | | | | | | | | | | |
| High Yield Index Series 17 | 5.00 | % | Credit Suisse Securities (USA) LLC | 12/20/16 | B+ | $ | 245 | $ | 1,122 | |
| MCDX North America Series 14 | 0.00 | % | Goldman Sachs | 6/20/20 | AA | $ | 270 | | (12,537 | ) |
| Markit CMBX North America AAA | | | | | | | | | | |
| Index Series 3 | 0.08 | % | Morgan Stanley & Co., Inc. | 12/13/49 | A+ | $ | 120 | | 2,623 | |
| Markit CMBX North America AAA | | | | | | | | | | |
| Index Series 4 | 0.35 | % | Morgan Stanley & Co., Inc. | 2/17/51 | A- | $ | 120 | | 2,295 | |
| Total | | | | | | | | $ | (6,497 | ) |
| 1 | | Using S&P’s rating of the underlying securities. |
| 2 | | The maximum potential amount the Portfolio may pay should a negative credit event take place as defined under the terms of agreement. |
| • | | Interest rate swaps outstanding as of December 31, 2011 were as follows: |
| Fixed Rate | Floating Rate | Counterparty | Expiration Date | Notional
Amount
(000) | Unrealized
Appreciation
(Depreciation) |
| 0.92 | %3 | 3-month LIBOR | Deutsche Bank AG | 2/28/13 | USD | 2,000 | $ | (5,132 | ) |
| 1.24 | %4 | 6-month EURIBOR | Citibank NA | 12/13/13 | EUR | 9,185 | | 9,510 | |
| 1.32 | %3 | 3-month LIBOR | Citibank NA | 12/17/13 | USD | 700 | | (8,063 | ) |
| 1.41 | %3 | 3-month LIBOR | Deutsche Bank AG | 12/20/13 | USD | 1,100 | | (14,629 | ) |
| 0.73 | %4 | 3-month LIBOR | Bank of America NA | 12/22/13 | USD | 2,200 | | 225 | |
| 0.73 | %4 | 3-month LIBOR | Citibank NA | 12/22/13 | USD | 500 | | 64 | |
| 0.74 | %4 | 3-month LIBOR | Deutsche Bank AG | 12/22/13 | USD | 1,000 | | 151 | |
| 0.74 | %4 | 3-month LIBOR | Deutsche Bank AG | 12/22/13 | USD | 2,000 | | 498 | |
| 1.26 | %3 | 3-month LIBOR | Deutsche Bank AG | 12/24/13 | USD | 1,100 | | (11,320 | ) |
| 0.80 | %4 | 3-month LIBOR | Citibank NA | 8/09/14 | USD | 300 | | 210 | |
| 2.45 | %4 | 3-month LIBOR | Deutsche Bank AG | 4/05/16 | USD | 300 | | 17,021 | |
| 1.25 | %3 | 3-month LIBOR | Deutsche Bank AG | 10/05/16 | USD | 100 | | (315 | ) |
| 2.57 | %4 | 3-month LIBOR | Deutsche Bank AG | 10/27/20 | USD | 200 | | 10,956 | |
| 3.27 | %3 | 3-month LIBOR | Deutsche Bank AG | 5/16/21 | USD | 210 | | (23,790 | ) |
| 3.25 | %3 | 3-month LIBOR | UBS AG | 7/05/21 | USD | 300 | | (33,348 | ) |
| 2.69 | %3 | 3-month LIBOR | Citibank NA | 8/09/21 | USD | 300 | | (18,578 | ) |
| 2.35 | %4 | 3-month LIBOR | Deutsche Bank AG | 8/12/21 | USD | 300 | | 9,567 | |
| 2.21 | %4 | 3-month LIBOR | Credit Suisse Securities (USA) LLC | 9/12/21 | USD | 200 | | 3,694 | |
| 2.26 | %3 | 3-month LIBOR | Citibank NA | 12/05/21 | USD | 200 | | (4,186 | ) |
| 2.24 | %3 | 3-month LIBOR | Credit Suisse Securities (USA) LLC | 12/05/21 | USD | 800 | | (15,852 | ) |
| 2.20 | %3 | 3-month LIBOR | Deutsche Bank AG | 12/12/21 | USD | 200 | | (3,170 | ) |
| 2.20 | %4 | 3-month LIBOR | JP Morgan Securities, Inc. | 12/12/21 | USD | 200 | | (109 | ) |
| 2.03 | %4 | 3-month LIBOR | Deutsche Bank AG | 12/21/21 | USD | 300 | | 14 | |
| 2.19 | %3 | 3-month LIBOR | Deutsche Bank AG | 12/29/21 | USD | 400 | | (5,569 | ) |
| 3.00 | %3 | 3-month LIBOR | UBS AG | 1/03/22 | USD | 600 | | (47,367 | ) |
| 2.58 | %3 | 6-month EURIBOR | Deutsche Bank AG | 11/11/41 | EUR | 100 | | (640 | ) |
| 2.68 | %3 | 6-month EURIBOR | Deutsche Bank AG | 11/18/41 | EUR | 170 | | (5,745 | ) |
| Total | | | | | | $ | (145,903 | ) |
| 3 | | Portfolio pays a fixed interest rate and receives floating rate. |
| 4 | | Portfolio pays a floating interest rate and receives fixed rate. |
See Notes to Financial Statements.
| 72 | BLACKROCK SERIES FUND, INC. | DECEMBER 31, 2011 |
| BlackRock Total Return Portfolio |
| Schedule of Investments (continued) |
| • | | Total return swaps outstanding as of December 31, 2011 were as follows: |
| Reference Entity | Portfolio Pays/Receives
the Total Return of
the Reference Entity | Fixed Rate/
Floating Rate | Counterparty | Expiration Date | Notional
Amount
(000) | Unrealized
Appreciation
(Depreciation) |
| Consumer Price Index | | | | | | | | | |
| for All Urban Consumers | Pays | 2.18%1 | Bank of America NA | 10/06/21 | $ | 425 | $ | (4,120 | ) |
| Gross return on the Markit | | | | | | | | | |
| IOS 5.00%, 30-year, fixed rate | | | | | | | | | |
| Fannie Mae residential | | | | | | | | | |
| mortgage-backed securities pool | Receives | 1-month LIBOR | Bank of America NA | 1/12/39 | $ | 157 | | (2,194 | ) |
| Gross return on the Markit | | | | | | | | | |
| IOS 5.00%, 30-year, fixed rate | | | | | | | | | |
| Fannie Mae residential | | | | | | | | | |
| mortgage-backed securities pool | Pays | 1-month LIBOR | JP Morgan Securities, Inc. | 1/12/39 | $ | 118 | | (508 | ) |
| Gross return on the Markit | | | | | | | | | |
| IOS 5.00%, 30-year, fixed rate | | | | | | | | | |
| Fannie Mae residential | | | | | | | | | |
| mortgage-backed securities pool | Pays | 1-month LIBOR | JP Morgan Securities, Inc. | 1/12/39 | $ | 39 | | 58 | |
| Gross return on the Markit | | | | | | | | | |
| IOS 5.50%, 30-year, fixed rate | | | | | | | | | |
| Fannie Mae residential | | | | | | | | | |
| mortgage-backed securities pool | Pays | 1-month LIBOR | JP Morgan Securities, Inc. | 1/12/39 | $ | 145 | | 2,082 | |
| Gross return on the Markit | | | | | | | | | |
| IOS 6.00%, 30-year, fixed rate | | | | | | | | | |
| Fannie Mae residential | | | | | | | | | |
| mortgage-backed securities pool | Pays | 1-month LIBOR | Royal Bank of Scotland Plc | 1/12/39 | $ | 135 | | 2,540 | |
| Total | | | | | | | $ | (2,142 | ) |
| 1 | | Net payment made at termination. |
| • | | Fair Value Measurements—Various inputs are used in determining the fair value of investments and derivative financial instruments. These inputs are categorized into a disclosure hierarchy consisting of three broad levels for financial statement purposes as follows: |
| • | | Level 1—unadjusted price quotations in active markets/exchanges for identical assets and liabilities |
| • | | Level 2—other observable inputs (including, but not limited to: quoted prices for similar assets or liabilities in markets that are active, quoted prices for identical or similar assets or liabilities in markets that are not active, inputs other than quoted prices that are observable for the assets or liabilities (such as interest rates, yield curves, volatilities, prepayment speeds, loss severities, credit risks and default rates) or other market-corroborated inputs) |
| • | | Level 3—unobservable inputs based on the best information available in the circumstances, to the extent observable inputs are not available (including the Portfolio’s own assumptions used in determining the fair value of investments and derivative financial instruments) |
Changes in valuation techniques may result in transfers in or out of an assigned level within the disclosure hierarchy. The categorization of a value determined for investments and derivative financial instruments is based on the pricing transparency of the investment and derivative financial instrument and does not necessarily correspond to the Portfolio’s perceived risk of investing in those securities. For information about the Portfolio’s policy regarding valuation of investments and derivative financial instruments and other significant accounting policies, please refer to Note 1 of the Notes to Financial Statements.
The following tables summarize the inputs used as of December 31, 2011 in determining the fair valuation of the Portfolio’s investments and derivative financial instruments:
| Valuation Inputs | Level 1 | Level 2 | Level 3 | Total |
| Assets: | | | | | | | | | | |
| Investments: | | | | | | | | | | |
| Long-Term Investments: | | | | | | | | | | |
| Asset-Backed | | | | | | | | | | |
| Securities | | — | $ | 3,148,858 | | $ | 934,144 | $ | 4,083,002 | |
| Corporate Bonds | | — | | 28,854,000 | | | — | | 28,854,000 | |
| Foreign Agency | | | | | | | | | | |
| Obligations | | — | | 3,047,436 | | | — | | 3,047,436 | |
| Non-Agency | | | | | | | | | | |
| Mortgage-Backed | | | | | | | | | | |
| Securities | | — | | 8,652,906 | | | 101,333 | | 8,754,239 | |
| Preferred Securities | $ | 87,888 | | 752,850 | | | — | | 840,738 | |
| Taxable | | | | | | | | | | |
| Municipal Bonds | | — | | 234,355 | | | — | | 234,355 | |
| US Government | | | | | | | | | | |
| Sponsored Agency | | | | | | | | | | |
| Securities | | — | | 45,998,388 | | | — | | 45,998,388 | |
| US Treasury Obligations | | — | | 24,203,179 | | | — | | 24,203,179 | |
| Liabilities: | | | | | | | | | | |
| Investments: | | | | | | | | | | |
| TBA Sale Commitments | | — | | (15,580,829 | ) | | — | | (15,580,829 | ) |
| Total | $ | 87,888 | $ | 99,311,143 | | $ | 1,035,477 | $ | 100,434,508 | |
See Notes to Financial Statements.
| BLACKROCK SERIES FUND, INC. | DECEMBER 31, 2011 | 73 |
| BlackRock Total Return Portfolio |
| Schedule of Investments (concluded) |
| Valuation Inputs | Level 1 | Level 2 | Level 3 | Total |
| Derivative Financial | | | | | | | | | | | | |
| Instruments1 | | | | | | | | | | | | |
| Assets: | | | | | | | | | | | | |
| Credit contracts | | — | | $ | 304,131 | | | — | | $ | 304,131 | |
| Foreign currency exchange | | | | | | | | | | | | |
| contracts | | — | | | 98,796 | | | — | | | 98,796 | |
| Interest rate contracts | $ | 143,485 | | | 141,766 | | | — | | | 285,251 | |
| Liabilities: | | | | | | | | | | | | |
| Credit contracts | | — | | | (30,969 | ) | $ | (12,899 | ) | | (43,868 | ) |
| Foreign currency | | | | | | | | | | | | |
| exchange contracts | | — | | | (25,032 | ) | | — | | | (25,032 | ) |
| Interest rate | | | | | | | | | | | | |
| contracts | | (122,738 | ) | | (457,581 | ) | | — | | | (580,319 | ) |
| Other contracts | | — | | | (4,120 | ) | | — | | | (4,120 | ) |
| Total | $ | 20,747 | | $ | 26,991 | | $ | (12,899 | ) | $ | 34,839 | |
| 1 | | Derivative financial instruments are swaps, financial futures contracts, foreign currency exchange contracts and options. Swaps, financial futures contracts and foreign currency exchange contracts are valued at the unrealized appreciation/depreciation on the instrument and options are shown at value. |
The following table is a reconciliation of Level 3 investments for which significant unobservable inputs were used to determine fair value:
| | Asset-Backed
Securities | Corporate
Bonds | Non-Agency
Mortgage-
Backed
Securities | Total |
| Assets: | | | | | | | | | | | | |
| Balance, as of | | | | | | | | | | | | |
| December 31, 2010 | $ | 359,612 | | $ | 250,000 | | $ | 402,040 | | $ | 1,011,652 | |
| Accrued discounts/premium | | 45 | | | — | | | (1,199 | ) | | (1,154 | ) |
| Net realized gain (loss) | | 57 | | | — | | | (72 | ) | | (15 | ) |
| Net change in unrealized | | | | | | | | | | | | |
| appreciation/depreciation2 | | (11,136 | ) | | — | | | 1,045 | | | (10,091 | ) |
| Purchases | | 572,278 | | | — | | | 105,150 | | | 677,428 | |
| Sales | | (67,184 | ) | | (250,000 | ) | | (3,591 | ) | | (320,775 | ) |
| Transfers in3 | | 255,423 | | | — | | | — | | | 255,423 | |
| Transfers out3 | | (174,951 | ) | | — | | | (402,040 | ) | | (576,991 | ) |
Balance, as of
December 31, 2011 | $ | 934,144 | | | — | | $ | 101,333 | | $ | 1,035,477 | |
| 2 | | Included in the related net change in unrealized appreciation/depreciation in the Statements of Operations. The change in unrealized appreciation/depreciation on investments still held at December 31, 2011 was $(10,091). |
| 3 | | The Portfolio’s policy is to recognize transfers in and transfers out as of the beginning of the period of the event or the change in circumstances that caused the transfer. |
The following table is a reconciliation of Level 3 derivative financial instruments for which significant unobservable inputs were used to determine fair value:
| | | Credit
Contract | Interest Rate Contracts | Total |
| Liabilities | | Liabilities | Assets | Liabilities | | | |
| Balance, as of | | | | | | | | | | | | | |
| December 31, 2010 | | $ | (6,320 | ) | $ | 8,969 | | $ | (27,156 | ) | $ | (24,507 | ) |
| Accrued discounts/premium | | | 1,021 | | | 25 | | | (86 | ) | | 960 | |
| Net realized gain (loss) | | | — | | | (7,897 | ) | | (4,194 | ) | | (12,091 | ) |
| Net change in unrealized | | | | | | | | | | | | | |
| appreciation/depreciation4 | | | (6,579 | ) | | (8,969 | ) | | 27,156 | | | 11,608 | |
| Purchases | | | — | | | — | | | — | | | — | |
| Issuances5 | | | (1,429 | ) | | — | | | — | | | (1,429 | ) |
| Sales | | | — | | | — | | | — | | | — | |
| Settlements6 | | | 408 | | | 7,872 | | | 4,280 | | | 12,560 | |
| Transfers in7 | | | — | | | — | | | — | | | — | |
| Transfers out7 | | | — | | | — | | | — | | | — | |
Balance, as of
December 31, 2011 | | $ | (12,899 | ) | | — | | | — | | $ | (12,899 | ) |
| 4 | | Included in the related net change in unrealized appreciation/depreciation in the Statements of Operations. The change in unrealized appreciation/depreciation on derivative financial instruments still held at December 31, 2011 was $(6,579). |
| 5 | | Issuances represent upfront cash received on certain derivative financial instruments. |
| 6 | | Settlements represent periodic contractual cash flows and/or cash flows to terminate certain derivative financial instruments. |
| 7 | | The Portfolio’s policy is to recognize transfers in and transfers out as of the beginning of the period of the event or the change in circumstances that caused the transfer. |
A reconciliation of Level 3 investments and derivative financial instruments is presented when the Portfolio had a significant amount of Level 3 investments and derivatives at the beginning and/or end of the period in relation to net assets.
See Notes to Financial Statements.
| 74 | BLACKROCK SERIES FUND, INC. | DECEMBER 31, 2011 |
| BlackRock U.S. Government Bond Portfolio | |
| Schedule of Investments December 31, 2011 | (Percentages shown are based on Net Assets) |
| Corporate Bonds | Par
(000) | | Value |
| Capital Markets—0.6% | | | |
| CDP Financial, Inc., 3.00%, 11/25/14 (a) | $ 485 | $ | 504,359 |
| Credit Suisse AG, 2.60%, 5/27/16 (a) | 200 | | 202,678 |
| | | | 707,037 |
| Commercial Banks—2.4% | | | |
| Bank Nederlandse Gemeenten, 1.75%, 10/06/15 (a) | 1,000 | | 998,287 |
| DnB NOR Boligkreditt (a): | | | |
| 2.10%, 10/14/15 | 315 | | 312,448 |
| 2.90%, 3/29/16 | 805 | | 818,360 |
| Sparebanken 1 Boligkreditt, 2.63%, 5/27/17 (a) | 500 | | 504,333 |
| | | | 2,633,428 |
| Electric Utilities—1.3% | | | |
| Hydro-Quebec: | | | |
| 9.40%, 2/01/21 | 125 | | 190,408 |
| 8.40%, 1/15/22 | 225 | | 329,005 |
| 8.05%, 7/07/24 | 590 | | 877,391 |
| | | | 1,396,804 |
| Thrifts & Mortgage Finance—0.5% | | | |
| Cie de Financement Foncier, 2.50%, 9/16/15 (a) | 400 | | 387,083 |
| Northern Rock Plc, 5.63%, 6/22/17 (a) | 100 | | 105,150 |
| | | | 492,233 |
| Total Corporate Bonds—4.8% | | | 5,229,502 |
| |
| Foreign Agency Obligations | | | |
| Kreditanstalt fuer Wiederaufbau, 1.38%, 7/15/13 | 220 | | 222,000 |
| Landwirtschaftliche Rentenbank: | | | |
| 4.13%, 7/15/13 | 45 | | 47,151 |
| Series E, 5.25%, 7/02/12 | 160 | | 163,609 |
| Qatar Government International Bond, 4.00%, | | | |
| 1/20/15 (a) | 260 | | 272,090 |
| Total Foreign Agency Obligations—0.6% | | | 704,850 |
| |
| US Government Sponsored Agency Securities | | | |
| Agency Obligations—2.4% | | | |
| Fannie Mae: | | | |
| 1.63%, 10/26/15 | 2,265 | | 2,321,190 |
| 4.54%, 10/09/19 (b) | 360 | | 276,792 |
| | | | 2,597,982 |
| Collateralized Mortgage Obligations—7.3% | | | |
| Freddie Mac Mortgage-Backed Securities, | | | |
| Series K013, Class A2, 3.97%, 1/25/21 (c) | 2,060 | | 2,264,898 |
| Ginnie Mae Mortgage-Backed Securities, Class Z (c): | | | |
| Series 2004-43, 4.50%, 6/16/44 | 2,451 | | 2,629,310 |
| Series 2004-45, 5.71%, 6/16/45 | 2,684 | | 3,016,984 |
| | | | 7,911,192 |
| Federal Deposit Insurance Corporation Guaranteed—0.9% | |
| General Electric Capital Corp.: | | | |
| 2.00%, 9/28/12 | 700 | | 709,523 |
| 2.13%, 12/21/12 | 195 | | 198,628 |
| | | | 908,151 |
| Interest Only Collateralized Mortgage Obligations—0.9% | |
| Ginnie Mae Mortgage-Backed Securities (c): | | | |
| Series 2002-83, Class IO, 0.50%, 10/16/42 | 13,377 | | 89,385 |
| Series 2003-109, Class IO, 0.42%, 11/16/43 | 8,859 | | 60,252 |
| Series 2003-17, Class IO, 0.54%, 3/16/43 | 13,296 | | 138,172 |
| Series 2004-77, Class IO, 0.41%, 9/16/44 | 39,666 | | 567,225 |
| Series 2004-9, Class IO, 0.50%, 3/16/34 | 6,126 | | 97,740 |
| | | | 952,774 |
| US Government Sponsored Agency Securities | Par
(000) | | Value |
| Mortgage-Backed Securities—71.1% | | | |
| Fannie Mae Mortgage-Backed Securities: | | | |
| 3.09%, 3/01/41 (c) | $ 162 | $ | 169,144 |
| 3.15%, 3/01/41 (c) | 240 | | 249,674 |
| 3.32%, 12/01/40 (c) | 252 | | 263,200 |
| 3.50%, 10/01/26—1/01/42 (d) | 11,976 | | 12,342,551 |
| 4.00%, 9/01/24—1/01/42 (d) | 14,244 | | 15,060,921 |
| 4.00%, 12/01/41 (d)(e) | 1,395 | | 1,475,729 |
| 4.50%, 1/01/27—1/01/42 (d) | 7,966 | | 8,517,495 |
| 5.00%, 1/01/27—1/01/42 (d) | 9,601 | | 10,369,071 |
| 5.50%, 1/01/27—1/01/39 (d) | 6,990 | | 7,628,562 |
| 6.00%, 1/01/35—1/01/42 (d) | 4,001 | | 4,407,061 |
| 6.50%, 7/01/37—1/01/42 | 2,749 | | 3,077,357 |
| Freddie Mac Mortgage-Backed Securities: | | | |
| 3.05%, 2/01/41 (c) | 261 | | 272,955 |
| 4.00%, 1/01/27—1/01/42 (d) | 3,400 | | 3,565,875 |
| 4.50%, 1/01/42 (d) | 2,400 | | 2,542,875 |
| 5.00%, 1/01/42 (d) | 2,200 | | 2,363,969 |
| 5.50%, 1/01/42 (d) | 900 | | 976,500 |
| 8.00%, 3/01/30—6/01/31 | 25 | | 28,615 |
| Ginnie Mae Mortgage-Backed Securities (d): | | | |
| 4.00%, 1/15/42 | 2,000 | | 2,145,312 |
| 5.50%, 1/15/42 | 100 | | 112,234 |
| 6.00%, 1/15/42 | 1,000 | | 1,131,875 |
| | | | 76,700,975 |
| Total US Government Sponsored Agency Securities—82.6% | | 89,071,074 |
| |
| US Treasury Obligations | | | |
| US Treasury Bonds: | | | |
| 8.13%, 8/15/21 (f) | 1,705 | | 2,670,456 |
| 6.25%, 8/15/23 | 1,370 | | 1,960,812 |
| 2.13%, 2/15/41 | 191 | | 258,351 |
| 4.38%, 5/15/41 | 270 | | 351,802 |
| 3.13%, 11/15/41 | 4,470 | | 4,683,022 |
| US Treasury Notes: | | | |
| 0.63%, 1/31/13 (g) | 240 | | 241,172 |
| 0.13%, 9/30/13 | 3,375 | | 3,368,277 |
| 0.50%, 8/15/14 | 440 | | 441,994 |
| 0.25%, 12/15/14 | 2,420 | | 2,412,060 |
| 0.88%, 11/30/16 | 4,790 | | 4,804,595 |
| 2.25%, 7/31/18 | 815 | | 866,829 |
| 2.63%, 8/15/20 | 360 | | 388,266 |
| 2.00%, 11/15/21 | 8,695 | | 8,794,175 |
| Total US Treasury Obligations—29.0% | | | 31,241,811 |
| Total Long-Term Investments | | | |
| (Cost—$123,472,891)—117.0% | | | 126,247,237 |
| |
| Short-Term Securities | Shares | | |
| BlackRock Liquidity Funds, TempFund, | | | |
| Institutional Class, 0.10% (h)(i) | 11,858,082 | | 11,858,082 |
| Total Short-Term Securities | | | |
| (Cost—$11,858,082)—11.0% | | | 11,858,082 |
| |
| Options Purchased | Contracts | | |
| Exchange-Traded Call Options—0.0% | | | |
| 10-Year US Treasury Note, Strike Price USD 132, | | | |
| Expires 1/27/12 | 10 | | 4,063 |
See Notes to Financial Statements.
| BLACKROCK SERIES FUND, INC. | DECEMBER 31, 2011 | 75 |
| BlackRock U.S. Government Bond Portfolio | |
| Schedule of Investments (continued) | (Percentages shown are based on Net Assets) |
| Options Purchased | Contracts | | Value |
| |
| Exchange-Traded Put Options—0.0% | | | | | |
| 10-Year US Treasury Note: | | | | | |
| Strike Price USD 127, Expires 1/27/12 | | 25 | $ | 1,172 | |
| Strike Price USD 128, Expires 1/27/12 | | 13 | | 1,219 | |
| Eurodollar 1-Year Mid-Curve Options: | | | | | |
| Strike Price USD 99, Expires 1/13/12 | | 30 | | 187 | |
| Strike Price USD 99, Expires 3/16/12 | | 65 | | 6,500 | |
| | | | | 9,078 | |
| |
| | | Notional
Amount
(000) | | | |
| Over-the-Counter Put Swaptions—0.0% | | | | | |
| Pay a fixed rate of 2.85% and receive a floating rate | | | | | |
| based on 3-month LIBOR, Expires 1/13/12, | | | | | |
| Broker Bank of America NA | $ | 1,400 | | — | |
| Pay a fixed rate of 2.50% and receive a floating rate | | | | | |
| based on 3-month LIBOR, Expires 1/26/12, | | | | | |
| Broker Deutsche Bank AG | | 1,400 | | — | |
| Pay a fixed rate of 2.70% and receive a floating rate | | | | | |
| based on 3-month LIBOR, Expires 1/27/12, | | | | | |
| Broker Goldman Sachs Bank USA | | 7,400 | | 897 | |
| Pay a fixed rate of 2.95% and receive a floating rate | | | | | |
| based on 3-month LIBOR, Expires 6/14/12, | | | | | |
| Broker Deutsche Bank AG | | 400 | | 14,668 | |
| | | | | 15,565 | |
| Total Options Purchased (Cost—$134,351)—0.0% | | 28,706 | |
| Total Investments Before TBA Sale Commitments | | | |
| and Options Written (Cost—$135,465,324)—128.0% | | 138,134,025 | |
| |
| TBA Sale Commitments | | Par
(000) | | | |
| |
| Fannie Mae Mortgage-Backed Securities (d): | | | | | |
| 3.50%, 1/01/27—1/01/42 | | 4,600 | | (4,742,843 | ) |
| 4.00%, 1/01/42 | | 13,300 | | (13,943,611 | ) |
| 4.50%, 1/01/42 | | 3,000 | | (3,188,250 | ) |
| 5.50%, 1/01/42 | | 4,700 | | (5,108,312 | ) |
| Total TBA Sale Commitments | | | | | |
| (Proceeds—$26,824,172)—(25.0)% | | | | (26,983,016 | ) |
| |
| Options Written | | Notional
Amount
(000) | | | |
| Over-the-Counter Call Swaptions—(0.1)% | | | | | |
| Pay a fixed rate of 2.60% and receive a floating rate | | | | | |
| based on 3-month LIBOR, Expires 12/16/13, | | | | | |
| Broker JPMorgan Chase Bank | | 600 | | (31,551 | ) |
| Pay a fixed rate of 2.56% and receive a floating rate | | | | | |
| based on 3-month LIBOR, Expires 12/19/13, | | | | | |
| Broker Deutsche Bank AG | | 600 | | (30,202 | ) |
| Pay a fixed rate of 3.88% and receive a floating rate | | | | | |
| based on 3-month LIBOR, Expires 6/09/14, | | | | | |
| Broker JPMorgan Chase Bank | | 1,400 | | (120,590 | ) |
| | | | | (182,343 | ) |
| Options Written | | Notional
Amount
(000) | | Value |
| Over-the-Counter Put Swaptions—(0.1)% | | | | | |
| Receive a fixed rate of 2.60% and pay a floating rate | | | | | |
| based on 3-month LIBOR, Expires 12/16/13, | | | | | |
| Broker JPMorgan Chase Bank | $ | 600 | $ | (28,547 | ) |
| Receive a fixed rate of 2.56% and pay a floating rate | | | | | |
| based on 3-month LIBOR, Expires 12/19/13, | | | | | |
| Broker Deutsche Bank AG | | 600 | | (29,796 | ) |
| Receive a fixed rate of 3.88% and pay a floating rate | | | | | |
| based on 3-month LIBOR, Expires 6/09/14, | | | | | |
| Broker JPMorgan Chase Bank | | 1,400 | | (11,650 | ) |
| | | | | (69,993 | ) |
| Total Options Written | | | | | |
| (Premiums Received—$218,900)—(0.2)% | | | | (252,336 | ) |
| Total Investments, Net of TBA Sale Commitments | | | |
| and Options Written—102.8% | | | | 110,898,673 | |
| Liabilities in Excess of Other Assets—(2.8)% | | | | (3,008,406 | ) |
| Net Assets—100.0% | | | $ | 107,890,267 | |
| (a) | | Security exempt from registration pursuant to Rule 144A under the Securities Act of 1933. These securities may be resold in transactions exempt from registration to qualified institutional investors. |
| (b) | | Represents a zero-coupon bond. Rate shown reflects the current yield as of report date. |
| (c) | | Variable rate security. Rate shown is as of report date. |
| (d) | | Represents or includes a TBA transaction. Unsettled TBA transactions as of December 31, 2011 were as follows: |
| Counterparty | Value | Unrealized
Appreciation
(Depreciation) |
| Bank of America Securities | $ | (617,063 | ) | $ | (6,680 | ) |
| BNP Paribas | $ | 1,396,891 | | $ | 8,734 | |
| Citigroup Global Markets, Inc. | $ | 3,468,234 | | $ | 37,078 | |
| Credit Suisse Securities (USA) LLC | $ | 8,068,656 | | $ | 36,297 | |
| Deutsche Bank Securities, Inc. | $ | (10,139,000 | ) | $ | (57,688 | ) |
| Goldman Sachs & Co. | $ | 2,408,750 | | $ | (2,156 | ) |
| JPMorgan Securities, Inc. | $ | (1,441,453 | ) | $ | (7,734 | ) |
| Morgan Stanley Capital Services, Inc. | $ | (1,343,953 | ) | $ | (8,805 | ) |
| UBS Securities | $ | 1,503,563 | | $ | 2,063 | |
| (e) | | When-issued security. Unsettled when-issued transactions were as follows: |
| Counterparty | Value | Unrealized
Appreciation |
| Wells Fargo Brokerage | $1,475,729 | $6,248 |
| (f) | | All or a portion of security has been pledged as collateral in connection with swaps. |
| (g) | | All or a portion of security has been pledged as collateral in connection with open financial futures contracts. |
| (h) | | Investments in companies considered to be an affiliate of the Portfolio during the year, for purposes of Section 2(a)(3) of the Investment Company Act of 1940, as amended, were as follows: |
| Affiliate | Shares
Held at
December 31,
2010 | Net
Activity | Shares
Held at
December 31,
2011 | Realized
Gain | Income |
| BlackRock Liquidity | | | | | |
| Funds, TempFund, | | | | | |
| Institutional Class | 10,691,295 | 1,166,787 | 11,858,082 | $221 | $17,300 |
| (i) | | Represents the current yield as of report date. |
| • | | For Portfolio compliance purposes, the Portfolio’s industry classifications refer to any one or more of the industry sub-classifications used by one or more widely recognized market indexes or rating group indexes and/or as defined by Portfolio management. These definitions may not apply for purposes of this report, which may combine industry sub-classifications for reporting ease. |
See Notes to Financial Statements.
| 76 | BLACKROCK SERIES FUND, INC. | DECEMBER 31, 2011 |
| BlackRock U.S. Government Bond Portfolio |
| Schedule of Investments (continued) |
• Financial futures contracts purchased as of December 31, 2011 were as follows:
| Contracts | Issue | Exchange | Expiration | Notional Value | Unrealized
Appreciation
(Depreciation) |
| 5 | 90-Day Euro-Dollar | Chicago Mercantile | March 2012 | $ | 1,241,938 | $ | 2,236 | |
| 10 | 30-Year US Treasury Bond | Chicago Board of Trade | March 2012 | $ | 1,448,125 | | 18,664 | |
| 5 | Ultra Long US Treasury Bond | Chicago Board of Trade | March 2012 | $ | 800,938 | | 19,534 | |
| 56 | 2-Year US Treasury Note | Chicago Board of Trade | March 2012 | $ | 12,350,625 | | 3,073 | |
| 11 | 90-Day Euro-Dollar | Chicago Mercantile | June 2012 | $ | 2,730,613 | | 87 | |
| 15 | 90-Day Euro-Dollar | Chicago Mercantile | September 2012 | $ | 3,722,438 | | 32,096 | |
| 16 | 90-Day Euro-Dollar | Chicago Mercantile | December 2012 | $ | 3,969,800 | | (2,844 | ) |
| 9 | 90-Day Euro-Dollar | Chicago Mercantile | March 2013 | $ | 2,233,125 | | 31,575 | |
| 13 | 90-Day Euro-Dollar | Chicago Mercantile | June 2013 | $ | 3,225,138 | | (437 | ) |
| 16 | 90-Day Euro-Dollar | Chicago Mercantile | September 2013 | $ | 3,968,400 | | 75,320 | |
| 14 | 90-Day Euro-Dollar | Chicago Mercantile | December 2013 | $ | 3,470,425 | | 76,105 | |
| 1 | 90-Day Euro-Dollar | Chicago Mercantile | March 2014 | $ | 247,675 | | 4,797 | |
| Total | | | | | | $ | 260,206 | |
• Financial futures contracts sold as of December 31, 2011 were as follows:
| Contracts | Issue | Exchange | Expiration | Notional Value | Unrealized
Depreciation |
| 115 | 10-Year US Treasury Note | Chicago Board of Trade | March 2012 | $ | 15,079,375 | $ | (23,125 | ) |
| 27 | 5-Year US Treasury Note | Chicago Board of Trade | March 2012 | $ | 3,327,961 | | (3,789 | ) |
| Total | | | | | | $ | (26,914 | ) |
• Interest rate swaps outstanding as of December 31, 2011 were as follows:
| Fixed Rate | Floating Rate | Counterparty | Expiration Date | Notional Amount
(000) | Unrealized
Appreciation
(Depreciation) |
| 1.33 | %1 | 3-month LIBOR | Deutsche Bank AG | 7/12/13 | $ | 1,100 | $ | 10,256 | |
| 0.74 | %1 | 3-month LIBOR | Citibank NA | 11/18/13 | $ | 6,400 | | 3,097 | |
| 0.80 | %2 | 3-month LIBOR | Morgan Stanley & Co., Inc. | 11/25/13 | $ | 6,400 | | (9,073 | ) |
| 0.81 | %2 | 3-month LIBOR | Citibank NA | 11/25/13 | $ | 6,400 | | (10,225 | ) |
| 0.78 | %1 | 3-month LIBOR | Citibank NA | 11/25/13 | $ | 6,400 | | 7,753 | |
| 0.73 | %1 | 3-month LIBOR | Bank of America NA | 12/22/13 | $ | 2,800 | | 287 | |
| 0.73 | %1 | 3-month LIBOR | Citibank NA | 12/22/13 | $ | 600 | | 77 | |
| 0.74 | %1 | 3-month LIBOR | Deutsche Bank AG | 12/22/13 | $ | 1,300 | | 196 | |
| 0.74 | %1 | 3-month LIBOR | Deutsche Bank AG | 12/22/13 | $ | 2,600 | | 647 | |
| 2.36 | %1 | 3-month LIBOR | Citibank NA | 12/20/15 | $ | 1,300 | | 67,811 | |
| 1.44 | %2 | 3-month LIBOR | Morgan Stanley & Co., Inc. | 10/18/16 | $ | 300 | | (3,527 | ) |
| 2.50 | %2 | 3-month LIBOR | Deutsche Bank AG | 9/30/20 | $ | 300 | | 15,111 | |
| 2.57 | %1 | 3-month LIBOR | Deutsche Bank AG | 10/19/20 | $ | 300 | | 16,576 | |
| 3.18 | %2 | 3-month LIBOR | Deutsche Bank AG | 12/07/20 | $ | 5,600 | | (589,122 | ) |
| 3.27 | %2 | 3-month LIBOR | Deutsche Bank AG | 5/16/21 | $ | 2,060 | | (233,366 | ) |
| 2.35 | %1 | 3-month LIBOR | Deutsche Bank AG | 8/12/21 | $ | 500 | | 15,945 | |
| 2.40 | %1 | 3-month LIBOR | Bank of America NA | 10/21/21 | $ | 300 | | 10,468 | |
| 2.24 | %2 | 3-month LIBOR | Credit Suisse Securities (USA) LLC | 12/05/21 | $ | 1,000 | | (19,815 | ) |
| 2.26 | %2 | 3-month LIBOR | Citibank NA | 12/05/21 | $ | 300 | | (6,280 | ) |
| 2.03 | %1 | 3-month LIBOR | Deutsche Bank AG | 12/21/21 | $ | 600 | | 29 | |
| 2.18 | %2 | 3-month LIBOR | Deutsche Bank AG | 12/29/21 | $ | 600 | | (8,353 | ) |
| 3.00 | %2 | 3-month LIBOR | UBS AG | 1/03/22 | $ | 700 | | (55,262 | ) |
| Total | | | | | | $ | (786,770 | ) |
| 1 | | Pays floating interest rate and receives fixed rate. |
| 2 | | Pays fixed interest rate and receives floating rate. |
| • | | Total return swaps outstanding as of December 31, 2011 were as follows: |
| Reference Entity | Fund Pays/Receives
the Total Return of
the Reference Entity | Fixed Rate/
Floating Rate | Counterparty | Expiration Date | Notional
Amount
(000) | Unrealized
Depreciation |
| Consumer Price Index | | | | | | |
| for All Urban Consumers | Pays | 2.18%3 | Bank of America NA | 10/06/21 | $550 | $(5,332) |
| 3 | | Net payment made at termination. |
See Notes to Financial Statements.
| BLACKROCK SERIES FUND, INC. | DECEMBER 31, 2011 | 77 |
| BlackRock U.S. Government Bond Portfolio |
| Schedule of Investments (concluded) |
| • | | Fair Value Measurements—Various inputs are used in determining the fair value of investments and derivative financial instruments. These inputs are categorized into a disclosure hierarchy consisting of three broad levels for financial statement purposes as follows: |
| • | | Level 1—unadjusted price quotations in active markets/exchanges for identical assets and liabilities |
| • | | Level 2—other observable inputs (including, but not limited to: quoted prices for similar assets or liabilities in markets that are active, quoted prices for identical or similar assets or liabilities in markets that are not active, inputs other than quoted prices that are observable for the assets or liabilities (such as interest rates, yield curves, volatilities, prepayment speeds, loss severities, credit risks and default rates) or other market-corroborated inputs) |
| • | | Level 3—unobservable inputs based on the best information available in the circumstances, to the extent observable inputs are not available (including the Portfolio’s own assumptions used in determining the fair value of investments and derivative financial instruments) |
Changes in valuation techniques may result in transfers in or out of an assigned level within the disclosure hierarchy. The categorization of a value determined for investments and derivative financial instruments is based on the pricing transparency of the investment and derivative financial instrument and does not necessarily correspond to the Portfolio’s perceived risk of investing in those securities. For information about the Portfolio’s policy regarding valuation of investments and derivative financial instruments and other significant accounting policies, please refer to Note 1 of the Notes to Financial Statements.
The following tables summarize the inputs used as of December 31, 2011 in determining the fair valuation of the Portfolio’s investments and derivative financial instruments:
| Valuation Inputs | | Level 1 | Level 2 | Level 3 | Total |
| Assets: | | | | | |
| Investments: | | | | | |
| Long-Term Investments1 | | — | $126,247,237 | — | $126,247,237 |
| Short-Term Securities | | $11,858,082 | — | — | 11,858,082 |
| Liabilities: | | | | | |
| Investments: | | | | | |
| TBA Sale Commitments | | — | (26,983,016) | — | (26,983,016) |
| Total | | $11,858,082 | $ 99,264,221 | — | $111,122,303 |
| 1 | | See above Schedule of Investments for values in each security type. |
| Valuation Inputs | | Level 1 | Level 2 | Level 3 | Total |
| Derivative Financial Instruments2 | | | | | |
| Assets: | | | | | |
| Interest rate contracts | | $276,628 | $ 163,818 | — | $ 440,446 |
| Liabilities: | | | | | |
| Interest rate contracts | | (30,195) | (1,187,359) | — | (1,217,554) |
| Other contracts | | — | (5,332) | — | (5,332) |
| Total | | $246,433 | $(1,028,873) | — | $ (782,440) |
| 2 | | Derivative financial instruments are swaps, financial futures contracts and options. Swaps, financial futures contracts and foreign currency exchange contracts are valued at the unrealized appreciation/depreciation on the instruments and options are shown at value. |
See Notes to Financial Statements.
| 78 | BLACKROCK SERIES FUND, INC. | DECEMBER 31, 2011 |
Statements of Assets and Liabilities December 31, 2011
| | BlackRock
Balanced
Capital
Portfolio | BlackRock
Capital
Appreciation
Portfolio | BlackRock
Global
Allocation
Portfolio1 | BlackRock
High Yield
Portfolio |
| Assets | | | | | | | | | | | | |
| Investments at value—unaffiliated2,3 | $ | 577,278,183 | | $ | 131,065,836 | | $ | 270,764,656 | | $ | 41,458,782 | |
| Investments at value—affiliated4 | | 953,832 | | | 4,818,879 | | | 1,377,367 | | | 5,383,394 | |
| Investments sold receivable—unaffiliated | | 64,745,728 | | | 573,681 | | | 937,612 | | | 1,125 | |
| Investments sold receivable—affiliated | | — | | | — | | | 23,536 | | | 48,411 | |
| TBA sale commitments receivable | | 40,621,980 | | | — | | | — | | | — | |
| Interest receivable | | 1,782,283 | | | — | | | 911,590 | | | 621,680 | |
| Unrealized appreciation on swaps | | 715,649 | | | — | | | 31,428 | | | 46,662 | |
| Dividends receivable | | 276,067 | | | 80,212 | | | 312,424 | | | — | |
| Capital shares sold receivable | | 29,636 | | | 6,517 | | | 120,657 | | | — | |
| Foreign currency at value5 | | 289,813 | | | 438 | | | 60,268 | | | — | |
| Unrealized appreciation on foreign currency exchange contracts | | 272,819 | | | — | | | 222,955 | | | — | |
| Swaps receivable | | 44,424 | | | — | | | 1,573 | | | 7,614 | |
| Principal paydown receivable | | 16,769 | | | — | | | 11,158 | | | 50,919 | |
| Margin variation receivable | | — | | | — | | | 28,935 | | | — | |
| Securities lending income receivable—affiliated | | — | | | 5,912 | | | 278 | | | — | |
| Prepaid expenses | | 21,014 | | | 4,337 | | | 17,028 | | | 9,364 | |
| Total assets | | 687,048,197 | | | 136,555,812 | | | 274,821,465 | | | 47,627,951 | |
| |
| Liabilities | | | | | | | | | | | | |
| Collateral on securities loaned at value | | — | | | 3,662,039 | | | 155,028 | | | — | |
| Bank overdraft | | — | | | — | | | 174,641 | | | — | |
| Investments purchased payable | | 108,294,342 | | | 512,853 | | | 30,031 | | | 211,894 | |
| TBA sale commitments at value6 | | 40,903,000 | | | — | | | — | | | — | |
| Reverse repurchase agreements | | 35,735,813 | | | — | | | — | | | — | |
| Options written at value7 | | 372,612 | | | — | | | 1,257,613 | | | — | |
| Structured options at value | | — | | | — | | | 79,316 | | | — | |
| Unrealized depreciation on swaps | | 490,647 | | | — | | | 10,869 | | | 336 | |
| Swaps payable | | 492,715 | | | — | | | 3,520 | | | 320,404 | |
| Capital shares redeemed payable | | 388,221 | | | 1,954 | | | 197,250 | | | 23,824 | |
| Income dividends payable | | — | | | — | | | — | | | 240,533 | |
| Investment advisory fees payable | | 146,636 | | | 41,758 | | | 29,576 | | | 5,595 | |
| Interest expense payable | | 61,757 | | | — | | | — | | | — | |
| Margin variation payable | | 68,130 | | | — | | | — | | | — | |
| Other affiliates payable | | 1,403 | | | 414 | | | 1,017 | | | 951 | |
| Deferred income | | — | | | — | | | — | | | 2,897 | |
| Officer’s and Directors’ fees payable | | 343 | | | 352 | | | 138 | | | 31 | |
| Unrealized depreciation on foreign currency exchange contracts | | 65,182 | | | — | | | 112,185 | | | — | |
| Other liabilities | | 66,875 | | | — | | | 159,530 | | | — | |
| Other accrued expenses payable | | 109,094 | | | 26,148 | | | 58,108 | | | 17,548 | |
| Total liabilities | | 187,196,770 | | | 4,245,518 | | | 2,268,822 | | | 824,013 | |
| Net Assets | $ | 499,851,427 | | $ | 132,310,294 | | $ | 272,552,643 | | $ | 46,803,938 | |
| |
| Net Assets Consist of | | | | | | | | | | | | |
| Paid-in capital | $ | 528,520,121 | | $ | 150,213,518 | | $ | 298,581,481 | | $ | 56,223,426 | |
| Undistributed (distributions in excess of) net investment income | | 274,974 | | | 41,554 | | | (1,046,940 | ) | | 35,249 | |
| Undistributed (accumulated) net realized gain (loss) | | (47,805,381 | ) | | (32,516,351 | ) | | (4,040,269 | ) | | (9,006,441 | ) |
| Net unrealized appreciation/depreciation | | 18,861,713 | | | 14,571,573 | | | (20,941,629 | ) | | (448,296 | ) |
| Net Assets | $ | 499,851,427 | | $ | 132,310,294 | | $ | 272,552,643 | | $ | 46,803,938 | |
| Shares outstanding, $0.10 par value8 | | 34,885,170 | | | 5,264,423 | | | 19,756,077 | | | 9,243,373 | |
| Net asset value, offering and redemption price per share | $ | 14.33 | | $ | 25.13 | | $ | 13.80 | | $ | 5.06 | |
| 1 Consolidated Statement of Assets and Liabilities. | | | | | | | | | | | | |
| 2 Investments at cost—unaffiliated | $ | 558,581,509 | | $ | 116,494,258 | | $ | 291,788,354 | | $ | 41,953,404 | |
| 3 Securities loaned at value | | — | | $ | 3,572,965 | | $ | 114,836 | | | — | |
| 4 Investments at cost—affiliated | $ | 953,832 | | $ | 4,818,879 | | $ | 1,298,472 | | $ | 5,383,394 | |
| 5 Foreign currency at cost | $ | 295,332 | | $ | 444 | | $ | 60,287 | | | — | |
| 6 Proceeds from TBA sale commitments | $ | 40,621,980 | | | — | | | — | | | — | |
| 7 Premiums received | $ | 361,474 | | | — | | $ | 1,275,307 | | | — | |
| 8 Authorized shares | | 300 Million | | | 100 Million | | | 100 Million | | | 100 Million | |
See Notes to Financial Statements.
| BLACKROCK SERIES FUND, INC. | DECEMBER 31, 2011 | 79 |
Statements of Assets and Liabilities December 31, 2011 (concluded)
| | BlackRock
Large Cap
Core
Portfolio | BlackRock
Money
Market
Portfolio | BlackRock
Total Return
Portfolio | BlackRock
U.S.
Government
Bond
Portfolio |
| Assets | | | | | | | | | | |
| Investments at value—unaffiliated1,2 | $ | 150,067,835 | | $ | 194,328,442 | $ | 116,132,235 | | $ | 126,275,943 |
| Investments at value—affiliated3 | | 5,240,782 | | | — | | — | | | 11,858,082 |
| Cash | | — | | | — | | 1,167,925 | | | — |
| Cash pledged as collateral for financial futures contracts | | — | | | — | | 263,000 | | | 63,000 |
| Investments sold receivable | | — | | | — | | 26,634,892 | | | 63,986,932 |
| TBA sale commitments receivable | | — | | | — | | 15,476,156 | | | 26,824,172 |
| Interest receivable | | — | | | 176,034 | | 643,055 | | | 491,827 |
| Unrealized appreciation on swaps | | — | | | — | | 343,117 | | | 148,253 |
| Dividends receivable | | 136,911 | | | — | | — | | | — |
| Capital shares sold receivable | | — | | | 625,072 | | — | | | — |
| Foreign currency at value4 | | — | | | — | | 130,735 | | | — |
| Unrealized appreciation on foreign currency exchange contracts | | — | | | — | | 98,360 | | | — |
| Swaps receivable | | — | | | — | | 18,911 | | | 50,156 |
| Principal paydown receivable | | — | | | — | | 12,532 | | | 851 |
| Securities lending income receivable—affiliated | | 3,134 | | | — | | — | | | — |
| Cash pledged as collateral for options written | | — | | | — | | — | | | 5,000 |
| Prepaid expenses | | 16,007 | | | 11,473 | | 14,127 | | | 15,300 |
| Other assets | | — | | | — | | 5,908 | | | 140,028 |
| Total assets | | 155,464,669 | | | 195,141,021 | | 160,940,953 | | | 229,859,544 |
| |
| Liabilities | | | | | | | | | | |
| Collateral on securities loaned at value | | 5,240,782 | | | — | | — | | | — |
| Bank overdraft | | 180,681 | | | — | | — | | | — |
| Investments purchased payable | | — | | | — | | 42,544,166 | | | 93,331,537 |
| TBA sale commitments at value5 | | — | | | — | | 15,580,829 | | | 26,983,016 |
| Reverse repurchase agreements | | — | | | — | | 17,346,563 | | | — |
| Options written at value6 | | — | | | — | | 257,188 | | | 252,336 |
| Unrealized depreciation on swaps | | — | | | — | | 248,381 | | | 940,355 |
| Swaps payable | | — | | | — | | 27,213 | | | 54,633 |
| Capital shares redeemed payable | | 16,391 | | | 14,255 | | 40,312 | | | 65,678 |
| Income dividends payable | | — | | | — | | 277,335 | | | 219,351 |
| Investment advisory fees payable | | 46,957 | | | 29,232 | | 20,187 | | | 28,987 |
| Swaps premiums received | | — | | | — | | 191,824 | | | — |
| Interest expense payable | | — | | | — | | 19,737 | | | 35,706 |
| Margin variation payable | | — | | | — | | 30,202 | | | 16,347 |
| Other affiliates payable | | 441 | | | 525 | | 279 | | | 292 |
| Deferred income | | — | | | — | | — | | | — |
| Officer’s and Directors’ fees payable | | 36 | | | 390 | | — | | | 205 |
| Unrealized depreciation on foreign currency exchange contracts | | — | | | — | | 25,032 | | | — |
| Other liabilities | | — | | | — | | — | | | — |
| Other accrued expenses payable | | 29,252 | | | 35,556 | | — | | | 40,834 |
| Total liabilities | | 5,514,540 | | | 79,958 | | 76,609,248 | | | 121,969,277 |
| Net Assets | $ | 149,950,129 | | $ | 195,061,063 | $ | 84,331,705 | | $ | 107,890,267 |
| |
| Net Assets Consist of | | | | | | | | | | |
| Paid-in capital | $ | 173,462,877 | | $ | 195,060,454 | $ | 89,824,153 | | $ | 104,640,187 |
| Undistributed (distributions in excess of) net investment income | | 122,442 | | | — | | 256,687 | | | 758,021 |
| Undistributed (accumulated) net realized gain (loss) | | (34,611,162 | ) | | 609 | | (7,298,375 | ) | | 258,257 |
| Net unrealized appreciation/depreciation | | 10,975,972 | | | — | | 1,549,240 | | | 2,233,802 |
| Net Assets | $ | 149,950,129 | | $ | 195,061,063 | $ | 84,331,705 | | $ | 107,890,267 |
| Shares outstanding, $0.10 par value7 | | 8,040,854 | | | 195,060,454 | | 7,418,756 | | | 9,334,414 |
| Net asset value, offering and redemption price per share | $ | 18.65 | | $ | 1.00 | $ | 11.37 | | $ | 11.56 |
| 1 Investments at cost—unaffiliated | $ | 139,091,863 | | $ | 194,328,442 | $ | 114,614,980 | | $ | 123,607,242 |
| 2 Securities loaned at value | $ | 5,091,669 | | | — | | — | | | — |
| 3 Investments at cost—affiliated | $ | 5,240,782 | | | — | | — | | $ | 11,858,082 |
| 4 Foreign currency at cost | | — | | | — | $ | 133,642 | | | — |
| 5 Proceeds from TBA sale commitments | | — | | | — | $ | 15,476,156 | | $ | 26,824,172 |
| 6 Premiums received | | — | | | — | $ | 221,469 | | $ | 218,900 |
| 7 Authorized shares | | 100 Million | | 2 Billion | | 100 Million | | 100 Million |
See Notes to Financial Statements.
| 80 | BLACKROCK SERIES FUND, INC. | DECEMBER 31, 2011 |
Statements of Operations Year Ended December 31, 2011
| | BlackRock
Balanced
Capital
Portfolio | BlackRock
Capital
Appreciation
Portfolio | BlackRock
Global
Allocation
Portfolio1 | BlackRock
High Yield
Portfolio |
| Investment Income | | | | | | | | | | | | |
| Dividends—unaffiliated | $ | 6,032,384 | | $ | 1,750,661 | | $ | 8,137,473 | | $ | 71,717 | |
| Foreign taxes withheld | | (63,900 | ) | | (144 | ) | | (457,537 | ) | | (42 | ) |
| Dividends—affiliated | | 5,652 | | | 1,232 | | | 3,286 | | | 1,417 | |
| Interest | | 9,619,414 | | | — | | | 4,416,388 | | | 3,743,610 | |
| Securities lending—affiliated | | — | | | 21,776 | | | 1,310 | | | — | |
| Total income | | 15,593,550 | | | 1,773,525 | | | 12,100,920 | | | 3,816,702 | |
| |
| Expenses | | | | | | | | | | | | |
| Investment advisory | | 1,833,279 | | | 579,715 | | | 1,684,394 | | | 172,153 | |
| Accounting services | | 164,138 | | | 42,586 | | | 140,583 | | | 37,273 | |
| Professional | | 70,470 | | | 48,994 | | | 92,172 | | | 52,767 | |
| Custodian | | 89,995 | | | 16,104 | | | 240,746 | | | 19,738 | |
| Officer and Directors | | 25,546 | | | 19,195 | | | 24,413 | | | 16,760 | |
| Printing | | 38,269 | | | 12,996 | | | 42,486 | | | 5,730 | |
| Transfer agent | | 5,000 | | | 5,000 | | | 5,000 | | | 5,000 | |
| Miscellaneous | | 53,740 | | | 14,489 | | | 49,192 | | | 15,002 | |
| Total expenses excluding interest expense and dividend expense | | 2,280,437 | | | 739,079 | | | 2,278,986 | | | 324,423 | |
| Interest expense | | 39,001 | | | — | | | — | | | 4,440 | |
| Total expenses | | 2,319,438 | | | 739,079 | | | 2,278,986 | | | 328,863 | |
| Less fees waived by advisor | | (3,579 | ) | | (857 | ) | | (133,712 | ) | | (78,575 | ) |
| Total expenses after fees waived | | 2,315,859 | | | 738,222 | | | 2,145,274 | | | 250,288 | |
| Net investment income | | 13,277,691 | | | 1,035,303 | | | 9,955,646 | | | 3,566,414 | |
| |
| Realized and Unrealized Gain (Loss) | | | | | | | | | | | | |
| Net realized gain (loss) from: | | | | | | | | | | | | |
| Investments—unaffiliated | | 41,715,618 | | | 16,153,611 | | | 34,511,153 | | | 456,883 | |
| Investments—affiliated | | — | | | — | | | 621,129 | | | 83 | |
| Financial futures contracts | | (4,826,598 | ) | | — | | | 2,606,425 | | | — | |
| Foreign currency transactions | | 345,823 | | | 6,256 | | | 1,716,084 | | | — | |
| Option written and structured options | | (1,421,263 | ) | | — | | | (379,987 | ) | | — | |
| Borrowed bonds | | 143,627 | | | — | | | — | | | — | |
| Swaps | | 452,007 | | | — | | | (10,954 | ) | | (291,608 | ) |
| | | 36,409,214 | | | 16,159,867 | | | 39,063,850 | | | 165,358 | |
| |
| Net change in unrealized appreciation/depreciation on: | | | | | | | | | | | | |
| Investments | | (26,638,422 | ) | | (31,652,561 | ) | | (64,046,207 | ) | | (2,452,426 | ) |
| Financial futures contracts | | 12,482 | | | — | | | 60,238 | | | — | |
| Foreign currency transactions | | 178,948 | | | (4,997 | ) | | (464,894 | ) | | (15 | ) |
| Option written and structured options | | 350,689 | | | — | | | (60,273 | ) | | — | |
| Swaps | | 524,843 | | | — | | | (9,587 | ) | | 46,326 | |
| Unfunded loan commitments | | — | | | — | | | — | | | 1,289 | |
| | | (25,571,460 | ) | | (31,657,558 | ) | | (64,520,723 | ) | | (2,404,826 | ) |
| Total realized and unrealized gain (loss) | | 10,837,754 | | | (15,497,691 | ) | | (25,456,873 | ) | | (2,239,468 | ) |
| Net Increase (Decrease) in Net Assets Resulting from Operations | $ | 24,115,445 | | $ | (14,462,388 | ) | $ | (15,501,227 | ) | $ | 1,326,946 | |
| | | | | | | | | | | | | |
| 1 | | Consolidated Statement of Operations. |
See Notes to Financial Statements.
| BLACKROCK SERIES FUND, INC. | DECEMBER 31, 2011 | 81 |
Statements of Operations Year Ended December 31, 2011 (concluded)
| | BlackRock
Large Cap
Core
Portfolio | BlackRock
Money
Market
Portfolio | BlackRock
Total
Return
Portfolio | BlackRock
U.S.
Government
Bond
Portfolio |
| Investment Income | | | | | | | | | | | | |
| Dividends—unaffiliated | $ | 2,862,523 | | | — | | | — | | | — | |
| Foreign taxes withheld | | (34,080 | ) | | — | | | — | | | — | |
| Dividends—affiliated | | 120 | | | — | | | — | | $ | 17,300 | |
| Interest | | — | | $ | 591,631 | | $ | 4,074,715 | | | 3,392,090 | |
| Securities lending—affiliated | | 9,657 | | | — | | | — | | | — | |
| Total income | | 2,838,220 | | | 591,631 | | | 4,074,715 | | | 3,409,390 | |
| |
| Expenses | | | | | | | | | | | | |
| Investment advisory | | 562,200 | | | 708,512 | | | 298,818 | | | 386,877 | |
| Accounting services | | 42,109 | | | 58,454 | | | 44,767 | | | 40,449 | |
| Professional | | 45,362 | | | 38,864 | | | 41,643 | | | 55,599 | |
| Custodian | | 16,821 | | | 14,673 | | | 43,477 | | | 44,180 | |
| Officer and Directors | | 18,799 | | | 19,877 | | | 17,392 | | | 18,046 | |
| Printing | | 12,284 | | | 15,019 | | | 6,588 | | | 11,310 | |
| Transfer agent | | 5,000 | | | 5,000 | | | 5,000 | | | 5,000 | |
| Miscellaneous | | 13,261 | | | 14,790 | | | 33,604 | | | 18,948 | |
| Total expenses excluding interest expense and dividend expense | | 715,836 | | | 875,189 | | | 491,289 | | | 580,409 | |
| Interest expense | | — | | | — | | | 18,724 | | | 1,345 | |
| Total expenses | | 715,836 | | | 875,189 | | | 510,013 | | | 581,754 | |
| Less fees waived by advisor | | (68 | ) | | (283,632 | ) | | (64,152 | ) | | (35,995 | ) |
| Total expenses after fees waived | | 715,768 | | | 591,557 | | | 445,861 | | | 545,759 | |
| Net investment income | | 2,122,452 | | | 74 | | | 3,628,854 | | | 2,863,631 | |
| |
| Realized and Unrealized Gain (Loss) | | | | | | | | | | | | |
| Net realized gain (loss) from: | | | | | | | | | | | | |
| Investments—unaffiliated | | 13,826,746 | | | 1,560 | | | 1,585,560 | | | 4,378,733 | |
| Investments—affiliated | | — | | | — | | | — | | | 221 | |
| Financial futures contracts | | — | | | — | | | (2,648,006 | ) | | (264,101 | ) |
| Foreign currency transactions | | — | | | — | | | (48,451 | ) | | 3,023 | |
| Option written and structured options | | — | | | — | | | (55,697 | ) | | (444,281 | ) |
| Borrowed bonds | | — | | | — | | | 28,588 | | | 2,333 | |
| Swaps | | — | | | — | | | (127,985 | ) | | (396,225 | ) |
| | | 13,826,746 | | | 1,560 | | | (1,265,991 | ) | | 3,279,703 | |
| |
| Net change in unrealized appreciation/depreciation on: | | | | | | | | | | | | |
| Investments | | (11,431,767 | ) | | — | | | 2,177,734 | | | 1,388,174 | |
| Financial futures contracts | | — | | | — | | | 14,084 | | | 343,884 | |
| Foreign currency transactions | | — | | | — | | | 66,774 | | | — | |
| Option written and structured options | | — | | | — | | | (4,511 | ) | | (33,436 | ) |
| Swaps | | — | | | — | | | 564,892 | | | (830,534 | ) |
| | | (11,431,767 | ) | | — | | | 2,818,973 | | | 868,088 | |
| Total realized and unrealized gain (loss) | | 2,394,979 | | | 1,560 | | | 1,552,982 | | | 4,147,791 | |
| Net Increase (Decrease) in Net Assets Resulting from Operations | $ | 4,517,431 | | $ | 1,634 | | $ | 5,181,836 | | $ | 7,011,422 | |
See Notes to Financial Statements.
| 82 | BLACKROCK SERIES FUND, INC. | DECEMBER 31, 2011 |
Statements of Changes in Net Assets
| | BlackRock
Balanced Capital
Portfolio | | BlackRock
Capital Appreciation
Portfolio |
| | Year Ended December 31, | | Year Ended December 31, |
| Increase (Decrease) in Net Assets: | 2011 | 2010 | | 2011 | 2010 |
| Operations | | | | | | | | | | | | | |
| Net investment income | $ | 13,277,691 | | $ | 12,832,006 | | | $ | 1,035,303 | | $ | 776,622 | |
| Net realized gain | | 36,409,214 | | | 35,143,079 | | | | 16,159,867 | | | 13,814,181 | |
| Net change in unrealized appreciation/depreciation | | (25,571,460 | ) | | (898,186 | ) | | | (31,657,558 | ) | | 14,719,497 | |
| Net increase in net assets resulting from operations | | 24,115,445 | | | 47,076,899 | | | | (14,462,388 | ) | | 29,310,300 | |
| |
| Dividends to Shareholders From | | | | | | | | | | | | | |
| Net investment income | | (13,880,759 | ) | | (12,758,496 | ) | | | (1,000,004 | ) | | (806,311 | ) |
| |
| Capital Share Transactions | | | | | | | | | | | | | |
| Net decrease in net assets derived from capital share transactions | | (41,862,935 | ) | | (52,806,525 | ) | | | (28,677,851 | ) | | (10,686,234 | ) |
| |
| Net Assets | | | | | | | | | | | | | |
| Total decrease in net assets | | (31,628,249 | ) | | (18,488,122 | ) | | | (44,140,243 | ) | | 17,817,755 | |
| Beginning of year | | 531,479,676 | | | 549,967,798 | | | | 176,450,537 | | | 158,632,782 | |
| End of year | $ | 499,851,427 | | $ | 531,479,676 | | | $ | 132,310,294 | | $ | 176,450,537 | |
| Undistributed net investment income | $ | 274,974 | | $ | 670,064 | | | $ | 41,554 | | | — | |
| | BlackRock
Global Allocation
Portfolio1 | | BlackRock
High Yield
Portfolio |
| | Year Ended December 31, | | Year Ended December 31, |
| Increase (Decrease) in Net Assets: | 2011 | 2010 | | 2011 | 2010 |
| Operations | | | | | | | | | | | | | |
| Net investment income | $ | 9,955,646 | | $ | 6,844,020 | | | $ | 3,566,414 | | $ | 3,913,211 | |
| Net realized gain | | 39,063,850 | | | 6,217,836 | | | | 165,358 | | | 1,609,332 | |
| Net change in unrealized appreciation/depreciation | | (64,520,723 | ) | | 20,178,471 | | | | (2,404,826 | ) | | 1,900,971 | |
| Net increase (decrease) in net assets resulting from operations | | (15,501,227 | ) | | 33,240,327 | | | | 1,326,946 | | | 7,423,514 | |
| |
| Dividends and Distributions to Shareholders From | | | | | | | | | | | | | |
| Net investment income | | (19,100,018 | ) | | (6,300,006 | ) | | | (3,564,140 | ) | | (3,900,828 | ) |
| Net realized gain | | (3,808,851 | ) | | — | | | | — | | | — | |
| Decrease in net assets resulting from dividends and | | | | | | | | | | | | | |
| distributions to shareholders | | (22,908,869 | ) | | (6,300,006 | ) | | | (3,564,140 | ) | | (3,900,828 | ) |
| |
| Capital Share Transactions | | | | | | | | | | | | | |
| Net increase (decrease) in net assets derived from capital | | | | | | | | | | | | | |
| share transactions | | (185,764,913 | ) | | 171,595,067 | | | | (4,180,402 | ) | | (404,578 | ) |
| |
| Net Assets | | | | | | | | | | | | | |
| Total increase (decrease) in net assets | | (224,175,009 | ) | | 198,535,388 | | | | (6,417,596 | ) | | 3,118,108 | |
| Beginning of year | | 496,727,652 | | | 298,192,264 | | | | 53,221,534 | | | 50,103,426 | |
| End of year | $ | 272,552,643 | | $ | 496,727,652 | | | $ | 46,803,938 | | $ | 53,221,534 | |
Undistributed (distribution in excess of) net investment
income | $ | (1,046,940 | ) | $ | (2,030,346 | ) | | $ | 35,249 | | $ | 2,730 | |
| | | | | | | | | | | | | | |
| 1 | | Consolidated Statements of Changes in Net Assets. |
See Notes to Financial Statements.
| BLACKROCK SERIES FUND, INC. | DECEMBER 31, 2011 | 83 |
Statements of Changes in Net Assets (concluded)
| | BlackRock
Large Cap Core
Portfolio | | BlackRock
Money Market
Portfolio |
| | Year Ended December 31, | | Year Ended December 31, |
| Increase (Decrease) in Net Assets: | 2011 | 2010 | | 2011 | | 2010 |
| Operations | | | | | | | | | | | | | |
| Net investment income | $ | 2,122,452 | | $ | 2,012,379 | | | $ | 74 | | $ | 5,947 | |
| Net realized gain | | 13,826,746 | | | 9,111,381 | | | | 1,560 | | | 1,841 | |
| Net change in unrealized appreciation/depreciation | | (11,431,767 | ) | | 3,927,239 | | | | — | | | — | |
| Net increase in net assets resulting from operations | | 4,517,431 | | | 15,050,999 | | | | 1,634 | | | 7,788 | |
| |
| Dividends to Shareholders From | | | | | | | | | | | | | |
| Net investment income | | (2,012,381 | ) | | (2,356,592 | ) | | | (74 | ) | | (5,947 | ) |
| Net realized gain | | — | | | — | | | | (1,316 | ) | | (12,821 | ) |
| Decrease in net assets resulting from dividends and | | | | | | | | | | | | | |
| distributions to shareholders | | (2,012,381 | ) | | (2,356,592 | ) | | | (1,390 | ) | | (18,768 | ) |
| |
| Capital Share Transactions | | | | | | | | | | | | | |
Net decrease in net assets derived from capital share
transactions | | (14,752,973 | ) | | (18,062,356 | ) | | | (20,849,288 | ) | | (47,662,940 | ) |
| |
| Net Assets | | | | | | | | | | | | | |
| Total decrease in net assets | | (12,247,923 | ) | | (5,367,949 | ) | | | (20,849,044 | ) | | (47,673,920 | ) |
| Beginning of year | | 162,198,052 | | | 167,566,001 | | | | 215,910,107 | | | 263,584,027 | |
| End of year | $ | 149,950,129 | | $ | 162,198,052 | | | $ | 195,061,063 | | $ | 215,910,107 | |
| Undistributed net investment income | $ | 122,442 | | $ | 12,371 | | | | — | | | — | |
| | BlackRock
Total Return
Portfolio | | BlackRock
U.S. Government Bond
Portfolio |
| | Year Ended December 31, | | Year Ended December 31, |
| Increase (Decrease) in Net Assets: | 2011 | 2010 | | 2011 | 2010 |
| Operations | | | | | | | | | | | | | |
| Net investment income | $ | 3,628,854 | | $ | 4,036,986 | | | $ | 2,863,631 | | $ | 4,559,502 | |
| Net realized gain (loss) | | (1,265,991 | ) | | 2,049,441 | | | | 3,279,703 | | | 4,196,524 | |
| Net change in unrealized appreciation/depreciation | | 2,818,973 | | | 1,406,064 | | | | 868,088 | | | 1,660,430 | |
| Net increase in net assets resulting from operations | | 5,181,836 | | | 7,492,491 | | | | 7,011,422 | | | 10,416,456 | |
| |
| Dividends to Shareholders From | | | | | | | | | | | | | |
| Net investment income | | (3,746,655 | ) | | (4,301,385 | ) | | | (3,029,477 | ) | | (4,707,773 | ) |
| Net realized gain | | — | | | — | | | | (1,051,689 | ) | | (2,647,438 | ) |
| Decrease in net assets resulting from dividends and | | | | | | | | | | | | | |
| distributions to shareholders | | (3,746,655 | ) | | (4,301,385 | ) | | | (4,081,166 | ) | | (7,355,211 | ) |
| |
| Capital Share Transactions | | | | | | | | | | | | | |
| Net decrease in net assets derived from capital share transactions | | (5,988,033 | ) | | (5,861,922 | ) | | | (10,459,217 | ) | | (12,138,260 | ) |
| |
| Net Assets | | | | | | | | | | | | | |
| Total decrease in net assets | | (4,552,852 | ) | | (2,670,816 | ) | | | (7,528,961 | ) | | (9,077,015 | ) |
| Beginning of year | | 88,884,557 | | | 91,555,373 | | | | 115,419,228 | | | 124,496,243 | |
| End of year | $ | 84,331,705 | | $ | 88,884,557 | | | $ | 107,890,267 | | $ | 115,419,228 | |
| Undistributed net investment income | $ | 256,687 | | $ | 353,152 | | | $ | 758,021 | | $ | 661,490 | |
See Notes to Financial Statements.
| 84 | BLACKROCK SERIES FUND, INC. | DECEMBER 31, 2011 |
Statement of Cash Flows Year Ended December 31, 2011
| | BlackRock Total
Return Portfolio |
| Cash Provided by Operating Activities: | | |
| Net increase in net assets resulting from operations | $ | 5,181,836 |
| Adjustments to reconcile net increase in net assets resulting from operations | | |
| to net cash provided by operating activities: | | |
| Decrease in interest receivable | | 291,895 |
| Increase in swaps receivable | | (1,322) |
| Decrease in other assets | | 2 |
| Increase in prepaid expenses | | (11,789) |
| Increase in investment advisory fees payable | | 415 |
| Increase in interest expense payable | | 17,954 |
| Decrease in other affiliates payable | | (294) |
| Increase in cash pledged as collateral for financial futures contracts | | (263,000) |
| Decrease in margin variation payable | | (22,295) |
| Decrease in swaps payable | | (31,944) |
| Decrease in other accrued expenses payable | | (45,637) |
| Decrease in Officer’s and Directors’ fees payable | | (284) |
| Net periodic and termination payments of swaps | | 4,467 |
| Net realized and unrealized gain | (4,363,340) |
| Amortization of premium and accretion of discount on investments | | 324,738 |
| Premiums received from options written | 2,411,685 |
| Proceeds from sales and paydowns of long-term investments | 1,449,240,882 |
| Purchases of long-term investments | (1,432,754,875) |
| Proceeds from borrowed bonds transactions | 5,518,602 |
| Payments from borrowed bonds transactions | (5,490,140) |
| Premiums paid on closing options written | (4,320,215) |
| Cash provided by operating activities | 15,687,341 |
| |
| Cash Used for Financing Activities: | | |
| Proceeds from shares sold | 4,304,127 |
| Cash payments on shares redeemed | (14,062,154) |
| Cash receipts from borrowings | 558,471,151 |
| Cash payments on borrowings | (565,875,280) |
| Cash dividend paid to shareholders | | (1) |
| Cash used for financing activities | (17,162,157) |
| |
| Cash Impact from Foreign Exchange Fluctuations: | | |
| Cash impact from foreign exchange fluctuations | | (1,113) |
| |
| Cash and Foreign Currency: | | |
| Net increase in cash and foreign currency | (1,475,929) |
| Cash and foreign currency at beginning of year | 2,774,589 |
| Cash and foreign currency at end of year | $ | 1,298,660 |
| |
| Cash Flow Information: | | |
| Cash paid for interest | $ | 770 |
| |
| Noncash Financing Activities: | | |
| Capital shares issued in reinvestment of dividends and distributions paid to shareholders | $ | 3,777,194 |
| | | |
A Statement of Cash Flows is presented when the Portfolio has a significant amount of borrowings during the year, based on the average borrowings outstanding in relation to total assets.
See Notes to Financial Statements.
| BLACKROCK SERIES FUND, INC. | DECEMBER 31, 2011 | 85 |
Financial Highlights
| | BlackRock Balanced Capital Portfolio |
| | Year Ended December 31, |
| | 2011 | 2010 | 2009 | | 2008 | 2007 |
| Per Share Operating Performance | | | | | | | | | | | | | | | |
| Net asset value, beginning of year | $ | 14.09 | | $ | 13.20 | | $ | 11.43 | | $ | 16.25 | | $ | 15.83 | |
| Net investment income1 | | 0.37 | | | 0.33 | | | 0.34 | | | 0.43 | | | 0.44 | |
| Net realized and unrealized gain (loss) | | 0.28 | | | 0.90 | | | 1.79 | | | (4.80 | ) | | 0.45 | |
| Net increase (decrease) from investment operations | | 0.65 | | | 1.23 | | | 2.13 | | | (4.37 | ) | | 0.89 | |
| Dividends from net investment income | | (0.41 | ) | | (0.34 | ) | | (0.36 | ) | | (0.45 | ) | | (0.47 | ) |
| Net asset value, end of year | $ | 14.33 | | $ | 14.09 | | $ | 13.20 | | $ | 11.43 | | $ | 16.25 | |
| |
| Total Investment Return2 | | | | | | | | | | | | | | | |
| Based on net asset value | | 4.58 | % | | 9.37 | % | | 18.64 | % | | (26.84 | )% | | 5.64 | % |
| |
| Ratios to Average Net Assets | | | | | | | | | | | | | | | |
| Total expenses | | 0.45 | % | | 0.51 | % | | 0.46 | % | | 0.50 | % | | 0.41 | % |
| Total expenses after fees waived | | 0.44 | % | | 0.51 | % | | 0.46 | % | | 0.50 | % | | 0.41 | % |
| Total expenses after fees waived and excluding | | | | | | | | | | | | | | | |
| interest expense | | 0.44 | % | | 0.44 | % | | 0.45 | % | | 0.42 | % | | 0.41 | % |
| Net investment income | | 2.55 | % | | 2.42 | % | | 2.84 | % | | 2.99 | % | | 2.63 | % |
| |
| Supplemental Data | | | | | | | | | | | | | | | |
| Net assets, end of year (000) | $ | 499,851 | | $ | 531,480 | | $ | 549,968 | | $ | 524,698 | | $ | 809,360 | |
| Portfolio turnover | | 612 | %3 | | 705 | %4 | | 461 | %5 | | 383 | %6 | | 451 | % |
| | | | | | | | | | | | | | | | |
| 1 | | Based on average shares outstanding. |
| 2 | | Where applicable, total investment returns exclude insurance-related fees and expenses and include the reinvestment of dividends and distributions. |
| 3 | | Includes mortgage dollar roll transactions. Excluding these transactions, the portfolio turnover rate would have been 415%. |
| 4 | | Includes mortgage dollar roll transactions. Excluding these transactions, the portfolio turnover rate would have been 548%. |
| 5 | | Includes mortgage dollar roll transactions. Excluding these transactions, the portfolio turnover rate would have been 335%. |
| 6 | | Includes mortgage dollar roll transactions. Excluding these transactions, the portfolio turnover rate would have been 283%. |
| | BlackRock Capital Appreciation Portfolio |
| | Year Ended December 31, |
| | 2011 | 2010 | 2009 | 2008 | 2007 |
| Per Share Operating Performance | | | | | | | | | | | | | | | |
| Net asset value, beginning of year1 | $ | 27.72 | | $ | 23.20 | | $ | 16.99 | | $ | 28.05 | | $ | 23.55 | |
| Net investment income | | 0.17 | | | 0.12 | | | 0.14 | | | 0.17 | | | 0.17 | |
| Net realized and unrealized gain (loss) | | (2.57 | ) | | 4.53 | | | 6.22 | | | (11.06 | ) | | 4.50 | |
| Net increase (decrease) from investment operations | | (2.40 | ) | | 4.65 | | | 6.36 | | | (10.89 | ) | | 4.67 | |
| Dividends from net investment income | | (0.19 | ) | | (0.13 | ) | | (0.15 | ) | | (0.17 | ) | | (0.17 | ) |
| Net asset value, end of year | $ | 25.13 | | $ | 27.72 | | $ | 23.20 | | $ | 16.99 | | $ | 28.05 | |
| |
| Total Investment Return2 | | | | | | | | | | | | | | | |
| Based on net asset value | | (8.66 | )% | | 20.04 | % | | 37.40 | % | | (38.81 | )% | | 19.83 | % |
| |
| Ratios to Average Net Assets | | | | | | | | | | | | | | | |
| Total expenses | | 0.45 | % | | 0.46 | % | | 0.49 | % | | 0.44 | % | | 0.43 | % |
| Total expenses after fees waived | | 0.44 | % | | 0.46 | % | | 0.49 | % | | 0.44 | % | | 0.43 | % |
| Net investment income | | 0.62 | % | | 0.50 | % | | 0.72 | % | | 0.71 | % | | 0.66 | % |
| |
| Supplemental Data | | | | | | | | | | | | | | | |
| Net assets, end of year (000) | $ | 132,310 | | $ | 176,451 | | $ | 158,633 | | $ | 127,953 | | $ | 233,779 | |
| Portfolio turnover | | 79 | % | | 74 | % | | 81 | % | | 116 | % | | 81 | % |
| | | | | | | | | | | | | | | | |
| 1 | | Based on average shares outstanding. |
| 2 | | Where applicable, total investment returns exclude insurance-related fees and expenses and include the reinvestment of dividends and distributions. |
See Notes to Financial Statements.
| 86 | BLACKROCK SERIES FUND, INC. | DECEMBER 31, 2011 |
Financial Highlights (continued)
| | BlackRock Global Allocation Portfolio |
| | Year Ended December 31, |
| | 20111 | 20101 | 20091 | 2008 | 2007 |
| Per Share Operating Performance | | | | | | | | | | | | | | | |
| Net asset value, beginning of year | $ | 15.59 | | $ | 14.32 | | $ | 11.97 | | $ | 17.95 | | $ | 17.03 | |
| Net investment income2 | | 0.33 | | | 0.31 | | | 0.34 | | | 0.38 | | | 0.40 | |
| Net realized and unrealized gain (loss) | | (0.86 | ) | | 1.17 | | | 2.35 | | | (4.14 | ) | | 2.65 | |
| Net increase (decrease) from investment operations | | (0.53 | ) | | 1.48 | | | 2.69 | | | (3.76 | ) | | 3.05 | |
| Dividends and distributions from: | | | | | | | | | | | | | | | |
| Net investment income | | (1.05 | ) | | (0.21 | ) | | (0.28 | ) | | (1.00 | ) | | (0.65 | ) |
| Net realized gain | | (0.21 | ) | | — | | | — | | | (1.22 | ) | | (1.48 | ) |
| Tax return of capital | | — | | | — | | | (0.06 | ) | | — | | | — | |
| Total dividends and distributions | | (1.26 | ) | | (0.21 | ) | | (0.34 | ) | | (2.22 | ) | | (2.13 | ) |
| Net asset value, end of year | $ | 13.80 | | $ | 15.59 | | $ | 14.32 | | $ | 11.97 | | $ | 17.95 | |
| |
| Total Investment Return3 | | | | | | | | | | | | | | | |
| Based on net asset value | | (3.39 | )% | | 10.31 | % | | 22.59 | % | | (20.75 | )% | | 17.96 | % |
| |
| Ratios to Average Net Assets | | | | | | | | | | | | | | | |
| Total expenses | | 0.47 | % | | 0.48 | % | | 0.53 | % | | 0.60 | % | | 0.51 | % |
| Total expenses after fees waived | | 0.44 | % | | 0.48 | % | | 0.51 | % | | 0.55 | % | | 0.51 | % |
| Total expenses after fees waived and excluding | | | | | | | | | | | | | | | |
| dividend and interest expense | | 0.44 | % | | 0.48 | % | | 0.50 | % | | 0.50 | % | | 0.51 | % |
| Net investment income | | 2.04 | % | | 2.16 | % | | 2.63 | % | | 2.31 | % | | 2.21 | % |
| |
| Supplemental Data | | | | | | | | | | | | | | | |
| Net assets, end of year (000) | $ | 272,553 | | $ | 496,728 | | $ | 298,192 | | $ | 256,591 | | $ | 338,642 | |
| Portfolio turnover | | 65 | % | | 40 | % | | 39 | % | | 53 | % | | 40 | % |
| | | | | | | | | | | | | | | | |
| 1 | | Consolidated Financial Highlights. |
| 2 | | Based on average shares outstanding. |
| 3 | | Where applicable, total investment returns exclude insurance-related fees and expenses and include the reinvestment of dividends and distributions. |
| | BlackRock High Yield Portfolio |
| | Year Ended December 31, |
| | 2011 | 2010 | 2009 | 2008 | 2007 |
| Per Share Operating Performance | | | | | | | | | | | | | | | |
| Net asset value, beginning of year | $ | 5.33 | | $ | 4.96 | | $ | 3.56 | | $ | 5.47 | | $ | 5.76 | |
| Net investment income1 | | 0.38 | | | 0.40 | | | 0.43 | | | 0.43 | | | 0.45 | |
| Net realized and unrealized gain (loss) | | (0.27 | ) | | 0.37 | | | 1.39 | | | (1.91 | ) | | (0.29 | ) |
| Net increase (decrease) from investment operations | | 0.11 | | | 0.77 | | | 1.82 | | | (1.48 | ) | | 0.16 | |
| Dividends from net investment income | | (0.38 | ) | | (0.40 | ) | | (0.42 | ) | | (0.43 | ) | | (0.45 | ) |
| Net asset value, end of year | $ | 5.06 | | $ | 5.33 | | $ | 4.96 | | $ | 3.56 | | $ | 5.47 | |
| |
| Total Investment Return2 | | | | | | | | | | | | | | | |
| Based on net asset value | | 2.04 | % | | 16.20 | % | | 53.68 | % | | (28.61 | )% | | 2.75 | % |
| |
| Ratios to Average Net Assets | | | | | | | | | | | | | | | |
| Total expenses | | 0.66 | % | | 0.67 | % | | 0.73 | % | | 0.66 | % | | 0.56 | % |
| Total expenses after fees waived | | 0.50 | % | | 0.50 | % | | 0.49 | % | | 0.50 | % | | 0.50 | % |
| Total expenses after fees waived and excluding interest expense | | 0.50 | % | | 0.50 | % | | 0.49 | % | | 0.50 | % | | 0.50 | % |
| Net investment income | | 7.18 | % | | 7.84 | % | | 9.91 | % | | 8.83 | % | | 7.84 | % |
| |
| Supplemental Data | | | | | | | | | | | | | | | |
| Net assets, end of year (000) | $ | 46,804 | | $ | 53,222 | | $ | 50,103 | | $ | 31,058 | | $ | 50,823 | |
| Portfolio turnover | | 96 | % | | 121 | % | | 107 | % | | 53 | % | | 55 | % |
| | | | | | | | | | | | | | | | |
| 1 | | Based on average shares outstanding. |
| 2 | | Where applicable, total investment returns exclude insurance-related fees and expenses and include the reinvestment of dividends and distributions. |
See Notes to Financial Statements.
| BLACKROCK SERIES FUND, INC. | DECEMBER 31, 2011 | 87 |
Financial Highlights (continued)
| | BlackRock Large Cap Core Portfolio |
| | Year Ended December 31, |
| | 2011 | 2010 | 2009 | 2008 | 2007 |
| Per Share Operating Performance | | | | | | | | | | | | | | | |
| Net asset value, beginning of year | $ | 18.42 | | $ | 16.98 | | $ | 14.02 | | $ | 23.58 | | $ | 25.18 | |
| Net investment income1 | | 0.25 | | | 0.22 | | | 0.23 | | | 0.24 | | | 0.28 | |
| Net realized and unrealized gain (loss) | | 0.23 | | | 1.49 | | | 2.98 | | | (9.21 | ) | | 1.83 | |
| Net increase (decrease) from investment operations | | 0.48 | | | 1.71 | | | 3.21 | | | (8.97 | ) | | 2.11 | |
| Dividends and distributions from: | | | | | | | | | | | | | | | |
| Net investment income | | (0.25 | ) | | (0.27 | ) | | (0.25 | ) | | (0.23 | ) | | (0.29 | ) |
| Net realized gain | | — | | | — | | | — | | | (0.36 | ) | | (3.42 | ) |
| Total dividends and distributions | | (0.25 | ) | | (0.27 | ) | | (0.25 | ) | | (0.59 | ) | | (3.71 | ) |
| Net asset value, end of year | $ | 18.65 | | $ | 18.42 | | $ | 16.98 | | $ | 14.02 | | $ | 23.58 | |
| |
| Total Investment Return2 | | | | | | | | | | | | | | | |
| Based on net asset value | | 2.61 | % | | 10.09 | % | | 22.90 | % | | (37.95 | )% | | 8.29 | % |
| |
| Ratios to Average Net Assets | | | | | | | | | | | | | | | |
| Total expenses | | 0.44 | % | | 0.45 | % | | 0.47 | % | | 0.45 | % | | 0.43 | % |
| Total expenses after fees waived | | 0.44 | % | | 0.45 | % | | 0.47 | % | | 0.44 | % | | 0.43 | % |
| Net investment income | | 1.32 | % | | 1.27 | % | | 1.54 | % | | 1.22 | % | | 1.05 | % |
| |
| Supplemental Data | | | | | | | | | | | | | | | |
| Net assets, end of year (000) | $ | 149,950 | | $ | 162,198 | | $ | 167,566 | | $ | 159,086 | | $ | 311,244 | |
| Portfolio turnover | | 104 | % | | 143 | % | | 150 | % | | 104 | % | | 74 | % |
| | | | | | | | | | | | | | | | |
| 1 | | Based on average shares outstanding. |
| 2 | | Where applicable, total investment returns exclude insurance-related fees and expenses and include the reinvestment of dividends and distributions. |
| | BlackRock Money Market Portfolio |
| | Year Ended December 31, |
| | 2011 | 2010 | 2009 | 2008 | 2007 |
| Per Share Operating Performance | | | | | | | | | | | | | | | |
| Net asset value, beginning of year | $ | 1.00 | | $ | 1.00 | | $ | 1.00 | | $ | 1.00 | | $ | 1.00 | |
| Net investment income | | 0.0000 | | | 0.0000 | | | 0.0030 | | | 0.0278 | | | 0.0492 | |
| Net realized gain | | — | | | — | | | 0.0000 | | | 0.0000 | | | 0.0002 | |
| Net increase (decrease) from investment operations | | 0.0000 | | | 0.0000 | | | 0.0030 | | | 0.0278 | | | 0.0494 | |
| Dividends and distributions from: | | | | | | | | | | | | | | | |
| Net investment income | | (0.0000 | ) | | (0.0000 | ) | | (0.0031 | ) | | (0.0278 | ) | | (0.0492 | ) |
| Net realized gain | | (0.0000 | ) | | (0.0001 | ) | | (0.0000 | ) | | — | | | — | |
| Total dividends and distributions | | (0.0000 | ) | | (0.0001 | ) | | (0.0031 | ) | | (0.0278 | ) | | (0.0492 | ) |
| Net asset value, end of year | $ | 1.00 | | $ | 1.00 | | $ | 1.00 | | $ | 1.00 | | $ | 1.00 | |
| |
| Total Investment Return1 | | | | | | | | | | | | | | | |
| Based on net asset value | | 0.00 | % | | 0.01 | % | | 0.32 | % | | 2.83 | % | | 5.03 | % |
| |
| Ratios to Average Net Assets | | | | | | | | | | | | | | | |
| Total expenses | | 0.43 | % | | 0.43 | % | | 0.48 | % | | 0.43 | % | | 0.41 | % |
| Total expenses after fees waived | | 0.29 | % | | 0.35 | % | | 0.45 | % | | 0.43 | % | | 0.41 | % |
| Net investment income | | 0.00 | % | | 0.00 | % | | 0.32 | % | | 2.77 | % | | 4.92 | % |
| |
| Supplemental Data | | | | | | | | | | | | | | | |
| Net assets, end of year (000) | $ | 195,061 | | $ | 215,910 | | $ | 263,584 | | $ | 312,788 | | $ | 301,754 | |
| | | | | | | | | | | | | | | | |
| 1 | | Where applicable, total investment returns exclude insurance-related fees and expenses and include the reinvestment of dividends and distributions. |
See Notes to Financial Statements.
| 88 | BLACKROCK SERIES FUND, INC. | DECEMBER 31, 2011 |
Financial Highlights (concluded)
| | BlackRock Total Return Portfolio |
| | Year Ended December 31, |
| | 2011 | 2010 | 2009 | | 2008 | 2007 |
| Per Share Operating Performance | | | | | | | | | | | | | | | |
| Net asset value, beginning of year | $ | 11.17 | | $ | 10.79 | | $ | 9.94 | | $ | 11.37 | | $ | 11.41 | |
| Net investment income1 | | 0.47 | | | 0.49 | | | 0.55 | | | 0.54 | | | 0.55 | |
| Net realized and unrealized gain (loss) | | 0.22 | | | 0.41 | | | 0.88 | | | (1.42 | ) | | (0.05 | ) |
| Net increase (decrease) from investment operations | | 0.69 | | | 0.90 | | | 1.43 | | | (0.88 | ) | | 0.50 | |
Dividends and distributions from net investment
income | | (0.49 | ) | | (0.52 | ) | | (0.58 | ) | | (0.55 | ) | | (0.54 | ) |
| Net asset value, end of year | $ | 11.37 | | $ | 11.17 | | $ | 10.79 | | $ | 9.94 | | $ | 11.37 | |
| |
| Total Investment Return2 | | | | | | | | | | | | | | | |
| Based on net asset value | | 6.34 | % | | 8.51 | % | | 14.81 | % | | (7.77 | )% | | 4.47 | % |
| |
| Ratios to Average Net Assets | | | | | | | | | | | | | | | |
| Total expenses | | 0.60 | % | | 0.72 | % | | 0.62 | % | | 0.57 | % | | 0.49 | % |
| Total expenses after fees waived | | 0.53 | % | | 0.63 | % | | 0.52 | % | | 0.54 | % | | 0.49 | % |
Total expenses after fees waived and excluding
interest expense | | 0.50 | % | | 0.50 | % | | 0.50 | % | | 0.50 | % | | 0.49 | % |
| Net investment income | | 4.28 | % | | 4.42 | % | | 5.35 | % | | 5.03 | % | | 4.88 | % |
| |
| Supplemental Data | | | | | | | | | | | | | | | |
| Net assets, end of year (000) | $ | 84,332 | | $ | 88,885 | | $ | 91,555 | | $ | 106,108 | | $ | 112,058 | |
| Portfolio turnover | | 1,237 | %3 | | 1,353 | %4 | | 847 | %5 | | 871 | %6 | | 281 | % |
| | | | | | | | | | | | | | | | |
| 1 | | Based on average shares outstanding. |
| 2 | | Where applicable, total investment returns exclude insurance-related fees and expenses and include the reinvestment of dividends and distributions. |
| 3 | | Includes mortgage dollar roll transactions. Excluding these transactions, the portfolio turnover would have been 793%. |
| 4 | | Includes mortgage dollar roll transactions. Excluding these transactions, the portfolio turnover would have been 1,009%. |
| 5 | | Includes mortgage dollar roll transactions. Excluding these transactions, the portfolio turnover would have been 568%. |
| 6 | | Includes mortgage dollar roll transactions. Excluding these transactions, the portfolio turnover would have been 607%. |
| | BlackRock U.S. Government Bond Portfolio |
| | Year Ended December 31, |
| | 2011 | 2010 | 2009 | 2008 | 2007 |
| Per Share Operating Performance | | | | | | | | | | | | | | | |
| Net asset value, beginning of year | $ | 11.26 | | $ | 11.02 | | $ | 11.75 | | $ | 11.15 | | $ | 11.20 | |
| Net investment income1 | | 0.29 | | | 0.42 | | | 0.43 | | | 0.39 | | | 0.54 | |
| Net realized and unrealized gain (loss) | | 0.43 | | | 0.52 | | | (0.62 | ) | | 0.49 | | | (0.04 | ) |
| Net increase (decrease) from investment operations | | 0.72 | | | 0.94 | | | (0.19 | ) | | 0.88 | | | 0.50 | |
| Dividends and distributions from: | | | | | | | | | | | | | | | |
| Net investment income | | (0.31 | ) | | (0.44 | ) | | (0.51 | ) | | (0.28 | ) | | (0.55 | ) |
| Net realized gain | | (0.11 | ) | | (0.26 | ) | | (0.03 | ) | | — | | | — | |
| Total dividends and distributions | | (0.42 | ) | | (0.70 | ) | | (0.54 | ) | | (0.28 | ) | | (0.55 | ) |
| Net asset value, end of year | $ | 11.56 | | $ | 11.26 | | $ | 11.02 | | $ | 11.75 | | $ | 11.15 | |
| |
| Total Investment Return2 | | | | | | | | | | | | | | | |
| Based on net asset value | | 6.54 | % | | 8.67 | % | | (1.61 | )% | | 8.01 | % | | 4.66 | % |
| |
| Ratios to Average Net Assets | | | | | | | | | | | | | | | |
| Total expenses | | 0.53 | % | | 0.62 | % | | 0.53 | % | | 0.67 | % | | 0.51 | % |
| Total expenses after fees waived | | 0.50 | % | | 0.58 | % | | 0.51 | % | | 0.67 | % | | 0.50 | % |
| Total expenses after fees waived and excluding | | | | | | | | | | | | | | | |
| interest expense and fees | | 0.50 | % | | 0.50 | % | | 0.49 | % | | 0.48 | % | | 0.48 | % |
| Net investment income | | 2.62 | % | | 3.72 | % | | 3.76 | % | | 3.47 | % | | 4.93 | % |
| |
| Supplemental Data | | | | | | | | | | | | | | | |
| Net assets, end of year (000) | $ | 107,890 | | $ | 115,419 | | $ | 124,496 | | $ | 147,878 | | $ | 154,590 | |
| Portfolio turnover | | 2,756 | %3 | | 3,218 | %4 | | 2,598 | %5 | | 6,059 | %6 | | 2,313 | % |
| | | | | | | | | | | | | | | | |
| 1 | | Based on average shares outstanding. |
| 2 | | Where applicable, total investment returns exclude insurance-related fees and expenses and include the reinvestment of dividends and distributions. |
| 3 | | Includes mortgage dollar roll transactions. Excluding these transactions, the portfolio turnover rate would have been 1,937%. |
| 4 | | Includes mortgage dollar roll transactions. Excluding these transactions, the portfolio turnover rate would have been 2,373%. |
| 5 | | Includes mortgage dollar roll transactions. Excluding these transactions, the portfolio turnover rate would have been 1,947%. |
| 6 | | Includes mortgage dollar roll transactions. Excluding these transactions, the portfolio turnover rate would have been 5,555%. |
See Notes to Financial Statements.
| BLACKROCK SERIES FUND, INC. | DECEMBER 31, 2011 | 89 |
Notes to Financial Statements
1. Organization and Significant Accounting Policies:
BlackRock Series Fund, Inc. (the “Fund”) is registered under the Investment Company Act of 1940, as amended (the “1940 Act”), as a diversified, open-end management investment company, offering eight separate portfolios (referred to as the “Portfolios” or individually as a “Portfolio”). The Fund is organized as a Maryland corporation. The Portfolios’ financial statements are prepared in conformity with accounting principles generally accepted in the United States of America (“US GAAP”), which may require management to make estimates and assumptions that affect the reported amounts and disclosures in the financial statements. Actual results could differ from those estimates. The Portfolios offer shares to insurance companies for their separate accounts to fund benefits under certain variable annuity and variable life insurance contracts.
On March 18, 2011, the Board of Directors (the “Board”) of the Fund approved a change to the investment objectives of BlackRock Government Income Portfolio and BlackRock High Income Portfolio. The two Portfolios will “seek to maximize total return, consistent with income generation and prudent investment management.” In addition, the Board approved a change in names from “BlackRock Government Income Portfolio” and “BlackRock High Income Portfolio” to “BlackRock U.S. Government Bond Portfolio” and “BlackRock High Yield Portfolio”, respectively. These changes were effective on October 1, 2011.
The following is a summary of significant accounting policies followed by the Portfolios:
Basis of Consolidation: The accompanying consolidated financial statements for BlackRock Global Allocation Portfolio include the accounts of BlackRock Cayman Global Allocation Fund I, Ltd. (the “Subsidiary”), a wholly owned subsidiary of the Portfolio, which primarily invests in commodity-related instruments. The Subsidiary enables the Portfolio to hold these commodity-related instruments and still satisfy Regulated Investment Company (“RIC”) tax requirements. The Portfolio may invest up to 25% of its total assets in the Subsidiary. Intercompany accounts and transactions have been eliminated. The Subsidiary is subject to the same investment policies and restrictions that apply to the Portfolio.
Valuation: US GAAP defines fair value as the price the Portfolios would receive to sell an asset or pay to transfer a liability in an orderly transaction between market participants at the measurement date. The Portfolios fair value their financial instruments at market value using independent dealers or pricing services under policies approved by the Fund’s Board.
BlackRock Money Market Portfolio’s investments are valued under the amortized cost method which approximates current market value in accordance with Rule 2a-7 under the 1940 Act. Under this method, investments are valued at cost when purchased and thereafter, a constant proportionate accretion and amortization of any discounts and premiums are recorded until the maturity of the security. BlackRock Money Market Portfolio seeks to maintain its NAV per share at $1.00, although there is no assurance that it will be able to do so on a continuing basis.
BlackRock Balanced Capital Portfolio, BlackRock Capital Appreciation Portfolio, BlackRock Global Allocation Portfolio, BlackRock High Yield Portfolio, BlackRock Large Cap Core Portfolio, BlackRock Total Return Portfolio and BlackRock U.S. Government Bond Portfolio:
The Portfolios value their bond investments on the basis of last available bid prices or current market quotations provided by dealers or pricing services. Floating rate loan interests are valued at the mean of the bid prices from one or more brokers or dealers as obtained from a pricing service. In determining the value of a particular investment, pricing services may use certain information with respect to transactions in such investments, quotations from dealers, pricing matrixes, market transactions in comparable investments, various relationships observed in the market between investments and calculated yield measures. Asset-backed and mortgage-backed securities are valued by independent pricing services using models that consider estimated cash flows of each tranche of the security, establish a benchmark yield and develop an estimated tranche specific spread to the benchmark yield based on the unique attributes of the tranche. To-be-announced (“TBA”) commitments are valued on the basis of last available bid prices or current market quotations provided by pricing services. Financial futures contracts traded on exchanges are valued at their last sale price. Swap agreements are valued utilizing quotes received daily by the Portfolios’ pricing service or through brokers, which are derived using daily swap curves and models that incorporate a number of market data factors, such as discounted cash flows, trades and values of the underlying reference instruments. Investments in open-end registered investment companies are valued at NAV each business day. Short-term securities with remaining maturities of 60 days or less may be valued at amortized cost, which approximates fair value.
| 90 | BLACKROCK SERIES FUND, INC. | DECEMBER 31, 2011 |
Notes to Financial Statements (continued)
Certain Portfolios value their investments in BlackRock Liquidity Series, LLC Money Market Series (the “Money Market Series”) at fair value, which is ordinarily based upon their pro rata ownership in the underlying fund’s net assets. The Money Market Series seeks current income consistent with maintaining liquidity and preserving capital. Although the Money Market Series is not registered under the 1940 Act, its investments will follow the parameters of investments by a money market fund that is subject to Rule 2a-7 under the 1940 Act. The Portfolios may withdraw up to 25% of their investment daily, although the manager of the Money Market Series, in its sole discretion, may permit an investor to withdraw more than 25% on any one day.
Municipal investments (including commitments to purchase such investments on a “when-issued” basis) are valued on the basis of prices provided by dealers or pricing services. In determining the value of a particular investment, pricing services may use certain information with respect to transactions in such investments, quotations from dealers, pricing matrixes, market transactions in comparable investments and information with respect to various relationships between investments.
Equity investments traded on a recognized securities exchange or the NASDAQ Global Market System (“NASDAQ”) are valued at the last reported sale price that day or the NASDAQ official closing price, if applicable. For equity investments traded on more than one exchange, the last reported sale price on the exchange where the stock is primarily traded is used. Equity investments traded on a recognized exchange for which there were no sales on that day are valued at the last available bid (long positions) or ask (short positions) price. If no bid or ask price is available, the prior day’s price will be used, unless it is determined that such prior day’s price no longer reflects the fair value of the security.
Securities and other assets and liabilities denominated in foreign currencies are translated into US dollars using exchange rates determined as of the close of business on the New York Stock Exchange (“NYSE”). Foreign currency exchange contracts are valued at the mean between the bid and ask prices and are determined as of the close of business on the NYSE. Interpolated values are derived when the settlement date of the contract is an interim date for which quotations are not available.
Exchange-traded options are valued at the mean between the last bid and ask prices at the close of the options market in which the options trade. An exchange-traded option for which there is no mean price is valued at the last bid (long positions) or ask (short positions) price. If no bid or ask price is available, the prior day’s price will be used, unless it is determined that the prior day’s price no longer reflects the fair value of the option. Over-the-counter (“OTC”) options and swaptions are valued by an independent pricing service using a mathematical model which incorporates a number of market data factors, such as the trades and prices of the underlying instruments.
In the event that application of these methods of valuation results in a price for an investment which is deemed not to be representative of the market value of such investment or if a price is not available, the investment will be valued in accordance with a policy approved by the Board as reflecting fair value (“Fair Value Assets”). When determining the price for Fair Value Assets, the investment advisor and/or the sub-advisor seeks to determine the price that each Portfolio might reasonably expect to receive from the current sale of that asset in an arm’s-length transaction. Fair value determinations shall be based upon all available factors that the investment advisor and/or sub-advisor deems relevant. The pricing of all Fair Value Assets is subsequently reported to the Board or a committee thereof.
Generally, trading in foreign instruments is substantially completed each day at various times prior to the close of business on the NYSE. Occasionally, events affecting the values of such instruments may occur between the foreign market close and the close of business on the NYSE that may not be reflected in the computation of each Portfolio’s net assets. If events (for example, a company announcement, market volatility or a natural disaster) occur during such periods that are expected to materially affect the value of such instruments, those instruments may be Fair Value Assets and be valued at their fair value, as determined in good faith by the investment advisor using a pricing service and/or policies approved by the Board. Each business day, the Portfolios use a pricing service to assist with the valuation of certain foreign exchange-traded equity securities and foreign exchange-traded and OTC options (the “Systematic Fair Value Price”). Using current market factors, the Systematic Fair Value Price is designed to value such foreign securities and foreign options at fair value as of the close of business on the NYSE, which follows the close of the local markets.
Foreign Currency Transactions: The Portfolios’ books and records are maintained in US dollars. Purchases and sales of investment securities are recorded at the rates of exchange prevailing on the respective date of such
| BLACKROCK SERIES FUND, INC. | DECEMBER 31, 2011 | 91 |
Notes to Financial Statements (continued)
transactions. Generally, when the US dollar rises in value against a foreign currency, the Portfolios’ investments denominated in that currency will lose value because its currency is worth fewer US dollars; the opposite effect occurs if the US dollar falls in relative value.
The Portfolios do not isolate the portion of the results of operations arising as a result of changes in the foreign exchange rates from the changes in the market prices of investments held or sold for financial reporting purposes. Accordingly, the effects of changes in foreign currency exchange rates on investments are not segregated on the Statements of Operations from the effects of changes in market prices of those investments but are included as a component of net realized and unrealized gain (loss) from investments. The Portfolios report realized currency gains (losses) on foreign currency related transactions as components of net realized gain (loss) for financial reporting purposes, whereas such components are treated as ordinary income for federal income tax purposes.
Asset-Backed and Mortgage-Backed Securities: Certain Portfolios may invest in asset-backed securities. Asset-backed securities are generally issued as pass-through certificates, which represent undivided fractional ownership interests in an underlying pool of assets, or as debt instruments, which are also known as collateralized obligations, and are generally issued as the debt of a special purpose entity organized solely for the purpose of owning such assets and issuing such debt. Asset-backed securities are often backed by a pool of assets representing the obligations of a number of different parties. The yield characteristics of certain asset-backed securities may differ from traditional debt securities. One such major difference is that all or a principal part of the obligations may be prepaid at any time because the underlying assets (i.e., loans) may be prepaid at any time. As a result, a decrease in interest rates in the market may result in increases in the level of prepayments as borrowers, particularly mortgagors, refinance and repay their loans. An increased prepayment rate with respect to an asset-backed security subject to such a prepayment feature will have the effect of shortening the maturity of the security. If a Portfolio has purchased such an asset-backed security at a premium, a faster than anticipated prepayment rate could result in a loss of principal to the extent of the premium paid.
Certain Portfolios may purchase certain mortgage pass-through securities. There are a number of important differences among the agencies and instrumentalities of the US government that issue mortgage-related securities and among the securities that they issue. For example, mortgage-related securities guaranteed by Ginnie Mae are guaranteed as to the timely payment of principal and interest by Ginnie Mae and such guarantee is backed by the full faith and credit of the United States. However, mortgage-related securities issued by Freddie Mac and Fannie Mae, including Freddie Mac and Fannie Mae guaranteed Mortgage Pass-Through Certificates, which are solely the obligations of Freddie Mac and Fannie Mae, are not backed by or entitled to the full faith and credit of the United States but are supported by the right of the issuer to borrow from the Treasury.
Collateralized Debt Obligations: Certain Portfolios may invest in collateralized debt obligations (“CDOs”), which include collateralized bond obligations (“CBOs”) and collateralized loan obligations (“CLOs”). CBOs and CLOs are types of asset-backed securities. A CDO is a bankruptcy remote entity which is backed by a diversified pool of debt securities (CBOs) or syndicated bank loans (CLOs). The cash flows of the CDO can be split into multiple segments, called “tranches”, which will vary in risk profile and yield. The riskiest segment is the subordinated or “equity” tranche. This tranche bears the greatest risk of defaults from the underlying assets in the CDO and serves to protect the other, more senior, tranches from default in all but the most severe circumstances. Since it is shielded from defaults by the more junior tranches, a “senior” tranche will typically have higher credit ratings and lower yields than their underlying securities, and often receive investment grade ratings from one or more of the nationally recognized rating agencies. Despite the protection from the more junior tranches, senior tranches can experience substantial losses due to actual defaults, increased sensitivity to future defaults and the disappearance of one or more protecting tranches as a result of changes in the credit profile of the underlying pool of assets.
Inflation-Indexed Bonds: Certain Portfolios may invest in inflation-indexed bonds. Inflation-indexed bonds are fixed income securities whose principal value is periodically adjusted according to the rate of inflation. If the index measuring inflation rises or falls, the principal value of inflation-indexed bonds will be adjusted upward or downward, and consequently the interest payable on these securities (calculated with respect to a larger or smaller principal amount) will be increased or reduced, respectively. Repayment of the original bond principal upon maturity (as adjusted for inflation) is guaranteed in the case of US Treasury inflation-indexed bonds. For
| 92 | BLACKROCK SERIES FUND, INC. | DECEMBER 31, 2011 |
Notes to Financial Statements (continued)
bonds that do not provide a similar guarantee, the adjusted principal value of the bond repaid at maturity may be less than the original principal.
Multiple Class Pass-Through Securities: Certain Portfolios may invest in multiple class pass-through securities, including collateralized mortgage obligations (“CMOs”) and commercial mortgage-backed securities. These multiple class securities may be issued by Ginnie Mae, US government agencies or instrumentalities or by trusts formed by private originators of, or investors in, mortgage loans. In general, CMOs are debt obligations of a legal entity that are collateralized by, and multiple class pass-through securities represent direct ownership interests in, a pool of residential or commercial mortgage loans or mortgage pass-through securities (the “Mortgage Assets”), the payments on which are used to make payments on the CMOs or multiple pass-through securities. Classes of CMOs include interest only (“IOs”), principal only (“POs”), planned amortization classes and targeted amortization classes. IOs and POs are stripped mortgage-backed securities representing interests in a pool of mortgages, the cash flow from which has been separated into interest and principal components. IOs receive the interest portion of the cash flow while POs receive the principal portion. IOs and POs can be extremely volatile in response to changes in interest rates. As interest rates rise and fall, the value of IOs tends to move in the same direction as interest rates. POs perform best when prepayments on the underlying mortgages rise since this increases the rate at which the principal is returned and the yield to maturity on the PO. When payments on mortgages underlying a PO are slower than anticipated, the life of the PO is lengthened and the yield to maturity is reduced. If the underlying Mortgage Assets experience greater than anticipated pre-payments of principal, the Portfolio may not fully recoup its initial investment in IOs.
Stripped Mortgage-Backed Securities: Certain Portfolios may invest in stripped mortgage-backed securities issued by the US government, its agencies and instrumentalities. Stripped mortgage-backed securities are usually structured with two classes that receive different proportions of the interest (IOs) and principal (POs) distributions on a pool of Mortgage Assets. The Portfolios also may invest in stripped mortgage-backed securities that are privately issued.
Zero-Coupon Bonds: Certain Portfolios may invest in zero-coupon bonds, which are normally issued at a significant discount from face value and do not provide for periodic interest payments. Zero-coupon bonds may experience greater volatility in market value than similar maturity debt obligations which provide for regular interest payments.
Capital Trusts: Certain Portfolios may invest in capital trusts. These securities are typically issued by corporations, generally in the form of interest-bearing notes with preferred securities characteristics, or by an affiliated business trust of a corporation, generally in the form of beneficial interests in subordinated debentures or similarly structured securities. The securities can be structured as either fixed or adjustable coupon securities that can have either a perpetual or stated maturity date. Dividends can be deferred without creating an event of default or acceleration, although maturity cannot take place unless all cumulative payment obligations have been met. The deferral of payments does not affect the purchase or sale of these securities in the open market. Payments on these securities are treated as interest rather than dividends for federal income tax purposes. These securities generally are rated below that of the issuing company’s senior debt securities.
Preferred Stock: Certain Portfolios may invest in preferred stocks. Preferred stock has a preference over common stock in liquidation (and generally in receiving dividends as well) but is subordinated to the liabilities of the issuer in all respects. As a general rule, the market value of preferred stock with a fixed dividend rate and no conversion element varies inversely with interest rates and perceived credit risk, while the market price of convertible preferred stock generally also reflects some element of conversion value. Because preferred stock is junior to debt securities and other obligations of the issuer, deterioration in the credit quality of the issuer will cause greater changes in the value of a preferred stock than in a more senior debt security with similar stated yield characteristics. Unlike interest payments on debt securities, preferred stock dividends are payable only if declared by the issuer’s board of directors. Preferred stock also may be subject to optional or mandatory redemption provisions.
Floating Rate Loan Interests: Certain Portfolios may invest in floating rate loan interests. The floating rate loan interests the Portfolios hold are typically issued to companies (the “borrower”) by banks, other financial institutions, and privately and publicly offered corporations (the “lender”). Floating rate loan interests are generally non-investment grade, often involve borrowers whose financial condition is troubled or uncertain and companies that are highly leveraged. The Portfolios may invest in obligations of borrowers who are in bankruptcy
| BLACKROCK SERIES FUND, INC. | DECEMBER 31, 2011 | 93 |
Notes to Financial Statements (continued)
proceedings. Floating rate loan interests may include fully funded term loans or revolving lines of credit. Floating rate loan interests are typically senior in the corporate capital structure of the borrower. Floating rate loan interests generally pay interest at rates that are periodically determined by reference to a base lending rate plus a premium. The base lending rates are generally the lending rate offered by one or more European banks, such as LIBOR (London Interbank Offered Rate), the prime rate offered by one or more US banks or the certificate of deposit rate. Floating rate loan interests may involve foreign borrowers, and investments may be denominated in foreign currencies. The Portfolios consider these investments to be investments in debt securities for purposes of their investment policies.
When a Portfolio purchases a floating rate loan interest it may receive a facility fee and when it sells a floating rate loan interest it may pay a facility fee. On an ongoing basis, the Portfolios may receive a commitment fee based on the undrawn portion of the underlying line of credit amount of a floating rate loan interest. Facility and commitment fees are typically amortized to income over the term of the loan or term of the commitment, respectively. Consent and amendment fees are recorded to income as earned. Prepayment penalty fees, which may be received by the Portfolios upon the prepayment of a floating rate loan interest by a borrower, are recorded as realized gains. The Portfolios may invest in multiple series or tranches of a loan. A different series or tranche may have varying terms and carry different associated risks.
Floating rate loan interests are usually freely callable at the borrower’s option. The Portfolios may invest in such loans in the form of participations in loans (“Participations”) or assignments (“Assignments”) of all or a portion of loans from third parties. Participations typically will result in the Portfolios having a contractual relationship only with the lender, not with the borrower. The Portfolios will have the right to receive payments of principal, interest and any fees to which it is entitled only from the lender selling the Participation and only upon receipt by the lender of the payments from the borrower. In connection with purchasing Participations, the Portfolios generally will have no right to enforce compliance by the borrower with the terms of the loan agreement, nor any rights of offset against the borrower, and the Portfolios may not benefit directly from any collateral supporting the loan in which it has purchased the Participation. As a result, the Portfolios will assume the credit risk of both the borrower and the lender that is selling the Participation. The Portfolio’s investment in loan participation interests involves the risk of insolvency of the financial intermediaries who are parties to the transactions. In the event of the insolvency of the lender selling the Participation, the Portfolios may be treated as a general creditor of the lender and may not benefit from any offset between the lender and the borrower. Assignments typically result in the Portfolios having a direct contractual relationship with the borrower, and the Portfolios may enforce compliance by the borrower with the terms of the loan agreement.
Borrowed Bond Agreements: Certain Portfolios may enter into borrowed bond agreements. In a borrowed bond agreement, a Portfolio borrows a bond from a counterparty in exchange for cash collateral with the commitment that the security and the cash will be returned to the counterparty and the Portfolio, respectively, at a mutually agreed upon rate and date. Certain agreements have no stated maturity and can be terminated by either party at any time. Borrowed bond agreements are entered into primarily in connection with short sales of bonds. Earnings on cash collateral and compensation to the lender of the bond are based on agreed upon rates between a Portfolio and the counterparty. The value of the underlying cash collateral approximates the market value and accrued interest of the borrowed bond. To the extent that a borrowed bond transaction exceeds one business day, the value of the cash collateral in the possession of the counterparty is monitored on a daily basis to ensure the adequacy of the collateral. As the market value of the borrowed bond changes, the cash collateral is periodically increased or decreased with a frequency and in amounts prescribed in the borrowed bond agreement. Full realization of the collateral by a Portfolio may be limited if the value of an investment purchased with the cash collateral by the lender decreases. A Portfolio may also experience delays in gaining access to the collateral.
Short Sales: Certain Portfolios may enter into short sale transactions in which a Portfolio sells a security it does not hold in anticipation of a decline in the market price of that security. When a Portfolio makes a short sale, it will borrow the security sold short and deliver it to the counterparty to which it sold the security short. An amount equal to the proceeds received by a Portfolio is reflected as an asset and an equivalent liability. The amount of the liability is subsequently marked-to-market to reflect the market value of the short sale. A Portfolio is required to repay the counterparty any dividends or interest received on the security sold short, which is shown as dividend or interest expense in the Statements
| 94 | BLACKROCK SERIES FUND, INC. | DECEMBER 31, 2011 |
Notes to Financial Statements (continued)
of Operations. A Portfolio may pay a fee on the assets borrowed from the counterparty, which is shown as stock loan fees in the Statements of Operations. A Portfolio maintains a segregated account of securities or deposits cash with the broker-dealer as collateral for the short sales. A Portfolio may receive interest on its cash collateral deposited with the broker-dealer. A Portfolio is exposed to market risk based on the amount, if any, that the market value of the security increases beyond the market value at which the position was sold. Thus, a short sale of a security involves the risk that instead of declining, the price of the security sold short will rise. The short sale of securities involves the possibility of a theoretically unlimited loss since there is a theoretically unlimited potential for the market price of the security sold short to increase. A gain, limited to the price at which a Portfolio sold the security short, or a loss, unlimited as to the dollar amount, will be recognized upon the termination of a short sale if the market price is greater or less than the proceeds originally received. There is no assurance a Portfolio will be able to close out a short position at a particular time or at an acceptable price.
Forward Commitments and When-Issued Delayed Delivery Securities: Certain Portfolios may purchase securities on a when-issued basis and may purchase or sell securities on a forward commitment basis. Settlement of such transactions normally occurs within a month or more after the purchase or sale commitment is made. The Portfolios may purchase securities under such conditions with the intention of actually acquiring them, but may enter into a separate agreement to sell the securities before the settlement date. Since the value of securities purchased may fluctuate prior to settlement, the Portfolios may be required to pay more at settlement than the security is worth. In addition, the Portfolios are not entitled to any of the interest earned prior to settlement. When purchasing a security on a delayed delivery basis, the Portfolios assume the rights and risks of ownership of the security, including the risk of price and yield fluctuations. In the event of default by the counterparty, a Portfolio’s maximum amount of loss is the unrealized appreciation of unsettled when-issued transactions, which is shown in the Schedules of Investments.
TBA Commitments: Certain Portfolios may enter into TBA commitments. TBA commitments are forward agreements for the purchase or sale of mortgage-backed securities for a fixed price, with payment and delivery on an agreed upon future settlement date. The specific securities to be delivered are not identified at the trade date. However, delivered securities must meet specified terms, including issuer, rate and mortgage terms. The Portfolios generally enter into TBA commitments with the intent to take possession of or deliver the underlying mortgage-backed securities but can extend the settlement or roll the transaction. TBA commitments involve a risk of loss if the value of the security to be purchased or sold declines or increases, respectively, prior to settlement date.
Mortgage Dollar Roll Transactions: Certain Portfolios may sell TBA mortgage-backed securities and simultaneously contract to repurchase substantially similar (same type, coupon and maturity) securities on a specific future date at an agreed upon price. During the period between the sale and repurchase, a Portfolio will not be entitled to receive interest and principal payments on the securities sold. A Portfolio accounts for mortgage dollar roll transactions as purchases and sales and realizes gains and losses on these transactions. These transactions may increase a Portfolio’s portfolio turnover rate. Mortgage dollar rolls involve the risk that the market value of the securities that a Portfolio is required to purchase may decline below the agreed upon repurchase price of those securities.
Treasury Roll Transactions: Certain Portfolios may enter into treasury roll transactions. In a treasury roll transaction, a Portfolio sells a Treasury security to a counterparty with a simultaneous agreement to repurchase the same security at an agreed upon price and future settlement date. A Portfolio receives cash from the sale of the Treasury security to use for other investment purposes. The difference between the sale price and repurchase price represents net interest income or net interest expense reflective of an agreed upon rate between a Portfolio and the counterparty over the term of the borrowing. For US GAAP purposes, a treasury roll transaction is accounted for as a secured borrowing and not as a purchase or sale. During the term of the borrowing, interest income from the Treasury security and the related interest expense on the secured borrowing is recorded by a Portfolio on an accrual basis. A Portfolio will benefit from the transaction if the income earned on the investment purchased with the cash received in the treasury roll transaction exceeds the interest expense incurred by a Portfolio. If the interest expense exceeds the income earned, a Portfolio’s net investment income and dividends to shareholders may be adversely impacted. Treasury roll transactions involve the risk that the market value of the securities that a Portfolio is required to repurchase may decline below the agreed upon repurchase price of those securities.
| BLACKROCK SERIES FUND, INC. | DECEMBER 31, 2011 | 95 |
Notes to Financial Statements (continued)
Repurchase Agreements: Certain Portfolios may invest in repurchase agreements. In a repurchase agreement, a Portfolio purchases a security from a counterparty who agrees to repurchase the same security at a mutually agreed upon date and price. On a daily basis, the counterparty is required to maintain collateral subject to the agreement and in value no less than the agreed repurchase amount. The agreements are conditioned upon the collateral being deposited under the Federal Reserve book entry system or held in a segregated account by a Portfolio’s custodian or designated sub-custodians under tri-party repurchase agreements. In the event the counterparty defaults and the fair value of the collateral declines, a Portfolio could experience losses, delays and costs in liquidating the collateral.
Reverse Repurchase Agreements: Certain Portfolios may enter into reverse repurchase agreements with qualified third party broker-dealers. In a reverse repurchase agreement, a Portfolio sells securities to a bank or broker-dealer and agrees to repurchase the same securities at a mutually agreed upon date and price. Certain agreements have no stated maturity and can be terminated by either party at any time. Interest on the value of the reverse repurchase agreements issued and outstanding is based upon competitive market rates determined at the time of issuance. A Portfolio may utilize reverse repurchase agreements when it is anticipated that the interest income to be earned from the investment of the proceeds of the transaction is greater than the interest expense of the transaction. Reverse repurchase agreements involve leverage risk and also the risk that the market value of the securities that a Portfolio is obligated to repurchase under the agreement may decline below the repurchase price. In the event the buyer of securities under a reverse repurchase agreement files for bankruptcy or becomes insolvent, a Portfolio’s use of the proceeds of the agreement may be restricted while the other party, or its trustee or receiver, determines whether or not to enforce a Portfolio’s obligation to repurchase the securities.
Segregation and Collateralization: In cases in which the 1940 Act and the interpretive positions of the Securities and Exchange Commission (“SEC”) require that a Portfolio either deliver collateral or segregate assets in connection with certain investments (e.g., dollar rolls, TBA sale commitments, financial futures contracts, foreign currency exchange contracts, swaps, short sales, options, structured options and options written), or certain borrowings (e.g., reverse repurchase agreements, treasury roll transactions and loan payable), a Portfolio will, consistent with SEC rules and/or certain interpretive letters issued by the SEC, segregate collateral or designate on its books and records cash or liquid securities having a market value at least equal to the amount that would otherwise be required to be physically segregated. Furthermore, based on requirements and agreements with certain exchanges and third party broker-dealers, each party to such transactions has requirements to deliver/deposit securities as collateral for certain investments.
Investment Transactions and Investment Income: For financial reporting purposes, investment transactions are recorded on the dates the transactions are entered into (the trade dates). Realized gains and losses on investment transactions are determined on the identified cost basis. Dividend income is recorded on the ex-dividend dates. Dividends from foreign securities where the ex-dividend date may have passed are subsequently recorded when a Portfolio is informed of the ex-dividend date. Under the applicable foreign tax laws, a withholding tax at various rates may be imposed on capital gains, dividends and interest. Upon notification from issuers, some of the dividend income received from a real estate investment trust may be redesignated as a reduction of cost of the related investment and/or realized gain. Interest income, including amortization and accretion of premiums and discounts on debt securities, is recognized on the accrual basis. Consent fees are compensation for agreeing to changes in the terms of debt instruments and are included in interest income in the Statements of Operations.
Redemptions-In-Kind: BlackRock Global Allocation Portfolio transferred securities and cash to shareholders in connection with a redemption-in-kind transaction. For purposes of US GAAP, these transactions were treated as a sale of securities and the resulting gains and losses were recognized based on the market value of the securities on the date of the transfer. For tax purposes, no gains or losses were recognized. Gains and losses resulting from such redemptions-in-kind were as follows:
| Investments—unaffiliated | $22,990,465 |
| Financial futures contracts | 531,367 |
| Options written and structured options | (189,533) |
| Total | $23,332,299 |
Dividends and Distributions: BlackRock Money Market Portfolio declares dividends and reinvests daily such dividends (net of non-resident alien tax and backup withholding tax withheld) in additional fund shares at NAV. Dividends are declared from the total of net investment income. For BlackRock Balanced Capital Portfolio, BlackRock Capital Appreciation Portfolio, BlackRock Global Allocation Portfolio and BlackRock Large Cap Core Portfolio, dividends from net investment income are
| 96 | BLACKROCK SERIES FUND, INC. | DECEMBER 31, 2011 |
Notes to Financial Statements (continued)
declared and paid at least annually. For BlackRock High Yield Portfolio, BlackRock Total Return Portfolio and BlackRock U.S. Government Bond Portfolio, dividends from net investment income are declared daily and paid monthly. For each Portfolio, distributions of capital gains, if any, on investments are paid at least annually and recorded on ex-dividend dates. If the total dividends and distributions made in any tax year exceeds net investment income and accumulated realized capital gains, a portion of the total distribution may be treated as a tax return of capital. The amount and timing of dividends and distributions are determined in accordance with federal income tax regulations, which may differ from US GAAP.
Securities Lending: Certain Portfolios may lend securities to approved borrowers, such as banks, brokers and other financial institutions. The borrower pledges cash, securities issued or guaranteed by the US government or irrevocable letters of credit issued by a bank as collateral, which will be maintained at all times in an amount equal to at least 100% of the current market value of the loaned securities. The market value of the loaned securities is determined at the close of business of a Portfolio and any additional required collateral is delivered to a Portfolio on the next business day. Securities lending income, as disclosed in the Statements of Operations, represents the income earned from the investment of the cash collateral, net of rebates paid to, or fees paid by, borrowers and less the fees paid to the securities lending agent. During the term of the loan, a Portfolio earns dividend or interest income on the securities loaned but does not receive interest income on the securities received as collateral. Loans of securities are terminable at any time and the borrower, after notice, is required to return borrowed securities within the standard time period for settlement of securities transactions. In the event that the borrower defaults on its obligation to return borrowed securities because of insolvency or for any other reason, a Portfolio could experience delays and costs in gaining access to the collateral. A Portfolio also could suffer a loss if the value of an investment purchased with cash collateral falls below the market value of loaned securities or if the value of an investment purchased with cash collateral falls below the value of the original cash collateral received. During the year ended December 31, 2011, any securities on loan were collateralized by cash.
Income Taxes: It is each Portfolio’s policy to comply with the requirements of the Internal Revenue Code of 1986, as amended, applicable to regulated investment companies and to distribute substantially all of its taxable income to its shareholders. Therefore, no federal income tax provision is required.
Each Portfolio files US federal and various state and local tax returns. No income tax returns are currently under examination. The statute of limitations on each Portfolio’s US federal tax returns remains open for each of the four years ended December 31, 2011. The statutes of limitations on each Portfolio’s state and local tax returns may remain open for an additional year depending upon the jurisdiction. Management does not believe there are any uncertain tax positions that require recognition of a tax liability.
Recent Accounting Standard: In May 2011, the Financial Accounting Standards Board (the “FASB”) issued amended guidance to improve disclosure about fair value measurements which will require the following disclosures for fair value measurements categorized as Level 3: quantitative information about the unobservable inputs and assumptions used in the fair value measurement, a description of the valuation policies and procedures and a narrative description of the sensitivity of the fair value measurement to changes in unobservable inputs and the interrelationships between those unobservable inputs. In addition, the amounts and reasons for all transfers in and out of Level 1 and Level 2 will be required to be disclosed. The amended guidance is effective for financial statements for fiscal years beginning after December 15, 2011, and interim periods within those fiscal years. Management is evaluating the impact of this guidance on the Portfolios’ financial statement disclosures.
In December 2011, the FASB issued guidance that will enhance current disclosure requirements on the offsetting of certain assets and liabilities. The new disclosures will be required for investments and derivative financial instruments subject to master netting agreements or similar agreements and will require an entity to disclose both gross and net information about such investments and transactions eligible for offset in the Statements of Assets and Liabilities. The guidance is effective for financial statements with fiscal years beginning on or after January 1, 2013, and interim periods within those fiscal years. Management is evaluating the impact of this guidance on the Portfolios’ financial statement disclosures.
Other: Expenses directly related to a Portfolio are charged to that Portfolio. Other operating expenses shared by several funds are pro rated among those funds on the basis of relative net assets or other appropriate methods.
The Portfolios have an arrangement with the custodian whereby fees may be reduced by credits earned on uninvested cash balances, which, if applicable, are shown as fees paid indirectly in the Statements of Operations.
| BLACKROCK SERIES FUND, INC. | DECEMBER 31, 2011 | 97 |
Notes to Financial Statements (continued)
The custodian imposes fees on overdrawn cash balances, which can be offset by accumulated credits earned or may result in additional custody charges.
2. Derivative Financial Instruments:
Certain Portfolios engage in various portfolio investment strategies using derivative contracts both to increase the returns of a Portfolio and to economically hedge, or protect, their exposure to certain risks such as credit risk, equity risk, interest rate risk, foreign currency exchange rate risk or other risk (commodity price risk and inflation risk). These contracts may be transacted on an exchange or OTC.
Losses may arise if the value of the contract decreases due to an unfavorable change in the market rates or values of the underlying instrument or if the counterparty does not perform under the contract. A Portfolio’s maximum risk of loss from counterparty credit risk on OTC derivatives is generally the aggregate unrealized gain netted against any collateral pledged by/posted to the counterparty. For OTC options purchased, a Portfolio bears the risk of loss in the amount of the premiums paid plus the positive change in market values net of any collateral received on the options should the counterparty fail to perform under the contracts. Options written by a Portfolio do not give rise to counterparty credit risk, as options written obligate a Portfolio to perform and not the counterparty. Counterparty risk related to exchange-traded financial futures contracts and options is deemed to be minimal due to the protection against defaults provided by the exchange on which these contracts trade.
A Portfolio may mitigate counterparty risk by procuring collateral and through netting provisions included within an International Swaps and Derivatives Association, Inc. master agreement (“ISDA Master Agreement”) implemented between a Portfolio and each of its respective counterparties. An ISDA Master Agreement allows a Portfolio to offset with each separate counterparty certain derivative financial instrument’s payables and/or receivables with collateral held. The amount of collateral moved to/from applicable counterparties is generally based upon minimum transfer amounts of up to $500,000. To the extent amounts due to the Portfolios from their counterparties are not fully collateralized contractually or otherwise, a Portfolio bears the risk of loss from counterparty non-performance. See Note 1 “Segregation and Collateralization” for information with respect to collateral practices. In addition, the Portfolios manage counterparty risk by entering into agreements only with counterparties that it believes have the financial resources to honor their obligations and by monitoring the financial stability of those counterparties.
Certain ISDA Master Agreements allow counterparties to OTC derivatives to terminate derivative contracts prior to maturity in the event a Portfolio’s net assets decline by a stated percentage or the Portfolios fail to meet the terms of its ISDA Master Agreements, which would cause the Portfolios to accelerate payment of any net liability owed to the counterparty.
Financial Futures Contracts: Certain Portfolios purchase or sell financial futures contracts and options on financial futures contracts to gain exposure to, or economically hedge against, changes in interest rates (interest rate risk), changes in the value of equity securities (equity risk) or foreign currencies (foreign currency exchange rate risk). Financial futures contracts are agreements between a Portfolio and counterparty to buy or sell a specific quantity of an underlying instrument at a specified price and at a specified date. Depending on the terms of the particular contract, futures contracts are settled either through physical delivery of the underlying instrument on the settlement date or by payment of a cash settlement amount on the settlement date. Pursuant to the contract, a Portfolio agrees to receive from or pay to the broker an amount of cash equal to the daily fluctuation in value of the contract. Such receipts or payments are known as margin variation and are recorded by a Portfolio as unrealized appreciation or depreciation. When the contract is closed, a Portfolio records a realized gain or loss equal to the difference between the value of the contract at the time it was opened and the value at the time it was closed. The use of financial futures contracts involves the risk of an imperfect correlation in the movements in the price of financial futures contracts, interest or foreign currency exchange rates and the underlying assets.
Foreign Currency Exchange Contracts: Certain Portfolios enter into foreign currency exchange contracts as an economic hedge against either specific transactions or portfolio instruments or to obtain exposure to foreign currencies (foreign currency exchange rate risk). A foreign currency exchange contract is an agreement between two parties to buy and sell a currency at a set exchange rate on a future date. Foreign currency exchange contracts, when used by a Portfolio, help to manage the overall exposure to the currencies in which some of the investments held by a Portfolio are denominated. The contract is marked-to-market daily and the change in market value is recorded by a Portfolio as an unrealized gain or loss. When the contract is closed, a Portfolio records a realized gain or loss equal to the difference between the value at the time it was opened and the value at the time it was closed. The use of foreign currency exchange contracts involves the risk that the
| 98 | BLACKROCK SERIES FUND, INC. | DECEMBER 31, 2011 |
Notes to Financial Statements (continued)
value of a foreign currency exchange contract changes unfavorably due to movements in the value of the referenced foreign currencies and the risk that a counterparty to the contract does not perform its obligations under the agreement.
Options: Certain Portfolios purchase and write call and put options to increase or decrease their exposure to underlying instruments (including credit risk, equity risk, interest rate risk and/or commodity price risk) and/or, in the case of options written, to generate gains from options premiums. A call option gives the purchaser (holder) of the option the right (but not the obligation) to buy, and obligates the seller (writer) to sell (when the option is exercised), the underlying instrument at the exercise or strike price at any time or at a specified time during the option period. A put option gives the holder the right to sell and obligates the writer to buy the underlying instrument at the exercise or strike price at any time or at a specified time during the option period. When the Portfolios purchase (write) an option, an amount equal to the premium paid (received) by the Portfolios is reflected as an asset (liability). The amount of the asset (liability) is subsequently marked-to-market to reflect the current market value of the option purchased (written). When an instrument is purchased or sold through an exercise of an option, the related premium paid (or received) is added to (or deducted from) the basis of the instrument acquired or deducted from (or added to) the proceeds of the instrument sold. When an option expires (or the Portfolios enter into a closing transaction), the Portfolios realize a gain or loss on the option to the extent of the premiums received or paid (or gain or loss to the extent the cost of the closing transaction exceeds the premiums received or paid). When a Portfolio writes a call option, such option is “covered,” meaning that a Portfolio holds the underlying instrument subject to being called by the option counterparty. When a Portfolio writes a put option, such option is covered by cash in an amount sufficient to cover the obligation.
Options on swaps (swaptions) are similar to options on securities except that instead of selling or purchasing the right to buy or sell a security, the writer or purchaser of the swap option is granting or buying the right to enter into a previously agreed upon interest rate or credit default swap agreement (interest rate risk and/or credit risk) at any time before the expiration of the option.
Certain Portfolios also purchase or sell listed or OTC foreign currency options, foreign currency futures and related options on foreign currency futures as a short or long hedge against possible variations in foreign exchange rates or to gain exposure to foreign currencies (foreign currency exchange rate risk). When foreign currency is purchased or sold through an exercise of a foreign currency option, the related premium paid (or received) is added to (or deducted from) the basis of the foreign currency acquired or deducted from (or added to) the proceeds of the foreign currency sold. Such transactions may be effected with respect to hedges on non-US dollar denominated instruments owned by a Portfolio but not yet delivered, or committed or anticipated to be purchased by a Portfolio.
In purchasing and writing options, a Portfolio bears the risk of an unfavorable change in the value of the underlying instrument or the risk that a Portfolio may not be able to enter into a closing transaction due to an illiquid market. Exercise of a written option could result in a Portfolio purchasing or selling a security at a price different from the current market value.
Certain Portfolios invest in structured options to increase or decrease its exposure to an underlying index or group of securities (equity risk). These structured options are European-Style Options and may consist of single or multiple OTC options which are priced as a single security. European-Style Options may only be exercised at the expiration date, but may be transferred/sold prior to the expiration date. The value of a structured option may either increase or decrease with the underlying index or group of securities, depending on the combination of options used. Structured options are issued in units whereby each unit represents a structure based on the specific index with an initial reference strike price. One type of structure involves the combination of selling a put while buying a call on a specific index. This option would rise in value as the underlying index increases and fall in value as the underlying index decreases. Alternatively, another structure involves the sale of a call and the purchase of a put. This option structure would rise in value as the underlying index decreases and fall in value as the underlying index increases. Upon the exercise of the structured option, a Portfolio will receive a payment from, or be required to remit a payment to the counterparty, depending on the value of the underlying index at exercise.
Swaps: Certain Portfolios enter into swap agreements, in which a Portfolio and a counterparty agree to either make periodic net payments on a specified notional amount or net payment upon termination. These payments received or made by a Portfolio are recorded in the Statements of Operations as realized gains or losses, respectively. Any upfront fees paid are recorded as assets and any upfront fees received are recorded as liabilities and amortized over the term of the swap. Swaps are marked-to-market daily and changes in value are recorded as unrealized appreciation (depreciation). When the swap is terminated,
| BLACKROCK SERIES FUND, INC. | DECEMBER 31, 2011 | 99 |
Notes to Financial Statements (continued)
a Portfolio will record a realized gain or loss equal to the difference between the proceeds from (or cost of) the closing transaction and the Portfolio’s basis in the contract, if any. Generally, the basis of the contracts is the premium received or paid. Swap transactions involve, to varying degrees, elements of interest rate, credit and market risk in excess of the amounts recognized in the Statements of Assets and Liabilities. Such risks involve the possibility that there will be no liquid market for these agreements, that the counterparty to the agreements may default on its obligation to perform or disagree as to the meaning of the contractual terms in the agreements, and that there may be unfavorable changes in interest rates and/or market values associated with these transactions.
| • | | Credit default swaps—Certain Portfolios enter into credit default swaps to manage their exposure to the market or certain sectors of the market, to reduce its risk exposure to defaults of corporate and/or sovereign issuers or to create exposure to corporate and/or sovereign issuers to which they are not otherwise exposed (credit risk). A Portfolio enters into credit default swap agreements to provide a measure of protection against the default of an issuer (as buyer of protection) and/or gain credit exposure to an issuer to which it is not otherwise exposed (as seller of protection). A Portfolio may either buy or sell (write) credit default swaps on single-name issuers (corporate or sovereign), a combination or basket of single-name issuers or traded indexes. Credit default swaps on single-name issuers are agreements in which the buyer pays fixed periodic payments to the seller in consideration for a guarantee from the seller to make a specific payment should a negative credit event take place with respect to the referenced entity (e.g., bankruptcy, failure to pay, obligation accelerators, repudiation, moratorium or restructuring). Credit default swaps on traded indexes are agreements in which the buyer pays fixed periodic payments to the seller in consideration for a guarantee from the seller to make a specific payment should a write-down, principal or interest shortfall or default of all or individual underlying securities included in the index occurs. As a buyer, if an underlying credit event occurs, a Portfolio will either receive from the seller an amount equal to the notional amount of the swap and deliver the referenced security or underlying securities comprising the index or receive a net settlement of cash equal to the notional amount of the swap less the recovery value of the security or underlying securities comprising the index. As a seller (writer), if an underlying credit event occurs, a Portfolio will either pay the buyer an amount equal to the notional amount of the swap and take delivery of the referenced security or underlying securities comprising the index or pay a net settlement of cash equal to the notional amount of the swap less the recovery value of the security or underlying securities comprising the index. |
| • | | Total return swaps—Certain Portfolios enter into total return swaps to obtain exposure to a security or market without owning such security or investing directly in that market or to transfer the risk/return of one market (e.g., fixed income) to another market (e.g., equity) (equity risk and/or interest rate risk). Total return swaps are agreements in which there is an exchange of cash flows whereby one party commits to make payments based on the total return (coupons plus capital gains/losses) of an underlying instrument in exchange for fixed or floating rate interest payments. To the extent the total return of the instrument or index underlying the transaction exceeds or falls short of the offsetting interest rate obligation, a Portfolio will receive a payment from or make a payment to the counterparty. |
| • | | Interest rate swaps—Certain Portfolios enter into interest rate swaps to gain or reduce exposure to interest rates or to manage duration, the yield curve or interest rate risk by economically hedging the value of the fixed rate bonds which may decrease when interest rates rise (interest rate risk). Interest rate swaps are agreements in which one party pays a stream of interest payments, either fixed or floating rate, for another party’s stream of interest payments, either fixed or floating, on the same notional amount for a specified period of time. Interest rate floors, which are a type of interest rate swap, are agreements in which one party agrees to make payments to the other party to the extent that interest rates fall below a specified rate or floor in return for a premium. In more complex swaps, the notional principal amount may decline (or amortize) over time. |
| • | | Cross-currency swaps—Certain Portfolios enter into cross-currency swaps to gain or reduce exposure to foreign currencies or as an economic hedge against either specific transactions or portfolio instruments (foreign currency exchange rate and/or interest rate risk). Cross-currency swaps are interest rate swaps in which one party pays a stream of interest payments, either fixed or floating, in exchange for another party’s stream of interest payments, either fixed or floating, based on the notional amounts of two different currencies. The notional amounts are typically determined based on the spot exchange rates at the inception of the trade. Cross-currency swaps may also involve an exchange of notional amounts at the start, during and/or at expiration of the contract, either at the current spot rate or another specified rate. |
| 100 | BLACKROCK SERIES FUND, INC. | DECEMBER 31, 2011 |
Notes to Financial Statements (continued)
Derivative Financial Instruments Categorized by Risk Exposure:
| | Fair Values of Derivative Financial Instruments as of December 31, 2011 | | |
| | Asset Derivatives |
| | | BlackRock
Balanced
Capital
Portfolio | BlackRock
Global
Allocation
Portfolio | BlackRock
High Yield
Portfolio | BlackRock
Total Return
Portfolio | BlackRock
U.S.
Government
Bond
Portfolio |
| | Statements of Assets
and Liabilities Location | | | | | Value | | | | |
| Interest rate contracts | Net unrealized appreciation/
depreciation1; Unrealized
appreciation on swaps;
Investments at value—
unaffiliated2 | $ | 642,833 | $ | 16,247 | | — | $ | 285,251 | $ | 440,446 |
| Foreign currency exchange contracts | Unrealized appreciation
on foreign currency
exchange contracts | | 273,938 | | 223,516 | | — | | 98,796 | | — |
| Credit contracts | Unrealized appreciation
on swaps; Investments
at value—unaffiliated2 | | 654,929 | | — | $ | 46,662 | | 304,131 | | — |
| Equity contracts | Net unrealized appreciation/
depreciation1; Unrealized
appreciation on swaps;
Investments at value—
unaffiliated2
Structured options at value | | — | | 520,705 | | — | | — | | — |
| Other contracts | Unrealized appreciation
on swaps | | — | | — | | — | | — | | — |
| Total | | $ | 1,571,700 | $ | 760,468 | $ | 46,662 | $ | 688,178 | $ | 440,446 |
| | Liability Derivatives |
| | | BlackRock
Balanced
Capital
Portfolio | BlackRock
Global
Allocation
Portfolio | BlackRock
High Yield
Portfolio | BlackRock
Total Return
Portfolio | BlackRock
U.S.
Government
Bond
Portfolio |
| | Statements of Assets
and Liabilities Location | | | | | | Value | | | | |
| Interest rate contracts | Net unrealized appreciation/
depreciation1; Unrealized
depreciation on swaps;
Options written at value | $ | 1,129,902 | $ | 7,789 | | — | $ | 580,319 | $ | 1,217,554 |
| Foreign currency exchange contracts | Unrealized depreciation on
foreign currency exchange
contracts; Unrealized
depreciation on swaps | | 65,182 | $ | 112,185 | | — | | 25,032 | | — |
| Credit contracts | Unrealized depreciation
on swaps; Options
written at value | | 106,382 | | — | $ | 336 | | 43,868 | | — |
| Equity contracts | Net unrealized appreciation/
depreciation1; Unrealized
depreciation on swaps;
Options written at value;
Structured options at value | | — | $ | 1,410,626 | | — | | — | | — |
| Other contracts | Unrealized depreciation
on swaps | | 10,616 | | — | | — | | 4,120 | | 5,332 |
| Total | | $ | 1,312,082 | $ | 1,530,600 | $ | 336 | $ | 653,339 | $ | 1,222,886 |
| 1 | | Includes cumulative appreciation/depreciation on financial futures contracts as reported in the Schedules of Investments. Only current day’s margin variation is reported within the Statements of Assets and Liabilities. |
| 2 | | Includes options purchased at value as reported in the Schedules of Investments. |
| BLACKROCK SERIES FUND, INC. | DECEMBER 31, 2011 | 101 |
Notes to Financial Statements (continued)
The Effect of Derivative Financial Instruments in the Statements of Operations Year Ended December 31, 2011
| | Net Realized Gain (Loss) From |
| | BlackRock
Balanced Capital
Portfolio | BlackRock
Global
Allocation
Portfolio | BlackRock
High Yield
Portfolio | BlackRock
Total Return
Portfolio | BlackRock
U.S.
Government
Bond
Portfolio |
| Interest rate contracts: | | | | | | | | | | | | | | | |
| Financial futures contracts | $ | (4,826,598 | ) | | — | | | — | | $ | (2,648,006 | ) | $ | (264,101 | ) |
| Swaps | | 577,804 | | $ | 39,423 | | | — | | | (97,322 | ) | | (390,058 | ) |
| Options3 | | (2,064,828 | ) | | — | | | — | | | (621,305 | ) | | (549,448 | ) |
| Foreign currency exchange contracts: | | | | | | | | | | | | | | | |
| Foreign currency exchange contracts | | (49,386 | ) | | 4,152,631 | | | — | | | (39,757 | ) | | — | |
| Swaps | | — | | | 25,417 | | | — | | | — | | | — | |
| Options | | — | | | (45,304 | ) | | — | | | — | | | — | |
| Credit contracts: | | | | | | | | | | | | | | | |
| Swaps | | (113,513 | ) | | — | | $ | (291,608 | ) | | (25,927 | ) | | — | |
| Options3 | | — | | | — | | | — | | | — | | | — | |
| Equity contracts: | | | | | | | | | | | | | | | |
| Financial futures contracts | | — | | | 2,606,425 | | | — | | | — | | | — | |
| Swaps | | — | | | (75,794 | ) | | — | | | — | | | — | |
| Options3 | | — | | | 508,085 | | | — | | | — | | | — | |
| Other contracts: | | | | | | | | | | | | | | | |
| Swaps | | (12,284 | ) | | — | | | — | | | (4,736 | ) | | (6,167 | ) |
| Total | $ | (6,488,805 | ) | $ | 7,210,883 | | $ | (291,608 | ) | $ | (3,437,053 | ) | $ | (1,209,774 | ) |
| | Net Change in Unrealized Appreciation/Depreciation on |
| | BlackRock
Balanced Capital
Portfolio | BlackRock
Global
Allocation
Portfolio | BlackRock
High Yield
Portfolio | BlackRock
Total Return
Portfolio | BlackRock
U.S.
Government
Bond
Portfolio |
| Interest rate contracts: | | | | | | | | | | | | | | |
| Financial futures contracts | $ | 12,482 | | | — | | | — | $ | 14,084 | | $ | 343,884 | |
| Swaps | | (211,910 | ) | $ | 13,074 | | | — | | 209,613 | | | (825,202 | ) |
| Options3 | | 401,032 | | | 6,589 | | | — | | (88,887 | ) | | (127,511 | ) |
| Foreign currency exchange contracts: | | | | | | | | | | | | | | |
| Foreign currency exchange contracts | | 195,789 | | | (424,447 | ) | | — | | 69,011 | | | — | |
| Swaps3 | | — | | | 561 | | | — | | — | | | — | |
| Options3 | | (37,599 | ) | | — | | | — | | (14,668 | ) | | — | |
| Credit contracts: | | | | | | | | | | | | | | |
| Swaps | | 747,369 | | | — | | $ | 46,326 | | 359,399 | | | — | |
| Options3 | | 38,496 | | | — | | | — | | 15,002 | | | — | |
| Equity contracts: | | | | | | | | | | | | | | |
| Financial futures contracts | | — | | | 60,238 | | | — | | — | | | — | |
| Swaps | | — | | | (23,222 | ) | | — | | — | | | — | |
| Options3 | | — | | | (600,070 | ) | | — | | — | | | — | |
| Other contracts: | | | | | | | | | | | | | | |
| Swaps | | (10,616 | ) | | — | | | — | | (4,120 | ) | | (5,332 | ) |
| Total | $ | 1,135,043 | | $ | (967,277 | ) | $ | 46,326 | $ | 559,434 | | $ | (614,161 | ) |
| 3 | | Options purchased are included in the net realized gain (loss) from investments and net change in unrealized appreciation/depreciation on investments. |
| 102 | BLACKROCK SERIES FUND, INC. | DECEMBER 31, 2011 |
Notes to Financial Statements (continued)
For the year ended December 31, 2011, the average quarterly balances of outstanding derivative financial instruments were as follows:
| | BlackRock
Balanced
Capital
Portfolio | BlackRock
Global
Allocation
Portfolio | BlackRock
High Yield
Portfolio | BlackRock
Total Return
Portfolio | BlackRock
U.S.
Government
Bond
Portfolio |
| Financial futures contracts: | | | | | | | | | | |
| Average number of contracts purchased | | 252 | | 27 | | — | | 98 | | 218 |
| Average number of contracts sold | | 393 | | 73 | | — | | 192 | | 114 |
| Average notional value of contracts purchased | $ | 50,979,216 | $ | 1,786,297 | | — | $ | 20,241,819 | $ | 45,919,433 |
| Average notional value of contracts sold | $ | 62,866,525 | $ | 7,133,718 | | — | $ | 30,362,296 | $ | 19,422,308 |
| Foreign currency exchange contracts: | | | | | | | | | | |
| Average number of contracts—US dollars purchased | | 1 | | 57 | | — | | 2 | | — |
| Average number of contracts—US dollars sold | | 1 | | 39 | | — | | 1 | | — |
| Average US dollars amounts purchased | $ | 1,557,472 | $ | 16,691,928 | | — | $ | 625,388 | | — |
| Average US dollars amounts sold | $ | 611,188 | $ | 32,184,186 | | — | $ | 271,810 | | — |
| Options: | | | | | | | | | | |
| Average number of option contracts purchased | | 1,137,886 | | 524,391 | | — | | 443,891 | | 140 |
| Average number of option contracts written | | 218 | | 377,340 | | — | | 75 | | 94 |
| Average notional value of option contracts purchased | $ | 1,923,500 | $ | 28,079,601 | | — | $ | 724,500 | $ | 275,000 |
| Average notional value of option contracts written | $ | 448,500 | $ | 39,567,103 | | — | $ | 149,250 | $ | 144,875 |
| Average number of swaption contracts purchased | | 26 | | — | | — | | 26 | | 7 |
| Average number of swaption contracts written | | 34 | | 1 | | — | | 31 | | 10 |
| Average notional value of swaption contracts purchased | $ | 71,376,606 | | — | | — | $ | 28,436,250 | $ | 12,075,000 |
| Average notional value of swaption contracts written | $ | 76,529,688 | $ | 1,520,425 | | — | $ | 29,277,188 | $ | 16,000,000 |
| Structured options: | | | | | | | | | | |
| Average number of units | | — | | 12,832 | | — | | — | | — |
| Average notional value | | — | $ | 6,644,604 | | — | | — | | — |
| Credit default swaps: | | | | | | | | | | |
| Average number of contracts—buy protection | | 11 | | — | | 1 | | 11 | | — |
| Average number of contracts—sell protection | | 9 | | — | | 1 | | 9 | | — |
| Average notional value—buy protection | $ | 10,471,796 | | — | $ | 7,500 | $ | 4,399,926 | | — |
| Average notional value—sell protection | $ | 3,485,875 | | — | $ | 980,000 | $ | 1,433,000 | | — |
| Interest rate swaps: | | | | | | | | | | |
| Average number of contracts—pays fixed rate | | 18 | | 2 | | — | | 18 | | 10 |
| Average number of contracts—receives fixed rate | | 15 | | 2 | | — | | 10 | | 11 |
| Average notional value—pays fixed rate | $ | 38,693,844 | $ | 89,000 | | — | $ | 16,269,862 | $ | 25,782,500 |
| Average notional value—receives fixed rate | $ | 26,375,543 | $ | 6,525,500 | | — | $ | 9,129,415 | $ | 13,250,000 |
| Cross—currency swaps: | | | | | | | | | | |
| Average number of contracts—pays fixed rate | | — | | — | | — | | — | | — |
| Average number of contracts—receives fixed rate | | — | | 1 | | — | | — | | — |
| Average notional value—pays fixed rate | | — | | — | | — | | — | | — |
| Average notional value—receives fixed rate | | — | $ | 187,831 | | — | | — | | — |
| Total return swaps: | | | | | | | | | | |
| Average number of contracts | | 6 | | 3 | | — | | 6 | | 2 |
| Average notional value | $ | 3,521,543 | $ | 3,791,495 | | — | $ | 1,351,662 | $ | 1,263,728 |
| BLACKROCK SERIES FUND, INC. | DECEMBER 31, 2011 | 103 |
Notes to Financial Statements (continued)
3. Investment Advisory Agreement and Other Transactions with Affiliates:
The PNC Financial Services Group, Inc. (“PNC”) and Barclays Bank PLC (“Barclays”) are the largest stockholders of BlackRock, Inc. (“BlackRock”). Due to the ownership structure, PNC is an affiliate for 1940 Act purposes, but Barclays is not.
The Fund, on behalf of the Portfolios, entered into an Investment Advisory Agreement with BlackRock Advisors, LLC (the “Manager”), the Portfolio’s investment advisor, an indirect, wholly owned subsidiary of BlackRock, to provide investment advisory and administration services. The Manager is responsible for the management of each Portfolio’s portfolio and provides the necessary personnel, facilities, equipment and certain other services necessary to the operations of each Portfolio. For such services, the Fund pays the Manager a monthly fee at the following annual rates of the eight combined Portfolios’ average daily net assets minus the sum of accrued liabilities as follows:
| Average Daily Net Assets | Investment
Advisory Fee |
| First $250 million | 0.50% |
| $250 million–$300 million | 0.45% |
| $300 million–$400 million | 0.40% |
| $400 million–$800 million | 0.35% |
| Greater than $800 million | 0.30% |
The portion of the assets of a Portfolio to which the rate of each breakpoint level applies will be determined on a “uniform percentage” basis. The uniform percentage applicable to a breakpoint level is determined by dividing the amount of the aggregate average daily net assets of the eight combined Portfolios that falls within that breakpoint level by the aggregate average daily net assets of the eight combined Portfolios. The amount of the fee for a Portfolio at each breakpoint level is determined by multiplying the average net assets of that Portfolio by the uniform percentage applicable to that breakpoint level and multiplying the product by the applicable advisory fee rate.
The Manager entered into a sub-advisory agreement on behalf of the Fund with BlackRock Financial Management, Inc. (“BFM”), BlackRock Investment Management, LLC (“BIM”), BlackRock International Limited (“BIL”) and BlackRock Institutional Management Corporation, Inc. (“BIMC”), as applicable, each affiliates of the Manager, as follows:
| | Sub-Advisor |
| BlackRock Balanced Capital Portfolio | BIM and BFM |
| BlackRock Capital Appreciation Portfolio | BIM |
| BlackRock Global Allocation Portfolio | BIM and BIL |
| BlackRock High Yield Portfolio | BFM |
| BlackRock Large Cap Core Portfolio | BIM |
| BlackRock Money Market Portfolio1 | BIMC |
| BlackRock Total Return Portfolio | BFM |
| BlackRock U.S. Government Bond Portfolio | BFM |
| 1 | | Effective July 1, 2011, the sub-advisory agreement with BIMC was terminated. |
Pursuant to the sub-advisory agreements, the Manager pays each sub-advisor, for services they provide, a monthly fee that is a percentage of the Manager’s investment advisory fee paid by each Portfolio to the Manager.
The Manager contractually agreed to waive and/or reimburse fees or expenses, excluding interest expense, dividend expense, acquired fund fees and expenses and certain other fund expenses, in order to limit expenses. The Manager has agreed not to reduce or discontinue this contractual waiver or reimbursement prior to May 1, 2012 unless approved by the Board, including a majority of independent Directors.
The current expense limitations as a percentage of net assets are as follows:
| BlackRock Balanced Capital Portfolio | 0.50% |
| BlackRock Capital Appreciation Portfolio | 0.57% |
| BlackRock Global Allocation Portfolio | 0.57% |
| BlackRock High Yield Portfolio | 0.50% |
| BlackRock Large Cap Core Portfolio | 0.50% |
| BlackRock Money Market Portfolio | 0.50% |
| BlackRock Total Return Portfolio | 0.50% |
| BlackRock U.S. Government Bond Portfolio | 0.50% |
| 104 | BLACKROCK SERIES FUND, INC. | DECEMBER 31, 2011 |
Notes to Financial Statements (continued)
The following Portfolios had waivers that are included in fees waived by advisor in the Statements of Operations. For the year ended December 31, 2011, the amounts were as follows:
| | Fees Waived
by Manager |
| BlackRock Balanced Capital Portfolio | $ | 2,442 |
| BlackRock Global Allocation Portfolio | $ | 133,194 |
| BlackRock High Yield Portfolio | $ | 77,711 |
| BlackRock Money Market Portfolio | $ | 283,632 |
| BlackRock Total Return Portfolio | $ | 64,152 |
| BlackRock U.S. Government Bond Portfolio | $ | 26,162 |
The Manager voluntarily agreed to waive management fees and reimburse operating expenses to enable the BlackRock Money Market Portfolio to maintain a minimum daily net investment income dividend. These amounts are reported in the Statements of Operations as fees waived by advisor. The Manager may discontinue the waiver or reimbursement at any time.
The Manager voluntarily agreed to waive its investment advisory fees by the amount of investment advisory fees certain Portfolios pay to the Manager indirectly through their investment in affiliated money market funds, however the Manager does not waive its investment advisory fees by the amount of investment advisory fees paid through certain Portfolios’ investment in other affiliated investment companies, if any. These amounts are included in fees waived by advisor in the Statements of Operations. For the year ended December 31, 2011, the amounts waived were as follows:
| | Fees Waived
by Manager |
| BlackRock Balanced Capital Portfolio | $ | 1,137 |
| BlackRock Capital Appreciation Portfolio | $ | 857 |
| BlackRock Global Allocation Portfolio | $ | 518 |
| BlackRock High Yield Portfolio | $ | 864 |
| BlackRock Large Cap Core Portfolio | $ | 68 |
| BlackRock U.S. Government Bond Portfolio | $ | 9,833 |
For the year ended December 31, 2011, each Portfolio reimbursed the Manager for certain accounting services, which is included in accounting services in the Statements of Operations. The reimbursements were as follows:
| BlackRock Balanced Capital Portfolio | $5,774 |
| BlackRock Capital Appreciation Portfolio | $1,846 |
| BlackRock Global Allocation Portfolio | $5,654 |
| BlackRock High Yield Portfolio | $ 522 |
| BlackRock Large Cap Core Portfolio | $1,757 |
| BlackRock Money Market Portfolio | $2,013 |
| BlackRock Total Return Portfolio | $1,062 |
| BlackRock U.S. Government Bond Portfolio | $1,044 |
The Fund, on behalf of Portfolios, entered into a Distribution Agreement and Distribution Plan with BlackRock Investments, LLC (“BRIL”), an affiliate of the Manager.
The Fund, on behalf of the Portfolios, received an exemptive order from the SEC permitting it, among other things, to pay an affiliated securities lending agent a fee based on a share of the income derived from the securities lending activities and has retained BIM as the securities lending agent. BIM may, on behalf of the Fund, invest cash collateral received by the Fund for such loans, among other things, in a private investment company managed by the Manager or in registered money market funds advised by the Manager or its affiliates. As securities lending agent, BIM is responsible for all transaction fees and all other operational costs relating to securities lending activities, other than extraordinary expenses. BIM does not receive any fees for managing the cash collateral. The market value of securities on loan and the value of the related collateral, if applicable, are shown in the Statements of Assets and Liabilities as securities loaned at value and collateral on securities loaned at value, respectively. The cash collateral invested by BIM is disclosed in the Schedules of Investments. Securities lending income is equal to the total of income earned from the reinvestment of cash collateral, net of rebates paid to, or fees paid by, borrowers of securities. The Fund retains 65% of securities lending income and pays a fee to BIM equal to 35% of such income. The share of income earned by the Fund on such investments is shown as securities lending—affiliated in the Statements of Operations. For the year ended December 31, 2011, BIM received securities lending agent fees related to securities lending agent fees as follows:
| BlackRock Capital Appreciation Portfolio | $ | 11,173 |
| BlackRock Global Allocation Portfolio | $ | 776 |
| BlackRock Large Cap Core Portfolio | $ | 4,132 |
Certain officers and/or directors of the Portfolios are officers and/or directors of BlackRock or its affiliates. The Portfolios reimburse the Manager for compensation paid to the Fund’s Chief Compliance Officer.
| BLACKROCK SERIES FUND, INC. | DECEMBER 31, 2011 | 105 |
Notes to Financial Statements (continued)
4. Investments:
Purchases and sales of investments including paydowns, mortgage dollar roll and TBA transactions and excluding short-term securities and US government securities for the year ended December 31, 2011, were as follows:
| | | Purchases | | Sales |
| BlackRock Balanced Capital Portfolio | | $ | 2,918,392,966 | | | $ | 2,983,452,967 | |
| BlackRock Capital Appreciation Portfolio | | $ | 131,261,231 | | | $ | 160,160,178 | |
| BlackRock Global Allocation Portfolio | | $ | 256,430,384 | | | $ | 381,033,112 | 1 |
| BlackRock High Yield Portfolio | | $ | 47,288,304 | | | $ | 57,858,748 | |
| BlackRock Large Cap Core Portfolio | | $ | 168,481,122 | | | $ | 182,863,055 | |
| BlackRock Total Return Portfolio | | $ | 1,103,503,960 | | | $ | 1,119,992,909 | |
| BlackRock U.S. Government Bond Portfolio | | $ | 2,642,428,962 | | | $ | 2,670,295,964 | |
1 Including $215,837,974 of sales representing redemptions-in-kind.
For the year ended December 31, 2011, purchases and sales of US government securities were as follows:
| | | Purchases | | Sales |
| BlackRock Balanced Capital Portfolio | | $ | 635,136,905 | | | $ | 633,441,633 | |
| BlackRock Global Allocation Portfolio | | $ | 25,126,127 | | | $ | 44,490,202 | |
| BlackRock Total Return Portfolio | | $ | 275,784,929 | | | $ | 281,169,440 | |
| BlackRock U.S. Government Bond Portfolio | | $ | 409,771,576 | | | $ | 411,633,446 | |
For the year ended December 31, 2011, purchases and sales of mortgage dollar rolls were as follows:
| | | Purchases | | Sales |
| BlackRock Balanced Capital Portfolio | | $ | 1,145,940,975 | | | $ | 1,146,484,747 | |
| BlackRock Total Return Portfolio | | $ | 494,964,832 | | | $ | 495,148,473 | |
| BlackRock U.S. Government Bond Portfolio | | $ | 906,952,635 | | | $ | 907,402,934 | |
Transactions in options written for the year ended December 31, 2011, were as follows:
| | Calls | | Puts |
| BlackRock Balanced Capital Portfolio | | Option
Contracts | | Notional
(000) | | Premium
Received | | Option
Contracts | | Notional
(000) | | Premiums
Received |
| Outstanding options, beginning of year | | | 30 | | | $ | 44,500 | | | $ | 2,298,124 | | | | 30 | | | $ | 61,600 | | | $ | 2,573,407 | |
| Options written | | | 715 | | | | 82,000 | | | | 3,034,308 | | | | 684 | | | | 107,025 | | | | 3,111,179 | |
| Options exercised | | | (143 | ) | | | (11,000 | ) | | | (368,825 | ) | | | — | | | | (10,300 | ) | | | (45,529 | ) |
| Options expired | | | (268 | ) | | | (8,400 | ) | | | (315,948 | ) | | | (383 | ) | | | (31,500 | ) | | | (619,854 | ) |
| Options closed | | | (334 | ) | | | (100,000 | ) | | | (4,478,289 | ) | | | (331 | ) | | | (117,906 | ) | | | (4,827,099 | ) |
| Outstanding options, end of year | | | — | | | $ | 7,100 | | | $ | 169,370 | | | | — | | | $ | 8,919 | | | $ | 192,104 | |
| | Calls | | Puts |
| BlackRock Global Allocation Portfolio | | Option
Contracts | | Notional
(000) | | Premium
Received | | Option
Contracts | | Notional
(000) | | Premiums
Received |
| Outstanding options, beginning of year | | | 982 | | | | — | | | $ | 202,434 | | | | 1,107 | | | | — | | | $ | 145,498 | |
| Options written | | | 307,850 | | | $ | 1,427 | | | | 1,572,778 | | | | 227,705 | | | | JPY 235,674 | | | | 2,162,521 | |
| Options exercised | | | (377 | ) | | | — | | | | (103,518 | ) | | | — | | | | — | | | | — | |
| Options expired | | | (164,110 | ) | | | (772 | ) | | | (91,325 | ) | | | (5,170 | ) | | | — | | | | (227,920 | ) |
| Options closed | | | (68,451 | ) | | | (655 | ) | | | (934,357 | ) | | | (60,917 | ) | | | (111,356 | ) | | | (1,450,804 | ) |
| Outstanding options, end of year | | | 75,894 | | | | — | | | $ | 646,012 | | | | 162,725 | | | | JPY 124,318 | | | $ | 629,295 | |
As of December 31, 2011, for BlackRock Global Allocation Portfolio, the value of portfolio holdings subject to covered call options written was $6,230,845.
| | Calls | | Puts |
| BlackRock Total Return Portfolio | | Option
Contracts | | Notional
(000) | | Premium
Received | | Option
Contracts | | Notional
(000) | | Premiums
Received |
| Outstanding options, beginning of year | | | — | | | $ | 18,700 | | | $ | 977,651 | | | | — | | | $ | 22,700 | | | $ | 1,096,651 | |
| Options written | | | 297 | | | | 32,000 | | | | 1,200,180 | | | | 230 | | | | 42,345 | | | | 1,211,505 | |
| Options exercised | | | (60 | ) | | | (4,800 | ) | | | (165,720 | ) | | | — | | | | — | | | | — | |
| Options expired | | | (92 | ) | | | (1,700 | ) | | | (97,982 | ) | | | (133 | ) | | | (11,900 | ) | | | (237,411 | ) |
| Options closed | | | (145 | ) | | | (40,100 | ) | | | (1,807,824 | ) | | | (97 | ) | | | (48,336 | ) | | | (1,955,581 | ) |
| Outstanding options, end of year | | | — | | | $ | 4,100 | | | $ | 106,305 | | | | — | | | $ | 4,809 | | | $ | 115,164 | |
| 106 | BLACKROCK SERIES FUND, INC. | DECEMBER 31, 2011 |
Notes to Financial Statements (continued)
| | Calls | | Puts |
BlackRock U.S. Government
Bond Portfolio | | Option
Contracts | | Notional
(000) | | Premium
Received | | Option
Contracts | | Notional
(000) | | Premiums
Received |
| Outstanding options, beginning of year | | | — | | | | — | | | | — | | | | — | | | | — | | | | — | |
| Options written | | | 450 | | | $ | 21,000 | | | $ | 983,091 | | | | 394 | | | $ | 36,700 | | | $ | 987,246 | |
| Options exercised | | | (74 | ) | | | (300 | ) | | | (53,712 | ) | | | — | | | | — | | | | — | |
| Options expired | | | (114 | ) | | | (1,800 | ) | | | (105,664 | ) | | | (126 | ) | | | (19,300 | ) | | | (186,743 | ) |
| Options closed | | | (262 | ) | | | (16,300 | ) | | | (714,265 | ) | | | (268 | ) | | | (14,800 | ) | | | (691,053 | ) |
| Outstanding options, end of year | | | — | | | $ | 2,600 | | | $ | 109,450 | | | | — | | | $ | 2,600 | | | $ | 109,450 | |
5. Income Tax Information:
US GAAP requires that certain components of net assets be adjusted to reflect permanent differences between financial and tax reporting. These reclassifications have no effect on net assets or net asset values per share. The following permanent differences as of December 31, 2011 attributable to the expiration of capital loss carryforwards, the accounting for swap agreements, the classification of investments, amortization and accretion methods on fixed income securities, foreign currency transactions, income recognized from pass-through entities, the sale of stock of passive foreign investment companies, net paydown losses, in-kind redemptions and the reclassification of distributions were reclassified to the following accounts:
| | BlackRock
Balanced
Capital
Portfolio | | BlackRock
Capital
Appreciation
Portfolio | | BlackRock
Global Allocation
Portfolio | | BlackRock
High Yield
Portfolio | | BlackRock
Total Return
Portfolio | | BlackRock
U.S.
Government
Bond
Portfolio |
| Paid-in capital | | — | | $ | (18,061,591 | ) | $ | 21,112,992 | | $ | (8,354,955 | ) | | — | | | — | |
| Undistributed (distributions in | | | | | | | | | | | | | | | | | | |
| excess of) net investment | | | | | | | | | | | | | | | | | | |
| income (loss) | $ | 207,978 | | $ | 6,255 | | $ | 10,127,778 | | $ | 30,245 | | $ | 21,336 | | $ | 262,377 | |
| Undistributed net realized gain | | | | | | | | | | | | | | | | | | |
| (accumulated net realized | | | | | | | | | | | | | | | | | | |
| loss) | $ | (207,978 | ) | $ | 18,055,336 | | $ | (31,240,770 | ) | $ | 8,324,710 | | $ | (21,336 | ) | $ | (262,377 | ) |
The tax character of distributions paid during the fiscal years ended December 31, 2011 and December 31, 2010 was as follows:
| | | BlackRock
Balanced
Capital
Portfolio | BlackRock
Capital
Appreciation
Portfolio | BlackRock
Global
Allocation
Portfolio | BlackRock
High Yield
Portfolio | BlackRock
Large
Cap Core
Portfolio | BlackRock
Money
Market
Portfolio | BlackRock
Total
Return
Portfolio | BlackRock
U.S.
Government
Bond
Portfolio |
| Ordinary income | 12/31/2011 | $ | 13,880,759 | $ | 1,000,004 | $ | 18,129,177 | $ | 3,564,140 | $ | 2,012,381 | $ | 1,390 | $ | 3,746,655 | $ | 3,629,485 |
| | 12/31/2010 | | 12,758,496 | | 806,311 | | 6,300,006 | | 3,900,828 | | 2,356,592 | | 18,768 | | 4,301,385 | | 7,276,741 |
| Long-term | | | | | | | | | | | | | | | | | |
| capital gains | 12/31/2011 | | — | | — | | 4,779,692 | | — | | — | | — | | — | | 451,681 |
| | 12/31/2010 | | — | | — | | — | | — | | — | | — | | — | | 78,470 |
| Total | 12/31/2011 | $ | 13,880,759 | $ | 1,000,004 | $ | 22,908,869 | $ | 3,564,140 | $ | 2,012,381 | $ | 1,390 | $ | 3,746,655 | $ | 4,081,166 |
| | 12/31/2010 | $ | 12,758,496 | $ | 806,311 | $ | 6,300,006 | $ | 3,900,828 | $ | 2,356,592 | $ | 18,768 | $ | 4,301,385 | $ | 7,355,211 |
| BLACKROCK SERIES FUND, INC. | DECEMBER 31, 2011 | 107 |
Notes to Financial Statements (continued)
As of December 31, 2011, the tax components of accumulated net earnings (losses) were as follows:
| | BlackRock
Balanced
Capital
Portfolio | BlackRock
Capital
Appreciation
Portfolio | BlackRock
Global
Allocation
Portfolio | BlackRock
High Yield
Portfolio | BlackRock
Large Cap
Core
Portfolio | BlackRock
Money
Market
Portfolio | BlackRock
Total
Return
Portfolio | BlackRock
U.S.
Government
Bond
Portfolio |
| Undistributed ordinary | | | | | | | | | | | | | | | | | | | | | | | |
| income | $ | 476,885 | | $ | 41,554 | | | — | | $ | 86,383 | | $ | 122,442 | | $ | 609 | $ | 331,671 | | $ | 1,369,604 | |
| Capital loss | | | | | | | | | | | | | | | | | | | | | | | |
| carryforwards | | (46,388,403 | ) | | (29,348,803 | ) | | — | | | (8,397,174 | ) | | (32,230,362 | ) | | — | | (6,485,683 | ) | | — | |
| Net unrealized | | | | | | | | | | | | | | | | | | | | | | | |
| gains (losses)1 | | 17,335,553 | | | 13,682,633 | | $ | (24,259,199 | ) | | (612,354 | ) | | 9,425,113 | | | — | | 1,404,425 | | | 2,028,193 | |
| Qualified late-year | | | | | | | | | | | | | | | | | | | | | | | |
| losses2 | | (92,729 | ) | | (2,278,608 | ) | | (1,769,639 | ) | | (496,343 | ) | | (829,941 | ) | | — | | (742,861 | ) | | (147,717 | ) |
| Total | $ | (28,668,694 | ) | $ | (17,903,224 | ) | $ | (26,028,838 | ) | $ | (9,419,488 | ) | $ | (23,512,748 | ) | $ | 609 | $ | (5,492,448 | ) | $ | 3,250,080 | |
| 1 | | The difference between book-basis and tax-basis net unrealized gains (losses) was attributable primarily to the tax deferral of losses on wash sales and straddles, amortization and accretion methods of premiums and discounts on fixed income securities, the accrual of income on securities in default, the realization for tax purposes of unrealized gains/losses on certain futures, options and foreign currency exchange contracts, the realization for tax purposes of unrealized gains on investments in passive foreign investment companies, the timing and recognition of partnership income, the accounting for swap agreements, the classification of investments, the timing of expense recognition and the investment in a wholly owned subsidiary. |
| 2 | | Certain Portfolios have elected to defer certain qualified late-year losses and recognize such losses in the year ending December 31, 2012. |
As of December 31, 2011, the Portfolios had capital loss carryforwards available to offset future realized capital gains through the indicated expiration dates as follows:
| Expires December 31, | | BlackRock
Balanced
Capital
Portfolio | | BlackRock
Capital
Appreciation
Portfolio | | BlackRock
High Yield
Portfolio | | BlackRock
Large Cap
Core
Portfolio | | BlackRock
Total Return
Portfolio |
| 2013 | | | — | | | | — | | | $ | 1,975,092 | | | | — | | | | — | |
| 2014 | | | — | | | | — | | | | 664,870 | | | | — | | | | — | |
| 2016 | | | — | | | $ | 117,171 | | | | 2,675,598 | | | | — | | | | — | |
| 2017 | | $ | 46,388,403 | | | | 29,231,632 | | | | 3,081,614 | | | $ | 32,230,362 | | | $ | 4,160,952 | |
| No expiration date3 | | | — | | | | — | | | | — | | | | — | | | | 2,324,731 | |
| Total | | $ | 46,388,403 | | | $ | 29,348,803 | | | $ | 8,397,174 | | | $ | 32,230,362 | | | $ | 6,485,683 | |
| 3 | | Must be utilized prior to losses subject to expiration. |
As of December 31, 2011, gross unrealized appreciation and gross unrealized depreciation based on cost for federal income tax purposes were as follows:
| | BlackRock
Balanced
Capital
Portfolio | BlackRock
Capital
Appreciation
Portfolio | BlackRock
Global
Allocation
Portfolio | BlackRock
High Yield
Portfolio | BlackRock
Large Cap
Core
Portfolio | BlackRock
Total
Return
Portfolio | BlackRock
U.S.
Government
Bond
Portfolio |
| Tax cost | $ | 560,863,624 | | $ | 122,202,077 | | $ | 294,394,393 | | $ | 47,486,423 | | $ | 145,883,504 | | $ | 114,628,693 | | $ | 135,469,371 | |
| Gross unrealized | | | | | | | | | | | | | | | | | | | | | |
| appreciation | $ | 36,217,770 | | $ | 20,195,951 | | $ | 10,287,495 | | $ | 1,588,316 | | $ | 15,506,161 | | $ | 3,530,067 | | $ | 3,396,616 | |
| Gross unrealized | | | | | | | | | | | | | | | | | | | | | |
| depreciation | | (18,849,379 | ) | | (6,513,313 | ) | | (32,539,865 | ) | | (2,232,563 | ) | | (6,081,048 | ) | | (2,026,525 | ) | | (731,962 | ) |
| Net unrealized | | | | | | | | | | | | | | | | | | | | | |
| appreciation | | | | | | | | | | | | | | | | | | | | | |
| (depreciation) | $ | 17,368,391 | | $ | 13,682,638 | | $ | (22,252,370 | ) | $ | (644,247 | ) | $ | 9,425,113 | | $ | 1,503,542 | | $ | 2,664,654 | |
| 108 | BLACKROCK SERIES FUND, INC. | DECEMBER 31, 2011 |
Notes to Financial Statements (continued)
6. Borrowings:
The Fund, on behalf of the Portfolios (except for BlackRock Money Market Portfolio), along with certain other funds managed by the Manager and its affiliates, is a party to a $500 million credit agreement with a group of lenders, which expired in November 2011. The Portfolios may borrow under the credit agreement to fund shareholder redemptions. Effective November 2010, the credit agreement had the following terms: a commitment fee of 0.08% per annum based on each Portfolio’s pro rata share of the unused portion of the credit agreement and interest at a rate equal to the higher of (a) the one-month LIBOR plus 1.00% per annum or (b) the Fed Funds rate plus 1.00% per annum on amounts borrowed. In addition, the Portfolios paid administration and arrangement fees which were allocated to the Portfolios based on their net assets as of October 31, 2010. Effective November 2011, the credit agreement was renewed until November 2012 with the following terms: a commitment fee of 0.065% per annum based on the Portfolio’s pro rata share of the unused portion of the credit agreement and interest at a rate equal to the higher of (a) the one-month LIBOR plus 0.80% per annum or (b) the Fed Funds rate plus 0.80% per annum on amounts borrowed. In addition, the Portfolios paid administration and arrangement fees which were allocated to the Portfolios based on their net assets as of October 31, 2011. The Portfolios did not borrow under the credit agreement during the year ended December 31, 2011.
For the year ended December 31, 2011 the Portfolios’ daily average amount of outstanding transactions considered as borrowings from reverse repurchase agreements and treasury rolls transactions were as follows:
| | | Average
Borrowings | | Daily Weighted
Average
Interest Rate |
| BlackRock Balanced Capital Portfolio | | $38,156,208 | | 0.10% |
| BlackRock High Yield Portfolio | | $784,350 | | 0.57% |
| BlackRock Total Return Portfolio | | $23,372,244 | | 0.08% |
| BlackRock U.S. Government Bond Portfolio | | $1,145,109 | | 0.12% |
7. Commitments:
Certain Portfolios may invest in floating rate loan interests. In connection with these investments, the Portfolios may also enter into unfunded floating rate loan interests and bridge loan commitments (“commitments”). Bridge loan commitments may obligate the Portfolios to furnish temporary financing to a borrower until permanent financing can be arranged. At December 31, 2011, the BlackRock High Yield Portfolio had outstanding bridge loan commitments of $230,000. In connection with either of these commitments, the Portfolios earn a commitment fee, typically set as a percentage of the commitment amount. Such fee income, which is included in interest income in the Statements of Operations, is recognized ratably over the commitment period. The unrecognized commitment fee income is recorded on the Statements of Assets and Liabilities as deferred income. Unfunded floating rate loan interests are marked-to-market daily, and any unrealized appreciation or depreciation is included in the Statements of Assets and Liabilities and Statements of Operations. As of December 31, 2011, none of the Portfolios had any unfunded floating rate loan interests.
8. Concentration, Market and Credit Risk:
In the normal course of business, the Portfolios invest in securities and enter into transactions where risks exist due to fluctuations in the market (market risk) or failure of the issuer of a security to meet all its obligations (issuer credit risk). The value of securities held by the Portfolios may decline in response to certain events, including those directly involving the issuers whose securities are owned by the Portfolios; conditions affecting the general economy; overall market changes; local, regional or global political, social or economic instability; and currency and interest rate and price fluctuations. Similar to issuer credit risk, the Portfolios may be exposed to counterparty credit risk, or the risk that an entity with which the Portfolios have unsettled or open transactions may fail to or be unable to perform on its commitments. The Portfolios manage counterparty credit risk by entering into transactions only with counterparties that they believe have the financial resources to honor their obligations and by monitoring the financial stability of those counterparties. Financial assets, which potentially expose the Portfolios to market, issuer and counterparty credit risks, consist principally of financial instruments and receivables due from counterparties. The extent of the Portfolio’s exposure to market, issuer and counterparty credit risks with respect to these financial assets is generally approximated by their value recorded in the Portfolio’s Statements of Assets and Liabilities, less any collateral held by the Portfolios.
| BLACKROCK SERIES FUND, INC. | DECEMBER 31, 2011 | 109 |
Notes to Financial Statements (continued)
Certain Portfolios invest a significant portion of their assets in securities backed by commercial or residential mortgage loans or in issuers that hold mortgage and other asset-backed securities. Please see the Schedules of Investments for these securities. Changes in economic conditions, including delinquencies and/or defaults on assets underlying these securities, can affect the value, income and/or liquidity of such positions.
As of December 31, 2011, the Capital Appreciation Portfolio invested a significant portion of its assets in securities in the information technology sector. Changes in economic conditions affecting the information technology sector would have a greater impact on the Portfolio and could affect the value, income and/or liquidity of positions in such securities.
As of December 31, 2011, BlackRock Global Allocation Portfolio invested a substantial amount of its assets in issuers located in a single country or a limited number of countries. When the Portfolio concentrates its investments in this manner, it assumes the risk that economic, political and social conditions in those countries may have a significant impact on its investment performance. Foreign issuers may not be subject to the same uniform accounting, auditing and financial reporting standards and practices as used in the U.S. Foreign securities markets may also be less liquid, more volatile, and less subject to governmental supervision not typically associated with investing in U.S. securities. Please see the Schedules of Investments for concentrations in specific countries. As of December 31, 2011, the BlackRock Global Allocation Portfolio had the following industry classifications:
| Industry | | Percent of
Long-Term
Investments |
| Oil, Gas & Consumable Fuels | | 11 | % |
| Foreign Agency Obligations | | 9 | |
| US Treasury Obligations | | 9 | |
| Metals & Mining | | 5 | |
| Other1 | | 66 | |
| 1 | | All other industries held were each less than 5% of long-term investments. |
As of December 31, 2011, the Large Cap Core Portfolio invested a significant portion of its assets in securities in the health care and information technology sectors. Changes in economic conditions affecting the health care and information technology sectors would have a greater impact on the Portfolio and could affect the value, income and/or liquidity of positions in such securities.
| 110 | BLACKROCK SERIES FUND, INC. | DECEMBER 31, 2011 |
Notes to Financial Statements (concluded)
9. Capital Share Transactions:
Transactions in capital shares for each class were as follows:
Year Ended
December 31, 2011 | BlackRock
Balanced Capital Portfolio | | BlackRock
Capital Appreciation Portfolio | | BlackRock
Global Allocation
Portfolio | | BlackRock
High Yield
Portfolio |
| Shares | | Amount | | Shares | | Amount | | Shares | | Amount | | Shares | | Amount | | |
| Shares sold | | 277,375 | | | $ | 3,971,923 | | | | 150,435 | | | $ | 4,257,123 | | | | 8,791,767 | | | $ | 139,036,622 | | | | 3,824,499 | | | $ | 19,656,920 | |
| Shares issued to | | | | | | | | | | | | | | | | | | | | | | | | | | | | | | | |
| shareholders in | | | | | | | | | | | | | | | | | | | | | | | | | | | | | | | |
| reinvestment of | | | | | | | | | | | | | | | | | | | | | | | | | | | | | | | |
| dividends | | 964,706 | | | | 13,880,759 | | | | 39,526 | | | | 1,000,004 | | | | 1,656,462 | | | | 22,908,869 | | | | 695,296 | | | | 3,685,053 | |
| Shares redeemed | | (4,085,628 | ) | | | (59,715,617 | ) | | | (1,290,706 | ) | | | (33,934,978 | ) | | | (22,561,316 | ) | | | (347,710,404 | ) | | | (5,269,816 | ) | | | (27,522,375 | ) |
| Net decrease | | (2,843,547 | ) | | $ | (41,862,935 | ) | | | (1,100,745 | ) | | $ | (28,677,851 | ) | | | (12,113,087 | ) | | $ | (185,764,913 | ) | | | (750,021 | ) | | $ | (4,180,402 | ) |
Year Ended
December 31, 2011 | BlackRock
Large Cap Core
Portfolio | | BlackRock
Money Market
Portfolio | | BlackRock
Total Return
Portfolio | | BlackRock
US Government
Return Portfolio |
| | Shares | Amount | | Shares | | Amount | | Shares | | Amount | | Shares | | Amount | |
| Shares sold | | 228,552 | | | $ | 4,449,492 | | | | 68,861,880 | | | $ | 68,861,880 | | | | 381,327 | | | $ | 4,301,389 | | | | 1,044,072 | | | $ | 11,942,912 | | |
| Shares issued to | | | | | | | | | | | | | | | | | | | | | | | | | | | | | | | | |
| shareholders in | | | | | | | | | | | | | | | | | | | | | | | | | | | | | | | | |
| reinvestment of | | | | | | | | | | | | | | | | | | | | | | | | | | | | | | | | |
| dividends | | 107,039 | | | | 2,012,381 | | | | 1,390 | | | | 1,390 | | | | 335,966 | | | | 3,777,194 | | | | 362,995 | | | | 4,133,633 | | |
| Shares redeemed | | (1,101,900 | ) | | | (21,214,846 | ) | | | (89,712,558 | ) | | | (89,712,558 | ) | | | (1,253,064 | ) | | | (14,066,616 | ) | | | (2,324,120 | ) | | | (26,535,762 | ) | |
| Net decrease | | (766,309 | ) | | $ | (14,752,973 | ) | | | (20,849,288 | ) | | $ | (20,849,288 | ) | | | (535,771 | ) | | $ | (5,988,033 | ) | | | (917,053 | ) | | $ | (10,459,217 | ) | |
Year Ended
December 31, 2011 | BlackRock
Balanced Capital
Portfolio | | BlackRock
Capital Appreciation Portfolio | | BlackRock
Global Allocation
Portfolio | | BlackRock
High Yield
Portfolio |
| | Shares | Amount | | Shares | | Amount | | Shares | | Amount | | Shares | | Amount | |
| Shares sold | | 109,279 | | | $ | 1,504,661 | | | | 289,321 | | | $ | 7,213,332 | | | | 13,081,187 | | | $ | 201,022,993 | | | | 4,313,209 | | | $ | 21,759,022 | | |
| Shares issued to | | | | | | | | | | | | | | | | | | | | | | | | | | | | | | | | |
| shareholders in | | | | | | | | | | | | | | | | | | | | | | | | | | | | | | | | |
| reinvestment of | | | | | | | | | | | | | | | | | | | | | | | | | | | | | | | | |
| dividends | | 911,122 | | | | 12,758,496 | | | | 29,332 | | | | 806,311 | | | | 406,714 | | | | 6,300,006 | | | | 787,313 | | | | 4,008,544 | | |
| Shares redeemed | | (4,941,746 | ) | | | (67,069,682 | ) | | | (790,786 | ) | | | (18,705,877 | ) | | | (2,448,817 | ) | | | (35,727,932 | ) | | | (5,201,147 | ) | | | (26,172,144 | ) | |
| Net decrease | | (3,921,345 | ) | | $ | (52,806,525 | ) | | | (472,133 | ) | | $ | (10,686,234 | ) | | | 11,039,084 | | | $ | 171,595,067 | | | | (100,625 | ) | | $ | (404,578 | ) | |
Year Ended
December 31, 2010 | BlackRock
Large Cap Core
Portfolio | | BlackRock
Money Market
Portfolio | | BlackRock
Total Return
Portfolio | | BlackRock
U.S. Government
Bond Portfolio |
| Shares | | Amount | | Shares | | Amount | | Shares | | Amount | | Shares | | Amount |
| Shares sold | | 174,062 | | | $ | 3,004,797 | | | | 64,059,476 | | | $ | 64,059,476 | | | | 647,342 | | | $ | 7,258,749 | | | | 1,155,661 | | | $ | 13,071,211 | |
| Shares issued to | | | | | | | | | | | | | | | | | | | | | | | | | | | | | | | |
| shareholders in | | | | | | | | | | | | | | | | | | | | | | | | | | | | | | | |
| reinvestment of | | | | | | | | | | | | | | | | | | | | | | | | | | | | | | | |
| dividends | | 130,401 | | | | 2,356,592 | | | | 18,762 | | | | 18,762 | | | | 397,419 | | | | 4,420,435 | | | | 669,347 | | | | 7,554,214 | |
| Shares redeemed | | (1,366,629 | ) | | | (23,423,745 | ) | | | (111,741,178 | ) | | | (111,741,178 | ) | | | (1,576,550 | ) | | | (17,541,106 | ) | | | (2,873,814 | ) | | | (32,763,685 | ) |
| Net decrease | | (1,062,166 | ) | | $ | (18,062,356 | ) | | | (47,662,940 | ) | | $ | (47,662,940 | ) | | | (531,789 | ) | | $ | (5,861,922 | ) | | | (1,048,806 | ) | | $ | (12,138,260 | ) |
10. Subsequent Events:
Management has evaluated the impact of all subsequent events on each Portfolio through the date the financial statements were issued and has determined that there were no subsequent events requiring adjustment or additional disclosure in the financial statements.
| BLACKROCK SERIES FUND, INC. | DECEMBER 31, 2011 | 111 |
Report of Independent Registered Public Accounting Firm
To the Shareholders and Board of Directors of BlackRock Series Fund, Inc.:
We have audited the accompanying statements of assets and liabilities, including the schedules of investments, of BlackRock Series Fund, Inc. (the “Series”), comprised of BlackRock Balanced Capital Portfolio, BlackRock Capital Appreciation Portfolio, BlackRock High Yield Portfolio (formerly known as BlackRock High Income Portfolio), BlackRock Large Cap Core Portfolio, BlackRock Money Market Portfolio, BlackRock Total Return Portfolio and BlackRock U.S. Government Bond Portfolio (formerly known as BlackRock Government Income Portfolio), as of December 31, 2011, and the related statements of operations for the year then ended, the statements of changes in net assets for each of the two years in the period then ended, the financial highlights for each of the five years in the period then ended and the statement of cash flows for BlackRock Total Return Portfolio for the year then ended. We have also audited the accompanying consolidated statement of assets and liabilities, including the consolidated schedule of investments, of BlackRock Global Allocation Portfolio, an additional portfolio of Series, as of December 31, 2011, and the related consolidated statement of operations for the year then ended, the consolidated statements of changes in net assets for each of the two years in the period then ended, the consolidated financial highlights for each of the three years in the period ended December 31, 2011, and the financial highlights for each of the two years in the period ended December 31, 2008. These financial statements and financial highlights, including the consolidated financial statements and consolidated financial highlights, are the responsibility of the Series’ management. Our responsibility is to express an opinion on these financial statements and financial highlights based on our audits.
We conducted our audits in accordance with the standards of the Public Company Accounting Oversight Board (United States). Those standards require that we plan and perform the audit to obtain reasonable assurance about whether the financial statements and financial highlights are free of material misstatement. The Series is not required to have, nor were we engaged to perform, an audit of its internal control over financial reporting. Our audits included consideration of internal control over financial reporting as a basis for designing audit procedures that are appropriate in the circumstances, but not for the purpose of expressing an opinion on the effectiveness of the Series’ internal control over financial reporting. Accordingly, we express no such opinion. An audit also includes examining, on a test basis, evidence supporting the amounts and disclosures in the financial statements, assessing the accounting principles used and significant estimates made by management, as well as evaluating the overall financial statement presentation. Our procedures included confirmation of securities owned as of December 31, 2011 by correspondence with the custodians, brokers and agent banks; where replies were not received from brokers and agent banks, we performed other auditing procedures. We believe that our audits provide a reasonable basis for our opinion.
In our opinion, the financial statements and financial highlights referred to above present fairly, in all material respects, the financial position of each of BlackRock Balanced Capital Portfolio, BlackRock Capital Appreciation Portfolio, BlackRock High Yield Portfolio, BlackRock Large Cap Core Portfolio, BlackRock Money Market Portfolio, BlackRock Total Return Portfolio and BlackRock U.S. Government Bond Portfolio as of December 31, 2011, the results of their operations for the year then ended, the changes in their net assets for each of the two years in the period then ended, the financial highlights for each of the five years in the period then ended, and the cash flows for BlackRock Total Return Portfolio for the year ended December 31, 2011 in conformity with accounting principles generally accepted in the United States of America. Additionally, in our opinion, the consolidated financial statements and financial highlights referred to above present fairly, in all material respects, the consolidated financial position of BlackRock Global Allocation Portfolio as of December 31, 2011, the consolidated results of its operations for the year then ended, the consolidated changes in its net assets for each of the two years in the period ended, the consolidated financial highlights for each of the two years in the period ended December 31, 2011 and the financial highlights for each of the three years in the period ended December 31, 2008, in conformity with accounting principles generally accepted in the United States of America.
Deloitte & Touche LLP
Boston, Massachusetts
February 27, 2012
| 112 | BLACKROCK SERIES FUND, INC. | DECEMBER 31, 2011 |
Officers and Directors
Non-Interested Directors1
Name, Address and
Year of Birth | Position(s) Held
with Fund | Length of
Time Served
as a Director2 | Principal Occupation(s)
During Past Five Years | Number of
BlackRock-Advised
Registered Investment
Companies (“RICs”)
Consisting of Investment
Portfolios (“Portfolios”)
Overseen | Public Directorships |
Robert M. Hernandez
55 East 52nd Street
New York, NY 10055
1944 | Chairman of the
Board and Director | Since 2007 | Director, Vice Chairman and Chief Financial Officer of USX Corporation (energy and steel business) from 1991 to 2001. | 29 RICs consisting of
82 Portfolios | ACE Limited
(insurance company);
Eastman Chemical Company
(chemical); RTI International
Metals, Inc. (metals);
TYCO Electronics
(electronics) |
Fred G. Weiss
55 East 52nd Street
New York, NY 10055
1941 | Vice Chairman of
the Board and
Director | Since 2000 | Managing Director, FGW Associates (consulting and investment company) since 1997; Director, Michael J. Fox Foundation for Parkinson's Research since 2000; Director, BTG International Plc (a global technology commercialization company) from 2001 to 2007. | 29 RICs consisting of
82 Portfolios | Watson Pharmaceuticals Inc. |
James H. Bodurtha
55 East 52nd Street
New York, NY 10055
1944 | Director | Since 2007 | Director, The China Business Group, Inc. (consulting firm) since 1996 and Executive Vice President thereof from 1996 to 2003; Chairman of the Board, Berkshire Holding Corporation since 1980. | 29 RICs consisting of
82 Portfolios | None |
Bruce R. Bond
55 East 52nd Street
New York, NY 10055
1946 | Director | Since 2007 | Trustee and Member of the Governance Committee, State Street Research Mutual Funds from 1997 to 2005; Board Member of Governance, Audit and Finance Committee, Avaya Inc. (computer equipment) from 2003 to 2007. | 29 RICs consisting of
82 Portfolios | None |
Donald W. Burton
55 East 52nd Street
New York, NY 10055
1944 | Director | Since 2002 | Managing General Partner, The Burton Partnership, LP (an investment partnership) since 1979; Managing General Partner, The South Atlantic Venture Funds since 1983; Director, Lifestyle Family Fitness (fitness industry) since 2006; Director, IDology, Inc. (technology solutions) since 2006; Member of the Investment Advisory Council of the Florida State Board of Administration from 2001 to 2007. | 29 RICs consisting of
82 Portfolios | Knology, Inc.
(telecommunications);
Capital Southwest
(financial) |
Honorable
Stuart E. Eizenstat
55 East 52nd Street
New York, NY 10055
1943 | Director | Since 2007 | Partner and Head of International Practice, Covington and Burling (law firm) since 2001; International Advisory Board Member, The Coca Cola Company since 2002; Advisory Board Member, Veracity Worldwide, LLC (risk management) since 2007; Member of the Board of Directors, Chicago Climate Exchange (environmental) since 2006; Member of the International Advisory Board GML (energy) since 2003; Advisory Board Member, BT Americas (telecommunications) from 2004 to 2010. | 29 RICs consisting of
82 Portfolios | Alcatel-Lucent
(telecommunications);
Global Specialty
Metallurgical
(metallurgical industry);
UPS Corporation
(delivery service) |
| BLACKROCK SERIES FUND, INC. | DECEMBER 31, 2011 | 113 |
Non-Interested Directors1 (concluded)
Name, Address and
Year of Birth | Position(s) Held
with Fund | Length of
Time Served
as a Director2 | Principal Occupation(s)
During Past Five Years | Number of
BlackRock-Advised
Registered Investment
Companies (“RICs”)
Consisting of Investment
Portfolios (“Portfolios”)
Overseen | Public Directorships |
Kenneth A. Froot
55 East 52nd Street
New York, NY 10055
1957 | Director | Since 2007 | Professor, Harvard University since 1992. | 29 RICs consisting of
82 Portfolios | None |
John F. O’Brien
55 East 52nd Street
New York, NY 10055
1943 | Director | Since 2005 | Chairman and Director, Woods Hole Oceanographic Institute since 2009 and Trustee thereof from 2003 to 2009; Director, Allmerica Financial Corporation from 1995 to 2003; Director, ABIOMED from 1989 to 2006; Director, Ameresco, Inc. (energy solutions company) from 2006 to 2007; Vice Chairman and Director, Boston Lyric Opera from 2002 to 2007. | 29 RICs consisting of
82 Portfolios | Cabot Corporation
(chemicals);
LKQ Corporation
(auto parts manufacturing);
TJX Companies, Inc.
(retailer) |
Roberta Cooper Ramo
55 East 52nd Street
New York, NY 10055
1942 | Director | Since 2007 | Shareholder, Modrall, Sperling, Roehl, Harris & Sisk, P.A. (law firm) since 1993; Chairman of the Board, Cooper’s Inc., (retail) since 2000; Director, ECMC Group (service provider to students, schools and lenders) since 2001; President, The American Law Institute, (non-profit), since 2008; President, American Bar Association from 1995 to 1996. | 29 RICs consisting of
82 Portfolios | None |
David H. Walsh
55 East 52nd Street
New York, NY 10055
1941 | Director | Since 2003 | Director, National Museum of Wildlife Art since 2007; Trustee, University of Wyoming Foundation since 2008; Director, Ruckleshaus Institute and Haub School of Natural Resources at the University of Wyoming from 2006 to 2008; Director, The American Museum of Fly Fishing since 1997; Director, The National Audubon Society from 1998 to 2005. | 29 RICs consisting of
82 Portfolios | None |
| 1 | | Directors serve until their resignation, removal or death, or until December 31 of the year in which they turn 72. |
| 2 | | Date shown is the earliest date a person has served as a Director for the Fund covered by this annual report. Following the combination of Merrill Lynch Investment Managers, L.P. (“MLIM”) and BlackRock, Inc. (“BlackRock”) in September 2006, the various legacy MLIM and legacy BlackRock Fund boards were realigned and consolidated into three new Fund boards in 2007. As a result, although the chart shows certain Directors as joining the Fund’s Board in 2007, each Director first became a member of the board of other legacy MLIM or legacy BlackRock Funds as follows: James H. Bodurtha, 1995; Bruce R. Bond, 2005; Donald W. Burton, 2002; Honorable Stuart E. Eizenstat, 2001; Kenneth A. Froot, 2005; Robert M. Hernandez, 1996; John F. O’Brien, 2004; Roberta Cooper Ramo, 2000; David H. Walsh, 2003; and Fred G. Weiss, 1998. |
| 114 | BLACKROCK SERIES FUND, INC. | DECEMBER 31, 2011 |
Interested Directors3
Name, Address and
Year of Birth | Position(s) Held
with Fund | Length of
Time Served
as a Director2 | Principal Occupation(s)
During Past Five Years | Number of
BlackRock-Advised
Registered Investment
Companies (“RICs”)
Consisting of Investment
Portfolios (“Portfolios”)
Overseen | Public Directorships |
Paul L. Audet
55 East 52nd Street
New York, NY 10055
1953 | Director | Since 2011 | Senior Managing Director, BlackRock and Head of BlackRock’s Real Estate business from 2008 to 2011; Member of BlackRock’s Global Operating and Corporate Risk Management Committees and the BlackRock Alternative Investors Executive Committee and Investment Committee for the Private Equity Fund of Funds business since 2008; Head of BlackRock’s Global Cash Management business from 2005 to 2010; Acting Chief Financial Officer of BlackRock from 2007 to 2008; Chief Financial Officer of BlackRock from 1998 to 2005. | 159 RICs consisting of
286 Portfolios | None |
Laurence D. Fink
55 East 52nd Street
New York, NY 10055
1952 | Director | Since 2007 | Chairman and Chief Executive Officer of BlackRock since its formation in 1998 and of BlackRock’s predecessor entities since 1988 and Chairman of the Executive and Management Committees; Formerly Managing Director, The First Boston Corporation, Member of its Management Committee, Co-head of its Taxable Fixed Income Division and Head of its Mortgage and Real Estate Products Group; Chairman of the Board of several of BlackRock’s alternative investment vehicles; Director of several of BlackRock’s offshore funds; Member of the Board of Trustees of New York University, Chair of the Financial Affairs Committee and a member of the Executive Committee, the Ad Hoc Committee on Board Governance, and the Committee on Trustees; Co-Chairman of the NYU Hospitals Center Board of Trustees, Chairman of the Development/Trustee Stewardship Committee and Chairman of the Finance Committee; Trustee, The Boys’ Club of New York. | 29 RICs consisting of
82 Portfolios | None |
Henry Gabbay
55 East 52nd Street
New York, NY 10055
1947 | Director | Since 2007 | Consultant, BlackRock from 2007 to 2008; Managing Director, BlackRock from 1989 to 2007; Chief Administrative Officer, BlackRock Advisors, LLC from 1998 to 2007; President of BlackRock Funds and BlackRock Bond Allocation Target Shares from 2005 to 2007 and Treasurer of certain closed-end funds in the BlackRock fund complex from 1989 to 2006. | 159 RICs consisting of
286 Portfolios | None |
| 3 | | Messrs. Audet and Fink are both “interested persons,” as defined in the 1940 Act, of the Fund based on their positions with BlackRock and its affiliates. Mr. Gabbay is an "interested person" of the Fund based on his former positions with BlackRock and its affiliates, as well as his ownership of BlackRock and The PNC Financial Services Group, Inc. securities. Mr. Audet and Mr. Gabbay are also Directors of the BlackRock registered closed-end funds and Directors of other BlackRock registered open-end funds. Directors serve until their resignation, removal or death, or until December 31 of the year in which they turn 72. |
| BLACKROCK SERIES FUND, INC. | DECEMBER 31, 2011 | 115 |
Fund Officers1
Name, Address and
Year of Birth | Position(s) Held
with the Fund | Length of
Time Served | Principal Occupation(s) During Past Five Years |
John M. Perlowski
55 East 52nd Street
New York, NY 10055
1964 | President and Chief
Executive Officer | Since 2010 | Managing Director of BlackRock since 2009; Global Head of BlackRock Fund Administration since 2009; Managing Director and Chief Operating Officer of the Global Product Group at Goldman Sachs Asset Management, L.P. from 2003 to 2009; Treasurer of Goldman Sachs Mutual Funds from 2003 to 2009 and Senior Vice President thereof from 2007 to 2009; Director of Goldman Sachs Offshore Funds from 2002 to 2009; Director of Family Resource Network (charitable foundation) since 2009. |
Brendan Kyne
55 East 52nd Street
New York, NY 10055
1977 | Vice President | Since 2009 | Managing Director of BlackRock since 2010; Director of BlackRock, Inc. from 2008 to 2009; Head of Product Development and Management for BlackRock's U.S. Retail Group since 2009 and Co-head thereof from 2007 to 2009; Vice President of BlackRock from 2005 to 2008. |
Neal Andrews
55 East 52nd Street
New York, NY 10055
1966 | Chief Financial
Officer | Since 2007 | Managing Director of BlackRock since 2006; Senior Vice President and Line of Business Head of Fund Accounting and Administration at PNC Global Investment Servicing (U.S.) Inc. from 1992 to 2006. |
Jay Fife
55 East 52nd Street
New York, NY 10055
1970 | Treasurer | Since 2007 | Managing Director of BlackRock since 2007; Director of BlackRock in 2006; Assistant Treasurer of the MLIM and Fund Asset Management, L.P. advised funds from 2005 to 2006; Director of MLIM Fund Services Group from 2001 to 2006. |
Brian Kindelan
55 East 52nd Street
New York, NY 10055
1959 | Chief Compliance
Officer and
Anti-Money
Laundering Officer | Since 2007 | Chief Compliance Officer of the BlackRock-advised funds since 2007; Managing Director and Senior Counsel of BlackRock, Inc. since 2005. |
Ira P. Shapiro
55 East 52nd Street
New York, NY 10055
1963 | Secretary | Since 2010 | Managing Director of BlackRock since 2009; Managing Director and Associate General Counsel of Barclays Global Investors from 2008 to 2009 and Principal thereof from 2004 to 2008. |
| 1 | | Officers of the Fund serve at the pleasure of the Board. |
| |
| Further information about the Officers and Directors is available in the Fund’s Statement of Additional Information, which can be obtained without charge by calling (800) 441-7762. |
Investment Advisor
BlackRock Advisors, LLC
Wilmington, DE 19809
Sub-Advisors
BlackRock Financial Management, Inc.
New York, NY 10055
BlackRock Investment Management, LLC
Princeton, NJ 08540
BlackRock International Limited
Edinburgh, EH3 8JB, United Kingdom
Custodian
The Bank of New York Mellon2
New York, NY 10286
Brown Brothers Harriman & Co.3
Boston, MA 02109
Transfer Agent
BNY Mellon Investment Servicing (US) Inc.
Providence, RI 02940
Accounting Agent
State Street Bank and Trust Company
Boston, MA 02110
Distributor
BlackRock Investments, LLC
New York, NY 10022
Independent Registered Public Accounting Firm
Deloitte & Touche LLP
Boston, MA 02116
Legal Counsel
Willkie Farr & Gallagher LLP
New York, NY 10019
Address of the Fund
100 Bellevue Parkway
Wilmington, DE 19809
| 2 | | For all Portfolios except BlackRock Global Allocation Portfolio. |
| 3 | | For BlackRock Global Allocation Portfolio. |
Effective September 13, 2011, Richard S. Davis resigned as Director
of the Fund, and Paul L. Audet became Director of the Fund. |
| 116 | BLACKROCK SERIES FUND, INC. | DECEMBER 31, 2011 |
Additional Information
Board Approvals
On March 18, 2011, the Board approved certain changes to the BlackRock High Income Portfolio. In particular, the Board approved a change in the name of the Portfolio to “BlackRock High Yield Portfolio,” a change in the Portfolio’s investment objective to “to maximize total return, consistent with income generation and prudent investment management” and certain changes to the Portfolio’s principal investment strategies, as detailed below. These changes were effective on October 1, 2011.
Effective October 1, 2011, the principal investment strategies of the BlackRock High Yield are as follows:
The Portfolio invests primarily in non-investment grade bonds with maturities of ten years or less.The Portfolio normally invests at least 80% of its assets in high yield bonds. The Portfolio may also invest in convertible and preferred securities. These securities will be counted toward the Portfolio’s 80% policy to the extent they have characteristics similar to the securities included within that policy. The high yield securities (commonly called “junk bonds”) acquired by the Portfolio will generally be in the lower rating categories of the major rating agencies (BB or lower by Standard & Poor’s (“S&P”) or Ba or lower by Moody’s Investor Services (“Moody’s”) or will be determined by the Portfolio management team to be of similar quality. Split rated bonds will be considered to have the higher credit rating. The Portfolio may invest up to 30% of its assets in non-dollar denominated bonds of issuers located outside of the United States. The Portfolio’s investment in non-dollar denominated bonds may be on a currency hedged or unhedged basis.
To add additional diversification, the management team can invest in a wide range of securities including corporate bonds, mezzanine investments, collateralized bond obligations, bank loans and mortgage-backed and asset-backed securities. The Portfolio can also invest, to the extent consistent with its investment objective, in non-U.S. and emerging market securities and currencies. The Portfolio may invest in securities of any rating, and may invest up to 10% of its assets (measured at the time of investment) in distressed securities that are in default or the issuers of which are in bankruptcy.
The Portfolio may buy or sell options or futures on a security or an index of securities, or enter into credit default swaps and interest rate or foreign currency transactions, including swaps (collectively, commonly known as derivatives). The Portfolio may seek to obtain market exposure to the securities in which it primarily invests by entering into a series of purchase and sale contracts or by using other investment techniques (such as reverse repurchase agreements or dollar rolls).
The Portfolio may engage in active and frequent trading of portfolio securities to achieve its principal investment strategies.
Section 19 Notices
These reported amounts and sources of distributions are estimates and are not being provided for tax reporting purposes. The actual amounts and sources for tax reporting purposes will depend upon each Portfolio’s investment experience during the year and may be subject to changes based on the tax regulations. Each Portfolio will provide a Form 1099-DIV each calendar year that will explain the character of these dividends and distributions for federal income tax purposes.
The Money Market Portfolio distributed $0.000005 per share of gains on the sale of securities on December 28, 2011.
At December 27, 2011, and after giving effect to the Portfolio’s cumulative gain distributions for its fiscal year, the Portfolio has accumulated net realized and unrealized losses of approximately $84. The amount of the Portfolio’s unrealized depreciation of portfolio securities as of that date was $0.
| BLACKROCK SERIES FUND, INC. | DECEMBER 31, 2011 | 117 |
Availability of Quarterly Schedule of Investments
The Portfolios file their complete schedule of portfolio holdings with the SEC for the first and third quarters of each fiscal year on Form N-Q. The Portfolios’ Forms N-Q are available on the SEC’s website at http://www.sec.gov and may also be reviewed and copied at the SEC’s Public Reference Room in Washington, D.C. Information on how to access documents on the SEC’s website may be obtained by calling (800) SEC-0330. The Portfolios’ Forms N-Q may also be obtained upon request and without charge by calling (800) 441-7762.
Availability of Proxy Voting Polices and Procedures
A description of the policies and procedures that the Portfolios use to determine how to vote proxies relating to portfolio securities is available (1) without charge, upon request, by calling (800) 441-7762; (2) at http://www.blackrock.com; and (3) on the SEC’s website at http://www.sec.gov.
Availability of Proxy Voting Record
Information on how the Portfolios voted proxies relating to securities held in the Portfolios’ portfolios during the most recent 12-month period ended June 30 is available upon request and without charge (1) at http://www.blackrock.com or by calling (800) 441-7762 and (2) on the SEC’s website at http://www.sec.gov.
BlackRock Privacy Principles
BlackRock is committed to maintaining the privacy of its current and former fund investors and individual clients (collectively, “Clients”) and to safeguarding their non-public personal information. The following information is provided to help you understand what personal information BlackRock collects, how we protect that information and why in certain cases we share such information with select parties.
If you are located in a jurisdiction where specific laws, rules or regulations require BlackRock to provide you with additional or different privacy-related rights beyond what is set forth below, then BlackRock will comply with those specific laws, rules or regulations.
BlackRock obtains or verifies personal non-public information from and about you from different sources, including the following: (i) information we receive from you or, if applicable, your financial intermediary, on applications, forms or other documents; (ii) information about your transactions with us, our affiliates, or others; (iii) information we receive from a consumer reporting agency; and (iv) from visits to our websites.
BlackRock does not sell or disclose to non-affiliated third parties any non-public personal information about its Clients, except as permitted by law or as is necessary to respond to regulatory requests or to service Client accounts. These non-affiliated third parties are required to protect the confidentiality and security of this information and to use it only for its intended purpose.
We may share information with our affiliates to service your account or to provide you with information about other BlackRock products or services that may be of interest to you. In addition, BlackRock restricts access to non-public personal information about its Clients to those BlackRock employees with a legitimate business need for the information. BlackRock maintains physical, electronic and procedural safeguards that are designed to protect the non-public personal information of its Clients, including procedures relating to the proper storage and disposal of such information.
| 118 | BLACKROCK SERIES FUND, INC. | DECEMBER 31, 2011 |
This report is authorized for distribution only to Policyowners of certain variable life insurance policies, which are funded by shares of BlackRock Series Fund, Inc. This report is not authorized for use as an offer of sale or a solicitation of an offer to buy shares of the Fund or the policies. Past performance results shown in this report should not be considered a representation of future performance. Investment returns and principal value of shares will fluctuate so that shares, when redeemed, may be worth more or less than their original cost. Performance information used throughout this report does not include insurance-related fees and expenses. An investment in BlackRock Money Market Portfolio is not insured or guaranteed by the Federal Deposit Insurance Corporation or any other Government agency. Although BlackRock Money Market Portfolio seeks to preserve the value of your investment at $1.00 per share, it is possible to lose money by investing in the Portfolio. Statements and other information herein are as dated and are subject to change. Please see the Fund’s prospectus for a description of risks associated with global investments.
| 59828-12/11-AR |  |
Item 2 – Code of Ethics – The registrant (or the “Fund”) has adopted a code of ethics, as of the end of the period covered by this report, applicable to the registrant’s principal executive officer, principal financial officer, principal accounting officer or controller, or persons performing similar functions. During the period covered by this report, there have been no amendments to or waivers granted under the code of ethics. A copy of the code of ethics is available without charge at www.blackrock.com.
Item 3 – Audit Committee Financial Expert – The registrant’s board of directors (the “board of directors”), has determined that (i) the registrant has the following audit committee financial experts serving on its audit committee and (ii) each audit committee financial expert is independent:
Robert M. Hernandez
Fred G. Weiss
Stuart E. Eizenstat
Under applicable securities laws, a person determined to be an audit committee financial expert will not be deemed an “expert” for any purpose, including without limitation for the purposes of Section 11 of the Securities Act of 1933, as a result of being designated or identified as an audit committee financial expert. The designation or identification of a person as an audit committee financial expert does not impose on such person any duties, obligations, or liabilities greater than the duties, obligations, and liabilities imposed on such person as a member of the audit committee and board of directors in the absence of such designation or identification.
Item 4 – Principal Accountant Fees and Services
The following table presents fees billed by Deloitte & Touche LLP (“D&T”) in each of the last two fiscal years for the services rendered to the Fund:
| | (a) Audit Fees | (b) Audit-Related Fees1 | (c) Tax Fees2 | (d) All Other Fees3 |
| Entity Name | Current Fiscal Year End | Previous Fiscal Year End | Current Fiscal Year End | Previous Fiscal Year End | Current Fiscal Year End | Previous Fiscal Year End | Current Fiscal Year End | Previous Fiscal Year End |
| BlackRock Balanced Capital Portfolio | $30,900 | $29,900 | $0 | $0 | $14,350 | $8,100 | $0 | $131 |
| BlackRock Capital Appreciation Portfolio | $23,600 | $22,700 | $0 | $0 | $12,350 | $8,100 | $0 | $33 |
| BlackRock Global Allocation Portfolio | $27,500 | $26,200 | $0 | $0 | $29,850 | $8,100 | $0 | $66 |
| BlackRock High Yield Portfolio | $28,000 | $26,700 | $0 | $0 | $8,950 | $8,100 | $0 | $9 |
| BlackRock Large Cap Core Portfolio | $22,600 | $21,700 | $0 | $0 | $12,350 | $8,100 | $0 | $38 |
| BlackRock Money Market Portfolio | $21,300 | $20,400 | $0 | $0 | $9,100 | $8,100 | $0 | $90 |
| BlackRock Total Return Portfolio | $30,000 | $28,700 | $0 | $0 | $13,250 | $8,100 | $0 | $27 |
| BlackRock U.S. Government Bond Portfolio | $37,800 | $36,700 | $0 | $0 | $14,100 | $8,100 | $0 | $43 |
The following table presents fees billed by D&T that were required to be approved by the registrant’s audit committee (the “Committee”) for services that relate directly to the operations or financial reporting of the Fund and that are rendered on behalf of BlackRock Advisors, LLC (“Investment
Adviser” or “BlackRock”) and entities controlling, controlled by, or under common control with BlackRock (not including any sub-adviser whose role is primarily portfolio management and is subcontracted with or overseen by another investment adviser) that provide ongoing services to the Fund (“Fund Service Providers”):
| | Current Fiscal Year End | Previous Fiscal Year End |
| (b) Audit-Related Fees1 | $0 | $0 |
| (c) Tax Fees2 | $0 | $0 |
| (d) All Other Fees3 | $3,030,000 | $2,950,000 |
| 1 | | The nature of the services includes assurance and related services reasonably related to the performance of the audit of financial statements not included in Audit Fees. |
| 2 | | The nature of the services includes tax compliance, tax advice and tax planning. |
| 3 | | Aggregate fees borne by BlackRock in connection with the review of compliance procedures and attestation thereto performed by D&T with respect to all of the registered closed-end funds and some of the registered open-end funds advised by BlackRock.
(e)(1) Audit Committee Pre-Approval Policies and Procedures: |
The Committee has adopted policies and procedures with regard to the pre-approval of services. Audit, audit-related and tax compliance services provided to the registrant on an annual basis require specific pre-approval by the Committee. The Committee also must approve other non-audit services provided to the registrant and those non-audit services provided to the Investment Adviser and Fund Service Providers that relate directly to the operations and the financial reporting of the registrant. Certain of these non-audit services that the Committee believes are (a) consistent with the SEC’s auditor independence rules and (b) routine and recurring services that will not impair the independence of the independent accountants may be approved by the Committee without consideration on a specific case-by-case basis (“general pre-approval”). The term of any general pre-approval is 12 months from the date of the pre-approval, unless the Committee provides for a different period. Tax or other non-audit services provided to the registrant which have a direct impact on the operations or financial reporting of the registrant will only be deemed pre-approved provided that any individual project does not exceed $10,000 attributable to the registrant or $50,000 per project. For this purpose, multiple projects will be aggregated to determine if they exceed the previously mentioned cost levels.
| | Any proposed services exceeding the pre-approved cost levels will require specific pre-approval by the Committee, as will any other services not subject to general pre-approval (e.g., unanticipated but permissible services). The Committee is informed of each service approved subject to general pre-approval at the next regularly scheduled in-person board meeting. At this meeting, an analysis of such services is presented to the Committee for ratification. The Committee may delegate to the Committee Chairman the authority to approve the provision of and fees for any specific engagement of permitted non-audit services, including services exceeding pre-approved cost levels.
(e)(2) None of the services described in each of Items 4(b) through (d) were approved by the Committee pursuant to paragraph (c)(7)(i)(C) of Rule 2-01 of Regulation S-X. |
(f) Not Applicable
(g) The aggregate non-audit fees paid to the accountant for services rendered by the accountant to the registrant, the Investment Adviser and the Fund Service Providers were:
| Entity Name | Current Fiscal Year End | Previous Fiscal Year End |
| BlackRock Balanced Capital Portfolio | $14,350 | $19,008 |
| BlackRock Capital Appreciation Portfolio | $12,350 | $18,910 |
| BlackRock Global Allocation Portfolio | $29,850 | $18,943 |
| BlackRock High Yield Portfolio | $8,950 | $18,886 |
| BlackRock Large Cap Core Portfolio | $12,350 | $18,915 |
| BlackRock Money Market Portfolio | $9,100 | $18,967 |
| BlackRock Total Return Portfolio | $13,250 | $18,904 |
| BlackRock U.S. Government Bond Portfolio | $14,100 | $18,922 |
| | Additionally, SAS No. 70 fees for the current and previous fiscal years of $3,030,000 and $2,950,000, respectively, were billed by D&T to the Investment Adviser. |
(h) The Committee has considered and determined that the provision of non-audit services that were rendered to the Investment Adviser, and the Fund Service Providers that were not pre-approved pursuant to paragraph (c)(7)(ii) of Rule 2-01 of Regulation S-X is compatible with maintaining the principal accountant’s independence.
Item 5 – Audit Committee of Listed Registrants – Not Applicable
Item 6 – Investments
(a) The registrant’s Schedule of Investments is included as part of the Report to Stockholders filed under Item 1 of this Form.
(b) Not Applicable due to no such divestments during the semi-annual period covered since the previous Form N-CSR filing.
Item 7 – Disclosure of Proxy Voting Policies and Procedures for Closed-End Management Investment Companies – Not Applicable
Item 8 – Portfolio Managers of Closed-End Management Investment Companies – Not Applicable
Item 9 – Purchases of Equity Securities by Closed-End Management Investment Company and Affiliated Purchasers – Not Applicable
Item 10 – Submission of Matters to a Vote of Security Holders – There have been no material changes to these procedures.
Item 11 – Controls and Procedures
(a) The registrant’s principal executive and principal financial officers, or persons performing similar functions, have concluded that the registrant’s disclosure controls and procedures (as defined in Rule 30a-3(c) under the Investment Company Act of 1940, as amended (the “1940 Act”)) are effective as of a date within 90 days of the filing of this report based on the evaluation of these controls and procedures required by Rule 30a-3(b) under the 1940 Act and Rule 15d-15(b) under the Securities Exchange Act of 1934, as amended.
(b) – There were no changes in the registrant’s internal control over financial reporting (as defined in Rule 30a-3(d) under the 1940 Act) that occurred during the second fiscal quarter of the period covered by this report that have materially affected, or are reasonably likely to materially affect, the registrant’s internal control over financial reporting.
Item 12 – Exhibits attached hereto
(a)(1) – Code of Ethics – See Item 2
(a)(2) – Certifications – Attached hereto
(a)(3) – Not Applicable
(b) – Certifications – Attached hereto
Pursuant to the requirements of the Securities Exchange Act of 1934 and the Investment Company Act of 1940, the registrant has duly caused this report to be signed on its behalf by the undersigned, thereunto duly authorized.
| BlackRock Series Fund, Inc. |
| | |
| By: | /s/ John M. Perlowski |
| | John M. Perlowski |
| | Chief Executive Officer (principal executive officer) of |
| | BlackRock Series Fund, Inc. |
| | |
| Date: | March 1, 2012 |
| | |
| Pursuant to the requirements of the Securities Exchange Act of 1934 and the Investment Company Act of 1940, this report has been signed below by the following persons on behalf of the registrant and in the capacities and on the dates indicated. |
| | |
| By: | /s/ John M. Perlowski |
| | John M. Perlowski |
| | Chief Executive Officer (principal executive officer) of |
| | BlackRock Series Fund, Inc. |
| | |
| Date: | March 1, 2012 |
| | |
| By: | /s/ Neal J. Andrews |
| | Neal J. Andrews |
| | Chief Financial Officer (principal financial officer) of |
| | BlackRock Series Fund, Inc. |
| | |
| Date: | March 1, 2012 |