UNITED STATES
SECURITIES AND EXCHANGE COMMISSION
Washington, D.C. 20549
FORMN-CSR
CERTIFIED SHAREHOLDER REPORT OF REGISTERED MANAGEMENT
INVESTMENT COMPANIES
Investment Company Act file number:811-03091
Name of Fund: BlackRock Series Fund, Inc.
BlackRock Advantage Large Cap Core Portfolio
BlackRock Balanced Capital Portfolio
BlackRock Capital Appreciation Portfolio
BlackRock Global Allocation Portfolio
BlackRock Government Money Market Portfolio
Fund Address: 100 Bellevue Parkway, Wilmington, DE 19809
Name and address of agent for service: John M. Perlowski, Chief Executive Officer, BlackRock Series Fund, Inc., 55 East 52nd Street, New York, NY 10055
Registrant’s telephone number, including area code: (800)441-7762
Date of fiscal year end: 12/31/2018
Date of reporting period: 12/31/2018
| Item 1 – | Report to Stockholders |
DECEMBER 31, 2018
| | |
ANNUAL REPORT | |  |
BlackRock Series Fund, Inc.
| Ø | | BlackRock Advantage Large Cap Core Portfolio |
| Ø | | BlackRock Balanced Capital Portfolio |
| Ø | | BlackRock Capital Appreciation Portfolio |
| Ø | | BlackRock Global Allocation Portfolio |
| Ø | | BlackRock Government Money Market Portfolio |
BlackRock Series Fund II, Inc.
| Ø | | BlackRock High Yield Portfolio |
| Ø | | BlackRock U.S. Government Bond Portfolio |
|
| Not FDIC Insured • May Lose Value • No Bank Guarantee |
The Markets in Review
Dear Shareholder,
In the 12 months ended December 31, 2018, concerns about a variety of political risks and a modest slowdown in global growth worked against the equity market despite solid corporate earnings, while rising interest rates constrained bond returns. Though the market’s appetite for risk remained healthy for most of the reporting period, risk-taking declined sharply later in the reporting period. As a result, bonds held their value better than stocks, which posted negative returns across the globe. Shorter-term, higher-quality securities led the bond market, and U.S. equities outperformed most international stock markets.
Volatility rose in emerging market stocks, as the rising U.S. dollar and higher interest rates in the U.S. disrupted economic growth abroad. U.S.-China trade relations and debt concerns adversely affected the Chinese stock market, while Turkey and Argentina became embroiled in currency crises, largely due to hyperinflation in both countries. An economic slowdown in Europe also led to negative performance for European equities.
In fixed income markets, short-term U.S. Treasury interest rates rose the fastest, while longer-term rates slightly increased. This led to a negative return for long-term U.S. Treasuries and a substantial flattening of the yield curve. Many investors are concerned with the flattening yield curve as a harbinger of recession. However, given the extraordinary monetary measures in the last decade, we believe a more accurate barometer for the economy is the returns along the risk spectrums in stock and bond markets. Although the fundamentals in credit markets remained relatively solid, investment-grade bonds posted flat returns, and high-yield bonds declined slightly. Recent sell-offs in risk assets have flattened asset returns along the risk spectrum somewhat, which bears further scrutiny in the months ahead.
In response to rising growth and inflation, the U.S. Federal Reserve (the “Fed”) increased short-term interest rates four times during the reporting period. The Fed also continued to reduce its balance sheet, gradually reversing the unprecedented stimulus measures it enacted after the financial crisis. By our estimation, the Fed’s neutral interest rate, or the theoretical rate that is neither stimulative nor restrictive to the economy, is approximately 3.0%. With that perspective, the Fed’s current policy is still mildly stimulative to the U.S. economy, which leaves room for further Fed rate hikes to arrive at monetary policy that is a neutral factor for economic growth.
Volatility in the U.S. equity market spiked in October, as a wide range of risks were brought to bear on markets, ranging from rising interest rates and slowing global growth to heightened trade tensions and political turmoil in several countries, including the United States. This was accompanied by a broad basedrisk-off in December — which was the worst December performance on record since 1931. Although fears of recession drove equity volatility higher at the end of 2018, we continue to believe the probability of recession in 2019 remains relatively low.
Economic growth and global earnings are likely to slow somewhat in 2019 — the tax cut stimulus will be less pronounced, and the Fed’s rate hikes in 2018 will gain traction in 2019. Trade frictions look more baked into asset prices than a year ago, but markets may be overlooking European political risks. Consequently, we are cautious on European equities, as European unity remains tenuous with a history offlare-ups. We continue to prefer to take risk in U.S. and emerging market equities. Within U.S. equities, we believe that companies with high-quality earnings and strong balance sheets offer the most attractive risk/rewardtrade-off. Going into 2019, we also favor short-term bonds over long-term bonds because they offer nearly equivalent yields with far lower volatility.
In this environment, investors need to think globally, extend their scope across a broad array of asset classes, and be nimble as market conditions change. We encourage you to talk with your financial advisor and visitblackrock.com for further insight about investing in today’s markets.
Sincerely,

Rob Kapito
President, BlackRock Advisors, LLC

Rob Kapito
President, BlackRock Advisors, LLC
| | | | |
| Total Returns as of December 31, 2018 |
| | | 6-month | | 12-month |
U.S. large cap equities
(S&P 500® Index) | | (6.85)% | | (4.38)% |
U.S. small cap equities
(Russell 2000® Index) | | (17.35) | | (11.01) |
International equities
(MSCI Europe, Australasia,
Far East Index) | | (11.35) | | (13.79) |
Emerging market equities
(MSCI Emerging Markets Index) | | (8.48) | | (14.57) |
3-month Treasury bills
(ICE BofAML3-Month
U.S. Treasury Bill Index) | | 1.06 | | 1.87 |
U.S. Treasury securities
(ICE BofAML10-Year
U.S. Treasury Index) | | 2.72 | | (0.03) |
U.S. investment grade bonds
(Bloomberg Barclays U.S.
Aggregate Bond Index) | | 1.65 | | 0.01 |
Tax-exempt municipal bonds
(S&P Municipal Bond Index) | | 1.38 | | 1.36 |
U.S. high yield bonds
(Bloomberg Barclays
U.S. Corporate High Yield
2% Issuer Capped Index) | | (2.24) | | (2.08) |
| Past performance is no guarantee of future results. Index performance is shown for illustrative purposes only. You cannot invest directly in an index. |
| | |
| 2 | | THIS PAGEISNOT PARTOF YOUR FUND REPORT |
Table of Contents
| | |
| Fund Summary as of December 31, 2018 | | BlackRock Advantage Large Cap Core Portfolio |
Investment Objective
BlackRock Advantage Large Cap Core Portfolio’s (the “Fund”) investment objective is to seek long-term capital appreciation.
Portfolio Management Commentary
How did the Fund perform?
For the 12-month period ended December 31, 2018, the Fund underperformed its benchmark, the Russell 1000® Index.
What factors influenced performance?
After beginning the year favoring growth stocks and trend-based strategies, investors later reversed course and sold out of more expensive, growth-oriented areas of the market on fears of expensive valuations and of approaching the end of the market cycle. As thesell-off was often disconnected with the broader sentiment of management and market participants, it created a difficult environment for sentiment-based signals and resulted in sentiment insights detracting from relative performance for the period. A signal that gauges company sentiment based on trends in online job postings was the largest detractor for the period. Identifying sentiment based on short positions of hedge funds acted as a drag on performance as well, largely due to significant hedge fundde-risking toward the end of the year. A signal that usesgeo-location data to determine consumer foot traffic patterns into variousbrick-and-mortar locations further detracted. Given a rotation out of growth positions, investors typically flock to pockets of attractive relative valuation. However, as value stocks showed some of the strongest earnings trends heading into the fourth quarter, theysold-off amid the rotation away from growth expectations. As a result, while fundamental signals held up well for the period, an insight that evaluates each stock based on forward sales relative to enterprise value hindered relative performance for the year.
As volatility and concerns about the approaching end of the current cycle increased, investors returned their focus to company fundamentals and to finding quality businesses offering sustainable growth prospects. In this vein, the Fund’s fundamental insights, particularly quality insights, were the primary drivers of positive relative return over the course of the year. Among the portfolio’s fundamental signals, identifying companies with attractive cash flow growth relative to operating assets was the top contributor. Identifying positive dividend growth trends as a measure of quality also proved beneficial. Although the portfolio’s sentiment insights overall were a drag on relative performance, sentiment insights that provide a more quality-based lens into companies contributed positively. Specifically, an insight that gauges sentiment from informed bond investors contributed significantly, given interest rate volatility. Text-based analyses of management conference calls to determine longer-term trends in company fundamentals proved beneficial as well. Both of these signals held up extremely well in the fourth quarter, in a market environment that was generally challenging for trend- and sentiment-based insights. Finally, thematic signals showed mixed results for the period, contributing marginally overall to relative performance.
Describe recent portfolio activity.
Over the course of the period, the portfolio maintained a balanced allocation of risk across all major return drivers. However, a number of new stock selection insights were added to the portfolio. Among these insights, a model that evaluates companies on the basis of governance and the ethics and sustainability of its business practices from a social and environmental perspective was added to the Fund’s bucket of quality signals. In addition, a new insight was added that captures the location of hotel booking trends and invests in related stocks most sensitive to those areas. A new macro thematic model that evaluates industries across various inputs such as labor costs and hiring activity was added as well.
Describe portfolio positioning at period end.
Relative to the Russell 1000® Index, the Fund was positioned essentially neutrally from a sector perspective. The Fund had slight overweight positions in health care and financials and slight underweight positions in communications services and consumer discretionary.
The views expressed reflect the opinions of BlackRock as of the date of this report and are subject to change based on changes in market, economic or other conditions. These views are not intended to be a forecast of future events and are no guarantee of future results.
| | |
| 4 | | 2018 BLACKROCK ANNUAL REPORTTO SHAREHOLDERS |
| | |
| Fund Summary as of December 31, 2018 (continued) | | BlackRock Advantage Large Cap Core Portfolio |
TOTAL RETURN BASED ON A $10,000 INVESTMENT
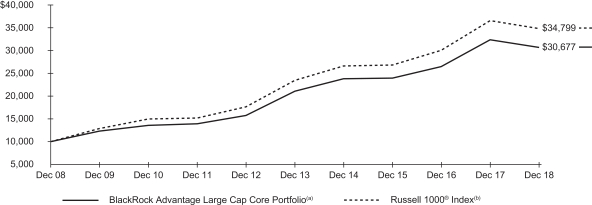
| (a) | Assuming transaction costs and other operating expenses, including investment advisory fees, if any. Does not include insurance-related fees and expenses. Under normal circumstances, the Fund seeks to invest at least 80% of its net assets, plus the amount of any borrowings for investment purposes, in large cap equity securities and derivatives that have similar economic characteristics to such securities. The Fund’s total returns prior to June 12, 2017 are the returns of the Fund when it followed different investment strategies under the name BlackRock Large Cap Core Portfolio. |
| (b) | The index measures the performance of the large cap segment of the U.S. equity universe. It is a subset of the Russell 3000® Index and includes approximately 1,000 of the largest securities based on a combination of their market capitalization and current index membership. The index represents approximately 92% of the total market capitalization of the Russell 3000® Index. |
Performance Summary for the Period Ended December 31, 2018
| | | | | | | | | | | | | | | | | | | | | | | | | | | | |
| | | 6-Month
Total Returns (a) | | | | | | Average Annual Total Returns (a) | |
| | | | | | 1 Year | | | | | | 5 Years | | | | | | 10 Years | |
BlackRock Advantage Large Cap Core Portfolio | | | (8.50 | )% | | | | | | | (5.11 | )% | | | | | | | 7.81 | % | | | | | | | 11.86 | % |
Russell 1000® Index | | | (7.42 | ) | | | | | | | (4.78 | ) | | | | | | | 8.21 | | | | | | | | 13.28 | |
| | (a) | Cumulative and average annual total returns are based on changes in net asset value for the periods shown and assume reinvestment of all distributions at net asset value on theex-dividend date. Insurance-related fees and expenses are not reflected in these returns. The Fund’s total returns prior to June 12, 2017 are the returns of the Fund when it followed different investment strategies under the name BlackRock Large Cap Core Portfolio. | |
Past performance is not indicative of future results. Performance results do not reflect the deduction of taxes that a shareholder would pay on Fund distributions or the redemption of Fund shares.
Performance results may include adjustments made for financial reporting purposes in accordance with U.S. generally accepted accounting principles.
Expense Example
| | | | | | | | | | | | | | | | | | | | | | | | | | | | | | | | |
| | | Actual | | | | | | Hypothetical (a) | | | | |
| | | Beginning
Account Value
(07/01/18) | | | Ending
Account Value
(12/31/18) | | | Expenses
Paid During
the Period (b) | | | | | | Beginning
Account Value
(07/01/18) | | | Ending
Account Value
(12/31/18) | | | Expenses
Paid During
the Period (b) | | | Annualized
Expense
Ratio | |
BlackRock Advantage Large Cap Core Portfolio | | $ | 1,000.00 | | | $ | 915.00 | | | $ | 2.41 | | | | | | | $ | 1,000.00 | | | $ | 1,022.68 | | | $ | 2.55 | | | | 0.50 | % |
| | (a) | Hypothetical 5% annual return before expenses is calculated by prorating the number of days in the most recent fiscal half year divided by 365. | |
| | (b) | Expenses are equal to the Fund’s annualized expense ratio, multiplied by the average account value over the period, multiplied by 184/365 (to reflect theone-half year period shown). | |
See “Disclosure of Expenses” on Page 18 for further information on how expenses were calculated.
| | |
| Fund Summary as of December 31, 2018 (continued) | | BlackRock Advantage Large Cap Core Portfolio |
Portfolio Information
SECTOR ALLOCATION
| | | | |
| Sector | | Percent of
Net Assets | |
Information Technology | | | 20 | % |
Health Care | | | 15 | |
Financials | | | 14 | |
Industrials | | | 10 | |
Consumer Discretionary | | | 10 | |
Communication Services | | | 9 | |
Consumer Staples | | | 6 | |
Energy | | | 5 | |
Real Estate | | | 4 | |
Utilities | | | 4 | |
Materials | | | 2 | |
Short-Term Securities | | | 4 | |
Liabilities in Excess of Other Assets | | | (3 | ) |
|
| For Fund compliance purposes, the Fund’s sector classifications refer to one or more of the sectorsub-classifications used by one or more widely recognized market indexes or ratings group indexes, and/or as defined by the investment adviser. These definitions may not apply for purposes of this report, which may combine sector sub classifications for reporting ease. | |
| | |
| 6 | | 2018 BLACKROCK ANNUAL REPORTTO SHAREHOLDERS |
| | |
| Fund Summary as of December 31, 2018 | | BlackRock Balanced Capital Portfolio |
Investment Objective
BlackRock Balanced Capital Portfolio’s (the “Fund”) investment objective is to seek high total investment return.
Portfolio Management Commentary
How did the Fund perform?
For the12-month period ended December 31, 2018, the Fund returned (2.66)%, underperforming its blended benchmark (60% Russell 1000® Index/40% Bloomberg Barclays U.S. Aggregate Bond Index), which returned (2.59)% for the period. The Russell 1000® Index returned (4.78)%, while the Bloomberg Barclays U.S. Aggregate Bond Index returned 0.01%.
What factors influenced performance?
From an asset allocation perspective, a favorable stance on equities was the primary detractor from performance, namely an overweight position in both Japanese and U.S. equities held during the fourth quarter as global equity markets sold off. The Fund tilted to European equities in the first half of the year, which benefitted performance as a dovish European Central Bank stance boosted equity returns. However, these positive contributions were more than offset by our overweight equity position in the fourth quarter.
Within U.S. equities, sentiment insights detracted from performance for the period. A signal that gauges company sentiment based on trends in online job postings was the largest detractor for the period. Identifying sentiment based on short positions of hedge funds acted as a drag on performance as well, largely due to significant hedge fundde-risking towards the end of the year. A signal that usesgeo-location data to determine consumer foot traffic patterns into variousbrick-and-mortar locations further detracted. While fundamental signals held up well overall, an insight that evaluates each stock based on forward sales relative to enterprise value hindered performance.
Within fixed income, overweight positions to emerging market bonds, corporate credit in Europe and Asia, and U.S. investment grade corporate credit detracted from returns.
From an asset allocation standpoint, the largest positive contributor to performance over the year was an underweight stance with respect to U.S. duration (and corresponding sensitivity to interest rate changes). The duration underweight added significant value as yields moved higher early in 2018. The Fund ultimately closed the position at a profit as the U.S. Federal Reserve hiked rates again in late September.
Within the equity allocation, among the portfolio’s fundamental signals, identifying companies with good growth relative to operating assets was the top contributor. Identifying positive dividend growth trends as a measure of quality also proved beneficial. Although broadly speaking the portfolio’s sentiment insights were a drag on relative performance, an insight that gauges sentiment from informed bond investors contributed significantly, given interest rate volatility. Text-based analyses of management conference calls to determine longer-term trends in company fundamentals proved beneficial as well.
Within fixed income, allocations to securitized assets such asnon-agency mortgage-backed securities (“MBS”) and collateralized loan obligations (“CLOs”) contributed positively to return. Macro investment strategies, duration positioning and an overweight to municipal bonds also added to performance.
The Fund held derivatives primarily in financial futures contracts during the period as part of its investment strategy. Although the positions were small, the contribution to Fund performance was positive. Derivatives are used by the investment adviser as a means to manage risk and/or take outright views on equities, interest rates, credit risk and/or foreign exchange positions.
Describe recent portfolio activity.
From a broad asset allocation perspective, the Fund began the period with a modest preference for stocks over bonds, notably in international developed markets. The Fund reduced the magnitude of its underweight position in U.S. bonds over the period. During the period, the Fund initiated an overweight position in European equities, and closed this position as prices moved higher. The Fund retained a preference for Japanese equities versus U.S. equities. The Fund initiated an overweight position in U.S. equities late in the period on an expectation that continued inflationary pressures would benefit equities. Thesell-off in U.S. equities at the end of 2018 provided an attractive opportunity to add to this overweight, given a belief that market pricing of the growth outlook had become overly pessimistic.
Within U.S. equities, new stock selection insights were added including a model that evaluates companies on the basis of governance as well as the sustainability of their business practices from a social and environmental perspective. Also, a new insight was added that captures the location of hotel booking trends and invests in related stocks most sensitive to those areas.
Within fixed income, an underweight stance with respect to duration and corresponding interest rate sensitivity was maintained early in the period, but reduced as the first quarter of 2018 progressed. The Fund held a constructive view on emerging market bonds early in the period but decreased its allocation in the second quarter. The Fund also became more cautious on corporate credit, while adding exposure to agency MBS and municipal bonds. The Fund continued to favorfront-end Treasuries and securitized assets. During the third quarter, the portfolio moved to overweight duration as the rise in interest rates provided an attractive entry point. During the fourth quarter, the duration overweight was reduced and exposure was increased to sectors expected to benefit from more accommodative monetary policy such as agency MBS and municipal bonds, as well as local currency emerging market debt. The portfolio reduced bank loans in favor of high yield bonds while adding to investment grade credit for high quality income. The Fund took profits on its allocation to securitized assets.
At period end, the Fund held a slightly elevated allocation to cash at 7%. The cash position did not have a material impact on performance results for the period.
| | |
| Fund Summary as of December 31, 2018 (continued) | | BlackRock Balanced Capital Portfolio |
Describe portfolio positioning at period end.
The Fund ended the period with a preference for stocks over bonds, notably in the United States and Japan. Within U.S. equities, the Fund had slight overweight positions in health care and financials and slight underweight positions in communication services and consumer discretionary. Within fixed income, the Fund ended the period with a slightly overweight duration stance and a tilt toward higher quality, more liquid sectors such as agency MBS, investment grade corporate credit and municipals. The Fund maintained a small allocation to emerging market bonds.
The views expressed reflect the opinions of BlackRock as of the date of this report and are subject to change based on changes in market, economic or other conditions.
These views are not intended to be a forecast of future events and are no guarantee of future results.
TOTAL RETURN BASED ON A $10,000 INVESTMENT
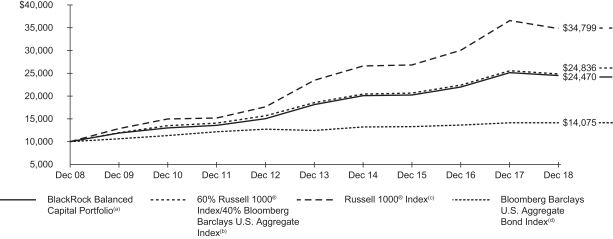
| (a) | Assuming transaction costs and other operating expenses, including investment advisory fees, if any. Does not include insurance-related fees and expenses. The Fund invests in U.S. and foreign equity and fixed income securities of any maturity. |
| (b) | A widely recognized unmanaged market-weighted index comprised of investment-grade corporate bonds rated BBB or better, mortgages and U.S. Treasury and U.S. Government agency issues with at least one year to maturity. |
| (c) | The index measures the performance of the large cap segment of the U.S. equity universe. It is a subset of the Russell 3000® Index and includes approximately 1,000 of the largest securities based on a combination of their market capitalization and current index membership. The index represents approximately 92% of the total market capitalization of the Russell 3000® Index. |
| (d) | The Fund compares its performance to that of a customized weighted index comprised of the returns of the Russell 1000® Index (60%) and Bloomberg Barclays U.S. Aggregate Bond Index (40%). |
Performance Summary for the Period Ended December 31, 2018
| | | | | | | | | | | | | | | | | | | | | | | | | | | | |
| | | 6-Month
Total Returns (a) | | | | | | Average Annual Total Returns (a) | |
| | | | | | 1 Year | | | | | | 5 Years | | | | | | 10 Years | |
BlackRock Balanced Capital Portfolio | | | (4.71 | )% | | | | | | | (2.66 | )% | | | | | | | 6.23 | % | | | | | | | 9.36 | % |
60% Russell 1000® Index/40% Bloomberg Barclays US Aggregate Bond Index | | | (3.67 | ) | | | | | | | (2.59 | ) | | | | | | | 6.07 | | | | | | | | 9.52 | |
Russell 1000® Index | | | (7.42 | ) | | | | | | | (4.78 | ) | | | | | | | 8.21 | | | | | | | | 13.28 | |
Bloomberg Barclays U.S. Aggregate Bond Index | | | 1.65 | | | | | | | | 0.01 | | | | | | | | 2.52 | | | | | | | | 3.48 | |
| | (a) | Cumulative and average annual total returns are based on changes in net asset value for the periods shown and assume reinvestment of all distributions at net asset value on theex-dividend date. Insurance-related fees and expenses are not reflected in these returns. | |
Past performance is not indicative of future results. Performance results do not reflect the deduction of taxes that a shareholder would pay on Fund distributions or the redemption of Fund shares.
Performance results may include adjustments made for financial reporting purposes in accordance with U.S. generally accepted accounting principles.
| | |
| 8 | | 2018 BLACKROCK ANNUAL REPORTTO SHAREHOLDERS |
| | |
| Fund Summary as of December 31, 2018 (continued) | | BlackRock Balanced Capital Portfolio |
Expense Example
| | | | | | | | | | | | | | | | | | | | | | | | | | | | | | | | | | | | | | | | |
| | | Actual | | | | | | Hypothetical (a) | |
| | | | | | | | | Including
interest
expense | | | Excluding
interest
expense | | | | | | | | | Including interest expense | | | Excluding interest expense | |
| | | Beginning
Account Value
(07/01/18) | | | Ending
Account Value
(12/31/18) | | | Expenses
Paid During
the Period (b) | | | Expenses
Paid During
the Period (c) | | | Beginning
Account Value
(07/01/18) | | | | | | Ending
Account Value
(12/31/18) | | | Expenses
Paid During
the Period (b) | | | Ending
Account Value
(12/31/18) | | | Expenses
Paid During
the Period (c) | |
BlackRock Balanced Capital Portfolio | | $ | 1,000.00 | | | $ | 952.90 | | | $ | 2.56 | | | $ | 2.46 | | | $ | 1,000.00 | | | | | | | $ | 1,022.58 | | | $ | 2.65 | | | $ | 1,022.68 | | | $ | 2.55 | |
| | (a) | Hypothetical 5% annual return before expenses is calculated by prorating the number of days in the most recent fiscal half year divided by 365. | |
| | (b) | Expenses are equal to the annualized expense ratio (0.52%), multiplied by the average account value over the period, multiplied by 184/365 (to reflect theone-half year period shown). | |
| | (c) | Expenses are equal to the annualized expense ratio (0.50%), multiplied by the average account value over the period, multiplied by 184/365 (to reflect theone-half year period shown). | |
See “Disclosure of Expenses” on page 18 for further information on how expenses were calculated.
Portfolio Information
PORTFOLIO COMPOSITION
| | | | |
| Asset Type | | Percent of
Total Investments (a) | |
Common Stocks | | | 56 | % |
U.S. Government Sponsored Agency Securities | | | 17 | |
Corporate Bonds | | | 12 | |
U.S. Treasury Obligations | | | 5 | |
Asset-Backed Securities | | | 4 | |
Municipal Bonds | | | 3 | |
Non-Agency Mortgage-Backed Securities | | | 2 | |
Foreign Government Obligations | | | 1 | |
Investment Companies | | | — | (b) |
Capital Trusts | | | — | (b) |
Foreign Agency Obligations | | | — | (b) |
| | (a) | Total Investments exclude short-term securities, options purchased, options written, borrowed bonds, TBA sale commitments andInvestments Sold Short. | |
| | (b) | Representing less than 0.5% of the Fund’s total investments. | |
| | |
| Fund Summary as of December 31, 2018 | | BlackRock Capital Appreciation Portfolio |
Investment Objective
BlackRock Capital Appreciation Portfolio’s (the “Fund”) investment objective is to seek long term growth of capital.
Portfolio Management Commentary
How did the Fund perform?
For the 12-month period ended December 31, 2018, the Fund outperformed its benchmark, the Russell 1000® Growth Index, and the broad market S&P 500® Index. The following discussion of relative performance pertains to the Russell 1000® Growth Index.
What factors influenced performance?
On a sector basis, the largest contributor to relative performance was consumer discretionary where internet & direct marketing retail holdings had the most positive impact. Selection within hotels, restaurants & leisure and a lack of exposure to media also added value within the sector. Health care and industrials were additional sources of strength. Within health care, equipment & supplies and life sciences tools & services holdings drove gains, while positioning to machinery and zero exposure to air freight & logistics benefited performance in industrials.
The top individual contributors were Amazon.com Inc. and Netflix Inc. Amazon outperformed as the company delivered a series of strong earnings reports, with revenue acceleration in North America, International, Prime, Amazon Web Services (“AWS”) and advertising. In addition, Amazon’s operating margin expansion has been notable, driven by advertising, subscription services, AWS and shipping efficiencies. Netflix continued to outperform after a series of strong earnings reports. The company exceeded 23 million global net subscriber additions for 2017 and is on pace to exceed 28 million in 2018, ahead of forecasts.
Conversely, communication services detracted from performance with entertainment holdings hindering results. Consumer staples and materials also weighed on performance. Selection within beverages was a drag in consumer staples, while an overweight to construction materials was a weakness in materials (at period end the Fund had zero exposure to construction materials).
The top detractors over the annual period were Tencent Holdings Ltd. and Constellation Brands Inc. Tencent underperformed amid U.S./China trade tensions, weakness in the Chinese stock market, regulatory uncertainty and questions around timing of game launches and monetization. In addition, data showed a modest decline in Tencent’s share of mobile user time spent. Constellation has underperformed on investor concerns over sales growth for its Mexican import beers and overall beer profit margin growth, as well over reinvestment risk in cannabis and hemp company Canopy Growth. Constellation announced a $4 billion investment in Canopy Growth during the second quarter.
Describe recent portfolio activity.
Due to a combination of portfolio trading activity, market movement and sector reclassifications during the12-month period, the portfolio’s weighting in the communication services sector increased, particularly within entertainment and interactive media & services. Health care exposure also increased, namely within equipment & supplies and pharmaceuticals. Exposure to information technology decreased, largely with respect to internet software & services. Consumer discretionary exposure, namely within specialty retail, declined as well.
Describe portfolio positioning at period end.
As of period end, the Fund’s largest overweight relative to the Russell 1000® Growth Index was the health care sector, followed by communication services. Industrials was the largest sector underweight, followed by consumer staples.
The views expressed reflect the opinions of BlackRock as of the date of this report and are subject to change based on changes in market, economic or other conditions. These views are not intended to be a forecast of future events and are no guarantee of future results.
| | |
| 10 | | 2018 BLACKROCK ANNUAL REPORTTO SHAREHOLDERS |
| | |
| Fund Summary as of December 31, 2018 (continued) | | BlackRock Capital Appreciation Portfolio |
TOTAL RETURN BASED ON A $10,000 INVESTMENT
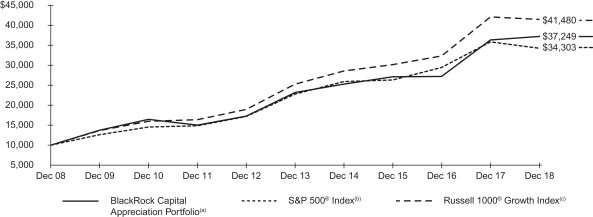
| (a) | Assuming transaction costs and other operating expenses, including investment advisory fees, if any. Does not include insurance-related fees and expenses. The Fund invests primarily in a diversified portfolio consisting primarily of common stock of U.S. companies that the investment adviser believes have exhibited above-average growth rates in earnings over the long term. |
| (b) | This unmanaged index covers 500 leading companies and captures approximately 80% coverage of available market capitalization. |
| (c) | This unmanaged index measures the performance of the large cap growth segment of the U.S. equity universe and consists of those Russell 1000®securities with higherprice-to-book ratios and higher forecasted growth values. |
Performance Summary for the Period Ended December 31, 2018
| | | | | | | | | | | | | | | | | | | | | | | | | | | | |
| | | 6-Month
Total Returns (a) | | | | | | Average Annual Total Returns (a) | |
| | | | | | 1 Year | | | | | | 5 Years | | | | | | 10 Years | |
BlackRock Capital Appreciation Portfolio | | | (10.78 | )% | | | | | | | 2.42 | % | | | | | | | 9.93 | % | | | | | | | 14.05 | % |
S&P 500® Index | | | (6.85 | ) | | | | | | | (4.38 | ) | | | | | | | 8.49 | | | | | | | | 13.12 | |
Russell 1000® Growth Index | | | (8.17 | ) | | | | | | | (1.51 | ) | | | | | | | 10.40 | | | | | | | | 15.29 | |
| | (a) | Cumulative and average annual total returns are based on changes in net asset value for the periods shown and assume reinvestment of all distributions at net asset value on theex-dividend date. Insurance-related fees and expenses are not reflected in these returns. | |
Past performance is not indicative of future results. Performance results do not reflect the deduction of taxes that a shareholder would pay on Fund distributions or the redemption of Fund shares.
Performance results may include adjustments made for financial reporting purposes in accordance with U.S. generally accepted accounting principles.
Expense Example
| | | | | | | | | | | | | | | | | | | | | | | | | | | | | | | | |
| | | Actual | | | | | | Hypothetical (a) | | | | |
| | | Beginning
Account Value
(07/01/18) | | | Ending
Account Value
(12/31/18) | | | Expenses
Paid During
the Period (b) | | | | | | Beginning
Account Value
(07/01/18) | | | Ending
Account Value
(12/31/18) | | | Expenses
Paid During
the Period (b) | | | Annualized
Expense
Ratio | |
BlackRock Capital Appreciation Portfolio | | $ | 1,000.00 | | | $ | 892.20 | | | $ | 2.34 | | | | | | | $ | 1,000.00 | | | $ | 1,022.74 | | | $ | 2.50 | | | | 0.49 | % |
| | (a) | Hypothetical 5% annual return before expenses is calculated by prorating the number of days in the most recent fiscal half year divided by 365. | |
| | (b) | Expenses are equal to the Fund’s annualized expense ratio, multiplied by the average account value over the period, multiplied by 184/365 (to reflect theone-half year period shown). | |
See “Disclosure of Expenses” on Page 18 for further information on how expenses were calculated.
| | |
| Fund Summary as of December 31, 2018 (continued) | | BlackRock Capital Appreciation Portfolio |
Portfolio Information
SECTOR ALLOCATION
| | | | |
| Sector | | Percent of
Net Assets | |
Information Technology | | | 32 | % |
Health Care | | | 19 | |
Consumer Discretionary | | | 16 | |
Communication Services | | | 15 | |
Industrials | | | 6 | |
Financials | | | 5 | |
Consumer Staples | | | 2 | |
Real Estate | | | 2 | |
Materials | | | 1 | |
Short-Term Securities | | | 5 | |
Liabilities in Excess of Other Assets | | | (3 | ) |
|
| For Fund compliance purposes, the Fund’s sector classifications refer to one or more of the sectorsub-classifications used by one or more widely recognized market indexes or ratings group indexes, and/or as defined by the investment adviser. These definitions may not apply for purposes of this report, which may combine sector sub classifications for reporting ease. | |
| | |
| 12 | | 2018 BLACKROCK ANNUAL REPORTTO SHAREHOLDERS |
| | |
| Fund Summary as of December 31, 2018 | | BlackRock Global Allocation Portfolio |
Investment Objective
BlackRock Global Allocation Portfolio’s (the “Fund”) investment objective is to seek high total investment return.
Portfolio Management Commentary
How did the Fund perform?
For the12-month period ended December 31, 2018, the Fund underperformed its Reference Benchmark and outperformed the broad-basedall-equity benchmark, the FTSE World Index. The Reference Benchmark is comprised as follows: 36% S&P 500® Index; 24% FTSE World(ex-U.S.) Index; 24% ICE BofAML Current5-Year U.S. Treasury Index; and 16% FTSENon-US Dollar World Government Bond Index. The Fund invests in both equities and bonds, and therefore, Fund management believes that the Reference Benchmark provides a more accurate representation of the Fund’s composition and a more comparable means for measurement. The following discussion of relative performance pertains to the Reference Benchmark. The following commentary (and referenced allocation percentages) are based on the economic exposures of the Fund, which reflect adjustments for futures, swaps and options (except with respect to fixed income securities), and convertible bonds, and may vary relative to the market value.
What factors influenced performance?
Within equities, the Fund’s overweight to Japan and underweight to the United States detracted from performance. In Europe, exposure to financials negatively influenced returns. From a sector perspective, an overweight to and stock selection within energy weighed on returns, as did stock selection within information technology (“IT”), health care, consumer discretionary, materials and real estate. Broadly speaking, an underweight to fixed income negatively impacted returns. Within fixed income, an overweight stance with respect to U.S. duration (and corresponding sensitivity to interest rate changes) weighed on performance, as did exposure to select emerging market government bonds. Exposure to commodity-related securities detracted as well. In terms of currency management, an overweight to the Indian rupee negatively impacted performance.
Within equities, an overweight to India positively impacted returns. From a sector perspective, overweight positions to health care and technology and underweights to consumer staples, financials and industrials contributed to performance. Stock selection within utilities and industrials was additive. The Fund’s performance also benefited from exposure to cash and cash equivalents. With respect to currency exposure, an underweight to the euro and an overweight to the U.S. dollar contributed to performance.
The Fund uses derivatives, which may include options, futures, swaps, and forward contracts both to seek to enhance returns of the Fund and to hedge (or protect) against adverse movements in currency exchange rates, interest rates, and movements in the securities markets. During the period, the Fund’s use of derivatives detracted from its performance.
Describe recent portfolio activity.
During the12-month period, the Fund’s overall equity allocation decreased from 62% to 58% of net assets. Within equities, the Fund decreased exposure to Europe, notably the United Kingdom, Germany and France, and increased exposure to Canada and Brazil. From a sector perspective, the Fund decreased exposure to IT, financials, industrials and consumer discretionary, and increased exposure to healthcare, consumer staples and communication services.
The Fund’s overall allocation to fixed income increased from 31% to 33% of net assets. Within fixed income, the Fund increased exposure to government bonds and corporate credit.
The Fund’s exposure to commodity-related securities decreased from 4% to 2% of net assets.
Reflecting the above changes, the Fund’s holdings of cash and cash equivalents increased from 3% to 7% of net assets. During the12-month period, the Fund’s cash position helped mitigate portfolio volatility and served as a source of funds for new investments and redemptions.
Describe portfolio positioning at period end.
Relative to its Reference Benchmark, the Fund was underweight in equities and fixed income, and overweight in commodity-related securities and cash. Within equities, the Fund was overweight in Asia and underweight in the United States and Europe. Within Asia, the Fund was overweight in Japan, China and India, and underweight in Australia. Within Europe, the Fund was overweight in the Netherlands and underweight in the United Kingdom, Germany and Switzerland. From a sector perspective, the Fund was overweight in communication services, energy and health care, and was underweight in financials, information technology, industrials and consumer discretionary. Within fixed income, the Fund was underweight in developed market government bonds and overweight in corporate debt. With respect to currency exposure, the Fund was overweight in the U.S. dollar, Indian rupee and Hong Kong dollar, and underweight in the euro, Australian dollar, Swiss franc and British pound.
The views expressed reflect the opinions of BlackRock as of the date of this report and are subject to change based on changes in market, economic or other conditions. These views are not intended to be a forecast of future events and are no guarantee of future results.
| | |
| Fund Summary as of December 31, 2018 (continued) | | BlackRock Global Allocation Portfolio |
TOTAL RETURN BASED ON A $10,000 INVESTMENT
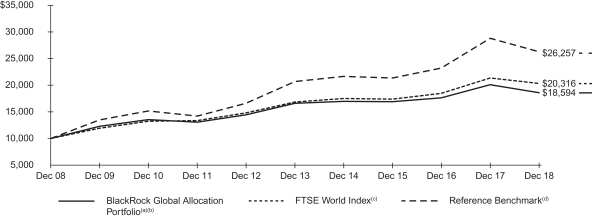
| (a) | Assuming transaction costs, if any, and other operating expenses, including investment advisory fees. Does not include insurance-related fees and expenses. |
| (b) | The Fund invests in a portfolio of U.S. and foreign equity securities, debt and money market securities, the combination of which will be varied from time to time with respect to types of securities and markets in response to changing markets and economic trends. |
| (c) | This unmanaged capitalization-weighted index is comprised of 2,602 equities from 35 countries in 4 regions, including the United States. |
| (d) | The Reference Benchmark is an unmanaged weighted index comprised as follows: 36% S&P 500® Index; 24% FTSE World(ex-U.S.) Index; 24% ICE BofAML Current5-Year U.S. Treasury Index; and 16% FTSENon-U.S. Dollar World Government Bond Index. |
Performance Summary for the Period Ended December 31, 2018
| | | | | | | | | | | | | | | | | | | | | | | | | | | | |
| | | | | | | | | Average Annual Total Returns (a) | |
| | | 6-Month
Total Returns (a) | | | | | | 1 Year | | | | | | 5 Years | | | | | | 10 Years | |
BlackRock Global Allocation Portfolio | | | (5.89 | )% | | | | | | | (7.27 | )% | | | | | | | 2.31 | % | | | | | | | 6.40 | % |
FTSE World Index | | | (8.72 | ) | | | | | | | (8.77 | ) | | | | | | | 4.91 | | | | | | | | 10.13 | |
Reference Benchmark | | | (4.47 | ) | | | | | | | (4.68 | ) | | | | | | | 3.87 | | | | | | | | 7.35 | |
U.S. Stocks: S&P 500 Index(b) | | | (6.85 | ) | | | | | | | (4.38 | ) | | | | | | | 8.49 | | | | | | | | 13.12 | |
Non U.S. Stocks: FTSE World(ex-U.S.) Index(c) | | | (10.68 | ) | | | | | | | (13.81 | ) | | | | | | | 1.08 | | | | | | | | 7.05 | |
U.S. Bonds: ICE BofAML Current5-Year U.S. Treasury Index(d) | | | 2.56 | | | | | | | | 1.46 | | | | | | | | 1.42 | | | | | | | | 2.09 | |
Non U.S. Stocks: FTSE Non U.S. Dollar World Government Bond Index(e) | | | (0.91 | ) | | | | | | | (1.82 | ) | | | | | | | 0.28 | | | | | | | | 1.27 | |
| | (a) | Cumulative and average annual total returns are based on changes in net asset value for the periods shown and assume reinvestment of all distributions at net asset value on theex-dividend date. Insurance-related fees and expenses are not reflected in these returns. | |
| | (b) | This unmanaged index covers 500 leading companies and captures approximately 80% coverage of available market capitalization. | |
| | (c) | This unmanaged capitalization-weighted index comprised of 1,979 equities from 34 countries, excluding the United States. | |
| | (d) | This unmanaged index is designed to track the total return of the current coupon five-year U.S. Treasury bond. | |
| | (e) | This unmanaged market capitalization-weighted index tracks 22 government bond indexes, excluding the United States. | |
Past performance is not indicative of future results. Performance results do not reflect the deduction of taxes that a shareholder would pay on Fund distributions or the redemption of Fund shares.
Performance results may include adjustments made for financial reporting purposes in accordance with U.S. generally accepted accounting principles.
Expense Example
| | | | | | | | | | | | | | | | | | | | | | | | | | | | | | | | | | | | | | | | |
| | | Actual | | | | | | Hypothetical (a) | |
| | | | | | | | | Including
dividend
expense | | | Excluding
dividend
expense | | | | | | | | | Including dividend expense | | | Excluding dividend expense | |
| | | Beginning
Account Value
(07/01/18) | | | Ending
Account Value
(12/31/18) | | | Expenses
Paid During
the Period (b) | | | Expenses
Paid During
the Period (c) | | | | | | Beginning
Account Value
(07/01/18) | | | Ending
Account Value
(12/31/18) | | | Expenses
Paid During
the Period (b) | | | Ending
Account Value
(12/31/18) | | | Expenses
Paid During
the Period (c) | |
BlackRock Global Allocation Portfolio | | $ | 1,000.00 | | | $ | 941.10 | | | $ | 2.84 | | | $ | 2.79 | | | | | | | $ | 1,000.00 | | | $ | 1,022.28 | | | $ | 2.96 | | | $ | 1,022.33 | | | $ | 2.91 | |
| | (a) | Hypothetical 5% annual return before expenses is calculated by prorating the number of days in the most recent fiscal half year divided by 365. | |
| | (b) | Expenses are equal to the annualized expense ratio (0.58%), multiplied by the average account value over the period, multiplied by 184/365 (to reflect theone-half year period shown). | |
| | (c) | Expenses are equal to the annualized expense ratio (0.57%), multiplied by the average account value over the period, multiplied by 184/365 (to reflect theone-half year period shown). | |
See “Disclosure of Expenses” on page 18 for further information on how expenses were calculated.
| | |
| 14 | | 2018 BLACKROCK ANNUAL REPORTTO SHAREHOLDERS |
| | |
| Fund Summary as of December 31, 2018 (continued) | | BlackRock Global Allocation Portfolio |
OVERALL ASSET EXPOSURE
| | | | | | | | | | | | |
| | | Percent of Fund’s
Net Assets (a) | | | Reference
Benchmark (b) Percentage (Open) | |
| Portfolio Composition | | 12/31/2018 | | | 12/31/2017 | |
U.S. Equities | | | 31 | % | | | 32 | % | | | 35 | % |
European Equities | | | 9 | | | | 15 | | | | 12 | |
Asia Pacific Equities | | | 15 | | | | 14 | | | | 10 | |
Other Equities | | | 3 | | | | 1 | | | | 3 | |
| | | | | | | | | | | | |
Total Equities | | | 58 | | | | 62 | | | | 60 | |
| | | | | | | | | | | | |
U.S Dollar Denominated Fixed Income Securities | | | 31 | | | | 22 | | | | 24 | |
U.S. Issuers | | | 29 | | | | 19 | | | | — | |
Non-U.S. Issuers | | | 2 | | | | 3 | | | | — | |
Non-U.S Dollar Denominated Fixed Income Securities | | | 2 | | | | 9 | | | | 16 | |
| | | | | | | | | | | | |
Total Fixed Income Securities | | | 33 | | | | 31 | | | | 40 | |
| | | | | | | | | | | | |
Commodity-Related Securities | | | 2 | | | | 4 | | | | | |
| | | | | | | | | | | | |
Cash & Short-Term Securities | | | 7 | | | | 3 | | | | — | |
| | | | | | | | | | | | |
| | (a) | Exposure based on market value and adjusted for the economic value of futures, swaps and options (except with respect to fixed income securities), and convertible bonds. | |
| | (b) | The Reference Benchmark is an unmanaged weighted index comprised as follows: 36% of the S&P 500 Index®; 24% FTSE World (ex U.S.) Index; 24% ICE BofA Merrill Lynch Current5-Year U.S. Treasury Index; and 16% FTSENon-U.S. Dollar World Government Bond Index. Descriptions of these indexes are found on page 14 of this report to shareholders in the “Performance Summary” section. | |
| | |
| Money Market Overview For the 12-Month Period Ended December 31, 2018 | | BlackRock Government Money Market Portfolio |
Noteworthy market conditions during 2018 included the continued steady removal of monetary accommodation by the Federal Open Market Committee (“FOMC”), the ongoing gradual reduction of the Fed’s balance sheet, increased Treasury bill issuance and various geopolitical events including trade-tariffs, the Italian elections, and Brexit uncertainty. 2018 was generally a strong year for cash as an asset class in terms of return and flows, but a volatile year for the overall financial markets.
The FOMC continued on their path to normalize monetary policy by hiking the federal funds rate four times during 2018, bringing the target range to 2.25%-2.50%. In the final statement of the year released by the FOMC at their December meeting, the FOMC’s assessments of economic growth, labor market conditions, and inflation were largely unchanged. As was generally expected, the “forward guidance” part of their statement was altered to signifying greater emphasis on a more “data dependent” approach to monetary policy. In another significant change, at the last FOMC meeting of the year, the FOMC’s interest rate forecast was revised to reflect just two hikes in 2019 (as compared with three hikes projected in the prior forecast in September). The outlook included one additional hike for 2020, while the median “longer run” rate forecast came down 0.25% to 2.75%.
In an effort to promote trading in the federal funds market at rates that are comfortably within the target range, the interest on overnight excess reserves rate (“IOER”) was raised just 0.20% to 2.40% at the June 2018 meeting. This move was widely viewed as a “technical adjustment” by the FOMC. As was the case with the technical adjustment in June, the FOMC followed the same action in December when they hiked the IOER by 0.20% and the federal funds range by 0.25%. To conclude the year, the Fed’s Summary of Economic Projections was updated to reflect modest declines in the near-term outlook for economic growth, while the unemployment rate was left unchanged.
U.S. Treasury bill supply during the year was robust, hitting record levels for net new issuance of $384 billion. Furthermore in October, the U.S. Treasury introduced the two-month Treasury bill to the market with a $25 billion initial offering while moving the auctions for four-week and eight-week Treasury bills to Thursdays. This move helped the Treasury to ladder maturing debt. Also of note, government agencies issued floating rate notes indexed to the Secured Overnight Financing Rate (“SOFR”), which is a broad measure of the cost of borrowing cash overnight collateralized by Treasury securities, and is the reference rate eventually expected to replace the London Inter-Bank Offered Rate (“LIBOR”). In addition to the agency notes referenced to SOFR, some large financial institutions also issued certificates of deposit and commercial paper linked to this index, and demand for such obligations was generally strong.
Credit spreads were periodically elevated in 2018 for a multitude of reasons including the surge in Treasury bill issuance, a lack of clarity about repatriation related flows early in the year, and bank balance sheet and funding pressures toward the end of the period. For example, credit spreads as evidenced by the three-month LIBOR and overnight indexed swaps widened out to 0.60% in April. This measure later contracted to around 0.17% by early October, before subsequently rising to a high of 0.43% later in the fourth quarter.
In our view, the FOMC’s interest rate normalization campaign appears closer to winding down, although a few additional interest rate hikes remain possible in 2019, subject to further declines in the unemployment rate, upward pressure on inflation, and an easing in financial conditions. That said, we believe the bar for further action has materially risen. We also surmise that the timing of any additional hikes has become less certain and could occur outside of the quarterly meeting cycle that market participants have generally been accustomed to, given the FOMC’s emphasis on “data-dependence.” The implementation of a press conference after every FOMC meeting reinforces to us this possibility. The net new supply of Treasury bills is expected to contract during the first quarter of 2019 as the U.S. Treasury reduces its cash balance in advance of the expiration of the suspension of the debt ceiling in early March. In the event that Congress does not address the debt ceiling in a timely fashion, we anticipate that extraordinary measures would be used to provide additional borrowing authority until around the third quarter of 2019.
Past performance is no guarantee of future results. Index performance is shown for illustrative purposes only. You cannot invest directly in an index.
| | |
| 16 | | 2018 BLACKROCK ANNUAL REPORTTO SHAREHOLDERS |
| | |
| Fund Summary as of December 31, 2018 | | BlackRock Government Money Market Portfolio |
Investment Objective
BlackRock Government Money Market Portfolio’s (the “Fund”) investment objective is to seek to preserve capital, to maintain liquidity and achieve the highest possible current income consistent with the foregoing.
Portfolio Information
PORTFOLIO COMPOSITION
| | | | |
| Asset Type | | Percent of
Net Assets | |
U.S. Government Sponsored Agency Obligations | | | 47 | % |
Repurchase Agreements | | | 38 | |
U.S. Treasury Obligations | | | 11 | |
Other Assets Less Liabilities | | | 4 | |
CURRENTSEVEN-DAY YIELDS
| | | | | | | | |
| | | 7-Day
SEC Yield | | | 7-Day
Yield | |
BlackRock Government Money Market Portfolio | | | 1.99 | % | | | 1.99 | % |
The7-Day SEC Yield may differ from the7-Day Yield shown above due to the fact that the7-Day SEC Yield excludes distributed capital gains.
Past performance is not indicative of future results.
Expense Example
| | | | | | | | | | | | | | | | | | | | | | | | | | | | | | | | |
| | | Actual | | | | | | Hypothetical (a) | | | | |
| | | Beginning
Account Value
(07/01/18) | | | Ending
Account Value
(12/31/18) | | | Expenses
Paid During
the Period (b) | | | | | | Beginning
Account Value
(07/01/18) | | | Ending
Account Value
(12/31/18) | | | Expenses
Paid During
the Period (b) | | | Annualized
Expense
Ratio | |
BlackRock Government Money Market Portfolio | | $ | 1,000.00 | | | $ | 1,008.40 | | | $ | 2.53 | | | | | | | $ | 1,000.00 | | | $ | 1,022.68 | | | $ | 2.55 | | | | 0.50 | % |
| | (a) | Hypothetical 5% annual return before expenses is calculated by prorating the number of days in the most recent fiscal half year divided by 365. | |
| | (b) | Expenses are equal to the Fund’s annualized expense ratio, multiplied by the average account value over the period, multiplied by 184/365 (to reflect theone-half year period shown). | |
See “Disclosure of Expenses” on page 18 for further information on how expenses were calculated.
| | |
| Fund Summary as of December 31, 2018 | | BlackRock High Yield Portfolio |
Investment Objective
BlackRock High Yield Portfolio’s (the “Fund”) investment objective is to seek to maximize total return, consistent with income generation and prudent investment management.
Portfolio Management Commentary
How did the Fund perform?
During the12-month period ended December 31, 2018, the Fund underperformed the benchmark, the Bloomberg Barclays U.S. Corporate High Yield 2% Issuer Capped Index.
What factors influenced performance?
The past year was a challenging time for the high yield market. After producing a modest gain through the end of September, the index declined 5.10% in the fourth quarter due to the combination of slowing economic growth, falling oil prices and heightened investor risk aversion. The index closed the year with a loss of 2.08% as a result.
Security selection in the wireless, independent energy and metals & mining industries detracted from Fund performance. Security selection in thenot-rated segment of the market, as well as an overweight allocation to CCC rated positions detracted, as well. Tactical allocations to equities and floating rate loan interests (“bank loans”) also detracted, largely due to their poor returns in the fourth quarter.
Security selection in the gaming and oilfield services contributed to performance, as did an underweight position in the midstream energy sector. Security selection in BB and B rated bonds also added value.
At period end, the Fund had a slightly above average cash balance. The cash balance did not have a material impact on Fund performance.
Describe recent portfolio activity.
The Fund actively managed risk throughout the annual period and ended the year with a beta of slightly less than 1.0. (Beta measures a security’s sensitivity to the movements of the market as a whole. A beta of greater than one indicates more volatility than the market, while a beta of less than one indicates lower volatility.)
The Fund added to its weighting in bank loans on the belief that these senior, secured assets provide attractive income with minimal interest-rate risk. The Fund held a steady credit positioning over the course of the year, with underweight positions in BB rated issues and overweights in the B and CCC credit tiers. The Fund maintained an underweight in consumer cyclicals on the belief that the industry faces fundamental headwinds. The portfolio was slightly underweight in energy, with a preference for the independent energy industry.
Describe portfolio positioning at period end.
The Fund’s general investment themes and core positions reflected the investment adviser’s views regarding issuer cash flows, firm or industry catalysts, and idiosyncratic factors.
The Fund was underweight in the market’s “tails” — both the higher-yielding segment that contains a larger concentration of stressed assets, as well as the portion that features higher quality and lower yields. With that said, the Fund maintained a position in select CCC rated issues with improving credit positions and/or attractive yields.
At the industry level, the Fund’s largest overweight positions were in technology, wireless and chemicals. Conversely, the Fund was underweight in the retail, automotive and consumer products industries. The Fund had an approximately 15% weighting in bank loans, coupled with smaller allocations to both preferred and common stocks.
The views expressed reflect the opinions of BlackRock as of the date of this report and are subject to change based on changes in market, economic or other conditions.
These views are not intended to be a forecast of future events and are no guarantee of future results.
| | |
| 18 | | 2018 BLACKROCK ANNUAL REPORTTO SHAREHOLDERS |
| | |
| Fund Summary as of December 31, 2018 (continued) | | BlackRock High Yield Portfolio |
TOTAL RETURN BASED ON A $10,000 INVESTMENT
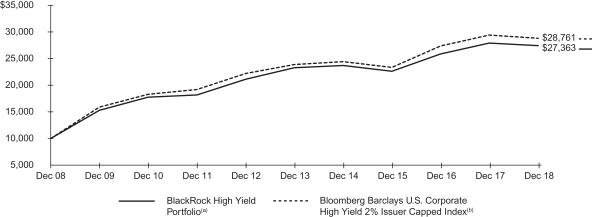
| (a) | Assuming transaction costs and other operating expenses, including investment advisory fees, if any. Does not include insurance-related fees and expenses. The Fund invests primarily innon-investment grade bonds with maturities of ten years or less. On September 17, 2018, the Fund acquired all the assets, subject to the liabilities of BlackRock High Yield Portfolio (the “Predecessor Fund”), a series of BlackRock Series Fund, Inc., through a tax-free reorganization (the “Reorganization”). The Predecessor Fund is the performance and accounting survivor of the Reorganization. The Fund’s total returns prior to October 1, 2011 are the returns of the Predecessor Fund when it followed a different investment objective and different investment strategies under the name “BlackRock High Income Portfolio”. |
| (b) | This unmanaged index is comprised of issues that meet the following criteria: at least $150 million par value outstanding; maximum credit rating of Ba1; at least one year to maturity; and no issuer represents more than 2% of the index. |
Performance Summary for the Period Ended December 31, 2018
| | | | | | | | | | | | | | | | | | | | | | | | | | | | |
| | | Standardized
30-Day Yield (b) | | | Unsubsidized
30-Day Yield (b) | | | 6-Month Total Returns (a) | | | | | | Average Annual Total Returns (a) | |
| | | | | | 1 Year | | | 5 Years | | | 10 Years | |
BlackRock High Yield Portfolio | | | 7.04 | % | | | 5.54 | % | | | (3.00 | )% | | | | | | | (2.31 | )% | | | 3.23 | % | | | 10.59 | % |
Bloomberg Barclays U.S. Corporate High Yield 2% Issuer Capped Index | | | — | | | | — | | | | (2.24 | ) | | | | | | | (2.08 | ) | | | 3.84 | | | | 11.14 | |
| | (a) | Cumulative and average annual total returns are based on changes in net asset value for the periods shown and assume reinvestment of all distributions at net asset value on theex-dividend/payable date. Insurance-related fees and expenses are not reflected in these returns. On September 17, 2018, the Fund acquired the assets, subject to the liabilities of BlackRock High Yield Portfolio (the “Predecessor Fund”), a series of BlackRock Series Fund, Inc., through a tax-free reorganization (the “Reorganization”). The Predecessor Fund is the performance and accounting survivor of the Reorganization. The Fund’s total returns prior to October 1, 2011 are the returns of the Predecessor Fund when it followed a different investment objective and different investment strategies under the name “BlackRock High Income Portfolio”. | |
| | (b) | The standardized30-day yield includes the effects of any waivers and/or reimbursements. The unsubsidized30-day yield excludes the effects of any waivers and/or reimbursements. | |
Past performance is not indicative of future results. Performance results do not reflect the deduction of taxes that a shareholder would pay on Fund distributions or the redemption of Fund shares.
Performance results may include adjustments made for financial reporting purposes in accordance with U.S. generally accepted accounting principles.
Expense Example
| | | | | | | | | | | | | | | | | | | | | | | | | | | | | | | | |
| | | Actual | | | | | | Hypothetical (a) | | | | |
| | | Beginning
Account Value
(07/01/18) | | | Ending
Account Value
(12/31/18) | | | Expenses
Paid During
the Period (b) | | | | | | Beginning
Account Value
(07/01/18) | | | Ending Account Value
(12/31/18) | | | Expenses
Paid During
the Period (b) | | | Annualized
Expense Ratio | |
BlackRock High Yield Portfolio | | $ | 1,000.00 | | | $ | 970.00 | | | $ | 2.48 | | | | | | | $ | 1,000.00 | | | $ | 1,022.68 | | | $ | 2.55 | | | | 0.50 | % |
| | (a) | Hypothetical 5% annual return before expenses is calculated by prorating the number of days in the most recent fiscal half year divided by 365. | |
| | (b) | Expenses are equal to the Fund’s annualized expense ratio, multiplied by the average account value over the period, multiplied by 184/365 (to reflect theone-half year period shown). | |
See “Disclosure of Expenses” on page 18 for further information on how expenses were calculated.
| | |
| Fund Summary as of December 31, 2018 (continued) | | BlackRock High Yield Portfolio |
Portfolio Information
CREDIT QUALITY ALLOCATION
| | | | |
| Credit Rating (a) | | Percent of Total Investments (b) | |
BBB/Baa | | | 6 | % |
BB/Ba | | | 35 | |
B | | | 46 | |
CCC/Caa | | | 10 | |
NR | | | 3 | |
| | (a) | For financial reporting purposes, credit quality ratings shown above reflect the highest rating assigned by either S&P Global Ratings or Moody’s Investors Service if ratings differ. These rating agencies are independent, nationally recognized statistical rating organizations and are widely used. Investment grade ratings are credit ratings of BBB/Baa or higher. Below investment grade ratings are credit ratings of BB/Ba or lower. Investments designated N/R are not rated by either rating agency. Unrated investments do not necessarily indicate low credit quality. Credit quality ratings are subject to change. | |
| | (b) | Total investments exclude short-term securities. | |
| | |
| 20 | | 2018 BLACKROCK ANNUAL REPORTTO SHAREHOLDERS |
| | |
| Fund Summary as of December 31, 2018 | | BlackRock U.S. Government Bond Portfolio |
Investment Objective
BlackRock U.S. Government Bond Portfolio’s (the “Fund”) investment objective is to seek to maximize total return, consistent with income generation and prudent investment management.
Portfolio Management Commentary
How did the Fund perform?
For the12-month period ended December 31, 2018, the Fund underperformed its benchmark, the Bloomberg Barclays U.S. Government/Mortgage Index.
What factors influenced performance?
The largest detractors from performance relative to the benchmark included an allocation to Treasury inflation protected securities. Security selection within30-year agency mortgage-backed securities (“MBS”) and the Fund’s underweighting of15-year agency MBS also weighed on the Fund’s return.
Positive contributors to performance relative to the benchmark included the Fund’s stance with respect to U.S. interest rates. A below-benchmark stance with respect to duration (and corresponding interest rate sensitivity) aided return as rates rose. In addition, the Fund’s positioning along the U.S. Treasury yield curve added to performance. Allocations to securitized sectors including commercial mortgage-backed securities (“CMBS”), agency collateralized mortgage obligations (“CMOs”) and senior floating rate collateralized loan obligations (“CLOs”) also contributed positively. These segments continued to benefit from favorable fundamentals around the U.S. consumer, housing and commercial real estate. The Fund’s strategies with respect to both global interest rates and currencies added to relative performance as well.
Describe recent portfolio activity.
During the12-month period, the Fund decreased its allocation to U.S. government securities, while adding exposures in agency MBS, primarily in pass-throughs with a smaller increase to CMOs. The Fund kept itsout-of-benchmark allocation to securitized assets roughly unchanged during the period, adding some exposures in CMBS while trimming exposures in CLOs. The Fund maintained an underweight stance with respect to duration, with the degree of underweight decreasing over the period.
The Fund held a small percentage of assets in derivatives including options and futures contracts as a means to manage risk to allocations in MBS and securitized assets. The Fund’s use of derivatives provided a positive return to Fund performance.
Describe portfolio positioning at period end.
At period end, the Fund was slightly underweight in agency MBS relative to the benchmark, with exposures continuing to favor higher coupons relative to lower coupons, given valuations that appeared attractive relative to the underlying fundamentals. The Fund continued to hold a core allocation to agency CMBS and CMOs for carry (incremental income), while pursuing an increased allocation to CMBS owing to attractive valuations versus low coupon MBS. The Fund was modestly short U.S. duration. Outside of the United States, the Fund was tactically short at thelong-end of the German yield curve in anticipation of a heavy January supply calendar. The Fund was also positioned with a short real rate position in the United Kingdom on the belief that the market was pricing an overly negative outcome from Brexit negotiations. Lastly, the Fund had a short position in the middle of the Japanese curve on the view that valuations for that segment were stretched.
The views expressed reflect the opinions of BlackRock as of the date of this report and are subject to change based on changes in market, economic or other conditions.
These views are not intended to be a forecast of future events and are no guarantee of future results.
Portfolio Information
PORTFOLIO COMPOSITION
| | | | |
| Asset Type | | Percent of
Total Investments (a) | |
U.S. Government Sponsored Agency Securities | | | 61 | % |
U.S. Treasury Obligations | | | 35 | |
Asset-Backed Securities | | | 2 | |
Non-Agency Mortgage-Backed Securities | | | 2 | |
Foreign Government Obligations | | | | —(b) |
| | (a) | Total investments exclude short-term securities, options purchased, options written and TBA sale commitments. | |
| | (b) | Representing less than 0.5% of the Fund’s total long investments. | |
| | |
| Fund Summary as of December 31, 2018 (continued) | | BlackRock U.S. Government Bond Portfolio |
TOTAL RETURN BASED ON A $10,000 INVESTMENT
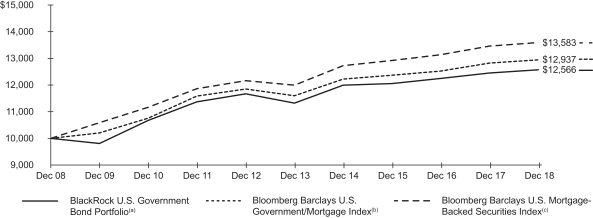
| (a) | Assuming transaction costs and other operating expenses, including investment advisory fees, if any. Does not include insurance-related fees and expenses. The Fund, under normal circumstances, will invest at least 80% of its assets in bonds that are issued or guaranteed by the U.S. Government and its agencies. On September 17, 2018, the Fund acquired all of the assets, subject to the liabilities, of BlackRock U.S. Government Bond Portfolio (the “Predecessor Fund”), a series of BlackRock Series Fund, Inc., through a tax-free reorganization (the “Reorganization”). The Predecessor Fund is the performance and accounting survivor of the Reorganization. The Predecessor Fund’s total returns prior to October 1, 2011 are the returns of the Fund when it followed a different investment objective and different investment strategies under the name “BlackRock Government Income Portfolio.” |
| (b) | This index measures debt issued by the U.S. Government, and its agencies, as well as mortgage-backed pass-through securities of Ginnie Mae, Fannie Mae and Freddie Mac. |
| (c) | This unmanaged index includes the mortgage-backed pass-through securities of Ginnie Mae, Fannie Mae and Freddie Mac that meet certain maturity and liquidity criteria. |
Performance Summary for the Period Ended December 31, 2018
| | | | | | | | | | | | | | | | | | | | | | | | | | | | |
| | | Standardized
30-Day Yield (b) | | | Unsubsidized
30-Day Yield (b) | | | 6-Month
Total Returns (a) | | | | | | Average Annual Total Returns (a) | |
| | | | | | 1 Year | | | 5 Years | | | 10 Years | |
BlackRock U.S. Government Bond Portfolio | | | 2.72 | % | | | 2.15 | % | | | 1.46 | % | | | | | | | 0.77 | % | | | 2.09 | % | | | 2.31 | % |
Bloomberg Barclays U.S. Government/Mortgage Index | | | — | | | | — | | | | 1.96 | | | | | | | | 0.93 | | | | 2.22 | | | | 2.61 | |
Bloomberg Barclays U.S. Mortgage-Backed Securities Index | | | — | | | | — | | | | 1.96 | | | | | | | | 0.99 | | | | 2.53 | | | | 3.11 | |
| | (a) | Cumulative and average annual total returns are based on changes in net asset value for the periods shown and assume reinvestment of all distributions at net asset value on theex-dividend/payable date. Insurance-related fees and expenses are not reflected in these returns. On September 17, 2018, the Fund acquired all of the assets, subject to the liabilities, of BlackRock U.S. Government Bond Portfolio (the “Predecessor Fund”), a series of BlackRock Series Fund, Inc., through a tax-free reorganization (the “Reorganization”). The Predecessor Fund is the performance and accounting survivor of the Reorganization. The Predecessor Fund’s total returns prior to October 1, 2011 are the returns of the Fund when it followed a different investment objective and different investment strategies under the name “BlackRock Government Income Portfolio.” | |
| | (b) | The standardized30-day yield includes the effects of any waivers and/or reimbursements. The unsubsidized30-day yield excludes the effects of any waivers and/or reimbursements | |
Past performance is not indicative of future results. Performance results do not reflect the deduction of taxes that a shareholder would pay on Fund distributions or the redemption of Fund shares.
Performance results may include adjustments made for financial reporting purposes in accordance with U.S. generally accepted accounting principles.
Expense Example
| | | | | | | | | | | | | | | | | | | | | | | | | | | | | | | | | | | | | | | | |
| | | Actual | | | | | | Hypothetical (a) | |
| | | | | | | | | Including
Interest
Expense | | | Excluding
Interest
Expense | | | | | | | | | Including
Interest
Expense | | | Excluding
Interest
Expense | |
| | | Beginning
Account Value
(07/01/18) | | | Ending
Account Value
(12/31/18) | | | Expenses
Paid During
the Period (b) | | | Expenses
Paid During
the Period (c) | | | | | | Beginning
Account Value
(07/01/18) | | | Ending
Account Value
(12/31/18) | | | Expenses
Paid During
the Period (b) | | | Ending
Account Value
(12/31/18) | | | Expenses
Paid During
the Period (c) | |
BlackRock U.S. Government Bond Portfolio | | $ | 1,000.00 | | | $ | 1,014.60 | | | $ | 5.08 | | | $ | 2.54 | | | | | | | $ | 1,000.00 | | | $ | 1,020.16 | | | $ | 5.09 | | | $ | 1,022.68 | | | $ | 2.55 | |
| | (a) | Hypothetical 5% annual return before expenses is calculated by prorating the number of days in the most recent fiscal half year divided by 365. | |
| | (b) | Expenses are equal to the annualized expense ratio (1.00%), multiplied by the average account value over the period, multiplied by 184/365 (to reflect theone-half year period shown). | |
| | (c) | Expenses are equal to the annualized expense ratio (0.50%), multiplied by the average account value over the period, multiplied by 184/365 (to reflect theone-half year period shown). | |
See “Disclosure of Expenses” on page 18 for further information on how expenses were calculated.
| | |
| 22 | | 2018 BLACKROCK ANNUAL REPORTTO SHAREHOLDERS |
The Benefits and Risks of Leveraging
The Funds may utilize leverage to seek to enhance returns and net asset value (“NAV”). However, there is no guarantee that these objectives can be achieved in all interest rate environments.
The Funds may utilize leverage by entering into reverse repurchase agreements.
In general, the concept of leveraging is based on the premise that the financing cost of leverage, which is based on short-term interest rates, is normally lower than the income earned by each Fund on its longer-term portfolio investments purchased with the proceeds from leverage. To the extent that the total assets of each Fund (including the assets obtained from leverage) are invested in higher-yielding portfolio investments, the Funds’ shareholders benefit from the incremental net income.
The interest earned on securities purchased with the proceeds from leverage is distributed to the Funds’ shareholders, and the value of these portfolio holdings is reflected in the Funds’ per share NAV. However, in order to benefit shareholders, the return on assets purchased with leverage proceeds must exceed the ongoing costs associated with the leverage. If interest and other ongoing costs of leverage exceed a Fund’s return on assets purchased with leverage proceeds, income to shareholders is lower than if the Funds had not used leverage.
Furthermore, the value of each Fund’s portfolio investments generally varies inversely with the direction of long-term interest rates, although other factors can also influence the value of portfolio investments. As a result, changes in interest rates can influence each Fund’s NAV positively or negatively in addition to the impact on each Fund’s performance from leverage. Changes in the direction of interest rates are difficult to predict accurately, and there is no assurance that a Fund’s leveraging strategy will be successful.
The use of leverage also generally causes greater changes in each Fund’s NAV and dividend rates than comparable portfolios without leverage. In a declining market, leverage is likely to cause a greater decline in the NAV of a Fund’s shares than if the Fund were not leveraged. In addition, each Fund may be required to sell portfolio securities at inopportune times or at distressed values in order to comply with regulatory requirements applicable to the use of leverage or as required by the terms of the leverage instruments, which may cause the Funds to incur losses. The use of leverage may limit a Fund’s ability to invest in certain types of securities or use certain types of hedging strategies. Each Fund incurs expenses in connection with the use of leverage, all of which are borne by each Fund’s shareholders and may reduce income.
Disclosure of Expenses
Shareholders of the Funds may incur the following charges: (a) transactional expenses, and (b) operating expenses, including investment advisory fees, service and distribution fees, including12b-1 fees, acquired fund fees and expenses, and other fund expenses. The expense examples on the previous pages (which are based on a hypothetical investment of $1,000 invested on July 1, 2018 and held through December 31, 2018) are intended to assist shareholders both in calculating expenses based on an investment in each Fund and in comparing these expenses with similar costs of investing in other mutual funds.
The expense examples provide information about actual account values and actual expenses. In order to estimate the expenses a shareholder paid during the period covered by this report, shareholders can divide their account value by $1,000 and then multiply the result by the number corresponding to their Fund under the headings entitled “Expenses Paid During the Period.”
The expense examples also provide information about hypothetical account values and hypothetical expenses based on a Fund’s actual expense ratio and an assumed rate of return of 5% per year before expenses. In order to assist shareholders in comparing the ongoing expenses of investing in these Funds and other funds, compare the 5% hypothetical example with the 5% hypothetical examples that appear in shareholder reports of other funds.
The expenses shown in the expense examples are intended to highlight shareholders’ ongoing costs only and do not reflect any transactional expenses, such as sales charges, if any. Therefore, the hypothetical examples are useful in comparing ongoing expenses only, and will not help shareholders determine the relative total expenses of owning different funds. If these transactional expenses were included, shareholder expenses would have been higher.
Derivative Financial Instruments
The Funds may invest in various derivative financial instruments. These instruments are used to obtain exposure to a security, commodity, index, market, and/or other assets without owning or taking physical custody of securities, commodities and/or other referenced assets or to manage market, equity, credit, interest rate, foreign currency exchange rate, commodity and/or other risks. Derivative financial instruments may give rise to a form of economic leverage and involve risks, including the imperfect correlation between the value of a derivative financial instrument and the underlying asset, possible default of the counterparty to the transaction or illiquidity of the instrument. The Funds’ successful use of a derivative financial instrument depends on the investment adviser’s ability to predict pertinent market movements accurately, which cannot be assured. The use of these instruments may result in losses greater than if they had not been used, may limit the amount of appreciation a Fund can realize on an investment and/or may result in lower distributions paid to shareholders. The Funds’ investments in these instruments, if any, are discussed in detail in the Notes to Financial Statements.
| | | | |
| THE BENEFITSAND RISKSOF LEVERAGING / DISCLOSUREOF EXPENSES / DERIVATIVE FINANCIAL INSTRUMENTS | | | 23 | |
| | |
Schedule of Investments December 31, 2018 | | BlackRock Advantage Large Cap Core Portfolio (Percentages shown are based on Net Assets) |
| | | | | | | | |
| Security | | Shares | | | Value | |
|
Common Stocks — 98.8% | |
| |
| Aerospace & Defense — 2.3% | | | | |
Boeing Co. (The) | | | 4,096 | | | $ | 1,320,960 | |
General Dynamics Corp. | | | 1,270 | | | | 199,656 | |
Lockheed Martin Corp. | | | 1,794 | | | | 469,741 | |
Raytheon Co.(a) | | | 11,745 | | | | 1,801,096 | |
| | | | | | | | |
| | | | | | | 3,791,453 | |
| |
| Airlines — 0.4% | | | | |
Delta Air Lines, Inc. | | | 3,349 | | | | 167,115 | |
Southwest Airlines Co. | | | 11,940 | | | | 554,971 | |
| | | | | | | | |
| | | | | | | 722,086 | |
| |
| Auto Components — 0.1% | | | | |
BorgWarner, Inc. | | | 2,911 | | | | 101,128 | |
| | | | | | | | |
| |
| Automobiles — 0.1% | | | | |
Ford Motor Co. | | | 9,563 | | | | 73,157 | |
General Motors Co. | | | 3,083 | | | | 103,126 | |
| | | | | | | | |
| | | | | | | 176,283 | |
| |
| Banks — 5.7% | | | | |
Bank of America Corp. | | | 128,879 | | | | 3,175,579 | |
BB&T Corp. | | | 17,349 | | | | 751,559 | |
Citigroup, Inc. | | | 14,671 | | | | 763,772 | |
Citizens Financial Group, Inc. | | | 25,358 | | | | 753,893 | |
Cullen/Frost Bankers, Inc. | | | 917 | | | | 80,641 | |
East West Bancorp, Inc. | | | 4,890 | | | | 212,862 | |
First Republic Bank(a) | | | 8,633 | | | | 750,208 | |
JPMorgan Chase & Co. | | | 16,791 | | | | 1,639,137 | |
Wells Fargo & Co. | | | 24,926 | | | | 1,148,590 | |
| | | | | | | | |
| | | | | | | 9,276,241 | |
| |
| Beverages — 1.5% | | | | |
Coca-Cola European Partners plc | | | 10,469 | | | | 480,004 | |
Constellation Brands, Inc., Class A | | | 1,935 | | | | 311,187 | |
Keurig Dr. Pepper, Inc. | | | 1,218 | | | | 31,229 | |
Molson Coors Brewing Co., Class B | | | 1,186 | | | | 66,606 | |
Monster Beverage Corp.(b) | | | 7,677 | | | | 377,862 | |
PepsiCo, Inc. | | | 10,182 | | | | 1,124,907 | |
| | | | | | | | |
| | | | | | | 2,391,795 | |
| |
| Biotechnology — 4.0% | | | | |
AbbVie, Inc. | | | 15,335 | | | | 1,413,734 | |
Amgen, Inc. | | | 6,672 | | | | 1,298,838 | |
Biogen, Inc.(b) | | | 1,069 | | | | 321,683 | |
Celgene Corp.(b) | | | 16,353 | | | | 1,048,064 | |
Genomic Health, Inc.(b) | | | 1,083 | | | | 69,756 | |
Gilead Sciences, Inc. | | | 28,413 | | | | 1,777,233 | |
Incyte Corp.(b) | | | 588 | | | | 37,391 | |
Regeneron Pharmaceuticals, Inc.(b) | | | 347 | | | | 129,604 | |
Vertex Pharmaceuticals, Inc.(b) | | | 1,922 | | | | 318,495 | |
| | | | | | | | |
| | | | | | | 6,414,798 | |
| |
| Building Products — 0.3% | | | | |
Allegion plc | | | 5,667 | | | | 451,717 | |
| | | | | | | | |
| |
| Capital Markets — 3.4% | | | | |
Charles Schwab Corp. (The) | | | 37,301 | | | | 1,549,110 | |
CME Group, Inc.(a) | | | 4,130 | | | | 776,936 | |
Evercore, Inc., Class A | | | 1,621 | | | | 115,999 | |
Moelis & Co., Class A | | | 8,574 | | | | 294,774 | |
Morgan Stanley | | | 52,526 | | | | 2,082,656 | |
S&P Global, Inc. | | | 3,774 | | | | 641,354 | |
SEI Investments Co. | | | 451 | | | | 20,836 | |
TD Ameritrade Holding Corp.(a) | | | 398 | | | | 19,486 | |
| | | | | | | | |
| | | | | | | 5,501,151 | |
| | | | | | | | |
| Security | | Shares | | | Value | |
| |
| Chemicals — 1.7% | | | | |
Air Products & Chemicals, Inc. | | | 9,508 | | | $ | 1,521,755 | |
Celanese Corp.(a) | | | 4,531 | | | | 407,654 | |
Eastman Chemical Co. | | | 3,626 | | | | 265,097 | |
Ecolab, Inc. | | | 2,687 | | | | 395,930 | |
Huntsman Corp. | | | 954 | | | | 18,403 | |
Linde plc | | | 944 | | | | 147,302 | |
Mosaic Co. (The) | | | 573 | | | | 16,737 | |
| | | | | | | | |
| | | | | | | 2,772,878 | |
| |
| Commercial Services & Supplies — 0.2% | | | | |
Clean Harbors, Inc.(b) | | | 4,246 | | | | 209,540 | |
Waste Connections, Inc. | | | 739 | | | | 54,871 | |
| | | | | | | | |
| | | | | | | 264,411 | |
| |
| Communications Equipment — 1.1% | | | | |
Ciena Corp.(b) | | | 6,226 | | | | 211,124 | |
Cisco Systems, Inc. | | | 23,674 | | | | 1,025,794 | |
Motorola Solutions, Inc. | | | 3,189 | | | | 366,863 | |
Palo Alto Networks, Inc.(a)(b) | | | 721 | | | | 135,800 | |
| | | | | | | | |
| | | | | | | 1,739,581 | |
| |
| Construction Materials — 0.1% | | | | |
Martin Marietta Materials, Inc. | | | 339 | | | | 58,264 | |
Vulcan Materials Co. | | | 288 | | | | 28,454 | |
| | | | | | | | |
| | | | | | | 86,718 | |
| |
| Consumer Finance — 0.8% | | | | |
American Express Co. | | | 12,260 | | | | 1,168,623 | |
Capital One Financial Corp. | | | 1,482 | | | | 112,025 | |
| | | | | | | | |
| | | | | | | 1,280,648 | |
| |
| Containers & Packaging — 0.3% | | | | |
Packaging Corp. of America | | | 3,307 | | | | 276,002 | |
WestRock Co. | | | 7,419 | | | | 280,142 | |
| | | | | | | | |
| | | | | | | 556,144 | |
| |
| Diversified Consumer Services — 0.2% | | | | |
H&R Block, Inc. | | | 12,219 | | | | 309,996 | |
| | | | | | | | |
| |
| Diversified Financial Services — 1.5% | | | | |
Berkshire Hathaway, Inc., Class B(b) | | | 12,112 | | | | 2,473,028 | |
| | | | | | | | |
| |
| Diversified Telecommunication Services — 1.4% | | | | |
AT&T, Inc. | | | 25,450 | | | | 726,343 | |
Verizon Communications, Inc. | | | 26,917 | | | | 1,513,274 | |
| | | | | | | | |
| | | | | | | 2,239,617 | |
| |
| Electric Utilities — 2.0% | | | | |
IDACORP, Inc. | | | 4,476 | | | | 416,537 | |
OGE Energy Corp. | | | 13,517 | | | | 529,731 | |
Pinnacle West Capital Corp. | | | 15,320 | | | | 1,305,264 | |
Portland General Electric Co. | | | 19,581 | | | | 897,789 | |
Xcel Energy, Inc. | | | 1,131 | | | | 55,724 | |
| | | | | | | | |
| | | | | | | 3,205,045 | |
| |
| Electrical Equipment — 0.9% | | | | |
AMETEK, Inc. | | | 5,639 | | | | 381,760 | |
Rockwell Automation, Inc. | | | 7,284 | | | | 1,096,097 | |
| | | | | | | | |
| | | | | | | 1,477,857 | |
|
| Electronic Equipment, Instruments & Components — 0.9% | |
CDW Corp. | | | 7,331 | | | | 594,178 | |
Keysight Technologies, Inc.(b) | | | 391 | | | | 24,273 | |
National Instruments Corp. | | | 15,200 | | | | 689,776 | |
Zebra Technologies Corp., Class A(b) | | | 747 | | | | 118,945 | |
| | | | | | | | |
| | | | | | | 1,427,172 | |
| |
| Energy Equipment & Services — 0.5% | | | | |
Halliburton Co. | | | 27,385 | | | | 727,893 | |
Nabors Industries Ltd.(a) | | | 14,330 | | | | 28,660 | |
| | | | | | | | |
| | | | | | | 756,553 | |
| | |
| 24 | | 2018 BLACKROCK ANNUAL REPORTTO SHAREHOLDERS |
| | |
Schedule of Investments (continued) December 31, 2018 | | BlackRock Advantage Large Cap Core Portfolio (Percentages shown are based on Net Assets) |
| | | | | | | | |
| Security | | Shares | | | Value | |
| |
| Entertainment — 1.1% | | | | |
Activision Blizzard, Inc. | | | 1,093 | | | $ | 50,901 | |
Electronic Arts, Inc.(b) | | | 5,011 | | | | 395,418 | |
Netflix, Inc.(b) | | | 2,079 | | | | 556,465 | |
Twenty-First Century Fox, Inc., Class A | | | 2,475 | | | | 119,097 | |
Twenty-First Century Fox, Inc., Class B | | | 1,751 | | | | 83,663 | |
Viacom, Inc., Class B | | | 16,854 | | | | 433,148 | |
World Wrestling Entertainment, Inc., Class A(a) | | | 1,673 | | | | 125,006 | |
| | | | | | | | |
| | | | | | | 1,763,698 | |
| |
| Equity Real Estate Investment Trusts (REITs) — 3.7% | | | | |
Equity LifeStyle Properties, Inc. | | | 1,775 | | | | 172,406 | |
Host Hotels & Resorts, Inc. | | | 37,488 | | | | 624,925 | |
Outfront Media, Inc. | | | 2,836 | | | | 51,388 | |
Park Hotels & Resorts, Inc. | | | 28,170 | | | | 731,857 | |
Prologis, Inc. | | | 34,386 | | | | 2,019,146 | |
Realty Income Corp. | | | 17,637 | | | | 1,111,837 | |
Simon Property Group, Inc. | | | 7,959 | | | | 1,337,032 | |
| | | | | | | | |
| | | | | | | 6,048,591 | |
| |
| Food & Staples Retailing — 1.0% | | | | |
Costco Wholesale Corp. | | | 6,836 | | | | 1,392,561 | |
Walmart, Inc. | | | 2,464 | | | | 229,522 | |
| | | | | | | | |
| | | | | | | 1,622,083 | |
| |
| Food Products — 2.0% | | | | |
Archer-Daniels-Midland Co. | | | 31,835 | | | | 1,304,280 | |
Hershey Co. (The) | | | 15,336 | | | | 1,643,713 | |
Kellogg Co. | | | 1,058 | | | | 60,317 | |
Lamb Weston Holdings, Inc. | | | 1,954 | | | | 143,736 | |
Tyson Foods, Inc., Class A | | | 1,336 | | | | 71,342 | |
| | | | | | | | |
| | | | | | | 3,223,388 | |
| |
| Gas Utilities — 0.5% | | | | |
Atmos Energy Corp. | | | 7,538 | | | | 698,923 | |
UGI Corp. | | | 842 | | | | 44,921 | |
| | | | | | | | |
| | | | | | | 743,844 | |
| |
| Health Care Equipment & Supplies — 3.1% | | | | |
Abbott Laboratories | | | 7,086 | | | | 512,530 | |
Danaher Corp. | | | 11,615 | | | | 1,197,739 | |
DexCom, Inc.(b) | | | 378 | | | | 45,284 | |
IDEXX Laboratories, Inc.(b) | | | 897 | | | | 166,860 | |
Intuitive Surgical, Inc.(b) | | | 860 | | | | 411,871 | |
Masimo Corp.(b) | | | 2,545 | | | | 273,257 | |
Medtronic plc | | | 5,541 | | | | 504,009 | |
STERIS plc | | | 2,413 | | | | 257,829 | |
Stryker Corp. | | | 9,938 | | | | 1,557,782 | |
| | | | | | | | |
| | | | | | | 4,927,161 | |
| |
| Health Care Providers & Services — 3.5% | | | | |
AmerisourceBergen Corp. | | | 6,807 | | | | 506,441 | |
Anthem, Inc. | | | 395 | | | | 103,739 | |
Cardinal Health, Inc. | | | 13,817 | | | | 616,238 | |
CVS Health Corp. | | | 5,100 | | | | 334,152 | |
Halfmoon Parent, Inc. | | | 750 | | | | 142,533 | |
Humana, Inc. | | | 2,423 | | | | 694,141 | |
McKesson Corp. | | | 5,721 | | | | 631,999 | |
Quest Diagnostics, Inc. | | | 827 | | | | 68,864 | |
UnitedHealth Group, Inc. | | | 9,626 | | | | 2,398,029 | |
WellCare Health Plans, Inc.(b) | | | 985 | | | | 232,549 | |
| | | | | | | | |
| | | | | | | 5,728,685 | |
| | |
| Health Care Technology — 0.3%(b) | | | | | | |
athenahealth, Inc. | | | 267 | | | | 35,225 | |
Cerner Corp. | | | 481 | | | | 25,224 | |
Veeva Systems, Inc., Class A | | | 5,632 | | | | 503,050 | |
| | | | | | | | |
| | | | | | | 563,499 | |
| | | | | | | | |
| Security | | Shares | | | Value | |
| |
| Hotels, Restaurants & Leisure — 2.2% | | | | |
Boyd Gaming Corp. | | | 1,374 | | | $ | 28,552 | |
Carnival Corp. | | | 8,442 | | | | 416,191 | |
Darden Restaurants, Inc. | | | 3,045 | | | | 304,074 | |
Domino’s Pizza, Inc. | | | 2,949 | | | | 731,322 | |
Dunkin’ Brands Group, Inc.(a) | | | 2,399 | | | | 153,824 | |
Extended Stay America, Inc. | | | 12,315 | | | | 190,882 | |
Hilton Worldwide Holdings, Inc. | | | 4,988 | | | | 358,138 | |
Las Vegas Sands Corp. | | | 2,686 | | | | 139,806 | |
McDonald’s Corp.(a) | | | 5,131 | | | | 911,112 | |
Norwegian Cruise Line Holdings Ltd.(b) | | | 5,688 | | | | 241,114 | |
Yum! Brands, Inc. | | | 655 | | | | 60,208 | |
| | | | | | | | |
| | | | | | | 3,535,223 | |
| |
| Household Durables — 0.3% | | | | |
Garmin Ltd. | | | 8,435 | | | | 534,104 | |
| | | | | | | | |
| |
| Household Products — 0.7% | | | | |
Church & Dwight Co., Inc. | | | 13,615 | | | | 895,322 | |
Clorox Co. (The) | | | 1,012 | | | | 155,990 | |
Procter & Gamble Co. (The) | | | 1,677 | | | | 154,150 | |
| | | | | | | | |
| | | | | | | 1,205,462 | |
| | |
| Industrial Conglomerates — 0.9% | | | | | | |
3M Co. | | | 5,360 | | | | 1,021,294 | |
General Electric Co. | | | 26,555 | | | | 201,021 | |
Honeywell International, Inc. | | | 706 | | | | 93,277 | |
Roper Technologies, Inc. | | | 224 | | | | 59,701 | |
| | | | | | | | |
| | | | | | | 1,375,293 | |
| |
| Insurance — 2.3% | | | | |
Allstate Corp. (The) | | | 11,797 | | | | 974,786 | |
American Financial Group, Inc. | | | 5,959 | | | | 539,468 | |
Arthur J Gallagher & Co. | | | 4,520 | | | | 333,124 | |
Athene Holding Ltd., Class A(b) | | | 6,077 | | | | 242,047 | |
First American Financial Corp. | | | 8,545 | | | | 381,449 | |
Hartford Financial Services Group, Inc. (The) | | | 8,150 | | | | 362,267 | |
Lincoln National Corp. | | | 2,438 | | | | 125,094 | |
Loews Corp. | | | 521 | | | | 23,716 | |
Progressive Corp. (The) | | | 4,375 | | | | 263,944 | |
Unum Group | | | 15,995 | | | | 469,933 | |
| | | | | | | | |
| | | | | | | 3,715,828 | |
| |
| Interactive Media & Services — 4.4%(b) | | | | |
Alphabet, Inc., Class A | | | 1,765 | | | | 1,844,355 | |
Alphabet, Inc., Class C | | | 2,084 | | | | 2,158,211 | |
Cargurus, Inc. | | | 2,946 | | | | 99,369 | |
Facebook, Inc., Class A | | | 19,249 | | | | 2,523,351 | |
Snap, Inc., Class A(a) | | | 4,238 | | | | 23,351 | |
TripAdvisor, Inc. | | | 965 | | | | 52,052 | |
Twitter, Inc. | | | 2,711 | | | | 77,914 | |
Yelp, Inc. | | | 9,591 | | | | 335,589 | |
| | | | | | | | |
| | | | | | | 7,114,192 | |
| |
| Internet & Direct Marketing Retail — 2.9%(b) | | | | |
Amazon.com, Inc. | | | 2,956 | | | | 4,439,823 | |
Booking Holdings, Inc. | | | 147 | | | | 253,196 | |
| | | | | | | | |
| | | | | | | 4,693,019 | |
| |
| IT Services — 4.6% | | | | |
Accenture plc, Class A | | | 3,307 | | | | 466,320 | |
Amdocs Ltd. | | | 278 | | | | 16,285 | |
Automatic Data Processing, Inc. | | | 9,961 | | | | 1,306,086 | |
Booz Allen Hamilton Holding Corp. | | | 15,596 | | | | 702,912 | |
Broadridge Financial Solutions, Inc. | | | 2,166 | | | | 208,478 | |
Cognizant Technology Solutions Corp., Class A | | | 576 | | | | 36,564 | |
Fidelity National Information Services, Inc. | | | 6,521 | | | | 668,729 | |
First Data Corp., Class A(b) | | | 5,296 | | | | 89,555 | |
GoDaddy, Inc., Class A(b) | | | 5,558 | | | | 364,716 | |
| | | | |
| SCHEDULES OF INVESTMENTS | | | 25 | |
| | |
Schedule of Investments (continued) December 31, 2018 | | BlackRock Advantage Large Cap Core Portfolio (Percentages shown are based on Net Assets) |
| | | | | | | | |
| Security | | Shares | | | Value | |
| |
| IT Services (continued) | | | | |
International Business Machines Corp. | | | 3,703 | | | $ | 420,920 | |
Mastercard, Inc., Class A | | | 8,885 | | | | 1,676,155 | |
Paychex, Inc. | | | 950 | | | | 61,893 | |
PayPal Holdings, Inc.(b) | | | 3,301 | | | | 277,581 | |
Square, Inc., Class A(b) | | | 1,300 | | | | 72,917 | |
Total System Services, Inc. | | | 208 | | | | 16,908 | |
Visa, Inc., Class A | | | 4,587 | | | | 605,209 | |
Western Union Co. (The) | | | 24,184 | | | | 412,579 | |
| | | | | | | | |
| | | | | | | 7,403,807 | |
| |
| Life Sciences Tools & Services — 0.3% | | | | |
Agilent Technologies, Inc. | | | 5,476 | | | | 369,411 | |
Thermo Fisher Scientific, Inc. | | | 195 | | | | 43,639 | |
| | | | | | | | |
| | | | | | | 413,050 | |
| |
| Machinery — 3.3% | | | | |
Crane Co. | | | 20,115 | | | | 1,451,901 | |
Illinois Tool Works, Inc. | | | 9,532 | | | | 1,207,609 | |
Ingersoll-Rand plc | | | 13,693 | | | | 1,249,212 | |
PACCAR, Inc. | | | 18,635 | | | | 1,064,804 | |
Parker-Hannifin Corp. | | | 137 | | | | 20,432 | |
Snap-on, Inc. | | | 2,558 | | | | 371,652 | |
| | | | | | | | |
| | | | | | | 5,365,610 | |
| |
| Media — 1.9% | | | | |
AMC Networks, Inc., Class A(b) | | | 7,102 | | | | 389,758 | |
CBS Corp.(Non-Voting), Class B | | | 8,234 | | | | 359,991 | |
Comcast Corp., Class A | | | 31,002 | | | | 1,055,618 | |
Interpublic Group of Cos., Inc. (The) | | | 16,483 | | | | 340,044 | |
Liberty Media Corp.-Liberty SiriusXM, Class A(b) | | | 10,485 | | | | 385,848 | |
Liberty Media Corp.-Liberty SiriusXM, Class C(b) | | | 12,683 | | | | 469,017 | |
Sinclair Broadcast Group, Inc., Class A | | | 1,238 | | | | 32,609 | |
Sirius XM Holdings, Inc. | | | 10,160 | | | | 58,014 | |
Tribune Media Co., Class A | | | 598 | | | | 27,137 | |
| | | | | | | | |
| | | | | | | 3,118,036 | |
| |
| Metals & Mining — 0.3% | | | | |
Newmont Mining Corp. | | | 9,134 | | | | 316,493 | |
Reliance Steel & Aluminum Co. | | | 1,900 | | | | 135,223 | |
Steel Dynamics, Inc. | | | 1,846 | | | | 55,454 | |
| | | | | | | | |
| | | | | | | 507,170 | |
| |
| Multiline Retail — 0.9% | | | | |
Target Corp. | | | 23,007 | | | | 1,520,533 | |
| | | | | | | | |
| |
| Multi-Utilities — 0.4% | | | | |
CMS Energy Corp. | | | 658 | | | | 32,670 | |
Consolidated Edison, Inc. | | | 7,549 | | | | 577,196 | |
| | | | | | | | |
| | | | | | | 609,866 | |
| |
| Oil, Gas & Consumable Fuels — 4.5% | | | | |
Anadarko Petroleum Corp. | | | 19,784 | | | | 867,330 | |
Antero Resources Corp.(b) | | | 1,723 | | | | 16,179 | |
Chevron Corp. | | | 8,909 | | | | 969,210 | |
Concho Resources, Inc.(b) | | | 468 | | | | 48,106 | |
ConocoPhillips | | | 18,849 | | | | 1,175,235 | |
Continental Resources, Inc.(b) | | | 2,331 | | | | 93,683 | |
Exxon Mobil Corp. | | | 23,682 | | | | 1,614,876 | |
Kinder Morgan, Inc. | | | 41,286 | | | | 634,979 | |
Occidental Petroleum Corp. | | | 11,709 | | | | 718,698 | |
Phillips 66 | | | 8,186 | | | | 705,224 | |
Suncor Energy, Inc.(a) | | | 10,884 | | | | 304,425 | |
Valero Energy Corp. | | | 203 | | | | 15,219 | |
Williams Cos., Inc. (The) | | | 4,054 | | | | 89,391 | |
| | | | | | | | |
| | | | | | | 7,252,555 | |
| |
| Personal Products — 0.5% | | | | |
Estee Lauder Cos., Inc. (The), Class A | | | 5,868 | | | | 763,427 | |
| | | | | | | | |
| | | | | | | | |
| Security | | Shares | | | Value | |
| |
| Pharmaceuticals — 4.2% | | | | |
Bristol-Myers Squibb Co. | | | 19,474 | | | $ | 1,012,258 | |
Eli Lilly & Co. | | | 10,026 | | | | 1,160,209 | |
Johnson & Johnson | | | 17,035 | | | | 2,198,367 | |
Merck & Co., Inc. | | | 23,149 | | | | 1,768,815 | |
Zoetis, Inc. | | | 6,900 | | | | 590,226 | |
| | | | | | | | |
| | | | | | | 6,729,875 | |
| |
| Professional Services — 0.6% | | | | |
Insperity, Inc. | | | 8,024 | | | | 749,121 | |
Robert Half International, Inc. | | | 3,874 | | | | 221,593 | |
| | | | | | | | |
| | | | | | | 970,714 | |
| |
| Road & Rail — 0.9% | | | | |
Landstar System, Inc. | | | 7,858 | | | | 751,775 | |
Norfolk Southern Corp. | | | 4,343 | | | | 649,452 | |
Schneider National, Inc., Class B | | | 1,775 | | | | 33,139 | |
| | | | | | | | |
| | | | | | | 1,434,366 | |
| |
| Semiconductors & Semiconductor Equipment — 3.4% | | | | |
Analog Devices, Inc. | | | 4,973 | | | | 426,832 | |
Applied Materials, Inc. | | | 15,228 | | | | 498,565 | |
Broadcom, Inc. | | | 291 | | | | 73,995 | |
Intel Corp. | | | 39,803 | | | | 1,867,955 | |
Maxim Integrated Products, Inc.(a) | | | 9,801 | | | | 498,381 | |
NVIDIA Corp. | | | 3,967 | | | | 529,594 | |
NXP Semiconductors NV(b) | | | 399 | | | | 29,239 | |
QUALCOMM, Inc. | | | 3,688 | | | | 209,884 | |
Skyworks Solutions, Inc. | | | 3,880 | | | | 260,038 | |
Texas Instruments, Inc. | | | 7,468 | | | | 705,726 | |
Xilinx, Inc. | | | 4,611 | | | | 392,719 | |
| | | | | | | | |
| | | | | | | 5,492,928 | |
| |
| Software — 6.5% | | | | |
Dropbox, Inc., Class A(b) | | | 8,379 | | | | 171,183 | |
Intuit, Inc. | | | 3,454 | | | | 679,920 | |
Microsoft Corp. | | | 51,324 | | | | 5,212,979 | |
New Relic, Inc.(b) | | | 1,234 | | | | 99,917 | |
Oracle Corp. | | | 32,022 | | | | 1,445,793 | |
salesforce.com, Inc.(b) | | | 13,951 | | | | 1,910,868 | |
Synopsys, Inc.(b) | | | 7,111 | | | | 599,031 | |
Ultimate Software Group, Inc. (The)(b) | | | 402 | | | | 98,438 | |
VMware, Inc., Class A(b) | | | 1,631 | | | | 223,659 | |
| | | | | | | | |
| | | | | | | 10,441,788 | |
| |
| Specialty Retail — 1.8% | | | | |
AutoNation, Inc.(b) | | | 2,003 | | | | 71,507 | |
Best Buy Co., Inc. | | | 311 | | | | 16,471 | |
Dick’s Sporting Goods, Inc.(a) | | | 1,575 | | | | 49,140 | |
Five Below, Inc.(b) | | | 1,568 | | | | 160,438 | |
Home Depot, Inc. (The) | | | 7,258 | | | | 1,247,069 | |
Penske Automotive Group, Inc.(a) | | | 11,494 | | | | 463,438 | |
Ross Stores, Inc. | | | 1,975 | | | | 164,320 | |
TJX Cos., Inc. (The) | | | 15,155 | | | | 678,035 | |
| | | | | | | | |
| | | | | | | 2,850,418 | |
| |
| Technology Hardware, Storage & Peripherals — 3.8% | | | | |
Apple, Inc. | | | 31,876 | | | | 5,028,120 | |
Dell Technologies, Inc., Class C(b) | | | 4,896 | | | | 239,280 | |
Hewlett Packard Enterprise Co. | | | 4,368 | | | | 57,702 | |
HP, Inc. | | | 32,250 | | | | 659,835 | |
Pure Storage, Inc., Class A(b) | | | 13,275 | | | | 213,462 | |
| | | | | | | | |
| | | | | | | 6,198,399 | |
| |
| Textiles, Apparel & Luxury Goods — 1.0% | | | | |
NIKE, Inc., Class B | | | 19,397 | | | | 1,438,093 | |
VF Corp. | | | 3,608 | | | | 257,395 | |
| | | | | | | | |
| | | | | | | 1,695,488 | |
| | |
| 26 | | 2018 BLACKROCK ANNUAL REPORTTO SHAREHOLDERS |
| | |
Schedule of Investments (continued) December 31, 2018 | | BlackRock Advantage Large Cap Core Portfolio (Percentages shown are based on Net Assets) |
| | | | | | | | |
| Security | | Shares | | | Value | |
| |
| Thrifts & Mortgage Finance — 0.1% | | | | |
Essent Group Ltd.(b) | | | 3,088 | | | $ | 105,548 | |
| | | | | | | | |
| |
| Tobacco — 0.7% | | | | |
Altria Group, Inc. | | | 13,061 | | | | 645,083 | |
Philip Morris International, Inc. | | | 6,477 | | | | 432,404 | |
| | | | | | | | |
| | | | | | | 1,077,487 | |
| |
| Water Utilities — 0.7% | | | | |
American Water Works Co., Inc. | | | 12,864 | | | | 1,167,665 | |
| | | | | | | | |
| |
| Wireless Telecommunication Services — 0.1% | | | | |
Telephone & Data Systems, Inc. | | | 7,102 | | | | 231,098 | |
| | | | | | | | |
| |
Total Common Stocks — 98.8%
(Cost: $167,714,618) | | | | 159,560,198 | |
| | | | | |
| |
Total Long-Term Investments — 98.8%
(Cost: $167,714,618) | | | | 159,560,198 | |
| | | | | |
| | | | | | | | |
| Security | | Shares | | | Value | |
|
Short-Term Securities — 3.8%(c) | |
BlackRock Liquidity Funds,T-Fund, Institutional Class, 2.32%(e) | | | 1,878,651 | | | $ | 1,878,651 | |
JPMorgan US Treasury Plus Money Market Fund, Agency Class, 2.24% | | | 19,032 | | | | 19,032 | |
SL Liquidity Series, LLC, Money Market Series, 2.57%(d)(e) | | | 4,227,706 | | | | 4,227,284 | |
| | | | | | | | |
| |
Total Short-Term Securities — 3.8%
(Cost: $6,125,224) | | | | 6,124,967 | |
| | | | | |
| |
Total Investments — 102.6%
(Cost: $173,839,842) | | | | 165,685,165 | |
| |
Liabilities in Excess of Other Assets — (2.6)% | | | | (4,272,075 | ) |
| | | | | |
| |
Net Assets — 100.0% | | | $ | 161,413,090 | |
| | | | | |
| (a) | Security, or a portion of the security, is on loan. |
| (b) | Non-income producing security. |
| (c) | Annualized7-day yield as of period end. |
| (d) | Security was purchased with the cash collateral from loaned securities. |
| (e) | During the year ended December 31, 2018, investments in issuers considered to be affiliates of the Fund for purposes of Section 2(a)(3) of the Investment Company Act of 1940, as amended, were as follows: |
| | | | | | | | | | | | | | | | | | | | | | | | | | | | |
| Affiliate | | Shares
Held at
12/31/17 | | | Net
Activity | | | Shares
Held at
12/31/18 | | | Value at
12/31/18 | | | Income | | | Net Realized
Gain (Loss) (a) | | | Change in
Unrealized
Appreciation
(Depreciation) | |
BlackRock Liquidity Funds,T-Fund, Institutional Class | | | 1,953,092 | | | | (74,441 | ) | | | 1,878,651 | | | $ | 1,878,651 | | | $ | 29,009 | | | $ | — | | | $ | — | |
SL Liquidity Series, LLC, Money Market Series | | | 661,529 | | | | 3,566,177 | | | | 4,227,706 | | | | 4,227,284 | | | | 6,147 | (b) | | | (1,907 | ) | | | (257 | ) |
| | | | | | | | | | | | | | | | | | | | | | | | | | | | |
| | | | | | | | | | | | | | $ | 6,105,935 | | | $ | 35,156 | | | $ | (1,907 | ) | | $ | (257 | ) |
| | | | | | | | | | | | | | | | | | | | | | | | | | | | |
| | (a) | Includes net capital gain distributions, if applicable. | |
| | (b) | Represents securities lending income earned from the reinvestment of cash collateral from loaned securities, net of fees and collateral investment expenses, and other payments to and from borrowers of securities. | |
For Fund compliance purposes, the Fund’s industry classifications refer to one or more of the industrysub-classifications used by one or more widely recognized market indexes or ratings group indexes, and/or as defined by the investment adviser. These definitions may not apply for purposes of this report, which may combine such industrysub-classifications for reporting ease.
Derivative Financial Instruments Outstanding as of Period End
Futures Contracts
| | | | | | | | | | | | | | | | |
| Description | | Number of Contracts | | | Expiration Date | | | Notional
Amount (000) | | | Value/ Unrealized Appreciation (Depreciation) | |
Long Contracts | | | | | | | | | | | | | | | | |
S&P 500E-Mini Index | | | 17 | | | | 03/15/19 | | | $ | 2,129 | | | $ | (25,914 | ) |
| | | | | | | | | | | | | | | | |
Derivative Financial Instruments Categorized by Risk Exposure
As of period end, the fair values of derivative financial instruments located in the Statements of Assets and Liabilities were as follows:
| | | | | | | | | | | | | | | | | | | | | | | | | | | | |
| | | Commodity
Contracts | | | Credit Contracts | | | Equity Contracts | | | Foreign Currency Exchange Contracts | | | Interest Rate Contracts | | | Other Contracts | | | Total | |
Liabilities — Derivative Financial Instruments | |
Futures contracts | | | | | | | | | | | | | | | | | | | | | | | | | | | | |
Net unrealized depreciation(a) | | $ | — | | | $ | — | | | $ | 25,914 | | | $ | — | | | $ | — | | | $ | — | | | $ | 25,914 | |
| | | | | | | | | | | | | | | | | | | | | | | | | | | | |
| | (a) | Includes cumulative depreciation on futures contracts, if any, as reported in the Schedule of Investments. Only current day’s variation margin is reported within the Statements of Assets and Liabilities. | |
| | | | |
| SCHEDULES OF INVESTMENTS | | | 27 | |
| | |
Schedule of Investments (continued) December 31, 2018 | | BlackRock Advantage Large Cap Core Portfolio |
For the year ended December 31, 2018, the effect of derivative financial instruments in the Statements of Operations were as follows:
| | | | | | | | | | | | | | | | | | | | | | | | | | | | |
| | | Commodity
Contracts | | | Credit Contracts | | | Equity Contracts | | | Foreign Currency Exchange Contracts | | | Interest Rate Contracts | | | Other Contracts | | | Total | |
Net Realized Gain (Loss) from: | | | | | | | | | | | | | | | | | | | | | | | | | | | | |
Futures contracts | | $ | — | | | $ | — | | | $ | (70,904 | ) | | $ | — | | | $ | — | | | $ | — | | | $ | (70,904 | ) |
| | | | | | | | | | | | | | | | | | | | | | | | | | | | |
| | | | | | | |
| Net Change in Unrealized Appreciation (Depreciation) on: | | | | | | | | | | | | | | | | | | | | | |
Futures contracts | | $ | — | | | $ | — | | | $ | (35,342 | ) | | $ | — | | | $ | — | | | $ | — | | | $ | (35,342 | ) |
| | | | | | | | | | | | | | | | | | | | | | | | | | | | |
Average Quarterly Balances of Outstanding Derivative Financial Instruments
| | | | |
Futures contracts: | | | | |
Average notional value of contracts — long | | $ | 2,115,118 | |
For more information about the Fund’s investment risks regarding derivative financial instruments, refer to the Notes to financial statements.
Fair Value Hierarchy as of Period End
Various inputs are used in determining the fair value of investments and derivative financial instruments. For information about the Fund’s policy regarding valuation of investments and derivative financial instruments, refer to the Notes to Financial Statements.
The following table summarizes the Fund’s investments and derivative financial instruments categorized in the disclosure hierarchy:
| | | | | | | | | | | | | | | | |
| | | Level 1 | | | Level 2 | | | Level 3 | | | Total | |
Assets: | | | | | | | | | | | | | | | | |
Investments: | | | | | | | | | | | | | | | | |
Long-Term Investments: | | | | | | | | | | | | | | | | |
Common Stocks(a) | | $ | 159,560,198 | | | $ | — | | | $ | — | | | $ | 159,560,198 | |
Short-Term Securities | | | 1,897,683 | | | | — | | | | — | | | | 1,897,683 | |
| | | | | | | | | | | | | | | | |
Subtotal | | $ | 161,457,881 | | | $ | — | | | $ | — | | | $ | 161,457,881 | |
| | | | | | | | | | | | | | | | |
Investments valued at NAV(b) | | | | | | | | | | | | | | $ | 4,227,284 | |
| | | | | | | | | | | | | | | | |
Total Investments | | | | | | | | | | | | | | $ | 165,685,165 | |
| | | | | | | | | | | | | | | | |
Derivative Financial Instruments(c) | | | | | | | | | | | | | | | | |
Liabilities: | | | | | | | | | | | | | | | | |
Equity contracts | | $ | (25,914 | ) | | $ | — | | | $ | — | | | $ | (25,914 | ) |
| | | | | | | | | | | | | | | | |
| | (a) | See above Schedule of Investments for values in each security type. | |
| | (b) | As of December 31, 2018, certain investments of the Fund were fair valued using NAV per share as no quoted market value is available and therefore have been excluded from the fair value hierarchy. | |
| | (c) | Derivative financial instruments are futures contracts, which are valued at the unrealized appreciation (depreciation) on the instrument. | |
During the year ended December 31, 2018, there were no transfers between levels.
See notes to financial statements.
| | |
| 28 | | 2018 BLACKROCK ANNUAL REPORTTO SHAREHOLDERS |
| | |
Schedule of Investments December 31, 2018 | | BlackRock Balanced Capital Portfolio (Percentages shown are based on Net Assets) |
| | | | | | | | | | | | |
| Security | | | | | Par
(000) | | | Value | |
|
| Asset-Backed Securities — 4.2% | |
ACE Securities Corp. Home Equity Loan Trust,Series 2007-HE4, Class A2A, (LIBOR USD 1 Month + 0.13%), 2.64%, 05/25/37(a) | | | USD | | | | 50 | | | $ | 14,485 | |
Ajax Mortgage Loan Trust(b): | | | | | | | | | | | | |
Series 2017-D, Class A, 3.75%, 12/25/57 | | | | | | | 156 | | | | 157,012 | |
Series 2018-E, Class A, 4.38%, 06/25/58(c) | | | | | | | 100 | | | | 99,479 | |
Series 2018-F, Class A, 4.38%, 11/25/58(c) | | | | | | | 455 | | | | 452,810 | |
Series 2018-G, Class A, 4.38%, 06/25/57(d) | | | | | | | 250 | | | | 248,850 | |
Series 2018-G, Class B, 5.25%, 06/25/57(d) | | | | | | | 100 | | | | 97,750 | |
Series 2018-G, Class C, 5.25%, 06/25/57 | | | | | | | 100 | | | | 92,255 | |
Allegro CLO II-S Ltd., Series 2014-1RA, Class A1, (LIBOR USD 3 Month + 1.08%), 3.23%, 10/21/28(a)(b) | | | | | | | 250 | | | | 248,954 | |
Anchorage Capital CLO 5-R Ltd.(a)(b): | | | | | | | | | | | | |
Series 2014-5RA, Class B, (LIBOR USD 3 Month + 1.45%), 3.89%, 01/15/30 | | | | | | | 250 | | | | 244,277 | |
Series 2014-5RA, Class C, (LIBOR USD 3 Month + 1.85%), 4.29%, 01/15/30 | | | | | | | 250 | | | | 236,916 | |
Anchorage Capital CLO 6 Ltd., Series 2015-6A, Class AR, (LIBOR USD 3 Month + 1.27%), 3.71%, 07/15/30(a)(b) | | | | | | | 250 | | | | 247,508 | |
Apidos CLO XII, Series 2013-12A, Class AR, (LIBOR USD 3 Month + 1.08%), 3.52%, 04/15/31(a)(b) | | | | | | | 500 | | | | 494,917 | |
Arbor Realty Collateralized Loan Obligation Ltd.,Series 2017-FL3, Class A, (LIBOR USD 1 Month + 0.99%), 3.45%, 12/15/27(a)(b) | | | | | | | 100 | | | | 99,452 | |
Arbor Realty Commercial Real Estate Notes
Ltd.(a)(b): | | | | | | | | | | | | |
Series 2016-FL1A, Class A, (LIBOR USD 1 Month + 1.70%), 4.16%, 09/15/26 | | | | | | | 100 | | | | 101,109 | |
Series 2017-FL2, Class A, (LIBOR USD 1 Month + 0.99%), 3.45%, 08/15/27 | | | | | | | 250 | | | | 249,019 | |
Argent Mortgage Loan Trust, Series 2005-W1, Class A2, (LIBOR USD 1 Month + 0.48%), 2.99%, 05/25/35(a) | | | | | | | 86 | | | | 75,727 | |
Avery Point V CLO Ltd., Series 2014-5A, Class AR, (LIBOR USD 3 Month + 0.98%), 3.43%, 07/17/26(a)(b) | | | | | | | 205 | | | | 204,526 | |
Avery Point VI CLO Ltd., Series 2015-6A, Class AR, (LIBOR USD 3 Month + 1.05%), 3.63%, 08/05/27(a)(b) | | | | | | | 250 | | | | 248,073 | |
B2R Mortgage Trust(b): | | | | | | | | | | | | |
Series 2015-1, Class A1, 2.52%, 05/15/48 | | | | | | | 29 | | | | 28,425 | |
Series 2015-2, Class A, 3.34%, 11/15/48 | | | | | | | 52 | | | | 51,574 | |
Barings CLO Ltd., Series 2018-3A, Class A1, (LIBOR USD 3 Month + 0.95%), 3.42%, 07/20/29(a)(b) | | | | | | | 250 | | | | 247,558 | |
BCMSC Trust(c): | | | | | | | | | | | | |
Series 2000-A, Class A2, 7.58%, 06/15/30 | | | | | | | 53 | | | | 17,077 | |
Series 2000-A, Class A3, 7.83%, 06/15/30 | | | | | | | 49 | | | | 16,380 | |
Series 2000-A, Class A4, 8.29%, 06/15/30 | | | | | | | 83 | | | | 29,633 | |
Bear Stearns Asset-Backed Securities I Trust(a): | | | | | | | | | | | | |
Series 2004-HE7, Class M2, (LIBOR USD 1 Month + 1.73%), 4.23%, 08/25/34 | | | | | | | 3 | | | | 3,184 | |
Series 2006-HE7, Class 1A2, (LIBOR USD 1 Month + 0.17%), 2.68%, 09/25/36 | | | | | | | 183 | | | | 208,169 | |
Series 2007-HE1, Class 21A2, (LIBOR USD 1 Month + 0.16%), 2.67%, 01/25/37 | | | | | | | 51 | | | | 50,132 | |
Series 2007-HE2, Class 22A, (LIBOR USD 1 Month + 0.14%), 2.65%, 03/25/37 | | | | | | | 26 | | | | 26,001 | |
Series 2007-HE2, Class 23A, (LIBOR USD 1 Month + 0.14%), 2.65%, 03/25/37 | | | | | | | 56 | | | | 56,784 | |
Series 2007-HE3, Class 1A3, (LIBOR USD 1 Month + 0.25%), 2.76%, 04/25/37 | | | | | | | 87 | | | | 90,205 | |
Bear Stearns Asset-Backed Securities Trust, Series 2005-4, Class M2, (LIBOR USD 1 Month + 1.20%), 3.52%, 01/25/36(a) | | | | | | | 7 | | | | 6,848 | |
Benefit Street Partners CLO VI Ltd., Series 2015-VIA, Class A1R, (LIBOR USD 3 Month + 1.24%), 3.68%, 10/18/29(a)(b) | | | | | | | 250 | | | | 249,271 | |
| | | | | | | | | | | | |
| Security | | | | | Par
(000) | | | Value | |
|
| Asset-Backed Securities (continued) | |
BSPRT Issuer Ltd., Series 2017-FL1, Class A, (LIBOR USD 1 Month + 1.35%), 3.81%,
06/15/27(a)(b) | | | USD | | | | 22 | | | $ | 21,733 | |
Carlyle Global Market Strategies CLO Ltd.(a)(b): | | | | | | | | | | | | |
Series 2014-1A, Class A1R2, (LIBOR USD 3 Month + 0.97%), 3.42%, 04/17/31 | | | | | | | 250 | | | | 245,900 | |
Series 2015-3A, Class A2R, (LIBOR USD 3 Month + 1.60%), 4.11%, 07/28/28 | | | | | | | 250 | | | | 247,351 | |
Carlyle US CLO Ltd., Series 2017-4A, Class A1, (LIBOR USD 3 Month + 1.18%), 3.62%,
01/15/30(a)(b) | | | | | | | 250 | | | | 247,751 | |
Carrington Mortgage Loan Trust(a): | | | | | | | | | | | | |
Series 2006-FRE2, Class A2, (LIBOR USD 1 Month + 0.12%), 2.63%, 10/25/36 | | | | | | | 70 | | | | 51,478 | |
Series 2006-FRE2, Class A3, (LIBOR USD 1 Month + 0.16%), 2.67%, 10/25/36 | | | | | | | 59 | | | | 43,003 | |
Series 2006-NC4, Class A3, (LIBOR USD 1 Month + 0.16%), 2.67%, 10/25/36 | | | | | | | 88 | | | | 81,823 | |
C-BASS Trust: | | | | | | | | | | | | |
Series 2007-CB1, Class AF4, 3.58%, 01/25/37(d) | | | | | | | 73 | | | | 33,032 | |
Series 2007-CB5, Class A2, (LIBOR USD 1 Month + 0.17%), 2.49%, 04/25/37(a) | | | | | | | 58 | | | | 43,163 | |
Cedar Funding VI CLO Ltd., Series 2016-6A, Class AR, (LIBOR USD 3 Month + 1.09%), 3.56%, 10/20/28(a)(b) | | | | | | | 250 | | | | 247,903 | |
Cedar Funding VIII CLO Ltd., Series 2017-8A, Class A1, (LIBOR USD 3 Month + 1.25%), 3.70%, 10/17/30(a)(b) | | | | | | | 250 | | | | 248,659 | |
Cent CLO 24 Ltd., Series 2015-24A, Class A1R, (LIBOR USD 3 Month + 1.07%), 3.51%,
10/15/26(a)(b) | | | | | | | 250 | | | | 249,042 | |
CIFC Funding Ltd.(a)(b): | | | | | | | | | | | | |
Series 2013-1A, Class A2R, (LIBOR USD 3 Month + 1.75%), 4.19%, 07/16/30 | | | | | | | 250 | | | | 245,206 | |
Series 2014-4RA, Class A1A, (LIBOR USD 3 Month + 1.13%), 3.59%, 10/17/30 | | | | | | | 250 | | | | 249,174 | |
Citigroup Mortgage Loan Trust(a): | | | | | | | | | | | | |
Series 2006-NC1, Class A2D, (LIBOR USD 1 Month + 0.25%), 2.76%, 08/25/36 | | | | | | | 90 | | | | 87,879 | |
Series 2007-AHL2, Class A3B, (LIBOR USD 1 Month + 0.20%), 2.71%, 05/25/37 | | | | | | | 218 | | | | 161,486 | |
Series 2007-AHL2, Class A3C, (LIBOR USD 1 Month + 0.27%), 2.78%, 05/25/37 | | | | | | | 99 | | | | 73,863 | |
Conseco Finance Corp.: | | | | | | | | | | | | |
Series 1998-8, Class A1, 6.28%, 09/01/30 | | | | | | | 24 | | | | 25,595 | |
Series 1998-8, Class M1, 6.98%, 09/01/30(c) | | | | | | | 60 | | | | 51,079 | |
Series 2001-D, Class B1, (LIBOR USD 1 Month + 2.50%), 4.96%, 11/15/32(a) | | | | | | | 108 | | | | 107,326 | |
Conseco Finance Securitizations Corp.: | | | | | | | | | | | | |
Series 2000-1, Class A5, 8.06%, 09/01/29(c) | | | | | | | 31 | | | | 14,408 | |
Series 2000-4, Class A5, 7.97%, 05/01/32 | | | | | | | 95 | | | | 41,384 | |
Series 2000-4, Class A6, 8.31%, 05/01/32(c) | | | | | | | 42 | | | | 19,338 | |
Series 2000-5, Class A6, 7.96%, 05/01/31 | | | | | | | 40 | | | | 23,383 | |
Countrywide Asset-Backed Certificates: | | | | | | | | | | | | |
Series 2006-8, Class 2A3, (LIBOR USD 1 Month + 0.16%), 2.67%, 12/25/35(a) | | | | | | | 47 | | | | 46,108 | |
Series 2006-S3, Class A4, 6.63%, 01/25/29(d) | | | | | | | 19 | | | | 20,264 | |
Series 2006-SPS1, Class A, (LIBOR USD 1 Month + 0.22%), 2.73%, 12/25/25(a) | | | | | | | 3 | | | | 3,261 | |
Credit Suisse First Boston Mortgage Securities Corp.,Series 2001-MH29, Class B1, 8.10%, 09/25/31(c) | | | | | | | 30 | | | | 31,725 | |
Credit-Based Asset Servicing & Securitization LLC,Series 2006-MH1, Class B1, 6.25%,
10/25/36(b)(d) | | | | | | | 100 | | | | 100,232 | |
CWABS Asset-Backed Certificates Trust, Series 2005-17, Class 1AF4, 6.05%, 05/25/36(d) | | | | | | | 39 | | | | 38,278 | |
CWHEQ Home Equity Loan Trust: | | | | | | | | | | | | |
Series 2006-S5, Class A4, 5.84%, 06/25/35 | | | | | | | 2 | | | | 4,245 | |
Series 2006-S5, Class A5, 6.16%, 06/25/35 | | | | | | | 18 | | | | 19,508 | |
| | | | |
| SCHEDULES OF INVESTMENTS | | | 29 | |
| | |
Schedule of Investments (continued) December 31, 2018 | | BlackRock Balanced Capital Portfolio (Percentages shown are based on Net Assets) |
| | | | | | | | | | | | |
| Security | | | | | Par
(000) | | | Value | |
|
| Asset-Backed Securities (continued) | |
Series 2007-S1, Class A3, 5.81%, 11/25/36(c) | | | USD | | | | 2 | | | $ | 1,519 | |
CWHEQ Revolving Home Equity Loan Resuritization Trust(a)(b): | | | | | | | | | | | | |
Series 2006-RES, Class 4Q1B, (LIBOR USD 1 Month + 0.30%), 2.76%, 12/15/33(e) | | | | | | | 31 | | | | 28,533 | |
Series 2006-RES, Class 5B1A, (LIBOR USD 1 Month + 0.19%), 2.65%, 05/15/35 | | | | | | | 154 | | | | 142,517 | |
CWHEQ Revolving Home Equity Loan Trust(a): | | | | | | | | | | | | |
Series 2005-B, Class 2A, (LIBOR USD 1 Month + 0.18%), 2.64%, 05/15/35 | | | | | | | 20 | | | | 19,314 | |
Series 2006-H, Class 1A, (LIBOR USD 1 Month + 0.15%), 2.61%, 11/15/36 | | | | | | | 32 | | | | 25,891 | |
DCP Rights LLC, Series 2014-1A, Class A, 5.46%, 10/25/44(b) | | | | | | | 280 | | | | 286,068 | |
Dryden 53 CLO Ltd., Series 2017-53A, Class A, (LIBOR USD 3 Month + 1.12%), 3.56%, 01/15/31(a)(b) | | | | | | | 280 | | | | 277,747 | |
First Franklin Mortgage Loan Trust, Series 2006-FFH1, Class M2, (LIBOR USD 1 Month + 0.40%), 2.91%, 01/25/36(a) | | | | | | | 46 | | | | 26,367 | |
Flatiron CLO Ltd., Series 2015-1A, Class AR, (LIBOR USD 3 Month + 0.89%), 3.33%, 04/15/27(a)(b) | | | | | | | 250 | | | | 248,358 | |
GE-WMC Mortgage Securities Trust, Series 2006-1, Class A2B, (LIBOR USD 1 Month + 0.15%), 2.66%, 08/25/36(a) | | | | | | | 548 | | | | 334,858 | |
GSAMP Trust(a): | | | | | | | | | | | | |
Series 2007-H1, Class A1B, (LIBOR USD 1 Month + 0.20%), 2.71%, 01/25/47 | | | | | | | 30 | | | | 18,701 | |
Series 2007-HS1, Class M6, (LIBOR USD 1 Month + 2.25%), 4.76%, 02/25/47 | | | | | | | 25 | | | | 25,269 | |
Halcyon Loan Advisors Funding Ltd., Series 2015-2A, Class AR, (LIBOR USD 3 Month + 1.08%), 3.57%, 07/25/27(a)(b) | | | | | | | 250 | | | | 249,942 | |
Home Equity Asset Trust, Series 2007-1, Class 2A3, (LIBOR USD 1 Month + 0.15%), 2.66%, 05/25/37(a) | | | | | | | 40 | | | | 32,580 | |
Home Equity Mortgage Loan Asset-Backed Trust, Series 2007-B, Class 2A3, (LIBOR USD 1 Month + 0.20%), 2.71%, 07/25/37(a) | | | | | | | 77 | | | | 48,114 | |
Home Equity Mortgage Trust, Series 2006-2, Class 1A1, 5.87%, 07/25/36(d) | | | | | | | 169 | | | | 56,355 | |
Home Loan Mortgage Loan Trust, Series 2005-1, Class A3, (LIBOR USD 1 Month + 0.72%), 3.18%, 04/15/36(a) | | | | | | | 42 | | | | 38,340 | |
ICG US CLO Ltd., Series 2015-1A, Class A1R, (LIBOR USD 3 Month + 1.14%), 3.59%, 10/19/28(a)(b) | | | | | | | 250 | | | | 247,771 | |
Invitation Homes Trust, Series 2018-SFR3, Class E, (LIBOR USD 1 Month + 2.00%), 4.46%, 07/17/37(a)(b) | | | | | | | 100 | | | | 98,997 | |
IXIS Real Estate Capital Trust, Series 2007-HE1, Class A4, (LIBOR USD 1 Month + 0.23%), 2.74%, 05/25/37(a) | | | | | | | 704 | | | | 235,082 | |
KKR CLO 23 Ltd., Series 23, Class B, (LIBOR USD 3 Month + 1.75%), 4.24%, 10/20/31(a)(b) | | | | | | | 250 | | | | 245,266 | |
Lehman ABS Manufactured Housing Contract Trust: | | | | | | | | | | | | |
Series 2001-B, Class M1, 6.63%, 04/15/40(c) | | | | | | | 130 | | | | 136,162 | |
Series 2002-A, Class C, 0.00%, 06/15/33 | | | | | | | 9 | | | | 6,698 | |
Lendmark Funding Trust, Series 2017-1A, Class A, 2.83%, 12/22/25(b) | | | | | | | 210 | | | | 207,196 | |
Litigation Fee Residual Funding LLC, Series 2015-1, Class A, 4.00%, 10/30/27(e) | | | | | | | 126 | | | | 125,656 | |
LoanCore Issuer Ltd., Series 2018-CRE1, Class A, (LIBOR USD 1 Month + 1.13%), 3.59%, 05/15/28(a)(b) | | | | | | | 100 | | | | 99,471 | |
Long Beach Mortgage Loan Trust(a): | | | | | | | | | | | | |
Series 2006-2, Class 1A, (LIBOR USD 1 Month + 0.18%), 2.69%, 03/25/46 | | | | | | | 99 | | | | 73,481 | |
Series 2006-3, Class 2A3, (LIBOR USD 1 Month + 0.18%), 2.69%, 05/25/46 | | | | | | | 29 | | | | 11,677 | |
| | | | | | | | | | | | |
| Security | | | | | Par
(000) | | | Value | |
|
| Asset-Backed Securities (continued) | |
Series 2006-5, Class 2A3, (LIBOR USD 1 Month + 0.15%), 2.66%, 06/25/36 | | | USD | | | | 28 | | | $ | 15,364 | |
Series 2006-7, Class 2A3, (LIBOR USD 1 Month + 0.16%), 2.67%, 08/25/36 | | | | | | | 17 | | | | 9,130 | |
Series 2006-9, Class 2A2, (LIBOR USD 1 Month + 0.11%), 2.62%, 10/25/36 | | | | | | | 22 | | | | 9,406 | |
Series 2006-10, Class 2A4, (LIBOR USD 1 Month + 0.22%), 2.73%, 11/25/36 | | | | | | | 15 | | | | 6,456 | |
Madison Park Funding XVIII Ltd., Series 2015-18A, Class A1R, (LIBOR USD 3 Month + 1.19%), 3.66%, 10/21/30(a)(b) | | | | | | | 250 | | | | 247,136 | |
Merrill Lynch First Franklin Mortgage Loan Trust, Series 2007-2, Class A2C, (LIBOR USD 1 Month + 0.24%), 2.75%, 05/25/37(a) | | | | | | | 25 | | | | 16,811 | |
Morgan Stanley ABS Capital I, Inc. Trust(a): | | | | | | | | | | | | |
Series 2005-HE1, Class A2MZ, (LIBOR USD 1 Month + 0.60%), 3.11%, 12/25/34 | | | | | | | 78 | | | | 76,417 | |
Series 2007-NC1, Class A1, (LIBOR USD 1 Month + 0.13%), 2.64%, 11/25/36 | | | | | | | 199 | | | | 118,345 | |
Morgan Stanley Mortgage Loan Trust, Series 2007-9SL, Class A, (LIBOR USD 1 Month + 0.32%), 2.83%, 07/25/37(a) | | | | | | | 20 | | | | 19,154 | |
MP CLO VIII Ltd., Series 2015-2A, Class AR, (LIBOR USD 3 Month + 0.91%), 3.42%,
10/28/27(a)(b) | | | | | | | 250 | | | | 247,488 | |
Navient Private Education Loan Trust(b): | | | | | | | | | | | | |
Series 2014-CTA, Class B, (LIBOR USD 1 Month + 1.75%), 4.21%,
10/17/44(a) | | | | | | | 250 | | | | 253,274 | |
Series 2016-AA, Class B, 3.50%, 12/16/58(c) | | | | | | | 100 | | | | 95,532 | |
Oakwood Mortgage Investors, Inc., Series 2001-D, Class A4, 6.93%, 09/15/31(c) | | | | | | | 13 | | | | 11,204 | |
OCP CLO Ltd., Series 2016-12A, Class A1R, (LIBOR USD 3 Month + 1.12%), 3.56%,
10/18/28(a)(b) | | | | | | | 100 | | | | 99,387 | |
Octagon Investment Partners 24 Ltd.(a)(b): | | | | | | | | | | | | |
Series 2015-1A, Class A1R, (LIBOR USD 3 Month + 0.90%), 3.54%, 05/21/27 | | | | | | | 250 | | | | 249,308 | |
Series 2015-1A, Class A2AR, (LIBOR USD 3 Month + 1.35%), 3.99%, 05/21/27 | | | | | | | 250 | | | | 243,355 | |
Octagon Investment Partners 33 Ltd., Series 2017-1A, Class A1, (LIBOR USD 3 Month + 1.19%), 3.66%, 01/20/31(a)(b) | | | | | | | 250 | | | | 248,480 | |
Octagon Investment Partners XVI Ltd., Series 2013-1A, Class A1R, (LIBOR USD 3 Month + 1.02%), 3.36%, 07/17/30(a)(b) | | | | | | | 305 | | | | 300,407 | |
OFSI Fund VI Ltd., Series 2014-6A, Class A2R, (LIBOR USD 3 Month + 1.13%), 3.57%,
03/20/25(a)(b) | | | | | | | 210 | | | | 209,131 | |
OHA Loan Funding Ltd., Series 2013-2A, Class AR, (LIBOR USD 3 Month + 1.04%), 3.72%, 05/23/31(a)(b) | | | | | | | 285 | | | | 280,046 | |
Option One Mortgage Loan Trust: | | | | | | | | | | | | |
Series 2007-CP1, Class 2A3, (LIBOR USD 1 Month + 0.21%), 2.72%, 03/25/37(a) | | | | | | | 40 | | | | 26,161 | |
Series 2007-FXD1, Class 1A1, 5.87%,
01/25/37(d) | | | | | | | 43 | | | | 39,937 | |
Series 2007-FXD1, Class 2A1, 5.87%,
01/25/37(d) | | | | | | | 52 | | | | 48,449 | |
Series 2007-FXD2, Class 1A1, 5.82%,
03/25/37(d) | | | | | | | 191 | | | | 186,691 | |
Origen Manufactured Housing Contract Trust, Series 2007-B, Class A1, (LIBOR USD 1 Month + 1.20%), 3.66%, 10/15/37(a)(b)(e) | | | | | | | 37 | | | | 35,685 | |
Ownit Mortgage Loan Trust, Series 2006-2, Class A2C, 6.00%, 01/25/37(d) | | | | | | | 30 | | | | 27,421 | |
OZLM Funding III Ltd., Series 2013-3A, Class BR, (LIBOR USD 3 Month + 3.00%), 5.47%, 01/22/29(a)(b) | | | | | | | 250 | | | | 249,571 | |
OZLM Funding IV Ltd., Series 2013-4A, Class A1R, (LIBOR USD 3 Month + 1.25%), 3.72%,
10/22/30(a)(b) | | | | | | | 495 | | | | 492,392 | |
| | |
| 30 | | 2018 BLACKROCK ANNUAL REPORTTO SHAREHOLDERS |
| | |
Schedule of Investments (continued) December 31, 2018 | | BlackRock Balanced Capital Portfolio (Percentages shown are based on Net Assets) |
| | | | | | | | | | | | |
| Security | | | | | Par
(000) | | | Value | |
|
| Asset-Backed Securities (continued) | |
OZLM XXI Ltd., Series 2017-21A, Class B, (LIBOR USD 3 Month + 1.90%), 4.37%, 01/20/31(a)(b) | | | USD | | | | 250 | | | $ | 236,681 | |
Parallel Ltd., Series 2015-1A, Class AR, (LIBOR USD 3 Month + 0.85%), 3.32%, 07/20/27(a)(b) | | | | | | | 250 | | | | 247,542 | |
PRPM LLC, Series 2017-1A, Class A1, 4.25%, 01/25/22(b)(d) | | | | | | | 27 | | | | 26,855 | |
RAMP Trust, Series 2006-RS6, Class A4, (LIBOR USD 1 Month + 0.27%), 2.78%, 11/25/36(a) | | | | | | | 104 | | | | 87,060 | |
Regatta VI Funding Ltd., Series 2016-1A, Class AR, (LIBOR USD 3 Month + 1.08%), 3.55%, 07/20/28(a)(b) | | | | | | | 250 | | | | 248,206 | |
Rockford Tower CLO Ltd., Series 2017-1A, Class B, (LIBOR USD 3 Month + 1.80%), 4.24%, 04/15/29(a)(b) | | | | | | | 250 | | | | 250,109 | |
Scholar Funding Trust, Series 2013-A, Class A, (LIBOR USD 1 Month + 0.65%), 3.16%, 01/30/45(a)(b) | | | | | | | 202 | | | | 200,755 | |
Securitized Asset-Backed Receivables LLC Trust, Series 2006-WM4, Class A1, (LIBOR USD 1 Month + 0.19%),
2.70%, 11/25/36(a)(b) | | | | | | | 43 | | | | 25,343 | |
SG Mortgage Securities Trust, Series 2006-FRE2, Class A2C, (LIBOR USD 1 Month + 0.16%), 2.67%, 07/25/36(a) | | | | | | | 18 | | | | 5,553 | |
Silver Creek CLO Ltd., Series 2014-1A, Class AR, (LIBOR USD 3 Month + 1.24%), 3.71%, 07/20/30(a)(b) | | | | | | | 250 | | | | 249,298 | |
SLM Private Credit Student Loan Trust(a): | | | | | | | | | | | | |
Series 2004-B, Class A3, (LIBOR USD 3 Month + 0.33%), 3.12%, 03/15/24 | | | | | | | 139 | | | | 138,034 | |
Series 2005-A, Class A3, (LIBOR USD 3 Month + 0.20%), 2.99%, 06/15/23 | | | | | | | 58 | | | | 57,917 | |
Sound Point CLO XII Ltd., Series 2016-2A, Class A, (LIBOR USD 3 Month + 1.66%), 4.13%, 10/20/28(a)(b) | | | | | | | 250 | | | | 249,961 | |
Sound Point CLO XIV Ltd., Series 2016-3A, Class C, (LIBOR USD 3 Month + 2.65%), 5.13%, 01/23/29(a)(b) | | | | | | | 250 | | | | 246,177 | |
Springleaf Funding Trust, Series 2015-AA, Class B, 3.62%, 11/15/24(b) | | | | | | | 320 | | | | 319,486 | |
Structured Asset Investment Loan Trust, Series 2004-8, Class M4, (LIBOR USD 1 Month + 1.50%), 4.01%, 09/25/34(a) | | | | | | | 44 | | | | 43,526 | |
Structured Asset Securities Corp. Mortgage Pass-Through Certificates, Series 2004-23XS, Class 2A1, (LIBOR USD 1 Month + 0.30%), 2.81%, 01/25/35(a) | | | | | | | 60 | | | | 58,544 | |
Symphony CLO XII Ltd., Series 2013-12A, Class AR, (LIBOR USD 3 Month + 1.03%), 3.47%, 10/15/25(a)(b) | | | | | | | 354 | | | | 352,401 | |
Symphony CLO XVII Ltd., Series 2016-17A, Class AR, (LIBOR USD 3 Month + 0.88%), 3.32%, 04/15/28(a)(b) | | | | | | | 250 | | | | 248,030 | |
TCI-Flatiron CLO Ltd., Series 2017-1A, Class A, (LIBOR USD 3 Month + 1.20%), 3.84%, 11/17/30(a)(b) | | | | | | | 250 | | | | 248,687 | |
Union Pacific Railroad Co. Pass-Through Trust,Series 2014-1, 3.23%, 05/14/26 | | | | | | | 55 | | | | 54,196 | |
Venture CDO Ltd., Series 2018-35A, Class AS, (LIBOR USD 3 Month + 1.15%), 3.65%, 10/22/31(a)(b) | | | | | | | 250 | | | | 249,545 | |
Wachovia Asset Securitization Issuance II LLC Trust, Series 2007-HE2A, Class A, (LIBOR USD 1 Month + 0.13%), 2.64%, 07/25/37(a)(b) | | | | | | | 66 | | | | 63,148 | |
Washington Mutual Asset-Backed CertificatesTrust, Series 2007-HE2, Class 2A2, (LIBOR USD 1 Month + 0.22%), 2.73%, 02/25/37(a) | | | | | | | 93 | | | | 39,764 | |
West CLO Ltd., Series 2013-1A, Class A1AR, (LIBOR USD 3 Month + 1.16%), 3.75%, 11/07/25(a)(b) | | | | | | | 74 | | | | 74,367 | |
| | | | | | | | | | | | |
| |
Total Asset-Backed Securities — 4.2%
(Cost: $19,244,552) | | | | 19,050,193 | |
| | | | | | | | | | | | |
| | | | | | | | | | | | |
Security | | | | | Shares | | | Value | |
|
| Common Stocks — 59.6% | |
|
| Aerospace & Defense — 1.4% | |
Boeing Co. (The) | | | | | | | 7,001 | | | $ | 2,257,822 | |
General Dynamics Corp. | | | | | | | 1,503 | | | | 236,287 | |
Lockheed Martin Corp. | | | | | | | 3,377 | | | | 884,234 | |
Raytheon Co. | | | | | | | 19,771 | | | | 3,031,883 | |
United Technologies Corp. | | | | | | | 1 | | | | 106 | |
| | | | | | | | | | | | |
| | | | | | | | | | | 6,410,332 | |
|
| Airlines — 0.3% | |
Delta Air Lines, Inc. | | | | | | | 3,814 | | | | 190,318 | |
Southwest Airlines Co. | | | | | | | 21,883 | | | | 1,017,122 | |
| | | | | | | | | | | | |
| | | | | | | | | | | 1,207,440 | |
|
| Auto Components — 0.0% | |
BorgWarner, Inc. | | | | | | | 5,780 | | | | 200,797 | |
| | | | | | | | | | | | |
| | | |
| Automobiles — 0.1% | | | | | | | | | |
Ford Motor Co. | | | | | | | 15,036 | | | | 115,025 | |
General Motors Co. | | | | | | | 5,150 | | | | 172,268 | |
| | | | | | | | | | | | |
| | | | | | | | | | | 287,293 | |
|
| Banks — 3.5% | |
Bank of America Corp. | | | | | | | 219,131 | | | | 5,399,388 | |
BB&T Corp. | | | | | | | 29,603 | | | | 1,282,402 | |
Citigroup, Inc. | | | | | | | 25,139 | | | | 1,308,736 | |
Citizens Financial Group, Inc. | | | | | | | 39,380 | | | | 1,170,767 | |
Cullen/Frost Bankers, Inc. | | | | | | | 1,934 | | | | 170,076 | |
East West Bancorp, Inc. | | | | | | | 8,275 | | | | 360,211 | |
First Republic Bank(f) | | | | | | | 15,875 | | | | 1,379,538 | |
JPMorgan Chase & Co. | | | | | | | 29,778 | | | | 2,906,928 | |
Wells Fargo & Co. | | | | | | | 43,433 | | | | 2,001,393 | |
| | | | | | | | | | | | |
| | | | | | | | | | | 15,979,439 | |
|
| Beverages — 0.9% | |
Coca-Cola European Partners plc | | | | | | | 17,940 | | | | 822,549 | |
Constellation Brands, Inc., Class A | | | | | | | 3,465 | | | | 557,241 | |
Keurig Dr. Pepper, Inc. | | | | | | | 2,048 | | | | 52,511 | |
Molson Coors Brewing Co., Class B | | | | | | | 1,993 | | | | 111,927 | |
Monster Beverage Corp.(g) | | | | | | | 13,201 | | | | 649,753 | |
PepsiCo, Inc. | | | | | | | 16,612 | | | | 1,835,294 | |
| | | | | | | | | | | | |
| | | | | | | | | | | 4,029,275 | |
|
| Biotechnology — 2.4% | |
AbbVie, Inc. | | | | | | | 25,936 | | | | 2,391,040 | |
Amgen, Inc. | | | | | | | 11,533 | | | | 2,245,129 | |
Biogen, Inc.(g) | | | | | | | 1,819 | | | | 547,373 | |
Celgene Corp.(g) | | | | | | | 27,743 | | | | 1,778,049 | |
Genomic Health, Inc.(g) | | | | | | | 2,141 | | | | 137,902 | |
Gilead Sciences, Inc. | | | | | | | 47,472 | | | | 2,969,374 | |
Incyte Corp.(g) | | | | | | | 1,267 | | | | 80,569 | |
Regeneron Pharmaceuticals, Inc.(g) | | | | | | | 602 | | | | 224,847 | |
Vertex Pharmaceuticals, Inc.(g) | | | | | | | 3,209 | | | | 531,763 | |
| | | | | | | | | | | | |
| | | | | | | | | | | 10,906,046 | |
|
| Building Products — 0.2% | |
Allegion plc | | | | | | | 9,596 | | | | 764,897 | |
| | | | | | | | | | | | |
| | | |
| Capital Markets — 2.0% | | | | | | | | | |
Charles Schwab Corp. (The) | | | | | | | 64,621 | | | | 2,683,710 | |
CME Group, Inc.(f) | | | | | | | 6,800 | | | | 1,279,216 | |
Evercore, Inc., Class A | | | | | | �� | 3,112 | | | | 222,695 | |
Moelis & Co., Class A | | | | | | | 13,487 | | | | 463,683 | |
Morgan Stanley | | | | | | | 89,026 | | | | 3,529,881 | |
S&P Global, Inc. | | | | | | | 5,961 | | | | 1,013,012 | |
SEI Investments Co. | | | | | | | 1,355 | | | | 62,601 | |
TD Ameritrade Holding Corp.(f) | | | | | | | 754 | | | | 36,916 | |
| | | | | | | | | | | | |
| | | | | | | | | | | 9,291,714 | |
| | | | |
| SCHEDULES OF INVESTMENTS | | | 31 | |
| | |
Schedule of Investments (continued) December 31, 2018 | | BlackRock Balanced Capital Portfolio (Percentages shown are based on Net Assets) |
| | | | | | | | | | | | |
Security | | | | | Shares | | | Value | |
|
| Chemicals — 1.0% | |
Air Products & Chemicals, Inc. | | | | | | | 16,032 | | | $ | 2,565,921 | |
Celanese Corp.(f) | | | | | | | 6,594 | | | | 593,262 | |
Eastman Chemical Co. | | | | | | | 6,288 | | | | 459,716 | |
Ecolab, Inc. | | | | | | | 5,135 | | | | 756,642 | |
Huntsman Corp. | | | | | | | 3,844 | | | | 74,151 | |
Linde plc | | | | | | | 1,157 | | | | 180,538 | |
Mosaic Co. (The) | | | | | | | 1,099 | | | | 32,102 | |
| | | | | | | | | | | | |
| | | | | | | | | | | 4,662,332 | |
|
| Commercial Services & Supplies — 0.1% | |
Clean Harbors, Inc.(g) | | | | | | | 6,645 | | | | 327,931 | |
Waste Connections, Inc. | | | | | | | 1,425 | | | | 105,806 | |
| | | | | | | | | | | | |
| | | | | | | | | | | 433,737 | |
|
| Communications Equipment — 0.6% | |
Ciena Corp.(g) | | | | | | | 11,310 | | | | 383,522 | |
Cisco Systems, Inc. | | | | | | | 35,219 | | | | 1,526,039 | |
Motorola Solutions, Inc. | | | | | | | 5,459 | | | | 628,003 | |
Palo Alto Networks, Inc.(f)(g) | | | | | | | 1,607 | | | | 302,679 | |
| | | | | | | | | | | | |
| | | | | | | | | | | 2,840,243 | |
|
| Construction Materials — 0.0% | |
Martin Marietta Materials, Inc. | | | | | | | 562 | | | | 96,591 | |
Vulcan Materials Co. | | | | | | | 727 | | | | 71,827 | |
| | | | | | | | | | | | |
| | | | | | | | | | | 168,418 | |
|
| Consumer Finance — 0.5% | |
American Express Co. | | | | | | | 20,080 | | | | 1,914,025 | |
Capital One Financial Corp. | | | | | | | 2,466 | | | | 186,405 | |
| | | | | | | | | | | | |
| | | | | | | | | | | 2,100,430 | |
|
| Containers & Packaging — 0.2% | |
Packaging Corp. of America | | | | | | | 5,013 | | | | 418,385 | |
WestRock Co. | | | | | | | 12,720 | | | | 480,307 | |
| | | | | | | | | | | | |
| | | | | | | | | | | 898,692 | |
|
| Distributors — 0.0% | |
Genuine Parts Co. | | | | | | | 276 | | | | 26,501 | |
| | | | | | | | | | | | |
|
| Diversified Consumer Services — 0.1% | |
H&R Block, Inc. | | | | | | | 21,027 | | | | 533,455 | |
| | | | | | | | | | | | |
|
| Diversified Financial Services — 0.9% | |
Berkshire Hathaway, Inc., Class B(g) | | | | | | | 20,444 | | | | 4,174,256 | |
| | | | | | | | | | | | |
|
| Diversified Telecommunication Services — 0.8% | |
AT&T, Inc. | | | | | | | 36,593 | | | | 1,044,364 | |
Verizon Communications, Inc. | | | | | | | 47,164 | | | | 2,651,560 | |
| | | | | | | | | | | | |
| | | | | | | | | | | 3,695,924 | |
|
| Electric Utilities — 1.1% | |
IDACORP, Inc. | | | | | | | 6,194 | | | | 576,414 | |
OGE Energy Corp. | | | | | | | 25,575 | | | | 1,002,284 | |
Pinnacle West Capital Corp. | | | | | | | 23,369 | | | | 1,991,039 | |
Portland General Electric Co. | | | | | | | 33,333 | | | | 1,528,318 | |
Xcel Energy, Inc. | | | | | | | 2,461 | | | | 121,253 | |
| | | | | | | | | | | | |
| | | | | | | | | | | 5,219,308 | |
|
| Electrical Equipment — 0.5% | |
AMETEK, Inc. | | | | | | | 8,688 | | | | 588,178 | |
Rockwell Automation, Inc. | | | | | | | 12,584 | | | | 1,893,640 | |
| | | | | | | | | | | | |
| | | | | | | | | | | 2,481,818 | |
|
| Electronic Equipment, Instruments & Components — 0.5% | |
CDW Corp. | | | | | | | 12,491 | | | | 1,012,396 | |
Keysight Technologies, Inc.(g) | | | | | | | 800 | | | | 49,664 | |
National Instruments Corp. | | | | | | | 25,956 | | | | 1,177,883 | |
Zebra Technologies Corp., Class A(g) | | | | | | | 1,074 | | | | 171,013 | |
| | | | | | | | | | | | |
| | | | | | | | | | | 2,410,956 | |
| | | | | | | | | | | | |
Security | | | | | Shares | | | Value | |
|
| Energy Equipment & Services — 0.3% | |
Halliburton Co. | | | | | | | 47,006 | | | $ | 1,249,419 | |
Nabors Industries Ltd.(f) | | | | | | | 25,697 | | | | 51,394 | |
| | | | | | | | | | | | |
| | | | | | | | | | | 1,300,813 | |
|
| Entertainment — 0.7% | |
Activision Blizzard, Inc. | | | | | | | 1,937 | | | | 90,206 | |
Electronic Arts, Inc.(g) | | | | | | | 8,870 | | | | 699,932 | |
Netflix, Inc.(g) | | | | | | | 3,398 | | | | 909,509 | |
Twenty-First Century Fox, Inc., Class A | | | | | | | 3,261 | | | | 156,919 | |
Twenty-First Century Fox, Inc., Class B | | | | | | | 4,001 | | | | 191,168 | |
Viacom, Inc., Class B | | | | | | | 28,085 | | | | 721,784 | |
Walt Disney Co. (The) | | | | | | | 296 | | | | 32,456 | |
World Wrestling Entertainment, Inc., Class A(f) | | | | | | | 3,122 | | | | 233,276 | |
| | | | | | | | | | | | |
| | | | | | | | | | | 3,035,250 | |
|
| Equity Real Estate Investment Trusts (REITs) — 2.3% | |
Equity LifeStyle Properties, Inc. | | | | | | | 3,153 | | | | 306,251 | |
Host Hotels & Resorts, Inc. | | | | | | | 68,633 | | | | 1,144,112 | |
Outfront Media, Inc. | | | | | | | 4,675 | | | | 84,711 | |
Park Hotels & Resorts, Inc. | | | | | | | 45,787 | | | | 1,189,546 | |
Prologis, Inc. | | | | | | | 57,711 | | | | 3,388,790 | |
Realty Income Corp. | | | | | | | 33,200 | | | | 2,092,928 | |
Simon Property Group, Inc. | | | | | | | 12,210 | | | | 2,051,158 | |
| | | | | | | | | | | | |
| | | | | | | | | | | 10,257,496 | |
|
| Food & Staples Retailing — 0.6% | |
Costco Wholesale Corp. | | | | | | | 11,837 | | | | 2,411,315 | |
Walmart, Inc. | | | | | | | 3,369 | | | | 313,823 | |
| | | | | | | | | | | | |
| | | | | | | | | | | 2,725,138 | |
| | | |
| Food Products — 1.2% | | | | | | | | | |
Archer-Daniels-Midland Co. | | | | | | | 53,515 | | | | 2,192,510 | |
Hershey Co. (The) | | | | | | | 25,686 | | | | 2,753,025 | |
Hormel Foods Corp.(f) | | | | | | | 2,422 | | | | 103,371 | |
Kellogg Co. | | | | | | | 1,498 | | | | 85,401 | |
Lamb Weston Holdings, Inc. | | | | | | | 2,710 | | | | 199,348 | |
Tyson Foods, Inc., Class A | | | | | | | 2,603 | | | | 139,000 | |
| | | | | | | | | | | | |
| | | | | | | | | | | 5,472,655 | |
|
| Gas Utilities — 0.3% | |
Atmos Energy Corp. | | | | | | | 13,280 | | | | 1,231,322 | |
UGI Corp. | | | | | | | 1,535 | | | | 81,892 | |
| | | | | | | | | | | | |
| | | | | | | | | | | 1,313,214 | |
|
| Health Care Equipment & Supplies — 1.8% | |
Abbott Laboratories | | | | | | | 12,047 | | | | 871,360 | |
Danaher Corp. | | | | | | | 17,145 | | | | 1,767,992 | |
DexCom, Inc.(g) | | | | | | | 490 | | | | 58,702 | |
IDEXX Laboratories, Inc.(g) | | | | | | | 1,680 | | | | 312,514 | |
Intuitive Surgical, Inc.(g) | | | | | | | 1,538 | | | | 736,579 | |
Masimo Corp.(g) | | | | | | | 4,741 | | | | 509,041 | |
Medtronic plc | | | | | | | 9,391 | | | | 854,205 | |
STERIS plc | | | | | | | 3,868 | | | | 413,296 | |
Stryker Corp. | | | | | | | 16,889 | | | | 2,647,351 | |
| | | | | | | | | | | | |
| | | | | | | | | | | 8,171,040 | |
|
| Health Care Providers & Services — 2.1% | |
AmerisourceBergen Corp. | | | | | | | 11,881 | | | | 883,946 | |
Anthem, Inc. | | | | | | | 558 | | | | 146,548 | |
Cardinal Health, Inc. | | | | | | | 22,835 | | | | 1,018,441 | |
CVS Health Corp. | | | | | | | 8,348 | | | | 546,961 | |
Halfmoon Parent, Inc. | | | | | | | 1,570 | | | | 298,144 | |
Humana, Inc. | | | | | | | 3,606 | | | | 1,033,047 | |
McKesson Corp. | | | | | | | 9,833 | | | | 1,086,251 | |
Quest Diagnostics, Inc. | | | | | | | 1,544 | | | | 128,569 | |
UnitedHealth Group, Inc. | | | | | | | 17,015 | | | | 4,238,777 | |
WellCare Health Plans, Inc.(g) | | | | | | | 1,565 | | | | 369,481 | |
| | | | | | | | | | | | |
| | | | | | | | | | | 9,750,165 | |
| | |
| 32 | | 2018 BLACKROCK ANNUAL REPORTTO SHAREHOLDERS |
| | |
Schedule of Investments (continued) December 31, 2018 | | BlackRock Balanced Capital Portfolio (Percentages shown are based on Net Assets) |
| | | | | | | | | | | | |
Security | | | | | Shares | | | Value | |
|
| Health Care Technology — 0.2%(g) | |
athenahealth, Inc. | | | | | | | 457 | | | $ | 60,292 | |
Cerner Corp. | | | | | | | 1,033 | | | | 54,170 | |
Veeva Systems, Inc., Class A | | | | | | | 9,306 | | | | 831,212 | |
| | | | | | | | | | | | |
| | | | | | | | | | | 945,674 | |
|
| Hotels, Restaurants & Leisure — 1.3% | |
Carnival Corp. | | | | | | | 13,828 | | | | 681,720 | |
Darden Restaurants, Inc. | | | | | | | 5,372 | | | | 536,448 | |
Domino’s Pizza, Inc. | | | | | | | 4,995 | | | | 1,238,710 | |
Dunkin’ Brands Group, Inc.(f) | | | | | | | 5,001 | | | | 320,664 | |
Extended Stay America, Inc. | | | | | | | 20,965 | | | | 324,958 | |
Hilton Worldwide Holdings, Inc. | | | | | | | 8,127 | | | | 583,519 | |
Las Vegas Sands Corp. | | | | | | | 4,508 | | | | 234,641 | |
McDonald’s Corp. | | | | | | | 7,752 | | | | 1,376,523 | |
Norwegian Cruise Line Holdings Ltd.(g) | | | | | | | 11,362 | | | | 481,635 | |
Yum! Brands, Inc. | | | | | | | 1,385 | | | | 127,309 | |
| | | | | | | | | | | | |
| | | | | | | | | | | 5,906,127 | |
|
| Household Durables — 0.2% | |
Garmin Ltd. | | | | | | | 13,892 | | | | 879,641 | |
| | | | | | | | | | | | |
|
| Household Products — 0.5% | |
Church & Dwight Co., Inc. | | | | | | | 25,155 | | | | 1,654,193 | |
Clorox Co. (The) | | | | | | | 1,152 | | | | 177,569 | |
Procter & Gamble Co. (The) | | | | | | | 2,879 | | | | 264,638 | |
| | | | | | | | | | | | |
| | | | | | | | | | | 2,096,400 | |
|
| Industrial Conglomerates — 0.5% | |
3M Co.(f) | | | | | | | 8,943 | | | | 1,703,999 | |
General Electric Co. | | | | | | | 42,756 | | | | 323,663 | |
Honeywell International, Inc. | | | | | | | 1,726 | | | | 228,039 | |
Roper Technologies, Inc. | | | | | | | 430 | | | | 114,604 | |
| | | | | | | | | | | | |
| | | | | | | | | | | 2,370,305 | |
|
| Insurance — 1.4% | |
Allstate Corp. (The) | | | | | | | 20,247 | | | | 1,673,010 | |
American Financial Group, Inc. | | | | | | | 8,786 | | | | 795,397 | |
Arthur J Gallagher & Co.(f) | | | | | | | 8,272 | | | | 609,646 | |
Athene Holding Ltd., Class A(g) | | | | | | | 9,624 | | | | 383,324 | |
First American Financial Corp. | | | | | | | 11,938 | | | | 532,912 | |
Hartford Financial Services Group, Inc. (The) | | | | | | | 15,578 | | | | 692,442 | |
Lincoln National Corp. | | | | | | | 4,587 | | | | 235,359 | |
Loews Corp. | | | | | | | 686 | | | | 31,227 | |
Progressive Corp. (The) | | | | | | | 6,234 | | | | 376,097 | |
Unum Group | | | | | | | 30,098 | | | | 884,279 | |
| | | | | | | | | | | | |
| | | | | | | | | | | 6,213,693 | |
|
| Interactive Media & Services — 2.7%(g) | |
Alphabet, Inc., Class A | | | | | | | 3,001 | | | | 3,135,925 | |
Alphabet, Inc., Class C | | | | | | | 3,525 | | | | 3,650,525 | |
Cargurus, Inc. | | | | | | | 5,100 | | | | 172,023 | |
Facebook, Inc., Class A | | | | | | | 32,550 | | | | 4,266,980 | |
Snap, Inc., Class A(f) | | | | | | | 7,188 | | | | 39,606 | |
TripAdvisor, Inc. | | | | | | | 1,279 | | | | 68,989 | |
Twitter, Inc. | | | | | | | 3,571 | | | | 102,631 | |
Yelp, Inc. | | | | | | | 16,558 | | | | 579,364 | |
| | | | | | | | | | | | |
| | | | | | | | | | | 12,016,043 | |
|
| Internet & Direct Marketing Retail — 1.8%(g) | |
Amazon.com, Inc. | | | | | | | 5,034 | | | | 7,560,917 | |
Booking Holdings, Inc. | | | | | | | 249 | | | | 428,883 | |
| | | | | | | | | | | | |
| | | | | | | | | | | 7,989,800 | |
|
| IT Services — 2.8% | |
Accenture plc, Class A | | | | | | | 6,198 | | | | 873,980 | |
Amdocs Ltd. | | | | | | | 609 | | | | 35,675 | |
Automatic Data Processing, Inc. | | | | | | | 16,986 | | | | 2,227,204 | |
Booz Allen Hamilton Holding Corp. | | | | | | | 26,582 | | | | 1,198,051 | |
| | | | | | | | | | | | |
Security | | | | | Shares | | | Value | |
|
| IT Services (continued) | |
Broadridge Financial Solutions, Inc. | | | | | | | 3,649 | | | $ | 351,216 | |
Cognizant Technology Solutions Corp., Class A | | | | | | | 1,084 | | | | 68,812 | |
Fidelity National Information Services, Inc. | | | | | | | 10,447 | | | | 1,071,340 | |
First Data Corp., Class A(f)(g) | | | | | | | 6,963 | | | | 117,744 | |
GoDaddy, Inc., Class A(f)(g) | | | | | | | 11,247 | | | | 738,028 | |
International Business Machines Corp. | | | | | | | 6,405 | | | | 728,056 | |
Mastercard, Inc., Class A | | | | | | | 14,516 | | | | 2,738,444 | |
Paychex, Inc. | | | | | | | 1,987 | | | | 129,453 | |
PayPal Holdings, Inc.(g) | | | | | | | 5,408 | | | | 454,759 | |
Square, Inc., Class A(g) | | | | | | | 2,437 | | | | 136,691 | |
Total System Services, Inc. | | | | | | | 324 | | | | 26,338 | |
Visa, Inc., Class A | | | | | | | 6,344 | | | | 837,028 | |
Western Union Co. (The) | | | | | | | 47,546 | | | | 811,135 | |
| | | | | | | | | | | | |
| | | | | | | | | | | 12,543,954 | |
|
| Life Sciences Tools & Services — 0.2% | |
Agilent Technologies, Inc. | | | | | | | 9,348 | | | | 630,616 | |
Thermo Fisher Scientific, Inc. | | | | | | | 386 | | | | 86,383 | |
| | | | | | | | | | | | |
| | | | | | | | | | | 716,999 | |
|
| Machinery — 2.0% | |
Crane Co. | | | | | | | 34,462 | | | | 2,487,467 | |
Illinois Tool Works, Inc. | | | | | | | 15,783 | | | | 1,999,548 | |
Ingersoll-Rand plc | | | | | | | 22,883 | | | | 2,087,616 | |
PACCAR, Inc. | | | | | | | 30,661 | | | | 1,751,970 | |
Snap-on, Inc.(f) | | | | | | | 4,293 | | | | 623,730 | |
| | | | | | | | | | | | |
| | | | | | | | | | | 8,950,331 | |
|
| Media — 1.2% | |
AMC Networks, Inc., Class A(g) | | | | | | | 11,972 | | | | 657,024 | |
CBS Corp. (Non-Voting), Class B | | | | | | | 13,532 | | | | 591,619 | |
Comcast Corp., Class A | | | | | | | 53,523 | | | | 1,822,458 | |
Interpublic Group of Cos., Inc. (The) | | | | | | | 27,779 | | | | 573,081 | |
Liberty Media Corp.-Liberty SiriusXM, Class A(g) | | | | | | | 17,898 | | | | 658,646 | |
Liberty Media Corp.-Liberty SiriusXM, Class C(g) | | | | | | | 23,054 | | | | 852,537 | |
Sinclair Broadcast Group, Inc., Class A | | | | | | | 2,105 | | | | 55,446 | |
Sirius XM Holdings, Inc. | | | | | | | 18,510 | | | | 105,692 | |
Tribune Media Co., Class A | | | | | | | 1,003 | | | | 45,516 | |
| | | | | | | | | | | | |
| | | | | | | | | | | 5,362,019 | |
|
| Metals & Mining — 0.2% | |
Newmont Mining Corp. | | | | | | | 15,723 | | | | 544,802 | |
Reliance Steel & Aluminum Co. | | | | | | | 3,699 | | | | 263,258 | |
Steel Dynamics, Inc. | | | | | | | 3,498 | | | | 105,080 | |
| | | | | | | | | | | | |
| | | | | | | | | | | 913,140 | |
|
| Multiline Retail — 0.6% | |
Target Corp. | | | | | | | 39,402 | | | | 2,604,078 | |
| | | | | | | | | | | | |
|
| Multi-Utilities — 0.2% | |
CMS Energy Corp. | | | | | | | 3,250 | | | | 161,363 | |
Consolidated Edison, Inc. | | | | | | | 12,344 | | | | 943,822 | |
| | | | | | | | | | | | |
| | | | | | | | | | | 1,105,185 | |
|
| Oil, Gas & Consumable Fuels — 2.7% | |
Anadarko Petroleum Corp. | | | | | | | 33,110 | | | | 1,451,542 | |
Antero Resources Corp.(g) | | | | | | | 2,104 | | | | 19,757 | |
Chevron Corp. | | | | | | | 14,870 | | | | 1,617,707 | |
Concho Resources, Inc.(g) | | | | | | | 965 | | | | 99,192 | |
ConocoPhillips | | | | | | | 32,373 | | | | 2,018,457 | |
Continental Resources, Inc.(g) | | | | | | | 3,715 | | | | 149,306 | |
Exxon Mobil Corp. | | | | | | | 40,844 | | | | 2,785,152 | |
Kinder Morgan, Inc. | | | | | | | 68,705 | | | | 1,056,683 | |
Occidental Petroleum Corp. | | | | | | | 19,498 | | | | 1,196,787 | |
Phillips 66 | | | | | | | 13,043 | | | | 1,123,655 | |
Suncor Energy, Inc.(f) | | | | | | | 18,889 | | | | 528,325 | |
Valero Energy Corp. | | | | | | | 731 | | | | 54,803 | |
Williams Cos., Inc. (The) | | | | | | | 10,517 | | | | 231,900 | |
| | | | | | | | | | | | |
| | | | | | | | | | | 12,333,266 | |
| | | | |
| SCHEDULES OF INVESTMENTS | | | 33 | |
| | |
Schedule of Investments (continued) December 31, 2018 | | BlackRock Balanced Capital Portfolio (Percentages shown are based on Net Assets) |
| | | | | | | | | | | | |
Security | | | | | Shares | | | Value | |
|
| Personal Products — 0.3% | |
Estee Lauder Cos., Inc. (The), Class A | | | | | | | 9,906 | | | $ | 1,288,771 | |
| | | | | | | | | | | | |
|
| Pharmaceuticals — 2.5% | |
Bristol-Myers Squibb Co. | | | | | | | 31,675 | | | | 1,646,467 | |
Eli Lilly & Co. | | | | | | | 17,072 | | | | 1,975,572 | |
Johnson & Johnson | | | | | | | 29,804 | | | | 3,846,206 | |
Merck & Co., Inc. | | | | | | | 39,066 | | | | 2,985,033 | |
Zoetis, Inc. | | | | | | | 11,506 | | | | 984,223 | |
| | | | | | | | | | | | |
| | | | | | | | | | | 11,437,501 | |
|
| Professional Services — 0.4% | |
Insperity, Inc. | | | | | | | 14,250 | | | | 1,330,380 | |
Robert Half International, Inc. | | | | | | | 6,678 | | | | 381,982 | |
| | | | | | | | | | | | |
| | | | | | | | | | | 1,712,362 | |
|
| Road & Rail — 0.5% | |
Landstar System, Inc. | | | | | | | 13,553 | | | | 1,296,616 | |
Norfolk Southern Corp. | | | | | | | 7,206 | | | | 1,077,585 | |
Schneider National, Inc., Class B | | | | | | | 4,500 | | | | 84,015 | |
| | | | | | | | | | | | |
| | | | | | | | | | | 2,458,216 | |
|
| Semiconductors & Semiconductor Equipment — 2.1% | |
Analog Devices, Inc. | | | | | | | 8,637 | | | | 741,314 | |
Applied Materials, Inc. | | | | | | | 25,161 | | | | 823,771 | |
Broadcom, Inc. | | | | | | | 706 | | | | 179,522 | |
Intel Corp. | | | | | | | 68,505 | | | | 3,214,940 | |
Maxim Integrated Products, Inc. | | | | | | | 15,280 | | | | 776,988 | |
NVIDIA Corp. | | | | | | | 6,662 | | | | 889,377 | |
NXP Semiconductors NV(g) | | | | | | | 363 | | | | 26,600 | |
QUALCOMM, Inc. | | | | | | | 6,022 | | | | 342,712 | |
Skyworks Solutions, Inc. | | | | | | | 6,808 | | | | 456,272 | |
Texas Instruments, Inc. | | | | | | | 13,353 | | | | 1,261,858 | |
Xilinx, Inc. | | | | | | | 7,552 | | | | 643,204 | |
| | | | | | | | | | | | |
| | | | | | | | | | | 9,356,558 | |
|
| Software — 3.9% | |
Dropbox, Inc., Class A(g) | | | | | | | 14,094 | | | | 287,941 | |
Intuit, Inc. | | | | | | | 5,451 | | | | 1,073,029 | |
Microsoft Corp. | | | | | | | 85,834 | | | | 8,718,159 | |
New Relic, Inc.(g) | | | | | | | 1,957 | | | | 158,458 | |
Oracle Corp. | | | | | | | 53,796 | | | | 2,428,890 | |
salesforce.com, Inc.(g) | | | | | | | 24,201 | | | | 3,314,811 | |
ServiceNow, Inc.(g) | | | | | | | 399 | | | | 71,042 | |
Synopsys, Inc.(g) | | | | | | | 12,005 | | | | 1,011,301 | |
Ultimate Software Group, Inc. (The)(g) | | | | | | | 631 | | | | 154,513 | |
VMware, Inc., Class A(g) | | | | | | | 2,914 | | | | 399,597 | |
| | | | | | | | | | | | |
| | | | | | | | | | | 17,617,741 | |
|
| Specialty Retail — 1.1% | |
AutoNation, Inc.(g) | | | | | | | 2,667 | | | | 95,212 | |
Best Buy Co., Inc. | | | | | | | 668 | | | | 35,377 | |
Dick’s Sporting Goods, Inc. | | | | | | | 2,042 | | | | 63,711 | |
Five Below, Inc.(g) | | | | | | | 2,525 | | | | 258,358 | |
Home Depot, Inc. (The) | | | | | | | 12,656 | | | | 2,174,554 | |
Penske Automotive Group, Inc. | | | | | | | 18,581 | | | | 749,186 | |
Ross Stores, Inc. | | | | | | | 3,483 | | | | 289,786 | |
TJX Cos., Inc. (The) | | | | | | | 24,922 | | | | 1,115,010 | |
Ulta Beauty, Inc.(g) | | | | | | | 117 | | | | 28,646 | |
| | | | | | | | | | | | |
| | | | | | | | | | | 4,809,840 | |
|
| Technology Hardware, Storage & Peripherals — 2.3% | |
Apple, Inc. | | | | | | | 54,234 | | | | 8,554,871 | |
Dell Technologies, Inc., Class C(g) | | | | | | | 3,994 | | | | 195,170 | |
Hewlett Packard Enterprise Co. | | | | | | | 7,490 | | | | 98,943 | |
HP, Inc. | | | | | | | 52,364 | | | | 1,071,367 | |
Pure Storage, Inc., Class A(g) | | | | | | | 21,522 | | | | 346,074 | |
| | | | | | | | | | | | |
| | | | | | | | | | | 10,266,425 | |
| | | | | | | | | | | | |
Security | | | | | Shares | | | Value | |
|
| Textiles, Apparel & Luxury Goods — 0.6% | |
NIKE, Inc., Class B | | | | | | | 33,186 | | | $ | 2,460,410 | |
Ralph Lauren Corp. | | | | | | | 269 | | | | 27,831 | |
VF Corp. | | | | | | | 5,267 | | | | 375,748 | |
| | | | | | | | | | | | |
| | | | | | | | | | | 2,863,989 | |
|
| Thrifts & Mortgage Finance — 0.0% | |
Essent Group Ltd.(g) | | | | | | | 3,317 | | | | 113,375 | |
| | | | | | | | | | | | |
|
| Tobacco �� 0.4% | |
Altria Group, Inc. | | | | | | | 22,867 | | | | 1,129,401 | |
British American Tobacco plc, ADR | | | | | | | 1 | | | | 32 | |
Philip Morris International, Inc. | | | | | | | 10,984 | | | | 733,292 | |
| | | | | | | | | | | | |
| | | | | | | | | | | 1,862,725 | |
|
| Water Utilities — 0.5% | |
American Water Works Co., Inc. | | | | | | | 24,421 | | | | 2,216,694 | |
| | | | | | | | | | | | |
|
| Wireless Telecommunication Services — 0.1% | |
Telephone & Data Systems, Inc. | | | | | | | 11,451 | | | | 372,616 | |
| | | | | | | | | | | | |
| |
Total Common Stocks — 59.6%
(Cost: $285,909,959) | | | | 270,072,542 | |
| | | | | | | | | | | | |
| | | |
| | | | | | Par
(000) | | | | |
|
Corporate Bonds — 13.1% | |
|
| Aerospace & Defense — 0.5% | |
BAE Systems Holdings, Inc.(b): | | | | | | | | | | | | |
2.85%, 12/15/20 | | | USD | | | | 138 | | | | 136,183 | |
3.85%, 12/15/25 | | | | | | | 90 | | | | 89,228 | |
4.75%, 10/07/44 | | | | | | | 8 | | | | 8,033 | |
Boeing Co. (The), 6.13%, 02/15/33 | | | | | | | 15 | | | | 18,987 | |
General Dynamics Corp., 3.75%, 05/15/28 | | | | | | | 55 | | | | 55,500 | |
Harris Corp.: | | | | | | | | | | | | |
2.70%, 04/27/20 | | | | | | | 39 | | | | 38,668 | |
4.40%, 06/15/28 | | | | | | | 125 | | | | 124,434 | |
5.05%, 04/27/45 | | | | | | | 55 | | | | 56,577 | |
L3 Technologies, Inc.: | | | | | | | | | | | | |
4.95%, 02/15/21 | | | | | | | 25 | | | | 25,582 | |
3.85%, 06/15/23 | | | | | | | 90 | | | | 90,140 | |
3.85%, 12/15/26 | | | | | | | 90 | | | | 87,125 | |
4.40%, 06/15/28 | | | | | | | 15 | | | | 14,997 | |
Lockheed Martin Corp.: | | | | | | | | | | | | |
3.55%, 01/15/26 | | | | | | | 43 | | | | 42,669 | |
3.60%, 03/01/35 | | | | | | | 85 | | | | 79,149 | |
4.50%, 05/15/36 | | | | | | | 17 | | | | 17,541 | |
4.07%, 12/15/42 | | | | | | | 49 | | | | 46,755 | |
3.80%, 03/01/45 | | | | | | | 35 | | | | 31,890 | |
4.70%, 05/15/46 | | | | | | | 110 | | | | 114,623 | |
4.09%, 09/15/52 | | | | | | | 32 | | | | 29,869 | |
Northrop Grumman Corp.: | | | | | | | | | | | | |
2.55%, 10/15/22 | | | | | | | 135 | | | | 130,633 | |
2.93%, 01/15/25 | | | | | | | 150 | | | | 142,333 | |
3.25%, 01/15/28 | | | | | | | 143 | | | | 133,419 | |
3.85%, 04/15/45 | | | | | | | 43 | | | | 37,964 | |
4.03%, 10/15/47 | | | | | | | 45 | | | | 40,928 | |
Raytheon Co., 7.20%, 08/15/27 | | | | | | | 20 | | | | 25,170 | |
United Technologies Corp.: | | | | | | | | | | | | |
1.95%, 11/01/21 | | | | | | | 200 | | | | 191,990 | |
4.13%, 11/16/28 | | | | | | | 135 | | | | 133,745 | |
4.50%, 06/01/42 | | | | | | | 160 | | | | 151,158 | |
4.15%, 05/15/45 | | | | | | | 2 | | | | 1,789 | |
| | | | | | | | | | | | |
| | | | | | | | | | | 2,097,079 | |
| | |
| 34 | | 2018 BLACKROCK ANNUAL REPORTTO SHAREHOLDERS |
| | |
Schedule of Investments (continued) December 31, 2018 | | BlackRock Balanced Capital Portfolio (Percentages shown are based on Net Assets) |
| | | | | | | | | | | | |
| Security | | | | | Par
(000) | | | Value | |
|
| Air Freight & Logistics — 0.0% | |
FedEx Corp.: | | | | | | | | | | | | |
4.90%, 01/15/34 | | | USD | | | | 40 | | | $ | 40,880 | |
3.90%, 02/01/35 | | | | | | | 55 | | | | 49,795 | |
3.88%, 08/01/42 | | | | | | | 70 | | | | 58,122 | |
4.05%, 02/15/48 | | | | | | | 75 | | | | 62,824 | |
| | | | | | | | | | | | |
| | | | | | | | | | | 211,621 | |
|
| Airlines — 0.2% | |
American Airlines Group, Inc.,
4.63%, 03/01/20(b) | | | | | | | 91 | | | | 90,545 | |
American Airlines Pass-Through Trust: | | | | | | | | | | | | |
Series 2015-1, Class B, 3.70%, 05/01/23 | | | | | | | 3 | | | | 3,281 | |
Series 2015-2, Class B, 4.40%, 09/22/23 | | | | | | | 92 | | | | 90,517 | |
Series 2016-1, Class B, 5.25%, 01/15/24 | | | | | | | 2 | | | | 1,635 | |
Series 2017-1, Class B, 4.95%, 02/15/25 | | | | | | | 9 | | | | 8,799 | |
Series 2017-2, Class B, 3.70%, 10/15/25 | | | | | | | 5 | | | | 4,592 | |
Series 2015-1, Class A, 3.38%, 05/01/27 | | | | | | | 79 | | | | 75,548 | |
Delta Air Lines, Inc.: | | | | | | | | | | | | |
2.88%, 03/13/20 | | | | | | | 338 | | | | 335,755 | |
2.60%, 12/04/20 | | | | | | | 130 | | | | 127,831 | |
3.40%, 04/19/21 | | | | | | | 10 | | | | 9,916 | |
3.63%, 03/15/22 | | | | | | | 32 | | | | 31,315 | |
Gol Finance, Inc., 7.00%, 01/31/25(b) | | | | | | | 62 | | | | 54,948 | |
Turkish Airlines Pass-Through Trust, Series 2015-1, Class A, 4.20%, 03/15/27(b) | | | | | | | 51 | | | | 44,093 | |
United Airlines Pass-Through Trust: | | | | | | | | | | | | |
Series 2014-1, Class B, 4.75%, 04/11/22 | | | | | | | 13 | | | | 12,946 | |
Series 2018-1, Class B, 4.60%, 03/01/26 | | | | | | | 25 | | | | 25,010 | |
Series 2016-2, Class AA, 2.88%, 10/07/28 | | | | | | | 9 | | | | 8,698 | |
US Airways Pass-Through Trust: | | | | | | | | | | | | |
Series 2012-2, Class B, 6.75%, 06/03/21 | | | | | | | 4 | | | | 3,775 | |
Series 2013-1, Class B, 5.38%, 11/15/21 | | | | | | | 8 | | | | 8,711 | |
| | | | | | | | | | | | |
| | | | | | | | | | | 937,915 | |
|
| Auto Components — 0.0% | |
Aptiv plc, 4.25%, 01/15/26 | | | | | | | 20 | | | | 19,457 | |
ZF North America Capital, Inc.,
4.75%, 04/29/25(b) | | | | | | | 150 | | | | 139,600 | |
| | | | | | | | | | | | |
| | | | | | | | | | | 159,057 | |
|
| Automobiles — 0.3% | |
BMW US Capital LLC, 2.80%, 04/11/26(b) | | | | | | | 45 | | | | 41,251 | |
Daimler Finance North America LLC(b): | | | | | | | | | | | | |
3.10%, 05/04/20 | | | | | | | 150 | | | | 149,170 | |
3.35%, 05/04/21 | | | | | | | 170 | | | | 169,484 | |
3.75%, 11/05/21 | | | | | | | 150 | | | | 150,512 | |
General Motors Co.: | | | | | | | | | | | | |
6.75%, 04/01/46 | | | | | | | 20 | | | | 19,362 | |
5.40%, 04/01/48 | | | | | | | 30 | | | | 25,550 | |
Hyundai Capital America, 2.55%, 04/03/20(b) | | | | | | | 402 | | | | 396,792 | |
Toyota Motor Corp., 3.67%, 07/20/28 | | | | | | | 25 | | | | 25,299 | |
Volkswagen Group of America Finance LLC, 4.00%, 11/12/21(b) | | | | | | | 325 | | | | 324,798 | |
| | | | | | | | | | | | |
| | | | | | | | | | | 1,302,218 | |
|
| Banks — 2.7% | |
ABN AMRO Bank NV, 2.65%, 01/19/21(b) | | | | | | | 235 | | | | 231,617 | |
Bank of America Corp.: | | | | | | | | | | | | |
2.63%, 10/19/20 | | | | | | | 15 | | | | 14,843 | |
(LIBOR USD 3 Month + 0.66%), 2.37%, 07/21/21(a) | | | | | | | 230 | | | | 225,884 | |
(LIBOR USD 3 Month + 0.63%), 2.33%, 10/01/21(a) | | | | | | | 465 | | | | 455,924 | |
5.70%, 01/24/22 | | | | | | | 125 | | | | 132,484 | |
(LIBOR USD 3 Month + 0.63%), 3.50%, 05/17/22(a) | | | | | | | 110 | | | | 110,017 | |
3.30%, 01/11/23 | | | | | | | 40 | | | | 39,394 | |
4.00%, 04/01/24 | | | | | | | 30 | | | | 30,166 | |
| | | | | | | | | | | | |
| Security | | | | | Par
(000) | | | Value | |
|
| Banks (continued) | |
4.20%, 08/26/24 | | | USD | | | | 270 | | | $ | 267,786 | |
Series L, 3.95%, 04/21/25 | | | | | | | 265 | | | | 256,768 | |
3.88%, 08/01/25 | | | | | | | 166 | | | | 164,218 | |
(LIBOR USD 3 Month + 0.81%),
3.37%, 01/23/26(a) | | | | | | | 60 | | | | 57,365 | |
3.50%, 04/19/26 | | | | | | | 52 | | | | 50,041 | |
Series L, 4.18%, 11/25/27 | | | | | | | 135 | | | | 129,757 | |
(LIBOR USD 3 Month + 1.04%),
3.42%, 12/20/28(a) | | | | | | | 360 | | | | 336,294 | |
(LIBOR USD 3 Month + 1.07%),
3.97%, 03/05/29(a) | | | | | | | 50 | | | | 48,602 | |
Barclays plc: | | | | | | | | | | | | |
(LIBOR USD 3 Month + 1.36%),
4.34%, 05/16/24(a) | | | | | | | 200 | | | | 194,449 | |
4.95%, 01/10/47 | | | | | | | 200 | | | | 176,740 | |
BNP Paribas SA, 3.80%, 01/10/24(b) | | | | | | | 200 | | | | 194,724 | |
Citigroup, Inc.: | | | | | | | | | | | | |
2.50%, 07/29/19 | | | | | | | 285 | | | | 284,026 | |
2.90%, 12/08/21 | | | | | | | 255 | | | | 250,876 | |
(LIBOR USD 3 Month + 0.95%),
2.88%, 07/24/23(a) | | | | | | | 66 | | | | 63,870 | |
3.75%, 06/16/24 | | | | | | | 85 | | | | 84,404 | |
4.40%, 06/10/25 | | | | | | | 53 | | | | 51,868 | |
4.45%, 09/29/27 | | | | | | | 73 | | | | 70,359 | |
(LIBOR USD 3 Month + 1.56%),
3.89%, 01/10/28(a) | | | | | | | 32 | | | | 30,877 | |
Citizens Bank NA: | | | | | | | | | | | | |
2.25%, 03/02/20 | | | | | | | 277 | | | | 274,035 | |
2.65%, 05/26/22 | | | | | | | 250 | | | | 242,884 | |
Credit Suisse Group Funding Guernsey Ltd., 2.75%, 03/26/20 | | | | | | | 250 | | | | 247,303 | |
HSBC Holdings plc: | | | | | | | | | | | | |
2.65%, 01/05/22 | | | | | | | 277 | | | | 268,726 | |
(USD Swap Rate 5 Year + 3.75%), 6.00%(a)(h) | | | | | | | 200 | | | | 180,096 | |
ING Groep NV, 4.10%, 10/02/23 | | | | | | | 200 | | | | 199,878 | |
Intesa Sanpaolo SpA, 5.02%, 06/26/24(b) | | | | | | | 200 | | | | 181,376 | |
JPMorgan Chase & Co.: | | | | | | | | | | | | |
2.55%, 03/01/21 | | | | | | | 100 | | | | 98,590 | |
4.63%, 05/10/21 | | | | | | | 63 | | | | 64,835 | |
(LIBOR USD 3 Month + 0.61%),
3.51%, 06/18/22(a) | | | | | | | 145 | | | | 145,328 | |
2.97%, 01/15/23 | | | | | | | 85 | | | | 82,873 | |
(LIBOR USD 3 Month + 0.73%),
3.56%, 04/23/24(a) | | | | | | | 30 | | | | 29,773 | |
(LIBOR USD 3 Month + 0.89%),
3.80%, 07/23/24(a) | | | | | | | 199 | | | | 199,359 | |
(LIBOR USD 3 Month + 1.00%),
4.02%, 12/05/24(a) | | | | | | | 400 | | | | 403,183 | |
(LIBOR USD 3 Month + 1.34%),
3.78%, 02/01/28(a) | | | | | | | 130 | | | | 126,194 | |
(LIBOR USD 3 Month + 1.38%),
3.54%, 05/01/28(a) | | | | | | | 90 | | | | 85,805 | |
(LIBOR USD 3 Month + 1.26%),
4.20%, 07/23/29(a) | | | | | | | 150 | | | | 149,544 | |
(LIBOR USD 3 Month + 1.33%),
4.45%, 12/05/29(a) | | | | | | | 50 | | | | 50,857 | |
(LIBOR USD 3 Month + 1.36%),
3.88%, 07/24/38(a) | | | | | | | 135 | | | | 122,605 | |
KeyCorp, 4.15%, 10/29/25 | | | | | | | 45 | | | | 45,709 | |
Lloyds Banking Group plc, 4.65%, 03/24/26 | | | | | | | 400 | | | | 376,076 | |
Mitsubishi UFJ Financial Group, Inc.: | | | | | | | | | | | | |
3.54%, 07/26/21 | | | | | | | 60 | | | | 60,225 | |
3.46%, 03/02/23 | | | | | | | 360 | | | | 357,790 | |
Mizuho Financial Group, Inc.: | | | | | | | | | | | | |
2.63%, 04/12/21(b) | | | | | | | 200 | | | | 196,207 | |
2.95%, 02/28/22 | | | | | | | 472 | | | | 462,733 | |
(LIBOR USD 3 Month + 1.00%),
3.92%, 09/11/24(a) | | | | | | | 200 | | | | 202,115 | |
Nordea Bank AB, 2.13%, 05/29/20(b) | | | | | | | 205 | | | | 201,888 | |
Royal Bank of Scotland Group plc, (LIBOR USD 3 Month + 1.91%), 5.08%, 01/27/30(a) | | | | | | | 200 | | | | 192,853 | |
Santander UK Group Holdings plc, 2.88%, 08/05/21 | | | | | | | 215 | | | | 207,401 | |
Santander UK plc, 5.00%, 11/07/23(b) | | | | | | | 200 | | | | 195,298 | |
Standard Chartered plc, (LIBOR USD 3 Month + 1.15%), 4.25%, 01/20/23(a)(b) | | | | | | | 265 | | | | 262,339 | |
Sumitomo Mitsui Trust Bank Ltd.(b): | | | | | | | | | | | | |
2.05%, 03/06/19 | | | | | | | 505 | | | | 504,123 | |
1.95%, 09/19/19 | | | | | | | 235 | | | | 232,912 | |
Toronto-Dominion Bank (The), 3.50%, 07/19/23 | | | | | | | 45 | | | | 45,310 | |
| | | | |
| SCHEDULES OF INVESTMENTS | | | 35 | |
| | |
Schedule of Investments (continued) December 31, 2018 | | BlackRock Balanced Capital Portfolio (Percentages shown are based on Net Assets) |
| | | | | | | | | | | | |
| Security | | | | | Par
(000) | | | Value | |
|
| Banks (continued) | |
UBS Group Funding Switzerland AG(b): | | | | | | | | | | | | |
2.95%, 09/24/20 | | | USD | | | | 335 | | | $ | 331,458 | |
(LIBOR USD 3 Month + 0.95%), 2.86%, 08/15/23(a) | | | | | | | 235 | | | | 226,020 | |
4.13%, 09/24/25 | | | | | | | 200 | | | | 199,260 | |
US Bancorp: | | | | | | | | | | | | |
2.95%, 07/15/22 | | | | | | | 135 | | | | 133,163 | |
Series X, 3.15%, 04/27/27 | | | | | | | 20 | | | | 19,160 | |
Wells Fargo & Co.: | | | | | | | | | | | | |
2.60%, 07/22/20 | | | | | | | 68 | | | | 67,341 | |
2.55%, 12/07/20 | | | | | | | 90 | | | | 88,732 | |
2.50%, 03/04/21 | | | | | | | 180 | | | | 177,043 | |
3.50%, 03/08/22 | | | | | | | 70 | | | | 69,767 | |
2.63%, 07/22/22 | | | | | | | 160 | | | | 154,282 | |
(LIBOR USD 3 Month + 1.31%), 3.58%, 05/22/28(a) | | | | | | | 160 | | | | 153,612 | |
| | | | | | | | |
| | | | | | | | | | | 12,269,414 | |
| | | |
| Beverages — 0.2% | | | | | | | | | |
Anheuser-Busch Cos. LLC(b): | | | | | | | | | | | | |
3.65%, 02/01/26 | | | | | | | 25 | | | | 23,639 | |
4.70%, 02/01/36 | | | | | | | 225 | | | | 208,664 | |
4.90%, 02/01/46 | | | | | | | 90 | | | | 83,465 | |
Anheuser-Busch InBev Finance, Inc.: | | | | | | | | | | | | |
2.63%, 01/17/23 | | | | | | | 39 | | | | 37,119 | |
3.30%, 02/01/23 | | | | | | | 255 | | | | 247,949 | |
Anheuser-Busch InBev Worldwide, Inc., 2.50%, 07/15/22 | | | | | | | 5 | | | | 4,774 | |
Keurig Dr. Pepper, Inc., 3.55%, 05/25/21(b) | | | | | | | 40 | | | | 39,939 | |
PepsiCo, Inc., 4.00%, 05/02/47 | | | | | | | 45 | | | | 43,992 | |
| | | | | | | | |
| | | | | | | | | | | 689,541 | |
| | | |
| Biotechnology — 0.2% | | | | | | | | | |
AbbVie, Inc.: | | | | | | | | | | | | |
2.30%, 05/14/21 | | | | | | | 50 | | | | 48,829 | |
3.75%, 11/14/23 | | | | | | | 60 | | | | 59,697 | |
3.60%, 05/14/25 | | | | | | | 105 | | | | 100,714 | |
4.25%, 11/14/28 | | | | | | | 50 | | | | 48,540 | |
4.50%, 05/14/35 | | | | | | | 105 | | | | 97,136 | |
4.40%, 11/06/42 | | | | | | | 35 | | | | 30,779 | |
Amgen, Inc., 4.40%, 05/01/45 | | | | | | | 65 | | | | 60,787 | |
Baxalta, Inc.: | | | | | | | | | | | | |
4.00%, 06/23/25 | | | | | | | 30 | | | | 29,330 | |
5.25%, 06/23/45 | | | | | | | 15 | | | | 15,204 | |
Celgene Corp.: | | | | | | | | | | | | |
3.95%, 10/15/20 | | | | | | | 10 | | | | 10,108 | |
3.25%, 08/15/22 | | | | | | | 60 | | | | 58,907 | |
3.55%, 08/15/22 | | | | | | | 60 | | | | 59,341 | |
Gilead Sciences, Inc.: | | | | | | | | | | | | |
2.50%, 09/01/23 | | | | | | | 60 | | | | 57,881 | |
3.70%, 04/01/24 | | | | | | | 130 | | | | 129,783 | |
3.65%, 03/01/26 | | | | | | | 30 | | | | 29,406 | |
4.60%, 09/01/35 | | | | | | | 29 | | | | 29,280 | |
4.00%, 09/01/36 | | | | | | | 50 | | | | 45,581 | |
5.65%, 12/01/41 | | | | | | | 60 | | | | 66,287 | |
4.50%, 02/01/45 | | | | | | | 39 | | | | 37,507 | |
| | | | | | | | |
| | | | | | | | | | | 1,015,097 | |
| |
| Building Products — 0.0% | | | | |
Johnson Controls International plc, 5.13%, 09/14/45 | | | | | | | 23 | | | | 22,964 | |
| | | | | | | | |
| | | | | | | | | | | | |
| | | |
| Capital Markets — 0.8% | | | | | | | | | |
Bank of New York Mellon Corp. (The), (LIBOR USD 3 Month + 1.07%), 3.44%, 02/07/28(a) | | | | | | | 50 | | | | 48,787 | |
CME Group, Inc., 3.75%, 06/15/28 | | | | | | | 5 | | | | 5,067 | |
Credit Suisse Group AG, (LIBOR USD 3 Month + 1.24%), 4.21%, 06/12/24(a)(b) | | | | | | | 250 | | | | 249,353 | |
| | | | | | | | | | | | |
| Security | | | | | Par
(000) | | | Value | |
| | | |
| Capital Markets (continued) | | | | | | | | | |
Deutsche Bank AG: | | | | | | | | | | | | |
2.70%, 07/13/20 | | | USD | | | | 144 | | | $ | 140,060 | |
2.95%, 08/20/20 | | | | | | | 129 | | | | 125,209 | |
4.25%, 02/04/21 | | | | | | | 300 | | | | 295,655 | |
4.25%, 10/14/21 | | | | | | | 40 | | | | 39,110 | |
Goldman Sachs & Co. LLC, (LIBOR USD 3 Month + 0.44%), 3.06%, 02/08/19(a) | | | | | | | 1,000 | | | | 999,376 | |
Goldman Sachs Group, Inc. (The): | | | | | | | | | | | | |
2.00%, 04/25/19 | | | | | | | 48 | | | | 47,833 | |
2.75%, 09/15/20 | | | | | | | 71 | | | | 70,266 | |
2.35%, 11/15/21 | | | | | | | 209 | | | | 201,520 | |
(LIBOR USD 3 Month + 1.17%), 3.79%, 05/15/26(a) | | | | | | | 40 | | | | 38,391 | |
(LIBOR USD 3 Month + 1.51%), 3.69%, 06/05/28(a) | | | | | | | 315 | | | | 292,752 | |
(LIBOR USD 3 Month + 1.30%), 4.22%, 05/01/29(a) | | | | | | | 130 | | | | 125,110 | |
(LIBOR USD 3 Month + 1.37%), 4.02%, 10/31/38(a) | | | | | | | 60 | | | | 52,800 | |
Intercontinental Exchange, Inc.: | | | | | | | | | | | | |
3.45%, 09/21/23 | | | | | | | 45 | | | | 45,226 | |
4.00%, 10/15/23 | | | | | | | 20 | | | | 20,478 | |
3.75%, 09/21/28 | | | | | | | 20 | | | | 20,013 | |
Moody’s Corp., 2.75%, 12/15/21 | | | | | | | 62 | | | | 60,803 | |
Morgan Stanley: | | | | | | | | | | | | |
2.75%, 05/19/22 | | | | | | | 235 | | | | 228,627 | |
6.25%, 08/09/26 | | | | | | | 100 | | | | 110,732 | |
3.63%, 01/20/27 | | | | | | | 70 | | | | 66,528 | |
(LIBOR USD 3 Month + 1.34%), 3.59%, 07/22/28(a) | | | | | | | 270 | | | | 255,286 | |
(LIBOR USD 3 Month + 1.14%), 3.77%, 01/24/29(a) | | | | | | | 135 | | | | 129,164 | |
Nuveen LLC, 4.00%, 11/01/28(b) | | | | | | | 20 | | | | 20,609 | |
S&P Global, Inc., 4.00%, 06/15/25 | | | | | | | 15 | | | | 15,274 | |
State Street Corp., 2.65%, 05/19/26 | | | | | | | 38 | | | | 35,579 | |
| | | | | | | | |
| | | | | | | | | | | 3,739,608 | |
| | | |
| Chemicals — 0.2% | | | | | | | | | |
Cydsa SAB de CV, 6.25%, 10/04/27(b) | | | | | | | 200 | | | | 178,750 | |
Dow Chemical Co. (The): | | | | | | | | | | | | |
9.00%, 04/01/21 | | | | | | | 55 | | | | 60,988 | |
4.38%, 11/15/42 | | | | | | | 27 | | | | 23,694 | |
4.63%, 10/01/44 | | | | | | | 20 | | | | 18,173 | |
DowDuPont, Inc.: | | | | | | | | | | | | |
4.49%, 11/15/25 | | | | | | | 235 | | | | 241,950 | |
5.42%, 11/15/48 | | | | | | | 130 | | | | 135,063 | |
Sherwin-Williams Co. (The): | | | | | | | | | | | | |
4.00%, 12/15/42 | | | | | | | 26 | | | | 21,860 | |
4.50%, 06/01/47 | | | | | | | 15 | | | | 13,526 | |
| | | | | | | | |
| | | | | | | | | | | 694,004 | |
|
| Commercial Services & Supplies — 0.0% | |
Catholic Health Initiatives, 4.35%, 11/01/42 | | | | | | | 30 | | | | 27,137 | |
Republic Services, Inc.: | | | | | | | | | | | | |
4.75%, 05/15/23 | | | | | | | 30 | | | | 31,402 | |
2.90%, 07/01/26 | | | | | | | 42 | | | | 39,616 | |
3.95%, 05/15/28 | | | | | | | 45 | | | | 45,029 | |
Waste Management, Inc., 3.90%, 03/01/35 | | | | | | | 42 | | | | 40,765 | |
| | | | | | | | | | | | |
| | | | | | | | | | | 183,949 | |
| | | |
| Communications Equipment — 0.0% | | | | | | | | | |
Cisco Systems, Inc., 2.95%, 02/28/26 | | | | | | | 30 | | | | 28,604 | |
Juniper Networks, Inc., 3.30%, 06/15/20 | | | | | | | 79 | | | | 78,704 | |
| | | | | | | | | | | | |
| | | | | | | | | | | 107,308 | |
| | | |
| Consumer Finance — 0.7% | | | | | | | | | |
AerCap Ireland Capital DAC, 4.63%, 10/30/20 | | | | | | | 220 | | | | 221,535 | |
American Express Co.: | | | | | | | | | | | | |
3.70%, 11/05/21 | | | | | | | 210 | | | | 211,887 | |
3.70%, 08/03/23 | | | | | | | 70 | | | | 70,202 | |
American Express Credit Corp., 2.25%, 08/15/19 | | | | | | | 119 | | | | 118,459 | |
| | |
| 36 | | 2018 BLACKROCK ANNUAL REPORTTO SHAREHOLDERS |
| | |
Schedule of Investments (continued) December 31, 2018 | | BlackRock Balanced Capital Portfolio (Percentages shown are based on Net Assets) |
| | | | | | | | | | | | |
| Security | | | | | Par
(000) | | | Value | |
| | | |
| Consumer Finance (continued) | | | | | | | | | |
Capital One Financial Corp.: | | | | | | | | | | | | |
2.40%, 10/30/20 | | | USD | | | | 94 | | | $ | 92,028 | |
3.45%, 04/30/21 | | | | | | | 70 | | | | 69,967 | |
3.75%, 03/09/27 | | | | | | | 30 | | | | 27,864 | |
Discover Financial Services, 4.10%, 02/09/27 | | | | | | | 17 | | | | 15,871 | |
Ford Motor Credit Co. LLC: | | | | | | | | | | | | |
5.75%, 02/01/21 | | | | | | | 200 | | | | 203,980 | |
3.22%, 01/09/22 | | | | | | | 425 | | | | 399,103 | |
2.98%, 08/03/22 | | | | | | | 200 | | | | 184,843 | |
General Motors Financial Co., Inc.: | | | | | | | | | | | | |
3.10%, 01/15/19 | | | | | | | 43 | | | | 42,998 | |
4.20%, 03/01/21 | | | | | | | 35 | | | | 34,981 | |
3.20%, 07/06/21 | | | | | | | 267 | | | | 260,807 | |
4.20%, 11/06/21 | | | | | | | 435 | | | | 434,804 | |
3.15%, 06/30/22 | | | | | | | 175 | | | | 167,153 | |
4.00%, 01/15/25 | | | | | | | 140 | | | | 130,959 | |
4.00%, 10/06/26 | | | | | | | 15 | | | | 13,467 | |
HSBC USA, Inc., 2.35%, 03/05/20 | | | | | | | 270 | | | | 267,274 | |
Synchrony Financial: | | | | | | | | | | | | |
2.60%, 01/15/19 | | | | | | | 90 | | | | 89,969 | |
2.70%, 02/03/20 | | | | | | | 52 | | | | 51,117 | |
Tarjeta Naranja SA, (Argentina Deposit Rates Badlar Private Banks ARS 30 to 35 Days + 3.50%), 52.29%, 04/11/22(a)(b) | | | | | | | 44 | | | | 17,600 | |
Toyota Motor Credit Corp., 3.05%, 01/11/28 | | | | | | | 50 | | | | 48,246 | |
Unifin Financiera SAB de CV SOFOM ENR, 7.25%, 09/27/23(b) | | | | | | | 200 | | | | 183,850 | |
| | | | | | | | | | | | |
| | | | | | | | | | | 3,358,964 | |
| | | |
| Containers & Packaging — 0.0% | | | | | | | | | |
Reynolds Group Issuer, Inc., 5.75%, 10/15/20 | | | | | | | 87 | | | | 87,002 | |
| | | | | | | | | | | | |
| | | |
| Diversified Consumer Services — 0.1% | | | | | | | | | |
Boston University, Series CC, 4.06%, 10/01/48 | | | | | | | 32 | | | | 32,098 | |
George Washington University (The), Series 2018, 4.13%, 09/15/48 | | | | | | | 58 | | | | 58,039 | |
University of Notre Dame du Lac, Series 2017, 3.39%, 02/15/48 | | | | | | | 36 | | | | 34,021 | |
University of Southern California, 3.03%, 10/01/39 | | | | | | | 31 | | | | 28,111 | |
Wesleyan University, 4.78%, 07/01/2116 | | | | | | | 79 | | | | 80,786 | |
| | | | | | | | | | | | |
| | | | | | | | | | | 233,055 | |
|
| Diversified Financial Services — 0.1% | |
AXA Equitable Holdings, Inc.(b): | | | | | | | | | | | | |
3.90%, 04/20/23 | | | | | | | 10 | | | | 9,876 | |
5.00%, 04/20/48 | | | | | | | 50 | | | | 44,352 | |
GE Capital International Funding Co. Unlimited Co., 4.42%, 11/15/35 | | | | | | | 200 | | | | 167,513 | |
Shell International Finance BV: | | | | | | | | | | | | |
2.25%, 01/06/23 | | | | | | | 145 | | | | 139,450 | |
3.25%, 05/11/25 | | | | | | | 50 | | | | 49,302 | |
4.13%, 05/11/35 | | | | | | | 38 | | | | 37,713 | |
3.63%, 08/21/42 | | | | | | | 16 | | | | 14,504 | |
Woodside Finance Ltd., 3.65%, 03/05/25(b) | | | | | | | 15 | | | | 14,247 | |
| | | | | | | | | | | | |
| | | | | | | | | | | 476,957 | |
|
| Diversified Telecommunication Services — 0.5% | |
AT&T, Inc.: | | | | | | | | | | | | |
3.40%, 05/15/25 | | | | | | | 30 | | | | 28,250 | |
4.13%, 02/17/26 | | | | | | | 20 | | | | 19,544 | |
4.30%, 02/15/30 | | | | | | | 455 | | | | 429,968 | |
5.25%, 03/01/37 | | | | | | | 70 | | | | 68,756 | |
4.35%, 06/15/45 | | | | | | | 200 | | | | 169,013 | |
5.15%, 02/15/50 | | | | | | | 80 | | | | 74,113 | |
Axtel SAB de CV, 6.38%, 11/14/24(b) | | | | | | | 200 | | | | 189,250 | |
| | | | | | | | | | | | |
| Security | | | | | Par
(000) | | | Value | |
| | | |
| Diversified Telecommunication Services (continued) | | | | | | | | | |
Oi SA, 8.00% ( 8.00% Cash or 4.00% PIK), 07/27/25(i) | | | USD | | | | 100 | | | $ | 96,969 | |
Telefonica Emisiones SA, 4.67%, 03/06/38 | | | | | | | 150 | | | | 135,689 | |
TELUS Corp., 4.60%, 11/16/48 | | | | | | | 10 | | | | 9,913 | |
Verizon Communications, Inc.: | | | | | | | | | | | | |
(LIBOR USD 3 Month + 0.55%), 3.20%, 05/22/20(a) | | | | | | | 205 | | | | 204,552 | |
4.33%, 09/21/28 | | | | | | | 518 | | | | 520,129 | |
4.50%, 08/10/33 | | | | | | | 175 | | | | 172,740 | |
4.40%, 11/01/34 | | | | | | | 33 | | | | 31,805 | |
4.13%, 08/15/46 | | | | | | | 50 | | | | 44,114 | |
5.50%, 03/16/47 | | | | | | | 200 | | | | 212,683 | |
| | | | | | | | | | | | |
| | | | | | | | | | | 2,407,488 | |
| | | |
| Electric Utilities — 0.6% | | | | | | | | | |
AEP Texas, Inc., 3.95%, 06/01/28(b) | | | | | | | 130 | | | | 130,194 | |
AEP Transmission Co. LLC, 4.25%, 09/15/48 | | | | | | | 70 | | | | 70,532 | |
Alabama Power Co.: | | | | | | | | | | | | |
4.15%, 08/15/44 | | | | | | | 10 | | | | 9,783 | |
3.75%, 03/01/45 | | | | | | | 15 | | | | 13,835 | |
Series B, 3.70%, 12/01/47 | | | | | | | 15 | | | | 13,674 | |
Series A, 4.30%, 07/15/48 | | | | | | | 60 | | | | 60,097 | |
Alliant Energy Finance LLC, 3.75%, 06/15/23(b) | | | | | | | 25 | | | | 25,154 | |
Baltimore Gas & Electric Co.: | | | | | | | | | | | | |
3.50%, 08/15/46 | | | | | | | 35 | | | | 31,060 | |
3.75%, 08/15/47 | | | | | | | 35 | | | | 32,094 | |
4.25%, 09/15/48 | | | | | | | 45 | | | | 44,688 | |
CenterPoint Energy Houston Electric LLC, 3.95%, 03/01/48 | | | | | | | 20 | | | | 19,432 | |
DTE Electric Co., Series A, 4.05%, 05/15/48 | | | | | | | 85 | | | | 84,226 | |
Duke Energy Carolinas LLC: | | | | | | | | | | | | |
3.95%, 11/15/28 | | | | | | | 40 | | | | 41,037 | |
3.88%, 03/15/46 | | | | | | | 60 | | | | 56,264 | |
3.70%, 12/01/47 | | | | | | | 35 | | | | 31,790 | |
Duke Energy Corp., 4.80%, 12/15/45 | | | | | | | 5 | | | | 5,093 | |
Duke Energy Florida LLC: | | | | | | | | | | | | |
3.20%, 01/15/27 | | | | | | | 130 | | | | 125,785 | |
3.80%, 07/15/28 | | | | | | | 35 | | | | 35,350 | |
4.20%, 07/15/48 | | | | | | | 10 | | | | 9,957 | |
Duke Energy Progress LLC: | | | | | | | | | | | | |
3.00%, 09/15/21 | | | | | | | 25 | | | | 25,036 | |
3.25%, 08/15/25 | | | | | | | 50 | | | | 48,654 | |
3.70%, 09/01/28 | | | | | | | 135 | | | | 136,371 | |
4.20%, 08/15/45 | | | | | | | 15 | | | | 14,884 | |
Emera US Finance LP, 2.15%, 06/15/19 | | | | | | | 101 | | | | 100,174 | |
Entergy Louisiana LLC: | | | | | | | | | | | | |
5.40%, 11/01/24 | | | | | | | 20 | | | | 21,984 | |
4.20%, 09/01/48 | | | | | | | 10 | | | | 9,870 | |
Eversource Energy, Series L, 2.90%, 10/01/24 | | | | | | | 60 | | | | 57,502 | |
Exelon Corp.: | | | | | | | | | | | | |
2.45%, 04/15/21 | | | | | | | 28 | | | | 27,385 | |
4.95%, 06/15/35 | | | | | | | 21 | | | | 21,145 | |
4.45%, 04/15/46 | | | | | | | 85 | | | | 79,952 | |
FirstEnergy Transmission LLC,
4.35%, 01/15/25(b) | | | | | | | 25 | | | | 25,261 | |
Florida Power & Light Co.: | | | | | | | | | | | | |
3.95%, 03/01/48 | | | | | | | 76 | | | | 74,225 | |
4.13%, 06/01/48 | | | | | | | 60 | | | | 60,154 | |
Genneia SA, 8.75%, 01/20/22(b) | | | | | | | 55 | | | | 49,569 | |
Kansas City Power & Light Co., 4.20%, 03/15/48 | | | | | | | 70 | | | | 67,891 | |
MidAmerican Energy Co., 4.40%, 10/15/44 | | | | | | | 37 | | | | 38,119 | |
Mid-Atlantic Interstate Transmission LLC, 4.10%, 05/15/28(b) | | | | | | | 25 | | | | 24,822 | |
Northern States Power Co.: | | | | | | | | | | | | |
3.40%, 08/15/42 | | | | | | | 65 | | | | 58,580 | |
4.00%, 08/15/45 | | | | | | | 40 | | | | 38,980 | |
4.20%, 09/01/48 | | | | | | | 30 | | | | 29,507 | |
| | | | |
| SCHEDULES OF INVESTMENTS | | | 37 | |
| | |
Schedule of Investments (continued) December 31, 2018 | | BlackRock Balanced Capital Portfolio (Percentages shown are based on Net Assets) |
| | | | | | | | | | | | |
| Security | | | | | Par
(000) | | | Value | |
| | | |
| Electric Utilities (continued) | | | | | | | | | |
Ohio Power Co., Series G, 6.60%, 02/15/33 | | | USD | | | | 50 | | | $ | 62,422 | |
Oncor Electric Delivery Co. LLC, 4.55%, 12/01/41 | | | | | | | 50 | | | | 52,133 | |
Pacific Gas & Electric Co., 6.05%, 03/01/34 | | | | | | | 30 | | | | 27,797 | |
PacifiCorp, 4.13%, 01/15/49 | | | | | | | 20 | | | | 19,682 | |
Public Service Electric & Gas Co., 3.65%, 09/01/28 | | | | | | | 80 | | | | 80,998 | |
Southern Co. (The), 4.40%, 07/01/46 | | | | | | | 95 | | | | 87,349 | |
Southwestern Electric Power Co., Series M, 4.10%, 09/15/28 | | | | | | | 45 | | | | 45,159 | |
Tampa Electric Co.: | | | | | | | | | | | | |
2.60%, 09/15/22 | | | | | | | 30 | | | | 29,084 | |
4.30%, 06/15/48 | | | | | | | 15 | | | | 14,333 | |
4.45%, 06/15/49 | | | | | | | 40 | | | | 38,995 | |
Trans-Allegheny Interstate Line Co., 3.85%, 06/01/25(b) | | | | | | | 79 | | | | 78,666 | |
Virginia Electric & Power Co.: | | | | | | | | | | | | |
Series C, 2.75%, 03/15/23 | | | | | | | 100 | | | | 97,505 | |
Series A, 3.50%, 03/15/27 | | | | | | | 97 | | | | 95,528 | |
4.00%, 01/15/43 | | | | | | | 100 | | | | 94,442 | |
Series B, 4.20%, 05/15/45 | | | | | | | 28 | | | | 27,161 | |
Series C, 4.00%, 11/15/46 | | | | | | | 50 | | | | 47,293 | |
4.60%, 12/01/48 | | | | | | | 15 | | | | 15,645 | |
| | | | | | | | | | | | |
| | | | | | | | | | | 2,764,302 | |
| | | |
| Electrical Equipment — 0.0% | | | | | | | | | |
Eaton Corp., 2.75%, 11/02/22 | | | | | | | 49 | | | | 47,657 | |
| | | | | | | | | | | | |
|
| Electronic Equipment, Instruments & Components — 0.0% | |
Corning, Inc., 4.38%, 11/15/57 | | | | | | | 120 | | | | 100,716 | |
Tyco Electronics Group SA: | | | | | | | | | | | | |
3.45%, 08/01/24 | | | | | | | 15 | | | | 14,600 | |
3.13%, 08/15/27 | | | | | | | 30 | | | | 27,750 | |
| | | | | | | | | | | | |
| | | | | | | | | | | 143,066 | |
|
| Energy Equipment & Services — 0.1% | |
Halliburton Co.: | | | | | | | | | | | | |
3.80%, 11/15/25 | | | | | | | 240 | | | | 232,557 | |
5.00%, 11/15/45 | | | | | | | 15 | | | | 14,728 | |
Odebrecht Drilling Norbe VIII/IX Ltd., 6.35%, 12/01/21(b) | | | | | | | 16 | | | | 15,475 | |
Odebrecht Offshore Drilling Finance Ltd., 6.72%, 12/01/22(b) | | | | | | | 11 | | | | 10,145 | |
| | | | | | | | | | | | |
| | | | | | | | | | | 272,905 | |
| | | |
| Entertainment — 0.1% | | | | | | | | | |
NBCUniversal Media LLC, 4.45%, 01/15/43 | | | | | | | 40 | | | | 38,557 | |
Viacom, Inc., 6.88%, 04/30/36 | | | | | | | 40 | | | | 42,926 | |
Warner Media LLC: | | | | | | | | | | | | |
2.10%, 06/01/19 | | | | | | | 143 | | | | 142,180 | |
3.55%, 06/01/24 | | | | | | | 50 | | | | 48,233 | |
3.60%, 07/15/25 | | | | | | | 64 | | | | 60,616 | |
4.65%, 06/01/44 | | | | | | | 20 | | | | 17,504 | |
4.85%, 07/15/45 | | | | | | | 77 | | | | 69,090 | |
| | | | | | | | | | | | |
| | | | | | | | | | | 419,106 | |
|
| Equity Real Estate Investment Trusts (REITs) — 0.2% | |
American Tower Corp.: | | | | | | | | | | | | |
3.30%, 02/15/21 | | | | | | | 71 | | | | 70,593 | |
3.50%, 01/31/23 | | | | | | | 19 | | | | 18,673 | |
3.00%, 06/15/23 | | | | | | | 220 | | | | 211,667 | |
4.40%, 02/15/26 | | | | | | | 14 | | | | 13,989 | |
CC Holdings GS V LLC, 3.85%, 04/15/23 | | | | | | | 40 | | | | 39,612 | |
Crown Castle International Corp.: | | | | | | | | | | | | |
3.40%, 02/15/21 | | | | | | | 33 | | | | 32,989 | |
2.25%, 09/01/21 | | | | | | | 120 | | | | 116,018 | |
3.20%, 09/01/24 | | | | | | | 175 | | | | 166,023 | |
| | | | | | | | | | | | |
| | | | | | | | | | | 669,564 | |
| | | | | | | | | | | | |
| Security | | | | | Par
(000) | | | Value | |
| | | |
| Food & Staples Retailing — 0.1% | | | | | | | | | |
Kroger Co. (The), 2.65%, 10/15/26 | | | USD | | | | 105 | | | $ | 93,498 | |
Walgreens Boots Alliance, Inc.: | | | | | | | | | | | | |
3.80%, 11/18/24 | | | | | | | 20 | | | | 19,696 | |
3.45%, 06/01/26 | | | | | | | 210 | | | | 197,586 | |
4.80%, 11/18/44 | | | | | | | 6 | | | | 5,463 | |
Walmart, Inc.: | | | | | | | | | | | | |
3.55%, 06/26/25 | | | | | | | 65 | | | | 65,717 | |
4.05%, 06/29/48 | | | | | | | 30 | | | | 29,851 | |
| | | | | | | | | | | | |
| | | | | | | | | | | 411,811 | |
| | | |
| Food Products — 0.1% | | | | | | | | | |
General Mills, Inc.: | | | | | | | | | | | | |
3.20%, 04/16/21 | | | | | | | 40 | | | | 39,780 | |
4.00%, 04/17/25 | | | | | | | 44 | | | | 43,303 | |
Marfrig Holdings Europe BV, 8.00%, 06/08/23(b) | | | | | | | 200 | | | | 200,000 | |
Tyson Foods, Inc.: | | | | | | | | | | | | |
3.90%, 09/28/23 | | | | | | | 15 | | | | 14,979 | |
3.95%, 08/15/24 | | | | | | | 75 | | | | 74,565 | |
3.55%, 06/02/27 | | | | | | | 70 | | | | 65,236 | |
5.10%, 09/28/48 | | | | | | | 15 | | | | 14,394 | |
| | | | | | | | | | | | |
| | | | | | | | | | | 452,257 | |
| | | |
| Health Care Equipment & Supplies — 0.2% | | | | | | | | | |
Abbott Laboratories: | | | | | | | | | | | | |
3.40%, 11/30/23 | | | | | | | 14 | | | | 13,957 | |
3.75%, 11/30/26 | | | | | | | 142 | | | | 140,239 | |
Baxter International, Inc., 1.70%, 08/15/21 | | | | | | | 10 | | | | 9,594 | |
Becton Dickinson and Co.: | | | | | | | | | | | | |
2.13%, 06/06/19 | | | | | | | 255 | | | | 253,514 | |
2.68%, 12/15/19 | | | | | | | 61 | | | | 60,420 | |
2.89%, 06/06/22 | | | | | | | 185 | | | | 179,176 | |
3.30%, 03/01/23 | | | | | | | 70 | | | | 68,773 | |
4.69%, 12/15/44 | | | | | | | 10 | | | | 9,360 | |
Covidien International Finance SA, 2.95%, 06/15/23 | | | | | | | 85 | | | | 83,223 | |
Edwards Lifesciences Corp., 4.30%, 06/15/28 | | | | | | | 25 | | | | 25,276 | |
Medtronic, Inc.: | | | | | | | | | | | | |
3.50%, 03/15/25 | | | | | | | 90 | | | | 89,645 | |
4.38%, 03/15/35 | | | | | | | 160 | | | | 163,814 | |
| | | | | | | | | | | | |
| | | | | | | | | | | 1,096,991 | |
| | | |
| Health Care Providers & Services — 0.6% | | | | | | | | | |
Aetna, Inc.: | | | | | | | | | | | | |
4.50%, 05/15/42 | | | | | | | 27 | | | | 25,065 | |
4.13%, 11/15/42 | | | | | | | 25 | | | | 21,642 | |
4.75%, 03/15/44 | | | | | | | 30 | | | | 28,624 | |
AHS Hospital Corp., 5.02%, 07/01/45 | | | | | | | 21 | | | | 23,325 | |
Anthem, Inc.: | | | | | | | | | | | | |
3.70%, 08/15/21 | | | | | | | 7 | | | | 7,047 | |
3.50%, 08/15/24 | | | | | | | 15 | | | | 14,713 | |
4.10%, 03/01/28 | | | | | | | 40 | | | | 39,206 | |
Baylor Scott & White Holdings, 4.19%, 11/15/45 | | | | | | | 40 | | | | 39,428 | |
CHRISTUS Health, Series C, 4.34%, 07/01/28 | | | | | | | 47 | | | | 47,962 | |
Cigna Corp., 3.25%, 04/15/25 | | | | | | | 125 | | | | 118,794 | |
CVS Health Corp.: | | | | | | | | | | | | |
3.70%, 03/09/23 | | | | | | | 290 | | | | 286,896 | |
4.00%, 12/05/23 | | | | | | | 95 | | | | 95,271 | |
4.10%, 03/25/25 | | | | | | | 135 | | | | 133,653 | |
4.78%, 03/25/38 | | | | | | | 35 | | | | 33,539 | |
5.13%, 07/20/45 | | | | | | | 240 | | | | 233,618 | |
5.05%, 03/25/48 | | | | | | | 100 | | | | 97,261 | |
Dignity Health, 2.64%, 11/01/19 | | | | | | | 57 | | | | 56,667 | |
Halfmoon Parent, Inc., 3.20%, 09/17/20(b) | | | | | | | 360 | | | | 358,520 | |
Kaiser Foundation Hospitals: | | | | | | | | | | | | |
3.50%, 04/01/22 | | | | | | | 56 | | | | 56,934 | |
4.15%, 05/01/47 | | | | | | | 15 | | | | 14,815 | |
| | |
| 38 | | 2018 BLACKROCK ANNUAL REPORTTO SHAREHOLDERS |
| | |
Schedule of Investments (continued) December 31, 2018 | | BlackRock Balanced Capital Portfolio (Percentages shown are based on Net Assets) |
| | | | | | | | | | | | |
| Security | | | | | Par
(000) | | | Value | |
|
| Health Care Providers & Services (continued) | |
Laboratory Corp. of America Holdings, 2.63%, 02/01/20 | | | USD | | | | 85 | | | $ | 84,409 | |
Mercy Health, Series 2018, 4.30%, 07/01/28 | | | | | | | 26 | | | | 26,523 | |
Montefiore Obligated Group, Series 18-C, 5.25%, 11/01/48 | | | | | | | 49 | | | | 47,441 | |
Ochsner Clinic Foundation, 5.90%, 05/15/45 | | | | | | | 33 | | | | 39,955 | |
PeaceHealth Obligated Group, Series 2018, 4.79%, 11/15/48 | | | | | | | 45 | | | | 47,572 | |
Providence St. Joseph Health Obligated Group, Series A, 3.93%, 10/01/48 | | | | | | | 38 | | | | 36,196 | |
Southern Baptist Hospital of Florida, Inc., 4.86%, 07/15/45 | | | | | | | 35 | | | | 38,093 | |
SSM Health Care Corp., Series 2018, 3.69%, 06/01/23 | | | | | | | 49 | | | | 49,449 | |
Sutter Health, Series 2018, 3.70%, 08/15/28 | | | | | | | 45 | | | | 45,123 | |
Toledo Hospital (The), 5.75%, 11/15/38 | | | | | | | 83 | | | | 87,641 | |
Trinity Health Corp., 4.13%, 12/01/45 | | | | | | | 36 | | | | 34,205 | |
UnitedHealth Group, Inc.: | | | | | | | | | | | | |
3.75%, 07/15/25 | | | | | | | 70 | | | | 70,859 | |
3.70%, 12/15/25 | | | | | | | 80 | | | | 80,798 | |
3.10%, 03/15/26 | | | | | | | 30 | | | | 28,953 | |
4.63%, 07/15/35 | | | | | | | 20 | | | | 21,200 | |
4.20%, 01/15/47 | | | | | | | 25 | | | | 24,841 | |
3.75%, 10/15/47 | | | | | | | 50 | | | | 45,758 | |
4.45%, 12/15/48 | | | | | | | 30 | | | | 30,880 | |
| | | | | | | | | | | | |
| | | | | | | | | | | 2,572,876 | |
|
| Hotels, Restaurants & Leisure — 0.1% | |
McDonald’s Corp.: | | | | | | | | | | | | |
3.35%, 04/01/23 | | | | | | | 85 | | | | 84,570 | |
3.70%, 01/30/26 | | | | | | | 70 | | | | 68,620 | |
4.70%, 12/09/35 | | | | | | | 50 | | | | 50,221 | |
3.70%, 02/15/42 | | | | | | | 20 | | | | 17,289 | |
4.88%, 12/09/45 | | | | | | | 57 | | | | 57,379 | |
4.45%, 03/01/47 | | | | | | | 40 | | | | 38,244 | |
| | | | | | | | | | | | |
| | | | | | | | | | | 316,323 | |
| | | |
| Industrial Conglomerates — 0.0% | | | | | | | | | |
Honeywell International, Inc., 3.81%, 11/21/47 | | | | | | | 20 | | | | 18,986 | |
| | | | | | | | | | | | |
| | | |
| Insurance — 0.2% | | | | | | | | | |
Ambac Assurance Corp., 5.10%, 06/07/20(b) | | | | | | | 5 | | | | 6,430 | |
Ambac LSNI LLC, (LIBOR USD 3 Month + 5.00%), 7.80%, 02/12/23(a)(b) | | | | | | | 30 | | | | 29,981 | |
Aon Corp., 4.50%, 12/15/28 | | | | | | | 120 | | | | 121,477 | |
Aon plc, 4.75%, 05/15/45 | | | | | | | 20 | | | | 19,625 | |
Hartford Financial Services Group, Inc. (The), 4.30%, 04/15/43 | | | | | | | 15 | | | | 13,935 | |
Marsh & McLennan Cos., Inc.: | | | | | | | | | | | | |
4.05%, 10/15/23 | | | | | | | 35 | | | | 35,511 | |
3.50%, 06/03/24 | | | | | | | 144 | | | | 141,845 | |
3.50%, 03/10/25 | | | | | | | 45 | | | | 44,206 | |
3.75%, 03/14/26 | | | | | | | 5 | | | | 4,941 | |
4.35%, 01/30/47 | | | | | | | 7 | | | | 6,528 | |
4.20%, 03/01/48 | | | | | | | 60 | | | | 54,495 | |
MetLife, Inc., 4.13%, 08/13/42 | | | | | | | 10 | | | | 9,363 | |
Principal Financial Group, Inc., 4.30%, 11/15/46 | | | | | | | 15 | | | | 13,801 | |
Prudential Financial, Inc., 3.88%, 03/27/28 | | | | | | | 90 | | | | 90,446 | |
Travelers Cos., Inc. (The), 4.60%, 08/01/43 | | | | | | | 35 | | | | 36,290 | |
Trinity Acquisition plc, 4.40%, 03/15/26 | | | | | | | 20 | | | | 19,874 | |
Willis North America, Inc., 3.60%, 05/15/24 | | | | | | | 131 | | | | 127,903 | |
| | | | | | | | | | | | |
| | | | | | | | | | | 776,651 | |
| | | |
| IT Services — 0.2% | | | | | | | | | |
DXC Technology Co., 2.88%, 03/27/20 | | | | | | | 48 | | | | 47,585 | |
Fidelity National Information Services, Inc.: | | | | | | | | | | | | |
3.63%, 10/15/20 | | | | | | | 8 | | | | 8,037 | |
3.00%, 08/15/26 | | | | | | | 180 | | | | 165,594 | |
| | | | | | | | | | | | |
| Security | | | | | Par
(000) | | | Value | |
| | | |
| IT Services (continued) | | | | | | | | | |
4.50%, 08/15/46 | | | USD | | | | 5 | | | $ | 4,547 | |
4.75%, 05/15/48 | | | | | | | 60 | | | | 55,773 | |
Fiserv, Inc.: | | | | | | | | | | | | |
3.85%, 06/01/25 | | | | | | | 20 | | | | 19,822 | |
4.20%, 10/01/28 | | | | | | | 65 | | | | 64,870 | |
IBM Credit LLC, 3.45%, 11/30/20 | | | | | | | 100 | | | | 100,517 | |
Total System Services, Inc.: | | | | | | | | | | | | |
3.80%, 04/01/21 | | | | | | | 20 | | | | 19,996 | |
3.75%, 06/01/23 | | | | | | | 25 | | | | 24,796 | |
4.80%, 04/01/26 | | | | | | | 124 | | | | 124,965 | |
Visa, Inc.: | | | | | | | | | | | | |
3.15%, 12/14/25 | | | | | | | 50 | | | | 49,135 | |
4.15%, 12/14/35 | | | | | | | 41 | | | | 42,403 | |
4.30%, 12/14/45 | | | | | | | 30 | | | | 31,004 | |
| | | | | | | | | | | | |
| | | | | | | | | | | 759,044 | |
|
| Life Sciences Tools & Services — 0.1% | |
Thermo Fisher Scientific, Inc.: | | | | | | | | | | | | |
4.50%, 03/01/21 | | | | | | | 95 | | | | 97,094 | |
3.00%, 04/15/23 | | | | | | | 50 | | | | 48,645 | |
4.15%, 02/01/24 | | | | | | | 110 | | | | 111,427 | |
2.95%, 09/19/26 | | | | | | | 117 | | | | 107,973 | |
| | | | | | | | | | | | |
| | | | | | | | | | | 365,139 | |
| | | |
| Media — 0.5% | | | | | | | | | |
CBS Corp., 2.30%, 08/15/19 | | | | | | | 107 | | | | 106,206 | |
Charter Communications Operating LLC: | | | | | | | | | | | | |
3.58%, 07/23/20 | | | | | | | 220 | | | | 219,763 | |
4.46%, 07/23/22 | | | | | | | 80 | | | | 80,769 | |
4.50%, 02/01/24 | | | | | | | 50 | | | | 49,924 | |
4.91%, 07/23/25 | | | | | | | 129 | | | | 128,272 | |
6.38%, 10/23/35 | | | | | | | 200 | | | | 205,289 | |
5.75%, 04/01/48 | | | | | | | 100 | | | | 93,642 | |
Comcast Corp.: | | | | | | | | | | | | |
3.30%, 10/01/20 | | | | | | | 195 | | | | 195,746 | |
3.45%, 10/01/21 | | | | | | | 20 | | | | 20,203 | |
3.38%, 02/15/25 | | | | | | | 15 | | | | 14,691 | |
3.15%, 03/01/26 | | | | | | | 140 | | | | 133,954 | |
4.15%, 10/15/28 | | | | | | | 75 | | | | 76,157 | |
4.25%, 10/15/30 | | | | | | | 70 | | | | 70,792 | |
4.40%, 08/15/35 | | | | | | | 34 | | | | 32,892 | |
3.20%, 07/15/36 | | | | | | | 229 | | | | 196,987 | |
3.40%, 07/15/46 | | | | | | | 172 | | | | 142,515 | |
4.95%, 10/15/58 | | | | | | | 40 | | | | 40,666 | |
Cox Communications, Inc., 3.15%, 08/15/24(b) | | | | | | | 210 | | | | 202,021 | |
Discovery Communications LLC: | | | | | | | | | | | | |
4.38%, 06/15/21 | | | | | | | 70 | | | | 71,234 | |
3.80%, 03/13/24 | | | | | | | 67 | | | | 65,361 | |
3.95%, 06/15/25(b) | | | | | | | 55 | | | | 52,831 | |
5.20%, 09/20/47 | | | | | | | 15 | | | | 13,786 | |
Interpublic Group of Cos., Inc. (The): | | | | | | | | | | | | |
3.50%, 10/01/20 | | | | | | | 25 | | | | 25,031 | |
3.75%, 10/01/21 | | | | | | | 15 | | | | 15,093 | |
Time Warner Cable LLC: | | | | | | | | | | | | |
5.00%, 02/01/20 | | | | | | | 89 | | | | 90,248 | |
4.00%, 09/01/21 | | | | | | | 25 | | | | 24,848 | |
5.50%, 09/01/41 | | | | | | | 29 | | | | 26,428 | |
4.50%, 09/15/42 | | | | | | | 9 | | | | 7,235 | |
| | | | | | | | | | | | |
| | | | | | | | | | | 2,402,584 | |
| | | |
| Metals & Mining — 0.1% | | | | | | | | | |
Anglo American Capital plc, 3.63%, 09/11/24(b) | | | | | | | 200 | | | | 189,050 | |
Barrick Gold Corp., 5.25%, 04/01/42 | | | | | | | 29 | | | | 28,999 | |
BHP Billiton Finance USA Ltd., 5.00%, 09/30/43 | | | | | | | 38 | | | | 41,514 | |
Largo Resources Ltd., 9.25%, 06/01/21(b) | | | | | | | 4 | | | | 4,205 | |
| | | | |
| SCHEDULES OF INVESTMENTS | | | 39 | |
| | |
Schedule of Investments (continued) December 31, 2018 | | BlackRock Balanced Capital Portfolio (Percentages shown are based on Net Assets) |
| | | | | | | | | | | | |
| Security | | | | | Par
(000) | | | Value | |
| | | |
| Metals & Mining (continued) | | | | | | | | | |
Newmont Mining Corp., 3.50%, 03/15/22 | | | USD | | | | 120 | | | $ | 118,748 | |
Nucor Corp., 5.20%, 08/01/43 | | | | | | | 21 | | | | 22,271 | |
Steel Dynamics, Inc., 5.13%, 10/01/21 | | | | | | | 38 | | | | 37,952 | |
| | | | | | | | | | | | |
| | | | | | | | | | | 442,739 | |
| | | |
| Multi-Utilities — 0.1% | | | | | | | | | |
Ameren Illinois Co., 3.80%, 05/15/28 | | | | | | | 50 | | | | 50,864 | |
Consumers Energy Co.: | | | | | | | | | | | | |
3.80%, 11/15/28 | | | | | | | 15 | | | | 15,362 | |
4.05%, 05/15/48 | | | | | | | 15 | | | | 14,791 | |
DTE Energy Co., Series D, 3.70%, 08/01/23 | | | | | | | 40 | | | | 39,720 | |
NiSource, Inc.: | | | | | | | | | | | | |
2.65%, 11/17/22 | | | | | | | 10 | | | | 9,574 | |
3.49%, 05/15/27 | | | | | | | 80 | | | | 76,339 | |
WEC Energy Group, Inc., 3.38%, 06/15/21 | | | | | | | 20 | | | | 19,988 | |
| | | | | | | | | | | | |
| | | | | | | | | | | 226,638 | |
| | | |
| Oil, Gas & Consumable Fuels — 1.5% | | | | | | | | | |
Anadarko Petroleum Corp., 6.20%, 03/15/40 | | | | | | | 70 | | | | 72,327 | |
Andeavor Logistics LP: | | | | | | | | | | | | |
5.50%, 10/15/19 | | | | | | | 90 | | | | 90,758 | |
5.25%, 01/15/25 | | | | | | | 20 | | | | 20,359 | |
5.20%, 12/01/47 | | | | | | | 70 | | | | 63,020 | |
Apache Corp.: | | | | | | | | | | | | |
2.63%, 01/15/23 | | | | | | | 43 | | | | 40,618 | |
5.10%, 09/01/40 | | | | | | | 30 | | | | 27,172 | |
4.75%, 04/15/43 | | | | | | | 80 | | | | 68,621 | |
BP Capital Markets America, Inc., 3.79%, 02/06/24 | | | | | | | 60 | | | | 60,647 | |
Buckeye Partners LP, 4.88%, 02/01/21 | | | | | | | 155 | | | | 156,722 | |
Cimarex Energy Co.: | | | | | | | | | | | | |
4.38%, 06/01/24 | | | | | | | 120 | | | | 119,332 | |
3.90%, 05/15/27 | | | | | | | 80 | | | | 74,235 | |
Concho Resources, Inc.: | | | | | | | | | | | | |
4.38%, 01/15/25 | | | | | | | 125 | | | | 123,463 | |
3.75%, 10/01/27 | | | | | | | 135 | | | | 127,084 | |
Continental Resources, Inc.: | | | | | | | | | | | | |
5.00%, 09/15/22 | | | | | | | 173 | | | | 171,773 | |
4.50%, 04/15/23 | | | | | | | 233 | | | | 229,313 | |
3.80%, 06/01/24 | | | | | | | 75 | | | | 71,000 | |
Devon Energy Corp., 4.00%, 07/15/21 | | | | | | | 40 | | | | 40,039 | |
Enbridge, Inc.: | | | | | | | | | | | | |
2.90%, 07/15/22 | | | | | | | 90 | | | | 87,099 | |
3.70%, 07/15/27 | | | | | | | 70 | | | | 66,300 | |
(LIBOR USD 3 Month + 3.42%), 5.50%, 07/15/77(a) | | | | | | | 70 | | | | 59,269 | |
Energy Transfer LP: | | | | | | | | | | | | |
4.25%, 03/15/23 | | | | | | | 215 | | | | 206,938 | |
5.88%, 01/15/24 | | | | | | | 130 | | | | 132,275 | |
Energy Transfer Operating LP: | | | | | | | | | | | | |
5.20%, 02/01/22 | | | | | | | 20 | | | | 20,539 | |
4.90%, 02/01/24 | | | | | | | 20 | | | | 20,242 | |
6.50%, 02/01/42 | | | | | | | 120 | | | | 119,763 | |
Energy Transfer Partners LP: | | | | | | | | | | | | |
5.75%, 09/01/20 | | | | | | | 20 | | | | 20,526 | |
5.88%, 03/01/22 | | | | | | | 165 | | | | 171,678 | |
5.00%, 10/01/22 | | | | | | | 30 | | | | 30,616 | |
4.50%, 11/01/23 | | | | | | | 125 | | | | 125,041 | |
Enterprise Products Operating LLC: | | | | | | | | | | | | |
4.45%, 02/15/43 | | | | | | | 67 | | | | 60,799 | |
5.10%, 02/15/45 | | | | | | | 23 | | | | 23,084 | |
4.25%, 02/15/48 | | | | | | | 35 | | | | 31,023 | |
EOG Resources, Inc.: | | | | | | | | | | | | |
4.15%, 01/15/26 | | | | | | | 52 | | | | 53,372 | |
3.90%, 04/01/35 | | | | | | | 10 | | | | 9,441 | |
| | | | | | | | | | | | |
| Security | | | | | Par
(000) | | | Value | |
| | | |
| Oil, Gas & Consumable Fuels (continued) | | | | | | | | | |
Exxon Mobil Corp., 1.82%, 03/15/19 | | | USD | | | | 84 | | | $ | 83,845 | |
Hess Corp., 5.80%, 04/01/47 | | | | | | | 35 | | | | 31,414 | |
Kinder Morgan Energy Partners LP: | | | | | | | | | | | | |
5.80%, 03/15/35 | | | | | | | 10 | | | | 10,223 | |
6.38%, 03/01/41 | | | | | | | 15 | | | | 15,920 | |
5.00%, 03/01/43 | | | | | | | 25 | | | | 22,685 | |
Kinder Morgan, Inc.: | | | | | | | | | | | | |
3.05%, 12/01/19 | | | | | | | 100 | | | | 99,423 | |
3.15%, 01/15/23 | | | | | | | 190 | | | | 184,630 | |
5.55%, 06/01/45 | | | | | | | 10 | | | | 9,904 | |
5.05%, 02/15/46 | | | | | | | 160 | | | | 146,102 | |
Marathon Oil Corp., 2.70%, 06/01/20 | | | | | | | 140 | | | | 137,931 | |
Marathon Petroleum Corp.: | | | | | | | | | | | | |
5.13%, 03/01/21 | | | | | | | 175 | | | | 180,052 | |
4.75%, 12/15/23(b) | | | | | | | 180 | | | | 184,697 | |
5.85%, 12/15/45 | | | | | | | 50 | | | | 49,365 | |
MPLX LP: | | | | | | | | | | | | |
4.88%, 12/01/24 | | | | | | | 25 | | | | 25,449 | |
4.88%, 06/01/25 | | | | | | | 50 | | | | 50,458 | |
4.13%, 03/01/27 | | | | | | | 140 | | | | 133,296 | |
5.20%, 03/01/47 | | | | | | | 35 | | | | 32,217 | |
Northwest Pipeline LLC, 4.00%, 04/01/27 | | | | | | | 135 | | | | 131,216 | |
Petrobras Global Finance BV: | | | | | | | | | | | | |
8.75%, 05/23/26 | | | | | | | 40 | | | | 44,900 | |
7.38%, 01/17/27 | | | | | | | 78 | | | | 80,145 | |
6.00%, 01/27/28 | | | | | | | 40 | | | | 37,700 | |
Pioneer Natural Resources Co.: | | | | | | | | | | | | |
3.95%, 07/15/22 | | | | | | | 10 | | | | 10,030 | |
4.45%, 01/15/26 | | | | | | | 192 | | | | 193,852 | |
Plains All American Pipeline LP, 3.65%, 06/01/22 | | | | | | | 10 | | | | 9,817 | |
Resolute Energy Corp., 8.50%, 05/01/20 | | | | | | | 90 | | | | 88,650 | |
Sabine Pass Liquefaction LLC: | | | | | | | | | | | | |
5.63%, 04/15/23 | | | | | | | 190 | | | | 200,180 | |
5.75%, 05/15/24 | | | | | | | 140 | | | | 146,070 | |
5.63%, 03/01/25 | | | | | | | 180 | | | | 186,923 | |
5.88%, 06/30/26 | | | | | | | 149 | | | | 157,762 | |
Spectra Energy Partners LP, 4.50%, 03/15/45 | | | | | | | 89 | | | | 80,476 | |
Sunoco Logistics Partners Operations LP: | | | | | | | | | | | | |
5.35%, 05/15/45 | | | | | | | 55 | | | | 48,682 | |
5.40%, 10/01/47 | | | | | | | 80 | | | | 72,497 | |
Tecpetrol SA, 4.88%, 12/12/22(b) | | | | | | | 14 | | | | 12,845 | |
Texas Eastern Transmission LP(b): | | | | | | | | | | | | |
3.50%, 01/15/28 | | | | | | | 60 | | | | 56,648 | |
4.15%, 01/15/48 | | | | | | | 30 | | | | 26,701 | |
TransCanada PipeLines Ltd.: | | | | | | | | | | | | |
4.88%, 01/15/26 | | | | | | | 110 | | | | 113,853 | |
6.10%, 06/01/40 | | | | | | | 55 | | | | 61,387 | |
5.00%, 10/16/43 | | | | | | | 30 | | | | 29,644 | |
Transcontinental Gas Pipe Line Co. LLC: | | | | | | | | | | | | |
7.85%, 02/01/26 | | | | | | | 41 | | | | 49,564 | |
4.00%, 03/15/28 | | | | | | | 80 | | | | 78,227 | |
4.60%, 03/15/48 | | | | | | | 25 | | | | 23,376 | |
Valero Energy Corp.: | | | | | | | | | | | | |
3.65%, 03/15/25 | | | | | | | 76 | | | | 72,526 | |
3.40%, 09/15/26 | | | | | | | 9 | | | | 8,256 | |
Williams Cos., Inc. (The): | | | | | | | | | | | | |
4.13%, 11/15/20 | | | | | | | 70 | | | | 70,556 | |
7.88%, 09/01/21 | | | | | | | 50 | | | | 54,603 | |
3.70%, 01/15/23 | | | | | | | 50 | | | | 48,775 | |
4.55%, 06/24/24 | | | | | | | 40 | | | | 40,388 | |
4.00%, 09/15/25 | | | | | | | 90 | | | | 86,901 | |
Series A, 7.50%, 01/15/31 | | | | | | | 35 | | | | 41,780 | |
5.75%, 06/24/44 | | | | | | | 55 | | | | 55,277 | |
| | | | | | | | | | | | |
| | | | | | | | | | | 6,612,306 | |
| | |
| 40 | | 2018 BLACKROCK ANNUAL REPORTTO SHAREHOLDERS |
| | |
Schedule of Investments (continued) December 31, 2018 | | BlackRock Balanced Capital Portfolio (Percentages shown are based on Net Assets) |
| | | | | | | | | | | | |
| Security | | | | | Par
(000) | | | Value | |
| | | |
| Paper & Forest Products — 0.0% | | | | | | | | | |
Georgia-Pacific LLC: | | | | | | | | | | | | |
5.40%, 11/01/20(b) | | | USD | | | | 50 | | | $ | 51,809 | |
3.73%, 07/15/23(b) | | | | | | | 45 | | | | 45,428 | |
7.38%, 12/01/25 | | | | | | | 37 | | | | 44,617 | |
| | | | | | | | | | | | |
| | | | | | | | | | | 141,854 | |
|
| Pharmaceuticals — 0.4% | |
Allergan Finance LLC, 3.25%, 10/01/22 | | | | | | | 45 | | | | 43,997 | |
Allergan Funding SCS: | | | | | | | | | | | | |
3.45%, 03/15/22 | | | | | | | 250 | | | | 246,011 | |
3.80%, 03/15/25 | | | | | | | 484 | | | | 472,492 | |
Bayer US Finance II LLC, 3.60%, 07/15/42(b) | | | | | | | 23 | | | | 16,969 | |
Bayer US Finance LLC, 3.38%, 10/08/24(b) | | | | | | | 200 | | | | 188,599 | |
GlaxoSmithKline Capital, Inc., 3.88%, 05/15/28 | | | | | | | 105 | | | | 106,703 | |
Johnson & Johnson: | | | | | | | | | | | | |
2.63%, 01/15/25 | | | | | | | 10 | | | | 9,631 | |
2.45%, 03/01/26 | | | | | | | 15 | | | | 14,088 | |
3.63%, 03/03/37 | | | | | | | 15 | | | | 14,429 | |
Shire Acquisitions Investments Ireland DAC: | | | | | | | | | | | | |
1.90%, 09/23/19 | | | | | | | 290 | | | | 285,936 | |
2.40%, 09/23/21 | | | | | | | 35 | | | | 33,844 | |
3.20%, 09/23/26 | | | | | | | 120 | | | | 108,591 | |
Takeda Pharmaceutical Co. Ltd., 5.00%, 11/26/28(b) | | | | | | | 200 | | | | 204,272 | |
Wyeth LLC: | | | | | | | | | | | | |
6.45%, 02/01/24 | | | | | | | 15 | | | | 17,176 | |
5.95%, 04/01/37 | | | | | | | 70 | | | | 83,948 | |
| | | | | | | | | | | | |
| | | | | | | | | | | 1,846,686 | |
| | | |
| Road & Rail — 0.2% | | | | | | | | | |
Burlington Northern Santa Fe LLC: | | | | | | | | | | | | |
6.15%, 05/01/37 | | | | | | | 23 | | | | 28,017 | |
4.15%, 04/01/45 | | | | | | | 16 | | | | 15,513 | |
4.70%, 09/01/45 | | | | | | | 11 | | | | 11,502 | |
4.13%, 06/15/47 | | | | | | | 73 | | | | 70,648 | |
4.15%, 12/15/48 | | | | | | | 5 | | | | 4,869 | |
CSX Corp.: | | | | | | | | | | | | |
4.25%, 03/15/29 | | | | | | | 45 | | | | 45,688 | |
4.75%, 11/15/48 | | | | | | | 20 | | | | 20,217 | |
4.25%, 11/01/66 | | | | | | | 43 | | | | 37,175 | |
Norfolk Southern Corp.: | | | | | | | | | | | | |
3.65%, 08/01/25 | | | | | | | 60 | | | | 60,313 | |
2.90%, 06/15/26 | | | | | | | 90 | | | | 85,223 | |
4.05%, 08/15/52 | | | | | | | 41 | | | | 36,617 | |
Penske Truck Leasing Co. LP, 3.40%, 11/15/26(b) | | | | | | | 94 | | | | 87,849 | |
Ryder System, Inc., 3.75%, 06/09/23 | | | | | | | 10 | | | | 9,939 | |
Union Pacific Corp.: | | | | | | | | | | | | |
3.75%, 07/15/25 | | | | | | | 75 | | | | 75,712 | |
3.38%, 02/01/35 | | | | | | | 29 | | | | 25,380 | |
3.60%, 09/15/37 | | | | | | | 80 | | | | 71,498 | |
3.80%, 10/01/51 | | | | | | | 20 | | | | 16,963 | |
3.88%, 02/01/55 | | | | | | | 37 | | | | 31,592 | |
| | | | | | | | | | | | |
| | | | | | | | | | | 734,715 | |
| | | |
| Semiconductors & Semiconductor Equipment — 0.4% | | | | | | | | | |
Analog Devices, Inc.: | | | | | | | | | | | | |
2.50%, 12/05/21 | | | | | | | 80 | | | | 78,092 | |
3.90%, 12/15/25 | | | | | | | 39 | | | | 38,272 | |
3.50%, 12/05/26 | | | | | | | 29 | | | | 27,756 | |
5.30%, 12/15/45 | | | | | | | 28 | | | | 29,455 | |
Applied Materials, Inc.: | | | | | | | | | | | | |
3.90%, 10/01/25 | | | | | | | 110 | | | | 110,694 | |
5.10%, 10/01/35 | | | | | | | 58 | | | | 61,724 | |
4.35%, 04/01/47 | | | | | | | 49 | | | | 47,907 | |
| | | | | | | | | | | | |
| Security | | | | | Par
(000) | | | Value | |
|
| Semiconductors & Semiconductor Equipment (continued) | |
Broadcom Corp.: | | | | | | | | | | | | |
2.38%, 01/15/20 | | | USD | | | | 115 | | | $ | 113,564 | |
3.00%, 01/15/22 | | | | | | | 383 | | | | 368,332 | |
2.65%, 01/15/23 | | | | | | | 35 | | | | 32,572 | |
3.63%, 01/15/24 | | | | | | | 26 | | | | 24,599 | |
Lam Research Corp.: | | | | | | | | | | | | |
2.75%, 03/15/20 | | | | | | | 60 | | | | 59,436 | |
2.80%, 06/15/21 | | | | | | | 35 | | | | 34,610 | |
NVIDIA Corp., 3.20%, 09/16/26 | | | | | | | 80 | | | | 75,876 | |
NXP BV(b): | | | | | | | | | | | | |
4.13%, 06/01/21 | | | | | | | 200 | | | | 197,500 | |
3.88%, 09/01/22 | | | | | | | 230 | | | | 220,800 | |
4.88%, 03/01/24 | | | | | | | 45 | | | | 45,198 | |
QUALCOMM, Inc.: | | | | | | | | | | | | |
2.60%, 01/30/23 | | | | | | | 75 | | | | 72,174 | |
2.90%, 05/20/24 | | | | | | | 50 | | | | 47,610 | |
3.45%, 05/20/25 | | | | | | | 65 | | | | 62,539 | |
4.80%, 05/20/45 | | | | | | | 56 | | | | 53,340 | |
4.30%, 05/20/47 | | | | | | | 95 | | | | 84,374 | |
Texas Instruments, Inc.: | | | | | | | | | | | | |
2.25%, 05/01/23 | | | | | | | 30 | | | | 28,829 | |
4.15%, 05/15/48 | | | | | | | 25 | | | | 24,946 | |
| | | | | | | | | | | | |
| | | | | | | | | | | 1,940,199 | |
| | | |
| Software — 0.3% | | | | | | | | | |
Autodesk, Inc., 3.50%, 06/15/27 | | | | | | | 160 | | | | 149,551 | |
Microsoft Corp.: | | | | | | | | | | | | |
3.50%, 02/12/35 | | | | | | | 69 | | | | 65,854 | |
3.45%, 08/08/36 | | | | | | | 175 | | | | 164,825 | |
3.70%, 08/08/46 | | | | | | | 210 | | | | 201,177 | |
Oracle Corp.: | | | | | | | | | | | | |
2.50%, 10/15/22 | | | | | | | 10 | | | | 9,732 | |
2.40%, 09/15/23 | | | | | | | 30 | | | | 28,789 | |
3.40%, 07/08/24 | | | | | | | 70 | | | | 69,861 | |
2.65%, 07/15/26 | | | | | | | 30 | | | | 27,803 | |
3.25%, 11/15/27 | | | | | | | 41 | | | | 39,544 | |
3.90%, 05/15/35 | | | | | | | 62 | | | | 59,348 | |
4.00%, 07/15/46 | | | | | | | 74 | | | | 69,048 | |
4.00%, 11/15/47 | | | | | | | 15 | | | | 13,976 | |
VMware, Inc., 2.30%, 08/21/20 | | | | | | | 264 | | | | 258,577 | |
| | | | | | | | | | | | |
| | | | | | | | | | | 1,158,085 | |
| | | |
| Specialty Retail — 0.0% | | | | | | | | | |
Home Depot, Inc. (The): | | | | | | | | | | | | |
3.90%, 12/06/28 | | | | | | | 20 | | | | 20,485 | |
5.88%, 12/16/36 | | | | | | | 45 | | | | 54,065 | |
3.50%, 09/15/56 | | | | | | | 20 | | | | 16,817 | |
Lowe’s Cos., Inc., 4.38%, 09/15/45 | | | | | | | 60 | | | | 53,878 | |
| | | | | | | | | | | | |
| | | | | | | | | | | 145,245 | |
|
| Technology Hardware, Storage & Peripherals — 0.2% | |
Apple, Inc.: | | | | | | | | | | | | |
2.70%, 05/13/22 | | | | | | | 80 | | | | 79,109 | |
3.00%, 02/09/24 | | | | | | | 138 | | | | 136,284 | |
2.85%, 05/11/24 | | | | | | | 205 | | | | 200,006 | |
4.50%, 02/23/36 | | | | | | | 30 | | | | 31,548 | |
3.85%, 05/04/43 | | | | | | | 100 | | | | 94,698 | |
3.45%, 02/09/45 | | | | | | | 29 | | | | 25,679 | |
4.65%, 02/23/46 | | | | | | | 78 | | | | 82,566 | |
Seagate HDD Cayman: | | | | | | | | | | | | |
4.25%, 03/01/22 | | | | | | | 25 | | | | 23,892 | |
5.75%, 12/01/34 | | | | | | | 3 | | | | 2,335 | |
| | | | | | | | | | | | |
| | | | | | | | | | | 676,117 | |
| | | | |
| SCHEDULES OF INVESTMENTS | | | 41 | |
| | |
Schedule of Investments (continued) December 31, 2018 | | BlackRock Balanced Capital Portfolio (Percentages shown are based on Net Assets) |
| | | | | | | | | | | | |
| Security | | | | | Par
(000) | | | Value | |
|
| Thrifts & Mortgage Finance — 0.0% | |
Washington Mutual Escrow Bonds(e)(g): | | | | | | | | | | | | |
0.00%, 11/06/09 | | | USD | | | | 100 | | | $ | — | |
0.00%, 09/29/17 | | | | | | | 400 | | | | — | |
| | | | | | | | | | | | |
| | | | | | | | | | | — | |
| | | |
| Tobacco — 0.1% | | | | | | | | | |
Altria Group, Inc.: | | | | | | | | | | | | |
2.85%, 08/09/22 | | | | | | | 30 | | | | 28,800 | |
4.00%, 01/31/24 | | | | | | | 125 | | | | 122,843 | |
BAT Capital Corp.: | | | | | | | | | | | | |
3.22%, 08/15/24 | | | | | | | 225 | | | | 207,246 | |
4.54%, 08/15/47 | | | | | | | 82 | | | | 65,276 | |
Reynolds American, Inc., 4.45%, 06/12/25 | | | | | | | 240 | | | | 231,416 | |
| | | | | | | | | | | | |
| | | | | | | | | | | 655,581 | |
|
| Trading Companies & Distributors — 0.0% | |
Air Lease Corp., 2.63%, 07/01/22 | | | | | | | 70 | | | | 66,353 | |
GATX Corp., 2.60%, 03/30/20 | | | | | | | 67 | | | | 66,349 | |
| | | | | | | | | | | | |
| | | | | | | | | | | 132,702 | |
|
| Wireless Telecommunication Services — 0.2% | |
Sprint Spectrum Co. LLC(b): | | | | | | | | | | | | |
3.36%, 09/20/21 | | | | | | | 193 | | | | 190,772 | |
4.74%, 03/20/25 | | | | | | | 415 | | | | 407,219 | |
Vodafone Group plc: | | | | | | | | | | | | |
3.75%, 01/16/24 | | | | | | | 241 | | | | 237,537 | |
4.13%, 05/30/25 | | | | | | | 55 | | | | 54,334 | |
5.25%, 05/30/48 | | | | | | | 130 | | | | 122,049 | |
| | | | | | | | | | | | |
| | | | | | | | | | | 1,011,911 | |
| | | | | | | | | | | | |
| |
Total Corporate Bonds — 13.1%
(Cost: $60,466,026) | | | | 59,207,281 | |
| | | | | | | | | | | | |
|
Foreign Agency Obligations — 0.1% | |
| | | |
| Argentina — 0.0% | | | | | | | | | |
YPF SA, 8.75%, 04/04/24 | | | | | | | 47 | | | | 44,180 | |
| | | | | | | | | | | | |
| | | |
| France — 0.1% | | | | | | | | | |
Electricite de France SA,
4.50%, 09/21/28(b) | | | | | | | 200 | | | | 193,847 | |
| | | | | | | | | | | | |
| |
Total Foreign Agency Obligations — 0.1%
(Cost: $250,948) | | | | 238,027 | |
| | | | | | | | | | | | |
|
Foreign Government Obligations — 0.8% | |
| | | |
| Argentina — 0.1% | | | | | | | | | |
Bonos de la Nacion Argentina con Ajuste por CER,
4.00%, 03/06/20 | | | ARS | | | | 740 | | | | 17,052 | |
Republic of Argentina: | | | | | | | | | | | | |
8.00%, 10/08/20 | | | USD | | | | 58 | | | | 54,244 | |
6.88%, 04/22/21 | | | | | | | 187 | | | | 169,002 | |
5.63%, 01/26/22 | | | | | | | 82 | | | | 69,188 | |
4.63%, 01/11/23 | | | | | | | 30 | | | | 23,662 | |
8.75%, 05/07/24 | | | | | | | 56 | | | | 51,213 | |
6.88%, 01/11/48 | | | | | | | 83 | | | | 57,581 | |
7.13%, 06/28/2117 | | | | | | | 49 | | | | 35,035 | |
| | | | | | | | | | | | |
| | | | | | | | | | | 476,977 | |
| | | |
| Colombia — 0.1% | | | | | | | | | |
Republic of Colombia: | | | | | | | | | | | | |
7.50%, 08/26/26 | | | COP | | | | 476,000 | | | | 154,279 | |
3.88%, 04/25/27 | | | USD | | | | 340 | | | | 324,445 | |
7.00%, 06/30/32 | | | COP | | | | 344,000 | | | | 104,294 | |
| | | | | | | | | | | | |
| | | | | | | | | | | 583,018 | |
| | | | | | | | | | | | |
| Security | | | | | Par
(000) | | | Value | |
| | | |
| Egypt — 0.0% | | | | | | | | | |
Arab Republic of Egypt, 5.75%, 04/29/20 | | | USD | | | | 100 | | | $ | 100,875 | |
| | | | | | | | | | | | |
| | | |
| Hungary — 0.0% | | | | | | | | | |
Republic of Hungary, 5.38%, 03/25/24 | | | | | | | 140 | | | | 149,238 | |
| | | | | | | | | | | | |
| | | |
| Indonesia — 0.0% | | | | | | | | | |
Republic of Indonesia, 7.50%, 05/15/38 | | | IDR | | | | 1,432,000 | | | | 90,670 | |
| | | | | | | | | | | | |
| | | |
| Mexico — 0.3% | | | | | | | | | |
United Mexican States: | | | | | | | | | | | | |
4.15%, 03/28/27 | | | USD | | | | 1,032 | | | | 994,590 | |
7.50%, 06/03/27 | | | MXN | | | | 12 | | | | 56,841 | |
7.75%, 11/23/34 | | | | | | | 14 | | | | 65,665 | |
10.00%, 11/20/36 | | | | | | | 10 | | | | 55,945 | |
8.50%, 11/18/38 | | | | | | | 20 | | | | 97,834 | |
7.75%, 11/13/42 | | | | | | | 20 | | | | 89,711 | |
| | | | | | | | | | | | |
| | | | | | | | | | | 1,360,586 | |
| | | |
| Oman — 0.1% | | | | | | | | | |
Oman Sovereign Sukuk SAOC, 5.93%, 10/31/25(b) | | | USD | | | | 200 | | | | 190,250 | |
| | | | | | | | | | | | |
| | | |
| Panama — 0.1% | | | | | | | | | |
Republic of Panama, 3.75%, 03/16/25 | | | | | | | 200 | | | | 198,450 | |
| | | | | | | | | | | | |
| | | |
| Peru — 0.0% | | | | | | | | | |
Republic of Peru, 7.35%, 07/21/25 | | | | | | | 150 | | | | 182,025 | |
| | | | | | | | | | | | |
| | | |
| Philippines — 0.1% | | | | | | | | | |
Republic of the Philippines, 3.00%, 02/01/28 | | | | | | | 260 | | | �� | 246,025 | |
| | | | | | | | | | | | |
| | | |
| South Africa — 0.0% | | | | | | | | | |
Republic of South Africa, 8.75%, 02/28/48 | | | ZAR | | | | 810 | | | | 50,070 | |
| | | | | | | | | | | | |
| | | |
| Uruguay — 0.0% | | | | | | | | | |
Oriental Republic of Uruguay, 4.38%, 10/27/27 | | | USD | | | | 140 | | | | 140,315 | |
| | | | | | | | | | | | |
| |
Total Foreign Government Obligations — 0.8%
(Cost: $3,928,430) | | | | 3,768,499 | |
| | | | | | | | | | | | |
| | | |
| | | | | | Shares | | | | |
|
Investment Companies — 0.4%(v) | |
iShares Edge MSCI Multifactor USA ETF | | | | | | | 12,018 | | | | 334,822 | |
iShares iBoxx $ High Yield Corporate Bond ETF | | | | | | | 11,100 | | | | 900,210 | |
iShares J.P. Morgan USD Emerging Markets Bond ETF | | | | | | | 5,333 | | | | 554,152 | |
| | | | | | | | | | | | |
| |
Total Investment Companies — 0.4%
(Cost: $1,852,128) | | | | 1,789,184 | |
| | | | | | | | | | | | |
| | | |
| | | | | | Par
(000) | | | | |
| | | |
Municipal Bonds — 2.8% | | | | | | | | | | | | |
Adams & Weld Counties School District No. 27J, Series 2017, GO, 5.00%, 12/01/42 | | | USD | | | | 20 | | | | 22,805 | |
Alamo Community College District; | | | | | | | | | | | | |
Series 2017, GO, 5.00%, 08/15/35 | | | | | | | 20 | | | | 23,181 | |
Series 2017, GO, 5.00%, 08/15/36 | | | | | | | 20 | | | | 23,066 | |
Series 2017, GO, 5.00%, 08/15/37 | | | | | | | 20 | | | | 22,984 | |
Series 2017, GO, 5.00%, 08/15/38 | | | | | | | 20 | | | | 22,886 | |
American Municipal Power, Inc. (Combined Hydroelectric Project); | | | | | | | | | | | | |
Series 2010B, RB, 7.83%, 02/15/41 | | | | | | | 20 | | | | 29,310 | |
Series 2009B, RB, 6.45%, 02/15/44 | | | | | | | 15 | | | | 19,259 | |
Arizona Health Facilities Authority (Banner Health), Series 2007B, RB, VRDN, 2.42%, 01/01/37(j) | | | | | | | 40 | | | | 38,089 | |
Arizona State University, Series 2017B, RB, 5.00%, 07/01/43 | | | | | | | 10 | | | | 11,353 | |
| | |
| 42 | | 2018 BLACKROCK ANNUAL REPORTTO SHAREHOLDERS |
| | |
Schedule of Investments (continued) December 31, 2018 | | BlackRock Balanced Capital Portfolio (Percentages shown are based on Net Assets) |
| | | | | | | | | | | | |
| Security | | | | | Par
(000) | | | Value | |
|
Municipal Bonds (continued) | |
Bay Area Toll Authority; | | | | | | | | | | | | |
Series 2010S-1, RB, 6.92%, 04/01/40 | | | USD | | | | 80 | | | $ | 106,804 | |
Series 2010S-1, RB, 7.04%, 04/01/50 | | | | | | | 110 | | | | 156,287 | |
Berks County Industrial Development Authority (Tower Health Project); | | | | | | | | | | | | |
Series 2017, RB, 5.00%, 11/01/47 | | | | | | | 20 | | | | 21,629 | |
Series 2017, RB, 5.00%, 11/01/50 | | | | | | | 20 | | | | 21,505 | |
Buckeye Tobacco Settlement Financing Authority, Series 2007A-2, RB, 5.88%, 06/01/47 | | | | | | | 90 | | | | 85,387 | |
Buena Park School District, Series 2018, GO, 5.00%,��08/01/47 | | | | | | | 10 | | | | 11,373 | |
California Health Facilities Financing Authority (Cedars- Sinai Medical Center); | | | | | | | | | | | | |
Series 2016A, RB, 5.00%, 08/15/33 | | | | | | | 20 | | | | 23,207 | |
Series 2017A, RB, 5.00%, 08/15/47 | | | | | | | 20 | | | | 21,949 | |
California Infrastructure & Economic Development Bank; | | | | | | | | | | | | |
Series 2017, RB, 5.00%, 05/15/47 | | | | | | | 10 | | | | 11,368 | |
Series 2017, RB, 5.00%, 05/15/52 | | | | | | | 10 | | | | 11,308 | |
California Municipal Finance Authority (LINXS APM Project), Series 2018A, RB, 5.00%, 12/31/47 | | | | | | | 20 | | | | 21,715 | |
California State Public Works Board (Various Capital Projects), Series 2009G,Sub-Series G-2, RB, 8.36%, 10/01/34 | | | | | | | 40 | | | | 58,119 | |
Canaveral Port Authority; | | | | | | | | | | | | |
Series 2018A, RB, 5.00%, 06/01/45 | | | | | | | 30 | | | | 32,479 | |
Series 2018B, RB, 5.00%, 06/01/48 | | | | | | | 30 | | | | 33,025 | |
Central Puget Sound Regional Transit Authority, Series 2015S-1, RB, 5.00%, 11/01/50 | | | | | | | 20 | | | | 22,321 | |
Central Texas Regional Mobility Authority; | | | | | | | | | | | | |
Series 2015A, RB, 5.00%, 01/01/45 | | | | | | | 20 | | | | 21,513 | |
Series 2016, RB, 5.00%, 01/01/46 | | | | | | | 20 | | | | 21,589 | |
Chesapeake Bay Bridge & Tunnel District (Parallel Thimble Shoal Tunnel Project); | | | | | | | | | | | | |
Series 2016, RB, 5.00%, 07/01/41 | | | | | | | 20 | | | | 22,524 | |
Series 2016, RB, 5.00%, 07/01/51 | | | | | | | 10 | | | | 10,803 | |
Chicago O’Hare International Airport, Series 2018C, RB, 4.47%, 01/01/49 | | | | | | | 120 | | | | 121,741 | |
City & County of Denver; | | | | | | | | | | | | |
Series 2016A, RB, 5.00%, 08/01/44 | | | | | | | 40 | | | | 44,810 | |
Series 2018A-1, RB, 5.00%, 08/01/48 | | | | | | | 50 | | | | 55,763 | |
City & County of Denver Airport System; | | | | | | | | | | | | |
Series 2017A, RB, 5.00%, 11/15/29 | | | | | | | 15 | | | | 17,447 | |
Series 2017A, RB, 5.00%, 11/15/30 | | | | | | | 15 | | | | 17,332 | |
City of Atlanta; | | | | | | | | | | | | |
Series 2015, RB, 5.00%, 11/01/40 | | | | | | | 10 | | | | 11,114 | |
Series 2018A, RB, 5.00%, 11/01/41 | | | | | | | 30 | | | | 34,247 | |
Series 2018B, RB, 5.00%, 11/01/43 | | | | | | | 20 | | | | 22,798 | |
Series 2018B, RB, 5.00%, 11/01/47 | | | | | | | 20 | | | | 22,732 | |
City of Aurora; | | | | | | | | | | | | |
Series 2016, RB, 5.00%, 08/01/41 | | | | | | | 50 | | | | 56,407 | |
Series 2016, RB, 5.00%, 08/01/46 | | | | | | | 60 | | | | 67,602 | |
City of Austin Water & Wastewater System, Series 2014, RB, 5.00%, 11/15/43 | | | | | | | 20 | | | | 22,031 | |
City of Cartersville, Series 2018, RB, 5.00%, 06/01/48 | | | | | | | 20 | | | | 22,818 | |
City of Colorado Springs Utilities System, Series 2017A-2, RB, 5.00%, 11/15/42 | | | | | | | 10 | | | | 11,429 | |
City of Columbia Waterworks & Sewer System; | | | | | | | | | | | | |
Series 2018, RB, 5.00%, 02/01/42 | | | | | | | 20 | | | | 22,935 | |
Series 2018, RB, 5.00%, 02/01/48 | | | | | | | 20 | | | | 22,833 | |
City of Long Beach, Series 2017C, RB, 5.00%, 05/15/47 | | | | | | | 30 | | | | 34,053 | |
City of New York; | | | | | | | | | | | | |
Series 2018F, Sub-Series F-1, GO, 5.00%, 04/01/40 | | | | | | | 30 | | | | 34,239 | |
Series 2018F, Sub-Series F-1, GO, 5.00%, 04/01/45 | | | | | | | 30 | | | | 34,085 | |
| | | | | | | | | | | | |
| Security | | | | | Par
(000) | | | Value | |
|
Municipal Bonds (continued) | |
City of Portland (Portland Building Project); | | | | | | | | | | | | |
Series 2018B, GO, 5.00%, 06/15/37 | | | USD | | | | 20 | | | $ | 23,522 | |
Series 2018B, GO, 5.00%, 06/15/40 | | | | | | | 20 | | | | 23,306 | |
City of Riverside, Series 2010A, RB, 7.61%, 10/01/40 | | | | | | | 25 | | | | 36,578 | |
City of San Antonio Electric & Gas Systems; | | | | | | | | | | | | |
Series 2010A, RB, 5.81%, 02/01/41 | | | | | | | 45 | | | | 57,060 | |
Series 2013, RB, 5.00%, 02/01/48(k) | | | | | | | 15 | | | | 16,179 | |
Clark County School District; | | | | | | | | | | | | |
Series 2018A, GO, 5.00%, 06/15/30 | | | | | | | 10 | | | | 11,644 | |
Series 2018A, GO, 5.00%, 06/15/31 | | | | | | | 30 | | | | 34,771 | |
Series 2018A, GO, 5.00%, 06/15/33 | | | | | | | 30 | | | | 34,505 | |
Series 2018A, GO, 5.00%, 06/15/34 | | | | | | | 30 | | | | 34,216 | |
Colorado Health Facilities Authority (Catholic Health Initiatives), Series 2011A, RB, 5.25%, 02/01/31 | | | | | | | 10 | | | | 10,505 | |
Commonwealth Financing Authority; | | | | | | | | | | | | |
Series 2018A, RB, 3.86%, 06/01/38 | | | | | | | 30 | | | | 29,585 | |
Series 2016A, RB, 4.14%, 06/01/38 | | | | | | | 30 | | | | 30,316 | |
Commonwealth of Massachusetts; | | | | | | | | | | | | |
Series 2017F, GO, 5.00%, 11/01/42 | | | | | | | 30 | | | | 34,148 | |
Series 2018A, GO, 5.00%, 01/01/45 | | | | | | | 30 | | | | 34,091 | |
Series 2017F, GO, 5.00%, 11/01/45 | | | | | | | 20 | | | | 22,683 | |
Commonwealth of Massachusetts Transportation Fund (Rail Enhancement & Accelerated Bridge Programs), Series 2018A, RB, 5.00%, 06/01/48 | | | | | | | 40 | | | | 45,636 | |
Commonwealth of Puerto Rico, Series 2014A, GO, 8.00%, 07/01/35(g)(l) | | | | | | | 235 | | | | 126,312 | |
Connecticut State Health & Educational Facilities Authority (Hartford Healthcare Corp.); | | | | | | | | | | | | |
Series 2015F, RB, 5.00%, 07/01/45 | | | | | | | 30 | | | | 31,877 | |
Series 2015L, RB, 5.00%, 07/01/45 | | | | | | | 40 | | | | 43,799 | |
Contra Costa Community College District, Series 2010B, GO, 6.50%, 08/01/34 | | | | | | | 25 | | | | 31,764 | |
County of Anne Arundel, Series 2018, GO, 5.00%, 10/01/47 | | | | | | | 20 | | | | 22,923 | |
County of Clark; | | | | | | | | | | | | |
Series 2018A, GO, 5.00%, 06/01/43 | | | | | | | 40 | | | | 45,740 | |
Series 2018A, GO, 5.00%, 05/01/48 | | | | | | | 100 | | | | 113,481 | |
County of Franklin; | | | | | | | | | | | | |
Series 2018, RB, 5.00%, 06/01/43 | | | | | | | 20 | | | | 23,028 | |
Series 2018, RB, 5.00%, 06/01/48 | | | | | | | 40 | | | | 45,880 | |
County of King; | | | | | | | | | | | | |
Series 2017, RB, 5.00%, 07/01/42 | | | | | | | 10 | | | | 11,401 | |
Series 2015A, RB, 5.00%, 07/01/47 | | | | | | | 20 | | | | 22,064 | |
County of Miami-Dade; | | | | | | | | | | | | |
Series 2016B, RB, 2.50%, 10/01/24 | | | | | | | 50 | | | | 48,368 | |
Series 2017D, RB, 3.35%, 10/01/29 | | | | | | | 10 | | | | 9,551 | |
Series 2017D, RB, 3.45%, 10/01/30 | | | | | | | 15 | | | | 14,337 | |
Series 2017D, RB, 3.50%, 10/01/31 | | | | | | | 15 | | | | 14,285 | |
Series 2018C, RB, 4.06%, 10/01/31 | | | | | | | 20 | | | | 20,514 | |
Series 2016A, GO, 5.00%, 07/01/35 | | | | | | | 20 | | | | 22,782 | |
Series 2015A, RB, 5.00%, 10/01/38 | | | | | | | 45 | | | | 49,106 | |
Series 2017B, RB, 5.00%, 10/01/40 | | | | | | | 20 | | | | 22,163 | |
Dallas Area Rapid Transit; | | | | | | | | | | | | |
Series 2016A, RB, 5.00%, 12/01/41 | | | | | | | 30 | | | | 33,521 | |
Series 2016A, RB, 5.00%, 12/01/46 | | | | | | | 40 | | | | 44,563 | |
Denton Independent School District, Series 2018, GO, 5.00%, 08/15/43 | | | | | | | 30 | | | | 34,062 | |
District of Columbia, Series 2017D, GO, 5.00%, 06/01/42 | | | | | | | 25 | | | | 28,354 | |
District of Columbia Water & Sewer Authority, Series 2018B, RB, 5.00%, 10/01/49 | | | | | | | 20 | | | | 22,706 | |
DuBois Hospital Authority (Penn Highlands Healthcare), Series 2018, RB, 5.00%, 07/15/43 | | | | | | | 20 | | | | 21,965 | |
| | | | |
| SCHEDULES OF INVESTMENTS | | | 43 | |
| | |
Schedule of Investments (continued) December 31, 2018 | | BlackRock Balanced Capital Portfolio (Percentages shown are based on Net Assets) |
| | | | | | | | | | | | |
| Security | | | | | Par
(000) | | | Value | |
|
Municipal Bonds (continued) | |
Dutchess County Local Development Corp. (Health Quest Systems, Inc. Project), Series 2016B, RB, 5.00%, 07/01/46 | | | USD | | | | 50 | | | $ | 54,631 | |
Florida Department of Management Services; | | | | | | | | | | | | |
Series 2018A, 5.00%, 11/01/27 | | | | | | | 30 | | | | 36,224 | |
Series 2018A, 5.00%, 11/01/28 | | | | | | | 30 | | | | 36,615 | |
Series 2018A, 5.00%, 11/01/29 | | | | | | | 20 | | | | 24,674 | |
Grand Parkway Transportation Corp. (Grand Parkway Project), Series 2018A, RB, 5.00%, 10/01/43 | | | | | | | 70 | | | | 79,292 | |
Grant County Public Utility District No. 2 (The Priest Rapids Project), Series 2015M, RB, 4.58%, 01/01/40 | | | | | | | 15 | | | | 15,772 | |
Great Lakes Water Authority Water Supply System, Series 2016C, RB, 5.25%, 07/01/33 | | | | | | | 5 | | | | 5,797 | |
Health & Educational Facilities Authority of the State of Missouri (Saint Luke’s Health System, Inc.); | | | | | | | | | | | | |
Series 2016, RB, 5.00%, 11/15/29 | | | | | | | 15 | | | | 17,033 | |
Series 2016A, RB, 3.65%, 01/15/46 | | | | | | | 15 | | | | 14,451 | |
Series 2017A, RB, 3.65%, 08/15/57 | | | | | | | 60 | | | | 56,646 | |
Houston Independent School District, Series 2018, GO, 5.00%, 07/15/36 | | | | | | | 20 | | | | 23,403 | |
Idaho Health Facilities Authority (Trinity Health Credit Group), Series 2017A, RB, 5.00%, 12/01/47 | | | | | | | 20 | | | | 22,263 | |
Indiana Finance Authority (CWA Authority Project); | | | | | | | | | | | | |
Series 2018A, RB, 5.00%, 02/01/35 | | | | | | | 20 | | | | 23,610 | |
Series 2015A, RB, 5.00%, 10/01/45 | | | | | | | 40 | | | | 43,617 | |
Indiana Housing & Community Development Authority, Series 2018A, RB, 3.80%, 07/01/38 | | | | | | | 10 | | | | 10,038 | |
Kentucky Economic Development Finance Authority (Owensboro Health, Inc.), Series 2015A, RB, 5.25%, 06/01/50 | | | | | | | 10 | | | | 10,470 | |
Kentucky Turnpike Authority (Revitalization Projects), Series 2010A, RB, 5.00%, 07/01/20 | | | | | | | 20 | | | | 20,900 | |
Las Vegas Convention & Visitors Authority, Series 2018B, RB, 5.00%, 07/01/43 | | | | | | | 30 | | | | 33,557 | |
Las Vegas Valley Water District, Series 2016A, GO, 5.00%, 06/01/46 | | | | | | | 10 | | | | 11,144 | |
Lexington County Health Services District, Inc., Series 2016, RB, 5.00%, 11/01/41 | | | | | | | 20 | | | | 21,429 | |
Los Angeles Community College District, Series 2010E, GO, 6.60%, 08/01/42 | | | | | | | 95 | | | | 130,532 | |
Los Angeles County Metropolitan Transportation Authority, Series 2017A, RB, 5.00%, 07/01/42 | | | | | | | 40 | | | | 45,927 | |
Los Angeles Department of Water & Power System (Water System Revenue Bonds); | | | | | | | | | | | | |
Series 2010D, RB, 6.57%, 07/01/45 | | | | | | | 20 | | | | 27,733 | |
Series 2010A, RB, 6.60%, 07/01/50 | | | | | | | 60 | | | | 84,680 | |
Los Angeles Unified School District, Series 2010I, GO, 6.76%, 07/01/34 | | | | | | | 60 | | | | 77,215 | |
Louisiana Public Facilities Authority, Series 2018E, RB, 5.00%, 07/01/48 | | | | | | | 20 | | | | 21,789 | |
Maryland Community Development Administration, Series 2018A, RB, 3.85%, 09/01/33 | | | | | | | 20 | | | | 20,354 | |
Maryland Stadium Authority (Baltimore City Public Schools Construction & Revitalization Program), Series 2016, RB, 5.00%, 05/01/41 | | | | | | | 20 | | | | 22,293 | |
Massachusetts Bay Transportation Authority; | | | | | | | | | | | | |
Series 2017A, Sub-Series A-1, RB, 5.00%, 07/01/39 | | | | | | | 10 | | | | 11,361 | |
Series 2017A, Sub-Series A-1, RB, 5.00%, 07/01/40 | | | | | | | 10 | | | | 11,337 | |
Series 2017A, Sub-Series A-1, RB, 5.00%, 07/01/41 | | | | | | | 20 | | | | 22,643 | |
Series 2017A, Sub-Series A-1, RB, 5.00%, 07/01/42 | | | | | | | 20 | | | | 22,627 | |
Series 2017A, Sub-Series A-2, RB, 5.00%, 07/01/43 | | | | | | | 10 | | | | 11,298 | |
| | | | | | | | | | | | |
| Security | | | | | Par
(000) | | | Value | |
|
Municipal Bonds (continued) | |
Massachusetts Development Finance Agency (Partners Healthcare System Issue); | | | | | | | | | | | | |
Series 2018J-2, RB, 5.00%, 07/01/43 | | | USD | | | | 30 | | | $ | 32,747 | |
Series 2017, RB, 5.00%, 09/01/45 | | | | | | | 10 | | | | 11,191 | |
Series 2016Q, RB, 5.00%, 07/01/47 | | | | | | | 20 | | | | 21,990 | |
Series 2018J-2, RB, 5.00%, 07/01/48 | | | | | | | 60 | | | | 65,245 | |
Series 2018J-2, RB, 5.00%, 07/01/53 | | | | | | | 30 | | | | 32,301 | |
Massachusetts Housing Finance Agency; | | | | | | | | | | | | |
Series 2014B, RB, 4.50%, 12/01/39 | | | | | | | 10 | | | | 10,338 | |
Series 2014B, RB, 4.60%, 12/01/44 | | | | | | | 10 | | | | 10,328 | |
Series 2015A, RB, 4.50%, 12/01/48 | | | | | | | 10 | | | | 10,330 | |
Massachusetts Port Authority, Series 2016B, RB, 5.00%, 07/01/43 | | | | | | | 20 | | | | 22,046 | |
Massachusetts School Building Authority, Series 2018A, RB, 5.25%, 02/15/48 | | | | | | | 35 | | | | 40,543 | |
Massachusetts Water Resources Authority, Series 2016C, RB, 5.00%, 08/01/40 | | | | | | | 10 | | | | 11,260 | |
Mesquite Independent School District, Series 2017B, GO, 5.00%, 08/15/42 | | | | | | | 20 | | | | 22,401 | |
Metropolitan Atlanta Rapid Transit Authority; | | | | | | | | | | | | |
Series 2015A, RB, 5.00%, 07/01/41 | | | | | | | 20 | | | | 22,232 | |
Series 2015A, RB, 5.00%, 07/01/42 | | | | | | | 20 | | | | 22,220 | |
Series 2015B, RB, 5.00%, 07/01/45 | | | | | | | 20 | | | | 22,453 | |
Metropolitan Government Nashville & Davidson County Health & Educational Facilities Board (Vanderbilt University Medical Center); | | | | | | | | | | | | |
Series 2016A, RB, 5.00%, 07/01/40 | | | | | | | 10 | | | | 10,790 | |
Series 2016A, RB, 5.00%, 07/01/46 | | | | | | | 30 | | | | 32,227 | |
Metropolitan St. Louis Sewer District; | | | | | | | | | | | | |
Series 2017A, RB, 5.00%, 05/01/42 | | | | | | | 30 | | | | 34,178 | |
Series 2017A, RB, 5.00%, 05/01/47 | | | | | | | 30 | | | | 33,942 | |
Metropolitan Transportation Authority; | | | | | | | | | | | | |
Series 2009C, RB, 7.34%, 11/15/39 | | | | | | | 170 | | | | 241,320 | |
Series 2010C-1, RB, 6.69%, 11/15/40 | | | | | | | 30 | | | | 38,681 | |
Series 2017A, RB, 5.00%, 11/15/42 | | | | | | | 30 | | | | 33,959 | |
Series 2015A, Sub-Series 2015A-1, RB, 5.00%, 11/15/45 | | | | | | | 10 | | | | 10,831 | |
Series 2017A, Sub-Series A-1, RB, 5.25%, 11/15/57 | | | | | | | 40 | | | | 44,334 | |
Metropolitan Washington Airports Authority; | | | | | | | | | | | | |
Series 2016A, RB, 5.00%, 10/01/32 | | | | | | | 40 | | | | 45,342 | |
Series 2018A, RB, 5.00%, 10/01/43 | | | | | | | 40 | | | | 44,671 | |
Metropolitan Washington Airports Authority Dulles Toll Road (Dulles Metrorail and Capital Improvement Project), Series 2009D, RB, 7.46%, 10/01/46 | | | | | | | 30 | | | | 43,092 | |
Miami-Dade County Educational Facilities Authority (University of Miami Issue); | | | | | | | | | | | | |
Series 2018A, RB, 5.00%, 04/01/48 | | | | | | | 20 | | | | 22,251 | |
Series 2015B, RB, 5.07%, 04/01/50 | | | | | | | 30 | | | | 33,765 | |
Series 2018A, RB, 5.00%, 04/01/53 | | | | | | | 40 | | | | 44,104 | |
Michigan Finance Authority (Henry Ford Health System); | | | | | | | | | | | | |
Series 2016, RB, 5.00%, 11/15/41 | | | | | | | 20 | | | | 21,547 | |
Series 2017A-MI, RB, 5.00%, 12/01/47 | | | | | | | 80 | | | | 85,404 | |
Michigan State Housing Development Authority; | | | | | | | | | | | | |
Series 2018B, RB, 3.55%, 10/01/33 | | | | | | | 10 | | | | 10,014 | |
Series 2018A, RB, 4.00%, 10/01/43 | | | | | | | 10 | | | | 9,937 | |
Series 2018A, RB, 4.05%, 10/01/48 | | | | | | | 10 | | | | 9,931 | |
Series 2018A, RB, 4.15%, 10/01/53 | | | | | | | 30 | | | | 29,998 | |
Mississippi Hospital Equipment & Facilities Authority (Baptist Memorial Health Corp.), Series 2016A, RB, 5.00%, 09/01/46 | | | | | | | 30 | | | | 31,921 | |
Municipal Electric Authority of Georgia (Plant Vogtle Units 3&4 Units Project), Series 2010A, RB, 6.64%, 04/01/57 | | | | | | | 45 | | | | 47,576 | |
| | |
| 44 | | 2018 BLACKROCK ANNUAL REPORTTO SHAREHOLDERS |
| | |
Schedule of Investments (continued) December 31, 2018 | | BlackRock Balanced Capital Portfolio (Percentages shown are based on Net Assets) |
| | | | | | | | | | | | |
| Security | | | | | Par
(000) | | | Value | |
|
Municipal Bonds (continued) | |
New Hope Cultural Education Facilities Finance Corp. (Children’s Health System of Texas Project), Series 2017A, RB, 5.00%, 08/15/47 | | | USD | | | | 20 | | | $ | 22,246 | |
New Jersey Transportation Trust Fund Authority, Series 2016A, Sub-Series A-1, RB, 5.00%, 06/15/29 | | | | | | | 20 | | | | 22,201 | |
New Jersey Turnpike Authority, Series 2009F, RB, 7.41%, 01/01/40 | | | | | | | 66 | | | | 92,994 | |
New Orleans Aviation Board (North Terminal Project), Series 2015B, RB, 5.00%, 01/01/40 | | | | | | | 20 | | | | 21,498 | |
New York City Housing Development Corp.; | | | | | | | | | | | | |
Series 2018C-1-A, RB, 3.70%, 11/01/38 | | | | | | | 10 | | | | 9,944 | |
Series 2018C-1-B, RB, 3.85%, 11/01/43 | | | | | | | 40 | | | | 39,935 | |
Series 2018C-1-A, RB, 4.00%, 11/01/53 | | | | | | | 40 | | | | 39,775 | |
New York City Transitional Finance Authority Building Aid, Series 2015S-2, RB, 5.00%, 07/15/40 | | | | | | | 20 | | | | 22,194 | |
New York City Transitional Finance Authority Future Tax Secured; | | | | | | | | | | | | |
Series 2018, Sub-Series C-4, RB, 3.55%, 05/01/25 | | | | | | | 65 | | | | 65,691 | |
Series 2017F, Sub-Series F-2, RB, 3.05%, 05/01/27 | | | | | | | 70 | | | | 67,355 | |
Series 2017B, RB, 5.00%, 08/01/31 | | | | | | | 10 | | | | 11,544 | |
Series 2016E, Sub-Series E-1, RB, 5.00%, 02/01/35 | | | | | | | 20 | | | | 22,629 | |
Series 2017A, Sub-Series A-1, RB, 5.00%, 05/01/36 | | | | | | | 20 | | | | 22,627 | |
New York City Water & Sewer System; | | | | | | | | | | | | |
Series 2018FF, RB, 5.00%, 06/15/39 | | | | | | | 50 | | | | 57,509 | |
Series 2018FF, RB, 5.00%, 06/15/40 | | | | | | | 30 | | | | 34,400 | |
Series 2010AA, RB, 5.75%, 06/15/41 | | | | | | | 35 | | | | 43,771 | |
Series 2011EE, RB, 5.38%, 06/15/43 | | | | | | | 215 | | | | 228,085 | |
Series 2011AA, RB, 5.44%, 06/15/43 | | | | | | | 25 | | | | 30,298 | |
Series 2011EE, RB, 5.50%, 06/15/43 | | | | | | | 255 | | | | 271,679 | |
Series 2011CC, RB, 5.88%, 06/15/44 | | | | | | | 50 | | | | 64,113 | |
Series 2017DD, RB, 5.00%, 06/15/47 | | | | | | | 65 | | | | 72,961 | |
New York Convention Center Development Corp.; | | | | | | | | | | | | |
Series 2015, RB, 5.00%, 11/15/40 | | | | | | | 20 | | | | 22,294 | |
Series 2016A, RB, 5.00%, 11/15/46 | | | | | | | 40 | | | | 44,794 | |
New York State Dormitory Authority; | | | | | | | | | | | | |
Series 2016A, RB, 5.00%, 02/15/31 | | | | | | | 10 | | | | 11,581 | |
Series 2015B, RB, 5.00%, 03/15/32 | | | | | | | 30 | | | | 34,281 | |
Series 2017B, RB, 5.00%, 02/15/36 | | | | | | | 30 | | | | 34,476 | |
Series 2017B, RB, 5.00%, 02/15/37 | | | | | | | 20 | | | | 22,902 | |
Series 2017B, RB, 5.00%, 02/15/38 | | | | | | | 20 | | | | 22,821 | |
Series 2018B, RB, 5.00%, 10/01/38 | | | | | | | 40 | | | | 46,873 | |
Series 2017B, RB, 5.00%, 02/15/39 | | | | | | | 20 | | | | 22,756 | |
Series 2018A, RB, 5.00%, 03/15/39 | | | | | | | 40 | | | | 45,903 | |
Series 2017B, RB, 5.00%, 02/15/40 | | | | | | | 30 | | | | 34,086 | |
Series 2010H, RB, 5.39%, 03/15/40 | | | | | | | 50 | | | | 58,568 | |
Series 2017B, RB, 5.00%, 02/15/41 | | | | | | | 30 | | | | 34,013 | |
Series 2018A, RB, 5.00%, 03/15/41 | | | | | | | 20 | | | | 22,848 | |
Series 2017B, RB, 5.00%, 02/15/42 | | | | | | | 40 | | | | 45,319 | |
Series 2018A, RB, 5.00%, 03/15/42 | | | | | | | 20 | | | | 22,831 | |
Series 2017B, RB, 5.00%, 02/15/43 | | | | | | | 20 | | | | 22,643 | |
Series 2017A, RB, 5.00%, 03/15/43 | | | | | | | 20 | | | | 22,547 | |
Series 2018A, RB, 5.00%, 03/15/43 | | | | | | | 20 | | | | 22,814 | |
Series 2018E, RB, 5.00%, 03/15/48 | | | | | | | 130 | | | | 148,559 | |
Series 2018A, RB, 5.00%, 10/01/48 | | | | | | | 10 | | | | 13,159 | |
New York State Urban Development Corp.; | | | | | | | | | | | | |
Series 2017B, RB, 2.86%, 03/15/24 | | | | | | | 80 | | | | 79,352 | |
Series 2017B, RB, 3.12%, 03/15/25 | | | | | | | 40 | | | | 39,672 | |
Series 2017D, RB, 3.32%, 03/15/29 | | | | | | | 55 | | | | 53,687 | |
New York Transportation Development Corp. (LaGuardia Airport Terminal B Redevelopment Project); | | | | | | | | | | | | |
Series 2016A, RB, 5.00%, 07/01/46 | | | | | | | 20 | | | | 21,028 | |
Series 2016A, RB, 5.25%, 01/01/50 | | | | | | | 130 | | | | 138,142 | |
| | | | | | | | | | | | |
| Security | | | | | Par
(000) | | | Value | |
|
Municipal Bonds (continued) | |
North Carolina Turnpike Authority, Series 2018, RB, 5.00%, 01/01/35 | | | USD | | | | 20 | | | $ | 22,893 | |
Ohio Turnpike & Infrastructure Commission, Series 2013A, RB, 5.00%, 02/15/48 | | | | | | | 20 | | | | 21,433 | |
Omaha Public Power District, Series 2017A, RB, 5.00%, 02/01/42 | | | | | | | 30 | | | | 34,132 | |
Orange County Local Transportation Authority, Series 2010A, RB, 6.91%, 02/15/41 | | | | | | | 75 | | | | 99,274 | |
Oregon School Boards Association; | | | | | | | | | | | | |
Series 2002B, GO, 5.49%, 06/30/23 | | | | | | | 65 | | | | 72,399 | |
Series 2005A, GO, 4.76%, 06/30/28 | | | | | | | 80 | | | | 86,346 | |
Pennsylvania Economic Development Financing Authority (Pennsylvania Rapid Bridge Replacement Project (The)); | | | | | | | | | | | | |
Series 2015, RB, 5.00%, 06/30/23 | | | | | | | 100 | | | | 108,609 | |
Series 2015, RB, 5.00%, 12/31/38 | | | | | | | 25 | | | | 26,789 | |
Pennsylvania State University; | | | | | | | | | | | | |
Series 2018, RB, 5.00%, 09/01/43 | | | | | | | 20 | | | | 23,025 | |
Series 2018, RB, 5.00%, 09/01/48 | | | | | | | 20 | | | | 22,935 | |
Pennsylvania Turnpike Commission; | | | | | | | | | | | | |
Series 2018B, RB, 5.00%, 12/01/43 | | | | | | | 40 | | | | 44,421 | |
Series 2016A-1, RB, 5.00%, 12/01/46 | | | | | | | 20 | | | | 21,739 | |
Series 2018A, RB, 5.00%, 12/01/48 | | | | | | | 150 | | | | 168,435 | |
Port Authority of New York & New Jersey; | | | | | | | | | | | | |
Series 181, RB, 4.96%, 08/01/46 | | | | | | | 30 | | | | 34,442 | |
Series 180-1, RB, 5.00%, 11/15/47 | | | | | | | 10 | | | | 11,094 | |
Series 174, RB, 4.46%, 10/01/62 | | | | | | | 55 | | | | 55,958 | |
Series 192, RB, 4.81%, 10/15/65 | | | | | | | 15 | | | | 16,288 | |
Port of Seattle, Series 2018A, RB, 5.00%, 05/01/43 | | | | | | | 10 | | | | 10,962 | |
Public Power Generation Agency, Series 2016A, RB, 5.00%, 01/01/35 | | | | | | | 20 | | | | 22,241 | |
Royal Oak Hospital Finance Authority (William Beaumont Hospital Obligated Group), Series 2014D, RB, 5.00%, 09/01/39 | | | | | | | 20 | | | | 21,600 | |
Sacramento County Sanitation Districts Financing Authority, Series 2035B, RB, VRDN, 2.36%, 12/01/35(j) | | | | | | | 20 | | | | 19,425 | |
Salt Lake City Corp.; | | | | | | | | | | | | |
Series 2017A, RB, 5.00%, 07/01/47 | | | | | | | 35 | | | | 38,532 | |
Series 2017B, RB, 5.00%, 07/01/47 | | | | | | | 25 | | | | 28,008 | |
Salt River Project Agricultural Improvement & Power District; | | | | | | | | | | | | |
Series 2017A, RB, 5.00%, 01/01/36 | | | | | | | 20 | | | | 23,460 | |
Series 2015A, RB, 5.00%, 12/01/45 | | | | | | | 90 | | | | 99,926 | |
San Antonio Water System, Series 2015B, RB, 5.00%, 05/15/39 | | | | | | | 60 | | | | 66,943 | |
San Diego County Regional Airport Authority, Series 2017A, RB, 5.00%, 07/01/47 | | | | | | | 20 | | | | 22,532 | |
San Diego Public Facilities Financing Authority, Series 2016A, RB, 5.00%, 05/15/39 | | | | | | | 25 | | | | 28,673 | |
San Diego Unified School District, Series 2017I, GO, 5.00%, 07/01/41 | | | | | | | 30 | | | | 34,567 | |
San Francisco City & County Airport Comm-San Francisco International Airport; | | | | | | | | | | | | |
Series 2016B, RB, 5.00%, 05/01/46 | | | | | | | 40 | | | | 43,874 | |
Series 2017A, RB, 5.00%, 05/01/47 | | | | | | | 20 | | | | 22,120 | |
San Jose Redevelopment Agency Successor Agency, Series 2017A-T, 2.96%, 08/01/24 | | | | | | | 50 | | | | 49,480 | |
South Carolina Ports Authority, Series 2018, RB, 5.00%, 07/01/55 | | | | | | | 20 | | | | 21,633 | |
South Carolina Public Service Authority; | | | | | | | | | | | | |
Series 2016D, RB, 2.39%, 12/01/23 | | | | | | | 51 | | | | 48,395 | |
Series 2014A, RB, 5.00%, 12/01/49 | | | | | | | 30 | | | | 31,253 | |
Series 2015A, RB, 5.00%, 12/01/50 | | | | | | | 30 | | | | 31,421 | |
State of Alabama, Series 2018A, GO, 5.00%, 11/01/38 | | | | | | | 30 | | | | 35,129 | |
| | | | |
| SCHEDULES OF INVESTMENTS | | | 45 | |
| | |
Schedule of Investments (continued) December 31, 2018 | | BlackRock Balanced Capital Portfolio (Percentages shown are based on Net Assets) |
| | | | | | | | | | | | |
| Security | | | | | Par
(000) | | | Value | |
|
Municipal Bonds (continued) | |
State of California; | | | | | | | | | | | | |
Series 2017, GO, 2.25%, 10/01/23 | | | USD | | | | 90 | | | $ | 87,602 | |
Series 2009, GO, 7.50%, 04/01/34 | | | | | | | 60 | | | | 81,764 | |
Series 2018, GO, 4.60%, 04/01/38 | | | | | | | 265 | | | | 273,308 | |
Series 2009, GO, 7.55%, 04/01/39 | | | | | | | 30 | | | | 42,977 | |
Series 2009, GO, 7.30%, 10/01/39 | | | | | | | 40 | | | | 54,909 | |
Series 2009, GO, 7.35%, 11/01/39 | | | | | | | 220 | | | | 303,708 | |
State of Connecticut, Series 2017A, GO, 3.31%, 01/15/26 | | | | | | | 65 | | | | 63,719 | |
State of Illinois; | | | | | | | | | | | | |
Series 2018A, GO, 5.00%, 05/01/20 | | | | | | | 20 | | | | 20,534 | |
Series 2017D, GO, 5.00%, 11/01/22 | | | | | | | 20 | | | | 21,094 | |
Series 2017D, GO, 5.00%, 11/01/24 | | | | | | | 60 | | | | 64,020 | |
Series 2017A, GO, 5.00%, 12/01/24 | | | | | | | 10 | | | | 10,673 | |
Series 2017D, GO, 5.00%, 11/01/25 | | | | | | | 160 | | | | 171,046 | |
Series 2003, GO, 5.10%, 06/01/33 | | | | | | | 175 | | | | 166,850 | |
State of Minnesota; | | | | | | | | | | | | |
Series 2018A, GO, 5.00%, 08/01/31 | | | | | | | 10 | | | | 12,089 | |
Series 2018A, GO, 5.00%, 08/01/32 | | | | | | | 10 | | | | 12,032 | |
Series 2018A, GO, 5.00%, 08/01/33 | | | | | | | 10 | | | | 11,986 | |
Series 2018A, GO, 5.00%, 08/01/34 | | | | | | | 10 | | | | 11,930 | |
Series 2018A, GO, 5.00%, 08/01/35 | | | | | | | 20 | | | | 23,766 | |
State of Mississippi, Series 2018A, GO, 5.00%, 11/01/35 | | | | | | | 10 | | | | 11,483 | |
State of Ohio; | | | | | | | | | | | | |
Series 2017A, GO, 5.00%, 03/15/32 | | | | | | | 40 | | | | 44,826 | |
Series 2017A, GO, 5.00%, 05/01/34 | | | | | | | 20 | | | | 22,671 | |
Series 2017A, GO, 5.00%, 05/01/35 | | | | | | | 20 | | | | 22,621 | |
Series 2017A, GO, 5.00%, 05/01/36 | | | | | | | 40 | | | | 45,118 | |
Series 2017A, GO, 5.00%, 05/01/37 | | | | | | | 30 | | | | 33,746 | |
State of Texas; | | | | | | | | | | | | |
Series 2016, GO, 5.00%, 04/01/40 | | | | | | | 20 | | | | 22,586 | |
Series 2016, GO, 5.00%, 04/01/43 | | | | | | | 30 | | | | 33,692 | |
State of Washington; | | | | | | | | | | | | |
Series R-2015C, GO, 5.00%, 07/01/30 | | | | | | | 60 | | | | 68,159 | |
Series R-2017A, GO, 5.00%, 08/01/30 | | | | | | | 20 | | | | 23,342 | |
Series 2016A-1, GO, 5.00%, 08/01/40 | | | | | | | 40 | | | | 44,666 | |
Series 2018B, GO, 5.00%, 08/01/40 | | | | | | | 20 | | | | 22,794 | |
Series 2017D, GO, 5.00%, 02/01/41 | | | | | | | 30 | | | | 33,930 | |
Series 2018B, GO, 5.00%, 08/01/41 | | | | | | | 20 | | | | 22,762 | |
Series 2018B, GO, 5.00%, 08/01/42 | | | | | | | 20 | | | | 22,746 | |
State of West Virginia; | | | | | | | | | | | | |
Series 2018B, GO, 5.00%, 06/01/40 | | | | | | | 30 | | | | 34,410 | |
Series 2018B, GO, 5.00%, 12/01/40 | | | | | | | 30 | | | | 34,410 | |
Series 2018B, GO, 5.00%, 12/01/41 | | | | | | | 30 | | | | 34,358 | |
State of Wisconsin; | | | | | | | | | | | | |
Series 2017C, RB, 3.15%, 05/01/27 | | | | | | | 50 | | | | 49,298 | |
Series 2017B, GO, 5.00%, 05/01/32 | | | | | | | 10 | | | | 11,423 | |
Series 2017B, GO, 5.00%, 05/01/33 | | | | | | | 10 | | | | 11,398 | |
Series 2017-3, GO, 5.00%, 11/01/33 | | | | | | | 20 | | | | 23,426 | |
Series 2017B, GO, 5.00%, 05/01/34 | | | | | | | 20 | | | | 22,771 | |
Series 2017B, GO, 5.00%, 05/01/36 | | | | | | | 20 | | | | 22,671 | |
Series 2017B, GO, 5.00%, 05/01/38 | | | | | | | 20 | | | | 22,461 | |
Tennessee Housing Development Agency (Residential Finance Program); | | | | | | | | | | | | |
Series 2018-3, RB, 3.75%, 07/01/38 | | | | | | | 10 | | | | 10,000 | |
Series 2018-3, RB, 3.85%, 07/01/43 | | | | | | | 10 | | | | 9,953 | |
Series 2018-3, RB, 3.95%, 01/01/49 | | | | | | | 5 | | | | 5,000 | |
Texas A&M University; | | | | | | | | | | | | |
Series 2017B, RB, 2.76%, 05/15/26 | | | | | | | 75 | | | | 72,576 | |
Series 2017B, RB, 2.84%, 05/15/27 | | | | | | | 30 | | | | 28,862 | |
Texas Municipal Gas Acquisition & Supply Corp., Series 2008D, RB, 6.25%, 12/15/26 | | | | | | | 10 | | | | 11,426 | |
| | | | | | | | | | | | |
| Security | | | | | Par
(000) | | | Value | |
|
Municipal Bonds (continued) | |
Texas Private Activity Bond Surface Transportation Corp. (Blueridge Transportation Group, LLC Share 288 Toll Lanes Project), Series 2016, RB, 5.00%, 12/31/55 | | | USD | | | | 25 | | | $ | 26,217 | |
Texas Water Development Board; | | | | | | | | | | | | |
Series 2018B, RB, 5.00%, 10/15/38 | | | | | | | 40 | | | | 46,590 | |
Series 2018A, RB, 5.00%, 10/15/43 | | | | | | | 30 | | | | 34,332 | |
Series 2017A, RB, 5.00%, 10/15/47 | | | | | | | 10 | | | | 11,352 | |
Series 2018B, RB, 5.00%, 04/15/49 | | | | | | | 240 | | | | 275,162 | |
Tobacco Settlement Finance Authority, Series 2007A, RB, 7.47%, 06/01/47 | | | | | | | 55 | | | | 53,885 | |
TSASC, Inc., Series 2017A, RB, 5.00%, 06/01/41 | | | | | | | 20 | | | | 20,636 | |
University of California; | | | | | | | | | | | | |
Series 2017AX, RB, 3.06%, 07/01/25 | | | | | | | 25 | | | | 24,673 | |
Series 2013AJ, RB, 4.60%, 05/15/31 | | | | | | | 30 | | | | 32,210 | |
Series 2012AD, RB, 4.86%, 05/15/2112 | | | | | | | 50 | | | | 52,486 | |
University of California Medical Centre; | | | | | | | | | | | | |
Series 2016L, RB, 5.00%, 05/15/47 | | | | | | | 20 | | | | 22,248 | |
Series 2009F, RB, 6.58%, 05/15/49 | | | | | | | 75 | | | | 99,203 | |
University of Houston; | | | | | | | | | | | | |
Series 2017A, RB, 5.00%, 02/15/33 | | | | | | | 20 | | | | 22,793 | |
Series 2017A, RB, 5.00%, 02/15/34 | | | | | | | 20 | | | | 22,710 | |
Series 2017A, RB, 5.00%, 02/15/35 | | | | | | | 40 | | | | 45,255 | |
Series 2017A, RB, 5.00%, 02/15/36 | | | | | | | 50 | | | | 56,364 | |
University of Oregon, Series 2016A, RB, 5.00%, 04/01/46 | | | | | | | 20 | | | | 22,379 | |
University of Texas, Series 2017A, RB, 3.38%, 07/01/47 | | | | | | | 25 | | | | 22,645 | |
Upper Arlington City School District, Series 2018A, GO, 5.00%, 12/01/48 | | | | | | | 30 | | | | 34,132 | |
Virginia Small Business Financing Authority (Transform 66 P3 Project); | | | | | | | | | | | | |
Series 2017, RB, 5.00%, 12/31/52 | | | | | | | 30 | | | | 31,942 | |
Series 2017, RB, 5.00%, 12/31/56 | | | | | | | 30 | | | | 31,831 | |
Washington Metropolitan Area Transit Authority, Series 2017B, RB, 5.00%, 07/01/36 | | | | | | | 10 | | | | 11,506 | |
Washington State Convention Center Public Facilities District, Series 2018, RB, 5.00%, 07/01/58 | | | | | | | 90 | | | | 99,523 | |
Weld County School District No. 4, Series 2016, GO, 5.25%, 12/01/41 | | | | | | | 20 | | | | 23,072 | |
West Virginia Hospital Finance Authority (West Virginia United Health System Obligated Group); | | | | | | | | | | | | |
Series 2016A, RB, 5.00%, 06/01/19 | | | | | | | 20 | | | | 20,256 | |
Series 2016A, RB, 5.00%, 06/01/20 | | | | | | | 20 | | | | 20,793 | |
Series 2016A, RB, 5.00%, 06/01/21 | | | | | | | 20 | | | | 21,298 | |
Series 2016A, RB, 5.00%, 06/01/22 | | | | | | | 20 | | | | 21,789 | |
Series 2016A, RB, 5.00%, 06/01/23 | | | | | | | 20 | | | | 22,217 | |
Series 2016A, RB, 5.00%, 06/01/24 | | | | | | | 20 | | | | 22,591 | |
Wisconsin Health & Educational Facilities Authority (Thedacare, Inc.), Series 2015, RB, 5.00%, 12/15/44 | | | | | | | 10 | | | | 10,672 | |
| | | | | | | | | | | | |
| |
Total Municipal Bonds — 2.8%
(Cost: $12,879,381) | | | | 12,874,478 | |
| | | | | | | | | | | | |
|
Non-Agency Mortgage-Backed Securities — 2.2% | |
|
| Collateralized Mortgage Obligations — 0.9% | |
Ajax Mortgage Loan Trust(e): | | | | | | | | | | | | |
Series 2018-B, Class A, 3.75%, 02/26/57 | | | | | | | 177 | | | | 170,712 | |
Series 2018-D, Class A,
3.75%, 08/25/58(b)(c) | | | | | | | 165 | | | | 162,078 | |
Alternative Loan Trust: | | | | | | | | | | | | |
Series 2005-22T1, Class A1, 2.86%, 06/25/35(c) | | | | | | | 67 | | | | 59,398 | |
Series 2005-72, Class A3, 3.11%, 01/25/36(c) | | | | | | | 26 | | | | 22,255 | |
Series 2006-11CB, Class 3A1, 6.50%, 05/25/36 | | | | | | | 27 | | | | 21,011 | |
Series 2006-OA21, Class A1, 2.66%, 03/20/47(c) | | | | | | | 1,000 | | | | 838,390 | |
Series 2006-OA9, Class 2A1B, 2.67%, 07/20/46(c) | | | | | | | 145 | | | | 109,851 | |
| | |
| 46 | | 2018 BLACKROCK ANNUAL REPORTTO SHAREHOLDERS |
| | |
Schedule of Investments (continued) December 31, 2018 | | BlackRock Balanced Capital Portfolio (Percentages shown are based on Net Assets) |
| | | | | | | | | | | | |
| Security | | | | | Par
(000) | | | Value | |
|
| Collateralized Mortgage Obligations (continued) | |
Series 2006-OC10, Class 2A3, 2.74%, 11/25/36(c) | | | USD | | | | 25 | | | $ | 19,016 | |
Series 2007-OA3, Class 1A1, 2.65%, 04/25/47(c) | | | | | | | 41 | | | | 38,629 | |
Series 2007-OA3, Class 2A2, 2.69%, 04/25/47(c) | | | | | | | 61 | | | | 9,510 | |
Series 2007-OA8, Class 2A1, 2.69%, 06/25/47(c) | | | | | | | 28 | | | | 21,448 | |
Series 2007-OH2, Class A2A, 2.75%, 08/25/47(c) | | | | | | | 15 | | | | 11,512 | |
American Home Mortgage Assets Trust, Series 2006-3, Class 2A11,
3.10%, 10/25/46(c) | | | | | | | 71 | | | | 61,736 | |
APS Resecuritization Trust(b)(c): | | | | | | | | | | | | |
Series 2016-1, Class 1MZ, 4.71%, 07/31/57 | | | | | | | 118 | | | | 35,555 | |
Series 2016-3, Class 3A, 5.36%, 09/27/46(e) | | | | | | | 116 | | | | 115,944 | |
Series 2016-3, Class 4A, 5.11%, 04/27/47(e) | | | | | | | 54 | | | | 52,283 | |
Banc of America Funding Trust,Series 2016-R2, Class 1A1,
4.70%, 05/01/33(b)(c)(e) | | | | | | | 163 | | | | 167,095 | |
Bear Stearns Mortgage Funding Trust,Series 2006-SL1, Class A1,
2.79%, 08/25/36(c) | | | | | | | 58 | | | | 57,477 | |
Chase Mortgage Finance Trust,Series 2007-S6, Class 1A1, 6.00%, 12/25/37 | | | | | | | 407 | | | | 300,594 | |
CHL Mortgage Pass-Through Trust: | | | | | | | | | | | | |
Series 2006-OA4, Class A1, 3.12%, 04/25/46(c) | | | | | | | 67 | | | | 33,775 | |
Series 2007-15, Class 2A2, 6.50%, 09/25/37 | | | | | | | 107 | | | | 79,024 | |
Citicorp Mortgage Securities Trust,Series 2008-2, Class 1A1, 6.50%, 06/25/38 | | | | | | | 46 | | | | 38,496 | |
Credit Suisse Mortgage Capital Certificates,Series 2009-12R, Class 3A1, 6.50%, 10/27/37(b) | | | | | | | 109 | | | | 62,528 | |
CSFB Mortgage-Backed Pass-Through Certificates, Series 2005-10, Class 10A1, 3.86%, 11/25/35(c) | | | | | | | 21 | | | | 7,454 | |
CSMC Mortgage-Backed Trust, Series 2007-5, Class 1A11, 7.00%, 08/25/37(c) | | | | | | | 30 | | | | 24,825 | |
CSMC Trust, Series 2009-5R, Class 4A4, 3.80%, 06/25/36(b)(c) | | | | | | | 29 | | | | 26,299 | |
Deutsche Alt-A Securities Mortgage Loan Trust,Series 2007-OA4, Class A2A, 2.68%, 08/25/47(c) | | | | | | | 163 | | | | 111,153 | |
Deutsche Alt-A Securities, Inc.,Series 2007-RS1, Class A2, 2.82%, 01/27/37(b)(c)(e) | | | | | | | 6 | | | | 6,229 | |
GreenPoint Mortgage Funding Trust,Series 2006-AR2, Class 4A1, 4.16%, 03/25/36(c) | | | | | | | 10 | | | | 9,545 | |
IndyMac INDX Mortgage Loan Trust, Series 2007-AR19, Class 3A1, 3.74%, 09/25/37(c) | | | | | | | 39 | | | | 26,864 | |
JPMorgan Alternative Loan Trust,Series 2007-A1, Class 1A4,
2.72%, 03/25/37(c) | | | | | | | 58 | | | | 53,302 | |
JPMorgan Mortgage Trust, Series 2017-3, Class 1A6, 3.00%, 08/25/47(b)(c) | | | | | | | 303 | | | | 293,237 | |
LSTAR Securities Investment Ltd.,Series 2018-1, Class A, 3.89%, 02/01/23(b)(c) | | | | | | | 98 | | | | 98,483 | |
MCM Capital Partners I LP, 4.00%, 06/01/57(e) | | | | | | | 484 | | | | 475,769 | |
MCM Trust, Series 2018-NPL2, Class A, 4.00%, 10/25/28(b)(e) | | | | | | | 200 | | | | 197,400 | |
Nomura Asset Acceptance Corp. Alternative Loan Trust, Series 2007-2, Class A4, 2.93%, 06/25/37(c) | | | | | | | 8 | | | | 6,780 | |
Seasoned Credit Risk Transfer Trust,Series 2017-3, Class M2, 4.75%, 07/25/56(c) | | | | | | | 30 | | | | 28,951 | |
Structured Adjustable Rate Mortgage Loan Trust, Series 2006-3, Class 4A, 3.79%, 04/25/36(c) | | | | | | | 16 | | | | 12,848 | |
Structured Asset Mortgage Investments II Trust,Series 2006-AR4, Class 3A1, 2.70%, 06/25/36(c)(e) | | | | | | | 21 | | | | 17,802 | |
Washington Mutual Mortgage Pass-Through Certificates Trust: | | | | | | | | | | | | |
Series 2006-4, Class 1A1, 6.00%, 04/25/36 | | | | | | | 87 | | | | 77,729 | |
Series 2006-4, Class 3A5,
6.35%, 05/25/36(d) | | | | | | | 82 | | | | 69,738 | |
| | | | | | | | | | | | |
| | | | 4,032,725 | |
| |
| Commercial Mortgage-Backed Securities — 1.2% | | | | |
280 Park Avenue Mortgage Trust,Series 2017-280P, Class E,
4.57%, 09/15/34(b)(c) | | | | | | | 100 | | | | 97,987 | |
| | | | | | | | | | | | |
| Security | | | | | Par
(000) | | | Value | |
| | | |
| Commercial Mortgage-Backed Securities (continued) | | | | | | | | | |
BAMLL Commercial Mortgage Securities Trust,Series 2018-DSNY, Class D,
4.16%, 09/15/34(b)(c) | | | USD | | | | 100 | | | $ | 99,741 | |
Banc of America Commercial Mortgage Trust, Series 2007-1, Class AMFX, 5.48%, 01/15/49(c) | | | | | | | 7 | | | | 6,787 | |
BANK, Series 2018-BN13, Class A5, 4.22%, 08/15/61 | | | | | | | 20 | | | | 20,705 | |
Bayview Commercial Asset Trust(b)(c): | | | | | | | | | | | | |
Series 2005-4A, Class A1, 2.81%, 01/25/36 | | | | | | | 29 | | | | 27,813 | |
Series 2005-4A, Class M1, 2.96%, 01/25/36 | | | | | | | 22 | | | | 20,975 | |
Series 2006-1A, Class A2, 2.87%, 04/25/36 | | | | | | | 14 | | | | 13,361 | |
Series 2006-3A, Class A1, 2.76%, 10/25/36 | | | | | | | 21 | | | | 20,140 | |
Series 2006-3A, Class A2, 2.81%, 10/25/36 | | | | | | | 21 | | | | 20,191 | |
Series 2006-4A, Class A1, 2.74%, 12/25/36 | | | | | | | 252 | | | | 242,722 | |
BBCMS Mortgage Trust, Series 2018-TALL, Class A, 3.18%, 03/15/37(b)(c) | | | | | | | 15 | | | | 14,736 | |
BBCMS Trust, Series 2015-SRCH, Class A1, 3.31%, 08/10/35(b) | | | | | | | 100 | | | | 98,253 | |
Bear Stearns Commercial Mortgage Securities Trust, Series 2007-T26, Class AM, 5.46%, 01/12/45(c) | | | | | | | 15 | | | | 14,685 | |
Benchmark Mortgage Trust: | | | | | | | | | | | | |
Series 2018-B5, Class A4, 4.21%, 07/15/51 | | | | | | | 20 | | | | 20,772 | |
Series 2018-B7, Class A4, 4.51%, 11/15/51 | | | | | | | 39 | | | | 41,475 | |
BHMS, Series 2018-ATLS, Class A, 3.71%, 07/15/35(b)(c) | | | | | | | 100 | | | | 99,506 | |
BWAY Mortgage Trust, Series 2013-1515, Class C, 3.45%, 03/10/33(b) | | | | | | | 100 | | | | 97,571 | |
BX Commercial Mortgage Trust, Series 2018-IND, Class H, 5.46%, 11/15/35(b)(c) | | | | | | | 220 | | | | 217,339 | |
BXP Trust(b)(c): | | | | | | | | | | | | |
Series 2017-CC, Class D, 3.55%, 08/13/37 | | | | | | | 25 | | | | 23,314 | |
Series 2017-CC, Class E, 3.55%, 08/13/37 | | | | | | | 40 | | | | 35,857 | |
CCRESG Commercial Mortgage Trust, Series 2016-HEAT, Class D,
5.49%, 04/10/29(b)(c) | | | | | | | 10 | | | | 10,217 | |
CCUBS Commercial Mortgage Trust, Series 2017-C1, Class A4, 3.54%, 11/15/50 | | | | | | | 12 | | | | 11,883 | |
CD Mortgage Trust: | | | | | | | | | | | | |
Series 2006-CD3, Class AM, 5.65%, 10/15/48 | | | | | | | 185 | | | | 190,086 | |
Series 2017-CD3, Class A4, 3.63%, 02/10/50 | | | | | | | 10 | | | | 10,014 | |
CFCRE Commercial Mortgage Trust, Series 2016-C3, Class A3, 3.87%, 01/10/48 | | | | | | | 10 | | | | 10,125 | |
CGDBB Commercial Mortgage Trust(b)(c): | | | | | | | | | | | | |
Series 2017-BIOC, Class A, 3.25%, 07/15/32 | | | | | | | 100 | | | | 99,065 | |
Series 2017-BIOC, Class D, 4.06%, 07/15/32 | | | | | | | 100 | | | | 98,379 | |
Series 2017-BIOC, Class E, 4.61%, 07/15/32 | | | | | | | 100 | | | | 98,431 | |
Citigroup Commercial Mortgage Trust,Series 2016-C1, Class C, 4.95%, 05/10/49(c) | | | | | | | 30 | | | | 30,205 | |
CLNS Trust, Series 2017-IKPR, Class E, 5.90%, 06/11/32(b)(c) | | | | | | | 50 | | | | 49,604 | |
Commercial Mortgage Trust: | | | | | | | | | | | | |
Series 2014-CR16, Class A4, 4.05%, 04/10/47 | | | | | | | 87 | | | | 89,774 | |
Series 2014-CR17, Class A5, 3.98%, 05/10/47 | | | | | | | 43 | | | | 44,257 | |
Series 2014-CR18, Class A4, 3.55%, 07/15/47 | | | | | | | 10 | | | | 10,062 | |
Series 2014-CR19, Class A5, 3.80%, 08/10/47 | | | | | | | 30 | | | | 30,595 | |
Series 2014-LC15, Class A4, 4.01%, 04/10/47 | | | | | | | 20 | | | | 20,596 | |
Series 2014-PAT, Class A, 3.19%, 08/13/27(b)(c) | | | | | | | 100 | | | | 99,913 | |
Series 2014-TWC, Class B,
3.99%, 02/13/32(b)(c) | | | | | | | 100 | | | | 99,556 | |
Series 2014-UBS4, Class C, 4.62%, 08/10/47(c) | | | | | | | 20 | | | | 19,831 | |
Series 2015-CR23, Class C, 4.25%, 05/10/48(c) | | | | | | | 10 | | | | 9,751 | |
Series 2015-CR23, Class CMD, 3.68%, 05/10/48(b)(c) | | | | | | | 110 | | | | 108,663 | |
Series 2015-CR25, Class A4, 3.76%, 08/10/48 | | | | | | | 40 | | | | 40,550 | |
Series 2015-CR25, Class C, 4.54%, 08/10/48(c) | | | | | | | 60 | | | | 58,614 | |
Series 2015-LC19, Class A4, 3.18%, 02/10/48 | | | | | | | 23 | | | | 22,684 | |
Series 2017-COR2, Class D, 3.00%, 09/10/50(b) | | | | | | | 100 | | | | 79,271 | |
Core Industrial Trust, Series 2015-TEXW, Class F, 3.85%, 02/10/34(b)(c) | | | | | | | 100 | | | | 97,205 | |
| | | | |
| SCHEDULES OF INVESTMENTS | | | 47 | |
| | |
Schedule of Investments (continued) December 31, 2018 | | BlackRock Balanced Capital Portfolio (Percentages shown are based on Net Assets) |
| | | | | | | | | | | | |
| Security | | | | | Par
(000) | | | Value | |
| | | |
| Commercial Mortgage-Backed Securities (continued) | | | | | | | | | |
CSMC Trust(b): | | | | | | | | | | | | |
Series 2015-GLPB, Class A, 3.64%, 11/15/34 | | | USD | | | | 100 | | | $ | 101,882 | |
Series 2018-RPL8, Class A1, 4.07%, 07/25/58 | | | | | | | 161 | | | | 160,567 | |
DBUBS Mortgage Trust(b): | | | | | | | | | | | | |
Series 2017-BRBK, Class A, 3.45%, 10/10/34 | | | | | | | 40 | | | | 39,725 | |
Series 2017-BRBK, Class E, 3.53%, 10/10/34(c) | | | | | | | 170 | | | | 159,862 | |
Series 2017-BRBK, Class F, 3.53%, 10/10/34(c)(e) | | | | | | | 40 | | | | 35,505 | |
GPMT Ltd., Series 2018-FL1, Class A, 3.38%, 11/21/35(b)(c) | | | | | | | 100 | | | | 99,115 | |
GS Mortgage Securities Corp. II,Series 2013-KING, Class E, 3.44%, 12/10/27(b)(c) | | | | | | | 350 | | | | 346,171 | |
GS Mortgage Securities Corp. Trust(b)(c): | | | | | | | | | | | | |
Series 2017-500K, Class D, 3.76%, 07/15/32 | | | | | | | 10 | | | | 9,890 | |
Series 2017-500K, Class E, 3.96%, 07/15/32 | | | | | | | 20 | | | | 19,689 | |
Series 2017-500K, Class F, 4.26%, 07/15/32 | | | | | | | 10 | | | | 9,846 | |
GS Mortgage Securities Trust: | | | | | | | | | | | | |
Series 2014-GC24, Class A5, 3.93%, 09/10/47 | | | | | | | 20 | | | | 20,495 | |
Series 2017-GS7, Class D,
3.00%, 08/10/50(b) | | | | | | | 10 | | | | 8,372 | |
HMH Trust, Series 2017-NSS, Class A, 3.06%, 07/05/31(b) | | | | | | | 100 | | | | 97,947 | |
IMT Trust, Series 2017-APTS, Class AFX, 3.48%, 06/15/34(b) | | | | | | | 100 | | | | 100,529 | |
JPMBB Commercial Mortgage Securities Trust: | | | | | | | | | | | | |
Series 2014-C21, Class A5, 3.77%, 08/15/47 | | | | | | | 30 | | | | 30,463 | |
Series 2014-C22, Class A4, 3.80%, 09/15/47 | | | | | | | 10 | | | | 10,165 | |
JPMorgan Chase Commercial Mortgage Securities Trust(b): | | | | | | | | | | | | |
Series 2015-UES, Class D,
3.62%, 09/05/32(c) | | | | | | | 110 | | | | 108,840 | |
Series 2016-NINE, Class A,
2.85%, 10/06/38(c) | | | | | | | 100 | | | | 94,994 | |
Series 2018-WPT, Class FFX, 5.54%, 07/05/33 | | | | | | | 10 | | | | 9,773 | |
Lehman Brothers Small Balance Commercial Mortgage Trust, Series 2007-1A, Class 1A, 2.76%, 03/25/37(b)(c) | | | | | | | 23 | | | | 22,171 | |
MAD Mortgage Trust, Series 2017-330M, Class E, 4.03%, 08/15/34(b)(c) | | | | | | | 100 | | | | 96,141 | |
Madison Avenue Trust, Series 2013-650M, Class D, 4.03%, 10/12/32(b)(c) | | | | | | | 120 | | | | 120,290 | |
Morgan Stanley Bank of America Merrill Lynch Trust: | | | | | | | | | | | | |
Series 2014-C16, Class A5, 3.89%, 06/15/47 | | | | | | | 70 | | | | 71,550 | |
Series 2015-C26, Class D,
3.06%, 10/15/48(b) | | | | | | | 26 | | | | 22,096 | |
Morgan Stanley Capital I, Series 2017-HR2, Class D, 2.73%, 12/15/50 | | | | | | | 10 | | | | 7,628 | |
Morgan Stanley Capital I Trust: | | | | | | | | | | | | |
Series 2006-IQ11, Class C,
6.25%, 10/15/42(c) | | | | | | | 100 | | | | 103,019 | |
Series 2006-T21, Class AJ,
5.24%, 10/12/52(c) | | | | | | | 2 | | | | 2,383 | |
Series 2007-T27, Class AJ,
5.95%, 06/11/42(c) | | | | | | | 40 | | | | 42,167 | |
Series 2017-CLS, Class F,
5.06%, 11/15/34(b)(c) | | | | | | | 84 | | | | 82,581 | |
Series 2017-H1, Class A5, 3.53%, 06/15/50 | | | | | | | 68 | | | | 66,840 | |
Series 2018-H3, Class A5, 4.18%, 07/15/51 | | | | | | | 20 | | | | 20,626 | |
Resource Capital Corp. Ltd.(b)(c): | | | | | | | | | | | | |
Series 2017-CRE5, Class A, 3.26%, 07/15/34 | | | | | | | 16 | | | | 15,663 | |
Series 2017-CRE5, Class B, 4.46%, 07/15/34 | | | | | | | 19 | | | | 18,870 | |
Waldorf Astoria Boca Raton Trust, Series 2016-BOCA, Class A, 3.81%, 06/15/29(b)(c) | | | | | | | 100 | | | | 99,805 | |
Wells Fargo Commercial Mortgage Trust: | | | | | | | | | | | | |
Series 2015-C27, Class C, 3.89%, 02/15/48 | | | | | | | 27 | | | | 25,530 | |
Series 2015-C31, Class A4, 3.70%, 11/15/48 | | | | | | | 30 | | | | 30,267 | |
Series 2015-P2, Class A4, 3.81%, 12/15/48 | | | | | | | 30 | | | | 30,638 | |
Series 2017-C38, Class A5, 3.45%, 07/15/50 | | | | | | | 20 | | | | 19,613 | |
Series 2017-C41, Class D,
2.60%, 11/15/50(b)(c) | | | | | | | 25 | | | | 19,968 | |
Series 2017-HSDB, Class A, 3.28%, 12/13/31(b)(c) | | | | | | | 100 | | | | 99,526 | |
WFRBS Commercial Mortgage Trust: | | | | | | | | | | | | |
Series 2014-C21, Class A5, 3.68%, 08/15/47 | | | | | | | 30 | | | | 30,444 | |
Series 2014-C22, Class C,
3.76%, 09/15/57(c) | | | | | | | 120 | | | | 113,700 | |
| | | | | | | | | | | | |
| | | | 5,298,607 | |
| | | | | | | | | | | | |
| Security | | | | | Par
(000) | | | Value | |
|
| Interest Only Collateralized Mortgage Obligations — 0.0% | |
Banc of America Funding Trust, Series 2014-R2, Class 1C, 0.00%, 11/26/36(b)(c) | | | USD | | | | 64 | | | $ | 12,778 | |
| | | | | | | | | | | | |
|
| Interest Only Commercial Mortgage-Backed Securities — 0.1%(c) | |
Banc of America Commercial Mortgage Trust, Series 2017-BNK3, Class XB, 0.63%, 02/15/50 | | | | | | | 1,000 | | | | 43,430 | |
BBCMS Trust, Series 2015-SRCH, Class XA, 0.96%, 08/10/35(b) | | | | | | | 1,000 | | | | 63,680 | |
BB-UBS Trust, Series 2012-SHOW, Class XA, 0.60%, 11/05/36(b) | | | | | | | 4,250 | | | | 140,952 | |
CFCRE Commercial Mortgage Trust: | | | | | | | | | | | | |
Series 2016-C4, Class XA, 1.73%, 05/10/58 | | | | | | | 125 | | | | 11,763 | |
Series 2016-C4, Class XB, 0.73%, 05/10/58(e) | | | | | | | 120 | | | | 5,820 | |
Commercial Mortgage Trust,Series 2015-3BP, Class XA, 0.06%, 02/10/35(b) | | | | | | | 2,522 | | | | 13,947 | |
Core Industrial Trust, Series 2015-TEXW, Class XA, 0.77%, 02/10/34(b) | | | | | | | 992 | | | | 20,274 | |
JPMDB Commercial Mortgage Securities Trust, Series 2016-C4, Class XC, 0.75%, 12/15/49(b) | | | | | | | 1,800 | | | | 88,135 | |
LSTAR Commercial Mortgage Trust,Series 2017-5, Class X, 1.11%, 03/10/50(b) | | | | | | | 890 | | | | 41,896 | |
Morgan Stanley Bank of America Merrill Lynch Trust, Series 2014-C19, Class XF, 1.19%, 12/15/47(b) | | | | | | | 100 | | | | 5,351 | |
Morgan Stanley Capital I Trust,Series 2018-H4, Class XA, 0.87%, 12/15/51 | | | | | | | 210 | | | | 13,806 | |
One Market Plaza Trust(b): | | | | | | | | | | | | |
Series 2017-1MKT, Class XCP, 0.09%, 02/10/32 | | | | | | | 1,000 | | | | 4,370 | |
Series 2017-1MKT, Class XNCP, 0.00%, 02/10/32(e) | | | | | | | 200 | | | | 2 | |
| | | | | | | | | | | | |
| | | | 453,426 | |
|
| Principal Only Collateralized Mortgage Obligations — 0.0% | |
Seasoned Credit Risk Transfer Trust,Series 2017-3,
Class B, 0.00%, 07/25/56(m) | | | | | | | 40 | | | | 2,763 | |
| | | | | | | | | | | | |
| |
Total Non-Agency Mortgage-Backed Securities — 2.2%
(Cost: $9,733,813) | | | | 9,800,299 | |
| | | | | | | | | | | | |
| | | |
| | | | | | Beneficial
Interest
(000) | | | | |
|
Other Interests — 0.0%(e)(g)(l)(n) | |
|
| Capital Markets — 0.0% | |
Lehman Brothers Holdings, Inc. | | | | | | | 620 | | | | — | |
| | | | | | | | | | | | |
| |
Total Other Interests — 0.0% | | | | — | |
| | | | | | | | | | | | |
| | | |
| | | | | | Par
(000) | | | | |
|
Preferred Securities — 0.1% | |
|
| Capital Markets — 0.1%(h)(o) | |
Bank of New York Mellon Corp. (The), Series F, 4.62% | | | | | | | 92 | | | | 82,455 | |
State Street Corp., Series H, 5.63% | | | | | | | 140 | | | | 132,300 | |
| | | | | | | | | | | | |
| | | | 214,755 | |
| | | |
| Consumer Finance — 0.0% | | | | | | | | | |
General Motors Financial Co., Inc., Series A, 5.75%(h)(o) | | | | | | | 15 | | | | 11,962 | |
| | | | | | | | | | | | |
| | | |
| Entertainment — 0.0% | | | | | | | | | |
NBCUniversal Enterprise, Inc., 5.25%(b)(h) | | | | | | | 80 | | | | 81,000 | |
| | | | | | | | | | | | |
| |
Total Preferred Securities — 0.1%
(Cost: $327,000) | | | | 307,717 | |
| | | | | | | | | | | | |
| | |
| 48 | | 2018 BLACKROCK ANNUAL REPORTTO SHAREHOLDERS |
| | |
Schedule of Investments (continued) December 31, 2018 | | BlackRock Balanced Capital Portfolio (Percentages shown are based on Net Assets) |
| | | | | | | | | | | | |
| Security | | | | | Par
(000) | | | Value | |
|
U.S. Government Sponsored Agency Securities — 18.3% | |
|
| Collateralized Mortgage Obligations — 0.1% | |
Federal National Mortgage Association Variable Rate Notes(a): | | | | | | | | | | | | |
Series 2017-C05, Class 1B1, (LIBOR USD 1 Month + 3.60%), 6.11%, 01/25/30 | | | USD | | | | 131 | | | $ | 130,103 | |
Series 2017-C07, Class 1B1, (LIBOR USD 1 Month + 4.00%), 6.51%, 05/25/30 | | | | | | | 50 | | | | 50,136 | |
| | | | | | | | | | | | |
| | | | 180,239 | |
| | | | | | | | | | | | |
|
| Commercial Mortgage-Backed Securities — 0.1% | |
Federal Home Loan Mortgage Corp.: | | | | | | | | | | | | |
Series K058, Class A2, 2.65%, 08/25/26 | | | | | | | 22 | | | | 21,175 | |
Series K064, Class A2, 3.22%, 03/25/27 | | | | | | | 27 | | | | 26,938 | |
Series K072, Class A2, 3.44%, 12/25/27 | | | | | | | 10 | | | | 10,086 | |
Series 2018-SB52, Class A10F, 3.48%, 06/25/28(o) | | | | | | | 30 | | | | 29,951 | |
Federal Home Loan Mortgage Corp. Variable Rate Notes(o): | | | | | | | | | | | | |
Series K059, Class A2, 3.12%, 09/25/26 | | | | | | | 50 | | | | 49,648 | |
Series K061, Class A2, 3.35%, 11/25/26 | | | | | | | 20 | | | | 20,132 | |
Series K034, Class A2, 3.53%, 07/25/23 | | | | | | | 20 | | | | 20,468 | |
Series K085, Class A2, 4.06%, 10/25/28 | | | | | | | 100 | | | | 105,313 | |
Federal National Mortgage Association ACES Variable Rate Notes(o): | | | | | | | | | | | | |
Series 2017-M7, Class A2, 2.96%, 02/25/27 | | | | | | | 81 | | | | 78,806 | |
Series 2018-M1, Class A2, 2.99%, 12/25/27 | | | | | | | 23 | | | | 22,496 | |
Series 2017-M8, Class A2, 3.06%, 05/25/27 | | | | | | | 14 | | | | 13,707 | |
Government National Mortgage Association: | | | | | | | | | | | | |
Series 2016-158, Class VA,
2.00%, 03/16/35(e) | | | | | | | 91 | | | | 81,630 | |
Series 2015-97, Class VA, 2.25%, 12/16/38 | | | | | | | 17 | | | | 15,731 | |
| | | | | | | | | | | | |
| | | | 496,081 | |
|
| Interest Only Commercial Mortgage-Backed Securities — 0.0% | |
Federal Home Loan Mortgage Corp. Variable Rate Notes(o): | | | | | | | | | | | | |
Series K718, Class X1, 0.62%, 01/25/22 | | | | | | | 185 | | | | 2,957 | |
Series KW03, Class X1, 0.85%, 06/25/27 | | | | | | | 114 | | | | 6,141 | |
Government National Mortgage Association: | | | | | | | | | | | | |
Series 2014-52, Class AI, 0.83%, 08/16/41 | | | | | | | 148 | | | | 3,096 | |
Series 2014-40, Class AI, 1.00%, 02/16/39 | | | | | | | 109 | | | | 1,373 | |
Government National Mortgage Association Variable Rate Notes: | | | | | | | | | | | | |
Series 2013-63, 0.79%, 09/16/51(o) | | | | | | | 853 | | | | 44,849 | |
Series 2017-100, 0.81%, 05/16/59(o) | | | | | | | 127 | | | | 8,608 | |
Series 2016-26, 0.96%, 02/16/58(o) | | | | | | | 230 | | | | 15,867 | |
Series 2016-34, 0.99%, 01/16/58(o) | | | | | | | 137 | | | | 10,500 | |
Series 2016-87, 1.00%, 08/16/58(o) | | | | | | | 183 | | | | 13,734 | |
Series 2016-110, 1.03%, 05/16/58(o) | | | | | | | 116 | | | | 8,599 | |
Series 2016-113, (LIBOR USD 1 Month + 0.00%), 1.19%, 02/16/58(a) | | | | | | | 114 | | | | 10,322 | |
| | | | | | | | | | | | |
| | | | | | | | | | | 126,046 | |
| | | |
| Mortgage-Backed Securities — 18.1% | | | | | | | | | |
Federal Home Loan Mortgage Corp.: | | | | | | | | | | | | |
2.50%, 01/01/29 - 04/01/31 | | | | | | | 437 | | | | 428,204 | |
2.50%, 01/15/34(p) | | | | | | | 507 | | | | 494,860 | |
3.00%, 09/01/27 - 12/01/46 | | | | | | | 1,474 | | | | 1,453,555 | |
3.00%, 01/15/34 - 01/15/49(p) | | | | | | | 2,507 | | | | 2,455,051 | |
3.50%, 04/01/31 - 01/01/48 | | | | | | | 3,124 | | | | 3,146,408 | |
3.50%, 01/15/34 - 01/15/49(p) | | | | | | | 979 | | | | 978,926 | |
4.00%, 01/15/34 - 01/15/49(p) | | | | | | | 2,059 | | | | 2,099,491 | |
4.00%, 08/01/40 - 08/01/47 | | | | | | | 1,105 | | | | 1,134,800 | |
4.50%, 02/01/39 - 08/01/48 | | | | | | | 1,084 | | | | 1,134,277 | |
4.50%, 01/15/49(p) | | | | | | | 199 | | | | 205,983 | |
5.00%, 10/01/41 - 11/01/41 | | | | | | | 274 | | | | 290,171 | |
5.00%, 01/15/49(p) | | | | | | | 63 | | | | 65,976 | |
5.50%, 06/01/41 | | | | | | | 108 | | | | 116,087 | |
6.00%, 01/01/34 | | | | | | | 58 | | | | 61,919 | |
| | | | | | | | | | | | |
| Security | | | | | Par
(000) | | | Value | |
| | | |
| Mortgage-Backed Securities (continued) | | | | | | | | | |
Federal National Mortgage Association: | | | | | | | | | | | | |
2.00%, 10/01/31 - 03/01/32 | | | USD | | | | 250 | | | $ | 239,202 | |
2.50%, 09/01/27 - 02/01/33 | | | | | | | 1,256 | | | | 1,229,009 | |
2.50%, 01/25/34(p) | | | | | | | 129 | | | | 125,881 | |
3.00%, 04/01/29 - 03/01/47 | | | | | | | 4,693 | | | | 4,634,736 | |
3.00%, 01/25/34 - 01/25/49(p) | | | | | | | 2,355 | | | | 2,311,134 | |
3.50%, 04/01/29 - 01/01/48 | | | | | | | 6,085 | | | | 6,126,259 | |
3.50%, 01/25/49(p) | | | | | | | 1,753 | | | | 1,753,022 | |
4.00%, 09/01/25 - 08/01/48 | | | | | | | 8,167 | | | | 8,394,355 | |
4.00%, 01/25/49(p) | | | | | | | 1,235 | | | | 1,258,928 | |
4.50%, 02/01/25 - 07/01/48 | | | | | | | 2,323 | | | | 2,429,993 | |
4.50%, 01/25/49 - 02/25/49(p) | | | | | | | 8,710 | | | | 9,014,884 | |
5.00%, 09/01/35 - 06/01/45 | | | | | | | 336 | | | | 354,549 | |
5.00%, 01/25/49(p) | | | | | | | 4,364 | | | | 4,570,949 | |
5.50%, 02/01/35 - 04/01/41 | | | | | | | 672 | | | | 720,709 | |
6.00%, 12/01/27 - 06/01/41 | | | | | | | 393 | | | | 428,708 | |
6.50%, 05/01/40 | | | | | | | 112 | | | | 126,590 | |
Government National Mortgage Association: | | | | | | | | | | | | |
3.00%, 02/15/45 - 12/20/46 | | | | | | | 2,497 | | | | 2,464,487 | |
3.00%, 01/15/49(p) | | | | | | | 674 | | | | 663,719 | |
3.50%, 01/15/42 - 10/20/46 | | | | | | | 6,716 | | | | 6,769,055 | |
3.50%, 01/15/49(p) | | | | | | | 1,510 | | | | 1,519,320 | |
4.00%, 04/20/39 - 03/15/41 | | | | | | | 374 | | | | 385,900 | |
4.00%, 01/15/49(p) | | | | | | | 7,713 | | | | 7,897,389 | |
4.50%, 12/20/39 - 09/20/48 | | | | | | | 569 | | | | 593,950 | |
4.50%, 01/15/49(p) | | | | | | | 3,025 | | | | 3,130,107 | |
5.00%, 12/15/38 - 07/20/42 | | | | | | | 176 | | | | 186,098 | |
5.00%, 01/15/49(p) | | | | | | | 403 | | | | 419,419 | |
5.50%, 01/15/49(p) | | | | | | | 295 | | | | 312,942 | |
7.50%, 03/15/32 | | | | | | | 3 | | | | 3,324 | |
| | | | | | | | | | | | |
| | | | | | | | | | | 82,130,326 | |
| |
Total U.S. Government Sponsored Agency Securities — 18.3%
(Cost: $82,954,513) | | | | 82,932,692 | |
| | | | | | | | | | | | |
| | | |
| U.S. Treasury Obligations — 4.9% | | | | | | | | | |
U.S. Treasury Bonds: | | | | | | | | | | | | |
4.25%, 05/15/39 | | | | | | | 112 | | | | 135,113 | |
4.50%, 08/15/39 | | | | | | | 109 | | | | 135,833 | |
4.38%, 11/15/39 | | | | | | | 109 | | | | 133,636 | |
3.13%, 02/15/43 | | | | | | | 425 | | | | 433,517 | |
2.88%, 05/15/43 - 11/15/46 | | | | | | | 549 | | | | 535,483 | |
3.63%, 08/15/43 | | | | | | | 406 | | | | 449,407 | |
3.75%, 11/15/43(q) | | | | | | | 431 | | | | 486,777 | |
3.00%, 02/15/47 | | | | | | | 77 | | | | 76,783 | |
3.00%, 08/15/48(q) | | | | | | | 1,669 | | | | 1,661,111 | |
3.38%, 11/15/48 | | | | | | | 20 | | | | 21,388 | |
U.S. Treasury Notes: | | | | | | | | | | | | |
1.25%, 08/31/19 | | | | | | | 1,090 | | | | 1,080,164 | |
1.00%, 10/15/19 | | | | | | | 1,090 | | | | 1,076,247 | |
1.63%, 06/30/20 - 10/31/23 | | | | | | | 1,821 | | | | 1,783,690 | |
2.63%, 08/31/20 - 12/31/23 | | | | | | | 1,765 | | | | 1,769,151 | |
2.63%, 05/15/21(q) | | | | | | | 1,278 | | | | 1,282,094 | |
1.13%, 06/30/21 | | | | | | | 658 | | | | 636,846 | |
2.25%, 07/31/21 - 02/15/27 | | | | | | | 2,076 | | | | 2,045,162 | |
2.13%, 09/30/21 | | | | | | | 253 | | | | 250,599 | |
1.88%, 04/30/22 | | | | | | | 763 | | | | 748,396 | |
2.75%, 08/31/23 - 08/31/25 | | | | | | | 1,875 | | | | 1,895,269 | |
2.00%, 04/30/24 - 11/15/26 | | | | | | | 2,031 | | | | 1,965,788 | |
3.00%, 10/31/25 | | | | | | | 3,570 | | | | 3,662,457 | |
| | | | | | | | |
| |
Total U.S. Treasury Obligations — 4.9%
(Cost: $22,208,625) | | | | 22,264,911 | |
| | | | | | | | |
| |
Total Long-Term Investments — 106.5%
(Cost: $499,755,381) | | | | 482,305,823 | |
| | | | | | | | |
| | | | |
| SCHEDULES OF INVESTMENTS | | | 49 | |
| | |
Schedule of Investments (continued) December 31, 2018 | | BlackRock Balanced Capital Portfolio (Percentages shown are based on Net Assets) |
| | | | | | | | | | | | |
| Security | | | | | Par
(000) | | | Value | |
|
| Short-Term Securities — 4.7% | |
|
Borrowed Bond Agreements — 0.9%(r) | |
BNP Paribas SA, 2.85%, 01/02/19 (Purchased on 12/31/18 to be repurchased at USD 141,936, collateralized by U.S. Treasury Notes, 2.75%, due at 09/15/21, par and fair value of USD 140,000 and $140,974, respectively) | | | USD | | | | 142 | | | $ | 141,925 | |
BNP Paribas SA, 2.85%, 01/02/19 (Purchased on 12/31/18 to be repurchased at USD 173,201, collateralized by U.S. Treasury Notes, 2.88%, due at 10/31/23, par and fair value of USD 170,000 and $172,829, respectively) | | | | | | | 173 | | | | 173,187 | |
Deutsche Bank Securities, Inc., 2.75%, 01/02/19 (Purchased on 12/31/18 to be repurchased at USD 2,137,188, collateralized by U.S. Treasury Notes, 2.88%, due at 08/15/28, par and fair value of USD 2,090,000 and $2,122,329, respectively) | | | | | | | 2,137 | | | | 2,137,025 | |
Deutsche Bank Securities, Inc., 2.75%, 01/02/19 (Purchased on 12/31/18 to be repurchased at USD 294,010, collateralized by U.S. Treasury Notes, 2.88%, due at 11/15/21, par and fair value of USD 290,000 and $293,229, respectively) | | | | | | | 294 | | | | 293,988 | |
Merrill Lynch, Pierce, Fenner & Smith Inc., 2.50%, 01/02/19 (Purchased on 12/31/18 to be repurchased at USD 591,416, collateralized by U.S. Treasury Notes, 3.13%, due at 11/15/28, par and fair value of USD 570,000 and $591,241, respectively) | | | | | | | 591 | | | | 591,375 | |
Merrill Lynch, Pierce, Fenner & Smith Inc., 2.95%, 01/02/19 (Purchased on 12/31/18 to be repurchased at USD 71,318, collateralized by U.S. Treasury Bonds, 3.13%, due at 05/15/48, par and fair value of USD 70,000 and $71,329, respectively) | | | | | | | 71 | | | | 71,313 | |
Merrill Lynch, Pierce, Fenner & Smith Inc., 2.98%, 01/02/19 (Purchased on 12/31/18 to be repurchased at USD 503,704, collateralized by U.S. Treasury Notes, 2.88%, due at 11/30/23, par and fair value of USD 495,000 and $503,624, respectively) | | | | | | | 504 | | | | 503,662 | |
| | | | | | | | | | | | |
| |
Total Borrowed Bond Agreements — 0.9%
(Cost: $3,912,475) | | | | 3,912,475 | |
| | | | | | | | |
| | | |
| Commercial Paper — 0.0% | | | | | | | | | |
General Motors Financial Co., Inc., 3.69%, 03/27/19(s) | | | | | | | 250 | | | | 248,104 | |
| | | | | | | | |
| |
Total Commercial Paper — 0.0%
(Cost: $247,846) | | | | 248,104 | |
| | | | | | | | |
|
Foreign Government Obligations — 1.3% | |
|
Egypt — 0.0% | |
Arab Republic of Egypt Treasury Bills(s): | | | | | | | | | | | | |
18.65%, 03/05/19 | | | EGP | | | | 1,100 | | | | 59,543 | |
19.90%, 08/27/19 | | | | | | | 500 | | | | 24,737 | |
| | | | | | | | |
| | | | | | | | | | | 84,280 | |
| | | |
| Japan — 1.3% | | | | | | | | | |
Government of Japan Treasury Bills, (0.29)%, 01/21/19(s) | | | JPY | | | | 614,950 | | | | 5,610,983 | |
| | | | | | | | | | | | |
|
| Nigeria — 0.0% | |
Federal Republic of Nigeria Treasury Bills, 14.66%, 04/04/19(s) | | | NGN | | | | 5,998 | | | | 16,060 | |
| | | | | | | | | | | | |
| |
Total Foreign Government Obligations — 1.3%
(Cost: $5,585,547) | | | | 5,711,323 | |
| | | | | | | | | | | | |
| | | | | | | | | | | | |
| Security | | | | |
Shares | | | Value | |
|
Money Market Funds — 2.5%(t) | |
BlackRock Liquidity Funds, T-Fund, Institutional Class, 2.32%(v) | | | | | | | 5,808,467 | | | $ | 5,808,467 | |
JPMorgan US Treasury Plus Money Market Fund, Agency Class, 2.24% | | | | | | | 33,063 | | | | 33,063 | |
SL Liquidity Series, LLC, Money Market Series, 2.57%(u)(v) | | | | | | | 5,719,066 | | | | 5,718,493 | |
| | | | | | | | | | | | |
| |
Total Money Market Funds — 2.5%
(Cost: $11,560,284) | | | | 11,560,023 | |
| | | | | | | | | | | | |
| |
Total Short-Term Securities — 4.7%
(Cost: $21,306,152) | | | | 21,431,925 | |
| | | | | | | | | | | | |
| |
Total Options Purchased — 0.0%
(Cost: $301,878) | | | | 322,300 | |
| | | | | | | | | | | | |
| |
Total Investments Before Options Written, Borrowed Bonds and TBA Sale Commitments — 111.2%
(Cost: $521,363,411) | | | | 504,060,048 | |
| | | | | | | | | | | | |
| |
Total Options Written — 0.0%
(Premium Received — $98,198) | | | | (125,793 | ) |
| | | | | | | | | | | | |
| | |
| | | Par
(000) | | | | |
|
Borrowed Bonds — (0.8)% | |
| | | |
U.S. Treasury Obligations — (0.8)% | | | | | | | | | | | | |
U.S. Treasury Bonds, 3.13%, 05/15/48 | | | USD | | | | 70 | | | | (71,329 | ) |
U.S. Treasury Notes: | | | | | | | | | | | | |
2.75%, 09/15/21 | | | | | | | 140 | | | | (140,974 | ) |
2.88%, 11/15/21 - 08/15/28 | | | | | | | 3,045 | | | | (3,092,011 | ) |
3.13%, 11/15/28 | | | | | | | 570 | | | | (591,241 | ) |
| | | | | | | | | | | | |
| |
Total Borrowed Bonds — (0.8)%
(Proceeds: $3,811,640) | | | | (3,895,555 | ) |
| | | | | | | | | | | | |
|
TBA Sale Commitments — (5.9)%(p) | |
| | | |
Mortgage-Backed Securities — (5.9)% | | | | | | | | | | | | |
Federal Home Loan Mortgage Corp.: | | | | | | | | | | | | |
3.50%, 01/15/49 | | | | | | | 4 | | | | (4,152 | ) |
4.50%, 01/15/49 | | | | | | | 108 | | | | (111,790 | ) |
Federal National Mortgage Association: | | | | | | | | | | | | |
2.00%, 01/25/34 | | | | | | | 274 | | | | (262,232 | ) |
3.00%, 01/25/49 | | | | | | | 375 | | | | (365,514 | ) |
3.50%, 01/25/34 - 02/25/49 | | | | | | | 7,364 | | | | (7,361,540 | ) |
4.00%, 01/25/34 - 01/25/49 | | | | | | | 5,000 | | | | (5,098,938 | ) |
4.50%, 01/25/49 | | | | | | | 5,600 | | | | (5,798,734 | ) |
5.50%, 01/25/49 | | | | | | | 615 | | | | (650,747 | ) |
6.00%, 01/25/49 | | | | | | | 280 | | | | (300,697 | ) |
Government National Mortgage Association: | | | | | | | | | | | | |
3.00%, 01/15/49 | | | | | | | 315 | | | | (309,702 | ) |
3.50%, 01/15/49 - 02/15/49 | | | | | | | 3,104 | | | | (3,122,374 | ) |
4.00%, 01/15/49 | | | | | | | 2,638 | | | | (2,701,065 | ) |
4.50%, 01/15/49 | | | | | | | 500 | | | | (517,373 | ) |
| | | | | | | | | | | | |
| |
Total TBA Sale Commitments — (5.9)%
(Proceeds: $26,353,784) | | | | (26,604,858 | ) |
| | | | | | | | | | | | |
| | |
Total Investments Net of Options Written, Borrowed Bonds and TBA Sale Commitments — 104.5%
(Cost: $491,099,789) | | | | | | | | 473,433,842 | |
| |
Liabilities in Excess of Other Assets — (4.5)% | | | | (20,404,199 | ) |
| | | | | | | | | | | | |
| |
Net Assets — 100.0% | | | $ | 453,029,643 | |
| | | | | | | | | | | | |
| | |
| 50 | | 2018 BLACKROCK ANNUAL REPORTTO SHAREHOLDERS |
| | |
Schedule of Investments (continued) December 31, 2018 | | BlackRock Balanced Capital Portfolio |
| (a) | Variable rate security. Security may be issued at a fixed coupon rate, which converts to a variable rate at a specified date. Rate shown is the rate in effect as of period end. |
| (b) | Security exempt from registration pursuant to Rule 144A under the Securities Act of 1933, as amended. These securities may be resold in transactions exempt from registration to qualified institutional investors. |
| (c) | Variable or floating rate security, which interest rate adjusts periodically based on changes in current interest rates and prepayments on the underlying pool of assets. Rate shown is the rate in effect as of period end. |
| (d) | Step-up bond that pays an initial coupon rate for the first period and then a higher coupon rate for the following periods. Rate as of period end. |
| (e) | Security is valued using significant unobservable inputs and is classified as Level 3 in the fair value hierarchy. |
| (f) | Security, or a portion of the security, is on loan. |
| (g) | Non-income producing security. |
| (h) | Perpetual security with no stated maturity date. |
| (i) | Payment-in-kind security which may pay interest/dividends in additional par/shares and/or in cash. Rates shown are the current rate and possible payment rates. |
| (j) | Variable rate security. Rate as of period end and maturity is the date the principal owed can be recovered through demand. |
| (k) | When-issued security. |
| (l) | Issuer filed for bankruptcy and/or is in default. |
| (n) | Other interests represent beneficial interests in liquidation trusts and other reorganizational or private entities. |
| (o) | Variable rate security. Rate shown is the rate in effect as of period end. |
| (p) | Represents or includes a TBA transaction. |
| (q) | All or a portion of the security has been pledged in connection with outstanding futures contracts. |
| (r) | Certain agreements have no stated maturity and can be terminated by either party at any time. |
| (s) | Rates are discount rates or a range of discount rates as of period end. |
| (t) | Annualized 7-day yield as of period end. |
| (u) | Security was purchased with the cash collateral from loaned securities. |
| (v) | During the year ended December 31, 2018, investments in issuers considered to be affiliates of the Fund for purposes of Section 2(a)(3) of the Investment Company Act of 1940, as amended, and/or related parties of the Fund were as follows: |
| | | | | | | | | | | | | | | | | | | | | | | | | | | | | | | | |
| Affiliate | | Shares
Held at
12/31/17 | | | Shares
Purchased | | | Shares
Sold | | | Shares
Held at
12/31/18 | | | Value at
12/31/18 | | | Income | | | Net
Realized
Gain (Loss)(a) | | | Change in
Unrealized
Appreciation
(Depreciation) | |
BlackRock Liquidity Funds,T-Fund, Institutional Class | | | 41,993,401 | | | | — | | | | (36,184,934 | )(b) | | | 5,808,467 | | | $ | 5,808,467 | | | $ | 571,405 | | | $ | — | | | $ | — | |
SL Liquidity Series, LLC, Money Market Series | | | 6,750,211 | | | | — | | | | (1,031,145 | )(b) | | | 5,719,066 | | | | 5,718,493 | | | | 10,878 | (c) | | | 994 | | | | (184 | ) |
iShares Edge MSCI Multifactor USA ETF | | | 297,982 | | | | — | | | | (285,964 | ) | | | 12,018 | | | | 334,822 | | | | 10,935 | | | | 239,276 | | | | 87,172 | |
iShares iBoxx $ High Yield Corporate Bond ETF | | | 18,780 | | | | 30,100 | | | | (37,780 | ) | | | 11,100 | | | | 900,210 | | | | 13,530 | | | | 15,394 | | | | (22,111 | ) |
iShares J.P. Morgan USD Emerging Markets Bond ETF | | | — | | | | 55,982 | | | | (50,649 | ) | | | 5,333 | | | | 554,152 | | | | 68,676 | | | | (79,558 | ) | | | (54 | ) |
| | | | | | | | | | | | | | | | | | | | | | | | | | | | |
| | | | | | | | | | | | | | | | | | $ | 13,316,144 | | | $ | 675,424 | | | $ | 176,106 | | | $ | 64,823 | |
| | | | | | | | | | | | | | | | | | | | | | | | | | | | | | | | |
| | (a) | Includes net capital gain distributions, if applicable. | |
| | (b) | Represents net shares sold. | |
| | (c) | Represents securities lending income earned from the reinvestment of cash collateral from loaned securities, net of fees and collateral investment expenses, and other payments to and from borrowers of securities. | |
For Fund compliance purposes, the Fund’s industry classifications refer to one or more of the industry sub-classifications used by one or more widely recognized market indexes or ratings group indexes, and/or as defined by the investment adviser. These definitions may not apply for purposes of this report, which may combine such industry sub-classifications for reporting ease.
Derivative Financial Instruments Outstanding as of Period End
Futures Contracts
| | | | | | | | | | | | | | | | |
| Description | | Number of
Contracts | | | Expiration
Date | | | Notional
Amount (000) | | | Value/ Unrealized
Appreciation (Depreciation) | |
| Long Contracts | | | | | | | | | | | | |
TOPIX Index | | | 44 | | | | 03/07/19 | | | $ | 5,996 | | | $ | (363,638 | ) |
S&P 500E-Mini Index | | | 194 | | | | 03/15/19 | | | | 24,300 | | | | (763,493 | ) |
U.S. Treasury 10 Year Note | | | 133 | | | | 03/20/19 | | | | 16,228 | | | | 231,331 | |
U.S. Treasury 10 Year Ultra Bond | | | 25 | | | | 03/20/19 | | | | 3,252 | | | | 72,649 | |
U.S. Treasury Ultra Bond | | | 39 | | | | 03/20/19 | | | | 6,266 | | | | 335,632 | |
U.S. Treasury 2 Year Note | | | 71 | | | | 03/29/19 | | | | 15,074 | | | | 88,595 | |
U.S. Treasury 5 Year Note | | | 157 | | | | 03/29/19 | | | | 18,006 | | | | 229,375 | |
| | | | | | | | | | | | | | | | |
| | | | | | | | | | | | | | | (169,549 | ) |
| | | | | | | | | | | | | | | | |
| Short Contracts | | | | | | | | | | | | |
Euro-Bund | | | 17 | | | | 03/07/19 | | | | 3,185 | | | | (17,725 | ) |
Euro-Buxl | | | 2 | | | | 03/07/19 | | | | 414 | | | | (874 | ) |
Japan 10 Year Bond | | | 1 | | | | 03/13/19 | | | | 1,391 | | | | (6,587 | ) |
U.S. Treasury Long Bond | | | 7 | | | | 03/20/19 | | | | 1,022 | | | | 179 | |
3 Month Eurodollar | | | 54 | | | | 12/14/20 | | | | 13,167 | | | | (54,758 | ) |
| | | | | | | | | | | | | | | | |
| | | | | | | | | | | | | | | (79,765 | ) |
| | | | | | | | | | | | | | | | |
| | | | | | | | | | | | | | $ | (249,314 | ) |
| | | | | | | | | | | | | | | | |
| | | | |
| SCHEDULES OF INVESTMENTS | | | 51 | |
| | |
Schedule of Investments (continued) December 31, 2018 | | BlackRock Balanced Capital Portfolio |
Forward Foreign Currency Exchange Contracts
| | | | | | | | | | | | | | | | | | | | |
Currency Purchased | | | Currency Sold | | | Counterparty | | Settlement Date | | | Unrealized
Appreciation
(Depreciation) | |
| BRL | | | 761,274 | | | USD | | | 196,000 | | | Citibank NA | | | 01/03/19 | | | $ | 420 | |
| BRL | | | 78,493 | | | USD | | | 20,225 | | | Goldman Sachs International | | | 01/03/19 | | | | 27 | |
| TWD | | | 1,851,780 | | | USD | | | 60,240 | | | BNP Paribas SA | | | 01/03/19 | | | | 6 | |
| USD | | | 140,329 | | | BRL | | | 542,035 | | | Goldman Sachs International | | | 01/03/19 | | | | 477 | |
| USD | | | 30,000 | | | ZAR | | | 426,738 | | | BNP Paribas SA | | | 01/10/19 | | | | 362 | |
| USD | | | 20,000 | | | COP | | | 64,210,000 | | | Royal Bank of Scotland | | | 01/11/19 | | | | 236 | |
| ARS | | | 389,500 | | | USD | | | 10,000 | | | BNP Paribas SA | | | 01/16/19 | | | | 149 | |
| ARS | | | 968,950 | | | USD | | | 25,000 | | | Citibank NA | | | 01/16/19 | | | | 247 | |
| ARS | | | 998,300 | | | USD | | | 25,000 | | | Deutsche Bank AG | | | 01/16/19 | | | | 1,012 | |
| ARS | | | 199,650 | | | USD | | | 5,000 | | | Royal Bank of Scotland | | | 01/16/19 | | | | 202 | |
| MXN | | | 405,967 | | | USD | | | 20,225 | | | Goldman Sachs International | | | 01/16/19 | | | | 393 | |
| USD | | | 50,000 | | | CLP | | | 34,388,220 | | | BNP Paribas SA | | | 01/16/19 | | | | 436 | |
| USD | | | 50,000 | | | RUB | | | 3,370,500 | | | Bank of America NA | | | 01/16/19 | | | | 1,717 | |
| USD | | | 140,000 | | | ZAR | | | 2,013,232 | | | BNP Paribas SA | | | 01/16/19 | | | | 289 | |
| IDR | | | 1,848,600,000 | | | USD | | | 120,000 | | | Barclays Bank plc | | | 01/18/19 | | | | 8,086 | |
| KRW | | | 66,798,000 | | | USD | | | 60,000 | | | Bank of America NA | | | 02/07/19 | | | | 42 | |
| USD | | | 60,000 | | | KRW | | | 66,288,000 | | | Morgan Stanley & Co. International plc | | | 02/07/19 | | | | 417 | |
| ARS | | | 199,622 | | | USD | | | 4,736 | | | BNP Paribas SA | | | 03/07/19 | | | | 147 | |
| ARS | | | 499,800 | | | USD | | | 12,000 | | | BNP Paribas SA | | | 03/11/19 | | | | 170 | |
| EUR | | | 7,845,685 | | | USD | | | 9,012,550 | | | Bank of America NA | | | 03/20/19 | | | | 34,667 | |
| GBP | | | 738,000 | | | USD | | | 937,134 | | | Barclays Bank plc | | | 03/20/19 | | | | 7,023 | |
| USD | | | 178,000 | | | CHF | | | 173,406 | | | Citibank NA | | | 03/20/19 | | | | 302 | |
| USD | | | 570,680 | | | EUR | | | 440,000 | | | Deutsche Bank AG | | | 12/13/19 | | | | 51,208 | |
| USD | | | 574,376 | | | EUR | | | 440,000 | | | Deutsche Bank AG | | | 02/25/20 | | | | 51,709 | |
| JPY | | | 59,510,000 | | | USD | | | 551,427 | | | JPMorgan Chase Bank NA | | | 03/16/20 | | | | 12,209 | |
| USD | | | 594,031 | | | JPY | | | 59,510,000 | | | HSBC Bank plc | | | 03/16/20 | | | | 30,395 | |
| | | | | | | | | | | | | | | | | | | | |
| | | | | | | | | | | | | | | | 202,348 | |
| | | | | | | | | | | | | | | | | |
| BRL | | | 57,465 | | | USD | | | 15,000 | | | Goldman Sachs International | | | 01/03/19 | | | | (173 | ) |
| USD | | | 90,896 | | | BRL | | | 356,040 | | | Goldman Sachs International | | | 01/03/19 | | | | (967 | ) |
| USD | | | 60,000 | | | TWD | | | 1,851,780 | | | BNP Paribas SA | | | 01/03/19 | | | | (246 | ) |
| ZAR | | | 422,673 | | | USD | | | 30,000 | | | BNP Paribas SA | | | 01/10/19 | | | | (645 | ) |
| COP | | | 63,220,000 | | | USD | | | 20,000 | | | BNP Paribas SA | | | 01/11/19 | | | | (541 | ) |
| CLP | | | 40,221,300 | | | USD | | | 60,000 | | | BNP Paribas SA | | | 01/16/19 | | | | (2,028 | ) |
| CLP | | | 33,456,000 | | | USD | | | 50,000 | | | Deutsche Bank AG | | | 01/16/19 | | | | (1,780 | ) |
| COP | | | 63,852,200 | | | USD | | | 20,000 | | | Goldman Sachs International | | | 01/16/19 | | | | (352 | ) |
| RUB | | | 3,323,000 | | | USD | | | 50,000 | | | Bank of America NA | | | 01/16/19 | | | | (2,397 | ) |
| USD | | | 18,000 | | | ARS | | | 695,250 | | | HSBC Bank plc | | | 01/16/19 | | | | (116 | ) |
| USD | | | 103,682 | | | IDR | | | 1,500,616,574 | | | BNP Paribas SA | | | 01/16/19 | | | | (321 | ) |
| USD | | | 85,000 | | | KRW | | | 95,719,350 | | | Citibank NA | | | 01/16/19 | | | | (983 | ) |
| USD | | | 90,000 | | | MXN | | | 1,812,078 | | | Citibank NA | | | 01/16/19 | | | | (2,030 | ) |
| USD | | | 80,900 | | | MXN | | | 1,645,608 | | | JPMorgan Chase Bank NA | | | 01/16/19 | | | | (2,676 | ) |
| ZAR | | | 712,119 | | | USD | | | 50,000 | | | Northern Trust Co. | | | 01/16/19 | | | | (582 | ) |
| ZAR | | | 1,270,260 | | | USD | | | 90,000 | | | UBS AG | | | 01/16/19 | | | | (1,849 | ) |
| USD | | | 120,000 | | | IDR | | | 1,769,640,000 | | | JPMorgan Chase Bank NA | | | 01/18/19 | | | | (2,615 | ) |
| USD | | | 5,514,970 | | | JPY | | | 615,363,112 | | | JPMorgan Chase Bank NA | | | 01/22/19 | | | | (108,356 | ) |
| USD | | | 100,706 | | | COP | | | 332,530,000 | | | Goldman Sachs International | | | 01/23/19 | | | | (1,580 | ) |
| USD | | | 29,968 | | | COP | | | 97,516,000 | | | HSBC Bank plc | | | 01/23/19 | | | | (28 | ) |
| USD | | | 121,194 | | | COP | | | 400,000,000 | | | UBS AG | | | 01/23/19 | | | | (1,845 | ) |
| USD | | | 386,406 | | | MXN | | | 7,780,000 | | | Citibank NA | | | 01/23/19 | | | | (8,214 | ) |
| USD | | | 52,288 | | | ZAR | | | 760,000 | | | Bank of America NA | | | 01/23/19 | | | | (404 | ) |
| BRL | | | 543,087 | | | USD | | | 140,329 | | | Goldman Sachs International | | | 02/04/19 | | | | (483 | ) |
| USD | | | 2,056 | | | JPY | | | 230,000 | | | State Street Bank & Trust Co. | | | 02/05/19 | | | | (48 | ) |
| USD | | | 118,963 | | | MXN | | | 2,401,000 | | | Standard Chartered Bank | | | 02/05/19 | | | | (2,547 | ) |
| USD | | | 10,000 | | | ARS | | | 403,000 | | | BNP Paribas SA | | | 02/11/19 | | | | (135 | ) |
| USD | | | 10,000 | | | ARS | | | 403,000 | | | JPMorgan Chase Bank NA | | | 02/11/19 | | | | (135 | ) |
| AUD | | | 11,752,927 | | | USD | | | 8,515,442 | | | Citibank NA | | | 03/20/19 | | | | (226,452 | ) |
| CAD | | | 559,035 | | | EUR | | | 356,000 | | | BNP Paribas SA | | | 03/20/19 | | | | (299 | ) |
| CAD | | | 485,028 | | | USD | | | 356,000 | | | Toronto Dominion Bank | | | 03/20/19 | | | | (87 | ) |
| USD | | | 935,622 | | | GBP | | | 738,000 | | | Morgan Stanley & Co. International plc | | | 03/20/19 | | | | (8,535 | ) |
| TRY | | | 135,908 | | | USD | | | 25,379 | | | JPMorgan Chase Bank NA | | | 06/19/19 | | | | (1,820 | ) |
| EUR | | | 440,000 | | | USD | | | 538,349 | | | JPMorgan Chase Bank NA | | | 12/13/19 | | | | (18,877 | ) |
| EUR | | | 440,000 | | | USD | | | 542,232 | | | JPMorgan Chase Bank NA | | | 02/25/20 | | | | (19,565 | ) |
| | | | | | | | | | | | | | | | | | | | |
| | | | | | | | | | | | | | | | (419,711 | ) |
| | | | | | | | | | | | | | | | | |
| | | Net Unrealized Depreciation | | | $ | (217,363 | ) |
| | | | | | | | |
| | |
| 52 | | 2018 BLACKROCK ANNUAL REPORTTO SHAREHOLDERS |
| | |
Schedule of Investments (continued) December 31, 2018 | | BlackRock Balanced Capital Portfolio |
OTC Barrier Options Purchased
| | | | | | | | | | | | | | | | | | | | | | | | | | | | | | | | | | | | |
| Description | | Type of Option | | Counterparty | | Expiration
Date | | | Exercise Price | | | Barrier
Price/Range | | | Notional
Amount (000) | | | Value | |
Put | | | | | | | | | | | | | | | | | | | | | | | | | | | | | | | | | | | | |
USD Currency | | One Touch | | Deutsche Bank AG | | | 01/07/19 | | | | BRL | | | | 3.60 | | | | BRL | | | | 4.00 | | | | USD | | | | 180 | | | $ | — | |
USD Currency | | One Touch | | Deutsche Bank AG | | | 02/07/19 | | | | BRL | | | | 3.50 | | | | BRL | | | | 4.00 | | | | USD | | | | 131 | | | | 1 | |
| | | | | | | | | | | | | | | | | | | | | | | | | | | | | | | | | | | | |
| | | | | | | | | | | | | | | | | | | | | | | | | | | | | | | | | | $ | 1 | |
| | | | | | | | | | | | | | | | | | | | | | | | | | | | | | | | | | | | |
OTC Currency Options Purchased
| | | | | | | | | | | | | | | | | | | | | | | | |
| Description | | Counterparty | | Expiration
Date | | Exercise Price | | | Notional
Amount (000) | | | Value | |
Call | | | | | | | | | | | | | | | | | | | | | | | | |
USD Currency | | Morgan Stanley & Co. International plc | | 01/10/19 | | | BRL | | | | 3.92 | | | | USD | | | | 60 | | | $ | 311 | |
USD Currency | | Deutsche Bank AG | | 04/03/19 | | | JPY | | | | 112.00 | | | | USD | | | | 1,097 | | | | 6,291 | |
| | | | | | | | | | | | | | | | | | | | | | | | |
| | | | | | | | | | | | | | | | | | | | | | | 6,602 | |
| | | | | | | | | | | | | | | | | | | | | | | | |
Put | | | | | | | | | | | | | | | | | | | | | | | | |
USD Currency | | Goldman Sachs International | | 01/08/19 | | | BRL | | | | 3.60 | | | | USD | | | | 60 | | | | — | |
USD Currency | | Morgan Stanley & Co. International plc | | 01/10/19 | | | BRL | | | | 3.74 | | | | USD | | | | 60 | | | | 32 | |
USD Currency | | HSBC Bank plc | | 01/31/19 | | | KRW | | | | 1,110.00 | | | | USD | | | | 85 | | | | 725 | |
USD Currency | | Goldman Sachs International | | 02/07/19 | | | BRL | | | | 3.90 | | | | USD | | | | 60 | | | | 1,210 | |
USD Currency | | HSBC Bank plc | | 02/07/19 | | | KRW | | | | 1,115.00 | | | | USD | | | | 60 | | | | 725 | |
USD Currency | | JPMorgan Chase Bank NA | | 02/21/19 | | | ZAR | | | | 13.50 | | | | USD | | | | 58 | | | | 257 | |
USD Currency | | Deutsche Bank AG | | 04/03/19 | | | JPY | | | | 112.00 | | | | USD | | | | 1,097 | | | | 36,847 | |
| | | | | | | | | | | | | | | | | | | | | | | | |
| | | | | | | | | | | | | | | | | | | | | | | 39,796 | |
| | | | | | | | | | | | | | | | | | | | | | | | |
| | | | | | | | | | | | | | | | | | | | | | $ | 46,398 | |
| | | | | | | | | | | | | | | | | | | | | | | | |
OTC Interest Rate Swaptions Purchased
| | | | | | | | | | | | | | | | | | | | | | | | | | | | | | | | | | |
| | | Paid by the Fund | | Received by the Fund | | | | Expiration | | | Exercise | | | Notional | | | | |
| Description | | Rate | | | Frequency | | Rate | | | Frequency | | Counterparty | | Date | | | Rate | | | Amount (000) | | | Value | |
Call | | | | | | | | | | | | | | | | | | | | | | | | | | | | | | | | | | |
10-Year Interest Rate Swap | | | 3 month LIBOR | | | Quarterly | | | 2.75% | | | Semi-Annual | | Citibank NA | | | 04/24/19 | | | | 2.75 | % | | | USD | | | | 890 | | | $ | 12,736 | |
10-Year Interest Rate Swap | | | 3 month LIBOR | | | Quarterly | | | 2.75% | | | Semi-Annual | | Citibank NA | | | 04/24/19 | | | | 2.75 | % | | | USD | | | | 220 | | | | 3,148 | |
10-Year Interest Rate Swap | | | 3 month LIBOR | | | Quarterly | | | 2.70% | | | Semi-Annual | | Barclays Bank plc | | | 06/10/19 | | | | 2.70 | % | | | USD | | | | 497 | | | | 7,244 | |
10-Year Interest Rate Swap | | | 3 month LIBOR | | | Quarterly | | | 3.04% | | | Semi-Annual | | JPMorgan Chase Bank NA | | | 04/27/38 | | | | 3.04 | % | | | USD | | | | 2,320 | | | | 132,549 | |
10-Year Interest Rate Swap | | | 3 month LIBOR | | | Quarterly | | | 3.04% | | | Semi-Annual | | JPMorgan Chase Bank NA | | | 04/27/38 | | | | 3.04 | % | | | USD | | | | 104 | | | | 5,751 | |
| | | | | | | | | | | | | | | | | | | | | | | | | | | | | | | | | | |
| | | | | | | | | | | | | | | | | | | | | | | | | | | | | | | | | 161,428 | |
| | | | | | | | | | | | | | | | | | | | | | | | | | | | | | | | | | |
Put | | | | | | | | | | | | | | | | | | | | | | | | | | | | | | | | | | |
10-Year Interest Rate Swap | | | 3.77% | | | Semi-Annual | | | 3 month LIBOR | | | Quarterly | | Citibank NA | | | 04/24/19 | | | | 3.77 | % | | | USD | | | | 555 | | | | 111 | |
10-Year Interest Rate Swap | | | 3.04% | | | Semi-Annual | | | 3 month LIBOR | | | Quarterly | | JPMorgan Chase Bank NA | | | 04/27/38 | | | | 3.04 | % | | | USD | | | | 104 | | | | 4,999 | |
10-Year Interest Rate Swap | | | 3.04% | | | Semi-Annual | | | 3 month LIBOR | | | Quarterly | | JPMorgan Chase Bank NA | | | 04/27/38 | | | | 3.04 | % | | | USD | | | | 2,320 | | | | 109,363 | |
| | | | | | | | | | | | | | | | | | | | | | | | | | | | | | | | | | |
| | | | | | | | | | | | | | | | | | | | | | | | | | | | | | | | | 114,473 | |
| | | | | | | | | | | | | | | | | | | | | | | | | | | | | | | | | | |
| | | | | | | | | | | | | | | | | | | | | | | | | | | | | | | | $ | 275,901 | |
| | | | | | | | | | | | | | | | | | | | | | | | | | | | | | | | | | |
OTC Currency Options Written
| | | | | | | | | | | | | | | | | | | | | | | | |
| Description | | Counterparty | | Expiration
Date | | Exercise
Price | | | Notional
Amount (000) | | | Value | |
Call | | | | | | | | | | | | | | | | | | | | | | | | |
USD Currency | | Morgan Stanley & Co. International plc | | 01/10/19 | | | BRL | | | | 3.90 | | | | USD | | | | 60 | | | $ | (414 | ) |
USD Currency | | Citibank NA | | 01/11/19 | | | MXN | | | | 20.90 | | | | USD | | | | 60 | | | | (8 | ) |
USD Currency | | JPMorgan Chase Bank NA | | 02/07/19 | | | KRW | | | | 1,140.00 | | | | USD | | | | 30 | | | | (97 | ) |
USD Currency | | Morgan Stanley & Co. International plc | | 04/03/19 | | | JPY | | | | 112.00 | | | | USD | | | | 1,097 | | | | (6,264 | ) |
| | | | | | | | | | | | | | | | | | | | | | | | |
| | | | | | | | | | | | | | | | | | | | | | | (6,783 | ) |
| | | | | | | | | | | | | | | | | | | | | | | | |
| | | | |
| SCHEDULES OF INVESTMENTS | | | 53 | |
| | |
Schedule of Investments (continued) December 31, 2018 | | BlackRock Balanced Capital Portfolio |
| | | | | | | | | | | | | | | | | | | | | | |
| Description | | Counterparty | | Expiration
Date | | Exercise
Price | | | Notional
Amount (000) | | | Value | |
Put | | | | | | | | | | | | | | | | | | | | | | |
USD Currency | | Morgan Stanley & Co. International plc | | 01/10/19 | | BRL | | | 3.60 | | | | USD | | | | 60 | | | $ | — | |
USD Currency | | JPMorgan Chase Bank NA | | 02/07/19 | | KRW | | | 1,085.00 | | | | USD | | | | 30 | | | | (78 | ) |
USD Currency | | HSBC Bank plc | | 02/07/19 | | KRW | | | 1,085.00 | | | | USD | | | | 60 | | | | (156 | ) |
USD Currency | | Goldman Sachs International | | 02/07/19 | | BRL | | | 3.75 | | | | USD | | | | 90 | | | | (475 | ) |
USD Currency | | Morgan Stanley & Co. International plc | | 04/03/19 | | JPY | | | 112.00 | | | | USD | | | | 1,097 | | | | (36,918 | ) |
| | | | | | | | | | | | | | | | | | | | | | |
| | | | | | | | | | | | | | | | | | | | | (37,627 | ) |
| | | | | | | | | | | | | | | | | | | | | | |
| | | | | | | | | | | | | | | | | | | | $ | (44,410 | ) |
| | | | | | | | | | | | | | | | | | | | | | |
OTC Interest Rate Swaptions Written
| | | | | | | | | | | | | | | | | | | | | | | | | | | | | | | | | | |
| | | Paid by the Fund | | Received by the Fund | | Counterparty | | Expiration | | | Exercise | | | Notional | | | | |
| Description | | Rate | | | Frequency | | Rate | | | Frequency | | Date | | | Rate | | | Amount (000) | | | Value | |
Call | | | | | | | | | | | | | | | | | | | | | | | | | | | | | | | | | | |
2-Year Interest Rate Swap | | | 3 month LIBOR | | | Quarterly | | | 2.75% | | | Semi-Annual | | Citibank NA | | | 10/16/20 | | | | 2.75 | % | | | USD | | | | 6,765 | | | $ | (73,326) | |
| | | | | | | | | | | | | | | | | | | | | | | | | | | | | | | | | | |
Put | | | | | | | | | | | | | | | | | | | | | | | | | | | | | | | | | | |
2-Year Interest Rate Swap | | | 3.75% | | | Semi-Annual | | | 3 month LIBOR | | | Quarterly | | Citibank NA | | | 10/16/20 | | | | 3.75 | % | | | USD | | | | 6,765 | | | | (8,057) | |
| | | | | | | | | | | | | | | | | | | | | | | | | | | | | | | | | | |
| | | | | | | | | | | | | | | | | | | | | | | | | | | | | | | | $ | (81,383) | |
| | | | | | | | | | | | | | | | | | | | | | | | | | | | | | | | | | |
Centrally Cleared Inflation Swaps
| | | | | | | | | | | | | | | | | | | | | | | | | | | | |
Paid by the Fund | | Received by the Fund | | Termination
Date | | | Notional
Amount (000) | | Value | | | Upfront
Premium
Paid
(Received) | | | Unrealized
Appreciation
(Depreciation) | |
| Reference | | Frequency | | Rate | | Frequency |
| UK Retail Price Index All Items Monthly | | At Termination | | 3.57% | | At Termination | | | 11/15/28 | | | | GBP | | | 555 | | $ | 2,612 | | | $ | (279) | | | $ | 2,891 | |
| | | | | | | | | | | | | | | | | | | | | | | | | | | | |
Centrally Cleared Interest Rate Swaps
| | | | | | | | | | | | | | | | | | | | | | | | | | | | | | | | |
| Paid by the Fund | | Received by the Fund | | Effective
Date | | | Termination
Date | | | Notional
Amount (000) | | | Value | | | Upfront
Premium
Paid
(Received) | | | Unrealized
Appreciation
(Depreciation) | |
| Rate | | Frequency | | Rate | | Frequency |
| 7.36% | | Monthly | | 28 day MXIBTIIE | | Monthly | | | N/A | | | | 01/28/19 | | | MXN | | | 12,895 | | | $ | 626 | | | $ | — | | | $ | 626 | |
| 28 day MXIBTIIE | | Monthly | | 8.21% | | Monthly | | | N/A | | | | 10/07/20 | | | MXN | | | 4,597 | | | | (1,623 | ) | | | — | | | | (1,623 | ) |
| 28 day MXIBTIIE | | Monthly | | 8.21% | | Monthly | | | N/A | | | | 10/07/20 | | | MXN | | | 9,354 | | | | (3,293 | ) | | | — | | | | (3,293 | ) |
| 6 month EURIBOR | | Semi-Annual | | 0.38% | | Annual | | | 11/09/20 | (a) | | | 11/09/21 | | | EUR | | | 7,920 | | | | 26,896 | | | | (376 | ) | | | 27,272 | |
| 6 month EURIBOR | | Semi-Annual | | 0.38% | | Annual | | | 11/09/20 | (a) | | | 11/09/21 | | | EUR | | | 7,920 | | | | 26,440 | | | | (106 | ) | | | 26,546 | |
| 1.55% | | Semi-Annual | | 6 month LIBOR | | Semi-Annual | | | 11/09/20 | (a) | | | 11/09/21 | | | GBP | | | 14,381 | | | | (39,265 | ) | | | 1,462 | | | | (40,727 | ) |
| 6 month EURIBOR | | Semi-Annual | | 0.32% | | Annual | | | 11/16/20 | (a) | | | 11/16/21 | | | EUR | | | 8,022 | | | | 21,419 | | | | — | | | | 21,419 | |
| 1.42% | | Semi-Annual | | 6 month LIBOR | | Semi-Annual | | | 11/16/20 | (a) | | | 11/16/21 | | | GBP | | | 6,190 | | | | (7,096 | ) | | | — | | | | (7,096 | ) |
| 1.34% | | Semi-Annual | | 6 month LIBOR | | Semi-Annual | | | 12/10/20 | (a) | | | 12/10/21 | | | GBP | | | 3,690 | | | | 141 | | | | (87 | ) | | | 228 | |
| 6 month EURIBOR | | Semi-Annual | | 0.24% | | Annual | | | 12/14/20 | (a) | | | 12/14/21 | | | EUR | | | 4,045 | | | | 6,014 | | | | 120 | | | | 5,894 | |
| 7.11% | | Monthly | | 28 day MXIBTIIE | | Monthly | | | N/A | | | | 10/14/22 | | | MXN | | | 2,077 | | | | 5,173 | | | | — | | | | 5,173 | |
| 7.11% | | Monthly | | 28 day MXIBTIIE | | Monthly | | | N/A | | | | 10/14/22 | | | MXN | | | 1,575 | | | | 3,912 | | | | — | | | | 3,912 | |
| 1.66% | | Semi-Annual | | 6 month LIBOR | | Semi-Annual | | | 11/08/21 | (a) | | | 11/08/22 | | | GBP | | | 3,647 | | | | (11,698 | ) | | | 304 | | | | (12,002 | ) |
| 1.67% | | Semi-Annual | | 6 month LIBOR | | Semi-Annual | | | 11/08/21 | (a) | | | 11/08/22 | | | GBP | | | 3,648 | | | | (12,150 | ) | | | 797 | | | | (12,947 | ) |
| 1.54% | | Semi-Annual | | 6 month LIBOR | | Semi-Annual | | | 11/15/21 | (a) | | | 11/15/22 | | | GBP | | | 3,223 | | | | (5,637 | ) | | | — | | | | (5,637 | ) |
| 28 day MXIBTIIE | | Monthly | | 6.32% | | Monthly | | | N/A | | | | 07/17/25 | | | MXN | | | 2,027 | | | | (12,312 | ) | | | — | | | | (12,312 | ) |
| 3 month LIBOR | | Quarterly | | 2.13% | | Semi-Annual | | | N/A | | | | 08/25/25 | | | USD | | | 65 | | | | (1,636 | ) | | | — | | | | (1,636 | ) |
| 6 month EURIBOR | | Semi-Annual | | 0.82% | | Annual | | | 03/11/19 | (a) | | | 02/15/28 | | | EUR | | | 1,870 | | | | 13,959 | | | | — | | | | 13,959 | |
| 1.58% | | Semi-Annual | | 6 month LIBOR | | Semi-Annual | | | N/A | | | | 11/21/28 | | | GBP | | | 771 | | | | (14,973 | ) | | | 82 | | | | (15,055 | ) |
| 2.85% | | Semi-Annual | | 3 month LIBOR | | Quarterly | | | N/A | | | | 12/24/28 | | | USD | | | 36 | | | | (396 | ) | | | — | | | | (396 | ) |
| 3.26% | | Semi-Annual | | 3 month LIBOR | | Quarterly | | | 04/26/19 | (a) | | | 04/26/29 | | | USD | | | 130 | | | | (6,034 | ) | | | — | | | | (6,034 | ) |
| 3 month LIBOR | | Quarterly | | 3.35% | | Semi-Annual | | | 04/26/19 | (a) | | | 04/26/29 | | | USD | | | 90 | | | | 4,841 | | | | — | | | | 4,841 | |
| 3.23% | | Semi-Annual | | 3 month LIBOR | | Quarterly | | | 04/26/19 | (a) | | | 04/26/29 | | | USD | | | 31 | | | | (1,352 | ) | | | — | | | | (1,352 | ) |
| 2.93% | | Semi-Annual | | 3 month LIBOR | | Quarterly | | | 06/12/19 | (a) | | | 06/12/29 | | | USD | | | 154 | | | | (2,593 | ) | | | — | | | | (2,593 | ) |
| | | | | | | | | | | | | | | | | | | | | | | | | | | | | | | | |
| | | | | | | | | | | | | | | | | | | | | | $ | (10,637) | | | $ | 2,196 | | | $ | (12,833) | |
| | | | | | | | | | | | | | | | | | | | | | | | | | | | | | | | |
| | |
| 54 | | 2018 BLACKROCK ANNUAL REPORTTO SHAREHOLDERS |
| | |
Schedule of Investments (continued) December 31, 2018 | | BlackRock Balanced Capital Portfolio |
OTC Currency Swaps
| | | | | | | | | | | | | | | | | | | | | | | | | | | | | | | | | | |
| Paid by the Fund | | Received by the Fund | | Notional Amount (000) | | | Counterparty | | Termination
Date (a) | | | Value | | | Upfront
Premium
Paid
(Received) | | | Unrealized
Appreciation
(Depreciation) | |
| Rate | | Frequency | | Rate | | Frequency | | Delivered | | | Received | |
| 16.77 TRY | | Annual | | 3 month LIBOR | | Quarterly | | TRY | 136 | | | USD | | | 25 | | | JPMorgan Chase Bank NA | | | 06/19/24 | | | $ | (1,060 | ) | | $ | — | | | $ | (1,060 | ) |
| | | | | | | | | | | | | | | | | | | | | | | | | | | | | | | | | | |
| | (a) | At expiration date, the notional amount delivered will be exchanged for the notional amount received. | |
OTC Credit Default Swaps — Buy Protection
| | | | | | | | | | | | | | | | | | | | | | | | | | | | | | | | |
| Reference Obligation/Index | | Financing
Rate Paid
by the Fund | | | Payment
Frequency | | | Counterparty | | Termination
Date | | | Notional
Amount (000) | | | Value | | | Upfront
Premium
Paid
(Received) | | | Unrealized
Appreciation
(Depreciation) | |
United Mexican States | | | 1.00 | % | | | Quarterly | | | JPMorgan Chase Bank NA | | | 06/20/20 | | | USD | | | 209 | | | $ | (412 | ) | | $ | 557 | | | $ | (969 | ) |
United Mexican States | | | 1.00 | | | | Quarterly | | | Bank of America NA | | | 09/20/20 | | | USD | | | 209 | | | | (370 | ) | | | 923 | | | | (1,293 | ) |
Federative Republic of Brazil | | | 1.00 | | | | Quarterly | | | Barclays Bank plc | | | 12/20/23 | | | USD | | | 45 | | | | 2,170 | | | | 2,072 | | | | 98 | |
Federative Republic of Brazil | | | 1.00 | | | | Quarterly | | | Barclays Bank plc | | | 12/20/23 | | | USD | | | 39 | | | | 1,865 | | | | 1,699 | | | | 166 | |
Federative Republic of Brazil | | | 1.00 | | | | Quarterly | | | Barclays Bank plc | | | 12/20/23 | | | USD | | | 77 | | | | 3,682 | | | | 3,387 | | | | 295 | |
Federative Republic of Brazil | | | 1.00 | | | | Quarterly | | | Barclays Bank plc | | | 12/20/23 | | | USD | | | 76 | | | | 3,635 | | | | 3,343 | | | | 292 | |
Federative Republic of Brazil | | | 1.00 | | | | Quarterly | | | Barclays Bank plc | | | 12/20/23 | | | USD | | | 39 | | | | 1,865 | | | | 1,732 | | | | 133 | |
Federative Republic of Brazil | | | 1.00 | | | | Quarterly | | | Barclays Bank plc | | | 12/20/23 | | | USD | | | 38 | | | | 1,817 | | | | 1,688 | | | | 129 | |
Federative Republic of Brazil | | | 1.00 | | | | Quarterly | | | Barclays Bank plc | | | 12/20/23 | | | USD | | | 39 | | | | 1,865 | | | | 1,746 | | | | 119 | |
Federative Republic of Brazil | | | 1.00 | | | | Quarterly | | | Barclays Bank plc | | | 12/20/23 | | | USD | | | 38 | | | | 1,817 | | | | 1,645 | | | | 172 | |
Federative Republic of Brazil | | | 1.00 | | | | Quarterly | | | Barclays Bank plc | | | 12/20/23 | | | USD | | | 38 | | | | 1,817 | | | | 1,655 | | | | 162 | |
Federative Republic of Brazil | | | 1.00 | | | | Quarterly | | | Barclays Bank plc | | | 12/20/23 | | | USD | | | 38 | | | | 1,817 | | | | 1,637 | | | | 180 | |
Federative Republic of Brazil | | | 1.00 | | | | Quarterly | | | Barclays Bank plc | | | 12/20/23 | | | USD | | | 39 | | | | 1,848 | | | | 1,773 | | | | 75 | |
Federative Republic of Brazil | | | 1.00 | | | | Quarterly | | | Barclays Bank plc | | | 12/20/23 | | | USD | | | 38 | | | | 1,817 | | | | 1,655 | | | | 162 | |
Federative Republic of Brazil | | | 1.00 | | | | Quarterly | | | Barclays Bank plc | | | 12/20/23 | | | USD | | | 38 | | | | 1,817 | | | | 1,655 | | | | 162 | |
Federative Republic of Brazil | | | 1.00 | | | | Quarterly | | | Barclays Bank plc | | | 12/20/23 | | | USD | | | 39 | | | | 1,865 | | | | 1,680 | | | | 185 | |
Federative Republic of Brazil | | | 1.00 | | | | Quarterly | | | Barclays Bank plc | | | 12/20/23 | | | USD | | | 39 | | | | 1,865 | | | | 1,699 | | | | 166 | |
Federative Republic of Brazil | | | 1.00 | | | | Quarterly | | | Goldman Sachs International | | | 12/20/23 | | | USD | | | 90 | | | | 4,305 | | | | 7,633 | | | | (3,328 | ) |
Federative Republic of Brazil | | | 1.00 | | | | Quarterly | | | Goldman Sachs International | | | 12/20/23 | | | USD | | | 25 | | | | 1,196 | | | | 1,108 | | | | 88 | |
Federative Republic of Brazil | | | 1.00 | | | | Quarterly | | | Goldman Sachs International | | | 12/20/23 | | | USD | | | 50 | | | | 2,391 | | | | 4,241 | | | | (1,850 | ) |
Federative Republic of Brazil | | | 1.00 | | | | Quarterly | | | HSBC Bank plc | | | 12/20/23 | | | USD | | | 390 | | | | 18,643 | | | | 33,145 | | | | (14,502 | ) |
Republic of Colombia | | | 1.00 | | | | Quarterly | | | Bank of America NA | | | 12/20/23 | | | USD | | | 22 | | | | 567 | | | | 240 | | | | 327 | |
Republic of Colombia | | | 1.00 | | | | Quarterly | | | Barclays Bank plc | | | 12/20/23 | | | USD | | | 37 | | | | 953 | | | | 708 | | | | 245 | |
Republic of Colombia | | | 1.00 | | | | Quarterly | | | Barclays Bank plc | | | 12/20/23 | | | USD | | | 37 | | | | 953 | | | | 708 | | | | 245 | |
Republic of Colombia | | | 1.00 | | | | Quarterly | | | BNP Paribas SA | | | 12/20/23 | | | USD | | | 39 | | | | 996 | | | | 654 | | | | 342 | |
Republic of Colombia | | | 1.00 | | | | Quarterly | | | BNP Paribas SA | | | 12/20/23 | | | USD | | | 36 | | | | 918 | | | | 556 | | | | 362 | |
Republic of Colombia | | | 1.00 | | | | Quarterly | | | Citibank NA | | | 12/20/23 | | | USD | | | 36 | | | | 926 | | | | 688 | | | | 238 | |
Republic of Colombia | | | 1.00 | | | | Quarterly | | | Citibank NA | | | 12/20/23 | | | USD | | | 37 | | | | 953 | | | | 732 | | | | 221 | |
Republic of Colombia | | | 1.00 | | | | Quarterly | | | Citibank NA | | | 12/20/23 | | | USD | | | 36 | | | | 926 | | | | 728 | | | | 198 | |
Republic of Colombia | | | 1.00 | | | | Quarterly | | | Citibank NA | | | 12/20/23 | | | USD | | | 12 | | | | 309 | | | | 224 | | | | 85 | |
Republic of Colombia | | | 1.00 | | | | Quarterly | | | Citibank NA | | | 12/20/23 | | | USD | | | 37 | | | | 953 | | | | 691 | | | | 262 | |
Republic of Colombia | | | 1.00 | | | | Quarterly | | | Deutsche Bank AG | | | 12/20/23 | | | USD | | | 38 | | | | 978 | | | | 727 | | | | 251 | |
Republic of the Philippines | | | 1.00 | | | | Quarterly | | | BNP Paribas SA | | | 12/20/23 | | | USD | | | 254 | | | | (1,660 | ) | | | (1,194 | ) | | | (466 | ) |
Republic of the Philippines | | | 1.00 | | | | Quarterly | | | Morgan Stanley & Co. International plc | | | 12/20/23 | | | USD | | | 15 | | | | (98 | ) | | | (77 | ) | | | (21 | ) |
United Mexican States | | | 1.00 | | | | Quarterly | | | Barclays Bank plc | | | 12/20/23 | | | USD | | | 59 | | | | 1,469 | | | | 464 | | | | 1,005 | |
United Mexican States | | | 1.00 | | | | Quarterly | | | Barclays Bank plc | | | 12/20/23 | | | USD | | | 30 | | | | 747 | | | | 229 | | | | 518 | |
United Mexican States | | | 1.00 | | | | Quarterly | | | Barclays Bank plc | | | 12/20/23 | | | USD | | | 75 | | | | 1,868 | | | | 573 | | | | 1,295 | |
United Mexican States | | | 1.00 | | | | Quarterly | | | BNP Paribas SA | | | 12/20/23 | | | USD | | | 30 | | | | 747 | | | | 241 | | | | 506 | |
United Mexican States | | | 1.00 | | | | Quarterly | | | BNP Paribas SA | | | 12/20/23 | | | USD | | | 30 | | | | 747 | | | | 664 | | | | 83 | |
United Mexican States | | | 1.00 | | | | Quarterly | | | BNP Paribas SA | | | 12/20/23 | | | USD | | | 30 | | | | 747 | | | | 241 | | | | 506 | |
United Mexican States | | | 1.00 | | | | Quarterly | | | BNP Paribas SA | | | 12/20/23 | | | USD | | | 36 | | | | 897 | | | | 796 | | | | 101 | |
United Mexican States | | | 1.00 | | | | Quarterly | | | BNP Paribas SA | | | 12/20/23 | | | USD | | | 30 | | | | 747 | | | | 241 | | | | 506 | |
United Mexican States | | | 1.00 | | | | Quarterly | | | BNP Paribas SA | | | 12/20/23 | | | USD | | | 30 | | | | 747 | | | | 228 | | | | 519 | |
United Mexican States | | | 1.00 | | | | Quarterly | | | BNP Paribas SA | | | 12/20/23 | | | USD | | | 36 | | | | 897 | | | | 796 | | | | 101 | |
United Mexican States | | | 1.00 | | | | Quarterly | | | BNP Paribas SA | | | 12/20/23 | | | USD | | | 21 | | | | 523 | | | | 201 | | | | 322 | |
United Mexican States | | | 1.00 | | | | Quarterly | | | Citibank NA | | | 12/20/23 | | | USD | | | 29 | | | | 722 | | | | 169 | | | | 553 | |
United Mexican States | | | 1.00 | | | | Quarterly | | | Citibank NA | | | 12/20/23 | | | USD | | | 37 | | | | 922 | | | | 806 | | | | 116 | |
United Mexican States | | | 1.00 | | | | Quarterly | | | Citibank NA | | | 12/20/23 | | | USD | | | 100 | | | | 2,491 | | | | 2,190 | | | | 301 | |
| | | | |
| SCHEDULES OF INVESTMENTS | | | 55 | |
| | |
Schedule of Investments (continued) December 31, 2018 | | BlackRock Balanced Capital Portfolio |
| | | | | | | | | | | | | | | | | | | | | | | | | | | | | | | | | | |
| Reference Obligation/Index | | Financing
Rate Paid
by the Fund | | | Payment
Frequency | | | Counterparty | | Termination
Date | | | Notional
Amount (000) | | | Value | | | Upfront
Premium
Paid
(Received) | | | Unrealized
Appreciation
(Depreciation) | |
United Mexican States | | | 1.00 | % | | | Quarterly | | | Citibank NA | | | 12/20/23 | | | | USD | | | | 37 | | | $ | 922 | | | $ | 838 | | | $ | 84 | |
United Mexican States | | | 1.00 | | | | Quarterly | | | Citibank NA | | | 12/20/23 | | | | USD | | | | 37 | | | | 922 | | | | 733 | | | | 189 | |
United Mexican States | | | 1.00 | | | | Quarterly | | | Citibank NA | | | 12/20/23 | | | | USD | | | | 50 | | | | 1,245 | | | | 480 | | | | 765 | |
United Mexican States | | | 1.00 | | | | Quarterly | | | Citibank NA | | | 12/20/23 | | | | USD | | | | 44 | | | | 1,097 | | | | 1,036 | | | | 61 | |
United Mexican States | | | 1.00 | | | | Quarterly | | | Citibank NA | | | 12/20/23 | | | | USD | | | | 29 | | | | 722 | | | | 215 | | | | 507 | |
United Mexican States | | | 1.00 | | | | Quarterly | | | Citibank NA | | | 12/20/23 | | | | USD | | | | 37 | | | | 922 | | | | 708 | | | | 214 | |
United Mexican States | | | 1.00 | | | | Quarterly | | | Citibank NA | | | 12/20/23 | | | | USD | | | | 29 | | | | 722 | | | | 156 | | | | 566 | |
United Mexican States | | | 1.00 | | | | Quarterly | | | Citibank NA | | | 12/20/23 | | | | USD | | | | 80 | | | | 1,992 | | | | 767 | | | | 1,225 | |
United Mexican States | | | 1.00 | | | | Quarterly | | | Citibank NA | | | 12/20/23 | | | | USD | | | | 44 | | | | 1,102 | | | | 789 | | | | 313 | |
United Mexican States | | | 1.00 | | | | Quarterly | | | Citibank NA | | | 12/20/23 | | | | USD | | | | 34 | | | | 847 | | | | 190 | | | | 657 | |
United Mexican States | | | 1.00 | | | | Quarterly | | | Citibank NA | | | 12/20/23 | | | | USD | | | | 18 | | | | 447 | | | | 140 | | | | 307 | |
United Mexican States | | | 1.00 | | | | Quarterly | | | Citibank NA | | | 12/20/23 | | | | USD | | | | 30 | | | | 747 | | | | 181 | | | | 566 | |
United Mexican States | | | 1.00 | | | | Quarterly | | | Deutsche Bank AG | | | 12/20/23 | | | | USD | | | | 28 | | | | 698 | | | | 274 | | | | 424 | |
United Mexican States | | | 1.00 | | | | Quarterly | | | Deutsche Bank AG | | | 12/20/23 | | | | USD | | | | 28 | | | | 698 | | | | 274 | | | | 424 | |
United Mexican States | | | 1.00 | | | | Quarterly | | | Morgan Stanley & Co. International plc | | | 12/20/23 | | | | USD | | | | 20 | | | | 498 | | | | 206 | | | | 292 | |
United Mexican States | | | 1.00 | | | | Quarterly | | | Morgan Stanley & Co. International plc | | | 12/20/23 | | | | USD | | | | 29 | | | | 722 | | | | 240 | | | | 482 | |
CMBX.NA.9.A | | | 2.00 | | | | Monthly | | | Citigroup Global Markets, Inc. | | | 09/17/58 | | | | USD | | | | 20 | | | | 805 | | | | 370 | | | | 435 | |
CMBX.NA.9.A | | | 2.00 | | | | Monthly | | | Credit Suisse International | | | 09/17/58 | | | | USD | | | | 32 | | | | 1,288 | | | | 500 | | | | 788 | |
CMBX.NA.9.A | | | 2.00 | | | | Monthly | | | Credit Suisse International | | | 09/17/58 | | | | USD | | | | 50 | | | | 2,012 | | | | 852 | | | | 1,160 | |
CMBX.NA.9.AAA | | | 0.50 | | | | Monthly | | | Credit Suisse International | | | 09/17/58 | | | | USD | | | | 60 | | | | 220 | | | | 709 | | | | (489 | ) |
CMBX.NA.9.A | | | 2.00 | | | | Monthly | | | Credit Suisse International | | | 09/17/58 | | | | USD | | | | 20 | | | | 805 | | | | 346 | | | | 459 | |
CMBX.NA.9.AAA | | | 0.50 | | | | Monthly | | | Deutsche Bank AG | | | 09/17/58 | | | | USD | | | | 50 | | | | 183 | | | | 600 | | | | (417 | ) |
CMBX.NA.9.A | | | 2.00 | | | | Monthly | | | Goldman Sachs International | | | 09/17/58 | | | | USD | | | | 10 | | | | 403 | | | | 184 | | | | 219 | |
CMBX.NA.9.AAA | | | 0.50 | | | | Monthly | | | Morgan Stanley & Co. International plc | | | 09/17/58 | | | | USD | | | | 40 | | | | 147 | | | | 474 | | | | (327 | ) |
CMBX.NA.9.AAA | | | 0.50 | | | | Monthly | | | Morgan Stanley & Co. International plc | | | 09/17/58 | | | | USD | | | | 110 | | | | 403 | | | | 1,400 | | | | (997 | ) |
CMBX.NA.9.AAA | | | 0.50 | | | | Monthly | | | Morgan Stanley & Co. International plc | | | 09/17/58 | | | | USD | | | | 50 | | | | 183 | | | | 592 | | | | (409 | ) |
CMBX.NA.6.AAA | | | 0.50 | | | | Monthly | | | Deutsche Bank AG | | | 05/11/63 | | | | USD | | | | 100 | | | | (604 | ) | | | (73 | ) | | | (531 | ) |
CMBX.NA.6.AAA | | | 0.50 | | | | Monthly | | | Deutsche Bank AG | | | 05/11/63 | | | | USD | | | | 70 | | | | (422 | ) | | | (9 | ) | | | (413 | ) |
CMBX.NA.6.AAA | | | 0.50 | | | | Monthly | | | Deutsche Bank AG | | | 05/11/63 | | | | USD | | | | 120 | | | | (724 | ) | | | — | | | | (724 | ) |
CMBX.NA.6.BBB- | | | 3.00 | | | | Monthly | | | JPMorgan Securities LLC | | | 05/11/63 | | | | USD | | | | 20 | | | | 3,215 | | | | 1,897 | | | | 1,318 | |
| | | | | | | | | | | | | | | | | | | | | | | | | | | | | | | | | | |
| | | | | | | | | | | | | | | | | | | | | | | | $ | 101,477 | | | $ | 104,966 | | | $ | (3,489 | ) |
| | | | | | | | | | | | | | | | | | | | | | | | | | | | | | | | | | |
OTC Credit Default Swaps — Sell Protection
| | | | | | | | | | | | | | | | | | | | | | | | | | | | | | | | | | | | | | |
| Reference Obligation/Index | | Financing
Rate Received
by the Fund | | | Payment
Frequency | | | Counterparty | | | Termination
Date | | | Credit
Rating (a) | | Notional
Amount (000) (b) | | | Value | | | Upfront
Premium
Paid
(Received) | | | Unrealized
Appreciation
(Depreciation) | |
United Mexican States | | | 1.00 | % | | | Quarterly | | | | Bank of America NA | | | | 06/20/20 | | | BBB+ | | | USD | | | | 209 | | | $ | 412 | | | $ | (643 | ) | | $ | 1,055 | |
United Mexican States | | | 1.00 | | | | Quarterly | | | | JPMorgan Chase Bank NA | | | | 09/20/20 | | | BBB+ | | | USD | | | | 209 | | | | 370 | | | | (807 | ) | | | 1,177 | |
CMBX.NA.3.AM | | | 0.50 | | | | Monthly | | | | Credit Suisse International | | | | 12/13/49 | | | NR | | | USD | | | | 670 | | | | (88 | ) | | | (2,615 | ) | | | 2,527 | |
CMBX.NA.3.AM | | | 0.50 | | | | Monthly | | | | Goldman Sachs International | | | | 12/13/49 | | | NR | | | USD | | | | 1,320 | | | | (174 | ) | | | (5,217 | ) | | | 5,043 | |
CMBX.NA.4.AM | | | 0.50 | | | | Monthly | | | | Deutsche Bank AG | | | | 02/17/51 | | | NR | | | USD | | | | 120 | | | | (1 | ) | | | (24 | ) | | | 23 | |
CMBX.NA.8.A | | | 2.00 | | | | Monthly | | | | Goldman Sachs International | | | | 10/17/57 | | | A3 | | | USD | | | | 30 | | | | (1,110 | ) | | | (1,624 | ) | | | 514 | |
CMBX.NA.8.A | | | 2.00 | | | | Monthly | | | | Goldman Sachs International | | | | 10/17/57 | | | A3 | | | USD | | | | 20 | | | | (740 | ) | | | (1,953 | ) | | | 1,213 | |
CMBX.NA.9.BBB- | | | 3.00 | | | | Monthly | | | | Credit Suisse International | | | | 09/17/58 | | | NR | | | USD | | | | 44 | | | | (5,321 | ) | | | (3,810 | ) | | | (1,511 | ) |
CMBX.NA.9.BBB- | | | 3.00 | | | | Monthly | | | | Deutsche Bank AG | | | | 09/17/58 | | | NR | | | USD | | | | 23 | | | | (2,781 | ) | | | (2,749 | ) | | | (32 | ) |
CMBX.NA.9.BBB- | | | 3.00 | | | | Monthly | | | | Deutsche Bank AG | | | | 09/17/58 | | | NR | | | USD | | | | 30 | | | | (3,628 | ) | | | (3,179 | ) | | | (449 | ) |
CMBX.NA.9.BBB- | | | 3.00 | | | | Monthly | | | | JPMorgan Securities LLC | | | | 09/17/58 | | | NR | | | USD | | | | 12 | | | | (1,451 | ) | | | (1,048 | ) | | | (403 | ) |
CMBX.NA.9.BBB- | | | 3.00 | | | | Monthly | | | | Morgan Stanley & Co. International plc | | | | 09/17/58 | | | NR | | | USD | | | | 21 | | | | (2,539 | ) | | | (2,470 | ) | | | (69 | ) |
CMBX.NA.10.BBB- | | | 3.00 | | | | Monthly | | | | JPMorgan Securities LLC | | | | 11/17/59 | | | BBB- | | | USD | | | | 5 | | | | (572 | ) | | | (426 | ) | | | (146 | ) |
CMBX.NA.6.BBB- | | | 3.00 | | | | Monthly | | | | Credit Suisse International | | | | 05/11/63 | | | BBB | | | USD | | | | 20 | | | | (3,215 | ) | | | (1,568 | ) | | | (1,647 | ) |
| | | | | | | | | | | | | | | | | | | | | | | | | | | | | | | | | | | | | | |
| | | | | | | | | | | | | | | | | | | | | | | | | | | | $ | (20,838 | ) | | $ | (28,133 | ) | | $ | 7,295 | |
| | | | | | | | | | | | | | | | | | | | | | | | | | | | | | | | | | | | | | |
| | (a) | Using S&P’s rating of the issuer or the underlying securities of the index, as applicable. | |
| | (b) | The maximum potential amount the Fund may pay should a negative credit event take place as defined under the terms of the agreement. | |
| | |
| 56 | | 2018 BLACKROCK ANNUAL REPORTTO SHAREHOLDERS |
| | |
Schedule of Investments (continued) December 31, 2018 | | BlackRock Balanced Capital Portfolio |
OTC Interest Rate Swaps
| | | | | | | | | | | | | | | | | | | | | | | | | | | | | | | | | | |
| Paid by the Fund | | Received by the Fund | | Counterparty | | Termination
Date | | | Notional
Amount (000) | | | Value | | | Upfront
Premium
Paid
(Received) | | | Unrealized
Appreciation
(Depreciation) | |
| Rate | | Frequency | | Rate | | | Frequency |
| 1 day BZDIOVER | | At Termination | | | 7.46% | | | At Termination | | Bank of America NA | | | 01/04/21 | | | | BRL | | | | 731 | | | $ | 496 | | | $ | — | | | $ | 496 | |
| 1 day BZDIOVER | | At Termination | | | 7.48% | | | At Termination | | Bank of America NA | | | 01/04/21 | | | | BRL | | | | 2,550 | | | | 1,978 | | | | — | | | | 1,978 | |
| 1 day BZDIOVER | | At Termination | | | 7.42% | | | At Termination | | Credit Suisse International | | | 01/04/21 | | | | BRL | | | | 1,274 | | | | 596 | | | | — | | | | 596 | |
| 1 day BZDIOVER | | At Termination | | | 7.43% | | | At Termination | | JPMorgan Chase Bank NA | | | 01/04/21 | | | | BRL | | | | 545 | | | | 282 | | | | — | | | | 282 | |
| 3.27% | | Semi-Annual | | | 3 month LIBOR | | | Quarterly | | Deutsche Bank AG | | | 05/16/21 | | | | USD | | | | 550 | | | | (8,676 | ) | | | — | | | | (8,676 | ) |
| 1 day BZDIOVER | | At Termination | | | 8.53% | | | At Termination | | Citibank NA | | | 01/02/23 | | | | BRL | | | | 1,520 | | | | 1,856 | | | | — | | | | 1,856 | |
| 5.73% | | Monthly | | | 28 day MXIBTIIE | | | Monthly | | Bank of America NA | | | 01/03/25 | | | | MXN | | | | 940 | | | | 6,652 | | | | — | | | | 6,652 | |
| 28 day MXIBTIIE | | Monthly | | | 6.43% | | | Monthly | | Bank of America NA | | | 06/06/25 | | | | MXN | | | | 836 | | | | (4,745 | ) | | | — | | | | (4,745 | ) |
| 28 day MXIBTIIE | | Monthly | | | 6.33% | | | Monthly | | Citibank NA | | | 07/17/25 | | | | MXN | | | | 1,010 | | | | (6,122 | ) | | | — | | | | (6,122 | ) |
| 6.31% | | Monthly | | | 28 day MXIBTIIE | | | Monthly | | Deutsche Bank AG | | | 08/11/25 | | | | MXN | | | | 3,807 | | | | 23,500 | | | | — | | | | 23,500 | |
| 28 day MXIBTIIE | | Monthly | | | 6.27% | | | Monthly | | Bank of America NA | | | 12/05/25 | | | | MXN | | | | 116 | | | | (754 | ) | | | — | | | | (754 | ) |
| | | | | | | | | | | | | | | | | | | | | | | | | | | | | | | | | | |
| | | | | | | | | | | | | | | | | | | | | | | | $ | 15,063 | | | $ | — | | | $ | 15,063 | |
| | | | | | | | | | | | | | | | | | | | | | | | | | | | | | | | | | |
The following reference rates, and their values as of period end, are used for security descriptions:
| | | | |
| Reference Index | | | | Reference rate |
1 day BZDIOVER | | Overnight Brazil CETIP — Interbank Rate | | 0.25% |
28 day MXIBTIIE | | Mexico Interbank TIIE28-Day | | 8.41% |
3 month LIBOR | | London Interbank Offered Rate | | 2.81% |
6 month EURIBOR | | Euro Interbank Offered Rate | | (0.24%) |
Balances Reported in the Statements of Assets and Liabilities for Centrally Cleared Swaps, OTC Swaps and Options Written
| | | | | | | | | | | | | | | | | | | | |
| | | Swap
Premiums
Paid | | | Swap
Premiums
Received | | | Unrealized
Appreciation | | | Unrealized
Depreciation | | | Value | |
Centrally Cleared Swaps(a) | | $ | 2,765 | | | $ | (848 | ) | | $ | 112,761 | | | $ | (122,703 | ) | | $ | — | |
OTC Swaps | | | 106,319 | | | | (29,486 | ) | | | 70,159 | | | | (52,350 | ) | | | — | |
Options Written | | | N/A | | | | N/A | | | | 33,965 | | | | (61,560 | ) | | | (125,793 | ) |
| | (a) | Includes cumulative appreciation (depreciation) on centrally cleared swaps, as reported in the Schedule of Investments. Only current day’s variation margin is reported within the Statements of Assets and Liabilities and is net of any previously paid (received) swap premium amounts. | |
Derivative Financial Instruments Categorized by Risk Exposure
As of period end, the fair values of derivative financial instruments located in the Statements of Assets and Liabilities were as follows:
| | | | | | | | | | | | | | | | | | | | | | | | | | | | |
| | | Commodity
Contracts | | | Credit
Contracts | | | Equity
Contracts | | | Foreign
Currency
Exchange
Contracts | | | Interest
Rate
Contracts | | | Other
Contracts | | | Total | |
Assets — Derivative Financial Instruments | | | | | | | | | | | | | | | | | | | | | | | | | | | | |
Futures contracts | | | | | | | | | | | | | | | | | | | | | | | | | | | | |
Net unrealized appreciation(a) | | $ | — | | | $ | — | | | $ | — | | | $ | — | | | $ | 957,761 | | | $ | — | | | $ | 957,761 | |
Forward foreign currency exchange contracts | | | | | | | | | | | | | | | | | | | | | | | | | | | | |
Unrealized appreciation on forward foreign currency exchange contracts | | | — | | | | — | | | | — | | | | 202,348 | | | | — | | | | — | | | | 202,348 | |
Options purchased | | | | | | | | | | | | | | | | | | | | | | | | | | | | |
Investments at value — unaffiliated(b) | | | — | | | | — | | | | — | | | | 46,399 | | | | 275,901 | | | | — | | | | 322,300 | |
Swaps — centrally cleared | | | | | | | | | | | | | | | | | | | | | | | | | | | | |
Net unrealized appreciation(a) | | | — | | | | — | | | | — | | | | — | | | | 109,870 | | | | 2,891 | | | | 112,761 | |
Swaps — OTC | | | | | | | | | | | | | | | | | | | | | | | | | | | | |
Unrealized appreciation on OTC swaps;
Swap premiums paid | | | — | | | | 141,118 | | | | — | | | | — | | | | 35,360 | | | | — | | | | 176,478 | |
| | | | | | | | | | | | | | | | | | | | | | | | | | | | |
| | $ | — | | | $ | 141,118 | | | $ | — | | | $ | 248,747 | | | $ | 1,378,892 | | | $ | 2,891 | | | $ | 1,771,648 | |
| | | | | | | | | | | | | | | | | | | | | | | | | | | | |
| | | | |
| SCHEDULES OF INVESTMENTS | | | 57 | |
| | |
Schedule of Investments (continued) December 31, 2018 | | BlackRock Balanced Capital Portfolio |
| | | | | | | | | | | | | | | | | | | | | | | | | | | | |
| | | Commodity
Contracts | | | Credit
Contracts | | | Equity
Contracts | | | Foreign
Currency
Exchange
Contracts | | | Interest
Rate
Contracts | | | Other
Contracts | | | Total | |
| | | | | | | |
| Liabilities — Derivative Financial Instruments | | | | | | | | | | | | | | | | | | | | | |
Futures contracts | | | | | | | | | | | | | | | | | | | | | | | | | | | | |
Net unrealized depreciation(a) | | $ | — | | | $ | — | | | $ | 1,127,131 | | | $ | — | | | $ | 79,944 | | | $ | — | | | $ | 1,207,075 | |
Forward foreign currency exchange contracts | | | | | | | | | | | | | | | | | | | | | | | | | | | | |
Unrealized depreciation on forward foreign currency exchange contracts | | | — | | | | — | | | | — | | | | 419,711 | | | | — | | | | — | | | | 419,711 | |
Options written | | | | | | | | | | | | | | | | | | | | | | | | | | | | |
Options written, at value | | | — | | | | — | | | | — | | | | 44,410 | | | | 81,383 | | | | — | | | | 125,793 | |
Swaps — centrally cleared | | | | | | | | | | | | | | | | | | | | | | | | | | | | |
Net unrealized depreciation(a) | | | — | | | | — | | | | — | | | | — | | | | 122,703 | | | | — | | | | 122,703 | |
Swaps — OTC | | | | | | | | | | | | | | | | | | | | | | | | | | | | |
Unrealized depreciation on OTC swaps;
Swap premiums received | | | — | | | | 60,479 | | | | — | | | | 1,060 | | | | 20,297 | | | | — | | | | 81,836 | |
| | | | | | | | | | | | | | | | | | | | | | | | | | | | |
| | $ | — | | | $ | 60,479 | | | $ | 1,127,131 | | | $ | 465,181 | | | $ | 304,327 | | | $ | — | | | $ | 1,957,118 | |
| | | | | | | | | | | | | | | | | | | | | | | | | | | | |
| | (a) | Includes cumulative appreciation (depreciation) on futures contracts and centrally cleared swaps, if any, as reported in the Schedule of Investments. Only current day’s variation margin is reported within the Statements of Assets and Liabilities. | |
| | (b) | Includes options purchased at value as reported in the Schedule of Investments. | |
For the year ended December 31, 2018, the effect of derivative financial instruments in the Statements of Operations were as follows:
| | | | | | | | | | | | | | | | | | | | | | | | | | | | |
| | | Commodity
Contracts | | | Credit
Contracts | | | Equity
Contracts | | | Foreign
Currency
Exchange
Contracts | | | Interest
Rate
Contracts | | | Other
Contracts | | | Total | |
Net Realized Gain (Loss) from: | | | | | | | | | | | | | | | | | | | | | | | | | | | | |
Futures contracts | | $ | — | | | $ | — | | | $ | 23,459 | | | $ | — | | | $ | 1,840,093 | | | $ | — | | | $ | 1,863,552 | |
Forward foreign currency exchange contracts | | | — | | | | — | | | | — | | | | (270,333 | ) | | | — | | | | — | | | | (270,333 | ) |
Options purchased(a) | | | — | | | | — | | | | — | | | | (335,780 | ) | | | (81,192 | ) | | | — | | | | (416,972 | ) |
Options written | | | — | | | | — | | | | 22,049 | | | | 199,590 | | | | 284,541 | | | | — | | | | 506,180 | |
Swaps | | | — | | | | 9,827 | | | | — | | | | (4,210 | ) | | | (54,870 | ) | | | (14,794 | ) | | | (64,047 | ) |
| | | | | | | | | | | | | | | | | | | | | | | | | | | | |
| | $ | — | | | $ | 9,827 | | | $ | 45,508 | | | $ | (410,733 | ) | | $ | 1,988,572 | | | $ | (14,794 | ) | | $ | 1,618,380 | |
| | | | | | | | | | | | | | | | | | | | | | | | | | | | |
|
| Net Change in Unrealized Appreciation (Depreciation) on: | |
Futures contracts | | $ | — | | | $ | — | | | $ | (1,131,351 | ) | | $ | — | | | $ | 1,444,834 | | | $ | — | | | $ | 313,483 | |
Forward foreign currency exchange contracts | | | — | | | | — | | | | — | | | | (142,115 | ) | | | — | | | | — | | | | (142,115 | ) |
Options purchased(b) | | | — | | | | — | | | | — | | | | 92,516 | | | | 138,772 | | | | — | | | | 231,288 | |
Options written | | | — | | | | — | | | | — | | | | (71,057 | ) | | | (84,931 | ) | | | — | | | | (155,988 | ) |
Swaps | | | — | | | | 3,542 | | | | — | | | | (1,060 | ) | | | 109,438 | | | | (1,551 | ) | | | 110,369 | |
| | | | | | | | | | | | | | | | | | | | | | | | | | | | |
| | $ | — | | | $ | 3,542 | | | $ | (1,131,351 | ) | | $ | (121,716 | ) | | $ | 1,608,113 | | | $ | (1,551 | ) | | $ | 357,037 | |
| | | | | | | | | | | | | | | | | | | | | | | | | | | | |
| | (a) | Options purchased are included in net realized gain (loss) from investments — unaffiliated. | |
| | (b) | Options purchased are included in net change in unrealized appreciation (depreciation) on investments — unaffiliated. | |
Derivative Financial Instruments — Offsetting as of Period End
The Fund’s derivative assets and liabilities (by type) were as follows:
| | | | | | | | |
| | | Assets | | | Liabilities | |
Derivative Financial Instruments: | | | | | | | | |
Futures contracts | | $ | 506,768 | | | $ | 22,364 | |
Forward foreign currency exchange contracts | | | 202,348 | | | | 419,711 | |
Options(a) | | | 322,300 | | | | 125,793 | |
Swaps — Centrally cleared | | | 5,530 | | | | — | |
Swaps — OTC(b) | | | 176,478 | | | | 81,836 | |
| | | | | | | | |
Total derivative assets and liabilities in the Statements of Assets and Liabilities | | $ | 1,213,424 | | | $ | 649,704 | |
Derivatives not subject to a Master Netting Agreement or similar agreement (“MNA”) | | | (512,298 | ) | | | (22,364 | ) |
| | | | | | | | |
Total derivative assets and liabilities subject to an MNA | | $ | 701,126 | | | $ | 627,340 | |
| | | | | | | | |
| | (a) | Includes options purchased at value which is included in Investments at value — unaffiliated in the Statements of Assets and Liabilities and reported in the Schedule of Investments. | |
| | (b) | Includes unrealized appreciation (depreciation) on OTC swaps and swap premiums (paid/received) in the Statements of Assets and Liabilities. | |
| | |
| 58 | | 2018 BLACKROCK ANNUAL REPORTTO SHAREHOLDERS |
| | |
Schedule of Investments (continued) December 31, 2018 | | BlackRock Balanced Capital Portfolio |
The following tables present the Fund’s derivative assets and liabilities by counterparty net of amounts available for offset under an MNA and net of the related collateral received and pledged by the Fund:
| | | | | | | | | | | | | | | | | | | | |
| Counterparty | | Derivative
Assets
Subject to
an MNA by
Counterparty | | | Derivatives
Available
for Offset (a) | | | Non-cash
Collateral
Received | | | Cash
Collateral
Received | | | Net Amount
of Derivative
Assets (b) | |
Bank of America NA | | $ | 48,097 | | | $ | (10,236 | ) | | $ | — | | | $ | — | | | $ | 37,861 | |
Barclays Bank plc | | | 59,905 | | | | — | | | | — | | | | — | | | | 59,905 | |
BNP Paribas SA | | | 9,525 | | | | (5,875 | ) | | | — | | | | — | | | | 3,650 | |
Citibank NA | | | 38,709 | | | | (38,709 | ) | | | — | | | | — | | | | — | |
Citigroup Global Markets, Inc. | | | 805 | | | | — | | | | — | | | | — | | | | 805 | |
Credit Suisse International | | | 7,937 | | | | (7,937 | ) | | | — | | | | — | | | | — | |
Deutsche Bank AG | | | 173,565 | | | | (19,056 | ) | | | — | | | | — | | | | 154,509 | |
Goldman Sachs International | | | 22,350 | | | | (18,002 | ) | | | — | | | | — | | | | 4,348 | |
HSBC Bank plc | | | 64,990 | | | | (14,802 | ) | | | — | | | | — | | | | 50,188 | |
JPMorgan Chase Bank NA | | | 267,144 | | | | (157,055 | ) | | | — | | | | — | | | | 110,089 | |
JPMorgan Securities LLC | | | 3,215 | | | | (2,023 | ) | | | — | | | | — | | | | 1,192 | |
Morgan Stanley & Co. International plc | | | 4,446 | | | | (4,446 | ) | | | — | | | | — | | | | — | |
Royal Bank of Scotland | | | 438 | | | | — | | | | — | | | | — | | | | 438 | |
| | | | | | | | | | | | | | | | | | | | |
| | $ | 701,126 | | | $ | (278,141 | ) | | $ | — | | | $ | — | | | $ | 422,985 | |
| | | | | | | | | | | | | | | | | | | | |
| | | | | | | | | | | | | | | | | | | | |
| Counterparty | | Derivative
Liabilities
Subject to
an MNA by
Counterparty | | | Derivatives
Available
for Offset (a) | | | Non-cash
Collateral
Pledged | | | Cash
Collateral
Pledged | | | Net Amount
of Derivative
Liabilities (c) | |
Bank of America NA | | $ | 10,236 | | | $ | (10,236 | ) | | $ | — | | | $ | — | | | $ | — | |
BNP Paribas SA | | | 5,875 | | | | (5,875 | ) | | | — | | | | — | | | | — | |
Citibank NA | | | 325,192 | | | | (38,709 | ) | | | — | | | | — | | | | 286,483 | |
Credit Suisse International | | | 11,640 | | | | (7,937 | ) | | | — | | | | — | | | | 3,703 | |
Deutsche Bank AG | | | 19,056 | | | | (19,056 | ) | | | — | | | | — | | | | — | |
Goldman Sachs International | | | 18,002 | | | | (18,002 | ) | | | — | | | | — | | | | — | |
HSBC Bank plc | | | 14,802 | | | | (14,802 | ) | | | — | | | | — | | | | — | |
JPMorgan Chase Bank NA | | | 157,055 | | | | (157,055 | ) | | | — | | | | — | | | | — | |
JPMorgan Securities LLC | | | 2,023 | | | | (2,023 | ) | | | — | | | | — | | | | — | |
Morgan Stanley & Co. International plc | | | 56,501 | | | | (4,446 | ) | | | — | | | | (52,055 | ) | | | — | |
Northern Trust Co. | | | 582 | | | | — | | | | — | | | | — | | | | 582 | |
Standard Chartered Bank | | | 2,547 | | | | — | | | | — | | | | — | | | | 2,547 | |
State Street Bank & Trust Co. | | | 48 | | | | — | | | | — | | | | — | | | | 48 | |
Toronto Dominion Bank | | | 87 | | | | — | | | | — | | | | — | | | | 87 | |
UBS AG | | | 3,694 | | | | — | | | | — | | | | — | | | | 3,694 | |
| | | | | | | | | | | | | | | | | | | | |
| | $ | 627,340 | | | $ | (278,141 | ) | | $ | — | | | $ | — | | | $ | 349,199 | |
| | | | | | | | | | | | | | | | | | | | |
| | (a) | The amount of derivatives available for offset is limited to the amount of derivative assets and/or liabilities that are subject to an MNA. | |
| | (b) | Net amount represents the net amount receivable from the counterparty in the event of default. | |
| | (c) | Net amount represents the net amount payable due to the counterparty in the event of default. | |
Average Quarterly Balances of Outstanding Derivative Financial Instruments
| | | | |
Futures contracts: | | | | |
Average notional value of contracts — long | | $ | 111,346,685 | |
Average notional value of contracts — short | | $ | 49,734,182 | |
Forward foreign currency exchange contracts: | | | | |
Average amounts purchased — in USD | | $ | 12,044,191 | |
Average amounts sold — in USD | | $ | 16,582,128 | |
Options: | | | | |
Average value of option contracts purchased | | $ | 80,924 | |
Average value of option contracts written | | $ | 44,855 | |
Average notional value of swaption contracts purchased | | $ | 5,175,750 | |
Average notional value of swaption contracts written | | $ | 31,462,500 | |
Credit default swaps: | | | | |
Average notional value — buy protection | | $ | 3,901,950 | |
Average notional value — sell protection | | $ | 2,791,982 | |
Interest rate swaps: | | | | |
Average notional value — pays fixed rate | | $ | 14,340,825 | |
Average notional value — receives fixed rate | | $ | 13,074,779 | |
| | | | |
| SCHEDULES OF INVESTMENTS | | | 59 | |
| | |
Schedule of Investments (continued) December 31, 2018 | | BlackRock Balanced Capital Portfolio |
| | | | |
Currency swaps: | | | | |
Average notional value — pays | | $ | 6,420 | |
Average notional value — receives | | $ | 6,345 | |
Inflation swaps: | | | | |
Average notional value — receives fixed rate | | $ | 561,061 | |
Total return swaps: | | | | |
Average notional value | | $ | 964,000 | |
For more information about the Fund’s investment risks regarding derivative financial instruments, refer to the Notes to Financial Statements.
Fair Value Hierarchy as of Period End
Various inputs are used in determining the fair value of investments and derivative financial instruments. For information about the Fund’s policy regarding valuation of investments and derivative financial instruments, refer to the Notes to Financial Statements.
The following tables summarize the Fund’s investments and derivative financial instruments categorized in the disclosure hierarchy:
| | | | | | | | | | | | | | | | |
| | | Level 1 | | | Level 2 | | | Level 3 | | | Total | |
Assets: | | | | | | | | | | | | | | | | |
Investments: | | | | | | | | | | | | | | | | |
Long-Term Investments: | | | | | | | | | | | | | | | | |
Asset-Backed Securities | | $ | — | | | $ | 18,860,319 | | | $ | 189,874 | | | $ | 19,050,193 | |
Common Stocks(a) | | | 270,072,542 | | | | — | | | | — | | | | 270,072,542 | |
Corporate Bonds(a) | | | — | | | | 59,207,281 | | | | — | | | | 59,207,281 | |
Foreign Agency Obligations | | | — | | | | 238,027 | | | | — | | | | 238,027 | |
Foreign Government Obligations | | | — | | | | 3,768,499 | | | | — | | | | 3,768,499 | |
Investment Companies | | | 1,789,184 | | | | — | | | | — | | | | 1,789,184 | |
Municipal Bonds | | | — | | | | 12,874,478 | | | | — | | | | 12,874,478 | |
Non-Agency Mortgage-Backed Securities | | | — | | | | 8,393,660 | | | | 1,406,639 | | | | 9,800,299 | |
Other Interests | | | — | | | | — | | | | — | | | | — | |
Preferred Securities(a) | | | — | | | | 307,717 | | | | — | | | | 307,717 | |
U.S. Government Sponsored Agency Securities | | | — | | | | 82,851,062 | | | | 81,630 | | | | 82,932,692 | |
U.S. Treasury Obligations | | | — | | | | 22,264,911 | | | | — | | | | 22,264,911 | |
Short-Term Securities: | | | | | | | | | | | | | | | | |
Borrowed Bond Agreements | | | — | | | | 3,912,475 | | | | — | | | | 3,912,475 | |
Commercial Paper | | | — | | | | 248,104 | | | | — | | | | 248,104 | |
Foreign Government Obligations | | | — | | | | 5,711,323 | | | | — | | | | 5,711,323 | |
Money Market Funds | | | 5,841,530 | | | | — | | | | — | | | | 5,841,530 | |
Options Purchased: | | | | | | | | | | | | | | | | |
Foreign currency exchange contracts | | | — | | | | 46,399 | | | | — | | | | 46,399 | |
Interest rate contracts | | | — | | | | 275,901 | | | | — | | | | 275,901 | |
Liabilities: | | | | | | | | | | | | | | | | |
Borrowed Bonds | | | — | | | | (3,895,555 | ) | | | — | | | | (3,895,555 | ) |
TBA Sale Commitments | | | — | | | | (26,604,858 | ) | | | — | | | | (26,604,858 | ) |
| | | | | | | | | | | | | | | | |
Subtotal | | $ | 277,703,256 | | | $ | 188,459,743 | | | $ | 1,678,143 | | | $ | 467,841,142 | |
| | | | | | | | | | | | | | | | |
Investments valued at NAV(b) | | | | | | | | | | | | | | | 5,718,493 | |
| | | | | | | | | | | | | | | | |
Total Investments | | | | | | | | | | | | | | $ | 473,559,635 | |
| | | | | | | | | | | | | | | | |
Derivative Financial Instruments(c) | | | | | | | | | | | | | | | | |
Assets: | | | | | | | | | | | | | | | | |
Credit contracts | | $ | — | | | $ | 34,799 | | | $ | — | | | $ | 34,799 | |
Foreign currency exchange contracts | | | — | | | | 202,348 | | | | — | | | | 202,348 | |
Interest rate contracts | | | 957,761 | | | | 145,230 | | | | — | | | | 1,102,991 | |
Other contracts | | | — | | | | 2,891 | | | | — | | | | 2,891 | |
Liabilities: | | | | | | | | | | | | | | | | |
Credit contracts | | | — | | | | (30,993 | ) | | | — | | | | (30,993 | ) |
Equity contracts | | | (1,127,131 | ) | | | — | | | | — | | | | (1,127,131 | ) |
Foreign currency exchange contracts | | | — | | | | (465,181 | ) | | | — | | | | (465,181 | ) |
Interest rate contracts | | | (79,944 | ) | | | (224,383 | ) | | | — | | | | (304,327 | ) |
| | | | | | | | | | | | | | | | |
| | $ | (249,314 | ) | | $ | (335,289 | ) | | $ | — | | | $ | (584,603 | ) |
| | | | | | | | | | | | | | | | |
| | (a) | See above Schedule of Investments for values in each industry. | |
| | (b) | As of December 31, 2018, certain investments of the Fund were fair valued using NAV per share as no quoted market value is available and therefore have been excluded from the fair value hierarchy. | |
| | (c) | Derivative financial instruments are swaps, futures contracts, forward foreign currency exchange contracts and options written. Swaps, futures contracts and forward foreign currency exchange contracts are valued at the unrealized appreciation (depreciation) on the instrument and options written are shown at value. | |
During the year ended December 31, 2018, there were no transfers between Level 1 and Level 2.
See notes to financial statements.
| | |
| 60 | | 2018 BLACKROCK ANNUAL REPORTTO SHAREHOLDERS |
| | |
Schedule of Investments December 31, 2018 | | BlackRock Capital Appreciation Portfolio (Percentages shown are based on Net Assets) |
| | | | | | | | |
| Security | |
Shares | | | Value | |
| | |
Common Stocks — 97.5% | | | | | | | | |
| | |
| Automobiles — 0.8% | | | | | | |
Tesla, Inc.(a)(b) | | | 3,722 | | | $ | 1,238,682 | |
| | | | | | | | |
| | |
| Banks — 0.6% | | | | | | |
First Republic Bank(a) | | | 10,648 | | | | 925,311 | |
| | | | | | | | |
| | |
| Beverages — 1.8% | | | | | | |
Constellation Brands, Inc., Class A | | | 17,944 | | | | 2,885,754 | |
| | | | | | | | |
| | |
| Biotechnology — 1.7%(b) | | | | | | |
BioMarin Pharmaceutical, Inc. | | | 8,091 | | | | 688,948 | |
Vertex Pharmaceuticals, Inc. | | | 12,732 | | | | 2,109,820 | |
| | | | | | | | |
| | | | | | | 2,798,768 | |
| | |
| Capital Markets — 3.4% | | | | | | |
CME Group, Inc.(a) | | | 12,877 | | | | 2,422,421 | |
S&P Global, Inc. | | | 18,338 | | | | 3,116,360 | |
| | | | | | | | |
| | | | | | | 5,538,781 | |
| | |
| Chemicals — 1.5% | | | | | | |
Sherwin-Williams Co. (The) | | | 6,307 | | | | 2,481,552 | |
| | | | | | | | |
| | |
| Diversified Financial Services — 1.2% | | | | | | |
Berkshire Hathaway, Inc., Class B(b) | | | 9,827 | | | | 2,006,477 | |
| | | | | | | | |
| | |
| Entertainment — 5.4% | | | | | | |
Activision Blizzard, Inc. | | | 27,492 | | | | 1,280,302 | |
Electronic Arts, Inc.(b) | | | 37,227 | | | | 2,937,583 | |
Netflix, Inc.(b) | | | 17,111 | | | | 4,579,930 | |
| | | | | | | | |
| | | | | | | 8,797,815 | |
| | |
| Equity Real Estate Investment Trusts (REITs) — 1.8% | | | | | | |
SBA Communications Corp.(b) | | | 17,608 | | | | 2,850,559 | |
| | | | | | | | |
| | |
| Health Care Equipment & Supplies — 7.6% | | | | | | |
Align Technology, Inc.(b) | | | 11,868 | | | | 2,485,515 | |
Becton Dickinson and Co. | | | 15,513 | | | | 3,495,389 | |
Boston Scientific Corp.(b) | | | 106,368 | | | | 3,759,045 | |
Intuitive Surgical, Inc.(b) | | | 5,577 | | | | 2,670,937 | |
| | | | | | | | |
| | | | | | | 12,410,886 | |
| | |
| Health Care Providers & Services — 5.4% | | | | | | |
Centene Corp.(b) | | | 19,956 | | | | 2,300,927 | |
UnitedHealth Group, Inc. | | | 25,673 | | | | 6,395,658 | |
| | | | | | | | |
| | | | | | | 8,696,585 | |
| | |
| Hotels, Restaurants & Leisure — 1.0% | | | | | | |
Domino’s Pizza, Inc.(a) | | | 6,691 | | | | 1,659,301 | |
| | | | | | | | |
| | |
| Industrial Conglomerates — 1.0% | | | | | | |
Roper Technologies, Inc. | | | 6,150 | | | | 1,639,098 | |
| | | | | | | | |
| | |
| Interactive Media & Services — 9.4% | | | | | | |
Alphabet, Inc., Class A(b) | | | 6,320 | | | | 6,604,147 | |
Facebook, Inc., Class A(b) | | | 21,600 | | | | 2,831,544 | |
IAC/InterActiveCorp(b) | | | 7,732 | | | | 1,415,265 | |
Tencent Holdings Ltd. | | | 112,700 | | | | 4,517,056 | |
| | | | | | | | |
| | | | | | | 15,368,012 | |
| |
| Internet & Direct Marketing Retail — 13.1% | | | | |
Amazon.com, Inc.(b) | | | 9,651 | | | | 14,495,512 | |
Booking Holdings, Inc.(b) | | | 2,445 | | | | 4,211,317 | |
MercadoLibre, Inc. | | | 8,957 | | | | 2,623,057 | |
| | | | | | | | |
| | | | | | | 21,329,886 | |
| |
| IT Services — 10.5% | | | | |
Mastercard, Inc., Class A | | | 29,096 | | | | 5,488,960 | |
PayPal Holdings, Inc.(b) | | | 35,442 | | | | 2,980,318 | |
Visa, Inc., Class A | | | 65,201 | | | | 8,602,620 | |
| | | | | | | | |
| | | | | | | 17,071,898 | |
| | | | | | | | |
| Security | |
Shares | | | Value | |
| |
| Life Sciences Tools & Services — 1.7% | | | | |
Illumina, Inc.(b) | | | 9,257 | | | $ | 2,776,452 | |
| | | | | | | | |
| |
| Machinery — 0.9% | | | | |
Xylem, Inc.(a) | | | 22,828 | | | | 1,523,084 | |
| | | | | | | | |
| |
| Pharmaceuticals — 2.6% | | | | |
Novartis AG, ADR | | | 31,293 | | | | 2,685,253 | |
Zoetis, Inc. | | | 18,058 | | | | 1,544,681 | |
| | | | | | | | |
| | | | | | | 4,229,934 | |
| |
| Professional Services — 2.2% | | | | |
CoStar Group, Inc.(b) | | | 10,781 | | | | 3,636,863 | |
| | | | | | | | |
| |
| Road & Rail — 1.6% | | | | |
Union Pacific Corp. | | | 19,136 | | | | 2,645,169 | |
| | | | | | | | |
| |
| Semiconductors & Semiconductor Equipment — 3.0% | | | | |
ASML Holding NV (Registered), NYRS | | | 19,242 | | | | 2,994,440 | |
NVIDIA Corp. | | | 14,297 | | | | 1,908,650 | |
| | | | | | | | |
| | | | | | | 4,903,090 | |
| |
| Software — 17.2% | | | | |
Adobe, Inc.(b) | | | 17,850 | | | | 4,038,384 | |
Autodesk, Inc.(b) | | | 19,398 | | | | 2,494,777 | |
Intuit, Inc. | | | 18,982 | | | | 3,736,606 | |
Microsoft Corp. | | | 102,990 | | | | 10,460,694 | |
salesforce.com, Inc.(b) | | | 35,743 | | | | 4,895,719 | |
ServiceNow, Inc.(b) | | | 13,720 | | | | 2,442,846 | |
| | | | | | | | |
| | | | | | | 28,069,026 | |
| |
| Technology Hardware, Storage & Peripherals — 0.9% | | | | |
Apple, Inc. | | | 9,174 | | | | 1,447,107 | |
| | | | | | | | |
| |
| Textiles, Apparel & Luxury Goods — 1.2% | | | | |
NIKE, Inc., Class B | | | 25,090 | | | | 1,860,173 | |
| | | | | | | | |
| |
Total Common Stocks — 97.5%
(Cost: $123,481,524) | | | | 158,790,263 | |
| | | | | |
| | |
Preferred Stocks — 0.6%(b)(c)(d) | | | | | | | | |
| | |
| Software — 0.6% | | | | | | |
Palantir Technologies, Inc., Series I
(Acquired 02/11/14, cost $1,152,906) | | | 188,076 | | | | 1,017,491 | |
| | | | | | | | |
| |
Total Preferred Stocks — 0.6%
(Cost: $1,152,906) | | | | 1,017,491 | |
| | | | | | | | |
| |
Total Long-Term Investments — 98.1%
(Cost: $124,634,430) | | | | 159,807,754 | |
| | | | | | | | |
| | |
Short-Term Securities — 5.2%(e) | | | | | | | | |
BlackRock Liquidity Funds, T-Fund, Institutional Class, 2.32%(g) | | | 3,749,583 | | | | 3,749,583 | |
JPMorgan US Treasury Plus Money Market Fund, Agency Class, 2.24% | | | 96,847 | | | | 96,847 | |
SL Liquidity Series, LLC, Money Market Series, 2.57%(f)(g) | | | 4,608,561 | | | | 4,608,100 | |
| | | | | | | | |
| |
Total Short-Term Securities — 5.2%
(Cost: $8,454,629) | | | | 8,454,530 | |
| | | | | | | | |
| |
Total Investments — 103.3%
(Cost: $133,089,059) | | | | 168,262,284 | |
| |
Liabilities in Excess of Other Assets — (3.3)% | | | | (5,396,218 | ) |
| | | | | | | | |
| |
Net Assets — 100.0% | | | $ | 162,866,066 | |
| | | | | | | | |
| (a) | Security, or a portion of the security, is on loan. |
| (b) | Non-income producing security. |
| (c) | Restricted security as to resale, excluding 144A securities. The Fund held restricted securities with a current value of $1,017,491, representing 0.62% of its net assets as of period end, and an original cost of $1,152,906. |
| | | | |
| SCHEDULES OF INVESTMENTS | | | 61 | |
| | |
Schedule of Investments (continued) December 31, 2018 | | BlackRock Capital Appreciation Portfolio (Percentages shown are based on Net Assets) |
| (d) | Security is valued using significant unobservable inputs and is classified as Level 3 in the fair value hierarchy. |
| (e) | Annualized 7-day yield as of period end. |
| (f) | Security was purchased with the cash collateral from loaned securities. |
| (g) | During the year ended December 31, 2018, investments in issuers considered to be affiliates of the Fund for purposes of Section 2(a)(3) of the Investment Company Act of 1940, as amended, were as follows: |
| | | | | | | | | | | | | | | | | | | | | | | | | | | | |
| Affiliate | | Shares
Held at
12/31/17 | | | Net Activity | | | Shares
Held at
12/31/18 | | | Value at
12/31/18 | | | Income | | | Net Realized
Gain (Loss) (a) | | | Change in
Unrealized
Appreciation
(Depreciation) | |
BlackRock Liquidity Funds, T-Fund, Institutional Class | | | 221,423 | | | | 3,528,160 | | | | 3,749,583 | | | $ | 3,749,583 | | | $ | 28,243 | | | $ | — | | | $ | — | |
SL Liquidity Series, LLC, Money Market Series | | | 8,905,737 | | | | (4,297,176 | ) | | | 4,608,561 | | | | 4,608,100 | | | | 20,600 | (b) | | | (2,428 | ) | | | 223 | |
| | | | | | | | | | | | | | | | | | | | | | | | | | | | |
| | | | | | | | | | | | | | $ | 8,357,683 | | | $ | 48,843 | | | $ | (2,428 | ) | | $ | 223 | |
| | | | | | | | | | | | | | | | | | | | | | | | | | | | |
| | (a) | Includes net capital gain distributions, if applicable. | |
| | (b) | Represents securities lending income earned from the reinvestment of cash collateral from loaned securities, net of fees and collateral investment expenses, and other payments to and from borrowers of securities. | |
For Fund compliance purposes, the Fund’s industry classifications refer to one or more of the industrysub-classifications used by one or more widely recognized market indexes or ratings group indexes, and/or as defined by the investment adviser. These definitions may not apply for purposes of this report, which may combine such industrysub-classifications for reporting ease.
Fair Value Hierarchy as of Period End
Various inputs are used in determining the fair value of investments. For information about the Fund’s policy regarding valuation of investments, refer to the Notes to Financial Statements.
The following table summarizes the Fund’s investments categorized in the disclosure hierarchy:
| | | | | | | | | | | | | | | | |
| | | Level 1 | | | Level 2 | | | Level 3 | | | Total | |
Assets: | | | | | | | | | | | | | | | | |
Investments: | | | | | | | | | | | | | | | | |
Long-Term Investments: | | | | | | | | | | | | | | | | |
Common Stocks: | | | | | | | | | | | | | | | | |
Automobiles | | $ | 1,238,682 | | | $ | — | | | $ | — | | | $ | 1,238,682 | |
Banks | | | 925,311 | | | | — | | | | — | | | | 925,311 | |
Beverages | | | 2,885,754 | | | | — | | | | — | | | | 2,885,754 | |
Biotechnology | | | 2,798,768 | | | | — | | | | — | | | | 2,798,768 | |
Capital Markets | | | 5,538,781 | | | | — | | | | — | | | | 5,538,781 | |
Chemicals | | | 2,481,552 | | | | — | | | | — | | | | 2,481,552 | |
Diversified Financial Services | | | 2,006,477 | | | | — | | | | — | | | | 2,006,477 | |
Entertainment | | | 8,797,815 | | | | — | | | | — | | | | 8,797,815 | |
Equity Real Estate Investment Trusts (REITs) | | | 2,850,559 | | | | — | | | | — | | | | 2,850,559 | |
Health Care Equipment & Supplies | | | 12,410,886 | | | | — | | | | — | | | | 12,410,886 | |
Health Care Providers & Services | | | 8,696,585 | | | | — | | | | — | | | | 8,696,585 | |
Hotels, Restaurants & Leisure | | | 1,659,301 | | | | — | | | | — | | | | 1,659,301 | |
Industrial Conglomerates | | | 1,639,098 | | | | — | | | | — | | | | 1,639,098 | |
Interactive Media & Services | | | 10,850,956 | | | | 4,517,056 | | | | — | | | | 15,368,012 | |
Internet & Direct Marketing Retail | | | 21,329,886 | | | | — | | | | — | | | | 21,329,886 | |
IT Services | | | 17,071,898 | | | | — | | | | — | | | | 17,071,898 | |
Life Sciences Tools & Services | | | 2,776,452 | | | | — | | | | — | | | | 2,776,452 | |
Machinery | | | 1,523,084 | | | | — | | | | — | | | | 1,523,084 | |
Pharmaceuticals | | | 4,229,934 | | | | — | | | | — | | | | 4,229,934 | |
Professional Services | | | 3,636,863 | | | | — | | | | — | | | | 3,636,863 | |
Road & Rail | | | 2,645,169 | | | | — | | | | — | | | | 2,645,169 | |
Semiconductors & Semiconductor Equipment | | | 4,903,090 | | | | — | | | | — | | | | 4,903,090 | |
Software | | | 28,069,026 | | | | — | | | | — | | | | 28,069,026 | |
Technology Hardware, Storage & Peripherals | | | 1,447,107 | | | | — | | | | — | | | | 1,447,107 | |
Textiles, Apparel & Luxury Goods | | | 1,860,173 | | | | — | | | | — | | | | 1,860,173 | |
Preferred Stocks | | | — | | | | — | | | | 1,017,491 | | | | 1,017,491 | |
Short-Term Securities | | | 3,846,430 | | | | — | | | | — | | | | 3,846,430 | |
| | | | | | | | | | | | | | | | |
Subtotal | | $ | 158,119,637 | | | $ | 4,517,056 | | | $ | 1,017,491 | | | $ | 163,654,184 | |
| | | | | | | | | | | | | | | | |
Investments valued at NAV(a) | | | | | | | | | | | | | | $ | 4,608,100 | |
| | | | | | | | | | | | | | | | |
Total Investments | | | | | | | | | | | | | | $ | 168,262,284 | |
| | | | | | | | | | | | | | | | |
| | (a) | As of December 31, 2018, certain investments of the Fund were fair valued using NAV per share as no quoted market value is available and therefore have been excluded from the fair value hierarchy. | |
During the year ended December 31, 2018, there were no transfers between Level 1 and Level 2.
See notes to financial statements.
| | |
| 62 | | 2018 BLACKROCK ANNUAL REPORTTO SHAREHOLDERS |
| | |
Consolidated Schedule of Investments December 31, 2018 | | BlackRock Global Allocation Portfolio (Percentages shown are based on Net Assets) |
| | | | | | | | |
| Security | |
Shares | | | Value | |
|
Common Stocks — 58.4% | |
|
| Australia — 0.2% | |
AGL Energy Ltd. | | | 1,565 | | | $ | 22,727 | |
BHP Group Ltd. | | | 199 | | | | 4,810 | |
Coles Group Ltd.(a) | | | 233 | | | | 1,927 | |
Newcrest Mining Ltd. | | | 5,986 | | | | 91,999 | |
Quintis HoldCo Pty. Ltd. (Acquired 10/22/18, cost $115,835)(a)(b)(c) | | | 218,994 | | | | 117,229 | |
Rio Tinto Ltd. | | | 151 | | | | 8,357 | |
Stockland | | | 2,645 | | | | 6,562 | |
Telstra Corp. Ltd. | | | 203 | | | | 407 | |
Woolworths Group Ltd. | | | 493 | | | | 10,227 | |
| | | | | | | | |
| | | | | | | 264,245 | |
|
| Belgium — 0.2% | |
Anheuser-Busch InBev SA | | | 6,213 | | | | 409,306 | |
| | | | | | | | |
|
| Brazil — 0.7% | |
Azul SA, ADR(a)(d) | | | 22,988 | | | | 636,538 | |
Banco do Brasil SA(a) | | | 934 | | | | 11,203 | |
Banco Santander Brasil SA | | | 300 | | | | 3,305 | |
Hapvida Participacoes e Investimentos SA(a)(e) | | | 27,780 | | | | 223,631 | |
Notre Dame Intermedica Participacoes SA(a) | | | 49,118 | | | | 368,535 | |
Petrobras Distribuidora SA | | | 306 | | | | 2,029 | |
Suzano Papel e Celulose SA | | | 306 | | | | 3,007 | |
TIM Participacoes SA(a) | | | 616 | | | | 1,883 | |
| | | | | | | | |
| | | | | | | 1,250,131 | |
|
| Canada — 1.5% | |
Canadian Natural Resources Ltd. | | | 132 | | | | 3,185 | |
Canadian Pacific Railway Ltd. | | | 38 | | | | 6,743 | |
Enbridge, Inc.(d) | | | 25,485 | | | | 791,693 | |
Encana Corp. | | | 30,711 | | | | 177,509 | |
Goldcorp, Inc. | | | 74 | | | | 725 | |
Husky Energy, Inc. | | | 817 | | | | 8,444 | |
Imperial Oil Ltd. | | | 341 | | | | 8,640 | |
Manulife Financial Corp. | | | 1,294 | | | | 18,360 | |
Nutrien Ltd.(d) | | | 339 | | | | 15,922 | |
Rogers Communications, Inc., Class B | | | 237 | | | | 12,145 | |
Suncor Energy, Inc. | | | 23,633 | | | | 660,069 | |
Teck Resources Ltd., Class B | | | 443 | | | | 9,537 | |
TransCanada Corp. | | | 21,508 | | | | 768,030 | |
Wheaton Precious Metals Corp. | | | 2,814 | | | | 54,932 | |
| | | | | | | | |
| | | | | | | 2,535,934 | |
|
| China — 1.5% | |
Agile Group Holdings Ltd. | | | 6,000 | | | | 7,078 | |
Agricultural Bank of China Ltd., Class H | | | 11,000 | | | | 4,818 | |
Alibaba Group Holding Ltd., ADR(a) | | | 2,811 | | | | 385,304 | |
Angang Steel Co. Ltd., Class H | | | 8,000 | | | | 5,519 | |
Angel Yeast Co. Ltd., Class A | | | 20,400 | | | | 75,235 | |
Anhui Conch Cement Co. Ltd., Class H | | | 1,500 | | | | 7,254 | |
BAIC Motor Corp. Ltd., Class H(a)(e) | | | 1,000 | | | | 529 | |
Baidu, Inc., ADR(a) | | | 50 | | | | 7,930 | |
Bank of China Ltd., Class H | | | 3,000 | | | | 1,293 | |
Beijing Capital International Airport Co. Ltd., Class H | | | 82,000 | | | | 87,029 | |
Beijing Enterprises Holdings Ltd. | | | 1,500 | | | | 7,954 | |
China CITIC Bank Corp. Ltd., Class H | | | 13,000 | | | | 7,887 | |
China Construction Bank Corp., Class H | | | 6,000 | | | | 4,913 | |
China Mobile Ltd. | | | 2,000 | | | | 19,353 | |
China National Building Material Co. Ltd., Class H | | | 4,000 | | | | 2,737 | |
China Petroleum & Chemical Corp., Class H | | | 32,000 | | | | 22,810 | |
China Resources Beer Holdings Co. Ltd. | | | 2,000 | | | | 6,992 | |
China Resources Cement Holdings Ltd. | | | 16,000 | | | | 14,428 | |
China Resources Gas Group Ltd. | | | 2,000 | | | | 7,925 | |
China Shenhua Energy Co. Ltd., Class H | | | 5,500 | | | | 11,995 | |
CITIC Ltd. | | | 10,000 | | | | 15,692 | |
| | | | | | | | |
| Security | |
Shares | | | Value | |
|
| China (continued) | |
CNOOC Ltd. | | | 15,000 | | | $ | 23,105 | |
Country Garden Holdings Co. Ltd. | | | 4,000 | | | | 4,857 | |
Country Garden Services Holdings Co. Ltd.(a) | | | 3,114 | | | | 4,930 | |
Dongfeng Motor Group Co. Ltd., Class H | | | 2,000 | | | | 1,818 | |
Fosun International Ltd. | | | 9,000 | | | | 13,116 | |
Guangzhou Automobile Group Co. Ltd., Class H | | | 4,800 | | | | 4,785 | |
Industrial & Commercial Bank of China Ltd., Class H | | | 35,000 | | | | 24,894 | |
Jiangsu Expressway Co. Ltd., Class H | | | 2,000 | | | | 2,792 | |
Jiangsu Yanghe Brewery Joint-Stock Co. Ltd., Class A | | | 4,900 | | | | 67,880 | |
Kweichow Moutai Co. Ltd., Class A | | | 2,800 | | | | 241,769 | |
Luzhou Laojiao Co. Ltd., Class A | | | 12,400 | | | | 73,612 | |
Meituan Dianping, Class B | | | 6,875 | | | | 38,532 | |
Momo, Inc., ADR(a) | | | 70 | | | | 1,662 | |
New Oriental Education & Technology Group, Inc., ADR(a) | | | 132 | | | | 7,235 | |
PetroChina Co. Ltd., Class H | | | 2,000 | | | | 1,241 | |
Ping An Healthcare and Technology Co. Ltd.(a)(e) | | | 46,856 | | | | 164,741 | |
SINA Corp.(a) | | | 274 | | | | 14,697 | |
Sinopec Shanghai Petrochemical Co. Ltd., Class H | | | 26,000 | | | | 11,381 | |
Tencent Holdings Ltd. | | | 24,500 | | | | 981,969 | |
Tingyi Cayman Islands Holding Corp. | | | 2,000 | | | | 2,679 | |
Want Want China Holdings Ltd. | | | 86,000 | | | | 60,172 | |
Wuliangye Yibin Co. Ltd., Class A | | | 9,300 | | | | 69,131 | |
Yanzhou Coal Mining Co. Ltd., Class H | | | 4,000 | | | | 3,230 | |
Yum China Holdings, Inc. | | | 1,503 | | | | 50,396 | |
Zhejiang Expressway Co. Ltd., Class H | | | 6,000 | | | | 5,205 | |
Zijin Mining Group Co. Ltd., Class H | | | 8,000 | | | | 3,032 | |
| | | | | | | | |
| | | | | | | 2,583,536 | |
|
| Czech Republic — 0.0% | |
CEZ A/S | | | 3,172 | | | | 75,615 | |
| | | | | | | | |
|
| Denmark — 0.1% | |
Carlsberg A/S, Class B | | | 265 | | | | 28,190 | |
Danske Bank A/S | | | 423 | | | | 8,398 | |
Novo Nordisk A/S, Class B | | | 2,623 | | | | 120,467 | |
| | | | | | | | |
| | | | | | | 157,055 | |
|
| Finland — 0.0% | |
Nokia OYJ | | | 2,798 | | | | 16,243 | |
| | | | | | | | |
|
| France — 2.7% | |
AXA SA | | | 14,907 | | | | 321,721 | |
Cie de Saint-Gobain | | | 492 | | | | 16,333 | |
Cie Generale des Etablissements Michelin SCA | | | 156 | | | | 15,354 | |
Danone SA | | | 18,971 | | | | 1,337,126 | |
Dassault Aviation SA | | | 205 | | | | 284,203 | |
Eiffage SA | | | 1,487 | | | | 124,324 | |
Engie SA | | | 1,043 | | | | 14,986 | |
EssilorLuxottica SA | | | 3,934 | | | | 489,727 | |
Eutelsat Communications SA | | | 3,674 | | | | 72,382 | |
Kering SA | | | 70 | | | | 32,793 | |
L’Oreal SA | | | 80 | | | | 18,306 | |
Publicis Groupe SA | | | 282 | | | | 16,090 | |
Safran SA | | | 5,935 | | | | 711,814 | |
Sanofi | | | 1,293 | | | | 112,168 | |
Societe Generale SA | | | 791 | | | | 25,078 | |
Sodexo SA | | | 8,641 | | | | 886,182 | |
TOTAL SA, ADR | | | 274 | | | | 14,297 | |
Unibail-Rodamco-Westfield | | | 1,571 | | | | 243,104 | |
| | | | | | | | |
| | | | | | | 4,735,988 | |
|
| Germany— 1.3% | |
adidas AG | | | 16 | | | | 3,344 | |
Allianz SE (Registered) | | | 163 | | | | 32,756 | |
Bayer AG (Registered) | | | 10,839 | | | | 753,839 | |
Evonik Industries AG | | | 944 | | | | 23,563 | |
Fresenius SE & Co. KGaA | | | 17,416 | | | | 841,787 | |
Knorr-Bremse AG(a) | | | 6,158 | | | | 554,706 | |
| | | | |
| CONSOLIDATED SCHEDULES OF INVESTMENTS | | | 63 | |
| | |
Consolidated Schedule of Investments (continued) December 31, 2018 | | BlackRock Global Allocation Portfolio (Percentages shown are based on Net Assets) |
| | | | | | | | |
| Security | |
Shares | | | Value | |
| | |
| Germany (continued) | | | | | | |
Muenchener Rueckversicherungs-Gesellschaft AG in Muenchen (Registered) | | | 29 | | | $ | 6,325 | |
SAP SE | | | 165 | | | | 16,376 | |
Vonovia SE | | | 981 | | | | 44,222 | |
| | | | | | | | |
| | | | | | | 2,276,918 | |
|
| Hong Kong— 0.9% | |
CK Asset Holdings Ltd. | | | 500 | | | | 3,658 | |
CK Infrastructure Holdings Ltd. | | | 10,500 | | | | 79,461 | |
CLP Holdings Ltd. | | | 8,000 | | | | 90,407 | |
Hang Lung Properties Ltd. | | | 47,000 | | | | 89,334 | |
HKT Trust & HKT Ltd.(f) | | | 39,000 | | | | 56,181 | |
Hongkong Land Holdings Ltd. | | | 2,100 | | | | 13,239 | |
I-CABLE Communications Ltd.(a) | | | 7,664 | | | | 115 | |
Jardine Matheson Holdings Ltd. | | | 1,700 | | | | 118,369 | |
Link REIT | | | 8,500 | | | | 86,171 | |
Nine Dragons Paper Holdings Ltd. | | | 1,000 | | | | 924 | |
Power Assets Holdings Ltd. | | | 3,000 | | | | 20,842 | |
Sino Land Co. Ltd. | | | 26,000 | | | | 44,545 | |
Sun Hung Kai Properties Ltd. | | | 60,666 | | | | 865,803 | |
Swire Pacific Ltd., Class A | | | 5,500 | | | | 58,069 | |
WH Group Ltd.(e) | | | 27,500 | | | | 21,121 | |
Wharf Real Estate Investment Co. Ltd. | | | 9,000 | | | | 53,828 | |
| | | | | | | | |
| | | | | | | 1,602,067 | |
|
| India— 1.2% | |
Coal India Ltd. | | | 19,979 | | | | 68,877 | |
HCL Technologies Ltd. | | | 433 | | | | 5,983 | |
Hero MotoCorp Ltd. | | | 1,417 | | | | 62,965 | |
Hindustan Petroleum Corp. Ltd. | | | 3,375 | | | | 12,264 | |
Housing Development Finance Corp. Ltd. | | | 20,348 | | | | 573,290 | |
Infosys Ltd. | | | 725 | | | | 6,850 | |
JSW Steel Ltd. | | | 601 | | | | 2,638 | |
Maruti Suzuki India Ltd. | | | 1,975 | | | | 211,034 | |
Oil & Natural Gas Corp. Ltd. | | | 20,569 | | | | 44,155 | |
Reliance Industries Ltd. | | | 57,408 | | | | 921,344 | |
State Bank of India(a) | | | 43,803 | | | | 185,508 | |
Tata Consultancy Services Ltd. | | | 294 | | | | 7,972 | |
| | | | | | | | |
| | | | | | | 2,102,880 | |
|
| Indonesia— 0.0% | |
Bank Central Asia Tbk. PT | | | 35,600 | | | | 64,381 | |
| | | | | | | | |
|
| Italy— 0.6% | |
Enel SpA | | | 77,414 | | | | 448,788 | |
Eni SpA | | | 995 | | | | 15,718 | |
RAI Way SpA(e) | | | 38,277 | | | | 190,115 | |
Snam SpA | | | 32,378 | | | | 141,763 | |
Telecom Italia SpA(a) | | | 275,826 | | | | 152,700 | |
Telecom Italia SpA | | | 13,780 | | | | 6,609 | |
UniCredit SpA | | | 261 | | | | 2,956 | |
| | | | | | | | |
| | | | | | | 958,649 | |
|
| Japan— 7.7% | |
Aeon Co. Ltd. | | | 200 | | | | 3,909 | |
Ajinomoto Co., Inc. | | | 36,900 | | | | 655,679 | |
Alfresa Holdings Corp. | | | 2,000 | | | | 50,979 | |
Alps Electric Co. Ltd. | | | 1,020 | | | | 19,778 | |
Asahi Kasei Corp. | | | 19,700 | | | | 202,189 | |
Astellas Pharma, Inc. | | | 36,750 | | | | 469,541 | |
Canon Marketing Japan, Inc. | | | 1,800 | | | | 32,081 | |
Daicel Corp. | | | 7,100 | | | | 72,886 | |
Daikin Industries Ltd. | | | 2,600 | | | | 276,264 | |
Daiwa House Industry Co. Ltd. | | | 200 | | | | 6,380 | |
Denso Corp. | | | 18,030 | | | | 798,146 | |
Dowa Holdings Co. Ltd. | | | 1,000 | | | | 29,931 | |
East Japan Railway Co. | | | 10,727 | | | | 947,303 | |
Eisai Co. Ltd. | | | 200 | | | | 15,484 | |
| | | | | | | | |
| Security | |
Shares | | | Value | |
| | |
| Japan (continued) | | | | | | |
Exedy Corp. | | | 1,200 | | | $ | 29,312 | |
Fujitsu Ltd. | | | 100 | | | | 6,234 | |
GS Yuasa Corp. | | | 2,400 | | | | 48,946 | |
Hino Motors Ltd. | | | 3,300 | | | | 31,075 | |
Hitachi Chemical Co. Ltd. | | | 2,500 | | | | 37,609 | |
Hitachi Ltd. | | | 1,000 | | | | 26,510 | |
Hoya Corp. | | | 9,101 | | | | 548,791 | |
Japan Airlines Co. Ltd. | | | 27,300 | | | | 967,541 | |
Japan Aviation Electronics Industry Ltd. | | | 3,500 | | | | 40,278 | |
JFE Holdings, Inc. | | | 200 | | | | 3,186 | |
Kajima Corp. | | | 300 | | | | 4,030 | |
Kamigumi Co. Ltd. | | | 1,700 | | | | 34,780 | |
KDDI Corp. | | | 2,600 | | | | 62,127 | |
Keyence Corp. | | | 100 | | | | 50,545 | |
Kinden Corp. | | | 7,100 | | | | 114,958 | |
Koito Manufacturing Co. Ltd. | | | 10,200 | | | | 526,254 | |
Kuraray Co. Ltd. | | | 2,700 | | | | 37,974 | |
Kyowa Hakko Kirin Co. Ltd. | | | 300 | | | | 5,669 | |
Kyudenko Corp. | | | 900 | | | | 34,108 | |
Mabuchi Motor Co. Ltd. | | | 1,900 | | | | 58,203 | |
Maeda Road Construction Co. Ltd. | | | 1,800 | | | | 37,291 | |
Medipal Holdings Corp. | | | 2,300 | | | | 49,207 | |
Mitsubishi Electric Corp. | | | 59,300 | | | | 653,936 | |
Mitsubishi Estate Co. Ltd. | | | 3,300 | | | | 51,921 | |
Mitsubishi Heavy Industries Ltd. | | | 400 | | | | 14,353 | |
Mitsubishi Tanabe Pharma Corp. | | | 100 | | | | 1,444 | |
Mitsubishi UFJ Financial Group, Inc. | | | 800 | | | | 3,926 | |
Mitsui & Co. Ltd. | | | 100 | | | | 1,536 | |
Mitsui Fudosan Co. Ltd. | | | 400 | | | | 8,885 | |
Murata Manufacturing Co. Ltd. | | | 4,440 | | | | 598,289 | |
Nexon Co. Ltd.(a) | | | 100 | | | | 1,291 | |
Nichias Corp. | | | 2,000 | | | | 34,107 | |
Nippo Corp. | | | 1,700 | | | | 32,525 | |
Nippon Telegraph & Telephone Corp. | | | 1,320 | | | | 53,855 | |
Nippon Television Holdings, Inc. | | | 4,300 | | | | 63,304 | |
Nitto Denko Corp. | | | 13,500 | | | | 677,085 | |
NTT Docomo, Inc. | | | 200 | | | | 4,494 | |
Okumura Corp. | | | 2,154 | | | | 62,761 | |
Olympus Corp. | | | 100 | | | | 3,058 | |
Ono Pharmaceutical Co. Ltd. | | | 200 | | | | 4,084 | |
Oracle Corp. | | | 200 | | | | 12,696 | |
Otsuka Holdings Co. Ltd. | | | 100 | | | | 4,086 | |
Panasonic Corp. | | | 1,200 | | | | 10,780 | |
Rohm Co. Ltd. | | | 5,260 | | | | 335,720 | |
Seino Holdings Co. Ltd. | | | 2,500 | | | | 32,731 | |
Seven & i Holdings Co. Ltd. | | | 900 | | | | 39,110 | |
Shimamura Co. Ltd. | | | 400 | | | | 30,630 | |
Shin-Etsu Chemical Co. Ltd. | | | 8,320 | | | | 639,249 | |
Shiseido Co. Ltd. | | | 200 | | | | 12,526 | |
Sony Corp. | | | 400 | | | | 19,284 | |
Stanley Electric Co. Ltd. | | | 1,100 | | | | 30,772 | |
Subaru Corp. | | | 35,660 | | | | 761,818 | |
Sumitomo Chemical Co. Ltd. | | | 3,000 | | | | 14,528 | |
Suzuken Co. Ltd. | | | 900 | | | | 45,830 | |
Suzuki Motor Corp. | | | 17,261 | | | | 870,152 | |
Sysmex Corp. | | | 100 | | | | 4,749 | |
Taisei Corp. | | | 100 | | | | 4,283 | |
Toagosei Co. Ltd. | | | 5,600 | | | | 61,720 | |
Toda Corp. | | | 9,000 | | | | 56,088 | |
Tokyo Gas Co. Ltd. | | | 24,916 | | | | 630,179 | |
Tokyo Steel Manufacturing Co. Ltd. | | | 9,200 | | | | 74,519 | |
Toray Industries, Inc. | | | 41,300 | | | | 291,996 | |
Toshiba Corp.(a) | | | 600 | | | | 16,942 | |
Toyota Industries Corp. | | | 9,714 | | | | 447,328 | |
TV Asahi Holdings Corp. | | | 3,200 | | | | 57,614 | |
| | |
| 64 | | 2018 BLACKROCK ANNUAL REPORTTO SHAREHOLDERS |
| | |
Consolidated Schedule of Investments (continued) December 31, 2018 | | BlackRock Global Allocation Portfolio (Percentages shown are based on Net Assets) |
| | | | | | | | |
| Security | |
Shares | | | Value | |
| | |
| Japan (continued) | | | | | | |
Ube Industries Ltd. | | | 14,660 | | | $ | 296,474 | |
Unicharm Corp. | | | 300 | | | | 9,703 | |
Yamato Kogyo Co. Ltd. | | | 1,300 | | | | 30,385 | |
| | | | | | | | |
| | | | | | | 13,447,924 | |
|
| Macau— 0.0% | |
Galaxy Entertainment Group Ltd. | | | 1,000 | | | | 6,317 | |
Sands China Ltd. | | | 400 | | | | 1,744 | |
| | | | | | | | |
| | | | | | | 8,061 | |
|
| Malaysia— 0.0% | |
Malaysia Airports Holdings Bhd. | | | 14,800 | | | | 29,980 | |
| | | | | | | | |
|
| Mexico— 0.0% | |
America Movil SAB de CV | | | 10,486 | | | | 7,465 | |
Cemex SAB de CV(a) | | | 7,153 | | | | 3,458 | |
Grupo Financiero Banorte SAB de CV, Class O | | | 137 | | | | 669 | |
| | | | | | | | |
| | | | | | | 11,592 | |
|
| Netherlands— 2.3% | |
ABN AMRO Group NV, CVA(e) | | | 13,119 | | | | 308,714 | |
ASML Holding NV | | | 19 | | | | 2,977 | |
Koninklijke Ahold Delhaize NV | | | 419 | | | | 10,585 | |
Koninklijke Philips NV | | | 40,931 | | | | 1,435,020 | |
NXP Semiconductors NV(a) | | | 238 | | | | 17,441 | |
Royal Dutch Shell plc, Class A | | | 50,883 | | | | 1,499,752 | |
Royal Dutch Shell plc, Class B | | | 603 | | | | 18,028 | |
Royal Dutch Shell plc, ADR, Class A(d) | | | 11,019 | | | | 642,077 | |
| | | | | | | | |
| | | | | | | 3,934,594 | |
|
| Norway— 0.0% | |
Equinor ASA | | | 196 | | | | 4,158 | |
| | | | | | | | |
|
| Peru— 0.0% | |
Southern Copper Corp. | | | 43 | | | | 1,323 | |
| | | | | | | | |
|
| Poland— 0.0% | |
Polski Koncern Naftowy ORLEN SA | | | 98 | | | | 2,839 | |
Polskie Gornictwo Naftowe i Gazownictwo SA(a) | | | 1,102 | | | | 2,038 | |
| | | | | | | | |
| | | | | | | 4,877 | |
|
| Portugal— 0.1% | |
Jeronimo Martins SGPS SA | | | 3,320 | | | | 39,344 | |
NOS SGPS SA | | | 24,524 | | | | 148,712 | |
| | | | | | | | |
| | | | | | | 188,056 | |
|
| Singapore— 0.6% | |
CapitaLand Ltd. | | | 335,700 | | | | 765,540 | |
ComfortDelGro Corp. Ltd. | | | 38,200 | | | | 60,339 | |
Genting Singapore Ltd. | | | 22,400 | | | | 16,034 | |
Singapore Telecommunications Ltd. | | | 30,600 | | | | 65,858 | |
United Overseas Bank Ltd. | | | 3,000 | | | | 54,270 | |
| | | | | | | | |
| | | | | | | 962,041 | |
|
| South Africa— 0.0% | |
Anglo American plc(d) | | | 357 | | | | 7,983 | |
Aspen Pharmacare Holdings Ltd. | | | 513 | | | | 4,800 | |
Kumba Iron Ore Ltd. | | | 26 | | | | 511 | |
MTN Group Ltd. | | | 396 | | | | 2,448 | |
Naspers Ltd., Class N | | | 4 | | | | 801 | |
Old Mutual Ltd. | | | 5,819 | | | | 9,041 | |
| | | | | | | | |
| | | | | | | 25,584 | |
|
| South Korea— 0.7% | |
Coway Co. Ltd. | | | 809 | | | | 53,726 | |
Doosan Bobcat, Inc.(a) | | | 5,538 | | | | 156,793 | |
E-MART, Inc. | | | 46 | | | | 7,512 | |
Hana Financial Group, Inc. | | | 404 | | | | 13,139 | |
Industrial Bank of Korea | | | 650 | | | | 8,186 | |
KB Financial Group, Inc. | | | 158 | | | | 6,591 | |
KT&G Corp. | | | 5,608 | | | | 510,590 | |
| | | | | | | | |
| Security | |
Shares | | | Value | |
|
| South Korea (continued) | |
LG Chem Ltd. | | | 273 | | | $ | 85,099 | |
LG Electronics, Inc. | | | 18 | | | | 1,010 | |
Lotte Chemical Corp. | | | 3 | | | | 746 | |
NCSoft Corp. | | | 135 | | | | 56,588 | |
POSCO | | | 369 | | | | 80,712 | |
Samsung Electro-Mechanics Co. Ltd.(a) | | | 5 | | | | 466 | |
Samsung Electronics Co. Ltd. | | | 751 | | | | 26,144 | |
Samsung SDS Co. Ltd. | | | 29 | | | | 5,307 | |
Shinhan Financial Group Co. Ltd. | | | 656 | | | | 23,259 | |
SK Innovation Co. Ltd. | | | 6 | | | | 963 | |
SK Telecom Co. Ltd. | | | 312 | | | | 75,279 | |
S-Oil Corp. | | | 605 | | | | 52,772 | |
Woori Bank | | | 555 | | | | 7,761 | |
| | | | | | | | |
| | | | | | | 1,172,643 | |
|
| Spain— 0.4% | |
Banco Bilbao Vizcaya Argentaria SA | | | 4,594 | | | | 24,402 | |
Cellnex Telecom SA(e) | | | 23,231 | | | | 594,098 | |
| | | | | | | | |
| | | | | | | 618,500 | |
|
| Sweden— 0.0% | |
Sandvik AB | | | 665 | | | | 9,528 | |
Telefonaktiebolaget LM Ericsson, Class B | | | 2,043 | | | | 18,085 | |
| | | | | | | | |
| | | | | | | 27,613 | |
|
| Switzerland— 0.9% | |
Nestle SA (Registered) | | | 19,184 | | | | 1,557,027 | |
Roche Holding AG | | | 91 | | | | 22,591 | |
Swiss Re AG | | | 147 | | | | 13,524 | |
| | | | | | | | |
| | | | | | | 1,593,142 | |
|
| Taiwan— 0.9% | |
Cathay Financial Holding Co. Ltd. | | | 52,000 | | | | 79,603 | |
Cheng Shin Rubber Industry Co. Ltd. | | | 24,341 | | | | 32,377 | |
Chunghwa Telecom Co. Ltd. | | | 116,000 | | | | 423,535 | |
Far EasTone Telecommunications Co. Ltd.(a) | | | 70,000 | | | | 173,878 | |
Formosa Chemicals & Fibre Corp. | | | 16,000 | | | | 54,737 | |
Formosa Petrochemical Corp.(a) | | | 12,000 | | | | 42,582 | |
Formosa Plastics Corp. | | | 18,000 | | | | 59,166 | |
Fubon Financial Holding Co. Ltd. | | | 62,000 | | | | 95,126 | |
Hon Hai Precision Industry Co. Ltd.(a) | | | 30,760 | | | | 70,792 | |
MediaTek, Inc. | | | 1,000 | | | | 7,443 | |
Nan Ya Plastics Corp. | | | 23,000 | | | | 56,565 | |
Nanya Technology Corp. | | | 5,000 | | | | 8,954 | |
Taiwan Cooperative Financial Holding Co. Ltd. | | | 30 | | | | 17 | |
Taiwan Mobile Co. Ltd. | | | 56,000 | | | | 193,933 | |
Taiwan Semiconductor Manufacturing Co. Ltd. | | | 15,000 | | | | 108,919 | |
Uni-President Enterprises Corp. | | | 38,000 | | | | 86,209 | |
| | | | | | | | |
| | | | | | | 1,493,836 | |
|
| Thailand— 0.2% | |
Advanced Info Service PCL | | | 16,200 | | | | 85,908 | |
Intouch Holdings PCL, Class F | | | 41,300 | | | | 60,568 | |
PTT Global Chemical PCL | | | 34,700 | | | | 76,031 | |
Siam Cement PCL (The) | | | 5,100 | | | | 68,322 | |
Thai Oil PCL | | | 23,900 | | | | 48,574 | |
| | | | | | | | |
| | | | | | | 339,403 | |
|
| Turkey— 0.0% | |
Eregli Demir ve Celik Fabrikalari TAS | | | 218 | | | | 296 | |
Turk Hava Yollari AO(a) | | | 2,008 | | | | 6,094 | |
Turkiye Is Bankasi A/S, Class C | | | 1,585 | | | | 1,353 | |
| | | | | | | | |
| | | | | | | 7,743 | |
|
| United Arab Emirates— 0.4% | |
NMC Health plc | | | 19,102 | | | | 666,684 | |
| | | | | | | | |
|
| United Kingdom— 1.6% | |
Barclays plc | | | 6,137 | | | | 11,742 | |
| | | | |
| CONSOLIDATED SCHEDULES OF INVESTMENTS | | | 65 | |
| | |
Consolidated Schedule of Investments (continued) December 31, 2018 | | BlackRock Global Allocation Portfolio (Percentages shown are based on Net Assets) |
| | | | | | | | |
| Security | |
Shares | | | Value | |
|
| United Kingdom (continued) | |
Berkeley Group Holdings plc | | | 1,349 | | | $ | 59,832 | |
Experian plc | | | 216 | | | | 5,236 | |
GlaxoSmithKline plc | | | 1,496 | | | | 28,511 | |
GW Pharmaceuticals plc, ADR(a) | | | 714 | | | | 69,537 | |
HSBC Holdings plc | | | 77,177 | | | | 636,690 | |
Kingfisher plc | | | 151,480 | | | | 398,285 | |
Liberty Global plc, Class A(a) | | | 15,789 | | | | 336,937 | |
Liberty Global plc, Class C(a) | | | 539 | | | | 11,125 | |
National Grid plc | | | 2,963 | | | | 28,988 | |
SSE plc | | | 589 | | | | 8,134 | |
Vodafone Group plc | | | 630,892 | | | | 1,226,637 | |
| | | | | | | | |
| | | | | | | 2,821,654 | |
|
| United States— 31.7% | |
Abbott Laboratories | | | 642 | | | | 46,436 | |
AbbVie, Inc.(d) | | | 655 | | | | 60,384 | |
Accenture plc, Class A | | | 213 | | | | 30,036 | |
Adobe, Inc.(a) | | | 186 | | | | 42,081 | |
AES Corp. | | | 848 | | | | 12,262 | |
Agilent Technologies, Inc. | | | 157 | | | | 10,591 | |
Air Products & Chemicals, Inc. | | | 7,572 | | | | 1,211,899 | |
Allergan plc | | | 120 | | | | 16,039 | |
Alliance Data Systems Corp. | | | 45 | | | | 6,754 | |
Ally Financial, Inc. | | | 336 | | | | 7,614 | |
Alphabet, Inc., Class A(a) | | | 29 | | | | 30,304 | |
Alphabet, Inc., Class C(a) | | | 2,527 | | | | 2,616,986 | |
Altria Group, Inc. | | | 19,120 | | | | 944,337 | |
Amazon.com, Inc.(a) | | | 1,107 | | | | 1,662,681 | |
American Airlines Group, Inc. | | | 254 | | | | 8,156 | |
American International Group, Inc. | | | 60 | | | | 2,365 | |
American Tower Corp. | | | 288 | | | | 45,559 | |
Ameriprise Financial, Inc. | | | 285 | | | | 29,745 | |
Amgen, Inc. | | | 307 | | | | 59,764 | |
Anadarko Petroleum Corp. | | | 16,350 | | | | 716,784 | |
Anthem, Inc. | | | 6,416 | | | | 1,685,034 | |
Apple, Inc. | | | 16,044 | | | | 2,530,781 | |
AT&T, Inc. | | | 5,296 | | | | 151,148 | |
Autodesk, Inc.(a) | | | 53 | | | | 6,816 | |
Automatic Data Processing, Inc. | | | 71 | | | | 9,310 | |
Bank of America Corp. | | | 26,617 | | | | 655,843 | |
Bank of New York Mellon Corp. (The) | | | 312 | | | | 14,686 | |
Baxter International, Inc. | | | 672 | | | | 44,231 | |
Berkshire Hathaway, Inc., Class B(a) | | | 537 | | | | 109,645 | |
Biogen, Inc.(a) | | | 1,407 | | | | 423,394 | |
Boeing Co. (The) | | | 184 | | | | 59,340 | |
Booking Holdings, Inc.(a) | | | 11 | | | | 18,947 | |
Bristol-Myers Squibb Co. | | | 620 | | | | 32,228 | |
Capital One Financial Corp. | | | 144 | | | | 10,885 | |
Carnival Corp. | | | 40 | | | | 1,972 | |
Caterpillar, Inc. | | | 223 | | | | 28,337 | |
Celgene Corp.(a) | | | 122 | | | | 7,819 | |
CenterPoint Energy, Inc. | | | 342 | | | | 9,655 | |
CH Robinson Worldwide, Inc. | | | 604 | | | | 50,790 | |
Charles Schwab Corp. (The) | | | 17,267 | | | | 717,098 | |
Charter Communications, Inc., Class A(a) | | | 5,073 | | | | 1,445,653 | |
Chevron Corp. | | | 350 | | | | 38,076 | |
Chubb Ltd. | | | 4,175 | | | | 539,326 | |
Cisco Systems, Inc.(d) | | | 1,318 | | | | 57,109 | |
Citigroup, Inc. | | | 9,977 | | | | 519,403 | |
Cloudera, Inc.(a) | | | 30,073 | | | | 332,607 | |
Cognizant Technology Solutions Corp., Class A | | | 338 | | | | 21,456 | |
Colgate-Palmolive Co. | | | 17,529 | | | | 1,043,326 | |
Comcast Corp., Class A(g) | | | 57,581 | | | | 1,960,633 | |
Conagra Brands, Inc. | | | 278 | | | | 5,938 | |
ConocoPhillips | | | 101 | | | | 6,297 | |
Constellation Brands, Inc., Class A | | | 50 | | | | 8,041 | |
| | | | | | | | |
| Security | |
Shares | | | Value | |
|
| United States (continued) | |
Corning, Inc. | | | 708 | | | $ | 21,389 | |
Costco Wholesale Corp. | | | 84 | | | | 17,112 | |
CSX Corp. | | | 674 | | | | 41,876 | |
Cummins, Inc. | | | 64 | | | | 8,553 | |
CVS Health Corp. | | | 19,239 | | | | 1,260,539 | |
DaVita, Inc.(a) | | | 8,368 | | | | 430,617 | |
Dell Technologies, Inc., Class C(a)(d) | | | 54 | | | | 2,649 | |
Delta Air Lines, Inc. | | | 326 | | | | 16,267 | |
Discover Financial Services | | | 235 | | | | 13,860 | |
Dollar General Corp. | | | 152 | | | | 16,428 | |
Dollar Tree, Inc.(a) | | | 8,336 | | | | 752,908 | |
Domo, Inc., Class B(a) | | | 6,742 | | | | 132,345 | |
Domo, Inc., Class B
(Acquired04/01/15-04/12/17, cost $469,893)(a)(b) | | | 3,715 | | | | 72,932 | |
Dover Corp. | | | 5,812 | | | | 412,361 | |
DowDuPont, Inc. | | | 14,528 | | | | 776,957 | |
Dropbox, Inc., Class A(a) | | | 24,291 | | | | 496,272 | |
DXC Technology Co. | | | 201 | | | | 10,687 | |
Eaton Corp. plc | | | 366 | | | | 25,130 | |
eBay, Inc.(a) | | | 636 | | | | 17,853 | |
Edgewell Personal Care Co.(a)(d) | | | 7,260 | | | | 271,161 | |
Edwards Lifesciences Corp.(a) | | | 78 | | | | 11,947 | |
Eli Lilly & Co. | | | 69 | | | | 7,985 | |
Equity Residential | | | 4,585 | | | | 302,656 | |
Exelon Corp. | | | 449 | | | | 20,250 | |
Expedia Group, Inc. | | | 132 | | | | 14,870 | |
Exxon Mobil Corp. | | | 23,548 | | | | 1,605,738 | |
Facebook, Inc., Class A(a) | | | 8,320 | | | | 1,090,669 | |
Fieldwood Energy, Inc.(a)(c) | | | 2,201 | | | | 83,638 | |
Fifth Third Bancorp | | | 686 | | | | 16,142 | |
FleetCor Technologies, Inc.(a) | | | 4,073 | | | | 756,438 | |
Fortune Brands Home & Security, Inc. | | | 898 | | | | 34,115 | |
General Electric Co. | | | 1,677 | | | | 12,695 | |
General Motors Co.(d) | | | 396 | | | | 13,246 | |
Gilead Sciences, Inc. | | | 12,972 | | | | 811,399 | |
Global Payments, Inc. | | | 336 | | | | 34,652 | |
Goldman Sachs Group, Inc. (The) | | | 229 | | | | 38,254 | |
Halfmoon Parent, Inc. | | | 75 | | | | 14,170 | |
Hartford Financial Services Group, Inc. (The) | | | 1,054 | | | | 46,850 | |
HCA Healthcare, Inc. | | | 3,797 | | | | 472,537 | |
Helmerich & Payne, Inc. | | | 243 | | | | 11,649 | |
Hewlett Packard Enterprise Co. | | | 1,186 | | | | 15,667 | |
Home Depot, Inc. (The) | | | 253 | | | | 43,470 | |
HP, Inc. | | | 563 | | | | 11,519 | |
Humana, Inc. | | | 49 | | | | 14,038 | |
Huntsman Corp. | | | 443 | | | | 8,545 | |
Illumina, Inc.(a) | | | 71 | | | | 21,295 | |
Intel Corp. | | | 1,505 | | | | 70,630 | |
International Business Machines Corp. | | | 307 | | | | 34,897 | |
Intuit, Inc. | | | 246 | | | | 48,425 | |
Intuitive Surgical, Inc.(a) | | | 25 | | | | 11,973 | |
Jawbone Health Hub, Inc. (Acquired 01/24/17, cost $0)(a)(b)(c) | | | 6,968 | | | | — | |
Johnson & Johnson | | | 17,411 | | | | 2,246,890 | |
JPMorgan Chase & Co. | | | 6,347 | | | | 619,594 | |
Kinder Morgan, Inc. | | | 208 | | | | 3,199 | |
KLA-Tencor Corp. | | | 155 | | | | 13,871 | |
Kohl’s Corp. | | | 208 | | | | 13,799 | |
Kroger Co. (The) | | | 557 | | | | 15,317 | |
Las Vegas Sands Corp. | | | 357 | | | | 18,582 | |
Lear Corp. | | | 69 | | | | 8,477 | |
Liberty Broadband Corp., Class A(a) | | | 1,215 | | | | 87,249 | |
Liberty Broadband Corp., Class C(a) | | | 5,113 | | | | 368,290 | |
Liberty Media Corp.-Liberty SiriusXM, Class A(a) | | | 4,266 | | | | 156,989 | |
Liberty Media Corp.-Liberty SiriusXM, Class C(a) | | | 7,149 | | | | 264,370 | |
Lookout, Inc. (Acquired 03/04/15, cost $16,643)(a)(b)(c) | | | 1,457 | | | | 29 | |
| | |
| 66 | | 2018 BLACKROCK ANNUAL REPORTTO SHAREHOLDERS |
| | |
Consolidated Schedule of Investments (continued) December 31, 2018 | | BlackRock Global Allocation Portfolio (Percentages shown are based on Net Assets) |
| | | | | | | | |
| Security | |
Shares | | | Value | |
|
| United States (continued) | |
Lowe’s Cos., Inc. | | | 1,039 | | | $ | 95,962 | |
Marathon Petroleum Corp. | | | 9,189 | | | | 542,243 | |
Marsh & McLennan Cos., Inc. | | | 14,134 | | | | 1,127,186 | |
Masco Corp. | | | 3,084 | | | | 90,176 | |
Mastercard, Inc., Class A(d) | | | 361 | | | | 68,103 | |
McDonald’s Corp. | | | 148 | | | | 26,280 | |
McKesson Corp. | | | 143 | | | | 15,797 | |
Medtronic plc | | | 674 | | | | 61,307 | |
Merck & Co., Inc. | | | 1,379 | | | | 105,369 | |
MetLife, Inc. | | | 612 | | | | 25,129 | |
MGM Resorts International | | | 13,863 | | | | 336,316 | |
Micron Technology, Inc.(a) | | | 633 | | | | 20,085 | |
Microsoft Corp. | | | 24,741 | | | | 2,512,943 | |
Mondelez International, Inc., Class A | | | 1,358 | | | | 54,361 | |
Morgan Stanley | | | 18,078 | | | | 716,793 | |
Newmont Mining Corp. | | | 14,545 | | | | 503,984 | |
NextEra Energy Partners LP | | | 6,379 | | | | 274,616 | |
NextEra Energy, Inc. | | | 8,138 | | | | 1,414,547 | |
NIKE, Inc., Class B | | | 180 | | | | 13,345 | |
Norfolk Southern Corp. | | | 127 | | | | 18,992 | |
Northrop Grumman Corp. | | | 37 | | | | 9,061 | |
NRG Energy, Inc. | | | 350 | | | | 13,860 | |
Occidental Petroleum Corp. | | | 293 | | | | 17,984 | |
Omnicom Group, Inc. | | | 894 | | | | 65,477 | |
Oracle Corp. | | | 4,417 | | | | 199,428 | |
Packaging Corp. of America | | | 162 | | | | 13,521 | |
Paychex, Inc. | | | 290 | | | | 18,893 | |
PayPal Holdings, Inc.(a) | | | 148 | | | | 12,445 | |
PepsiCo, Inc. | | | 763 | | | | 84,296 | |
Pfizer, Inc. | | | 34,539 | | | | 1,507,627 | |
PG&E Corp.(a) | | | 352 | | | | 8,360 | |
Philip Morris International, Inc. | | | 9,209 | | | | 614,793 | |
Phillips 66 | | | 480 | | | | 41,352 | |
Procter & Gamble Co. (The) | | | 8,276 | | | | 760,730 | |
Prudential Financial, Inc. | | | 154 | | | | 12,559 | |
Pure Storage, Inc., Class A(a) | | | 15,209 | | | | 244,561 | |
PVH Corp. | | | 111 | | | | 10,317 | |
QUALCOMM, Inc. | | | 10,743 | | | | 611,384 | |
Raytheon Co. | | | 2,284 | | | | 350,251 | |
Red Hat, Inc.(a) | | | 96 | | | | 16,861 | |
Reinsurance Group of America, Inc. | | | 137 | | | | 19,211 | |
Rockwell Automation, Inc. | | | 182 | | | | 27,387 | |
Ross Stores, Inc. | | | 201 | | | | 16,723 | |
Royal Caribbean Cruises Ltd. | | | 128 | | | | 12,517 | |
Schlumberger Ltd. | | | 4,159 | | | | 150,057 | |
Sempra Energy(d) | | | 3,452 | | | | 373,472 | |
Sprint Corp.(a) | | | 78 | | | | 454 | |
St Joe Co. (The)(a) | | | 2,545 | | | | 33,518 | |
Starbucks Corp. | | | 9,100 | | | | 586,040 | |
State Street Corp. | | | 112 | | | | 7,064 | |
Stryker Corp. | | | 375 | | | | 58,781 | |
SunTrust Banks, Inc. | | | 10,308 | | | | 519,936 | |
Symantec Corp. | | | 63 | | | | 1,190 | |
Sysco Corp. | | | 171 | | | | 10,715 | |
Target Corp. | | | 181 | | | | 11,962 | |
Tenet Healthcare Corp.(a) | | | 3,634 | | | | 62,287 | |
Thermo Fisher Scientific, Inc. | | | 279 | | | | 62,437 | |
Travelers Cos., Inc. (The) | | | 597 | | | | 71,491 | |
Union Pacific Corp. | | | 111 | | | | 15,344 | |
United Continental Holdings, Inc.(a) | | | 7,213 | | | | 603,944 | |
United Technologies Corp. | | | 5,137 | | | | 546,988 | |
UnitedHealth Group, Inc. | | | 798 | | | | 198,798 | |
US Bancorp | | | 385 | | | | 17,594 | |
Valero Energy Corp. | | | 443 | | | | 33,212 | |
VeriSign, Inc.(a) | | | 155 | | | | 22,985 | |
| | | | | | | | | | | | |
| Security | | | | |
Shares | | | Value | |
United States (continued) | | | | | | | | | | | | |
Verizon Communications, Inc. | | | | | | | 11,787 | | | $ | 662,665 | |
VF Corp. | | | | | | | 74 | | | | 5,279 | |
Visa, Inc., Class A | | | | | | | 606 | | | | 79,956 | |
Vistra Energy Corp.(a) | | | | | | | 3,665 | | | | 83,892 | |
VMware, Inc., Class A(a) | | | | | | | 128 | | | | 17,553 | |
Vornado Realty Trust | | | | | | | 247 | | | | 15,321 | |
Walgreens Boots Alliance, Inc. | | | | | | | 35 | | | | 2,392 | |
Walmart, Inc. | | | | | | | 483 | | | | 44,991 | |
Walt Disney Co. (The) | | | | | | | 194 | | | | 21,272 | |
Waste Management, Inc. | | | | | | | 91 | | | | 8,098 | |
Wells Fargo & Co. | | | | | | | 31,590 | | | | 1,455,667 | |
Western Digital Corp. | | | | | | | 12,310 | | | | 455,101 | |
Weyerhaeuser Co. | | | | | | | 649 | | | | 14,187 | |
Williams Cos., Inc. (The) | | | | | | | 63,200 | | | | 1,393,560 | |
Wyndham Destinations, Inc. | | | | | | | 331 | | | | 11,863 | |
Xcel Energy, Inc. | | | | | | | 184 | | | | 9,066 | |
Yum! Brands, Inc. | | | | | | | 281 | | | | 25,830 | |
Zoetis, Inc. | | | | | | | 171 | | | | 14,627 | |
Zynga, Inc., Class A(a) | | | | | | | 93,070 | | | | 365,765 | |
| | | | | | | | |
| | | | | | | | | | | 55,189,998 | |
| | | | | | | | |
| |
Total Common Stocks— 58.4%
(Cost: $105,310,372) | | | | 101,582,354 | |
| | | | | | | | |
| | | |
| | | | | | Par
(000) | | | | |
| | | |
Corporate Bonds— 4.6% | | | | | | | | | | | | |
| | | |
| Australia— 0.4% | | | | | | | | | |
Quintis Australia Pty. Ltd.(c)(e)(h): | | | | | | | | | | | | |
7.50% (7.50% Cash or 8.00% PIK), 10/01/26 | | | USD | | | | 360 | | | | 354,367 | |
12.00% (0.00% Cash or 0.00% PIK), 10/01/28 | | | | | | | 427 | | | | 426,980 | |
| | | | | | | | |
| | | | | | | | | | | 781,347 | |
| | | |
| Belgium— 0.1% | | | | | | | | | |
Anheuser-Busch InBev Worldwide, Inc.: | | | | | | | | | | | | |
3.50%, 01/12/24 | | | | | | | 80 | | | | 78,252 | |
4.00%, 04/13/28 | | | | | | | 132 | | | | 126,262 | |
| | | | | | | | |
| | | | | | | | | | | 204,514 | |
| | | |
| Chile— 0.0% | | | | | | | | | |
Inversiones Alsacia SA, 8.00%, 12/31/18(a)(e)(i) | | | | | | | 166 | | | | 3,326 | |
| | | | | | | | |
| | | |
| China— 0.0% | | | | | | | | | |
China Milk Products Group Ltd., 0.00%, 01/05/12(a)(i)(j)(k) | | | | | | | 300 | | | | 3,000 | |
| | | | | | | | |
| | | |
| France— 0.1% | | | | | | | | | |
Danone SA, 2.59%, 11/02/23(e) | | | | | | | 200 | | | | 190,138 | |
| | | | | | | | |
| | | |
| Germany— 0.2% | | | | | | | | | |
Bayer Capital Corp. BV, 5.63%, 11/22/19(e)(j) | | | EUR | | | | 300 | | | | 262,850 | |
| | | | | | | | |
| | | |
| India— 0.0% | | | | | | | | | |
REI Agro Ltd.(a)(c)(i)(j): | | | | | | | | | | | | |
5.50%, 11/13/14(e) | | | USD | | | | 220 | | | | — | |
5.50%, 11/13/14 | | | | | | | 152 | | | | — | |
| | | | | | | | |
| | | | | | | | | | | — | |
| | | |
| Japan— 0.2% | | | | | | | | | |
Sumitomo Mitsui Financial Group, Inc., 3.94%, 10/16/23 | | | | | | | 410 | | | | 417,208 | |
| | | | | | | | | | | | |
|
| Luxembourg— 0.0% | |
Intelsat Jackson Holdings SA, 8.00%, 02/15/24(e) | | | | | | | 37 | | | | 38,110 | |
| | | | | | | | | | | | |
|
| Netherlands— 0.1% | |
ING Groep NV, 4.10%, 10/02/23 | | | | | | | 200 | | | | 199,879 | |
| | | | | | | | | | | | |
|
| Singapore— 0.1% | |
CapitaLand Ltd., 1.95%, 10/17/23(e)(j) | | | SGD | | | | 250 | | | | 177,652 | |
| | | | | | | | | | | | |
| | | | |
| CONSOLIDATED SCHEDULES OF INVESTMENTS | | | 67 | |
| | |
Consolidated Schedule of Investments (continued) December 31, 2018 | | BlackRock Global Allocation Portfolio (Percentages shown are based on Net Assets) |
| | | | | | | | | | | | |
| Security | | | | | Par
(000) | | | Value | |
|
| Turkey— 0.1% | |
Bio City Development Co. BV, 8.00%, 07/06/20(a)(c)(e)(i)(j) | | | USD | | | | 800 | | | $ | 124,000 | |
| | | | | | | | | | | | |
|
| United Kingdom— 0.1% | |
HSBC Holdings plc, (LIBOR USD 3 Month + 1.06%), 3.26%, 03/13/23(l) | | | | | | | 200 | | | | 195,731 | |
| | | | | | | | | | | | |
| | | |
| United States— 3.2% | | | | | | | | | |
Allergan Funding SCS, 3.45%, 03/15/22 | | | | | | | 127 | | | | 124,973 | |
Allergan Sales LLC, 5.00%, 12/15/21(e) | | | | | | | 63 | | | | 64,821 | |
American Express Co., 3.70%, 08/03/23 | | | | | | | 285 | | | | 285,824 | |
Apple, Inc.: | | | | | | | | | | | | |
3.35%, 02/09/27 | | | | | | | 233 | | | | 227,033 | |
3.20%, 05/11/27 | | | | | | | 224 | | | | 216,178 | |
AT&T, Inc., 3.60%, 02/17/23 | | | | | | | 278 | | | | 276,277 | |
AvalonBay Communities, Inc., 3.50%, 11/15/24 | | | | | | | 28 | | | | 27,832 | |
Bank of America Corp.: | | | | | | | | | | | | |
(LIBOR USD 3 Month + 0.66%), 2.37%, 07/21/21(l) | | | | | | | 58 | | | | 56,962 | |
3.30%, 01/11/23 | | | | | | | 133 | | | | 130,986 | |
4.00%, 01/22/25 | | | | | | | 71 | | | | 69,165 | |
Becton Dickinson and Co.: | | | | | | | | | | | | |
3.13%, 11/08/21 | | | | | | | 129 | | | | 127,227 | |
2.89%, 06/06/22 | | | | | | | 106 | | | | 102,663 | |
3.36%, 06/06/24 | | | | | | | 57 | | | | 54,747 | |
BP Capital Markets America, Inc., 3.79%, 02/06/24 | | | | | | | 115 | | | | 116,241 | |
Capital One Financial Corp.: | | | | | | | | | | | | |
3.20%, 01/30/23 | | | | | | | 96 | | | | 93,420 | |
3.30%, 10/30/24 | | | | | | | 40 | | | | 37,830 | |
Citigroup, Inc., 2.45%, 01/10/20 | | | | | | | 128 | | | | 126,972 | |
Comcast Corp.: | | | | | | | | | | | | |
3.45%, 10/01/21 | | | | | | | 106 | | | | 107,075 | |
2.75%, 03/01/23 | | | | | | | 134 | | | | 130,418 | |
3.70%, 04/15/24 | | | | | | | 264 | | | | 265,612 | |
CVS Health Corp., 3.70%, 03/09/23 | | | | | | | 409 | | | | 404,622 | |
DowDuPont, Inc., 3.77%, 11/15/20 | | | | | | | 105 | | | | 106,007 | |
eBay, Inc., 2.75%, 01/30/23 | | | | | | | 75 | | | | 72,104 | |
Edgewell Personal Care Co.: | | | | | | | | | | | | |
4.70%, 05/19/21 | | | | | | | 66 | | | | 65,010 | |
4.70%, 05/24/22 | | | | | | | 65 | | | | 62,563 | |
Enterprise Products Operating LLC: | | | | | | | | | | | | |
3.35%, 03/15/23 | | | | | | | 71 | | | | 70,030 | |
3.90%, 02/15/24 | | | | | | | 40 | | | | 40,339 | |
Gilead Sciences, Inc., 3.25%, 09/01/22 | | | | | | | 133 | | | | 132,687 | |
Goldman Sachs Group, Inc. (The),
(LIBOR USD 3 Month + 1.05%), 2.91%, 06/05/23(l) | | | | | | | 133 | | | | 127,679 | |
Halfmoon Parent, Inc.(e): | | | | | | | | | | | | |
3.40%, 09/17/21 | | | | | | | 181 | | | | 180,588 | |
3.75%, 07/15/23 | | | | | | | 154 | | | | 153,487 | |
Hughes Satellite Systems Corp., 7.63%, 06/15/21 | | | | | | | 21 | | | | 21,788 | |
Northrop Grumman Corp., 2.55%, 10/15/22 | | | | | | | 133 | | | | 128,698 | |
Philip Morris International, Inc.: | | | | | | | | | | | | |
2.50%, 11/02/22 | | | | | | | 24 | | | | 23,066 | |
3.60%, 11/15/23 | | | | | | | 53 | | | | 53,122 | |
QUALCOMM, Inc.: | | | | | | | | | | | | |
2.60%, 01/30/23 | | | | | | | 67 | | | | 64,475 | |
2.90%, 05/20/24 | | | | | | | 80 | | | | 76,176 | |
Sempra Energy, 2.88%, 10/01/22 | | | | | | | 35 | | | | 33,755 | |
Sherwin-Williams Co. (The), 2.25%, 05/15/20 | | | | | | | 25 | | | | 24,617 | |
Simon Property Group LP, 2.75%, 06/01/23 | | | | | | | 53 | | | | 51,359 | |
Starbucks Corp., 3.10%, 03/01/23 | | | | | | | 134 | | | | 131,984 | |
UnitedHealth Group, Inc.: | | | | | | | | | | | | |
3.50%, 06/15/23 | | | | | | | 133 | | | | 134,147 | |
3.50%, 02/15/24 | | | | | | | 85 | | | | 85,544 | |
| | | | | | | | | | | | |
| Security | | | | | Par
(000) | | | Value | |
| | | |
| United States (continued) | | | | | | | | | |
Verizon Communications, Inc., 3.13%, 03/16/22 | | | USD | | | | 139 | | | $ | 138,073 | |
Walgreen Co., 3.10%, 09/15/22 | | | | | | | 136 | | | | 132,668 | |
Wells Fargo & Co., 3.07%, 01/24/23 | | | | | | | 28 | | | | 27,270 | |
Wells Fargo Bank NA, 3.55%, 08/14/23 | | | | | | | 250 | | | | 248,943 | |
Williams Cos., Inc. (The), 3.70%, 01/15/23 | | | | | | | 67 | | | | 65,359 | |
| | | | | | | | | | | | |
| | | | | | | | | | | 5,498,416 | |
| | | | | | | | | | | | |
| |
Total Corporate Bonds — 4.6%
(Cost: $9,776,390) | | | | 8,096,171 | |
| | | | | |
|
Floating Rate Loan Interests — 0.2%(m) | |
|
| United States — 0.2% | |
Fieldwood Energy LLC, 2nd Lien Term Loan,
(LIBOR USD 1 Month + 7.25%), 9.77%, 04/11/23 | | | | | | | 75 | | | | 65,318 | |
Fieldwood Energy LLC, Term Loan,
(LIBOR USD 1 Month + 5.25%), 7.77%, 04/11/22 | | | | | | | 56 | | | | 51,885 | |
Hilton Worldwide Finance LLC, 1st Lien Term Loan B2, (LIBOR USD 1 Month + 1.75%), 4.26%, 10/25/23 | | | | | | | 212 | | | | 203,710 | |
| | | | | | | | | | | | |
| | | | | | | | | | | 320,913 | |
| | | | | | | | | | | | |
| |
Total Floating Rate Loan Interests — 0.2%
(Cost: $288,619) | | | | 320,913 | |
| | | | | |
|
Foreign Government Obligations — 2.8% | |
|
| Argentina — 0.8% | |
Republic of Argentina: | | | | | | | | | | | | |
3.38%, 01/15/23 | | | EUR | | | | 110 | | | | 99,881 | |
6.88%, 01/26/27 | | | USD | | | | 559 | | | | 424,840 | |
5.88%, 01/11/28 | | | | | | | 808 | | | | 578,730 | |
7.82%, 12/31/33 | | | EUR | | | | 322 | | | | 308,072 | |
| | | | | | | | | | | | |
| | | | | | | | | | | 1,411,523 | |
|
| Australia — 0.2% | |
Commonwealth of Australia, 3.00%, 03/21/47 | | | AUD | | | | 568 | | | | 413,921 | |
| | | | | | | | | | | | |
|
| Canada — 0.2% | |
Canadian Government Bond, 0.75%, 03/01/21 | | | CAD | | | | 446 | | | | 318,982 | |
| | | | | | | | | | | | |
| | | |
| Germany — 0.9% | | | | | | | | | |
Federal Republic of Germany, 0.50%, 02/15/28 | | | EUR | | | | 1,265 | | | | 1,491,788 | |
| | | | | | | | |
| | | |
| Mexico — 0.7% | | | | | | | | | |
United Mexican States: | | | | | | | | | | | | |
6.50%, 06/10/21 | | | MXN | | | | 128 | | | | 619,686 | |
8.00%, 12/07/23 | | | | | | | 122 | | | | 605,596 | |
| | | | | | | | |
| | | | | | | | | | | 1,225,282 | |
| | | | | | | | | | | | |
| |
Total Foreign Government Obligations — 2.8%
(Cost: $5,298,422) | | | | 4,861,496 | |
| | | | | | | | |
| | | |
| | | | | | Shares | | | | |
| | | |
Investment Companies — 1.3% | | | | | | | | | | | | |
iShares Gold Trust(a)(n)(u) | | | | | | | 126,072 | | | | 1,549,425 | |
SPDR Gold Shares(a)(g)(n) | | | | | | | 4,023 | | | | 487,789 | |
VanEck Vectors Gold Miners ETF(d) | | | | | | | 10,194 | | | | 214,991 | |
| | | | | | | | |
| |
Total Investment Companies — 1.3%
(Cost: $2,367,452) | | | | 2,252,205 | |
| | | | | | | | |
| | |
| 68 | | 2018 BLACKROCK ANNUAL REPORTTO SHAREHOLDERS |
| | |
Consolidated Schedule of Investments (continued) December 31, 2018 | | BlackRock Global Allocation Portfolio (Percentages shown are based on Net Assets) |
| | | | | | | | | | | | |
| Security | | | | | Par
(000) | | | Value | |
| |
Preferred Securities — 2.5% | | | | | |
| | | |
Capital Trusts — 0.9% | | | | | | | | | | | | |
| | | |
| United Kingdom — 0.3%(m)(o) | | | | | | | | | |
HSBC Holdings plc, 6.37% | | | USD | | | | 235 | | | $ | 218,550 | |
Lloyds Bank plc, 13.00% | | | GBP | | | | 155 | | | | 317,157 | |
| | | | | | | | |
| | | | | | | | | | | 535,707 | |
| | | |
| United States — 0.6% | | | | | | | | | |
American Express Co., Series C, 4.90%(m)(o) | | | | | | | 88 | | | | 84,260 | |
Citigroup, Inc.(m)(o): | | | | | | | | | | | | |
Series O, 5.87% | | | | | | | 300 | | | | 289,500 | |
Series Q, 5.95% | | | | | | | 121 | | | | 116,765 | |
Goldman Sachs Group, Inc. (The), Series M, 5.38%(m)(o) | | | | | | | 141 | | | | 136,244 | |
Morgan Stanley, Series H, 5.45%(m)(o) | | | | | | | 100 | | | | 97,262 | |
NBCUniversal Enterprise, Inc., 5.25%(e)(o) | | | | | | | 100 | | | | 101,250 | |
Prudential Financial, Inc.(m): | | | | | | | | | | | | |
5.63%, 06/15/43 | | | | | | | 51 | | | | 49,946 | |
5.87%, 09/15/42 | | | | | | | 76 | | | | 76,760 | |
USB Capital IX, 3.50%(m)(o) | | | | | | | 37 | | | | 27,380 | |
| | | | | | | | |
| | | | | | | | | | | 979,367 | |
| | | | | | | | |
| | |
Total Capital Trusts — 0.9%
(Cost: $1,587,310) | | | | | | | | 1,515,074 | |
| | | | | | | | |
| | | |
| | | | | | Shares | | | | |
| |
| Preferred Stocks — 1.2% | | | | |
| | | |
| Brazil — 0.1% | | | | | | | | | |
Braskem SA (Preference) | | | | | | | 200 | | | | 2,445 | |
Itau Unibanco Holding SA (Preference) | | | | | | | 10,134 | | | | 92,822 | |
Petroleo Brasileiro SA (Preference)(a) | | | | | | | 332 | | | | 1,943 | |
| | | | | | | | | | | | |
| | | | | | | | | | | 97,210 | |
| | | |
| South Korea — 0.0% | | | | | | | | | |
Samsung Electronics Co. Ltd. (Preference)(a) | | | | | | | 429 | | | | 12,258 | |
| | | | | | | | | | | | |
| | | |
| United States — 1.1% | | | | | | | | | |
Grand Rounds, Inc., Series C
(Acquired 03/31/15, cost $127,944), 0.00%(a)(b)(c) | | | | | | | 46,081 | | | | 112,899 | |
Grand Rounds, Inc., Series D
(Acquired 05/01/18, cost $51,112), 0.00%(a)(b)(c) | | | | | | | 21,089 | | | | 51,036 | |
Lookout, Inc., Series F
(Acquired09/19/14-10/22/14, cost $243,061), 0.00%(a)(b)(c) | | | | | | | 21,278 | | | | 128,519 | |
Palantir Technologies, Inc., Series I
(Acquired 02/11/14, cost $272,246), 0.00%(a)(b)(c) | | | | | | | 44,412 | | | | 240,269 | |
Uber Technologies, Inc., Series D
(Acquired 06/06/14, cost $418,728), 0.00%(a)(b)(c) | | | | | | | 26,992 | | | | 1,213,830 | |
Wells Fargo & Co., Series L, 7.50%(j)(o) | | | | | | | 57 | | | | 71,932 | |
Welltower, Inc., Series I, 6.50%(d)(j)(o) | | | | | | | 2,453 | | | | 154,907 | |
| | | | | | | | | | | | |
| | | | | | | | | | | 1,973,392 | |
| | | |
Total Preferred Stocks — 1.2%
(Cost: $1,393,312) | | | | | | | | | | | 2,082,860 | |
| | | | | | | | | | | | |
| | | |
Trust Preferreds — 0.4% | | | | | | | | | | | | |
| | | |
| China — 0.2% | | | | | | | | | |
Mandatory Exchangeable Trust, 5.75%, 06/01/19(e)(j) | | | | | | | 2,682 | | | | 413,913 | |
| | | | | | | | | | | | |
|
| United States — 0.2%(m) | |
Citigroup Capital XIII, 8.89%, 10/30/40 | | | | | | | 6,206 | | | | 164,024 | |
GMAC Capital Trust I, Series 2, 8.40%, 02/15/40 | | | | | | | 6,800 | | | | 172,380 | |
| | | | | | | | | | | | |
| | | | | | | | | | | 336,404 | |
| | | | | | | | | | | | |
| |
Total Trust Preferreds — 0.4%
(Cost: $593,769) | | | | 750,317 | |
| | | | | | | | | | | | |
| |
Total Preferred Securities — 2.5%
(Cost: $3,574,391) | | | | 4,348,251 | |
| | | | | | | | | | | | |
| | | | | | | | | | | | |
| Security | | | | | Par
(000) | | | Value | |
|
U.S. Treasury Obligations — 24.3% | |
U.S. Treasury Inflation Linked Notes, 0.63%, 04/15/23 | | | USD | | | | 1,441 | | | $ | 1,416,963 | |
U.S. Treasury Notes: | | | | | | | | | | | | |
1.50%, 11/30/19(n) | | | | | | | 3,346 | | | | 3,311,098 | |
2.75%, 08/31/23 | | | | | | | 4,305 | | | | 4,353,263 | |
2.88%, 09/30/23-11/30/25 | | | | | | | 15,045 | | | | 15,296,375 | |
2.88%, 10/31/23(g) | | | | | | | 11,928 | | | | 12,126,591 | |
3.00%, 10/31/25(p) | | | | | | | 5,623 | | | | 5,768,217 | |
| | | | | | | | | | | | |
| |
Total U.S. Treasury Obligations — 24.3%
(Cost: $41,455,070) | | | | 42,272,507 | |
| | | | | | | | | | | | |
| |
Total Long-Term Investments — 94.1%
(Cost: $168,070,716) | | | | 163,733,897 | |
| | | | | | | | | | | | |
| |
Short-Term Securities — 7.5% | | | | | |
|
Foreign Government Obligations — 2.0%(q) | |
| | | |
| Japan — 2.0% | | | | | | | | | |
Japan Treasury Bills: | | | | | | | | | | | | |
(0.32)%, 01/28/19 | | | JPY | | | | 110,300 | | | | 1,006,448 | |
(0.34)%, 02/04/19 | | | | | | | 110,400 | | | | 1,007,394 | |
(0.25)%, 03/04/19 | | | | | | | 114,050 | | | | 1,040,828 | |
(0.16)%, 03/25/19 | | | | | | | 48,400 | | | | 441,743 | |
| | | | | | | | | | | | |
| | | | | | | | | | | 3,496,413 | |
| | | | | | | | | | | | |
| |
Total Foreign Government Obligations — 2.0%
(Cost: $3,412,773) | | | | 3,496,413 | |
| | | | | | | | | | | | |
| | | |
| | | | | | Shares | | | | |
|
Money Market Funds — 1.6%(r)(u) | |
BlackRock Liquidity Funds,T-Fund, Institutional Class, 2.32% | | | | | | | 572,384 | | | | 572,384 | |
SL Liquidity Series, LLC, Money Market Series, 2.57%(s) | | | | | | | 2,217,730 | | | | 2,217,509 | |
| | | | | | | | |
| | |
Total Money Market Funds — 1.6%
(Cost: $2,789,953) | | | | | | | | 2,789,893 | |
| | | | | | | | |
| | | |
| | | | | | Par
(000) | | | | |
| | | |
Time Deposits — 0.0% | | | | | | | | | | | | |
| | | |
| Canada — 0.0% | | | | | | | | | |
Brown Brothers Harriman & Co., 0.84%, 01/02/19 | | | CAD | | | | 6 | | | | 4,582 | |
| | | | | | | | | | | | |
| | | |
| Europe — 0.0% | | | | | | | | | |
Citibank NA, (0.57)%, 01/02/19 | | | EUR | | | | 18 | | | | 20,211 | |
| | | | | | | | | | | | |
| | | |
| Hong Kong — 0.0% | | | | | | | | | |
Brown Brothers Harriman & Co., 1.52%, 01/02/19 | | | HKD | | | | 15 | | | | 1,975 | |
| | | | | | | | | | | | |
| | | |
| United Kingdom — 0.0% | | | | | | | | | |
JPMorgan Chase & Co., 0.37%, 01/02/19 | | | GBP | | | | — | (t) | | | 296 | |
| | | | | | | | | | | | |
| | | |
| United States — 0.0% | | | | | | | | | |
Brown Brothers Harriman & Co., 2.42%, 01/02/19 | | | USD | | | | 1 | | | | 985 | |
| | | | | | | | | | | | |
| |
Total Time Deposits — 0.0%
(Cost: $28,049) | | | | 28,049 | |
| | | | | | | | |
|
U.S. Treasury Obligations — 3.9% | |
U.S. Treasury Bills(q): | | | | | | | | | | | | |
2.28%, 01/08/19 | | | | | | | 4,000 | | | | 3,998,502 | |
2.31%, 01/15/19 | | | | | | | 2,000 | | | | 1,998,358 | |
2.35%, 01/22/19 | | | | | | | 750 | | | | 749,041 | |
| | | | | | | | | | | | |
| |
Total U.S. Treasury Obligations — 3.9%
(Cost: $6,745,408) | | | | 6,745,901 | |
| | | | | | | | �� |
| | | | |
| CONSOLIDATED SCHEDULES OF INVESTMENTS | | | 69 | |
| | |
Consolidated Schedule of Investments (continued) December 31, 2018 | | BlackRock Global Allocation Portfolio (Percentages shown are based on Net Assets) |
| | | | | | | | | | | | |
| Security | | | | | Par
(000) | | | Value | |
| |
Total Short-Term Securities — 7.5%
(Cost: $12,976,183) | | | $ | 13,060,256 | |
| | | | | | | | |
| |
Total Options Purchased — 0.2%
(Cost: $962,935) | | | | 426,631 | |
| | | | | | | | |
| |
Total Investments Before Options Written and Investments Sold Short — 101.8%
(Cost: $182,009,834) | | | | 177,220,784 | |
| | | | | | | | |
| |
Total Options Written — (0.8)%
(Premiums Received — $880,316) | | | | (1,355,470 | ) |
| | | | | | | | |
| | | |
| | | | | | Shares | | | | |
| | | |
Investments Sold Short — (0.2)% | | | | | | | | | | | | |
| | | |
Common Stocks — (0.2)% | | | | | | | | | | | | |
| | | |
| France — (0.1)% | | | | | | | | | |
Pernod Ricard SA | | | | | | | 600 | | | | (98,472 | ) |
| | | | | | | | | | | | |
| | | |
| Japan — (0.1)% | | | | | | | | | |
SUMCO Corp. | | | | | | | 9,800 | | | | (109,143 | ) |
Yaskawa Electric Corp. | | | | | | | 4,800 | | | | (117,332 | ) |
| | | | | | | | | | | | |
| | | | | | | | | | | (226,475 | ) |
| | | |
| United States — 0.0% | | | | | | | | | |
LyondellBasell Industries NV, Class A | | | | | | | 735 | | | | (61,122 | ) |
| | | | | | | | | | | | |
| |
Total Common Stocks — (0.2)%
(Proceeds: $491,633) | | | | (386,069 | ) |
| | | | | | | | | | | | |
| |
Total Investments Sold Short — (0.2)%
(Proceeds: $491,633) | | | | (386,069 | ) |
| | | | | | | | | | | | |
| |
Total Investments Net of Options Written and Investments Sold Short — 100.8%
(Cost: $180,637,885) | | | | 175,479,245 | |
| | | | | | | | | | | | |
| |
Liabilities in Excess of Other Assets — (0.8)% | | | | (1,496,183 | ) |
| | | | | | | | | | | | |
| |
Net Assets — 100.0% | | | $ | 173,983,062 | |
| | | | | | | | |
| (a) | Non-income producing security. |
| (b) | Restricted security as to resale, excluding 144A securities. The Fund held restricted securities with a current value of $1,936,743, representing 1.11% of its net assets as of period end, and an original cost of $1,715,462. |
| (c) | Security is valued using significant unobservable inputs and is classified as Level 3 in the fair value hierarchy. |
| (d) | Security, or a portion of the security, is on loan. |
| (e) | Security exempt from registration pursuant to Rule 144A under the Securities Act of 1933, as amended. These securities may be resold in transactions exempt from registration to qualified institutional investors. |
| (f) | A security contractually bound to one or more other securities to form a single saleable unit which cannot be sold separately. |
| (g) | All or a portion of the security has been pledged and/or segregated as collateral in connection with outstanding exchange-traded options written. |
| (h) | Payment-in-kind security which may pay interest/dividends in additional par/shares and/or in cash. Rates shown are the current rate and possible payment rates. |
| (i) | Issuer filed for bankruptcy and/or is in default. |
| (l) | Variable rate security. Security may be issued at a fixed coupon rate, which converts to a variable rate at a specified date. Rate shown is the rate in effect as of period end. |
| (m) | Variable rate security. Rate shown is the rate in effect as of period end. |
| (n) | All or a portion of the security is held by a wholly-owned subsidiary. See Note 1 of the Notes to Financial Statements for details on the wholly-owned subsidiary. |
| (o) | Perpetual security with no stated maturity date. |
| (p) | All or a portion of the security has been pledged in connection with outstanding centrally cleared swaps. |
| (q) | Rates are discount rates or a range of discount rates as of period end. |
| (r) | Annualized7-day yield as of period end. |
| (s) | Security was purchased with the cash collateral from loaned securities. |
| (t) | Amount is less than $500. |
| (u) | During the year ended December 31, 2018, investments in issuers considered to be affiliates of the Fund for purposes of Section 2(a)(3) of the Investment Company Act of 1940, as amended, and/or related parties of the Fund were as follows: |
| | | | | | | | | | | | | | | | | | | | | | | | | | | | | | | | |
| Affiliated Persons and/or Related Parties | | Shares
Held at
12/31/17 | | | Shares
Purchased | | | Shares
Sold | | | Shares
Held at
12/31/18 | | | Value at
12/31/18 | | | Income | | | Net Realized
Gain (Loss)(a) | | | Change in Unrealized Appreciation (Depreciation) | |
BlackRock Liquidity Funds,T-Fund, Institutional Class | | | 8,343,679 | | | | — | | | | (7,771,295 | )(b) | | | 572,384 | | | $ | 572,384 | | | $ | 53,944 | | | $ | — | | | $ | — | |
SL Liquidity Series, LLC, Money Market Series | | | 4,119,672 | | | | — | | | | (1,901,942 | )(b) | | | 2,217,730 | | | | 2,217,509 | | | | 18,967 | (c) | | | 1,209 | | | | 43 | |
iShares Gold Trust | | | 55,980 | | | | 70,092 | | | | — | | | | 126,072 | | | | 1,549,425 | | | | — | | | | — | | | | (55,469 | ) |
| | | | | | | | | | | | | | | | | | | | | | | | | | | | | | | | |
| | | $ | 4,339,318 | | | $ | 72,911 | | | $ | 1,209 | | | $ | (55,426 | ) |
| | | | | | | | | | | | | | | | | | | | | | | | | | | | | | | | |
| | (a) | Includes capital gain distribution, if applicable. | |
| | (b) | Represents net shares sold. | |
| | (c) | Represents securities lending income earned from the reinvestment of cash collateral from loaned securities, net of fees and collateral investment expenses, and other payments to and from borrowers of securities. | |
| | |
| 70 | | 2018 BLACKROCK ANNUAL REPORTTO SHAREHOLDERS |
| | |
Consolidated Schedule of Investments (continued) December 31, 2018 | | BlackRock Global Allocation Portfolio |
Derivative Financial Instruments Outstanding as of Period End
Futures Contracts
| | | | | | | | | | | | | | | | |
| Description | | Number of
Contracts | | | Expiration
Date | | | Notional
Amount (000) | | | Value/
Unrealized
Appreciation (Depreciation) | |
Short Contracts | | | | | | | | | | | | | | | | |
Yen Denominated Nikkei 225 Index | | | 4 | | | | 03/07/19 | | | | 362 | | | $ | 16,077 | |
EURO STOXX 50 Index | | | 105 | | | | 03/15/19 | | | | 3,578 | | | | 100,439 | |
NASDAQ 100E-mini Index | | | 6 | | | | 03/15/19 | | | | 760 | | | | 17,815 | |
S&P 500E-Mini Index | | | 5 | | | | 03/15/19 | | | | 626 | | | | 699 | |
Canada 10 Year Bond | | | 15 | | | | 03/20/19 | | | | 1,503 | | | | (18,093 | ) |
| | | | | | | | | | | | | | | | |
| | | | | | | | | | | | | | $ | 116,937 | |
| | | | | | | | | | | | | | | | |
Forward Foreign Currency Exchange Contracts
| | | | | | | | | | | | | | | | | | | | |
| Currency Purchased | | | Currency Sold | | | Counterparty | | Settlement Date | | | Unrealized Appreciation (Depreciation) | |
| JPY | | | 19,999 | | | USD | | | 181 | | | UBS AG | | | 01/04/19 | | | $ | 1 | |
| JPY | | | 346,829 | | | USD | | | 3,142 | | | UBS AG | | | 01/07/19 | | | | 24 | |
| JPY | | | 102,493,612 | | | USD | | | 923,000 | | | JPMorgan Chase Bank NA | | | 01/25/19 | | | | 13,832 | |
| USD | | | 307,698 | | | AUD | | | 435,000 | | | JPMorgan Chase Bank NA | | | 01/25/19 | | | | 1,161 | |
| JPY | | | 102,108,000 | | | USD | | | 914,225 | | | Citibank NA | | | 01/31/19 | | | | 19,524 | |
| JPY | | | 156,520,000 | | | USD | | | 1,392,112 | | | JPMorgan Chase Bank NA | | | 02/14/19 | | | | 40,700 | |
| EUR | | | 406,000 | | | USD | | | 463,863 | | | Goldman Sachs International | | | 02/15/19 | | | | 3,026 | |
| EUR | | | 400,000 | | | USD | | | 455,155 | | | Morgan Stanley & Co. International plc | | | 02/28/19 | | | | 5,299 | |
| JPY | | | 62,120,993 | | | USD | | | 550,000 | | | Morgan Stanley & Co. International plc | | | 03/07/19 | | | | 19,575 | |
| EUR | | | 393,000 | | | USD | | | 447,007 | | | Morgan Stanley & Co. International plc | | | 03/14/19 | | | | 5,936 | |
| SEK | | | 8,174,948 | | | EUR | | | 791,000 | | | Bank of America NA | | | 03/21/19 | | | | 15,919 | |
| | | | | | | | | | | | | | | | | | | | |
| | | | | | | | | | | | | | | | | | | 124,997 | |
| | | | | | | | | | | | | | | | | | | | |
| GBP | | | 635,000 | | | USD | | | 828,977 | | | JPMorgan Chase Bank NA | | | 01/11/19 | | | | (19,287 | ) |
| EUR | | | 401,000 | | | USD | | | 460,818 | | | Morgan Stanley & Co. International plc | | | 01/25/19 | | | | (482 | ) |
| USD | | | 995,123 | | | JPY | | | 110,300,000 | | | Morgan Stanley & Co. International plc | | | 01/28/19 | | | | (13,301 | ) |
| NOK | | | 3,032,000 | | | USD | | | 365,816 | | | JPMorgan Chase Bank NA | | | 02/01/19 | | | | (14,655 | ) |
| USD | | | 986,958 | | | JPY | | | 110,400,000 | | | Goldman Sachs International | | | 02/04/19 | | | | (22,926 | ) |
| GBP | | | 718,000 | | | USD | | | 939,894 | | | JPMorgan Chase Bank NA | | | 02/15/19 | | | | (22,750 | ) |
| USD | | | 466,825 | | | EUR | | | 406,000 | | | Morgan Stanley & Co. International plc | | | 02/15/19 | | | | (63 | ) |
| GBP | | | 375,000 | | | USD | | | 490,920 | | | JPMorgan Chase Bank NA | | | 02/21/19 | | | | (11,781 | ) |
| USD | | | 459,068 | | | EUR | | | 400,000 | | | Deutsche Bank AG | | | 02/28/19 | | | | (1,387 | ) |
| USD | | | 506,348 | | | BRL | | | 1,974,000 | | | Deutsche Bank AG | | | 03/01/19 | | | | (796 | ) |
| USD | | | 1,023,408 | | | JPY | | | 114,050,000 | | | Goldman Sachs International | | | 03/04/19 | | | | (21,995 | ) |
| USD | | | 450,646 | | | EUR | | | 393,000 | | | Morgan Stanley & Co. International plc | | | 03/14/19 | | | | (2,297 | ) |
| ZAR | | | 7,840,000 | | | USD | | | 547,289 | | | BNP Paribas SA | | | 03/14/19 | | | | (6,957 | ) |
| USD | | | 439,817 | | | JPY | | | 48,400,000 | | | JPMorgan Chase Bank NA | | | 03/25/19 | | | | (4,716 | ) |
| | | | | | | | | | | | | | | | | | | | |
| | | | | | | | | | | | | | | | | | | (143,393 | ) |
| | | | | | | | | | | | | | | | | | | | |
| | | Net Unrealized Depreciation | | | | | | $ | (18,396 | ) |
| | | | | | | | | | | | | | | | | | | | |
| | | | |
| CONSOLIDATED SCHEDULES OF INVESTMENTS | | | 71 | |
| | |
Consolidated Schedule of Investments (continued) December 31, 2018 | | BlackRock Global Allocation Portfolio |
OTC Options Purchased
| | | | | | | | | | | | | | | | | | | | | | | | | | | | |
| Description | | Counterparty | | Number of
Contracts | | Expiration
Date | | | Exercise
Price | | | Notional
Amount (000) | | | Value | |
Call | | | | | | | | | | | | | | | | | | | | | | | | | | | | |
Chevron Corp. | | UBS AG | | 5,390 | | | 01/18/19 | | | | USD | | | | 125.00 | | | | USD | | | | 586 | | | $ | 189 | |
Exxon Mobil Corp. | | UBS AG | | 3,664 | | | 01/18/19 | | | | USD | | | | 95.00 | | | | USD | | | | 250 | | | | 55 | |
Schlumberger Ltd. | | UBS AG | | 5,304 | | | 01/18/19 | | | | USD | | | | 90.00 | | | | USD | | | | 191 | | | | 26 | |
SPDR Gold Shares(a) | | JPMorgan Chase Bank NA | | 2,851 | | | 02/15/19 | | | | USD | | | | 120.00 | | | | USD | | | | 346 | | | | 8,140 | |
TOPIX Index | | Morgan Stanley & Co. International plc | | 38,681 | | | 03/08/19 | | | | JPY | | | | 1,785.00 | | | | JPY | | | | 57,793 | | | | 293 | |
KOSPI 200 Index | | Goldman Sachs International | | 2 | | | 03/14/19 | | | | USD | | | | 302.50 | | | | USD | | | | 5 | | | | 444 | |
Russell 2000 Index | | Bank of America NA | | 537 | | | 03/15/19 | | | | USD | | | | 1,700.00 | | | | USD | | | | 724 | | | | 148 | |
SPDR Gold Shares(a) | | Societe Generale SA | | 5,092 | | | 03/15/19 | | | | USD | | | | 121.00 | | | | USD | | | | 617 | | | | 16,164 | |
SPDR Gold Shares(a) | | Societe Generale SA | | 5,338 | | | 04/18/19 | | | | USD | | | | 123.00 | | | | USD | | | | 647 | | | | 16,281 | |
GBP Currency | | UBS AG | | — | | | 05/15/19 | | | | USD | | | | 1.32 | | | | GBP | | | | 2,843 | | | | 67,239 | |
SPDR Gold Shares(a) | | Morgan Stanley & Co. International plc | | 2,871 | | | 05/17/19 | | | | USD | | | | 120.00 | | | | USD | | | | 348 | | | | 12,197 | |
BP plc | | UBS AG | | 17,142 | | | 06/21/19 | | | | USD | | | | 52.00 | | | | USD | | | | 650 | | | | 1,457 | |
ConocoPhillips Co. | | UBS AG | | 9,003 | | | 06/21/19 | | | | USD | | | | 75.00 | | | | USD | | | | 561 | | | | 11,209 | |
Occidental Petroleum Corp. | | UBS AG | | 7,980 | | | 06/21/19 | | | | USD | | | | 92.50 | | | | USD | | | | 490 | | | | 1,608 | |
Royal Dutch Shell plc | | UBS AG | | 9,785 | | | 06/21/19 | | | | USD | | | | 77.00 | | | | USD | | | | 570 | | | | 1,566 | |
SPDR Gold Shares(a) | | Societe Generale SA | | 5,092 | | | 06/21/19 | | | | USD | | | | 124.00 | | | | USD | | | | 617 | | | | 20,674 | |
Suncor Energy, Inc. | | UBS AG | | 11,597 | | | 06/21/19 | | | | USD | | | | 45.00 | | | | USD | | | | 324 | | | | 290 | |
Facebook, Inc. | | UBS AG | | 5,568 | | | 09/20/19 | | | | USD | | | | 165.00 | | | | USD | | | | 730 | | | | 31,020 | |
TOTAL SA | | UBS AG | | 12,113 | | | 09/20/19 | | | | USD | | | | 70.00 | | | | USD | | | | 632 | | | | 1,551 | |
TOPIX Banks Index | | Bank of America NA | | 134,228 | | | 12/13/19 | | | | JPY | | | | 191.28 | | | | JPY | | | | 19,695 | | | | 1,816 | |
TOPIX Banks Index | | Morgan Stanley & Co. International plc | | 254,099 | | | 12/13/19 | | | | JPY | | | | 191.28 | | | | JPY | | | | 37,284 | | | | 3,438 | |
Alphabet, Inc. | | JPMorgan Chase Bank NA | | 324 | | | 01/17/20 | | | | USD | | | | 1,225.00 | | | | USD | | | | 336 | | | | 18,720 | |
Anadarko Petroleum Corp. | | Credit Suisse International | | 3,417 | | | 01/17/20 | | | | USD | | | | 67.50 | | | | USD | | | | 150 | | | | 5,433 | |
BP plc | | Nomura International plc | | 15,600 | | | 01/17/20 | | | | USD | | | | 43.50 | | | | USD | | | | 592 | | | | 24,380 | |
CVS Health Corp. | | JPMorgan Chase Bank NA | | 2,397 | | | 01/17/20 | | | | USD | | | | 78.50 | | | | USD | | | | 157 | | | | 8,883 | |
Halliburton Co. | | Citibank NA | | 6,585 | | | 01/17/20 | | | | USD | | | | 50.00 | | | | USD | | | | 175 | | | | 1,119 | |
Johnson & Johnson | | Bank of America NA | | 2,430 | | | 01/17/20 | | | | USD | | | | 155.00 | | | | USD | | | | 314 | | | | 6,282 | |
JPMorgan Chase & Co. | | Citibank NA | | 2,402 | | | 01/17/20 | | | | USD | | | | 114.50 | | | | USD | | | | 234 | | | | 7,995 | |
Schlumberger Ltd. | | UBS AG | | 5,511 | | | 01/17/20 | | | | USD | | | | 70.00 | | | | USD | | | | 199 | | | | 661 | |
Sumitomo Mitsui Financial Group, Inc. | | Morgan Stanley & Co. International plc | | 6,991 | | | 03/13/20 | | | | JPY | | | | 4,756.33 | | | | JPY | | | | 25,482 | | | | 2,881 | |
TOPIX Banks Index | | BNP Paribas SA | | 181,254 | | | 03/13/20 | | | | JPY | | | | 194.04 | | | | JPY | | | | 26,595 | | | | 2,939 | |
TOPIX Banks Index | | Morgan Stanley & Co. International plc | | 161,095 | | | 04/10/20 | | | | JPY | | | | 192.04 | | | | JPY | | | | 23,637 | | | | 3,022 | |
Sumitomo Mitsui Financial Group, Inc. | | Morgan Stanley & Co. International plc | | 5,643 | | | 09/11/20 | | | | JPY | | | | 4,816.24 | | | | JPY | | | | 20,569 | | | | 2,983 | |
Sumitomo Mitsui Financial Group, Inc. | | Morgan Stanley & Co. International plc | | 5,646 | | | 12/11/20 | | | | JPY | | | | 4,894.87 | | | | JPY | | | | 20,580 | | | | 2,969 | |
EURO STOXX Bank Index | | Barclays Bank plc | | 3,161 | | | 03/19/21 | | | | EUR | | | | 136.97 | | | | EUR | | | | 952 | | | | 3,149 | |
EURO STOXX Bank Index | | UBS AG | | 3,260 | | | 06/18/21 | | | | EUR | | | | 134.92 | | | | EUR | | | | 982 | | | | 3,343 | |
| | | | | | | | | | | | | | | | | | | | | | | | | | | | |
| | | | | | | | | | | | | | | | | | | | | | | | | | | 290,564 | |
| | | | | | | | | | | | | | | | | | | | | | | | | | | | |
Put | | | | | | | | | | | | | | | | | | | | | | | | | | | | |
S&P 500 Index | | Barclays Bank plc | | 71 | | | 01/18/19 | | | | USD | | | | 2,350.00 | | | | USD | | | | 178 | | | $ | 948 | |
S&P 500 Index | | Barclays Bank plc | | 86 | | | 01/18/19 | | | | USD | | | | 2,400.00 | | | | USD | | | | 216 | | | | 1,724 | |
S&P 500 Index | | Barclays Bank plc | | 669 | | | 01/18/19 | | | | USD | | | | 2,700.00 | | | | USD | | | | 1,677 | | | | 128,716 | |
S&P 500 Index | | Barclays Bank plc | | 71 | | | 01/31/19 | | | | USD | | | | 2,400.00 | | | | USD | | | | 178 | | | | 2,215 | |
| | | | | | | | | | | | | | | | | | | | | | | | | | | | |
| | | | | | | | | | | | | | | | | | | | | | | | | | | 133,603 | |
| | | | | | | | | | | | | | | | | | | | | | | | | | | | |
| | | | | | | | | | | | | | | | | | | | | | | | | | $ | 424,167 | |
| | | | | | | | | | | | | | | | | | | | | | | | | | | | |
| | (a) | All or a portion of the security is held by a wholly-owned subsidiary. See Note 1 of the Notes to Financial Statements for details on the wholly-owned subsidiary. | |
OTC Interest Rate Swaptions Purchased
| | | | | | | | | | | | | | | | | | | | | | | | | | | | | | |
| | | Paid by the Fund | | Received by the Fund | | Counterparty | | Expiration
Date | | | Exercise
Rate | | | Notional
Amount (000) | | | Value | |
| Description | | Rate | | | Frequency | | Rate | | | Frequency |
Put | | | | | | | | | | | | | | | | | | | | | | | | | | | | | | |
5-Year Interest Rate Swap | | | 3.00 | % | | Semi-Annual | | | 3 month LIBOR | | | Quarterly | | Nomura International plc | | | 03/04/19 | | | | 3.00 | % | | | USD 5,694 | | | $ | 2,464 | |
| | | | | | | | | | | | | | | | | | | | | | | | | | | | | | |
| | |
| 72 | | 2018 BLACKROCK ANNUAL REPORTTO SHAREHOLDERS |
| | |
Consolidated Schedule of Investments (continued) December 31, 2018 | | BlackRock Global Allocation Portfolio |
Exchange-Traded Options Written
| | | | | | | | | | | | | | | | | | | | |
| Description | | Number of
Contracts | | | Expiration
Date | | | Exercise
Price | | | Notional
Amount (000) | | | Value | |
Call | | | | | | | | | | | | | | | | | | | | |
McDonald’s Corp. | | | 1 | | | | 01/18/19 | | | USD | 185.00 | | | USD | 18 | | | $ | (88) | |
Amazon.com, Inc. | | | 2 | | | | 02/15/19 | | | USD | 1,790.00 | | | USD | 300 | | | | (3,070 | ) |
Amazon.com, Inc. | | | 2 | | | | 02/15/19 | | | USD | 1,780.00 | | | USD | 300 | | | | (3,460 | ) |
Amazon.com, Inc. | | | 2 | | | | 02/15/19 | | | USD | 1,800.00 | | | USD | 300 | | | | (2,770 | ) |
| | | | | | | | | | | | | | | | | | | | |
| | | | | | | | | | | | | | | | | | $ | (9,388 | ) |
| | | | | | | | | | | | | | | | | | | | |
OTC Options Written
| | | | | | | | | | | | | | | | | | | | | | | | | | | | | | |
| Description | | Counterparty | | Number of
Contracts | | | Expiration
Date | | | Exercise
Price | | | Notional
Amount (000) | | | Value | |
| Call | | | | | | | | | | | | | | | | | | | | | | | |
Apple, Inc. | | Barclays Bank plc | | | 1,364 | | | | 01/18/19 | | | | USD | | | | 160.00 | | | | USD | | | | 215 | | | $ | (5,763) | |
Microsoft Corp. | | Barclays Bank plc | | | 2,417 | | | | 01/18/19 | | | | USD | | | | 90.00 | | | | USD | | | | 245 | | | | (29,125 | ) |
United Continental Holdings, Inc. | | Deutsche Bank AG | | | 1,754 | | | | 01/18/19 | | | | USD | | | | 75.00 | | | | USD | | | | 147 | | | | (16,137 | ) |
TOPIX Index | | Morgan Stanley & Co. International plc | | | 38,681 | | | | 03/08/19 | | | | JPY | | | | 1,950.00 | | | | JPY | | | | 57,793 | | | | (71 | ) |
KOSPI 200 Index | | Goldman Sachs International | | | 2 | | | | 03/14/19 | | | | USD | | | | 327.50 | | | | USD | | | | 5 | | | | (32 | ) |
ConocoPhillips Co. | | UBS AG | | | 9,003 | | | | 06/21/19 | | | | USD | | | | 85.00 | | | | USD | | | | 561 | | | | (2,071 | ) |
TOTAL SA | | UBS AG | | | 12,113 | | | | 09/20/19 | | | | USD | | | | 75.00 | | | | USD | | | | 632 | | | | (2,315 | ) |
TOPIX Banks Index | | Bank of America NA | | | 134,228 | | | | 12/13/19 | | | | JPY | | | | 221.29 | | | | JPY | | | | 19,695 | | | | (519 | ) |
TOPIX Banks Index | | Morgan Stanley & Co. International plc | | | 254,099 | | | | 12/13/19 | | | | JPY | | | | 221.29 | | | | JPY | | | | 37,284 | | | | (982 | ) |
Alphabet, Inc. | | JPMorgan Chase Bank NA | | | 324 | | | | 01/17/20 | | | | USD | | | | 1,350.00 | | | | USD | | | | 336 | | | | (9,491 | ) |
Anadarko Petroleum Corp. | | Credit Suisse International | | | 3,417 | | | | 01/17/20 | | | | USD | | | | 76.00 | | | | USD | | | | 150 | | | | (2,932 | ) |
Comcast Corp. | | Citibank NA | | | 5,994 | | | | 01/17/20 | | | | USD | | | | 37.50 | | | | USD | | | | 204 | | | | (14,266 | ) |
CVS Health Corp. | | JPMorgan Chase Bank NA | | | 2,397 | | | | 01/17/20 | | | | USD | | | | 87.50 | | | | USD | | | | 157 | | | | (3,571 | ) |
Facebook, Inc. | | UBS AG | | | 13,009 | | | | 01/17/20 | | | | USD | | | | 220.00 | | | | USD | | | | 1,705 | | | | (17,237 | ) |
Johnson & Johnson | | Bank of America NA | | | 2,430 | | | | 01/17/20 | | | | USD | | | | 170.00 | | | | USD | | | | 314 | | | | (2,150 | ) |
JPMorgan Chase & Co. | | Citibank NA | | | 2,402 | | | | 01/17/20 | | | | USD | | | | 125.50 | | | | USD | | | | 234 | | | | (3,555 | ) |
Sumitomo Mitsui Financial Group, Inc. | | Morgan Stanley & Co. International plc | | | 6,991 | | | | 03/13/20 | | | | JPY | | | | 5,679.90 | | | | JPY | | | | 25,482 | | | | (732 | ) |
TOPIX Banks Index | | BNP Paribas SA | | | 181,254 | | | | 03/13/20 | | | | JPY | | | | 237.47 | | | | JPY | | | | 26,595 | | | | (642 | ) |
TOPIX Banks Index | | Morgan Stanley & Co. International plc | | | 161,095 | | | | 04/10/20 | | | | JPY | | | | 233.87 | | | | JPY | | | | 23,637 | | | | (717 | ) |
| | | | | | | | | | | | | | | | | | | | | | | | | | | | | | |
| | | | | | | | | | | | | | | | | | | | | | | | | | | | | (112,308 | ) |
| | | | | | | | | | | | | | | | | | | | | | | | | | | | | | |
| Put | | | | | | | | | | | | | | | | | | | | | | | |
S&P 500 Index | | Barclays Bank plc | | | 71 | | | | 01/18/19 | | | | USD | | | | 2,200.00 | | | | USD | | | | 178 | | | | (246 | ) |
S&P 500 Index | | Barclays Bank plc | | | 86 | | | | 01/18/19 | | | | USD | | | | 2,250.00 | | | | USD | | | | 216 | | | | (473 | ) |
S&P 500 Index | | Barclays Bank plc | | | 71 | | | | 01/31/19 | | | | USD | | | | 2,250.00 | | | | USD | | | | 178 | | | | (753 | ) |
TOPIX Index | | Morgan Stanley & Co. International plc | | | 38,681 | | | | 03/08/19 | | | | JPY | | | | 1,600.00 | | | | JPY | | | | 57,793 | | | | (44,290 | ) |
KOSPI 200 Index | | Goldman Sachs International | | | 2 | | | | 03/14/19 | | | | USD | | | | 270.00 | | | | USD | | | | 5 | | | | (33,315 | ) |
S&P 500 Index | | Bank of America NA | | | 284 | | | | 03/15/19 | | | | USD | | | | 2,600.00 | | | | USD | | | | 712 | | | | (40,172 | ) |
SPDR Gold Shares(a) | | Morgan Stanley & Co. International plc | | | 1,435 | | | | 05/17/19 | | | | USD | | | | 113.00 | | | | USD | | | | 174 | | | | (378 | ) |
TOPIX Banks Index | | Bank of America NA | | | 134,228 | | | | 12/13/19 | | | | JPY | | | | 156.59 | | | | JPY | | | | 19,695 | | | | (27,105 | ) |
TOPIX Banks Index | | Morgan Stanley & Co. International plc | | | 254,099 | | | | 12/13/19 | | | | JPY | | | | 156.59 | | | | JPY | | | | 37,284 | | | | (51,308 | ) |
Alphabet, Inc. | | JPMorgan Chase Bank NA | | | 324 | | | | 01/17/20 | | | | USD | | | | 860.00 | | | | USD | | | | 336 | | | | (14,693 | ) |
Anadarko Petroleum Corp. | | Credit Suisse International | | | 3,417 | | | | 01/17/20 | | | | USD | | | | 46.00 | | | | USD | | | | 150 | | | | (29,809 | ) |
BP plc | | Nomura International plc | | | 15,600 | | | | 01/17/20 | | | | USD | | | | 28.00 | | | | USD | | | | 592 | | | | (16,770 | ) |
CVS Health Corp. | | JPMorgan Chase Bank NA | | | 2,397 | | | | 01/17/20 | | | | USD | | | | 56.00 | | | | USD | | | | 157 | | | | (9,453 | ) |
Facebook, Inc. | | UBS AG | | | 13,009 | | | | 01/17/20 | | | | USD | | | | 155.00 | | | | USD | | | | 1,705 | | | | (399,701 | ) |
Halliburton Co. | | Citibank NA | | | 6,585 | | | | 01/17/20 | | | | USD | | | | 35.00 | | | | USD | | | | 175 | | | | (62,887 | ) |
Johnson & Johnson | | Bank of America NA | | | 2,430 | | | | 01/17/20 | | | | USD | | | | 109.00 | | | | USD | | | | 314 | | | | (11,202 | ) |
JPMorgan Chase & Co. | | Citibank NA | | | 2,402 | | | | 01/17/20 | | | | USD | | | | 87.25 | | | | USD | | | | 234 | | | | (15,121 | ) |
Schlumberger Ltd. | | UBS AG | | | 5,511 | | | | 01/17/20 | | | | USD | | | | 52.50 | | | | USD | | | | 199 | | | | (96,718 | ) |
Sumitomo Mitsui Financial Group, Inc. | | Morgan Stanley & Co. International plc | | | 6,991 | | | | 03/13/20 | | | | JPY | | | | 3,832.77 | | | | JPY | | | | 25,482 | | | | (34,287 | ) |
TOPIX Banks Index | | BNP Paribas SA | | | 181,254 | | | | 03/13/20 | | | | JPY | | | | 155.80 | | | | JPY | | | | 26,595 | | | | (39,256 | ) |
TOPIX Banks Index | | Morgan Stanley & Co. International plc | | | 161,095 | | | | 04/10/20 | | | | JPY | | | | 157.82 | | | | JPY | | | | 23,637 | | | | (37,897 | ) |
Sumitomo Mitsui Financial Group, Inc. | | Morgan Stanley & Co. International plc | | | 3,762 | | | | 09/11/20 | | | | JPY | | | | 3,820.96 | | | | JPY | | | | 13,712 | | | | (23,197 | ) |
Sumitomo Mitsui Financial Group, Inc. | | Morgan Stanley & Co. International plc | | | 3,764 | | | | 12/11/20 | | | | JPY | | | | 3,786.60 | | | | JPY | | | | 13,720 | | | | (22,394 | ) |
EURO STOXX Bank Index | | Barclays Bank plc | | | 2,107 | | | | 03/19/21 | | | | EUR | | | | 110.23 | | | | EUR | | | | 635 | | | | (86,101 | ) |
EURO STOXX Bank Index | | UBS AG | | | 2,144 | | | | 06/18/21 | | | | EUR | | | | 106.38 | | | | EUR | | | | 646 | | | | (86,077 | ) |
| | | | | | | | | | | | | | | | | | | | | | | | | | | | | | |
| | | | | | | | | | | | | | | | | | | | | | | | | | | | | (1,183,603 | ) |
| | | | | | | | | | | | | | | | | | | | | | | | | | | | | | |
| | | | | | | | | | | | | | | | | | | | | | | | | | | | $ | (1,295,911) | |
| | | | | | | | | | | | | | | | | | | | | | | | | | | | | | |
| | (a) | All or a portion of the security is held by a wholly-owned subsidiary. See Note 1 of the Notes to Financial Statements for details on the wholly-owned subsidiary. | |
| | | | |
| CONSOLIDATED SCHEDULES OF INVESTMENTS | | | 73 | |
| | |
Consolidated Schedule of Investments (continued) December 31, 2018 | | BlackRock Global Allocation Portfolio |
OTC Interest Rate Swaptions Written
| | | | | | | | | | | | | | | | | | | | | | | | | | | | | | | | |
Description | | Paid by the Fund | | Received by the Fund | | Counterparty | | Expiration | | | Exercise | | | Notional | | | Value | |
| | Rate | | | Frequency | | Rate | | | Frequency | | Date | | | Rate | | | Amount (000) | |
| Call | | | | | | | | | | | | | | | | | | | | | | | | | | |
5-Year Interest Rate Swap | | | 3 month LIBOR | | | Quarterly | | | 2.70 | % | | Semi-Annual | | Nomura International plc | | | 03/04/19 | | | | 2.70 | % | | USD | | | 5,694 | | | $ | (50,171) | |
| | | | | | | | | | | | | | | | | | | | | | | | | | | | | | | | |
Centrally Cleared Credit Default Swaps — Buy Protection
| | | | | | | | | | | | | | | | | | | | | | | | | | | | |
| Reference Obligation/Index | | Financing
Rate Paid
by the Fund | | | Payment
Frequency | | | Termination
Date | | | Notional
Amount (000) | | | Value | | | Upfront
Premium
Paid
(Received) | | | Unrealized
Appreciation
(Depreciation) | |
CDX.NA.HY.30.V1 | | | 5.00 | % | | | Quarterly | | | | 06/20/23 | | | | USD 175 | | | $ | (5,681 | ) | | $ | (11,509 | ) | | $ | 5,828 | |
| | | | | | | | | | | | | | | | | | | | | | | | | | | | |
Centrally Cleared Interest Rate Swaps
| | | | | | | | | | | | | | | | | | | | | | | | | | | | | | |
| Paid by the Fund | | Received by the Fund | | Effective
Date | | | Termination
Date | | | Notional
Amount(000) | | | Value | | | Upfront
Premium
Paid
(Received) | | | Unrealized
Appreciation
(Depreciation) | |
| Rate | | Frequency | | Rate | | Frequency |
| 3 month LIBOR | | Quarterly | | 2.97% | | Semi-Annual | | | 07/20/20 | (a) | | | 07/18/25 | | | USD | 6,141 | | | $ | 105,254 | | | $ | — | | | $ | 105,254 | |
| 0.84% | | Annual | | 6 month EURIBOR | | Semi-Annual | | | N/A | | | | 02/15/28 | | | EUR | 660 | | | | (12,182 | ) | | | — | | | | (12,182 | ) |
| 0.84% | | Annual | | 6 month EURIBOR | | Semi-Annual | | | N/A | | | | 02/15/28 | | | EUR | 729 | | | | (13,465 | ) | | | — | | | | (13,465 | ) |
| 0.99% | | Annual | | 6 month EURIBOR | | Semi-Annual | | | N/A | | | | 10/29/28 | | | EUR | 3,805 | | | | (90,616 | ) | | | — | | | | (90,616 | ) |
| 3 month LIBOR | | Quarterly | | 3.20% | | Semi-Annual | | | N/A | | | | 10/29/28 | | | USD | 4,806 | | | | 212,798 | | | | — | | | | 212,798 | |
| 2.99% | | Semi-Annual | | 3 month LIBOR | | Quarterly | | | 07/20/20 | (a) | | | 07/18/50 | | | USD | 1,380 | | | | (33,283 | ) | | | — | | | | (33,283 | ) |
| | | | | | | | | | | | | | | | | | | | | | | | | | | | | | |
| | | | | | | | | | | | | | | | | | | | $ | 168,506 | | | $ | — | | | $ | 168,506 | |
| | | | | | | | | | | | | | | | | | | | | | | | | | | | | | |
OTC Total Return Swaps
| | | | | | | | | | | | | | | | | | | | | | | | | | | | | | | | | | | | |
| Reference Entity | | Fixed Amount
Paid/(Received)
by the Fund (a) | | | Counterparty | | | Termination
Date | | | Notional
Amount (000) | | | Value | | | Upfront
Premium
Paid
(Received) | | | Unrealized
Appreciation
(Depreciation) | |
EURO STOXX Banks Net Return Index | | | EUR | | | | (278,081 | ) | | | BNP Paribas SA | | | | 04/30/19 | | | | EUR | | | | 278 | | | $ | 29,600 | | | $ | — | | | $ | 29,600 | |
S&P 500 Index Annual Dividend Future December 2020 | | | USD | | | | 59,969 | | |
| Goldman Sachs
International |
| | | 12/18/20 | | | | USD | | | | 60 | | | | 10,656 | | | | — | | | | 10,656 | |
Nikkei Dividend Future December 2020 | | | JPY | | | | 3,827,500 | | | | BNP Paribas SA | | | | 04/01/21 | | | | JPY | | | | 3,828 | | | | 4,585 | | | | — | | | | 4,585 | |
Nikkei Dividend Future December 2020 | | | JPY | | | | 7,760,000 | | | | BNP Paribas SA | | | | 04/01/21 | | | | JPY | | | | 7,760 | | | | 8,211 | | | | — | | | | 8,211 | |
Nikkei Dividend Future December 2020 | | | JPY | | | | 4,215,000 | | | | BNP Paribas SA | | | | 04/01/21 | | | | JPY | | | | 4,215 | | | | 1,049 | | | | — | | | | 1,049 | |
S&P 500 Index Annual Dividend Future December 2021 | | | USD | | | | 72,825 | | | | BNP Paribas SA | | | | 12/17/21 | | | | USD | | | | 73 | | | | 12,525 | | | | — | | | | 12,525 | |
Nikkei Dividend Future December 2021 | | | JPY | | | | 4,260,000 | | | | BNP Paribas SA | | | | 04/01/22 | | | | JPY | | | | 4,260 | | | | 739 | | | | — | | | | 739 | |
Nikkei Dividend Future December 2021 | | | JPY | | | | 3,975,000 | | | | BNP Paribas SA | | | | 04/01/22 | | | | JPY | | | | 3,975 | | | | 3,339 | | | | ��� | | | | 3,339 | |
Nikkei Dividend Future December 2021 | | | JPY | | | | 7,860,000 | | | | BNP Paribas SA | | | | 04/01/22 | | | | JPY | | | | 7,860 | | | | 7,500 | | | | — | | | | 7,500 | |
Nikkei Dividend Future December 2021 | | | JPY | | | | 3,985,000 | | | | BNP Paribas SA | | | | 04/01/22 | | | | JPY | | | | 3,985 | | | | 3,248 | | | | — | | | | 3,248 | |
| | | | | | | | | | | | | | | | | | | | | | | | | | | | | | | | | | | | |
| | | | | | | | | | | | | | | | | | | | | | | | | | $ | 81,452 | | | $ | — | | | $ | 81,452 | |
| | | | | | | | | | | | | | | | | | | | | | | | | | | | | | | | | | | | |
| | (a) | At termination, the fixed amount paid (received) will be exchanged for the total return of the reference entity. | |
| | |
| 74 | | 2018 BLACKROCK ANNUAL REPORTTO SHAREHOLDERS |
| | |
Consolidated Schedule of Investments (continued) December 31, 2018 | | BlackRock Global Allocation Portfolio |
OTC Total Return Swaps (a)
| | | | | | | | | | | | | | | | | | | | | | |
| Reference Entity | | Counterparty | | Expiration
Date | | | Net
Notional Amount | | | Unrealized
Appreciation
(Depreciation) | | | Net Value of
Reference
Entities | | | Gross
Notional
Amount
Net Asset
Percentage | |
Equity Securities Long/Short | | Citibank NA | | | 02/24/23-02/27/23 | | | $ | (332,253 | ) | | $ | (10,776 | )(b) | | $ | (343,633 | ) | | | 0.2 | % |
| | JP Morgan Chase Bank NA | | | 02/08/23 | | | | (414,615 | ) | | | 16,545 | (c) | | | (399,055 | ) | | | 0.2 | % |
| | | | | | | | | | | | | | | | | | | | | | |
| | | | | | | | | | | | $ | 5,769 | | | $ | (742,688 | ) | | | | |
| | | | | | | | | | | | | | | | | | | | | | |
| | (a) | The Fund receives or pays the total return on a portfolio of long and short positions underlying the total return swap. In addition, the Fund pays or receives a variable rate of interest, based on a specified benchmark, plus or minus a spread in a range of20-151 basis points. The benchmark and spread are determined based upon the country and/or currency of the individual underlying positions. The following are the specified benchmarks used in determining the variable rate of interest: | |
Intercontinental Exchange LIBOR
EUR 1 Week
USD 1 Week
| | (b) | Amount includes $604 of net dividends and financing fees. | |
| | (c) | Amount includes $985 of net dividends and financing fees. | |
The following reference rates, and their values as of period end, are used for security descriptions:
| | | | |
| Reference Index | | | | Reference Rate |
3 month LIBOR | | London Interbank Offered Rate | | 2.81% |
6 month EURIBOR | | Euro Interbank Offered Rate | | (0.24%) |
Balances Reported in the Statements of Assets and Liabilities for Centrally Cleared Swaps, Swaps and Options Written
| | | | | | | | | | | | | | | | | | | | |
| | | Swap
Premiums
Paid | | | Swap
Premiums
Received | | | Unrealized
Appreciation | | | Unrealized
Depreciation | | | Value | |
Centrally Cleared Swaps(a) | | $ | — | | | $ | (11,509 | ) | | $ | 323,880 | | | $ | (149,546 | ) | | $ | — | |
OTC Swaps | | | — | | | | — | | | | 97,997 | | | | (10,776 | ) | | | — | |
Options Written | | | N/A | | | | N/A | | | | 318,532 | | | | (793,686 | ) | | | (1,355,470 | ) |
| | (a) | Includes cumulative appreciation (depreciation) on centrally cleared swaps, as reported in the Consolidated Schedule of Investments. Only current day’s variation margin is reported within the Statements of Assets and Liabilities and is net of any previously paid (received) swap premium amounts. | |
Derivative Financial Instruments Categorized by Risk Exposure
As of period end, the fair values of derivative financial instruments located in the Statements of Assets and Liabilities were as follows:
| | | | | | | | | | | | | | | | | | | | | | | | | | | | |
| | | Commodity
Contracts | | | Credit
Contracts | | | Equity
Contracts | | | Foreign
Currency
Exchange
Contracts | | | Interest
Rate
Contracts | | | Other
Contracts | | | Total | |
Assets — Derivative Financial Instruments | | | | | | | | | | | | | | | | | | | | | | | | | | | | |
Futures contracts | | | | | | | | | | | | | | | | | | | | | | | | | | | | |
Net unrealized appreciation(a) | | $ | — | | | $ | — | | | $ | 135,030 | | | $ | — | | | $ | — | | | $ | — | | | $ | 135,030 | |
Forward foreign currency exchange contracts | | | | | | | | | | | | | | | | | | | | | | | | | | | | |
Unrealized appreciation on forward foreign currency exchange contracts | | | — | | | | — | | | | — | | | | 124,997 | | | | — | | | | — | | | | 124,997 | |
Options purchased | | | | | | | | | | | | | | | | | | | | | | | | | | | | |
Investments at value — unaffiliated(b) | | | — | | | | — | | | | 356,928 | | | | 67,239 | | | | 2,464 | | | | — | | | | 426,631 | |
Swaps — centrally cleared | | | | | | | | | | | | | | | | | | | | | | | | | | | | |
Net unrealized appreciation(a) | | | — | | | | 5,828 | | | | — | | | | — | | | | 318,052 | | | | — | | | | 323,880 | |
Swaps — OTC | | | | | | | | | | | | | | | | | | | | | | | | | | | | |
Unrealized appreciation on OTC swaps; Swap premiums paid | | | — | | | | — | | | | 97,997 | | | | — | | | | — | | | | — | | | | 97,997 | |
| | | | | | | | | | | | | | | | | | | | | | | | | | | | |
| | $ | — | | | $ | 5,828 | | | $ | 589,955 | | | $ | 192,236 | | | $ | 320,516 | | | $ | — | | | $ | 1,108,535 | |
| | | | | | | | | | | | | | | | | | | | | | | | | | | | |
| | | | |
| CONSOLIDATED SCHEDULES OF INVESTMENTS | | | 75 | |
| | |
Consolidated Schedule of Investments (continued) December 31, 2018 | | BlackRock Global Allocation Portfolio |
| | | | | | | | | | | | | | | | | | | | | | | | | | | | |
| | | Commodity
Contracts | | | Credit
Contracts | | | Equity
Contracts | | | Foreign
Currency
Exchange
Contracts | | | Interest
Rate
Contracts | | | Other
Contracts | | | Total | |
| | | | | | | |
| Liabilities — Derivative Financial Instruments | | | | | | | | | | | | | | | | | | | | | |
Futures contracts | | | | | | | | | | | | | | | | | | | | | | | | | | | | |
Net unrealized depreciation(a) | | $ | — | | | $ | — | | | $ | — | | | $ | — | | | $ | 18,093 | | | $ | — | | | $ | 18,093 | |
Forward foreign currency exchange contracts | | | | | | | | | | | | | | | | | | | | | | | | | | | | |
Unrealized depreciation on forward foreign currency exchange contracts | | | — | | | | — | | | | — | | | | 143,393 | | | | — | | | | — | | | | 143,393 | |
Options written | | | | | | | | | | | | | | | | | | | | | | | | | | | | |
Options written, at value | | | — | | | | — | | | | 1,305,299 | | | | — | | | | 50,171 | | | | — | | | | 1,355,470 | |
Swaps — centrally cleared | | | | | | | | | | | | | | | | | | | | | | | | | | | | |
Net unrealized depreciation(a) | | | — | | | | — | | | | — | | | | — | | | | 149,546 | | | | — | | | | 149,546 | |
Swaps — OTC | | | | | | | | | | | | | | | | | | | | | | | | | | | | |
Unrealized depreciation on OTC swaps; Swap premiums received | | | — | | | | — | | | | 10,776 | | | | — | | | | — | | | | — | | | | 10,776 | |
| | | | | | | | | | | | | | | | | | | | | | | | | | | | |
| | $ | — | | | $ | — | | | $ | 1,316,075 | | | $ | 143,393 | | | $ | 217,810 | | | $ | — | | | $ | 1,677,278 | |
| | | | | | | | | | | | | | | | | | | | | | | | | | | | |
| | (a) | Includes cumulative appreciation (depreciation) on futures contracts and centrally cleared swaps, if any, as reported in the Consolidated Schedule of Investments. Only current day’s variation margin is reported within the Statements of Assets and Liabilities. | |
| | (b) | Includes options purchased at value as reported in the Consolidated Schedule of Investments. | |
For the year ended December 31, 2018, the effect of derivative financial instruments in the Statements of Operations were as follows:
| | | | | | | | | | | | | | | | | | | | | | | | | | | | |
| | | Commodity
Contracts | | | Credit
Contracts | | | Equity
Contracts | | | Foreign
Currency
Exchange
Contracts | | | Interest
Rate
Contracts | | | Other
Contracts | | | Total | |
Net Realized Gain (Loss) from: | | | | | | | | | | | | | | | | | | | | | | | | | | | | |
Futures contracts | | $ | — | | | $ | — | | | $ | 16,345 | | | $ | — | | | $ | — | | | $ | — | | | $ | 16,345 | |
Forward foreign currency exchange contracts | | | — | | | | — | | | | — | | | | (267,965 | ) | | | — | | | | — | | | | (267,965 | ) |
Options purchased(a) | | | — | | | | — | | | | 197,511 | | | | (210,942 | ) | | | (116,264 | ) | | | — | | | | (129,695 | ) |
Options written | | | — | | | | — | | | | 241,438 | | | | 87,865 | | | | (91,885 | ) | | | — | | | | 237,418 | |
Swaps | | | — | | | | (38,636 | ) | | | 405,255 | | | | 47,469 | | | | (280,381 | ) | | | — | | | | 133,707 | |
| | | | | | | | | | | | | | | | | | | | | | | | | | | | |
| | $ | — | | | $ | (38,636 | ) | | $ | 860,549 | | | $ | (343,573 | ) | | $ | (488,530 | ) | | $ | — | | | | $ (10,190) | |
| | | | | | | | | | | | | | | | | | | | | | | | | | | | |
| | | | | | | |
| Net Change in Unrealized Appreciation (Depreciation) on: | | | | | | | | | | | | | | | | | | | | | |
Futures contracts | | $ | — | | | $ | — | | | $ | 139,836 | | | $ | — | | | $ | (18,093 | ) | | $ | — | | | $ | 121,743 | |
Forward foreign currency exchange contracts | | | — | | | | — | | | | — | | | | (149,643 | ) | | | — | | | | — | | | | (149,643 | ) |
Options purchased(b) | | | — | | | | — | | | | (670,659 | ) | | | (81,689 | ) | | | 93,109 | | | | — | | | | (659,239 | ) |
Options written | | | — | | | | — | | | | (563,015 | ) | | | (47,379 | ) | | | (100,286 | ) | | | — | | | | (710,680 | ) |
Swaps | | | — | | | | 36,645 | | | | (363,407 | ) | | | — | | | | 4,382 | | | | — | | | | (322,380 | ) |
| | | | | | | | | | | | | | | | | | | | | | | | | | | | |
| | $ | — | | | $ | 36,645 | | | $ | (1,457,245 | ) | | $ | (278,711 | ) | | $ | (20,888 | ) | | $ | — | | | $ | (1,720,199 | ) |
| | | | | | | | | | | | | | | | | | | | | | | | | | | | |
| | (a) | Options purchased are included in net realized gain (loss) from investments — unaffiliated. | |
| | (b) | Options purchased are included in net change in unrealized appreciation (depreciation) on investments — unaffiliated. | |
Average Quarterly Balances of Outstanding Derivative Financial Instruments
| | | | |
Futures contracts: | | | | |
Average notional value of contracts — long | | $ | 248,807 | |
Average notional value of contracts — short | | $ | 5,011,375 | |
Forward foreign currency exchange contracts: | | | | |
Average amounts purchased — in USD | | $ | 6,625,332 | |
Average amounts sold — in USD | | $ | 10,513,124 | |
Options: | | | | |
Average value of option contracts purchased . . . . . . . . . . . . . . . . . . . . . . . . . . . . . .. | | $ | 544,260 | |
Average value of option contracts written . . . . . . . . . . . . . . . . . . . . . . . . . . . . . . . . .. | | $ | 864,525 | |
Average notional value of swaption contracts purchased . . . . . . . . . . . . . . . . . . . . . . | | $ | 12,005,716 | |
Average notional value of swaption contracts written . . . . . . . . . . . . . . . . . . . . . . . . .. | | $ | 14,837,115 | |
Credit default swaps: | | | | |
Average notional value — buy protection | | $ | 161,356 | |
| | |
| 76 | | 2018 BLACKROCK ANNUAL REPORTTO SHAREHOLDERS |
| | |
Consolidated Schedule of Investments (continued) December 31, 2018 | | BlackRock Global Allocation Portfolio |
| | | | |
Interest rate swaps: | | | | |
Average notional value — pays fixed rate | | $ | 9,161,844 | |
Average notional value — receives fixed rate | | $ | 9,614,691 | |
Currency swaps: | | | | |
Average notional value — pays | | $ | 887,441 | |
Average notional value — receives | | $ | 946,109 | |
Total return swaps: | | | | |
Average notional value | | $ | 1,330,610 | |
For more information about the Fund’s investment risks regarding derivative financial instruments, refer to the Notes to Financial Statements.
Derivative Financial Instruments — Offsetting as of Period End
The Fund’s derivative assets and liabilities (by type) were as follows:
| | | | | | | | |
| | | Assets | | | Liabilities | |
Derivative Financial Instruments: | | | | | | | | |
Futures contracts | | $ | 4,564 | | | $ | 75,756 | |
Forward foreign currency exchange contracts | | | 124,997 | | | | 143,393 | |
Options(a) | | | 426,631 | | | | 1,355,470 | |
Swaps — Centrally cleared | | | 21,934 | | | | — | |
Swaps — OTC(b) | | | 97,997 | | | | 10,776 | |
| | | | | | | | |
Total derivative assets and liabilities in the Statements of Assets and Liabilities | | $ | 676,123 | | | $ | 1,585,395 | |
Derivatives not subject to a Master Netting Agreement or similar agreement (“MNA”) | | | (26,498 | ) | | | (85,144 | ) |
| | | | | | | | |
Total derivative assets and liabilities subject to an MNA | | $ | 649,625 | | | $ | 1,500,251 | |
| | | | | | | | |
| | (a) | Includes options purchased at value which is included in Investments at value — unaffiliated in the Statements of Assets and Liabilities and reported in the Consolidated Schedule of Investments. | |
| | (b) | Includes unrealized appreciation (depreciation) on OTC swaps and swap premiums (paid/received) in the Statements of Assets and Liabilities. | |
The following tables present the Fund’s derivative assets and liabilities by counterparty net of amounts available for offset under an MNA and net of the related collateral received and pledged by the Fund:
| | | | | | | | | | | | | | | | | | | | |
| Counterparty | | Derivative
Assets
Subject to
an MNA by
Counterparty | | | Derivatives
Available
for Offset (a) | | | Non-cash
Collateral
Received | | | Cash
Collateral
Received (b) | | | Net Amount
of Derivative
Assets (c) | |
Bank of America NA | | $ | 24,165 | | | $ | (24,165 | ) | | $ | — | | | $ | — | | | $ | — | |
Barclays Bank plc | | | 136,752 | | | | (122,461 | ) | | | — | | | | — | | | | 14,291 | |
BNP Paribas SA | | | 73,735 | | | | (46,855 | ) | | | — | | | | (26,880 | ) | | | — | |
Citibank NA | | | 28,638 | | | | (28,638 | ) | | | — | | | | — | | | | — | |
Credit Suisse International | | | 5,433 | | | | (5,433 | ) | | | — | | | | — | | | | — | |
Goldman Sachs International | | | 14,126 | | | | (14,126 | ) | | | — | | | | — | | | | — | |
JPMorgan Chase Bank NA | | | 99,841 | | | | (99,841 | ) | | | — | | | | — | | | | — | |
JPMorgan Chase Bank NA(e) | | | 8,140 | | | | — | | | | — | | | | — | | | | 8,140 | |
Morgan Stanley & Co. International plc | | | 46,396 | | | | (46,396 | ) | | | — | | | | — | | | | — | |
Morgan Stanley & Co. International plc(e) | | | 12,197 | | | | (378 | ) | | | — | | | | — | | | | 11,819 | |
Nomura International plc | | | 26,844 | | | | (26,844 | ) | | | — | | | | — | | | | — | |
Societe Generale SA(e) | | | 53,119 | | | | — | | | | — | | | | — | | | | 53,119 | |
UBS AG | | | 120,239 | | | | (120,239 | ) | | | — | | | | — | | | | — | |
| | | | | | | | | | | | | | | | | | | | |
| | $ | 649,625 | | | $ | (535,376 | ) | | $ | — | | | $ | (26,880 | ) | | $ | 87,369 | |
| | | | | | | | | | | | | | | | | | | | |
| | | | |
| CONSOLIDATED SCHEDULES OF INVESTMENTS | | | 77 | |
| | |
Consolidated Schedule of Investments (continued) December 31, 2018 | | BlackRock Global Allocation Portfolio |
| | | | | | | | | | | | | | | | | | | | |
| Counterparty | | Derivative
Liabilities
Subject to
an MNA by
Counterparty | | | Derivatives
Available
for Offset (a) | | | Non-cash
Collateral
Pledged | | | Cash
Collateral
Pledged | | | Net Amount
of Derivative
Liabilities (d) | |
Bank of America NA | | $ | 81,148 | | | $ | (24,165 | ) | | $ | — | | | $ | — | | | $ | 56,983 | |
Barclays Bank plc | | | 122,461 | | | | (122,461 | ) | | | — | | | | — | | | | — | |
BNP Paribas SA | | | 46,855 | | | | (46,855 | ) | | | — | | | | — | | | | — | |
Citibank NA | | | 106,605 | | | | (28,638 | ) | | | — | | | | — | | | | 77,967 | |
Credit Suisse International | | | 32,741 | | | | (5,433 | ) | | | — | | | | — | | | | 27,308 | |
Deutsche Bank AG | | | 18,320 | | | | — | | | | — | | | | — | | | | 18,320 | |
Goldman Sachs International | | | 78,268 | | | | (14,126 | ) | | | — | | | | — | | | | 64,142 | |
JPMorgan Chase Bank NA | | | 110,397 | | | | (99,841 | ) | | | — | | | | — | | | | 10,556 | |
Morgan Stanley & Co. International plc | | | 232,018 | | | | (46,396 | ) | | | — | | | | — | | | | 185,622 | |
Morgan Stanley & Co. International plc(e) | | | 378 | | | | (378 | ) | | | — | | | | — | | | | — | |
Nomura International plc | | | 66,941 | | | | (26,844 | ) | | | — | | | | — | | | | 40,097 | |
UBS AG | | | 604,119 | | | | (120,239 | ) | | | (432,629 | ) | | | — | | | | 51,251 | |
| | | | | | | | | | | | | | | | | | | | |
| | $ | 1,500,251 | | | $ | (535,376 | ) | | $ | (432,629 | ) | | $ | — | | | $ | 532,246 | |
| | | | | | | | | | | | | | | | | | | | |
| | (a) | The amount of derivatives available for offset is limited to the amount of derivative assets and/or liabilities that are subject to an MNA. | |
| | (b) | Excess of collateral received from the individual counterparty is not shown for financial reporting purposes. | |
| | (c) | Net amount represents the net amount receivable from the counterparty in the event of default. | |
| | (d) | Net amount represents the net amount payable due to the counterparty in the event of default. | |
| | (e) | Represents derivatives owned by the BlackRock Cayman Global Allocation Portfolio. Fund I, Ltd., a wholly-owed subsidiary of the Fund. See Note 1. | |
Fair Value Hierarchy as of Period End
Various inputs are used in determining the fair value of investments and derivative financial instruments. For information about the Fund’s policy regarding valuation of investments and derivative financial instruments, refer to the Notes to Financial Statements.
The following tables summarize the Fund’s investments and derivative financial instruments categorized in the disclosure hierarchy:
| | | | | | | | | | | | | | | | |
| | | Level 1 | | | Level 2 | | | Level 3 | | | Total | |
Assets: | | | | | | | | | | | | | | | | |
Investments: | | | | | | | | | | | | | | | | |
Long-Term Investments: | | | | | | | | | | | | | | | | |
Common Stocks: | | | | | | | | | | | | | | | | |
Australia | | $ | 1,927 | | | $ | 145,089 | | | $ | 117,229 | | | $ | 264,245 | |
Belgium | | | — | | | | 409,306 | | | | — | | | | 409,306 | |
Brazil | | | 1,250,131 | | | | — | | | | — | | | | 1,250,131 | |
Canada | | | 2,535,934 | | | | — | | | | — | | | | 2,535,934 | |
China | | | 467,224 | | | | 2,116,312 | | | | — | | | | 2,583,536 | |
Czech Republic | | | — | | | | 75,615 | | | | — | | | | 75,615 | |
Denmark | | | — | | | | 157,055 | | | | — | | | | 157,055 | |
Finland | | | — | | | | 16,243 | | | | — | | | | 16,243 | |
France | | | 788,227 | | | | 3,947,761 | | | | — | | | | 4,735,988 | |
Germany | | | 554,706 | | | | 1,722,212 | | | | — | | | | 2,276,918 | |
Hong Kong | | | — | | | | 1,602,067 | | | | — | | | | 1,602,067 | |
India | | | — | | | | 2,102,880 | | | | — | | | | 2,102,880 | |
Indonesia | | | — | | | | 64,381 | | | | — | | | | 64,381 | |
Italy | | | 190,115 | | | | 768,534 | | | | — | | | | 958,649 | |
Japan | | | — | | | | 13,447,924 | | | | — | | | | 13,447,924 | |
Macau | | | — | | | | 8,061 | | | | — | | | | 8,061 | |
Malaysia | | | — | | | | 29,980 | | | | — | | | | 29,980 | |
Mexico | | | 11,592 | | | | — | | | | — | | | | 11,592 | |
Netherlands | | | 659,518 | | | | 3,275,076 | | | | — | | | | 3,934,594 | |
Norway | | | — | | | | 4,158 | | | | — | | | | 4,158 | |
Peru | | | 1,323 | | | | — | | | | — | | | | 1,323 | |
Poland | | | — | | | | 4,877 | | | | — | | | | 4,877 | |
Portugal | | | — | | | | 188,056 | | | | — | | | | 188,056 | |
Singapore | | | — | | | | 962,041 | | | | — | | | | 962,041 | |
South Africa | | | — | | | | 25,584 | | | | — | | | | 25,584 | |
South Korea | | | 53,726 | | | | 1,118,917 | | | | — | | | | 1,172,643 | |
Spain | | | — | | | | 618,500 | | | | — | | | | 618,500 | |
Sweden | | | — | | | | 27,613 | | | | — | | | | 27,613 | |
Switzerland | | | — | | | | 1,593,142 | | | | — | | | | 1,593,142 | |
Taiwan | | | — | | | | 1,493,836 | | | | — | | | | 1,493,836 | |
Thailand | | | — | | | | 339,403 | | | | — | | | | 339,403 | |
| | |
| 78 | | 2018 BLACKROCK ANNUAL REPORTTO SHAREHOLDERS |
| | |
Consolidated Schedule of Investments (continued) December 31, 2018 | | BlackRock Global Allocation Portfolio |
| | | | | | | | | | | | | | | | |
| | | Level 1 | | | Level 2 | | | Level 3 | | | Total | |
Turkey | | $ | — | | | $ | 7,743 | | | $ | — | | | $ | 7,743 | |
United Arab Emirates | | | — | | | | 666,684 | | | | — | | | | 666,684 | |
United Kingdom | | | 417,599 | | | | 2,404,055 | | | | — | | | | 2,821,654 | |
United States | | | 55,033,399 | | | | 72,932 | | | | 83,667 | | | | 55,189,998 | |
Corporate Bonds: | | | | | | | | | | | | | | | | |
Australia | | | — | | | | — | | | | 781,347 | | | | 781,347 | |
Belgium | | | — | | | | 204,514 | | | | — | | | | 204,514 | |
Chile | | | — | | | | 3,326 | | | | — | | | | 3,326 | |
China | | | — | | | | 3,000 | | | | — | | | | 3,000 | |
France | | | — | | | | 190,138 | | | | — | | | | 190,138 | |
Germany | | | — | | | | 262,850 | | | | — | | | | 262,850 | |
Japan | | | — | | | | 417,208 | | | | — | | | | 417,208 | |
Luxembourg | | | — | | | | 38,110 | | | | — | | | | 38,110 | |
Netherlands | | | — | | | | 199,879 | | | | — | | | | 199,879 | |
Singapore | | | — | | | | 177,652 | | | | — | | | | 177,652 | |
Turkey | | | — | | | | — | | | | 124,000 | | | | 124,000 | |
United Kingdom | | | — | | | | 195,731 | | | | — | | | | 195,731 | |
United States | | | — | | | | 5,498,416 | | | | — | | | | 5,498,416 | |
Floating Rate Loan Interests | | | — | | | | 320,913 | | | | — | | | | 320,913 | |
Foreign Government Obligations | | | — | | | | 4,861,496 | | | | — | | | | 4,861,496 | |
Investment Companies | | | 2,252,205 | | | | — | | | | — | | | | 2,252,205 | |
Preferred Securities: | | | | | | | | | | | | | | | | |
Brazil | | | 97,210 | | | | — | | | | — | | | | 97,210 | |
China | | | — | | | | 413,913 | | | | — | | | | 413,913 | |
South Korea | | | — | | | | 12,258 | | | | — | | | | 12,258 | |
United Kingdom | | | — | | | | 535,707 | | | | — | | | | 535,707 | |
United States | | | 563,243 | | | | 979,367 | | | | 1,746,553 | | | | 3,289,163 | |
U.S. Treasury Obligations | | | — | | | | 42,272,507 | | | | — | | | | 42,272,507 | |
Short-Term Securities: | | | | | | | | | | | | | | | | |
Foreign Government Obligations | | | — | | | | 3,496,413 | | | | — | | | | 3,496,413 | |
Money Market Funds | | | 572,384 | | | | — | | | | — | | | | 572,384 | |
Time Deposits | | | — | | | | 28,049 | | | | — | | | | 28,049 | |
U.S. Treasury Obligations | | | — | | | | 6,745,901 | | | | — | | | | 6,745,901 | |
Options Purchased: | | | | | | | | | | | | | | | | |
Equity contracts | | | — | | | | 356,928 | | | | — | | | | 356,928 | |
Foreign currency exchange contracts | | | — | | | | 67,239 | | | | — | | | | 67,239 | |
Interest rate contracts | | | — | | | | 2,464 | | | | — | | | | 2,464 | |
Liabilities: | | | | | | | | | | | | | | | | |
Investment Sold Short | | | | | | | | | | | | | | | | |
Common Stocks: | | | | | | | | | | | | | | | | |
France | | | — | | | | (98,472 | ) | | | — | | | | (98,472 | ) |
Japan | | | — | | | | (226,475 | ) | | | — | | | | (226,475 | ) |
United States | | | (61,122 | ) | | | — | | | | — | | | | (61,122 | ) |
| | | | | | | | | | | | | | | | |
Subtotal | | $ | 65,389,341 | | | $ | 106,375,069 | | | $ | 2,852,796 | | | $ | 174,617,206 | |
| | | | | | | | | | | | | | | | |
Investments valued at NAV(a) | | | | | | | | | | | | | | | 2,217,509 | |
| | | | | | | | | | | | | | | | |
Total Investments | | | | | | | | | | | | | | $ | 176,834,715 | |
| | | | | | | | | | | | | | | | |
Derivative Financial Instruments(b) | | | | | | | | | | | | | | | | |
Assets: | | | | | | | | | | | | | | | | |
Credit contracts | | $ | — | | | $ | 5,828 | | | $ | — | | | $ | 5,828 | |
Equity contracts | | | 135,030 | | | | 97,997 | | | | — | | | | 233,027 | |
Foreign currency exchange contracts | | | — | | | | 124,997 | | | | — | | | | 124,997 | |
Interest rate contracts | | | — | | | | 318,052 | | | | — | | | | 318,052 | |
Liabilities: | | | | | | | | | | | | | | | | |
Equity contracts | | | (9,388 | ) | | | (1,306,687 | ) | | | — | | | | (1,316,075 | ) |
Foreign currency exchange contracts | | | — | | | | (143,393 | ) | | | — | | | | (143,393 | ) |
Interest rate contracts | | | (18,093 | ) | | | (199,717 | ) | | | — | | | | (217,810 | ) |
| | | | | | | | | | | | | | | | |
| | $ | 107,549 | | | $ | (1,102,923 | ) | | $ | — | | | $ | (995,374 | ) |
| | | | | | | | | | | | | | | | |
| | (a) | As of December 31, 2018, certain investments of the Fund were fair valued using NAV per share as no quoted market value is available and therefore have been excluded from the fair value hierarchy. | |
| | (b) | Derivative financial instruments are swaps, futures contracts, forward foreign currency exchange contracts, and options written. Swaps, futures contracts and forward foreign currency exchange contracts are valued at the unrealized appreciation (depreciation) on the instrument and options written are shown at value. | |
| | | | |
| CONSOLIDATED SCHEDULES OF INVESTMENTS | | | 79 | |
| | |
Consolidated Schedule of Investments (continued) December 31, 2018 | | BlackRock Global Allocation Portfolio |
Transfers between Level 1 and Level 2 were as follows:
| | | | | | | | |
| | | Transfers
Out of Level 1(a) | | | Transfers
Into Level 2(a) | |
Assets: | | | | | | | | |
Investments: | | | | | | | | |
Common Stocks: | | | | | | | | |
Czech Republic | | $ | 87,740 | | | $ | 87,740 | |
Hong Kong | | | 199,749 | | | | 199,749 | |
India | | | 1,395 | | | | 1,395 | |
Japan | | | 5,627 | | | | 5,627 | |
Poland | | | 1,097 | | | | 1,097 | |
Portugal | | | 206,795 | | | | 206,795 | |
South Korea | | | 462,530 | | | | 462,530 | |
Taiwan | | | 361,793 | | | | 361,793 | |
Thailand | | | 151,715 | | | | 151,715 | |
United Arab Emirates | | | 784,100 | | | | 784,100 | |
United Kingdom | | | 313,532 | | | | 313,532 | |
| | | | | | | | |
| | $ | 2,576,073 | | | $ | 2,576,073 | |
| | | | | | | | |
| | (a) | External pricing service used to reflect any significant market movements between the time the Fund valued such foreign securities and the earlier closing of foreign markets. See notes to financial statements. | |
A reconciliation of Level 3 investments is presented when the Fund had a significant amount of Level 3 investments at the beginning and/or end of the year in relation to net assets. The following table is a reconciliation of Level 3 investments for which significant unobservable inputs were used in determining fair value:
| | | | | | | | | | | | | | | | | | | | |
| | | Common
Stocks | | | Corporate
Bonds | | | Preferred
Securities | | | Warrants | | | Total | |
Investments: | | | | | | | | | | | | | | | | | | | | |
Assets: | | | | | | | | | | | | | | | | | | | | |
Opening Balance, as of December 31, 2017 | | $ | 9,808 | | | $ | 225,617 | | | $ | 2,338,429 | | | $ | 1 | | | $ | 2,573,855 | |
Transfers into Level 3 | | | — | | | | — | | | | — | | | | — | | | | — | |
Transfers out of Level 3 | | | — | | | | (1,500 | ) | | | (866,832 | ) | | | — | | | | (868,332 | ) |
Accrued discounts/premiums | | | — | | | | (2,635 | ) | | | — | | | | — | | | | (2,635 | ) |
Net realized gain (loss) | | | — | | | | (982,547 | ) | | | — | | | | — | | | | (982,547 | ) |
Net change in unrealized appreciation (depreciation)(a)(b) | | | (87,886 | ) | | | 831,630 | | | | 223,843 | | | | (1 | ) | | | 967,586 | |
Purchases | | | 278,974 | | | | 834,782 | | | | 51,113 | | | | — | | | | 1,164,869 | |
Sales | | | — | | | | — | | | | — | | | | — | | | | — | |
| | | | | | | | | | | | | | | | | | | | |
Closing Balance, as of December 31, 2018 | | $ | 200,896 | | | $ | 905,347 | | | $ | 1,746,553 | | | $ | — | | | $ | 2,852,796 | |
| | | | | | | | | | | | | | | | | | | | |
Net change in unrealized appreciation (depreciation) on investments still held at December 31, 2018(b) | | $ | (87,886 | ) | | $ | (136,320 | ) | | $ | 223,843 | | | $ | — | | | $ | (363 | ) |
| | | | | | | | | | | | | | | | | | | | |
| | (a) | Included in the related net change in unrealized appreciation (depreciation) in the Statements of Operations. | |
| | (b) | Any difference between net change in unrealized appreciation (depreciation) and net change in unrealized appreciation (depreciation) on investments still held at December 31, 2018 is generally due to investments no longer held or categorized as Level 3 at period end. | |
The Fund’s investments that are categorized as Level 3 were valued utilizing third party pricing information without adjustment. Such valuations are based on unobservable inputs. A significant change in third party information could result in a significantly lower or higher value of such Level 3 investments.
| | |
| 80 | | 2018 BLACKROCK ANNUAL REPORTTO SHAREHOLDERS |
| | |
Consolidated Schedule of Investments (continued) December 31, 2018 | | BlackRock Global Allocation Portfolio |
The following table summarizes the valuation approaches used and unobservable inputs utilized by the BlackRock Global Valuation Methodologies Committee (the “Global Valuation Committee”) to determine the value of certain of the Fund’s Level 3 investments as of period end. The table does not include Level 3 investments with values based upon unadjusted third party pricing information in the amount of $83,638. A significant change in the third party information could result in a significantly lower or higher value of such Level 3 investments.
| | | | | | | | | | | | | | | | |
| | | Value | | | Valuation
Approach | | Unobservable Inputs | | Range of
Unobservable
Inputs Utilized | | | Weighted
Average of
Unobservable
Inputs | |
Common Stocks | | $ | 117,258 | | | Market | | Revenue Multiple(a) | | | 3.50x | | | | — | |
| | | | | | | | Time to Exit(a) | | | 0.5 years | | | | — | |
| | | | | | | | Volatility(a) | | | 44% | | | | — | |
| | | | | | Income | | Discount Rate(b) | | | 15% | | | | — | |
Corporate Bonds | | | 905,347 | | | Income | | Discount Rate(b) | | | 15% - 38% | | | | 18% | |
Preferred Stocks(c) | | | 1,746,553 | | | Market | | Recent Transactions(a) | | | — | | | | — | |
| | | | | | | | | | | | | | | | |
| | | | | | | | Revenue Multiple(a) | | | 3.50x - 14.25x | | | | 7.43x | |
| | | | | | | | Time to Exit(b) | | | 0.5 years | | | | — | |
| | | | | | | | Volatility(b) | | | 44% | | | | — | |
| | $ | 2,769,158 | | | | | | | | | | | | | |
| | | | | | | | | | | | | | | | |
| | (a) | Increase in unobservable input may result in a significant increase to value, while a decrease in unobservable input may result in a significant decrease to value. | |
| | (b) | Decrease in unobservable input may result in a significant increase to value, while an increase in unobservable input may result in a significant decrease to value. | |
| | (c) | For the year ended December 31, 2018, the valuation technique for investments classified as preferred stocks amounting to $1,213,830 changed to Current Value. The investments were previously valued utilizing Transaction Price. The change was due to consideration of the information that was available at the time the investments were valued. | |
See notes to financial statements.
| | | | |
| CONSOLIDATED SCHEDULES OF INVESTMENTS | | | 81 | |
| | |
Schedule of Investments December 31, 2018 | | BlackRock Government Money Market Portfolio (Percentages shown are based on Net Assets) |
| | | | | | | | | | | | |
| Security | | Par
(000) | | | Value | |
|
U.S. Government Sponsored Agency Obligations — 47.3% | |
Federal Farm Credit Bank Discount Notes(a): | | | | | | | | | | | | |
2.09%, 01/15/19 | | | USD | | | | 1,995 | | | $ | 1,993,231 | |
2.11%, 01/16/19 | | | | | | | 1,380 | | | | 1,378,770 | |
2.30%, 02/04/19 | | | | | | | 780 | | | | 778,372 | |
2.39%, 03/11/19 | | | | | | | 745 | | | | 741,830 | |
2.40%, 03/19/19 | | | | | | | 745 | | | | 741,447 | |
2.44%, 04/12/19 | | | | | | | 200 | | | | 198,754 | |
2.50%, 06/17/19 | | | | | | | 765 | | | | 756,483 | |
2.51%, 06/28/19 | | | | | | | 530 | | | | 523,684 | |
2.52%, 07/23/19 | | | | | | | 1,175 | | | | 1,158,351 | |
2.52%, 07/29/19 | | | | | | | 3,080 | | | | 3,033,741 | |
2.55%, 08/15/19 | | | | | | | 720 | | | | 709,152 | |
2.56%, 09/12/19 | | | | | | | 495 | | | | 485,885 | |
Federal Farm Credit Bank Variable Rate Notes(b): | | | | | | | | | | | | |
(LIBOR USD 1 Month - 0.05%), 2.33%, 02/07/20 | | | | | | | 1,545 | | | | 1,544,983 | |
(LIBOR USD 1 Month + 0.00%), 2.47%, 06/19/20 | | | | | | | 1,000 | | | | 1,000,683 | |
(LIBOR USD 1 Month - 0.05%), 2.41%, 08/17/20 | | | | | | | 455 | | | | 455,000 | |
(LIBOR USD 1 Month - 0.04%), 2.36%, 09/11/20 | | | | | | | 545 | | | | 544,972 | |
(LIBOR USD 1 Month + 0.03%), 2.47%, 12/14/20 | | | | | | | 685 | | | | 684,945 | |
Federal Home Loan Bank Discount Notes(a): | | | | | | | | | | | | |
1.21%, 01/04/19 | | | | | | | 525 | | | | 524,907 | |
1.88%, 01/09/19 | | | | | | | 1,885 | | | | 1,884,045 | |
1.98%, 01/11/19 | | | | | | | 1,900 | | | | 1,898,784 | |
2.11%, 01/16/19 | | | | | | | 3,250 | | | | 3,246,860 | |
2.21%, 01/23/19 | | | | | | | 430 | | | | 429,384 | |
2.25%, 01/29/19 | | | | | | | 210 | | | | 209,637 | |
2.30%, 02/05/19 | | | | | | | 430 | | | | 429,020 | |
2.31%, 02/06/19 | | | | | | | 640 | | | | 638,496 | |
2.32%, 02/11/19 | | | | | | | 1,305 | | | | 1,301,486 | |
2.33%, 02/13/19 | | | | | | | 300 | | | | 299,147 | |
2.33%, 02/15/19 | | | | | | | 810 | | | | 807,602 | |
2.35%, 02/20/19 | | | | | | | 360 | | | | 358,810 | |
2.39%, 03/06/19 | | | | | | | 200 | | | | 199,201 | |
2.40%, 03/20/19 | | | | | | | 1,250 | | | | 1,243,714 | |
2.41%, 03/27/19 | | | | | | | 5,000 | | | | 4,971,348 | |
2.50%, 06/21/19 | | | | | | | 735 | | | | 726,307 | |
Federal Home Loan Bank Variable Rate Notes(b): | | | | | | | | | | | | |
(LIBOR USD 1 Month - 0.09%), 2.42%, 01/25/19 | | | | | | | 845 | | | | 845,000 | |
(LIBOR USD 1 Month - 0.13%), 2.38%, 01/28/19 | | | | | | | 495 | | | | 495,000 | |
(LIBOR USD 1 Month - 0.13%), 2.22%, 02/01/19 | | | | | | | 855 | | | | 855,000 | |
(LIBOR USD 1 Month - 0.12%), 2.39%, 02/25/19 | | | | | | | 810 | | | | 810,000 | |
(LIBOR USD 1 Month - 0.12%), 2.39%, 03/25/19 | | | | | | | 1,700 | | | | 1,700,000 | |
(LIBOR USD 1 Month - 0.09%), 2.29%, 04/05/19 | | | | | | | 3,000 | | | | 3,000,000 | |
(LIBOR USD 3 Month - 0.16%), 2.62%, 06/12/19 | | | | | | | 340 | | | | 339,961 | |
(LIBOR USD 1 Month - 0.09%), 2.35%, 06/14/19 | | | | | | | 1,620 | | | | 1,620,000 | |
(LIBOR USD 3 Month - 0.16%), 2.63%, 06/20/19 | | | | | | | 855 | | | | 855,000 | |
2.50%, 06/21/19 | | | | | | | 225 | | | | 225,000 | |
(LIBOR USD 1 Month - 0.08%), 2.32%, 07/11/19 | | | | | | | 1,760 | | | | 1,760,000 | |
(LIBOR USD 1 Month - 0.11%), 2.36%, 07/19/19 | | | | | | | 2,095 | | | | 2,095,000 | |
(LIBOR USD 1 Month - 0.08%), 2.43%, 08/27/19 | | | | | | | 785 | | | | 785,000 | |
(LIBOR USD 1 Month - 0.09%), 2.30%, 09/09/19 | | | | | | | 1,655 | | | | 1,655,000 | |
(LIBOR USD 1 Month - 0.07%), 2.39%, 09/17/19 | | | | | | | 630 | | | | 630,000 | |
(LIBOR USD 3 Month - 0.14%), 2.66%, 12/19/19 | | | | | | | 430 | | | | 430,000 | |
(LIBOR USD 1 Month - 0.06%), 2.44%, 02/24/20 | | | | | | | 1,180 | | | | 1,180,000 | |
(LIBOR USD 1 Month - 0.04%), 2.41%, 04/17/20 | | | | | | | 1,805 | | | | 1,804,773 | |
(LIBOR USD 3 Month - 0.14%), 2.31%, 04/20/20 | | | | | | | 2,000 | | | | 2,000,000 | |
Federal Home Loan Mortgage Corp. Variable Rate Notes, (LIBOR USD 1 Month - 0.10%),
2.29%, 08/08/19(b) | | | | | | | 965 | | | | 964,713 | |
Federal National Mortgage Association Discount Notes,
1.88%, 01/09/19(a) | | | | | | | 1,485 | | | | 1,484,261 | |
Federal National Mortgage Association Notes,
0.88%, 08/02/19 | | | | | | | 730 | | | | 722,666 | |
| | | | | |
| |
Total U.S. Government Sponsored Agency Obligations — 47.3%
(Cost: $62,155,405) | | | | 62,155,405 | |
| | | | | |
| | | | | | | | | | | | |
| Security | | Par
(000) | | | Value | |
|
U.S. Treasury Obligations — 11.3% | |
U.S. Treasury Bills(a): | | | | | | | | | | | | |
2.05%, 01/17/19 | | | USD | | | | 7,305 | | | $ | 7,298,034 | |
2.28%, 02/07/19 | | | | | | | 2,130 | | | | 2,125,228 | |
2.31%, 02/21/19 | | | | | | | 965 | | | | 962,013 | |
U.S. Treasury Notes: | | | | | | | | | | | | |
1.13%, 01/31/19 | | | | | | | 60 | | | | 59,948 | |
1.25%, 01/31/19 | | | | | | | 60 | | | | 59,955 | |
(US Treasury 3 Month Bill Money Market Yield + 0.14%),
2.57%, 01/31/19(b) | | | | | | | 3,000 | | | | 3,000,000 | |
(US Treasury 3 Month Bill Money Market Yield + 0.05%),
2.47%, 10/31/20(b) | | | | | | | 1,300 | | | | 1,297,519 | |
| | | | | |
| |
Total U.S. Treasury Obligations — 11.3%
(Cost: $14,802,697) | | | | 14,802,697 | |
| | | | | | | | |
| |
Total Repurchase Agreements — 37.8%
(Cost: $49,700,000) | | | | 49,700,000 | |
| | | | | | | | |
| |
Total Investments — 96.4%
(Cost: $126,658,102)(c) | | | | 126,658,102 | |
| |
Other Assets Less Liabilities — 3.6% | | | | 4,702,498 | |
| | | | | | | | |
| |
Net Assets — 100.0% | | | $ | 131,360,600 | |
| | | | | | | | |
| (a) | Rates are discount rates or a range of discount rates as of period end. |
| (b) | Variable rate security. Rate shown is the rate in effect as of period end. |
| (c) | Cost for U.S. federal income tax purposes. |
| | |
| 82 | | 2018 BLACKROCK ANNUAL REPORTTO SHAREHOLDERS |
| | |
Schedule of Investments (continued) December 31, 2018 | | BlackRock Government Money Market Portfolio |
Repurchase Agreements
| | | | | | | | | | | | | | | | | | | | | | | | | | | | | | |
| | | Repurchase Agreements | | | | Collateral |
| Counterparty | | Coupon
Rate | | | Purchase
Date | | | Maturity
Date | | | Par
(000) | | | At Value
(000) | | | Proceeds
Including
Interest | | | | Position | | Original Par | | Position
Received,
At Value |
Bank of Montreal | | | 2.90 | % | | | 12/31/18 | | | | 01/02/19 | | | $ | 1,500 | | | $ | 1,500 | | | $1,500,242 | | | | U.S. Government Sponsored Agency Obligations and U.S. Treasury Obligations, 0.63% to 5.00%, due 02/28/19 to 08/15/48 | | $4,551,473 | | $1,540,014 |
BNP Paribas SA | | | 3.00 | | | | 12/31/18 | | | | 01/02/19 | | | | 10,000 | | | | 10,000 | | | 10,001,667 | | | | U.S. Government Sponsored Agency Obligations, 3.00% to 6.00%, due 12/15/23 to 08/20/48 | | 24,253,021 | | 10,200,001 |
Goldman Sachs & Co. LLC | | | 2.67 | | | | 12/31/18 | | | | 01/07/19 | | | | 3,000 | | | | 3,000 | | | 3,001,557 | | | | U.S. Government Sponsored Agency Obligation, 3.75%, due 08/01/28 | | 3,022,712 | | 3,090,001 |
JP Morgan Securities LLC | | | 2.67 | (a) | | | 12/31/18 | | | | 02/06/19 | | | | 2,500 | | | | 2,500 | | | 2,506,867 | | | | U.S. Government Sponsored Agency Obligations, 3.13% to 4.09%, due 01/20/40 to 02/25/51 | | 47,937,800 | | 2,625,003 |
| | | 2.95 | | | | 12/31/18 | | | | 01/02/19 | | | | 10,000 | | | | 10,000 | | | 10,001,639 | | | | U.S. Treasury Obligation, 1.50%, due 11/30/19 | | 10,291,400 | | 10,200,027 |
| | | | | | | | | | | | | | | | | | | | | | | | | | | | | | |
Total JP Morgan Securities LLC | | | $ | 12,500 | | | | | | | | | | | $12,825,030 |
| | | | | | | | | | | | | | | | | | | | | | | | | | | | | | |
Merrill Lynch, Pierce, Fenner & Smith, Inc. | | | 2.65 | | | | 12/31/18 | | | | 01/07/19 | | | | 1,500 | | | | 1,500 | | | 1,500,773 | | | | U.S. Government Sponsored Agency Obligation, 4.00%, due 08/01/48 | | 1,538,070 | | 1,545,000 |
| | | 3.00 | | | | 12/31/18 | | | | 01/02/19 | | | | 10,000 | | | | 10,000 | | | 10,001,667 | | | | U.S. Government Sponsored Agency Obligation, 4.50%, due 08/20/48 | | 9,690,300 | | 10,200,000 |
| | | | | | | | | | | | | | | | | | | | | | | | | | | | | | |
Total Merrill Lynch, Pierce, Fenner & Smith, Inc. | | | $ | 11,500 | | | | | | | | | | | $11,745,000 |
| | | | | | | | | | | | | | | | | | | | | | | | | | | | | | |
Mizuho Securities USA LLC | | | 2.95 | | | | 12/31/18 | | | | 01/02/19 | | | | 10,000 | | | | 10,000 | | | 10,001,639 | | | | U.S. Treasury Obligation, 2.63%, due 12/31/23 | | 10,175,000 | | 10,200,030 |
Wells Fargo Securities LLC | | | 2.50 | | | | 12/26/18 | | | | 01/02/19 | | | | 1,200 | | | | 1,200 | | | 1,200,583 | | | | U.S. Government Sponsored Agency Obligations, 0.00% to 9.00%, due 03/01/19 to 06/01/53 | | 13,399,161 | | 1,225,899 |
| | | | | | | | | | | | | | | | | | | | | | | | | | | | | | |
| | | | | | | | | | | | | | | | | | $ | 49,700 | | | | | | | | | | | $50,825,975 |
| | | | | | | | | | | | | | | | | | | | | | | | | | | | | | |
| | (a) | Variable rate security. Rate as of period end and maturity is the date the principal owed can be recovered through demand. | |
Fair Value Hierarchy as of Period End
Various inputs are used in determining the fair value of investments. For information about the Fund’s policy regarding valuation of investments, refer to the Notes to Financial Statements.
The following table summarizes the Fund’s investments categorized in the disclosure hierarchy:
| | | | | | | | | | | | | | | | |
| | | Level 1 | | | Level 2 | | | Level 3 | | | Total | |
Assets: | | | | | | | | | | | | | | | | |
Investments: | | | | | | | | | | | | | | | | |
Short-Term Securities(a) | | $ | — | | | $ | 126,658,102 | | | $ | — | | | $ | 126,658,102 | |
| | | | | | | | | | | | | | | | |
| | (a) | See above Schedule of Investments for values in each security type. | |
During the year ended December 31, 2018, there were no transfers between levels.
See notes to financial statements.
| | | | |
| SCHEDULES OF INVESTMENTS | | | 83 | |
| | |
Schedule of Investments (continued) December 31, 2018 | | BlackRock High Yield Portfolio (Percentages shown are based on Net Assets) |
| | | | | | | | | | | | |
| Security | | | | |
Shares | | | Value | |
|
Common Stocks — 1.3% | |
|
| Chemicals — 0.4% | |
Platform Specialty Products Corp.(a) | | | | | | | 8,813 | | | $ | 91,038 | |
| | | | | | | | | | | | |
| | | |
| Containers & Packaging — 0.2% | | | | | | | | | |
Crown Holdings, Inc.(a) | | | | | | | 1,433 | | | | 59,570 | |
| | | | | | | | | | | | |
|
| Equity Real Estate Investment Trusts (REITs) — 0.1% | |
Gaming and Leisure Properties, Inc. | | | | | | | 880 | | | | 28,433 | |
| | | | | | | | | | | | |
| | | |
| Hotels, Restaurants & Leisure — 0.4% | | | | | | | | | |
Star Group, Inc. (The)(a) | | | | | | | 6,142 | | | | 101,407 | |
| | | | | | | | | | | | |
| | | |
| Media — 0.1% | | | | | | | | | |
Altice USA, Inc., Class A | | | | | | | 1,650 | | | | 27,258 | |
| | | | | | | | | | | | |
| | | |
| Metals & Mining — 0.1% | | | | | | | | | |
Constellium NV, Class A(a) | | | | | | | 5,016 | | | | 35,062 | |
| | | | | | | | | | | | |
| |
Total Common Stocks — 1.3%
(Cost: $451,103) | | | | 342,768 | |
| | | | | | | | | | | | |
| | | |
| | | | | | Par (000) | | | | |
| | | |
| Corporate Bonds — 76.2% | | | | | | | | | |
| | | |
| Aerospace & Defense — 2.3% | | | | | | | | | |
Arconic, Inc., 5.13%, 10/01/24 | | | USD | | | | 100 | | | | 96,001 | |
BBA US Holdings, Inc., 5.38%, 05/01/26(b) | | | | | | | 27 | | | | 25,582 | |
Bombardier, Inc.(b): | | | | | | | | | | | | |
7.75%, 03/15/20 | | | | | | | 10 | | | | 10,150 | |
8.75%, 12/01/21 | | | | | | | 46 | | | | 47,380 | |
5.75%, 03/15/22 | | | | | | | 13 | | | | 12,122 | |
6.00%, 10/15/22 | | | | | | | 2 | | | | 1,875 | |
6.13%, 01/15/23 | | | | | | | 67 | | | | 62,812 | |
7.50%, 12/01/24 | | | | | | | 128 | | | | 120,640 | |
7.50%, 03/15/25 | | | | | | | 99 | | | | 93,308 | |
BWX Technologies, Inc., 5.38%, 07/15/26(b) | | | | | | | 15 | | | | 14,433 | |
Kratos Defense & Security Solutions, Inc., 6.50%, 11/30/25(b) | | | | | | | 27 | | | | 27,473 | |
Pioneer Holdings LLC, 9.00%, 11/01/22(b) | | | | | | | 14 | | | | 14,070 | |
TransDigm, Inc.: | | | | | | | | | | | | |
6.00%, 07/15/22 | | | | | | | 12 | | | | 11,820 | |
6.50%, 07/15/24 | | | | | | | 50 | | | | 48,625 | |
6.50%, 05/15/25 | | | | | | | 14 | | | | 13,370 | |
6.38%, 06/15/26 | | | | | | | 28 | | | | 26,040 | |
| | | | | | | | | | | | |
| | | | | | | | | | | 625,701 | |
| | | |
| Auto Components — 0.2% | | | | | | | | | |
Icahn Enterprises LP: | | | | | | | | | | | | |
6.00%, 08/01/20 | | | | | | | 3 | | | | 2,996 | |
6.75%, 02/01/24 | | | | | | | 41 | | | | 40,590 | |
6.38%, 12/15/25 | | | | | | | 21 | | | | 20,213 | |
Lear Corp., Escrow(a)(c): | | | | | | | | | | | | |
0.00%, 12/01/13 | | | | | | | 150 | | | | — | |
0.00%, 08/01/14 | | | | | | | 100 | | | | — | |
| | | | | | | | | | | | |
| | | | | | | | | | | 63,799 | |
| | | |
| Automobiles — 0.1% | | | | | | | | | |
Tesla, Inc., 5.30%, 08/15/25(b) | | | | | | | 41 | | | | 35,619 | |
| | | | | | | | | | | | |
| | | |
| Banks — 0.4% | | | | | | | | | |
Banco Espirito Santo SA, 4.75%, 01/15/18(a)(d) | | | EUR | | | | 100 | | | | 32,940 | |
CIT Group, Inc.: | | | | | | | | | | | | |
5.00%, 08/01/23 | | | USD | | | | 54 | | | | 52,920 | |
5.25%, 03/07/25 | | | | | | | 12 | | | | 11,730 | |
6.13%, 03/09/28 | | | | | | | 10 | | | | 9,950 | |
| | | | | | | | | | | | |
| | | | | | | | | | | 107,540 | |
| | | | | | | | | | | | |
| Security | | | | | Par (000) | | | Value | |
| | | |
| Building Products — 0.5%(b) | | | | | | | | | |
CPG Merger Sub LLC, 8.00%, 10/01/21 | | | USD | | | | 37 | | | $ | 35,890 | |
Jeld-Wen, Inc., 4.63%, 12/15/25 | | | | | | | 14 | | | | 12,250 | |
Masonite International Corp., 5.75%, 09/15/26 | | | | | | | 15 | | | | 14,138 | |
NCI Building Systems, Inc., 8.00%, 04/15/26 | | | | | | | 7 | | | | 6,405 | |
PGT Escrow Issuer, Inc., 6.75%, 08/01/26 | | | | | | | 10 | | | | 9,850 | |
Standard Industries, Inc.: | | | | | | | | | | | | |
5.38%, 11/15/24 | | | | | | | 13 | | | | 12,204 | |
6.00%, 10/15/25 | | | | | | | 36 | | | | 34,527 | |
USG Corp., 4.88%, 06/01/27 | | | | | | | 18 | | | | 18,135 | |
| | | | | | | | | | | | |
| | | | | | | | | | | 143,399 | |
| | | |
| Capital Markets — 0.2% | | | | | | | | | |
Eagle Holding Co. II LLC,
7.63% ( 7.63% Cash or 8.38% PIK), 05/15/22(b)(e) | | | | | | | 21 | | | | 20,055 | |
FS Energy & Power Fund, 7.50%, 08/15/23(b) | | | | | | | 19 | | | | 18,050 | |
Lehman Brothers Holdings Capital Trust VII Escrow Bonds(a)(d): | | | | | | | | | | | | |
9.00%, 03/01/15 | | | | | | | 30 | | | | 570 | |
0.00%, 05/17/49 | | | | | | | 110 | | | | 2,090 | |
Lions Gate Capital Holdings LLC,
5.88%, 11/01/24(b) | | | | | | | 10 | | | | 9,875 | |
MSCI, Inc., 5.25%, 11/15/24(b) | | | | | | | 12 | | | | 11,940 | |
| | | | | | | | | | | | |
| | | | | | | | | | | 62,580 | |
| | | |
| Chemicals — 2.9% | | | | | | | | | |
Blue Cube Spinco LLC: | | | | | | | | | | | | |
9.75%, 10/15/23 | | | | | | | 42 | | | | 46,200 | |
10.00%, 10/15/25 | | | | | | | 32 | | | | 36,160 | |
Chemours Co. (The): | | | | | | | | | | | | |
6.63%, 05/15/23 | | | | | | | 14 | | | | 14,140 | |
7.00%, 05/15/25 | | | | | | | 41 | | | | 41,307 | |
5.38%, 05/15/27 | | | | | | | 14 | | | | 12,600 | |
Gates Global LLC, 6.00%, 07/15/22(b) | | | | | | | 85 | | | | 83,300 | |
GCB MPM Escrow LLC, 8.88%, 10/15/20(c) | | | | | | | 82 | | | | — | |
GCP Applied Technologies, Inc., 5.50%, 04/15/26(b) | | | | | | | 16 | | | | 15,600 | |
Hexion, Inc., 10.38%, 02/01/22(b) | | | | | | | 22 | | | | 17,545 | |
Huntsman International LLC, 5.13%, 11/15/22 | | | | | | | 20 | | | | 20,150 | |
Koppers, Inc., 6.00%, 02/15/25(b) | | | | | | | 10 | | | | 8,800 | |
Momentive Performance Materials, Inc., 3.88%, 10/24/21 | | | | | | | 28 | | | | 29,680 | |
NOVA Chemicals Corp., 4.88%, 06/01/24(b) | | | | | | | 31 | | | | 27,978 | |
Olin Corp., 5.13%, 09/15/27 | | | | | | | 30 | | | | 27,600 | |
Platform Specialty Products Corp.(b): | | | | | | | | | | | | |
6.50%, 02/01/22 | | | | | | | 200 | | | | 200,000 | |
5.88%, 12/01/25 | | | | | | | 126 | | | | 117,810 | |
PQ Corp.(b): | | | | | | | | | | | | |
6.75%, 11/15/22 | | | | | | | 42 | | | | 43,260 | |
5.75%, 12/15/25 | | | | | | | 51 | | | | 47,175 | |
| | | | | | | | | | | | |
| | | | | | | | | | | 789,305 | |
| | | |
| Commercial Services & Supplies — 2.0% | | | | | | | | | |
ADT Corp. (The): | | | | | | | | | | | | |
3.50%, 07/15/22 | | | | | | | 37 | | | | 34,225 | |
4.13%, 06/15/23 | | | | | | | 34 | | | | 31,110 | |
4.88%, 07/15/32(b) | | | | | | | 46 | | | | 34,040 | |
Advanced Disposal Services, Inc.,
5.63%, 11/15/24(b) | | | | | | | 9 | | | | 8,797 | |
APX Group, Inc.: | | | | | | | | | | | | |
8.75%, 12/01/20 | | | | | | | 34 | | | | 32,385 | |
7.88%, 12/01/22 | | | | | | | 25 | | | | 23,625 | |
Aramark Services, Inc.(b): | | | | | | | | | | | | |
5.00%, 04/01/25 | | | | | | | 5 | | | | 4,887 | |
5.00%, 02/01/28 | | | | | | | 63 | | | | 58,748 | |
GFL Environmental, Inc., 5.38%, 03/01/23(b) | | | | | | | 13 | | | | 11,375 | |
Harland Clarke Holdings Corp., 8.38%, 08/15/22(b) | | | | | | | 14 | | | | 12,758 | |
Hulk Finance Corp., 7.00%, 06/01/26(b) | | | | | | | 12 | | | | 10,470 | |
| | |
| 84 | | 2018 BLACKROCK ANNUAL REPORTTO SHAREHOLDERS |
| | |
Schedule of Investments (continued) December 31, 2018 | | BlackRock High Yield Portfolio (Percentages shown are based on Net Assets) |
| | | | | | | | | | | | |
| Security | | | | | Par (000) | | | Value | |
| | | |
| Commercial Services & Supplies (continued) | | | | | | | | | |
KAR Auction Services, Inc., 5.13%, 06/01/25(b) | | | USD | | | | 20 | | | $ | 18,050 | |
Matthews International Corp., 5.25%, 12/01/25(b) | | | | | | | 2 | | | | 1,860 | |
Mobile Mini, Inc., 5.88%, 07/01/24 | | | | | | | 50 | | | | 49,000 | |
Nielsen Co. Luxembourg SARL (The), 5.00%, 02/01/25(b) | | | | | | | 6 | | | | 5,610 | |
Nielsen Finance LLC, 5.00%, 04/15/22(b) | | | | | | | 35 | | | | 33,425 | |
Prime Security Services Borrower LLC, 9.25%, 05/15/23(b) | | | | | | | 99 | | | | 102,094 | |
Ritchie Bros Auctioneers, Inc., 5.38%, 01/15/25(b) | | | | | | | 20 | | | | 19,400 | |
Tervita Escrow Corp., 7.63%, 12/01/21(b) | | | | | | | 32 | | | | 30,480 | |
Waste Pro USA, Inc., 5.50%, 02/15/26(b) | | | | | | | 12 | | | | 11,040 | |
| | | | | | | | | | | | |
| | | | | | | | | | | 533,379 | |
| | | |
| Communications Equipment — 0.4% | | | | | | | | | |
CommScope Technologies LLC,
5.00%, 03/15/27(b) | | | | | | | 40 | | | | 32,400 | |
CommScope, Inc., 5.50%, 06/15/24(b) | | | | | | | 3 | | | | 2,745 | |
Nokia OYJ, 6.63%, 05/15/39 | | | | | | | 60 | | | | 60,900 | |
| | | | | | | | | | | | |
| | | | | | | | | | | 96,045 | |
| | | |
| Construction & Engineering — 0.3% | | | | | | | | | |
Brand Industrial Services, Inc., 8.50%, 07/15/25(b) | | | | | | | 22 | | | | 18,755 | |
Engility Corp., 8.88%, 09/01/24 | | | | | | | 26 | | | | 27,755 | |
New Enterprise Stone & Lime Co., Inc.(b): | | | | | | | | | | | | |
10.13%, 04/01/22 | | | | | | | 17 | | | | 16,575 | |
6.25%, 03/15/26 | | | | | | | 7 | | | | 6,370 | |
Tutor Perini Corp., 6.88%, 05/01/25(b) | | | | | | | 12 | | | | 11,160 | |
Weekley Homes LLC, 6.63%, 08/15/25 | | | | | | | 3 | | | | 2,752 | |
| | | | | | | | | | | | |
| | | | | | | | | | | 83,367 | |
| | | |
| Consumer Finance — 1.4% | | | | | | | | | |
Ally Financial, Inc.: | | | | | | | | | | | | |
4.63%, 05/19/22 | | | | | | | 24 | | | | 23,610 | |
5.13%, 09/30/24 | | | | | | | 40 | | | | 39,700 | |
8.00%, 11/01/31 | | | | | | | 133 | | | | 147,630 | |
Navient Corp.: | | | | | | | | | | | | |
6.63%, 07/26/21 | | | | | | | 22 | | | | 21,230 | |
6.50%, 06/15/22 | | | | | | | 6 | | | | 5,595 | |
5.50%, 01/25/23 | | | | | | | 37 | | | | 32,375 | |
7.25%, 09/25/23 | | | | | | | 17 | | | | 15,597 | |
5.88%, 10/25/24 | | | | | | | 7 | | | | 5,845 | |
6.75%, 06/25/25 | | | | | | | 13 | | | | 11,083 | |
6.75%, 06/15/26 | | | | | | | 12 | | | | 9,960 | |
5.63%, 08/01/33 | | | | | | | 24 | | | | 15,840 | |
Springleaf Finance Corp.: | | | | | | | | | | | | |
5.63%, 03/15/23 | | | | | | | 4 | | | | 3,690 | |
6.88%, 03/15/25 | | | | | | | 38 | | | | 34,010 | |
7.13%, 03/15/26 | | | | | | | 6 | | | | 5,355 | |
| | | | | | | | | | | | |
| | | | | | | | | | | 371,520 | |
| | | |
| Containers & Packaging — 1.7% | | | | | | | | | |
Ardagh Packaging Finance plc,
4.63%, 05/15/23(b) | | | | | | | 200 | | | | 191,000 | |
BWAY Holding Co., 5.50%, 04/15/24(b) | | | | | | | 76 | | | | 71,440 | |
Crown Americas LLC: | | | | | | | | | | | | |
4.75%, 02/01/26(b) | | | | | | | 37 | | | | 34,872 | |
4.25%, 09/30/26 | | | | | | | 28 | | | | 25,130 | |
Intertape Polymer Group, Inc., 7.00%, 10/15/26(b) | | | | | | | 12 | | | | 11,850 | |
OI European Group BV, 4.00%, 03/15/23(b) | | | | | | | 19 | | | | 17,765 | |
Reynolds Group Issuer, Inc.: | | | | | | | | | | | | |
5.75%, 10/15/20 | | | | | | | 8 | | | | 7,733 | |
5.13%, 07/15/23(b) | | | | | | | 6 | | | | 5,715 | |
7.00%, 07/15/24(b) | | | | | | | 95 | | | | 90,488 | |
Sealed Air Corp., 6.88%, 07/15/33(b) | | | | | | | 9 | | | | 8,978 | |
| | | | | | | | | | | | |
| | | | | | | | | | | 464,971 | |
| | | | | | | | | | | | |
| Security | | | | | Par (000) | | | Value | |
| | | |
| Distributors — 0.2%(b) | | | | | | | | | |
American Builders & Contractors Supply Co., Inc.: | | | | | | | | | | | | |
5.75%, 12/15/23 | | | USD | | | | 2 | | | $ | 1,980 | |
5.88%, 05/15/26 | | | | | | | 27 | | | | 25,582 | |
Core & Main LP, 6.13%, 08/15/25 | | | | | | | 29 | | | | 25,520 | |
| | | | | | | | | | | | |
| | | | | | | | | | | 53,082 | |
| | | |
| Diversified Consumer Services — 0.4% | | | | | | | | | |
frontdoor, Inc., 6.75%, 08/15/26(b) | | | | | | | 26 | | | | 24,700 | |
Graham Holdings Co., 5.75%, 06/01/26(b) | | | | | | | 18 | | | | 18,045 | |
Laureate Education, Inc., 8.25%, 05/01/25(b) | | | | | | | 11 | | | | 11,302 | |
Service Corp. International, 4.50%, 11/15/20 | | | | | | | 20 | | | | 19,850 | |
ServiceMaster Co. LLC (The), 5.13%, 11/15/24(b) | | | | | | | 26 | | | | 24,570 | |
| | | | | | | | | | | | |
| | | | | | | | | | | 98,467 | |
| | | |
| Diversified Financial Services — 1.7%(b) | | | | | | | | | |
Jefferies Finance LLC, 7.38%, 04/01/20 | | | | | | | 200 | | | | 199,500 | |
Refinitiv US Holdings, Inc.: | | | | | | | | | | | | |
4.50%, 05/15/26 | | | EUR | | | | 100 | | | | 111,424 | |
6.25%, 05/15/26 | | | USD | | | | 3 | | | | 2,895 | |
8.25%, 11/15/26 | | | | | | | 50 | | | | 45,688 | |
Tempo Acquisition LLC, 6.75%, 06/01/25 | | | | | | | 43 | | | | 39,775 | |
Travelport Corporate Finance plc, 6.00%, 03/15/26 | | | | | | | 18 | | | | 18,180 | |
Verscend Escrow Corp., 9.75%, 08/15/26 | | | | | | | 55 | | | | 51,700 | |
| | | | | | | | | | | | |
| | | | | | | | | | | 469,162 | |
|
| Diversified Telecommunication Services — 6.1% | |
Altice France SA, 8.13%, 02/01/27(b) | | | | | | | 248 | | | | 233,740 | |
CCO Holdings LLC(b): | | | | | | | | | | | | |
4.00%, 03/01/23 | | | | | | | 29 | | | | 27,043 | |
5.13%, 05/01/23 | | | | | | | 7 | | | | 6,807 | |
5.13%, 05/01/27 | | | | | | | 222 | | | | 206,771 | |
5.00%, 02/01/28 | | | | | | | 71 | | | | 65,320 | |
CenturyLink, Inc.: | | | | | | | | | | | | |
Series S, 6.45%, 06/15/21 | | | | | | | 40 | | | | 39,900 | |
Series W, 6.75%, 12/01/23 | | | | | | | 4 | | | | 3,855 | |
Series Y, 7.50%, 04/01/24 | | | | | | | 3 | | | | 2,895 | |
Series P, 7.60%, 09/15/39 | | | | | | | 2 | | | | 1,580 | |
Series U, 7.65%, 03/15/42 | | | | | | | 64 | | | | 50,400 | |
Cincinnati Bell, Inc.(b): | | | | | | | | | | | | |
7.00%, 07/15/24 | | | | | | | 37 | | | | 30,525 | |
8.00%, 10/15/25 | | | | | | | 15 | | | | 12,375 | |
Embarq Corp., 8.00%, 06/01/36 | | | | | | | 42 | | | | 38,010 | |
Frontier Communications Corp.: | | | | | | | | | | | | |
10.50%, 09/15/22 | | | | | | | 17 | | | | 11,815 | |
11.00%, 09/15/25 | | | | | | | 137 | | | | 85,276 | |
Intelsat Jackson Holdings SA: | | | | | | | | | | | | |
5.50%, 08/01/23 | | | | | | | 63 | | | | 54,810 | |
8.50%, 10/15/24(b) | | | | | | | 77 | | | | 74,690 | |
9.75%, 07/15/25(b) | | | | | | | 98 | | | | 98,274 | |
Level 3 Financing, Inc.: | | | | | | | | | | | | |
5.38%, 08/15/22 | | | | | | | 21 | | | | 20,590 | |
5.63%, 02/01/23 | | | | | | | 10 | | | | 9,825 | |
5.13%, 05/01/23 | | | | | | | 13 | | | | 12,545 | |
5.38%, 01/15/24 | | | | | | | 21 | | | | 20,003 | |
5.38%, 05/01/25 | | | | | | | 17 | | | | 15,937 | |
5.25%, 03/15/26 | | | | | | | 74 | | | | 67,710 | |
Level 3 Parent LLC, 5.75%, 12/01/22 | | | | | | | 40 | | | | 39,300 | |
Qualitytech LP, 4.75%, 11/15/25(b) | | | | | | | 16 | | | | 14,960 | |
Qwest Corp., 6.75%, 12/01/21 | | | | | | | 10 | | | | 10,224 | |
Sprint Capital Corp.: | | | | | | | | | | | | |
6.90%, 05/01/19 | | | | | | | 25 | | | | 25,125 | |
8.75%, 03/15/32 | | | | | | | 66 | | | | 69,630 | |
Telecom Italia Capital SA: | | | | | | | | | | | | |
6.38%, 11/15/33 | | | | | | | 36 | | | | 32,495 | |
| | | | |
| SCHEDULES OF INVESTMENTS | | | 85 | |
| | |
Schedule of Investments (continued) December 31, 2018 | | BlackRock High Yield Portfolio (Percentages shown are based on Net Assets) |
| | | | | | | | | | | | |
| Security | | | | | Par (000) | | | Value | |
|
| Diversified Telecommunication Services (continued) | |
6.00%, 09/30/34 | | | USD | | | | 45 | | | $ | 38,925 | |
Telesat Canada, 8.88%, 11/15/24(b) | | | | | | | 27 | | | | 28,080 | |
Virgin Media Finance plc, 5.75%, 01/15/25(b) | | | | | | | 200 | | | | 188,006 | |
| | | | | | | | | | | | |
| | | | | | | | | | | 1,637,441 | |
| | | |
| Electric Utilities — 0.0% | | | | | | | | | |
NextEra Energy Operating Partners LP, 4.25%, 09/15/24(b) | | | | | | | 10 | | | | 9,250 | |
| | | | | | | | | | | | |
| | | |
| Electrical Equipment — 0.4%(b) | | | | | | | | | |
Energizer Gamma Acquisition, Inc., 6.38%, 07/15/26 | | | | | | | 6 | | | | 5,505 | |
Sensata Technologies BV: | | | | | | | | | | | | |
5.63%, 11/01/24 | | | | | | | 7 | | | | 6,895 | |
5.00%, 10/01/25 | | | | | | | 39 | | | | 36,660 | |
Vertiv Group Corp., 9.25%, 10/15/24 | | | | | | | 53 | | | | 48,760 | |
| | | | | | | | | | | | |
| | | | | | | | | | | 97,820 | |
|
| Electronic Equipment, Instruments & Components — 0.3% | |
CDW LLC: | | | | | | | | | | | | |
5.50%, 12/01/24 | | | | | | | 32 | | | | 31,600 | |
5.00%, 09/01/25 | | | | | | | 53 | | | | 50,747 | |
| | | | | | | | | | | | |
| | | | | | | | | | | 82,347 | |
| | | |
| Energy Equipment & Services — 2.4% | | | | | | | | | |
Apergy Corp., 6.38%, 05/01/26 | | | | | | | 10 | | | | 9,700 | |
Calfrac Holdings LP, 8.50%, 06/15/26(b) | | | | | | | 11 | | | | 7,810 | |
CSI Compressco LP, 7.50%, 04/01/25(b) | | | | | | | 33 | | | | 30,690 | |
Diamond Offshore Drilling, Inc.: | | | | | | | | | | | | |
7.88%, 08/15/25 | | | | | | | 16 | | | | 13,280 | |
5.70%, 10/15/39 | | | | | | | 4 | | | | 2,440 | |
4.88%, 11/01/43 | | | | | | | 24 | | | | 13,320 | |
Ensco Jersey Finance Ltd., 3.00%, 01/31/24(f) | | | | | | | 23 | | | | 15,209 | |
Ensco plc: | | | | | | | | | | | | |
4.50%, 10/01/24 | | | | | | | 8 | | | | 5,200 | |
5.20%, 03/15/25 | | | | | | | 19 | | | | 12,635 | |
7.75%, 02/01/26 | | | | | | | 25 | | | | 18,500 | |
5.75%, 10/01/44 | | | | | | | 14 | | | | 7,824 | |
McDermott Technology Americas, Inc., 10.63%, 05/01/24(b) | | | | | | | 5 | | | | 4,219 | |
Nabors Industries, Inc.: | | | | | | | | | | | | |
4.63%, 09/15/21 | | | | | | | 6 | | | | 5,380 | |
5.50%, 01/15/23 | | | | | | | 5 | | | | 3,969 | |
5.75%, 02/01/25 | | | | | | | 15 | | | | 11,356 | |
Noble Holding International Ltd.: | | | | | | | | | | | | |
7.75%, 01/15/24 | | | | | | | 11 | | | | 8,332 | |
7.88%, 02/01/26(b) | | | | | | | 92 | | | | 78,430 | |
5.25%, 03/15/42 | | | | | | | 12 | | | | 6,960 | |
Oceaneering International, Inc., 4.65%, 11/15/24 | | | | | | | 6 | | | | 4,739 | |
Pacific Drilling First Lien Escrow Issuer Ltd., 8.38%, 10/01/23(b) | | | | | | | 71 | | | | 67,805 | |
Pioneer Energy Services Corp., 6.13%, 03/15/22 | | | | | | | 28 | | | | 17,080 | |
Rowan Cos., Inc., 4.88%, 06/01/22 | | | | | | | 26 | | | | 21,450 | |
SESI LLC: | | | | | | | | | | | | |
7.13%, 12/15/21 | | | | | | | 10 | | | | 8,500 | |
7.75%, 09/15/24 | | | | | | | 22 | | | | 17,490 | |
Transocean Guardian Ltd., 5.88%, 01/15/24(b) | | | | | | | 17 | | | | 16,278 | |
Transocean Pontus Ltd., 6.13%, 08/01/25(b) | | | | | | | 20 | | | | 19,300 | |
Transocean, Inc.: | | | | | | | | | | | | |
5.80%, 10/15/22 | | | | | | | 23 | | | | 20,240 | |
9.00%, 07/15/23(b) | | | | | | | 82 | | | | 81,590 | |
7.25%, 11/01/25(b) | | | | | | | 30 | | | | 26,175 | |
7.50%, 01/15/26(b) | | | | | | | 4 | | | | 3,510 | |
Trinidad Drilling Ltd., 6.63%, 02/15/25(b) | | | | | | | 25 | | | | 25,213 | |
| | | | | | | | | | | | |
| Security | | | | | Par (000) | | | Value | |
| | | |
| Energy Equipment & Services (continued) | | | | | | | | | |
USA Compression Partners LP, 6.88%, 04/01/26(b) | | | USD | | | | 37 | | | $ | 35,520 | |
Vantage Drilling International, 9.25%, 11/15/23(b) | | | | | | | 12 | | | | 11,730 | |
Weatherford International Ltd.: | | | | | | | | | | | | |
5.13%, 09/15/20 | | | | | | | 20 | | | | 15,600 | |
6.50%, 08/01/36 | | | | | | | 14 | | | | 7,280 | |
5.95%, 04/15/42 | | | | | | | 11 | | | | 5,596 | |
| | | | | | | | | | | | |
| | | | | | | | | | | 660,350 | |
| | | |
| Entertainment — 0.5% | | | | | | | | | |
Ascend Learning LLC, 6.88%, 08/01/25(b) | | | | | | | 24 | | | | 22,980 | |
Live Nation Entertainment, Inc., 4.88%, 11/01/24(b) | | | | | | | 3 | | | | 2,850 | |
Netflix, Inc.: | | | | | | | | | | | | |
5.50%, 02/15/22 | | | | | | | 42 | | | | 42,367 | |
4.38%, 11/15/26 | | | | | | | 6 | | | | 5,445 | |
5.88%, 11/15/28(b) | | | | | | | 48 | | | | 46,642 | |
WMG Acquisition Corp., 5.50%, 04/15/26(b) | | | | | | | 12 | | | | 11,460 | |
| | | | | | | | | | | | |
| | | | | | | | | | | 131,744 | |
|
| Equity Real Estate Investment Trusts (REITs) — 2.2% | |
CoreCivic, Inc., 4.75%, 10/15/27 | | | | | | | 17 | | | | 14,067 | |
CyrusOne LP, 5.38%, 03/15/27 | | | | | | | 8 | | | | 7,760 | |
Equinix, Inc.: | | | | | | | | | | | | |
5.88%, 01/15/26 | | | | | | | 70 | | | | 70,525 | |
5.38%, 05/15/27 | | | | | | | 15 | | | | 14,663 | |
ESH Hospitality, Inc., 5.25%, 05/01/25(b) | | | | | | | 18 | | | | 16,740 | |
GEO Group, Inc. (The): | | | | | | | | | | | | |
5.13%, 04/01/23 | | | | | | | 11 | | | | 9,900 | |
5.88%, 10/15/24 | | | | | | | 24 | | | | 21,180 | |
GLP Capital LP: | | | | | | | | | | | | |
5.38%, 11/01/23 | | | | | | | 6 | | | | 6,082 | |
5.25%, 06/01/25 | | | | | | | 6 | | | | 5,958 | |
iStar, Inc.: | | | | | | | | | | | | |
4.63%, 09/15/20 | | | | | | | 4 | | | | 3,900 | |
6.00%, 04/01/22 | | | | | | | 3 | | | | 2,902 | |
5.25%, 09/15/22 | | | | | | | 11 | | | | 10,284 | |
MGM Growth Properties Operating Partnership LP: | | | | | | | | | | | | |
5.63%, 05/01/24 | | | | | | | 103 | | | | 101,970 | |
4.50%, 09/01/26 | | | | | | | 72 | | | | 65,160 | |
4.50%, 01/15/28 | | | | | | | 34 | | | | 29,750 | |
MPT Operating Partnership LP: | | | | | | | | | | | | |
6.38%, 03/01/24 | | | | | | | 3 | | | | 3,075 | |
5.50%, 05/01/24 | | | | | | | 5 | | | | 4,975 | |
5.00%, 10/15/27 | | | | | | | 50 | | | | 45,719 | |
SBA Communications Corp.: | | | | | | | | | | | | |
4.00%, 10/01/22 | | | | | | | 44 | | | | 41,910 | |
4.88%, 09/01/24 | | | | | | | 92 | | | | 86,480 | |
VICI Properties 1 LLC, 8.00%, 10/15/23 | | | | | | | 23 | | | | 25,156 | |
| | | | | | | | | | | | |
| | | | | | | | | | | 588,156 | |
| | | |
| Food & Staples Retailing — 0.1% | | | | | | | | | |
Albertsons Cos. LLC, 5.75%, 03/15/25 | | | | | | | 22 | | | | 19,250 | |
Rite Aid Corp., 6.13%, 04/01/23(b) | | | | | | | 11 | | | | 8,690 | |
| | | | | | | | | | | | |
| | | | | | | | | | | 27,940 | |
| | | |
| Food Products — 0.9%(b) | | | | | | | | | |
Chobani LLC, 7.50%, 04/15/25 | | | | | | | 15 | | | | 11,813 | |
JBS USA LUX SA: | | | | | | | | | | | | |
5.88%, 07/15/24 | | | | | | | 29 | | | | 28,529 | |
5.75%, 06/15/25 | | | | | | | 74 | | | | 70,948 | |
6.75%, 02/15/28 | | | | | | | 55 | | | | 53,488 | |
Post Holdings, Inc.: | | | | | | | | | | | | |
5.50%, 03/01/25 | | | | | | | 29 | | | | 27,834 | |
5.75%, 03/01/27 | | | | | | | 30 | | | | 28,125 | |
5.63%, 01/15/28 | | | | | | | 8 | | | | 7,360 | |
| | |
| 86 | | 2018 BLACKROCK ANNUAL REPORTTO SHAREHOLDERS |
| | |
Schedule of Investments (continued) December 31, 2018 | | BlackRock High Yield Portfolio (Percentages shown are based on Net Assets) |
| | | | | | | | | | | | |
| Security | | | | | Par (000) | | | Value | |
|
| Food Products (continued) | |
Simmons Foods, Inc., 7.75%, 01/15/24 | | | USD | | | | 17 | | | $ | 17,085 | |
| | | | | | | | | | | | |
| | | | | | | | | | | 245,182 | |
|
| Gas Utilities — 0.1% | |
Superior Plus LP, 7.00%, 07/15/26(b) | | | | | | | 31 | | | | 29,915 | |
| | | | | | | | | | | | |
| | | |
| Health Care Equipment & Supplies — 1.8% | | | | | | | | | |
Avantor, Inc.(b): | | | | | | | | | | | | |
6.00%, 10/01/24 | | | | | | | 138 | | | | 135,585 | |
9.00%, 10/01/25 | | | | | | | 47 | | | | 47,000 | |
DJO Finance LLC, 8.13%, 06/15/21(b) | | | | | | | 79 | | | | 81,370 | |
Hologic, Inc., 4.38%, 10/15/25(b) | | | | | | | 4 | | | | 3,720 | |
Immucor, Inc., 11.13%, 02/15/22(b) | | | | | | | 8 | | | | 8,000 | |
Mallinckrodt International Finance SA(b): | | | | | | | | | | | | |
4.88%, 04/15/20 | | | | | | | 9 | | | | 8,685 | |
5.75%, 08/01/22 | | | | | | | 43 | | | | 36,980 | |
5.63%, 10/15/23 | | | | | | | 4 | | | | 3,040 | |
Ortho-Clinical Diagnostics, Inc.,
6.63%, 05/15/22(b) | | | | | | | 139 | | | | 125,100 | |
Sotera Health Holdings LLC, 6.50%, 05/15/23(b) | | | | | | | 28 | | | | 26,810 | |
Teleflex, Inc., 4.88%, 06/01/26 | | | | | | | 15 | | | | 14,325 | |
| | | | | | | | | | | | |
| | | | | | | | | | | 490,615 | |
| | | |
| Health Care Providers & Services — 5.1% | | | | | | | | | |
Acadia Healthcare Co., Inc.: | | | | | | | | | | | | |
5.13%, 07/01/22 | | | | | | | 9 | | | | 8,595 | |
5.63%, 02/15/23 | | | | | | | 16 | | | | 15,160 | |
6.50%, 03/01/24 | | | | | | | 38 | | | | 36,670 | |
AHP Health Partners, Inc., 9.75%, 07/15/26(b) | | | | | | | 14 | | | | 14,175 | |
Centene Corp., 4.75%, 05/15/22 | | | | | | | 37 | | | | 36,537 | |
Centene Escrow I Corp., 5.38%, 06/01/26(b) | | | | | | | 135 | | | | 131,288 | |
Community Health Systems, Inc., 8.63%, 01/15/24(b) | | | | | | | 39 | | | | 38,513 | |
DaVita, Inc., 5.00%, 05/01/25 | | | | | | | 28 | | | | 25,410 | |
HCA, Inc.: | | | | | | | | | | | | |
5.00%, 03/15/24 | | | | | | | 71 | | | | 70,290 | |
5.38%, 02/01/25 | | | | | | | 4 | | | | 3,900 | |
5.25%, 04/15/25 | | | | | | | 117 | | | | 116,415 | |
5.25%, 06/15/26 | | | | | | | 88 | | | | 87,340 | |
5.38%, 09/01/26 | | | | | | | 36 | | | | 35,010 | |
5.63%, 09/01/28 | | | | | | | 38 | | | | 36,670 | |
5.50%, 06/15/47 | | | | | | | 121 | | | | 114,648 | |
inVentiv Group Holdings, Inc., 7.50%, 10/01/24(b) | | | | | | | 25 | | | | 26,000 | |
MEDNAX, Inc.(b): | | | | | | | | | | | | |
5.25%, 12/01/23 | | | | | | | 12 | | | | 11,760 | |
6.25%, 01/15/27 | | | | | | | 8 | | | | 7,720 | |
Molina Healthcare, Inc., 4.88%, 06/15/25(b) | | | | | | | 12 | | | | 10,950 | |
MPH Acquisition Holdings LLC,
7.13%, 06/01/24(b) | | | | | | | 32 | | | | 29,840 | |
NVA Holdings, Inc., 6.88%, 04/01/26(b) | | | | | | | 14 | | | | 12,530 | |
Polaris Intermediate Corp., 8.41% ( 8.50% Cash or 9.25% PIK), 12/01/22(b)(e) | | | | | | | 94 | | | | 85,739 | |
RegionalCare Hospital Partners Holdings, Inc., 8.25%, 05/01/23(b) | | | | | | | 18 | | | | 18,180 | |
Surgery Center Holdings, Inc.(b): | | | | | | | | | | | | |
8.88%, 04/15/21 | | | | | | | 14 | | | | 13,965 | |
6.75%, 07/01/25 | | | | | | | 35 | | | | 29,750 | |
Team Health Holdings, Inc., 6.38%, 02/01/25(b) | | | | | | | 41 | | | | 33,466 | |
Tenet Healthcare Corp.: | | | | | | | | | | | | |
6.00%, 10/01/20 | | | | | | | 27 | | | | 27,338 | |
7.50%, 01/01/22(b) | | | | | | | 32 | | | | 32,480 | |
8.13%, 04/01/22 | | | | | | | 73 | | | | 73,182 | |
4.63%, 07/15/24 | | | | | | | 111 | | | | 103,230 | |
6.88%, 11/15/31 | | | | | | | 24 | | | | 20,160 | |
Vizient, Inc., 10.38%, 03/01/24(b) | | | | | | | 38 | | | | 40,280 | |
WellCare Health Plans, Inc.: | | | | | | | | | | | | |
5.25%, 04/01/25 | | | | | | | 8 | | | | 7,700 | |
| | | | | | | | | | | | |
| Security | | | | | Par (000) | | | Value | |
|
| Health Care Providers & Services (continued) | |
5.38%, 08/15/26(b) | | | USD | | | | 31 | | | $ | 29,915 | |
| | | | | | | | | | | | |
| | | | | | | | | | | 1,384,806 | |
|
| Hotels, Restaurants & Leisure — 3.1% | |
1011778 BC ULC(b): | | | | | | | | | | | | |
4.25%, 05/15/24 | | | | | | | 36 | | | | 33,120 | |
5.00%, 10/15/25 | | | | | | | 169 | | | | 155,480 | |
Boyd Gaming Corp., 6.00%, 08/15/26 | | | | | | | 11 | | | | 10,285 | |
Boyne USA, Inc., 7.25%, 05/01/25(b) | | | | | | | 8 | | | | 8,260 | |
Caesars Resort Collection LLC,
5.25%, 10/15/25(b) | | | | | | | 27 | | | | 23,220 | |
Churchill Downs, Inc., 4.75%, 01/15/28(b) | | | | | | | 14 | | | | 12,666 | |
Eldorado Resorts, Inc.: | | | | | | | | | | | | |
6.00%, 04/01/25 | | | | | | | 8 | | | | 7,717 | |
6.00%, 09/15/26(b) | | | | | | | 12 | | | | 11,340 | |
Golden Nugget, Inc., 6.75%, 10/15/24(b) | | | | | | | 49 | | | | 46,182 | |
Hilton Domestic Operating Co., Inc.: | | | | | | | | | | | | |
4.25%, 09/01/24 | | | | | | | 12 | | | | 11,340 | |
5.13%, 05/01/26(b) | | | | | | | 51 | | | | 48,960 | |
Hilton Worldwide Finance LLC, 4.88%, 04/01/27 | | | | | | | 10 | | | | 9,375 | |
IRB Holding Corp., 6.75%, 02/15/26(b) | | | | | | | 3 | | | | 2,625 | |
KFC Holding Co.(b): | | | | | | | | | | | | |
5.00%, 06/01/24 | | | | | | | 10 | | | | 9,650 | |
5.25%, 06/01/26 | | | | | | | 27 | | | | 26,122 | |
4.75%, 06/01/27 | | | | | | | 2 | | | | 1,860 | |
MGM Resorts International: | | | | | | | | | | | | |
6.63%, 12/15/21 | | | | | | | 88 | | | | 90,200 | |
7.75%, 03/15/22 | | | | | | | 28 | | | | 29,785 | |
4.63%, 09/01/26 | | | | | | | 2 | | | | 1,795 | |
Sabre GLBL, Inc.(b): | | | | | | | | | | | | |
5.38%, 04/15/23 | | | | | | | 11 | | | | 10,945 | |
5.25%, 11/15/23 | | | | | | | 19 | | | | 18,762 | |
Scientific Games International, Inc.: | | | | | | | | | | | | |
10.00%, 12/01/22 | | | | | | | 51 | | | | 51,765 | |
5.00%, 10/15/25(b) | | | | | | | 37 | | | | 33,023 | |
Six Flags Entertainment Corp., 4.88%, 07/31/24(b) | | | | | | | 49 | | | | 46,183 | |
Stars Group Holdings BV, 7.00%, 07/15/26(b) | | | | | | | 11 | | | | 10,698 | |
Station Casinos LLC, 5.00%, 10/01/25(b) | | | | | | | 6 | | | | 5,430 | |
Viking Cruises Ltd.(b): | | | | | | | | | | | | |
6.25%, 05/15/25 | | | | | | | 21 | | | | 20,685 | |
5.88%, 09/15/27 | | | | | | | 84 | | | | 78,330 | |
Wyndham Destinations, Inc., 5.75%, 04/01/27 | | | | | | | 8 | | | | 7,340 | |
Yum! Brands, Inc.: | | | | | | | | | | | | |
3.88%, 11/01/23 | | | | | | | 2 | | | | 1,890 | |
5.35%, 11/01/43 | | | | | | | 2 | | | | 1,660 | |
| | | | | | | | | | | | |
| | | | | | | | | | | 826,693 | |
| | | |
| Household Durables — 0.9% | | | | | | | | | |
K. Hovnanian Enterprises, Inc.,
10.00%, 07/15/22(b) | | | | | | | 17 | | | | 14,875 | |
Lennar Corp.: | | | | | | | | | | | | |
6.63%, 05/01/20 | | | | | | | 6 | | | | 6,172 | |
8.38%, 01/15/21 | | | | | | | 44 | | | | 46,750 | |
5.25%, 06/01/26 | | | | | | | 14 | | | | 13,195 | |
4.75%, 11/29/27 | | | | | | | 40 | | | | 36,100 | |
Mattamy Group Corp.(b): | | | | | | | | | | | | |
6.88%, 12/15/23 | | | | | | | 18 | | | | 16,808 | |
6.50%, 10/01/25 | | | | | | | 4 | | | | 3,580 | |
MDC Holdings, Inc., 6.00%, 01/15/43 | | | | | | | 10 | | | | 7,800 | |
Meritage Homes Corp., 5.13%, 06/06/27 | | | | | | | 9 | | | | 7,650 | |
PulteGroup, Inc.: | | | | | | | | | | | | |
6.38%, 05/15/33 | | | | | | | 22 | | | | 20,075 | |
6.00%, 02/15/35 | | | | | | | 6 | | | | 5,190 | |
Tempur Sealy International, Inc., 5.50%, 06/15/26 | | | | | | | 6 | | | | 5,475 | |
TRI Pointe Group, Inc.: | | | | | | | | | | | | |
4.38%, 06/15/19 | | | | | | | 10 | | | | 9,925 | |
4.88%, 07/01/21 | | | | | | | 13 | | | | 12,415 | |
| | | | |
| SCHEDULES OF INVESTMENTS | | | 87 | |
| | |
Schedule of Investments (continued) December 31, 2018 | | BlackRock High Yield Portfolio (Percentages shown are based on Net Assets) |
| | | | | | | | | | | | |
| Security | | | | | Par (000) | | | Value | |
|
| Household Durables (continued) | |
Williams Scotsman International, Inc.(b): | | | | | | | | | | | | |
7.88%, 12/15/22 | | | USD | | | | 13 | | | $ | 12,708 | |
6.88%, 08/15/23 | | | | | | | 16 | | | | 15,360 | |
| | | | | | | | | | | | |
| | | | | | | | | | | 234,078 | |
|
| Independent Power and Renewable Electricity Producers — 1.6% | |
AES Corp.: | | | | | | | | | | | | |
5.50%, 04/15/25 | | | | | | | 20 | | | | 19,850 | |
6.00%, 05/15/26 | | | | | | | 27 | | | | 27,405 | |
5.13%, 09/01/27 | | | | | | | 35 | | | | 33,600 | |
Calpine Corp.: | | | | | | | | | | | | |
5.38%, 01/15/23 | | | | | | | 66 | | | | 61,875 | |
5.88%, 01/15/24(b) | | | | | | | 31 | | | | 30,380 | |
5.75%, 01/15/25 | | | | | | | 10 | | | | 9,150 | |
5.25%, 06/01/26(b) | | | | | | | 69 | | | | 62,962 | |
Clearway Energy Operating LLC: | | | | | | | | | | | | |
5.38%, 08/15/24 | | | | | | | 23 | | | | 21,850 | |
5.75%, 10/15/25(b) | | | | | | | 11 | | | | 10,505 | |
NRG Energy, Inc.: | | | | | | | | | | | | |
6.25%, 05/01/24 | | | | | | | 8 | | | | 8,120 | |
6.63%, 01/15/27 | | | | | | | 78 | | | | 78,585 | |
5.75%, 01/15/28 | | | | | | | 7 | | | | 6,720 | |
Pattern Energy Group, Inc., 5.88%, 02/01/24(b) | | | | | | | 24 | | | | 23,160 | |
Talen Energy Supply LLC, 6.50%, 06/01/25 | | | | | | | 19 | | | | 13,490 | |
Vistra Energy Corp., 7.63%, 11/01/24 | | | | | | | 12 | | | | 12,660 | |
| | | | | | | | | | | | |
| | | | | | | | | | | 420,312 | |
| | | |
| Insurance — 0.7%(b) | | | | | | | | | |
Alliant Holdings Intermediate LLC, 8.25%, 08/01/23 | | | | | | | 118 | | | | 116,230 | |
AmWINS Group, Inc., 7.75%, 07/01/26 | | | | | | | 14 | | | | 13,230 | |
HUB International Ltd., 7.00%, 05/01/26 | | | | | | | 56 | | | | 50,540 | |
USIS Merger Sub, Inc., 6.88%, 05/01/25 | | | | | | | 6 | | | | 5,509 | |
| | | | | | | | | | | | |
| | | | | | | | | | | 185,509 | |
| | | |
| Interactive Media & Services — 0.0% | | | | | | | | | |
Rackspace Hosting, Inc., 8.63%, 11/15/24(b) | | | | | | | 15 | | | | 11,700 | |
| | | | | | | | | | | | |
| | | |
| Internet & Direct Marketing Retail — 0.0% | | | | | | | | | |
Uber Technologies, Inc., 7.50%, 11/01/23(b) | | | | | | | 12 | | | | 11,610 | |
| | | | | | | | | | | | |
| | | |
| IT Services — 2.0% | | | | | | | | | |
Alliance Data Systems Corp.(b): | | | | | | | | | | | | |
5.88%, 11/01/21 | | | | | | | 37 | | | | 36,948 | |
5.38%, 08/01/22 | | | | | | | 24 | | | | 23,400 | |
Banff Merger Sub, Inc., 9.75%, 09/01/26(b) | | | | | | | 118 | | | | 107,970 | |
Booz Allen Hamilton, Inc., 5.13%, 05/01/25(b) | | | | | | | 5 | | | | 4,750 | |
First Data Corp., 5.75%, 01/15/24(b) | | | | | | | 186 | | | | 181,350 | |
Gartner, Inc., 5.13%, 04/01/25(b) | | | | | | | 22 | | | | 21,354 | |
WEX, Inc., 4.75%, 02/01/23(b) | | | | | | | 16 | | | | 15,600 | |
Zayo Group LLC: | | | | | | | | | | | | |
6.00%, 04/01/23 | | | | | | | 53 | | | | 50,223 | |
6.38%, 05/15/25 | | | | | | | 25 | | | | 23,250 | |
5.75%, 01/15/27(b) | | | | | | | 86 | | | | 76,755 | |
| | | | | | | | | | | | |
| | | | | | | | | | | 541,600 | |
| | | |
| Leisure Products — 0.1% | | | | | | | | | |
Mattel, Inc.: | | | | | | | | | | | | |
6.75%, 12/31/25(b) | | | | | | | 31 | | | | 27,658 | |
6.20%, 10/01/40 | | | | | | | 7 | | | | 5,145 | |
5.45%, 11/01/41 | | | | | | | 4 | | | | 2,840 | |
| | | | | | | | | | | | |
| | | | | | | | | | | 35,643 | |
| | | |
| Life Sciences Tools & Services — 0.1% | | | | | | | | | |
Charles River Laboratories International, Inc., 5.50%, 04/01/26(b) | | | | | | | 15 | | | | 14,775 | |
| | | | | | | | | | | | |
| | | | | | | | | | | | |
| Security | | | | | Par (000) | | | Value | |
|
| Machinery — 1.3%(b) | |
Grinding Media, Inc., 7.38%, 12/15/23 | | | USD | | | | 26 | | | $ | 25,155 | |
Mueller Water Products, Inc., 5.50%, 06/15/26 | | | | | | | 17 | | | | 16,490 | |
Navistar International Corp., 6.63%, 11/01/25 | | | | | | | 29 | | | | 27,985 | |
Novelis Corp., 6.25%, 08/15/24 | | | | | | | 118 | | | | 110,920 | |
RBS Global, Inc., 4.88%, 12/15/25 | | | | | | | 30 | | | | 27,225 | |
SPX FLOW, Inc., 5.63%, 08/15/24 | | | | | | | 16 | | | | 15,120 | |
Stevens Holding Co., Inc., 6.13%, 10/01/26 | | | | | | | 19 | | | | 18,715 | |
Terex Corp., 5.63%, 02/01/25 | | | | | | | 35 | | | | 32,593 | |
Titan Acquisition Ltd., 7.75%, 04/15/26 | | | | | | | 55 | | | | 47,025 | |
Wabash National Corp., 5.50%, 10/01/25 | | | | | | | 23 | | | | 19,694 | |
| | | | | | | | | | | | |
| | | | | | | | | | | 340,922 | |
| | | |
| Media — 7.3% | | | | | | | | | |
Altice Luxembourg SA, 7.75%, 05/15/22(b) | | | | | | | 200 | | | | 182,000 | |
AMC Networks, Inc., 4.75%, 08/01/25 | | | | | | | 48 | | | | 43,560 | |
Cablevision Systems Corp., 8.00%, 04/15/20 | | | | | | | 15 | | | | 15,187 | |
Clear Channel International BV,
8.75%, 12/15/20(b) | | | | | | | 96 | | | | 96,720 | |
Clear Channel Worldwide Holdings, Inc.: | | | | | | | | | | | | |
Series B, 7.63%, 03/15/20 | | | | | | | 65 | | | | 63,375 | |
Series A, 6.50%, 11/15/22 | | | | | | | 321 | | | | 320,830 | |
CSC Holdings LLC: | | | | | | | | | | | | |
6.75%, 11/15/21 | | | | | | | 164 | | | | 168,100 | |
10.13%, 01/15/23(b) | | | | | | | 200 | | | | 215,250 | |
5.25%, 06/01/24 | | | | | | | 43 | | | | 39,399 | |
10.88%, 10/15/25(b) | | | | | | | 200 | | | | 224,750 | |
5.50%, 05/15/26(b) | | | | | | | 200 | | | | 188,500 | |
DISH DBS Corp.: | | | | | | | | | | | | |
6.75%, 06/01/21 | | | | | | | 11 | | | | 10,887 | |
5.88%, 07/15/22 | | | | | | | 132 | | | | 121,440 | |
5.00%, 03/15/23 | | | | | | | 23 | | | | 19,147 | |
5.88%, 11/15/24 | | | | | | | 4 | | | | 3,220 | |
Gray Escrow, Inc., 7.00%, 05/15/27(b) | | | | | | | 21 | | | | 20,437 | |
MDC Partners, Inc., 6.50%, 05/01/24(b) | | | | | | | 40 | | | | 36,400 | |
Meredith Corp., 6.88%, 02/01/26(b) | | | | | | | 16 | | | | 15,640 | |
Midcontinent Communications,
6.88%, 08/15/23(b) | | | | | | | 28 | | | | 28,700 | |
Outfront Media Capital LLC: | | | | | | | | | | | | |
5.63%, 02/15/24 | | | | | | | 4 | | | | 3,940 | |
5.88%, 03/15/25 | | | | | | | 5 | | | | 4,913 | |
Radiate Holdco LLC(b): | | | | | | | | | | | | |
6.88%, 02/15/23 | | | | | | | 6 | | | | 5,445 | |
6.63%, 02/15/25 | | | | | | | 16 | | | | 13,840 | |
Sirius XM Radio, Inc.(b): | | | | | | | | | | | | |
5.38%, 04/15/25 | | | | | | | 15 | | | | 14,212 | |
5.00%, 08/01/27 | | | | | | | 18 | | | | 16,448 | |
TEGNA, Inc., 5.50%, 09/15/24(b) | | | | | | | 8 | | | | 7,750 | |
Tribune Media Co., 5.88%, 07/15/22 | | | | | | | 32 | | | | 32,160 | |
Univision Communications, Inc.(b): | | | | | | | | | | | | |
6.75%, 09/15/22 | | | | | | | 1 | | | | 995 | |
5.13%, 05/15/23 | | | | | | | 17 | | | | 15,257 | |
5.13%, 02/15/25 | | | | | | | 23 | | | | 20,183 | |
Videotron Ltd., 5.13%, 04/15/27(b) | | | | | | | 38 | | | | 35,910 | |
| | | | | | | | | | | | |
| | | | | | | | | | | 1,984,595 | |
| | | |
| Metals & Mining — 2.8% | | | | | | | | | |
Big River Steel LLC, 7.25%, 09/01/25(b) | | | | | | | 21 | | | | 20,842 | |
Cleveland-Cliffs, Inc., 4.88%, 01/15/24(b) | | | | | | | 20 | | | | 18,600 | |
Constellium NV, 5.88%, 02/15/26(b) | | | | | | | 250 | | | | 222,500 | |
Freeport-McMoRan, Inc.: | | | | | | | | | | | | |
4.00%, 11/14/21 | | | | | | | 22 | | | | 21,395 | |
3.55%, 03/01/22 | | | | | | | 60 | | | | 56,775 | |
3.88%, 03/15/23 | | | | | | | 110 | | | | 101,750 | |
4.55%, 11/14/24 | | | | | | | 24 | | | | 22,140 | |
5.40%, 11/14/34 | | | | | | | 10 | | | | 7,875 | |
5.45%, 03/15/43 | | | | | | | 146 | | | | 111,143 | |
| | |
| 88 | | 2018 BLACKROCK ANNUAL REPORTTO SHAREHOLDERS |
| | |
Schedule of Investments (continued) December 31, 2018 | | BlackRock High Yield Portfolio (Percentages shown are based on Net Assets) |
| | | | | | | | | | | | |
| Security | | | | | Par (000) | | | Value | |
|
| Metals & Mining (continued) | |
Joseph T Ryerson & Son, Inc.,
11.00%, 05/15/22(b) | | | USD | | | | 16 | | | $ | 16,120 | |
Kaiser Aluminum Corp., 5.88%, 05/15/24 | | | | | | | 14 | | | | 13,685 | |
Steel Dynamics, Inc.: | | | | | | | | | | | | |
5.25%, 04/15/23 | | | | | | | 7 | | | | 6,904 | |
5.50%, 10/01/24 | | | | | | | 26 | | | | 25,740 | |
4.13%, 09/15/25 | | | | | | | 22 | | | | 20,212 | |
SunCoke Energy Partners LP, 7.50%, 06/15/25(b) | | | | | | | 26 | | | | 24,635 | |
Teck Resources Ltd.: | | | | | | | | | | | | |
4.50%, 01/15/21 | | | | | | | 2 | | | | 1,995 | |
5.20%, 03/01/42 | | | | | | | 28 | | | | 23,520 | |
5.40%, 02/01/43 | | | | | | | 5 | | | | 4,350 | |
United States Steel Corp.: | | | | | | | | | | | | |
6.88%, 08/15/25 | | | | | | | 25 | | | | 22,875 | |
6.25%, 03/15/26 | | | | | | | 13 | | | | 11,375 | |
| | | | | | | | | | | | |
| | | | | | | | | | | 754,431 | |
|
| Mortgage Real Estate Investment Trusts (REITs) — 0.0% | |
Starwood Property Trust, Inc., 5.00%, 12/15/21 | | | | | | | 12 | | | | 11,790 | |
| | | | | | | | | | | | |
| | | |
| Oil, Gas & Consumable Fuels — 9.1% | | | | | | | | | |
Antero Midstream Partners LP, 5.38%, 09/15/24 | | | | | | | 5 | | | | 4,662 | |
Antero Resources Corp.: | | | | | | | | | | | | |
5.13%, 12/01/22 | | | | | | | 12 | | | | 11,280 | |
5.63%, 06/01/23 | | | | | | | 10 | | | | 9,500 | |
5.00%, 03/01/25 | | | | | | | 36 | | | | 32,580 | |
Ascent Resources Utica Holdings LLC(b): | | | | | | | | | | | | |
10.00%, 04/01/22 | | | | | | | 14 | | | | 14,319 | |
7.00%, 11/01/26 | | | | | | | 20 | | | | 18,100 | |
Berry Petroleum Co. LLC, 7.00%, 02/15/26(b) | | | | | | | 36 | | | | 32,400 | |
Bruin E&P Partners LLC, 8.88%, 08/01/23(b) | | | | | | | 36 | | | | 32,040 | |
California Resources Corp., 8.00%, 12/15/22(b) | | | | | | | 74 | | | | 50,135 | |
Callon Petroleum Co.: | | | | | | | | | | | | |
6.13%, 10/01/24 | | | | | | | 21 | | | | 19,530 | |
6.38%, 07/01/26 | | | | | | | 13 | | | | 12,090 | |
Carrizo Oil & Gas, Inc.: | | | | | | | | | | | | |
6.25%, 04/15/23 | | | | | | | 28 | | | | 25,900 | |
8.25%, 07/15/25 | | | | | | | 28 | | | | 27,440 | |
Chaparral Energy, Inc., 8.75%, 07/15/23(b) | | | | | | | 27 | | | | 19,305 | |
Cheniere Corpus Christi Holdings LLC: | | | | | | | | | | | | |
7.00%, 06/30/24 | | | | | | | 100 | | | | 105,500 | |
5.88%, 03/31/25 | | | | | | | 25 | | | | 24,875 | |
5.13%, 06/30/27 | | | | | | | 10 | | | | 9,440 | |
Cheniere Energy Partners LP: | | | | | | | | | | | | |
5.25%, 10/01/25 | | | | | | | 15 | | | | 13,987 | |
5.63%, 10/01/26(b) | | | | | | | 36 | | | | 33,660 | |
Chesapeake Energy Corp.: | | | | | | | | | | | | |
6.63%, 08/15/20 | | | | | | | 28 | | | | 27,090 | |
4.88%, 04/15/22 | | | | | | | 8 | | | | 6,980 | |
7.00%, 10/01/24 | | | | | | | 54 | | | | 46,710 | |
8.00%, 01/15/25 | | | | | | | 31 | | | | 27,357 | |
8.00%, 06/15/27 | | | | | | | 88 | | | | 73,920 | |
CNX Resources Corp., 5.88%, 04/15/22 | | | | | | | 171 | | | | 164,160 | |
Comstock Escrow Corp., 9.75%, 08/15/26(b) | | | | | | | 17 | | | | 14,365 | |
CONSOL Energy, Inc., 11.00%, 11/15/25(b) | | | | | | | 38 | | | | 41,610 | |
Covey Park Energy LLC, 7.50%, 05/15/25(b) | | | | | | | 30 | | | | 25,800 | |
Crestwood Midstream Partners LP, 6.25%, 04/01/23 | | | | | | | 5 | | | | 4,812 | |
CrownRock LP, 5.63%, 10/15/25(b) | | | | | | | 54 | | | | 48,600 | |
DCP Midstream Operating LP: | | | | | | | | | | | | |
4.75%, 09/30/21(b) | | | | | | | 35 | | | | 34,562 | |
5.38%, 07/15/25 | | | | | | | 4 | | | | 3,910 | |
6.45%, 11/03/36(b) | | | | | | | 17 | | | | 16,490 | |
6.75%, 09/15/37(b) | | | | | | | 29 | | | | 28,565 | |
Denbury Resources, Inc., 9.25%, 03/31/22(b) | | | | | | | 34 | | | | 31,365 | |
| | | | | | | | | | | | |
| Security | | | | | Par (000) | | | Value | |
|
| Oil, Gas & Consumable Fuels (continued) | |
Diamondback Energy, Inc.: | | | | | | | | | | | | |
4.75%, 11/01/24(b) | | | USD | | | | 20 | | | $ | 19,300 | |
4.75%, 11/01/24 | | | | | | | 21 | | | | 20,265 | |
5.38%, 05/31/25 | | | | | | | 13 | | | | 12,675 | |
Endeavor Energy Resources LP(b): | | | | | | | | | | | | |
5.50%, 01/30/26 | | | | | | | 43 | | | | 44,075 | |
5.75%, 01/30/28 | | | | | | | 24 | | | | 24,485 | |
EnLink Midstream Partners LP: | | | | | | | | | | | | |
4.40%, 04/01/24 | | | | | | | 22 | | | | 20,732 | |
4.15%, 06/01/25 | | | | | | | 2 | | | | 1,803 | |
4.85%, 07/15/26 | | | | | | | 19 | | | | 17,134 | |
5.05%, 04/01/45 | | | | | | | 8 | | | | 6,250 | |
5.45%, 06/01/47 | | | | | | | 19 | | | | 15,366 | |
EP Energy LLC: | | | | | | | | | | | | |
9.38%, 05/01/20 | | | | | | | 2 | | | | 1,555 | |
9.38%, 05/01/24(b) | | | | | | | 24 | | | | 10,680 | |
7.75%, 05/15/26(b) | | | | | | | 27 | | | | 23,895 | |
Extraction Oil & Gas, Inc.(b): | | | | | | | | | | | | |
7.38%, 05/15/24 | | | | | | | 31 | | | | 25,575 | |
5.63%, 02/01/26 | | | | | | | 43 | | | | 31,390 | |
Genesis Energy LP: | | | | | | | | | | | | |
6.50%, 10/01/25 | | | | | | | 11 | | | | 9,680 | |
6.25%, 05/15/26 | | | | | | | 16 | | | | 13,720 | |
Great Western Petroleum LLC, 9.00%, 09/30/21(b) | | | | | | | 51 | | | | 46,410 | |
Gulfport Energy Corp., 6.63%, 05/01/23 | | | | | | | 17 | | | | 16,065 | |
Halcon Resources Corp., 6.75%, 02/15/25 | | | | | | | 40 | | | | 29,200 | |
Hess Infrastructure Partners LP, 5.63%, 02/15/26(b) | | | | | | | 27 | | | | 26,123 | |
Jagged Peak Energy LLC, 5.88%, 05/01/26(b) | | | | | | | 3 | | | | 2,790 | |
Magnolia Oil & Gas Operating LLC,
6.00%, 08/01/26(b) | | | | | | | 10 | | | | 9,650 | |
Matador Resources Co., 5.88%, 09/15/26 | | | | | | | 36 | | | | 33,120 | |
MEG Energy Corp., 6.50%, 01/15/25(b) | | | | | | | 50 | | | | 50,750 | |
NGPL PipeCo LLC(b): | | | | | | | | | | | | |
4.88%, 08/15/27 | | | | | | | 30 | | | | 28,275 | |
7.77%, 12/15/37 | | | | | | | 42 | | | | 47,880 | |
Northern Oil and Gas, Inc., 8.50% ( 8.50% Cash or 1.00% PIK), 05/15/23(e) | | | | | | | 28 | | | | 26,913 | |
Oasis Petroleum, Inc., 6.88%, 03/15/22 | | | | | | | 9 | | | | 8,483 | |
Parsley Energy LLC(b): | | | | | | | | | | | | |
6.25%, 06/01/24 | | | | | | | 9 | | | | 8,730 | |
5.38%, 01/15/25 | | | | | | | 42 | | | | 38,640 | |
5.25%, 08/15/25 | | | | | | | 9 | | | | 8,145 | |
5.63%, 10/15/27 | | | | | | | 22 | | | | 19,993 | |
PBF Holding Co. LLC, 7.25%, 06/15/25 | | | | | | | 20 | | | | 18,800 | |
PDC Energy, Inc.: | | | | | | | | | | | | |
1.13%, 09/15/21(f) | | | | | | | 2 | | | | 1,773 | |
6.13%, 09/15/24 | | | | | | | 2 | | | | 1,850 | |
5.75%, 05/15/26 | | | | | | | 15 | | | | 13,350 | |
QEP Resources, Inc.: | | | | | | | | | | | | |
6.88%, 03/01/21 | | | | | | | 3 | | | | 3,023 | |
5.38%, 10/01/22 | | | | | | | 35 | | | | 31,850 | |
5.25%, 05/01/23 | | | | | | | 5 | | | | 4,425 | |
5.63%, 03/01/26 | | | | | | | 60 | | | | 49,800 | |
Range Resources Corp.: | | | | | | | | | | | | |
5.88%, 07/01/22 | | | | | | | 4 | | | | 3,700 | |
5.00%, 03/15/23 | | | | | | | 12 | | | | 10,560 | |
4.88%, 05/15/25 | | | | | | | 10 | | | | 8,200 | |
Resolute Energy Corp., 8.50%, 05/01/20 | | | | | | | 44 | | | | 43,340 | |
Sanchez Energy Corp.: | | | | | | | | | | | | |
7.75%, 06/15/21 | | | | | | | 160 | | | | 37,600 | |
7.25%, 02/15/23(b) | | | | | | | 12 | | | | 9,780 | |
Seven Generations Energy Ltd.(b): | | | | | | | | | | | | |
6.88%, 06/30/23 | | | | | | | 8 | | | | 7,880 | |
5.38%, 09/30/25 | | | | | | | 2 | | | | 1,790 | |
| | | | |
| SCHEDULES OF INVESTMENTS | | | 89 | |
| | |
Schedule of Investments (continued) December 31, 2018 | | BlackRock High Yield Portfolio (Percentages shown are based on Net Assets) |
| | | | | | | | | | | | |
| Security | | | | | Par (000) | | | Value | |
|
| Oil, Gas & Consumable Fuels (continued) | |
SM Energy Co.: | | | | | | | | | | | | |
6.13%, 11/15/22 | | | USD | | | | 7 | | | $ | 6,615 | |
5.00%, 01/15/24 | | | | | | | 6 | | | | 5,220 | |
5.63%, 06/01/25 | | | | | | | 27 | | | | 23,490 | |
6.75%, 09/15/26 | | | | | | | 14 | | | | 12,530 | |
Southwestern Energy Co.: | | | | | | | | | | | | |
6.20%, 01/23/25 | | | | | | | 16 | | | | 14,300 | |
7.50%, 04/01/26 | | | | | | | 13 | | | | 12,285 | |
7.75%, 10/01/27 | | | | | | | 36 | | | | 34,200 | |
Sunoco LP: | | | | | | | | | | | | |
4.88%, 01/15/23 | | | | | | | 28 | | | | 27,300 | |
5.50%, 02/15/26 | | | | | | | 8 | | | | 7,580 | |
5.88%, 03/15/28 | | | | | | | 2 | | | | 1,871 | |
Tallgrass Energy Partners LP(b): | | | | | | | | | | | | |
4.75%, 10/01/23 | | | | | | | 2 | | | | 1,930 | |
5.50%, 09/15/24 | | | | | | | 38 | | | | 37,335 | |
5.50%, 01/15/28 | | | | | | | 86 | | | | 82,560 | |
Targa Resources Partners LP: | | | | | | | | | | | | |
5.25%, 05/01/23 | | | | | | | 2 | | | | 1,960 | |
5.13%, 02/01/25 | | | | | | | 48 | | | | 45,000 | |
5.88%, 04/15/26(b) | | | | | | | 27 | | | | 26,258 | |
5.00%, 01/15/28 | | | | | | | 12 | | | | 10,860 | |
TerraForm Power Operating LLC(b): | | | | | | | | | | | | |
4.25%, 01/31/23 | | | | | | | 19 | | | | 17,718 | |
5.00%, 01/31/28 | | | | | | | 20 | | | | 17,600 | |
W&T Offshore, Inc., 9.75%, 11/01/23(b) | | | | | | | 1 | | | | 875 | |
Whiting Petroleum Corp., 6.63%, 01/15/26 | | | | | | | 10 | | | | 8,575 | |
WildHorse Resource Development Corp., 6.88%, 02/01/25 | | | | | | | 14 | | | | 13,230 | |
WPX Energy, Inc.: | | | | | | | | | | | | |
6.00%, 01/15/22 | | | | | | | 6 | | | | 5,835 | |
8.25%, 08/01/23 | | | | | | | 6 | | | | 6,270 | |
5.25%, 09/15/24 | | | | | | | 9 | | | | 8,145 | |
| | | | | | | | | | | | |
| | | | | | | | | | | 2,470,049 | |
| | | |
| Paper & Forest Products — 0.2% | | | | | | | | | |
Mercer International, Inc.: | | | | | | | | | | | | |
6.50%, 02/01/24 | | | | | | | 15 | | | | 14,663 | |
5.50%, 01/15/26 | | | | | | | 13 | | | | 11,635 | |
Norbord, Inc., 6.25%, 04/15/23(b) | | | | | | | 22 | | | | 22,035 | |
| | | | | | | | | | | | |
| | | | | | | | | | | 48,333 | |
| | | |
| Pharmaceuticals — 2.2%(b) | | | | | | | | | |
Bausch Health Cos., Inc. | | | | | | | | | | | | |
5.63%, 12/01/21 | | | | | | | 11 | | | | 10,835 | |
5.50%, 03/01/23 | | | | | | | 63 | | | | 57,645 | |
5.88%, 05/15/23 | | | | | | | 95 | | | | 87,875 | |
7.00%, 03/15/24 | | | | | | | 42 | | | | 42,420 | |
6.13%, 04/15/25 | | | | | | | 104 | | | | 90,740 | |
5.50%, 11/01/25 | | | | | | | 72 | | | | 67,140 | |
9.00%, 12/15/25 | | | | | | | 13 | | | | 12,935 | |
Catalent Pharma Solutions, Inc., 4.88%, 01/15/26 | | | | | | | 35 | | | | 33,162 | |
Elanco Animal Health, Inc. | | | | | | | | | | | | |
4.27%, 08/28/23 | | | | | | | 13 | | | | 12,989 | |
4.90%, 08/28/28 | | | | | | | 17 | | | | 17,299 | |
Endo Finance LLC | | | | | | | | | | | | |
7.25%, 01/15/22 | | | | | | | 5 | | | | 4,325 | |
5.38%, 01/15/23 | | | | | | | 60 | | | | 45,600 | |
Valeant Pharmaceuticals International, Inc.: | | | | | | | | | | | | |
9.25%, 04/01/26 | | | | | | | 36 | | | | 36,000 | |
8.50%, 01/31/27 | | | | | | | 64 | | | | 62,080 | |
| | | | | | | | | | | | |
| | | | | | | | | | | 581,045 | |
| | | | | | | | | | | | |
| Security | | | | | Par (000) | | | Value | |
|
| Professional Services — 0.3% | |
Jaguar Holding Co. II, 6.38%, 08/01/23(b) | | | USD | | | | 91 | | | $ | 87,087 | |
| | | | | | | | | | | | |
|
| Real Estate Management & Development — 0.3%(b) | |
Five Point Operating Co. LP, 7.88%, 11/15/25 | | | | | | | 16 | | | | 15,440 | |
Greystar Real Estate Partners LLC, 5.75%, 12/01/25 | | | | | | | 18 | | | | 17,595 | |
Howard Hughes Corp. (The), 5.38%, 03/15/25 | | | | | | | 25 | | | | 23,500 | |
Newmark Group, Inc., 6.13%, 11/15/23 | | | | | | | 10 | | | | 9,847 | |
| | | | | | | | | | | | |
| | | | | | | | | | | 66,382 | |
| | | |
| Road & Rail — 0.5%(b) | | | | | | | | | |
Avolon Holdings Funding Ltd., 5.13%, 10/01/23 | | | | | | | 32 | | | | 30,560 | |
Herc Rentals, Inc.: | | | | | | | | | | | | |
7.50%, 06/01/22 | | | | | | | 6 | | | | 6,225 | |
7.75%, 06/01/24 | | | | | | | 17 | | | | 17,722 | |
Hertz Corp. (The), 7.63%, 06/01/22 | | | | | | | 39 | | | | 36,757 | |
Park Aerospace Holdings Ltd.: | | | | | | | | | | | | |
3.63%, 03/15/21 | | | | | | | 26 | | | | 25,025 | |
5.25%, 08/15/22 | | | | | | | 27 | | | | 26,123 | |
| | | | | | | | | | | | |
| | | | | | | | | | | 142,412 | |
|
| Semiconductors & Semiconductor Equipment — 0.3% | |
Advanced Micro Devices, Inc., 7.50%, 08/15/22 | | | | | | | 10 | | | | 10,725 | |
Entegris, Inc., 4.63%, 02/10/26(b) | | | | | | | 20 | | | | 18,400 | |
Qorvo, Inc., 5.50%, 07/15/26(b) | | | | | | | 36 | | | | 34,380 | |
Versum Materials, Inc., 5.50%, 09/30/24(b) | | | | | | | 14 | | | | 13,860 | |
| | | | | | | | | | | | |
| | | | | | | | | | | 77,365 | |
| | | |
| Software — 3.6% | | | | | | | | | |
ACI Worldwide, Inc., 5.75%, 08/15/26(b) | | | | | | | 59 | | | | 57,967 | |
CDK Global, Inc., 4.88%, 06/01/27 | | | | | | | 73 | | | | 67,708 | |
Genesys Telecommunications Laboratories, Inc., 10.00%, 11/30/24(b) | | | | | | | 72 | | | | 75,420 | |
Infor Software Parent LLC, 7.13% ( 7.13% Cash or 7.88% PIK), 05/01/21(b)(e) | | | | | | | 42 | | | | 40,845 | |
Infor US, Inc., 6.50%, 05/15/22 | | | | | | | 227 | | | | 219,543 | |
Informatica LLC, 7.13%, 07/15/23(b) | | | | | | | 93 | | | | 90,572 | |
Nuance Communications, Inc.: | | | | | | | | | | | | |
6.00%, 07/01/24 | | | | | | | 21 | | | | 20,895 | |
5.63%, 12/15/26 | | | | | | | 25 | | | | 23,750 | |
PTC, Inc., 6.00%, 05/15/24 | | | | | | | 22 | | | | 22,110 | |
RP Crown Parent LLC, 7.38%, 10/15/24(b) | | | | | | | 44 | | | | 44,330 | |
Solera LLC, 10.50%, 03/01/24(b) | | | | | | | 170 | | | | 181,050 | |
Sophia LP, 9.00%, 09/30/23(b) | | | | | | | 26 | | | | 26,000 | |
Symantec Corp., 5.00%, 04/15/25(b) | | | | | | | 22 | | | | 20,519 | |
TIBCO Software, Inc., 11.38%, 12/01/21(b) | | | | | | | 82 | | | | 85,895 | |
| | | | | | | | | | | | |
| | | | | | | | | | | 976,604 | |
| | | |
| Specialty Retail — 0.5% | | | | | | | | | |
Asbury Automotive Group, Inc., 6.00%, 12/15/24 | | | | | | | 36 | | | | 34,470 | |
Group 1 Automotive, Inc.: | | | | | | | | | | | | |
5.00%, 06/01/22 | | | | | | | 10 | | | | 9,475 | |
5.25%, 12/15/23(b) | | | | | | | 4 | | | | 3,710 | |
L Brands, Inc.: | | | | | | | | | | | | |
6.88%, 11/01/35 | | | | | | | 44 | | | | 36,749 | |
6.75%, 07/01/36 | | | | | | | 5 | | | | 4,075 | |
Penske Automotive Group, Inc.: | | | | | | | | | | | | |
5.75%, 10/01/22 | | | | | | | 13 | | | | 12,967 | |
5.50%, 05/15/26 | | | | | | | 8 | | | | 7,440 | |
Staples, Inc., 8.50%, 09/15/25(b) | | | | | | | 28 | | | | 25,262 | |
| | | | | | | | | | | | |
| | | | | | | | | | | 134,148 | |
|
| Technology Hardware, Storage & Peripherals — 0.6% | |
Dell International LLC, 7.13%, 06/15/24(b) | | | | | | | 68 | | | | 69,190 | |
Western Digital Corp., 4.75%, 02/15/26 | | | | | | | 107 | | | | 92,822 | |
| | | | | | | | | | | | |
| | | | | | | | | | | 162,012 | |
| | |
| 90 | | 2018 BLACKROCK ANNUAL REPORTTO SHAREHOLDERS |
| | |
Schedule of Investments (continued) December 31, 2018 | | BlackRock High Yield Portfolio (Percentages shown are based on Net Assets) |
| | | | | | | | | | | | |
| Security | | | | | Par (000) | | | Value | |
|
| Thrifts & Mortgage Finance — 0.2%(b) | |
Ladder Capital Finance Holdings LLLP, 5.25%, 10/01/25 | | | USD | | | | 33 | | | $ | 29,453 | |
Nationstar Mortgage Holdings, Inc.: | | | | | | | | | | | | |
8.13%, 07/15/23 | | | | | | | 18 | | | | 17,550 | |
9.13%, 07/15/26 | | | | | | | 14 | | | | 13,615 | |
| | | | | | | | | | | | |
| | | | | | | | | | | 60,618 | |
| |
| Trading Companies & Distributors — 1.1% | | | | |
Flexi-Van Leasing, Inc., 10.00%, 02/15/23(b) | | | | | | | 15 | | | | 12,150 | |
Fortress Transportation & Infrastructure Investors LLC(b): | | | | | | | | | | | | |
6.75%, 03/15/22 | | | | | | | 8 | | | | 8,020 | |
6.50%, 10/01/25 | | | | | | | 8 | | | | 7,480 | |
HD Supply, Inc., 5.38%, 10/15/26(b) | | | | | | | 176 | | | | 170,720 | |
United Rentals North America, Inc.: | | | | | | | | | | | | |
5.50%, 07/15/25 | | | | | | | 4 | | | | 3,770 | |
4.63%, 10/15/25 | | | | | | | 37 | | | | 33,023 | |
5.88%, 09/15/26 | | | | | | | 30 | | | | 28,275 | |
5.50%, 05/15/27 | | | | | | | 29 | | | | 26,897 | |
4.88%, 01/15/28 | | | | | | | 15 | | | | 13,162 | |
| | | | | | | | | | | | |
| | | | | | | | | | | 303,497 | |
| |
| Wireless Telecommunication Services — 2.8% | | | | |
Digicel Ltd., 6.00%, 04/15/21(b) | | | | | | | 200 | | | | 180,250 | |
Hughes Satellite Systems Corp.: | | | | | | | | | | | | |
7.63%, 06/15/21 | | | | | | | 10 | | | | 10,375 | |
5.25%, 08/01/26 | | | | | | | 25 | | | | 22,906 | |
Sprint Corp.: | | | | | | | | | | | | |
7.88%, 09/15/23 | | | | | | | 101 | | | | 103,652 | |
7.13%, 06/15/24 | | | | | | | 206 | | | | 204,010 | |
7.63%, 02/15/25 | | | | | | | 8 | | | | 8,000 | |
7.63%, 03/01/26 | | | | | | | 84 | | | | 82,950 | |
T-Mobile USA, Inc.: | | | | | | | | | | | | |
4.00%, 04/15/22 | | | | | | | 10 | | | | 9,750 | |
6.38%, 03/01/25 | | | | | | | 28 | | | | 28,280 | |
5.13%, 04/15/25 | | | | | | | 6 | | | | 5,827 | |
6.50%, 01/15/26 | | | | | | | 18 | | | | 18,360 | |
4.50%, 02/01/26 | | | | | | | 67 | | | | 61,473 | |
4.75%, 02/01/28 | | | | | | | 33 | | | | 29,865 | |
| | | | | | | | | | | | |
| | | | | | | | | | | 765,698 | |
| |
Total Corporate Bonds — 76.2%
(Cost: $22,121,271) | | | | 20,632,410 | |
| | | | | | | | | | | | |
| |
Floating Rate Loan Interests — 14.8%(g) | | | | | |
| | | |
| Aerospace & Defense — 0.1% | | | | | | | | | |
Atlantic Aviation FBO, Inc., Term Loan B, (LIBOR USD 6 Month + 3.75%), 6.13%, 11/30/25(c) | | | | | | | 13 | | | | 12,870 | |
Sequa Mezzanine Holdings LLC, 1st Lien Term Loan, (LIBOR USD 3 Month + 5.00%), 7.41%, 11/28/21 | | | | | | | 20 | | | | 18,740 | |
Sequa Mezzanine Holdings LLC, 2nd Lien Term Loan, (LIBOR USD 3 Month + 9.00%), 11.52%, 04/28/22(c) | | | | | | | 5 | | | | 4,725 | |
| | | | | | | | | | | | |
| | | | | | | | | | | 36,335 | |
| | | |
| Auto Components — 0.0%(c) | | | | | | | | | |
Mavis Tire Express Services Corp., 1st Lien Term Loan, (LIBOR USD 1 Month + 3.25%), 5.75%, 03/15/25 | | | | | | | 7 | | | | 6,973 | |
Mavis Tire Express Services Corp., Delayed Draw 1st Lien Term Loan, (LIBOR USD 1 Month + 3.25%), 6.05%, 03/15/25 | | | | | | | — | (h) | | | 167 | |
| | | | | | | | | | | | |
| | | | | | | | | | | 7,140 | |
| | | | | | | | | | | | |
| Security | | | | | Par (000) | | | Value | |
|
| Chemicals — 1.4% | |
Alpha 3 BV, Term Loan, 01/31/24(i) | | | USD | | | | 43 | | | $ | 40,726 | |
Ascend Performance Materials Operations LLC, 1st Lien Term Loan B, (LIBOR USD 3 Month + 5.25%), 8.05%, 08/12/22(c) | | | | | | | 162 | | | | 159,614 | |
Greenrock Finance, Inc., Term Loan, (LIBOR USD 3 Month + 3.50%), 6.30%, 06/28/24 | | | | | | | 6 | | | | 5,821 | |
Invictus Co., Term Loan B, (LIBOR USD 3 Month + 3.00%), 5.50%, 03/28/25 | | | | | | | 12 | | | | 11,232 | |
Invictus Co., Term Loan B26, (LIBOR USD 3 Month + 6.75%), 9.25%, 03/30/26 | | | | | | | 6 | | | | 5,985 | |
Messer Industries LLC, Term Loan, 10/01/25(i) | | | | | | | 82 | | | | 77,627 | |
Starfruit Finco BV, Term Loan, 10/01/25(c)(i) | | | | | | | 91 | | | | 86,715 | |
| | | | | | | | | | | | |
| | | | | | | | | | | 387,720 | |
| | | |
| Commercial Services & Supplies — 0.8% | | | | | | | | | |
Access CIG LLC, 2nd Lien Term Loan: | | | | | | | | | | | | |
(LIBOR USD 3 Month + 7.75%), 10.46%, 02/27/26 | | | | | | | 3 | | | | 3,426 | |
Brand Energy & Infrastructure Services, Inc., Term Loan, (LIBOR USD 3 Month + 4.25%), 6.73% - 6.76%, 06/21/24 | | | | | | | 131 | | | | 124,068 | |
GFL Environmental, Inc., Term Loan B, (LIBOR USD 1 Month + 3.00%), 5.52%, 05/30/25 | | | | | | | 67 | | | | 62,187 | |
Tempo Acquisition LLC, Term Loan, (LIBOR USD 1 Month + 3.00%), 5.52%, 05/01/24 | | | | | | | 14 | | | | 13,101 | |
West Corp., Term Loan, (LIBOR USD 3 Month + 3.50%), 6.03%, 10/10/24 | | | | | | | 8 | | | | 7,260 | |
| | | | | | | | | | | | |
| | | | | | | | | | | 210,042 | |
| | | |
| Construction & Engineering — 0.3% | | | | | | | | | |
Ply Gem, Inc., Term Loan B, (LIBOR USD 3 Month + 3.75%), 6.18%, 04/01/25(c) | | | | | | | 41 | | | | 37,576 | |
SRS Distribution, Inc., Term Loan B, (LIBOR USD 1 Month + 3.25%), 5.77%, 05/23/25 | | | | | | | 37 | | | | 34,347 | |
| | | | | | | | | | | | |
| | | | | | | | | | | 71,923 | |
| | | |
| Diversified Consumer Services — 0.1% | | | | | | | | | |
Laureate Education, Inc., Term Loan, (LIBOR USD 3 Month + 3.50%), 6.03%, 04/26/24 | | | | | | | 12 | | | | 11,800 | |
TierPoint LLC, Term Loan, (LIBOR USD 1 Month + 3.75%), 6.27%, 05/06/24 | | | | | | | 14 | | | | 12,942 | |
| | | | | | | | | | | | |
| | | | | | | | | | | 24,742 | |
| | | |
| Diversified Financial Services — 0.1% | | | | | | | | | |
LTI Holdings, Inc., Term Loan, (LIBOR USD 1 Month + 3.50%), 6.02%, 09/06/25 | | | | | | | 13 | | | | 12,179 | |
WP CPP Holdings, Term Loan B, (LIBOR USD 3 Month + 3.75%), 6.28%, 03/16/25 | | | | | | | 6 | | | | 5,768 | |
| | | | | | | | | | | | |
| | | | | | | | | | | 17,947 | |
| |
| Diversified Telecommunication Services — 0.6% | | | | |
Altice France SA, Term Loan, (LIBOR USD 1 Month + 4.00%), 6.46%, 08/14/26 | | | | | | | 66 | | | | 62,205 | |
CenturyLink, Inc., Term Loan, (LIBOR USD 1 Month + 2.75%), 5.27%, 01/31/25 | | | | | | | 82 | | | | 76,491 | |
Frontier Communications Corp., Term Loan, 03/31/21(i) | | | | | | | 22 | | | | 20,410 | |
| | | | | | | | | | | | |
| | | | | | | | | | | 159,106 | |
| | | |
| Electric Utilities — 0.1% | | | | | | | | | |
Vistra Operations Co. LLC, Term Loan B3,
12/31/25(i) | | | | | | | 16 | | | | 15,268 | |
| | | | | | | | | | | | |
| | | |
| Energy Equipment & Services — 1.0% | | | | | | | | | |
McDermott International, Inc., Term Loan,
05/12/25(i) | | | | | | | 162 | | | | 150,926 | |
Pioneer Energy Services Corp., Term Loan, (LIBOR USD 1 Month + 7.75%), 10.21%, 11/08/22(c) | | | | | | | 80 | | | | 78,800 | |
| | | | |
| SCHEDULES OF INVESTMENTS | | | 91 | |
| | |
Schedule of Investments (continued) December 31, 2018 | | BlackRock High Yield Portfolio (Percentages shown are based on Net Assets) |
| | | | | | | | | | | | |
| Security | | | | | Par (000) | | | Value | |
| | | |
| Energy Equipment & Services (continued) | | | | | | | | | |
Weatherford International Ltd., Term Loan, (LIBOR USD 1 Month + 1.43%), 3.96%, 07/13/20(c) | | | USD | | | | 36 | | | $ | 33,974 | |
| | | | | | | | | | | | |
| | | | | | | | | | | 263,700 | |
| | | |
| Food Products — 0.1% | | | | | | | | | |
CHG PPC Parent LLC, Term Loan, (LIBOR USD 1 Month + 2.75%), 5.27%, 03/31/25 | | | | | | | 11 | | | | 10,480 | |
Chobani LLC, Term Loan, (LIBOR USD 1 Month + 3.50%), 6.02%, 10/10/23 | | | | | | | 8 | | | | 7,305 | |
JBS USA Lux SA, Term Loan, (LIBOR USD 3 Month + 2.50%), 5.02% - 5.30%, 10/30/22 | | | | | | | 8 | | | | 7,801 | |
| | | | | | | | | | | | |
| | | | | | | | | | | 25,586 | |
| | | |
| Gas Utilities — 0.1% | | | | | | | | | |
Midcoast Operating LP, Term Loan, (LIBOR USD 3 Month + 5.50%), 8.30%, 06/30/25 | | | | | | | 26 | | | | 25,116 | |
| | | | | | | | | | | | |
| | | |
| Health Care Equipment & Supplies — 0.6% | | | | | | | | | |
DJO Finance LLC, 1st Lien Term Loan B, 06/08/20(i) | | | | | | | 79 | | | | 78,162 | |
Immucor, Inc., 1st Lien Term Loan, (LIBOR USD 3 Month + 5.00%), 7.80%, 06/15/21 | | | | | | | 77 | | | | 75,818 | |
Universal Hospital Services, Inc., Delayed Draw Term Loan B, 10/18/25(c)(i) | | | | | | | 9 | | | | 8,685 | |
| | | | | | | | | | | | |
| | | | | | | | | | | 162,665 | |
| | | |
| Health Care Providers & Services — 0.9% | | | | | | | | | |
AHP Health Partners, Inc., Term Loan, (LIBOR USD 1 Month + 4.50%), 7.02%, 06/30/25 | | | | | | | 14 | | | | 13,686 | |
Auris LuxCo, Term Loan, 07/24/25(i) | | | | | | | 15 | | | | 14,559 | |
Concentra, Inc., 2nd Lien Term Loan, (LIBOR USD 1 Month + 6.50%), 8.88%, 07/25/23 | | | | | | | 22 | | | | 21,780 | |
Dentalcorp Perfect Smile ULC, 1st Lien Term Loan, (LIBOR USD 1 Month + 3.75%), 6.27%, 05/31/25 | | | | | | | 9 | | | | 8,836 | |
Dentalcorp Perfect Smile ULC, Delayed Draw Term Loan, (LIBOR USD 1 Month + 3.75%),0.00% - 6.27%, 05/31/25 | | | | | | | 1 | | | | 1,248 | |
Envision Healthcare Corp., Term Loan, (LIBOR USD 1 Month + 3.75%), 6.27%, 10/10/25 | | | | | | | 96 | | | | 89,431 | |
Gentiva Health Services, Inc., Term Loan, (LIBOR USD 1 Month + 7.00%), 9.56%, 07/02/26 | | | | | | | 5 | | | | 5,446 | |
Gentiva Health Services, Inc., Term Loan U, (LIBOR USD 1 Month + 3.75%), 6.31%, 07/02/25(c) | | | | | | | 39 | | | | 37,944 | |
Ortho-Clinical Diagnostics, Inc., Term Loan B, (LIBOR USD 1 Month + 3.25%), 5.76%, 06/30/25 | | | | | | | 16 | | | | 14,583 | |
Quorum Health Corp., 1st Lien Term Loan, (LIBOR USD 1 Month + 6.75%), 9.27%, 04/29/22 | | | | | | | 20 | | | | 19,719 | |
Team Health Holdings, Inc., Term Loan, (LIBOR USD 1 Month + 2.75%), 5.27%, 02/06/24 | | | | | | | 24 | | | | 20,970 | |
| | | | | | | | | | | | |
| | | | | | | | | | | 248,202 | |
| | | |
| Health Care Technology — 0.1% | | | | | | | | | |
Change Healthcare Holdings LLC, Term Loan B, 03/01/24(i) | | | | | | | 31 | | | | 29,709 | |
Goodrx, Inc., Term Loan, (LIBOR USD 1 Month + 3.00%), 5.43%, 10/10/25 | | | | | | | 9 | | | | 8,651 | |
| | | | | | | | | | | | |
| | | | | | | | | | | 38,360 | |
| | | |
| Hotels, Restaurants & Leisure — 0.8% | | | | | | | | | |
IRB Holding Corp., Term Loan B, (LIBOR USD 1 Month + 3.25%), 5.68%, 02/05/25 | | | | | | | 24 | | | | 22,779 | |
Las Vegas Sands LLC, Term Loan, (LIBOR USD 1 Month + 1.75%), 4.27%, 03/27/25 | | | | | | | 57 | | | | 53,893 | |
Penn National Gaming, Inc., 1st Lien Term Loan, (LIBOR USD 1 Month + 2.25%), 4.71%, 10/15/25 | | | | | | | 7 | | | | 6,742 | |
Stars Group Holdings BV, Term Loan, (LIBOR USD 3 Month + 3.50%), 6.30%, 07/10/25 | | | | | | | 143 | | | | 138,146 | |
| | | | | | | | | | | | |
| | | | | | | | | | | 221,560 | |
| | | | | | | | | | | | |
| Security | | | | | Par (000) | | | Value | |
| | | |
| Household Products — 0.0% | | | | | | | | | |
Energizer Holdings, Inc., 1st Lien Term Loan B, 06/20/25(i) | | | USD | | | | 5 | | | $ | 4,819 | |
| | | | | | | | | | | | |
|
| Industrial Conglomerates — 0.5% | |
Accudyne Industries LLC, Term Loan, (LIBOR USD 1 Month + 3.00%), 5.52%, 08/18/24 | | | | | | | 43 | | | | 40,594 | |
Filtration Group Corp., Term Loan B, (LIBOR USD 1 Month + 3.00%), 5.52%, 03/29/25 | | | | | | | 7 | | | | 6,681 | |
PSAV Holdings LLC, 1st Lien Term Loan, (LIBOR USD 3 Month + 3.25%), 5.77% - 6.05%, 02/21/25 | | | | | | | 12 | | | | 11,255 | |
PSAV Holdings LLC, 2nd Lien Term Loan, 09/01/25(c)(i) | | | | | | | 7 | | | | 6,858 | |
Uber Technologies, Inc., Term Loan, (LIBOR USD 1 Month + 4.00%), 6.39%, 03/14/25(c) | | | | | | | 44 | | | | 42,576 | |
Vertiv Co., Term Loan B, (LIBOR USD 3 Month + 4.00%), 6.71%, 11/30/23 | | | | | | | 22 | | | | 20,111 | |
| | | | | | | | | | | | |
| | | | | | | | | | | 128,075 | |
| | | |
| Insurance — 0.5% | | | | | | | | | |
Alliant Holdings Intermediate LLC, Term Loan, (LIBOR USD 1 Month + 2.75%), 5.21%, 05/09/25 | | | | | | | 5 | | | | 4,692 | |
Asurion LLC, 2nd Lien Term Loan B2, (LIBOR USD 1 Month + 6.50%), 9.02%, 08/04/25 | | | | | | | 46 | | | | 45,396 | |
Sedgwick, 1st Lien Term Loan, 11/06/25(i) | | | | | | | 69 | | | | 65,751 | |
USI, Inc., 1st Lien Term Loan B, (LIBOR USD 3 Month + 3.00%), 5.80%, 05/16/24 | | | | | | | 22 | | | | 20,505 | |
| | | | | | | | | | | | |
| | | | | | | | | | | 136,344 | |
| | | |
| IT Services — 1.1% | | | | | | | | | |
Boxer Parent Co., Inc., Term Loan B, (LIBOR USD 3 Month + 4.25%), 7.05%, 10/02/25 | | | | | | | 44 | | | | 42,336 | |
CCC Information Services, Inc., 2nd Lien Term Loan, (LIBOR USD 1 Month + 6.75%), 9.27%, 04/28/25 | | | | | | | 4 | | | | 3,930 | |
CCC Information Services, Inc., Term Loan, (LIBOR USD 1 Month + 3.00%), 5.53%, 04/29/24 | | | | | | | 15 | | | | 13,784 | |
Deck Chassis Acquisition, Inc., Term Loan, (LIBOR USD 3 Month + 6.00%), 8.53%, 06/15/23(c) | | | | | | | 3 | | | | 2,575 | |
Mitchell International, Inc., 1st Lien Term Loan, (LIBOR USD 1 Month + 3.25%), 5.77%, 11/29/24 | | | | | | | 21 | | | | 19,837 | |
Mitchell International, Inc., 2nd Lien Term Loan, (LIBOR USD 1 Month + 7.25%), 9.77%, 12/01/25 | | | | | | | 10 | | | | 9,694 | |
Peak 10 Holding Corp., 2nd Lien Term Loan, (LIBOR USD 3 Month + 7.25%), 9.79%, 08/01/25 | | | | | | | 7 | | | | 6,239 | |
Peak 10 Holding Corp., Term Loan, (LIBOR USD 3 Month + 3.50%), 6.31%, 08/01/24 | | | | | | | 17 | | | | 15,221 | |
Renaissance Learning, Inc., Term Loan, (LIBOR USD 1 Month + 3.25%), 5.77%, 05/24/25 | | | | | | | 12 | | | | 11,052 | |
SS&C Technologies Holdings, Inc., Term Loan B, (LIBOR USD 1 Month + 2.25%), 4.77%, 04/16/25 | | | | | | | 34 | | | | 31,713 | |
SS&C Technologies, Inc., 1st Lien Term Loan B5, (LIBOR USD 1 Month + 2.25%), 4.77%, 04/16/25 | | | | | | | 22 | | | | 20,669 | |
Verscend Holding Corp., Term Loan B, (LIBOR USD 1 Month + 4.50%), 7.02%, 08/27/25 | | | | | | | 126 | | | | 121,689 | |
| | | | | | | | | | | | |
| | | | | | | | | | | 298,739 | |
| | | |
| Life Sciences Tools & Services — 0.0% | | | | | | | | | |
Albany Molecular Research, Inc., Term Loan, (LIBOR USD 1 Month + 3.25%), 5.77%, 08/30/24 | | | | | | | 9 | | | | 8,363 | |
| | | | | | | | | | | | |
| | | |
| Machinery — 0.3% | | | | | | | | | |
Altra Industrial Motion Corp., Term Loan, (LIBOR USD 1 Month + 2.00%), 4.52%, 09/26/25 | | | | | | | 18 | | | | 16,801 | |
Brookfield WEC Holdings, Inc., 2nd Lien Term Loan, (LIBOR USD 1 Month + 6.75%), 9.27%, 08/03/26 | | | | | | | 10 | | | | 9,750 | |
Titan Acquisition Ltd., Term Loan, 03/28/25(i) | | | | | | | 64 | | | | 58,097 | |
| | | | | | | | | | | | |
| | | | | | | | | | | 84,648 | |
| | |
| 92 | | 2018 BLACKROCK ANNUAL REPORTTO SHAREHOLDERS |
| | |
Schedule of Investments (continued) December 31, 2018 | | BlackRock High Yield Portfolio (Percentages shown are based on Net Assets) |
| | | | | | | | | | | | |
| Security | | | | | Par (000) | | | Value | |
| | | |
| Media — 1.4% | | | | | | | | | |
Ascend Learning LLC, Term Loan B, (LIBOR USD 1 Month + 3.00%), 5.52%, 07/12/24 | | | USD | | | | 7 | | | $ | 6,515 | |
Charter Communications Operating LLC, Term Loan, (LIBOR USD 1 Month + 1.50%), 4.03%, 03/31/23 | | | | | | | 133 | | | | 126,350 | |
Gray Television, Inc., Term Loan, 11/02/25(i) | | | | | | | 9 | | | | 8,679 | |
Intelsat Jackson Holdings SA, Term Loan: | | | | | | | | | | | | |
(LIBOR USD 1 Month + 3.75%), 6.26% , 11/27/23 | | | | | | | 8 | | | | 8,115 | |
(LIBOR USD 6 Month + 6.63%), 6.63% , 01/02/24 | | | | | | | 164 | | | | 161,539 | |
(LIBOR USD 1 Month + 4.50%), 7.01% , 01/02/24 | | | | | | | 31 | | | | 30,903 | |
Xplornet Communications, Inc., Term Loan, (LIBOR USD 3 Month + 4.00%), 6.80%, 09/09/21(c) | | | | | | | 28 | | | | 27,373 | |
| | | | | | | | | | | | |
| | | | | | | | | | | 369,474 | |
| | | |
| Multiline Retail — 0.1% | | | | | | | | | |
Neiman Marcus Group Ltd. LLC, Term Loan, (LIBOR USD 1 Month + 3.25%), 5.63%, 10/25/20 | | | | | | | 28 | | | | 23,945 | |
| | | | | | | | | | | | |
| | | |
| Multi-Utilities — 0.0% | | | | | | | | | |
Exgen Renewables IV LLC, Term Loan, (LIBOR USD 3 Month + 3.00%), 5.71%, 11/28/24 | | | | | | | 9 | | | | 8,341 | |
| | | | | | | | | | | | |
| | | |
| Oil, Gas & Consumable Fuels — 0.7% | | | | | | | | | |
BCP Raptor II LLC, Term Loan, (LIBOR USD 3 Month + 4.75%), 7.14%, 10/22/25 | | | | | | | 9 | | | | 8,314 | |
Bronco Midstream Funding LLC, Term Loan B, (LIBOR USD 1 Month + 3.50%), 6.01%, 08/14/23 | | | | | | | 3 | | | | 3,036 | |
California Resources Corp., Term Loan: | | | | | | | | | | | | |
, 12/31/21(i) | | | | | | | 55 | | | | 53,527 | |
(LIBOR USD 1 Month + 4.75%), 7.26% , 12/31/22 | | | | | | | 76 | | | | 73,590 | |
CNX Resources Corp., Term Loan, (LIBOR USD 1 Month + 6.00%), 8.53%, 11/28/22 | | | | | | | 32 | | | | 31,888 | |
Gavilan Resources LLC, 2nd Lien Term Loan, (LIBOR USD 1 Month + 6.00%), 8.50%, 03/01/24 | | | | | | | 14 | | | | 10,793 | |
| | | | | | | | | | | | |
| | | | | | | | | | | 181,148 | |
| | | |
| Pharmaceuticals — 0.4% | | | | | | | | | |
Amneal Pharmaceuticals LLC, Term Loan B18, (LIBOR USD 1 Month + 3.50%), 6.06%, 03/21/25 | | | | | | | 30 | | | | 28,429 | |
Bausch Health Co., Inc., Term Loan, (LIBOR USD 1 Month + 3.00%), 5.38%, 06/02/25 | | | | | | | 36 | | | | 33,870 | |
Endo Pharmaceuticals, Inc., Term Loan B, (LIBOR USD 1 Month + 4.25%), 6.81%, 04/29/24 | | | | | | | 38 | | | | 35,549 | |
Valeant Pharmaceuticals International, Inc., Term Loan, (LIBOR USD 1 Month + 2.75%), 5.13%, 11/14/25 | | | | | | | 20 | | | | 18,701 | |
| | | | | | | | | | | | |
| | | | | | | | | | | 116,549 | |
| |
| Real Estate Management & Development — 0.0% | | | | |
Forest City, Term Loan B, (LIBOR USD 6 Month + 4.00%), 6.38%, 12/31/25 | | | | | | | 9 | | | | 8,760 | |
| | | | | | | | | | | | |
| | | |
| Software — 1.5% | | | | | | | | | |
Financial & Risk US Holdings, Inc., Term Loan, (LIBOR USD 1 Month + 3.75%), 6.27%, 10/01/25 | | | | | | | 305 | | | | 289,750 | |
Infor US, Inc., Term Loan, (LIBOR USD 1 Month + 2.75%), 5.27%, 02/01/22 | | | | | | | 10 | | | | 9,440 | |
Kronos, Inc., 2nd Lien Term Loan B, (LIBOR USD 3 Month + 8.25%), 9.25%, 11/01/24 | | | | | | | 63 | | | | 61,602 | |
McAfee LLC, Term Loan, (LIBOR USD 1 Month + 3.75%), 6.27%, 09/30/24 | | | | | | | 15 | | | | 14,178 | |
PowerSchool Group LLC, 1st Lien Term Loan, (LIBOR USD 1 Month + 3.25%), 5.63%, 07/31/25(c) | | | | | | | 9 | | | | 8,505 | |
SS&C Technologies Holdings, Inc., Term Loan, (LIBOR USD 1 Month + 2.25%), 4.77%, 04/16/25 | | | | | | | 12 | | | | 11,586 | |
| | | | | | | | | | | | |
| | | | | | | | | | | 395,061 | |
| | | | | | | | | | | | |
| Security | | | | | Par (000) | | | Value | |
|
| Specialty Retail — 0.0% | |
Belron Finance US LLC, Term Loan B, (LIBOR USD 3 Month + 2.25%), 4.84%, 11/07/24(c) | | | USD | | | | 13 | | | $ | 12,259 | |
| | | | | | | | | | | | |
|
| Trading Companies & Distributors — 0.1% | |
Beacon Roofing Supply, Inc., Term Loan B, (LIBOR USD 1 Month + 2.25%), 4.68%, 01/02/25 | | | | | | | 14 | | | | 13,186 | |
| | | | | | | | | | | | |
| |
| Wireless Telecommunication Services — 1.1% | | | | |
Digicel International Finance Ltd., Term Loan, (LIBOR USD 3 Month + 3.25%), 5.96%, 05/27/24 | | | | | | | 26 | | | | 23,687 | |
Ligado Networks LLC, Term Loan, (LIBOR USD 3 Month + 12.50%), 15.27%, 12/07/20 | | | | | | | 74 | | | | 13,938 | |
New Lightsquared LLC, 1st Lien Term Loan, (LIBOR USD 3 Month + 0.00%), 11.52%, 12/07/20 | | | | | | | 288 | | | | 195,941 | |
Sprint Communications, Inc., Term Loan, (LIBOR USD 1 Month + 3.00%), 5.56%, 02/02/24 | | | | | | | 63 | | | | 60,795 | |
| | | | | | | | | | | | |
| | | | | | | | | | | 294,361 | |
| |
Total Floating Rate Loan Interests — 14.8%
(Cost: $4,275,732) | | | | 3,999,484 | |
| | | | | | | | | | | | |
| | | |
Preferred Securities — 2.6% | | | | | | | | | | | | |
| | | |
Capital Trusts — 1.8%(g)(j) | | | | | | | | | | | | |
| | | |
| Banks — 1.6% | | | | | | | | | |
Bank of America Corp.: | | | | | | | | | | | | |
Series X, 6.25% | | | | | | | 66 | | | | 65,208 | |
Series Z, 6.50% | | | | | | | 33 | | | | 33,412 | |
Series AA, 6.10% | | | | | | | 106 | | | | 104,410 | |
CIT Group, Inc., Series A, 5.80% | | | | | | | 26 | | | | 23,530 | |
JPMorgan Chase & Co.: | | | | | | | | | | | | |
Series V, 5.00% | | | | | | | 65 | | | | 62,725 | |
Series Q, 5.15% | | | | | | | 20 | | | | 19,052 | |
Series R, 6.00% | | | | | | | 5 | | | | 4,887 | |
Series U, 6.13% | | | | | | | 7 | | | | 6,948 | |
Series X, 6.10% | | | | | | | 78 | | | | 77,512 | |
Wells Fargo & Co.: | | | | | | | | | | | | |
Series S, 5.90% | | | | | | | 15 | | | | 14,291 | |
Series U, 5.87% | | | | | | | 34 | | | | 33,608 | |
| | | | | | | | | | | | |
| | | | | | | | | | | 445,583 | |
| | | |
| Capital Markets — 0.2% | | | | | | | | | |
Goldman Sachs Group, Inc. (The), Series P, 5.00% | | | | | | | 20 | | | | 16,748 | |
Morgan Stanley, Series H, 5.45% | | | | | | | 27 | | | | 26,261 | |
| | | | | | | | | | | | |
| | | | 43,009 | |
| |
Total Capital Trusts — 1.8%
(Cost: $517,601) | | | | 488,592 | |
| | | | | | | | | | | | |
| | | |
| | | | | | Shares | | | | |
| | | |
Trust Preferreds — 0.8% | | | | | | | | | | | | |
| | | |
| Banks — 0.8% | | | | | | | | | |
GMAC Capital Trust I, Series 2, 8.40%, 02/15/40(g) | | | | | | | 8,676 | | | | 219,937 | |
| |
Total Trust Preferreds — 0.8%
(Cost: $227,891) | | | | 219,937 | |
| | | | | | | | |
| |
Total Preferred Securities — 2.6%
(Cost: $745,492) | | | | 708,529 | |
| | | | | | | | |
| |
Total Long-Term Investments — 94.9%
(Cost: $27,593,598) | | | | 25,683,191 | |
| | | | | | | | | | | | |
| | | | |
| SCHEDULES OF INVESTMENTS | | | 93 | |
| | |
Schedule of Investments (continued) December 31, 2018 | | BlackRock High Yield Portfolio (Percentages shown are based on Net Assets) |
| | | | | | | | | | | | |
| Security | | | | |
Shares | | | Value | |
|
Short-Term Securities — 5.2%(k) | |
BlackRock Liquidity Funds, T-Fund, Institutional Class, 2.32%(l) | | | | | | | 1,355,813 | | | $ | 1,355,813 | |
JPMorgan US Treasury Plus Money Market Fund, Agency Class, 2.24% | | | | | | | 52,133 | | | | 52,134 | |
| |
Total Short-Term Securities — 5.2%
(Cost: $1,407,947) | | | | 1,407,947 | |
| | | | | | | | | | | | |
| |
Total Investments — 100.1%
(Cost: $29,001,545) | | | | 27,091,138 | |
| | | | | | | | | | | | |
| |
Liabilities in Excess of Other Assets — (0.1)% | | | | (23,279 | ) |
| | | | | | | | | | | | |
| |
Net Assets — 100.0% | | | $ | 27,067,859 | |
| | | | | | | | | | | | |
| (a) | Non-income producing security. |
| (b) | Security exempt from registration pursuant to Rule 144A under the Securities Act of 1933, as amended. These securities may be resold in transactions exempt from registration to qualified institutional investors. |
| (c) | Security is valued using significant unobservable inputs and is classified as Level 3 in the fair value hierarchy. |
| (d) | Issuer filed for bankruptcy and/or is in default. |
| (e) | Payment-in-kind security which may pay interest/dividends in additional par/shares and/or in cash. Rates shown are the current rate and possible payment rates. |
| (f) | Convertible security. |
| (g) | Variable rate security. Rate shown is the rate in effect as of period end. |
| (h) | Amount is less than $500. |
| (i) | Represents an unsettled loan commitment at period end. Certain details associated with this purchase are not known prior to the settlement date, including coupon rate. |
| (j) | Perpetual security with no stated maturity date. |
| (k) | Annualized 7-day yield as of period end. |
| (l) | During the year ended December 31, 2018, investments in issuers considered to be affiliates of the Fund for purposes of Section 2(a)(3) of the Investment Company Act of 1940, as amended, and/or related parties of the Fund were as follows: |
| | | | | | | | | | | | | | | | | | | | | | | | | | | | | | | | |
| Affiliate | | Shares
Held at
12/31/17 | | | Shares
Purchased | | | Shares
Sold | | | Shares
Held at
12/31/18 | | | Value at
12/31/18 | | | Income | | | Net
Realized
Gain (Loss) (a) | | | Change in
Unrealized
Appreciation
(Depreciation) | |
BlackRock Liquidity Funds, T-Fund, Institutional Class | | | 228,778 | | | | 1,127,035 | (b) | | | — | | | | 1,355,813 | | | $ | 1,355,813 | | | $ | 9,029 | | | $ | — | | | $ | — | |
iShares iBoxx $ High Yield Corporate Bond ETF | | | 472 | | | | — | | | | (472 | ) | | | — | | | | — | | | | 334 | | | | (1,178 | ) | | | 270 | |
| | | | | | | | | | | | | | | | | | | | | | | | | | | | | | | | |
| | | | | | | | | | | | | | | | | | $ | 1,355,813 | | | $ | 9,363 | | | $ | (1,178 | ) | | $ | 270 | |
| | | | | | | | | | | | | | | | | | | | | | | | | | | | | | | | |
| | (a) | Includes net capital gains distributions. | |
| | (b) | Represents net shares purchased. | |
For Fund compliance purposes, the Fund’s industry classifications refer to one or more of the industry sub-classifications used by one or more widely recognized market indexes or ratings group indexes, and/or as defined by the investment adviser. These definitions may not apply for purposes of this report, which may combine such industry sub-classifications for reporting ease.
Derivative Financial Instruments Outstanding as of Period End
Futures Contracts
| | | | | | | | | | | | | | | | |
| Description | | Number of
Contracts | | | Expiration
Date | | | Notional
Amount (000) | | | Value/
Unrealized
Appreciation
(Depreciation) | |
Long Contracts | | | | | | | | | | | | | | | | |
U.S. Treasury 2 Year Note | | | 6 | | | | 03/29/19 | | | $ | 1,274 | | | $ | 3,658 | |
U.S. Treasury 5 Year Note | | | 6 | | | | 03/29/19 | | | | 688 | | | | 4,278 | |
| | | | | | | | | | | | | | | | |
| | | | | | | | | | | | | | $ | 7,936 | |
| | | | | | | | | | | | | | | | |
Forward Foreign Currency Exchange Contracts
| | | | | | | | | | | | | | | | | | | | |
Currency
Purchased | | | Currency
Sold | | | Counterparty | | Settlement Date | | | Unrealized
Appreciation
(Depreciation) | |
| EUR | | | 282,000 | | | USD | | | 322,371 | | | Citibank NA | | | 02/05/19 | | | $ | 1,668 | |
| | | | | | | | | | | | | | | | | | | | |
| | |
| 94 | | 2018 BLACKROCK ANNUAL REPORTTO SHAREHOLDERS |
| | |
Schedule of Investments (continued) December 31, 2018 | | BlackRock High Yield Portfolio |
Centrally Cleared Credit Default Swaps — Sell Protection
| | | | | | | | | | | | | | | | | | | | | | | | | | | | | | |
| Reference Obligation/Index | | Financing
Rate Received
by the Fund | | | Payment
Frequency | | | Termination
Date | | | Credit
Rating (a) | | Notional
Amount (000) (b) | | | Value | | | Upfront
Premium
Paid
(Received) | | | Unrealized
Appreciation
(Depreciation) | |
CDX.NA.HY.31.V1 | | | 5.00 | % | | | Quarterly | | | | 12/20/23 | | | B+ | | USD | 269 | | | $ | 5,811 | | | $ | 10,483 | | | $ | (4,672 | ) |
| | | | | | | | | | | | | | | | | | | | | | | | | | | | | | |
| | (a) | Using S&P’s rating of the issuer or the underlying securities of the index, as applicable. | |
| | (b) | The maximum potential amount the Fund may pay should a negative credit event take place as defined under the terms of the agreement. | |
OTC Credit Default Swaps — Sell Protection
| | | | | | | | | | | | | | | | | | | | | | | | | | | | | | | | | | |
| Reference Obligation/Index | | Financing
Rate Received
by the Fund | | | Payment
Frequency | | | Counterparty | | | Termination
Date | | | Credit
Rating (a) | | Notional
Amount (000) (b) | | | Value | | | Upfront
Premium
Paid
(Received) | | | Unrealized
Appreciation
(Depreciation) | |
CenturyLink, Inc. | | | 1.00 | % | | | Quarterly | | | | Barclays Bank plc | | | | 12/20/23 | | | B+ | | USD | 8 | | | $ | (1,272 | ) | | $ | (609 | ) | | $ | (663 | ) |
Chesapeake Energy Corp. | | | 5.00 | | | | Quarterly | | | | Barclays Bank plc | | | | 12/20/23 | | | B- | | USD | 8 | | | | (1,089 | ) | | | 15 | | | | (1,104 | ) |
Chesapeake Energy Corp. | | | 5.00 | | | | Quarterly | | | | Barclays Bank plc | | | | 12/20/23 | | | B- | | USD | 16 | | | | (2,177 | ) | | | 149 | | | | (2,326 | ) |
CenturyLink, Inc. | | | 1.00 | | | | Quarterly | | | | Barclays Bank plc | | | | 06/20/25 | | | B+ | | USD | 6 | | | | (1,305 | ) | | | (1,031 | ) | | | (274 | ) |
| | | | | | | | | | | | | | | | | | | | | | | | | | | | | | | | | | |
| | | | | | | | | | | | | | | | | | | | | | | | $ | (5,843 | ) | | $ | (1,476 | ) | | $ | (4,367 | ) |
| | | | | | | | | | | | | | | | | | | | | | | | | | | | | | | | | | |
| | (a) | Using S&P’s rating of the issuer or the underlying securities of the index, as applicable. | |
| | (b) | The maximum potential amount the Fund may pay should a negative credit event take place as defined under the terms of the agreement. | |
Balances reported in the Statements of Assets and Liabilities for Centrally Cleared Swaps and OTC Swaps
| | | | | | | | | | | | | | | | |
| | | Swap
Premiums
Paid | | | Swap
Premiums
Received | | | Unrealized
Appreciation | | | Unrealized
Depreciation | |
Centrally Cleared Swaps(a) | | $ | 10,483 | | | $ | — | | | $ | — | | | $ | (4,672 | ) |
OTC Swaps | | | 164 | | | | (1,640 | ) | | | — | | | | (4,367 | ) |
| | (a) | Includes cumulative appreciation (depreciation) on centrally cleared swaps, as reported in the Schedule of Investments. Only current day’s variation margin is reported within the Statements of Assets and Liabilities and is net of any previously paid (received) swap premium amounts. | |
Derivative Financial Instruments Categorized by Risk Exposure
As of period end, the fair values of derivative financial instruments located in the Statements of Assets and Liabilities were as follows:
| | | | | | | | | | | | | | | | | | | | | | | | | | | | |
| | | Commodity
Contracts | | | Credit
Contracts | | | Equity
Contracts | | | Foreign
Currency
Exchange
Contracts | | | Interest
Rate
Contracts | | | Other
Contracts | | | Total | |
Assets — Derivative Financial Instruments | | | | | | | | | | | | | | | | | | | | | | | | | | | | |
Futures contracts | | | | | | | | | | | | | | | | | | | | | | | | | | | | |
Net unrealized appreciation(a) | | $ | — | | | $ | — | | | $ | — | | | $ | — | | | $ | 7,936 | | | $ | — | | | $ | 7,936 | |
Forward foreign currency exchange contracts | | | | | | | | | | | | | | | | | | | | | | | | | | | | |
Unrealized appreciation on forward foreign currency exchange contracts | | | — | | | | — | | | | — | | | | 1,668 | | | | — | | | | — | | | | 1,668 | |
Swaps — OTC | | | | | | | | | | | | | | | | | | | | | | | | | | | | |
Unrealized appreciation on OTC swaps; Swap premiums paid | | | — | | | | 164 | | | | — | | | | — | | | | — | | | | — | | | | 164 | |
| | | | | | | | | | | | | | | | | | | | | | | | | | | | |
| | $ | — | | | $ | 164 | | | $ | — | | | $ | 1,668 | | | $ | 7,936 | | | $ | — | | | $ | 9,768 | |
| | | | | | | | | | | | | | | | | | | | | | | | | | | | |
| | | | | | | |
| Liabilities — Derivative Financial Instruments | | | | | | | | | | | | | | | | | | | | | |
Swaps — centrally cleared | | | | | | | | | | | | | | | | | | | | | | | | | | | | |
Net unrealized depreciation(a) | | $ | — | | | $ | 4,672 | | | $ | — | | | $ | — | | | $ | — | | | $ | — | | | $ | 4,672 | |
Swaps — OTC | | | | | | | | | | | | | | | | | | | | | | | | | | | | |
Unrealized depreciation on OTC swaps; Swap premiums received | | | — | | | | 6,007 | | | | — | | | | — | | | | — | | | | — | | | | 6,007 | |
| | | | | | | | | | | | | | | | | | | | | | | | | | | | |
| | $ | — | | | $ | 10,679 | | | $ | — | | | $ | — | | | $ | — | | | $ | — | | | $ | 10,679 | |
| | | | | | | | | | | | | | | | | | | | | | | | | | | | |
| | (a) | Includes cumulative appreciation (depreciation) on futures contracts and centrally cleared swaps, if any, as reported in the Schedule of Investments. Only current day’s variation margin is reported within the Statements of Assets and Liabilities. | |
| | | | |
| SCHEDULES OF INVESTMENTS | | | 95 | |
| | |
Schedule of Investments (continued) December 31, 2018 | | BlackRock High Yield Portfolio |
For the year ended December 31, 2018, the effect of derivative financial instruments in the Statements of Operations were as follows:
| | | | | | | | | | | | | | | | | | | | | | | | | | | | |
| | | Commodity
Contracts | | | Credit
Contracts | | | Equity
Contracts | | | Foreign
Currency
Exchange
Contracts | | | Interest
Rate
Contracts | | | Other
Contracts | | | Total | |
Net Realized Gain (Loss) from: | | | | | | | | | | | | | | | | | | | | | | | | | | | | |
Futures contracts | | $ | — | | | $ | — | | | $ | (820 | ) | | $ | — | | | $ | 7,044 | | | $ | — | | | $ | 6,224 | |
Forward foreign currency exchange contracts | | | — | | | | — | | | | — | | | | (17,312 | ) | | | — | | | | — | | | | (17,312 | ) |
Options purchased(a) | | | — | | | | — | | | | (22,793 | ) | | | — | | | | — | | | | — | | | | (22,793 | ) |
Options written | | | — | | | | — | | | | 10,486 | | | | — | | | | — | | | | — | | | | 10,486 | |
Swaps | | | — | | | | 17,284 | | | | — | | | | — | | | | — | | | | — | | | | 17,284 | |
| | | | | | | | | | | | | | | | | | | | | | | | | | | | |
| | $ | — | | | $ | 17,284 | | | $ | (13,127 | ) | | $ | (17,312 | ) | | $ | 7,044 | | | $ | — | | | $ | (6,111 | ) |
| | | | | | | | | | | | | | | | | | | | | | | | | | | | |
| | | | | | | |
| Net Change in Unrealized Appreciation (Depreciation) on: | | | | | | | | | | | | | | | | | | | | | |
Futures contracts | | $ | — | | | $ | — | | | $ | — | | | $ | — | | | $ | 7,035 | | | $ | — | | | $ | 7,035 | |
Forward foreign currency exchange contracts | | | — | | | | — | | | | — | | | | 3,209 | | | | — | | | | — | | | | 3,209 | |
Swaps | | | — | | | | (8,927 | ) | | | — | | | | — | | | | — | | | | — | | | | (8,927 | ) |
| | | | | | | | | | | | | | | | | | | | | | | | | | | | |
| | $ | — | | | $ | (8,927 | ) | | $ | — | | | $ | 3,209 | | | $ | 7,035 | | | $ | — | | | $ | 1,317 | |
| | | | | | | | | | | | | | | | | | | | | | | | | | | | |
| | (a) | Options purchased are included in net realized gain (loss) from investments — unaffiliated. | |
Average Quarterly Balances of Outstanding Derivative Financial Instruments
| | | | |
Futures contracts: | | | | |
Average notional value of contracts — long | | $ | 490,500 | |
Average notional value of contracts — short | | | 148,013 | |
Forward foreign currency exchange contracts: | | | | |
Average amounts sold — in USD | | | 192,565 | |
Credit default swaps: | | | | |
Average notional value — buy protection | | | 8,253 | |
Average notional value — sell protection | | | 554,875 | |
For more information about the Fund’s investment risks regarding derivative financial instruments, refer to the Notes to Financial Statements.
Derivative Financial Instruments — Offsetting as of Period End
The Fund’s derivative assets and liabilities (by type) were as follows:
| | | | | | | | |
| | | Assets | | | Liabilities | |
Derivative Financial Instruments: | | | | | | | | |
Futures contracts | | $ | 2,343 | | | $ | — | |
Forward foreign currency exchange contracts | | | 1,668 | | | | — | |
Swaps — Centrally cleared | | | 309 | | | | — | |
Swaps — OTC(a) | | | 164 | | | | 6,007 | |
| | | | | | | | |
Total derivative assets and liabilities in the Statements of Assets and Liabilities | | $ | 4,484 | | | $ | 6,007 | |
Derivatives not subject to a Master Netting Agreement or similar agreement (“MNA”) | | | (2,652 | ) | | | — | |
| | | | | | | | |
Total derivative assets and liabilities subject to an MNA | | $ | 1,832 | | | $ | 6,007 | |
| | | | | | | | |
| | (a) | Includes unrealized appreciation (depreciation) on OTC swaps and swap premiums (paid/received) in the Statements of Assets and Liabilities. | |
The following tables present the Fund’s derivative assets and liabilities by counterparty net of amounts available for offset under an MNA and net of the related collateral received and pledged by the Fund:
| | | | | | | | | | | | | | | | | | | | |
| Counterparty | | Derivative
Assets
Subject to
an MNA by
Counterparty | | | Derivatives
Available
for Offset (a) | | | Non-cash
Collateral
Received | | | Cash
Collateral
Received | | | Net Amount
of Derivative
Assets (b) | |
Citibank NA | | $ | 1,668 | | | $ | — | | | $ | — | | | $ | — | | | $ | 1,668 | |
Barclays Bank plc | | | 164 | | | | (164 | ) | | | — | | | | — | | | | — | |
| | | | | | | | | | | | | | | | | | | | |
| | $ | 1,832 | | | $ | (164 | ) | | $ | — | | | $ | — | | | $ | 1,668 | |
| | | | | | | | | | | | | | | | | | | | |
| | | | | | | | | | | | | | | | | | | | |
| | |
| 96 | | 2018 BLACKROCK ANNUAL REPORTTO SHAREHOLDERS |
| | |
Schedule of Investments (continued) December 31, 2018 | | BlackRock High Yield Portfolio |
| | | | | | | | | | | | | | | | | | | | |
| Counterparty | | Derivative
Liabilities
Subject to
an MNA by
Counterparty | | | Derivatives
Available
for Offset (a) | | | Non-cash
Collateral
Pledged | | | Cash
Collateral
Pledged | | | Net Amount
of Derivative
Liabilities (c) | |
Barclays Bank plc | | $ | 6,007 | | | $ | (164 | ) | | $ | — | | | $ | — | | | $ | 5,843 | |
| | | | | | | | | | | | | | | | | | | | |
| | (a) | The amount of derivatives available for offset is limited to the amount of derivative assets and/or liabilities that are subject to an MNA. | |
| | (b) | Net amount represents the net amount receivable from the counterparty in the event of default. | |
| | (c) | Net amount represents the net amount payable due to the counterparty in the event of default. | |
Fair Value Hierarchy as of Period End
Various inputs are used in determining the fair value of investments and derivative financial instruments. For information about the Fund’s policy regarding valuation of investments and derivative financial instruments, refer to the Notes to Financial Statements.
The following tables summarize the Fund’s investments and derivative financial instruments categorized in the disclosure hierarchy:
| | | | | | | | | | | | | | | | |
| | | Level 1 | | | Level 2 | | | Level 3 | | | Total | |
Assets: | | | | | | | | | | | | | | | | |
Investments: | | | | | | | | | | | | | | | | |
Long-Term Investments: | | | | | | | | | | | | | | | | |
Common Stocks(a) | | $ | 342,768 | | | $ | — | | | $ | — | | | $ | 342,768 | |
Corporate Bonds(a) | | | — | | | | 20,632,410 | | | | — | | | | 20,632,410 | |
Floating Rate Loan Interests: | | | | | | | | | | | | | | | | |
Aerospace & Defense | | | — | | | | 18,740 | | | | 17,595 | | | | 36,335 | |
Auto Components | | | — | | | | — | | | | 7,140 | | | | 7,140 | |
Chemicals | | | — | | | | 141,391 | | | | 246,329 | | | | 387,720 | |
Commercial Services & Supplies | | | — | | | | 210,042 | | | | — | | | | 210,042 | |
Construction & Engineering | | | — | | | | 34,347 | | | | 37,576 | | | | 71,923 | |
Diversified Consumer Services | | | — | | | | 24,742 | | | | — | | | | 24,742 | |
Diversified Financial Services | | | — | | | | 17,947 | | | | — | | | | 17,947 | |
Diversified Telecommunication Services | | | — | | | | 159,106 | | | | — | | | | 159,106 | |
Electric Utilities | | | — | | | | 15,268 | | | | — | | | | 15,268 | |
Energy Equipment & Services | | | — | | | | 150,926 | | | | 112,774 | | | | 263,700 | |
Food Products | | | — | | | | 25,586 | | | | — | | | | 25,586 | |
Gas Utilities | | | — | | | | 25,116 | | | | — | | | | 25,116 | |
Health Care Equipment & Supplies | | | — | | | | 153,980 | | | | 8,685 | | | | 162,665 | |
Health Care Providers & Services | | | — | | | | 210,258 | | | | 37,944 | | | | 248,202 | |
Health Care Technology | | | — | | | | 38,360 | | | | — | | | | 38,360 | |
Hotels, Restaurants & Leisure | | | — | | | | 221,560 | | | | — | | | | 221,560 | |
Household Products | | | — | | | | 4,819 | | | | — | | | | 4,819 | |
Industrial Conglomerates | | | — | | | | 78,641 | | | | 49,434 | | | | 128,075 | |
Insurance | | | — | | | | 136,344 | | | | — | | | | 136,344 | |
IT Services | | | — | | | | 296,164 | | | | 2,575 | | | | 298,739 | |
Life Sciences Tools & Services | | | — | | | | 8,363 | | | | — | | | | 8,363 | |
Machinery | | | — | | | | 84,648 | | | | — | | | | 84,648 | |
Media | | | — | | | | 342,101 | | | | 27,373 | | | | 369,474 | |
Multiline Retail | | | — | | | | 23,945 | | | | — | | | | 23,945 | |
Multi-Utilities | | | — | | | | 8,341 | | | | — | | | | 8,341 | |
Oil, Gas & Consumable Fuels | | | — | | | | 181,148 | | | | — | | | | 181,148 | |
Pharmaceuticals | | | — | | | | 116,549 | | | | — | | | | 116,549 | |
Real Estate Management & Development | | | — | | | | 8,760 | | | | — | | | | 8,760 | |
Software | | | — | | | | 386,556 | | | | 8,505 | | | | 395,061 | |
Specialty Retail | | | — | | | | — | | | | 12,259 | | | | 12,259 | |
Trading Companies & Distributors | | | — | | | | 13,186 | | | | — | | | | 13,186 | |
Wireless Telecommunication Services | | | — | | | | 294,361 | | | | — | | | | 294,361 | |
Preferred Securities: | | | | | | | | | | | | | | | | |
Banks | | | 219,937 | | | | 445,583 | | | | — | | | | 665,520 | |
Capital Markets | | | — | | | | 43,009 | | | | — | | | | 43,009 | |
Short-Term Securities | | | 1,407,947 | | | | — | | | | — | | | | 1,407,947 | |
Liabilities: | | | | | | | | | | | | | | | | |
Unfunded Floating Rate Loan Interests(b) | | | — | | | | (42 | ) | | | (32 | ) | | | (74 | ) |
| | | | | | | | | | | | | | | | |
Total Investments | | $ | 1,970,652 | | | $ | 24,552,255 | | | $ | 568,157 | | | $ | 27,091,064 | |
| | | | | | | | | | | | | | | | |
Derivative Financial Instruments(c) | | | | | | | | | | | | | | | | |
| | | | |
| SCHEDULES OF INVESTMENTS | | | 97 | |
| | |
Schedule of Investments (continued) December 31, 2018 | | BlackRock High Yield Portfolio |
| | | | | | | | | | | | | | | | |
| | | Level 1 | | | Level 2 | | | Level 3 | | | Total | |
Assets: | | | | | | | | | | | | | | | | |
Foreign currency exchange contracts | | $ | — | | | $ | 1,668 | | | $ | — | | | $ | 1,668 | |
Interest rate contracts | | | 7,936 | | | | — | | | | — | | | | 7,936 | |
Liabilities: | | | | | | | | | | | | | | | | |
Credit contracts | | | — | | | | (9,039 | ) | | | — | | | | (9,039 | ) |
| | | | | | | | | | | | | | | | |
| | $ | 7,936 | | | $ | (7,371 | ) | | $ | — | | | $ | 565 | |
| | | | | | | | | | | | | | | | |
| | (a) | See above Schedule of Investments for values in each industry. | |
| | (b) | Unfunded floating rate loan interests are valued at the unrealized appreciation (depreciation) on the commitment. | |
| | (c) | Derivative financial instruments are swaps, futures contracts and foreign currency exchange contracts. Swaps, futures contracts and foreign currency exchange contracts are valued at the unrealized appreciation (depreciation) on the instrument. | |
During the year ended December 31, 2018, there were no transfers between Level 1 and Level 2.
A reconciliation of Level 3 investments is presented when the Fund had a significant amount of Level 3 investments at the beginning and/or end of the period in relation to net assets. The following table is a reconciliation of Level 3 investments for which significant unobservable inputs were used in determining fair value:
| | | | | | | | | | | | | | | | |
| | | Corporate
Bonds | | | Floating Rate
Loan Interests | | | Unfunded
Floating Rate
Loan Interests | | | Total | |
Investments: | | | | | | | | | | | | | | | | |
Assets: | | | | | | | | | | | | | | | | |
Opening Balance, as of December 31, 2017 | | $ | 148,500 | | | $ | 317,239 | | | $ | 6 | | | $ | 465,745 | |
Transfers into Level 3 | | | — | | | | 64,102 | | | | — | | | | 64,102 | |
Transfers out of Level 3 | | | — | | | | (9,090 | ) | | | — | | | | (9,090 | ) |
Accrued discounts/premiums | | | — | | | | 1,283 | | | | — | | | | 1,283 | |
Net realized gain (loss) | | | 3,910 | | | | 665 | | | | — | | | | 4,575 | |
Net change in unrealized appreciation (depreciation)(a)(b) | | | 1,500 | | | | (19,708 | ) | | | (38 | ) | | | (18,246 | ) |
Purchases | | | — | | | | 407,923 | | | | — | | | | 407,923 | |
Sales | | | (153,910 | ) | | | (194,225 | ) | | | — | | | | (348,135 | ) |
| | | | | | | | | | | | | | | | |
Closing Balance, as of December 31, 2018 | | $ | — | | | $ | 568,189 | | | $ | (32 | ) | | $ | 568,157 | |
| | | | | | | | | | | | | | | | |
Net change in unrealized appreciation (depreciation) on investments still held at December 31, 2018(b) | | $ | — | | | $ | (20,332 | ) | | $ | (38 | ) | | $ | (20,364 | ) |
| | | | | | | | | | | | | | | | |
| | (a) | Included in the related net change in unrealized appreciation (depreciation) in the Statements of Operations. | |
| | (b) | Any difference between net change in unrealized appreciation (depreciation) and net change in unrealized appreciation (depreciation) on investments still held at December 31, 2018 is generally due to investments no longer held or categorized as Level 3 at period end. | |
The Fund’s investments that are categorized as Level 3 were valued utilizing third party pricing information without adjustment. Such valuations are based on unobservable inputs. A significant change in third party information could result in a significantly lower or higher value of such Level 3 investments.
See notes to financial statements.
| | |
| 98 | | 2018 BLACKROCK ANNUAL REPORTTO SHAREHOLDERS |
| | |
Schedule of Investments December 31, 2018 | | BlackRock U.S. Government Bond Portfolio (Percentages shown are based on Net Assets) |
| | | | | | | | | | | | |
| Security | | | | | Par
(000) | | | Value | |
Asset-Backed Securities — 2.2%(a) | |
Arbor Realty Commercial Real Estate Notes Ltd., Series 2016-FL1A, Class A, (LIBOR USD 1 Month + 1.70%), 4.16%, 09/15/26(b) | | | USD | | | | 170 | | | $ | 171,886 | |
BSPRT Issuer Ltd., Series2017-FL1, Class A, (LIBOR USD 1 Month + 1.35%), 3.81%, 06/15/27(b) | | | | | | | 37 | | | | 36,946 | |
Dryden XXVIII Senior Loan Fund, Series2013-28A, Class A1LR, (LIBOR USD 3 Month + 1.20%), 3.81%, 08/15/30(b) | | | | | | | 500 | | | | 495,171 | |
Progress Residential Trust, Series 2017-SFR1, Class A, 2.77%, 08/17/34 | | | | | | | 100 | | | | 97,786 | |
RomarkWM-R Ltd., Series2018-1A, Class A1, (LIBOR USD 3 Month + 1.03%), 3.50%, 04/20/31(b) | | | | | | | 400 | | | | 393,354 | |
| | | | | | | | | | | | |
| |
Total Asset-Backed Securities — 2.2%
(Cost: $1,206,596) | | | | 1,195,143 | |
| | | | | | | | | | | | |
|
Foreign Government Obligations — 0.1% | |
|
| Colombia — 0.0% | |
Republic of Colombia: | | | | | | | | | | | | |
7.50%, 08/26/26 | | | COP | | | | 70,000 | | | | 22,688 | |
7.00%, 06/30/32 | | | | | | | 51,000 | | | | 15,462 | |
| | | | | | | | | | | | |
| | | | | | | | | | | 38,150 | |
|
| Mexico — 0.1% | |
United Mexican States, 8.50%, 11/18/38 | | | MXN | | | | 10 | | | | 48,917 | |
| | | | | | | | | | | | |
| |
Total Foreign Government Obligations — 0.1%
(Cost: $85,830) | | | | 87,067 | |
| | | | | | | | | | | | |
|
Non-Agency Mortgage-Backed Securities — 2.2% | |
|
| Collateralized Mortgage Obligations — 0.5% | |
Seasoned Credit Risk Transfer Trust: | | | | | | | | | | | | |
Series2018-2, Class MA, 3.50%, 11/25/57 | | | USD | | | | 123 | | | | 123,787 | |
Series2018-3, Class MA, 3.50%, 08/25/57 | | | | | | | 156 | | | | 156,298 | |
| | | | | | | | | | | | |
| | | | | | | | | | | 280,085 | |
|
| Commercial Mortgage-Backed Securities — 1.3%(a) | |
AREIT Trust, Series 2018-CRE1, Class A, 3.29%, 02/14/35(c)(d) | | | | | | | 106 | | | | 106,104 | |
Commercial Mortgage Trust, Series 2017-PANW, Class A, 3.24%, 10/10/29 | | | | | | | 350 | | | | 343,813 | |
CSMC Trust, Series2016-MFF, Class A, 4.06%, 11/15/33(c) | | | | | | | 69 | | | | 69,507 | |
LMREC, Inc., Series 2016-CRE2, Class A, 4.20%, 11/24/31(c) | | | | | | | 94 | | | | 93,949 | |
RAIT Trust, Series2017-FL7, Class A, 3.41%, 06/15/37(c) | | | | | | | 98 | | | | 97,523 | |
| | | | | | | | | | | | |
| | | | 710,896 | |
|
| Interest Only Commercial Mortgage-Backed Securities — 0.4%(c) | |
CFCRE Commercial Mortgage Trust, Series2016-C4, Class XA, 1.73%, 05/10/58 | | | | | | | 619 | | | | 58,283 | |
Core Industrial Trust(a): | | | | | | | | | | | | |
Series 2015-TEXW, Class XA, 0.77%, 02/10/34 | | | | | | | 2,580 | | | | 52,714 | |
Series 2015-WEST, Class XA, 0.93%, 02/10/37 | | | | | | | 1,276 | | | | 64,662 | |
| | | | | | | | | | | | |
| | | | | | | | | | | 175,659 | |
| | | | | | | | | | | | |
| |
TotalNon-Agency Mortgage-Backed Securities — 2.2%
(Cost: $1,182,088) | | | | 1,166,640 | |
| | | | | | | | | | | | |
| | | | | | | | | | | | |
| Security | | | | | Par
(000) | | | Value | |
|
U.S. Government Sponsored Agency Securities — 88.3% | |
|
| Agency Obligations — 10.0% | |
Federal Home Loan Bank, 4.00%, 04/10/28 | | | USD | | | | 400 | | | $ | 424,856 | |
Federal Home Loan Bank Discount Notes, 2.39%, 01/25/19(e) | | | | | | | 5,000 | | | | 4,992,395 | |
| | | | | | | | | | | | |
| | | | 5,417,251 | |
|
| Collateralized Mortgage Obligations — 1.7% | |
Federal National Mortgage Association: | | | | | | | | | | | | |
Series2011-8, Class ZA, 4.00%, 02/25/41 | | | | | | | 256 | | | | 264,204 | |
Series2017-69, Class HA, 3.00%, 06/25/46 | | | | | | | 522 | | | | 518,927 | |
Government National Mortgage Association Variable Rate Notes, Series2014-107, Class WX, 6.81%, 07/20/39(f) | | | | | | | 121 | | | | 133,976 | |
| | | | | | | | | | | | |
| | | | 917,107 | |
|
| Commercial Mortgage-Backed Securities — 1.5% | |
Federal Home Loan Mortgage Corp.: | | | | | | | | | | | | |
Series K076, Class A2, 3.90%, 06/25/51 | | | | | | | 140 | | | | 146,057 | |
Series K079, Class A2, 3.93%, 06/25/28 | | | | | | | 260 | | | | 271,680 | |
Federal Home Loan Mortgage Corp. Variable Rate Notes(f): | | | | | | | | | | | | |
Series K082, Class A2, 3.92%, 09/25/28 | | | | | | | 40 | | | | 41,756 | |
Series K086, Class A2, 3.86%, 11/25/28 | | | | | | | 265 | | | | 275,364 | |
Federal National Mortgage Association ACES Variable Rate Notes, Series2018-M7, Class A2, 3.05%, 03/25/28(f) | | | | | | | 60 | | | | 58,374 | |
| | | | | | | | | | | | |
| | | | 793,231 | |
|
| Interest Only Commercial Mortgage-Backed Securities — 2.7% | |
Federal Home Loan Mortgage Corp., Series 2015-K718, Class X2A, 0.10%, 02/25/48(a)(f) | | | | | | | 17,915 | | | | 43,343 | |
Federal National Mortgage Association ACES Variable Rate Notes(f): | | | | | | | | | | | | |
Series2015-M1, Class X2, 0.55%, 09/25/24 | | | | | | | 5,807 | | | | 145,803 | |
Series2016-M4, Class X2, 2.63%, 01/25/39 | | | | | | | 308 | | | | 27,642 | |
Government National Mortgage Association Variable Rate Notes: | | | | | | | | | | | | |
Series2002-83, 0.00%, 10/16/42(f) | | | | | | | 450 | | | | 1 | |
Series2003-17, 0.00%, 03/16/43(f) | | | | | | | 897 | | | | — | |
Series2003-109, 0.00%, 11/16/43(f) | | | | | | | 879 | | | | 167 | |
Series2016-22, 0.77%, 11/16/55(f) | | | | | | | 2,135 | | | | 114,050 | |
Series2016-45, 1.01%, 02/16/58(f) | | | | | | | 3,219 | | | | 242,313 | |
Series2016-113, (LIBOR 1 Month + 0.00%), 1.19%, 02/16/58(b) | | | | | | | 1,421 | | | | 129,033 | |
Series2016-119, (LIBOR 1 Month + 0.00%), 1.12%, 04/16/58(b) | | | | | | | 3,408 | | | | 282,366 | |
Series2017-30, 0.76%, 08/16/58(f) | | | | | | | 621 | | | | 40,322 | |
Series2017-44, 0.70%, 04/17/51(f) | | | | | | | 619 | | | | 36,617 | |
Series2017-53, 0.69%, 11/16/56(f) | | | | | | | 3,883 | | | | 230,116 | |
Series2017-54, 0.65%, 12/16/58(f) | | | | | | | 148 | | | | 9,098 | |
Series2017-61, 0.77%, 05/16/59(f) | | | | | | | 422 | | | | 31,523 | |
Series2017-64, 0.72%, 11/16/57(f) | | | | | | | 769 | | | | 51,122 | |
Series2017-72, 0.68%, 04/16/57(f) | | | | | | | 1,096 | | | | 69,850 | |
| | | | | | | | | | | | |
| | | | | | | | | | | 1,453,366 | |
| | | |
| Mortgage-Backed Securities — 72.4% | | | | | | | | | |
Federal Home Loan Mortgage Corp.: | | | | | | | | | | | | |
2.50%, 03/01/30 - 04/01/31 | | | | | | | 209 | | | | 204,224 | |
2.50%, 01/15/34(g) | | | | | | | 196 | | | | 191,307 | |
3.00%, 09/01/27 - 12/01/46 | | | | | | | 528 | | | | 521,376 | |
3.00%, 01/15/34 - 01/15/49(g) | | | | | | | 1,199 | | | | 1,172,937 | |
3.50%, 04/01/31 - 01/01/48 | | | | | | | 2,738 | | | | 2,755,467 | |
3.50%, 01/15/49(g) | | | | | | | 9 | | | | 8,995 | |
4.00%, 01/15/34 - 01/15/49(g) | | | | | | | 473 | | | | 482,408 | |
| | | | |
| SCHEDULES OF INVESTMENTS | | | 99 | |
| | |
Schedule of Investments (continued) December 31, 2018 | | BlackRock U.S. Government Bond Portfolio (Percentages shown are based on Net Assets) |
| | | | | | | | | | | | |
| Security | | | | | Par
(000) | | | Value | |
| | | |
| Mortgage-Backed Securities (continued) | | | | | | | | | |
4.00%, 08/01/40 - 06/01/48 | | | USD | | | | 872 | | | $ | 896,476 | |
4.50%, 02/01/39 - 08/01/48 | | | | | | | 454 | | | | 475,123 | |
4.50%, 01/15/49(g) | | | | | | | 150 | | | | 155,264 | |
5.00%, 11/01/41 | | | | | | | 119 | | | | 126,484 | |
5.00%, 01/15/4 9(g) | | | | | | | 21 | | | | 21,992 | |
5.50%, 06/01/41 | | | | | | | 108 | | | | 116,087 | |
8.00%, 03/01/30 - 06/01/31 | | | | | | | 13 | | | | 13,836 | |
Federal National Mortgage Association: | | | | | | | | | | | | |
2.00%, 10/01/31 - 03/01/32 | | | | | | | 128 | | | | 122,454 | |
2.50%, 04/01/30 - 02/01/33 | | | | | | | 724 | | | | 708,312 | |
3.00%, 04/01/29 - 03/01/47 | | | | | | | 4,551 | | | | 4,496,122 | |
3.00%, 01/25/34 - 01/25/49(g) | | | | | | | 1,527 | | | | 1,509,660 | |
3.50%, 04/01/29 - 01/01/48 | | | | | | | 3,154 | | | | 3,176,476 | |
3.50%, 01/25/34 - 01/25/49(g) | | | | | | | 928 | | | | 928,970 | |
4.00%, 09/01/33 - 04/01/48 | | | | | | | 3,980 | | | | 4,090,724 | |
4.00%, 01/25/49(g) | | | | | | | 575 | | | | 586,141 | |
4.50%, 06/01/26 - 12/01/48 | | | | | | | 1,776 | | | | 1,861,358 | |
4.50%, 01/25/49 - 02/25/49(g) | | | | | | | 1,671 | | | | 1,729,457 | |
5.00%, 02/01/35 - 12/01/43 | | | | | | | 249 | | | | 263,334 | |
5.00%, 01/25/49(g) | | | | | | | 1,294 | | | | 1,355,364 | |
5.50%, 11/01/21 - 09/01/39 | | | | | | | 325 | | | | 345,718 | |
6.00%, 04/01/35 - 09/01/40 | | | | | | | 225 | | | | 245,655 | |
6.50%, 05/01/40 | | | | | | | 48 | | | | 54,352 | |
Government National Mortgage Association: | | | | | | | | | | | | |
3.00%, 02/15/45 - 12/20/46 | | | | | | | 1,689 | | | | 1,666,301 | |
3.00%, 01/15/49(g) | | | | | | | 315 | | | | 310,195 | |
3.50%, 01/15/42 - 10/20/46 | | | | | | | 2,923 | | | | 2,945,753 | |
3.50%, 01/15/49(g) | | | | | | | 605 | | | | 608,734 | |
4.00%, 10/20/40 - 01/15/48 | | | | | | | 442 | | | | 454,890 | |
4.00%, 01/15/49(g) | | | | | | | 2,382 | | | | 2,438,945 | |
4.50%, 12/20/39 - 09/20/48 | | | | | | | 996 | | | | 1,041,519 | |
4.50%, 01/15/49(g) | | | | | | | 689 | | | | 712,940 | |
5.00%, 07/15/39 - 07/20/44 | | | | | | | 84 | | | | 88,521 | |
5.00%, 01/15/49(g) | | | | | | | 161 | | | | 167,560 | |
| | | | | | | | | | | | |
| | | | | | | | | | | 39,051,431 | |
| | | | | | | | | | | | |
| |
Total U.S. Government Sponsored Agency Securities — 88.3%
(Cost: $47,887,125) | | | | 47,632,386 | |
| | | | | | | | | | | | |
|
U.S. Treasury Obligations — 50.8% | |
U.S. Treasury Bonds: | |
4.25%, 05/15/39 | | | | | | | 190 | | | | 229,210 | |
4.50%, 08/15/39 | | | | | | | 184 | | | | 229,296 | |
4.38%, 11/15/39 | | | | | | | 185 | | | | 226,813 | |
3.13%, 02/15/43 | | | | | | | 720 | | | | 734,428 | |
2.88%, 05/15/43 - 11/15/46 | | | | | | | 929 | | | | 906,130 | |
3.63%, 08/15/43 | | | | | | | 687 | | | | 760,450 | |
3.75%, 11/15/43 | | | | | | | 729 | | | | 823,343 | |
3.00%, 02/15/47 - 08/15/48 | | | | | | | 1,126 | | | | 1,120,928 | |
U.S. Treasury Inflation Linked Notes, 0.63%, 04/15/23 | | | | | | | 611 | | | | 600,705 | |
U.S. Treasury Notes: | | | | | | | | | | | | |
1.25%, 08/31/19 | | | | | | | 1,846 | | | | 1,829,343 | |
1.00%, 10/15/19(h) | | | | | | | 1,846 | | | | 1,822,709 | |
1.63%, 06/30/20 - 07/31/20(h) | | | | | | | 2,308 | | | | 2,276,040 | |
2.63%, 08/31/20(h) | | | | | | | 2,520 | | | | 2,523,347 | |
1.13%, 06/30/21(h) | | | | | | | 1,293 | | | | 1,251,432 | |
2.25%, 07/31/21(h) | | | | | | | 1,293 | | | | 1,285,828 | |
2.75%, 09/15/21 - 08/31/25 | | | | | | | 1,225 | | | | 1,236,794 | |
2.13%, 09/30/21(h) | | | | | | | 1,293 | | | | 1,280,727 | |
1.88%, 04/30/22 | | | | | | | 1,293 | | | | 1,268,251 | |
1.63%, 10/31/23 | | | | | | | 1,016 | | | | 975,161 | |
2.25%, 01/31/24 - 02/15/27 | | | | | | | 2,226 | | | | 2,180,907 | |
2.00%, 04/30/24 - 05/31/24(h) | | | | | | | 2,216 | | | | 2,156,791 | |
2.00%, 08/15/25 - 11/15/26 | | | | | | | 1,226 | | | | 1,174,689 | |
| | | | | | | | | | | | |
| Security | | | | | Par
(000) | | | Value | |
| | | |
| U.S. Treasury Obligations (continued) | | | | | | | | | |
2.88%, 08/15/28 | | | USD | | | | 495 | | | $ | 502,657 | |
| | | | | | | | | | | | |
| |
Total U.S. Treasury Obligations — 50.8%
(Cost: $27,432,151) | | | | 27,395,979 | |
| | | | | | | | | | | | |
| |
Total Long-Term Investments — 143.6%
(Cost: $77,793,790) | | | | 77,477,215 | |
| | | | | | | | | | | | |
|
Short-Term Securities — 3.9% | |
|
Commercial Paper — 0.9% | |
Macquarie Bank Ltd., 3.27%, 10/11/19(e) | | | | | | | 500 | | | | 488,013 | |
| | | | | | | | | | | | |
| |
Total Commercial Paper — 0.9%
(Cost: $487,501) | | | | 488,013 | |
| | | | | | | | | | | | |
| | | |
| | | | | | Shares | | | | |
|
Money Market Funds — 3.0% | |
BlackRock Liquidity Funds,T-Fund, Institutional Class, 2.32%(i)(j) | | | | | | | 1,608,196 | | | | 1,608,196 | |
| | | | | | | | | | | | |
| |
Total Money Market Funds — 3.0%
(Cost: $1,608,196) | | | | 1,608,196 | |
| | | | | |
| |
Total Short-Term Securities — 3.9%
(Cost: $2,095,697) | | | | 2,096,209 | |
| | | | | | | | | | | | |
| |
Total Options Purchased — 0.3%
(Cost: $94,075) | | | | 137,265 | |
| | | | | |
| |
Total Investments Before Options Written and TBA Sale
Commitments — 147.8%
(Cost: $79,983,562) | | | | 79,710,689 | |
| | | | | |
| |
Total Options Written — (0.2)%
(Premium Received — $47,816) | | | | (114,015 | ) |
| | | | | |
| | | |
| | | | | | Par (000) | | | | |
|
TBA Sale Commitments — (28.0)%(g) | |
| | | |
| Mortgage-Backed Securities — (28.0)% | | | | | | | | | |
Federal Home Loan Mortgage Corp.: | |
2.50%, 01/15/34 | | | USD | | | | 14 | | | | (13,665 | ) |
3.00%, 01/15/34 - 01/15/49 | | | | | | | 50 | | | | (49,141 | ) |
3.50%, 01/15/34 - 01/15/49 | | | | | | | 1,249 | | | | (1,248,948 | ) |
4.00%, 01/15/49 | | | | | | | 4 | | | | (4,077 | ) |
4.50%, 01/15/49 | | | | | | | 106 | | | | (109,720 | ) |
Federal National Mortgage Association: | |
2.00%, 01/25/34 | | | | | | | 139 | | | | (133,030 | ) |
2.50%, 01/25/34 | | | | | | | 112 | | | | (109,182 | ) |
3.00%, 01/25/49 - 02/25/49 | | | | | | | 1,343 | | | | (1,308,419 | ) |
3.50%, 01/25/34 - 02/25/49 | | | | | | | 5,030 | | | | (5,031,815 | ) |
4.00%, 01/25/34 - 01/25/49 | | | | | | | 2,366 | | | | (2,412,862 | ) |
4.50%, 01/25/49 | | | | | | | 1,664 | | | | (1,723,053 | ) |
5.50%, 01/25/49 | | | | | | | 74 | | | | (78,301 | ) |
6.00%, 01/25/49 | | | | | | | 69 | | | | (74,100 | ) |
Government National Mortgage Association: | |
3.00%, 01/15/49 - 02/15/49 | | | | | | | 803 | | | | (790,068 | ) |
3.50%, 01/15/49 - 02/15/49 | | | | | | | 1,302 | | | | (1,309,944 | ) |
4.00%, 01/15/49 | | | | | | | 665 | | | | (680,898 | ) |
| | | | | | | | | | | | |
| |
Total TBA Sale Commitments — (28.0)%
(Proceeds: $14,894,774) | | | | (15,077,223 | ) |
| | | | | |
| |
Total Investments Net of Options Written and
TBA Sale Commitments — 119.6%
(Cost: $65,040,972) | | | | 64,519,451 | |
| |
Liabilities in Excess of Other Assets — (19.6)% | | | | (10,578,353 | ) |
| | | | | |
| |
Net Assets — 100.0% | | | $ | 53,941,098 | |
| | | | | |
| | |
| 100 | | 2018 BLACKROCK ANNUAL REPORTTO SHAREHOLDERS |
| | |
Schedule of Investments (continued) December 31, 2018 | | BlackRock U.S. Government Bond Portfolio (Percentages shown are based on Net Assets) |
| (a) | Security exempt from registration pursuant to Rule 144A under the Securities Act of 1933, as amended. These securities may be resold in transactions exempt from registration to qualified institutional investors. |
| (b) | Variable rate security. Security may be issued at a fixed coupon rate, which converts to a variable rate at a specified date. Rate shown is the rate in effect as of period end. |
| (c) | Variable or floating rate security, which interest rate adjusts periodically based on changes in current interest rates and prepayments on the underlying pool of assets. Rate shown is the rate in effect as of period end. |
| (d) | Security is valued using significant unobservable inputs and is classified as Level 3 in the fair value hierarchy. |
| (e) | Rates are discount rates or a range of discount rates as of period end. |
| (f) | Variable rate security. Rate shown is the rate in effect as of period end. |
| (g) | Represents or includes a TBA transaction. |
| (h) | All or a portion of the securities has been pledged as collateral in connection with outstanding reverse repurchase agreements. |
| (i) | Annualized7-day yield as of period end. |
| (j) | During the year ended December 31, 2018, investments in issuers considered to be an affiliate of the Fund for purposes of Section 2(a)(3) of the Investment Company Act of 1940, as amended, were as follows: |
| | | | | | | | | | | | | | | | | | | | | | | | | | | | |
| Affiliate | | Shares
Held at
12/31/17 | | | Net
Activity | | | Shares
Held at
12/31/18 | | | Value at
12/31/18 | | | Income | | | Net
Realized
Gain (Loss)(a) | | | Change in
Unrealized
Appreciation
(Depreciation) | |
BlackRock Liquidity Funds,T-Fund, Institutional Class | | | 1,681,021 | | | | (72,825 | ) | | | 1,608,196 | | | $ | 1,608,196 | | | $ | 30,122 | | | $ | — | | | $ | — | |
| | | | | | | | | | | | | | | | | | | | | | | | | | | | |
| | (a) | Includes net capital gain distributions, if applicable. | |
Reverse Repurchase Agreements
| | | | | | | | | | | | | | | | | | | | | | | | |
| Counterparty | | Interest
Rate | | | Trade
Date | | | Maturity
Date | | | Face Value | | | Face Value
Including
Accrued Interest | | | Type of Non-Cash Underlying Collateral | | Remaining Contractual
Maturity of the Agreements |
BNP Paribas SA | | | 3.12 | % | | | 12/31/18 | | | | 01/02/19 | | | $ | 2,545,200 | | | $ | 2,545,421 | | | U.S. Treasury Obligations | | Overnight |
Merrill Lynch, Pierce, Fenner & Smith, Inc. | | | 3.20 | % | | | 12/31/18 | | | | 01/02/19 | | | | 1,077,530 | | | | 1,077,626 | | | U.S. Treasury Obligations | | Overnight |
Merrill Lynch, Pierce, Fenner & Smith, Inc. | | | 3.20 | % | | | 12/31/18 | | | | 01/02/19 | | | | 1,249,361 | | | | 1,249,472 | | | U.S. Treasury Obligations | | Overnight |
Merrill Lynch, Pierce, Fenner & Smith, Inc. | | | 3.20 | % | | | 12/31/18 | | | | 01/02/19 | | | | 1,138,132 | | | | 1,138,233 | | | U.S. Treasury Obligations | | Overnight |
Merrill Lynch, Pierce, Fenner & Smith, Inc. | | | 3.20 | % | | | 12/31/18 | | | | 01/02/19 | | | | 1,080,300 | | | | 1,080,396 | | | U.S. Treasury Obligations | | Overnight |
Merrill Lynch, Pierce, Fenner & Smith, Inc. | | | 3.20 | % | | | 12/31/18 | | | | 01/02/19 | | | | 1,296,233 | | | | 1,296,348 | | | U.S. Treasury Obligations | | Overnight |
Merrill Lynch, Pierce, Fenner & Smith, Inc. | | | 3.20 | % | | | 12/31/18 | | | | 01/02/19 | | | | 1,827,540 | | | | 1,827,702 | | | U.S. Treasury Obligations | | Overnight |
Merrill Lynch, Pierce, Fenner & Smith, Inc. | | | 3.20 | % | | | 12/31/18 | | | | 01/02/19 | | | | 1,286,535 | | | | 1,286,649 | | | U.S. Treasury Obligations | | Overnight |
Merrill Lynch, Pierce, Fenner & Smith, Inc. | | | 3.20 | % | | | 12/31/18 | | | | 01/02/19 | | | | 1,145,345 | | | | 1,145,447 | | | U.S. Treasury Obligations | | Overnight |
| | | | | | | | | | | | | | | | | | | | | | | | |
| | | | | | | | | | | | | | $ | 12,646,176 | | | $ | 12,647,294 | | | | | |
| | | | | | | | | | | | | | | | | | | | | | | | |
Derivative Financial Instruments Outstanding as of Period End
Futures Contracts
| | | | | | | | | | | | | | | | |
| Description | | Number of
Contracts | | | Expiration
Date | | | Notional
Amount (000) | | | Value/
Unrealized
Appreciation
(Depreciation) | |
Long Contracts | | | | | | | | | | | | | | | | |
U.S. Treasury 10 Year Ultra Bond | | | 2 | | | | 03/20/19 | | | $ | 260 | | | $ | 1,761 | |
U.S. Treasury Long Bond | | | 8 | | | | 03/20/19 | | | | 1,168 | | | | 20,315 | |
U.S. Treasury 2 Year Note | | | 60 | | | | 03/29/19 | | | | 12,739 | | | | 71,026 | |
U.S. Treasury 5 Year Note | | | 38 | | | | 03/29/19 | | | | 4,358 | | | | 28,103 | |
| | | | | | | | | | | | | | | | |
| | | | | | | | | | | | | | | 121,205 | |
| | | | | | | | | | | | | | | | |
| | | | |
| SCHEDULES OF INVESTMENTS | | | 101 | |
| | |
Schedule of Investments (continued) December 31, 2018 | | BlackRock U.S. Government Bond Portfolio |
| | | | | | | | | | | | | | | | |
| Description | | Number of
Contracts | | | Expiration
Date | | | Notional
Amount (000) | | | Value/
Unrealized
Appreciation
(Depreciation) | |
Short Contracts | | | | | | | | | | | | | | | | |
Euro-Bund | | | 4 | | | | 03/07/19 | | | $ | 750 | | | $ | (4,147 | ) |
Euro-Buxl | | | 1 | | | | 03/07/19 | | | | 207 | | | | 927 | |
U.S. Treasury 10 Year Note | | | 10 | | | | 03/20/19 | | | | 1,220 | | | | (8,732 | ) |
U.S. Treasury Ultra Bond | | | 1 | | | | 03/20/19 | | | | 161 | | | | (7,395 | ) |
3 Month Eurodollar | | | 17 | | | | 12/14/20 | | | | 4,145 | | | | (17,239 | ) |
| | | | | | | | | | | | | | | | |
| | | | | | | | | | | | | | | (36,586 | ) |
| | | | | | | | | | | | | | | | |
| | | | | | | | | | | | | | $ | 84,619 | |
| | | | | | | | | | | | | | | | |
Forward Foreign Currency Exchange Contracts
| | | | | | | | | | | | | | | | | | | | |
Currency
Purchased | | | Currency
Sold | | | Counterparty | | Settlement Date | | | Unrealized
Appreciation
(Depreciation) | |
| BRL | | | 69,913 | | | USD | | | 18,000 | | | Citibank NA | | | 01/03/19 | | | $ | 39 | |
| USD | | | 8,961 | | | BRL | | | 34,613 | | | Goldman Sachs International | | | 01/03/19 | | | | 30 | |
| ARS | | | 192,200 | | | USD | | | 5,000 | | | Citibank NA | | | 01/16/19 | | | | 8 | |
| BRL | | | 38,829 | | | USD | | | 10,000 | | | Goldman Sachs International | | | 01/16/19 | | | | 9 | |
| USD | | | 12,800 | | | CLP | | | 8,710,069 | | | BNP Paribas SA | | | 01/16/19 | | | | 246 | |
| USD | | | 10,000 | | | RUB | | | 674,100 | | | Bank of America NA | | | 01/16/19 | | | | 343 | |
| USD | | | 20,000 | | | ZAR | | | 287,605 | | | BNP Paribas SA | | | 01/16/19 | | | | 41 | |
| IDR | | | 308,100,000 | | | USD | | | 20,000 | | | Barclays Bank plc | | | 01/18/19 | | | | 1,348 | |
| JPY | | | 183,473,171 | | | USD | | | 1,640,207 | | | HSBC Bank plc | | | 01/22/19 | | | | 36,412 | |
| GBP | | | 219,000 | | | USD | | | 278,092 | | | Barclays Bank plc | | | 03/20/19 | | | | 2,084 | |
| USD | | | 194,550 | | | EUR | | | 150,000 | | | Deutsche Bank AG | | | 12/13/19 | | | | 17,457 | |
| USD | | | 195,810 | | | EUR | | | 150,000 | | | Deutsche Bank AG | | | 02/25/20 | | | | 17,628 | |
| JPY | | | 19,510,000 | | | USD | | | 180,782 | | | JPMorgan Chase Bank NA | | | 03/16/20 | | | | 4,003 | |
| USD | | | 194,750 | | | JPY | | | 19,510,000 | | | HSBC Bank plc | | | 03/16/20 | | | | 9,965 | |
| | | | | | | | | | | | | | | | | | | | |
| | | | | | | | | | | | | | | | 89,613 | |
| | | | | | | | | | | | | | | | | |
| USD | | | 9,039 | | | BRL | | | 35,406 | | | Goldman Sachs International | | | 01/03/19 | | | | (96 | ) |
| CLP | | | 8,564,736 | | | USD | | | 12,800 | | | Deutsche Bank AG | | | 01/16/19 | | | | (455 | ) |
| RUB | | | 664,600 | | | USD | | | 10,000 | | | Bank of America NA | | | 01/16/19 | | | | (479 | ) |
| USD | | | 10,000 | | | KRW | | | 11,261,100 | | | Citibank NA | | | 01/16/19 | | | | (116 | ) |
| USD | | | 300 | | | MXN | | | 6,102 | | | JPMorgan Chase Bank NA | | | 01/16/19 | | | | (10 | ) |
| USD | | | 10,000 | | | MXN | | | 201,342 | | | Citibank NA | | | 01/16/19 | | | | (225 | ) |
| ZAR | | | 141,140 | | | USD | | | 10,000 | | | UBS AG | | | 01/16/19 | | | | (205 | ) |
| ZAR | | | 142,448 | | | USD | | | 10,000 | | | HSBC Bank plc | | | 01/16/19 | | | | (115 | ) |
| USD | | | 20,000 | | | IDR | | | 294,940,000 | | | JPMorgan Chase Bank NA | | | 01/18/19 | | | | (436 | ) |
| USD | | | 1,644,312 | | | JPY | | | 183,473,171 | | | JPMorgan Chase Bank NA | | | 01/22/19 | | | | (32,307 | ) |
| USD | | | 2,048 | | | COP | | | 6,736,000 | | | JPMorgan Chase Bank NA | | | 01/23/19 | | | | (24 | ) |
| USD | | | 4,429 | | | COP | | | 14,412,000 | | | HSBC Bank plc | | | 01/23/19 | | | | (4 | ) |
| USD | | | 14,558 | | | COP | | | 48,070,000 | | | Goldman Sachs International | | | 01/23/19 | | | | (228 | ) |
| USD | | | 18,179 | | | COP | | | 60,000,000 | | | UBS AG | | | 01/23/19 | | | | (277 | ) |
| USD | | | 48,114 | | | MXN | | | 970,000 | | | Citibank NA | | | 01/23/19 | | | | (1,086 | ) |
| BRL | | | 34,680 | | | USD | | | 8,961 | | | Goldman Sachs International | | | 02/04/19 | | | | (31 | ) |
| USD | | | 28,288 | | | MXN | | | 571,000 | | | Standard Chartered Bank | | | 02/05/19 | | | | (610 | ) |
| USD | | | 277,644 | | | GBP | | | 219,000 | | | Morgan Stanley & Co. International plc | | | 03/20/19 | | | | (2,533 | ) |
| EUR | | | 150,000 | | | USD | | | 183,528 | | | JPMorgan Chase Bank NA | | | 12/13/19 | | | | (6,435 | ) |
| EUR | | | 150,000 | | | USD | | | 184,852 | | | JPMorgan Chase Bank NA | | | 02/25/20 | | | | (6,670 | ) |
| | | | | | | | | | | | | | | | | | | | |
| | | | | | | | | | | | | | | | (52,342 | ) |
| | | | | | | | | | | | | | | | | |
| | | Net Unrealized Appreciation | | | $ | 37,271 | |
| | | | | | | | |
| | |
| 102 | | 2018 BLACKROCK ANNUAL REPORTTO SHAREHOLDERS |
| | |
Schedule of Investments (continued) December 31, 2018 | | BlackRock U.S. Government Bond Portfolio |
OTC Barrier Options Purchased
| | | | | | | | | | | | | | | | | | | | | | | | | | | | | | | | | | | | |
| Description | | Type of Option | | Counterparty | | Expiration
Date | | | Exercise
Price | | | Barrier
Price/Range | | | Notional
Amount (000) | | | Value | |
Put | | | | | | | | | | | | | | | | | | | | | | | | | | | | | | | | | | | | |
USD Currency | | Up and In | | Deutsche Bank AG | | | 01/07/19 | | | | BRL | | | | 3.60 | | | | BRL | | | | 4.00 | | | | USD | | | | 40 | | | $ | — | |
USD Currency | | Up and In | | Deutsche Bank AG | | | 02/07/19 | | | | BRL | | | | 3.50 | | | | BRL | | | | 4.00 | | | | USD | | | | 29 | | | | — | |
| | | | | | | | | | | | | | | | | | | | | | | | | | | | | | | | | | | | |
| | | | | | | | | | | | | | | | | | | | | | | | | | | | | | | | | | $ | — | |
| | | | | | | | | | | | | | | | | | | | | | | | | | | | | | | | | | | | |
OTC Interest Rate Swaptions Purchased
| | | | | | | | | | | | | | | | | | | | | | | | | | | | |
| | | Paid by the Fund | | Received by the Fund | | | | Expiration
Date | | | Exercise
Rate | | | Notional
Amount (000) | | | | |
| Description | | Rate | | Frequency | | Rate | | | Frequency | | Counterparty | | Value | |
Call | | | | | | | | | | | | | | | | | | | | | | | | | | | | |
2-Year Interest Rate Swap | | 3 month LIBOR | | Quarterly | | | 3.00% | | | Semi-Annual | | Barclays Bank plc | | | 05/31/19 | | | | 3.00 | % | | USD | 5,400 | | | $ | 46,661 | |
10-Year Interest Rate Swap | | 3 month LIBOR | | Quarterly | | | 2.75% | | | Semi-Annual | | Citibank NA | | | 04/24/19 | | | | 2.75 | % | | USD | 320 | | | | 4,579 | |
10-Year Interest Rate Swap | | 3 month LIBOR | | Quarterly | | | 2.75% | | | Semi-Annual | | Citibank NA | | | 04/24/19 | | | | 2.75 | % | | USD | 70 | | | | 1,002 | |
10-Year Interest Rate Swap | | 3 month LIBOR | | Quarterly | | | 2.70% | | | Semi-Annual | | Barclays Bank plc | | | 06/10/19 | | | | 2.70 | % | | USD | 179 | | | | 2,609 | |
10-Year Interest Rate Swap | | 3 month LIBOR | | Quarterly | | | 3.04% | | | Semi-Annual | | JPMorgan Chase Bank NA | | | 04/27/38 | | | | 3.04 | % | | USD | 790 | | | | 45,135 | |
| | | | | | | | | | | | | | | | | | | | | | | | | | | | |
| | | | | | | | | | | | | | | | | | | | | | | | | | | 99,986 | |
| | | | | | | | | | | | | | | | | | | | | | | | | | | | |
Put | | | | | | | | | | | | | | | | | | | | | | | | | | | | |
10-Year Interest Rate Swap | | 3.77% | | Semi-Annual | | | 3 month LIBOR | | | Quarterly | | Citibank NA | | | 04/24/19 | | | | 3.77 | % | | USD | 195 | | | | 39 | |
10-Year Interest Rate Swap | | 3.04% | | Semi-Annual | | | 3 month LIBOR | | | Quarterly | | JPMorgan Chase Bank NA | | | 04/27/38 | | | | 3.04 | % | | USD | 790 | | | | 37,240 | |
| | | | | | | | | | | | | | | | | | | | | | | | | | | | |
| | | | | | | | | | | | | | | | | | | | | | | | | | | 37,279 | |
| | | | | | | | | | | | | | | | | | | | | | | | | | | | |
| | | | | | | | | | | | | | | | | | | | | | | | | | $ | 137,265 | |
| | | | | | | | | | | | | | | | | | | | | | | | | | | | |
OTC Interest Rate Swaptions Written
| | | | | | | | | | | | | | | | | | | | | | | | | | | | | | |
Description | | Paid by the Fund | | Received by the Fund | | Counterparty | | Expiration
Date | | | Exercise
Rate | | | Notional
Amount (000) | | | Value | |
| | Rate | | | Frequency | | Rate | | | Frequency |
Call | | | | | | | | | | | | | | | | | | | | | | | | | | | | | | |
2-Year Interest Rate Swap | | | 3 month LIBOR | | | Quarterly | | | 2.90% | | | Semi-Annual | | Bank of America NA | | | 02/28/19 | | | | 2.90 | % | | USD | 2,700 | | | $ | (15,111 | ) |
2-Year Interest Rate Swap | | | 3 month LIBOR | | | Quarterly | | | 2.70% | | | Semi-Annual | | Citibank NA | | | 03/05/19 | | | | 2.70 | % | | USD | 2,900 | | | | (8,333 | ) |
2-Year Interest Rate Swap | | | 3 month LIBOR | | | Quarterly | | | 2.60% | | | Semi-Annual | | Barclays Bank plc | | | 05/31/19 | | | | 2.60 | % | | USD | 5,400 | | | | (18,983 | ) |
2-Year Interest Rate Swap | | | 3 month LIBOR | | | Quarterly | | | 2.80% | | | Semi-Annual | | Barclays Bank plc | | | 05/31/19 | | | | 2.80 | % | | USD | 5,400 | | | | (30,828 | ) |
2-Year Interest Rate Swap | | | 3 month LIBOR | | | Quarterly | | | 2.75% | | | Semi-Annual | | Citibank NA | | | 10/16/20 | | | | 2.75 | % | | USD | 2,110 | | | | (22,870 | ) |
5-Year Interest Rate Swap | | | 3 month LIBOR | | | Quarterly | | | 2.71% | | | Semi-Annual | | Citibank NA | | | 03/14/19 | | | | 2.71 | % | | USD | 1,600 | | | | (15,206 | ) |
| | | | | | | | | | | | | | | | | | | | | | | | | | | | | | |
| | | | | | | | | | | | | | | | | | | | | | | | | | | | | (111,331 | ) |
| | | | | | | | | | | | | | | | | | | | | | | | | | | | | | |
Put | | | | | | | | | | | | | | | | | | | | | | | | | | | | | | |
2-Year Interest Rate Swap | | | 3.33% | | | Semi-Annual | | | 3 month LIBOR | | | Quarterly | | Citibank NA | | | 04/30/19 | | | | 3.33 | % | | USD | 2,700 | | | | (171 | ) |
2-Year Interest Rate Swap | | | 3.75% | | | Semi-Annual | | | 3 month LIBOR | | | Quarterly | | Citibank NA | | | 10/16/20 | | | | 3.75 | % | | USD | 2,110 | | | | (2,513 | ) |
| | | | | | | | | | | | | | | | | | | | | | | | | | | | | | |
| | | | | | | | | | | | | | | | | | | | | | | | | | | | | (2,684 | ) |
| | | | | | | | | | | | | | | | | | | | | | | | | | | | | | |
| | | | | | | | | | | | | | | | | | | | | | | | | | | | $ | (114,015 | ) |
| | | | | | | | | | | | | | | | | | | | | | | | | | | | | | |
Centrally Cleared Inflation Swaps
| | | | | | | | | | | | | | | | | | | | | | | | | | | | |
Paid by the Fund | | Received by the Fund | | Termination
Date | | | Notional
Amount (000) | | Value | | | Upfront
Premium
Paid
(Received) | | | Unrealized
Appreciation
(Depreciation) | |
| Reference | | Frequency | | Rate | | Frequency |
| UK Retail Price Index All Items Monthly | | At Termination | | 3.57% | | At Termination | | | 11/15/28 | | | | GBP | | | 171 | | $ | 805 | | | $ | (86 | ) | | $ | 891 | |
| | | | | | | | | | | | | | | | | | | | | | | | | | | | |
| | | | |
| SCHEDULES OF INVESTMENTS | | | 103 | |
| | |
Schedule of Investments (continued) December 31, 2018 | | BlackRock U.S. Government Bond Portfolio |
Centrally Cleared Interest Rate Swaps
| | | | | | | | | | | | | | | | | | | | | | | | | | | | | | | | |
Paid by the Fund | | Received by the Fund | | Effective
Date | | | Termination
Date | | | Notional Amount (000) | | | Value | | | Upfront
Premium
Paid
(Received) | | | Unrealized
Appreciation
(Depreciation) | |
| Rate | | Frequency | | Rate | | Frequency |
| 7.36% | | Monthly | | 28 day MXIBTIIE | | Monthly | | | N/A | | | | 01/28/19 | | | MXN | | | 2,579 | | | $ | 125 | | | $ | — | | | $ | 125 | |
| 1 day Fed Funds | | At Termination | | 1.47% | | At Termination | | | N/A | | | | 03/20/19 | | | USD | | | 23,511 | | | | (55,463 | ) | | | (6,505 | ) | | | (48,958 | ) |
| 1.47% | | At Termination | | 1 day Fed Funds | | At Termination | | | N/A | | | | 03/20/19 | | | USD | | | 23,511 | | | | 55,463 | | | | — | | | | 55,463 | |
| 28 day MXIBTIIE | | Monthly | | 8.21% | | Monthly | | | N/A | | | | 10/07/20 | | | MXN | | | 687 | | | | (242 | ) | | | — | | | | (242 | ) |
| 28 day MXIBTIIE | | Monthly | | 8.21% | | Monthly | | | N/A | | | | 10/07/20 | | | MXN | | | 1,397 | | | | (491 | ) | | | — | | | | (491 | ) |
| 3.07% | | Semi-Annual | | 3 month LIBOR | | Quarterly | | | N/A | | | | 10/11/20 | | | USD | | | 2,050 | | | | (16,881 | ) | | | — | | | | (16,881 | ) |
| 3.05% | | Semi-Annual | | 3 month LIBOR | | Quarterly | | | N/A | | | | 10/15/20 | | | USD | | | 2,050 | | | | (16,070 | ) | | | 28 | | | | (16,098 | ) |
| 3.11% | | Semi-Annual | | 3 month LIBOR | | Quarterly | | | N/A | | | | 10/23/20 | | | USD | | | 2,050 | | | | (18,375 | ) | | | — | | | | (18,375 | ) |
| 3.06% | | Semi-Annual | | 3 month LIBOR | | Quarterly | | | N/A | | | | 10/25/20 | | | USD | | | 2,050 | | | | (16,204 | ) | | | — | | | | (16,204 | ) |
| 1.37% | | Semi-Annual | | 3 month LIBOR | | Quarterly | | | N/A | | | | 11/30/20 | | | USD | | | 1,400 | | | | 35,171 | | | | — | | | | 35,171 | |
| 3 month LIBOR | | Quarterly | | 1.37% | | Semi-Annual | | | N/A | | | | 11/30/20 | | | USD | | | 470 | | | | (11,807 | ) | | | (2,858 | ) | | | (8,949 | ) |
| 6 month EURIBOR | | Semi-Annual | | 0.38% | | Annual | | | 11/09/20 | (a) | | | 11/09/21 | | | EUR | | | 2,360 | | | | 7,879 | | | | (32 | ) | | | 7,911 | |
| 1.55% | | Semi-Annual | | 6 month LIBOR | | Semi-Annual | | | 11/09/20 | (a) | | | 11/09/21 | | | GBP | | | 4,285 | | | | (11,699 | ) | | | 439 | | | | (12,138 | ) |
| 6 month EURIBOR | | Semi-Annual | | 0.38% | | Annual | | | 11/09/20 | (a) | | | 11/09/21 | | | EUR | | | 2,360 | | | | 8,015 | | | | (112 | ) | | | 8,127 | |
| 1.42% | | Semi-Annual | | 6 month LIBOR | | Semi-Annual | | | 11/16/20 | (a) | | | 11/16/21 | | | GBP | | | 2,170 | | | | (2,488 | ) | | | — | | | | (2,488 | ) |
| 6 month EURIBOR | | Semi-Annual | | 0.32% | | Annual | | | 11/16/20 | (a) | | | 11/16/21 | | | EUR | | | 2,376 | | | | 6,344 | | | | — | | | | 6,344 | |
| 1.34% | | Semi-Annual | | 6 month LIBOR | | Semi-Annual | | | 12/10/20 | (a) | | | 12/10/21 | | | GBP | | | 1,095 | | | | 42 | | | | (26 | ) | | | 68 | |
| 6 month EURIBOR | | Semi-Annual | | 0.24% | | Annual | | | 12/14/20 | (a) | | | 12/14/21 | | | EUR | | | 1,195 | | | | 1,777 | | | | 36 | | | | 1,741 | |
| 7.11% | | Monthly | | 28 day MXIBTIIE | | Monthly | | | N/A | | | | 10/14/22 | | | MXN | | | 350 | | | | 871 | | | | — | | | | 871 | |
| 7.11% | | Monthly | | 28 day MXIBTIIE | | Monthly | | | N/A | | | | 10/14/22 | | | MXN | | | 265 | | | | 659 | | | | — | | | | 659 | |
| 1.66% | | Semi-Annual | | 6 month LIBOR | | Semi-Annual | | | 11/08/21 | (a) | | | 11/08/22 | | | GBP | | | 1,087 | | | | (3,487 | ) | | | 91 | | | | (3,578 | ) |
| 1.67% | | Semi-Annual | | 6 month LIBOR | | Semi-Annual | | | 11/08/21 | (a) | | | 11/08/22 | | | GBP | | | 1,087 | | | | (3,621 | ) | | | 237 | | | | (3,858 | ) |
| 1.54% | | Semi-Annual | | 6 month LIBOR | | Semi-Annual | | | 11/15/21 | (a) | | | 11/15/22 | | | GBP | | | 1,100 | | | | (1,924 | ) | | | — | | | | (1,924 | ) |
| 2.50% | | Semi-Annual | | 3 month LIBOR | | Quarterly | | | N/A | | | | 01/29/23 | | | USD | | | 841 | | | | (2,954 | ) | | | — | | | | (2,954 | ) |
| 3 month LIBOR | | Quarterly | | 2.13% | | Semi-Annual | | | N/A | | | | 08/25/25 | | | USD | | | 10 | | | | (251 | ) | | | — | | | | (251 | ) |
| 3.07% | | Semi-Annual | | 3 month LIBOR | | Quarterly | | | N/A | | | | 08/31/25 | | | USD | | | 970 | | | | (27,535 | ) | | | — | | | | (27,535 | ) |
| 6 month EURIBOR | | Semi-Annual | | 0.82% | | Annual | | | 03/11/19 | (a) | | | 02/15/28 | | | EUR | | | 510 | | | | 3,807 | | | | — | | | | 3,807 | |
| 1.58% | | Semi-Annual | | 6 month LIBOR | | Semi-Annual | | | N/A | | | | 11/21/28 | | | GBP | | | 231 | | | | (4,493 | ) | | | 25 | | | | (4,518 | ) |
| 2.85% | | Semi-Annual | | 3 month LIBOR | | Quarterly | | | N/A | | | | 12/21/28 | | | USD | | | 200 | | | | (2,111 | ) | | | — | | | | (2,111 | ) |
| 2.85% | | Semi-Annual | | 3 month LIBOR | | Quarterly | | | N/A | | | | 12/24/28 | | | USD | | | 13 | | | | (143 | ) | | | — | | | | (143 | ) |
| 3 month LIBOR | | Quarterly | | 3.35% | | Semi-Annual | | | 04/26/19 | (a) | | | 04/26/29 | | | USD | | | 32 | | | | 1,721 | | | | — | | | | 1,721 | |
| 3.26% | | Semi-Annual | | 3 month LIBOR | | Quarterly | | | 04/26/19 | (a) | | | 04/26/29 | | | USD | | | 50 | | | | (2,321 | ) | | | — | | | | (2,321 | ) |
| 3.23% | | Semi-Annual | | 3 month LIBOR | | Quarterly | | | 04/26/19 | (a) | | | 04/26/29 | | | USD | | | 10 | | | | (436 | ) | | | — | | | | (436 | ) |
| 2.93% | | Semi-Annual | | 3 month LIBOR | | Quarterly | | | 06/12/19 | (a) | | | 06/12/29 | | | USD | | | 55 | | | | (926 | ) | | | — | | | | (926 | ) |
| | | | | | | | | | | | | | | | | | | | | | | | | | | | | | | | |
| | | | | | | | | | | | | | | | | | | | | | $ | (78,048 | ) | | $ | (8,677 | ) | | $ | (69,371 | ) |
| | | | | | | | | | | | | | | | | | | | | | | | | | | | | | | | |
OTC Credit Default Swaps — Buy Protection
| | | | | | | | | | | | | | | | | | | | | | | | | | | | | | | | |
| Reference Obligation/Index | | Financing
Rate Paid
by the Fund | | | Payment
Frequency | | | Counterparty | | Termination
Date | | | Notional
Amount (000) | | | Value | | | Upfront
Premium
Paid
(Received) | | | Unrealized
Appreciation
(Depreciation) | |
Republic of Colombia | | | 1.00 | % | | | Quarterly | | | Barclays Bank plc | | | 12/20/23 | | | USD | | | 5 | | | $ | 128 | | | $ | 96 | | | $ | 32 | |
Republic of Colombia | | | 1.00 | | | | Quarterly | | | Barclays Bank plc | | | 12/20/23 | | | USD | | | 6 | | | | 154 | | | | 115 | | | | 39 | |
Republic of Colombia | | | 1.00 | | | | Quarterly | | | BNP Paribas SA | | | 12/20/23 | | | USD | | | 6 | | | | 167 | | | | 101 | | | | 66 | |
Republic of Colombia | | | 1.00 | | | | Quarterly | | | BNP Paribas SA | | | 12/20/23 | | | USD | | | 6 | | | | 156 | | | | 103 | | | | 53 | |
Republic of Colombia | | | 1.00 | | | | Quarterly | | | Citibank NA | | | 12/20/23 | | | USD | | | 5 | | | | 128 | | | | 99 | | | | 29 | |
Republic of Colombia | | | 1.00 | | | | Quarterly | | | Citibank NA | | | 12/20/23 | | | USD | | | 5 | | | | 128 | | | | 93 | | | | 35 | |
Republic of Colombia | | | 1.00 | | | | Quarterly | | | Citibank NA | | | 12/20/23 | | | USD | | | 6 | | | | 154 | | | | 121 | | | | 33 | |
Republic of Colombia | | | 1.00 | | | | Quarterly | | | Citibank NA | | | 12/20/23 | | | USD | | | 6 | | | | 154 | | | | 115 | | | | 39 | |
Republic of Colombia | | | 1.00 | | | | Quarterly | | | Citibank NA | | | 12/20/23 | | | USD | | | 2 | | | | 51 | | | | 37 | | | | 14 | |
Republic of Colombia | | | 1.00 | | | | Quarterly | | | Deutsche Bank AG | | | 12/20/23 | | | USD | | | 5 | | | | 128 | | | | 96 | | | | 32 | |
Republic of the Philippines | | | 1.00 | | | | Quarterly | | | BNP Paribas SA | | | 12/20/23 | | | USD | | | 40 | | | | (261 | ) | | | (188 | ) | | | (73 | ) |
United Mexican States | | | 1.00 | | | | Quarterly | | | Barclays Bank plc | | | 12/20/23 | | | USD | | | 5 | | | | 125 | | | | 38 | | | | 87 | |
United Mexican States | | | 1.00 | | | | Quarterly | | | Barclays Bank plc | | | 12/20/23 | | | USD | | | 14 | | | | 348 | | | | 107 | | | | 241 | |
United Mexican States | | | 1.00 | | | | Quarterly | | | Barclays Bank plc | | | 12/20/23 | | | USD | | | 10 | | | | 250 | | | | 79 | | | | 171 | |
United Mexican States | | | 1.00 | | | | Quarterly | | | BNP Paribas SA | | | 12/20/23 | | | USD | | | 6 | | | | 150 | | | | 133 | | | | 17 | |
United Mexican States | | | 1.00 | | | | Quarterly | | | BNP Paribas SA | | | 12/20/23 | | | USD | | | 5 | | | | 125 | | | | 40 | | | | 85 | |
| | |
| 104 | | 2018 BLACKROCK ANNUAL REPORTTO SHAREHOLDERS |
| | |
Schedule of Investments (continued) December 31, 2018 | | BlackRock U.S. Government Bond Portfolio |
| | | | | | | | | | | | | | | | | | | | | | | | | | | | | | | | | | |
| Reference Obligation/Index | | Financing
Rate Paid
by the Fund | | | Payment
Frequency | | | Counterparty | | Termination
Date | | | Notional
Amount
(000) | | | Value | | | Upfront
Premium
Paid
(Received) | | | Unrealized
Appreciation
(Depreciation) | |
United Mexican States | | | 1.00 | % | | | Quarterly | | | BNP Paribas SA | | | 12/20/23 | | | | USD | | | | 5 | | | $ | 124 | | | $ | 110 | | | $ | 14 | |
United Mexican States | | | 1.00 | | | | Quarterly | | | BNP Paribas SA | | | 12/20/23 | | | | USD | | | | 5 | | | | 124 | | | | 40 | | | | 84 | |
United Mexican States | | | 1.00 | | | | Quarterly | | | BNP Paribas SA | | | 12/20/23 | | | | USD | | | | 4 | | | | 100 | | | | 88 | | | | 12 | |
United Mexican States | | | 1.00 | | | | Quarterly | | | Citibank NA | | | 12/20/23 | | | | USD | | | | 5 | | | | 124 | | | | 37 | | | | 87 | |
United Mexican States | | | 1.00 | | | | Quarterly | | | Citibank NA | | | 12/20/23 | | | | USD | | | | 10 | | | | 249 | | | | 96 | | | | 153 | |
United Mexican States | | | 1.00 | | | | Quarterly | | | Citibank NA | | | 12/20/23 | | | | USD | | | | 7 | | | | 178 | | | | 127 | | | | 51 | |
United Mexican States | | | 1.00 | | | | Quarterly | | | Citibank NA | | | 12/20/23 | | | | USD | | | | 10 | | | | 250 | | | | 96 | | | | 154 | |
United Mexican States | | | 1.00 | | | | Quarterly | | | Citibank NA | | | 12/20/23 | | | | USD | | | | 6 | | | | 150 | | | | 115 | | | | 35 | |
United Mexican States | | | 1.00 | | | | Quarterly | | | Citibank NA | | | 12/20/23 | | | | USD | | | | 23 | | | | 573 | | | | 180 | | | | 393 | |
United Mexican States | | | 1.00 | | | | Quarterly | | | Citibank NA | | | 12/20/23 | | | | USD | | | | 6 | | | | 150 | | | | 119 | | | | 31 | |
United Mexican States | | | 1.00 | | | | Quarterly | | | Citibank NA | | | 12/20/23 | | | | USD | | | | 6 | | | | 150 | | | | 136 | | | | 14 | |
United Mexican States | | | 1.00 | | | | Quarterly | | | Citibank NA | | | 12/20/23 | | | | USD | | | | 7 | | | | 174 | | | | 164 | | | | 10 | |
United Mexican States | | | 1.00 | | | | Quarterly | | | Citibank NA | | | 12/20/23 | | | | USD | | | | 6 | | | | 150 | | | | 131 | | | | 19 | |
United Mexican States | | | 1.00 | | | | Quarterly | | | Citibank NA | | | 12/20/23 | | | | USD | | | | 5 | | | | 124 | | | | 27 | | | | 97 | |
United Mexican States | | | 1.00 | | | | Quarterly | | | Citibank NA | | | 12/20/23 | | | | USD | | | | 5 | | | | 124 | | | | 28 | | | | 96 | |
United Mexican States | | | 1.00 | | | | Quarterly | | | Deutsche Bank AG | | | 12/20/23 | | | | USD | | | | 4 | | | | 100 | | | | 39 | | | | 61 | |
United Mexican States | | | 1.00 | | | | Quarterly | | | Deutsche Bank AG | | | 12/20/23 | | | | USD | | | | 4 | | | | 100 | | | | 39 | | | | 61 | |
United Mexican States | | | 1.00 | | | | Quarterly | | | Goldman Sachs International | | | 12/20/23 | | | | USD | | | | 32 | | | | 797 | | | | 293 | | | | 504 | |
| | | | | | | | | | | | | | | | | | | | | | | | | | | | | | | | | | |
| | | | | | | | | | | | | | | | | | | | | | | | $ | 5,826 | | | $ | 3,050 | | | $ | 2,776 | |
| | | | | | | | | | | | | | | | | | | | | | | | | | | | | | | | | | |
OTC Interest Rate Swaps
| | | | | | | | | | | | | | | | | | | | | | | | | | | | | | | | | | |
| Paid by the Fund | | Received by the Fund | | Counterparty | | Termination
Date | | | Notional
Amount (000) | | | Value | | | Upfront
Premium
Paid
(Received) | | | Unrealized
Appreciation
(Depreciation) | |
| Rate | | Frequency | | Rate | | | Frequency |
| 1 day BZDIOVER | | At Termination | | | 8.53% | | | At Termination | | Citibank NA | | | 01/02/23 | | | | BRL | | | | 220 | | | $ | 269 | | | $ | — | | | $ | 269 | |
| 28 day MXIBTIIE | | Monthly | | | 6.32% | | | Monthly | | Goldman Sachs International | | | 08/06/25 | | | | MXN | | | | 511 | | | | (3,136 | ) | | | — | | | | (3,136 | ) |
| 6.31% | | Monthly | | | 28 day MXIBTIIE | | | Monthly | | Deutsche Bank AG | | | 08/11/25 | | | | MXN | | | | 640 | | | | 3,949 | | | | — | | | | 3,949 | |
| | | | | | | | | | | | | | | | | | | | | | | | | | | | | | | | | | |
| | | | | | | | | | | | | | | | | | | | | | | | $ | 1,082 | | | $ | — | | | $ | 1,082 | |
| | | | | | | | | | | | | | | | | | | | | | | | | | | | | | | | | | |
The following reference rates, and their values as of period end, are used for security descriptions:
| | | | |
| Reference Index | | | | Reference rate |
1 day BZDIOVER | | Overnight Brazil CETIP — Interbank Rate | | 0.25% |
1 day Fed Funds | | 1 day Fed Funds | | 2.40% |
28 day MXIBTIIE | | Mexico Interbank TIIE28-Day | | 8.41% |
3 month LIBOR | | London Interbank Offered Rate | | 2.81% |
6 month EURIBOR | | Euro Interbank Offered Rate | | (0.24%) |
Balances Reported in the Statements of Assets and Liabilities for Centrally Cleared Swaps and OTC Swaps and Options Written
| | | | | | | | | | | | | | | | | | | | |
| | | Swap
Premiums
Paid | | | Swap
Premiums
Received | | | Unrealized
Appreciation | | | Unrealized
Depreciation | | | Value | |
Centrally Cleared Swaps(a) | | $ | 856 | | | $ | (9,619 | ) | | $ | 122,899 | | | $ | (191,379 | ) | | $ | — | |
OTC Swaps | | | 3,238 | | | | (188 | ) | | | 7,067 | | | | (3,209 | ) | | | — | |
Options Written | | | NA | | | | NA | | | | 10,270 | | | | (76,469 | ) | | | (114,015 | ) |
| | (a) | Includes cumulative appreciation (depreciation) on centrally cleared swaps, as reported in the Schedule of Investments. Only current day’s variation margin is reported within the Statements of Assets and Liabilities and is net of any previously paid (received) swap premium amounts. | |
| | | | |
| SCHEDULES OF INVESTMENTS | | | 105 | |
| | |
Schedule of Investments (continued) December 31, 2018 | | BlackRock U.S. Government Bond Portfolio |
Derivative Financial Instruments Categorized by Risk Exposure
As of period end, the fair values of derivative financial instruments located in the Statements of Assets and Liabilities were as follows:
| | | | | | | | | | | | | | | | | | | | | | | | | | | | |
| | | Commodity
Contracts | | | Credit
Contracts | | | Equity
Contracts | | | Foreign
Currency
Exchange
Contracts | | | Interest
Rate
Contracts | | | Other
Contracts | | | Total | |
Assets — Derivative Financial Instruments | | | | | | | | | | | | | | | | | | | | | | | | | | | | |
Futures contracts | | | | | | | | | | | | | | | | | | | | | | | | | | | | |
Net unrealized appreciation(a) | | $ | — | | | $ | — | | | $ | — | | | $ | — | | | $ | 122,132 | | | $ | — | | | $ | 122,132 | |
Forward foreign currency exchange contracts | | | | | | | | | | | | | | | | | | | | | | | | | | | | |
Unrealized appreciation on forward foreign currency exchange contracts | | | — | | | | — | | | | — | | | | 89,613 | | | | — | | | | — | | | | 89,613 | |
Options purchased | | | | | | | | | | | | | | | | | | | | | | | | | | | | |
Investments at value — unaffiliated(b) | | | — | | | | — | | | | — | | | | — | | | | 137,265 | | | | — | | | | 137,265 | |
Swaps — centrally cleared | | | | | | | | | | | | | | | | | | | | | | | | | | | | |
Net unrealized appreciation(a) | | | — | | | | — | | | | — | | | | — | | | | 122,008 | | | | 891 | | | | 122,899 | |
Swaps — OTC | | | | | | | | | | | | | | | | | | | | | | | | | | | | |
Unrealized appreciation on OTC swaps; Swap premiums paid | | | — | | | | 6,087 | | | | — | | | | — | | | | 4,218 | | | | — | | | | 10,305 | |
| | | | | | | | | | | | | | | | | | | | | | | | | | | | |
| | $ | — | | | $ | 6,087 | | | $ | — | | | $ | 89,613 | | | $ | 385,623 | | | | 891 | | | $ | 482,214 | |
| | | | | | | | | | | | | | | | | | | | | | | | | | | | |
| | | | | | | |
| Liabilities — Derivative Financial Instruments | | | | | | | | | | | | | | | | | | | | | |
Futures contracts | | | | | | | | | | | | | | | | | | | | | | | | | | | | |
Net unrealized depreciation(a) | | $ | — | | | $ | — | | | $ | — | | | $ | — | | | $ | 37,513 | | | $ | — | | | $ | 37,513 | |
Forward foreign currency exchange contracts | | | | | | | | | | | | | | | | | | | | | | | | | | | | |
Unrealized depreciation on forward foreign currency exchange contracts | | | — | | | | — | | | | — | | | | 52,342 | | | | — | | | | — | | | | 52,342 | |
Options written | | | | | | | | | | | | | | | | | | | | | | | | | | | | |
Options written, at value | | | — | | | | — | | | | — | | | | — | | | | 114,015 | | | | — | | | | 114,015 | |
Swaps — centrally cleared | | | | | | | | | | | | | | | | | | | | | | | | | | | | |
Net unrealized depreciation(a) | | | — | | | | — | | | | — | | | | — | | | | 191,379 | | | | — | | | | 191,379 | |
Swaps — OTC | | | | | | | | | | | | | | | | | | | | | | | | | | | | |
Unrealized depreciation on OTC swaps; Swap premiums received | | | — | | | | 261 | | | | — | | | | — | | | | 3,136 | | | | — | | | | 3,397 | |
| | | | | | | | | | | | | | | | | | | | | | | | | | | | |
| | $ | — | | | $ | 261 | | | $ | — | | | $ | 52,342 | | | $ | 346,043 | | | $ | — | | | $ | 398,646 | |
| | | | | | | | | | | | | | | | | | | | | | | | | | | | |
| | (a) | Includes cumulative appreciation (depreciation) on futures contracts and centrally cleared swaps, if any, as reported in the Schedule of Investments. Only current day’s variation margin is reported within the Statements of Assets and Liabilities. | |
| | (b) | Includes options purchased at value as reported in the Schedule of Investments. | |
For the year ended December 31, 2018, the effect of derivative financial instruments in the Statements of Operations were as follows:
| | | | | | | | | | | | | | | | | | | | | | | | | | | | |
| | | Commodity
Contracts | | | Credit
Contracts | | | Equity
Contracts | | | Foreign
Currency
Exchange
Contracts | | | Interest
Rate
Contracts | | | Other
Contracts | | | Total | |
Net Realized Gain (Loss) from: | | | | | | | | | | | | | | | | | | | | | | | | | | | | |
Futures contracts | | $ | — | | | $ | — | | | $ | — | | | $ | — | | | $ | 47,716 | | | $ | — | | | $ | 47,716 | |
Forward foreign currency exchange contracts | | | — | | | | — | | | | — | | | | 101,063 | | | | — | | | | — | | | | 101,063 | |
Options purchased(a) | | | — | | | | — | | | | — | | | | (20,636 | ) | | | 77,863 | | | | — | | | | 57,227 | |
Options written | | | — | | | | — | | | | — | | | | 3,737 | | | | 70,415 | | | | — | | | | 74,152 | |
Swaps | | | — | | | | (2,156 | ) | | | — | | | | — | | | | (55,497 | ) | | | (3,493 | ) | | | (61,146 | ) |
| | | | | | | | | | | | | | | | | | | | | | | | | | | | |
| | $ | — | | | $ | (2,156 | ) | | $ | — | | | $ | 84,164 | | | $ | 140,497 | | | $ | (3,493 | ) | | $ | 219,012 | |
| | | | | | | | | | | | | | | | | | | | | | | | | | | | |
| | | | | | | |
| Net Change in Unrealized Appreciation (Depreciation) on: | | | | | | | | | | | | | | | | | | | | | |
Futures contracts | | $ | — | | | $ | — | | | $ | — | | | $ | — | | | $ | 90,285 | | | $ | (15 | ) | | $ | 90,270 | |
Forward foreign currency exchange contracts | | | — | | | | — | | | | — | | | | 19,689 | | | | — | | | | — | | | | 19,689 | |
Options purchased(b) | | | — | | | | — | | | | — | | | | 8,160 | | | | 78,184 | | | | — | | | | 86,344 | |
Options written | | | — | | | | — | | | | — | | | | — | | | | (85,462 | ) | | | — | | | | (85,462 | ) |
Swaps | | | — | | | | 5,169 | | | | — | | | | — | | | | (59,203 | ) | | | (860 | ) | | | (54,894 | ) |
| | | | | | | | | | | | | | | | | | | | | | | | | | | | |
| | $ | — | | | $ | 5,169 | | | $ | — | | | $ | 27,849 | | | $ | 23,804 | | | $ | (875 | ) | | $ | 55,947 | |
| | | | | | | | | | | | | | | | | | | | | | | | | | | | |
| | (a) | Options purchased are included in net realized gain (loss) from investments — unaffiliated. | |
| | (b) | Options purchased are included in net change in unrealized appreciation (depreciation) on investments — unaffiliated. | |
| | |
| 106 | | 2018 BLACKROCK ANNUAL REPORTTO SHAREHOLDERS |
| | |
Schedule of Investments (continued) December 31, 2018 | | BlackRock U.S. Government Bond Portfolio |
Average Quarterly Balances of Outstanding Derivative Financial Instruments
| | | | |
Futures contracts: | | | | |
Average notional value of contracts — long | | $ | 21,280,679 | |
Average notional value of contracts — short | | $ | 12,433,848 | |
Forward foreign currency exchange contracts: | | | | |
Average amounts purchased — in USD | | $ | 2,447,261 | |
Average amounts sold — in USD | | $ | 1,501,957 | |
Options: | | | | |
Average value of option contracts purchased | | $ | 10,724 | |
Average value of option contracts written | | $ | 2,061 | |
Average notional value of swaption contracts purchased | | $ | 3,378,500 | |
Average notional value of swaption contracts written | | $ | 20,528,000 | |
Credit default swaps: | | | | |
Average notional value — buy protection | | $ | 395,787 | |
Interest rate swaps: | | | | |
Average notional value — pays fixed rate | | $ | 32,736,586 | |
Average notional value — receives fixed rate | | $ | 28,759,461 | |
Inflation Swaps: | | | | |
Average notional value — receives fixed rate | | $ | 351,775 | |
For more information about the Fund’s investment risks regarding derivative financial instruments, refer to the Notes to Financial Statements.
Derivative Financial Instruments — Offsetting as of Period End
The Fund’s derivative assets and liabilities (by type) were as follows:
| | | | | | | | |
| | | Assets | | | Liabilities | |
Derivative Financial Instruments: | | | | | | | | |
Futures contracts | | $ | 22,258 | | | $ | 6,791 | |
Forward foreign currency exchange contracts | | | 89,613 | | | | 52,342 | |
Options(a) | | | 137,265 | | | | 114,015 | |
Swaps — Centrally cleared | | | — | | | | 7,462 | |
Swaps — OTC(b) | | | 10,305 | | | | 3,397 | |
| | | | | | | | |
Total derivative assets and liabilities in the Statements of Assets and Liabilities | | $ | 259,441 | | | $ | 184,007 | |
Derivatives not subject to a Master Netting Agreement or similar agreement (“MNA”) | | | (22,258 | ) | | | (14,253 | ) |
| | | | | | | | |
Total derivative assets and liabilities subject to an MNA | | $ | 237,183 | | | $ | 169,754 | |
| | | | | | | | |
| | (a) | Includes options purchased at value which is included in Investments at value — unaffiliated in the Statements of Assets and Liabilities and reported in the Schedule of Investments. | |
| | (b) | Includes unrealized appreciation (depreciation) on OTC swaps and swap premiums (paid/received) in the Statements of Assets and Liabilities. | |
The following tables present the Fund’s derivative assets and liabilities by counterparty net of amounts available for offset under an MNA and net of the related collateral received and pledged by the Fund:
| | | | | | | | | | | | | | | | | | | | |
| Counterparty | | Derivative
Assets
Subject to
an MNA by
Counterparty | | | Derivatives
Available
for Offset (a) | | | Non-cash
Collateral
Received | | | Cash
Collateral
Received | | | Net Amount
of Derivative
Assets (b) | |
Bank of America NA | | $ | 343 | | | $ | (343 | ) | | $ | — | | | $ | — | | | $ | — | |
Barclays Bank plc | | | 53,707 | | | | (49,811 | ) | | | — | | | | — | | | | 3,896 | |
BNP Paribas SA | | | 1,233 | | | | (261 | ) | | | — | | | | — | | | | 972 | |
Citibank NA | | | 8,947 | | | | (8,947 | ) | | | — | | | | — | | | | — | |
Deutsche Bank AG | | | 39,362 | | | | (455 | ) | | | — | | | | — | | | | 38,907 | |
Goldman Sachs International | | | 836 | | | | (836 | ) | | | — | | | | — | | | | — | |
HSBC Bank plc | | | 46,377 | | | | (119 | ) | | | — | | | | — | | | | 46,258 | |
JPMorgan Chase Bank NA | | | 86,378 | | | | (45,882 | ) | | | — | | | | — | | | | 40,496 | |
| | | | | | | | | | | | | | | | | | | | |
| | $ | 237,183 | | | $ | (106,654 | ) | | $ | — | | | $ | — | | | $ | 130,529 | |
| | | | | | | | | | | | | | | | | | | | |
| | | | | | | | | | | | | | | | | | | | |
| | | | |
| SCHEDULES OF INVESTMENTS | | | 107 | |
| | |
Schedule of Investments (continued) December 31, 2018 | | BlackRock U.S. Government Bond Portfolio |
| | | | | | | | | | | | | | | | | | | | |
| Counterparty | | Derivative
Liabilities
Subject to
an MNA by
Counterparty | | | Derivatives
Available
for Offset (a) | | | Non-cash
Collateral
Pledged | | | Cash
Collateral
Pledged | | | Net Amount
of Derivative
Liabilities (c) | |
Bank of America NA | | $ | 15,590 | | | $ | (343 | ) | | $ | — | | | $ | — | | | $ | 15,247 | |
Barclays Bank plc | | | 49,811 | | | | (49,811 | ) | | | — | | | | — | | | | — | |
BNP Paribas SA | | | 261 | | | | (261 | ) | | | — | | | | — | | | | — | |
Citibank NA | | | 50,520 | | | | (8,947 | ) | | | — | | | | — | | | | 41,573 | |
Deutsche Bank AG | | | 455 | | | | (455 | ) | | | — | | | | — | | | | — | |
Goldman Sachs International | | | 3,491 | | | | (836 | ) | | | — | | | | — | | | | 2,655 | |
HSBC Bank plc | | | 119 | | | | (119 | ) | | | — | | | | — | | | | — | |
JPMorgan Chase Bank NA | | | 45,882 | | | | (45,882 | ) | | | — | | | | — | | | | — | |
Morgan Stanley & Co. International plc | | | 2,533 | | | | — | | | | — | | | | — | | | | 2,533 | |
Standard Chartered Bank | | | 610 | | | | — | | | | — | | | | — | | | | 610 | |
UBS AG | | | 482 | | | | — | | | | — | | | | — | | | | 482 | |
| | | | | | | | | | | | | | | | | | | | |
| | $ | 169,754 | | | $ | (106,654 | ) | | $ | — | | | $ | — | | | $ | 63,100 | |
| | | | | | | | | | | | | | | | | | | | |
| | (a) | The amount of derivatives available for offset is limited to the amount of derivative assets and/or liabilities that are subject to an MNA. | |
| | (b) | Net amount represents the net amount receivable from the counterparty in the event of default. | |
| | (c) | Net amount represents the net amount payable due to the counterparty in the event of default. | |
Fair Value Hierarchy as of Period End
Various inputs are used in determining the fair value of investments and derivative financial instruments. For information about the Fund’s policy regarding valuation of investments and derivative financial instruments, refer to the Notes to Financial Statements.
The following tables summarize the Fund’s investments and derivative financial instruments categorized in the disclosure hierarchy:
| | | | | | | | | | | | | | | | |
| | | Level 1 | | | Level 2 | | | Level 3 | | | Total | |
Assets: | | | | | | | | | | | | | | | | |
Investments: | | | | | | | | | | | | | | | | |
Long-Term Investments: | | | | | | | | | | | | | | | | |
Asset-Backed Securities | | $ | — | | | $ | 1,195,143 | | | $ | — | | | $ | 1,195,143 | |
Foreign Government Obligations | | | — | | | | 87,067 | | | | — | | | | 87,067 | |
Non-Agency Mortgage-Backed Securities | | | — | | | | 1,060,536 | | | | 106,104 | | | | 1,166,640 | |
U.S. Government Sponsored Agency Securities | | | — | | | | 47,632,386 | | | | — | | | | 47,632,386 | |
U.S. Treasury Obligations | | | — | | | | 27,395,979 | | | | — | | | | 27,395,979 | |
Short-Term Securities: | | | | | | | | | | | | | | | | |
Commercial Paper | | | — | | | | 488,013 | | | | — | | | | 488,013 | |
Money Market Funds | | | 1,608,196 | | | | — | | | | — | | | | 1,608,196 | |
Options Purchased: | | | | | | | | | | | | | | | | |
Interest rate contracts | | | — | | | | 137,265 | | | | — | | | | 137,265 | |
Liabilities: | | | | | | | | | | | | | | | | |
TBA Sale Commitments | | | — | | | | (15,077,223 | ) | | | — | | | | (15,077,223 | ) |
| | | | | | | | | | | | | | | | |
| | $ | 1,608,196 | | | $ | 62,919,166 | | | $ | 106,104 | | | $ | 64,633,466 | |
| | | | | | | | | | | | | | | | |
Derivative Financial Instruments(a) | | | | | | | | | | | | | | | | |
Assets: | | | | | | | | | | | | | | | | |
Credit contracts | | $ | — | | | $ | 2,849 | | | $ | — | | | $ | 2,849 | |
Foreign currency exchange contracts | | | — | | | | 89,613 | | | | — | | | | 89,613 | |
Interest rate contracts | | | 122,132 | | | | 126,226 | | | | — | | | | 248,358 | |
Other contracts | | | — | | | | 891 | | | | — | | | | 891 | |
Liabilities: | | | | | | | | | | | | | | | | |
Credit contracts | | | — | | | | (73 | ) | | | — | | | | (73 | ) |
Foreign currency exchange contracts | | | — | | | | (52,342 | ) | | | — | | | | (52,342 | ) |
Interest rate contracts | | | (37,513 | ) | | | (308,530 | ) | | | — | | | | (346,043 | ) |
| | | | | | | | | | | | | | | | |
| | $ | 84,619 | | | $ | (141,366 | ) | | $ | — | | | $ | (56,747 | ) |
| | | | | | | | | | | | | | | | |
| | (a) | Derivative financial instruments are swaps, futures contracts, forward foreign currency exchange contracts and options written. Swaps, futures contracts, forward foreign currency exchange contracts and options written are valued at the unrealized appreciation (depreciation) on the instrument. | |
The Fund may hold liabilities in which the fair value approximates the carrying amount or face value, including accrued interest, for financial statements purposes. As of year end, reverse repurchase agreements of $12,647,294 are categorized as Level 2 within the disclosure hierarchy.
During the year ended December 31, 2018, there were no transfers between levels.
See notes to financial statements.
| | |
| 108 | | 2018 BLACKROCK ANNUAL REPORTTO SHAREHOLDERS |
Statements of Assets and Liabilities
December 31, 2018
| | | | | | | | | | | | | | | | |
| | | BlackRock
Advantage
Large Cap Core Portfolio | | | BlackRock
Balanced
Capital Portfolio | | | BlackRock
Capital
Appreciation
Portfolio | | | BlackRock
Global
Allocation
Portfolio (a) | |
| | | | |
ASSETS | | | | | | | | | | | | | | | | |
Investments at value — unaffiliated(b)(c) | | $ | 159,579,230 | | | $ | 490,743,904 | | | $ | 159,904,601 | | | $ | 172,881,466 | |
Investments at value — affiliated(d) | | | 6,105,935 | | | | 13,316,144 | | | | 8,357,683 | | | | 4,339,318 | |
Cash | | | 18,563 | | | | — | | | | — | | | | 572,850 | |
Cash pledged: | | | | | | | | | | | | | | | | |
Collateral — OTC derivatives | | | — | | | | 300,000 | | | | — | | | | — | |
Futures contracts | | | 85,000 | | | | 1,009,275 | | | | — | | | | 377,000 | |
Centrally cleared swaps | | | — | | | | 219,182 | | | | — | | | | 228,000 | |
Foreign currency at value(e) | | | — | | | | 1,268,306 | | | | 58 | | | | 22,381 | |
Receivables: | | | | | | | | | | | | | | | | |
Investments sold | | | 1,808,407 | | | | 14,152,774 | | | | — | | | | 357,913 | |
Securities lending income — affiliated | | | 854 | | | | 946 | | | | 984 | | | | 691 | |
Swaps | | | — | | | | — | | | | — | | | | 22,162 | |
TBA sale commitments | | | — | | | | 26,353,784 | | | | — | | | | — | |
Capital shares sold | | | 2,091 | | | | 897 | | | | 4,770 | | | | 6,234 | |
Dividends — affiliated | | | 3,123 | | | | 21,234 | | | | 5,146 | | | | 1,691 | |
Dividends — unaffiliated | | | 253,746 | | | | 429,747 | | | | 25,553 | | | | 156,554 | |
Interest — unaffiliated | | | — | | | | 1,329,267 | | | | — | | | | 395,429 | |
From custodian | | | — | | | | — | | | | 96,847 | | | | — | |
From the Manager | | | — | | | | — | | | | 1,608 | | | | 316 | |
Variation margin on futures contracts | | | 12,013 | | | | 506,768 | | | | — | | | | 4,564 | |
Variation margin on centrally cleared swaps | | | — | | | | 5,530 | | | | — | | | | 21,934 | |
Swap premiums paid | | | — | | | | 106,319 | | | | — | | | | — | |
Unrealized appreciation on: | | | | | | | | | | | | | | | | |
Forward foreign currency exchange contracts | | | — | | | | 202,348 | | | | — | | | | 124,997 | |
OTC swaps | | | — | | | | 70,159 | | | | — | | | | 97,997 | |
Prepaid expenses | | | 684 | | | | 1,007 | | | | 682 | | | | 693 | |
Other assets | | | — | | | | 3,867 | | | | — | | | | — | |
| | | | | | | | | | | | | | | | |
Total assets | | | 167,869,646 | | | | 550,041,458 | | | | 168,397,932 | | | | 179,612,190 | |
| | | | | | | | | | | | | | | | |
| | | | |
LIABILITIES | | | | | | | | | | | | | | | | |
Investments sold short, at value(f) | | | — | | | | — | | | | — | | | | 386,069 | |
Bank overdraft | | | — | | | | 498,653 | | | | — | | | | — | |
Cash received as collateral for OTC derivatives | | | — | | | | — | | | | — | | | | 410,000 | |
Borrowed bonds at value(g) | | | — | | | | 3,895,555 | | | | — | | | | — | |
Cash collateral on securities loaned at value | | | 4,229,010 | | | | 5,717,412 | | | | 4,610,994 | | | | 2,214,925 | |
Options written at value(h) | | | — | | | | 125,793 | | | | — | | | | 1,355,470 | |
TBA sale commitments at value(i) | | | — | | | | 26,604,858 | | | | — | | | | — | |
Payables: | | | | | | | | | | | | | | | | |
Investments purchased | | | 1,916,938 | | | | 58,815,741 | | | | 683,344 | | | | 567,044 | |
Board realignment and consolidation | | | 1,150 | | | | 1,167 | | | | 1,139 | | | | 1,158 | |
Capital shares redeemed | | | 21,529 | | | | 114,617 | | | | 10,993 | | | | 26,908 | |
Custodian fees | | | 16,064 | | | | 38,994 | | | | 4,824 | | | | 77,176 | |
Deferred foreign capital gain tax | | | — | | | | — | | | | — | | | | 14,759 | |
Interest expense | | | — | | | | 30,300 | | | | — | | | | — | |
Investment advisory fees | | | 50,207 | | | | 145,612 | | | | 53,427 | | | | 40,652 | |
Directors’ and Officer’s fees | | | 3,903 | | | | 5,052 | | | | 3,893 | | | | 3,958 | |
Other affiliates | | | 515 | | | | 1,391 | | | | 459 | | | | 602 | |
Professional fees | | | 12,635 | | | | 27,103 | | | | 6,502 | | | | 51,688 | |
Transfer agent fees | | | 115,902 | | | | 335,119 | | | | 123,251 | | | | 133,130 | |
Other accrued expenses | | | 88,703 | | | | 130,537 | | | | 33,040 | | | | 115,664 | |
Variation margin on futures contracts | | | — | | | | 22,364 | | | | — | | | | 75,756 | |
Swap premiums received | | | — | | | | 29,486 | | | | — | | | | — | |
Unrealized depreciation on: | | | | | | | | | | | | | | | | |
Forward foreign currency exchange contracts | | | — | | | | 419,711 | | | | — | | | | 143,393 | |
OTC swaps | | | — | | | | 52,350 | | | | — | | | | 10,776 | |
| | | | | | | | | | | | | | | | |
Total liabilities | | | 6,456,556 | | | | 97,011,815 | | | | 5,531,866 | | | | 5,629,128 | |
| | | | | | | | | | | | | | | | |
| | | | |
NET ASSETS | | $ | 161,413,090 | | | $ | 453,029,643 | | | $ | 162,866,066 | | | $ | 173,983,062 | |
| | | | | | | | | | | | | | | | |
See notes to financial statements.
Statements of Assets and Liabilities (continued)
December 31, 2018
| | | | | | | | | | | | | | | | |
| | | BlackRock
Advantage
Large Cap Core Portfolio | | | BlackRock
Balanced
Capital Portfolio | | | BlackRock
Capital
Appreciation
Portfolio | | | BlackRock
Global
Allocation
Portfolio (a) | |
| | | | |
NET ASSETS CONSIST OF | | | | | | | | | | | | | | | | |
Paid-in capital | | $ | 171,592,507 | | | $ | 475,069,839 | | | $ | 126,503,533 | | | $ | 178,411,247 | |
Accumulated earnings (loss) | | | (10,179,417 | ) | | | (22,040,196 | ) | | | 36,362,533 | | | | (4,428,185 | ) |
| | | | | | | | | | | | | | | | |
NET ASSETS | | $ | 161,413,090 | | | $ | 453,029,643 | | | $ | 162,866,066 | | | $ | 173,983,062 | |
| | | | | | | | | | | | | | | | |
| | | | |
Share outstanding, $0.10 par value(j) | | | 8,168,291 | | | | 32,436,923 | | | | 4,445,704 | | | | 12,248,332 | |
| | | | | | | | | | | | | | | | |
| | | | |
Net asset value, offering and redemption price per share | | $ | 19.76 | | | $ | 13.97 | | | $ | 36.63 | | | $ | 14.20 | |
| | | | | | | | | | | | | | | | |
| | | | |
(a) Consolidated Statement of Assets and Liabilities | | | | | | | | | | | | | | | | |
(b) Investments at cost — unaffiliated | | $ | 167,733,650 | | | $ | 507,984,062 | | | $ | 124,731,277 | | | $ | 177,541,343 | |
(c) Securities loaned at value | | $ | 4,142,764 | | | $ | 5,605,805 | | | $ | 4,529,210 | | | $ | 2,117,364 | |
(d) Investments at cost — affiliated | | $ | 6,106,192 | | | $ | 13,379,349 | | | $ | 8,357,782 | | | $ | 4,468,491 | |
(e) Foreign currency at cost | | $ | — | | | $ | 1,270,217 | | | $ | 58 | | | $ | 22,330 | |
(f) Proceeds received from investments sold short at value — unaffiliated | | $ | — | | | $ | — | | | $ | — | | | $ | 491,633 | |
(g) Proceeds received from borrowed bonds | | $ | — | | | $ | 3,811,640 | | | $ | — | | | $ | — | |
(h) Premiums received | | $ | — | | | $ | 98,198 | | | $ | — | | | $ | 880,316 | |
(i) Proceeds from TBA sale commitments | | $ | — | | | $ | 26,353,784 | | | $ | — | | | $ | — | |
(j) Authorized shares | | | 100 million | | | | 300 million | | | | 100 million | | | | 100 million | |
See notes to financial statements.
| | |
| 110 | | 2018 BLACKROCK ANNUAL REPORTTO SHAREHOLDERS |
Statements of Assets and Liabilities
December 31, 2018
| | | | | | | | | | | | |
| | | BlackRock
Government Money Market
Portfolio | | | BlackRock High
Yield Portfolio | | | BlackRock U.S.
Government Bond Portfolio | |
| | | |
ASSETS | | | | | | | | | | | | |
Investments at value — unaffiliated(a) | | $ | 76,958,102 | | | $ | 25,735,325 | | | $ | 78,102,493 | |
Investments at value — affiliated(b) | | | — | | | | 1,355,813 | | | | 1,608,196 | |
Cash | | | 4,190,645 | | | | — | | | | — | |
Cash pledged: | | | | | | | | | | | | |
Futures contracts | | | — | | | | 8,000 | | | | 84,540 | |
Centrally cleared swaps | | | — | | | | 15,000 | | | | 145,000 | |
Foreign currency at value(c) | | | — | | | | 2,776 | | | | 140,341 | |
Repurchase agreements at value — unaffiliated(d) | | | 49,700,000 | | | | — | | | | — | |
Receivables: | | | | | | | | | | | | |
Investments sold | | | — | | | | 46,328 | | | | 6,164,837 | |
TBA sale commitments | | | — | | | | — | | | | 14,894,774 | |
Capital shares sold | | | 548,498 | | | | 325 | | | | — | |
Dividends — affiliated | | | — | | | | 1,829 | | | | 1,631 | |
Dividends — unaffiliated | | | — | | | | 1,047 | | | | 25,004 | |
Interest — unaffiliated | | | 64,731 | | | | 404,067 | | | | 306,027 | |
From the Manager | | | 580 | | | | 170,941 | | | | 180,066 | |
Investment adviser | | | — | | | | 4,408 | | | | 4,201 | |
Variation margin on futures contracts | | | — | | | | 2,343 | | | | 22,258 | |
Variation margin on centrally cleared swaps | | | — | | | | 309 | | | | — | |
Swap premiums paid | | | — | | | | 164 | | | | 3,238 | |
Unrealized appreciation on: | | | | | | | | | | | | |
Forward foreign currency exchange contracts | | | — | | | | 1,668 | | | | 89,613 | |
OTC swaps | | | — | | | | — | | | | 7,067 | |
Prepaid expenses | | | 634 | | | | 526 | | | | 56 | |
Other assets | | | — | | | | 351 | | | | 10,801 | |
| | | | | | | | | | | | |
Total assets | | | 131,463,190 | | | | 27,751,220 | | | | 101,790,143 | |
| | | | | | | | | | | | |
| | | |
LIABILITIES | | | | | | | | | | | | |
Bank overdraft | | | — | | | | 1,628 | | | | 1,106 | |
Options written at value(e) | | | — | | | | — | | | | 114,015 | |
TBA sale commitments at value(f) | | | — | | | | — | | | | 15,077,223 | |
Reverse repurchase agreements at value | | | — | | | | — | | | | 12,647,294 | |
Payables: | | | | | | | | | | | | |
Investments purchased | | | — | | | | 281,996 | | | | 19,271,421 | |
Accounting services fees | | | 6,458 | | | | 21,605 | | | | 10,838 | |
Printing fees | | | 18,472 | | | | 16,587 | | | | 18,136 | |
Board realignment and consolidation | | | 1,131 | | | | 154,157 | | | | 178,843 | |
Capital shares redeemed | | | 557 | | | | 1,441 | | | | 259,995 | |
Custodian fees | | | 4,718 | | | | 8,536 | | | | 12,343 | |
Income dividend distributions | | | — | | | | 125,584 | | | | 115,431 | |
Investment advisory fees | | | 37,023 | | | | — | | | | — | |
Directors’ and Officer’s fees | | | 3,695 | | | | 3,344 | | | | 3,440 | |
Other affiliates | | | 223 | | | | 85 | | | | 142 | |
Professional fees | | | 2,030 | | | | 17,546 | | | | 10,339 | |
Transfer agent fees | | | 24,982 | | | | 16,632 | | | | 31,431 | |
Other accrued expenses | | | 3,301 | | | | 28,139 | | | | 27,056 | |
Variation margin on futures contracts | | | — | | | | — | | | | 6,791 | |
Variation margin on centrally cleared swaps | | | — | | | | — | | | | 7,462 | |
Swap premiums received | | | — | | | | 1,640 | | | | 188 | |
Unrealized depreciation on: | | | | | | | | | | | | |
Forward foreign currency exchange contracts | | | — | | | | — | | | | 52,342 | |
OTC swaps | | | — | | | | 4,367 | | | | 3,209 | |
Unfunded floating rate loan interests | | | — | | | | 74 | | | | — | |
| | | | | | | | | | | | |
Total liabilities | | | 102,590 | | | | 683,361 | | | | 47,849,045 | |
| | | | | | | | | | | | |
| | | |
NET ASSETS | | $ | 131,360,600 | | | $ | 27,067,859 | | | $ | 53,941,098 | |
| | | | | | | | | | | | |
See notes to financial statements.
Statements of Assets and Liabilities (continued)
December 31, 2018
| | | | | | | | | | | | |
| | | BlackRock
Government Money Market
Portfolio | | | BlackRock High
Yield Portfolio | | | BlackRock U.S.
Government Bond Portfolio | |
| | | |
NET ASSETS CONSIST OF | | | | | | | | | | | | |
Paid-in capital | | $ | 131,359,718 | | | $ | 30,941,011 | | | $ | 57,629,679 | |
Accumulated earnings (loss) | | | 882 | | | | (3,873,152 | ) | | | (3,688,581 | ) |
| | | | | | | | | | | | |
NET ASSETS | | $ | 131,360,600 | | | $ | 27,067,859 | | | $ | 53,941,098 | |
| | | | | | | | | | | | |
| | | |
Share outstanding, $0.10 par value(g) | | | 131,359,724 | | | | 5,416,319 | | | | 5,096,002 | |
| | | | | | | | | | | | |
| | | |
Net asset value | | $ | 1.00 | | | $ | 5.00 | | | $ | 10.58 | |
| | | | | | | | | | | | |
| | | |
(a) Investments at cost — unaffiliated | | $ | 76,958,102 | | | $ | 27,645,732 | | | $ | 78,375,366 | |
(b) Investments at cost — affiliated | | $ | — | | | $ | 1,355,813 | | | $ | 1,608,196 | |
(c) Foreign currency at cost | | $ | — | | | $ | 2,871 | | | $ | 140,693 | |
(d) Repurchase agreements at cost — unaffiliated | | $ | 49,700,000 | | | $ | — | | | $ | — | |
(e) Premiums received | | $ | — | | | $ | — | | | $ | 47,816 | |
(f) Proceeds from TBA sale commitments | | $ | — | | | $ | — | | | $ | 14,894,774 | |
(g) Authorized shares | | | 2 billion | | | | 100 million | | | | 100 million | |
See notes to financial statements.
| | |
| 112 | | 2018 BLACKROCK ANNUAL REPORTTO SHAREHOLDERS |
Statements of Operations
Year Ended December 31, 2018
| | | | | | | | | | | | | | | | |
| | | BlackRock
Advantage
Large Cap Core Portfolio | | | BlackRock
Balanced Capital Portfolio | | | BlackRock
Capital
Appreciation
Portfolio | | | BlackRock
Global
Allocation
Portfolio (a) | |
| | | | |
INVESTMENT INCOME | | | | | | | | | | | | | | | | |
Dividends — affiliated | | $ | 29,009 | | | $ | 664,546 | | | $ | 28,243 | | | $ | 53,944 | |
Dividends — unaffiliated | | | 3,731,008 | (b) | | | 6,007,933 | | | | 1,458,417 | (c) | | | 2,678,879 | |
Interest — unaffiliated | | | — | | | | 5,901,261 | | | | — | | | | 1,894,255 | |
Securities lending income — affiliated — net | | | 6,147 | | | | 10,878 | | | | 20,600 | | | | 18,967 | |
Foreign taxes withheld | | | (6,542 | ) | | | (24,974 | ) | | | — | | | | (179,010 | ) |
| | | | | | | | | | | | | | | | |
Total investment income | | | 3,759,622 | | | | 12,559,644 | | | | 1,507,260 | | | | 4,467,035 | |
| | | | | | | | | | | | | | | | |
| | | | |
EXPENSES | | | | | | | | | | | | | | | | |
Investment advisory | | | 687,934 | | | | 1,846,963 | | | | 677,761 | | | | 729,816 | |
Transfer agent | | | 266,172 | | | | 738,473 | | | | 264,809 | | | | 308,628 | |
Custodian | | | 53,619 | | | | 145,313 | | | | 11,124 | | | | 222,213 | |
Professional | | | 52,943 | | | | 75,197 | | | | 49,586 | | | | 95,268 | |
Accounting services | | | 52,013 | | | | 141,790 | | | | 51,667 | | | | 116,409 | |
Printing | | | 27,252 | | | | 26,987 | | | | 11,717 | | | | 12,315 | |
Directors and Officer | | | 18,701 | | | | 21,766 | | | | 18,205 | | | | 17,176 | |
Pricing | | | 1,373 | | | | 80,088 | | | | 1,133 | | | | 26,793 | |
Board realignment and consolidation | | | 1,262 | | | | 1,467 | | | | 1,251 | | | | 1,276 | |
Registration | | | 704 | | | | 704 | | | | 704 | | | | 704 | |
Miscellaneous | | | 11,324 | | | | 5,735 | | | | 6,035 | | | | 4,730 | |
| | | | | | | | | | | | | | | | |
Total expenses excluding dividend expense and interest expense | | | 1,173,297 | | | | 3,084,483 | | | | 1,093,992 | | | | 1,535,328 | |
| | | | | | | | | | | | | | | | |
Dividend expense — unaffiliated | | | — | | | | — | | | | — | | | | 15,459 | |
Interest expense | | | — | | | | 122,700 | | | | — | | | | — | |
| | | | | | | | | | | | | | | | |
Total expenses | | | 1,173,297 | | | | 3,207,183 | | | | 1,093,992 | | | | 1,550,787 | |
| | | | | | | | | | | | | | | | |
Less: | | | | | | | | | | | | | | | | |
Transfer agent fees waived and/or reimbursed | | | (233,495 | ) | | | (579,288 | ) | | | (186,173 | ) | | | (303,213 | ) |
Fees waived and/or reimbursed by the Manager | | | (3,026 | ) | | | (34,249 | ) | | | (1,198 | ) | | | (97,045 | ) |
| | | | | | | | | | | | | | | | |
Total expenses after fees waived and/or reimbursed | | | 936,776 | | | | 2,593,646 | | | | 906,621 | | | | 1,150,529 | |
| | | | | | | | | | | | | | | | |
Net investment income | | | 2,822,846 | | | | 9,965,998 | | | | 600,639 | | | | 3,316,506 | |
| | | | | | | | | | | | | | | | |
| | | | |
REALIZED AND UNREALIZED GAIN (LOSS) | | | | | | | | | | | | | | | | |
Net realized gain (loss) from: | | | | | | | | | | | | | | | | |
Investments — affiliated | | | (1,907 | ) | | | 176,106 | | | | (2,428 | ) | | | 1,209 | |
Investments — unaffiliated | | | 16,210,773 | | | | 20,020,373 | | | | 17,306,610 | | | | 6,780,183 | (d) |
Borrowed bonds | | | — | | | | (15,321 | ) | | | — | | | | — | |
Forward foreign currency exchange contracts | | | — | | | | (270,333 | ) | | | — | | | | (267,965 | ) |
Foreign currency transactions | | | — | | | | 66,114 | | | | (30 | ) | | | 224,060 | |
Futures contracts | | | (70,904 | ) | | | 1,863,552 | | | | — | | | | 16,345 | |
Options written | | | — | | | | 506,180 | | | | — | | | | 237,418 | |
Short sales — unaffiliated | | | — | | | | 489,891 | | | | — | | | | 83,731 | |
Swaps | | | — | | | | (64,047 | ) | | | — | | | | 133,707 | |
| | | | | | | | | | | | | | | | |
| | | 16,137,962 | | | | 22,772,515 | | | | 17,304,152 | | | | 7,208,688 | |
| | | | | | | | | | | | | | | | |
Net change in unrealized appreciation (depreciation) on: | | | | | | | | | | | | | | | | |
Investments — affiliated | | | (257 | ) | | | 64,823 | | | | 223 | | | | (55,426 | ) |
Investments — unaffiliated | | | (26,751,355 | ) | | | (44,276,014 | ) | | | (12,615,433 | ) | | | (23,388,485 | )(e) |
Borrowed bonds | | | — | | | | (64,978 | ) | | | — | | | | — | |
Forward foreign currency exchange contracts | | | — | | | | (142,115 | ) | | | — | | | | (149,643 | ) |
Foreign currency translations | | | — | | | | (8,843 | ) | | | — | | | | (3,273 | ) |
Futures contracts | | | (35,342 | ) | | | 313,483 | | | | — | | | | 121,743 | |
Options written | | | — | | | | (155,988 | ) | | | — | | | | (710,680 | ) |
Short sales — unaffiliated | | | — | | | | — | | | | — | | | | 105,564 | |
Swaps | | | — | | | | 110,369 | | | | — | | | | (322,380 | ) |
| | | | | | | | | | | | | | | | |
| | | (26,786,954 | ) | | | (44,159,263 | ) | | | (12,615,210 | ) | | | (24,402,580 | ) |
| | | | | | | | | | | | | | | | |
Net realized and unrealized gain (loss) | | | (10,648,992 | ) | | | (21,386,748 | ) | | | 4,688,942 | | | | (17,193,892 | ) |
| | | | | | | | | | | | | | | | |
NET INCREASE (DECREASE) IN NET ASSETS RESULTING FROM OPERATIONS | | $ | (7,826,146 | ) | | $ | (11,420,750 | ) | | $ | 5,289,581 | | | $ | (13,877,386 | ) |
| | | | | | | | | | | | | | | | |
| | | | |
(a) Consolidated Statement of Operations | | | | | | | | | | | | | | | | |
(b) Includesnon-recurring dividends in the amount of $107,355. | | | | | | | | | | | | | | | | |
(c) Includes non-recurring dividends in the amount of $398,693. | | | | | | | | | | | | | | | | |
(d) Net of $(4,338) foreign capital gain tax. | | | | | | | | | | | | | | | | |
(e) Net of $2,794 foreign capital gain tax. | | | | | | | | | | | | | | | | |
See notes to financial statements.
Statements of Operations
Year Ended December 31, 2018
| | | | | | | | | | | | |
| | | BlackRock
Government
Money Market
Portfolio | | | BlackRock
High Yield
Portfolio | | | BlackRock U.S.
Government
Bond Portfolio | |
| | | |
INVESTMENT INCOME | | | | | | | | | | | | |
Dividends — affiliated | | $ | — | | | $ | 9,363 | | | $ | 30,122 | |
Dividends — unaffiliated | | | — | | | | 28,047 | | | | 295 | |
Interest — unaffiliated | | | 2,403,101 | | | | 1,801,520 | | | | 1,772,484 | |
Foreign taxes withheld | | | — | | | | — | | | | (134 | ) |
| | | | | | | | | | | | |
Total investment income | | | 2,403,101 | | | | 1,838,930 | | | | 1,802,767 | |
| | | | | | | | | | | | |
| | | |
EXPENSES | | | | | | | | | | | | |
Investment advisory | | | 462,355 | | | | 109,745 | | | | 204,096 | |
Transfer agent | | | 195,163 | | | | 48,446 | | | | 87,698 | |
Professional | | | 58,413 | | | | 85,944 | | | | 68,393 | |
Accounting services | | | 39,041 | | | | 129,368 | | | | 75,200 | |
Directors and Officer | | | 17,436 | | | | 16,340 | | | | 16,619 | |
Custodian | | | 11,739 | | | | 21,358 | | | | 32,023 | |
Printing | | | 10,684 | | | | 9,894 | | | | 8,809 | |
Registration | | | 3,517 | | | | 704 | | | | 222 | |
Pricing | | | 1,897 | | | | 9,410 | | | | 56,623 | |
Board realignment and consolidation | | | 1,209 | | | | 154,157 | | | | 178,843 | |
Miscellaneous | | | 5,811 | | | | 5,326 | | | | 12,454 | |
| | | | | | | | | | | | |
Total expenses excluding interest expense | | | 807,265 | | | | 590,692 | | | | 740,980 | |
| | | | | | | | | | | | |
Interest expense | | | — | | | | — | | | | 197,421 | |
| | | | | | | | | | | | |
Total expenses | | | 807,265 | | | | 590,692 | | | | 938,401 | |
| | | | | | | | | | | | |
Less: | | | | | | | | | | | | |
Transfer agent fees waived and/or reimbursed | | | (175,939 | ) | | | (43,449 | ) | | | (82,697 | ) |
Fees waived and/or reimbursed by the Manager | | | (5,475 | ) | | | (398,032 | ) | | | (380,702 | ) |
| | | | | | | | | | | | |
Total expenses after fees waived and/or reimbursed | | | 625,851 | | | | 149,211 | | | | 475,002 | |
| | | | | | | | | | | | |
Net investment income | | | 1,777,250 | | | | 1,689,719 | | | | 1,327,765 | |
| | | | | | | | | | | | |
| | | |
REALIZED AND UNREALIZED GAIN (LOSS) | | | | | | | | | | | | |
Net realized gain (loss) from: | | | | | | | | | | | | |
Investments — affiliated | | | — | | | | (1,178 | ) | | | — | |
Investments — unaffiliated | | | 715 | | | | (58,521 | ) | | | (768,870 | ) |
Borrowed bonds | | | — | | | | — | | | | 34 | |
Forward foreign currency exchange contracts | | | — | | | | (17,312 | ) | | | 101,063 | |
Foreign currency transactions | | | — | | | | (14,610 | ) | | | 12,781 | |
Futures contracts | | | — | | | | 6,224 | | | | 47,716 | |
Options written | | | — | | | | 10,486 | | | | 74,152 | |
Payment by affiliate | | | — | | | | 2,724 | (a) | | | — | |
Swaps | | | — | | | | 17,284 | | | | (61,146 | ) |
| | | | | | | | | | | | |
| | | 715 | | | | (54,903 | ) | | | (594,270 | ) |
| | | | | | | | | | | | |
Net change in unrealized appreciation (depreciation) on: | | | | | | | | | | | | |
Investments — affiliated | | | — | | | | 270 | | | | — | |
Investments — unaffiliated | | | — | | | | (2,322,620 | ) | | | (248,355 | ) |
Forward foreign currency exchange contracts | | | — | | | | 3,209 | | | | 19,689 | |
Foreign currency translations | | | — | | | | (102 | ) | | | (737 | ) |
Futures contracts | | | — | | | | 7,035 | | | | 90,270 | |
Options written | | | — | | | | — | | | | (85,462 | ) |
Swaps | | | — | | | | (8,927 | ) | | | (54,894 | ) |
Unfunded floating rate loan interests | | | — | | | | (80 | ) | | | — | |
| | | | | | | | | | | | |
| | | — | | | | (2,321,215 | ) | | | (279,489 | ) |
| | | | | | | | | | | | |
Net realized and unrealized gain (loss) | | | 715 | | | | (2,376,118 | ) | | | (873,759 | ) |
| | | | | | | | | | | | |
NET INCREASE (DECREASE) IN NET ASSETS RESULTING FROM OPERATIONS | | $ | 1,777,965 | | | $ | (686,399 | ) | | $ | 454,006 | |
| | | | | | | | | | | | |
| (a) | See Note 6 of the Notes to Financial Statements. |
See notes to financial statements.
| | |
| 114 | | 2018 BLACKROCK ANNUAL REPORTTO SHAREHOLDERS |
Statements of Changes in Net Assets
| | | | | | | | | | | | | | | | | | | | |
| | | BlackRock Advantage Large Cap
Core Portfolio | | | | | | BlackRock Balanced Capital
Portfolio | |
| | | Year Ended December 31, | | | | | | Year Ended December 31, | |
| | 2018 | | | 2017 | | | | | | 2018 | | | 2017 | |
| | | | | |
INCREASE (DECREASE) IN NET ASSETS | | | | | | | | | | | | | | | | | | | | |
| | | | | |
OPERATIONS | | | | | | | | | | | | | | | | | | | | |
Net investment income | | $ | 2,822,846 | | | $ | 2,397,763 | | | | | | | $ | 9,965,998 | | | $ | 8,916,319 | |
Net realized gain | | | 16,137,962 | | | | 47,477,016 | | | | | | | | 22,772,515 | | | | 84,848,949 | |
Net change in unrealized appreciation (depreciation) | | | (26,786,954 | ) | | | (14,151,938 | ) | | | | | | | (44,159,263 | ) | | | (25,392,201 | ) |
| | | | | | | | | | | | | | | | | | | | |
Net increase (decrease) in net assets resulting from operations | | | (7,826,146 | ) | | | 35,722,841 | | | | | | | | (11,420,750 | ) | | | 68,373,067 | |
| | | | | | | | | | | | | | | | | | | | |
| | | | | |
DISTRIBUTIONS TO SHAREHOLDERS(a)(b) | | | | | | | | | | | | | | | | | | | | |
Decrease in net assets resulting from distributions to shareholders | | | (23,736,716 | ) | | | (51,414,199 | ) | | | | | | | (42,865,047 | ) | | | (94,650,453 | ) |
| | | | | | | | | | | | | | | | | | | | |
| | | | | |
CAPITAL SHARE TRANSACTIONS | | | | | | | | | | | | | | | | | | | | |
Net increase (decrease) in net assets derived from capital share transactions | | | 5,438,391 | | | | 35,241,835 | | | | | | | | (3,877,300 | ) | | | 47,028,541 | |
| | | | | | | | | | | | | | | | | | | | |
| | | | | |
NET ASSETS(b) | | | | | | | | | | | | | | | | | | | | |
Total increase (decrease) in net assets | | | (26,124,471 | ) | | | 19,550,477 | | | | | | | | (58,163,097 | ) | | | 20,751,155 | |
Beginning of year | | | 187,537,561 | | | | 167,987,084 | | | | | | | | 511,192,740 | | | | 490,441,585 | |
| | | | | | | | | | | | | | | | | | | | |
End of year | | $ | 161,413,090 | | | $ | 187,537,561 | | | | | | | $ | 453,029,643 | | | $ | 511,192,740 | |
| | | | | | | | | | | | | | | | | | | | |
| (a) | Distributions for annual periods determined in accordance with U.S. federal income tax regulations. |
| (b) | Prior year distribution character information and undistributed net investment income has been modified or removed to conform with current year RegulationS-X presentation changes. Refer to Note 12 for this prior year information. |
See notes to financial statements.
Statements of Changes in Net Assets
| | | | | | | | | | | | | | | | | | | | |
| | | BlackRock Capital Appreciation
Portfolio | | | | | | BlackRock Global Allocation
Portfolio (a) | |
| | | Year Ended December 31, | | | | | | Year Ended December 31, | |
| | 2018 | | | 2017 | | | | | | 2018 | | | 2017 | |
| | | | | |
INCREASE (DECREASE) IN NET ASSETS | | | | | | | | | | | | | | | | | | | | |
| | | | | |
OPERATIONS | | | | | | | | | | | | | | | | | | | | |
Net investment income | | $ | 600,639 | | | $ | 464,587 | | | | | | | $ | 3,316,506 | | | $ | 3,291,636 | |
Net realized gain | | | 17,304,152 | | | | 15,183,647 | | | | | | | | 7,208,688 | | | | 8,073,637 | |
Net change in unrealized appreciation (depreciation) | | | (12,615,210 | ) | | | 29,407,057 | | | | | | | | (24,402,580 | ) | | | 16,327,473 | |
| | | | | | | | | | | | | | | | | | | | |
Net increase (decrease) in net assets resulting from operations | | | 5,289,581 | | | | 45,055,291 | | | | | | | | (13,877,386 | ) | | | 27,692,746 | |
| | | | | | | | | | | | | | | | | | | | |
| | | | | |
DISTRIBUTIONS TO SHAREHOLDERS(b)(c) | | | | | | | | | | | | | | | | | | | | |
Decrease in net assets resulting from distributions to shareholders | | | (19,636,188 | ) | | | (16,717,731 | ) | | | | | | | (12,321,000 | ) | | | (2,964,477 | ) |
| | | | | | | | | | | | | | | | | | | | |
| | | | | |
CAPITAL SHARE TRANSACTIONS | | | | | | | | | | | | | | | | | | | | |
Net increase (decrease) in net assets derived from capital share transactions | | | 6,382,954 | | | | 3,473,022 | | | | | | | | (11,373,660 | ) | | | (19,698,247 | ) |
| | | | | | | | | | | | | | | | | | | | |
| | | | | |
NET ASSETS(c) | | | | | | | | | | | | | | | | | | | | |
Total increase (decrease) in net assets | | | (7,963,653 | ) | | | 31,810,582 | | | | | | | | (37,572,046 | ) | | | 5,030,022 | |
Beginning of year | | | 170,829,719 | | | | 139,019,137 | | | | | | | | 211,555,108 | | | | 206,525,086 | |
| | | | | | | | | | | | | | | | | | | | |
End of year | | $ | 162,866,066 | | | $ | 170,829,719 | | | | | | | $ | 173,983,062 | | | $ | 211,555,108 | |
| | | | | | | | | | | | | | | | | | | | |
| (a) | Consolidated Statements of Changes in Net Assets |
| (b) | Distributions for annual periods determined in accordance with U.S. federal income tax regulations. |
| (c) | Prior year distribution character information and (distributions in excess of) net investment income has been modified or removed to conform with current year RegulationS-X presentation changes. Refer to Note 12 for this prior year information. |
See notes to financial statements.
| | |
| 116 | | 2018 BLACKROCK ANNUAL REPORTTO SHAREHOLDERS |
Statements of Changes in Net Assets
| | | | | | | | | | | | | | | | | | | | |
| | | BlackRock Government Money
Market Portfolio | | | | | | BlackRock High Yield Portfolio | |
| | | Year Ended December 31, | | | | | | Year Ended December 31, | |
| | 2018 | | | 2017 | | | | | | 2018 | | | 2017 | |
| | | | | |
INCREASE (DECREASE) IN NET ASSETS | | | | | | | | | | | | | | | | | | | | |
| | | | | |
OPERATIONS | | | | | | | | | | | | | | | | | | | | |
Net investment income | | $ | 1,777,250 | | | $ | 498,444 | | | | | | | $ | 1,689,719 | | | $ | 1,851,923 | |
Net realized gain (loss) | | | 715 | | | | 533 | | | | | | | | (54,903 | ) | | | 920,556 | |
Net change in unrealized appreciation (depreciation) | | | — | | | | — | | | | | | | | (2,321,215 | ) | | | (186,639 | ) |
| | | | | | | | | | | | | | | | | | | | |
Net increase (decrease) in net assets resulting from operations | | | 1,777,965 | | | | 498,977 | | | | | | | | (686,399 | ) | | | 2,585,840 | |
| | | | | | | | | | | | | | | | | | | | |
| | | | | |
DISTRIBUTIONS TO SHAREHOLDERS(a)(b) | | | | | | | | | | | | | | | | | | | | |
From net investment income and net realized gain | | | (1,777,250 | ) | | | (498,810 | ) | | | | | | | (1,697,206 | ) | | | (1,883,102 | ) |
From return of capital | | | — | | | | — | | | | | | | | (8,797 | ) | | | — | |
| | | | | | | | | | | | | | | | | | | | |
Decrease in net assets resulting from distributions to shareholders | | | (1,777,250 | ) | | | (498,810 | ) | | | | | | | (1,706,003 | ) | | | (1,883,102 | ) |
| | | | | | | | | | | | | | | | | | | | |
| | | | | |
CAPITAL SHARE TRANSACTIONS | | | | | | | | | | | | | | | | | | | | |
Net increase (decrease) in net assets derived from capital share transactions | | | 24,060,474 | | | | (14,758,053 | ) | | | | | | | (2,544,915 | ) | | | (2,491,823 | ) |
| | | | | | | | | | | | | | | | | | | | |
| | | | | |
NET ASSETS(b) | | | | | | | | | | | | | | | | | | | | |
Total increase (decrease) in net assets | | | 24,061,189 | | | | (14,757,886 | ) | | | | | | | (4,937,317 | ) | | | (1,789,085 | ) |
Beginning of year | | | 107,299,411 | | | | 122,057,297 | | | | | | | | 32,005,176 | | | | 33,794,261 | |
| | | | | | | | | | | | | | | | | | | | |
End of year | | $ | 131,360,600 | | | $ | 107,299,411 | | | | | | | $ | 27,067,859 | | | $ | 32,005,176 | |
| | | | | | | | | | | | | | | | | | | | |
| (a) | Distributions for annual periods determined in accordance with U.S. federal income tax regulations. |
| (b) | Prior year distribution character information and undistributed (distributions in excess of) net investment income has been modified or removed to conform with current year RegulationS-X presentation changes. Refer to Note 12 for this prior year information. |
See notes to financial statements.
Statements of Changes in Net Assets
| | | | | | | | |
| | | BlackRock U.S. Government
Bond Portfolio | |
| | | Year Ended December 31, | |
| | | 2018 | | | 2017 | |
| | |
INCREASE (DECREASE) IN NET ASSETS | | | | | | | | |
| | |
OPERATIONS | | | | | | | | |
Net investment income | | $ | 1,327,765 | | | $ | 1,097,605 | |
Net realized loss | | | (594,270 | ) | | | (923,940 | ) |
Net change in unrealized appreciation (depreciation) | | | (279,489 | ) | | | 876,423 | |
| | | | | | | | |
Net increase in net assets resulting from operations | | | 454,006 | | | | 1,050,088 | |
| | | | | | | | |
| | |
DISTRIBUTIONS TO SHAREHOLDERS(a)(b) | | | | | | | | |
Decrease in net assets resulting from distributions to shareholders | | | (1,565,228 | ) | | | (1,311,639 | ) |
| | | | | | | | |
| | |
CAPITAL SHARE TRANSACTIONS | | | | | | | | |
Net increase (decrease) in net assets derived from capital share transactions | | | 472,083 | | | | (5,663,932 | ) |
| | | | | | | | |
| | |
NET ASSETS(b) | | | | | | | | |
Total decrease in net assets | | | (639,139 | ) | | | (5,925,483 | ) |
Beginning of year | | | 54,580,237 | | | | 60,505,720 | |
| | | | | | | | |
End of year | | $ | 53,941,098 | | | $ | 54,580,237 | |
| | | | | | | | |
| (a) | Distributions for annual periods determined in accordance with U.S. federal income tax regulations. |
| (b) | Prior year distribution character information and undistributed net investment income has been modified or removed to conform with current year RegulationS-X presentation changes. Refer to Note 12 for this prior year information. |
See notes to financial statements.
| | |
| 118 | | 2018 BLACKROCK ANNUAL REPORTTO SHAREHOLDERS |
Statement of Cash Flows
Year Ended December 31, 2018
| | | | |
| | | BlackRock U.S.
Government Bond
Portfolio | |
| |
CASH USED FOR OPERATING ACTIVITIES | | | | |
Net increase in net assets resulting from operations | | $ | 454,006 | |
Adjustments to reconcile net increase in net assets resulting from operations to net cash provided for operating activities: | | | | |
Proceeds from sales of long-term investments and principal paydowns | | | 460,250,521 | |
Purchases of long term investments | | | (466,332,925 | ) |
Net purchases of short-term securities | | | (414,676 | ) |
Amortization of premium and accretion of discount on investments | | | (25,227 | ) |
Premiums received from options written | | | 345,328 | |
Premiums paid on closing options written | | | (276,367 | ) |
Net realized (gain) loss on investments and options written | | | 694,683 | |
Net unrealized (appreciation) depreciation on investments, forward foreign currency exchange contracts, foreign currency translations, options written and swaps | | | 310,299 | |
| |
| (Increase) Decrease in Assets: | | | |
Receivables: | | | | |
Dividends — affiliated | | | 326 | |
Dividends — unaffiliated | | | (8,517 | ) |
Interest — unaffiliated | | | (79,663 | ) |
From the Manager | | | (118,434 | ) |
Investment adviser | | | (4,201 | ) |
Variation margin on futures contracts | | | (22,258 | ) |
Variation margin on centrally cleared swaps | | | 2,788 | |
Swap premiums paid | | | (3,137 | ) |
Prepaid expenses | | | 191 | |
Other assets | | | 22,461 | |
| |
| Increase (Decrease) in Liabilities: | | | |
Payables: | | | | |
Accounting services fees | | | (7,780 | ) |
Board realignment and consolidation | | | 178,843 | |
Custodian fees | | | (20,494 | ) |
Directors’ and Officer’s fees | | | (62 | ) |
Printing fees | | | 5,030 | |
Professional fees | | | (34,926 | ) |
Transfer agent fees | | | 31,431 | |
Other accrued expenses | | | (40,723 | ) |
Other affiliates | | | (262 | ) |
Variation margin on futures contracts | | | (3,640 | ) |
Variation margin on centrally cleared swaps | | | 7,462 | |
Interest expense and fees | | | 670 | |
Swap premiums received | | | (3,323 | ) |
| | | | |
Net cash used for operating activities | | | (5,092,576 | ) |
| | | | |
| |
CASH PROVIDED BY FINANCING ACTIVITIES | | | | |
Cash dividends paid to shareholders | | | 1 | |
Payments on redemption of capital shares | | | (8,985,464 | ) |
Proceeds from issuance of capital shares | | | 8,076,002 | |
Net borrowing of reverse repurchase agreements | | | 5,998,933 | |
Increase in bank overdraft | | | 1,024 | |
| | | | |
Net cash provided by financing activities | | | 5,090,496 | |
| | | | |
| |
CASH IMPACT FROM FOREIGN EXCHANGE FLUCTUATIONS | | | | |
Cash impact from foreign exchange fluctuations | | | (452 | ) |
| | | | |
| |
CASH AND FOREIGN CURRENCY | | | | |
Net decrease in restricted and unrestricted cash and foreign currency | | | (2,532 | ) |
Restricted and unrestricted cash and foreign currency at beginning of year | | | 372,413 | |
| | | | |
Restricted and unrestricted cash and foreign currency at end of year | | $ | 369,881 | |
| | | | |
| |
SUPPLEMENTAL DISCLOSURE OF CASH FLOW INFORMATION | | | | |
Cash paid during the period for interest expense | | $ | 196,751 | |
| | | | |
| |
NON-CASH FINANCING ACTIVITIES | | | | |
Capital shares issued in reinvestment of dividends and distributions paid to shareholders | | $ | 1,539,514 | |
| | | | |
See notes to financial statements.
Statement of Cash Flows (continued)
Year Ended December 31, 2018
| | | | | | | | |
| | | Year Ended
December 31, 2018 | | | Year Ended
December 31, 2017 | |
| | |
RECONCILIATION OF RESTRICTED AND UNRESTRICTED CASH AND FOREIGN CURRENCY TO THE STATEMENTS OF ASSETS AND LIABILITIES | | | | | | | | |
Cash | | $ | — | | | $ | 23,568 | |
Cash Pledged: | | | | | | | | |
Futures contracts | | | 84,540 | | | | 110,540 | |
Centrally cleared swaps | | | 145,000 | | | | 138,000 | |
Foreign currency at value | | | 140,341 | | | | 100,305 | |
| | | | | | | | |
| | $ | 369,881 | | | $ | 372,413 | |
| | | | | | | | |
See notes to financial statements.
| | |
| 120 | | 2018 BLACKROCK ANNUAL REPORTTO SHAREHOLDERS |
Financial Highlights
(For a share outstanding throughout each period)
| | | | | | | | | | | | | | | | | | | | |
| | | BlackRock Advantage Large Cap Core Portfolio | |
| |
| | | Year Ended December 31, | |
| | 2018 | | | 2017 | | | 2016 | | | 2015 | | | 2014 | |
| | | | | |
Net asset value, beginning of year | | $ | 24.31 | | | $ | 27.15 | | | $ | 26.53 | | | $ | 28.11 | | | $ | 27.50 | |
| | | | | | | | | | | | | | | | | | | | |
Net investment income(a) | | | 0.38 | (b) | | | 0.40 | | | | 0.36 | | | | 0.32 | | | | 0.29 | |
Net realized and unrealized gain (loss) | | | (1.62 | ) | | | 5.58 | | | | 2.47 | | | | (0.15 | ) | | | 3.23 | |
| | | | | | | | | | | | | | | | | | | | |
Net increase (decrease) from investment operations | | | (1.24 | ) | | | 5.98 | | | | 2.83 | | | | 0.17 | | | | 3.52 | |
| | | | | | | | | | | | | | | | | | | | |
| | | | | |
| Distributions(c) | | | | | | | | | | | | | | | |
From net investment income | | | (0.39 | ) | | | (0.41 | ) | | | (0.37 | ) | | | (0.33 | ) | | | (0.32 | ) |
From net realized gain | | | (2.92 | ) | | | (8.41 | ) | | | (1.84 | ) | | | (1.42 | ) | | | (2.59 | ) |
| | | | | | | | | | | | | | | | | | | | |
Total distributions | | | (3.31 | ) | | | (8.82 | ) | | | (2.21 | ) | | | (1.75 | ) | | | (2.91 | ) |
| | | | | | | | | | | | | | | | | | | | |
| | | | | |
Net asset value, end of year | | $ | 19.76 | | | $ | 24.31 | | | $ | 27.15 | | | $ | 26.53 | | | $ | 28.11 | |
| | | | | | | | | | | | | | | | | | | | |
| | | | | |
| Total Return(d) | | | | | | | | | | | | | | | |
Based on net asset value | | | (5.11 | )% | | | 22.24 | % | | | 10.69 | % | | | 0.60 | % | | | 12.79 | % |
| | | | | | | | | | | | | | | | | | | | |
| | | | | |
Ratios to Average Net Assets | | | | | | | | | | | | | | | | | | | | |
Total expenses | | | 0.63 | % | | | 0.63 | % | | | 0.60 | % | | | 0.60 | % | | | 0.59 | % |
| | | | | | | | | | | | | | | | | | | | |
Total expenses after fees waived and/or reimbursed | | | 0.50 | % | | | 0.50 | % | | | 0.50 | % | | | 0.50 | % | | | 0.49 | % |
| | | | | | | | | | | | | | | | | | | | |
Net investment income | | | 1.51 | %(b) | | | 1.35 | % | | | 1.36 | % | | | 1.14 | % | | | 1.03 | % |
| | | | | | | | | | | | | | | | | | | | |
| | | | | |
Supplemental Data | | | | | | | | | | | | | | | | | | | | |
Net assets, end of year (000) | | $ | 161,413 | | | $ | 187,538 | | | $ | 167,987 | | | $ | 169,173 | | | $ | 184,854 | |
| | | | | | | | | | | | | | | | | | | | |
Portfolio turnover rate | | | 151 | % | | | 154 | % | | | 48 | % | | | 31 | % | | | 47 | % |
| | | | | | | | | | | | | | | | | | | | |
| (a) | Based on average shares outstanding. |
| (b) | Net investment income per share and the ratio of net investment income to average net assets includes $0.01 per share and 0.06%, respectively, resulting from a non-recurring dividend. |
| (c) | Distributions for annual periods determined in accordance with U.S. federal income tax regulations. |
| (d) | Where applicable, excludes insurance-related fees and expenses and assumes the reinvestment of distributions. |
See notes to financial statements.
Financial Highlights (continued)
(For a share outstanding throughout each period)
��
| | | | | | | | | | | | | | | | | | | | |
| | | BlackRock Balanced Capital Portfolio | |
| |
| | | Year Ended December 31, | |
| | 2018 | | | 2017 | | | 2016 | | | 2015 | | | 2014 | |
| | | | | |
Net asset value, beginning of year | | $ | 15.81 | | | $ | 16.87 | | | $ | 16.74 | | | $ | 17.81 | | | $ | 18.26 | |
| | | | | | | | | | | | | | | | | | | | |
Net investment income(a) | | | 0.32 | | | | 0.31 | | | | 0.29 | | | | 0.28 | | | | 0.33 | |
Net realized and unrealized gain (loss) | | | (0.73 | ) | | | 2.14 | | | | 1.16 | | | | (0.19 | ) | | | 1.67 | |
| | | | | | | | | | | | | | | | | | | | |
Net increase (decrease) from investment operations | | | (0.41 | ) | | | 2.45 | | | | 1.45 | | | | 0.09 | | | | 2.00 | |
| | | | | | | | | | | | | | | | | | | | |
| | | | | |
| Distributions(b) | | | | | | | | | | | | | | | |
From net investment income | | | (0.31 | ) | | | (0.34 | ) | | | (0.30 | ) | | | (0.30 | ) | | | (0.36 | ) |
From net realized gain | | | (1.12 | ) | | | (3.17 | ) | | | (1.02 | ) | | | (0.86 | ) | | | (2.09 | ) |
| | | | | | | | | | | | | | | | | | | | |
Total distributions | | | (1.43 | ) | | | (3.51 | ) | | | (1.32 | ) | | | (1.16 | ) | | | (2.45 | ) |
| | | | | | | | | | | | | | | | | | | | |
| | | | | |
Net asset value, end of year | | $ | 13.97 | | | $ | 15.81 | | | $ | 16.87 | | | $ | 16.74 | | | $ | 17.81 | |
| | | | | | | | | | | | | | | | | | | | |
| | | | | |
| Total Return(c) | | | | | | | | | | | | | | | |
Based on net asset value | | | (2.66 | )% | | | 14.59 | % | | | 8.65 | % | | | 0.52 | % | | | 11.07 | % |
| | | | | | | | | | | | | | | | | | | | |
| | | | | |
Ratios to Average Net Assets(d) | | | | | | | | | | | | | | | | | | | | |
Total expenses | | | 0.64 | % | | | 0.66 | % | | | 0.62 | % | | | 0.61 | % | | | 0.57 | % |
| | | | | | | | | | | | | | | | | | | | |
Total expenses after fees waived and/or reimbursed | | | 0.52 | % | | | 0.53 | % | | | 0.52 | % | | | 0.50 | % | | | 0.48 | % |
| | | | | | | | | | | | | | | | | | | | |
Total expenses after fees waived and/or reimbursed and excluding interest expense | | | 0.49 | % | | | 0.49 | % | | | 0.49 | % | | | 0.49 | % | | | 0.47 | % |
| | | | | | | | | | | | | | | | | | | | |
Net investment income | | | 1.98 | % | | | 1.75 | % | | | 1.72 | % | | | 1.54 | % | | | 1.72 | % |
| | | | | | | | | | | | | | | | | | | | |
| | | | | |
Supplemental Data | | | | | | | | | | | | | | | | | | | | |
Net assets, end of year (000) | | $ | 453,030 | | | $ | 511,193 | | | $ | 490,442 | | | $ | 499,439 | | | $ | 546,054 | |
| | | | | | | | | | | | | | | | | | | | |
Portfolio turnover rate(e) | | | 280 | % | | | 332 | % | | | 264 | % | | | 340 | % | | | 345 | % |
| | | | | | | | | | | | | | | | | | | | |
| (a) | Based on average shares outstanding. |
| (b) | Distributions for annual periods determined in accordance with U.S. federal income tax regulations. |
| (c) | Where applicable, excludes insurance-related fees and expenses and assumes the reinvestment of distributions. |
| (d) | Excludes expenses incurred indirectly as a result of investments in underlying funds as follows: |
| | | | | | | | | | | | | | | | | | | | | | | | | | | | | | | | | | | | | | | | |
| | | Year Ended December 31, | |
| | 2018 | | | | | | 2017 | | | | | | 2016 | | | | | | 2015 | | | | | | 2014 | | | | |
Investments in underlying funds | | | 0.02 | % | | | | | | | 0.01 | % | | | | | | | 0.01 | % | | | | | | | — | % | | | | | | | — | % | | | | |
| | | | | | | | | | | | | | | | | | | | | | | | | | | | | | | | | | | | | | | | |
| (e) | Includes mortgage dollar roll transactions (“MDRs”). Additional information regarding portfolio turnover rate is as follows: |
| | | | | | | | | | | | | | | | | | | | | | | | | | | | | | | | | | | | | | | | |
| | | Year Ended December 31, | |
| | 2018 | | | | | | 2017 | | | | | | 2016 | | | | | | 2015 | | | | | | 2014 | | | | |
Portfolio turnover rate (excluding MDRs) | | | 211 | % | | | | | | | 248 | % | | | | | | | 188 | % | | | | | | | 240 | % | | | | | | | 259 | % | | | | |
| | | | | | | | | | | | | | | | | | | | | | | | | | | | | | | | | | | | | | | | |
See notes to financial statements.
| | |
| 122 | | 2018 BLACKROCK ANNUAL REPORTTO SHAREHOLDERS |
Financial Highlights (continued)
(For a share outstanding throughout each period)
| | | | | | | | | | | | | | | | | | | | |
| | | BlackRock Capital Appreciation Portfolio | |
| |
| | | Year Ended December 31, | |
| | 2018 | | | 2017 | | | 2016 | | | 2015 | | | 2014 | |
| | | | | |
Net asset value, beginning of year | | $ | 40.56 | | | $ | 33.61 | | | $ | 34.32 | | | $ | 34.75 | | | $ | 38.16 | |
| | | | | | | | | | | | | | | | | | | | |
Net investment income(a) | | | 0.15 | (b) | | | 0.12 | (c) | | | 0.07 | (d) | | | 0.05 | | | | 0.07 | |
Net realized and unrealized gain | | | 0.83 | | | | 11.11 | | | | 0.07 | | | | 2.45 | | | | 3.33 | |
| | | | | | | | | | | | | | | | | | | | |
Net increase from investment operations | | | 0.98 | | | | 11.23 | | | | 0.14 | | | | 2.50 | | | | 3.40 | |
| | | | | | | | | | | | | | | | | | | | |
| | | | | |
| Distributions(e) | | | | | | | | | | | | | | | |
From net investment income | | | (0.14 | ) | | | (0.12 | ) | | | (0.08 | ) | | | (0.05 | ) | | | (0.07 | ) |
From net realized gain | | | (4.77 | ) | | | (4.16 | ) | | | (0.77 | ) | | | (2.88 | ) | | | (6.74 | ) |
| | | | | | | | | | | | | | | | | | | | |
Total distributions | | | (4.91 | ) | | | (4.28 | ) | | | (0.85 | ) | | | (2.93 | ) | | | (6.81 | ) |
| | | | | | | | | | | | | | | | | | | | |
| | | | | |
Net asset value, end of year | | $ | 36.63 | | | $ | 40.56 | | | $ | 33.61 | | | $ | 34.32 | | | $ | 34.75 | |
| | | | | | | | | | | | | | | | | | | | |
| | | | | |
| Total Return(f) | | | | | | | | | | | | | | | |
Based on net asset value | | | 2.42 | % | | | 33.62 | % | | | 0.40 | % | | | 7.09 | % | | | 9.12 | % |
| | | | | | | | | | | | | | | | | | | | |
| | | | | |
Ratios to Average Net Assets | | | | | | | | | | | | | | | | | | | | |
Total expenses | | | 0.59 | %(g) | | | 0.60 | % | | | 0.62 | % | | | 0.61 | % | | | 0.60 | % |
| | | | | | | | | | | | | | | | | | | | |
Total expenses after fees waived and/or reimbursed | | | 0.49 | %(g) | | | 0.51 | % | | | 0.53 | % | | | 0.51 | % | | | 0.51 | % |
| | | | | | | | | | | | | | | | | | | | |
Net investment income | | | 0.33 | %(b)g) | | | 0.29 | %(c) | | | 0.21 | %(d) | | | 0.14 | % | | | 0.19 | % |
| | | | | | | | | | | | | | | | | | | | |
| | | | | |
Supplemental Data | | | | | | | | | | | | | | | | | | | | |
Net assets, end of year (000) | | $ | 162,866 | | | $ | 170,830 | | | $ | 139,019 | | | $ | 156,722 | | | $ | 157,387 | |
| | | | | | | | | | | | | | | | | | | | |
Portfolio turnover rate | | | 45 | % | | | 48 | % | | | 86 | % | | | 71 | % | | | 99 | % |
| | | | | | | | | | | | | | | | | | | | |
| (a) | Based on average shares outstanding. |
| (b) | Net investment income per share and the ratio of net investment income to average net assets includes $0.10 per share and 0.22%, respectively, resulting from a non-recurring dividend. |
| (c) | Net investment income per share and the ratio of net investment income to average net assets includes $0.04 per share and 0.09%, respectively, resulting from a non-recurring dividend. |
| (d) | Net investment income per share and the ratio of net investment income to average net assets includes $0.03 per share and 0.08%, respectively, resulting from a non-recurring dividend. |
| (e) | Distributions for annual periods determined in accordance with U.S. federal income tax regulations. |
| (f) | Where applicable, excludes insurance-related fees and expenses and assumes the reinvestment of distributions. |
| (g) | Excludes expenses incurred indirectly as a result of investments in underlying funds of 0.01%. |
See notes to financial statements.
Financial Highlights (continued)
(For a share outstanding throughout each period)
| | | | | | | | | | | | | | | | | | | | |
| | | BlackRock Global Allocation Portfolio | |
| |
| | | Year Ended December 31,(a) | |
| | 2018 | | | 2017 | | | 2016 | | | 2015 | | | 2014 | |
| | | | | |
Net asset value, beginning of year | | $ | 16.42 | | | $ | 14.60 | | | $ | 14.25 | | | $ | 15.55 | | | $ | 16.97 | |
| | | | | | | | | | | | | | | | | | | | |
Net investment income(b) | | | 0.27 | | | | 0.25 | | | | 0.23 | | | | 0.24 | | | | 0.31 | |
Net realized and unrealized gain (loss) | | | (1.44 | ) | | | 1.80 | | | | 0.37 | | | | (0.35 | ) | | | 0.12 | |
| | | | | | | | | | | | | | | | | | | | |
Net increase (decrease) from investment operations | | | (1.17 | ) | | | 2.05 | | | | 0.60 | | | | (0.11 | ) | | | 0.43 | |
| | | | | | | | | | | | | | | | | | | | |
| | | | | |
| Distributions(c) | | | | | | | | | | | | | | | |
From net investment income | | | (0.24 | ) | | | (0.23 | ) | | | (0.25 | ) | | | (0.30 | ) | | | (0.43 | ) |
From net realized gain | | | (0.81 | ) | | | — | | | | — | | | | (0.89 | ) | | | (1.42 | ) |
From return of capital | | | — | | | | — | | | | — | | | | — | (d) | | | — | |
| | | | | | | | | | | | | | | | | | | | |
Total distributions | | | (1.05 | ) | | | (0.23 | ) | | | (0.25 | ) | | | (1.19 | ) | | | (1.85 | ) |
| | | | | | | | | | | | | | | | | | | | |
| | | | | |
Net asset value, end of year | | $ | 14.20 | | | $ | 16.42 | | | $ | 14.60 | | | $ | 14.25 | | | $ | 15.55 | |
| | | | | | | | | | | | | | | | | | | | |
| | | | | |
| Total Return(e) | | | | | | | | | | | | | | | |
Based on net asset value | | | (7.27 | )% | | | 14.05 | % | | | 4.17 | % | | | (0.74 | )% | | | 2.52 | % |
| | | | | | | | | | | | | | | | | | | | |
| | | | | |
Ratios to Average Net Assets(f) | | | | | | | | | | | | | | | | | | | | |
Total expenses | | | 0.78 | % | | | 0.79 | % | | | 0.83 | % | | | 0.77 | % | | | 0.72 | % |
| | | | | | | | | | | | | | | | | | | | |
Total expenses after fees waived and/or reimbursed | | | 0.58 | % | | | 0.58 | % | | | 0.58 | % | | | 0.58 | % | | | 0.57 | % |
| | | | | | | | | | | | | | | | | | | | |
Total expenses after fees waived and/or reimbursed and excluding dividend expense, broker fees and expenses on short sales, interest expense and stock loan fees | | | 0.57 | % | | | 0.57 | % | | | 0.57 | % | | | 0.57 | % | | | 0.57 | % |
| | | | | | | | | | | | | | | | | | | | |
Net investment income | | | 1.67 | % | | | 1.56 | % | | | 1.62 | % | | | 1.52 | % | | | 1.81 | % |
| | | | | | | | | | | | | | | | | | | | |
| | | | | |
Supplemental Data | | | | | | | | | | | | | | | | | | | | |
Net assets, end of year (000) | | $ | 173,983 | | | $ | 211,555 | | | $ | 206,525 | | | $ | 229,649 | | | $ | 257,696 | |
| | | | | | | | | | | | | | | | | | | | |
Portfolio turnover rate | | | 145 | % | | | 129 | % | | | 134 | % | | | 89 | %(g) | | | 70 | % |
| | | | | | | | | | | | | | | | | | | | |
| (a) | Consolidated Financial Highlights. |
| (b) | Based on average shares outstanding. |
| (c) | Distributions for annual periods determined in accordance with U.S. federal income tax regulations. |
| (d) | Amount is greater than $(0.005) per share. |
| (e) | Where applicable, excludes insurance-related fees and expenses and assumes the reinvestment of distributions. |
| (f) | Excludes expenses incurred indirectly as a result of investments in underlying funds as follows: |
| | | | | | | | | | | | | | | | | | | | | | | | | | | | | | | | | | | | | | | | |
| | | Year Ended December 31, | |
| | 2018 | | | | | | 2017 | | | | | | 2016 | | | | | | 2015 | | | | | | 2014 | | | | |
Investments in underlying funds | | | 0.02 | % | | | | | | | 0.01 | % | | | | | | | — | % | | | | | | | — | % | | | | | | | — | % | | | | |
| | | | | | | | | | | | | | | | | | | | | | | | | | | | | | | | | | | | | | | | |
| (g) | Includes mortgage dollar roll transactions. Excluding these transactions the portfolio rate would have been 87%. |
See notes to financial statements.
| | |
| 124 | | 2018 BLACKROCK ANNUAL REPORTTO SHAREHOLDERS |
Financial Highlights (continued)
(For a share outstanding throughout each period)
| | | | | | | | | | | | | | | | | | | | |
| | | BlackRock Government Money Market Portfolio | |
| |
| | | Year Ended December 31, | |
| | 2018 | | | 2017 | | | 2016 | | | 2015 | | | 2014 | |
| | | | | |
Net asset value, beginning of year | | $ | 1.00 | | | $ | 1.00 | | | $ | 1.00 | | | $ | 1.00 | | | $ | 1.00 | |
| | | | | | | | | | | | | | | | | | | | |
Net investment income | | | 0.0139 | | | | 0.0044 | | | | 0.0000 | (a) | | | 0.0000 | (a) | | | 0.0000 | (a) |
Net realized gain | | | 0.0000 | (a) | | | 0.0000 | (a) | | | 0.0000 | (a) | | | 0.0001 | | | | 0.0001 | |
| | | | | | | | | | | | | | | | | | | | |
Net increase from investment operations | | | 0.0139 | | | | 0.0044 | | | | 0.0000 | | | | 0.0001 | | | | 0.0001 | |
| | | | | | | | | | | | | | | | | | | | |
| | | | | |
| Distributions(b) | | | | | | | | | | | | | | | |
From net investment income | | | (0.0139 | ) | | | (0.0044 | ) | | | (0.0000 | )(c) | | | (0.0000 | )(c) | | | (0.0000 | )(c) |
From net realized gain | | | — | | | | (0.0000 | )(c) | | | (0.0000 | )(c) | | | (0.0001 | ) | | | (0.0001 | ) |
| | | | | | | | | | | | | | | | | | | | |
Total distributions | | | (0.0139 | ) | | | (0.0044 | ) | | | (0.0000 | ) | | | (0.0001 | ) | | | (0.0001 | ) |
| | | | | | | | | | | | | | | | | | | | |
| | | | | |
Net asset value, end of year | | $ | 1.00 | | | $ | 1.00 | | | $ | 1.00 | | | $ | 1.00 | | | $ | 1.00 | |
| | | | | | | | | | | | | | | | | | | | |
| | | | | |
| Total Return(d) | | | | | | | | | | | | | | | |
Based on net asset value | | | 1.41 | % | | | 0.45 | % | | | 0.00 | % | | | 0.01 | % | | | 0.01 | % |
| | | | | | | | | | | | | | | | | | | | |
| | | | | |
Ratios to Average Net Assets | | | | | | | | | | | | | | | | | | | | |
Total expenses | | | 0.64 | % | | | 0.70 | % | | | 0.54 | % | | | 0.54 | % | | | 0.49 | % |
| | | | | | | | | | | | | | | | | | | | |
Total expenses after fees waived and/or reimbursed | | | 0.50 | % | | | 0.50 | % | | | 0.42 | % | | | 0.22 | % | | | 0.23 | % |
| | | | | | | | | | | | | | | | | | | | |
Net investment income | | | 1.41 | % | | | 0.44 | % | | | 0.00 | % | | | 0.00 | % | | | 0.00 | % |
| | | | | | | | | | | | | | | | | | | | |
| | | | | |
Supplemental Data | | | | | | | | | | | | | | | | | | | | |
Net assets, end of year (000) | | $ | 131,361 | | | $ | 107,299 | | | $ | 122,057 | | | $ | 125,641 | | | $ | 138,033 | |
| | | | | | | | | | | | | | | | | | | | |
| (a) | Amount is less than $0.00005 per share. |
| (b) | Distributions for annual periods determined in accordance with U.S. federal income tax regulations. |
| (c) | Amount is greater than $(0.00005) per share. |
| (d) | Where applicable, excludes insurance-related fees and expenses and assumes the reinvestment of distributions. |
See notes to financial statements.
Financial Highlights (continued)
(For a share outstanding throughout each period)
| | | | | | | | | | | | | | | | | | | | |
| | | BlackRock High Yield Portfolio | |
| |
| | | Year Ended December 31, | |
| | 2018 | | | 2017 | | | 2016 | | | 2015 | | | 2014 | |
| | | | | |
Net asset value, beginning of year | | $ | 5.42 | | | $ | 5.31 | | | $ | 4.91 | | | $ | 5.44 | | | $ | 5.69 | |
| | | | | | | | | | | | | | | | | | | | |
Net investment income(a) | | | 0.30 | | | | 0.30 | | | | 0.29 | | | | 0.28 | | | | 0.32 | |
Net realized and unrealized gain (loss) | | | (0.42 | ) | | | 0.12 | | | | 0.40 | | | | (0.52 | ) | | | (0.21 | ) |
| | | | | | | | | | | | | | | | | | | | |
Net increase (decrease) from investment operations | | | (0.12 | ) | | | 0.42 | | | | 0.69 | | | | (0.24 | ) | | | 0.11 | |
| | | | | | | | | | | | | | | | | | | | |
| | | | | |
| Distributions(b) | | | | | | | | | | | | | | | |
From net investment income | | | (0.30 | ) | | | (0.31 | ) | | | (0.29 | ) | | | (0.29 | ) | | | (0.36 | ) |
From return of capital | | | (0.00 | )(c) | | | — | | | | — | | | | — | | | | — | |
| | | | | | | | | | | | | | | | | | | | |
Total distributions | | | (0.30 | ) | | | (0.31 | ) | | | (0.29 | ) | | | (0.29 | ) | | | (0.36 | ) |
| | | | | | | | | | | | | | | | | | | | |
| | | | | |
Net asset value, end of year | | $ | 5.00 | | | $ | 5.42 | | | $ | 5.31 | | | $ | 4.91 | | | $ | 5.44 | |
| | | | | | | | | | | | | | | | | | | | |
| | | | | |
| Total Return(d) | | | | | | | | | | | | | | | |
Based on net asset value | | | (2.31 | )%(e) | | | 7.95 | % | | | 14.43 | % | | | (4.65 | )% | | | 1.88 | % |
| | | | | | | | | | | | | | | | | | | | |
| | | | | |
Ratios to Average Net Assets | | | | | | | | | | | | | | | | | | | | |
Total expenses | | | 1.98 | % | | | 1.34 | % | | | 0.99 | %(f) | | | 0.91 | % | | | 0.84 | % |
| | | | | | | | | | | | | | | | | | | | |
Total expenses after fees waived and/or reimbursed | | | 0.50 | % | | | 0.50 | % | | | 0.50 | %(f) | | | 0.50 | % | | | 0.51 | % |
| | | | | | | | | | | | | | | | | | | | |
Total expenses after fees waived and/or reimbursed and excluding interest expense | | | 0.50 | % | | | 0.50 | % | | | 0.50 | %(f) | | | 0.50 | % | | | 0.50 | % |
| | | | | | | | | | | | | | | | | | | | |
Net investment income | | | 5.66 | % | | | 5.53 | % | | | 5.64 | %(f) | | | 5.30 | % | | | 5.54 | % |
| | | | | | | | | | | | | | | | | | | | |
| | | | | |
Supplemental Data | | | | | | | | | | | | | | | | | | | | |
Net assets, end of year (000) | | $ | 27,068 | | | $ | 32,005 | | | $ | 33,794 | | | $ | 31,788 | | | $ | 39,081 | |
| | | | | | | | | | | | | | | | | | | | |
Portfolio turnover rate | | | 67 | % | | | 73 | % | | | 101 | % | | | 84 | % | | | 78 | % |
| | | | | | | | | | | | | | | | | | | | |
| (a) | Based on average shares outstanding. |
| (b) | Distributions for annual periods determined in accordance with U.S. federal income tax regulations. |
| (c) | Amount is greater than $(0.005) per share. |
| (d) | Where applicable, excludes insurance-related fees and expenses and assumes the reinvestment of distributions. |
| (e) | Includes payment received from an affiliate, which had no impact on the Fund’s total return. |
| (f) | Excludes expenses incurred indirectly as a result of investments in underlying funds of 0.01%. |
See notes to financial statements.
| | |
| 126 | | 2018 BLACKROCK ANNUAL REPORTTO SHAREHOLDERS |
Financial Highlights (continued)
(For a share outstanding throughout each period)
| | | | | | | | | | | | | | | | | | | | |
| | | BlackRock U.S. Government Bond Portfolio | |
| |
| | | Year Ended December 31, | |
| | 2018 | | | 2017 | | | 2016 | | | 2015 | | | 2014 | |
| | | | | |
Net asset value, beginning of year | | $ | 10.80 | | | $ | 10.86 | | | $ | 10.90 | | | $ | 11.07 | | | $ | 10.67 | |
| | | | | | | | | | | | | | | | | | | | |
Net investment income(a) | | | 0.25 | | | | 0.21 | | | | 0.17 | | | | 0.17 | | | | 0.20 | |
Net realized and unrealized gain (loss) | | | (0.17 | ) | | | (0.02 | ) | | | 0.00 | (b) | | | (0.11 | ) | | | 0.43 | |
| | | | | | | | | | | | | | | | | | | | |
Net increase from investment operations | | | 0.08 | | | | 0.19 | | | | 0.17 | | | | 0.06 | | | | 0.63 | |
| | | | | | | | | | | | | | | | | | | | |
Distributions from net investment income(c) | | | (0.30 | ) | | | (0.25 | ) | | | (0.21 | ) | | | (0.23 | ) | | | (0.23 | ) |
| | | | | | | | | | | | | | | | | | | | |
| | | | | |
Net asset value, end of year | | $ | 10.58 | | | $ | 10.80 | | | $ | 10.86 | | | $ | 10.90 | | | $ | 11.07 | |
| | | | | | | | | | | | | | | | | | | | |
| | | | | |
| Total Return(d) | | | | | | | | | | | | | | | |
Based on net asset value | | | 0.77 | % | | | 1.72 | % | | | 1.54 | % | | | 0.54 | % | | | 5.95 | % |
| | | | | | | | | | | | | | | | | | | | |
| | | | | |
Ratios to Average Net Assets(e) | | | | | | | | | | | | | | | | | | | | |
Total expenses | | | 1.69 | % | | | 1.15 | % | | | 0.94 | % | | | 0.81 | % | | | 0.76 | % |
| | | | | | | | | | | | | | | | | | | | |
Total expenses after fees waived and/or reimbursed | | | 0.86 | % | | | 0.63 | % | | | 0.59 | % | | | 0.53 | % | | | 0.53 | % |
| | | | | | | | | | | | | | | | | | | | |
Total expenses after fees waived and/or reimbursed and excluding interest expense | | | 0.50 | % | | | 0.50 | % | | | 0.50 | % | | | 0.50 | % | | | 0.50 | % |
| | | | | | | | | | | | | | | | | | | | |
Net investment income | | | 2.39 | % | | | 1.89 | % | | | 1.50 | % | | | 1.58 | % | | | 1.79 | % |
| | | | | | | | | | | | | | | | | | | | |
| | | | | |
Supplemental Data | | | | | | | | | | | | | | | | | | | | |
Net assets, end of year (000) | | $ | 53,941 | | | $ | 54,580 | | | $ | 60,506 | | | $ | 66,263 | | | $ | 74,925 | |
| | | | | | | | | | | | | | | | | | | | |
Portfolio turnover rate(f) | | | 728 | % | | | 1,058 | % | | | 1,004 | % | | | 1,421 | % | | | 1,374 | % |
| | | | | | | | | | | | | | | | | | | | |
| (a) | Based on average shares outstanding. |
| (b) | Amount is less than $0.005 per share. |
| (c) | Distributions for annual periods determined in accordance with U.S. federal income tax regulations. |
| (d) | Where applicable, excludes insurance-related fees and expenses and assumes the reinvestment of distributions. |
| (e) | Excludes expenses incurred indirectly as a result of investments in underlying funds as follows: |
| | | | | | | | | | | | | | | | | | | | | | | | | | | | | | | | | | | | | | | | |
| | | Year Ended December 31, | |
| | 2018 | | | | | | 2017 | | | | | | 2016 | | | | | | 2015 | | | | | | 2014 | | | | |
Investments in underlying funds | | | 0.01 | % | | | | | | | 0.01 | % | | | | | | | — | | | | | | | | 0.01 | % | | | | | | | — | | | | | |
| | | | | | | | | | | | | | | | | | | | | | | | | | | | | | | | | | | | | | | | |
| (f) | Includes mortgage dollar roll transactions (“MDRs”). Additional information regarding portfolio turnover rate is as follows: |
| | | | | | | | | | | | | | | | | | | | | | | | | | | | | | | | | | | | | | | | |
| | | Year Ended December 31, | |
| | 2018 | | | | | | 2017 | | | | | | 2016 | | | | | | 2015 | | | | | | 2014 | | | | |
Portfolio turnover rate (excluding MDRs) | | | 434 | % | | | | | | | 694 | % | | | | | | | 631 | % | | | | | | | 891 | % | | | | | | | 723 | % | | | | |
| | | | | | | | | | | | | | | | | | | | | | | | | | | | | | | | | | | | | | | | |
See notes to financial statements.
Notes to Financial Statements
BlackRock Series Fund, Inc. (“Series Fund”) and BlackRock Series Fund II, Inc. (“Series Fund II” and together with Series Fund, the “Companies” and each, a “Company”) are each registered under the Investment Company Act of 1940, as amended (the “1940 Act”), asopen-end management investment companies. Each Company is organized as a Maryland corporation and is comprised of the separate portfolios indicated below. The following are referred to herein collectively as the “Funds” or individually as a “Fund”:
| | | | | | |
| Fund Name | | Company | | Herein Referred To As | | Diversification
Classification |
BlackRock Advantage Large Cap Core Portfolio | | Series Fund | | Advantage Large Cap Core | | Diversified |
BlackRock Balanced Capital Portfolio | | Series Fund | | Balanced Capital | | Diversified |
BlackRock Capital Appreciation Portfolio | | Series Fund | | Capital Appreciation | | Diversified |
BlackRock Global Allocation Portfolio | | Series Fund | | Global Allocation | | Diversified |
BlackRock Government Money Market Portfolio | | Series Fund | | Government Money Market | | Diversified |
BlackRock High Yield Portfolio | | Series Fund II | | High Yield | | Diversified |
BlackRock U.S. Government Bond Portfolio | | Series Fund II | | U.S. Government Bond | | Diversified |
The Funds offer shares to insurance companies for their separate accounts to fund benefits under certain variable annuity and variable life insurance contracts.
The Funds, together with certain other registered investment companies advised by BlackRock Advisors, LLC (the “Manager”) or its affiliates, are included in a complex ofopen-end funds referred to as the Equity-Bond Complex.
Government Money Market operates as a “government money market fund” under Rule2a-7 under the 1940 Act. The Fund is not subject to liquidity fees or temporary suspensions of redemptions due to declines in the Fund’s weekly liquid assets.
Reorganization: The Board (as defined below) approved an Agreement and Plan of Reorganization with respect to each of the following funds (each, a “Target Fund”), pursuant to which each Target Fund reorganized into a newly created series (each, an “Acquiring Fund”) of BlackRock Series Fund II, Inc., a newly organized Maryland corporation. These reorganizations (the “Reorganizations”) closed on September 17, 2018 and were not subject to approval by shareholders of the Target Funds.
| | | | | | |
| Target Fund | | Target Fund’s Registrant | | Acquiring Fund | | Acquiring Fund’s Registrant |
BlackRock U.S Government Bond Portfolio | | BlackRock Series Fund, Inc. | | BlackRock U.S. Government Bond Portfolio | | BlackRock Series Fund II, Inc. |
BlackRock High Yield Portfolio | | BlackRock Series Fund, Inc. | | BlackRock High Yield Portfolio | | BlackRock Series Fund II, Inc. |
The Reorganizations were effected in connection with the proposed reconfiguration of the boards of directors/trustees of certain BlackRock-advised funds.
Each Acquiring Fund has the same investment objective, strategies and policies, investment adviser, portfolio management team and service providers as the corresponding Target Fund. Each Target Fund is the performance and accounting survivor of its Reorganization, meaning that the corresponding Acquiring Fund assumed the performance and financial history of the Target Fund upon completion of the Reorganization. In addition, each Acquiring Fund is subject to the same contractual arrangements, including the same contractual fees and expenses, as those of the corresponding Target Fund as of the date of the Reorganization. The Reorganizations weretax-free, meaning that each Target Fund’s shareholders became shareholders of the corresponding Acquiring Fund without realizing any gain or loss for federal income tax purposes.
As a result, each Acquiring Fund acquired all of the assets and assumed all of the liabilities of the corresponding Target Fund in exchange for an equal aggregate value of newly-issued shares of the Acquiring Fund. Each shareholder of a Target Fund received shares of the corresponding Acquiring Fund in an amount equal to the aggregate net asset value (“NAV”) of such shareholder’s Target Fund shares, as determined at the close of business on September 14, 2018.
The Reorganizations were accomplished by atax-free exchange of shares of each Acquiring Fund in the following amounts and at the following conversion ratio:
| | | | | | | | | | | | |
| Target Fund | | Shares Prior to
Reorganization | | | Conversion
Ratio | | | Shares Post-
Reorganization | |
U.S. Government Bond | | | 5,309,106 | | | | 1 | | | | 5,309,106 | |
High Yield | | | 5,600,142 | | | | 1 | | | | 5,600,142 | |
For financial reporting purposes, assets received and shares issued by each Acquiring Fund were recorded at fair value. However, the cost basis of the investments received from each Target Fund were carried forward to align ongoing reporting of each Acquiring Fund’s realized and unrealized gains and losses with amounts distributable to shareholders for tax purposes.
Prior to the Reorganizations, the Acquiring Funds had not yet commenced operations and had no assets or liabilities. Each Target Fund’s net assets, fair value and cost of investments and derivative financial instruments prior to the Reorganizations were as follows:
| | | | | | | | | | | | |
| Target Fund | | Net Assets | | | Fair Value
of Investments | | | Cost of
Investments | |
U.S. Government Bond | | $ | 55,767,462 | | | $ | 51,133,566 | | | $ | 52,360,462 | |
High Yield | | | 29,943,625 | | | | 29,394,482 | | | | 29,569,493 | |
| | |
| 128 | | 2018 BLACKROCK ANNUAL REPORTTO SHAREHOLDERS |
Notes to Financial Statements (continued)
Prior to the Reorganizations’ effective date, each Target Fund began to incur expenses in connection with the proposed realignment and consolidation of the boards of directors/trustees of certain BlackRock-advised funds. These expenses and liabilities have been assumed by each respective Acquiring Fund. The Manager has voluntarily agreed to reimburse certain funds for all or a portion of such expenses, which amounts are included in fees waived and/or reimbursed by the Manager in the Statements of Operations.
Basis of Consolidation: The accompanying consolidated financial statements of Global Allocation include the accounts of BlackRock Cayman Global Allocation Portfolio I, Ltd. (the “Subsidiary”), which is a wholly-owned subsidiary of Global Allocation and primarily invests in commodity-related instruments and other derivatives. The Subsidiary enables Global Allocation to hold these commodity-related instruments and satisfy regulated investment company tax requirements. Global Allocation may invest up to 25% of its total assets in the Subsidiary. The net assets of the Subsidiary as of period end were $5,425,892, which is 3.1% of Global Allocation’s consolidated net assets. Intercompany accounts and transactions, if any, have been eliminated. The Subsidiary is subject to the same investment policies and restrictions that apply to Global Allocation, except that the Subsidiary may invest without limitation in commodity-related instruments.
| 2. | SIGNIFICANT ACCOUNTING POLICIES |
The financial statements are prepared in conformity with accounting principles generally accepted in the United States of America (“U.S. GAAP”), which may require management to make estimates and assumptions that affect the reported amounts of assets and liabilities in the financial statements, disclosure of contingent assets and liabilities at the date of the financial statements and the reported amounts of increases and decreases in net assets from operations during the reporting period. Actual results could differ from those estimates. Each Fund is considered an investment company under U.S. GAAP and follows the accounting and reporting guidance applicable to investment companies. Below is a summary of significant accounting policies:
Investment Transactions and Income Recognition: For financial reporting purposes, investment transactions are recorded on the dates the transactions are entered into (the “trade dates”). Realized gains and losses on investment transactions are determined on the identified cost basis. Dividend income is recorded on theex-dividend date. Dividends from foreign securities where theex-dividend date may have passed are subsequently recorded when the Funds are informed of theex-dividend date. Under the applicable foreign tax laws, a withholding tax at various rates may be imposed on capital gains, dividends and interest. Upon notification from issuers, a portion of the dividend income received from a real estate investment trust may be redesignated as a reduction of cost of the related investment and/or realized gain. Interest income, including amortization and accretion of premiums and discounts on debt securities, is recognized on an accrual basis.
Foreign Currency Translation: Each Fund’s books and records are maintained in U.S. dollars. Securities and other assets and liabilities denominated in foreign currencies are translated into U.S. dollars using exchange rates determined as of the close of trading on the New York Stock Exchange (“NYSE”). Purchases and sales of investments are recorded at the rates of exchange prevailing on the respective dates of such transactions. Generally, when the U.S. dollar rises in value against a foreign currency, the investments denominated in that currency will lose value; the opposite effect occurs if the U.S. dollar falls in relative value.
Each Fund does not isolate the portion of the results of operations arising as a result of changes in the exchange rates from the changes in the market prices of investments held or sold for financial reporting purposes. Accordingly, the effects of changes in exchange rates on investments are not segregated in the Statements of Operations from the effects of changes in market prices of those investments, but are included as a component of net realized and unrealized gain (loss) from investments. Each Fund reports realized currency gains (losses) on foreign currency related transactions as components of net realized gain (loss) for financial reporting purposes, whereas such components are generally treated as ordinary income for U.S. federal income tax purposes.
Segregation and Collateralization: In cases where a Fund enters into certain investments (e.g., dollar rolls, TBA sale commitments, futures contracts, forward foreign currency exchange contracts, options written, swaps and short sales) or certain borrowings (e.g., reverse repurchase transactions) that would be treated as “senior securities” for 1940 Act purposes, a Fund may segregate or designate on its books and records cash or liquid assets having a market value at least equal to the amount of its future obligations under such investments or borrowings. Doing so allows the investment or borrowing to be excluded from treatment as a “senior security.” Furthermore, if required by an exchange or counterparty agreement, the Funds may be required to deliver/deposit cash and/or securities to/with an exchange, or broker-dealer or custodian as collateral for certain investments or obligations.
Distributions: For Government Money Market, distributions from net investment income are declared daily and paid monthly. For Advantage Large Cap Core, Balanced Capital, Capital Appreciation and Global Allocation, distributions from net investment income are declared and paid at least annually. For High Yield and U.S. Government Bond, distributions from net investment income are declared daily and paid monthly. For each Fund, distributions of capital gains are recorded on theex-dividend dates and made at least annually.
Portions of return of capital distributions under U.S. GAAP may be taxed at ordinary income rates.
The character of distributions is determined in accordance with U.S. federal income tax regulations, which may differ from U.S. GAAP. The portion of distributions, if any, that exceeds a Fund’s current and accumulated earnings and profits, as measured on a tax basis, constitute anon-taxable return of capital. Realized net capital gains can be offset by capital losses carried forward from prior years. However, certain Funds have capital loss carryforwards frompre-2012 tax years that offset realized net capital gains but do not offset current earnings and profits. Consequently, if distributions in any tax year are less than the Fund’s current earnings and profits but greater than net investment income and net realized capital gains (taxable income), distributions in excess of taxable income are not treated asnon-taxable return of capital, but rather may be taxable to shareholders at ordinary income rates. Under certain circumstances, taxable excess distributions could be significant. See Note 8, Income Tax Information, for the tax character of each Fund’s distributions paid during the year.
Net income and realized gains from investments held by the Subsidiary are treated as ordinary income for tax purposes. If a net loss is realized by the Subsidiary in any taxable year, the loss will generally not be available to offset Global Allocation’s ordinary income and/or capital gains for that year.
| | | | |
| NOTESTO FINANCIAL STATEMENTS | | | 129 | |
Notes to Financial Statements (continued)
Recent Accounting Standards: In March 2017, the Financial Accounting Standards Board issued Accounting Standards Update “Premium Amortization of Purchased Callable Debt Securities” which amends the amortization period for certain purchased callable debt securities. Under the new guidance, the premium amortization of purchased callable debt securities that have explicit,non-contingent call features and are callable at fixed prices will be amortized to the earliest call date. The guidance will be applied on a modified retrospective basis and is effective for fiscal years, and their interim periods, beginning after December 15, 2018. Management is currently evaluating the impact of this guidance to the Funds.
In August 2018, the Financial Accounting Standards Board issued Accounting Standards Update2018-13 “Changes to the Disclosure Requirements for Fair Value Measurement” which modifies disclosure requirements for fair value measurements. The guidance is effective for fiscal years beginning after December 15, 2019 and for interim periods within those fiscal years. Management is currently evaluating the impact of this guidance to the Funds.
Indemnifications: In the normal course of business, a Fund enters into contracts that contain a variety of representations that provide general indemnification. A Fund’s maximum exposure under these arrangements is unknown because it involves future potential claims against a Fund, which cannot be predicted with any certainty.
Other: Expenses directly related to a Fund are charged to that Fund. Other operating expenses shared by several funds, including other funds managed by the Manager, are prorated among those funds on the basis of relative net assets or other appropriate methods.
Global Allocation has an arrangement with its custodian whereby credits are earned on uninvested cash balances, which could be used to reduce custody fees and/or overdraft charges. Global Allocation may incur charges on certain uninvested cash balances and overdrafts, subject to certain conditions.
| 3. | INVESTMENT VALUATION AND FAIR VALUE MEASUREMENTS |
Investment Valuation Policies: The Funds’ investments are valued at fair value (also referred to as “market value” within the financial statements) as of the close of trading on the NYSE (generally 4:00 p.m., Eastern time). U.S. GAAP defines fair value as the price the Funds would receive to sell an asset or pay to transfer a liability in an orderly transaction between market participants at the measurement date. The Funds determine the fair values of their financial instruments using various independent dealers or pricing services under policies approved by the Boards of Directors of the Companies (together, the “Board”). The BlackRock Global Valuation Methodologies Committee (the “Global Valuation Committee”) is the committee formed by management to develop global pricing policies and procedures and to oversee the pricing function for all financial instruments.
Government Money Market’s investments are valued under the amortized cost method which approximates current market value in accordance with Rule2a-7 under the 1940 Act. Under this method, investments are valued at cost when purchased and, thereafter, a constant proportionate accretion of discounts and amortization of premiums are recorded until the maturity of the security. The Fund seeks to maintain its NAV per share at $1.00, although there is no assurance that it will be able to do so on a continuing basis.
Fair Value Inputs and Methodologies: The following methods and inputs are used to establish the fair value of each Fund’s assets and liabilities:
| | • | | Equity investments traded on a recognized securities exchange are valued at the official closing price each day, if available. For equity investments traded on more than one exchange, the official closing price on the exchange where the stock is primarily traded is used. Equity investments traded on a recognized exchange for which there were no sales on that day may be valued at the last available bid (long positions) or ask (short positions) price. |
| | • | | Fixed-income securities for which market quotations are readily available are generally valued using the last available bid prices or current market quotations provided by independent dealers or third party pricing services. Floating rate loan interests are valued at the mean of the bid prices from one or more independent brokers or dealers as obtained from a third party pricing service. Pricing services generally value fixed-income securities assuming orderly transactions of an institutional round lot size, but a fund may hold or transact in such securities in smaller, odd lot sizes. Odd lots may trade at lower prices than institutional round lots. The pricing services may use matrix pricing or valuation models that utilize certain inputs and assumptions to derive values, including transaction data (e.g., recent representative bids and offers), credit quality information, perceived market movements, news, and other relevant information. Certain fixed-income securities, including asset-backed and mortgage related securities may be valued based on valuation models that consider the estimated cash flows of each tranche of the entity, establish a benchmark yield and develop an estimated tranche specific spread to the benchmark yield based on the unique attributes of the tranche. The amortized cost method of valuation may be used with respect to debt obligations with sixty days or less remaining to maturity unless the Manager determines such method does not represent fair value. |
Generally, trading in foreign instruments is substantially completed each day at various times prior to the close of trading on the NYSE. Occasionally, events affecting the values of such instruments may occur between the foreign market close and the close of trading on the NYSE that may not be reflected in the computation of the Funds’ net assets. Each business day, the Funds use a pricing service to assist with the valuation of certain foreign exchange-traded equity securities and foreign exchange-traded over-the-counter (“OTC”) options (the “Systematic Fair Value Price”). Using current market factors, the Systematic Fair Value Price is designed to value such foreign securities and foreign options at fair value as of the close of trading on the NYSE, which follows the close of the local markets.
| | • | | Municipal investments (including commitments to purchase such investments on a “when-issued” basis) are valued on the basis of prices provided by dealers or pricing services. In determining the value of a particular investment, pricing services may use certain information with respect to transactions in such investments, quotations from dealers, pricing matrixes, market transactions in comparable investments and information with respect to various relationships between investments. |
| | • | | Investments inopen-end U.S. mutual funds are valued at NAV each business day. |
| | • | | The Funds value their investment in SL Liquidity Series, LLC, Money Market Series (the “Money Market Series”) at fair value, which is ordinarily based upon their pro rata ownership in the underlying fund’s net assets. The Money Market Series seeks current income consistent with maintaining liquidity and preserving capital. Although the Money Market Series is not registered under the 1940 Act, its investments may follow the parameters of investments by a money market fund that is subject to Rule2a-7 under the 1940 Act. |
| | • | | Futures contracts traded on exchanges are valued at their last sale price. |
| | |
| 130 | | 2018 BLACKROCK ANNUAL REPORTTO SHAREHOLDERS |
Notes to Financial Statements (continued)
| | • | | Forward foreign currency exchange contracts are valued at the mean between the bid and ask prices and are determined as of the close of trading on the NYSE. Interpolated values are derived when the settlement date of the contract is an interim date for which quotations are not available. |
| | • | | Exchange-traded options are valued at the mean between the last bid and ask prices at the close of the options market in which the options trade. An exchange-traded option for which there is no mean price is valued at the last bid (long positions) or ask (short positions) price. If no bid or ask price is available, the prior day’s price will be used, unless it is determined that the prior day’s price no longer reflects the fair value of the option. OTC options and options on swaps (“swaptions”) are valued by an independent pricing service using a mathematical model, which incorporates a number of market data factors, such as the trades and prices of the underlying instruments. |
| | • | | Swap agreements are valued utilizing quotes received daily by the Funds’ pricing service or through brokers, which are derived using daily swap curves and models that incorporate a number of market data factors, such as discounted cash flows, trades and values of the underlying reference instruments. |
| | • | | To-be-announced (“TBA”) commitments are valued on the basis of last available bid prices or current market quotations provided by pricing services. |
If events (e.g., a company announcement, market volatility or a natural disaster) occur that are expected to materially affect the value of such investments, or in the event that the application of these methods of valuation results in a price for an investment that is deemed not to be representative of the market value of such investment, or if a price is not available, the investment will be valued by the Global Valuation Committee, or its delegate, in accordance with a policy approved by the Board as reflecting fair value (“Fair Valued Investments”). The fair valuation approaches that may be used by the Global Valuation Committee will include market approach, income approach and cost approach. Valuation techniques such as discounted cash flow, use of market comparables and matrix pricing are types of valuation approaches and are typically used in determining fair value. When determining the price for Fair Valued Investments, the Global Valuation Committee, or its delegate, seeks to determine the price that each Fund might reasonably expect to receive or pay from the current sale or purchase of that asset or liability in anarm’s-length transaction. Fair value determinations shall be based upon all available factors that the Global Valuation Committee, or its delegate, deems relevant and consistent with the principles of fair value measurement.
The Global Valuation Committee, or its delegate, employs various methods for calibrating valuation approaches for investments where an active market does not exist, including regular due diligence of each Fund’s pricing vendors, regular reviews of key inputs and assumptions, transactional back-testing or disposition analysis to compare unrealized gains and losses to realized gains and losses, reviews of missing or stale prices and large movements in market values and reviews of any market related activity. The pricing of all Fair Valued Investments is subsequently reported to the Board or a committee thereof on a quarterly basis. As a result of the inherent uncertainty in valuation of these investments, the fair values may differ from the values that would have been used had an active market existed.
For investments in equity or debt issued by privately held companies or funds (a “Private Company” or collectively, the “Private Companies”) and other Fair Valued Investments, the fair valuation approaches that are used by third party pricing services utilize one or a combination of, but not limited to, the following inputs:
| | |
| | | Standard Inputs Generally Considered By Third Party Pricing Services |
Market approach | | (i) recent market transactions, including subsequent rounds of financing, in the underlying investment or comparable issuers; (ii) recapitalizations and other transactions across the capital structure; and (iii) market multiples of comparable issuers |
Income approach | | (i) future cash flows discounted to present and adjusted as appropriate for liquidity, credit, and/or market risks; (ii) quoted prices for similar investments or assets in active markets; and (iii) other risk factors, such as interest rates, yield curves, volatilities, prepayment speeds, loss severities, credit risks, recovery rates, liquidation amounts and/or default rates. |
Cost approach. | | (i) audited or unaudited financial statements, investor communications and financial or operational metrics issued by the Private Company; (ii) changes in the valuation of relevant indices or publicly traded companies comparable to the Private Company; (iii) relevant news and other public sources; and (iv) known secondary market transactions in the Private Company’s interests and merger or acquisition activity in companies comparable to the Private Company. |
Investments in series of preferred stock issued by Private Companies are typically valued utilizing market approach in determining the enterprise value of the company. Such investments often contain rights and preferences that differ from other series of preferred and common stock of the same issuer. Valuation techniques such as an option pricing model (“OPM”), a probability weighted expected return model (“PWERM”) or a hybrid of those techniques are used in allocating enterprise value of the company, as deemed appropriate under the circumstances. The use of OPM and PWERM techniques involve a determination of the exit scenarios of the investment in order to appropriately allocate the enterprise value of the company among the various parts of its capital structure.
The Private Companies are not subject to the public company disclosure, timing, and reporting standards as other investments held by a Fund. Typically, the most recently available information by a Private Company is as of a date that is earlier than the date a Fund is calculating its NAV. This factor may result in a difference between the value of the investment and the price a Fund could receive upon the sale of the investment.
Fair Value Hierarchy: Various inputs are used in determining the fair value of investments and derivative financial instruments. These inputs to valuation techniques are categorized into a fair value hierarchy consisting of three broad levels for financial statements purposes as follows:
| | • | | Level 1 — Unadjusted price quotations in active markets/exchanges for identical assets or liabilities that each Fund has the ability to access |
| | • | | Level 2 — Other observable inputs (including, but not limited to, quoted prices for similar assets or liabilities in markets that are active, quoted prices for identical or similar assets or liabilities in markets that are not active, inputs other than quoted prices that are observable for the assets or liabilities (such as interest rates, yield curves, volatilities, prepayment speeds, loss severities, credit risks and default rates) or other market–corroborated inputs) |
| | | | |
| NOTESTO FINANCIAL STATEMENTS | | | 131 | |
Notes to Financial Statements (continued)
| | • | | Level 3 — Unobservable inputs based on the best information available in the circumstances, to the extent observable inputs are not available (including each Fund’s own assumptions used in determining the fair value of investments and derivative financial instruments) |
The hierarchy gives the highest priority to unadjusted quoted prices in active markets for identical assets or liabilities (Level 1 measurements) and the lowest priority to unobservable inputs (Level 3 measurements). Accordingly, the degree of judgment exercised in determining fair value is greatest for instruments categorized in Level 3. The inputs used to measure fair value may fall into different levels of the fair value hierarchy. In such cases, for disclosure purposes, the fair value hierarchy classification is determined based on the lowest level input that is significant to the fair value measurement in its entirety. Investments classified within Level 3 have significant unobservable inputs used by the Global Valuation Committee in determining the price for Fair Valued Investments. Level 3 investments include equity or debt issued by Private Companies. There may not be a secondary market, and/or there are a limited number of investors. Level 3 investments may also be adjusted to reflect illiquidity and/ornon-transferability, with the amount of such discount estimated by the Global Valuation Committee in the absence of market information.
Changes in valuation techniques may result in transfers into or out of an assigned level within the hierarchy. In accordance with each Fund’s policy, transfers between different levels of the fair value hierarchy are deemed to have occurred as of the beginning of the reporting period. The categorization of a value determined for investments and derivative financial instruments is based on the pricing transparency of the investments and derivative financial instruments and is not necessarily an indication of the risks associated with investing in those securities.
As of December 31, 2018, certain investments of the Funds were valued using NAV per share as no quoted market value is available and therefore have been excluded from the fair value hierarchy.
| 4. | SECURITIES AND OTHER INVESTMENTS |
Asset-Backed and Mortgage-Backed Securities:Asset-backed securities are generally issued as pass-through certificates or as debt instruments. Asset-backed securities issued as pass-through certificates represent undivided fractional ownership interests in an underlying pool of assets. Asset-backed securities issued as debt instruments, which are also known as collateralized obligations, are typically issued as the debt of a special purpose entity organized solely for the purpose of owning such assets and issuing such debt. Asset-backed securities are often backed by a pool of assets representing the obligations of a number of different parties. The yield characteristics of certain asset-backed securities may differ from traditional debt securities. One such major difference is that all or a principal part of the obligations may be prepaid at any time because the underlying assets (i.e., loans) may be prepaid at any time. As a result, a decrease in interest rates in the market may result in increases in the level of prepayments as borrowers, particularly mortgagors, refinance and repay their loans. An increased prepayment rate with respect to an asset-backed security will have the effect of shortening the maturity of the security. In addition, a fund may subsequently have to reinvest the proceeds at lower interest rates. If a fund has purchased such an asset-backed security at a premium, a faster than anticipated prepayment rate could result in a loss of principal to the extent of the premium paid.
For mortgage pass-through securities (the “Mortgage Assets”) there are a number of important differences among the agencies and instrumentalities of the U.S. Government that issue mortgage-related securities and among the securities that they issue. For example, mortgage-related securities guaranteed by Ginnie Mae are guaranteed as to the timely payment of principal and interest by Ginnie Mae and such guarantee is backed by the full faith and credit of the United States. However, mortgage-related securities issued by Freddie Mac and Fannie Mae, including Freddie Mac and Fannie Mae guaranteed mortgage pass-through certificates, which are solely the obligations of Freddie Mac and Fannie Mae, are not backed by or entitled to the full faith and credit of the United States, but are supported by the right of the issuer to borrow from the U.S. Treasury.
Non-agency mortgage-backed securities are securities issued bynon-governmental issuers and have no direct or indirect government guarantees of payment and are subject to various risks.Non-agency mortgage loans are obligations of the borrowers thereunder only and are not typically insured or guaranteed by any other person or entity. The ability of a borrower to repay a loan is dependent upon the income or assets of the borrower. A number of factors, including a general economic downturn, acts of God, terrorism, social unrest and civil disturbances, may impair a borrower’s ability to repay its loans.
Collateralized Debt Obligations: Collateralized debt obligations (“CDOs”), including collateralized bond obligations (“CBOs”) and collateralized loan obligations (“CLOs”), are types of asset-backed securities. A CDO is an entity that is backed by a diversified pool of debt securities (CBOs) or syndicated bank loans (CLOs). The cash flows of the CDO can be split into multiple segments, called “tranches,” which will vary in risk profile and yield. The riskiest segment is the subordinated or “equity” tranche. This tranche bears the greatest risk of defaults from the underlying assets in the CDO and serves to protect the other, more senior, tranches from default in all but the most severe circumstances. Since it is shielded from defaults by the more junior tranches, a “senior” tranche will typically have higher credit ratings and lower yields than their underlying securities, and often receive investment grade ratings from one or more of the nationally recognized rating agencies. Despite the protection from the more junior tranches, senior tranches can experience substantial losses due to actual defaults, increased sensitivity to future defaults and the disappearance of one or more protecting tranches as a result of changes in the credit profile of the underlying pool of assets.
Inflation-Indexed Bonds: Inflation-indexed bonds (other than municipal inflation-indexed and certain corporate inflation-indexed bonds) are fixed-income securities whose principal value is periodically adjusted according to the rate of inflation. If the index measuring inflation rises or falls, the principal value of inflation-indexed bonds (other than municipal inflation-indexed and certain corporate inflation-indexed bonds) will be adjusted upward or downward, and consequently the interest payable on these securities (calculated with respect to a larger or smaller principal amount) will be increased or reduced, respectively. Any upward or downward adjustment in the principal amount of an inflation-indexed bond will be included as interest income in the Statements of Operations, even though investors do not receive their principal until maturity. Repayment of the original bond principal upon maturity (as adjusted for inflation) is guaranteed in the case of U.S. Treasury inflation-indexed bonds. For bonds that do not provide a similar guarantee, the adjusted principal value of the bond repaid at maturity may be less than the original principal. With regard to municipal inflation-indexed bonds and certain corporate inflation-indexed bonds, the inflation adjustment is typically reflected in the semi-annual coupon payment. As a result, the principal value of municipal inflation-indexed bonds and such corporate inflation-indexed bonds does not adjust according to the rate of inflation.
Multiple Class Pass-Through Securities: Multiple class pass-through securities, including collateralized mortgage obligations (“CMOs”) and commercial mortgage-backed securities, may be issued by Ginnie Mae, U.S. Government agencies or instrumentalities or by trusts formed by private originators of, or investors in, mortgage
| | |
| 132 | | 2018 BLACKROCK ANNUAL REPORTTO SHAREHOLDERS |
Notes to Financial Statements (continued)
loans. In general, CMOs are debt obligations of a legal entity that are collateralized by a pool of residential or commercial mortgage loans or Mortgage Assets. The payments on these are used to make payments on the CMOs or multiple pass-through securities. Multiple class pass-through securities represent direct ownership interests in the Mortgage Assets. Classes of CMOs include interest only (“IOs”), principal only (“POs”), planned amortization classes and targeted amortization classes. IOs and POs are stripped mortgage-backed securities representing interests in a pool of mortgages, the cash flow from which has been separated into interest and principal components. IOs receive the interest portion of the cash flow while POs receive the principal portion. IOs and POs can be extremely volatile in response to changes in interest rates. As interest rates rise and fall, the value of IOs tends to move in the same direction as interest rates. POs perform best when prepayments on the underlying mortgages rise since this increases the rate at which the principal is returned and the yield to maturity on the PO. When payments on mortgages underlying a PO are slower than anticipated, the life of the PO is lengthened and the yield to maturity is reduced. If the underlying Mortgage Assets experience greater than anticipated prepayments of principal, a fund’s initial investment in the IOs may not fully recoup.
Stripped Mortgage-Backed Securities: Stripped mortgage-backed securities are typically issued by the U.S. Government, its agencies and instrumentalities. Stripped mortgage-backed securities are usually structured with two classes that receive different proportions of the interest (IOs) and principal (POs) distributions on a pool of Mortgage Assets. Stripped mortgage-backed securities may be privately issued.
Zero-Coupon Bonds: Zero-coupon bonds are normally issued at a significant discount from face value and do not provide for periodic interest payments. These bonds may experience greater volatility in market value than other debt obligations of similar maturity which provide for regular interest payments.
Capital Securities and Trust Preferred Securities: Capital securities, including trust preferred securities, are typically issued by corporations, generally in the form of interest-bearing notes with preferred securities characteristics. In the case of trust preferred securities, an affiliated business trust of a corporation issues these securities, generally in the form of beneficial interests in subordinated debentures or similarly structured securities. The securities can be structured with either a fixed or adjustable coupon that can have either a perpetual or stated maturity date. For trust preferred securities, the issuing bank or corporation pays interest to the trust, which is then distributed to holders of these securities as a dividend. Dividends can be deferred without creating an event of default or acceleration, although maturity cannot take place unless all cumulative payment obligations have been met. The deferral of payments does not affect the purchase or sale of these securities in the open market. These securities generally are rated below that of the issuing company’s senior debt securities and are freely callable at the issuer’s option.
Preferred Stocks: Preferred stock has a preference over common stock in liquidation (and generally in receiving dividends as well), but is subordinated to the liabilities of the issuer in all respects. As a general rule, the market value of preferred stock with a fixed dividend rate and no conversion element varies inversely with interest rates and perceived credit risk, while the market price of convertible preferred stock generally also reflects some element of conversion value. Because preferred stock is junior to debt securities and other obligations of the issuer, deterioration in the credit quality of the issuer will cause greater changes in the value of a preferred stock than in a more senior debt security with similar stated yield characteristics. Unlike interest payments on debt securities, preferred stock dividends are payable only if declared by the issuer’s board of directors. Preferred stock also may be subject to optional or mandatory redemption provisions.
Warrants: Warrants entitle a fund to purchase a specified number of shares of common stock and arenon-income producing. The purchase price and number of shares are subject to adjustment under certain conditions until the expiration date of the warrants, if any. If the price of the underlying stock does not rise above the strike price before the warrant expires, the warrant generally expires without any value and a fund will lose any amount it paid for the warrant. Thus, investments in warrants may involve more risk than investments in common stock. Warrants may trade in the same markets as their underlying stock; however, the price of the warrant does not necessarily move with the price of the underlying stock.
Floating Rate Loan Interests: Floating rate loan interests are typically issued to companies (the “borrower”) by banks, other financial institutions, or privately and publicly offered corporations (the “lender”). Floating rate loan interests are generallynon-investment grade, often involve borrowers whose financial condition is troubled or uncertain and companies that are highly leveraged or in bankruptcy proceedings. In addition, transactions in floating rate loan interests may settle on a delayed basis, which may result in proceeds from the sale not being readily available for a fund to make additional investments or meet its redemption obligations. Floating rate loan interests may include fully funded term loans or revolving lines of credit. Floating rate loan interests are typically senior in the corporate capital structure of the borrower. Floating rate loan interests generally pay interest at rates that are periodically determined by reference to a base lending rate plus a premium. Since the rates reset only periodically, changes in prevailing interest rates (and particularly sudden and significant changes) can be expected to cause some fluctuations in the NAV of a fund to the extent that it invests in floating rate loan interests. The base lending rates are generally the lending rate offered by one or more European banks, such as the London Interbank Offered Rate (“LIBOR”), the prime rate offered by one or more U.S. banks or the certificate of deposit rate. Floating rate loan interests may involve foreign borrowers, and investments may be denominated in foreign currencies. These investments are treated as investments in debt securities for purposes of a fund’s investment policies.
When a fund purchases a floating rate loan interest, it may receive a facility fee and when it sells a floating rate loan interest, it may pay a facility fee. On an ongoing basis, a fund may receive a commitment fee based on the undrawn portion of the underlying line of credit amount of a floating rate loan interest. Facility and commitment fees are typically amortized to income over the term of the loan or term of the commitment, respectively. Consent and amendment fees are recorded to income as earned. Prepayment penalty fees, which may be received by a fund upon the prepayment of a floating rate loan interest by a borrower, are recorded as realized gains. A fund may invest in multiple series or tranches of a loan. A different series or tranche may have varying terms and carry different associated risks.
Floating rate loan interests are usually freely callable at the borrower’s option. A fund may invest in such loans in the form of participations in loans (“Participations”) or assignments (“Assignments”) of all or a portion of loans from third parties. Participations typically will result in a fund having a contractual relationship only with the lender, not with the borrower. A fund has the right to receive payments of principal, interest and any fees to which it is entitled only from the lender selling the Participation and only upon receipt by the lender of the payments from the borrower. In connection with purchasing Participations, a fund generally will have no right to enforce compliance by the borrower with the terms of the loan agreement, nor any rights of offset against the borrower. A fund may not benefit directly from any collateral supporting the loan in which it has purchased the Participation. As a result, a fund assumes the credit risk of both the borrower and the lender that is selling the Participation. A fund’s investment in loan participation interests involves the risk of insolvency of the financial intermediaries who are parties to the transactions. In the event of the insolvency of the lender selling the Participation, a fund may be treated as a general creditor of the lender and may not benefit from any offset between the lender and the borrower. Assignments typically result in a fund having a direct contractual relationship with the borrower, and a fund may enforce compliance by the borrower with the terms of the loan agreement.
| | | | |
| NOTESTO FINANCIAL STATEMENTS | | | 133 | |
Notes to Financial Statements (continued)
In connection with floating rate loan interests, High Yield may also enter into unfunded floating rate loan interests (“commitments”). In connection with these commitments, a fund earns a commitment fee, typically set as a percentage of the commitment amount. Such fee income, which is included in interest income in the Statements of Operations, is recognized ratably over the commitment period. Unfunded floating rate loan interests aremarked-to-market daily, and any unrealized appreciation (depreciation) is included in the Statements of Assets and Liabilities and Statements of Operations. As of period end, High Yield had the following unfunded floating rate loan interests:
| | | | | | | | | | | | | | | | |
| Borrower | | Par | | | Commitment
Amount | | | Value | | | Unrealized
Appreciation
(Depreciation) | |
Access CIG LLC, Term Loan | | $ | 831 | | | $ | 831 | | | $ | 820 | | | $ | (11 | ) |
Dentalcorp Perfect Smile ULC, Delayed Draw Term Loan | | | 999 | | | | 999 | | | | 968 | | | | (31 | ) |
Mavis Tire Express Services Corp., Delayed Draw 1st Lien Term Loan | | | 995 | | | | 990 | | | | 958 | | | | (32 | ) |
| | | | | | | | | | | | | | | | |
| | | | | | | | | | | | | | $ | (74 | ) |
| | | | | | | | | | | | | | | | |
Forward Commitments and When-Issued Delayed Delivery Securities: Certain funds may purchase securities on a when-issued basis and may purchaseor sell securities on a forward commitment basis. Settlement of such transactions normally occurs within a month or more after the purchase or sale commitment is made. A fund may purchase securities under such conditions with the intention of actually acquiring them, but may enter into a separate agreement to sell the securities before the settlement date. Since the value of securities purchased may fluctuate prior to settlement, a fund may be required to pay more at settlement than the security is worth. In addition, a fund is not entitled to any of the interest earned prior to settlement. When purchasing a security on a delayed delivery basis, a fund assumes the rights and risks of ownership of the security, including the risk of price and yield fluctuations. In the event of default by the counterparty, a fund’s maximum amount of loss is the unrealized appreciation of unsettled when-issued transactions.
TBA Commitments: TBA commitments are forward agreements for the purchase or sale of mortgage-backed securities for a fixed price, with payment and delivery on an agreed upon future settlement date. The specific securities to be delivered are not identified at the trade date. However, delivered securities must meet specified terms, including issuer, rate and mortgage terms. When entering into TBA commitments, a fund may take possession of or deliver the underlying mortgage-backed securities but can extend the settlement or roll the transaction. TBA commitments involve a risk of loss if the value of the security to be purchased or sold declines or increases, respectively, prior to settlement date.
In order to better define contractual rights and to secure rights that will help a fund mitigate their counterparty risk, TBA commitments may be entered into by a fund under Master Securities Forward Transaction Agreements (each, an “MSFTA”). An MSFTA typically contains, among other things, collateral posting terms and netting provisions in the event of default and/or termination event. The collateral requirements are typically calculated by netting themark-to-market amount for each transaction under such agreement and comparing that amount to the value of the collateral currently pledged by a fund and the counterparty. Cash collateral that has been pledged to cover the obligations of a fund and cash collateral received from the counterparty, if any, is reported separately in the Statements of Assets and Liabilities as cash pledged as collateral for TBA commitments or cash received as collateral for TBA commitments, respectively.Non-cash collateral pledged by a fund, if any, is noted in the Schedules of Investments. Typically, a fund is permitted to sell,re-pledge or use the collateral it receives; however, the counterparty is not permitted to do so. To the extent amounts due to a fund are not fully collateralized, contractually or otherwise, a fund bears the risk of loss from counterpartynon-performance.
Mortgage Dollar Roll Transactions: Certain funds may sell TBA mortgage-backed securities and simultaneously contract to repurchase substantially similar (i.e., same type, coupon and maturity) securities on a specific future date at an agreed upon price. During the period between the sale and repurchase, a fund is not entitled to receive interest and principal payments on the securities sold. Mortgage dollar roll transactions are treated as purchases and sales and realize gains and losses on these transactions. Mortgage dollar rolls involve the risk that the market value of the securities that a fund is required to purchase may decline below the agreed upon repurchase price of those securities.
Repurchase Agreements: Repurchase agreements are commitments to purchase a security from a counterparty who agrees to repurchase the same security at a mutually agreed upon date and price. On a daily basis, the counterparty is required to maintain collateral subject to the agreement and in value no less than the agreed upon repurchase amount. Pursuant to the custodial undertaking associated with atri-party repurchase arrangement, an unaffiliated third party custodian maintains accounts to hold collateral for a fund and its counterparties. Typically, a fund and counterparty are not permitted to sell,re-pledge or use the collateral absent a default by the counterparty or a fund, respectively.
In the event the counterparty defaults and the fair value of the collateral declines, a fund could experience losses, delays and costs in liquidating the collateral.
Repurchase agreements are entered into by a fund under Master Repurchase Agreements (each, an “MRA”). The MRA permits a fund, under certain circumstances including an event of default (such as bankruptcy or insolvency), to offset payables and/or receivables with collateral held by and/or posted to the counterparty. As a result, one single net payment is created. Bankruptcy or insolvency laws of a particular jurisdiction may impose restrictions on or prohibitions against such a right of offset in the event of the MRA counterparty’s bankruptcy or insolvency. Based on the terms of the MRA, a fund receives securities as collateral with a market value in excess of the repurchase price at maturity. Upon a bankruptcy or insolvency of the MRA counterparty, a fund would recognize a liability with respect to such excess collateral. The liability reflects a fund’s obligation under bankruptcy law to return the excess to the counterparty.
Borrowed Bond Agreements: Repurchase agreements may be referred to as borrowed bond agreements when entered into in connection with short sales of bonds. In a borrowed bond agreement, a fund borrows a bond from a counterparty in exchange for cash collateral. The agreement contains a commitment that the security and the cash will be returned to the counterparty and a fund at a mutually agreed upon date. Certain agreements have no stated maturity and can be terminated by either party at any time. Earnings on cash collateral and compensation to the lender of the bond are based on agreed upon rates between a fund and the counterparty. The value of the underlying cash collateral approximates the market value and accrued interest of the borrowed bond. To the extent that a borrowed bond transaction exceeds one business day, the value of the cash collateral in the possession of the counterparty is monitored on a daily basis to ensure the adequacy of the collateral. As the market value of the borrowed bond changes, the cash collateral is periodically increased or decreased with a frequency and in amounts prescribed in the borrowed bond agreement. A fund may also experience delays in gaining access to the collateral.
| | |
| 134 | | 2018 BLACKROCK ANNUAL REPORTTO SHAREHOLDERS |
Notes to Financial Statements (continued)
Reverse Repurchase Agreements: Reverse repurchase agreements are agreements with qualified third party broker dealers in which a fund sells securities to a bank or broker-dealer and agrees to repurchase the same securities at a mutually agreed upon date and price. A fund receives cash from the sale to use for other investment purposes. During the term of the reverse repurchase agreement, a fund continues to receive the principal and interest payments on the securities sold. Certain agreements have no stated maturity and can be terminated by either party at any time. Interest on the value of the reverse repurchase agreements issued and outstanding is based upon competitive market rates determined at the time of issuance. A fund may utilize reverse repurchase agreements when it is anticipated that the interest income to be earned from the investment of the proceeds of the transaction is greater than the interest expense of the transaction. Reverse repurchase agreements involve leverage risk. If a fund suffers a loss on its investment of the transaction proceeds from a reverse repurchase agreement, a fund would still be required to pay the full repurchase price. Further, a fund remains subject to the risk that the market value of the securities repurchased declines below the repurchase price. In such cases, a fund would be required to return a portion of the cash received from the transaction or provide additional securities to the counterparty.
Cash received in exchange for securities delivered plus accrued interest due to the counterparty is recorded as a liability in the Statements of Assets and Liabilities at face value including accrued interest. Due to the short-term nature of the reverse repurchase agreements, face value approximates fair value. Interest payments made by a fund to the counterparties are recorded as a component of interest expense in the Statements of Operations. In periods of increased demand for the security, a fund may receive a fee for the use of the security by the counterparty, which may result in interest income to a fund.
For the year ended December 31, 2018, the average amount of reverse repurchase agreements and the daily weighted average interest rate for the Funds were as follows:
| | | | | | | | |
| | | Balanced Capital | | | U.S. Government Bond | |
Average Borrowings | | $ | 5,722,761 | | | $ | 9,853,311 | |
Daily Weighted Average Interest Rate | | | 1.63 | % | | | 1.88 | % |
Borrowed bond agreements and reverse repurchase transactions are entered into by a fund under Master Repurchase Agreements (each, an “MRA”), which permit a fund, under certain circumstances, including an event of default (such as bankruptcy or insolvency), to offset payables and/or receivables under the MRA with collateral held and/or posted to the counterparty and create one single net payment due to or from a fund. With borrowed bond agreements and reverse repurchase transactions, typically a fund and counterparty under an MRA are permitted to sell,re-pledge, or use the collateral associated with the transaction. Bankruptcy or insolvency laws of a particular jurisdiction may impose restrictions on or prohibitions against such a right of offset in the event of the MRA counterparty’s bankruptcy or insolvency. Pursuant to the terms of the MRA, a fund receives or posts securities and cash as collateral with a market value in excess of the repurchase price to be paid or received by a fund upon the maturity of the transaction. Upon a bankruptcy or insolvency of the MRA counterparty, a fund is considered an unsecured creditor with respect to excess collateral and, as such, the return of excess collateral may be delayed.
As of period end, the following table is a summary of the Funds’ open borrowed bond agreements and reverse repurchase agreements by counterparty which are subject to offset under an MRA on a net basis:
| | | | | | | | | | | | | | | | | | | | | | | | | | | | | | | | | | | | |
| Counterparty | | Borrowed Bond
Agreements (a) | | | Borrowed Bond
at Value
including
Accrued
Interest (b) | | | Exposure Due
(to) / from
Counterparty
before
Collateral | | | Non-cash
Collateral
Received | | | Cash
Collateral
Received | | | Non-cash
Collateral
Pledged | | | Cash Collateral Pledged | | | Net Collateral
(Received)/
Pledged | | | Net Exposure
Due (to) / from
Counterparty (c) | |
Balanced Capital | | | | | | | | | | | | | | | | | | | | | | | | | | | | | | | | | |
BNP Paribas SA | | $ | 315,112 | | | $ | (315,788 | ) | | $ | (676 | ) | | $ | — | | | $ | — | | | $ | — | | | $ | — | | | $ | — | | | $ | (676 | ) |
Deutsche Bank Securities, Inc. | | | 2,431,013 | | | | (2,439,337 | ) | | | (8,324 | ) | | | — | | | | — | | | | — | | | | — | | | | — | | | | (8,324 | ) |
Merrill Lynch, Pierce, Fenner & Smith Inc. | | | 1,166,350 | | | | (1,170,042 | ) | | | (3,692 | ) | | | — | | | | — | | | | — | | | | — | | | | — | | | | (3,692 | ) |
| | | | | | | | | | | | | | | | | | | | | | | | | | | | | | | | | | | | |
| | $ | 3,912,475 | | | $ | (3,925,167 | ) | | $ | (12,692 | ) | | $ | — | | | $ | — | | | $ | — | | | $ | — | | | $ | — | | | $ | (12,692 | ) |
| | | | | | | | | | | | | | | | | | | | | | | | | | | | | | | | | | | | |
| | (a) | Included in Investments at value — unaffiliated in the Statements of Assets and Liabilities. | |
| | (b) | Includes accrued interest on borrowed bonds in the amount of $29,612 which is included in interest expense payable in the Statements of Assets and Liabilities. | |
| | (c) | Net exposure represents the net receivable (payable) that would be due from/to the counterparty in the event of default. | |
| | | | | | | | | | | | | | | | |
| Counterparty | | Reverse
Repurchase
Agreements | | | Fair Value of
Non-cash
Collateral Pledged
Including Accrued
Interest (a) | | | Cash Collateral
Pledged | | | Net
Amount | |
U.S. Government Bond | | | | | | | | | | | | | | | | |
BNP Paribas SA | | $ | (2,545,421 | ) | | $ | 2,545,421 | | | $ | — | | | $ | — | |
Merrill Lynch, Pierce, Fenner & Smith Inc. | | | (10,101,873 | ) | | | 10,101,873 | | | | — | | | | — | |
| | | | | | | | | | | | | | | | |
| | $ | (12,647,294 | ) | | $ | 12,647,294 | | | $ | — | | | $ | — | |
| | | | | | | | | | | | | | | | |
| | (a) | Net collateral with a value of $12,656,183 has been pledged in connection with open reverse repurchase agreements. Excess of net collateral pledged to the individual counterparty is not shown for financial reporting purposes. | |
| | | | |
| NOTESTO FINANCIAL STATEMENTS | | | 135 | |
Notes to Financial Statements (continued)
In the event the counterparty of securities under an MRA files for bankruptcy or becomes insolvent, a fund’s use of the proceeds from the agreement may be restricted while the counterparty, or its trustee or receiver, determines whether or not to enforce a fund’s obligation to repurchase the securities.
Short Sale Transactions (Borrowed Bonds): In short sale transactions, a fund sells a security it does not hold in anticipation of a decline in the market price of that security. When a fund makes a short sale, it will borrow the security sold short (borrowed bond) and deliver the fixed-income security to the counterparty to which it sold the security short. An amount equal to the proceeds received by a fund is reflected as an asset and an equivalent liability. The amount of the liability is subsequentlymarked-to-market to reflect the market value of the short sale. A fund is required to repay the counterparty interest on the security sold short, which, if applicable, is included in interest expense in the Statements of Operations. A fund is exposed to market risk based on the amount, if any, that the market value of the security increases beyond the market value at which the position was sold. Thus, a short sale of a security involves the risk that instead of declining, the price of the security sold short will rise. The short sale of securities involves the possibility of an unlimited loss since there is an unlimited potential for the market price of the security sold short to increase. A gain is limited to the price at which a fund sold the security short. A realized gain or loss is recognized upon the termination of a short sale if the market price is either less than or greater than the proceeds originally received. There is no assurance that a fund will be able to close out a short position at a particular time or at an acceptable price.
Short Sale Transactions (Equities): In short sale transaction, a fund sells a security it does not hold in anticipation of a decline in the market price of that security. When a fund makes a short sale, it will borrow the security sold short from a broker/counterparty and deliver the security to the purchaser. To close out a short position, a fund delivers the same security to the broker and records a liability to reflect the obligation to return the security to the broker. The amount of the liability is subsequentlymarked-to-market to reflect the market value of the short sale. A fund maintains a segregated account of securities or deposits cash with the broker-dealer as collateral for the short sales. Cash deposited with the broker is recorded as an asset in the Statements of Assets and Liabilities. Securities segregated as collateral are denoted in the Schedules of Investments. A fund may pay a financing fee for the difference between the market value of the short position and the cash collateral deposited with the broker which would be recorded as interest expense. A fund is required to repay the counterparty any dividends received on the security sold short, which, if applicable, is shown as dividend expense in the Statements of Operations. A fund may pay a fee on the assets borrowed from the counterparty, which, if applicable, is shown as broker fees and expenses on short sales in the Statements of Operations. A fund is exposed to market risk based on the amount, if any, that the market value of the security increases beyond the market value at which the position was sold. Thus, a short sale of a security involves the risk that instead of declining, the price of the security sold short will rise. The short sale of securities involves the possibility of an unlimited loss since there is an unlimited potential for the market price of the security sold short to increase. A gain, limited to the price at which a fund sold the security short. A realized gain or loss is recognized upon the termination of a short sale if the market price is either less than or greater than the proceeds originally received. There is no assurance that a fund will be able to close out a short position at a particular time or at an acceptable price.
Securities Lending: Certain Funds may lend their securities to approved borrowers, such as brokers, dealers and other financial institutions. The borrower pledges and maintains with the Funds collateral consisting of cash, an irrevocable letter of credit issued by a bank, or securities issued or guaranteed by the U.S. Government. The initial collateral received by each Fund is required to have a value of at least 102% of the current value of the loaned securities for securities traded on U.S. exchanges and a value of at least 105% for all other securities. The collateral is maintained thereafter at a value equal to at least 100% of the current market value of the securities on loan. The market value of the loaned securities is determined at the close of each business day of the Fund and any additional required collateral is delivered to the Fund, or excess collateral returned by the Fund, on the next business day. During the term of the loan, the Funds are entitled to all distributions made on or in respect of the loaned securities, but do not receive interest income on securities received as collateral. Loans of securities are terminable at any time and the borrower, after notice, is required to return borrowed securities within the standard time period for settlement of securities transactions.
The market value of any securities on loan, all of which were classified as common stocks and investment companies in the Funds’ Schedules of Investments, and the value of any related collateral are shown separately in the Statements of Assets and Liabilities as a component of investments at value — unaffiliated, and collateral on securities loaned at value, respectively. As of period end, any securities on loan were collateralized by cash and/or U.S. Government obligations. Cash collateral invested by the securities lending agent, BlackRock Investment Management, LLC (“BIM”), if any, is disclosed in the Schedules of Investments.
Securities lending transactions are entered into by the Funds under Master Securities Lending Agreements (each, an “MSLA”), which provide the right, in the event of default (including bankruptcy or insolvency), for thenon-defaulting party to liquidate the collateral and calculate a net exposure to the defaulting party or request additional collateral. In the event that a borrower defaults, the Funds, as lender, would offset the market value of the collateral received against the market value of the securities loaned. When the value of the collateral is greater than that of the market value of the securities loaned, the lender is left with a net amount payable to the defaulting party. However, bankruptcy or insolvency laws of a particular jurisdiction may impose restrictions on or prohibitions against such a right of offset in the event of an MSLA counterparty’s bankruptcy or insolvency. Under the MSLA, absent an event of default, the borrower can resell orre-pledge the loaned securities, and a Fund can reinvest cash collateral received in connection with loaned securities. Upon an event of default, the parties’ obligations to return the securities or collateral to the other party are extinguished, and the parties can resell orre-pledge the loaned securities or the collateral received in connection with the loaned securities in order to satisfy the defaulting party’s net payment obligation for all transactions under the MSLA. The defaulting party remains liable for any deficiency.
As of period end, the following tables are a summary of the Funds’ securities lending agreements by counterparty which are subject to offset under an MSLA:
| | | | | | | | | | | | |
| Counterparty | | Securities
Loaned at Value | | | Cash Collateral
Received (a) | | | Net
Amount (b) | |
Advantage Large Cap Core | | | | | | | | | | | | |
Citigroup Global Markets Inc. | | $ | 2,275,288 | | | $ | (2,275,288 | ) | | $ | — | |
Credit Suisse Securities (USA) LLC | | | 28,372 | | | | (28,372 | ) | | | — | |
Deutsche Bank Securities Inc. | | | 2,855 | | | | (2,855 | ) | | | — | |
JP Morgan Securities LLC | | | 1,034,695 | | | | (1,034,695 | ) | | | — | |
Morgan Stanley & Co. LLC | | | 242,281 | | | | (242,281 | ) | | | — | |
State Street Bank & Trust Co. | | | 65,926 | | | | (65,926 | ) | | | — | |
UBS Securities LLC | | | 493,347 | | | | (493,347 | ) | | | — | |
| | | | | | | | | | | | |
| | $ | 4,142,764 | | | $ | (4,142,764 | ) | | $ | — | |
| | | | | | | | | | | | |
| | |
| 136 | | 2018 BLACKROCK ANNUAL REPORTTO SHAREHOLDERS |
Notes to Financial Statements (continued)
| | | | | | | | | | | | |
| Counterparty | | Securities
Loaned at Value | | | Cash Collateral
Received (a) | | | Net
Amount (b) | |
Balanced Capital | | | | | | | | | | | | |
Citigroup Global Markets Inc. | | $ | 1,872,646 | | | $ | (1,872,646 | ) | | $ | — | |
Credit Suisse Securities (USA) LLC | | | 268,815 | | | | (268,815 | ) | | | — | |
JP Morgan Securities LLC | | | 1,396,813 | | | | (1,396,813 | ) | | | — | |
Morgan Stanley & Co. LLC | | | 2,011,836 | | | | (2,011,836 | ) | | | — | |
State Street Bank & Trust Co. | | | 55,695 | | | | (55,695 | ) | | | — | |
| | | | | | | | | | | | |
| | $ | 5,605,805 | | | $ | (5,605,805 | ) | | $ | — | |
| | | | | | | | | | | | |
Capital Appreciation | | | | | | | | | | | | |
Citigroup Global Markets Inc. | | $ | 916,013 | | | $ | (916,013 | ) | | $ | — | |
Deutsche Bank Securities Inc. | | | 1,226,035 | | | | (1,226,035 | ) | | | — | |
Fidelity Investments | | | 233,520 | | | | (233,478 | ) | | | 42 | |
JP Morgan Securities LLC | | | 2,130,083 | | | | (2,130,083 | ) | | | — | |
State Street Bank & Trust Co. | | | 23,559 | | | | (23,559 | ) | | | — | |
| | | | | | | | | | | | |
| | $ | 4,529,210 | | | $ | (4,529,168 | ) | | $ | 42 | |
| | | | | | | | | | | | |
Global Allocation | | | | | | | | | | | | |
Citigroup Global Markets Inc. | | $ | 1,453 | | | $ | (1,453 | ) | | $ | — | |
Credit Suisse Securities (USA) LLC | | | 1,081,142 | | | | (1,081,142 | ) | | | — | |
JP Morgan Securities LLC | | | 738,806 | | | | (738,806 | ) | | | — | |
Merrill Lynch, Pierce, Fenner & Smith | | | 1,346 | | | | (1,261 | ) | | | 85 | |
Morgan Stanley & Co. LLC | | | 267,986 | | | | (267,986 | ) | | | — | |
Nomura Securities International Inc. | | | 12,054 | | | | (12,054 | ) | | | — | |
State Street Bank & Trust Co. | | | 14,577 | | | | (14,577 | ) | | | — | |
| | | | | | | | | | | | |
| | $ | 2,117,364 | | | $ | (2,117,279 | ) | | $ | 85 | |
| | | | | | | | | | | | |
| | (a) | Cash Collateral with a value of $4,229,010, $5,717,412, $4,610,994 and $2,214,925 has been received by Advantage Large Cap Core, Balanced Capital, Capital Appreciation and Global Allocation, respectively, in connection with securities lending agreements. Collateral received in excess of the value of securities loaned from the individual counterparty, if any, is not shown for financial reporting purposes in the table above. | |
| | (b) | The market value of the loaned securities is determined as of December 31, 2018. Additional collateral is delivered to the Funds on the next business day in accordance with the MSLA. The net amount would be subject to the borrower default indemnity in the event of default by the counterparty. | |
The risks of securities lending include the risk that the borrower may not provide additional collateral when required or may not return the securities when due. To mitigate these risks, the Funds benefit from a borrower default indemnity provided by BIM. BIM’s indemnity allows for full replacement of the securities loaned if the collateral received does not cover the value on the securities loaned in the event of borrower default. Each Fund could incur a loss if the value of an investment purchased with cash collateral falls below the market value of loaned securities or if the value of an investment purchased with cash collateral falls below the value of the original cash collateral received.
| 5. | DERIVATIVE FINANCIAL INSTRUMENTS |
The Funds engage in various portfolio investment strategies using derivative contracts both to increase the returns of the Funds and/or to manage their exposure to certain risks such as credit risk, equity risk, interest rate risk, foreign currency exchange rate risk, commodity price risk or other risks (e.g., inflation risk). Derivative financial instruments categorized by risk exposure are included in the Schedules of Investments. These contracts may be transacted on an exchange or OTC.
Futures Contracts: Futures contracts are purchased or sold to gain exposure to, or manage exposure to, changes in interest rates (interest rate risk) and changes in the value of equity securities (equity risk) or foreign currencies (foreign currency exchange rate risk).
Futures contracts are agreements between the Funds and a counterparty to buy or sell a specific quantity of an underlying instrument at a specified price and on a specified date. Depending on the terms of a contract, it is settled either through physical delivery of the underlying instrument on the settlement date or by payment of a cash amount on the settlement date. Upon entering into a futures contract, the Funds are required to deposit initial margin with the broker in the form of cash or securities in an amount that varies depending on a contract’s size and risk profile. The initial margin deposit must then be maintained at an established level over the life of the contract. Amounts pledged, which are considered restricted, are included in cash pledged for futures contracts in the Statements of Assets and Liabilities.
Securities deposited as initial margin are designated in the Schedules of Investments and cash deposited, if any, is shown as cash pledged for futures contracts in the Statements of Assets and Liabilities. Pursuant to the contract, the Funds agree to receive from or pay to the broker an amount of cash equal to the daily fluctuation in market value of the contract (“variation margin”). Variation margin is recorded as unrealized appreciation (depreciation) and, if any, shown as variation margin receivable (or payable) on futures contracts in the Statements of Assets and Liabilities. When the contract is closed, a realized gain or loss is recorded in the Statements of Operations equal to the difference between the notional amount of the contract at the time it was opened and the notional amount at the time it was closed. The use of futures contracts involves the risk of an imperfect correlation in the movements in the price of futures contracts and interest, foreign currency exchange rates or underlying assets.
Forward Foreign Currency Exchange Contracts: Forward foreign currency exchange contracts are entered into to gain or reduce exposure to foreign currencies (foreign currency exchange rate risk).
A forward foreign currency exchange contract is an agreement between two parties to buy and sell a currency at a set exchange rate on a specified date. These contracts help to manage the overall exposure to the currencies in which some of the investments held by the Funds are denominated and in some cases, may be used to obtain exposure to a particular market.
| | | | |
| NOTESTO FINANCIAL STATEMENTS | | | 137 | |
Notes to Financial Statements (continued)
The contract ismarked-to-market daily and the change in market value is recorded as unrealized appreciation (depreciation) in the Statements of Assets and Liabilities. When a contract is closed, a realized gain or loss is recorded in the Statements of Operations equal to the difference between the value at the time it was opened and the value at the time it was closed.Non-deliverable forward foreign currency exchange contracts are settled with the counterparty in cash without the delivery of foreign currency. The use of forward foreign currency exchange contracts involves the risk that the value of a forward foreign currency exchange contract changes unfavorably due to movements in the value of the referenced foreign currencies. Cash amounts pledged for forward foreign currency exchange contracts are considered restricted and are included in cash pledged as collateral for OTC derivatives in the Statements of Assets and Liabilities.
Options: Certain Funds purchase and write call and put options to increase or decrease their exposure to the risks of underlying instruments, including equity risk, interest rate risk and/or commodity price risk and/or, in the case of options written, to generate gains from options premiums.
A call option gives the purchaser (holder) of the option the right (but not the obligation) to buy, and obligates the seller (writer) to sell (when the option is exercised) the underlying instrument at the exercise or strike price at any time or at a specified time during the option period. A put option gives the holder the right to sell and obligates the writer to buy the underlying instrument at the exercise or strike price at any time or at a specified time during the option period.
Premiums paid on options purchased and premiums received on options written, as well as the daily fluctuation in market value, are included in investments at value — unaffiliated and options written at value, respectively, in the Statements of Assets and Liabilities. When an instrument is purchased or sold through the exercise of an option, the premium is offset against the cost or proceeds of the underlying instrument. When an option expires, a realized gain or loss is recorded in the Statements of Operations to the extent of the premiums received or paid. When an option is closed or sold, a gain or loss is recorded in the Statements of Operations to the extent the cost of the closing transaction exceeds the premiums received or paid. When the Funds write a call option, such option is typically “covered,” meaning that they hold the underlying instrument subject to being called by the option counterparty. When the Funds write a put option, such option is covered by cash in an amount sufficient to cover the obligation. These amounts, which are considered restricted, are included in cash pledged as collateral for options written in the Statements of Assets and Liabilities.
| | • | | Swaptions — Certain Funds purchase and write options on swaps (“swaptions”) primarily to preserve a return or spread on a particular investment or portion of the Funds’ holdings, as a duration management technique or to protect against an increase in the price of securities it anticipates purchasing at a later date. The purchaser and writer of a swaption is buying or granting the right to enter into a previously agreed upon interest rate or credit default swap agreement (interest rate risk and/or credit risk) at any time before the expiration of the option. |
| | • | | Interest rate and caps and floors — Interest rate caps and floors are entered into to gain or reduce exposure to interest rates (interest rate risk and/or other risk). Caps are agreements whereby one party agrees to make payments to the other, in return for a premium, to the extent that interest rate indexes exceed a specified rate, or “cap.” Floors are agreements whereby one party agrees to make payments to the other, in return for a premium, to the extent that interest rate indexes fall below a specified rate, or “floor.” The maximum potential amount of future payments that a Fund would be required to make under an interest rate cap would be the notional amount times the percentage increase in interest rates determined by the difference between the interest rate index current value and the value at the time the cap was entered into. |
| | • | | Foreign currency options — Certain Funds purchase and write foreign currency options, foreign currency futures and options on foreign currency futures to gain or reduce exposure to foreign currencies (foreign currency exchange rate risk). Foreign currency options give the purchaser the right to buy from or sell to the writer a foreign currency at any time before the expiration of the option. |
| | • | | Barrier options — Certain Funds may purchase and write a variety of options withnon-standard payout structures or other features (“barrier options”) that are generally traded OTC. |
The Funds may invest in various types of barrier options, includingdown-and-out options,down-and-in options, doubleno-touch options,one-touch options,up-and-out options andup-and-in options.Down-and-out options expire worthless to the purchaser if the price of the underlying instrument falls below a specific barrier price level prior to the expiration date.Down-and-in options expire worthless to the purchaser unless the price of the underlying instrument falls below a specific barrier price level prior to the expiration date. Doubleno-touch options provide the purchaser an agreed-upon payout if the price of the underlying instrument does not reach or surpass predetermined barrier price levels prior to the option’s expiration date.One-touch options provide the purchaser an agreed-upon payout if the price of the underlying instrument reaches or surpasses predetermined barrier price levels prior to the expiration date.Up-and-out options expire worthless to the purchaser if the price of the underlying instrument increases beyond a predetermined barrier price level prior to the expiration date.Up-and-in options can only be exercised when the price of the underlying instrument increases beyond a predetermined barrier price level.
In purchasing and writing options, the Funds bear the risk of an unfavorable change in the value of the underlying instrument or the risk that they may not be able to enter into a closing transaction due to an illiquid market. Exercise of a written option could result in the Funds purchasing or selling a security when it otherwise would not, or at a price different from the current market value.
Swaps: Swap contracts are entered into to manage exposure to issuers, markets and securities. Such contracts are agreements between the Funds and a counterparty to make periodic net payments on a specified notional amount or a net payment upon termination. Swap agreements are privately negotiated in the OTC market and may be entered into as a bilateral contract (“OTC swaps”) or centrally cleared (“centrally cleared swaps”).
For OTC swaps, any upfront premiums paid and any upfront fees received are shown as swap premiums paid and swap premiums received, respectively, in the Statements of Assets and Liabilities and amortized over the term of the contract. The daily fluctuation in market value is recorded as unrealized appreciation (depreciation) on OTC Swaps in the Statements of Assets and Liabilities. Payments received or paid are recorded in the Statements of Operations as realized gains or losses, respectively. When an OTC swap is terminated, a realized gain or loss is recorded in the Statements of Operations equal to the difference between the proceeds from (or cost of) the closing transaction and the Funds’ basis in the contract, if any. Generally, the basis of the contract is the premium received or paid.
| | |
| 138 | | 2018 BLACKROCK ANNUAL REPORTTO SHAREHOLDERS |
Notes to Financial Statements (continued)
In a centrally cleared swap, immediately following execution of the swap contract, the swap contract is novated to a central counterparty (the “CCP”) and the Funds’ counterparty on the swap agreement becomes the CCP. The Funds are required to interface with the CCP through the broker. Upon entering into a centrally cleared swap, the Funds are required to deposit initial margin with the broker in the form of cash or securities in an amount that varies depending on the size and risk profile of the particular swap. Securities deposited as initial margin are designated in the Schedules of Investments and cash deposited is shown as cash pledged for centrally cleared swaps in the Statements of Assets and Liabilities. Amounts pledged, which are considered restricted cash, are included in cash pledged for centrally cleared swaps in the Statements of Assets and Liabilities. Pursuant to the contract, the Funds agree to receive from or pay to the broker an amount of cash equal to the daily fluctuation in market value of the contract (“variation margin”). Variation margin is recorded as unrealized appreciation (depreciation) and shown as variation margin receivable (or payable) on centrally cleared swaps in the Statements of Assets and Liabilities. Payments received from (paid to) the counterparty, including at termination, are recorded as realized gains (losses) in the Statements of Operations.
| | • | | Credit default swaps — Credit default swaps are entered into to manage exposure to the market or certain sectors of the market, to reduce risk exposure to defaults of corporate and/or sovereign issuers or to create exposure to corporate and/or sovereign issuers to which a fund is not otherwise exposed (credit risk). |
The Funds may either buy or sell (write) credit default swaps on single-name issuers (corporate or sovereign), a combination or basket of single-name issuers or traded indexes. Credit default swaps are agreements in which the protection buyer pays fixed periodic payments to the seller in consideration for a promise from the protection seller to make a specific payment should a negative credit event take place with respect to the referenced entity (e.g., bankruptcy, failure to pay, obligation acceleration, repudiation, moratorium or restructuring). As a buyer, if an underlying credit event occurs, the Funds will either (i) receive from the seller an amount equal to the notional amount of the swap and deliver the referenced security or underlying securities comprising the index, or (ii) receive a net settlement of cash equal to the notional amount of the swap less the recovery value of the security or underlying securities comprising the index. As a seller (writer), if an underlying credit event occurs, the Funds will either pay the buyer an amount equal to the notional amount of the swap and take delivery of the referenced security or underlying securities comprising the index or pay a net settlement of cash equal to the notional amount of the swap less the recovery value of the security or underlying securities comprising the index.
| | • | | Total return swaps — Total return swaps are entered into to obtain exposure to a security or market without owning such security or investing directly in such market or to exchange the risk/return of one market (e.g., fixed-income) with another market (e.g., equity or commodity prices) (equity risk, commodity price risk and/or interest rate risk). |
Total return swaps are agreements in which there is an exchange of cash flows whereby one party commits to make payments based on the total return (distributions plus capital gains/losses) of an underlying instrument, or basket or underlying instruments, in exchange for fixed or floating rate interest payments. If the total return of the instrument or index underlying the transaction exceeds or falls short of the offsetting fixed or floating interest rate obligation, the Funds receive payment from or make a payment to the counterparty.
Certain total return swaps are designed to function as a portfolio of direct investments in long and short equity positions. This means that each Fund has the ability to trade in and out of these long and short positions within the swap and will receive the economic benefits and risks equivalent to direct investment in these positions, subject to certain adjustments due to events related to the counterparty. Benefits and risks include capital appreciation (depreciation), corporate actions and dividends received and paid, all of which are reflected in the swap’s market value. The market value also includes interest charges and credits (“financing fees”) related to the notional values of the long and short positions and cash balances within the swap. These interest charges and credits are based on a specified benchmark rate plus or minus a specified spread determined based upon the country and/or currency of the positions in the portfolio.
Positions within the swap and financing fees are reset periodically. During a reset, any unrealized appreciation (depreciation) on positions and accrued financing fees become available for cash settlement between the Funds and the counterparty. The amounts that are available for cash settlement are recorded as realized gains or losses in the Statements of Operations. Cash settlement in and out of the swap may occur at a reset date or any other date, at the discretion of the Funds and the counterparty, over the life of the agreement. Certain swaps have no stated expiration and can be terminated by either party at any time.
| | • | | Interest rate swaps — Interest rate swaps are entered into to gain or reduce exposure to interest rates or to manage duration, the yield curve or interest rate (interest rate risk). |
Interest rate swaps are agreements in which one party pays a stream of interest payments, either fixed or floating, in exchange for another party’s stream of interest payments, either fixed or floating, on the same notional amount for a specified period of time. In more complex interest rate swaps, the notional principal amount may decline (or amortize) over time.
| | • | | Currency swaps — Currency swaps are entered into to gain or reduce exposure to foreign currencies (foreign currency exchange rate risk). |
Currency swaps are interest rate swaps in which one party pays a stream of interest payments, either fixed or floating, in exchange for another party’s stream of interest payments, either fixed or floating, based on the notional amounts of two different currencies. The notional amounts are typically determined based on the spot exchange rates at the inception of the trade. Currency swaps may also involve an exchange of notional amounts at the start, during and/or at expiration of the contract, either at the current spot rate or another specified rate.
| | • | | Forward swaps — Certain Funds enter into forward interest rate swaps and forward total return swaps. In a forward swap, each Fund and the counterparty agree to make periodic net payments beginning on a specified date or a net payment at termination. |
Swap transactions involve, to varying degrees, elements of interest rate, credit and market risk in excess of the amounts recognized in the Statements of Assets and Liabilities. Such risks involve the possibility that there will be no liquid market for these agreements, that the counterparty to the agreements may default on its obligation to perform or disagree as to the meaning of the contractual terms in the agreements, and that there may be unfavorable changes in interest rates and/or market values associated with these transactions.
| | | | |
| NOTESTO FINANCIAL STATEMENTS | | | 139 | |
Notes to Financial Statements (continued)
Master Netting Arrangements: In order to define their contractual rights and to secure rights that will help them mitigate their counterparty risk, the Funds may enter into an International Swaps and Derivatives Association, Inc. Master Agreement (“ISDA Master Agreement”) or similar agreement with their counterparties. An ISDA Master Agreement is a bilateral agreement between each Fund and a counterparty that governs certain OTC derivatives and typically contains, among other things, collateral posting terms and netting provisions in the event of a default and/or termination event. Under an ISDA Master Agreement, each Fund may, under certain circumstances, offset with the counterparty certain derivative financial instruments’ payables and/or receivables with collateral held and/or posted and create one single net payment. The provisions of the ISDA Master Agreement typically permit a single net payment in the event of default including the bankruptcy or insolvency of the counterparty. Bankruptcy or insolvency laws of a particular jurisdiction may restrict or prohibit the right of offset in bankruptcy, insolvency or other events.
Collateral Requirements: For derivatives traded under an ISDA Master Agreement, the collateral requirements are typically calculated by netting themark-to-market amount for each transaction under such agreement and comparing that amount to the value of any collateral currently pledged by the Fund and the counterparty.
Cash collateral that has been pledged to cover obligations of the Funds and cash collateral received from the counterparty, if any, is reported separately in the Statements of Assets and Liabilities as cash pledged as collateral and cash received as collateral, respectively.Non-cash collateral pledged by the Funds, if any, is noted in the Schedules of Investments. Generally, the amount of collateral due from or to a counterparty is subject to a certain minimum transfer amount threshold before a transfer is required, which is determined at the close of business of the Funds. Any additional required collateral is delivered to/pledged by the Funds on the next business day. Typically, the counterparty is not permitted to sell,re-pledge or use cash andnon-cash collateral it receives. A Fund generally agrees not to usenon-cash collateral that it receives but may, absent default or certain other circumstances defined in the underlying ISDA Master Agreement, be permitted to use cash collateral received. In such cases, interest may be paid pursuant to the collateral arrangement with the counterparty. To the extent amounts due to the Funds from their counterparties are not fully collateralized, they bear the risk of loss from counterpartynon-performance. Likewise, to the extent the Funds have delivered collateral to a counterparty and stand ready to perform under the terms of their agreement with such counterparty, they bear the risk of loss from a counterparty in the amount of the value of the collateral in the event the counterparty fails to return such collateral. Based on the terms of agreements, collateral may not be required for all derivative contracts.
For financial reporting purposes, the Funds do not offset derivative assets and derivative liabilities that are subject to netting arrangements, if any, in the Statements of Assets and Liabilities.
| 6. | INVESTMENT ADVISORY AGREEMENTS AND OTHER TRANSACTIONS WITH AFFILIATES |
Investment Advisory:Each Company, on behalf of its respective Funds, entered into an Investment Advisory Agreement with the Manager, the Funds’ investment adviser and an indirect, wholly-owned subsidiary of BlackRock, to provide investment advisory and administrative services. The Manager is responsible for the management of each Fund’s portfolio and provides the personnel, facilities, equipment and certain other services necessary to the operations of each Fund.
For such services, each Fund pays the Manager a monthly fee based on the percentage of the seven combined Funds’ average daily net assets at the following annual rates:
| | | | |
| Average Daily Net Assets of the Seven Combined Funds | | Investment
Advisory Fee | |
First $250 Million | | | 0.50 | % |
$250 Million — $300 Million | | | 0.45 | |
$300 Million — $400 Million | | | 0.40 | |
$400 Million — $800 Million | | | 0.35 | |
Greater than $800 Million | | | 0.30 | |
The portion of the assets of a Fund to which the rate of each breakpoint level applies will be determined on a “uniform percentage” basis. The uniform percentage applicable to a breakpoint level is determined by dividing the amount of the aggregate average daily net assets of the seven combined Funds that falls within that breakpoint level by the aggregate average daily net assets of the seven combined Funds. The amount of the fee for a Fund at each breakpoint level is determined by multiplying the average net assets of that Fund by the uniform percentage applicable to that breakpoint level and multiplying the product by the applicable advisory fee rate.
The Manager provides investment management and other services to the Subsidiary of Global Allocation. The Manager does not receive separate compensation from the Subsidiary for providing investment management or administrative services. However, Global Allocation pays the Manager based on the Fund’s net assets which includes the assets of the Subsidiary.
Distribution Fees: Each Company, on behalf of its respective Funds, entered into a Distribution Agreement and a Distribution Plan with BlackRock Investments, LLC (“BRIL”), an affiliate of the Manager.
Transfer Agent: On behalf of the Funds, the Manager entered into agreements with insurance companies and other financial intermediaries (“Service Organizations”), some of which may be affiliates. Pursuant to these agreements, the Service Organizations provide the Funds with administrative, networking, recordkeeping,sub-transfer agency and shareholder services tosub-accounts they service. For these services, the Service Organizations receive an annual fee per shareholder account, which will vary depending on share class and/or net assets of Fund shareholders serviced by the Service Organizations. For the year ended December 31, 2018, the Funds did not pay any amounts to affiliates in return for these services.
Expense Limitations, Waivers and Reimbursements: With respect to each Fund, the Manager voluntarily agreed to waive its investment advisory fees by the amount of investment advisory fees each Fund pays to the Manager indirectly through its investment in affiliated money market funds (the “affiliated money market fund waiver”). The amount of waivers and/or reimbursements of fees and expenses made pursuant to the expense limitation, described below, will be reduced by the amount of the affiliated money market fund waiver. However, the Manager does not waive its investment advisory fees by the amount of investment advisory fees paid in connection with the
| | |
| 140 | | 2018 BLACKROCK ANNUAL REPORTTO SHAREHOLDERS |
Notes to Financial Statements (continued)
Government Money Market’s investments in other affiliated investment companies, if any. These amounts are included in fees waived and/or reimbursed by the Manager in the Statements of Operations. For the year ended December 31, 2018, the amounts waived were as follows:
| | | | | | | | | | | | | | | | | | | | |
Advantage Large
Cap Core | | Balanced Capital | | | Capital Appreciation | | | Global Allocation | | | High Yield | | | U.S. Government Bond | |
$ 1,231 | | | $ 25,552 | | | | $ 1,198 | | | | $ 2,758 | | | | $ 361 | | | | $ 1,408 | |
The Funds have begun to incur expenses in connection with the proposed realignment and consolidation of the boards of directors of certain BlackRock-advised funds, including the Funds. The Manager has voluntarily agreed to reimburse certain Funds for all or a portion of such expenses, which amounts are included in fees waived and/or reimbursed by the Manager in the Statements of Operations. For the year ended December 31, 2018, the amounts reimbursed to High Yield and U.S. Government Bond were $154,157 and $178,843, respectively.
The Manager has contractually agreed to waive its investment advisory fee with respect to any portion of each Fund’s assets (other than Government Money Market) invested in affiliated equity and fixed-income mutual funds and affiliated exchange-traded funds that have a contractual management fee through April 30, 2019, except High Yield and U.S. Government Bond which are through April 30, 2020. The contractual agreement may be terminated upon 90 days’ notice by a majority of the directors who are not “interested persons” of the Funds, as defined in the 1940 Act (“Independent Directors”), or by a vote of a majority of the outstanding voting securities of a Fund. These amounts are included in fees waived and/or reimbursed by the Manager in the Statements of Operations. For the year ended December 31, 2018, the amounts waived in investment advisory fees pursuant to these arrangements were as follows:
| | | | | | | | |
| Balanced Capital | | Global Allocation | | | High Yield | |
$ 8,232 | | | $ 4,377 | | | | $ 35 | |
For the year ended December 31, 2018, the Funds reimbursed the Manager for certain accounting services, which are included in accounting services in the Statements of Operations. The reimbursements were as follows:
| | | | | | | | | | | | | | | | | | | | |
Advantage Large
Cap Core | | | Balanced
Capital | | Capital
Appreciation | | | Global
Allocation | | Government
Money Market | | | High Yield | | U.S. Government
Bond | |
| $ | 2,263 | | | $ 5,748 | | $ | 2,084 | | | $ 2,187 | | $ | 1,211 | | | $ 320 | | $ | 502 | |
The Manager has contractually agreed to waive and/or reimburse transfer agent fees in order to limit such expenses as a percentage of average daily net assets as follows:
| | | | | | | | | | | | | | | | | | | | |
Advantage Large Cap Core | | | Balanced
Capital | | Capital
Appreciation | | | Global
Allocation | | Government
Money Market | | | High Yield | | U.S. Government
Bond | |
| | 0.04% | | | 0.04% | | | 0.04% | | | 0.04% | | | 0.02% | | | 0.05% | | | 0.05% | |
The Manager has agreed not to reduce or discontinue this contractual expense limitation prior to April 30, 2019, except High Yield and U.S. Government Bond which are through April 30, 2020. The contractual agreement may be terminated, with respect to each Fund, upon 90 days’ notice by a majority of the Independent Directors of the Funds or by a vote of a majority of the outstanding voting securities of a Fund.
These amounts waived and/or reimbursed are shown as transfer agent fees waived and/or reimbursed the Statements of Operations. For the year ended December 31, 2018, class specific expense waivers and/or reimbursement are as follows:
| | | | | | | | | | | | | | | | | | |
Advantage Large
Cap Core | | Balanced
Capital | | Capital
Appreciation | | | Global
Allocation | | Government
Money Market | | | High Yield | | U.S. Government
Bond | |
| $ 186,391 | | $ 532,905 | | $ | 174,134 | | | $ 223,905 | | $ | 165,021 | | | $ 28,523 | | $ | 54,939 | |
With respect to each Fund, the Manager contractually agreed to waive and/or reimburse fees or expenses in order to limit expenses, excluding interest expense, dividend expense, tax expense, acquired fund fees and expenses, and certain other fund expenses, which constitute extraordinary expenses not incurred in the ordinary course of each Fund’s business (“expense limitation”). The expense limitations as a percentage of average daily net assets are as follows:
| | | | |
Advantage Large Cap Core | | | 0.50 | % |
Balanced Capital | | | 0.50 | |
Capital Appreciation | | | 0.57 | |
Global Allocation | | | 0.57 | |
Government Money Market | | | 0.50 | |
High Yield | | | 0.50 | |
U.S. Government Bond | | | 0.50 | |
| | | | |
| NOTESTO FINANCIAL STATEMENTS | | | 141 | |
Notes to Financial Statements (continued)
The Manager has agreed not to reduce or discontinue these contractual expense limitations through April 30, 2019 for each Fund, except High Yield and U.S. Government Bond which are through April 30, 2020. The contractual agreement may be terminated, with respect to each Fund, upon 90 days’ notice by a majority of the Independent Directors of the Funds or by a vote of a majority of the outstanding voting securities of a Fund. For the year ended December 31, 2018, the following amounts are included in fees waived and/or reimbursed by the Manager and transfer agent fees waived and/or reimbursed in the Statements of Operations:
| | | | | | | | | | | | | | | | | | | | | | | | |
| | | Advantage Large
Cap Core | | | Balanced
Capital | | | Global
Allocation | | | Government
Money Market | | | High Yield | | | U.S. Government
Bond | |
Fees waived and/or reimbursed by the Manager | | $ | 1,795 | | | $ | 465 | | | $ | 89,910 | | | $ | 5,475 | | | $ | 243,479 | | | $ | 200,451 | |
| | | | | | | | | | | | | | | | | | | | | | | | | | | | |
| | | Advantage Large
Cap Core | | | Balanced
Capital | | | Capital
Appreciation | | | Global
Allocation | | | Government
Money Market | | | High Yield | | | U.S. Government
Bond | |
Transfer agent fees waived and/or reimbursed | | $ | 47,104 | | | $ | 46,383 | | | $ | 12,039 | | | $ | 79,308 | | | $ | 10,918 | | | $ | 14,926 | | | $ | 27,758 | |
The Manager and BRIL voluntarily agreed to waive a portion of their respective management and distribution fees and/or reimburse operating expenses to enable Government Money Market to maintain minimum levels of daily net investment income. For the year ended December 31, 2018, there were no fees waived and/or reimbursed by the Manager. However, the Manager does not waive its investment advisory fees by the amount of investment advisory fees paid in connection with the Fund’s investments in other affiliated investment companies, if any. The Manager and BRIL may discontinue the waiver or reimbursement at any time.
Securities Lending: The U.S. Securities and Exchange Commission (“SEC”) has issued an exemptive order which permits BIM, an affiliate of the Manager, to serve as securities lending agent for the Funds, subject to applicable conditions. As securities lending agent, BIM bears all operational costs directly related to securities lending. The Funds are responsible for expenses in connection with the investment of cash collateral received for securities on loan (the “collateral investment expenses”). The cash collateral is invested in a private investment company managed by the Manager or its affiliates. However, BIM has agreed to cap the collateral investment expenses of the private investment company to an annual rate of 0.04%. The investment adviser to the private investment company will not charge any advisory fees with respect to shares purchased by the Funds. The private investment company in which the cash collateral has been invested may, under certain circumstances, impose a liquidity fee of up to 2% of the value withdrawn or temporarily restrict withdrawals for up to 10 business days during a 90 day period, in the event that the private investment company’s weekly liquid assets fall below certain thresholds.
Securities lending income is equal to the total of income earned from the reinvestment of cash collateral, net of fees and other payments to and from borrowers of securities, and less the collateral investment expenses. Each Fund retains a portion of securities lending income and remits a remaining portion to BIM as compensation for its services as securities lending agent.
Pursuant to a securities lending agreement, Government Money Market, High Yield and U.S. Government Bond retain 80% of securities lending income (which excludes collateral investment expenses), and this amount retained can never be less than 70% of the total of securities lending income plus the collateral investment expenses. In addition, commencing the business day following the date that the aggregate securities lending income earned across the Equity-Bond Complex in a calendar year exceeds a specified threshold, Government Money Market, High Yield and U.S. Government Bond, pursuant to the securities lending agreement, will retain for the remainder of that calendar year securities lending income in an amount equal to 85% of securities lending income, and this amount retained can never be less than 70% of the total of securities lending income plus the collateral investment expenses.
Pursuant to a securities lending agreement, Advantage Large Cap Core, Balanced Capital and Capital Appreciation retain 71.5% of securities lending income, and this amount retained can never be less than 65% of the total of securities lending income plus the collateral investment expenses. In addition, commencing the business day following the date that the aggregate securities lending income earned across the Equity-Bond Complex in a calendar year exceeds a specified threshold, Advantage Large Cap Core, Balanced Capital and Capital Appreciation, pursuant to the securities lending agreement, will retain for the remainder of that calendar year securities lending income in an amount equal to 75% of securities lending income, and this amount retained can never be less than 65% of the total of securities lending income plus the collateral investment expenses.
Pursuant to a securities lending agreement, Global Allocation retains 80% of securities lending income, and this amount retained can never be less than 70% of the total of securities lending income plus the collateral investment expenses. In addition, commencing the business day following the date that the aggregate securities lending income earned across the Equity-Bond Complex in a calendar year exceeds a specified threshold, Global Allocation, pursuant to the securities lending agreement, will retain for the remainder of that calendar year securities lending income in an amount equal to 85% of securities lending income, and this amount retained can never be less than 70% of the total of securities lending income plus the collateral investment expenses.
The share of securities lending income earned by each Fund is shown as securities lending income — affiliated — net in the Statements of Operations. For the year ended December 31, 2018, each Fund paid BIM the following amounts for securities lending agent services:
| | | | | | | | | | | | | | | | | | | | |
Advantage Large
Cap Core | | | | | Balanced
Capital | | | | | Capital
Appreciation | | | | | Global
Allocation | |
| $ | 2,209 | | | | | $ | 3,898 | | | | | $ | 7,712 | | | | | $ | 4,382 | |
Interfund Lending: In accordance with an exemptive order (the “Order”) from the SEC, each Fund may participate in a joint lending and borrowing facility for temporary purposes (the “Interfund Lending Program”), subject to compliance with the terms and conditions of the Order, and to the extent permitted by each Fund’s investment policies and restrictions. Each Fund is currently permitted to borrow and lend under the Interfund Lending Program.
A lending BlackRock fund may lend in aggregate up to 15% of its net assets, but may not lend more than 5% of its net assets to any one borrowing fund through the Interfund Lending Program. A borrowing BlackRock fund may not borrow through the Interfund Lending Program or from any other source more than 33 1/3% of its total assets (or any lower threshold provided for by the fund’s investment restrictions). If a borrowing BlackRock fund’s total outstanding borrowings exceed 10% of its total assets, each of its outstanding interfund loans will be subject to collateralization of at least 102% of the outstanding principal value of the loan. All interfund loans are for
| | |
| 142 | | 2018 BLACKROCK ANNUAL REPORTTO SHAREHOLDERS |
Notes to Financial Statements (continued)
temporary or emergency purposes and the interest rate to be charged will be the average of the highest current overnight repurchase agreement rate available to a lending fund and the bank loan rate, as calculated according to a formula established by the Board.
During the year ended December 31, 2018, the Funds did not participate in the Interfund Lending Program.
Directors and Officers: Certain directors and/or officers of the Companies are directors and/or officers of BlackRock or its affiliates. The Funds reimburse the Manager for a portion of the compensation paid to the Companies’ Chief Compliance Officer, which is included in Directors and Officer in the Statements of Operations.
Other Transactions: During the year ended December 31, 2018, High Yield received a reimbursement of $2,724 from an affiliate, which is included in payment by affiliate in the Statements of Operations, related to an operating event.
The Funds may purchase securities from, or sell securities to, an affiliated fund provided the affiliation is due solely to having a common investment adviser, common officers, or common directors. For the year ended December 31, 2018, the purchase and sale transactions and any net realized gains (losses) with affiliated funds in compliance with Rule17a-7 under the 1940 Act were as follows:
| | | | | | | | | | | | |
| | | Purchases | | | Sales | | | Net Realized
Gain (Loss) | |
Balanced Capital | | $ | 502,270 | | | $ | 102,256 | | | $ | (3,823 | ) |
Global Allocation | | $ | 66,914 | | | $ | 174,012 | | | $ | 5,735 | |
High Yield | | $ | 44,839 | | | | — | | | | — | |
U.S. Government Bond Portfolio | | $ | 19,278 | | | | — | | | | — | |
For the year ended December 31, 2018, purchases and sales of investments, including mortgage dollar rolls and excluding short-term securities, were as follows:
| | | | | | | | | | | | | | | | | | | | | | | | |
| Purchases | | Advantage
Large
Cap Core | | | Balanced
Capital | | | Capital
Appreciation | | | Global
Allocation | | | High Yield | | | U.S. Government
Bond Portfolio | |
Non-U.S Government Securities | | $ | 277,626,133 | | | $ | 1,280,729,849 | | | $ | 81,814,312 | | | $ | 90,353,774 | | | $ | 19,593,433 | | | $ | 405,710,858 | |
U.S Government Securities | | | — | | | | 54,269,940 | | | | — | | | | 172,109,921 | | | | — | | | | 52,058,543 | |
| | | | | | | | | | | | | | | | | | | | | | | | |
Total Purchases | | $ | 277,626,133 | | | $ | 1,334,999,789 | | | $ | 81,814,312 | | | $ | 262,463,695 | | | $ | 19,593,433 | | | $ | 457,769,401 | |
| | | | | | | | | | | | | | | | | | | | | | | | |
| | | | | | | | | | | | | | | | | | | | | | | | |
| Sales | | | | | | | | | | | | | | | | | | |
Non-U.S Government Securities | | $ | 293,061,458 | | | $ | 1,270,402,999 | | | $ | 96,445,863 | | | $ | 111,988,343 | | | $ | 23,528,951 | | | $ | 405,361,015 | |
U.S Government Securities | | | — | | | | 82,082,534 | | | | — | | | | 162,365,543 | | | | — | | | | 54,904,772 | |
| | | | | | | | | | | | | | | | | | | | | | | | |
Total Sales | | $ | 293,061,458 | | | $ | 1,352,485,533 | | | $ | 96,445,863 | | | $ | 274,353,886 | | | $ | 23,528,951 | | | $ | 460,265,787 | |
| | | | | | | | | | | | | | | | | | | | | | | | |
For the year ended December 31, 2018, purchases and sales related to mortgage dollar rolls were as follows:
| | | | | | | | |
| Purchases and Sales — MDRs | | Balanced
Capital | | | U.S. Government
Bond Portfolio | |
Purchases | | $ | 331,474,343 | | | $ | 185,124,317 | |
Sales | | $ | 331,633,158 | | | $ | 185,146,405 | |
It is each Fund’s policy to comply with the requirements of the Internal Revenue Code of 1986, as amended, applicable to regulated investment companies, and to distribute substantially all of its taxable income to its shareholders. Therefore, no U.S. federal income tax provision is required.
Each Fund files U.S. federal and various state and local tax returns. No income tax returns are currently under examination. The statute of limitations on each Fund’s U.S. federal tax returns generally remains open for each of the four years ended December 31, 2018. The statutes of limitations on each Fund’s state and local tax returns may remain open for an additional year depending upon the jurisdiction.
Management has analyzed tax laws and regulations and their application to the Funds as of December 31, 2018, inclusive of the open tax return years, and does not believe that there are any uncertain tax positions that require recognition of a tax liability in the Funds’ financial statements.
US GAAP requires that certain components of net assets be adjusted to reflect permanent differences between financial and tax reporting. These reclassifications have no effect on net assets or net asset values per share. As of December 31, 2018 the following permanent differences, attributable to investment in wholly owned subsidiaries, were reclassified to the following accounts:
| | | | |
| | | Global
Allocation | |
Paid-in capital | | $ | (380,540 | ) |
Accumulated earnings | | | 380,540 | |
| | | | |
| NOTESTO FINANCIAL STATEMENTS | | | 143 | |
Notes to Financial Statements (continued)
The tax character of distributions paid was as follows:
| | | | | | | | | | | | | | | | | | | | | | | | | | | | | | | | |
| | | | | | Advantage
Large Cap
Core | | | Balanced
Capital | | | Capital
Appreciation | | | Global
Allocation | | | Government
Money
Market | | | High Yield | | | U.S.
Government
Bond | |
Ordinary income | | | 12/31/2018 | | | $ | 15,692,629 | | | $ | 30,251,389 | | | $ | 1,372,000 | | | $ | 5,546,837 | | | $ | 1,777,250 | | | $ | 1,697,206 | | | $ | 1,565,228 | |
| | | 12/31/2017 | | | | 6,679,027 | | | | 20,664,975 | | | | 3,691,980 | | | | 2,964,477 | | | | 498,459 | | | | 1,883,102 | | | | 1,311,639 | |
Long-term capital gains | | | 12/31/2018 | | | | 8,044,087 | | | | 12,613,658 | | | | 18,264,188 | | | | 6,774,163 | | | | — | | | | — | | | | — | |
| | | 12/31/2017 | | | | 44,735,172 | | | | 73,985,478 | | | | 13,025,751 | | | | — | | | | 351 | | | | — | | | | — | |
Tax return of capital | | | 12/31/2018 | | | | — | | | | — | | | | — | | | | — | | | | — | | | | 8,797 | | | | — | |
| | | 12/31/2017 | | | | — | | | | — | | | | — | | | | — | | | | — | | | | — | | | | — | |
| | | | | | | | | | | | | | | | | | | | | | | | | | | | | | | | |
Total | | | 12/31/2018 | | | $ | 23,736,716 | | | $ | 42,865,047 | | | $ | 19,636,188 | | | $ | 12,321,000 | | | $ | 1,777,250 | | | $ | 1,706,003 | | | $ | 1,565,228 | |
| | | | | | | | | | | | | | | | | | | | | | | | | | | | | | | | |
| | | 12/31/2017 | | | $ | 51,414,199 | | | $ | 94,650,453 | | | $ | 16,717,731 | | | $ | 2,964,477 | | | $ | 498,810 | | | $ | 1,883,102 | | | $ | 1,311,639 | |
| | | | | | | | | | | | | | | | | | | | | | | | | | | | | | | | |
As of December 31, 2018, the tax components of accumulated earnings (loss) were as follows:
| | | | | | | | | | | | | | | | | | | | | | | | | | | | |
| | | Advantage
Large Cap
Core | | | Balanced
Capital | | | Capital
Appreciation | | | Global
Allocation | | | Government
Money
Market | | | High Yield | | | U.S.
Government
Bond | |
Undistributed ordinary income | | $ | 53,976 | | | $ | — | | | $ | 39,776 | | | $ | 106,682 | | | $ | 882 | | | $ | — | | | $ | 40,449 | |
Undistributed long-term capital gains | | | — | | | | — | | | | 1,127,876 | | | | 1,480,751 | | | | — | | | | — | | | | — | |
Capital loss carryforwards | | | — | | | | — | | | | — | | | | — | | | | — | | | | (1,825,510 | ) | | | (3,146,705 | ) |
Net unrealized gains (losses)(a) | | | (9,079,702 | ) | | | (20,469,280 | ) | | | 35,194,881 | | | | (6,015,618 | ) | | | — | | | | (2,041,706 | ) | | | (582,325 | ) |
Qualified late-year losses(b) | | | (1,153,691 | ) | | | (1,570,916 | ) | | | — | | | | — | | | | — | | | | (5,936 | ) | | | — | |
| | | | | | | | | | | | | | | | | | | | | | | | | | | | |
| | $ | (10,179,417 | ) | | $ | (22,040,196 | ) | | $ | 36,362,533 | | | $ | (4,428,185 | ) | | $ | 882 | | | $ | (3,873,152 | ) | | $ | (3,688,581 | ) |
| | | | | | | | | | | | | | | | | | | | | | | | | | | | |
| | (a) | The difference between book-basis andtax-basis net unrealized gains (losses) was attributable primarily to the tax deferral of losses on wash sales and straddles, amortization and accretion methods of premiums and discounts on fixed income securities, the realization for tax purposes of unrealized gains/losses on certain futures, options and foreign currency contracts, the timing and recognition of partnership income, the accounting for swap agreements, and the classification of investments. | |
| | (b) | The Fund has elected to defer certain qualified late-year losses and recognize such losses in the next taxable year. | |
As of December 31, 2018, the Funds had capital loss carryforwards available to offset future realized capital gains with no expiration as follows:
| | | | | | | | |
| | | High Yield | | | U.S.
Government
Bond | |
No expiration date | | $ | 1,825,510 | | | $ | 3,146,705 | |
As of December 31, 2018, gross unrealized appreciation and depreciation for investments and derivatives based on cost for U.S. federal income tax purposes were as follows:
| | | | | | | | | | | | | | | | | | | | | | | | |
| | | Advantage
Large Cap
Core | | | Balanced
Capital | | | Capital
Appreciation | | | Global
Allocation | | | High Yield | | | U.S.
Government
Bond | |
Tax cost | | $ | 174,790,235 | | | $ | 523,830,072 | | | $ | 133,110,603 | | | $ | 182,787,009 | | | $ | 28,997,933 | | | $ | 80,001,931 | |
| | | | | | | | | | | | | | | | | | | | | | | | |
Gross unrealized appreciation | | $ | 5,585,740 | | | $ | 8,599,843 | | | $ | 39,480,091 | | | $ | 10,069,982 | | | $ | 53,251 | | | $ | 774,454 | |
Gross unrealized depreciation | | | (14,690,810 | ) | | | (29,097,720 | ) | | | (4,328,410 | ) | | | (15,904,190 | ) | | | (1,969,210 | ) | | | (1,365,884 | ) |
| | | | | | | | | | | | | | | | | | | | | | | | |
Net unrealized appreciation (depreciation) | | $ | (9,105,070 | ) | | $ | (20,497,877 | ) | | $ | 35,151,681 | | | $ | (5,834,208 | ) | | $ | (1,915,959 | ) | | $ | (591,430 | ) |
| | | | | | | | | | | | | | | | | | | | | | | | |
The Companies, on behalf of the Funds (except for Government Money Market), along with certain other funds managed by the Manager and its affiliates (“Participating Funds”), is a party to a364-day, $2.25 billion credit agreement with a group of lenders. Under this agreement, the Funds may borrow to fund shareholder redemptions. Excluding commitments designated for certain individual funds, the Participating Funds, including the Funds, can borrow up to an aggregate commitment amount of $1.75 billion at any time outstanding, subject to asset coverage and other limitations as specified in the agreement. The credit agreement has the following terms: a fee of 0.10% per annum on unused commitment amounts and interest at a rate equal to the higher of(a) one-month LIBOR (but, in any event, not less than 0.00%) on the date the loan is made plus 0.80% per annum or (b) the Fed Funds rate (but, in any event, not less than 0.00%) in effect from time to time plus 0.80% per annum on amounts borrowed. The agreement expires in April 2019 unless extended or renewed. Prior to April 19, 2018, the aggregate commitment amount was $2.1 billion and the fee was 0.12% per annum. Participating Funds paid an upfront commitment fee of 0.02% on the total commitment amounts, in addition to administration, legal and arrangement fees, which are included in miscellaneous expenses in the Statements of Operations. These fees were allocated among such funds based upon portions of the aggregate commitment available to them and relative net assets of Participating Funds. During the year ended December 31, 2018, the Funds did not borrow under the credit agreement.
| | |
| 144 | | 2018 BLACKROCK ANNUAL REPORTTO SHAREHOLDERS |
Notes to Financial Statements (continued)
Many municipalities insure repayment of their bonds, which may reduce the potential for loss due to credit risk. The market value of these bonds may fluctuate for other reasons, including market perception of the value of such insurance, and there is no guarantee that the insurer will meet its obligation.
Inventories of municipal bonds held by brokers and dealers may decrease, which would lessen their ability to make a market in these securities. Such a reduction in market making capacity could potentially decrease a Fund’s ability to buy or sell bonds. As a result, a Fund may sell a security at a lower price, sell other securities to raise cash, or give up an investment opportunity, any of which could have a negative impact on performance. If a Fund needed to sell large blocks of bonds, those sales could further reduce the bonds’ prices and impact performance.
In the normal course of business, certain Funds invest in securities or other instruments and may enter into certain transactions, and such activities subject each Fund to various risks, including among others, fluctuations in the market (market risk) or failure of an issuer to meet all of its obligations. The value of securities or other instruments may also be affected by various factors, including, without limitation: (i) the general economy; (ii) the overall market as well as local, regional or global political and/or social instability; (iii) regulation, taxation or international tax treaties between various countries; or (iv) currency, interest rate and price fluctuations. Each Fund’s prospectus provides details of the risks to which each Fund is subject.
Each Fund may be exposed to prepayment risk, which is the risk that borrowers may exercise their option to prepay principal earlier than scheduled during periods of declining interest rates, which would force each Fund to reinvest in lower yielding securities. Each Fund may also be exposed to reinvestment risk, which is the risk that income from each Fund’s portfolio will decline if each Fund invests the proceeds from matured, traded or called fixed-income securities at market interest rates that are below each Fund portfolio’s current earnings rate.
Certain obligations held by the Government Money Market have a credit enhancement or liquidity feature that may, under certain circumstances, provide for repayment of principal and interest on the obligation when due. These enhancements, which may include letters of credit,stand-by bond purchase agreements and/or third party insurance, are issued by financial institutions. The value of the obligations may be affected by changes in creditworthiness of the entities that provide the credit enhancements or liquidity features. The Government Money Market monitors its exposure by reviewing the creditworthiness of the issuers, as well as the financial institutions issuing the credit enhancements and by limiting the amount of holdings with credit enhancements from one financial institution.
The Funds may be exposed to additional risks when reinvesting cash collateral in money market funds that do not seek to maintain a stable NAV per share of $1.00, which may be subject to redemption gates or liquidity fees under certain circumstances.
Valuation Risk: The market values of equities, such as common stocks and preferred securities or equity related investments, such as futures and options, may decline due to general market conditions which are not specifically related to a particular company. They may also decline due to factors which affect a particular industry or industries. A Fund may invest in illiquid investments and may experience difficulty in selling those investments in a timely manner at the price that they believe the investments are worth. Prices may fluctuate widely over short or extended periods in response to company, market or economic news. Markets also tend to move in cycles, with periods of rising and falling prices. This volatility may cause each Fund’s NAV to experience significant increases or decreases over short periods of time. If there is a general decline in the securities and other markets, the NAV of a Fund may lose value, regardless of the individual results of the securities and other instruments in which a Fund invests.
The price a Fund could receive upon the sale of any particular portfolio investment may differ from a Fund’s valuation of the investment, particularly for securities that trade in thin or volatile markets or that are valued using a fair valuation technique or a price provided by an independent pricing service. Changes to significant unobservable inputs and assumptions (i.e., publicly traded company multiples, growth rate, time to exit) due to the lack of observable inputs may significantly impact the resulting fair value and therefore a Fund’s results of operations. As a result, the price received upon the sale of an investment may be less than the value ascribed by a Fund, and a Fund could realize a greater than expected loss or lesser than expected gain upon the sale of the investment. A Fund’s ability to value its investments may also be impacted by technological issues and/or errors by pricing services or other third party service providers.
Counterparty Credit Risk: The Funds may be exposed to counterparty credit risk, or the risk that an entity may fail to or be unable to perform on its commitments related to unsettled or open transactions. The Funds manage counterparty credit risk by entering into transactions only with counterparties that the Manager believes have the financial resources to honor their obligations and by monitoring the financial stability of those counterparties. Financial assets, which potentially expose the Funds to market, issuer and counterparty credit risks, consist principally of financial instruments and receivables due from counterparties. The extent of the Funds’ exposure to market, issuer and counterparty credit risks with respect to these financial assets is approximately their value recorded in the Statements of Assets and Liabilities, less any collateral held by the Funds.
A derivative contract may suffer amark-to-market loss if the value of the contract decreases due to an unfavorable change in the market rates or values of the underlying instrument. Losses can also occur if the counterparty does not perform under the contract.
A Fund’s risk of loss from counterparty credit risk on OTC derivatives is generally limited to the aggregate unrealized gain less the value of any collateral held by such Fund.
For OTC options purchased, each Fund bears the risk of loss in the amount of the premiums paid plus the positive change in market values net of any collateral held by the Funds should the counterparty fail to perform under the contracts. Options written by the Funds do not typically give rise to counterparty credit risk, as options written generally obligate the Funds, and not the counterparty, to perform. The Funds may be exposed to counterparty credit risk with respect to options written to the extent each Fund deposits collateral with its counterparty to a written option.
With exchange-traded options purchased and futures and centrally cleared swaps, there is less counterparty credit risk to the Funds since the exchange or clearinghouse, as counterparty to such instruments, guarantees against a possible default. The clearinghouse stands between the buyer and the seller of the contract; therefore, credit risk is limited to failure of the clearinghouse. While offset rights may exist under applicable law, a Fund does not have a contractual right of offset against a clearing broker or clearinghouse in the event of a default (including the bankruptcy or insolvency). Additionally, credit risk exists in exchange-traded futures and centrally cleared swaps with
| | | | |
| NOTESTO FINANCIAL STATEMENTS | | | 145 | |
Notes to Financial Statements (continued)
respect to initial and variation margin that is held in a clearing broker’s customer accounts. While clearing brokers are required to segregate customer margin from their own assets, in the event that a clearing broker becomes insolvent or goes into bankruptcy and at that time there is a shortfall in the aggregate amount of margin held by the clearing broker for all its clients, typically the shortfall would be allocated on a pro rata basis across all the clearing broker’s customers, potentially resulting in losses to the Funds.
Concentration Risk:As of period end, Capital Appreciation invested a significant portion of its assets in securities in the Information Technology sector. Changes in economic conditions affecting such sector would have a greater impact on the Fund and could affect the value, income and/or liquidity of positions in such securities.
Certain Funds may invest in securities that are rated below investment grade quality (sometimes called “junk bonds”), which are predominantly speculative, have greater credit risk and generally are less liquid and have more volatile prices than higher quality securities.
Certain Funds invest a significant portion of their assets in fixed-income securities and/or use derivatives tied to the fixed-income markets. Changes in market interest rates or economic conditions may affect the value and/or liquidity of such investments. Interest rate risk is the risk that prices of bonds and other fixed-income securities will increase as interest rates fall and decrease as interest rates rise. The Funds may be subject to a greater risk of rising interest rates due to the current period of historically low rates. The Federal Reserve has begun to raise the Federal Funds rate, and each increase results in more pronounced interest rate risk in the current market environment.
Global Allocation invests a significant portion of its assets in securities of issuers located in Europe or with significant exposure to European issuers or countries. The European financial markets have recently experienced volatility and adverse trends due to concerns about economic downturns in, or rising government debt levels of, several European countries. These events may spread to other countries in Europe and may affect the value and liquidity of certain of the Fund’s investments.
The United Kingdom is scheduled to withdraw from the European Union in March 2019, which may introduce significant new uncertainties and instability in the financial markets across Europe.
Certain Funds invest a significant portion of their assets in securities backed by commercial or residential mortgage loans or in issuers that hold mortgage and other asset-backed securities. Investment percentages in these securities are presented in the Schedules of Investments. Changes in economic conditions, including delinquencies and/or defaults on assets underlying these securities, can affect the value, income and/or liquidity of such positions.
| 11. | CAPITAL SHARE TRANSACTIONS |
Transactions in capital shares were as follows:
| | | | | | | | | | | | | | | | |
| | | Year Ended
12/31/2018 | | | Year Ended
12/31/2017 | |
| | | Shares | | | Amount | | | Shares | | | Amount | |
Advantage Large Cap Core | | | | | | | | | | | | | | | | |
Shares sold | | | 99,043 | | | $ | 2,482,951 | | | | 67,459 | | | $ | 1,993,192 | |
Shares issued in reinvestment of distributions | | | 1,179,759 | | | | 23,736,716 | | | | 2,075,146 | | | | 51,414,199 | |
Shares redeemed | | | (825,637 | ) | | | (20,781,276 | ) | | | (615,362 | ) | | | (18,165,556 | ) |
| | | | | | | | | | | | | | | | |
Net increase | | | 453,165 | | | $ | 5,438,391 | | | | 1,527,243 | | | $ | 35,241,835 | |
| | | | | | | | | | | | | | | | |
| | | | |
Balanced Capital | | | | | | | | | | | | | | | | |
Shares sold | | | 334,548 | | | $ | 5,391,449 | | | | 127,486 | | | $ | 2,301,988 | |
Shares issued in reinvestment of distributions | | | 3,015,997 | | | | 42,865,047 | | | | 5,916,860 | | | | 94,650,453 | |
Shares redeemed | | | (3,241,325 | ) | | | (52,133,796 | ) | | | (2,783,339 | ) | | | (49,923,900 | ) |
| | | | | | | | | | | | | | | | |
Net increase (decrease) | | | 109,220 | | | $ | (3,877,300 | ) | | | 3,261,007 | | | $ | 47,028,541 | |
| | | | | | | | | | | | | | | | |
| | | | |
Capital Appreciation | | | | | | | | | | | | | | | | |
Shares sold | | | 146,630 | | | $ | 6,537,756 | | | | 73,811 | | | $ | 2,839,338 | |
Shares issued in reinvestment of distributions | | | 528,706 | | | | 19,636,188 | | | | 411,735 | | | | 16,717,731 | |
Shares redeemed | | | (440,896 | ) | | | (19,790,990 | ) | | | (410,434 | ) | | | (16,084,047 | ) |
| | | | | | | | | | | | | | | | |
Net increase | | | 234,440 | | | $ | 6,382,954 | | | | 75,112 | | | $ | 3,473,022 | |
| | | | | | | | | | | | | | | | |
| | | | |
Global Allocation | | | | | | | | | | | | | | | | |
Shares sold | | | 254,002 | | | $ | 4,146,671 | | | | 217,883 | | | $ | 3,442,483 | |
Shares issued in reinvestment of distributions | | | 839,563 | | | | 12,321,000 | | | | 182,085 | | | | 2,964,477 | |
Shares redeemed | | | (1,729,560 | ) | | | (27,841,331 | ) | | | (1,660,211 | ) | | | (26,105,207 | ) |
| | | | | | | | | | | | | | | | |
Net decrease | | | (635,995 | ) | | $ | (11,373,660 | ) | | | (1,260,243 | ) | | $ | (19,698,247 | ) |
| | | | | | | | | | | | | | | | |
| | | | |
Government Money Market | | | | | | | | | | | | | | | | |
Shares sold | | | 99,118,478 | | | $ | 99,118,478 | | | | 58,382,126 | | | $ | 58,382,126 | |
Shares issued in reinvestment of distributions | | | 1,777,250 | | | | 1,777,250 | | | | 500,974 | | | | 500,974 | |
Shares redeemed | | | (76,835,254 | ) | | | (76,835,254 | ) | | | (73,641,153 | ) | | | (73,641,153 | ) |
| | | | | | | | | | | | | | | | |
Net increase (decrease) | | | 24,060,474 | | | $ | 24,060,474 | | | | (14,758,053 | ) | | $ | (14,758,053 | ) |
| | | | | | | | | | | | | | | | |
| | |
| 146 | | 2018 BLACKROCK ANNUAL REPORTTO SHAREHOLDERS |
Notes to Financial Statements (continued)
| | | | | | | | | | | | | | | | |
| | | Year Ended
12/31/2018 | | | Year Ended
12/31/2017 | |
| | | Shares | | | Amount | | | Shares | | | Amount | |
High Yield | | | | | | | | | | | | | | | | |
Shares sold | | | 534,177 | | | $ | 2,855,921 | | | | 320,121 | | | $ | 1,725,112 | |
Shares issued in reinvestment of distributions | | | 322,100 | | | | 1,715,158 | | | | 352,197 | | | | 1,906,199 | |
Shares redeemed | | | (1,340,521 | ) | | | (7,115,994 | ) | | | (1,134,478 | ) | | | (6,123,134 | ) |
| | | | | | | | | | | | | | | | |
Net decrease | | | (484,244 | ) | | $ | (2,544,915 | ) | | | (462,160 | ) | | $ | (2,491,823 | ) |
| | | | | | | | | | | | | | | | |
| | | | |
U.S. Government Bond | | | | | | | | | | | | | | | | |
Shares sold | | | 764,341 | | | $ | 8,076,002 | | | | 150,584 | | | $ | 1,637,179 | |
Shares issued in reinvestment of distributions | | | 145,821 | | | | 1,539,514 | | | | 121,674 | | | | 1,323,617 | |
Shares redeemed | | | (866,836 | ) | | | (9,143,433 | ) | | | (792,757 | ) | | | (8,624,728 | ) |
| | | | | | | | | | | | | | | | |
Net increase (decrease) | | | 43,326 | | | $ | 472,083 | | | | (520,499 | ) | | $ | (5,663,932 | ) |
| | | | | | | | | | | | | | | | |
| 12. | REGULATIONS-X AMENDMENTS |
On August 17, 2018, the SEC adopted amendments to certain disclosure requirements in Securities Act ReleaseNo. 33-10532, Disclosure Update and Simplification. The Funds have adopted the amendments pertinent to RegulationS-X in this shareholder report. The amendments impacted certain disclosure presentation on the Statements of Assets and Liabilities, Statements of Changes in Net Assets and Notes to the Financial Statements.
Prior year distribution information and undistributed (distributions in excess of) net investment income in the Statements of Changes in Net Assets has been modified to conform to the current year presentation in accordance with the RegulationS-X changes.
Distributions for the year ended December 31, 2017 were classified as follows:
| | | | | | | | | | | | |
| Fund Name | | Class | | | Net Investment Income | | | Net Realized Gain | |
Advantage Large Cap Core | | | I | | | $ | (2,382,955 | ) | | $ | (49,031,244 | ) |
Balanced Capital | | | I | | | | (9,065,930 | ) | | | (85,584,523 | ) |
Capital Appreciation | | | I | | | | (450,001 | ) | | | (16,267,730 | ) |
Global Allocation | | | I | | | | (2,964,477 | ) | | | — | |
Government Money Market | | | I | | | | (498,444 | ) | | | (366 | ) |
High Yield | | | I | | | | (1,883,102 | ) | | | — | |
U.S. Government Bond | | | I | | | | (1,311,639 | ) | | | — | |
Undistributed (distributions in excess of) net investment income as of December 31, 2017 is as follows:
| | | | |
| Fund Name | | Undistributed
(Distributions in
Excess of) Net
Investment Income | |
Advantage Large Cap Core | | $ | 32,209 | |
Balanced Capital | | | 305,034 | |
Capital Appreciation | | | 32,372 | |
Global Allocation | | | (556,143 | ) |
Government Money Market | | | — | |
High Yield | | | (126,702 | ) |
U.S. Government Bond | | | 126,329 | |
Management has evaluated the impact of all subsequent events on the Funds through the date the financial statements were issued and has determined that there were no subsequent events requiring adjustment or additional disclosure in the financial statements.
| | | | |
| NOTESTO FINANCIAL STATEMENTS | | | 147 | |
| | |
| Report of Independent Registered Public Accounting Firm | | |
To the Shareholders of the BlackRock Advantage Large Cap Core Portfolio, BlackRock Balanced Capital Portfolio, BlackRock Capital Appreciation Portfolio, BlackRock Global Allocation Portfolio, BlackRock Government Money Market Portfolio, BlackRock High Yield Portfolio, and BlackRock U.S. Government Bond Portfolio, and the Board of Directors of BlackRock Series Fund, Inc. and BlackRock Series Fund II, Inc.
Opinion on the Financial Statements and Financial Highlights
We have audited the accompanying consolidated statement of assets and liabilities of BlackRock Global Allocation Portfolio of BlackRock Series Fund, Inc. and subsidiary, including the consolidated schedule of investments, as of December 31, 2018, the related consolidated statement of operations for the year then ended, the consolidated statements of changes in net assets for each of the two years in the period then ended, the consolidated financial highlights for each of the five years in the period then ended, and the related notes. We have also audited the accompanying statements of assets and liabilities of BlackRock Advantage Large Cap Core Portfolio, BlackRock Balanced Capital Portfolio, BlackRock Capital Appreciation Portfolio, and BlackRock Government Money Market Portfolio of BlackRock Series Fund, Inc., and of BlackRock High Yield Portfolio and BlackRock U.S. Government Bond Portfolio of BlackRock Series Fund II, Inc., (collectively with BlackRock Global Allocation Portfolio, the “Funds”), including the schedules of investments, as of December 31, 2018, the related statements of operations (and the statement of cash flows for the Blackrock U.S. Government Bond Portfolio) for the year then ended, the statements of changes in net assets for each of the two years in the period then ended, the financial highlights for each of the five years in the period then ended, and the related notes. In our opinion, the financial statements and financial highlights present fairly, in all material respects, the financial position of the Funds as of December 31, 2018, and the results of their operations (and BlackRock U.S. Government Bond Portfolio’s cash flows) for the year then ended, the changes in their net assets for each of the two years in the period then ended, and the financial highlights for each of the five years in the period then ended, in conformity with accounting principles generally accepted in the United States of America.
Basis for Opinion
These financial statements and financial highlights are the responsibility of the Funds’ management. Our responsibility is to express an opinion on the Funds’ financial statements and financial highlights based on our audits. We are a public accounting firm registered with the Public Company Accounting Oversight Board (United States) (PCAOB) and are required to be independent with respect to the Funds in accordance with the U.S. federal securities laws and the applicable rules and regulations of the Securities and Exchange Commission and the PCAOB.
We conducted our audits in accordance with the standards of the PCAOB. Those standards require that we plan and perform the audits to obtain reasonable assurance about whether the financial statements and financial highlights are free of material misstatement, whether due to error or fraud. The Funds are not required to have, nor were we engaged to perform, an audit of their internal control over financial reporting. As part of our audits we are required to obtain an understanding of internal control over financial reporting but not for the purpose of expressing an opinion on the effectiveness of the Funds’ internal control over financial reporting. Accordingly, we express no such opinion.
Our audits included performing procedures to assess the risks of material misstatement of the financial statements and financial highlights, whether due to error or fraud, and performing procedures that respond to those risks. Such procedures included examining, on a test basis, evidence regarding the amounts and disclosures in the financial statements and financial highlights. Our audits also included evaluating the accounting principles used and significant estimates made by management, as well as evaluating the overall presentation of the financial statements and financial highlights. Our procedures included confirmation of securities owned as of December 31, 2018, by correspondence with the custodian, agent banks, and brokers; when replies were not received from agent banks and brokers, we performed other auditing procedures. We believe that our audits provide a reasonable basis for our opinion.
Deloitte & Touche LLP
Boston, Massachusetts
February 15, 2019
We have served as the auditor of one or more BlackRock investment companies since 1992.
| | |
| 148 | | 2018 BLACKROCK ANNUAL REPORTTO SHAREHOLDERS |
Disclosure of Investment Advisory Agreement
The Board of Directors (the “Board,” the members of which are referred to as “Board Members”) of BlackRock Series Fund II, Inc. (the “Corporation”) met in person on May 8, 2018 (the “Organizational Meeting”) to consider the initial approval of the investment advisory agreement (the “Advisory Agreement” or the “Agreement”) between the Corporation, on behalf of BlackRock High Yield Portfolio (the “High Yield Portfolio”) and BlackRock U.S. Government Bond Portfolio (the “U.S. Government Bond Portfolio”) (each, a “Fund,” and collectively, the “Funds”), each a series of the Corporation, and BlackRock Advisors, LLC (the “Manager” or “BlackRock”), each Fund’s investment advisor.
On September 17, 2018, each Fund acquired the assets, subject to the liabilities of the BlackRock High Yield Portfolio (the “Predecessor High Yield Portfolio”) and BlackRock U.S. Government Bond Portfolio (the “Predecessor U.S. Government Bond Portfolio”) (each, a “Predecessor Fund,” and collectively, the “Predecessor Funds”), each a series of BlackRock Series Fund, Inc. (the “Predecessor Corporation”), through a reorganization (the “Reorganization”). Each Fund has the same investment objectives, strategies and policies, portfolio management team and contractual arrangements, including the same contractual fees and expenses, as its respective Predecessor Fund. As a result of the Reorganization, each Fund adopted the performance and financial history of its respective Predecessor Fund. The Agreement is substantially similar to the advisory agreement (the “Predecessor Advisory Agreement” or the “Predecessor Agreement”) between the Predecessor Corporation, on behalf of each Predecessor Fund, and the Manager.
Activities and Composition of the Board
On the date of the Organizational Meeting, the Board consisted of eleven individuals, nine of whom were not “interested persons” of the Corporation as defined in the Investment Company Act of 1940, as amended (the “1940 Act”) (the “Independent Board Members”). The Board Members are responsible for the oversight of the operations of each Fund and perform the various duties imposed on the directors of investment companies by the 1940 Act. The Independent Board Members have retained independent legal counsel to assist them in connection with their duties. The Chair of the Board is an Independent Board Member. The Board has established five standing committees: an Audit Committee, a Governance and Nominating Committee, a Compliance Committee, a Performance Oversight Committee and an Executive Committee, each of which is chaired by an Independent Board Member and composed of Independent Board Members (except for the Performance Oversight Committee and the Executive Committee, each of which also has one interested Board Member).
The Agreement
Pursuant to the 1940 Act, the Board is required to consider the initial approval of the Agreement. In connection with this deliberative process, the Board assessed, among other things, the nature, extent and quality of the services to be provided to each Fund (and those provided to each Predecessor Fund) by BlackRock, BlackRock’s personnel and affiliates, including (as applicable): investment management; accounting, administrative and shareholder services; oversight of each Fund’s (and each Predecessor Fund’s) service providers; marketing and promotional services; risk management and oversight; legal and compliance services; and ability to meet applicable legal and regulatory requirements.
Board Considerations in Approving the Agreement
The Approval Process: At the Organizational Meeting, the Board reviewed materials relating to its consideration of the proposed Agreement. The Predecessor Agreement was most recently considered and approved by the board of directors of the Predecessor Corporation (the “Predecessor Board”) at in person meetings held on April 10, 2018 (the “April Meeting”) and May 8, 2018 (the “May Meeting”). The factors considered by the Board Members at the Organizational Meeting in connection with approval of the proposed Agreement were identical to the factors considered by them as members of the Predecessor Board at the April and May Meetings for the Predecessor Agreement. (Accordingly, references below to the “Board” mean both the Board and the Predecessor Board, and references below to the Board Members mean the members of both the Board and the Predecessor Board, unless the context requires otherwise.) These factors included, among other things: (a) the nature, extent and quality of the services to be provided by BlackRock (and those provided by BlackRock to each Predecessor Fund); (b) the investment performance of each Predecessor Fund as compared with a peer group of funds (“Performance Peers”) and other metrics, as applicable; (c) the advisory fee and the estimated cost of the services and estimated profits realized by BlackRock and its affiliates from their relationship with each Fund and each Predecessor Fund; (d) the sharing of potential economies of scale;(e) fall-out benefits to BlackRock and its affiliates as a result of BlackRock’s relationship with each Fund and each Predecessor Fund; and (f) other factors deemed relevant by the Board Members.
In determining whether to approve the Predecessor Agreement, the Board met with the relevant investment advisory personnel from BlackRock and considered all information it deemed reasonably necessary to evaluate the terms of the Predecessor Agreement. These meetings were considered by the Board in evaluating approval of the Agreement. The Board received materials in advance of the Organizational Meeting relating to its consideration of the Agreement, including, among other things, (a) fees and estimated expense ratios of each Fund and the fees and expense ratios of each Predecessor Fund in comparison to the fees and expense ratios of a peer group of funds as determined by Broadridge Financial Solutions, Inc. (“Broadridge”) (“Expense Peers”); (b) information regarding BlackRock’s economic outlook for each Predecessor Fund and its general investment outlook for the markets; (c) information regarding fees paid to service providers that are affiliates of BlackRock; and (d) information outlining the legal duties of the Board under the 1940 Act with respect to the consideration and approval of the Agreement. The Board also received information at prior Board meetings concerning compliance records and regulatory matters relating to BlackRock.
The Board also considered other matters it deemed important to the approval process, such as other payments to be made to BlackRock or its affiliates, securities lending and cash management, services related to the valuation and pricing of Fund portfolio holdings, and advice from independent legal counsel with respect to the review process and materials submitted for the Board’s review. The Board noted the willingness of BlackRock personnel to engage in open, candid discussions with the Board. The Board did not identify any particular information as determinative, and each Board Member may have attributed different weights to the various items considered.
A. Nature, Extent and Quality of the Services to be Provided by BlackRock: The Board, including the Independent Board Members, considered the nature, extent and quality of services to be provided by BlackRock, including the investment advisory services to be provided to each Fund and those provided to each Predecessor Fund and the resulting performance of each Predecessor Fund. Throughout the year, the Board Members compared Predecessor Fund performance to the performance of a
| | | | |
| DISCLOSURE OF INVESTMENT ADVISORY AGREEMENT | | | 149 | |
Disclosure of Investment Advisory Agreement (continued)
comparable group of mutual funds, a relevant benchmark, and performance metrics, as applicable. The Board met with
BlackRock’s senior management personnel responsible for investment activities, including the senior investment officers, in connection with its evaluation of each Predecessor Fund. The Board also reviewed the materials provided by each Fund’s portfolio management team discussing each Predecessor Fund’s performance and each Fund’s investment objective(s), strategies and outlook.
The Board considered, among other factors, with respect to BlackRock: the number, education and experience of investment personnel generally and each Fund’s portfolio management team; BlackRock’s research capabilities; investments by portfolio managers in the funds they manage; portfolio trading capabilities; use of technology; commitment to compliance; credit analysis capabilities; risk analysis and oversight capabilities; and the approach to training and retaining portfolio managers and other research, advisory and management personnel. The Board also considered BlackRock’s overall risk management program, including the continued efforts of BlackRock and its affiliates to address cybersecurity risks and the role of BlackRock’s Risk & Quantitative Analysis Group. The Board considered BlackRock’s compensation structure with respect to each Fund’s portfolio management team and BlackRock’s ability to attract and retain high-quality talent and create performance incentives that had been presented in connection with the Board’s evaluation of the Predecessor Agreement.
In addition to investment advisory services, the Board considered the quality of the administrative and othernon-investment advisory services to be provided to each Fund (and those provided to each Predecessor Fund). The Board considered that BlackRock and its affiliates will provide each Fund (and provided each Predecessor Fund) with certain administrative, shareholder and other services (in addition to any such services provided to each Fund by third parties) and officers and other personnel as are necessary for the operations of each Fund. In particular, the Board noted that BlackRock and its affiliates will provide each Fund (and provided each Predecessor Fund) with administrative services including, among others: (i) responsibility for disclosure documents, such as the prospectus, the summary prospectus (as applicable), the statement of additional information and periodic shareholder reports; (ii) oversight of daily accounting and pricing; (iii) responsibility for periodic filings with regulators; (iv) overseeing and coordinating the activities of other service providers including, among others, each Fund’s custodian, fund accountant, transfer agent, and auditor; (v) organizing Board meetings and preparing the materials for such Board meetings; (vi) providing legal and compliance support; (vii) furnishing analytical and other support to assist the Board in its consideration of strategic issues such as the merger, consolidation or repurposing of certainopen-end funds; and (viii) performing administrative functions necessary for the operation of each Fund, such as tax reporting, expense management, fulfilling regulatory filing requirements, overseeing each Fund’s distribution partners, and shareholder call center and other services. The Board considered the structure and duties of BlackRock’s fund administration, shareholder services, and legal & compliance departments and considered BlackRock’s policies and procedures for assuring compliance with applicable laws and regulations.
B. The Investment Performance of each Predecessor Fund and BlackRock: The Board, including the Independent Board Members, also reviewed and considered the performance history of each Predecessor Fund. In connection with its review of each Predecessor Fund’s performance history, the Board had been provided with reports independently prepared by Broadridge, which included a comprehensive analysis of each Predecessor Fund’s performance as of December 31, 2017. Broadridge ranks funds in quartiles, ranging from first to fourth, where first is the most desirable quartile position and fourth is the least desirable. In connection with this review, the Board had received and reviewed information regarding the investment performance of each Predecessor Fund as compared to its Performance Peers.
In evaluating performance, the Board recognized that the performance data reflects a snapshot of a period as of a particular date and that selecting a different performance period could produce significantly different results. Further, the Board recognized that it is possible that long-term performance can be impacted by even one period of significant outperformance or underperformance, so that a single investment theme has the ability to affect long-term performance disproportionately.
The Board noted that for theone-, three- and five-year periods reported, the Predecessor High Yield Portfolio ranked in the first, second, and first quartiles, respectively, against its Performance Peers.
The Board noted that for theone-, three- and five-year periods reported, the Predecessor U.S. Government Bond Portfolio ranked in the third, second and second quartiles, respectively, against its Performance Peers. The Board and BlackRock reviewed the Predecessor U.S. Government Bond Portfolio’s underperformance during the applicable period.
C. Consideration of the Advisory/Management Fees and the Estimated Cost of the Services to be Provided and Estimated Profits Realized by BlackRock and its Affiliates from their Relationship with each Fund and each Predecessor Fund: In connection with the initial approval of the Agreement, the Board, including the Independent Board Members, considered that each Fund’s proposed contractual management fee rate was identical to each Predecessor Fund’s contractual management fee rate. The contractual management fee rate represents a combination of the advisory fee and any administrative fees, before taking into account any reimbursements or fee waivers. The Board also considered that each Fund’s estimated total net expense ratio was identical to each Predecessor Fund’s total expense ratio. The Board also considered the comparison of each Predecessor Fund’s actual and contractual management fee rate to those of its Expense Peers. The total expense ratio represents a fund’s total net operating expenses, including any12b-1 or non12b-1 service fees. The total expense ratio gives effect to any expense reimbursements or fee waivers that benefit a fund, and the actual management fee rate gives effect to any management fee reimbursements or waivers that benefit a fund. The Board considered the services provided and the fees charged by BlackRock and its affiliates to other types of clients with similar investment mandates, as applicable, including institutional accounts andsub-advised mutual funds (including mutual funds sponsored by third parties) that had been presented in connection with its evaluation of the Predecessor Agreement.
The Board considered BlackRock’s profitability methodology, including an estimated profitability analysis that detailed the revenues earned and the expenses incurred by BlackRock for services provided to each Predecessor Fund, which would be the same services to be provided to each Fund. The Board reviewed BlackRock’s estimated profitability with respect to each Predecessor Fund and other funds the Board currently oversees for the year ended December 31, 2017 compared to available aggregate estimated profitability data provided for the prior two years. The Board considered its review of, in connection with its review of the Predecessor Agreement, BlackRock’s estimated profitability with respect to certain other U.S. fund complexes managed by the Manager and/or its affiliates, including BlackRock’s assumptions and methodology of allocating expenses in the estimated profitability analysis and the inherent limitations in allocating costs among various advisory products. The Board recognized that profitability may be affected by numerous factors including, among other things, fee waivers and expense reimbursements by the Manager, the types of funds managed, precision of expense allocations and business mix. As a result, calculating and comparing profitability at individual fund levels is difficult.
| | |
| 150 | | 2018 BLACKROCK ANNUAL REPORTTO SHAREHOLDERS |
Disclosure of Investment Advisory Agreement (continued)
The Board noted that, in general, individual fund or product line profitability of other advisors is not publicly available. In connection with its review of the Predecessor Agreement, the Board reviewed BlackRock’s operating margin, in general, compared to that of certain other publicly-traded asset management firms and considered the differences between BlackRock and these other firms, including the contribution of technology at BlackRock, BlackRock’s expense management, and the relative product mix.
In addition, the Board considered the estimated cost of the services to be provided to each Fund based on its review of the estimated cost of the services provided to each Predecessor Fund by BlackRock, and BlackRock’s and its affiliates’ estimated profits relating to the management and distribution of each Predecessor Fund and the other funds advised by BlackRock and its affiliates. As part of this analysis, the Board had reviewed BlackRock’s methodology in allocating its costs of managing the Predecessor Funds to each Predecessor Fund. The Board considered whether BlackRock has the financial resources necessary to attract and retain high quality investment management personnel to perform its obligations under the Agreement and to continue to provide the high quality of services that is expected by the Board Members. The Board further considered factors including but not limited to BlackRock’s commitment of time, assumption of risk, and liability profile in servicing each Fund and each Predecessor Fund in contrast to what is required of BlackRock with respect to other products with similar investment mandates across theopen-end fund, exchange-traded fund,closed-end fund,sub-advised mutual fund, separately managed account, collective investment trust, and institutional separate account product channels, as applicable.
The Board noted that the Predecessor High Yield Portfolio’s contractual management fee rate ranked in the first quartile, and that the actual management fee rate and total expense ratio each ranked in the first quartile, relative to the Predecessor High Yield Portfolio’s Expense Peers. The Board also noted that the High Yield Portfolio has an advisory fee arrangement that includes breakpoints that adjust the fee rate downward as the aggregate assets of the High Yield Portfolio, combined with the assets of the U.S. Government Bond Portfolio and the series of the Predecessor Corporation, increase above certain contractually specified levels. The Board further noted that BlackRock and the Board have contractually agreed to a cap on the High Yield Portfolio’s total expenses as a percentage of the High Yield Portfolio’s average daily net assets. Additionally, the Board noted that BlackRock and the Board have contractually agreed to a cap on certain operational and recordkeeping fees for the High Yield Portfolio.
The Board noted that the Predecessor U.S. Government Bond Portfolio’s contractual management fee rate ranked in the first quartile, and that the actual management fee rate and total expense ratio each ranked in the first quartile, relative to the Predecessor U.S. Government Bond Portfolio’s Expense Peers. The Board also noted that the U.S. Government Bond Portfolio has an advisory fee arrangement that includes breakpoints that adjust the fee rate downward as the aggregate assets of the U.S. Government Bond Portfolio, combined with the assets of the High Yield Portfolio and the series of the Predecessor Corporation, increase above certain contractually specified levels. The Board further noted that BlackRock and the Board have contractually agreed to a cap on the U.S. Government Bond Portfolio’s total expenses as a percentage of the U.S. Government Bond Portfolio’s average daily net assets. Additionally, the Board noted that BlackRock and the Board have contractually agreed to a cap on certain operational and recordkeeping fees for the U.S. Government Bond Portfolio.
D. Economies of Scale: The Board, including the Independent Board Members, considered the extent to which economies of scale might be realized as the assets of each Fund increase, including the existence of fee waivers and/or expense caps, as applicable, noting that any contractual fee waivers and expense caps had been approved by the Board. The Board also considered the extent to which each Predecessor Fund benefited from such economies in a variety of ways, and whether there should be changes in the advisory fee rate or breakpoint structure in order to enable each Fund to more fully participate in these economies of scale. The Board considered each Predecessor Fund’s asset levels and, in light of those asset levels, whether the current fee schedule was appropriate for each Fund. In its consideration, the Board Members took into account the existence of any expense caps and further considered the continuation and/or implementation, as applicable, of such caps.
E. Other Factors Deemed Relevant by the Board Members: The Board, including the Independent Board Members, also took into account other potential ancillary or“fall-out” benefits that BlackRock or its affiliates may derive from BlackRock’s respective relationships with each Fund based on its review of the Predecessor Agreement, including both tangible and intangible benefits, such as BlackRock’s ability to leverage its investment professionals who manage other portfolios and risk management personnel, an increase in BlackRock’s profile in the investment advisory community, and the engagement of BlackRock’s affiliates as service providers to each Fund (and each Predecessor Fund), including for administrative, distribution, securities lending and cash management services. The Board also considered BlackRock’s overall operations and its efforts to expand the scale of, and improve the quality of, its operations. The Board also considered that, subject to applicable law, BlackRock may use and benefit from third party research obtained by soft dollars generated by certain registered fund transactions to assist in managing all or a number of its other client accounts.
In connection with its consideration of the Agreement, the Board also considered information regarding BlackRock’s brokerage and soft dollar practices and reports from BlackRock which included information on brokerage commissions and trade execution practices that it had received in consideration of the Predecessor Agreement.
The Board considered the competitive nature of theopen-end fund marketplace, and that shareholders are able to redeem their Fund shares if they believe that each Fund’s fees and expenses are too high or if they are dissatisfied with the performance of each Fund.
Conclusion
Following discussion, the Board, including the Independent Board Members, approved the Advisory Agreement between the Manager and the Corporation, on behalf of each Fund, for atwo-year term beginning on the effective date of the Advisory Agreement. Based upon its evaluation of all of the aforementioned factors in their totality, as well as other information, the Board, including the Independent Board Members, was satisfied that the terms of the Agreement were fair and reasonable and in the best interest of each Fund and its shareholders. In arriving at its decision to approve the Agreement, the Board did not identify any single factor or group of factors asall-important or controlling, but considered all factors together, and different Board Members may have attributed different weights to the various factors considered. The Independent Board Members were also assisted by the advice of independent legal counsel in making this determination.
| | | | |
| DISCLOSURE OF INVESTMENT ADVISORY AGREEMENT | | | 151 | |
Director and Officer Information
| | | | | | | | |
| Independent Directors (a) |
| | | | | |
Name Year of Birth (b) | | Position(s) Held
(Length of Service) (c) | | Principal Occupation(s) During Past Five Years | | Number of BlackRock-Advised
Registered Investment Companies
(“RICs”) Consisting of
Investment Portfolios
(“Portfolios”) Overseen | | Public Company and Other
Investment Company
Directorships Held During
Past Five Years |
Robert M. Hernandez 1944 | | Chair of the Board and Director (Since 2007) | | Director, Vice Chairman and Chief Financial Officer of USX Corporation (energy and steel business) from 1991 to 2001; Director andnon-executive Chairman, RTI International Metals, Inc. from 1990 to 2015; Director, TE Connectivity (electronics) from 2006 to 2012. | | 32 RICs consisting of 95 Portfolios | | Chubb Limited (insurance company); Eastman Chemical Company |
James H. Bodurtha 1944 | | Director (Since 2007) | | Director, The China Business Group, Inc. (consulting and investing firm) from 1996 to 2013 and Executive Vice President thereof from 1996 to 2003; Chairman of the Board, Berkshire Holding Corporation since 1980; Director, ICI Mutual since 2010. | | 32 RICs consisting of 95 Portfolios | | None |
Bruce R. Bond 1946 | | Director (Since 2007) | | Board Member, Amsphere Limited (software) since 2018; Trustee and Member of the Governance Committee, State Street Research Mutual Funds from 1997 to 2005; Board Member of Governance, Audit and Finance Committee, Avaya Inc. (computer equipment) from 2003 to 2007. | | 32 RICs consisting of 95 Portfolios | | None |
Honorable Stuart E. Eizenstat 1943 | | Director (Since 2007) | | Senior Counsel of Covington and Burling LLP (law firm) since 2016; Head of International Practice thereof since 2001, and Partner thereof from 2001 to 2016; Advisory Board Member, OCP S.A. (phosphates) since 2010; International Advisory Board Member, The Coca-Cola Company from 2002 to 2011; Advisory Board Member, Veracity Worldwide, LLC (risk management) from 2007 to 2012; Member of the International Advisory Board, GML Ltd. (energy) since 2003; Board of Directors, Ferroglobe (silicon metals) since 2016. | | 32 RICs consisting of 95 Portfolios | | Alcatel-Lucent (telecommunications); Global Specialty Metallurgical; UPS Corporation (delivery service) |
Henry Gabbay 1947 | | Director (Since 2007) | | Board Member, Equity-Liquidity andClosed-End Fund Boards from 2007 through 2014; Consultant, BlackRock, Inc. from 2007 to 2008; Managing Director, BlackRock, Inc. from 1989 to 2007; Chief Administrative Officer, BlackRock Advisors, LLC from 1998 to 2007; President of BlackRock Funds and BlackRock Allocation Target Shares (formerly, BlackRock Bond Allocation Target Shares) from 2005 to 2007 and Treasurer of certainclosed-end funds in the BlackRock fund complex from 1989 to 2006. | | 32 RICs consisting of 95 Portfolios | | None |
Lena G. Goldberg 1949 | | Director (Since 2016) | | Senior Lecturer, Harvard Business School since 2008; Director, Charles Stark Draper Laboratory, Inc. since 2013; FMR LLC/Fidelity Investments (financial services) from 1996 to 2008, serving in various senior roles including Executive Vice President — Strategic Corporate Initiatives and Executive Vice President and General Counsel; Partner, Sullivan & Worcester LLP from 1985 to 1996 and Associate thereof from 1979 to 1985. | | 32 RICs consisting of 95 Portfolios | | None |
Henry R. Keizer 1956 | | Director (Since 2016) | | Director, Park Indemnity Ltd. (captive insurer) since 2010; Director, MUFG Americas Holdings Corporation and MUFG Union Bank, N.A. (financial and bank holding company) from 2014 to 2016; Director, American Institute of Certified Public Accountants from 2009 to 2011; Director, KPMG LLP (audit, tax and advisory services) from 2004 to 2005 and 2010 to 2012; Director, KPMG International in 2012, Deputy Chairman and Chief Operating Officer thereof from 2010 to 2012 and U.S. Vice Chairman of Audit thereof from 2005 to 2010; Global Head of Audit, KPMGI (consortium of KPMG firms) from 2006 to 2010; Director, YMCA of Greater New York from 2006 to 2010. | | 32 RICs consisting of 95 Portfolios | | Hertz Global Holdings (car rental); Montpelier Re Holdings, Ltd. (publicly held property and casual reinsurance) from 2013 until 2015; Sealed Air Corp. (packaging); WABCO (commercial vehicle safety systems) |
| | |
| 152 | | 2018 BLACKROCK ANNUAL REPORTTO SHAREHOLDERS |
Director and Officer Information (continued)
| | | | | | | | |
| Independent Directors (a) |
| | | | | |
Name Year of Birth (b) | | Position(s) Held
(Length of Service) (c) | | Principal Occupation(s) During Past Five Years | | Number of BlackRock-Advised
Registered Investment Companies
(“RICs”) Consisting of
Investment Portfolios
(“Portfolios”) Overseen | | Public Company and Other
Investment Company
Directorships Held During
Past Five Years |
John F O’Brien 1943 | | Director (Since 2007) | | Trustee, Woods Hole Oceanographic Institute since 2003 and Chairman thereof from 2009 to 2015;Co-Founder and Managing Director, Board Leaders LLC (director education) since 2005. | | 32 RICs consisting of 95 Portfolios | | Cabot Corporation (chemicals); LKQ Corporation (auto parts manufacturing); TJX Companies, Inc. (retailer) |
Donald C. Opatrny 1952 | | Director (Since 2015) | | Trustee, Vice Chair, Member of the Executive Committee and Chair of the Investment Committee, Cornell University since 2004; President, Trustee and Member of the Investment Committee, The Aldrich Contemporary Art Museum from 2007 to 2014; Member of the Board and Investment Committee, University School from 2007 to 2018; Member of the Investment Committee, Mellon Foundation from 2009 to 2015; Trustee, Artstor (a Mellon Foundation affiliate) from 2010 to 2015; President and Trustee, the Center for the Arts, Jackson Hole from 2011 to 2018; Director, Athena Capital Advisors LLC (investment management firm) since 2013; Trustee and Chair of the Investment Committee, Community Foundation of Jackson Hole since 2014; Member of Affordable Housing Supply Board of Jackson, Wyoming since 2017; Member, Investment Funds Committee, State of Wyoming since 2017; Trustee, Phoenix Art Museum since 2018. | | 32 RICs consisting of 95 Portfolios | | None |
| | | | | | | | |
| Interested Directors (a)(d) |
| | | | | |
Name
Year of Birth (b) | | Position(s) Held
(Length of Service) (c) | | Principal Occupation(s) During Past Five Years | | Number of BlackRock-Advised
Registered Investment Companies
(“RICs”) Consisting of
Investment Portfolios
(“Portfolios”) Overseen | | Public Company and Other
Investment Company
Directorships Held During
Past Five Years |
Robert Fairbairn 1965 | | Director (Since 2015) | | Senior Managing Director of BlackRock, Inc. since 2010; oversees BlackRock’s Strategic Partner Program and Strategic Product Management Group; Member of BlackRock’s Global Executive and Global Operating Committees;Co-Chair of BlackRock’s Human Capital Committee; Member of the Board of Managers of BlackRock Investments, LLC since 2011; Global Head of BlackRock’s Retail and iShares® businesses from 2012 to 2016. | | 127 RICs consisting of 304 Portfolios | | None |
John M. Perlowski 1964 | | Director
(Since 2015) and President and Chief Executive Officer (Since 2010) | | Managing Director of BlackRock, Inc. since 2009; Head of BlackRock Global Accounting and Product Services since 2009; Advisory Director of Family Resource Network (charitable foundation) since 2009. | | 127 RICs consisting of 304 Portfolios | | None |
| (a) | The address of each Director is c/o BlackRock, Inc., 55 East 52nd Street, New York, NY 10055. |
| (b) | Each Independent Director holds office until his or her successor is duly elected and qualifies or until his or her earlier death, resignation, retirement or removal as provided by the Fund’sby-laws or charter or statute, or until December 31 of the year in which he or she turns 75. The Board may determine to extend the terms of Independent Directors on acase-by-case basis, as appropriate. Interested Directors serve until their successor is duly elected and qualifies or until their earlier death, resignation, retirement or removal as provided by the Fund’sby-laws or statute, or until December 31 of the year in which they turn 72. |
| (c) | Following the combination of Merrill Lynch Investment Managers, L.P. (“MLIM”) and BlackRock, Inc. in September 2006, the various legacy MLIM and legacy BlackRock fund boards were realigned and consolidated into three new fund boards in 2007. As a result, although the chart shows certain Independent Directors as joining the Fund’s board in 2007, those Directors first became members of the boards of other legacy MLIM or legacy BlackRock funds as follows: James H. Bodurtha, 1995; Bruce R. Bond, 2005; Honorable Stuart E. Eizenstat, 2001; Robert M. Hernandez, 1996; and John F. O’Brien, 2005. For High Yield and U.S. Government Bond, Length of Service includes service as director of the Target Funds. |
| (d) | Mr. Fairbairn and Mr. Perlowski are both “interested persons,” as defined in the 1940 Act, of the Fund based on their positions with BlackRock, Inc. and its affiliates. Mr. Fairbairn and Mr. Perlowski are also board members of the BlackRockClosed-End Complex and the BlackRock Equity-Liquidity Complex. |
| | | | |
| DIRECTORAND OFFICER INFORMATION | | | 153 | |
Director and Officer Information (continued)
| | | | |
| Officers Who Are Not Directors (a) |
| | | |
Name
Year of Birth (b) | | Position(s) Held (Length of Service) | | Principal Occupation(s) During Past Five Years |
Jennifer McGovern 1977 | | Vice President (Since 2014) | | Managing Director of BlackRock, Inc. since 2016; Director of BlackRock, Inc. from 2011 to 2015; Head of Product Structure and Oversight for BlackRock’s U.S. Wealth Advisory Group since 2013. |
Neal J. Andrews 1966 | | Chief Financial Officer (Since 2007) | | Managing Director of BlackRock, Inc. since 2006. |
Jay M. Fife 1970 | | Treasurer (Since 2007) | | Managing Director of BlackRock, Inc. since 2007. |
Charles Park 1967 | | Chief Compliance Officer (Since 2014) | | Anti-Money Laundering Compliance Officer for the BlackRock-advised Funds in the Equity-Bond Complex, the Equity-Liquidity Complex and theClosed-End Complex from 2014 to 2015; Chief Compliance Officer of BlackRock Advisors, LLC and the BlackRock-advised Funds in the Equity-Bond Complex, the Equity-Liquidity Complex and theClosed-End Complex since 2014; Principal of and Chief Compliance Officer for iShares® Delaware Trust Sponsor LLC since 2012 and BlackRock Fund Advisors (“BFA”) since 2006; Chief Compliance Officer for theBFA-advised iShares® exchange traded funds since 2006; Chief Compliance Officer for BlackRock Asset Management International Inc. since 2012. |
John MacKessy 1972 | | Anti-Money Laundering Compliance Officer (Since 2018) | | Director of BlackRock, Inc. since 2017; Global Head of Anti-Money Laundering at BlackRock, Inc. since 2017; Director of AML Monitoring and Investigations Group of Citibank from 2015 to 2017; Global Anti-Money Laundering and Economic Sanctions Officer for MasterCard from 2011 to 2015. |
Benjamin Archibald 1975 | | Secretary (Since 2012) | | Managing Director of BlackRock, Inc. since 2014; Director of BlackRock, Inc. from 2010 to 2013; Secretary of the iShares® exchange traded funds since 2015; Secretary of the BlackRock-advised mutual funds since 2012. |
| (a) | The address of each Officer is c/o BlackRock, Inc., 55 East 52nd Street, New York, NY 10055. |
| (b) | Officers of the Funds serve at the pleasure of the Board. |
Further information about the Funds’ Directors and Officers is available in the Funds’ Statement of Additional Information, which can be obtained without charge by calling1-800-441-7762.
At a special meeting of shareholders held on November 21, 2018, each Fund’s shareholders elected Directors who took office on January 1, 2019. For BlackRock Series Fund, Inc., the newly elected Directors include seven former Directors and eight individuals who served as directors/trustees of the funds in the BlackRock Equity-Liquidity Complex. For BlackRock Series Fund II, Inc., the newly elected Directors include three former Directors and eight individuals who served as directors/trustees of the funds in the BlackRock Closed-End Complex. Information regarding the individuals who began serving as Directors effective January 1, 2019 can be found in the proxy statement for the special meeting of shareholders, which is available on the SEC’s EDGAR Database at http://www.sec.gov.
Investment Adviser and Administrator
BlackRock Advisors, LLC Wilmington, DE 19809
Accounting Agent
JPMorgan Chase Bank, N.A.
New York, NY 10179
Transfer Agent
BNY Mellon Investment Servicing (US) Inc.
Wilmington, DE 19809
Custodians
JPMorgan Chase Bank, N.A.(a)
New York, NY 10179
Brown Brothers Harriman & Co.(b)
40 Water Street
Boston, Massachusetts 02109
Independent Registered Public Accounting Firm
Deloitte & Touche LLP
Boston, MA 02116
Distributor
BlackRock Investments, LLC
New York, NY 10022
Legal Counsel
Willkie Farr & Gallagher LLP
New York, NY 10019
Address of the Trust
100 Bellevue Parkway
Wilmington, DE 19809
| (a) | For all Funds except BlackRock Global Allocation Portfolio. |
| (b) | For BlackRock Global Allocation Portfolio. |
| | |
| 154 | | 2018 BLACKROCK ANNUAL REPORTTO SHAREHOLDERS |
Additional Information
Proxy Results
BlackRock Series Fund, Inc.
A Special Meeting of Shareholders was held on November 21, 2018 for shareholders of record on September 24, 2018, to elect a Board of Directors of the Funds. The newly elected Directors took office effective January 1, 2019.
Shareholders approved the Directors* of BlackRock Series Fund, Inc. with voting results as follows:
| | | | | | | | | | | | |
| | | Votes For | | | Votes Against | | | Votes Abstained | |
Bruce R. Bond | | | 154,036,422 | | | | 4,356,173 | | | | 10,178,217 | |
Susan J. Carter | | | 154,890,683 | | | | 3,540,878 | | | | 10,139,252 | |
Collette Chilton | | | 154,768,085 | | | | 3,664,197 | | | | 10,138,532 | |
Neil A. Cotty | | | 154,597,173 | | | | 3,762,236 | | | | 10,211,404 | |
Robert Fairbairn | | | 154,581,970 | | | | 3,810,626 | | | | 10,178,217 | |
Lena G. Goldberg | | | 154,066,831 | | | | 4,321,401 | | | | 10,182,581 | |
Robert M. Hernandez | | | 153,482,177 | | | | 4,839,268 | | | | 10,249,368 | |
Henry R. Keizer | | | 154,488,013 | | | | 3,893,720 | | | | 10,189,080 | |
Cynthia A. Montgomery | | | 154,504,449 | | | | 3,927,112 | | | | 10,139,252 | |
Donald C. Opatrny | | | 154,259,291 | | | | 4,130,255 | | | | 10,181,267 | |
John M. Perlowski | | | 154,585,558 | | | | 3,774,571 | | | | 10,210,684 | |
Joseph P. Platt | | | 154,111,387 | | | | 4,237,880 | | | | 10,221,546 | |
Mark Stalnecker | | | 154,342,201 | | | | 4,058,927 | | | | 10,169,684 | |
Kenneth L. Urish | | | 154,448,446 | | | | 3,978,678 | | | | 10,143,689 | |
Claire A. Walton | | | 154,839,562 | | | | 3,595,164 | | | | 10,136,087 | |
| | * | Denotes Company-wide proposal and voting results. | |
The above Directors, referred to as the BlackRock Multi-Asset Board, have also been elected to serve as directors for other BlackRock-advised equity, multi-asset, index and money market funds.
BlackRock Series Fund II, Inc.
A Special Meeting of Shareholders was held on November 21, 2018 for shareholders of record on September 24, 2018, to elect a Board of Directors of the Funds. The newly elected Directors took office effective January 1, 2019.
Shareholders approved the Directors* of BlackRock Series Fund II, Inc. with voting results as follows:
| | | | | | | | | | | | |
| | | Votes For | | | Votes Against | | | Votes Abstained | |
Michael J. Castellano | | | 9,453,671 | | | | 275,283 | | | | 491,101 | |
Richard E. Cavanagh | | | 9,442,528 | | | | 286,426 | | | | 491,101 | |
Cynthia L. Egan | | | 9,672,468 | | | | 56,486 | | | | 491,101 | |
Frank J. Fabozzi | | | 9,558,438 | | | | 170,516 | | | | 491,101 | |
Robert Fairbairn | | | 9,599,043 | | | | 129,911 | | | | 491,101 | |
Henry Gabbay | | | 9,508,557 | | | | 220,397 | | | | 491,101 | |
R. Glenn Hubbard | | | 9,593,797 | | | | 135,157 | | | | 491,101 | |
W. Carl Kester | | | 9,606,439 | | | | 122,515 | | | | 491,101 | |
Catherine A. Lynch | | | 9,672,468 | | | | 56,486 | | | | 491,101 | |
John M. Perlowski | | | 9,599,043 | | | | 129,911 | | | | 491,101 | |
Karen P. Robards | | | 9,672,468 | | | | 56,486 | | | | 491,101 | |
| | * | Denotes Company-wide proposal and voting results. | |
The above Directors, referred to as the BlackRock Fixed-Income Board, have also been elected to serve as directors for other BlackRock-advised non-index fixed-income mutual funds and all of the BlackRock-advised closed-end funds.
General Information
Householding
The Funds will mail only one copy of shareholder documents, including prospectuses, annual and semi-annual reports and proxy statements, to shareholders with multiple accounts at the same address. This practice is commonly called “householding” and is intended to reduce expenses and eliminate duplicate mailings of shareholder documents. Mailings of your shareholder documents may be householded indefinitely unless you instruct us otherwise. If you do not want the mailing of these documents to be combined with those for other members of your household, please call the Funds at (800)441-7762.
| | | | |
| ADDITIONAL INFORMATION | | | 155 | |
Additional Information (continued)
Availability of Quarterly Schedule of Investments
The Funds file their complete schedule of portfolio holdings with the SEC for the first and third quarters of each fiscal year on FormN-Q. The Funds’ FormsN-Q are available on the SEC’s website at http://www.sec.gov. The Funds’ FormsN-Q may also be obtained upon request and without charge by calling (800)441-7762.
Availability of Proxy Voting Policies and Procedures
A description of the policies and procedures that the Funds use to determine how to vote proxies relating to portfolio securities is available upon request and without charge (1) by calling (800)441-7762; (2) athttp://www.blackrock.com/prospectus/insurance; and (3) on the SEC’s website at http://www.sec.gov.
Availability of Proxy Voting Record
Information about how the Funds voted proxies relating to securities held in the Funds’ portfolios during the most recent12-month period ended June 30 is available upon request and without charge (1) athttp://www.blackrock.com/prospectus/insurance or by calling (800)441-7762 and (2) on the SEC’s website athttp://www.sec.gov.
BlackRock’s Mutual Fund Family
BlackRock offers a diverse lineup ofopen-end mutual funds crossing all investment styles and managed by experts in equity, fixed-income andtax-exempt investing. Visithttp://www.blackrock.com for more information.
Shareholder Privileges
Account Information
Call us at (800)441-7762 from 8:00 AM to 6:00 PM ET on any business day to get information about your account balances, recent transactions and share prices. You can also reach us on the Web athttp://www.blackrock.com.
Automatic Investment Plans
Investor Class shareholders who want to invest regularly can arrange to have $50 or more automatically deducted from their checking or savings account and invested in any of the BlackRock funds.
Systematic Withdrawal Plans
Investor Class shareholders can establish a systematic withdrawal plan and receive periodic payments of $50 or more from their BlackRock funds, as long as their account balance is at least $10,000.
Retirement Plans
Shareholders may make investments in conjunction with Traditional, Rollover, Roth, Coverdell, Simple IRAs, SEP IRAs and 403(b) Plans.
BlackRock Privacy Principles
BlackRock is committed to maintaining the privacy of its current and former fund investors and individual clients (collectively, “Clients”) and to safe-guarding theirnon-public personal information. The following information is provided to help you understand what personal information BlackRock collects, how we protect that information and why in certain cases we share such information with select parties.
If you are located in a jurisdiction where specific laws, rules or regulations require BlackRock to provide you with additional or different privacy-related rights beyond what is set forth below, then BlackRock will comply with those specific laws, rules or regulations.
BlackRock obtains or verifies personalnon-public information from and about you from different sources, including the following: (i) information we receive from you or, if applicable, your financial intermediary, on applications, forms or other documents; (ii) information about your transactions with us, our affiliates, or others; (iii) information we receive from a consumer reporting agency; and (iv) from visits to our websites.
BlackRock does not sell or disclose tonon-affiliated third parties anynon-public personal information about its Clients, except as permitted by law or as is necessary to respond to regulatory requests or to service Client accounts. Thesenon-affiliated third parties are required to protect the confidentiality and security of this information and to use it only for its intended purpose.
We may share information with our affiliates to service your account or to provide you with information about other BlackRock products or services that may be of interest to you. In addition, BlackRock restricts access tonon-public personal information about its Clients to those BlackRock employees with a legitimate business need for the information. BlackRock maintains physical, electronic and procedural safeguards that are designed to protect thenon-public personal information of its Clients, including procedures relating to the proper storage and disposal of such information.
| | |
| 156 | | 2018 BLACKROCK ANNUAL REPORTTO SHAREHOLDERS |
Glossary of Terms Used in this Report
| | |
| Currency |
| |
| ARS | | Argentine Peso |
| |
| AUD | | Australian Dollar |
| |
| BRL | | Brazilian Real |
| |
| CAD | | Canadian Dollar |
| |
| CHF | | Swiss Franc |
| |
| CLP | | Chilean Peso |
| |
| COP | | Colombian Peso |
| |
| EGP | | Egyptian Pound |
| |
| EUR | | Euro |
| |
| GBP | | British Pound |
| |
| IDR | | Indonesian Rupiah |
| |
| JPY | | Japanese Yen |
| |
| KRW | | South Korean Won |
| |
| MXN | | Mexican Peso |
| |
| NGN | | Nigerian Naira |
| |
| NOK | | Norwegian Krone |
| |
| RUB | | New Russian Ruble |
| |
| SEK | | Swedish Krona |
| |
| SGD | | Singapore Dollar |
| |
| TRY | | Turkish Lira |
| |
| TWD | | New Taiwan Dollar |
| |
| USD | | United States Dollar |
| |
| ZAR | | South African Rand |
| | |
| Portfolio Abbreviations |
| |
| ABS | | Asset-Backed Security |
| |
| ADR | | American Depositary Receipt |
| |
| BZDIOVER | | Overnight Brazil CETIP — Interbank Rate |
| |
| CDO | | Collateralized Debt Obligation |
| |
| CDX | | Credit Default Swap Index |
| |
| CLO | | Collateralized Loan Obligation |
| |
| CSMC | | Credit Suisse Mortgage Capital |
| |
| CVA | | Certification Van Aandelon (Dutch Certificate) |
| |
| CWABS | | Countrywide Asset-Backed Certificates |
| |
| DAC | | Designated Activity Company |
| |
| ETF | | Exchange-Traded Fund |
| |
| EURIBOR | | Euro Interbank Offered Rate |
| |
| GO | | General Obligation Bonds |
| |
| LIBOR | | London Interbank Offered Rate |
| |
| MXIBTIIE | | Mexico Interbank TIIE 28-Day |
| |
| NASDAQ | | National Association of Securities Dealers Automated |
| |
| NYRS | | New York Registered Shares |
| |
| OTC | | Over-The-Counter |
| | |
| Portfolio Abbreviations(continued) |
| |
| PCL | | Public Company Limited |
| |
| PIK | | Pay-In-Kind |
| |
| RB | | Revenue Bonds |
| |
| REIT | | Real Estate Investment Trust |
| |
| S&P | | Standard & Poor’s |
| |
| SPDR | | S&P Depository Receipt |
| |
| TBA | | To-be-announced |
| |
| VRDN | | Variable Rate Demand Notes |
| | | | |
| GLOSSARYOF TERMS USEDINTHIS REPORT | | | 157 | |
This report is authorized for distribution only to Policyowners of certain variable life insurance policies, which are funded by shares of BlackRock Series Fund, Inc. This report is not authorized for use as an offer of sale or a solicitation of an offer to buy shares of the Fund or the policies. Past performance results shown in this report should not be considered a representation of future performance. Investment returns and principal value of shares will fluctuate so that shares, when redeemed, may be worth more or less than their original cost. Performance information used throughout this report does not include insurance-related fees and expenses. An investment in BlackRock Government Money Market Portfolio is not insured or guaranteed by the Federal Deposit Insurance Corporation or any other Government agency. Although BlackRock Government Money Market Portfolio seeks to preserve the value of your investment at $1.00 per share, it is possible to lose money by investing in the Portfolio. Statements and other information herein are as dated and are subject to change. Please see the Fund’s prospectus for a description of risks associated with global investments.

| | |
Series8-12/18-AR | |  |
| Item 2 – | Code of Ethics – The registrant (or the “Fund”) has adopted a code of ethics, as of the end of the period covered by this report, applicable to the registrant’s principal executive officer, principal financial officer, principal accounting officer or controller, or persons performing similar functions. During the period covered by this report, the code of ethics was amended to update certain information and to make othernon-material changes. During the period covered by this report, there have been no waivers granted under the code of ethics. The registrant undertakes to provide a copy of the code of ethics to any person upon request, without charge, who calls1-800-441-7762. |
| Item 3 – | Audit Committee Financial Expert – The registrant’s board of directors (the “board of directors”), has determined that (i) the registrant has the following audit committee financial experts serving on its audit committee and (ii) each audit committee financial expert is independent: |
Robert M. Hernandez
Henry R. Keizer
Bruce R. Bond
Under applicable securities laws, a person determined to be an audit committee financial expert will not be deemed an “expert” for any purpose, including without limitation for the purposes of Section 11 of the Securities Act of 1933, as a result of being designated or identified as an audit committee financial expert. The designation or identification of a person as an audit committee financial expert does not impose on such person any duties, obligations, or liabilities greater than the duties, obligations, and liabilities imposed on such person as a member of the audit committee and board of directors in the absence of such designation or identification.
| Item 4 – | Principal Accountant Fees and Services |
The following table presents fees billed by Deloitte & Touche LLP (“D&T”) in each of the last two fiscal years for the services rendered to the Fund:
| | | | | | | | | | | | | | | | |
| | | (a) Audit Fees | | (b) Audit-Related Fees1 | | (c) Tax Fees2 | | (d) All Other Fees |
| Entity Name | | Current
Fiscal Year
End | | Previous
Fiscal Year
End | | Current
Fiscal Year
End | | Previous
Fiscal Year
End | | Current
Fiscal Year
End | | Previous
Fiscal Year
End | | Current
Fiscal Year
End | | Previous
Fiscal Year
End |
| BlackRock Advantage Large Cap Core Portfolio | | $23,052 | | $23,044 | | $0 | | $4,000 | | $13,100 | | $13,107 | | $0 | | $0 |
| BlackRock Balanced Capital Portfolio | | $33,966 | | $33,941 | | $0 | | $0 | | $15,700 | | $15,657 | | $0 | | $0 |
| BlackRock Capital Appreciation Portfolio | | $25,806 | | $25,849 | | $0 | | $0 | | $13,100 | | $13,107 | | $0 | | $0 |
| BlackRock Global Allocation Portfolio | | $38,250 | | $38,250 | | $0 | | $0 | | $20,000 | | $20,000 | | $0 | | $0 |
| BlackRock Government Money Market Portfolio | | $26,520 | | $23,282 | | $0 | | $0 | | $9,800 | | $9,792 | | $0 | | $0 |
The following table presents fees billed by D&T that were required to be approved by the registrant’s audit committee (the “Committee”) for services that relate directly to the operations or financial reporting of the Fund and that are rendered on behalf of BlackRock Advisors, LLC (the “Investment Adviser” or “BlackRock”) and entities controlling, controlled by, or under common control with
2
BlackRock (not including anysub-adviser whose role is primarily portfolio management and is subcontracted with or overseen by another investment adviser) that provide ongoing services to the Fund (“Affiliated Service Providers”):
| | | | |
| | | Current Fiscal Year End | | Previous Fiscal Year End |
(b) Audit-Related Fees1 | | $0 | | $0 |
(c) Tax Fees2 | | $0 | | $0 |
(d) All Other Fees3 | | $2,274,000 | | $2,129,000 |
1 The nature of the services includes assurance and related services reasonably related to the performance of the audit or review of financial statements not included in Audit Fees, including accounting consultations, agreed-upon procedure reports, attestation reports, comfort letters,out-of-pocket expenses and internal control reviews not required by regulators.
2 The nature of the services includes tax compliance and/or tax preparation, including services relating to the filing or amendment of federal, state or local income tax returns, regulated investment company qualification reviews, taxable income and tax distribution calculations.
3Non-audit fees of $2,274,000 and $2,129,000 for the current fiscal year and previous fiscal year, respectively, were paid to the Fund’s principal accountant in their entirety by BlackRock, in connection with services provided to the Affiliated Service Providers of the Fund and of certain other funds sponsored and advised by BlackRock or its affiliates for a service organization review and an accounting research tool subscription. These amounts represent aggregate fees paid by BlackRock and were not allocated on a per fund basis.
(e)(1) Audit CommitteePre-Approval Policies and Procedures:
The Committee has adopted policies and procedures with regard to thepre-approval of services. Audit, audit-related and tax compliance services provided to the registrant on an annual basis require specificpre-approval by the Committee. The Committee also must approve othernon-audit services provided to the registrant and thosenon-audit services provided to the Investment Adviser and Affiliated Service Providers that relate directly to the operations and the financial reporting of the registrant. Certain of thesenon-audit services that the Committee believes are (a) consistent with the SEC’s auditor independence rules and (b) routine and recurring services that will not impair the independence of the independent accountants may be approved by the Committee without consideration on a specificcase-by-case basis (“generalpre-approval”). The term of any generalpre-approval is 12 months from the date of thepre-approval, unless the Committee provides for a different period. Tax or othernon-audit services provided to the registrant which have a direct impact on the operations or financial reporting of the registrant will only be deemedpre-approved provided that any individual project does not exceed $10,000 attributable to the registrant or $50,000 per project. For this purpose, multiple projects will be aggregated to determine if they exceed the previously mentioned cost levels.
Any proposed services exceeding thepre-approved cost levels will require specificpre-approval by the Committee, as will any other services not subject to generalpre-approval (e.g., unanticipated but permissible services). The Committee is informed of each service approved subject to generalpre-approval at the next regularly scheduledin-person board meeting. At this meeting, an analysis of such services is presented to the Committee for ratification. The Committee may delegate to the Committee Chairman the authority to approve the provision of and fees for any specific engagement of permittednon-audit services, including services exceedingpre-approved cost levels.
(e)(2) None of the services described in each of Items 4(b) through (d) were approved by the Committee pursuant to the de minimis exception in paragraph (c)(7)(i)(C) of Rule2-01 of RegulationS-X.
(f) Not Applicable
3
(g) The aggregatenon-audit fees, defined as the sum of the fees shown under “Audit-Related Fees,” “Tax Fees” and “All Other Fees,” paid to the accountant for services rendered by the accountant to the registrant, the Investment Adviser and the Affiliated Service Providers were:
| | | | | | | | |
| | | Entity Name | | Current Fiscal Year
End | | Previous Fiscal Year
End | | |
| | BlackRock Advantage Large Cap Core Portfolio | | $13,100 | | $13,107 |
| | BlackRock Balanced Capital Portfolio | | $15,700 | | $15,657 |
| | BlackRock Capital Appreciation Portfolio | | $13,100 | | $13,107 |
| | BlackRock Global Allocation Portfolio | | $20,000 | | $20,000 |
| | BlackRock Government Money Market Portfolio | | $9,800 | | $9,792 |
Additionally, the amounts billed by D&T in connection with services provided to the Affiliated Service Providers of the Fund and of other funds sponsored and advised by BlackRock or its affiliates during the current and previous fiscal years for a service organization review and an accounting research tool subscription were:
| | |
Current Fiscal Year
End | | Previous Fiscal Year
End |
$2,274,000 | | $2,129,000 |
These amounts represent aggregate fees paid by BlackRock and were not allocated on a per fund basis.
(h) The Committee has considered and determined that the provision ofnon-audit services that were rendered to the Investment Adviser and the Affiliated Service Providers that were notpre-approved pursuant to paragraph (c)(7)(ii) ofRule 2-01 of RegulationS-X is compatible with maintaining the principal accountant’s independence.
| Item 5 – | Audit Committee of Listed Registrants – Not Applicable |
(a) The registrant’s Schedule of Investments is included as part of the Report to Stockholders filed under Item 1 of this Form.
(b) Not Applicable due to no such divestments during the semi-annual period covered since the previousForm N-CSR filing.
| Item 7 – | Disclosure of Proxy Voting Policies and Procedures forClosed-End Management Investment Companies – Not Applicable |
| Item 8 – | Portfolio Managers ofClosed-End Management Investment Companies – Not Applicable |
| Item 9 – | Purchases of Equity Securities byClosed-End Management Investment Company and Affiliated Purchasers – Not Applicable |
4
| Item 10 – | Submission of Matters to a Vote of Security Holders – There have been no material changes to these procedures. |
| Item 11 – | Controls and Procedures |
(a) – The registrant’s principal executive and principal financial officers, or persons performing similar functions, have concluded that the registrant’s disclosure controls and procedures (as defined in Rule30a-3(c) under the Investment Company Act of 1940, as amended (the “1940 Act”)) are effective as of a date within 90 days of the filing of this report based on the evaluation of these controls and procedures required byRule 30a-3(b) under the 1940 Act and Rule 15d-15(b) under the Securities Exchange Act of 1934, as amended.
(b) – There were no changes in the registrant’s internal control over financial reporting (as defined inRule 30a-3(d) under the 1940 Act) that occurred during the second fiscal quarter of the period covered by this report that have materially affected, or are reasonably likely to materially affect, the registrant’s internal control over financial reporting.
| Item 12 – | Disclosure of Securities Lending Activities forClosed-End Management Investment Companies – Not Applicable to the registrant. |
| Item 13 – | Exhibits attached hereto |
(a)(1) Code of Ethics – See Item 2
(a)(2) Certifications – Attached hereto
(a)(3) Not Applicable
(a)(4) Not Applicable
(b) Certifications – Attached hereto
5
Pursuant to the requirements of the Securities Exchange Act of 1934 and the Investment Company Act of 1940, the registrant has duly caused this report to be signed on its behalf by the undersigned, thereunto duly authorized.
| | |
| BlackRock Series Fund, Inc. |
| |
| By: | | /s/ John M. Perlowski |
| | John M. Perlowski |
| | Chief Executive Officer (principal executive officer) of |
| | BlackRock Series Fund, Inc. |
Date: February 28, 2019
Pursuant to the requirements of the Securities Exchange Act of 1934 and the Investment Company Act of 1940, this report has been signed below by the following persons on behalf of the registrant and in the capacities and on the dates indicated.
| | |
| By: | | /s/ John M. Perlowski |
| | John M. Perlowski |
| | Chief Executive Officer (principal executive officer) of |
| | BlackRock Series Fund, Inc. |
Date: February 28, 2019
| | |
| By: | | /s/ Neal J. Andrews |
| | Neal J. Andrews |
| | Chief Financial Officer (principal financial officer) of |
| | BlackRock Series Fund, Inc. |
Date: February 28, 2019
6