UNITED STATES
SECURITIES AND EXCHANGE COMMISSION
Washington, D.C. 20549
FORM N-CSR
CERTIFIED SHAREHOLDER REPORT OF REGISTERED MANAGEMENT
INVESTMENT COMPANIES
Investment Company Act file number: 811-03091
Name of Fund: BlackRock Series Fund, Inc.
BlackRock Balanced Capital Portfolio
BlackRock Capital Appreciation Portfolio
BlackRock Global Allocation Portfolio
BlackRock Government Money Market Portfolio (Formerly, BlackRock Money Market Portfolio)
BlackRock High Yield Portfolio
BlackRock Large Cap Core Portfolio
BlackRock Total Return Portfolio
BlackRock U.S. Government Bond Portfolio
Fund Address: 100 Bellevue Parkway, Wilmington, DE 19809
Name and address of agent for service: John M. Perlowski, Chief Executive Officer, BlackRock Series Fund, Inc., 55 East 52nd Street, New York, NY 10055
Registrant’s telephone number, including area code: (800) 441-7762
Date of fiscal year end: 12/31/2015
Date of reporting period: 12/31/2015
Item 1 – Report to Stockholders
DECEMBER 31, 2015
BlackRock Series Fund, Inc.
▶ BlackRock Balanced Capital Portfolio
▶ BlackRock Capital Appreciation Portfolio
▶ BlackRock Global Allocation Portfolio
▶ BlackRock Government Money Market Portfolio
▶ BlackRock High Yield Portfolio
▶ BlackRock Large Cap Core Portfolio
▶ BlackRock Total Return Portfolio
▶ BlackRock U.S. Government Bond Portfolio
| | |
| Not FDIC Insured ¡ May Lose Value ¡ No Bank Guarantee | | |
| | | | | | |
| 2 | | BLACKROCK SERIES FUND, INC. | | DECEMBER 31, 2015 | | |
Dear Shareholder,
Diverging monetary policies and shifting economic outlooks across regions have been the overarching themes driving financial markets over the past couple of years. With U.S. growth outpacing the global economic recovery in 2015 while inflationary pressures remained low, investors spent most of the year anticipating a short-term rate hike from the Federal Reserve (the “Fed”), which ultimately came to fruition in December. In contrast, the European Central Bank (“ECB”) and the Bank of Japan moved to a more accommodative stance during the year. In this environment, the U.S. dollar strengthened considerably, causing profit challenges for U.S. exporters and high levels of volatility in emerging market currencies and commodities. Oil prices were particularly volatile and below the historical norm due to an ongoing imbalance in global supply and demand.
Market volatility broadly increased in the middle of 2015, beginning with a sharp, but temporary, selloff in June as Greece’s long-brewing debt troubles came to an impasse. Just as these concerns abated, Chinese equities tumbled amid weakness in the country’s economy. This, combined with a depreciation of the yuan and declining confidence in China’s policymakers, stoked worries about the potential impact to the broader world economy, causing heightened volatility to spread throughout markets globally. Given a dearth of meaningful growth across most of the world, financial markets became more reliant on central bank policies to drive performance. In that vein, risk assets (such as equities and high yield bonds) rallied in October when China’s central bank provided more stimulus, the ECB hinted at further easing, and soft U.S. data pushed back expectations for a Fed rate hike. As the period came to a close, however, the ECB disappointed investors with its subdued policy changes. The Fed’s December rate hike had a positive impact on the markets as it removed a source of uncertainty, but this was counteracted by the dampening effect of a stronger U.S. dollar, falling oil prices and tighter credit conditions.
At BlackRock, we believe investors need to think globally, extend their scope across a broad array of asset classes and be prepared to move freely as market conditions change over time. We encourage you to talk with your financial advisor and visit blackrock.com for further insight about investing in today’s markets.
Sincerely,

Rob Kapito
President, BlackRock Advisors, LLC

Rob Kapito
President, BlackRock Advisors, LLC
| | | | | | | | |
| Total Returns as of December 31, 2015 | |
| | | 6-month | | | 12-month | |
U.S. large cap equities (S&P 500® Index) | | | 0.15 | % | | | 1.38 | % |
U.S. small cap equities (Russell 2000® Index) | | | (8.75 | ) | | | (4.41 | ) |
International equities (MSCI Europe, Australasia, Far East Index) | | | (6.01 | ) | | | (0.81 | ) |
Emerging market equities (MSCI Emerging Markets Index) | | | (17.35 | ) | | | (14.92 | ) |
3-month Treasury bill (BofA Merrill Lynch 3-Month U.S. Treasury Bill Index) | | | 0.04 | | | | 0.05 | |
U.S. Treasury securities (BofA Merrill Lynch 10-Year U.S. Treasury Index) | | | 1.43 | | | | 0.91 | |
U.S. investment-grade bonds (Barclays U.S. Aggregate Bond Index) | | | 0.65 | | | | 0.55 | |
Tax-exempt municipal bonds (S&P Municipal Bond Index) | | | 3.31 | | | | 3.32 | |
U.S. high yield bonds (Barclays U.S. Corporate High Yield 2% Issuer Capped Index) | | | (6.79 | ) | | | (4.43 | ) |
|
| Past performance is no guarantee of future results. Index performance is shown for illustrative purposes only. You cannot invest directly in an index. | |
| | | | | | |
| | | THIS PAGE NOT PART OF YOUR FUND REPORT | | | | 3 |
| | | | |
| Fund Summary as of December 31, 2015 | | | BlackRock Balanced Capital Portfolio | |
BlackRock Balanced Capital Portfolio’s (the “Fund”) investment objective is to seek high total investment return.
|
| Portfolio Management Commentary |
How did the Fund perform?
| • | | For the 12-month period ended December 31, 2015, the Fund returned 0.52%, underperforming its blended benchmark (60% Russell 1000® Index/40% Barclays U.S. Aggregate Bond Index), which returned 1.00% for the period. The Russell 1000® Index advanced 0.92%, while the Barclays U.S. Aggregate Bond Index returned 0.55%. |
What factors influenced performance?
| • | | From a broad asset allocation perspective, the Fund’s overweight in equities relative to the blended benchmark contributed positively to performance as equities outperformed core fixed income during the period. |
| • | | With respect to the Fund’s equity allocation, stock selection within information technology (“IT”) detracted from performance, as holdings of hardware and semiconductor companies were impacted by a difficult sales environment for personal computers. |
| • | | Within equities, exposure to managed care companies within health care was a notable positive contributor. These companies have consistently exceeded earnings expectations and raised forward guidance. The managed care segment has benefited from a recent favorable Supreme Court ruling concerning insurance subsidies under the Affordable Care Act and, more critically, the consolidation trend in the industry. Positioning with respect to energy was also additive, in particular underweight exposure to the worst-performing exploration & production companies and overweight exposure to refining & marketing firms. Additional positive contributions came from holdings of beverage companies within consumer staples, and from exposure to home-improvement retailers, leisure travel companies and auto components companies within consumer discretionary. |
| • | | Within the fixed income allocation, the Fund’s stance with respect to overall portfolio duration (and corresponding sensitivity to interest rates) hindered performance, as did positioning along the yield curve. The Fund’s allocations to European credits and U.S. Treasury Inflation Protected Securities also detracted. |
| • | | Within fixed income, positive performance for the year was led by allocations to securitized assets. Within U.S. investment grade credit, an overweight position in financials and underweight in industrials added to performance. |
Describe recent portfolio activity.
| • | | Within equities, the Fund’s weighting in the consumer discretionary sector saw the most significant increase over the 12-month period, while allocations to health care and consumer staples also increased. The most notable reduction was with respect to the industrials sector, while energy, financials and IT saw declines as well. |
| • | | Within fixed income, the Fund tactically shifted overall portfolio duration, while maintaining a somewhat conservative stance with respect to U.S. interest rates for much of the year. Entering the 12-month period, the Fund was underweight U.S. investment grade credit given the low yields offered, and then moved to a neutral weighting as global bond yields rose in the second quarter of 2015. The Fund tactically traded exposure to U.S. high yield corporates, modestly adding to these holdings towards the end of the period. The Fund’s allocation to securitized assets was modestly reduced during the period, based on less attractive valuations following a period of relatively strong performance and on rising macro concerns. |
| • | | The Fund held derivatives during the period, principally to manage foreign currency exposures. The use of derivatives did not have a material impact on performance. |
Describe portfolio positioning at period end.
| • | | Relative to the blended benchmark, the Fund ended the period overweight in equities relative to fixed income. Relative to the Russell 1000® Index, the Fund’s equity allocation was most notably overweight IT, followed by consumer discretionary and health care, while industrials, telecommunication services and utilities were the most significant underweights. In fixed income, the Fund ended the period with a conservative stance with respect to overall duration and interest rate risk relative to the Barclays U.S. Aggregate Bond Index. Within investment grade credit, the Fund had a tilt toward financials. The Fund maintained an allocation to municipal bonds, modest exposure to high yield corporate bonds and overweight exposure to securitized assets. In emerging markets, the Fund was focused on attractive income opportunities that were created by the significant moves in currency and country valuations in 2015. The Fund remained modestly overweight the U.S. dollar, in particular versus the euro, the Saudi Arabian riyal and the Chinese yuan. |
| | | | | |
| Portfolio Composition | | Percent of
Total Investments1 |
Common Stocks | | | | 58 | % |
U.S. Government Sponsored Agency Securities | | | | 16 | |
Corporate Bonds | | | | 10 | |
U.S. Treasury Obligations | | | | 8 | |
Asset-Backed Securities | | | | 3 | |
Non-Agency Mortgage-Backed Securities | | | | 3 | |
Foreign Government Obligations | | | | 1 | |
Taxable Municipal Bonds | | | | 1 | |
| | 1 | | Total Investments exclude short-term securities, options purchased, borrowed bonds and TBA sale commitments. |
| | | | | | |
| 4 | | BLACKROCK SERIES FUND, INC. | | DECEMBER 31, 2015 | | |
| | | | |
| | | | BlackRock Balanced Capital Portfolio | |
|
Total Return Based on a $10,000 Investment |
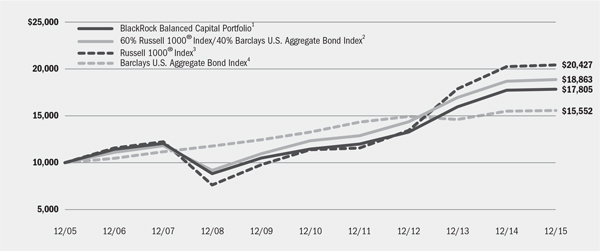
| | 1 | Assuming transaction costs and other operating expenses, including investment advisory fees, if any. Does not include insurance-related fees and expenses. The Fund invests in U.S. and foreign equity and fixed income securities of any maturity. |
| | 2 | The Fund compares its performance to that of a customized weighted index comprised of the returns of the Russell 1000® Index (60%) and Barclays U.S. Aggregate Bond Index (40%). |
| | 3 | The index measures the performance of the large cap segment of the U.S. equity universe. It is a subset of the Russell 3000® Index and includes approximately 1,000 of the largest securities based on a combination of their market capitalization and current index membership. The index represents approximately 92% of the total market capitalization of the Russell 3000® Index. |
| | 4 | A widely recognized unmanaged market-weighted index comprised of investment-grade corporate bonds rated BBB or better, mortgages and U.S. Treasury and U.S. Government agency issues with at least one year to maturity. |
| | | | | | | | |
| Performance Summary for the Period Ended December 31, 2015 |
| | | | | | | | | | | | | | | | | | | | |
| | | | | Average Annual Total Returns5 |
| | | 6-Month
Total Returns5 | | 1 Year | | 5 Years | | 10 Years |
BlackRock Balanced Capital Portfolio | | | | (0.04 | )% | | | | 0.52 | % | | | | 9.25 | % | | | | 5.94 | % |
60% Russell 1000® Index/40% Barclays U.S. Aggregate Bond Index | | | | (0.07 | ) | | | | 1.00 | | | | | 8.88 | | | | | 6.55 | |
Russell 1000® Index | | | | (0.78 | ) | | | | 0.92 | | | | | 12.44 | | | | | 7.40 | |
Barclays U.S. Aggregate Bond Index | | | | 0.65 | | | | | 0.55 | | | | | 3.25 | | | | | 4.51 | |
| | 5 | | Cumulative and average annual total returns are based on changes in net asset value for the periods shown and assume reinvestment of all distributions at net asset value on the ex-dividend date. Insurance related fees and expenses are not reflected in these returns. |
| | | | Past performance is not indicative of future results. Performance results do not reflect the deduction of taxes that a shareholder would pay on Fund distributions or the redemption of Fund shares. |
| | | | | | | | | | | | | | | | | | | | |
| Expense Example |
| | | Actual | | | | Hypothetical8 |
| | | | | | | Including
Interest Expense | | Excluding
Interest Expense | | | | | | Including Interest Expense | | Excluding Interest Expense |
| | | Beginning
Account Value
July 1, 2015 | | Ending
Account Value
December 31, 2015 | | Expenses
Paid During the Period6 | | Expenses
Paid During the Period7 | | | | Beginning
Account Value
July 1, 2015 | | Ending
Account Value
December 31,
2015 | | Expenses
Paid During the Period6 | | Ending
Account Value
December 31,
2015 | | Expenses
Paid During the Period7 |
BlackRock Balanced Capital Portfolio | | $1,000.00 | | $999.60 | | $2.62 | | $2.52 | | | | $1,000.00 | | $1,022.58 | | $2.65 | | $1,022.68 | | $2.55 |
| | 6 | | Expenses are equal to the annualized expense ratio (0.52%), multiplied by the average account value over the period, multiplied by 184/365 (to reflect the one-half year period shown). |
| | 7 | | Expenses are equal to the annualized expense ratio (0.50%), multiplied by the average account value over the period, multiplied by 184/365 (to reflect the one-half year period shown). |
| | 8 | | Hypothetical 5% annual return before expenses is calculated by prorating the number of days in the most recent fiscal half year divided by 365. |
| | | | See “Disclosure of Expenses” on page 20 for further information on how expenses were calculated. |
| | | | | | |
| | | BLACKROCK SERIES FUND, INC. | | DECEMBER 31, 2015 | | 5 |
| | | | |
| Fund Summary as of December 31, 2015 | | | BlackRock Capital Appreciation Portfolio | |
BlackRock Capital Appreciation Portfolio’s (the “Fund”) investment objective is to seek long-term growth of capital.
|
| Portfolio Management Commentary |
How did the Fund perform?
| • | | For the 12-month period ended December 31, 2015, the Fund returned 7.27%, outperforming its benchmark, the Russell 1000® Growth Index, which returned 5.67%, and the broad-market S&P 500® Index, which returned 1.38%. The following discussion of relative performance pertains to the Russell 1000® Growth Index. |
What factors influenced performance?
| • | | In sector terms, consumer discretionary was the prime contributor to relative performance, driven by internet & catalog retail holdings. Information technology (“IT”) was a second source of strength, led by software and IT services names. Absence in communications equipment also proved advantageous in the sector. Limited exposure to the materials and energy sectors further benefited the Fund. These positives more than offset weakness in health care, where pharmaceutical holdings weighed. Consumer staples and industrials were a drag as well. |
| • | | At the stock level, the top individual contributor was Netflix, Inc. Shares outperformed in the first half of 2015 as global subscriber growth came in materially above expectations, with total customers topping 62 million. Strong performance continued in the second half of the reporting period, with the company continuing to report strong subscriber growth, both domestically and internationally. Overall, Netflix, Inc. continues to leverage its large scale enabling it to drive more content, attracting more subscribers. |
| • | | Positions in Facebook Inc. and Alphabet Inc. (Google’s parent company) also added considerable value. Facebook Inc. outperformed as the company showed accelerating growth in its core platform and material progress with monetizing its emerging growth properties (Instagram, Facebook Messenger and WhatsApp). Alphabet Inc. gained as Google showed acceleration in owned and operated (Google.com) revenues, excluding |
| | foreign exchange. This, combined with year-over-year margin improvement, is driving positive earnings revisions and multiple expansion for the stock. |
| • | | The largest individual detractors were Yahoo Inc., Twenty-First Century Fox Inc. and Union Pacific Corp. Yahoo Inc. underperformed as its primary value driver – i.e. its stake in Chinese e-commerce company Alibaba – declined more than 20%. Shares of Twenty-First Century Fox Inc. underperformed early in the period as investors worried about the impact of foreign exchange on the company’s future earnings; additionally, ratings remained weak at its Fox broadcast network. Later, overall media multiples came under pressure (most notably in August 2015) amid growing concerns about the sustainability of the cable bundling model. Both Yahoo Inc. and Twenty-First Century Fox Inc. were eliminated by the end of the reporting period. Union Pacific Corp. underperformed in 2015 due to declining freight volumes, particularly coal and metals. |
Describe recent portfolio activity.
| • | | Due to a combination of portfolio trading activity and market movement during the 12-month period, the Fund’s weighting in the consumer staples sector considerably increased. The allocations to IT and materials also increased. The Fund’s weighting in the health care and industrials sectors decreased, with declines in consumer discretionary and energy as well. |
Describe portfolio positioning at period end.
| • | | As of period end, the Fund’s largest sector overweight relative to the Russell 1000® Growth Index was in IT, while industrials was the largest underweight. |
The views expressed reflect the opinions of BlackRock as of the date of this report and are subject to change based on changes in market, economic or other conditions. These views are not intended to be a forecast of future events and are no guarantee of future results.
| | | | | |
| Sector Allocation | | Percent of
Net Assets |
Information Technology | | | | 38% | |
Consumer Discretionary | | | | 21 | |
Health Care | | | | 18 | |
Consumer Staples | | | | 9 | |
Financials | | | | 6 | |
Industrials | | | | 3 | |
Materials | | | | 3 | |
Telecommunication Services | | | | 1 | |
Energy | | | | 1 | |
Short-Term Securities | | | | 5 | |
Liabilities in Excess of Other Assets. | | | | (5) | |
For Fund compliance purposes, the Fund’s sector classifications refer to any one or more of the sector sub-classifications used by one or more widely recognized market indexes or ratings group indexes, and/or as defined by the investment advisor. These definitions may not apply for purposes of this report, which may combine sector sub classifications for reporting ease.
| | | | | | |
| 6 | | BLACKROCK SERIES FUND, INC. | | DECEMBER 31, 2015 | | |
| | |
| | | BlackRock Capital Appreciation Portfolio |
|
| Total Return Based on a $10,000 Investment |
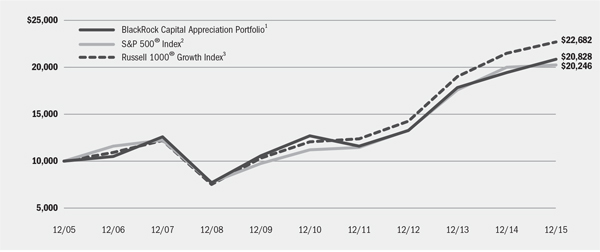
| | 1 | Assuming transaction costs and other operating expenses, including investment advisory fees, if any. Does not include insurance-related fees and expenses. The Fund invests primarily in a diversified portfolio consisting primarily of common stock of U.S. companies that the investment advisor believes have shown above-average growth rates in earnings over the long term. |
| | 2 | This unmanaged index covers 500 leading companies and captures approximately 80% coverage of available market capitalization. |
| | 3 | This unmanaged index measures the performance of the large cap growth segment of the U.S. equity universe and consists of those Russell 1000® securities with higher price-to-book ratios and higher forecasted growth values. |
| | | | | | | | |
| Performance Summary for the Period Ended December 31, 2015 |
| | | | | Average Annual Total Returns4 |
| | | 6-Month
Total Returns4 | | 1 Year | | 5 Years | | 10 Years |
BlackRock Capital Appreciation Portfolio | | 0.82% | | 7.27% | | 10.45% | | 7.61% |
S&P 500® Index | | 0.15 | | 1.38 | | 12.57 | | 7.31 |
Russell 1000® Growth Index | | 1.64 | | 5.67 | | 13.53 | | 8.53 |
| | 4 | | Cumulative and average annual total returns are based on changes in net asset value for the periods shown and assume reinvestment of all distributions at net asset value on the ex-dividend date. Insurance related fees and expenses are not reflected in these returns. |
| | | | Past performance is not indicative of future results. Performance results do not reflect the deduction of taxes that a shareholder would pay on Fund distributions or the redemption of Fund shares. |
| | | | | | | | | | | | | | |
| Expense Example | | | | | | | | | | | | | | |
| | | Actual | | Hypothetical6 | | |
| | | Beginning
Account Value
July 1, 2015 | | Ending
Account Value
December 31, 2015 | | Expenses Paid
During the Period5 | | Beginning
Account Value
July 1, 2015 | | Ending
Account Value
December 31, 2015 | | Expenses Paid
During the Period5 | | Annualized
Expense
Ratio |
BlackRock Capital Appreciation Portfolio | | $1,000.00 | | $1,008.20 | | $2.58 | | $1,000.00 | | $1,022.63 | | $2.60 | | 0.51% |
| | 5 | | Expenses are equal to the annualized net expense ratio, multiplied by the average account value over the period, multiplied by 184/365 (to reflect the one-half year period shown). |
| | 6 | | Hypothetical 5% annual return before expenses is calculated by prorating the number of days in the most recent fiscal half year divided by 365. See “Disclosure of Expenses” on page 20 for further information on how expenses were calculated. |
Performance results do not include adjustments made for financial reporting purposes in accordance with U.S. generally accepted accounting principles and may differ from results reported in the financial highlights.
| | | | | | |
| | | BLACKROCK SERIES FUND, INC. | | DECEMBER 31, 2015 | | 7 |
| | | | |
| Fund Summary as of December 31, 2015 | | | BlackRock Global Allocation Portfolio | |
BlackRock Global Allocation Portfolio’s (the “Fund”) investment objective is to seek high total investment return.
|
| Portfolio Management Commentary |
How did the Fund perform?
| • | | For the 12-month period ended December 31, 2015, the Fund outperformed its Reference Benchmark, which is comprised of the S&P 500® Index (36%), FTSE World (ex-US) Index (24%), BofA Merrill Lynch Current 5-Year U.S. Treasury Index (24%) and Citigroup Non-U.S. Dollar World Government Bond Index (16%) (the “Reference Benchmark”). For the same period, the Fund also outperformed the broad-based all-equity benchmark, the FTSE World Index. The Fund invests in both equities and bonds; therefore, the Reference Benchmark provides a truer representation of the Fund’s composition and a more comparable means for measurement. The following discussion of relative performance pertains to the Reference Benchmark. The commentary (and referenced allocation percentages) are based on the economic exposures of the Fund, which reflect adjustments for futures, swaps, options and convertible bonds, and may vary relative to the market value. |
What factors influenced performance?
| • | | Within equities, an overweight to Japan contributed to performance, although this was partially offset by stock selection within that market. From a sector perspective, stock selection in information technology (“IT”), financials, and telecommunication services (“telecom”) was additive. Currency management, most notably an overweight to the U.S. dollar, also contributed to performance. |
| • | | Detractors from performance included stock selection in the United States and Canada. From a sector perspective, stock selection in and an overweight to materials as well as stock selection in and an underweight to both consumer discretionary and consumer staples weighed on returns. An overweight to energy and stock selection in health care, utilities, and industrials also detracted. An underweight to fixed income negatively impacted returns, while an overweight to commodity-related securities also weighed on performance. |
| • | | The Fund uses derivatives, which may include options, future, swaps and forward contracts both to enhance returns of the Fund and to hedge (or protect) against adverse movements in currency exchange rates, interest rates |
| | | and movements in the securities markets. During the period, the Fund’s use of derivatives had a positive impact on the absolute performance of the Fund. |
Describe recent portfolio activity.
| • | | During the period, the Fund’s overall equity allocation decreased from 62% to 58% of net assets. Within equities, the Fund decreased exposure to the United States, Brazil, and Japan. From a sector perspective, the Fund decreased exposure to healthcare, energy, materials, and industrials, and increased exposure to consumer staples, IT, and telecom. The Fund’s overall allocation to fixed income remained essentially unchanged at 23% of net assets. Within fixed income, the Fund reduced exposure to government bonds and increased exposure to corporate bonds. The Fund’s allocation to commodity-related securities remained essentially unchanged at 1% of net assets. |
| • | | Reflecting the above changes, the Fund’s allocation to cash and cash equivalents increased from 14% to 18% of net assets. Over the period, cash helped mitigate portfolio volatility and served as a source of funds for new investments. The Fund’s overweight to cash equivalents helped keep overall portfolio duration (and corresponding interest rate sensitivity) relatively low. |
Describe portfolio positioning at period end.
| • | | Relative to its Reference Benchmark, the Fund ended the period underweight equities and fixed income and overweight commodity-related securities and cash equivalents. Within equities, the Fund was overweight Japan and underweight the United States. Within Europe, the Fund was overweight France and Italy, and underweight Switzerland and Sweden. From a sector perspective, the Fund was overweight healthcare, telecom, energy, and materials, and underweight consumer staples, financials, and consumer discretionary. Within fixed income, the Fund was underweight developed market government bonds, and overweight corporate and convertible bonds. With respect to currency exposure, the Fund was overweight the U.S. dollar and underweight the euro, Japanese yen, Australian dollar and Canadian dollar. |
The views expressed reflect the opinions of BlackRock as of the date of this report and are subject to change based on changes in market, economic or other conditions. These views are not intended to be a forecast of future events and are no guarantee of future results.
| | | | | | | | |
| Overall Asset Exposure | | | | | | | | |
| | | Percent of Fund’s Net Assets1 | | | | Reference
Benchmark3 |
| Portfolio Composition | | 12/31/15 | | 12/31/142 | | | | Percentage |
U.S. Equities | | 27% | | 28% | | | | 35% |
European Equities | | 14 | | 14 | | | | 13 |
Asia Pacific Equities | | 15 | | 16 | | | | 9 |
Other Equities | | 2 | | 4 | | | | 3 |
Total Equities | | 58 | | 62 | | | | 60 |
U.S. Dollar Denominated Fixed Income Securities | | 18 | | 15 | | | | 24 |
U.S. Issuers | | 14 | | 12 | | | | — |
Non-U.S. Issuers | | 4 | | 3 | | | | — |
Non-U.S. Dollar Denominated Fixed Income Securities | | 5 | | 8 | | | | 16 |
Total Fixed Income Securities | | 23 | | 23 | | | | 40 |
Commodity-Related Securities | | 1 | | 1 | | | | — |
Cash & Short-Term Securities | | 18 | | 14 | | | | — |
| | 1 | | Exposure based on market value and adjusted for the economic value of futures, swaps, options and convertible bonds. |
| | 2 | | Prior period data is updated to reflect the economic value of options and convertible bonds and to present commodity-related exposure separately. |
| | 3 | | The Reference Benchmark is an unmanaged weighted index comprised as follows: 36% of the S&P 500 Index®; 24% FTSE World (ex U.S.) Index; 24% BofA Merrill Lynch Current 5-Year U.S. Treasury Index; and 16% Citigroup Non-U.S. Dollar World Government Bond Index. Descriptions of these indexes are found on page 5 of this report to shareholders in the “Performance Summary” section. |
| | | | | | |
| 8 | | BLACKROCK SERIES FUND, INC. | | DECEMBER 31, 2015 | | |
| | | | |
| | | | BlackRock Global Allocation Portfolio | |
|
| Total Return Based on a $10,000 Investment |
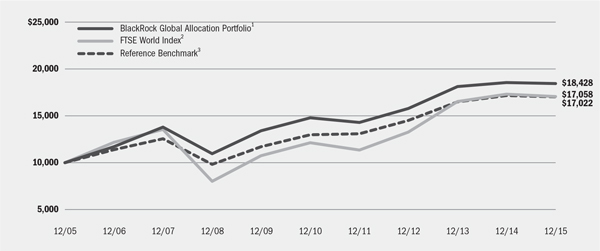
| | 1 | Assuming transaction costs and other operating expenses, including investment advisory fees, if any. Does not include insurance-related fees and expenses. The Fund invests in a portfolio of equity, debt and money market securities. |
| | 2 | This unmanaged capitalization-weighted index is comprised of 2,538 equities from 35 countries in 4 regions, including the United States. |
| | 3 | The Reference Benchmark is an unmanaged weighted index comprised as follows: 36% S&P 500® Index; 24% FTSE World (ex U.S.) Index; 24% BofA Merrill Lynch Current 5-Year U.S. Treasury Index; and 16% Citigroup Non-U.S. Dollar World Government Bond Index. |
| | | | | | | | |
| Performance Summary for the Period Ended December 31, 2015 | | |
| | | | | | | | | | | | | | | | | | | | |
| | | | | Average Annual Total Returns4 |
| | | 6-Month
Total Returns4 | | 1 Year | | 5 Years | | 10 Years |
BlackRock Global Allocation Portfolio | | | | (3.66 | )% | | | | (0.62 | )% | | | | 4.52 | % | | | | 6.30 | % |
FTSE World Index | | | | (4.06 | ) | | | | (1.37 | ) | | | | 7.10 | | | | | 5.49 | |
Reference Benchmark | | | | (1.63 | ) | | | | (0.78 | ) | | | | 5.58 | | | | | 5.46 | |
U.S. Stocks: S&P 500® Index5 | | | | 0.15 | | | | | 1.38 | | | | | 12.57 | | | | | 7.31 | |
Non-U.S. Stocks: FTSE World (ex U.S.) Index6 | | | | (8.08 | ) | | | | (4.16 | ) | | | | 2.10 | | | | | 3.59 | |
U.S. Bonds: BofA Merrill Lynch Current 5-Year U.S. Treasury Index7 | | | | 0.37 | | | | | 1.49 | | | | | 2.63 | | | | | 4.41 | |
Non-U.S. Bonds: Citigroup Non-U.S. Dollar World Government Bond Index8 | | | | 0.30 | | | | | (5.54 | ) | | | | (1.30 | ) | | | | 3.05 | |
| | 4 | | Cumulative and average annual total returns are based on changes in net asset value for the periods shown and assume reinvestment of all distributions at net asset value on the ex-dividend date. Insurance related fees and expenses are not reflected in these returns. |
| | 5 | | This unmanaged index covers 500 leading companies and captures approximately 80% coverage of available market capitalization. |
| | 6 | | An unmanaged capitalization-weighted index comprised of over 1,892 equities from 34 countries, excluding the United States. |
| | 7 | | This unmanaged index is designed to track the total return of the current coupon five-year U.S. Treasury bond. |
| | 8 | | This unmanaged market capitalization-weighted index tracks 22 government bond indexes, excluding the United States. |
Past performance is not indicative of future results. Performance results do not reflect the deduction of taxes that a shareholder would pay on Fund distributions or the redemption of Fund shares.
| | | | | | | | | | | | | | | | | | | | |
| | | Actual | | | | Hypothetical11 |
| | | | | | | Including
Dividend Expense | | Excluding
Dividend Expense | | | | | | Including
Dividend Expense | | Excluding
Dividend Expense |
| | | Beginning
Account Value
July 1, 2015 | | Ending
Account Value
December 31,
2015 | | Expenses Paid During the Period9 | | Expenses Paid During the Period10 | | | | Beginning
Account Value
July 1, 2015 | | Ending
Account Value
December 31,
2015 | | Expenses
Paid During
the Period9 | | Ending
Account Value
December 31,
2015 | | Expenses
Paid During
the Period10 |
BlackRock Global Allocation Portfolio | | $1,000.00 | | $963.40 | | $2.87 | | $2.82 | | | | $1,000.00 | | $1,022.28 | | $2.96 | | $1,022.33 | | $2.91 |
| | 9 | | Expenses are equal to the annualized expense ratio (0.58%), multiplied by the average account value over the period, multiplied by 184/365 (to reflect the one-half year period shown). |
| | 10 | | Expenses are equal to the annualized expense ratio (0.57%), multiplied by the average account value over the period, multiplied by 184/365 (to reflect the one-half year period shown). |
| | 11 | | Hypothetical 5% annual return before expenses is calculated by prorating the number of days in the most recent fiscal half year divided by 365. |
See “Disclosure of Expenses” on page 20 for further information on how expenses were calculated.
Performance results do not include adjustments made for financial reporting purposes in accordance with U.S. generally accepted accounting principles and may differ from results reported in the financial highlights.
| | | | | | |
| | | BLACKROCK SERIES FUND, INC. | | DECEMBER 31, 2015 | | 9 |
| | | | |
| Fund Summary as of December 31, 2015 | | | BlackRock Government Money Market Portfolio | |
|
| For the 12-Month Period Ended December 31, 2015 |
While the U.S. labor market continued to improve, U.S. economic growth slowed in the fourth quarter due to a strong dollar and global headwinds. Lower oil prices continued to undermine investments by energy firms while unseasonably mild weather cut into consumer spending on utilities and apparel. For the first time since 2006, on December 16, 2015, the Federal Open Market Committee (“FOMC”) voted unanimously to raise its target range for the Federal Funds Rate by 25 basis points to 0.25% to 0.50%. The move was widely expected as in the 2 months leading up to the meeting several Fed speakers commented on economic growth, specifically the gradual improvement and sustainability experienced throughout 2015. Over the same time period, Fed Fund Futures projected a 55% to 76% probability of a 25 basis point rate hike at the December meeting. As a result of the well telegraphed move, the market experienced minimal volatility throughout the remainder of the year. To note, effective December 17, the overnight level of the N.Y. Federal Reserve Reverse Repo Program (“RRP”) moved up to 0.25% from 0.05% and Interest on Reserves (“IOR”) up to 0.50% from 0.25%.
Also at the December meeting, the Federal Reserve released an updated forecast of the Summary of Economic Projection (“SEP”); the data projected 4 additional rate increases by the end of 2016 (ending the year with a 1.25% Fed Funds rate). While Chairwoman Yellen did not comment on the “dots,” she and several Fed officials did state that the future path of policy would remain dependent on the data and if the positive momentum continues, the pace of additional increases would be gradual as to not disrupt or shock the market.
The short-term tax-exempt market was relatively stable for the duration of the twelve months ended December 31, 2015. While municipal money fund industry assets have been stable, holdings of highly liquid variable rate demand note (“VRDN”) securities generally increased over the period. Rates on VRDN securities as measured by the benchmark Securities Industry and Financial Markets Association (“SIFMA”) Index, which represents the average rate on seven-day terms, ranged between a high of 0.03% to a historical low of 0.01%, and ended the period at 0.01%. With the exception of seasonal weakness resulting from tax-related redemptions in April and May, when inventory of VRDN securities reached a high not seen in over three years of near $13 billion, inventory remained at or near historical lows around and sometimes below $1 billion for the majority of the period.
Posturing around the FOMC meetings and the need to replace maturing municipal notes combined to keep demand for VRDN securities elevated over the majority of the period. In addition, improvement in the fiscal health of state and local municipal issuers contributed to a reduced need to borrow in the short-term municipal market to meet fiscal year 2016 operational budget needs. The reduced borrowing need has resulted in a reduction in one-year fixed-rate note issuance by roughly 25% from the previous year’s levels. While a federal funds rate hike was widely expected before year end, a reduction in note issuance had contributed to only a moderate amount of upward pressure on one-year rates. As the year came to a close, rates on one-year notes continued to rise as investors prepared for the anticipated Fed rate hike and reached an all-time high for the period when the Fed ultimately commenced its rate hiking cycle in mid-December. The Municipal Market Advisors AAA General Obligation One-Year Index yield increased from 0.18% on December 31, 2014 to 0.50% on December 31, 2015. In addition, the reduced supply of fixed-rate notes and defensive positioning have combined to elevate demand for VRDN securities as an investment alternative, which resulted in the SIFMA Index dropping to the historical low of 0.01% by December 31, 2015.
Past performance is no guarantee of future results. Index performance is shown for illustrative purposes only. You cannot invest directly in an index.
| | | | | | |
| 10 | | BLACKROCK SERIES FUND, INC. | | DECEMBER 31, 2015 | | |
| | | | |
| | | | BlackRock Government Money Market Portfolio | |
BlackRock Government Money Market Portfolio’s (the “Fund”) investment objective is to seek to preserve capital, maintain liquidity and achieve the highest possible current income consistent with the foregoing.
On May 13, 2015, the Board of Directors of the Fund approved changes to the Fund’s name and principal investment strategies. Effective September 1, 2015, the Fund changed its name to BlackRock Government Money Market Portfolio. Under its new principal investment strategies, the Fund invests at least 99.5% of its total assets in cash, U.S. Treasury bills, notes and other obligations issued or guaranteed as to principal and interest by the U.S. Government, its agencies or instrumentalities, and repurchase agreements secured by such obligations or cash. The Fund continues to seek to maintain a net asset value of $1.00 per share.
| | | | | | | | |
| | |
| Yields | | 7-Day SEC Yield | | | 7-Day Yield | |
BlackRock Government Money Market Portfolio | | | 0.00% | | | | 0.00% | |
| | | | |
| Portfolio Composition | | Percent of
Net Assets |
U.S. Government Sponsored Agency Securities | | | 56 | % |
Repurchase Agreements | | | 33 | |
U.S. Treasury Obligations | | | 11 | |
| | | | |
Total | | | 100 | % |
| | | | |
The 7-Day SEC Yield may differ from the 7-Day Yield shown above due to the fact that the 7-Day SEC Yield excludes distributed capital gains.
Past performance is not indicative of future results. Performance results do not reflect the deduction of taxes that a shareholder would pay on Fund distributions or the redemption of Fund shares.
| | | | | | | | | | | | | | | | | | | | | | | | | | | | | | | | | | | |
| | | Actual | | Hypothetical2 | | |
| | | Beginning
Account Value
July 1, 2015 | | Ending Account Value
December 31, 2015 | | Expenses Paid
During the Period1 | | Beginning
Account Value
July 1, 2015 | | Ending Account Value
December 31, 2015 | | Expenses Paid
During the Period1 | | Annualized
Expense
Ratio |
BlackRock Government Money Market Portfolio | | | $ | 1,000.00 | | | | $ | 1,000.10 | | | | $ | 0.86 | | | | $ | 1,000.00 | | | | $ | 1,024.35 | | | | $ | 0.87 | | | | | 0.17 | % |
| | 1 | | Expenses are equal to the annualized expense ratio, multiplied by the average account value over the period, multiplied by 184/365 (to reflect the one-half year period shown). |
| | 2 | | Hypothetical 5% annual return before expenses is calculated by prorating the number of days in the most recent fiscal half year divided by 365. |
See “Disclosure of Expenses” on page 20 for further information on how expenses were calculated.
| | | | | | |
| | | BLACKROCK SERIES FUND, INC. | | DECEMBER 31, 2015 | | 11 |
| | | | |
| Fund Summary as of December 31, 2015 | | | BlackRock High Yield Portfolio | |
BlackRock High Yield Portfolio’s (the “Fund”) investment objective is to seek to maximize total return, consistent with income generation and prudent investment management.
|
| Portfolio Management Commentary |
How did the Fund perform?
| • | | For the 12-month period ended December 31, 2015, the Fund returned (4.65)%, underperforming the (4.43)% return of its benchmark, the Barclays U.S. Corporate High Yield 2% Issuer Capped Index. |
What factors influenced performance?
| • | | The Fund’s allocation to select equity and equity-like investments was the largest detractor from performance during the period. Notable underperformers included the stocks of Amaya, Inc. within the gaming industry, Ally Financial, Inc. in banking, and Huntsman Corp. in chemicals. The Fund’s position in convertible bonds issued by Whiting Petroleum Corp. also weighed on its relative performance. |
| • | | The loss for the high yield market in 2015 represented only its sixth year of negative performance in its roughly 30-year existence. Much of the market’s weakness was caused by stress in commodity-related sectors such as energy and metals & mining. The Fund was underweight in these market segments relative to the benchmark, and was the largest factor in its outperformance during the year. Security selection and a higher-quality bias within the independent energy industry also aided results. Selection in the retail and aerospace/defense industries contributed positively, as well. The Fund’s allocation to bank loans, which outperformed high yield in 2015, was further additive to performance. |
| • | | The Fund may utilize credit default swaps (“CDS”) and currency forward contracts from time to time. Currency forwards are intermittently employed in the portfolio to manage the currency risk of non-dollar denominated bonds. CDS are normally used to manage risk, but are also used to express credit views and as a means to put capital to work in moving markets. On occasion, the Fund utilizes futures on the S&P 500 Index and Russell 2000 Index to manage portfolio beta and offset general market volatility. The Fund’s exposure to derivatives did not have a material impact on performance during 2015. |
Describe recent portfolio activity.
| • | | The Fund’s investment advisor grew increasingly conservative during the period as volatility spiked. The combination of broader macroeconomic |
| | | instability and sector-specific concerns related to commodities proved challenging for high yield and caused investors to reduce their exposure to higher-risk assets. The Fund decreased its allocation to equities and increased its use of techniques to manage exposure to equity markets during the period, resulting in a net short position by year-end. The Fund also reduced its position in CCC rated bonds, which suffered from the downgrades to commodity-related issues and the broader increase in investors’ aversion to risk. The Fund added to BB-rated issues, the highest-rated credit tier within high yield. |
| • | | The investment advisor maintained a focus on liquidity, prompting it to increase the Fund’s weighting in cash during the second half of the year. In accordance with that theme, the Fund maintained its exposure to its positions in highly liquid credit default swaps and high yield exchange-traded funds. |
Describe portfolio positioning at period end.
| • | | The Fund’s general investment themes and core positions reflected the investment advisor’s views regarding issuer cash flows, firm or industry catalysts, and idiosyncratic factors. At the same time, the Fund sought to underweight market segments where macroeconomic trends or technological changes were negatively affecting industries and/or business models. |
| • | | Relative to the Fund’s benchmark, the Fund remained underweight in BB-rated credits, with an overweight to single B-rated assets and a slight overweight to CCC-rated issuers. With regard to the yield curve, the Fund remained overweight in 7- to 10-year bonds while staying underweight in the 3- to 5-year and 5- to 7-year segments. Outside of high yield, the Fund maintained positions in floating rate bank loans and the equity of select high yield companies. Among individual issues, leading overweight positions included Ally Financial, Inc., First Data Corp. (technology), and American Capital Ltd. (finance). At the close the period, the Fund’s duration of 3.8 years was below the benchmark duration of 4.3 years. (Duration is a measure of interest rate sensitivity.) |
The views expressed reflect the opinions of BlackRock as of the date of this report and are subject to change based on changes in market, economic or other conditions. These views are not intended to be a forecast of future events and are no guarantee of future results.
| | | | | |
| Credit Quality Allocation1 | | Percent of
Total Investments2 |
BBB/Baa | | | | 4 | % |
BB/Ba | | | | 39 | |
B | | | | 47 | |
CCC/Caa | | | | 8 | |
N/R | | | | 2 | |
| | 1 | | For financial reporting purposes, credit quality ratings shown above reflect the highest rating assigned by either Standard & Poor’s (“S&P”) or Moody’s Investors Service if ratings differ. These rating agencies are independent, nationally recognized statistical rating organizations and are widely used. Investment grade ratings are credit ratings of BBB/Baa or higher. Below investment grade ratings are credit ratings of BB/Ba or lower. Investments designated N/R are not rated by either rating agency. Unrated investments do not necessarily indicate low credit quality. Credit quality ratings are subject to change. |
| | 2 | | Total Investments exclude short-term securities. |
| | | | | | |
| 12 | | BLACKROCK SERIES FUND, INC. | | DECEMBER 31, 2015 | | |
| | |
| | | BlackRock High Yield Portfolio |
|
| Total Return Based on a $10,000 Investment |
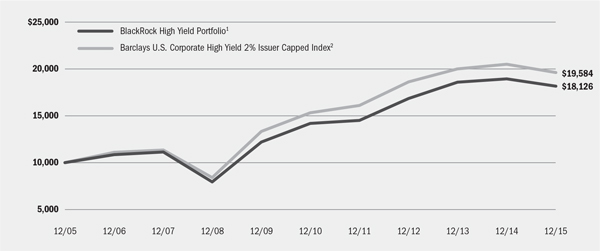
| | 1 | Assuming transaction costs and other operating expenses, including investment advisory fees, if any. Does not include insurance-related fees and expenses. The Fund invests primarily in non-investment grade bonds with maturities of ten years or less. The Fund’s total returns prior to October 1, 2011 are the returns of the Fund when it followed a different investment objective and different investment strategies under the name “BlackRock High Income Fund.” |
| | 2 | This unmanaged index is comprised of issues that meet the following criteria: at least $150 million par value outstanding; maximum credit rating of Ba1; at least one year to maturity; and no issuer represents more than 2% of the index. |
| | | | | | | | | | | | |
| Performance Summary for the Period Ended December 31, 2015 |
| | | | | | | | | Average Annual Total Returns4 |
| | | Standardized
30-Day Yield3 | | Unsubsidized
30-Day Yield3 | | 6-Month
Total Returns4 | | 1 Year | | 5 Years | | 10 Years |
BlackRock High Yield Portfolio | | 6.54% | | 6.16% | | (6.87)% | | (4.65)% | | 4.90% | | 6.13% |
Barclays U.S. Corporate High Yield 2% Issuer Capped Index | | — | | — | | (6.79) | | (4.43) | | 5.03 | | 6.95 |
| | 3 | | The standardized 30-day yield includes the effects of any waivers and/or reimbursements. The unsubsidized 30-day yield excludes the effects of any waivers and/or reimbursements. |
| | 4 | | Cumulative and average annual total returns are based on changes in net asset value for the periods shown and assume reinvestment of all distributions at net asset value on the ex-dividend/payable date. Insurance related fees and expenses are not reflected in these returns. |
| | | | Past performance is not indicative of future results. Performance results do not reflect the deduction of taxes that a shareholder would pay on Fund distributions or the redemption of Fund shares. |
| | | | | | | | | | | | | | |
| Expense Example |
| | | Actual | | Hypothetical6 | | |
| | | Beginning
Account Value
July 1, 2015 | | Ending
Account Value
December 31, 2015 | | Expenses
Paid During
the Period5 | | Beginning
Account Value
July 1, 2015 | | Ending Account Value
December 31, 2015 | | Expenses
Paid During
the Period5 | | Annualized
Expense
Ratio |
BlackRock High Yield Portfolio | | $1,000.00 | | $931.30 | | $2.43 | | $1,000.00 | | $1,022.68 | | $2.55 | | 0.50% |
| | 5 | | Expenses are equal to the annualized expense ratio, multiplied by the average account value over the period, multiplied by 184/365 (to reflect the one-half year period shown). |
| | 6 | | Hypothetical 5% annual return before expenses is calculated by prorating the number of days in the most recent fiscal half year divided by 365. |
| | | | See “Disclosure of Expenses” on page 20 for further information on how expenses were calculated. |
| | | | | | |
| | | BLACKROCK SERIES FUND, INC. | | DECEMBER 31, 2015 | | 13 |
| | | | |
| Fund Summary as of December 31, 2015 | | | BlackRock Large Cap Core Portfolio | |
BlackRock Large Cap Core Portfolio’s (the “Fund”) investment objective is to seek long-term growth of capital and income, and moderate current income.
|
| Portfolio Management Commentary |
How did the Fund perform?
| • | | For the 12-month period ended December 31, 2015, the Fund underperformed its benchmark, the Russell 1000® Index. |
What factors influenced performance?
| • | | Information technology (“IT”) was the prime detractor from relative performance, largely owing to the Fund’s tilt toward enterprise hardware and compute-intensive semiconductor companies. Key names underperformed as the magnitude of PC unit weakness was worse than anticipated, pressuring earnings and forward guidance of several holdings with PC exposure. Micron Technology Inc. and Western Digital Corp. were the leading individual detractors within the Fund for the 12-month period. |
| • | | Elsewhere in the Fund, financials detracted on weakness in consumer finance holdings. Zero exposure to internet & catalog retail name Amazon.com Inc. also hindered relative returns as the stock more than doubled in the period. |
| • | | Relative performance was supported by strong selection in the health care sector. The Fund’s tilt toward managed care proved especially advantageous as the companies consistently beat earnings expectations and raised guidance on strong underlying fundamentals, while further benefiting from the summer’s favorable Supreme Court ruling concerning insurance subsidies under the Affordable Care Act and, more critically, the broader consolidation trend in the industry. Elsewhere in the sector, a positon in non-benchmark holding Teva Pharmaceutical Industries Ltd. added considerable value. |
| • | | Selection benefited in consumer staples as well, led by beverage holdings. Dr. Pepper Snapple Group Inc. contributed on a higher earnings outlook for 2015 due to improved carbonated soft drink pricing in the United States. Molson Coors Brewing Co. outperformed on the announcement AB InBev will make an offer to acquire SABMiller. |
| • | | Energy was another source of strength, attributable to both the Fund’s underweight to the benchmark’s worst-performing names concentrated in exploration & production, and overweight to refining & marketing. The benefit of this positioning more than offset weakness resulting from the Fund’s overweight in energy services companies, which struggled amid the steep decline in the price of oil. |
Describe recent portfolio activity.
| • | | Due to a combination of portfolio trading activity and market movement during the 12-month period, the Fund’s weighting in the consumer discretionary sector substantially increased, with additions in health care and consumer staples as well. The largest reduction was in the industrials sector. Financials, energy and IT also saw declines. |
Describe portfolio positioning at period end.
| • | | Relative to the Russell 1000® Index, the Fund ended the period with its largest sector overweights in IT, consumer discretionary and health care. Industrials, telecommunication services and utilities were the most significant underweights. |
The views expressed reflect the opinions of BlackRock as of the date of this report and are subject to change based on changes in market, economic or other conditions. These views are not intended to be a forecast of future events and are no guarantee of future results.
| | | | | |
| Sector Allocation | | Percent of
Net Assets |
Information Technology | | | | 24 | % |
Health Care | | | | 18 | |
Financials | | | | 18 | |
Consumer Discretionary | | | | 17 | |
Consumer Staples | | | | 8 | |
Industrials | | | | 6 | |
Energy | | | | 5 | |
Materials | | | | 2 | |
Utilities | | | | 1 | |
Short-Term Securities | | | | 5 | |
Liabilities in Excess of Other Assets. | | | | (4 | ) |
For Fund compliance purposes, the Fund’s sector classifications refer to any one or more of the sector sub-classifications used by one or more widely recognized market indexes or ratings group indexes, and/or as defined by the investment advisor. These definitions may not apply for purposes of this report, which may combine sector sub classifications for reporting ease.
| | | | | | |
| 14 | | BLACKROCK SERIES FUND, INC. | | DECEMBER 31, 2015 | | |
| | | | |
| Fund Summary as of December 31, 2015 | | | BlackRock Large Cap Core Portfolio | |
|
| Total Return Based on a $10,000 Investment |
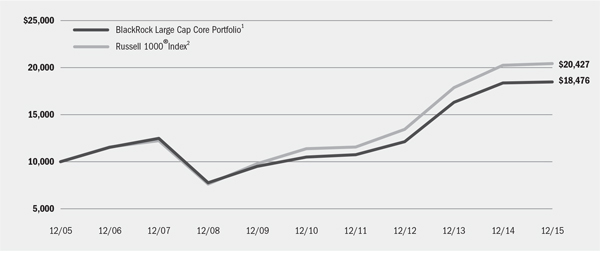
| | 1 | Assuming transaction costs and other operating expenses, including investment advisory fees, if any. Does not include insurance-related fees and expenses. Under normal circumstances, the Fund invests at least 80% of its assets in a diversified portfolio of equity securities, primarily common stocks, of large capitalization companies included at the time of purchase in the Russell 1000® Index. |
| | 2 | The index measures the performance of the large cap segment of the U.S. equity universe. It is a subset of the Russell 3000® Index and includes approximately 1,000 of the largest securities based on a combination of their market capitalization and current index membership. The index represents approximately 92% of the total market capitalization of the Russell 3000® Index. |
| | | | | | | | |
| Performance Summary for the Period Ended December 31, 2015 |
| | | | | Average Annual Total Returns3 |
| | | 6-Month
Total Returns3 | | 1 Year | | 5 Years | | 10 Years |
BlackRock Large Cap Core Portfolio. | | (0.14)% | | 0.60% | | 12.05% | | 6.33% |
Russell 1000® Index | | (0.78) | | 0.92 | | 12.44 | | 7.40 |
| | 3 | | Cumulative and average annual total returns are based on changes in net asset value for the periods shown and assume reinvestment of all distributions at net asset value on the ex-dividend date. Insurance related fees and expenses are not reflected in these returns. |
| | | | Past performance is not indicative of future results. Performance results do not reflect the deduction of taxes that a shareholder would pay on Fund distributions or the redemption of Fund shares. |
| | | | | | | | | | | | | | |
| Expense Example |
| | | Actual | | Hypothetical5 | | |
| | | Beginning
Account Value
July 1, 2015 | | Ending Account Value
December 31, 2015 | | Expenses
Paid During
the Period4 | | Beginning
Account Value
July 1, 2015 | | Ending
Account Value
December 31, 2015 | | Expenses
Paid During
the Period4 | | Annualized
Expense
Ratio |
BlackRock Large Cap Core Portfolio | | $1,000.00 | | $998.60 | | $2.52 | | $1,000.00 | | $1,022.68 | | $2.55 | | 0.50% |
| | 4 | | Expenses are equal to the annualized expense ratio, multiplied by the average account value over the period, multiplied by 184/365 (to reflect the one-half year period shown). |
| | 5 | | Hypothetical 5% annual return before expenses is calculated by prorating the number of days in the most recent fiscal half year divided by 365. |
| | | | See “Disclosure of Expenses” on page 20 for further information on how expenses were calculated. |
| | | | | | |
| | | BLACKROCK SERIES FUND, INC. | | DECEMBER 31, 2015 | | 15 |
| | | | |
| Fund Summary as of December 31, 2015 | | | BlackRock Total Return Portfolio | |
BlackRock Total Return Portfolio’s (the “Fund”) investment objective is to seek to maximize total return, consistent with income generation and prudent investment management.
|
| Portfolio Management Commentary |
How did the Fund perform?
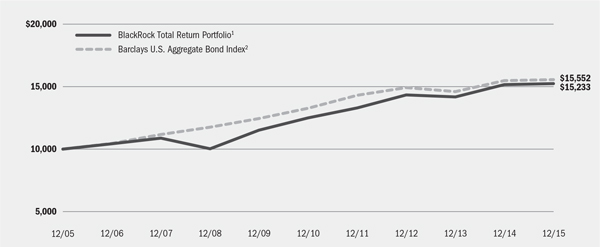
| • | | For the 12-month period ended December 31, 2015, the Fund returned 0.29%, underperforming its benchmark, the Barclays U.S. Aggregate Bond Index, which returned 0.55%. |
What factors influenced performance?
| • | | The most significant detractor from performance relative to the benchmark was the Fund’s stance with respect to overall portfolio duration (and corresponding interest rate sensitivity), together with positioning along the yield curve. An allocation to Treasury Inflation Protected Securities also hindered relative performance, as inflation expectations were undermined during the period by a sharp decline in oil prices and slowing China growth. |
| • | | Positive performance for the year was driven by allocations to U.S. securitized assets including commercial mortgage-backed securities, asset-backed securities and non-agency residential mortgage-backed securities. In addition, within U.S. investment grade corporates an overweight position in financials and underweight position in industrials added to relative return. |
Describe recent portfolio activity.
| • | | Throughout the year, the Fund’s overall duration and interest rate sensitivity were tactically managed, with duration modestly underweight for much of the 12 months. Additionally, the Fund was modestly underweight in U.S. investment grade credit given the sector’s low all-in yields. |
| | However, this allocation was increased in May as global yields rose, with a focus on longer-maturity bonds within industrials. Exposure to high yield corporates was tactically traded during the period, and was modestly increased entering the fourth quarter. The Fund maintained an overweight position in securitized assets based on their relative value versus other sectors that trade at a yield spread versus U.S. Treasuries, as well as a strong supply/demand backdrop. However, the Fund’s allocation to securitized assets was trimmed on increasing macro volatility and diminishing relative value versus other spread sectors. |
| • | | The Fund held derivatives (i.e. financial futures contracts and forward foreign exchange contracts) during the period as a part of its investment strategy. Derivatives are used by the investment advisor as a means to manage risk and/or take outright views on interest rates, credit risk and/or foreign exchange positions in the Fund. For the period, the use of derivatives had a positive impact on the Fund’s performance. |
Describe portfolio positioning at period end.
| • | | The Fund was defensively positioned with a bias toward higher quality. The Fund was underweight in duration and had below benchmark exposure to the shorter end of the U.S. yield curve. Within investment grade credit, the Fund had a cautious tilt toward financials, while exposure to high yield corporate bonds was modest. The Fund remained overweight in securitized assets and municipal bonds. With respect to emerging markets, the Fund was positioned to take advantage of income opportunities created by the significant moves in currency and country valuations seen in 2015. |
The views expressed reflect the opinions of BlackRock as of the date of this report and are subject to change based on changes in market, economic or other conditions. These views are not intended to be a forecast of future events and are no guarantee of future results.
| | | | | |
| Portfolio Composition | | Percent of
Total Investments1 |
U.S. Government Sponsored Agency Securities | | | | 37 | % |
Corporate Bonds | | | | 24 | |
U.S. Treasury Obligations | | | | 20 | |
Non-Agency Mortgage-Backed Securities | | | | 8 | |
Asset-Backed Securities | | | | 7 | |
Foreign Government Obligations | | | | 2 | |
Taxable Municipal Bonds | | | | 2 | |
| | 1 | | Total Investments exclude short-term securities, options purchased, borrowed bonds and TBA sale commitments. |
| | | | | |
| Credit Quality Allocation2 | | Percent of
Total Investments3 |
AAA/Aaa4 | | | | 60 | % |
AA/Aa | | | | 7 | |
A | | | | 12 | |
BBB/Baa | | | | 12 | |
BB/Ba | | | | 2 | |
B | | | | 1 | |
CCC/Caa | | | | 1 | |
CC/Ca | | | | 1 | |
N/R | | | | 4 | |
| | 2 | | For financial reporting purposes, credit quality ratings shown above reflect the highest rating assigned by either Standard & Poor’s (“S&P”) or Moody’s Investors Service (“Moody’s”). These rating agencies are independent, nationally recognized statistical rating organizations and are widely used. Investment grade ratings are credit ratings of BBB/Baa or higher. Below investment grade ratings are credit ratings of BB/Ba or lower. Investments designated N/R are not rated by either rating agency. Unrated investments do not necessarily indicate low credit quality. Credit quality ratings are subject to change. |
| | 3 | | Total Investments exclude short-term securities, options purchased, borrowed bonds and TBA sale commitments. |
| | 4 | | The investment advisor evaluates the credit quality of unrated investments based upon certain factors including, but not limited to, credit ratings for similar investments and financial analysis of sectors, individual investments and/or issuers. Using this approach, the investment advisor has deemed unrated U.S. Government Sponsored Agency Securities and U.S. Treasury Obligations to be of similar credit quality as investments rated AAA/Aaa. |
| | | | | | |
| 16 | | BLACKROCK SERIES FUND, INC. | | DECEMBER 31, 2015 | | |
| | | | |
| | | | BlackRock Total Return Portfolio | |
|
| Total Return Based on a $10,000 Investment |
| | 1 | Assuming transaction costs and other operating expenses, including investment advisory fees, if any. Does not include insurance-related fees and expenses. The Fund, under normal circumstances, will invest at least 80%, and typically invests 90% or more, of its assets in fixed-income securities such as corporate bonds and notes, mortgage-backed securities, asset-backed securities, convertible securities, preferred securities and government obligations. |
| | 2 | A widely recognized unmanaged market-weighted index, comprised of investment-grade corporate bonds rated BBB or better, mortgages and U.S. Treasury and U.S. Government agency issues with at least one year to maturity. |
|
| Performance Summary for the Period Ended December 31, 2015 |
| | | | | | | | | | | | |
| | | | | | | | | Average Annual Total Returns4 |
| | | Standardized
30-Day Yield3 | | Unsubsidized
30-Day Yield3 | | 6-Month
Total Returns4 | | 1 Year | | 5 Years | | 10 Years |
BlackRock Total Return Portfolio | | 2.54% | | 2.10% | | 0.13% | | 0.29% | | 3.99% | | 4.30% |
Barclays U.S. Aggregate Bond Index | | — | | — | | 0.65 | | 0.55 | | 3.25 | | 4.51 |
| | 3 | | The standardized 30-day yield includes the effects of any waivers and/or reimbursements. The unsubsidized 30-day yield excludes the effects of any waivers and/or reimbursements. |
| | 4 | | Cumulative and average annual total returns are based on changes in net asset value for the periods shown and assume reinvestment of all distributions at net asset value on the ex-dividend/payable date. Insurance-related fees and expenses are not reflected in these returns. |
Past performance is not indicative of future results. Performance results do not reflect the deduction of taxes that a shareholder would pay on Fund distributions or the redemption of Fund shares.
| | | | | | | | | | | | | | | | | | | | |
| | | Actual | | | | Hypothetical7 |
| | | | | | | Including
Interest Expense | | Excluding
Interest Expense | | | | | | Including
Interest Expense | | Excluding
Interest Expense |
| | | Beginning
Account Value
July 1, 2015 | | Ending
Account Value
December 31, 2015 | | Expenses
Paid During
the Period5 | | Expenses
Paid During
the Period6 | | | | Beginning
Account Value
July 1, 2015 | | Ending
Account Value
December 31,
2015 | | Expenses
Paid During
the Period5 | | Ending
Account Value
December 31,
2015 | | Expenses
Paid During
the Period6 |
BlackRock Total Return Portfolio | | $1,000.00 | | $1,001.30 | | $2.82 | | $2.52 | | | | $1,000.00 | | $1,022.38 | | $2.85 | | $1,022.68 | | $2.55 |
| | 5 | | Expenses are equal to the annualized expense ratio (0.56%), multiplied by the average account value over the period, multiplied by 184/365 (to reflect the one-half year period shown). |
| | 6 | | Expenses are equal to the annualized expense ratio (0.50%), multiplied by the average account value over the period, multiplied by 184/365 (to reflect the one-half year period shown). |
| | 7 | | Hypothetical 5% annual return before expenses is calculated by prorating the number of days in the most recent fiscal half year divided by 365. |
See “Disclosure of Expenses” on page 20 for further information on how expenses were calculated.
| | | | | | |
| | | BLACKROCK SERIES FUND, INC. | | DECEMBER 31, 2015 | | 17 |
| | | | |
| Fund Summary as of December 31, 2015 | | | BlackRock U.S. Government Bond Portfolio | |
BlackRock U.S. Government Bond Portfolio’s (the “Fund”) investment objective is to seek to maximize total return, consistent with income generation and prudent investment management.
|
| Portfolio Management Commentary |
How did the Fund perform?
| • | | For the 12-month period ended December 31, 2015, the Series returned 0.54%, underperforming its benchmark, the Barclays U.S. Government/Mortgage Index, which returned 1.13%. |
What factors influenced performance?
| • | | The principal detractors from the Fund’s performance versus the benchmark included an allocation to Treasury Inflation Protected Securities (“TIPS”), as inflation expectations remained subdued in view of slowing China growth and a sharp decline in energy prices. An underweight in nominal U.S. Treasuries also hindered results. Additionally, the Fund’s overweight in 15-year relative to 30-year agency mortgage-backed securities (“MBS”) further detracted from performance. |
| • | | Positive contributors to performance during the 12-month period include allocations with respect to non-U.S. dollar currencies, including underweights in the euro, Australian dollar, and Swiss franc. Allocations to commercial mortgage-backed securities (“CMBS”), including interest only securities, performed well based on strong demand from yield-oriented investors during the period. Holdings of collateralized loan obligations also added to results. |
Describe recent portfolio activity.
| • | | During the 12-month period, the Fund reduced its underweight in U.S. Treasuries, and increased its overweight in TIPS. The Fund also increased its overweight in CMBS. The Fund moved from an underweight position in 15-year versus 30-year pass-through MBS to a slight overweight in 15-year MBS relative to the benchmark. |
| • | | The Fund uses derivatives as a part of its investment strategy. Derivatives are used by the investment advisor as a means to manage risk and/or gain or reduce exposure to interest rates, credit risk and/or foreign exchange positions in the Fund. During the period, the Fund’s use of derivatives did not have a material impact on performance. |
Describe portfolio positioning at period end.
| • | | The Fund finished the 12-month period slightly overweight in duration (and corresponding interest rate sensitivity). The Fund was underweight in MBS relative to the benchmark. The majority of the Fund’s MBS allocation was to pools of conventional mortgages backed by Fannie Mae and Freddie Mac. |
| • | | As of period-end, the Fund maintained an overweight position in the U.S. dollar relative to the euro, Australian dollar, and Swiss franc. The Fund was also overweight in TIPS relative to nominal U.S. Treasuries. |
The views expressed reflect the opinions of BlackRock as of the date of this report and are subject to change based on changes in market, economic or other conditions. These views are not intended to be a forecast of future events and are no guarantee of future results.
| | | | | |
| Portfolio Composition | | Percent of
Total Investments1 |
U.S. Government Sponsored Agency Securities | | | | 59 | % |
U.S. Treasury Obligations | | | | 33 | |
Non-Agency Mortgage-Backed Securities | | | | 4 | |
Corporate Bonds | | | | 2 | |
Asset-Backed Securities | | | | 2 | |
| | 1 | | Total Investments exclude short-term securities, options purchased, options written, borrowed bonds and TBA sale commitments. |
| | | | | | |
| 18 | | BLACKROCK SERIES FUND, INC. | | DECEMBER 31, 2015 | | |
| | |
| | | BlackRock U.S. Government Bond Portfolio |
|
| Total Return Based on a $10,000 Investment |
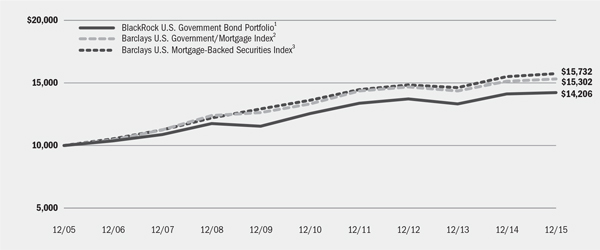
| | 1 | Assuming transaction costs and other operating expenses, including investment advisory fees, if any. Does not include insurance-related fees and expenses. The Fund, under normal circumstances, will invest at least 80% of its assets in bonds that are issued or guaranteed by the U.S. government and its agencies. The Fund’s total returns prior to October 1, 2011 are the returns of the Fund when it followed a different investment objective and different investment strategies under the name “BlackRock Government Income Portfolio”. |
| | 2 | This index measures debt issued by the U.S. Government, and its agencies, as well as mortgage-backed pass-through securities of Ginnie Mae, Fannie Mae and Freddie Mac. |
| | 3 | This unmanaged index includes the mortgage-backed pass-through securities of Ginnie Mae, Fannie Mae and Freddie Mac that meet certain maturity and liquidity criteria. |
| | | | | | | | | | | | |
| Performance Summary for the Period Ended December 31, 2015 |
| | | | | | | | | | | | | | | | | | | | | | | | | | | | | | |
| | | | | | | | | Average Annual Total Returns5 |
| | | Standardized
30-Day Yield4 | | Unsubsidized
30-Day Yield4 | | 6-Month
Total Returns5 | | 1 Year | | 5 Years | | 10 Years |
BlackRock U.S. Government Bond Portfolio | | | | 2.02 | % | | | | 1.78 | % | | | | 0.65 | % | | | | 0.54 | % | | | | 2.46 | % | | | | 3.57 | % |
Barclays U.S. Government/Mortgage Index | | | | — | | | | | — | | | | | 0.96 | | | | | 1.13 | | | | | 2.83 | | | | | 4.35 | |
Barclays U.S. Mortgage-Backed Securities Index | | | | — | | | | | — | | | | | 1.20 | | | | | 1.51 | | | | | 2.96 | | | | | 4.64 | |
| | 4 | | The standardized 30-day yield includes the effects of any waivers and/or reimbursements. The unsubsidized 30-day yield excludes the effects of any waivers and/or reimbursements. |
| | 5 | | Cumulative and average annual total returns are based on changes in net asset value for the periods shown and assume reinvestment of all distributions at net asset value on the ex-dividend/payable date. Insurance-related fees and expenses are not reflected in these returns. |
| | | | Past performance is not indicative of future results. Performance results do not reflect the deduction of taxes that a shareholder would pay on Fund distributions or the redemption of Fund shares. |
| | | | | | | | | | | | | | | | | | | | | | | | | | | | | | | | | | | | | | | | | | | | | | | |
| | | Actual | | | | Hypothetical8 |
| | | | | | | Including
Interest Expense | | Excluding
Interest Expense | | | | | | Including
Interest Expense | | Excluding
Interest Expense |
| | | Beginning
Account Value
July 1, 2015 | | Ending
Account Value
December 31,
2015 | | Expenses
Paid During
the Period6 | | Expenses
Paid During
the Period7 | | | | Beginning
Account Value
July 1, 2015 | | Ending
Account Value
December 31,
2015 | | Expenses
Paid During
the Period6 | | Ending
Account Value
December 31,
2015 | | Expenses
Paid During
the Period7 |
BlackRock U.S. Government Bond Portfolio | | | | $1,000.00 | | �� | | | $1,006.50 | | | | | $2.68 | | | | | $2.53 | | | | | | | $1,000.00 | | | | | $1,022.53 | | | | | $2.70 | | | | | $1,022.68 | | | | | $2.55 | |
| | 6 | | Expenses are equal to the annualized expense ratio (0.53%), multiplied by the average account value over the period, multiplied by 184/365 (to reflect the one-half year period shown). |
| | 7 | | Expenses are equal to the annualized expense ratio (0.50%), multiplied by the average account value over the period, multiplied by 184/365 (to reflect the one-half year period shown). |
| | 8 | | Hypothetical 5% annual return before expenses is calculated by prorating the number of days in the most recent fiscal half year divided by 365. |
See “Disclosure of Expenses” on page 20 for further information on how expenses were calculated.
| | | | | | |
| | | BLACKROCK SERIES FUND, INC. | | DECEMBER 31, 2015 | | 19 |
| | |
| The Benefits and Risks of Leveraging | | |
The Funds may utilize leverage to seek to enhance yield and net asset value per share (“NAV”). However, these objectives cannot be achieved in all interest rate environments.
The Funds may utilize leverage by entering into reverse repurchase agreements.
In general, the concept of leveraging is based on the premise that the financing cost of leverage, which is based on short-term interest rates, is normally lower than the income earned by each Fund on its longer-term portfolio investments purchased with the proceeds from leverage. To the extent that the total assets of each Fund (including the assets obtained from leverage) are invested in higher-yielding portfolio investments, the Fund’s shareholders benefit from the incremental net income.
The interest earned on securities purchased with the proceeds from leverage is distributed to the Funds’ shareholders, and the value of these portfolio holdings is reflected in the Fund’s per share NAV. However, in order to benefit shareholders, the return on assets purchased with leverage proceeds must exceed the ongoing costs associated with the leverage. If interest and other ongoing costs of leverage exceed a Fund’s return on assets purchased with leverage proceeds, income to shareholders is lower than if the Fund had not used leverage.
Furthermore, the value of each Fund’s portfolio investments generally varies inversely with the direction of long-term interest rates, although other factors can also influence the value of portfolio investments. As a result, changes in interest rates can influence each Fund’s NAV positively or negatively in addition to the impact on each Fund’s performance from leverage. Changes in the direction of interest rates are difficult to predict accurately, and there is no assurance that a Fund’s leveraging strategy will be successful.
The use of leverage also generally causes greater changes in each Fund’s NAV and distribution rates than it would in comparable fund that does not use leverage. In a declining market, leverage is likely to cause a greater decline in the NAV of a Fund’s shares than if the Fund were not leveraged. In addition, each Fund may be required to sell portfolio securities at inopportune times or at distressed values in order to comply with regulatory requirements applicable to the use of leverage or as required by the terms of leverage instruments, which may cause the Fund to incur losses. The use of leverage may limit a Fund’s ability to invest in certain types of securities or use certain types of hedging strategies. Each Fund incurs expenses in connection with the use of leverage, all of which are borne by the Fund’s shareholders and may reduce income.
Shareholders of these Funds may incur the following charges: (a) transactional expenses, such as sales charges; and (b) operating expenses, including investment advisory fees, service and distribution fees, including 12b-1 fees, acquired fund fees and expenses, and other Fund expenses. The expense examples on the previous pages (which are based on a hypothetical investment of $1,000 invested on July 1, 2015 and held through December 31, 2015) are intended to assist shareholders both in calculating expenses based on an investment in each Fund and in comparing these expenses with similar costs of investing in other mutual funds.
The expense examples provide information about actual account values and actual expenses. In order to estimate the expenses a shareholder paid during the period covered by this report, shareholders can divide their account value by $1,000 and then multiply the result by the number corresponding to their Fund under the headings entitled “Expenses Paid During the Period.”
The expense examples also provide information about hypothetical account values and hypothetical expenses based on a Fund’s actual expense ratio and an assumed rate of return of 5% per year before expenses. In order to assist shareholders in comparing the ongoing expenses of investing in these Funds and other funds, compare the 5% hypothetical example with the 5% hypothetical examples that appear in shareholder reports of other funds.
The expenses shown in the expense examples are intended to highlight shareholders’ ongoing costs only and do not reflect any transactional expenses, such as sales charges, if any. Therefore, the hypothetical examples are useful in comparing ongoing expenses only, and will not help shareholders determine the relative total expenses of owning different funds. If these transactional expenses were included, shareholder expenses would have been higher.
| | | | | | |
| 20 | | BLACKROCK SERIES FUND, INC. | | DECEMBER 31, 2015 | | |
| | |
| Derivative Financial Instruments | | |
The Funds may invest in various derivative financial instruments. Derivative financial instruments are used to obtain exposure to a security, index and/or market without owning or taking physical custody of securities or to manage market, equity, credit, interest rate, foreign currency exchange rate, commodity and/or other risks. Derivative financial instruments may give rise to a form of economic leverage. Derivative financial instruments also involve risks, including the imperfect correlation between the value of a derivative financial instrument and the underlying asset, possible default of the counterparty to the transaction or illiquidity of the derivative
financial instrument. The Funds’ ability to use a derivative financial instrument successfully depends on the investment advisor’s ability to predict pertinent market movements accurately, which cannot be assured. The use of derivative financial instruments may result in losses greater than if they had not been used, may limit the amount of appreciation a Fund can realize on an investment and/or may result in lower distributions paid to shareholders. The Funds’ investments in these instruments are discussed in detail in the Notes to Financial Statements.
| | | | | | |
| | | BLACKROCK SERIES FUND, INC. | | DECEMBER 31, 2015 | | 21 |
| | | | |
| Schedule of Investments December 31, 2015 | | | BlackRock Balanced Capital Portfolio | |
| | | (Percentages shown are based on Net Assets) | |
| | | | | | | | | | | | |
| Asset-Backed Securities | | | | | Par
(000) | | | Value | |
ACAS CLO Ltd., Series 2012-1AR, Class BR, 2.64%, 9/20/23 (a)(b) | | | USD | | | | 250 | | | $ | 248,712 | |
ACE Securities Corp. Home Equity Loan Trust, Series 2006-CW1, Class A2D, 0.68%, 7/25/36 (b) | | | | | | | 520 | | | | 289,591 | |
Anchorage Capital CLO 6 Ltd., Series 2015-6A, Class B, 2.37%, 4/15/27 (a)(b) | | | | | | | 250 | | | | 243,425 | |
Anchorage Capital CLO Ltd., Series 2013-1A, Class A2A, 2.04%, 7/13/25 (a)(b) | | | | | | | 250 | | | | 242,607 | |
Apidos CLO XII, Series 2013-12A, Class A, 1.42%, 4/15/25 (a)(b) | | | | | | | 500 | | | | 491,000 | |
Argent Mortgage Loan Trust, Series 2005-W1, Class A2, 0.66%, 5/25/35 (b) | | | | | | | 122 | | | | 91,767 | |
B2R Mortgage Trust: | | | | | | | | | | | | |
Series 2015-1, Class A1, 2.52%, 5/15/48 (a) | | | | | | | 98 | | | | 95,671 | |
Series 2015-2, Class A, 3.34%, 11/15/48 (a) | | | | | | | 100 | | | | 99,507 | |
Babson CLO Ltd., Series 2013-IA, Class A, 1.42%, 4/20/25 (a)(b) | | | | | | | 250 | | | | 244,843 | |
Battalion CLO IV Ltd., Series 2013-4A, Class A1, 1.72%, 10/22/25 (a)(b) | | | | | | | 250 | | | | 246,806 | |
Bayview Opportunity Master Fund IIIA Trust, Series 2014-16RP, Class A, 3.84%, 11/28/29 (a)(c) | | | | | | | 78 | | | | 77,008 | |
Bayview Opportunity Master Fund IIIB RPL Trust, Series 2015-3, Class A1, 3.62%, 4/28/30 (a)(c) | | | | | | | 46 | | | | 45,851 | |
BCMSC Trust: | | | | | | | | | | | | |
Series 2000-A, Class A2, 7.58%, 6/15/30 (b) | | | | | | | 53 | | | | 27,489 | |
Series 2000-A, Class A3, 7.83%, 6/15/30 (b) | | | | | | | 49 | | | | 26,337 | |
Series 2000-A, Class A4, 8.29%, 6/15/30 (b) | | | | | | | 84 | | | | 47,586 | |
Bear Stearns Asset-Backed Securities I Trust: | | | | | | | | | | | | |
Series 2006-HE7, Class 1A2, 0.59%, 9/25/36-1/25/37 (b) | | | | | | | 366 | | | | 301,809 | |
Series 2006-HE9, Class 2A, 0.56%, 11/25/36-3/25/37 (b) | | | | | | | 255 | | | | 206,470 | |
| | | | | | | | | | | | |
| Asset-Backed Securities | | | | | Par (000) | | | Value | |
Bear Stearns Asset-Backed Securities I Trust (continued): | | | | | | | | | | | | |
Series 2007-HE1, Class 21A2, 0.58%, 1/25/37 (b) | | | USD | | | | 78 | | | $ | 70,127 | |
Carlyle Global Market Strategies CLO Ltd., Series 2012-4A, Class A, 1.68%, 1/20/25 (a)(b) | | | | | | | 405 | | | | 403,288 | |
Carrington Mortgage Loan Trust: | | | | | | | | | | | | |
Series 2006-NC5, Class A4, 0.64%, 1/25/37 (b) | | | | | | | 100 | | | | 59,668 | |
Series 2007-FRE1, Class A2, 0.62%, 2/25/37 (b) | | | | | | | 68 | | | | 63,547 | |
CHLUPA Trust, Series 2013-VM, Class A, 3.33%, 8/15/20 (a) | | | | | | | 111 | | | | 110,801 | |
CIFC Funding Ltd.: | | | | | | | | | | | | |
Series 2011-1AR, Class A1R, 1.59%, 1/19/23 (a)(b) | | | | | | | 135 | | | | 134,473 | |
Series 2014-2A, Class A1L, 1.86%, 5/24/26 (a)(b) | | | | | | | 480 | | | | 474,277 | |
Citigroup Mortgage Loan Trust, Series 2006-NC1, Class A2D, 0.67%, 8/25/36 (b) | | | | | | | 90 | | | | 66,234 | |
Citigroup Mortgage Loan Trust, Inc., Series 2007-WFH3, Class A3, 0.67%, 6/25/37 (b) | | | | | | | 30 | | | | 24,692 | |
Conseco Finance Securitizations Corp., Series 2000-4, Class A6, 8.31%, 5/01/32 (b) | | | | | | | 44 | | | | 27,662 | |
Countrywide Asset-Backed Certificates: | | | | | | | | | | | | |
Series 2006-8, Class 2A3, 0.58%, 1/25/46 (b) | | | | | | | 129 | | | | 117,044 | |
Series 2006-S3, Class A4, 6.43%, 1/25/29 (c) | | | | | | | 29 | | | | 28,384 | |
Series 2006-SPS1, Class A, 0.64%, 12/25/25 (b) | | | | | | | 6 | | | | 19,391 | |
CT CDO IV Ltd., Series 2006-4A, Class A1, 0.71%, 10/20/43 (a)(b) | | | | | | | 37 | | | | 36,602 | |
| | | | | | | | | | |
| Portfolio Abbreviations |
ABS | | Asset-Backed Security | | EUR | | Euro | | OTC | | Over-the-counter |
| ADR | | American Depositary Receipts | | EURIBOR | | Euro Interbank Offered Rate | | PCL | | Public Company Limited |
| AGM | | Assurance Guaranty Municipal Corp. | | FKA | | Formerly Known As | | PIK | | Payment-in-kind |
| AKA | | Also Known As | | FTSE | | Financial Times Stock Exchange | | PLN | | Polish Zloty |
| AMBAC | | AMBAC Assurance Corp. | | GBP | | British Pound | | RB | | Revenue Bonds |
| AUD | | Australian Dollar | | GDR | | Global Depositary Receipts | | REIT | | Real Estate Investment Trust |
| BRL | | Brazilian Real | | GO | | General Obligation Bonds | | RUB | | Russian Ruble |
| BZDIOVER | | Overnight Brazil CETIP — | | HUF | | Hungarian Forint | | SAR | | Saudi Arabian Riyal |
| | Interbank Rate | | IDR | | Indonesian Rupiah | | S&P | | Standard & Poor’s |
| CAD | | Canadian Dollar | | JPY | | Japanese Yen | | SGD | | Singapore Dollar |
| CDO | | Collateralized Debt Obligation | | JSC | | Joint Stock Company | | SPDR | | Standard & Poor’s |
| CLO | | Collateralized Loan Obligation | | KRW | | Korean Won | | | | Depositary Receipts |
| CLP | | Chilean Peso | | LIBOR | | London Interbank Offered Rate | | TBA | | To Be Announced |
| COP | | Colombian Peso | | MXIBTIIE | | Mexico Interbank TIIE 28 Day | | TWD | | Taiwan New Dollar |
| CNH | | Chinese Yuan Offshore | | MXN | | Mexican Peso | | USD | | US Dollar |
| CNY | | Chinese Yuan | | MYR | | Malaysian Ringgit | | WIBOR | | Warsaw Interbank Offered Rate |
| ETF | | Exchange-Traded Fund | | NYSE | | New York Stock Exchange | | ZAR | | South African Rand |
See Notes to Financial Statements.
| | | | | | |
| 22 | | BLACKROCK SERIES FUND, INC. | | DECEMBER 31, 2015 | | |
| | | | |
| Schedule of Investments (continued) | | | BlackRock Balanced Capital Portfolio | |
| | | | |
| | | | | | | | | | | | |
| Asset-Backed Securities | | | | | Par (000) | | | Value | |
| |
CWHEQ Home Equity Loan Trust: | | | | | | | | | | | | |
Series 2006-S5, Class A4, 5.84%, 6/25/35 | | | USD | | | | 35 | | | $ | 34,444 | |
Series 2006-S5, Class A5, 6.16%, 6/25/35 | | | | | | | 21 | | | | 19,283 | |
Series 2007-S1, Class A3, 5.81%, 11/25/36 (b) | | | | | | | 33 | | | | 32,341 | |
CWHEQ Revolving Home Equity Loan Resecuritization Trust, Series 2006-RES, Class 4Q1B, 0.50%, 12/15/33 (a)(b) | | | | | | | 59 | | | | 49,973 | |
CWHEQ Revolving Home Equity Loan Trust, Series 2005-B, Class 2A, 0.51%, 5/15/35 (b) | | | | | | | 51 | | | | 42,708 | |
DCP Rights LLC, Series 2014-1A, Class A, 5.46%, 10/25/44 (a) | | | | | | | 294 | | | | 290,469 | |
Flatiron CLO Ltd., Series 2011-1A, Class A, 1.87%, 1/15/23 (a)(b) | | | | | | | 370 | | | | 370,277 | |
Ford Credit Floorplan Master Owner Trust, Series 2012-5, Class C, 2.14%, 9/15/19 | | | | | | | 115 | | | | 115,076 | |
Galaxy XX CLO Ltd., Series 2015-20A, Class A, 1.73%, 7/20/27 (a)(b) | | | | | | | 250 | | | | 246,126 | |
GSAMP Trust, Series 2007-H1, Class A1B, 0.62%, 1/25/47 (b) | | | | | | | 37 | | | | 24,002 | |
GT Loan Financing I Ltd., Series 2013-1A, Class A, 1.59%, 10/28/24 (a)(b) | | | | | | | 280 | | | | 274,316 | |
Highbridge Loan Management Ltd., Series 2012-1AR, Class A2R, 2.53%, 9/20/22 (a)(b) | | | | | | | 250 | | | | 249,906 | |
Home Equity Mortgage Trust, Series 2006-2, Class 1A1, 5.37%, 7/25/36 | | | | | | | 232 | | | | 102,612 | |
Home Loan Mortgage Loan Trust, Series 2005-1, Class A3, 0.69%, 4/15/36 (b) | | | | | | | 65 | | | | 57,267 | |
Invitation Homes Trust, Series 2014-SFR2, Class A, 1.45%, 9/17/31 (a)(b) | | | | | | | 100 | | | | 98,149 | |
KKR Financial CLO Ltd., Series 2013-1A, Class A1, 1.47%, 7/15/25 (a)(b) | | | | | | | 500 | | | | 490,700 | |
Lehman ABS Manufactured Housing Contract Trust: | | | | | | | | | | | | |
Series 2001-B, Class M1, 6.63%, 3/15/28 (b) | | | | | | | 130 | | | | 138,833 | |
Series 2001-B, Class M2, 7.17%, 4/15/40 (b) | | | | | | | 25 | | | | 17,259 | |
Litigation Fee Residual Funding LLC, Series 2015-1, Class A, 3.50%, 10/01/27 (a) | | | | | | | 213 | | | | 212,574 | |
Long Beach Mortgage Loan Trust: | | | | | | | | | | | | |
Series 2006-10, Class 2A4, 0.64%, 11/25/36 (b) | | | | | | | 19 | | | | 8,046 | |
Series 2006-11, Class 1A, 0.58%, 12/25/36 (b) | | | | | | | 149 | | | | 92,437 | |
Series 2006-2, Class 2A3, 0.61%, 3/25/46 (b) | | | | | | | 421 | | | | 168,632 | |
Morgan Stanley ABS Capital I, Inc., Trust, Series 2005-HE1, Class A2MZ, 1.02%, 12/25/34 (b) | | | | | | | 78 | | | | 70,390 | |
Morgan Stanley Mortgage Loan Trust, Series 2007-7AX, Class 1A, 0.64%, 4/25/37 (b) | | | | | | | 437 | | | | 185,322 | |
MSCC Heloc Trust, Series 2007-1, Class A, 0.52%, 12/25/31 (b) | | | | | | | 17 | | | | 16,264 | |
Navient Private Education Loan Trust: | | | | | | | | | | | | |
Series 2014-CTA, Class B, 2.08%, 10/17/44 (a)(b) | | | | | | | 250 | | | | 237,121 | |
Series 2015-AA, Class A3, 2.03%, 11/15/30 (a)(b) | | | | | | | 103 | | | | 99,694 | |
Northwoods Capital IX Ltd., Series 2012-9A, Class A, 1.74%, 1/18/24 (a)(b) | | | | | | | 260 | | | | 257,427 | |
Oakwood Mortgage Investors, Inc., Series 2001-D, Class A4, 6.93%, 9/15/31 (b) | | | | | | | 18 | | | | 15,273 | |
| | | | | | | | | | | | |
| Asset-Backed Securities | | | | | Par (000) | | | Value | |
| |
Octagon Investment Partners XVI Ltd., Series 2013-1A, Class A, 1.44%, 7/17/25 (a)(b) | | | USD | | | | 305 | | | $ | 297,558 | |
OHA Loan Funding Ltd., Series 2013-2A, Class A, 1.65%, 8/23/24 (a)(b) | | | | | | | 285 | | | | 282,908 | |
OneMain Financial Issuance Trust, Series 2014-1A, Class A, 2.43%, 6/18/24 (a) | | | | | | | 325 | | | | 323,879 | |
Option One Mortgage Loan Trust, Series 2007-FXD1, Class 3A4, 5.86%, 1/25/37 (c) | | | | | | | 80 | | | | 74,823 | |
OZLM Funding IV Ltd., Series 2013-4A, Class A1, 1.47%, 7/22/25 (a)(b) | | | | | | | 495 | | | | 486,337 | |
OZLM Funding Ltd., Series 2012-2A, Class A1, 1.80%, 10/30/23 (a)(b) | | | | | | | 435 | | | | 433,985 | |
Pretium Mortgage Credit Partners I LLC, Series 2015-NPL4, Class A1, 4.38%, 11/27/30 (a) | | | | | | | 243 | | | | 241,946 | |
Progress Residential Trust, Series 2015-SFR3, Class D, 4.67%, 11/12/20 (a) | | | | | | | 100 | | | | 99,450 | |
RCO Mortgage LLC, Series 2015-NQM1, Class A, 3.50%, 6/25/23 (a)(b) | | | | | | | 80 | | | | 79,936 | |
RMAT LLC, Series 2015-RPL1, Class A1, 3.97%, 5/26/20 (a)(c) | | | | | | | 95 | | | | 94,213 | |
Santander Drive Auto Receivables Trust: | | | | | | | | | | | | |
Series 2014-S1, Class R, 1.42%, 8/16/18 (a) | | | | | | | 3 | | | | 2,567 | |
Series 2014-S2, Class R, 1.43%, 11/16/18-6/18/19 (a) | | | | | | | 81 | | | | 80,812 | |
Series 2014-S6, Class R, 1.43%, 12/17/19 (a) | | | | | | | 12 | | | | 11,981 | |
SASCO Mortgage Loan Trust, Series 2005-GEL2, Class A, 0.70%, 4/25/35 (b) | | | | | | | 5 | | | | 4,912 | |
Scholar Funding Trust: | | | | | | | | | | | | |
Series 2011-A, Class A, 1.22%, 10/28/43 (a)(b) | | | | | | | 150 | | | | 142,836 | |
Series 2013-A, Class A, 1.07%, 1/30/45 (a)(b) | | | | | | | 475 | | | | 442,629 | |
SLM Private Credit Student Loan Trust: | | | | | | | | | | | | |
Series 2004-B, Class A2, 0.71%, 6/15/21-6/15/23 (b) | | | | | | | 392 | | | | 382,527 | |
Series 2004-B, Class A3, 0.84%, 3/15/24 (b) | | | | | | | 225 | | | | 212,328 | |
Series 2006-C, Class A4, 0.68%, 3/15/23 (b) | | | | | | | 55 | | | | 54,340 | |
SLM Private Education Loan Trust: | | | | | | | | | | | | |
Series 2011-B, Class A3, 2.58%, 6/16/42 (a)(b) | | | | | | | 400 | | | | 413,401 | |
Series 2013-C, Class B, 3.50%, 6/15/44 (a) | | | | | | | 500 | | | | 492,046 | |
SoFi Professional Loan Program LLC, Series 2015-B, Class A2, 2.51%, 9/27/32 (a) | | | | | | | 139 | | | | 136,901 | |
Soundview Home Loan Trust, Series 2005-OPT3, Class A4, 0.72%, 11/25/35 (b) | | | | | | | 57 | | | | 57,156 | |
SpringCastle America Funding LLC, Series 2014-AA, Class B, 4.61%, 10/25/27 (a) | | | | | | | 214 | | | | 214,406 | |
Springleaf Funding Trust, Series 2015-AA, Class B, 3.62%, 11/15/24 (a) | | | | | | | 320 | | | | 316,549 | |
Structured Asset Investment Loan Trust, Series 2004-8, Class M4, 1.92%, 9/25/34 (b) | | | | | | | 65 | | | | 56,521 | |
Structured Asset Securities Corp. Mortgage Pass-Through Certificates, Series 2004-23XS, Class 2A1, 0.72%, 1/25/35 (b) | | | | | | | 114 | | | | 105,265 | |
SWAY Residential Trust, Series 2014-1, Class A, 1.65%, 1/17/20 (a)(b) | | | | | | | 257 | | | | 251,832 | |
Symphony CLO XII Ltd., Series 2013-12A, Class A, 1.59%, 10/15/25 (a)(b) | | | | | | | 380 | | | | 373,168 | |
See Notes to Financial Statements.
| | | | | | |
| | | BLACKROCK SERIES FUND, INC. | | DECEMBER 31, 2015 | | 23 |
| | | | |
| Schedule of Investments (continued) | | | BlackRock Balanced Capital Portfolio | |
| | | | |
| | | | | | | | | | | | |
| Asset-Backed Securities | | | | | Par (000) | | | Value | |
TICP CLO III Ltd., Series 2014-3A, Class B1, 2.67%, 1/20/27 (a)(b) | | | USD | | | | 250 | | | $ | 248,553 | |
U.S. Residential Opportunity Fund Trust, Series 2015-1IV, Class A, 3.72%, 2/27/35 (a) | | | | | | | 79 | | | | 78,111 | |
Venture XIX CLO Ltd., Series 2014-19A, Class A, 1.92%, 1/15/26 (a)(b) | | | | | | | 250 | | | | 248,369 | |
Voya CLO Ltd., Series 2012-2RA, Class BR, 2.27%, 10/15/22 (a)(b) | | | | | | | 250 | | | | 246,807 | |
Wachovia Asset Securitization Issuance II LLC Trust, Series 2007-HE2A, Class A,
0.55%, 7/25/37 (a)(b) | | | | | | | 107 | | | | 95,311 | |
WVUE, Series 2015-1A, Class A, 4.50%, 9/25/20 (a) | | | | | | | 87 | | | | 86,426 | |
Ziggurat CLO I Ltd., Series 2014-1A, Class A1, 1.90%, 10/17/26 (a)(b) | | | | | | | 515 | | | | 512,425 | |
Total Asset-Backed Securities — 3.3% | | | | | | | | | | | 16,362,804 | |
| | | | | | | | | | | | |
| Common Stocks | | | | | Shares | | | | |
Aerospace & Defense — 0.8% | | | | | | | | | | | | |
Raytheon Co. | | | | | | | 30,990 | | | | 3,859,185 | |
Air Freight & Logistics — 0.8% | | | | | | | | | | | | |
FedEx Corp. | | | | | | | 25,640 | | | | 3,820,104 | |
Airlines — 1.3% | | | | | | | | | | | | |
Southwest Airlines Co. | | | | | | | 105,900 | | | | 4,560,054 | |
United Continental Holdings, Inc. (d) | | | | | | | 33,500 | | | | 1,919,550 | |
| | | | | | | | | | | | |
| | | | | | | | | | | | 6,479,604 | |
Auto Components — 1.4% | | | | | | | | | | | | |
Goodyear Tire & Rubber Co. | | | | | | | 55,900 | | | | 1,826,253 | |
Lear Corp. | | | | | | | 41,300 | | | | 5,072,879 | |
| | | | | | | | | | | | |
| | | | | | | | | | | | 6,899,132 | |
Banks — 7.3% | | | | | | | | | | | | |
Bank of America Corp. | | | | | | | 423,515 | | | | 7,127,757 | |
Citigroup, Inc. | | | | | | | 143,293 | | | | 7,415,413 | |
JPMorgan Chase & Co. | | | | | | | 156,990 | | | | 10,366,050 | |
SunTrust Banks, Inc. | | | | | | | 104,650 | | | | 4,483,206 | |
U.S. Bancorp | | | | | | | 169,750 | | | | 7,243,233 | |
| | | | | | | | | | | | |
| | | | | | | | | | | | 36,635,659 | |
Beverages — 1.4% | | | | | | | | | | | | |
Dr. Pepper Snapple Group, Inc. | | | | | | | 47,000 | | | | 4,380,400 | |
Molson Coors Brewing Co., Class B | | | | | | | 28,600 | | | | 2,686,112 | |
| | | | | | | | | | | | |
| | | | | | | | | | | | 7,066,512 | |
Biotechnology — 1.7% | | | | | | | | | | | | |
Amgen, Inc. | | | | | | | 38,050 | | | | 6,176,657 | |
Gilead Sciences, Inc. | | | | | | | 25,000 | | | | 2,529,750 | |
| | | | | | | | | | | | |
| | | | | | | | | | | | 8,706,407 | |
Building Products — 0.3% | | | | | | | | | | | | |
Owens Corning | | | | | | | 34,800 | | | | 1,636,644 | |
Capital Markets — 1.1% | | | | | | | | | | | | |
Goldman Sachs Group, Inc. | | | | | | | 29,750 | | | | 5,361,843 | |
Chemicals — 0.9% | | | | | | | | | | | | |
Dow Chemical Co. | | | | | | | 41,100 | | | | 2,115,828 | |
Eastman Chemical Co. | | | | | | | 35,480 | | | | 2,395,255 | |
| | | | | | | | | | | | |
| | | | | | | | | | | | 4,511,083 | |
Communications Equipment — 1.8% | | | | | | | | | | | | |
Brocade Communications Systems, Inc. | | | | | | | 211,403 | | | | 1,940,680 | |
Cisco Systems, Inc. | | | | | | | 253,570 | | | | 6,885,693 | |
| | | | | | | | | | | | |
| | | | | | | | | | | | 8,826,373 | |
| | | | | | | | |
| Common Stocks | | Shares | | | Value | |
Consumer Finance — 0.4% | | | | | | | | |
SLM Corp. (d) | | | 289,080 | | | $ | 1,884,802 | |
Containers & Packaging — 0.3% | | | | | | | | |
Packaging Corp. of America | | | 24,675 | | | | 1,555,759 | |
Electronic Equipment, Instruments & Components — 0.4% | | | | | |
CDW Corp. | | | 47,200 | | | | 1,984,288 | |
Energy Equipment & Services — 1.3% | | | | | | | | |
Atwood Oceanics, Inc. (e) | | | 77,800 | | | | 795,894 | |
Schlumberger Ltd. | | | 72,540 | | | | 5,059,665 | |
Weatherford International PLC (d) | | | 80,580 | | | | 676,066 | |
| | | | | | | | |
| | | | | | | | 6,531,625 | |
Food & Staples Retailing — 1.7% | | | | | | | | |
CVS Health Corp. | | | 83,075 | | | | 8,122,243 | |
Kroger Co. | | | 10,020 | | | | 419,137 | |
| | | | | | | | |
| | | | | | | | 8,541,380 | |
Food Products — 0.7% | | | | | | | | |
Pilgrim’s Pride Corp. | | | 25,100 | | | | 554,459 | |
Tyson Foods, Inc., Class A | | | 54,900 | | | | 2,927,817 | |
| | | | | | | | |
| | | | | | | | 3,482,276 | |
Health Care Equipment & Supplies — 0.1% | | | | | | | | |
Medtronic PLC | | | 4,440 | | | | 341,525 | |
Health Care Providers & Services — 7.1% | | | | | | | | |
Aetna, Inc. | | | 64,780 | | | | 7,004,014 | |
Centene Corp. (d) | | | 50,100 | | | | 3,297,081 | |
Cigna Corp. | | | 47,000 | | | | 6,877,510 | |
Express Scripts Holding Co. (d) | | | 11,200 | | | | 978,992 | |
Humana, Inc. | | | 17,100 | | | | 3,052,521 | |
Laboratory Corp. of America Holdings (d) | | | 28,160 | | | | 3,481,702 | |
McKesson Corp. | | | 13,880 | | | | 2,737,552 | |
UnitedHealth Group, Inc. | | | 46,020 | | | | 5,413,793 | |
Universal Health Services, Inc., Class B | | | 23,447 | | | | 2,801,682 | |
| | | | | | | | |
| | | | | | | | 35,644,847 | |
Hotels, Restaurants & Leisure — 1.5% | | | | | | | | |
Carnival Corp. (e) | | | 125,004 | | | | 6,810,218 | |
Las Vegas Sands Corp. | | | 15,400 | | | | 675,136 | |
| | | | | | | | |
| | | | | | | | 7,485,354 | |
Household Durables — 0.8% | | | | | | | | |
DR Horton, Inc. | | | 43,415 | | | | 1,390,582 | |
Lennar Corp., Class A (e) | | | 24,420 | | | | 1,194,382 | |
NVR, Inc. | | | 437 | | | | 717,991 | |
Toll Brothers, Inc. (d) | | | 20,168 | | | | 671,594 | |
| | | | | | | | |
| | | | | | | | 3,974,549 | |
Industrial Conglomerates — 0.2% | | | | | | | | |
3M Co. | | | 7,465 | | | | 1,124,528 | |
Insurance — 2.1% | | | | | | | | |
American International Group, Inc. | | | 112,450 | | | | 6,968,527 | |
Travelers Cos., Inc. | | | 31,175 | | | | 3,518,411 | |
| | | | | | | | |
| | | | | | | | 10,486,938 | |
Internet & Catalog Retail — 0.6% | | | | | | | | |
Priceline Group, Inc. (d) | | | 2,440 | | | | 3,110,878 | |
Internet Software & Services — 3.2% | | | | | | | | |
Alphabet, Inc., Class A (d) | | | 7,280 | | | | 5,663,913 | |
Alphabet, Inc., Class C (d) | | | 7,411 | | | | 5,624,060 | |
Facebook, Inc., Class A (d) | | | 43,500 | | | | 4,552,710 | |
| | | | | | | | |
| | | | | | | | 15,840,683 | |
IT Services — 3.5% | | | | | | | | |
Amdocs Ltd. | | | 46,531 | | | | 2,539,197 | |
See Notes to Financial Statements.
| | | | | | |
| 24 | | BLACKROCK SERIES FUND, INC. | | DECEMBER 31, 2015 | | |
| | | | |
| Schedule of Investments (continued) | | | BlackRock Balanced Capital Portfolio | |
| | | | |
| | | | | | | | |
| Common Stocks | | Shares | | | Value | |
IT Services (continued) | | | | | | | | |
Cognizant Technology Solutions Corp., Class A (d) | | | 80,400 | | | $ | 4,825,608 | |
DST Systems, Inc. | | | 12,286 | | | | 1,401,341 | |
MasterCard, Inc., Class A | | | 65,370 | | | | 6,364,423 | |
Total System Services, Inc. | | | 45,029 | | | | 2,242,444 | |
| | | | | | | | |
| | | | | | | | 17,373,013 | |
Machinery — 0.2% | | | | | | | | |
WABCO Holdings, Inc. (d) | | | 9,920 | | | | 1,014,419 | |
Media — 2.4% | | | | | | | | |
Comcast Corp., Class A | | | 143,800 | | | | 8,114,634 | |
Omnicom Group, Inc. | | | 29,110 | | | | 2,202,463 | |
Viacom, Inc., Class B | | | 37,600 | | | | 1,547,616 | |
| | | | | | | | |
| | | | | | | | 11,864,713 | |
Multi-Utilities — 0.5% | | | | | | | | |
Public Service Enterprise Group, Inc. | | | 65,600 | | | | 2,538,064 | |
Oil, Gas & Consumable Fuels — 1.9% | | | | | | | | |
BP PLC — ADR | | | 92,960 | | | | 2,905,930 | |
Exxon Mobil Corp. | | | 2,440 | | | | 190,198 | |
Hess Corp. | | | 9,162 | | | | 444,174 | |
PBF Energy, Inc., Class A | | | 12,620 | | | | 464,542 | |
Suncor Energy, Inc. | | | 126,150 | | | | 3,254,670 | |
Tesoro Corp. | | | 9,742 | | | | 1,026,515 | |
Valero Energy Corp. | | | 18,800 | | | | 1,329,348 | |
| | | | | | | | |
| | | | | | | | 9,615,377 | |
Paper & Forest Products — 0.3% | | | | | | | | |
Domtar Corp. | | | 41,200 | | | | 1,522,340 | |
Pharmaceuticals — 2.0% | | | | | | | | |
Allergan PLC (d) | | | 6,500 | | | | 2,031,250 | |
Johnson & Johnson | | | 11,200 | | | | 1,150,464 | |
Merck & Co., Inc. | | | 8,186 | | | | 432,385 | |
Pfizer, Inc. | | | 10,260 | | | | 331,193 | |
Teva Pharmaceutical Industries Ltd. — ADR | | | 92,305 | | | | 6,058,900 | |
| | | | | | | | |
| | | | | | | | 10,004,192 | |
Semiconductors & Semiconductor Equipment — 1.1% | | | | | | | | |
Intel Corp. | | | 53,570 | | | | 1,845,487 | |
Micron Technology, Inc. (d) | | | 71,780 | | | | 1,016,405 | |
NVIDIA Corp. | | | 77,400 | | | | 2,551,104 | |
| | | | | | | | |
| | | | | | | | 5,412,996 | |
Software — 2.4% | | | | | | | | |
Activision Blizzard, Inc. | | | 110,380 | | | | 4,272,810 | |
Microsoft Corp. | | | 103,310 | | | | 5,731,639 | |
Oracle Corp. | | | 54,330 | | | | 1,984,675 | |
| | | | | | | | |
| | | | | | | | 11,989,124 | |
Specialty Retail — 3.6% | | | | | | | | |
Home Depot, Inc. | | | 56,800 | | | | 7,511,800 | |
Lowe’s Cos., Inc. | | | 102,000 | | | | 7,756,080 | |
Ross Stores, Inc. | | | 49,796 | | | | 2,679,523 | |
| | | | | | | | |
| | | | | | | | 17,947,403 | |
Technology Hardware, Storage & Peripherals — 2.3% | | | | | | | | |
Apple Inc. | | | 66,820 | | | | 7,033,473 | |
EMC Corp. | | | 37,600 | | | | 965,568 | |
Western Digital Corp. | | | 53,840 | | | | 3,233,092 | |
| | | | | | | | |
| | | | | | | | 11,232,133 | |
Textiles, Apparel & Luxury Goods — 0.1% | | | | | | | | |
Fossil Group, Inc. (d)(e) | | | 14,500 | | | | 530,120 | |
| | | | | | | | | | | | |
| Common Stocks | | | | | Shares | | | Value | |
Tobacco — 1.2% | | | | | | | | | | | | |
Altria Group, Inc. | | | | | | | 105,843 | | | $ | 6,161,121 | |
Total Common Stocks — 60.7% | | | | | | | | | | | 302,996,993 | |
| | | | | | | | | | | | |
| Corporate Bonds | | | | | Par
(000) | | | | |
Aerospace & Defense — 0.2% | | | | | | | | | | | | |
BAE Systems Holdings, Inc.: | | | | | | | | | | | | |
2.85%, 12/15/20 (a) | | | USD | | | | 38 | | | | 37,903 | |
3.85%, 12/15/25 (a) | | | | | | | 24 | | | | 23,759 | |
4.75%, 10/07/44 (a) | | | | | | | 8 | | | | 7,786 | |
Boeing Co.: | | | | | | | | | | | | |
2.20%, 10/30/22 | | | | | | | 12 | | | | 11,583 | |
2.60%, 10/30/25 | | | | | | | 17 | | | | 16,455 | |
Lockheed Martin Corp.: | | | | | | | | | | | | |
3.10%, 1/15/23 | | | | | | | 16 | | | | 15,989 | |
3.55%, 1/15/26 | | | | | | | 43 | | | | 43,151 | |
3.60%, 3/01/35 | | | | | | | 78 | | | | 69,752 | |
4.50%, 5/15/36 | | | | | | | 17 | | | | 17,211 | |
4.07%, 12/15/42 | | | | | | | 50 | | | | 46,271 | |
4.70%, 5/15/46 | | | | | | | 49 | | | | 50,194 | |
Northrop Grumman Corp., 3.85%, 4/15/45 | | | | | | | 74 | | | | 66,495 | |
Raytheon Co., 3.15%, 12/15/24 | | | | | | | 25 | | | | 25,050 | |
United Technologies Corp.: | | | | | | | | | | | | |
1.78%, 5/04/18 (c) | | | | | | | 246 | | | | 243,517 | |
4.15%, 5/15/45 | | | | | | | 65 | | | | 62,106 | |
| | | | | | | | | | | | |
| | | | | | | | | | | | 737,222 | |
Air Freight & Logistics — 0.1% | | | | | | | | | | | | |
FedEx Corp.: | | | | | | | | | | | | |
4.90%, 1/15/34 | | | | | | | 128 | | | | 131,496 | |
3.90%, 2/01/35 | | | | | | | 11 | | | | 10,013 | |
4.10%, 2/01/45 | | | | | | | 55 | | | | 49,010 | |
4.75%, 11/15/45 | | | | | | | 54 | | | | 53,501 | |
| | | | | | | | | | | | |
| | | | | | | | | | | | 244,020 | |
Airlines — 0.1% | | | | | | | | | | | | |
American Airlines Group, Inc., 4.63%, 3/01/20 (a) | | | | | | | 91 | | | | 86,677 | |
American Airlines Pass-Through Trust, Series 2015-1, Class A, 3.38%, 5/01/27 | | | | | | | 231 | | | | 223,135 | |
Southwest Airlines Co.: | | | | | | | | | | | | |
2.75%, 11/06/19 | | | | | | | 45 | | | | 45,349 | |
2.65%, 11/05/20 | | | | | | | 81 | | | | 80,588 | |
Turkish Airlines Pass-Through Trust, Series 2015-1, Class A, 4.20%, 9/15/28 (a) | | | | | | | 64 | | | | 61,913 | |
United Airlines Pass-Through Trust, Series 2014-1, Class B, 4.75%, 10/11/23 | | | | | | | 18 | | | | 18,067 | |
| | | | | | | | | | | | |
| | | | | | | | | | | | 515,729 | |
Auto Components — 0.1% | | | | | | | | | | | | |
BorgWarner, Inc., 3.38%, 3/15/25 | | | | | | | 80 | | | | 75,524 | |
Delphi Automotive PLC, 4.25%, 1/15/26 | | | | | | | 95 | | | | 95,424 | |
Icahn Enterprises LP/Icahn Enterprises Finance Corp.: | | | | | | | | | | | | |
3.50%, 3/15/17 | | | | | | | 48 | | | | 48,240 | |
4.88%, 3/15/19 | | | | | | | 65 | | | | 64,415 | |
6.00%, 8/01/20 | | | | | | | 80 | | | | 80,672 | |
| | | | | | | | | | | | |
| | | | | | | | | | | | 364,275 | |
See Notes to Financial Statements.
| | | | | | |
| | | BLACKROCK SERIES FUND, INC. | | DECEMBER 31, 2015 | | 25 |
| | | | |
| Schedule of Investments (continued) | | | BlackRock Balanced Capital Portfolio | |
| | | | |
| | | | | | | | | | | | |
| Corporate Bonds | | | | | Par
(000) | | | Value | |
Automobiles — 0.0% | | | | | | | | | | | | |
Daimler Finance North America LLC, 2.45%, 5/18/20 (a) | | | USD | | | | 184 | | | $ | 180,467 | |
Banks — 1.4% | | | | | | | | | | | | |
Bank of America Corp.: | | | | | | | | | | | | |
2.25%, 4/21/20 | | | | | | | 492 | | | | 480,126 | |
3.30%, 1/11/23 | | | | | | | 230 | | | | 226,395 | |
4.00%, 1/22/25 | | | | | | | 217 | | | | 212,427 | |
3.95%, 4/21/25 | | | | | | | 186 | | | | 181,121 | |
3.88%, 8/01/25 | | | | | | | 400 | | | | 406,051 | |
4.88%, 4/01/44 | | | | | | | 28 | | | | 28,993 | |
Bank of Nova Scotia: | | | | | | | | | | | | |
1.30%, 7/21/17 | | | | | | | 383 | | | | 381,799 | |
2.80%, 7/21/21 | | | | | | | 318 | | | | 319,748 | |
Barclays PLC: | | | | | | | | | | | | |
2.75%, 11/08/19 | | | | | | | 200 | | | | 199,269 | |
2.88%, 6/08/20 | | | | | | | 200 | | | | 199,580 | |
BB&T Corp., 2.45%, 1/15/20 | | | | | | | 112 | | | | 112,750 | |
Citigroup, Inc.: | | | | | | | | | | | | |
1.80%, 2/05/18 | | | | | | | 205 | | | | 204,215 | |
2.50%, 9/26/18 | | | | | | | 208 | | | | 209,806 | |
2.50%, 7/29/19 | | | | | | | 285 | | | | 284,570 | |
3.50%, 5/15/23 | | | | | | | 126 | | | | 123,885 | |
3.88%, 3/26/25 | | | | | | | 140 | | | | 136,260 | |
Cooperatieve Centrale Raiffeisen-Boerenleenbank BA, 4.38%, 8/04/25 | | | | | | | 250 | | | | 254,263 | |
HSBC Bank Brasil SA - Banco Multiplo, 4.00%, 5/11/16 (a) | | | | | | | 760 | | | | 761,900 | |
HSBC USA, Inc.: | | | | | | | | | | | | |
2.35%, 3/05/20 | | | | | | | 448 | | | | 442,792 | |
2.75%, 8/07/20 | | | | | | | 180 | | | | 180,018 | |
JPMorgan Chase & Co.: | | | | | | | | | | | | |
1.35%, 2/15/17 | | | | | | | 231 | | | | 230,535 | |
2.20%, 10/22/19 | | | | | | | 111 | | | | 110,101 | |
2.75%, 6/23/20 | | | | | | | 29 | | | | 29,129 | |
3.88%, 9/10/24 | | | | | | | 310 | | | | 308,371 | |
3.90%, 7/15/25 | | | | | | | 206 | | | | 212,288 | |
4.25%, 10/01/27 | | | | | | | 105 | | | | 104,749 | |
U.S. Bancorp, 2.95%, 7/15/22 | | | | | | | 208 | | | | 206,802 | |
Wells Fargo & Co.: | | | | | | | | | | | | |
2.60%, 7/22/20 | | | | | | | 138 | | | | 137,646 | |
2.55%, 12/07/20 | | | | | | | 90 | | | | 89,558 | |
3.55%, 9/29/25 | | | | | | | 115 | | | | 116,034 | |
3.90%, 5/01/45 | | | | | | | 161 | | | | 148,459 | |
4.90%, 11/17/45 | | | | | | | 52 | | | | 52,464 | |
| | | | | | | | | | | | |
| | | | | | | | | | | | 7,092,104 | |
Beverages — 0.1% | | | | | | | | | | | | |
Anheuser-Busch InBev Worldwide, Inc., 3.75%, 7/15/42 | | | | | | | 46 | | | | 39,524 | |
Coca-Cola Co., 2.88%, 10/27/25 | | | | | | | 191 | | | | 188,298 | |
Molson Coors Brewing Co., 5.00%, 5/01/42 | | | | | | | 31 | | | | 29,853 | |
| | | | | | | | | | | | |
| | | | | | | | | | | | 257,675 | |
Biotechnology — 0.2% | | | | | | | | | | | | |
Amgen, Inc.: | | | | | | | | | | | | |
2.13%, 5/01/20 | | | | | | | 127 | | | | 125,268 | |
5.65%, 6/15/42 | | | | | | | 97 | | | | 104,962 | |
4.40%, 5/01/45 | | | | | | | 65 | | | | 60,224 | |
Biogen, Inc.: | | | | | | | | | | | | |
2.90%, 9/15/20 | | | | | | | 48 | | | | 47,874 | |
3.63%, 9/15/22 | | | | | | | 82 | | | | 82,908 | |
4.05%, 9/15/25 | | | | | | | 69 | | | | 69,313 | |
5.20%, 9/15/45 | | | | | | | 53 | | | | 53,020 | |
| | | | | | | | | | | | |
| Corporate Bonds | | | | | Par
(000) | | | Value | |
Biotechnology (continued) | | | | | | | | | | | | |
Celgene Corp.: | | | | | | | | | | | | |
2.25%, 5/15/19 | | | USD | | | | 108 | | | $ | 107,051 | |
3.25%, 8/15/22 | | | | | | | 116 | | | | 115,080 | |
Gilead Sciences, Inc.: | | | | | | | | | | | | |
2.35%, 2/01/20 | | | | | | | 25 | | | | 25,017 | |
3.65%, 3/01/26 | | | | | | | 25 | | | | 25,212 | |
4.60%, 9/01/35 | | | | | | | 29 | | | | 29,488 | |
4.50%, 2/01/45 | | | | | | | 60 | | | | 58,690 | |
4.75%, 3/01/46 | | | | | | | 23 | | | | 23,277 | |
| | | | | | | | | | | | |
| | | | | | | | | | | | 927,384 | |
Building Products — 0.1% | | | | | | | | | | | | |
Building Materials Corp. of America, 6.00%, 10/15/25 (a) | | | | | | | 244 | | | | 248,880 | |
Capital Markets — 0.7% | | | | | | | | | | | | |
Bank of New York Mellon Corp.: | | | | | | | | | | | | |
2.10%, 1/15/19 | | | | | | | 172 | | | | 172,799 | |
3.00%, 2/24/25 | | | | | | | 179 | | | | 176,028 | |
Credit Suisse AG, 3.00%, 10/29/21 | | | | | | | 250 | | | | 249,005 | |
Credit Suisse Group Funding Guernsey Ltd., 2.75%, 3/26/20 (a) | | | | | | | 250 | | | | 247,630 | |
Deutsche Bank AG, 1.88%, 2/13/18 | | | | | | | 130 | | | | 128,895 | |
Goldman Sachs Group, Inc.: | | | | | | | | | | | | |
3.63%, 2/07/16 | | | | | | | 109 | | | | 109,276 | |
2.63%, 1/31/19 | | | | | | | 297 | | | | 299,124 | |
2.60%, 4/23/20 | | | | | | | 144 | | | | 142,906 | |
2.75%, 9/15/20 | | | | | | | 71 | | | | 70,953 | |
3.50%, 1/23/25 | | | | | | | 94 | | | | 92,384 | |
3.75%, 5/22/25 | | | | | | | 531 | | | | 534,541 | |
4.25%, 10/21/25 | | | | | | | 32 | | | | 31,755 | |
4.80%, 7/08/44 | | | | | | | 51 | | | | 50,704 | |
4.75%, 10/21/45 | | | | | | | 75 | | | | 74,503 | |
Jefferies Group LLC, 6.50%, 1/20/43 | | | | | | | 30 | | | | 27,739 | |
Morgan Stanley: | | | | | | | | | | | | |
2.80%, 6/16/20 | | | | | | | 243 | | | | 243,773 | |
3.75%, 2/25/23 | | | | | | | 164 | | | | 167,980 | |
3.70%, 10/23/24 | | | | | | | 179 | | | | 179,861 | |
4.00%, 7/23/25 | | | | | | | 251 | | | | 258,473 | |
4.30%, 1/27/45 | | | | | | | 117 | | | | 111,631 | |
| | | | | | | | | | | | |
| | | | | | | | | | | | 3,369,960 | |
Chemicals — 0.1% | | | | | | | | | | | | |
Agrium, Inc., 4.13%, 3/15/35 | | | | | | | 55 | | | | 46,786 | |
CF Industries, Inc.: | | | | | | | | | | | | |
3.45%, 6/01/23 | | | | | | | 55 | | | | 51,193 | |
5.38%, 3/15/44 | | | | | | | 92 | | | | 80,014 | |
Dow Chemical Co.: | | | | | | | | | | | | |
4.38%, 11/15/42 | | | | | | | 32 | | | | 27,869 | |
4.63%, 10/01/44 | | | | | | | 43 | | | | 38,870 | |
Eastman Chemical Co., 4.80%, 9/01/42 | | | | | | | 58 | | | | 53,251 | |
Ecolab, Inc., 2.25%, 1/12/20 | | | | | | | 67 | | | | 66,614 | |
Huntsman International LLC, 5.13%, 11/15/22 (a) | | | | | | | 80 | | | | 72,000 | |
Monsanto Co., 3.60%, 7/15/42 | | | | | | | 87 | | | | 62,950 | |
Sherwin-Williams Co., 4.00%, 12/15/42 | | | | | | | 26 | | | | 24,561 | |
| | | | | | | | | | | | |
| | | | | | | | | | | | 524,108 | |
Commercial Services & Supplies — 0.1% | | | | | | | | | | | | |
Aviation Capital Group Corp., 2.88%, 9/17/18 (a) | | | | | | | 175 | | | | 173,996 | |
Republic Services, Inc., 3.20%, 3/15/25 | | | | | | | 142 | | | | 136,704 | |
Waste Management, Inc.: 3.13%, 3/01/25 | | | | | | | 54 | | | | 52,554 | |
See Notes to Financial Statements.
| | | | | | |
| 26 | | BLACKROCK SERIES FUND, INC. | | DECEMBER 31, 2015 | | |
| | | | |
| Schedule of Investments (continued) | | | BlackRock Balanced Capital Portfolio | |
| | | | |
| | | | | | | | | | | | |
| Corporate Bonds | | | | | Par
(000) | | | Value | |
Commercial Services & Supplies (continued) | | | | | | | | | | | | |
Waste Management, Inc. (continued): | | | | | | | | | | | | |
3.90%, 3/01/35 | | | USD | | | | 62 | | | $ | 57,733 | |
| | | | | | | | | | | | |
| | | | | | | | | | | | 420,987 | |
Communications Equipment — 0.1% | | | | | | | | | | | | |
Harris Corp.: | | | | | | | | | | | | |
2.70%, 4/27/20 | | | | | | | 39 | | | | 38,262 | |
4.85%, 4/27/35 | | | | | | | 95 | | | | 93,476 | |
5.05%, 4/27/45 | | | | | | | 40 | | | | 39,167 | |
Juniper Networks, Inc., 3.30%, 6/15/20 | | | | | | | 79 | | | | 78,657 | |
| | | | | | | | | | | | |
| | | | | | | | | | | | 249,562 | |
Consumer Finance — 0.8% | | | | | | | | | | | | |
Ally Financial, Inc.: | | | | | | | | | | | | |
4.13%, 2/13/22 | | | | | | | 200 | | | | 198,000 | |
5.13%, 9/30/24 | | | | | | | 180 | | | | 184,275 | |
American Express Credit Corp.: | | | | | | | | | | | | |
1.13%, 6/05/17 | | | | | | | 311 | | | | 309,566 | |
2.25%, 8/15/19 | | | | | | | 179 | | | | 179,031 | |
Capital One Financial Corp.: | | | | | | | | | | | | |
4.75%, 7/15/21 | | | | | | | 5 | | | | 5,416 | |
4.20%, 10/29/25 | | | | | | | 109 | | | | 107,621 | |
Capital One N.A., 2.95%, 7/23/21 | | | | | | | 263 | | | | 260,333 | |
Discover Bank, 3.10%, 6/04/20 | | | | | | | 250 | | | | 250,567 | |
Discover Financial Services, 3.75%, 3/04/25 | | | | | | | 59 | | | | 56,658 | |
Ford Motor Credit Co. LLC: | | | | | | | | | | | | |
1.72%, 12/06/17 | | | | | | | 500 | | | | 492,299 | |
2.15%, 1/09/18 | | | | | | | 200 | | | | 199,260 | |
4.25%, 9/20/22 | | | | | | | 213 | | | | 217,907 | |
General Motors Financial Co., Inc.: | | | | | | | | | | | | |
2.75%, 5/15/16 | | | | | | | 211 | | | | 211,617 | |
2.63%, 7/10/17 | | | | | | | 250 | | | | 250,763 | |
4.75%, 8/15/17 | | | | | | | 260 | | | | 269,475 | |
3.10%, 1/15/19 | | | | | | | 43 | | | | 42,938 | |
3.70%, 11/24/20 | | | | | | | 117 | | | | 117,316 | |
3.45%, 4/10/22 | | | | | | | 105 | | | | 100,722 | |
4.00%, 1/15/25 | | | | | | | 180 | | | | 170,776 | |
Synchrony Financial: | | | | | | | | | | | | |
2.60%, 1/15/19 | | | | | | | 90 | | | | 89,677 | |
2.70%, 2/03/20 | | | | | | | 52 | | | | 51,003 | |
4.50%, 7/23/25 | | | | | | | 112 | | | | 111,735 | |
Toyota Motor Credit Corp., 2.75%, 5/17/21 | | | | | | | 185 | | | | 186,997 | |
| | | | | | | | | | | | |
| | | | | | | | | | | | 4,063,952 | |
Containers & Packaging — 0.1% | | | | | | | | | | | | |
Reynolds Group Issuer, Inc., 6.88%, 2/15/21 | | | | | | | 320 | | | | 329,600 | |
Diversified Financial Services — 0.3% | | | | | | | | | | | | |
BP Capital Markets PLC, 2.24%, 5/10/19 | | | | | | | 221 | | | | 221,293 | |
General Electric Capital Corp.: | | | | | | | | | | | | |
3.15%, 9/07/22 | | | | | | | 169 | | | | 172,969 | |
3.10%, 1/09/23 | | | | | | | 231 | | | | 234,468 | |
Intercontinental Exchange, Inc.: | | | | | | | | | | | | |
2.75%, 12/01/20 | | | | | | | 57 | | | | 56,986 | |
3.75%, 12/01/25 | | | | | | | 37 | | | | 37,102 | |
Moody’s Corp., 4.50%, 9/01/22 | | | | | | | 85 | | | | 90,085 | |
Shell International Finance BV: | | | | | | | | | | | | |
2.13%, 5/11/20 | | | | | | | 273 | | | | 268,568 | |
4.13%, 5/11/35 | | | | | | | 245 | | | | 233,859 | |
3.63%, 8/21/42 | | | | | | | 46 | | | | 38,382 | |
Woodside Finance Ltd., 3.65%, 3/05/25 (a) | | | | | | | 35 | | | | 31,000 | |
| | | | | | | | | | | | |
| | | | | | | | | | | 1,384,712 | |
| |
| | | | | | | | | | | | |
| Corporate Bonds | | | | | Par
(000) | | | Value | |
Diversified Telecommunication Services — 0.5% | | | | | | | | | | | | |
AT&T Inc.: | | | | | | | | | | | | |
2.38%, 11/27/18 | | | USD | | | | 91 | | | $ | 91,620 | |
2.30%, 3/11/19 | | | | | | | 115 | | | | 114,944 | |
2.45%, 6/30/20 | | | | | | | 225 | | | | 221,585 | |
3.88%, 8/15/21 | | | | | | | 133 | | | | 137,212 | |
3.00%, 6/30/22 | | | | | | | 223 | | | | 217,652 | |
3.40%, 5/15/25 | | | | | | | 243 | | | | 233,545 | |
4.30%, 12/15/42 | | | | | | | 127 | | | | 108,521 | |
4.75%, 5/15/46 | | | | | | | 54 | | | | 49,442 | |
Intelsat Jackson Holdings SA, 5.50%, 8/01/23 | | | | | | | 80 | | | | 62,800 | |
Level 3 Financing, Inc., 5.38%, 8/15/22 | | | | | | | 120 | | | | 121,800 | |
Verizon Communications, Inc.: | | | | | | | | | | | | |
2.63%, 2/21/20 | | | | | | | 197 | | | | 197,685 | |
3.45%, 3/15/21 | | | | | | | 239 | | | | 244,518 | |
5.05%, 3/15/34 | | | | | | | 60 | | | | 59,779 | |
4.40%, 11/01/34 | | | | | | | 252 | | | | 232,502 | |
3.85%, 11/01/42 | | | | | | | 175 | | | | 143,042 | |
4.86%, 8/21/46 | | | | | | | 138 | | | | 130,648 | |
| | | | | | | | | | | | |
| | | | | | | | | | | | 2,367,295 | |
Electric Utilities — 0.4% | | | | | | | | | | | | |
Alabama Power Co., 2.80%, 4/01/25 | | | | | | | 24 | | | | 23,157 | |
Commonwealth Edison Co., 4.70%, 1/15/44 | | | | | | | 87 | | | | 91,511 | |
Duke Energy Carolinas LLC: | | | | | | | | | | | | |
4.25%, 12/15/41 | | | | | | | 128 | | | | 127,584 | |
3.75%, 6/01/45 | | | | | | | 59 | | | | 54,643 | |
Duke Energy Corp.: | | | | | | | | | | | | |
3.05%, 8/15/22 | | | | | | | 7 | | | | 6,902 | |
3.75%, 4/15/24 | | | | | | | 81 | | | | 82,069 | |
4.80%, 12/15/45 | | | | | | | 75 | | | | 75,772 | |
Duke Energy Florida LLC, 3.85%, 11/15/42 | | | | | | | 59 | | | | 55,201 | |
Entergy Arkansas, Inc., 3.70%, 6/01/24 | | | | | | | 137 | | | | 139,729 | |
Exelon Corp., 2.85%, 6/15/20 | | | | | | | 168 | | | | 167,082 | |
Florida Power & Light Co., 3.80%, 12/15/42 | | | | | | | 46 | | | | 43,559 | |
Georgia Power Co., 3.00%, 4/15/16 | | | | | | | 371 | | | | 373,059 | |
PacifiCorp: | | | | | | | | | | | | |
3.60%, 4/01/24 | | | | | | | 175 | | | | 180,842 | |
3.35%, 7/01/25 | | | | | | | 161 | | | | 162,307 | |
Progress Energy, Inc., 4.88%, 12/01/19 | | | | | | | 20 | | | | 21,443 | |
Public Service Co. of Colorado, 2.50%, 3/15/23 | | | | | | | 110 | | | | 107,170 | |
Puget Sound Energy, Inc., 4.30%, 5/20/45 | | | | | | | 123 | | | | 124,582 | |
Southern California Edison Co., 1.25%, 11/01/17 | | | | | | | 49 | | | | 48,732 | |
Trans-Allegheny Interstate Line Co., 3.85%, 6/01/25 (a) | | | | | | | 182 | | | | 182,013 | |
| | | | | | | | | | | | |
| | | | | | | | | | | | 2,067,357 | |
Electrical Equipment — 0.0% | | | | | | | | | | | | |
Rockwell Automation, Inc., 2.88%, 3/01/25 | | | | | | | 95 | | | | 92,648 | |
Electronic Equipment, Instruments & Components — 0.0% | | | | | | | | | |
CDW LLC/CDW Finance Corp., 5.00%, 9/01/23 | | | | | | | 80 | | | | 81,200 | |
Energy Equipment & Services — 0.0% | | | | | | | | | | | | |
Ensco PLC, 5.75%, 10/01/44 | | | | | | | 22 | | | | 14,502 | |
Schlumberger Holdings Corp., 3.00%, 12/21/20 (a) | | | | | | | 157 | | | | 154,972 | |
Transocean, Inc., 6.80%, 3/15/38 | | | | | | | 30 | | | | 16,163 | |
| | | | | | | | | | | | |
| | | | | | | | | | | 185,637 | |
| |
See Notes to Financial Statements.
| | | | | | |
| | | BLACKROCK SERIES FUND, INC. | | DECEMBER 31, 2015 | | 27 |
| | | | |
| Schedule of Investments (continued) | | | BlackRock Balanced Capital Portfolio | |
| | | | |
| | | | | | | | | | | | |
| Corporate Bonds | | | | | Par (000) | | | Value | |
Food & Staples Retailing — 0.1% | | | | | | | | | | | | |
CVS Health Corp.: | | | | | | | | | | | | |
4.00%, 12/05/23 | | | USD | | | | 89 | | | $ | 92,490 | |
4.88%, 7/20/35 | | | | | | | 213 | | | | 219,921 | |
5.30%, 12/05/43 | | | | | | | 36 | | | | 38,667 | |
Walgreens Boots Alliance, Inc., 4.80%, 11/18/44 | | | | | | | 55 | | | | 49,752 | |
Wal-Mart Stores, Inc.: | | | | | | | | | | | | |
2.55%, 4/11/23 | | | | | | | 62 | | | | 61,144 | |
4.00%, 4/11/43 | | | | | | | 31 | | | | 30,104 | |
| | | | | | | | | | | | |
| | | | | | | | | | | | 492,078 | |
Food Products — 0.0% | | | | | | | | | | | | |
Kraft Foods Group, Inc., 6.88%, 1/26/39 | | | | | | | 36 | | | | 42,667 | |
Health Care Equipment & Supplies — 0.3% | | | | | | | | | | | | |
Abbott Laboratories, 2.55%, 3/15/22 | | | | | | | 205 | | | | 203,724 | |
Becton Dickinson and Co.: | | | | | | | | | | | | |
1.45%, 5/15/17 | | | | | | | 102 | | | | 101,569 | |
1.80%, 12/15/17 | | | | | | | 35 | | | | 34,949 | |
2.68%, 12/15/19 | | | | | | | 149 | | | | 149,811 | |
3.13%, 11/08/21 | | | | | | | 64 | | | | 64,538 | |
4.69%, 12/15/44 | | | | | | | 20 | | | | 20,178 | |
Boston Scientific Corp.: | | | | | | | | | | | | |
2.65%, 10/01/18 | | | | | | | 101 | | | | 101,531 | |
2.85%, 5/15/20 | | | | | | | 119 | | | | 118,380 | |
3.85%, 5/15/25 | | | | | | | 132 | | | | 129,881 | |
Medtronic, Inc.: | | | | | | | | | | | | |
2.50%, 3/15/20 | | | | | | | 92 | | | | 92,653 | |
3.13%, 3/15/22 | | | | | | | 88 | | | | 88,891 | |
3.63%, 3/15/24 | | | | | | | 110 | | | | 112,670 | |
4.63%, 3/15/44 | | | | | | | 134 | | | | 136,369 | |
4.63%, 3/15/45 | | | | | | | 74 | | | | 76,328 | |
St. Jude Medical, Inc.: | | | | | | | | | | | | |
2.80%, 9/15/20 | | | | | | | 82 | | | | 82,031 | |
3.88%, 9/15/25 | | | | | | | 27 | | | | 27,252 | |
Stryker Corp., 3.38%, 11/01/25 | | | | | | | 37 | | | | 36,520 | |
Zimmer Biomet Holdings, Inc.: | | | | | | | | | | | | |
3.55%, 4/01/25 | | | | | | | 46 | | | | 44,699 | |
4.25%, 8/15/35 | | | | | | | 106 | | | | 98,819 | |
| | | | | | | | | | | | |
| | | | | | | | | | | | 1,720,793 | |
Health Care Providers & Services — 0.5% | | | | | | | | | | | | |
Aetna, Inc.: | | | | | | | | | | | | |
4.50%, 5/15/42 | | | | | | | 65 | | | | 63,853 | |
4.13%, 11/07/42 | | | | | | | 32 | | | | 29,942 | |
AmerisourceBergen Corp.: | | | | | | | | | | | | |
1.15%, 5/15/17 | | | | | | | 129 | | | | 128,077 | |
3.25%, 3/01/25 | | | | | | | 31 | | | | 30,014 | |
4.25%, 3/01/45 | | | | | | | 31 | | | | 28,493 | |
Anthem, Inc.: | | | | | | | | | | | | |
1.88%, 1/15/18 | | | | | | | 287 | | | | 285,755 | |
2.30%, 7/15/18 | | | | | | | 396 | | | | 395,253 | |
Series A, 3.70%, 8/15/21 | | | | | | | 7 | | | | 7,154 | |
3.30%, 1/15/23 | | | | | | | 193 | | | | 187,561 | |
4.65%, 8/15/44 | | | | | | | 54 | | | | 51,467 | |
Baylor Scott & White Holdings, 4.19%, 11/15/45 | | | | | | | 40 | | | | 37,828 | |
Catholic Health Initiatives, 4.35%, 11/01/42 | | | | | | | 30 | | | | 28,059 | |
Cigna Corp., 3.25%, 4/15/25 | | | | | | | 212 | | | | 208,028 | |
Dignity Health, 5.27%, 11/01/64 | | | | | | | 90 | | | | 92,329 | |
Express Scripts Holding Co.: | | | | | | | | | | | | |
1.25%, 6/02/17 | | | | | | | 98 | | | | 97,347 | |
3.90%, 2/15/22 | | | | | | | 66 | | | | 67,794 | |
HCA, Inc., 5.25%, 4/15/25 | | | | | | | 180 | | | | 181,350 | |
| | | | | | | | | | | | |
| Corporate Bonds | | | | | Par (000) | | | Value | |
Health Care Providers & Services (continued) | | | | | | | | | | | | |
Laboratory Corp. of America Holdings, 2.63%, 2/01/20 | | | USD | | | | 85 | | | $ | 83,917 | |
Ochsner Clinic Foundation, 5.90%, 5/15/45 | | | | | | | 35 | | | | 37,601 | |
Southern Baptist Hospital of Florida, Inc., 4.86%, 7/15/45 | | | | | | | 35 | | | | 36,158 | |
UnitedHealth Group, Inc.: | | | | | | | | | | | | |
2.70%, 7/15/20 | | | | | | | 48 | | | | 48,503 | |
2.88%, 12/15/21 | | | | | | | 98 | | | | 99,359 | |
3.35%, 7/15/22 | | | | | | | 47 | | | | 48,074 | |
4.63%, 7/15/35 | | | | | | | 20 | | | | 20,762 | |
3.95%, 10/15/42 | | | | | | | 117 | | | | 108,899 | |
| | | | | | | | | | | | |
| | | | | | | | | | | | 2,403,577 | |
Hotels, Restaurants & Leisure — 0.0% | | | | | | | | | | | | |
McDonald’s Corp.: | | | | | | | | | | | | |
2.75%, 12/09/20 | | | | | | | 32 | | | | 31,978 | |
3.70%, 1/30/26 | | | | | | | 31 | | | | 30,975 | |
4.70%, 12/09/35 | | | | | | | 23 | | | | 22,915 | |
4.60%, 5/26/45 | | | | | | | 31 | | | | 29,827 | |
4.88%, 12/09/45 | | | | | | | 27 | | | | 27,164 | |
| | | | | | | | | | | | |
| | | | | | | | | | | | 142,859 | |
Household Durables — 0.0% | | | | | | | | | | | | |
Newell Rubbermaid, Inc., 2.88%, 12/01/19 | | | | | | | 210 | | | | 202,582 | |
Household Products — 0.0% | | | | | | | | | | | | |
Kimberly-Clark Corp.: | | | | | | | | | | | | |
1.90%, 5/22/19 | | | | | | | 187 | | | | 186,221 | |
2.65%, 3/01/25 | | | | | | | 40 | | | | 38,612 | |
| | | | | | | | | | | | |
| | | | | | | | | | | | 224,833 | |
Industrial Conglomerates — 0.1% | | | | | | | | | | | | |
Eaton Corp., 2.75%, 11/02/22 | | | | | | | 152 | | | | 147,082 | |
General Electric Co., 4.50%, 3/11/44 | | | | | | | 194 | | | | 199,652 | |
| | | | | | | | | | | | |
| | | | | | | | | | | | 346,734 | |
Insurance — 0.5% | | | | | | | | | | | | |
Aflac, Inc., 3.63%, 6/15/23 | | | | | | | 52 | | | | 53,834 | |
Allstate Corp., 3.15%, 6/15/23 | | | | | | | 62 | | | | 61,952 | |
American International Group, Inc.: | | | | | | | | | | | | |
3.38%, 8/15/20 | | | | | | | 119 | | | | 122,351 | |
3.75%, 7/10/25 | | | | | | | 79 | | | | 78,294 | |
3.88%, 1/15/35 | | | | | | | 62 | | | | 54,686 | |
4.50%, 7/16/44 | | | | | | | 61 | | | | 56,410 | |
4.38%, 1/15/55 | | | | | | | 53 | | | | 45,542 | |
Aon PLC, 4.75%, 5/15/45 | | | | | | | 49 | | | | 48,441 | |
Lincoln National Corp., 3.35%, 3/09/25 | | | | | | | 31 | | | | 29,889 | |
Loews Corp., 2.63%, 5/15/23 | | | | | | | 62 | | | | 59,077 | |
Marsh & McLennan Cos., Inc., 3.75%, 3/14/26 | | | | | | | 19 | | | | 19,025 | |
MassMutual Global Funding II, 2.35%, 4/09/19 (a) | | | | | | | 220 | | | | 221,117 | |
MetLife, Inc., 4.05%, 3/01/45 | | | | | | | 133 | | | | 123,423 | |
Metropolitan Life Global Funding I: | | | | | | | | | | | | |
1.30%, 4/10/17 (a) | | | | | | | 646 | | | | 645,754 | |
2.30%, 4/10/19 (a) | | | | | | | 330 | | | | 330,079 | |
Prudential Financial, Inc., 4.60%, 5/15/44 | | | | | | | 171 | | | | 170,154 | |
Travelers Cos., Inc., 4.60%, 8/01/43 | | | | | | | 84 | | | | 88,271 | |
XLIT Ltd., 2.30%, 12/15/18 | | | | | | | 99 | | | | 99,018 | |
| | | | | | | | | | | | |
| | | | | | | | | | | | 2,307,317 | |
Internet & Catalog Retail — 0.0% | | | | | | | | | | | | |
Amazon.com, Inc., 2.60%, 12/05/19 | | | | | | | 147 | | | | 149,305 | |
See Notes to Financial Statements.
| | | | | | |
| 28 | | BLACKROCK SERIES FUND, INC. | | DECEMBER 31, 2015 | | |
| | | | |
| Schedule of Investments (continued) | | | BlackRock Balanced Capital Portfolio | |
| | | | |
| | | | | | | | | | | | |
| Corporate Bonds | | | | | Par (000) | | | Value | |
IT Services — 0.2% | | | | | | | | | | | | |
Fidelity National Information Services, Inc., 3.63%, 10/15/20 | | | USD | | | | 13 | | | $ | 13,169 | |
Hewlett Packard Enterprise Co.: | | | | | | | | | | | | |
2.85%, 10/05/18 (a) | | | | | | | 205 | | | | 204,886 | |
3.60%, 10/15/20 (a) | | | | | | | 181 | | | | 181,415 | |
International Business Machines Corp., 2.88%, 11/09/22 | | | | | | | 150 | | | | 148,858 | |
MasterCard, Inc., 3.38%, 4/01/24 | | | | | | | 131 | | | | 133,874 | |
Visa, Inc.: | | | | | | | | | | | | |
2.80%, 12/14/22 | | | | | | | 186 | | | | 186,769 | |
3.15%, 12/14/25 | | | | | | | 151 | | | | 151,187 | |
4.15%, 12/14/35 | | | | | | | 51 | | | | 51,488 | |
4.30%, 12/14/45 | | | | | | | 68 | | | | 68,990 | |
| | | | | | | | | | | | |
| | | | | | | | | | | | 1,140,636 | |
Life Sciences Tools & Services — 0.0% | | | | | | | | | | | | |
Thermo Fisher Scientific, Inc.: | | | | | | | | | | | | |
3.30%, 2/15/22 | | | | | | | 94 | | | | 93,769 | |
3.65%, 12/15/25 | | | | | | | 29 | | | | 28,837 | |
| | | | | | | | | | | | |
| | | | | | | | | | | | 122,606 | |
Machinery — 0.1% | | | | | | | | | | | | |
Caterpillar, Inc., 4.75%, 5/15/64 | | | | | | | 127 | | | | 122,334 | |
Ingersoll-Rand Luxembourg Finance SA, 4.65%, 11/01/44 | | | | | | | 16 | | | | 15,313 | |
John Deere Capital Corp., 3.35%, 6/12/24 | | | | | | | 149 | | | | 151,408 | |
Schaeffler Holding Finance BV, 6.75% (6.75% Cash or 7.25% PIK), 11/15/22 (a)(f) | | | | | | | 200 | | | | 215,000 | |
| | | | | | | | | | | | |
| | | | | | | | | | | | 504,055 | |
Media — 0.6% | | | | | | | | | | | | |
21st Century Fox America, Inc.: | | | | | | | | | | | | |
3.70%, 9/15/24 | | | | | | | 60 | | | | 60,495 | |
3.70%, 10/15/25 (a) | | | | | | | 27 | | | | 26,933 | |
4.75%, 9/15/44 | | | | | | | 42 | | | | 40,398 | |
4.95%, 10/15/45 (a) | | | | | | | 12 | | | | 11,818 | |
Altice U.S. Finance I Corp., 5.38%, 7/15/23 (a) | | | | | | | 200 | | | | 200,500 | |
CBS Corp., 2.30%, 8/15/19 | | | | | | | 107 | | | | 105,812 | |
CCO Safari II LLC: | | | | | | | | | | | | |
3.58%, 7/23/20 (a) | | | | | | | 131 | | | | 130,215 | |
4.46%, 7/23/22 (a) | | | | | | | 275 | | | | 274,040 | |
6.38%, 10/23/35 (a) | | | | | | | 116 | | | | 117,198 | |
CCOH Safari LLC, 5.75%, 2/15/26 (a) | | | | | | | 45 | | | | 45,113 | |
Comcast Corp.: | | | | | | | | | | | | |
3.38%, 8/15/25 | | | | | | | 91 | | | | 92,126 | |
4.25%, 1/15/33 | | | | | | | 35 | | | | 34,392 | |
4.40%, 8/15/35 | | | | | | | 161 | | | | 161,959 | |
4.60%, 8/15/45 | | | | | | | 54 | | | | 54,676 | |
DIRECTV Holdings LLC/DIRECTV Financing Co., Inc.: | | | | | | | | | | | | |
4.60%, 2/15/21 | | | | | | | 245 | | | | 259,497 | |
6.38%, 3/01/41 | | | | | | | 45 | | | | 48,300 | |
Discovery Communications LLC: | | | | | | | | | | | | |
3.45%, 3/15/25 | | | | | | | 65 | | | | 58,843 | |
4.88%, 4/01/43 | | | | | | | 29 | | | | 23,870 | |
DISH DBS Corp., 5.00%, 3/15/23 | | | | | | | 80 | | | | 69,400 | |
Interpublic Group of Cos., Inc.: | | | | | | | | | | | | |
4.00%, 3/15/22 | | | | | | | 72 | | | | 72,104 | |
3.75%, 2/15/23 | | | | | | | 60 | | | | 57,732 | |
NBCUniversal Media LLC, 4.45%, 1/15/43 | | | | | | | 87 | | | | 85,239 | |
| | | | | | | | | | | | |
| Corporate Bonds | | | | | Par (000) | | | Value | |
Media (continued) | | | | | | | | | | | | |
Scripps Networks Interactive, Inc., 2.75%, 11/15/19 | | | USD | | | | 75 | | | $ | 73,772 | |
Time Warner Cable, Inc.: | | | | | | | | | | | | |
5.00%, 2/01/20 | | | | | | | 89 | | | | 94,212 | |
4.13%, 2/15/21 | | | | | | | 186 | | | | 189,920 | |
4.00%, 9/01/21 | | | | | | | 25 | | | | 25,243 | |
5.50%, 9/01/41 | | | | | | | 60 | | | | 54,219 | |
4.50%, 9/15/42 | | | | | | | 9 | | | | 7,063 | |
Time Warner, Inc.: | | | | | | | | | | | | |
2.10%, 6/01/19 | | | | | | | 223 | | | | 221,772 | |
3.60%, 7/15/25 | | | | | | | 124 | | | | 120,711 | |
4.65%, 6/01/44 | | | | | | | 91 | | | | 83,479 | |
Viacom, Inc.: | | | | | | | | | | | | |
2.75%, 12/15/19 | | | | | | | 71 | | | | 70,040 | |
4.50%, 3/01/21 | | | | | | | 90 | | | | 92,912 | |
| | | | | | | | | | | | |
| | | | | | | | | | | | 3,064,003 | |
Metals & Mining — 0.1% | | | | | | | | | | | | |
Freeport-McMoRan, Inc.: | | | | | | | | | | | | |
4.00%, 11/14/21 | | | | | | | 124 | | | | 74,400 | |
5.40%, 11/14/34 | | | | | | | 74 | | | | 39,220 | |
Newmont Mining Corp., 3.50%, 3/15/22 | | | | | | | 86 | | | | 76,652 | |
Novelis, Inc., 8.75%, 12/15/20 | | | | | | | 420 | | | | 385,350 | |
Nucor Corp., 5.20%, 8/01/43 | | | | | | | 41 | | | | 37,208 | |
Rio Tinto Finance USA PLC, 2.88%, 8/21/22 | | | | | | | 4 | | | | 3,628 | |
| | | | | | | | | | | | |
| | | | | | | | | | | | 616,458 | |
Multiline Retail — 0.0% | | | | | | | | | | | | |
Macy’s Retail Holdings, Inc., 4.50%, 12/15/34 | | | | | | | 67 | | | | 55,999 | |
Target Corp.: | | | | | | | | | | | | |
3.50%, 7/01/24 | | | | | | | 33 | | | | 34,243 | |
4.00%, 7/01/42 | | | | | | | 63 | | | | 61,512 | |
| | | | | | | | | | | | |
| | | | | | | | | | | | 151,754 | |
Multi-Utilities — 0.3% | | | | | | | | | | | | |
Berkshire Hathaway Energy Co.: | | | | | | | | | | | | |
2.40%, 2/01/20 | | | | | | | 57 | | | | 56,468 | |
3.50%, 2/01/25 | | | | | | | 57 | | | | 56,523 | |
CenterPoint Energy Houston Electric LLC, 4.50%, 4/01/44 | | | | | | | 55 | | | | 56,740 | |
CMS Energy Corp., 3.88%, 3/01/24 | | | | | | | 183 | | | | 185,769 | |
Consumers Energy Co., 3.95%, 5/15/43 | | | | | | | 46 | | | | 44,521 | |
Dominion Resources, Inc.: | | | | | | | | | | | | |
1.95%, 8/15/16 | | | | | | | 171 | | | | 171,431 | |
2.50%, 12/01/19 | | | | | | | 142 | | | | 141,475 | |
DTE Electric Co., 3.95%, 6/15/42 | | | | | | | 59 | | | | 56,480 | |
DTE Energy Co.: | | | | | | | | | | | | |
2.40%, 12/01/19 | | | | | | | 41 | | | | 40,826 | |
3.50%, 6/01/24 | | | | | | | 160 | | | | 160,178 | |
NiSource Finance Corp., 3.85%, 2/15/23 | | | | | | | 103 | | | | 105,000 | |
Pacific Gas & Electric Co.: | | | | | | | | | | | | |
4.75%, 2/15/44 | | | | | | | 60 | | | | 62,349 | |
4.30%, 3/15/45 | | | | | | | 46 | | | | 45,379 | |
PG&E Corp., 2.40%, 3/01/19 | | | | | | | 92 | | | | 91,804 | |
Sempra Energy, 2.88%, 10/01/22 | | | | | | | 45 | | | | 43,545 | |
Virginia Electric & Power Co.: | | | | | | | | | | | | |
3.45%, 2/15/24 | | | | | | | 60 | | | | 61,254 | |
4.45%, 2/15/44 | | | | | | | 46 | | | | 47,313 | |
4.20%, 5/15/45 | | | | | | | 98 | | | | 97,312 | |
| | | | | | | | | | | | |
| | | | | | | | | | | | 1,524,367 | |
See Notes to Financial Statements.
| | | | | | |
| | | BLACKROCK SERIES FUND, INC. | | DECEMBER 31, 2015 | | 29 |
| | | | |
| Schedule of Investments (continued) | | | BlackRock Balanced Capital Portfolio | |
| | | | |
| | | | | | | | | | | | |
| Corporate Bonds | | | | | Par (000) | | | Value | |
Oil, Gas & Consumable Fuels — 0.8% | | | | | | | | | | | | |
Anadarko Petroleum Corp.: | | | | | | | | | | | | |
7.95%, 6/15/39 | | | USD | | | | 61 | | | $ | 65,180 | |
4.50%, 7/15/44 | | | | | | | 61 | | | | 46,701 | |
California Resources Corp.: | | | | | | | | | | | | |
8.00%, 12/15/22 (a) | | | | | | | 48 | | | | 25,260 | |
6.00%, 11/15/24 | | | | | | | 19 | | | | 5,795 | |
Chevron Corp.: | | | | | | | | | | | | |
2.19%, 11/15/19 | | | | | | | 36 | | | | 35,984 | |
1.96%, 3/03/20 | | | | | | | 273 | | | | 269,025 | |
CONSOL Energy, Inc., 5.88%, 4/15/22 | | | | | | | 80 | | | | 49,600 | |
Continental Resources, Inc.: | | | | | | | | | | | | |
3.80%, 6/01/24 | | | | | | | 62 | | | | 43,674 | |
4.90%, 6/01/44 | | | | | | | 71 | | | | 42,811 | |
Devon Energy Corp., 5.60%, 7/15/41 | | | | | | | 65 | | | | 49,129 | |
Energy Transfer Partners LP: | | | | | | | | | | | | |
4.15%, 10/01/20 | | | | | | | 68 | | | | 62,730 | |
4.65%, 6/01/21 | | | | | | | 119 | | | | 111,723 | |
4.90%, 3/15/35 | | | | | | | 69 | | | | 50,171 | |
6.63%, 10/15/36 | | | | | | | 48 | | | | 41,567 | |
5.15%, 2/01/43 | | | | | | | 60 | | | | 42,893 | |
Enterprise Products Operating LLC: | | | | | | | | | | | | |
3.90%, 2/15/24 | | | | | | | 67 | | | | 62,512 | |
3.70%, 2/15/26 | | | | | | | 175 | | | | 156,975 | |
4.45%, 2/15/43 | | | | | | | 175 | | | | 133,506 | |
Exxon Mobil Corp., 1.82%, 3/15/19 | | | | | | | 296 | | | | 296,214 | |
Halcon Resources Corp., 8.63%, 2/01/20 (a) | | | | | | | 80 | | | | 55,200 | |
Kinder Morgan Energy Partners LP: | | | | | | | | | | | | |
3.50%, 3/01/21 | | | | | | | 335 | | | | 299,784 | |
3.95%, 9/01/22 | | | | | | | 100 | | | | 87,052 | |
5.63%, 9/01/41 | | | | | | | 30 | | | | 22,733 | |
4.70%, 11/01/42 | | | | | | | 92 | | | | 64,736 | |
Kinder Morgan, Inc., 3.05%, 12/01/19 | | | | | | | 40 | | | | 37,021 | |
Laredo Petroleum, Inc., 7.38%, 5/01/22 | | | | | | | 15 | | | | 13,800 | |
Marathon Petroleum Corp., 4.75%, 9/15/44 | | | | | | | 35 | | | | 28,609 | |
MEG Energy Corp.: | | | | | | | | | | | | |
6.50%, 3/15/21 (a) | | | | | | | 20 | | | | 14,000 | |
7.00%, 3/31/24 (a) | | | | | | | 180 | | | | 127,800 | |
Peabody Energy Corp., 6.00%, 11/15/18 | | | | | | | 33 | | | | 6,105 | |
Phillips 66, 4.88%, 11/15/44 | | | | | | | 48 | | | | 42,824 | |
Plains All American Pipeline LP/PAA Finance Corp.: | | | | | | | | | | | | |
2.85%, 1/31/23 | | | | | | | 223 | | | | 183,944 | |
5.15%, 6/01/42 | | | | | | | 48 | | | | 34,826 | |
4.90%, 2/15/45 | | | | | | | 54 | | | | 38,836 | |
Regency Energy Partners LP/Regency Energy Finance Corp., 5.00%, 10/01/22 | | | | | | | 121 | | | | 107,191 | |
Spectra Energy Partners LP, 3.50%, 3/15/25 | | | | | | | 186 | | | | 162,693 | |
Sunoco Logistics Partners Operations LP, 3.45%, 1/15/23 | | | | | | | 129 | | | | 108,881 | |
TransCanada PipeLines Ltd.: | | | | | | | | | | | | |
1.88%, 1/12/18 | | | | | | | 59 | | | | 58,767 | |
2.50%, 8/01/22 | | | | | | | 70 | | | | 64,264 | |
4.63%, 3/01/34 | | | | | | | 122 | | | | 115,347 | |
Valero Energy Corp., 3.65%, 3/15/25 | | | | | | | 239 | | | | 225,430 | |
Western Gas Partners LP, 4.00%, 7/01/22 | | | | | | | 98 | | | | 86,682 | |
Williams Partners LP: | | | | | | | | | | | | |
4.00%, 11/15/21 | | | | | | | 165 | | | | 137,623 | |
4.50%, 11/15/23 | | | | | | | 34 | | | | 27,520 | |
4.90%, 1/15/45 | | | | | | | 43 | | | | 27,376 | |
| | | | | | | | | | | | |
| | | | | | | | | | | | 3,770,494 | |
Paper & Forest Products — 0.0% | | | | | | | | | | | | |
International Paper Co.: | | | | | | | | | | | | |
3.65%, 6/15/24 | | | | | | | 63 | | | | 61,617 | |
4.80%, 6/15/44 | | | | | | | 96 | | | | 87,333 | |
| | | | | | | | | | | | |
| | | | | | | | | | | | 148,950 | |
| | | | | | | | | | | | |
| Corporate Bonds | | | | | Par (000) | | | Value | |
Pharmaceuticals — 0.5% | | | | | | | | | | | | |
AbbVie, Inc.: | | | | | | | | | | | | |
2.50%, 5/14/20 | | | USD | | | | 180 | | | $ | 178,190 | |
2.90%, 11/06/22 | | | | | | | 135 | | | | 130,604 | |
4.50%, 5/14/35 | | | | | | | 82 | | | | 80,327 | |
4.40%, 11/06/42 | | | | | | | 106 | | | | 98,996 | |
Actavis Funding SCS: | | | | | | | | | | | | |
2.35%, 3/12/18 | | | | | | | 275 | | | | 275,287 | |
3.00%, 3/12/20 | | | | | | | 542 | | | | 541,569 | |
AstraZeneca PLC: | | | | | | | | | | | | |
3.38%, 11/16/25 | | | | | | | 145 | | | | 143,950 | |
4.38%, 11/16/45 | | | | | | | 40 | | | | 40,081 | |
Bristol-Myers Squibb Co., 4.50%, 3/01/44 | | | | | | | 66 | | | | 71,347 | |
Eli Lilly & Co., 3.70%, 3/01/45 | | | | | | | 49 | | | | 45,835 | |
Endo Finance LLC/Endo Finco, Inc., 5.88%, 1/15/23 (a) | | | | | | | 80 | | | | 78,400 | |
GlaxoSmithKline Capital PLC, 2.85%, 5/08/22 | | | | | | | 95 | | | | 95,738 | |
Mylan, Inc., 3.13%, 1/15/23 (a) | | | | | | | 67 | | | | 61,478 | |
Novartis Capital Corp.: | | | | | | | | | | | | |
4.40%, 4/24/20 | | | | | | | 145 | | | | 158,795 | |
3.00%, 11/20/25 | | | | | | | 55 | | | | 54,232 | |
4.00%, 11/20/45 | | | | | | | 40 | | | | 39,179 | |
Pfizer, Inc.: | | | | | | | | | | | | |
4.30%, 6/15/43 | | | | | | | 57 | | | | 57,044 | |
4.40%, 5/15/44 | | | | | | | 48 | | | | 48,746 | |
Roche Holdings, Inc., 2.88%, 9/29/21 (a) | | | | | | | 200 | | | | 202,645 | |
Teva Pharmaceutical Finance Co. BV, 3.65%, 11/10/21 | | | | | | | 56 | | | | 56,791 | |
Valeant Pharmaceuticals International, Inc., 6.13%, 4/15/25 (a) | | | | | | | 171 | | | | 152,617 | |
Zoetis, Inc., 3.25%, 2/01/23 | | | | | | | 57 | | | | 54,426 | |
| | | | | | | | | | | | |
| | | | | | | | | | | | 2,666,277 | |
Real Estate Investment Trusts (REITs) — 0.1% | | | | | | | | | | | | |
American Tower Corp.: | | | | | | | | | | | | |
3.45%, 9/15/21 | | | | | | | 82 | | | | 82,402 | |
3.50%, 1/31/23 | | | | | | | 19 | | | | 18,571 | |
5.00%, 2/15/24 | | | | | | | 19 | | | | 20,112 | |
AvalonBay Communities, Inc., 3.50%, 11/15/25 | | | | | | | 13 | | | | 12,875 | |
Communications Sales & Leasing, Inc./CSL Capital LLC, 8.25%, 10/15/23 | | | | | | | 80 | | | | 67,600 | |
ERP Operating LP, 3.38%, 6/01/25 | | | | | | | 59 | | | | 58,341 | |
Omega Healthcare Investors, Inc., 4.50%, 4/01/27 | | | | | | | 50 | | | | 47,079 | |
Prologis LP, 3.75%, 11/01/25 | | | | | | | 22 | | | | 21,823 | |
Simon Property Group LP: | | | | | | | | | | | | |
3.38%, 10/01/24 | | | | | | | 89 | | | | 89,842 | |
4.25%, 10/01/44 | | | | | | | 77 | | | | 76,666 | |
Ventas Realty LP, 3.75%, 5/01/24 | | | | | | | 95 | | | | 93,093 | |
| | | | | | | | | | | | |
| | | | | | | | | | | | 588,404 | |
Road & Rail — 0.2% | | | | | | | | | | | | |
Burlington Northern Santa Fe LLC: | | | | | | | | | | | | |
3.45%, 9/15/21 | | | | | | | 30 | | | | 30,662 | |
3.00%, 3/15/23 | | | | | | | 74 | | | | 72,925 | |
4.15%, 4/01/45 | | | | | | | 36 | | | | 32,628 | |
4.70%, 9/01/45 | | | | | | | 35 | | | | 34,924 | |
CSX Corp.: | | | | | | | | | | | | |
3.35%, 11/01/25 | | | | | | | 41 | | | | 39,820 | |
4.10%, 3/15/44 | | | | | | | 48 | | | | 43,486 | |
Norfolk Southern Corp., 4.45%, 6/15/45 | | | | | | | 62 | | | | 58,420 | |
Penske Truck Leasing Co. LP/PTL Finance Corp., 3.38%, 2/01/22 (a) | | | | | | | 144 | | | | 139,822 | |
Ryder System, Inc., 2.45%, 9/03/19 | | | | | | | 91 | | | | 89,648 | |
Union Pacific Corp.: | | | | | | | | | | | | |
3.38%, 2/01/35 | | | | | | | 34 | | | | 30,708 | |
See Notes to Financial Statements.
| | | | | | |
| 30 | | BLACKROCK SERIES FUND, INC. | | DECEMBER 31, 2015 | | |
| | | | |
| Schedule of Investments (continued) | | | BlackRock Balanced Capital Portfolio | |
| | | | |
| | | | | | | | | | | | |
| Corporate Bonds | | | | | Par (000) | | | Value | |
Road & Rail (continued) | | | | | | | | | | | | |
Union Pacific Corp. (continued): | | | | | | | | | | | | |
4.05%, 11/15/45 | | | USD | | | | 12 | | | $ | 11,610 | |
4.38%, 11/15/49 | | | | | | | 45 | | | | 41,714 | |
3.88%, 2/01/55 | | | | | | | 141 | | | | 124,336 | |
Union Pacific Railroad Co. Pass-Through Trust, Series 2014-1, 3.23%, 5/14/26 | | | | | | | 157 | | | | 157,026 | |
| | | | | | | | | | | | |
| | | | | | | | | | | | 907,729 | |
Semiconductors & Semiconductor Equipment — 0.0% | | | | | | | | | |
Analog Devices, Inc.: | | | | | | | | | | | | |
3.90%, 12/15/25 | | | | | | | 19 | | | | 19,182 | |
5.30%, 12/15/45 | | | | | | | 18 | | | | 18,544 | |
Applied Materials, Inc.: | | | | | | | | | | | | |
2.63%, 10/01/20 | | | | | | | 67 | | | | 66,923 | |
3.90%, 10/01/25 | | | | | | | 55 | | | | 55,296 | |
| | | | | | | | | | | | |
| | | | | | | | | | | | 159,945 | |
Software — 0.2% | | | | | | | | | | | | |
First Data Corp.: | | | | | | | | | | | | |
8.75%, 1/15/22 (a) | | | | | | | 128 | | | | 133,741 | |
5.00%, 1/15/24 (a) | | | | | | | 20 | | | | 19,900 | |
5.75%, 1/15/24 (a) | | | | | | | 43 | | | | 42,355 | |
Microsoft Corp.: | | | | | | | | | | | | |
3.13%, 11/03/25 | | | | | | | 53 | | | | 53,281 | |
3.50%, 2/12/35 | | | | | | | 162 | | | | 149,728 | |
4.45%, 11/03/45 | | | | | | | 10 | | | | 10,312 | |
Oracle Corp.: | | | | | | | | | | | | |
2.80%, 7/08/21 | | | | | | | 366 | | | | 370,723 | |
3.25%, 5/15/30 | | | | | | | 178 | | | | 167,164 | |
4.38%, 5/15/55 | | | | | | | 70 | | | | 64,038 | |
| | | | | | | | | | | | |
| | | | | | | | | | | | 1,011,242 | |
Specialty Retail — 0.1% | | | | | | | | | | | | |
Home Depot, Inc.: | | | | | | | | | | | | |
3.35%, 9/15/25 | | | | | | | 22 | | | | 22,481 | |
5.40%, 9/15/40 | | | | | | | 36 | | | | 41,951 | |
4.40%, 3/15/45 | | | | | | | 21 | | | | 21,705 | |
Lowe’s Cos., Inc.: | | | | | | | | | | | | |
3.38%, 9/15/25 | | | | | | | 24 | | | | 24,367 | |
4.25%, 9/15/44 | | | | | | | 41 | | | | 40,806 | |
4.38%, 9/15/45 | | | | | | | 18 | | | | 18,500 | |
QVC, Inc.: | | | | | | | | | | | | |
3.13%, 4/01/19 | | | | | | | 55 | | | | 54,284 | |
5.13%, 7/02/22 | | | | | | | 92 | | | | 91,707 | |
| | | | | | | | | | | | |
| | | | | | | | | | | | 315,801 | |
Technology Hardware, Storage & Peripherals — 0.1% | | | | | | | | | |
Apple Inc.: | | | | | | | | | | | | |
2.10%, 5/06/19 | | | | | | | 221 | | | | 223,584 | |
3.45%, 2/09/45 | | | | | | | 44 | | | | 37,882 | |
HP, Inc., 3.75%, 12/01/20 | | | | | | | 21 | | | | 20,837 | |
Seagate HDD Cayman, 5.75%, 12/01/34 (a) | | | | | | | 3 | | | | 2,099 | |
| | | | | | | | | | | | |
| | | | | | | | | | | | 284,402 | |
Textiles, Apparel & Luxury Goods — 0.0% | | | | | | | | | | | | |
NIKE, Inc., 3.88%, 11/01/45 | | | | | | | 64 | | | | 61,760 | |
Tobacco — 0.2% | | | | | | | | | | | | |
Altria Group, Inc.: | | | | | | | | | | | | |
2.63%, 1/14/20 | | | | | | | 89 | | | | 89,165 | |
2.85%, 8/09/22 | | | | | | | 55 | | | | 53,618 | |
4.25%, 8/09/42 | | | | | | | 37 | | | | 33,949 | |
Philip Morris International, Inc.: | | | | | | | | | | | | |
1.13%, 8/21/17 | | | | | | | 183 | | | | 182,735 | |
4.13%, 3/04/43 | | | | | | | 59 | | | | 55,770 | |
4.88%, 11/15/43 | | | | | | | 91 | | | | 96,208 | |
Reynolds American, Inc.: | | | | | | | | | | | | |
2.30%, 6/12/18 | | | | | | | 70 | | | | 70,440 | |
| | | | | | | | |
| Corporate Bonds | | Par (000) | | | Value | |
Tobacco (continued) | | | | | | | | |
Reynolds American, Inc. (continued): | | | | | | | | |
3.25%, 6/12/20 | | USD | 55 | | | $ | 55,897 | |
3.25%, 11/01/22 | | | 76 | | | | 75,147 | |
3.75%, 5/20/23 | | | 22 | | | | 21,950 | |
4.75%, 11/01/42 | | | 59 | | | | 56,314 | |
| | | | | | | | |
| | | | | | | | 791,193 | |
Trading Companies & Distributors — 0.0% | | | | | | | | |
GATX Corp., 2.60%, 3/30/20 | | | 67 | | | | 65,183 | |
HD Supply, Inc., 5.25%, 12/15/21 (a) | | | 80 | | | | 81,600 | |
United Rentals North America, Inc., 7.63%, 4/15/22 | | | 45 | | | | 48,092 | |
| | | | | | | | |
| | | | | | | | 194,875 | |
Wireless Telecommunication Services — 0.3% | | | | | |
America Movil SAB de CV, 2.38%, 9/08/16 | | | 480 | | | | 481,760 | |
Orange SA, 5.50%, 2/06/44 | | | 61 | | | | 64,763 | |
Rogers Communications, Inc.: | | | | | | | | |
3.63%, 12/15/25 | | | 23 | | | | 22,623 | |
5.00%, 3/15/44 | | | 20 | | | | 20,135 | |
Sprint Communications, Inc., 9.00%, 11/15/18 (a) | | | 560 | | | | 589,400 | |
Sprint Corp., 7.88%, 9/15/23 | | | 175 | | | | 131,425 | |
T-Mobile USA, Inc.: | | | | | | | | |
6.63%, 4/28/21 | | | 65 | | | | 67,438 | |
6.73%, 4/28/22 | | | 60 | | | | 62,550 | |
6.84%, 4/28/23 | | | 20 | | | | 20,700 | |
Vodafone Group PLC, 2.50%, 9/26/22 | | | 67 | | | | 62,063 | |
| | | | | | | | |
| | | | | | | | 1,522,857 | |
Total Corporate Bonds — 10.7% | | | | | | | 53,285,327 | |
| | | | | | | | |
| Foreign Agency Obligations | | | | | | |
Norway — 0.0% | | | | | | | | |
Statoil ASA, 2.90%, 11/08/20 | | | 153 | | | | 155,502 | |
| | | | | | | | |
| Foreign Government Obligations | | | | | | |
Colombia — 0.0% | | | | | | | | |
Republic of Colombia, 4.00%, 2/26/24 | | | 280 | | | | 266,700 | |
Germany — 0.2% | | | | | | | | |
Deutsche Bundesrepublik Inflation Linked Bonds, 0.10%, 4/15/26 | | EUR | 805 | | | | 926,934 | |
Indonesia — 0.0% | | | | | | | | |
Republic of Indonesia: | | | | | | | | |
3.38%, 4/15/23 | | USD | 200 | | | | 185,848 | |
8.38%, 3/15/34 | | IDR | 1,080,000 | | | | 73,365 | |
| | | | | | | | |
| | | | | | | | 259,213 | |
Mexico — 0.3% | | | | | | | | |
United Mexican States: | | | | | | | | |
4.75%, 6/14/18 | | MXN | 4,553 | | | | 265,448 | |
4.00%, 10/02/23 | | USD | 945 | | | | 957,285 | |
8.00%, 12/07/23 | | MXN | 3,000 | | | | 194,829 | |
| | | | | | | | |
| | | | | | | | 1,417,562 | |
See Notes to Financial Statements.
| | | | | | |
| | | BLACKROCK SERIES FUND, INC. | | DECEMBER 31, 2015 | | 31 |
| | | | |
| Schedule of Investments (continued) | | | BlackRock Balanced Capital Portfolio | |
| | | | |
| | | | | | | | | | | | |
| Foreign Government Obligations | | | | | Par
(000) | | | Value | |
Peru — 0.0% | | | | | | | | | | | | |
Republic of Peru, 7.35%, 7/21/25 | | | USD | | | | 150 | | | $ | 188,063 | |
| |
Poland — 0.1% | | | | | | | | | | | | |
Republic of Poland: | | | | | | | | | | | | |
3.25%, 7/25/25 | | | PLN | | | | 524 | | | | 137,391 | |
2.50%, 7/25/26 | | | | | | | 925 | | | | 221,983 | |
| | | | | | | | | | | | |
| | | | | | | | | | | | 359,374 | |
Russia — 0.0% | | | | | | | | | | | | |
Russian Federation, 7.00%, 8/16/23 | | | RUB | | | | 995 | | | | 11,780 | |
Slovenia — 0.1% | | | | | | | | | | | | |
Republic of Slovenia, 4.13%, 2/18/19 (a) | | | USD | | | | 260 | | | | 273,325 | |
Turkey — 0.1% | | | | | | | | | | | | |
Republic of Turkey, 5.75%, 3/22/24 | | | | | | | 480 | | | | 507,130 | |
Total Foreign Government Obligations — 0.8% | | | | 4,210,081 | |
| | | | | | | | | | | | |
| Investment Companies | | | | | Shares | | | | |
iShares iBoxx $ High Yield Corporate Bond ETF (g) | | | | | | | 29,546 | | | | 2,380,817 | |
Utilities Select Sector SPDR Fund (e) | | | | | | | 25,900 | | | | 1,120,952 | |
Total Investment Companies — 0.7% | | | | | | | | | | | 3,501,769 | |
| | | | | | | | | | | | |
| Non-Agency Mortgage-Backed Securities | | | | | Par
(000) | | | | |
Collateralized Mortgage Obligations — 1.0% | | | | | | | | | | | | |
Adjustable Rate Mortgage Trust, Series 2005-12, Class 4A1, 3.47%, 3/25/36 (b) | | | USD | | | | 88 | | | | 64,322 | |
American Home Mortgage Assets Trust, Series 2006-3, Class 2A11, 1.20%, 10/25/46 (b) | | | | | | | 100 | | | | 70,740 | |
Angel Oak Mortgage Trust LLC, Series 2015-1, Class A, 4.50%, 11/25/45 (a)(b) | | | | | | | 90 | | | | 89,842 | |
COLT LLC, Series 2015-1, Class A1V, 3.20%, 12/26/45 (a)(b) | | | | | | | 99 | | | | 98,577 | |
Countrywide Alternative Loan Trust: | | | | | | | | | | | | |
Series 2005-72, Class A3, 0.72%, 1/25/36 (b) | | | | | | | 42 | | | | 34,485 | |
Series 2005-80CB, Class 4A1, 6.00%, 2/25/36 | | | | | | | 87 | | | | 72,899 | |
Series 2006-OA21, Class A1, 0.59%, 3/20/47 (b) | | | | | | | 1,601 | | | | 1,239,479 | |
Series 2007-22, Class 2A16, 6.50%, 9/25/37 | | | | | | | 1,075 | | | | 837,949 | |
Series 2007-OA3, Class 1A1, 0.36%, 4/25/47 (b) | | | | | | | 60 | | | | 50,025 | |
Countrywide Home Loan Mortgage Pass-Through Trust: | | | | | | | | | | | | |
Series 2006-OA4, Class A1, 1.22%, 4/25/46 (b) | | | | | | | 91 | | | | 50,609 | |
Series 2006-OA5, Class 2A1, 0.62%, 4/25/46 (b) | | | | | | | 166 | | | | 134,152 | |
Credit Suisse Mortgage Capital Certificates: | | | | | | | | | | | | |
Series 2011-5R, Class 2A1, 3.15%, 8/27/46 (a)(b) | | | | | | | 332 | | | | 325,294 | |
Series 2015-10R, Class 4A1, 4.75%, 7/27/37 (a)(b) | | | | | | | 87 | | | | 86,392 | |
Series 2015-PR1, Class A-1, 3.50%, 2/25/55 (a)(c) | | | | | | | 199 | | | | 192,532 | |
| | | | | | | | | | | | |
| Non-Agency Mortgage-Backed Securities | | | | | Par
(000) | | | Value | |
Collateralized Mortgage Obligations (continued) | | | | | | | | | | | | |
Deutsche ALT-A Securities, Inc., Series 2007-RS1, Class A2, 0.92%, 1/27/37 (a)(b) | | | USD | | | | 33 | | | $ | 56,583 | |
GreenPoint Mortgage Funding Trust, Series 2006-AR2, Class 4A1, 2.26%, 3/25/36 (b) | | | | | | | 14 | | | | 11,234 | |
GSMSC Resecuritization Trust, Series 2015-5R, Class 1C, 0.36%, 4/26/37 (a)(b) | | | | | | | 100 | | | | 63,000 | |
Impac Secured Assets CMN Owner Trust, Series 2004-3, Class 1A4, 1.22%, 11/25/34 (b) | | | | | | | 51 | | | | 50,757 | |
JPMorgan Alternative Loan Trust, Series 2007-A1, Class 1A4, 0.41%, 3/25/37 (b) | | | | | | | 91 | | | | 61,568 | |
LSTAR Securities Investment Trust: | | | | | | | | | | | | |
Series 2014-1, Class Note,
3.34%, 9/01/21 (a)(b) | | | | | | | 437 | | | | 435,261 | |
Series 2014-2, Class A,
2.24%, 12/01/21 (a)(b) | | | | | | | 307 | | | | 303,200 | |
Series 2015-1, Class A, 2.24%, 1/01/20 (a)(b) | | | | | | | 106 | | | | 104,451 | |
Series 2015-10, Class A1,
2.24%, 11/02/20 (a)(b) | | | | | | | 98 | | | | 96,235 | |
Series 2015-10, Class A2,
3.74%, 11/02/20 (a)(b) | | | | | | | 110 | | | | 106,717 | |
Series 2015-3, Class A, 2.24%, 3/01/20 (a)(b) | | | | | | | 278 | | | | 273,909 | |
Morgan Stanley Resecuritization Trust, Series 2014-R8, Class 3B1, 0.99%, 6/26/47 (a)(b) | | | | | | | 95 | | | | 86,774 | |
RALI Trust: | | | | | | | | | | | | |
Series 2006-QO2, Class A1,
0.64%, 2/25/46 (b) | | | | | | | 213 | | | | 90,573 | |
Series 2007-QH6, Class A1,
0.61%, 7/25/37 (b) | | | | | | | 63 | | | | 50,335 | |
| | | | | | | | | | | | |
| | | | | | | | | | | | 5,137,894 | |
Commercial Mortgage-Backed Securities — 1.8% | | | | | | | | | | | | |
Banc of America Commercial Mortgage Trust: | | | | | | | | | | | | |
Series 2007-1, Class A4, 5.45%, 1/15/49 | | | | | | | 141 | | | | 144,276 | |
Series 2007-1, Class AMFX, 5.48%, 1/15/49 (b) | | | | | | | 30 | | | | 30,720 | |
Series 2007-3, Class A1A, 5.56%, 6/10/49 (b) | | | | | | | 317 | | | | 327,479 | |
Series 2007-3, Class A4, 5.56%, 6/10/49 (b) | | | | | | | 238 | | | | 245,008 | |
Series 2007-3, Class AJ, 5.56%, 6/10/49 (b) | | | | | | | 60 | | | | 60,793 | |
Series 2007-5, Class AM, 5.77%, 2/10/51 (b) | | | | | | | 130 | | | | 135,240 | |
Banc of America Merrill Lynch Commercial Mortgage Securities Trust, Series 2015-200P, Class F, 3.60%, 4/14/33 (a)(b) | | | | | | | 100 | | | | 86,810 | |
Barclays Commercial Mortgage Trust: | | | | | | | | | | | | |
Series 2015-SLP, Class D,
3.53%, 2/15/28 (a)(b) | | | | | | | 100 | | | | 98,739 | |
Series 2015-SRCH, Class A1,
3.31%, 8/10/35 (a) | | | | | | | 100 | | | | 97,596 | |
Series 2015-VFM, Class A2,
3.38%, 3/15/36 (a)(b) | | | | | | | 100 | | | | 100,190 | |
Bayview Commercial Asset Trust: | | | | | | | | | | | | |
Series 2006-3A, Class A2,
0.72%, 10/25/36 (a)(b) | | | | | | | 35 | | | | 28,406 | |
Series 2008-4, Class A3,
3.17%, 7/25/38 (a)(b) | | | | | | | 138 | | | | 138,654 | |
See Notes to Financial Statements.
| | | | | | |
| 32 | | BLACKROCK SERIES FUND, INC. | | DECEMBER 31, 2015 | | |
| | |
| Schedule of Investments (continued) | | BlackRock Balanced Capital Portfolio |
| | | | | | | | | | | | |
| Non-Agency Mortgage-Backed Securities | | | | | Par
(000) | | | Value | |
| |
Commercial Mortgage-Backed Securities (continued) | | | | | | | | | | | | |
Bear Stearns Commercial Mortgage Securities Trust: | | | | | | | | | | | | |
Series 2007-PW15, Class A1A, 5.32%, 2/11/44 | | | USD | | | | 269 | | | $ | 277,116 | |
Series 2007-PW16, Class AM,
5.72%, 6/11/40 (b) | | | | | | | 54 | | | | 56,211 | |
BHMS Mortgage Trust, Series 2014-ATLS, Class AFL, 1.77%, 7/05/33 (a)(b) | | | | | | | 130 | | | | 130,013 | |
CDGJ Commercial Mortgage Trust, Series 2014-BXCH, Class A, 1.73%, 12/15/27 (a)(b) | | | | | | | 215 | | | | 213,651 | |
Citigroup Commercial Mortgage Trust: | | | | | | | | | | | | |
Series 2013-GC11, Class D,
4.46%, 4/10/46 (a)(b) | | | | | | | 400 | | | | 360,827 | |
Series 2014-388G, Class A,
1.08%, 6/15/33 (a)(b) | | | | | | | 273 | | | | 270,162 | |
Series 2014-388G, Class E,
2.68%, 6/15/33 (a)(b) | | | | | | | 100 | | | | 98,050 | |
Citigroup/Deutsche Bank Commercial Mortgage Trust: | | | | | | | | | | | | |
Series 2006-CD3, Class AM, 5.65%, 10/15/48 | | | | | | | 250 | | | | 253,428 | |
Series 2007-CD5, Class AMA,
6.12%, 11/15/44 (b) | | | | | | | 138 | | | | 146,424 | |
COBALT CMBS Commercial Mortgage Trust, Series 2007-C3, Class AM, 5.77%, 5/15/46 (b) | | | | | | | 245 | | | | 257,183 | |
Commercial Mortgage Pass-Through Certificates: | | | | | | | | | | | | |
Series 2007-C9, Class AJFL,
0.98%, 12/10/49 (a)(b) | | | | | | | 140 | | | | 133,725 | |
Series 2010-RR1, Class GEB,
5.54%, 12/11/49 (a)(b) | | | | | | | 130 | | | | 133,763 | |
Series 2012-LTRT, Class A2,
3.40%, 10/05/30 (a) | | | | | | | 285 | | | | 284,988 | |
Series 2013-GAM, Class A2, 3.37%, 2/10/28 (a) | | | | | | | 180 | | | | 181,367 | |
Series 2014-FL5, Class D,
4.33%, 10/15/31 (a)(b) | | | | | | | 115 | | | | 111,011 | |
Core Industrial Trust, Series 2015-TEXW, Class A, 3.08%, 2/10/34 (a) | | | | | | | 100 | | | | 99,183 | |
Countrywide Alternative Loan Trust, Series 2006-OA9, Class 2A1B 0.60%, 7/20/46 (b) | | | | | | | 234 | | | | 170,118 | |
Credit Suisse Commercial Mortgage Trust, Series 2008-C1, Class A3, 6.07%, 2/15/41 (b) | | | | | | | 80 | | | | 84,170 | |
Credit Suisse Mortgage Capital Certificates, Series 2015-GLPB, Class A, 3.64%, 11/15/34 (a) | | | | | | | 100 | | | | 102,640 | |
Deutsche Bank Re-REMIC Trust, Series 2011-C32, Class A3A, 5.71%, 6/17/49 (a)(b) | | | | | | | 205 | | | | 211,716 | |
Extended Stay America Trust, Series 2013-ESH7, Class A27, 2.96%, 12/05/31 (a) | | | | | | | 225 | | | | 225,199 | |
GAHR Commercial Mortgage Trust, Series 2015-NRF, Class FFX, 3.38%, 12/15/19 (a)(b) | | | | | | | 30 | | | | 27,682 | |
GS Mortgage Securities Corp. II, Series 2013-KING, Class E, 3.44%, 12/10/27 (a)(b) | | | | | | | 350 | | | | 334,304 | |
JPMorgan Chase Commercial Mortgage Securities Trust: | | | | | | | | | | | | |
Series 2006-CB16, Class AM, 5.59%, 5/12/45 | | | | | | | 97 | | | | 98,231 | |
Series 2007-CB20, Class AJ, 6.08%, 2/12/51 (b) | | | | | | | 15 | | | | 15,243 | |
Series 2007-LDPX, Class AM,
5.46%, 1/15/49 (b) | | | | | | | 282 | | | | 287,262 | |
| | | | | | | | | | | | |
| Non-Agency Mortgage-Backed Securities | | | | | Par
(000) | | | Value | |
| |
JPMorgan Chase Commercial Mortgage Securities Trust (continued): | | | | | | | | | | | | |
Series 2008-C2, Class ASB,
6.13%, 2/12/51 (b) | | | USD | | | | 171 | | | $ | 175,292 | |
Series 2014-FL6, Class A,
1.73%, 11/15/31 (a)(b) | | | | | | | 140 | | | | 139,210 | |
Series 2015-CSMO, Class D,
3.63%, 1/15/32 (a)(b) | | | | | | | 100 | | | | 99,286 | |
LB-UBS Commercial Mortgage Trust, Series 2007-C1, Class AJ, 5.48%, 2/15/40 | | | | | | | 20 | | | | 20,201 | |
Lone Star Portfolio Trust, Series 2015-LSP, Class A1A2, 2.13%, 9/15/28 (a)(b) | | | | | | | 100 | | | | 99,981 | |
Merrill Lynch Mortgage Trust, Series 2007-C1, Class A1A, 5.84%, 6/12/50 (b) | | | | | | | 143 | | | | 147,762 | |
ML-CFC Commercial Mortgage Trust: | | | | | | | | | | | | |
Series 2006-4, Class AM, 5.20%, 12/12/49 | | | | | | | 50 | | | | 51,314 | |
Series 2007-7, Class A4, 5.74%, 6/12/50 (b) | | | | | | | 82 | | | | 85,003 | |
Morgan Stanley Capital I Trust: | | | | | | | | | | | | |
Series 2007-HQ11, Class AMFL,
0.49%, 2/12/44 (b) | | | | | | | 32 | | | | 31,205 | |
Series 2007-IQ13, Class AM, 5.41%, 3/15/44 | | | | | | | 150 | | | | 153,969 | |
Morgan Stanley Re-REMIC Trust: | | | | | | | | | | | | |
Series 2011-IO, Class C,
0.00%, 3/23/51 (a)(h) | | | | | | | 75 | | | | 71,996 | |
Series 2012-IO, Class AXB2,
1.00%, 3/27/51 (a) | | | | | | | 30 | | | | 30,014 | |
Series 2012-XA, Class A, 2.00%, 7/27/49 (a) | | | | | | | 104 | | | | 103,334 | |
RBSCF Trust, Series 2010-RR3, Class WBTA,
5.95%, 2/16/51 (a)(b) | | | | | | | 835 | | | | 847,781 | |
Resource Capital Corp. Ltd., Series 2014-CRE2, Class A, 1.40%, 4/15/32 (a)(b) | | | | | | | 126 | | | | 125,455 | |
STRIPs Ltd.: | | | | | | | | | | | | |
Series 2012-1A, Class A, 1.50%, 12/25/44 (a) | | | | | | | 102 | | | | 101,162 | |
Series 2012-1A, Class B, 0.50%, 12/25/44 (a) | | | | | | | 110 | | | | 99,594 | |
VFC LLC, Series 2014-2, Class A, 2.75%, 7/20/30 (a) | | | | | | | 29 | | | | 29,143 | |
Wachovia Bank Commercial Mortgage Trust: | | | | | | | | | | | | |
Series 2006-C28, Class AJ,
5.63%, 10/15/48 (b) | | | | | | | 20 | | | | 20,243 | |
Series 2007-C33, Class AJ,
5.95%, 2/15/51 (b) | | | | | | | 53 | | | | 54,015 | |
Wells Fargo Commercial Mortgage Trust: | | | | | | | | | | | | |
Series 2014-TISH, Class SCH1,
3.08%, 1/15/27 (a)(b) | | | | | | | 300 | | | | 291,573 | |
Series 2015-C27, Class C, 3.89%, 2/15/48 | | | | | | | 47 | | | | 42,037 | |
Series 2015-C31, Class D, 3.85%, 11/15/48 | | | | | | | 20 | | | | 14,696 | |
Wells Fargo Resecuritization Trust, Series 2012-IO, Class A, 1.75%, 8/20/21 (a) | | | | | | | 42 | | | | 41,566 | |
| | | | | | | | | | | | |
| | | | | | | | | | | | 8,933,410 | |
Interest Only Commercial Mortgage-Backed Securities — 0.3% | |
Barclays Commercial Mortgage Trust, Series 2015-SRCH, Class XA, 1.12%, 8/10/35 (a)(b) | | | | | | | 1,000 | | | | 82,260 | |
BB-UBS Trust, Series 2012-SHOW, Class XA,
0.60%, 11/05/36 (a)(b) | | | | | | | 4,250 | | | | 202,352 | |
Commercial Mortgage Pass-Through Certificates: | | | | | | | | | | | | |
Series 2013-LC6, Class XA,
1.74%, 1/10/46 (b) | | | | | | | 2,417 | | | | 166,061 | |
Series 2015-3BP, Class XA,
0.06%, 2/10/35 (a)(b) | | | | | | | 2,522 | | | | 20,025 | |
See Notes to Financial Statements.
| | | | | | |
| | | BLACKROCK SERIES FUND, INC. | | DECEMBER 31, 2015 | | 33 |
| | |
| Schedule of Investments (continued) | | BlackRock Balanced Capital Portfolio |
| | | | | | | | | | | | |
| Non-Agency Mortgage-Backed Securities | | | Par (000) | | | Value | |
Interest Only Commercial Mortgage-Backed Securities
(continued) | |
Core Industrial Trust, Series 2015-TEXW, Class XA, 0.77%, 2/10/34 (a)(b) | | | USD | | | | 1,000 | | | $ | 41,670 | |
Credit Suisse Mortgage Capital Certificates, Series 2015-GLPA, Class XA,
0.40%, 11/15/37 (a)(b) | | | | | | | 1,000 | | | | 23,738 | |
GS Mortgage Securities Corp. II, Series 2013-GC10, Class XA,
1.62%, 2/10/46 (b) | | | | | | | 3,112 | | | | 258,696 | |
JPMBB Commercial Mortgage Securities Trust: | | | | | | | | | |
Series 2015-C28, Class XA,
1.21%, 10/15/48 (b) | | | | | | | 997 | | | | 69,150 | |
Series 2015-C33, Class XA,
1.06%, 12/15/48 (b) | | | | | | | 420 | | | | 30,854 | |
Morgan Stanley Bank of America Merrill Lynch Trust, Series 2014-C19, Class XA,
1.16%, 12/15/47 (b) | | | | | | | 754 | | | | 48,832 | |
Wells Fargo Commercial Mortgage Trust, Series 2015-C27, Class XA,
1.00%, 2/15/48 (b) | | | | | | | 995 | | | | 65,406 | |
WF-RBS Commercial Mortgage Trust: | | | | | | | | | | | | |
Series 2014-C24, Class XA,
0.98%, 11/15/47 (b) | | | | | | | 1,099 | | | | 66,738 | |
Series 2014-LC14, Class XA,
1.43%, 3/15/47 (b) | | | | | | | 1,377 | | | | 98,914 | |
| | | | | | | | | | | | |
| | | | | | | | | | | | 1,174,696 | |
Total Non-Agency Mortgage-Backed Securities — 3.1% | | | | 15,246,000 | |
| | | | | | | | | | | | |
| Other Interests (i) | | | | | Beneficial
Interest
(000) | | | | |
Capital Markets — 0.0% | | | | | | | | | | | | |
Lehman Brothers Holdings Capital Trust VII (d)(j) | | | | 130 | | | | 13 | |
Lehman Brothers Holdings, Inc. (d)(j) | | | | | | | 490 | | | | 49 | |
Total Other Interests — 0.0% | | | | | | | | | | | 62 | |
| | | | | | | | | | | | |
| Preferred Securities | | | | | | | | | |
| Capital Trusts | | | | | Par (000) | | | | |
Banks — 0.2% | | | | | | | | | | | | |
Bank of America Corp., 6.10% (b)(k) | | | | | | | 63 | | | | 63,866 | |
Citigroup, Inc.: | | | | | | | | | | | | |
5.90% (b)(k) | | | | | | | 55 | | | | 54,038 | |
Series Q, 5.95% (b)(k) | | | | | | | 179 | | | | 178,441 | |
Series P, 5.95% (b)(k) | | | | | | | 100 | | | | 96,250 | |
Series R, 6.13% (b)(k) | | | | | | | 116 | | | | 118,320 | |
JPMorgan Chase & Co., 5.30% (b)(k) | | | | | | | 75 | | | | 74,719 | |
Royal Bank of Scotland Group PLC,
7.50% (b)(k) | | | | | | | 200 | | | | 208,250 | |
| | | | | | | | | | | | |
| | | | | | | | | | | | 793,884 | |
Capital Markets — 0.0% | | | | | | | | | | | | |
Goldman Sachs Group, Inc., 5.38% (b)(k) | | | | | | | 87 | | | | 86,456 | |
State Street Capital Trust IV,
1.51%, 6/01/77 (b) | | | | | | | 38 | | | | 31,065 | |
| | | | | | | | | | | | |
| | | | | | | | | | | | 117,521 | |
Consumer Finance — 0.0% | | | | | | | | | | | | |
Capital One Financial Corp., 5.55% (b)(k) | | | | | | | 100 | | | | 99,500 | |
| | | | | | | | | | | | |
| Preferred Securities | | | | | Par
(000) | | | Value | |
Insurance — 0.0% | | | | | | | | | | | | |
MetLife, Inc., 5.25% (b)(k) | | | USD | | | | 51 | | | $ | 51,893 | |
Media — 0.1% | | | | | | | | | | | | |
NBCUniversal Enterprise, Inc., 5.25% (a)(k) | | | | | | | 200 | | | | 212,000 | |
Total Capital Trusts — 0.3% | | | | | | | | | | | 1,274,798 | |
| | | | | | | | | | | | |
| Preferred Stocks | | | | | Shares | | | | |
Thrifts & Mortgage Finance — 0.0% | | | | | | | | | | | | |
Fannie Mae, Series S, 8.25% (b) | | | | | | | 10,000 | | | | 35,000 | |
Freddie Mac, Series Z, 0.05% (b) | | | | | | | 10,000 | | | | 34,000 | |
| | | | | | | | | | | | |
| | | | | | | | | | | | 69,000 | |
Total Preferred Stocks — 0.0% | | | | | | | | | | | 69,000 | |
| | | | | | | | | | | | |
| Trust Preferreds | | | | | | | | | |
Banks — 0.1% | | | | | | | | | | | | |
Citigroup Capital XIII, 7.88%, 10/30/40 (b) | | | | | | | 16,773 | | | | 435,930 | |
Consumer Finance — 0.0% | | | | | | | | | | | | |
GMAC Capital Trust I, Series 2, 8.13%, 2/15/40 (b) | | | | | | | 10,500 | | | | 266,280 | |
Total Trust Preferreds — 0.1% | | | | | | | | | | | 702,210 | |
Total Preferred Securities — 0.4% | | | | | | | | | | | 2,046,008 | |
| | | | | | | | | | | | |
| Taxable Municipal Bonds | | | | | Par
(000) | | | | |
Arizona Health Facilities Authority RB,
1.03%, 1/01/37 (b) | | | USD | | | | 60 | | | | 54,238 | |
Bay Area Toll Authority RB: | | | | | | | | | | | | |
6.92%, 4/01/40 | | | | | | | 65 | | | | 85,619 | |
7.04%, 4/01/50 | | | | | | | 45 | | | | 61,928 | |
California State Public Works Board RB,
8.36%, 10/01/34 | | | | | | | 40 | | | | 56,494 | |
City of Charleston, SC Waterworks & Sewer System Revenue RB, 5.00%, 1/01/45 | | | | | | | 35 | | | | 40,816 | |
City of San Jose, CA Airport Revenue RB, AMBAC, 5.00%, 3/01/37 | | | | | | | 45 | | | | 46,643 | |
City Public Service Board of San Antonio, TX RB, 5.81%, 2/01/41 | | | | | | | 45 | | | | 56,078 | |
Clark County School District GO,
5.00%, 6/15/26-6/15/28 | | | | | | | 110 | | | | 134,352 | |
Contra Costa Community College District GO,
6.50%, 8/01/34 | | | | | | | 40 | | | | 49,660 | |
County of Miami-Dade, FL Aviation Revenue RB, 5.00%, 10/01/38 | | | | | | | 90 | | | | 101,542 | |
Delaware Transportation Authority RB,
5.00%, 6/01/55 | | | | | | | 30 | | | | 33,839 | |
Golden State Tobacco Securitization Corp. RB,
5.00%, 6/01/40 | | | | | | | 25 | | | | 28,655 | |
Grant County Public Utility District No. 2 RB,
4.58%, 1/01/40 | | | | | | | 15 | | | | 14,915 | |
Los Angeles Community College District GO,
6.60%, 8/01/42 | | | | | | | 65 | | | | 88,866 | |
Los Angeles Department of Water & Power RB,
6.60%, 7/01/50 | | | | | | | 30 | | | | 40,919 | |
Los Angeles Unified School District GO,
6.76%, 7/01/34 | | | | | | | 60 | | | | 79,051 | |
Massachusetts Development Finance Agency RB, 5.00%, 7/01/44-8/15/45 | | | | | | | 165 | | | | 181,547 | |
See Notes to Financial Statements.
| | | | | | |
| 34 | | BLACKROCK SERIES FUND, INC. | | DECEMBER 31, 2015 | | |
| | |
| Schedule of Investments (continued) | | BlackRock Balanced Capital Portfolio |
| | | | | | | | | | | | |
| Taxable Municipal Bonds | | | | | Par
(000) | | | Value | |
Metropolitan Pier & Exposition Authority RB,
5.00%, 6/15/52 | | | USD | | | | 25 | | | $ | 25,875 | |
Metropolitan St. Louis Sewer District RB,
5.00%, 5/01/45 | | | | | | | 50 | | | | 58,575 | |
Metropolitan Transportation Authority RB: | | | | | | | | | | | | |
6.69%, 11/15/40 | | | | | | | 30 | | | | 39,264 | |
6.81%, 11/15/40 | | | | | | | 55 | | | | 72,838 | |
Metropolitan Washington Airports Authority Dulles Toll Road Revenue RB, 7.46%, 10/01/46 | | | | | | | 30 | | | | 40,342 | |
Miami-Dade County Educational Facilities Authority RB, 5.07%, 4/01/50 | | | | | | | 30 | | | | 31,286 | |
Municipal Electric Authority of Georgia RB,
6.64%, 4/01/57 | | | | | | | 45 | | | | 53,595 | |
New Jersey State Turnpike Authority RB,
7.41%, 1/01/40 | | | | | | | 66 | | | | 93,810 | |
New York City Transitional Finance Authority Building Aid Revenue RB, 5.00%, 7/15/36 | | | | | | | 30 | | | | 35,026 | |
New York City Water & Sewer System RB: | | | | | | | | | | | | |
5.75%, 6/15/41 | | | | | | | 35 | | | | 44,201 | |
5.38%, 6/15/43 | | | | | | | 215 | | | | 250,266 | |
5.50%, 6/15/43 | | | | | | | 255 | | | | 298,722 | |
5.88%, 6/15/44 | | | | | | | 50 | | | | 64,580 | |
New York State Dormitory Authority RB,
5.39%, 3/15/40 | | | | | | | 50 | | | | 59,424 | |
New York State Thruway Authority RB, 5.00%, 1/01/31 | | | | | | | 35 | | | | 41,609 | |
Orange County Local Transportation Authority RB, 6.91%, 2/15/41 | | | | | | | 75 | | | | 101,058 | |
Pennsylvania Economic Development Financing Authority RB, 5.00%, 12/31/38 | | | | | | | 50 | | | | 54,657 | |
Port Authority of New York & New Jersey RB,
4.96%, 8/01/46 | | | | | | | 85 | | | | 91,816 | |
Regents of the University of California Medical Center Pooled Revenue RB, 6.58%, 5/15/49 | | | | | | | 75 | | | | 96,295 | |
Salt River Project Agricultural Improvement & Power District RB, 5.00%, 12/01/45 | | | | | | | 50 | | | | 58,239 | |
State of California GO: | | | | | | | | | | | | |
7.50%, 4/01/34 | | | | | | | 60 | | | | 84,009 | |
7.55%, 4/01/39 | | | | | | | 30 | | | | 43,610 | |
4.99%, 4/01/39 | | | | | | | 40 | | | | 40,879 | |
7.60%, 11/01/40 | | | | | | | 240 | | | | 356,736 | |
State of Connecticut GO, 5.00%, 11/15/32 | | | | | | | 35 | | | | 41,468 | |
State of Illinois GO, 5.10%, 6/01/33 | | | | | | | 230 | | | | 217,591 | |
State of Washington GO, 5.00%, 7/01/28 | | | | | | | 35 | | | | 42,485 | |
University of California RB, 4.86%, 5/15/12 | | | | | | | 50 | | | | 47,830 | |
Utility Debt Securitization Authority RB,
5.00%, 12/15/36-12/15/37 | | | | | | | 85 | | | | 101,831 | |
Wisconsin Department of Transportation RB,
5.00%, 7/01/31 | | | | | | | 35 | | | | 41,989 | |
Total Taxable Municipal Bonds — 0.8% | | | | | | | | | | | 3,785,068 | |
| | | | | | | | | | | | |
| U.S. Government Sponsored Agency Securities | | | | | | | | | |
Collateralized Mortgage Obligations — 0.2% | | | | | | | | | | | | |
Fannie Mae: | | | | | | | | | | | | |
Series 2013-C01, Class M2,
5.67%, 10/25/23 (b) | | | | | | | 590 | | | | 611,432 | |
Series 2014-C01, Class M2,
4.82%, 1/25/24 (b) | | | | | | | 134 | | | | 133,019 | |
| | | | | | | | | | | | |
| | | | | | | | | | | | 744,451 | |
Commercial Mortgage-Backed Securities — 0.0% | | | | | | | | | | | | |
Freddie Mac, Series K050, Class A2, 3.33%, 8/25/25 | | | | | | | 80 | | | | 81,851 | |
| | | | | | | | | | | | |
| U.S. Government Sponsored Agency Securities | | | | | Par
(000) | | | Value | |
Interest Only Commercial Mortgage-Backed Securities — 0.0% | |
Fannie Mae, Series 2014-M13, Class X2,
0.14%, 2/25/24 (b) | | | USD | | | | 5,003 | | | $ | 56,044 | |
Freddie Mac, Series K718, Class X1,
0.65%, 1/25/22 | | | | | | | 194 | | | | 6,509 | |
Ginnie Mae: | | | | | | | | | | | | |
Series 2012-120, Class IO,
0.91%, 2/16/53 (b) | | | | | | | 1,242 | | | | 79,067 | |
Series 2014-40, Class AI,
1.00%, 2/16/39 | | | | | | | 458 | | | | 12,770 | |
Series 2014-52, Class AI,
0.83%, 8/16/41 | | | | | | | 353 | | | | 9,811 | |
| | | | | | | | | | | | |
| | | | | | | | | | | | 164,201 | |
Mortgage-Backed Securities — 16.6% | | | | | | | | | | | | |
Fannie Mae Mortgage-Backed Securities: | | | | | | | | | | | | |
2.35%, 8/01/38 (b) | | | | | | | 109 | | | | 114,713 | |
2.50%, 4/01/30-1/01/31 (l) | | | | | | | 1,607 | | | | 1,621,278 | |
2.96%, 3/01/41 (b) | | | | | | | 57 | | | | 60,329 | |
3.00%, 11/01/26-1/01/46 (l) | | | | | | | 8,555 | | | | 8,708,240 | |
3.13%, 3/01/41 (b) | | | | | | | 74 | | | | 78,299 | |
3.15%, 12/01/40 (b) | | | | | | | 102 | | | | 106,491 | |
3.35%, 6/01/41 (b) | | | | | | | 132 | | | | 138,986 | |
3.50%, 7/01/26-1/01/46 (l) | | | | | | | 15,602 | | | | 16,195,375 | |
3.50%, 9/01/41 (b) | | | | | | | 95 | | | | 99,644 | |
4.00%, 2/01/25-1/01/46 (l) | | | | | | | 6,437 | | | | 6,845,939 | |
4.50%, 2/01/25-1/01/46 (l) | | | | | | | 5,876 | | | | 6,328,113 | |
5.00%, 9/01/33-1/01/46 (l) | | | | | | | 2,349 | | | | 2,589,357 | |
5.50%, 2/01/35-1/01/46 (l) | | | | | | | 1,651 | | | | 1,848,148 | |
6.00%, 12/01/27-1/01/46 (l) | | | | | | | 1,105 | | | | 1,253,204 | |
6.50%, 5/01/40 | | | | | | | 418 | | | | 478,055 | |
Freddie Mac Mortgage-Backed Securities: | | | | | | | | | | | | |
2.50%, 3/01/30-1/01/31 (l) | | | | | | | 983 | | | | 992,128 | |
2.99%, 2/01/41 (b) | | | | | | | 98 | | | | 104,526 | |
3.00%, 5/01/27-1/01/46 (l) | | | | | | | 2,849 | | | | 2,877,170 | |
3.50%, 4/01/42-1/01/46 (l) | | | | | | | 7,956 | | | | 8,200,799 | |
4.00%, 8/01/40-1/01/46 (l) | | | | | | | 4,142 | | | | 4,379,871 | |
4.50%, 2/01/39-1/01/46 (l) | | | | | | | 1,505 | | | | 1,626,464 | |
5.00%, 8/01/40-1/01/46 (l) | | | | | | | 1,557 | | | | 1,703,695 | |
5.50%, 6/01/41-1/01/46 (l) | | | | | | | 341 | | | | 378,510 | |
6.00%, 1/01/34 | | | | | | | 165 | | | | 184,841 | |
Ginnie Mae Mortgage-Backed Securities: | | | | | | | | | | | | |
3.00%, 7/20/45-1/15/46 (l) | | | | | | | 3,025 | | | | 3,069,759 | |
3.50%, 12/15/42-1/15/46 (l) | | | | | | | 5,192 | | | | 5,421,096 | |
4.00%, 9/20/40-1/15/46 (l) | | | | | | | 2,550 | | | | 2,712,539 | |
4.50%, 12/20/39-2/15/42 | | | | | | | 2,394 | | | | 2,596,616 | |
5.00%, 12/15/38-1/15/46 (l) | | | | | | | 1,409 | | | | 1,546,135 | |
5.50%, 1/15/46 (l) | | | | | | | 700 | | | | 777,681 | |
7.50%, 3/15/32 | | | | | | | 5 | | | | 5,671 | |
| | | | | | | | | | | | |
| | | | | | | | | | | | 83,043,672 | |
Total U.S. Government Sponsored Agency Securities — 16.8% | | | | 84,034,175 | |
| | | | | | | | | | | | |
| U.S. Treasury Obligations | | | | | | | | | |
U.S. Treasury Bonds: | | | | | | | | | | | | |
2.88%, 8/15/45 (m) | | | | | | | 4,619 | | | | 4,485,732 | |
3.00%, 11/15/45 | | | | | | | 1,054 | | | | 1,050,830 | |
U.S. Treasury Inflation Indexed Notes: | | | | | | | | | | | | |
0.25%, 1/15/25 | | | | | | | 6,324 | | | | 6,035,269 | |
0.38%, 7/15/25 | | | | | | | 1,088 | | | | 1,053,403 | |
See Notes to Financial Statements.
| | | | | | |
| | | BLACKROCK SERIES FUND, INC. | | DECEMBER 31, 2015 | | 35 |
| | | | |
| Schedule of Investments (continued) | | | BlackRock Balanced Capital Portfolio | |
| | | | | | | | | | | | |
| U.S. Treasury Obligations | | | | | Par (000) | | | Value | |
U.S. Treasury Notes: | | | | | | | | | | | | |
0.75%, 10/31/17 | | | USD | | | | 1,490 | | | $ | 1,482,085 | |
0.88%, 10/15/18 (n) | | | | | | | 7,780 | | | | 7,694,296 | |
1.38%, 10/31/20 | | | | | | | 4,095 | | | | 4,022,699 | |
1.63%, 11/30/20 | | | | | | | 7,831 | | | | 7,784,500 | |
1.88%, 10/31/22 | | | | | | | 2,560 | | | | 2,527,601 | |
2.25%, 11/15/25 | | | | | | | 2,466 | | | | 2,460,508 | |
Total U.S. Treasury Obligations — 7.7% | | | | | | | | | | | 38,596,923 | |
Total Long-Term Investments (Cost — $471,024,944) — 105.0% | | | | 524,220,712 | |
| | | | | | | | | | | | |
| Short-Term Securities | | | | | | | | | |
Borrowed Bond Agreements — 1.1% (o) | | | | | | | | | | | | |
Barclays Capital, Inc., 0.30%, 1/06/16
(Purchased on 12/30/15 to be repurchased at $94,171, collateralized by U.S. Treasury Notes, 1.38% due at 9/30/20, par and fair value of USD 95,600 and $93,949, respectively) | | | | | | | 94 | | | | 94,166 | |
Deutsche Bank Securities, Inc., 0.35%, 1/06/16
(Purchased on 12/30/15 to be repurchased at $49,690, collateralized by U.S. Treasury Bonds, 3.00% due at 5/15/45, par and fair value of USD 50,000 and $49,772, respectively) | | | | | | | 50 | | | | 49,688 | |
Merrill Lynch, Pierce, Fenner & Smith, Inc., 0.30%, 1/04/16
(Purchased on 12/30/15 to be repurchased at $5,551,163, collateralized by U.S. Treasury Notes, 2.00% due at 8/15/25, par and fair value of USD 5,657,000 and $5,515,796, respectively) | | | | | | | 5,551 | | | | 5,550,931 | |
Total Borrowed Bond Agreements (Cost — $5,694,785) — 1.1% | | | | 5,694,785 | |
| | | | | | | | | | | | |
| Money Market Funds | | | | | Shares | | | | |
BlackRock Liquidity Funds, TempFund, Institutional Class, 0.23% (g)(p) | | | | | | | 87,935 | | | | 87,935 | |
| | | | | | Beneficial Interest (000) | | | | |
Money Market Funds — 0.8% | | | | | | | | | | | | |
BlackRock Liquidity Series, LLC, Money Market Series, 0.39% (g)(p)(q) | | | USD | | | | 3,965 | | | | 3,964,938 | |
Total Short-Term Securities (Cost — $9,747,658) — 1.9% | | | | 9,747,658 | |
| | | | | | | | | | | | |
| Options Purchased | | | | | | | | Value | |
(Cost — $26,021) — 0.0% | | | | | | | | | | $ | 16,823 | |
Total Investments Before Borrowed Bonds and TBA Sale Commitments (Cost — $480,798,623) — 106.9% | | | | 533,985,193 | |
| | | | | | | | | | | | |
| Borrowed Bonds | | | | | Par (000) | | | | |
U.S. Treasury Obligations — (1.1)% | | | | | | | | | | | | |
U.S. Treasury Bonds, 3.00%, 5/15/45 | | | USD | | | | 50 | | | | (49,772 | ) |
U.S. Treasury Notes: | | | | | | | | | | | | |
1.38%, 9/30/20 | | | | | | | 96 | | | | (93,949 | ) |
2.00%, 8/15/25 | | | | | | | 5,657 | | | | (5,515,796 | ) |
Total Borrowed Bonds (Proceeds — $5,696,713) — (1.1)% | | | | (5,659,517 | ) |
| | | | | | | | | | | | |
| TBA Sale Commitments (l) | | | | | | | | | |
Fannie Mae Mortgage-Backed Securities: | | | | | | | | | | | | |
3.00%, 1/01/31-1/01/46 | | | | | | | 2,657 | | | | (2,722,023 | ) |
3.50%, 1/01/31-1/01/46 | | | | | | | 13,062 | | | | (13,499,597 | ) |
4.00%, 1/01/31-1/01/46 | | | | | | | 1,512 | | | | (1,587,543 | ) |
4.50%, 1/01/46 | | | | | | | 2,424 | | | | (2,617,289 | ) |
5.00%, 1/01/46 | | | | | | | 1,900 | | | | (2,090,722 | ) |
5.50%, 1/01/46 | | | | | | | 1,000 | | | | (1,114,270 | ) |
Freddie Mac Mortgage-Backed Securities: | | | | | | | | | | | | |
3.00%, 1/01/31 | | | | | | | 378 | | | | (389,519 | ) |
3.50%, 1/01/46 | | | | | | | 4,526 | | | | (4,654,620 | ) |
4.00%, 1/01/46 | | | | | | | 675 | | | | (713,061 | ) |
5.00%, 1/01/46 | | | | | | | 500 | | | | (546,150 | ) |
6.00%, 1/01/46 | | | | | | | 100 | | | | (112,457 | ) |
Ginnie Mae Mortgage-Backed Securities: | | | | | | | | | | | | |
3.50%, 1/15/46 | | | | | | | 400 | | | | (416,148 | ) |
4.00%, 1/15/46 | | | | | | | 155 | | | | (164,421 | ) |
4.50%, 1/15/46 | | | | | | | 52 | | | | (55,868 | ) |
Total TBA Sale Commitments (Proceeds — $30,679,859) — (6.2)% | | | | | | | | | | | (30,683,688 | ) |
Total Investments Net of Borrowed Bonds and TBA Sale Commitments — 99.6% | | | | 497,641,988 | |
Other Assets Less Liabilities — 0.4% | | | | | | | | | | | 1,796,716 | |
| | | | | | | | | | | | |
Net Assets — 100.0% | | | | | | | | | | $ | 499,438,704 | |
| | | | | | | | | | | | |
|
| Notes to Schedule of Investments |
| (a) | Security exempt from registration pursuant to Rule 144A under the Securities Act of 1933, as amended. These securities may be resold in transactions exempt from registration to qualified institutional investors. |
| (b) | Variable rate security. Rate as of period end. |
| (c) | Step-up bond that pays an initial coupon rate for the first period and then a higher coupon rate for the following periods. Rate as of period end. |
| (d) | Non-income producing security. |
| (e) | Security, or a portion of security, is on loan. |
| (f) | Payment-in-kind security which may pay interest/dividends in additional par/shares and/or in cash. Rates shown are the current rate and possible payment rates. |
See Notes to Financial Statements.
| | | | | | |
| 36 | | BLACKROCK SERIES FUND, INC. | | DECEMBER 31, 2015 | | |
| | | | |
| Schedule of Investments (continued) | | | BlackRock Balanced Capital Portfolio | |
| (g) | During the year ended December 31, 2015, investments in issuers considered to be an affiliate of the Fund for purposes of Section 2(a)(3) of the Investment Company Act of 1940, as amended, were as follows: |
| | | | | | | | | | | | | | | | | | | | | | | | | | | | | | | | | | | |
| Affiliate | | Shares/
Beneficial
Interest Held at
December 31,
2014 | | Shares/
Beneficial
Interest
Purchased | | Shares/
Beneficial
Interest
Sold | | Shares/
Beneficial
Interest Held at
December 31,
2015 | | Value at
December 31,
2015 | | Income | | Realized
Gain |
BlackRock Liquidity Funds, TempFund, Institutional Class | | | | 1,865,211 | | | | | — | | | | | (1,777,276 | )1 | | | | 87,935 | | | | | $ 87,935 | | | | $ | 7,534 | | | | | $139 | |
BlackRock Liquidity Series, LLC, Money Market Series | | | | $ 561,281 | | | | $ | 3,403,657 | 2 | | | | — | | | | | $3,964,938 | | | | | $3,964,938 | | | | $ | 13,586 | 3 | | | | — | |
iShares iBoxx $ High Yield Corporate Bond ETF | | | | — | | | | | 29,546 | | | | | — | | | | | 29,546 | | | | | $2,380,817 | | | | | — | | | | | — | |
| | 1 | | Represents net shares sold. |
| | 2 | | Represents net beneficial interest purchased. |
| | 3 | | Represents securities lending income earned from the reinvestment of cash collateral from loaned securities, net of fees, and other payments to and from borrowers of securities, and less the collateral investment expenses |
| (i) | Other interests represent beneficial interests in liquidation trusts and other reorganization or private entities. |
| (j) | Issuer filed for bankruptcy and/or is in default of interest payments. |
| (k) | Perpetual security with no stated maturity date. |
| (l) | Represents or includes a TBA transaction. As of period end, unsettled TBA transactions were as follows: |
| | | | | | | | |
| Counterparty | | Value | | | Unrealized
Appreciation
(Depreciation) | |
Barclays Capital, Inc. | | $ | (2,459,840 | ) | | | $ 3,025 | |
BNP Paribas Securities Corp. | | $ | 100,791 | | | | $ (84 | ) |
Citigroup Global Markets, Inc. | | $ | (1,527,651 | ) | | | $ 1,367 | |
Credit Suisse Securities (USA) LLC | | $ | 757,792 | | | | $ 2,100 | |
Deutsche Bank Securities, Inc. | | $ | (560,502 | ) | | | $ 730 | |
Goldman Sachs & Co. | | $ | (3,179,752 | ) | | | $(1,515 | ) |
J.P. Morgan Securities LLC | | $ | (3,632,588 | ) | | | $ 3,337 | |
Merrill Lynch, Pierce, Fenner & Smith, Inc. | | $ | 386,865 | | | | $(2,349 | ) |
Morgan Stanley & Co. LLC | | $ | 967,246 | | | | $ 390 | |
Nomura Securities International, Inc. | | $ | 101,355 | | | | $ 246 | |
RBC Capital Markets, LLC | | $ | 100,791 | | | | $ (69 | ) |
Wells Fargo Securities, LLC | | $ | 110,870 | | | | $ (127 | ) |
| (m) | All or a portion of security has been pledged in connection with outstanding financial futures contracts. |
| (n) | All or a portion of security has been pledged as collateral in connection with outstanding reverse repurchase agreements. |
| (o) | Certain agreements have no stated maturity and can be terminated by either party at any time. |
| (p) | Current yield as of period end. |
| (q) | Security was purchased with the cash collateral from loaned securities. The Fund may withdraw up to 25% of its investment daily, although the manager of the BlackRock Liquidity Series, LLC, Money Market Series, in its sole discretion, may permit an investor to withdraw more than 25% on any one day. |
| • | | For Fund compliance purposes, the Fund’s industry classifications refer to any one or more of the industry sub-classifications used by one or more widely recognized market indexes or ratings group indexes, and/or as defined by the investment advisor. These definitions may not apply for purposes of this report, which may combine such industry sub-classifications for reporting ease. |
Reverse Repurchase Agreements
| | | | | | | | | | | | | | |
| Counterparty | | Interest
Rate | | Trade
Date | | Maturity
Date1 | | Face Value | | Face Value
Including
Accrued
Interest | | Type of Underlying
Collateral | | Remaining
Contractual
Maturity of the
Agreements |
Deutsche Bank Securities, Inc. | | (0.40)% | | 11/02/15 | | Open | | $7,741,100 | | $7,741,100 | | U.S. Treasury Obligations | | Open/Demand1 |
| | 1 | | Certain agreements have no stated maturity and can be terminated by either party at any time. |
|
| Derivative Financial Instruments Outstanding as of Period End |
Financial Futures Contracts
| | | | | | | | | | | | | | | | |
Contracts Long (Short) | | Issue | | Expiration | | Notional Value | | | Unrealized
Appreciation
(Depreciation) | |
| (5) | | Euro-Bund | | March 2016 | | | USD | | | | 858,102 | | | | $ (4,103 | ) |
| 22 | | U.S. Treasury Bonds (30 Year) | | March 2016 | | | USD | | | | 3,382,500 | | | | 16,528 | |
| 53 | | U.S. Treasury Notes (10 Year) | | March 2016 | | | USD | | | | 6,673,031 | | | | (23,143 | ) |
| 64 | | U.S. Treasury Notes (2 Year) | | March 2016 | | | USD | | | | 13,903,000 | | | | (22,784 | ) |
See Notes to Financial Statements.
| | | | | | |
| | | BLACKROCK SERIES FUND, INC. | | DECEMBER 31, 2015 | | 37 |
| | | | |
| Schedule of Investments (continued) | | | BlackRock Balanced Capital Portfolio | |
| | | | | | | | | | | | | | | | |
Contracts
Long (Short) | | Issue | | Expiration | | Notional Value | | | Unrealized
Appreciation
(Depreciation) | |
| 60 | | U.S. Treasury Notes (5 Year) | | March 2016 | | | USD | | | | 7,099,219 | | | | $(14,038 | ) |
| 27 | | U.S. Ultra Treasury Bonds | | March 2016 | | | USD | | | | 4,284,563 | | | | 20,393 | |
| (124) | | Euro Dollar Futures | | December 2017 | | | USD | | | | 30,449,750 | | | | 38,644 | |
| Total | | | | | | | | | | | | | | | $11,497 | |
| | | | | | | | | | | | | | | | |
Forward Foreign Currency Exchange Contracts
| | | | | | | | | | | | | | | | | | | | | | |
Currency
Purchased | | | Currency
Sold | | | Counterparty | | Settlement
Date | | | Unrealized
Appreciation
(Depreciation) | |
| USD | | | 826,181 | | | | EUR | | | | 780,000 | | | UBS AG | | | 1/06/16 | | | | $(21,616 | ) |
| USD | | | 279,319 | | | | MXN | | | | 4,640,000 | | | Société Générale | | | 1/06/16 | | | | 10,212 | |
| USD | | | 79,065 | | | | IDR | | | | 1,123,515,180 | | | HSBC Bank PLC | | | 1/14/16 | | | | (2,149 | ) |
| MXN | | | 992,937 | | | | USD | | | | 57,816 | | | State Street Bank and Trust Co. | | | 1/15/16 | | | | (267 | ) |
| PLN | | | 623,026 | | | | USD | | | | 157,092 | | | Standard Chartered Bank | | | 1/15/16 | | | | 1,678 | |
| PLN | | | 1,079,251 | | | | USD | | | | 273,035 | | | Standard Chartered Bank | | | 1/15/16 | | | | 1,998 | |
| USD | | | 122,744 | | | | MXN | | | | 2,038,147 | | | Morgan Stanley & Co. International PLC | | | 1/15/16 | | | | 4,617 | |
| USD | | | 746,466 | | | | PLN | | | | 3,017,664 | | | Citibank N.A. | | | 1/15/16 | | | | (22,546 | ) |
| USD | | | 48,148 | | | | PLN | | | | 190,438 | | | Goldman Sachs International | | | 1/15/16 | | | | (383 | ) |
| MXN | | | 1,250,545 | | | | USD | | | | 73,447 | | | State Street Bank and Trust Co. | | | 1/20/16 | | | | (994 | ) |
| USD | | | 221,804 | | | | MXN | | | | 3,733,741 | | | Royal Bank of Scotland PLC | | | 1/20/16 | | | | 5,483 | |
| MXN | | | 1,576,113 | | | | USD | | | | 91,832 | | | Citibank N.A. | | | 1/26/16 | | | | (557 | ) |
| RUB | | | 3,183,142 | | | | USD | | | | 45,348 | | | BNP Paribas S.A. | | | 2/09/16 | | | | (2,220 | ) |
| USD | | | 60,361 | | | | RUB | | | | 4,236,929 | | | BNP Paribas S.A. | | | 2/09/16 | | | | 2,955 | |
| MXN | | | 994,795 | | | | USD | | | | 58,342 | | | State Street Bank and Trust Co. | | | 2/10/16 | | | | (796 | ) |
| USD | | | 214,669 | | | | MXN | | | | 3,642,635 | | | Goldman Sachs International | | | 2/10/16 | | | | 3,951 | |
| Total | | | | | | | | | | | | | | | | | | | | | $(20,634 | ) |
| | | | | | | | | | | | | | | | | | | | | | |
Exchange-Traded Options Purchased
| | | | | | | | | | | | | | | | | | |
| Description | | Put/
Call | | Expiration
Date | | Strike Price | | | Contracts | | Value | |
Euro Dollar 90-Day | | Put | | 3/11/16 | | | USD | | | | 98.38 | | | 206 | | | $ 14,163 | |
OTC Interest Rate Swaptions Purchased
| | | | | | | | | | | | | | | | | | | | | | | | |
| Description | | Counterparty | | Put/
Call | | Exercise Rate | | Pay/Receive
Exercise Rate | | Floating Rate
Index | | Expiration
Date | | Notional
Amount (000) | | | Value | |
10-Year Interest Rate Swap | | JPMorgan Chase
Bank N.A. | | Call | | 2.00% | | Receive | | 3-month LIBOR | | 1/19/16 | | | USD | | | | 4,357 | | | | $2,660 | |
Centrally Cleared Credit Default Swaps — Buy Protection
| | | | | | | | | | | | | | | | | | |
| Index | | Pay
Fixed
Rate | | Expiration
Date | | | Notional Amount (000) | | | Unrealized
Depreciation | |
CDX.NA.HY Series 25 Version 1 | | 5.00% | | | 12/20/20 | | | | USD | | | | 1,020 | | | | $(15,560 | ) |
See Notes to Financial Statements.
| | | | | | |
| 38 | | BLACKROCK SERIES FUND, INC. | | DECEMBER 31, 2015 | | |
| | | | |
| Schedule of Investments (continued) | | | BlackRock Balanced Capital Portfolio | |
Centrally Cleared Interest Rate Swaps
| | | | | | | | | | | | | | | | |
Fixed Rate | | Floating Rate | | | Effective
Date | | Expiration
Date | | Notional Amount (000) | | | Unrealized
Appreciation
(Depreciation) | |
0.65%1 | | | 3-month LIBOR | | | N/A | | 11/26/16 | | USD | 695 | | | | $ 928 | |
1.26%1 | | | 3-month LIBOR | | | 1/12/162 | | 1/12/17 | | USD | 9,370 | | | | (34,584 | ) |
2.13%3 | | | 3-month LIBOR | | | N/A | | 8/25/25 | | USD | 65 | | | | 279 | |
Total | | | | | | | | | | | | | | | $(33,377 | ) |
| | | | | | | | | | | | | | | | |
| | 1 | | Fund pays the fixed rate and receives the floating rate. |
| | 3 | | Fund pays the floating rate and receives the fixed rate. |
OTC Credit Default Swaps — Buy Protection
| | | | | | | | | | | | | | | | | | | | | | | | | | | | |
| Issuer | | Pay
Fixed
Rate | | | Counterparty | | Expiration
Date | | Notional
Amount
(000) | | | Value | | | Premiums
Paid
(Received) | | | Unrealized
Appreciation
(Depreciation) | |
United Mexican States | | | 1.00 | % | | JPMorgan Chase Bank N.A. | | 6/20/20 | | | USD | | | | 209 | | | $ | 5,096 | | | $ | 1,649 | | | | $ 3,447 | |
United Mexican States | | | 1.00 | % | | Bank of America N.A. | | 9/20/20 | | | USD | | | | 209 | | | | 5,885 | | | | 2,488 | | | | 3,397 | |
Deutsche Bank AG | | | 1.00 | % | | Bank of America N.A. | | 12/20/20 | | | EUR | | | | 360 | | | | (1,043 | ) | | | (2,478 | ) | | | 1,435 | |
Standard Chartered PLC | | | 1.00 | % | | Bank of America N.A. | | 12/20/20 | | | EUR | | | | 400 | | | | 7,141 | | | | 7,724 | | | | (583 | ) |
HSBC Bank PLC | | | 1.00 | % | | BNP Paribas S.A. | | 12/20/20 | | | EUR | | | | 320 | | | | (5,058 | ) | | | (831 | ) | | | (4,227 | ) |
Standard Chartered PLC | | | 1.00 | % | | BNP Paribas S.A. | | 12/20/20 | �� | | EUR | | | | 140 | | | | 2,499 | | | | 3,572 | | | | (1,073 | ) |
Standard Chartered PLC | | | 1.00 | % | | BNP Paribas S.A. | | 12/20/20 | | | EUR | | | | 110 | | | | 1,963 | | | | 2,926 | | | | (963 | ) |
HSBC Holdings PLC | | | 1.00 | % | | Citibank N.A. | | 12/20/20 | | | EUR | | | | 450 | | | | (7,113 | ) | | | (1,657 | ) | | | (5,456 | ) |
HSBC Holdings PLC | | | 1.00 | % | | Citibank N.A. | | 12/20/20 | | | EUR | | | | 260 | | | | (4,110 | ) | | | (816 | ) | | | (3,294 | ) |
Standard Chartered PLC | | | 1.00 | % | | Citibank N.A. | | 12/20/20 | | | EUR | | | | 370 | | | | 6,605 | | | | 4,169 | | | | 2,436 | |
Standard Chartered PLC | | | 1.00 | % | | Citibank N.A. | | 12/20/20 | | | EUR | | | | 240 | | | | 4,284 | | | | 6,762 | | | | (2,478 | ) |
Standard Chartered PLC | | | 1.00 | % | | Goldman Sachs International | | 12/20/20 | | | EUR | | | | 190 | | | | 3,391 | | | | 2,159 | | | | 1,232 | |
HSBC Bank PLC | | | 1.00 | % | | JPMorgan Chase Bank N.A. | | 12/20/20 | | | EUR | | | | 370 | | | | (5,848 | ) | | | (5,556 | ) | | | (292 | ) |
HSBC Bank PLC | | | 1.00 | % | | JPMorgan Chase Bank N.A. | | 12/20/20 | | | EUR | | | | 370 | | | | (5,848 | ) | | | (3,183 | ) | | | (2,665 | ) |
Standard Chartered PLC | | | 1.00 | % | | Morgan Stanley Capital Services LLC | | 12/20/20 | | | EUR | | | | 160 | | | | 2,857 | | | | 2,616 | | | | 241 | |
Standard Chartered PLC | | | 1.00 | % | | Morgan Stanley Capital Services LLC | | 12/20/20 | | | EUR | | | | 60 | | | | 1,071 | | | | 1,627 | | | | (556 | ) |
Federation of Malaysia | | | 1.00 | % | | Bank of America N.A. | | 12/20/20 | | | USD | | | | 39 | | | | 1,460 | | | | 2,084 | | | | (624 | ) |
Republic of South Africa | | | 1.00 | % | | Bank of America N.A. | | 12/20/20 | | | USD | | | | 50 | | | | 5,117 | | | | 5,121 | | | | (4 | ) |
Federation of Malaysia | | | 1.00 | % | | Barclays Bank PLC | | 12/20/20 | | | USD | | | | 36 | | | | 1,349 | | | | 1,820 | | | | (471 | ) |
Federation of Malaysia | | | 1.00 | % | | Barclays Bank PLC | | 12/20/20 | | | USD | | | | 20 | | | | 748 | | | | 1,248 | | | | (500 | ) |
Loews Corp. | | | 1.00 | % | | Barclays Bank PLC | | 12/20/20 | | | USD | | | | 110 | | | | (4,033 | ) | | | (4,134 | ) | | | 101 | |
Republic of South Africa | | | 1.00 | % | | Barclays Bank PLC | | 12/20/20 | | | USD | | | | 95 | | | | 9,722 | | | | 9,768 | | | | (46 | ) |
Federation of Malaysia | | | 1.00 | % | | BNP Paribas S.A. | | 12/20/20 | | | USD | | | | 30 | | | | 1,135 | | | | 1,704 | | | | (569 | ) |
Federation of Malaysia | | | 1.00 | % | | BNP Paribas S.A. | | 12/20/20 | | | USD | | | | 20 | | | | 755 | | | | 1,277 | | | | (522 | ) |
Federation of Malaysia | | | 1.00 | % | | Citibank N.A. | | 12/20/20 | | | USD | | | | 30 | | | | 1,135 | | | | 1,571 | | | | (436 | ) |
Federation of Malaysia | | | 1.00 | % | | Citibank N.A. | | 12/20/20 | | | USD | | | | 30 | | | | 1,135 | | | | 1,609 | | | | (474 | ) |
Republic of the Philippines | | | 1.00 | % | | Citibank N.A. | | 12/20/20 | | | USD | | | | 106 | | | | 462 | | | | (140 | ) | | | 602 | |
Republic of the Philippines | | | 1.00 | % | | Citibank N.A. | | 12/20/20 | | | USD | | | | 53 | | | | 231 | | | | (20 | ) | | | 251 | |
Republic of the Philippines | | | 1.00 | % | | Citibank N.A. | | 12/20/20 | | | USD | | | | 52 | | | | 229 | | | | (20 | ) | | | 249 | |
Australia and New Zealand Banking Group Ltd. | | | 1.00 | % | | Deutsche Bank AG | | 12/20/20 | | | USD | | | | 410 | | | | (3,817 | ) | | | (3,237 | ) | | | (580 | ) |
Australia and New Zealand Banking Group Ltd. | | | 1.00 | % | | Goldman Sachs International | | 12/20/20 | | | USD | | | | 1,155 | | | | (10,754 | ) | | | (6,456 | ) | | | (4,298 | ) |
Federation of Malaysia | | | 1.00 | % | | HSBC Bank PLC | | 12/20/20 | | | USD | | | | 30 | | | | 1,135 | | | | 1,647 | | | | (512 | ) |
Republic of South Africa | | | 1.00 | % | | HSBC Bank PLC | | 12/20/20 | | | USD | | | | 53 | | | | 5,424 | | | | 5,166 | | | | 258 | |
Australia and New Zealand Banking Group Ltd. | | | 1.00 | % | | JPMorgan Chase Bank N.A. | | 12/20/20 | | | USD | | | | 128 | | | | (1,196 | ) | | | (468 | ) | | | (728 | ) |
Australia and New Zealand Banking Group Ltd. | | | 1.00 | % | | JPMorgan Chase Bank N.A. | | 12/20/20 | | | USD | | | | 117 | | | | (1,085 | ) | | | (327 | ) | | | (758 | ) |
See Notes to Financial Statements.
| | | | | | |
| | | BLACKROCK SERIES FUND, INC. | | DECEMBER 31, 2015 | | 39 |
| | | | |
| Schedule of Investments (continued) | | | BlackRock Balanced Capital Portfolio | |
| | | | | | | | | | | | | | | | | | | | | | | | | | | | |
| Issuer | | Pay
Fixed
Rate | | | Counterparty | | Expiration
Date | | Notional
Amount
(000) | | | Value | | | Premiums
Paid
(Received) | | | Unrealized
Appreciation
(Depreciation) | |
Republic of South Africa | | | 1.00 | % | | JPMorgan Chase Bank N.A. | | 12/20/20 | | | USD | | | | 50 | | | | $ 5,116 | | | | $ 5,181 | | | | $ (65 | ) |
Total | | | | | | | | | | | | | | | | | | | $26,040 | | | | $44,565 | | | | $(18,525 | ) |
| | | | | | | | | | | | | | | | | | | | |
OTC Credit Default Swaps — Sell Protection
| | | | | | | | | | | | | | | | | | | | | | | | | | | | | | | | |
| Issuer/Index | | Receive
Fixed
Rate | | | Counterparty | | | Expiration
Date | | Credit
Rating1 | | Notional
Amount
(000)2 | | | Value | | | Premiums
Paid
(Received) | | | Unrealized
Appreciation
(Depreciation) | |
Transocean, Inc. | | | 1.00 | % | | | Goldman Sachs International | | | 6/20/19 | | BB+ | | | USD | | | | 145 | | | | $ (46,506 | ) | | | $ (3,155 | ) | | | $ (43,351 | ) |
Transocean, Inc. | | | 1.00 | % | | | Goldman Sachs International | | | 6/20/19 | | BB+ | | | USD | | | | 25 | | | | (8,018 | ) | | | (543 | ) | | | (7,475 | ) |
Transocean, Inc. | | | 1.00 | % | | | Bank of America N.A. | | | 12/20/19 | | BB+ | | | USD | | | | 45 | | | | (16,304 | ) | | | (2,883 | ) | | | (13,421 | ) |
Transocean, Inc. | | | 1.00 | % | | | Bank of America N.A. | | | 12/20/19 | | BB+ | | | USD | | | | 40 | | | | (14,492 | ) | | | (2,419 | ) | | | (12,073 | ) |
Transocean, Inc. | | | 1.00 | % | | | Bank of America N.A. | | | 12/20/19 | | BB+ | | | USD | | | | 35 | | | | (12,681 | ) | | | (2,169 | ) | | | (10,512 | ) |
United Mexican States | | | 1.00 | % | | | Bank of America N.A. | | | 6/20/20 | | BBB+ | | | USD | | | | 209 | | | | (5,095 | ) | | | (1,911 | ) | | | (3,184 | ) |
United Mexican States | | | 1.00 | % | | | JPMorgan Chase Bank N.A. | | | 9/20/20 | | BBB+ | | | USD | | | | 209 | | | | (5,885 | ) | | | (2,660 | ) | | | (3,225 | ) |
Republic of Indonesia | | | 1.00 | % | | | Barclays Bank PLC | | | 12/20/20 | | BB+ | | | USD | | | | 62 | | | | (3,682 | ) | | | (3,161 | ) | | | (521 | ) |
Republic of Indonesia | | | 1.00 | % | | | Barclays Bank PLC | | | 12/20/20 | | BB+ | | | USD | | | | 47 | | | | (2,762 | ) | | | (2,431 | ) | | | (331 | ) |
Republic of Indonesia | | | 1.00 | % | | | Barclays Bank PLC | | | 12/20/20 | | BB+ | | | USD | | | | 30 | | | | (1,761 | ) | | | (1,427 | ) | | | (334 | ) |
Republic of Indonesia | | | 1.00 | % | | | Barclays Bank PLC | | | 12/20/20 | | BB+ | | | USD | | | | 30 | | | | (1,761 | ) | | | (1,380 | ) | | | (381 | ) |
Republic of Indonesia | | | 1.00 | % | | | Barclays Bank PLC | | | 12/20/20 | | BB+ | | | USD | | | | 30 | | | | (1,761 | ) | | | (1,406 | ) | | | (355 | ) |
Republic of Indonesia | | | 1.00 | % | | | Barclays Bank PLC | | | 12/20/20 | | BB+ | | | USD | | | | 27 | | | | (1,600 | ) | | | (1,354 | ) | | | (246 | ) |
Republic of Indonesia | | | 1.00 | % | | | Citibank N.A. | | | 12/20/20 | | BB+ | | | USD | | | | 117 | | | | (6,926 | ) | | | (5,703 | ) | | | (1,223 | ) |
Republic of Indonesia | | | 1.00 | % | | | Citibank N.A. | | | 12/20/20 | | BB+ | | | USD | | | | 60 | | | | (3,582 | ) | | | (3,076 | ) | | | (506 | ) |
Republic of Indonesia | | | 1.00 | % | | | Citibank N.A. | | | 12/20/20 | | BB+ | | | USD | | | | 58 | | | | (3,464 | ) | | | (2,902 | ) | | | (562 | ) |
Republic of Indonesia | | | 1.00 | % | | | Citibank N.A. | | | 12/20/20 | | BB+ | | | USD | | | | 58 | | | | (3,435 | ) | | | (2,878 | ) | | | (557 | ) |
Republic of Indonesia | | | 1.00 | % | | | HSBC Bank PLC | | | 12/20/20 | | BB+ | | | USD | | | | 66 | | | | (3,918 | ) | | | (3,364 | ) | | | (554 | ) |
Russian Federation | | | 1.00 | % | | | Barclays Bank PLC | | | 12/20/20 | | BB+ | | | USD | | | | 98 | | | | (8,995 | ) | | | (8,123 | ) | | | (872 | ) |
CMBX.NA Series 3 AM | | | 0.50 | % | | | Credit Suisse International | | | 12/13/49 | | BBB- | | | USD | | | | 670 | | | | (9,675 | ) | | | (61,798 | ) | | | 52,123 | |
CMBX.NA Series 3 AM | | | 0.50 | % | | | Goldman Sachs International | | | 12/13/49 | | BBB- | | | USD | | | | 1,320 | | | | (19,061 | ) | | | (123,292 | ) | | | 104,231 | |
CMBX.NA Series 4 AM | | | 0.50 | % | | | Deutsche Bank AG | | | 2/17/51 | | BB | | | USD | | | | 120 | | | | (2,425 | ) | | | (16,723 | ) | | | 14,298 | |
CMBX.NA Series 8 BBB- | | | 3.00 | % | | | Barclays Bank PLC | | | 10/17/57 | | BBB- | | | USD | | | | 30 | | | | (3,763 | ) | | | (3,281 | ) | | | (482 | ) |
CMBX.NA Series 8 BBB- | | | 3.00 | % | | | Barclays Bank PLC | | | 10/17/57 | | BBB- | | | USD | | | | 30 | | | | (3,762 | ) | | | (3,198 | ) | | | (564 | ) |
CMBX.NA Series 8 BBB- | | | 3.00 | % | | | Credit Suisse International | | | 10/17/57 | | NR | | | USD | | | | 20 | | | | (2,508 | ) | | | (2,126 | ) | | | (382 | ) |
Total | | | | | | | | | | | | | | | | | | | | | | | $(193,822 | ) | | | $(263,363 | ) | | | $ 69,541 | |
| | | | | | | | | | | | | | | | | | | | | | | | |
| | 1 | | Using S&P’s rating of the issuer or the underlying securities of the index, as applicable. |
| | 2 | | The maximum potential amount the Fund may pay should a negative credit event take place as defined under the terms of the agreement. |
OTC Interest Rate Swaps
| | | | | | | | | | | | | | | | | | | | | | | | | | |
Fixed Rate | | Floating Rate | | Counterparty | | Expiration
Date | | Notional Amount (000) | | | Value | | | Premiums
Paid
(Received) | | | Unrealized
Appreciation
(Depreciation) | |
| 12.30%1 | | 1-day BZDIOVER | | Bank of America N.A. | | 1/04/16 | | | BRL | | | | 2,954 | | | | $ 7,775 | | | | — | | | | $ 7,775 | |
| 12.30%2 | | 1-day BZDIOVER | | Credit Suisse International | | 1/04/16 | | | BRL | | | | 1,936 | | | | (5,096 | ) | | | — | | | | (5,096 | ) |
| 11.36%2 | | 1-day BZDIOVER | | Credit Suisse International | | 1/04/16 | | | BRL | | | | 1,404 | | | | (6,802 | ) | | | — | | | | (6,802 | ) |
| 11.12%2 | | 1-day BZDIOVER | | Credit Suisse International | | 1/04/16 | | | BRL | | | | 367 | | | | (2,100 | ) | | | — | | | | (2,100 | ) |
| 11.26%2 | | 1-day BZDIOVER | | Deutsche Bank AG | | 1/04/16 | | | BRL | | | | 339 | | | | (1,788 | ) | | | — | | | | (1,788 | ) |
| 12.14%1 | | 1-day BZDIOVER | | JPMorgan Chase Bank N.A. | | 1/04/16 | | | BRL | | | | 2,490 | | | | 6,749 | | | | — | | | | 6,749 | |
| 11.80%1 | | 1-day BZDIOVER | | JPMorgan Chase Bank N.A. | | 1/04/16 | | | BRL | | | | 1,716 | | | | 5,071 | | | | — | | | | 5,071 | |
See Notes to Financial Statements.
| | | | | | |
| 40 | | BLACKROCK SERIES FUND, INC. | | DECEMBER 31, 2015 | | |
| | | | |
| Schedule of Investments (continued) | | | BlackRock Balanced Capital Portfolio | |
| | | | | | | | | | | | | | | | | | | | | | | | | | |
Fixed Rate | | Floating Rate | | Counterparty | | Expiration
Date | | Notional Amount (000) | | | Value | | | Premiums
Paid
(Received) | | | Unrealized
Appreciation
(Depreciation) | |
| 12.13%1 | | 1-day BZDIOVER | | JPMorgan Chase Bank N.A. | | 1/04/16 | | | BRL | | | | 1,312 | | | | $ 3,596 | | | | — | | | | $ 3,596 | |
| 11.85%2 | | 1-day BZDIOVER | | JPMorgan Chase Bank N.A. | | 1/04/16 | | | BRL | | | | 860 | | | | (2,995 | ) | | | — | | | | (2,995 | ) |
| 11.91%2 | | 1-day BZDIOVER | | JPMorgan Chase Bank N.A. | | 1/04/16 | | | BRL | | | | 770 | | | | (1,524 | ) | | | — | | | | (1,524 | ) |
| 5.72%2 | | Colombia Overnight Interbank
Reference Rate | | Goldman Sachs International | | 2/24/16 | | | COP | | | | 1,276,073 | | | | 274 | | | | — | | | | 274 | |
| 5.70%2 | | Colombia Overnight Interbank
Reference Rate | | Credit Suisse International | | 2/25/16 | | | COP | | | | 1,242,911 | | | | 122 | | | | — | | | | 122 | |
| 5.70%2 | | Colombia Overnight Interbank
Reference Rate | | Credit Suisse International | | 2/25/16 | | | COP | | | | 1,113,648 | | | | 109 | | | | — | | | | 109 | |
| 5.70%2 | | Colombia Overnight Interbank
Reference Rate | | Credit Suisse International | | 2/25/16 | | | COP | | | | 1,080,589 | | | | 106 | | | | — | | | | 106 | |
| 2.25%2 | | 7-day China Fixing Repo
Rates | | Bank of America N.A. | | 5/22/17 | | | CNY | | | | 2,192 | | | | 183 | | | | $ (10 | ) | | | 193 | |
| 2.12%2 | | 7-day China Fixing Repo
Rates | | Deutsche Bank AG | | 7/09/17 | | | CNY | | | | 1,105 | | | | (276 | ) | | | 2 | | | | (278 | ) |
| 1.92%2 | | 3-month KRW Certificate of
Deposit | | Deutsche Bank AG | | 11/10/17 | | | KRW | | | | 311,432 | | | | 1,725 | | | | 767 | | | | 958 | |
| 1.69%1 | | 3-month KRW Certificate of
Deposit | | Deutsche Bank AG | | 11/10/17 | | | KRW | | | | 311,432 | | | | (496 | ) | | | — | | | | (496 | ) |
| 2.26%2 | | 7-day China Fixing Repo
Rates | | Deutsche Bank AG | | 11/12/17 | | | CNY | | | | 1,655 | | | | 304 | | | | — | | | | 304 | |
| 4.34%1 | | 28-day MXIBTIIE | | Bank of America N.A. | | 12/15/17 | | | MXN | | | | 834 | | | | 28 | | | | 4 | | | | 24 | |
| 4.35%1 | | 28-day MXIBTIIE | | Goldman Sachs International | | 12/15/17 | | | MXN | | | | 9,249 | | | | 252 | | | | 41 | | | | 211 | |
| 4.33%1 | | 28-day MXIBTIIE | | Goldman Sachs International | | 12/15/17 | | | MXN | | | | 8,119 | | | | 358 | | | | 35 | | | | 323 | |
| 4.30%1 | | 28-day MXIBTIIE | | Bank of America N.A. | | 12/18/17 | | | MXN | | | | 7,180 | | | | 751 | | | | 10 | | | | 741 | |
| 4.30%1 | | 28-day MXIBTIIE | | Goldman Sachs International | | 12/18/17 | | | MXN | | | | 5,344 | | | | 559 | | | | 7 | | | | 552 | |
| 4.32%1 | | 28-day MXIBTIIE | | UBS AG | | 12/18/17 | | | MXN | | | | 4,782 | | | | 392 | | | | 6 | | | | 386 | |
| 4.55%1 | | 28-day MXIBTIIE | | Barclays Bank PLC | | 3/21/18 | | | MXN | | | | 1,273 | | | | (68 | ) | | | 16 | | | | (84 | ) |
| 4.85%1 | | 28-day MXIBTIIE | | Bank of America N.A. | | 11/01/18 | | | MXN | | | | 959 | | | | (140 | ) | | | 3 | | | | (143 | ) |
| 4.55%1 | | 3-month KLIBOR | | Citibank N.A. | | 9/11/20 | | | MYR | | | | 445 | | | | (1,583 | ) | | | 6 | | | | (1,589 | ) |
| 4.34%1 | | 3-month KLIBOR | | Bank of America N.A. | | 9/18/20 | | | MYR | | | | 444 | | | | (589 | ) | | | 7 | | | | (596 | ) |
| 4.51%1 | | 3-month KLIBOR | | Barclays Bank PLC | | 9/23/20 | | | MYR | | | | 527 | | | | (1,580 | ) | | | 12 | | | | (1,592 | ) |
| 4.51%1 | | 3-month KLIBOR | | Citibank N.A. | | 9/23/20 | | | MYR | | | | 362 | | | | (1,085 | ) | | | 9 | | | | (1,094 | ) |
| 4.77%1 | | 3-month KLIBOR | | Citibank N.A. | | 9/29/20 | | | MYR | | | | 445 | | | | (2,459 | ) | | | 6 | | | | (2,465 | ) |
| 4.38%1 | | 3-month KLIBOR | | Bank of America N.A. | | 10/09/20 | | | MYR | | | | 444 | | | | (906 | ) | | | 9 | | | | (915 | ) |
| 4.41%1 | | 3-month KLIBOR | | Citibank N.A. | | 10/20/20 | | | MYR | | | | 655 | | | | (1,453 | ) | | | 5 | | | | (1,458 | ) |
| 4.41%1 | | 3-month KLIBOR | | Citibank N.A. | | 10/20/20 | | | MYR | | | | 359 | | | | (795 | ) | | | 3 | | | | (798 | ) |
| 4.42%1 | | 3-month KLIBOR | | Citibank N.A. | | 10/20/20 | | | MYR | | | | 320 | | | | (726 | ) | | | 3 | | | | (729 | ) |
See Notes to Financial Statements.
| | | | | | |
| | | BLACKROCK SERIES FUND, INC. | | DECEMBER 31, 2015 | | 41 |
| | | | |
| Schedule of Investments (continued) | | | BlackRock Balanced Capital Portfolio | |
| | | | | | | | | | | | | | | | | | | | | | | | |
Fixed Rate | | Floating Rate | | Counterparty | | Expiration
Date | | Notional Amount (000) | | | Value | | | Premiums
Paid
(Received) | | | Unrealized
Appreciation
(Depreciation) | |
| 2.57%2 | | 3-month LIBOR | | Deutsche Bank AG | | 10/27/20 | | USD | | | 300 | | | | $ 13,426 | | | | — | | | | $ 13,426 | |
| 4.33%1 | | 3-month KLIBOR | | Bank of America N.A. | | 11/06/20 | | MYR | | | 444 | | | | (578 | ) | | | $ 8 | | | | (586 | ) |
| 11.41%1 | | 1-day BZDIOVER | | Bank of America N.A. | | 1/04/21 | | BRL | | | 253 | | | | 15,684 | | | | — | | | | 15,684 | |
| 12.05%2 | | 1-day BZDIOVER | | Bank of America N.A. | | 1/04/21 | | BRL | | | 116 | | | | (6,140 | ) | | | — | | | | (6,140 | ) |
| 11.84%2 | | 1-day BZDIOVER | | HSBC Bank PLC | | 1/04/21 | | BRL | | | 78 | | | | (4,310 | ) | | | — | | | | (4,310 | ) |
| 11.72%2 | | 1-day BZDIOVER | | JPMorgan Chase Bank N.A. | | 1/04/21 | | BRL | | | 56 | | | | (3,238 | ) | | | — | | | | (3,238 | ) |
| 3.27%1 | | 3-month LIBOR | | Deutsche Bank AG | | 5/16/21 | | USD | | | 550 | | | | (44,810 | ) | | | — | | | | (44,810 | ) |
| 2.16%1 | | 3-month LIBOR | | Bank of America N.A. | | 5/28/23 | | USD | | | 200 | | | | (2,737 | ) | | | — | | | | (2,737 | ) |
| 2.31%1 | | 3-month LIBOR | | Deutsche Bank AG | | 5/31/23 | | USD | | | 200 | | | | (4,511 | ) | | | — | | | | (4,511 | ) |
| 5.84%2 | | 28-day MXIBTIIE | | Deutsche Bank AG | | 11/14/24 | | MXN | | | 1,459 | | | | (2,515 | ) | | | (7 | ) | | | (2,508 | ) |
| 5.85%2 | | 28-day MXIBTIIE | | Deutsche Bank AG | | 11/14/24 | | MXN | | | 634 | | | | (1,072 | ) | | | (3 | ) | | | (1,069 | ) |
| 5.73%1 | | 28-day MXIBTIIE | | Bank of America N.A. | | 1/03/25 | | MXN | | | 940 | | | | 2,126 | | | | 13 | | | | 2,113 | |
| 5.55%2 | | 28-day MXIBTIIE | | Bank of America N.A. | | 1/13/25 | | MXN | | | 649 | | | | (1,976 | ) | | | (3 | ) | | | (1,973 | ) |
| 5.56%2 | | 28-day MXIBTIIE | | Goldman Sachs International | | 1/13/25 | | MXN | | | 1,469 | | | | (4,442 | ) | | | (6 | ) | | | (4,436 | ) |
| 6.43%2 | | 28-day MXIBTIIE | | Bank of America N.A. | | 6/06/25 | | MXN | | | 836 | | | | 450 | | | | (14 | ) | | | 464 | |
| 6.33%2 | | 28-day MXIBTIIE | | Citibank N.A. | | 7/17/25 | | MXN | | | 1,010 | | | | (4 | ) | | | (5 | ) | | | 1 | |
| 6.32%2 | | 28-day MXIBTIIE | | Morgan Stanley Capital Services
LLC | | 7/17/25 | | MXN | | | 2,027 | | | | (52 | ) | | | (10 | ) | | | (42 | ) |
| 6.31%1 | | 28-day MXIBTIIE | | Bank of America N.A. | | 8/11/25 | | MXN | | | 1,026 | | | | 88 | | | | 5 | | | | 83 | |
| 6.31%1 | | 28-day MXIBTIIE | | Bank of America N.A. | | 8/11/25 | | MXN | | | 1,026 | | | | 88 | | | | 5 | | | | 83 | |
| 6.31%1 | | 28-day MXIBTIIE | | Deutsche Bank AG | | 8/11/25 | | MXN | | | 3,807 | | | | 373 | | | | 17 | | | | 356 | |
| 6.27%2 | | 28-day MXIBTIIE | | Bank of America N.A. | | 12/05/25 | | MXN | | | 116 | | | | (49 | ) | | | (2 | ) | | | (47 | ) |
| 6.30%2 | | 28-day MXIBTIIE | | Goldman Sachs International | | 12/05/25 | | MXN | | | 2,158 | | | | (663 | ) | | | (30 | ) | | | (633 | ) |
| 6.27%2 | | 28-day MXIBTIIE | | Goldman Sachs International | | 12/05/25 | | MXN | | | 1,973 | | | | (869 | ) | | | (27 | ) | | | (842 | ) |
| 6.20%2 | | 28-day MXIBTIIE | | Bank of America N.A. | | 12/08/25 | | MXN | | | 1,739 | | | | (1,358 | ) | | | (8 | ) | | | (1,350 | ) |
| 6.18%2 | | 28-day MXIBTIIE | | Goldman Sachs International | | 12/08/25 | | MXN | | | 1,315 | | | | (1,114 | ) | | | (6 | ) | | | (1,108 | ) |
| 6.20%2 | | 28-day MXIBTIIE | | UBS AG | | 12/08/25 | | MXN | | | 1,192 | | | | (904 | ) | | | (5 | ) | | | (899 | ) |
| Total | | | | | | | | | | | | | | | $(53,214 | ) | | | $863 | | | | $(54,077 | ) |
| | | | | | | | | | | | | | | | |
| | 1 | | Fund pays the fixed rate and receives the floating rate. |
| | 2 | | Fund pays the floating rate and receives the fixed rate. |
| | | | | | | | | | | | | | | | |
| Transactions in Options Written for the Year Ended December 31, 2015 |
| | | | | | | | | | | | | | | | | | | | | | | | | | | | | | |
| | | | | Calls | | | | |
| | | | | Notional (000) | | | | |
| | | Contracts | | BRL | | | EUR | | | KOR | | | MXN | | | USD | | | ZAR | | | Premiums
Received | |
Outstanding options, beginning of year | | 8 | | | 17,942 | | | | — | | | | — | | | | — | | | | 1,868 | | | | 8,456 | | | | $ 72,120 | |
Options written | | 99 | | | — | | | | 4,935 | | | | 311,432 | | | | 11,766 | | | | 11,157 | | | | — | | | | 247,094 | |
Options expired | | (4) | | | (17,942 | ) | | | — | | | | (311,432 | ) | | | (2,846 | ) | | | — | | | | — | | | | (19,696 | ) |
Options closed | | (103) | | | — | | | | (4,935 | ) | | | — | | | | (8,920 | ) | | | (13,025 | ) | | | (8,456) | | | | (299,518 | ) |
| | | |
Outstanding options, end of year | | — | | | — | | | | — | | | | — | | | | — | | | | — | | | | — | | | | — | |
| | | |
See Notes to Financial Statements.
| | | | | | |
| 42 | | BLACKROCK SERIES FUND, INC. | | DECEMBER 31, 2015 | | |
| | | | |
| Schedule of Investments (continued) | | | BlackRock Balanced Capital Portfolio | |
| | | | | | | | | | | | | | | | | | | | |
| | | Puts | |
| | | | | | Notional (000) | | | | |
| | | Contracts | | | BRL | | | EUR | | | USD | | | Premiums Received | |
Outstanding options, beginning of year | | | 7 | | | | 8,085 | | | | — | | | | 1,868 | | | $ | 61,868 | |
Options written | | | 762 | | | | — | | | | 4,935 | | | | 15,932 | | | | 376,195 | |
Options exercised | | | — | | | | | | | | — | | | | | | | | — | |
Options expired | | | (11) | | | | (6,035 | ) | | | — | | | | | | | | (6,755 | ) |
Options closed | | | (758) | | | | (2,050 | ) | | | (4,935 | ) | | | (17,800 | ) | | | (431,308 | ) |
| | | | |
Outstanding options, end of year | | | — | | | | — | | | | — | | | | — | | | | — | |
| | | | |
| | | | | | | | | | | | | | | | | | | | | | | | |
| Derivative Financial Instruments Categorized by Risk Exposure | |
As of period end, the fair values of derivative financial instruments located in the Statements of Assets and Liabilities were as follows: | |
| Assets — Derivative Financial Instruments | | Commodity Contracts | | Credit Contracts | | | Equity Contracts | | Foreign Currency Exchange Contracts | | | Interest Rate Contracts | | | Other Contracts | | Total | |
Financial futures contracts | | Net unrealized appreciation1 | | — | | | — | | | — | | | — | | | | $ 75,565 | | | — | | | $ 75,565 | |
Forward foreign currency exchange contracts | | Unrealized appreciation on forward foreign currency exchange contracts | | — | | | — | | | — | | | $30,894 | | | | — | | | — | | | 30,894 | |
Options purchased | | Investments at value — unaffiliated2 | | — | | | — | | | — | | | — | | | | 16,823 | | | — | | | 16,823 | |
Swaps — centrally cleared | | Net unrealized appreciation1 | | — | | | — | | | — | | | — | | | | 1,207 | | | — | | | 1,207 | |
Swaps — OTC | | Unrealized appreciation on OTC swaps; Swap premiums paid | | — | | | $258,189 | | | — | | | — | | | | 60,703 | | | — | | | 318,892 | |
| | | |
Total | | | | — | | | $258,189 | | | — | | | $30,894 | | | | $154,298 | | | — | | | $443,381 | |
| | | |
| | | | | | | | | | | | | | | | | | | | | | | | |
| Liabilities — Derivative Financial Instruments | |
Financial futures contracts | | Net unrealized depreciation1 | | — | | | — | | | — | | | — | | | | $ 64,068 | | | — | | | $ 64,068 | |
Forward foreign currency exchange contracts | | Unrealized depreciation on forward foreign currency exchange contracts | | — | | | — | | | — | | | $51,528 | | | | — | | | — | | | 51,528 | |
Swaps — centrally cleared | | Net unrealized depreciation1 | | | | | $ 15,560 | | | — | | | — | | | | 34,584 | | | — | | | 50,144 | |
Swaps — OTC | | Unrealized depreciation on OTC swaps; Swap premiums received | | — | | | 425,971 | | | — | | | — | | | | 113,917 | | | — | | | 539,888 | |
| | | |
Total | | | | — | | | $441,531 | | | — | | | $51,528 | | | | $212,569 | | | — | | | $705,628 | |
| | | |
| | 1 | | Includes cumulative appreciation (depreciation) on financial futures contracts and centrally cleared swaps, if any, as reported in the Schedule of Investments. Only current day’s variation margin is reported within the Statements of Assets and Liabilities. |
| | 2 | | Includes options purchased at value as reported in the Schedule of Investments. |
For the year ended December 31, 2015, the effect of derivative financial instruments in the Statements of Operations were as follows:
| | | | | | | | | | | | | | | | | | | | | | | | |
| Net Realized Gain (Loss) from: | | Commodity
Contracts | | Credit
Contracts | | | Equity
Contracts | | | Foreign
Currency
Exchange
Contracts | | | Interest
Rate
Contracts | | | Other
Contracts | | Total | |
Financial futures contracts | | — | | | — | | | | — | | | | — | | | | $(190,019 | ) | | — | | | $(190,019 | ) |
Foreign currency transactions | | — | | | — | | | | — | | | | $ 958,632 | | | | — | | | — | | | 958,632 | |
Interest rate floors | | — | | | — | | | | — | | | | — | | | | (41,840 | ) | | — | | | (41,840 | ) |
Options purchased3 | | — | | | — | | | | — | | | | — | | | | (381,588 | ) | | — | | | (381,588 | ) |
Options written | | — | | | — | | | | $369 | | | | — | | | | 158,140 | | | — | | | 158,509 | |
Swaps | | — | | | $ 233,142 | | | | — | | | | — | | | | 109,536 | | | — | | | 342,678 | |
| | | |
Total | | — | | | $ 233,142 | | | | $369 | | | | $ 958,632 | | | | $(345,771 | ) | | — | | | $ 846,372 | |
| | | |
| | | | | | | | | | | | | | | | | | | | | | | | |
| Net Change in Unrealized Appreciation (Depreciation) on: | | | | | | | | | | | | | | | | | |
Financial futures contracts | | — | | | — | | | | — | | | | — | | | | $(107,736 | ) | | — | | | $(107,736 | ) |
Foreign currency translations | | — | | | — | | | | — | | | | $(294,330 | ) | | | — | | | — | | | (294,330 | ) |
Interest rate floors | | — | | | — | | | | — | | | | — | | | | 7,634 | | | — | | | 7,634 | |
Options purchased3 | | — | | | — | | | | — | | | | — | | | | 110,761 | | | — | | | 110,761 | |
Options written | | — | | | — | | | | — | | | | — | | | | 1,605 | | | — | | | 1,605 | |
Swaps | | — | | | $(134,153 | ) | | | — | | | | — | | | | (40,536 | ) | | — | | | (174,689 | ) |
| | | |
Total | | — | | | $(134,153 | ) | | | — | | | | $(294,330 | ) | | | $ (28,272 | ) | | — | | | $(456,755 | ) |
| | | |
| | 3 | | Options purchased are included in the net realized gain (loss) from investments and the net change in unrealized appreciation (depreciation) on investments. |
See Notes to Financial Statements.
| | | | | | |
| | | BLACKROCK SERIES FUND, INC. | | DECEMBER 31, 2015 | | 43 |
| | | | |
| Schedule of Investments (continued) | | | BlackRock Balanced Capital Portfolio | |
| | |
| Average Quarterly Balances of Outstanding Derivative Financial Instruments | | |
| | | | |
Financial futures contracts: | | | | |
Average notional value of contracts - long | | $ | 41,375,959 | |
Average notional value of contracts - short | | $ | 31,419,068 | |
Forward foreign currency exchange contracts: | | | | |
Average amounts purchased - in USD | | $ | 3,831,123 | |
Average amounts sold - USD | | $ | 912,575 | |
Options: | | | | |
Average value of option contracts purchased | | $ | 14,799 | |
Average value of option contracts written | | $ | 8,692 | |
Average notional value of swaption contracts purchased | | $ | 9,448,189 | |
Average notional value of swaption contracts written | | $ | 9,500,924 | |
Average value of interest rate floors purchased | | $ | 13,485 | |
Average value of interest rate floors written | | $ | 2,444 | |
Credit default swaps: | | | | |
Average notional value - buy protection | | $ | 4,823,324 | |
Average notional value - sell protection | | $ | 5,511,250 | |
Interest rate swaps: | | | | |
Average notional value - pays fixed rate | | $ | 17,037,901 | |
Average notional value - receives fixed rate | | $ | 11,085,918 | |
|
For more information about the Fund’s investment risks regarding derivative financial instruments, refer to the Notes to Financial Statements. |
| Derivative Financial Instruments — Offsetting as of Period End |
The Fund’s derivative assets and liabilities (by type) were as follows:
| | | | | | | | |
| | | Assets | | | Liabilities | |
Derivative Financial Instruments: | | | | | | | | |
Financial futures contracts | | | $ 58,491 | | | | $ 6,291 | |
Forward foreign currency exchange contracts | | | 30,894 | | | | 51,528 | |
Options | | | 16,823 | 1 | | | — | |
Swaps — Centrally cleared | | | 924 | | | | — | |
Swaps — OTC2 | | | 318,892 | | | | 539,888 | |
| | | | |
Total derivative assets and liabilities in the Statements of Assets and Liabilities | | | $426,024 | | | | $597,707 | |
Derivatives not subject to a Master Netting Agreement or similar agreement (“MNA”) | | | (73,578 | ) | | | (6,291 | ) |
| | | | |
Total derivative assets and liabilities subject to an MNA | | | $352,446 | | | | $591,416 | |
| | | | |
| | 1 | | Includes options purchased at value which is included in Investments at value — unaffiliated in the Statements of Assets and Liabilities and reported in the Schedule of Investments. |
| | 2 | | Includes unrealized appreciation (depreciation) on OTC swaps and swap premiums paid/received in the Statements of Assets and Liabilities. |
The following tables present the Fund’s derivative assets and liabilities by counterparty net of amounts available for offset under an MNA and net of the related collateral received and pledged by the Fund.
| | | | | | | | | | | | | | | | | | | | | | | | | |
| Counterparty | | Derivative Assets Subject to an MNA by Counterparty | | Derivatives Available for Offset3 | | Non-cash Collateral Received | | Cash Collateral Received | | Net Amount of Derivative Assets4 |
Bank of America N.A | | | | $ 49,473 | | | | | $ (49,473 | ) | | — | | — | | | | — | |
Barclays Bank PLC | | | | 12,965 | | | | | (12,965 | ) | | — | | — | | | | — | |
BNP Paribas S.A. | | | | 12,434 | | | | | (10,405 | ) | | — | | — | | | | $ 2,029 | |
Citibank N.A. | | | | 17,682 | | | | | (17,682 | ) | | — | | — | | | | — | |
Credit Suisse International | | | | 52,460 | | | | | (52,460 | ) | | — | | — | | | | — | |
Deutsche Bank AG | | | | 30,128 | | | | | (30,128 | ) | | — | | — | | | | — | |
Goldman Sachs International | | | | 113,016 | | | | | (113,016 | ) | | — | | — | | | | — | |
HSBC Bank PLC | | | | 7,071 | | | | | (7,071 | ) | | — | | — | | | | — | |
JPMorgan Chase Bank N.A. | | | | 28,353 | | | | | (27,684 | ) | | — | | — | | | | 669 | |
Morgan Stanley & Co. International PLC | | | | 4,617 | | | | | — | | | — | | — | | | | 4,617 | |
Morgan Stanley Capital Services LLC | | | | 4,484 | | | | | (608 | ) | | — | | — | | | | 3,876 | |
Royal Bank of Scotland PLC | | | | 5,483 | | | | | — | | | — | | — | | | | 5,483 | |
Société Générale | | | | 10,212 | | | | | — | | | — | | — | | | | 10,212 | |
Standard Chartered Bank | | | | 3,676 | | | | | — | | | — | | — | | | | 3,676 | |
UBS AG | | | | 392 | | | | | (392 | ) | | — | | — | | | | — | |
Total | | | | $352,446 | | | | | $(321,884 | ) | | — | | — | | | | $30,562 | |
| | 3 | | The amount of derivatives available for offset is limited to the amount of assets and/or liabilities that are subject to an MNA. |
| | 4 | | Net amount represents the net amount receivable from the counterparty in the event of default. |
See Notes to Financial Statements.
| | | | | | |
| 44 | | BLACKROCK SERIES FUND, INC. | | DECEMBER 31, 2015 | | |
| | | | |
| Schedule of Investments (continued) | | | BlackRock Balanced Capital Portfolio | |
| | | | | | | | | | |
| Counterparty | | Derivative Liabilities
Subject to an MNA by
Counterparty | | Derivatives Available
for Offset1 | | Non-cash
Collateral
Pledged | | Cash
Collateral
Pledged | | Net Amount of
Derivative Liabilities2 |
Bank of America N.A. | | $ 66,785 | | $ (49,473) | | — | | — | | $ 17,312 |
Barclays Bank PLC | | 36,674 | | (12,965) | | — | | — | | 23,709 |
BNP Paribas S.A. | | 10,405 | | (10,405) | | — | | — | | — |
Citibank N.A. | | 63,439 | | (17,682) | | — | | — | | 45,757 |
Credit Suisse International | | 78,304 | | (52,460) | | — | | — | | 25,844 |
Deutsche Bank AG | | 76,010 | | (30,128) | | — | | — | | 45,882 |
Goldman Sachs International | | 196,041 | | (113,016) | | — | | — | | 83,025 |
HSBC Bank PLC | | 10,889 | | (7,071) | | — | | — | | 3,818 |
JPMorgan Chase Bank N.A. | | 27,684 | | (27,684) | | — | | — | | — |
Morgan Stanley Capital Services LLC | | 608 | | (608) | | — | | — | | — |
State Street Bank and Trust Co. | | 2,057 | | — | | — | | — | | 2,057 |
UBS AG | | 22,520 | | (392) | | — | | — | | 22,128 |
| | |
Total | | $591,416 | | $(321,884) | | — | | — | | $269,532 |
| | |
| | 1 | | The amount of derivatives available for offset is limited to the amount of assets and/or liabilities that are subject to an MNA. |
| | 2 | | Net amount represents the net amount payable due to the counterparty in the event of default. |
|
| Fair Value Hierarchy as of Period End |
Various inputs are used in determining the fair value of investments and derivative financial instruments. For information about the Fund’s policy regarding valuation of investments and derivative financial instruments, refer to the Notes to Financial Statements.
The following tables summarize the Fund’s investments and derivative financial instruments in the disclosure hierarchy:
| | | | | | | | | | | | | | | | | | | | | | |
| | | Level 1 | | | | | Level 2 | | | | | Level 3 | | | | | Total | |
Assets: | | | | | | | | | | | | | | | | | | | | | | |
Investments: | | | | | | | | | | | | | | | | | | | | | | |
Long-Term Investments: | | | | | | | | | | | | | | | | | | | | | | |
Asset-Backed Securities | | | — | | | | | $ | 12,632,411 | | | | | $ | 3,730,393 | | | | | | $ 16,362,804 | |
Common Stocks | | $ | 302,996,993 | | | | | | — | | | | | | — | | | | | | 302,996,993 | |
Corporate Bonds | | | — | | | | | | 53,285,327 | | | | | | — | | | | | | 53,285,327 | |
Foreign Agency Obligations | | | — | | | | | | 155,502 | | | | | | — | | | | | | 155,502 | |
Foreign Government Obligations | | | — | | | | | | 4,210,081 | | | | | | — | | | | | | 4,210,081 | |
Investment Companies | | | 3,501,769 | | | | | | — | | | | | | — | | | | | | 3,501,769 | |
Non-Agency Mortgage-Backed Securities | | | — | | | | | | 13,398,744 | | | | | | 1,847,256 | | | | | | 15,246,000 | |
Other Interests | | | — | | | | | | — | | | | | | 62 | | | | | | 62 | |
Preferred Securities | | | 771,210 | | | | | | 1,274,798 | | | | | | — | | | | | | 2,046,008 | |
Taxable Municipal Bonds | | | — | | | | | | 3,785,068 | | | | | | — | | | | | | 3,785,068 | |
U.S. Government Sponsored Agency Securities | | | — | | | | | | 84,034,175 | | | | | | — | | | | | | 84,034,175 | |
U.S. Treasury Obligations | | | — | | | | | | 38,596,923 | | | | | | — | | | | | | 38,596,923 | |
Short-Term Securities: | | | | | | | | | | | | | | | | | | | | | | |
Borrowed Bond Agreements | | | — | | | | | | 5,694,785 | | | | | | — | | | | | | 5,694,785 | |
Money Market Funds | | | 87,935 | | | | | | 3,964,938 | | | | | | — | | | | | | 4,052,873 | |
Options Purchased: | | | | | | | | | | | | | | | | | | | | | | |
Interest Rate Contracts | | | 14,163 | | | | | | 2,660 | | | | | | — | | | | | | 16,823 | |
Liabilities: | | | | | | | | | | | | | | | | | | | | | | |
Investments: | | | | | | | | | | | | | | | | | | | | | | |
Borrowed Bonds | | | — | | | | | | (5,659,517 | ) | | | | | — | | | | | | (5,659,517) | |
TBA Sale Commitments | | | — | | | | | | (30,683,688 | ) | | | | | — | | | | | | (30,683,688) | |
| | | | |
Total | | $ | 307,372,070 | | | | | $ | 184,692,207 | | | | | $ | 5,577,711 | | | | | | $497,641,988 | |
| | | | |
See Notes to Financial Statements.
| | | | | | |
| | | BLACKROCK SERIES FUND, INC. | | DECEMBER 31, 2015 | | 45 |
| | | | |
| Schedule of Investments (concluded) | | | BlackRock Balanced Capital Portfolio | |
| | | | | | | | | | | | | | | | | | | | |
| | | Level 1 | | Level 2 | | Level 3 | | Total |
Derivative Financial Instruments1 | | | | | | | | | | | | | | | | | | | | |
Assets: | | | | | | | | | | | | | | | | | | | | |
Credit contracts | | | | — | | | | $ | 184,301 | | | | | — | | | | $ | 184,301 | |
Foreign currency exchange contracts | | | | — | | | | | 30,894 | | | | | — | | | | | 30,894 | |
Interest rate contracts | | | $ | 75,565 | | | | | 60,911 | | | | | — | | | | | 136,476 | |
Liabilities: | | | | | | | | | | | | | | | | | | | | |
Credit contracts | | | | — | | | | | (148,845 | ) | | | | — | | | | | (148,845 | ) |
Foreign currency exchange contracts | | | | — | | | | | (51,528 | ) | | | | — | | | | | (51,528 | ) |
Interest rate contracts | | | | (64,068 | ) | | | | (148,365 | ) | | | | — | | | | | (212,433 | ) |
| | | | | |
Total | | | $ | 11,497 | | | | $ | (72,632 | ) | | | | — | | | | $ | (61,135 | ) |
| | | | | |
|
1 Derivative financial instruments are swaps, financial futures contracts and forward foreign currency exchange contracts. Swaps, financial futures contracts and forward foreign currency exchange contracts are valued at the unrealized appreciation (depreciation) on the instrument. The Fund may hold assets and/or liabilities in which the fair value approximates the carrying amount, for financial statement purposes. As of December 31, 2015, such assets and/or liabilities are categorized within the disclosure hierarchy as follows: | |
| | | Level 1 | | Level 2 | | Level 3 | | Total |
Assets: | | | | | | | | | | | | | | | | | | | | |
Cash | | | $ | 3,654,593 | | | | | — | | | | | — | | | | $ | 3,654,593 | |
Cash pledged for centrally cleared swaps | | | | 60,182 | | | | | — | | | | | — | | | | | 60,182 | |
Foreign currency at value | | | | 197,393 | | | | | — | | | | | — | | | | | 197,393 | |
Liabilities: | | | | | | | | | | | | | | | | | | | | |
Reverse repurchase agreements | | | | — | | | | $ | (7,741,100 | ) | | | | — | | | | | (7,741,100 | ) |
Collateral on securities loaned at value | | | | — | | | | | (3,964,938 | ) | | | | — | | | | | (3,964,938 | ) |
| | | | | |
Total | | | $ | 3,912,168 | | | | $ | (11,706,038 | ) | | | | — | | | | $ | (7,793,870 | ) |
| | | | | |
During the year ended December 31, 2015, there were no transfers between Level 1 and Level 2.
A reconciliation of Level 3 investments is presented when the Fund had a significant amount of Level 3 investments at the beginning and/or end of the year in relation to net assets. The following table is a reconciliation of Level 3 investments for which significant unobservable inputs were used in determining fair value:
| | | | | | | | | | | | | | | | |
| | | Asset-
Backed
Securities | | | Non-Agency
Mortgage-Backed
Securities | | | Other
Interests | | | Total | |
Assets: | | | | | | | | | | | | | | | | |
Opening Balance, as of December 31, 2014 | | $ | 3,119,760 | | | | $1,876,711 | | | | — | | | $ | 4,996,471 | |
Transfers into Level 3 | | | 1,449,288 | | | | — | | | | — | | | | 1,449,288 | |
Transfers out of Level 3 | | | (901,449 | ) | | | (426,356 | ) | | | — | | | | (1,327,805 | ) |
Accrued discounts/premiums | | | 2,563 | | | | (2,635 | ) | | | — | | | | (72 | ) |
Net realized gain (loss) | | | 16,970 | | | | 15,798 | | | | — | | | | 32,768 | |
Net change in unrealized appreciation (depreciation)2,3 | | | (43,725 | ) | | | (19,168 | ) | | | $62 | | | | (62,831 | ) |
Purchases | | | 1,432,704 | | | | 1,260,516 | | | | — | | | | 2,693,220 | |
Sales | | | (1,345,718 | ) | | | (857,610 | ) | | | — | | | | (2,203,328 | ) |
| | | | |
Closing Balance, as of December 31, 2015 | | $ | 3,730,393 | | | | $1,847,256 | | | | $62 | | | $ | 5,577,711 | |
| | | | |
Net change in unrealized appreciation (depreciation) on investments still held at December 31, 20153 | | $ | (48,261 | ) | | | $ (18,879 | ) | | | $62 | | | $ | (67,140 | ) |
| | | | |
| | 2 | | Included in the related change in unrealized appreciation (depreciation) in the Statements of Operations. |
| | 3 | | Any difference between net change in unrealized appreciation (depreciation) and net change in unrealized appreciation (depreciation) on investments still held at December 31, 2015 is generally due to investments no longer held or categorized as Level 3 at year end. |
The Fund’s investments that are categorized as Level 3 were valued utilizing third party pricing information without adjustment. Such valuations are based on unobservable inputs. A significant change in third party information could result in a significantly lower or higher value of such Level 3 investments.
See Notes to Financial Statements.
| | | | | | |
| 46 | | BLACKROCK SERIES FUND, INC. | | DECEMBER 31, 2015 | | |
| | | | |
| Schedule of Investments December 31, 2015 | | | BlackRock Capital Appreciation Portfolio | |
| | | (Percentages shown are based on Net Assets) | |
| | | | | | | | |
| Common Stocks | | Shares | | | Value | |
Airlines — 2.1% | | | | | | | | |
Delta Air Lines, Inc. | | | 64,920 | | | $ | 3,290,795 | |
Auto Components — 1.3% | | | | | | | | |
Delphi Automotive PLC | | | 24,585 | | | | 2,107,672 | |
Beverages — 4.0% | | | | | | | | |
Anheuser-Busch InBev NV — ADR (a) | | | 27,800 | | | | 3,475,000 | |
Constellation Brands, Inc., Class A | | | 20,075 | | | | 2,859,483 | |
| | | | | | | | |
| | | | | | | | 6,334,483 | |
Biotechnology — 10.0% | | | | | | | | |
AbbVie, Inc. | | | 35,040 | | | | 2,075,770 | |
Biogen, Inc. (b) | | | 14,815 | | | | 4,538,575 | |
Celgene Corp. (b) | | | 9,281 | | | | 1,111,493 | |
United Therapeutics Corp. (b) | | | 29,954 | | | | 4,691,096 | |
Vertex Pharmaceuticals, Inc. (b) | | | 25,588 | | | | 3,219,738 | |
| | | | | | | | |
| | | | | | | | 15,636,672 | |
Chemicals — 3.0% | | | | | | | | |
Ecolab, Inc. | | | 13,025 | | | | 1,489,800 | |
Sherwin-Williams Co. | | | 12,225 | | | | 3,173,610 | |
| | | | | | | | |
| | | | | | | | 4,663,410 | |
Diversified Financial Services — 3.7% | | | | | | | | |
Berkshire Hathaway, Inc., Class B (b) | | | 30,547 | | | | 4,033,426 | |
Moody’s Corp. | | | 17,901 | | | | 1,796,186 | |
| | | | | | | | |
| | | | | | | | 5,829,612 | |
Food & Staples Retailing — 3.3% | | | | | | | | |
Costco Wholesale Corp. | | | 16,634 | | | | 2,686,391 | |
CVS Health Corp. | | | 24,683 | | | | 2,413,257 | |
| | | | | | | | |
| | | | | | | | 5,099,648 | |
Food Products — 1.0% | | | | | | | | |
Mead Johnson Nutrition Co. | | | 20,072 | | | | 1,584,684 | |
Health Care Providers & Services — 2.5% | | | | | | | | |
UnitedHealth Group, Inc. | | | 33,437 | | | | 3,933,529 | |
Hotels, Restaurants & Leisure — 2.8% | | | | | | | | |
Chipotle Mexican Grill, Inc. (b) | | | 4,577 | | | | 2,196,273 | |
Domino’s Pizza, Inc. | | | 8,695 | | | | 967,319 | |
Starbucks Corp. | | | 20,074 | | | | 1,205,042 | |
| | | | | | | | |
| | | | | | | | 4,368,634 | |
Internet & Catalog Retail — 9.5% | | | | | | | | |
Amazon.com, Inc. (b) | | | 10,098 | | | | 6,825,137 | |
Netflix, Inc. (b) | | | 35,814 | | | | 4,096,405 | |
TripAdvisor, Inc. (b) | | | 46,165 | | | | 3,935,566 | |
| | | | | | | | |
| | | | | | | | 14,857,108 | |
Internet Software & Services — 16.4% | | | | | | | | |
Alphabet, Inc., Class A (b) | | | 14,728 | | | | 11,458,531 | |
Facebook, Inc., Class A (b) | | | 92,637 | | | | 9,695,388 | |
LinkedIn Corp., Class A (b) | | | 5,381 | | | | 1,211,155 | |
Tencent Holdings Ltd. | | | 172,700 | | | | 3,381,464 | |
| | | | | | | | |
| | | | | | | | 25,746,538 | |
IT Services — 8.8% | | | | | | | | |
Alliance Data Systems Corp. (b) | | | 15,355 | | | | 4,246,732 | |
MasterCard, Inc., Class A | | | 27,507 | | | | 2,678,082 | |
Visa, Inc., Class A | | | 87,976 | | | | 6,822,539 | |
| | | | | | | | |
| | | | | | | | 13,747,353 | |
Life Sciences Tools & Services — 1.1% | | | | | | | | |
Illumina, Inc. (a)(b) | | | 9,356 | | | | 1,795,837 | |
Media — 2.2% | | | | | | | | |
Liberty Global PLC, Class A (b) | | | 81,816 | | | | 3,465,726 | |
| | | | | | | | |
| Common Stocks | | Shares | | | Value | |
Oil, Gas & Consumable Fuels — 0.5% | | | | | | | | |
Concho Resources, Inc. (b) | | | 7,908 | | | $ | 734,337 | |
Pharmaceuticals — 4.5% | | | | | | | | |
Allergan PLC (b) | | | 7,101 | | | | 2,219,064 | |
Perrigo Co. PLC | | | 33,222 | | | | 4,807,223 | |
| | | | | | | | |
| | | | | | | | 7,026,287 | |
Real Estate Investment Trusts (REITs) — 1.8% | | | | | |
Crown Castle International Corp. | | | 33,104 | | | | 2,861,841 | |
Road & Rail — 1.3% | | | | | | | | |
Union Pacific Corp. | | | 25,508 | | | | 1,994,726 | |
Semiconductors & Semiconductor Equipment — 1.1% | | | | | |
NXP Semiconductors NV | | | 20,507 | | | | 1,727,715 | |
Software — 6.7% | | | | | | | | |
Activision Blizzard, Inc. | | | 43,278 | | | | 1,675,291 | |
Mobileye NV (a)(b) | | | 41,811 | | | | 1,767,769 | |
Salesforce.com, Inc. (b) | | | 58,491 | | | | 4,585,694 | |
Workday, Inc., Class A (b) | | | 30,760 | | | | 2,450,957 | |
| | | | | | | | |
| | | | | | | | 10,479,711 | |
Specialty Retail — 3.3% | | | | | | | | |
Home Depot, Inc. | | | 24,764 | | | | 3,275,039 | |
Restoration Hardware Holdings, Inc. (b) | | | 23,511 | | | | 1,867,949 | |
| | | | | | | | |
| | | | | | | | 5,142,988 | |
Technology Hardware, Storage & Peripherals — 4.6% | | | | | |
Apple Inc. | | | 68,308 | | | | 7,190,100 | |
Textiles, Apparel & Luxury Goods — 1.7% | | | | | | | | |
NIKE, Inc., Class B | | | 43,174 | | | | 2,698,375 | |
Wireless Telecommunication Services — 1.0% | | | | | |
SBA Communications Corp., Class A (b) | | | 15,000 | | | | 1,576,050 | |
Total Common Stocks — 98.2% | | | | | | | 153,893,831 | |
| | | | | | | | |
| Preferred Stocks | | | | | | |
Software — 1.4% | | | | | | | | |
Palantir Technologies, Inc., Series I (Acquired 2/11/14, cost $1,152,906), 0.00% (b)(c) | | | 188,076 | | | | 2,140,305 | |
Total Preferred Stocks — 1.4% | | | | | | | 2,140,305 | |
Total Long-Term Investments (Cost — $132,147,212) — 99.6% | | | | | | | 156,034,136 | |
| |
| | | | | | | | |
Short-Term Securities | | | | | | | | |
BlackRock Liquidity Funds, TempFund, Institutional Class, 0.23% (d)(e) | | | 2,660,556 | | | | 2,660,556 | |
| | | Beneficial
Interest
(000) | | | | |
BlackRock Liquidity Series, LLC, Money Market
Series, 0.39% (d)(e)(f) | | $ | 5,786 | | | | 5,786,479 | |
Total Short-Term Securities (Cost — $8,447,035) — 5.4% | | | | | | | 8,447,035 | |
Total Investments (Cost — $140,594,247) — 105.0% | | | | 164,481,171 | |
Liabilities in Excess of Other Assets — (5.0)% | | | | (7,758,933 | ) |
| | | | | | | | |
Net Assets — 100.0% | | | | | | $ | 156,722,238 | |
| | | | | | | | |
See Notes to Financial Statements.
| | | | | | |
| | | BLACKROCK SERIES FUND, INC. | | DECEMBER 31, 2015 | | 47 |
| | | | |
| Schedule of Investments (continued) | | | BlackRock Capital Appreciation Portfolio | |
|
| Notes to Schedule of Investments |
| (a) | Security, or a portion of security, is on loan. |
| (b) | Non-income producing security. |
| (c) | Restricted security as to resale, excluding 144A securities. As of period end, the Fund held restricted securities with a current value of $2,140,305 and an original cost of $1,152,906 which was 1.4% of its net assets. |
| (d) | During the year ended December 31, 2015, investments in issuers considered to be affiliates of the Fund for purposes of Section 2(a)(3) of the Investment Company Act of 1940, as amended, were as follows: |
| | | | | | | | | | | | | | | | | | | | |
| Affiliate | | Shares/Beneficial
Interest Held at
December 31, 2014 | | | Net Activity | | | Shares/Beneficial
Interest Held at
December 31, 2015 | | | Income | | | Realized
Gain | |
BlackRock Liquidity Funds, TempFund, Institutional Class | | | 796,055 | | | | 1,864,501 | | | | 2,660,556 | | | | $ 1,962 | | | | $49 | |
BlackRock Liquidity Series, LLC, Money Market Series | | | $3,648,890 | | | | $2,137,589 | | | | $5,786,479 | | | | $15,829 | 1 | | | — | |
| 1 | Represents securities lending income earned from the reinvestment of cash collateral from loaned securities, net of fees, and other payments to and from borrowers of securities, and less the collateral investment expenses. |
| (e) | Current yield as of period end. |
| (f) | Security was purchased with the cash collateral from loaned securities. The Fund may withdraw up to 25% of its investment daily, although the manager of the BlackRock Liquidity Series, LLC, Money Market Series, in its sole discretion, may permit an investor to withdraw more than 25% on any one day. |
| • | | For Fund compliance purposes, the Fund’s industry classifications refer to any one or more of the industry sub-classifications used by one or more widely recognized market indexes or ratings group indexes, and/or as defined by the investment advisor. These definitions may not apply for purposes of this report, which may combine such industry sub-classifications for reporting ease. |
|
| Fair Value Hierarchy as of Period End |
Various inputs are used in determining the fair value of investments. For information about the Fund’s policy regarding valuation of investments, refer to the Notes to Financial Statements.
The following table summarizes the Fund’s investments categorized in the disclosure hierarchy:
| | | | | | | | | | | | | | | | |
| | | Level 1 | | | Level 2 | | | Level 3 | | | Total | |
Assets: | | | | | | | | | | | | | | | | |
Investments: | | | | | | | | | | | | | | | | |
Long-Term Investments: | | | | | | | | | | | | | | | | |
Common Stocks: | | | | | | | | | | | | | | | | |
Airlines | | $ | 3,290,795 | | | | — | | | | — | | | $ | 3,290,795 | |
Auto Components | | | 2,107,672 | | | | — | | | | — | | | | 2,107,672 | |
Beverages | | | 6,334,483 | | | | — | | | | — | | | | 6,334,483 | |
Biotechnology | | | 15,636,672 | | | | — | | | | — | | | | 15,636,672 | |
Chemicals | | | 4,663,410 | | | | — | | | | — | | | | 4,663,410 | |
Diversified Financial Services | | | 5,829,612 | | | | — | | | | — | | | | 5,829,612 | |
Food & Staples Retailing | | | 5,099,648 | | | | — | | | | — | | | | 5,099,648 | |
Food Products | | | 1,584,684 | | | | — | | | | — | | | | 1,584,684 | |
Health Care Providers & Services | | | 3,933,529 | | | | — | | | | — | | | | 3,933,529 | |
Hotels, Restaurants & Leisure | | | 4,368,634 | | | | — | | | | — | | | | 4,368,634 | |
Internet & Catalog Retail | | | 14,857,108 | | | | — | | | | — | | | | 14,857,108 | |
Internet Software & Services | | | 22,365,074 | | | $ | 3,381,464 | | | | — | | | | 25,746,538 | |
IT Services | | | 13,747,353 | | | | — | | | | — | | | | 13,747,353 | |
Life Sciences Tools & Services | | | 1,795,837 | | | | — | | | | — | | | | 1,795,837 | |
Media | | | 3,465,726 | | | | — | | | | — | | | | 3,465,726 | |
Oil, Gas & Consumable Fuels | | | 734,337 | | | | — | | | | — | | | | 734,337 | |
Pharmaceuticals | | | 7,026,287 | | | | — | | | | — | | | | 7,026,287 | |
Real Estate Investment Trusts (REITs) | | | 2,861,841 | | | | — | | | | — | | | | 2,861,841 | |
Road & Rail | | | 1,994,726 | | | | — | | | | — | | | | 1,994,726 | |
Semiconductors & Semiconductor Equipment | | | 1,727,715 | | | | — | | | | — | | | | 1,727,715 | |
Software | | | 10,479,711 | | | | — | | | | — | | | | 10,479,711 | |
Specialty Retail | | | 5,142,988 | | | | — | | | | — | | | | 5,142,988 | |
Technology Hardware, Storage & Peripherals | | | 7,190,100 | | | | — | | | | — | | | | 7,190,100 | |
Textiles, Apparel & Luxury Goods | | | 2,698,375 | | | | — | | | | — | | | | 2,698,375 | |
Wireless Telecommunication Services | | | 1,576,050 | | | | — | | | | — | | | | 1,576,050 | |
Preferred Stock: | | | | | | | | | | | | | | | | |
Software | | | — | | | | — | | | $ | 2,140,305 | | | | 2,140,305 | |
Short-Term Securities | | | 2,660,556 | | | | 5,786,479 | | | | — | | | | 8,447,035 | |
| | | | |
Total | | $ | 153,172,923 | | | $ | 9,167,943 | | | $ | 2,140,305 | | | $ | 164,481,171 | |
| | | | |
See Notes to Financial Statements.
| | | | | | |
| 48 | | BLACKROCK SERIES FUND, INC. | | DECEMBER 31, 2015 | | |
| | | | |
| Schedule of Investments (concluded) | | | BlackRock Capital Appreciation Portfolio | |
The Fund may hold liabilities in which the fair value approximates the carrying amount for financial statement purposes. As of period end, collateral on securities loaned at value of $5,786,479 is categorized as Level 2 within the disclosure hierarchy.
During the year ended December 31, 2015, there were no transfers between Level 1 and Level 2.
A reconciliation of Level 3 investments is presented when the Fund had a significant amount of Level 3 investments at the beginning and/or end of the year in relation to net assets. The following table is a reconciliation of Level 3 investments for which significant unobservable inputs were used in determining fair value:
| | | | |
| | | Preferred
Stocks | |
Assets: | | | | |
Opening Balance, as of December 31, 2014 | | $ | 1,423,735 | |
Transfers into Level 3 | | | — | |
Transfers out of Level 3 | | | — | |
Accrued discounts/premiums | | | — | |
Net realized gain (loss) | | | — | |
Net change in unrealized appreciation/depreciation1,2 | | | 716,570 | |
Purchases | | | — | |
Sales | | | — | |
Closing Balance, as of December 31, 2015 | | $ | 2,140,305 | |
| | | | |
Net change in unrealized appreciation (depreciation) on investments still held at December 31, 20152 | | $ | 716,570 | |
| | | | |
| | 1 | | Included in the related net change in unrealized appreciation (depreciation) in the Statement of Operations. |
| | 2 | | Any difference between net change in unrealized appreciation (depreciation) and net change in unrealized appreciation (depreciation) on investments still held at December 31, 2015 is generally due to investments no longer held or categorized as Level 3 at period end. |
The Fund’s investments that are categorized as Level 3 were valued utilizing third party pricing information without adjustment. Such valuations are based on unobservable inputs. A significant change in third party information could result in a significantly lower or higher value of such Level 3 investments.
The following table summarizes the valuation techniques used and unobservable inputs utilized by the BlackRock Global Valuation Methodologies Committee (the “Global Valuation Committee”) to determine the value of certain of the Fund’s Level 3 investments as of period end.
| | | | | | | | | | | | |
| | | Value | | | Valuation Techniques | | Unobservable Inputs | | Range of
Unobservable Inputs
Utilized | |
Preferred Stocks | | $ | 2,140,305 | | | Market Comparables | | Revenue Multiple3 | | | 22.92x | |
| | | | | | | | | Revenue Growth Rate3 | | | 94.00% | |
| | 3 | | Increase in unobservable input may result in a significant increase to value, while a decrease in the unobservable input may result in a significant decrease to value. |
See Notes to Financial Statements.
| | | | | | |
| | | BLACKROCK SERIES FUND, INC. | | DECEMBER 31, 2015 | | 49 |
| | | | |
| Consolidated Schedule of Investments December 31, 2015 | | | BlackRock Global Allocation Portfolio | |
| | | (Percentages shown are based on Net Assets) | |
| | | | | | | | |
| Common Stocks | | Shares | | | Value | |
Australia — 0.1% | | | | | | | | |
BHP Billiton PLC | | | 6,794 | | | $ | 75,766 | |
Healthscope Ltd. | | | 113,181 | | | | 218,103 | |
Scentre Group | | | 3,998 | | | | 12,126 | |
Wesfarmers Ltd. | | | 249 | | | | 7,507 | |
| | | | | | | | |
| | | | | | | | 313,502 | |
Austria — 0.0% | | | | | | | | |
Oesterreichische Post AG | | | 339 | | | | 12,376 | |
Belgium — 0.1% | | | | | | | | |
Anheuser-Busch InBev NV | | | 168 | | | | 20,907 | |
BHF Kleinwort Benson Group (a) | | | 5,827 | | | | 36,190 | |
bpost SA | | | 1,045 | | | | 25,642 | |
Colruyt SA | | | 995 | | | | 51,186 | |
Proximus SADP | | | 2,935 | | | | 95,508 | |
Telenet Group Holding NV (a) | | | 431 | | | | 23,293 | |
| | | | | | | | |
| | | | | | | | 252,726 | |
Brazil — 0.1% | | | | | | | | |
Cyrela Brazil Realty SA Empreendimentos e Participacoes | | | 10,230 | | | | 19,393 | |
Gerdau SA — ADR | | | 35,333 | | | | 42,400 | |
MRV Engenharia e Participacoes SA | | | 643 | | | | 1,411 | |
Petroleo Brasileiro SA — ADR (a)(b) | | | 21,469 | | | | 92,317 | |
SLC Agricola SA | | | 8,431 | | | | 35,056 | |
| | | | | | | | |
| | | | | | | | 190,577 | |
Canada — 0.9% | | | | | | | | |
Athabasca Oil Corp. (a)(b) | | | 33,205 | | | | 36,956 | |
Barrick Gold Corp. | | | 34,373 | | | | 253,673 | |
Brookfield Asset Management, Inc., Class A | | | 5,111 | | | | 161,161 | |
Cameco Corp. | | | 18,147 | | | | 223,752 | |
Canadian National Railway Co. (b) | | | 2,175 | | | | 121,539 | |
Cenovus Energy, Inc. | | | 34,526 | | | | 436,659 | |
Eldorado Gold Corp. | | | 27,073 | | | | 80,219 | |
Enbridge, Inc. | | | 648 | | | | 21,542 | |
First Quantum Minerals Ltd. | | | 39,058 | | | | 146,217 | |
Goldcorp, Inc. (b) | | | 16,956 | | | | 196,011 | |
Platinum Group Metals Ltd. (a) | | | 184,126 | | | | 26,360 | |
Suncor Energy, Inc. | | | 1,131 | | | | 29,197 | |
Toronto-Dominion Bank | | | 7,923 | | | | 310,576 | |
TransCanada Corp. | | | 331 | | | | 10,810 | |
| | | | | | | | |
| | | | | | | | 2,054,672 | |
China — 0.3% | | | | | | | | |
Alibaba Group Holding Ltd. — ADR (a)(b) | | | 4,333 | | | | 352,143 | |
CAR, Inc. (a)(b) | | | 78,054 | | | | 128,621 | |
Dongfeng Motor Group Co. Ltd., Class H | | | 31,800 | | | | 42,126 | |
Haitian International Holdings Ltd. | | | 59,898 | | | | 86,904 | |
Zhongsheng Group Holdings Ltd. (b) | | | 96,925 | | | | 58,293 | |
| | | | | | | | |
| | | | | | | | 668,087 | |
Cyprus — 0.0% | | | | | | | | |
Ocean Rig UDW, Inc. (a)(b) | | | 5,959 | | | | 9,713 | |
Egypt — 0.0% | | | | | | | | |
Integrated Diagnostics Holdings PLC (a)(c) | | | 7,962 | | | | 39,372 | |
France — 2.5% | | | | | | | | |
Accor SA | | | 4,205 | | | | 182,119 | |
Aeroports de Paris | | | 214 | | | | 24,903 | |
Air Liquide SA | | | 735 | | | | 82,516 | |
Airbus Group SE | | | 7,684 | | | | 517,807 | |
Alcatel-Lucent (a) | | | 6,658 | | | | 26,304 | |
Atos SE | | | 4,078 | | | | 342,360 | |
AXA SA | | | 14,560 | | | | 397,833 | |
BNP Paribas SA | | | 3,247 | | | | 183,708 | |
Cie Generale des Etablissements Michelin | | | 254 | | | | 24,176 | |
Compagnie de Saint-Gobain | | | 4,550 | | | | 197,177 | |
| | | | | | | | |
| Common Stocks | | Shares | | | Value | |
France (continued) | | | | | | | | |
Danone SA | | | 3,255 | | | $ | 219,953 | |
Dassault Aviation SA | | | 225 | | | | 280,342 | |
Elis SA | | | 3,183 | | | | 52,672 | |
Engie SA | | | 9,793 | | | | 173,466 | |
Eutelsat Communications SA | | | 1,622 | | | | 48,564 | |
Groupe Eurotunnel SA, Registered Shares | | | 3,569 | | | | 44,402 | |
Iliad SA | | | 423 | | | | 100,835 | |
L’Oreal SA | | | 546 | | | | 91,840 | |
Metropole Television SA | | | 638 | | | | 10,971 | |
Numericable-SFR SAS | | | 593 | | | | 21,543 | |
Orange SA | | | 6,229 | | | | 104,185 | |
Peugeot SA (a) | | | 13,283 | | | | 232,838 | |
Renault SA | | | 1,492 | | | | 149,343 | |
Safran SA | | | 6,813 | | | | 468,074 | |
Sanofi | | | 6,072 | | | | 517,469 | |
Société Générale SA | | | 2,499 | | | | 115,160 | |
Societe Television Francaise 1 | | | 1,818 | | | | 20,187 | |
Sopra Steria Group | | | 372 | | | | 43,745 | |
TOTAL SA | | | 6,179 | | | | 277,015 | |
TOTAL SA — ADR (b) | | | 703 | | | | 31,600 | |
UbiSoft Entertainment (a) | | | 6,597 | | | | 190,926 | |
Unibail-Rodamco SE | | | 1,138 | | | | 288,975 | |
Vinci SA | | | 3,109 | | | | 199,272 | |
Vivendi SA | | | 4,261 | | | | 91,514 | |
Worldline SA (a) | | | 4,364 | | | | 113,037 | |
| | | | | | | | |
| | | | | | | | 5,866,831 | |
Germany — 0.8% | | | | | | | | |
Axel Springer SE | | | 462 | | | | 25,692 | |
Bayer AG, Registered Shares | | | 1,843 | | | | 230,174 | |
Bayerische Motoren Werke AG | | | 1,642 | | | | 172,988 | |
Deutsche Bank AG, Registered Shares | | | 7,520 | | | | 182,622 | |
Deutsche Post AG, Registered Shares | | | 7,269 | | | | 203,226 | |
Deutsche Telekom AG, Registered Shares | | | 14,302 | | | | 256,875 | |
E.ON SE | | | 999 | | | | 9,592 | |
Fraport AG Frankfurt Airport Services Worldwide | | | 806 | | | | 51,401 | |
Linde AG | | | 681 | | | | 98,377 | |
ProSiebenSat.1 Media SE | | | 2,027 | | | | 102,265 | |
SAP SE | | | 190 | | | | 15,077 | |
Stroeer SE | | | 433 | | | | 27,186 | |
Telefonica Deutschland Holding AG | | | 8,300 | | | | 43,780 | |
TUI AG | | | 5,240 | | | | 93,561 | |
United Internet AG, Registered Shares | | | 1,960 | | | | 107,760 | |
Volkswagen AG | | | 107 | | | | 16,442 | |
Vonovia SE | | | 3,743 | | | | 115,633 | |
| | | | | | | | |
| | | | | | | | 1,752,651 | |
Hong Kong — 0.8% | | | | | | | | |
AIA Group Ltd. | | | 37,800 | | | | 225,858 | |
Beijing Enterprises Holdings Ltd. | | | 44,819 | | | | 270,181 | |
Brilliance China Automotive Holdings Ltd. | | | 56,000 | | | | 70,042 | |
Chaoda Modern Agriculture Holdings Ltd. (a) | | | 715,816 | | | | 22,746 | |
Cheung Kong Property Holdings Ltd. | | | 2,000 | | | | 12,938 | |
China Resources Land Ltd. | | | 96,000 | | | | 277,795 | |
CLP Holdings Ltd. | | | 1,000 | | | | 8,476 | |
Haier Electronics Group Co. Ltd. | | | 64,000 | | | | 129,185 | |
Hong Kong & China Gas Co. Ltd. | | | 3,000 | | | | 5,871 | |
Power Assets Holdings Ltd. | | | 1,000 | | | | 9,168 | |
Sino Biopharmaceutical Ltd. | | | 127,000 | | | | 114,823 | |
Sun Hung Kai Properties Ltd. | | | 34,666 | | | | 416,671 | |
Wharf Holdings Ltd. | | | 69,000 | | | | 380,430 | |
| | | | | | | | |
| | | | | | | | 1,944,184 | |
India — 0.4% | | | | | | | | |
Coal India Ltd. | | | 41,958 | | | | 208,160 | |
Maruti Suzuki India Ltd. | | | 2,777 | | | | 193,394 | |
See Notes to Financial Statements.
| | | | | | |
| 50 | | BLACKROCK SERIES FUND, INC. | | DECEMBER 31, 2015 | | |
| | | | |
| Consolidated Schedule of Investments (continued) | | | BlackRock Global Allocation Portfolio | |
| | | | |
| | | | | | | | |
| Common Stocks | | Shares | | | Value | |
India (continued) | | | | | | | | |
Oil & Natural Gas Corp. Ltd. (a) | | | 46,507 | | | $ | 169,606 | |
Reliance Industries Ltd. | | | 23,828 | | | | 364,840 | |
| | | | | | | | |
| | | | | | | | 936,000 | |
Indonesia — 0.0% | | | | | | | | |
Siloam International Hospitals Tbk PT | | | 116,210 | | | | 82,328 | |
Ireland — 0.2% | | | | | | | | |
Shire PLC | | | 2,532 | | | | 173,715 | |
XL Group PLC | | | 5,860 | | | | 229,595 | |
| | | | | | | | |
| | | | | | | | 403,310 | |
Israel — 0.5% | | | | | | | | |
Check Point Software Technologies Ltd. (a)(b) | | | 635 | | | | 51,676 | |
Mobileye NV | | | 7,590 | | | | 320,905 | |
Teva Pharmaceutical Industries Ltd. — ADR (d) | | | 10,356 | | | | 679,768 | |
| | | | | | | | |
| | | | | | | | 1,052,349 | |
Italy — 0.7% | | | | | | | | |
EI Towers SpA | | | 6,181 | | | | 398,239 | |
Enel SpA | | | 40,120 | | | | 168,236 | |
Eni SpA | | | 1,932 | | | | 28,706 | |
Intesa Sanpaolo SpA | | | 126,629 | | | | 420,537 | |
Mediaset SpA (a) | | | 20,566 | | | | 85,224 | |
Rai Way SpA (c) | | | 35,888 | | | | 184,009 | |
Telecom Italia SpA (a) | | | 186,503 | | | | 236,359 | |
Telecom Italia SpA, Non-Convertible Savings Shares | | | 24,611 | | | | 25,259 | |
UniCredit SpA | | | 21,654 | | | | 119,719 | |
| | | | | | | | |
| | | | | | | | 1,666,288 | |
Japan — 8.7% | | | | | | | | |
Aisin Seiki Co. Ltd. | | | 7,320 | | | | 315,041 | |
Ajinomoto Co., Inc. | | | 5,000 | | | | 118,379 | |
Alpine Electronics, Inc. | | | 1,300 | | | | 20,205 | |
Asahi Group Holdings Ltd. | | | 3,800 | | | | 118,957 | |
Asahi Kasei Corp. | | | 31,900 | | | | 215,711 | |
Astellas Pharma, Inc. | | | 12,950 | | | | 184,353 | |
Autobacs Seven Co. Ltd. | | | 600 | | | | 10,936 | |
Bandai Namco Holdings, Inc. | | | 1,900 | | | | 40,142 | |
Bank of Yokohama Ltd. | | | 7,000 | | | | 42,907 | |
Benesse Holdings, Inc. | | | 300 | | | | 8,639 | |
Bridgestone Corp. | | | 12,600 | | | | 432,198 | |
Canon Marketing Japan, Inc. | | | 900 | | | | 14,074 | |
Chiba Bank Ltd. | | | 6,000 | | | | 42,577 | |
Chiyoda Corp. | | | 2,000 | | | | 15,187 | |
Chubu Electric Power Co., Inc. | | | 15,500 | | | | 212,253 | |
COMSYS Holdings Corp. | | | 600 | | | | 8,437 | |
Daikin Industries Ltd. | | | 4,200 | | | | 305,851 | |
Daikyo, Inc. | | | 12,000 | | | | 19,464 | |
Daito Trust Construction Co. Ltd. | | | 1,500 | | | | 173,266 | |
Daiwa House Industry Co. Ltd. | | | 500 | | | | 14,373 | |
Dena Co. Ltd. | | | 2,600 | | | | 40,654 | |
Denso Corp. | | | 13,030 | | | | 622,645 | |
East Japan Railway Co. | | | 6,527 | | | | 614,621 | |
Eisai Co. Ltd. | | | 1,500 | | | | 99,226 | |
Electric Power Development Co. Ltd. | | | 2,300 | | | | 81,918 | |
Exedy Corp. | | | 600 | | | | 14,501 | |
FamilyMart Co. Ltd. | | | 3,700 | | | | 172,179 | |
FANUC Corp. | | | 800 | | | | 137,832 | |
Fuji Heavy Industries Ltd. | | | 22,660 | | | | 933,508 | |
Fukuoka Financial Group, Inc. | | | 15,000 | | | | 74,379 | |
Futaba Industrial Co. Ltd. | | | 7,970 | | | | 38,038 | |
GS Yuasa Corp. | | | 25,000 | | | | 92,910 | |
GungHo Online Entertainment, Inc. (a) | | | 5,300 | | | | 14,398 | |
Hitachi Chemical Co. Ltd. | | | 10,300 | | | | 163,406 | |
Hitachi High-Technologies Corp. | | | 1,400 | | | | 37,860 | |
| | | | | | | | |
| Common Stocks | | Shares | | | Value | |
Japan (continued) | | | | | | | | |
Hitachi Kokusai Electric, Inc. | | | 1,000 | | | $ | 13,594 | |
Honda Motor Co. Ltd. | | | 9,840 | | | | 314,502 | |
Hoya Corp. | | | 4,901 | | | | 200,415 | |
IHI Corp. | | | 27,000 | | | | 74,533 | |
Inpex Corp. | | | 40,599 | | | | 395,796 | |
Isuzu Motors Ltd. | | | 19,700 | | | | 212,221 | |
Japan Airlines Co. Ltd. | | | 17,700 | | | | 633,534 | |
Japan Post Bank Co. Ltd. (a) | | | 10,300 | | | | 149,965 | |
Japan Tobacco, Inc. | | | 3,700 | | | | 135,841 | |
JGC Corp. | | | 5,580 | | | | 85,409 | |
JSR Corp. | | | 10,500 | | | | 163,636 | |
Kamigumi Co. Ltd. | | | 2,000 | | | | 17,220 | |
Kansai Electric Power Co., Inc. (a) | | | 2,300 | | | | 27,577 | |
KDDI Corp. | | | 10,300 | | | | 267,493 | |
Keyence Corp. | | | 100 | | | | 54,961 | |
Kinden Corp. | | | 2,100 | | | | 26,777 | |
Koito Manufacturing Co. Ltd. | | | 3,700 | | | | 151,727 | |
Komatsu Ltd. | | | 8,200 | | | | 134,172 | |
Kubota Corp. | | | 10,880 | | | | 168,081 | |
Kuraray Co. Ltd. | | | 10,320 | | | | 125,004 | |
Kyocera Corp. | | | 4,700 | | | | 218,271 | |
Kyushu Electric Power Co, Inc. (a) | | | 9,800 | | | | 106,811 | |
Mabuchi Motor Co. Ltd. | | | 1,000 | | | | 54,195 | |
Maeda Road Construction Co. Ltd. | | | 1,000 | | | | 16,763 | |
Medipal Holdings Corp. | | | 400 | | | | 6,818 | |
Mitsubishi Corp. | | | 12,390 | | | | 206,084 | |
Mitsubishi Electric Corp. | | | 45,000 | | | | 472,358 | |
Mitsubishi Estate Co. Ltd. | | | 21,000 | | | | 436,660 | |
Mitsubishi Heavy Industries Ltd. | | | 44,000 | | | | 192,390 | |
Mitsubishi UFJ Financial Group, Inc. | | | 55,300 | | | | 342,542 | |
Mitsui & Co. Ltd. | | | 19,220 | | | | 228,373 | |
Mitsui Fudosan Co. Ltd. | | | 1,000 | | | | 25,098 | |
Mizuho Financial Group, Inc. | | | 82,900 | | | | 165,800 | |
MS&AD Insurance Group Holdings, Inc. | | | 2,415 | | | | 70,819 | |
Murata Manufacturing Co. Ltd. | | | 640 | | | | 92,084 | |
Nabtesco Corp. | | | 2,500 | | | | 50,788 | |
NEC Corp. | | | 64,000 | | | | 202,785 | |
Nexon Co. Ltd. | | | 2,800 | | | | 45,550 | |
Nikon Corp. (b) | | | 20,000 | | | | 267,869 | |
Nintendo Co. Ltd. | | | 2,100 | | | | 288,771 | |
Nippon Express Co. Ltd. | | | 11,000 | | | | 51,691 | |
Nippon Steel & Sumitomo Metal Corp. | | | 3,800 | | | | 75,173 | |
Nippon Telegraph & Telephone Corp. | | | 6,620 | | | | 263,464 | |
Nitto Denko Corp. | | | 7,100 | | | | 518,340 | |
Nomura Holdings, Inc. | | | 30,000 | | | | 167,102 | |
NS Solutions Corp. | | | 200 | | | | 4,557 | |
Okumura Corp. (b) | | | 24,270 | | | | 136,659 | |
Omron Corp. | | | 3,000 | | | | 100,041 | |
Otsuka Holdings Co. Ltd. | | | 5,300 | | | | 188,303 | |
Rinnai Corp. | | | 2,150 | | | | 190,497 | |
Rohm Co. Ltd. | | | 6,960 | | | | 352,530 | |
Sanrio Co. Ltd. | | | 6,000 | | | | 140,960 | |
Sawai Pharmaceutical Co. Ltd. | | | 700 | | | | 47,923 | |
SCSK Corp. | | | 200 | | | | 8,036 | |
Secom Co. Ltd. | | | 500 | | | | 33,885 | |
Sega Sammy Holdings, Inc. | | | 12,000 | | | | 112,240 | |
Seino Holdings Co. Ltd. | | | 2,900 | | | | 30,172 | |
Seven & i Holdings Co. Ltd. | | | 2,800 | | | | 128,197 | |
Shimamura Co. Ltd. | | | 300 | | | | 35,133 | |
Shin-Etsu Chemical Co. Ltd. | | | 9,920 | | | | 539,309 | |
Ship Healthcare Holdings, Inc. | | | 2,600 | | | | 64,375 | |
Shizuoka Bank Ltd. | | | 4,000 | | | | 38,792 | |
SHO-BOND Holdings Co Ltd. | | | 100 | | | | 3,647 | |
SMC Corp. | | | 300 | | | | 77,920 | |
Sohgo Security Services Co. Ltd. | | | 1,400 | | | | 65,658 | |
See Notes to Financial Statements.
| | | | | | |
| | | BLACKROCK SERIES FUND, INC. | | DECEMBER 31, 2015 | | 51 |
| | | | |
| Consolidated Schedule of Investments (continued) | | | BlackRock Global Allocation Portfolio | |
| | | | |
| | | | | | | | |
| Common Stocks | | Shares | | | Value | |
Japan (continued) | | | | | | | | |
Sompo Japan Nipponkoa Holdings, Inc. | | | 1,900 | | | $ | 62,386 | |
Sony Financial Holdings, Inc. | | | 13,000 | | | | 232,534 | |
Stanley Electric Co. Ltd. | | | 1,000 | | | | 21,938 | |
Sumco Corp. | | | 14,500 | | | | 109,395 | |
Sumitomo Corp. | | | 19,100 | | | | 194,731 | |
Sumitomo Electric Industries Ltd. | | | 13,000 | | | | 183,571 | |
Sumitomo Mitsui Financial Group, Inc. | | | 4,600 | | | | 173,609 | |
Suntory Beverage & Food Ltd. | | | 2,900 | | | | 126,951 | |
Suzuki Motor Corp. | | | 9,861 | | | | 299,615 | |
Toda Corp. | | | 26,000 | | | | 138,624 | |
Tokio Marine Holdings, Inc. | | | 4,902 | | | | 189,338 | |
Tokyo Electric Power Co., Inc. (a) | | | 4,000 | | | | 23,033 | |
Tokyo Gas Co. Ltd. | | | 112,581 | | | | 528,995 | |
Toyota Industries Corp. | | | 13,214 | | | | 706,598 | |
Toyota Motor Corp. | | | 10,200 | | | | 628,106 | |
Toyota Tsusho Corp. | | | 3,800 | | | | 88,893 | |
Trend Micro, Inc. (a) | | | 1,800 | | | | 73,039 | |
TV Asahi Holdings Corp. | | | 900 | | | | 15,536 | |
Ube Industries Ltd. | | | 75,600 | | | | 159,759 | |
Yahoo! Japan Corp. | | | 22,800 | | | | 92,680 | |
Yamada Denki Co. Ltd. | | | 33,100 | | | | 142,976 | |
Yamaha Corp. | | | 2,500 | | | | 60,386 | |
Yamato Kogyo Co. Ltd. | | | 100 | | | | 2,550 | |
| | | | | | | | |
| | | | | | | | 19,924,159 | |
Kazakhstan — 0.0% | | | | | | | | |
KazMunaiGas Exploration Production JSC — GDR | | | 8,526 | | | | 56,505 | |
Luxembourg — 0.0% | | | | | | | | |
RTL Group SA | | | 536 | | | | 44,636 | |
Malaysia — 0.1% | | | | | | | | |
Axiata Group Bhd | | | 92,751 | | | | 138,221 | |
IHH Healthcare Bhd | | | 139,200 | | | | 213,331 | |
| | | | | | | | |
| | | | | | | | 351,552 | |
Mexico — 0.3% | | | | | | | | |
America Movil SAB de CV, Series L | | | 113,057 | | | | 79,506 | |
America Movil SAB de CV, Series L — ADR | | | 8,953 | | | | 125,879 | |
Fibra Uno Administracion SA de CV (b) | | | 144,843 | | | | 319,277 | |
Telesites SAB (a) | | | 162,148 | | | | 105,467 | |
| | | | | | | | |
| | | | | | | | 630,129 | |
Netherlands — 1.2% | | | | | | | | |
Akzo Nobel NV | | | 9,684 | | | | 647,075 | |
CNH Industrial NV — Special Voting Shares | | | 3,789 | | | | 25,917 | |
Constellium NV, Class A (a) | | | 14,044 | | | | 108,139 | |
ING Groep NV — CVA | | | 15,120 | | | | 204,575 | |
Koninklijke KPN NV | | | 54,951 | | | | 207,846 | |
Koninklijke Philips NV | | | 12,764 | | | | 325,793 | |
PostNL NV (a) | | | 14,230 | | | | 53,974 | |
Randstad Holding NV | | | 3,346 | | | | 208,361 | |
Royal Dutch Shell PLC, Class A | | | 3,052 | | | | 69,126 | |
Royal Dutch Shell PLC, Class B | | | 1,902 | | | | 43,349 | |
SBM Offshore NV (a) | | | 51,677 | | | | 652,825 | |
TomTom NV (a) | | | 10,282 | | | | 129,266 | |
Unilever NV | | | 597 | | | | 26,020 | |
| | | | | | | | |
| | | | | | | | 2,702,266 | |
Norway — 0.2% | | | | | | | | |
Statoil ASA | | | 35,842 | | | | 499,880 | |
Peru — 0.2% | | | | | | | | |
Southern Copper Corp. (b) | | | 13,711 | | | | 358,131 | |
| | | | | | | | |
| Common Stocks | | Shares | | | Value | |
Portugal — 0.1% | | | | | | | | |
CTT-Correios de Portugal SA | | | 2,181 | | | $ | 20,961 | |
NOS SGPS SA | | | 20,265 | | | | 159,444 | |
| | | | | | | | |
| | | | | | | | 180,405 | |
Singapore — 0.7% | | | | | | | | |
Avago Technologies Ltd. | | | 74 | | | | 10,741 | |
CapitaLand Ltd. | | | 200,800 | | | | 471,978 | |
Global Logistic Properties Ltd. | | | 349,800 | | | | 528,254 | |
Keppel Corp. Ltd. | | | 57,400 | | | | 262,213 | |
Raffles Medical Group Ltd. | | | 15,300 | | | | 44,855 | |
Singapore Telecommunications Ltd. | | | 86,600 | | | | 223,278 | |
| | | | | | | | |
| | | | | | | | 1,541,319 | |
South Korea — 0.5% | | | | | | | | |
Hyundai Motor Co. (b) | | | 2,544 | | | | 320,859 | |
Hyundai Wia Corp. | | | 632 | | | | 59,756 | |
Samsung Electronics Co. Ltd. | | | 488 | | | | 520,492 | |
Samsung SDI Co. Ltd. | | | 478 | | | | 45,952 | |
SK Hynix, Inc. | | | 5,489 | | | | 141,797 | |
| | | | | | | | |
| | | | | | | | 1,088,856 | |
Spain — 0.6% | | | | | | | | |
Aena SA (a)(c) | | | 872 | | | | 99,853 | |
Banco Santander SA | | | 43,923 | | | | 216,075 | |
Cellnex Telecom SAU (c) | | | 22,370 | | | | 418,253 | |
Cia de Distribucion Integral Logista Holdings SA | | | 1,306 | | | | 27,537 | |
Distribuidora Internacional de Alimentacion SA (b) | | | 31,970 | | | | 188,563 | |
Iberdrola SA | | | 9,895 | | | | 70,146 | |
Industria de Diseno Textil SA | | | 5,882 | | | | 202,072 | |
Mediaset Espana Comunicacion SA | | | 4,552 | | | | 49,525 | |
Merlin Properties Socimi SA | | | 16,301 | | | | 204,207 | |
| | | | | | | | |
| | | | | | | | 1,476,231 | |
Sweden — 0.1% | | | | | | | | |
Getinge AB, Class B | | | 2,098 | | | | 54,958 | |
Svenska Handelsbanken AB, A Shares | | | 13,595 | | | | 180,562 | |
Telefonaktiebolaget LM Ericsson, B Shares | | | 633 | | | | 6,103 | |
| | | | | | | | |
| | | | | | | | 241,623 | |
Switzerland — 1.4% | | | | | | | | |
Credit Suisse Group AG, Registered Shares | | | 6,066 | | | | 130,674 | |
Glencore PLC | | | 162,497 | | | | 215,331 | |
Nestle SA, Registered Shares | | | 11,508 | | | | 854,299 | |
Novartis AG, Registered Shares | | | 5,965 | | | | 513,105 | |
Roche Holding AG | | | 1,525 | | | | 422,590 | |
Syngenta AG, Registered Shares | | | 1,033 | | | | 404,319 | |
TE Connectivity Ltd. | | | 119 | | | | 7,689 | |
UBS Group AG, Registered Shares | | | 23,805 | | | | 461,804 | |
Zurich Insurance Group AG | | | 399 | | | | 102,503 | |
| | | | | | | | |
| | | | | | | | 3,112,314 | |
Taiwan — 0.2% | | | | | | | | |
Cheng Shin Rubber Industry Co. Ltd. | | | 42,341 | | | | 68,434 | |
Delta Electronics, Inc. | | | 9,000 | | | | 42,332 | |
Hon Hai Precision Industry Co. Ltd. | | | 3,250 | | | | 7,954 | |
Taiwan Semiconductor Manufacturing Co. Ltd. | | | 52,000 | | | | 224,341 | |
Yulon Motor Co. Ltd. | | | 51,059 | | | | 46,480 | |
| | | | | | | | |
| | | | | | | | 389,541 | |
Thailand — 0.1% | | | | | | | | |
Bangkok Dusit Medical Services PCL | | | 281,700 | | | | 174,570 | |
See Notes to Financial Statements.
| | | | | | |
| 52 | | BLACKROCK SERIES FUND, INC. | | DECEMBER 31, 2015 | | |
| | | | |
| Consolidated Schedule of Investments (continued) | | | BlackRock Global Allocation Portfolio | |
| | | | |
| | | | | | | | |
| Common Stocks | | Shares | | | Value | |
Thailand (continued) | | | | | | | | |
Bumrungrad Hospital PCL | | | 20,300 | | | $ | 119,030 | |
| | | | | | | | |
| | | | | | | | 293,600 | |
United Arab Emirates — 0.2% | | | | | | | | |
Al Noor Hospitals Group PLC | | | 10,805 | | | | 176,247 | |
NMC Health PLC (b) | | | 18,315 | | | | 226,936 | |
| | | | | | | | |
| | | | | | | | 403,183 | |
United Kingdom — 3.4% | | | | | | | | |
Antofagasta PLC | | | 41,600 | | | | 286,160 | |
AstraZeneca PLC | | | 9,925 | | | | 670,412 | |
AstraZeneca PLC — ADR | | | 682 | | | | 23,154 | |
Barclays PLC | | | 22,102 | | | | 71,142 | |
BG Group PLC | | | 2,640 | | | | 38,269 | |
BP PLC | | | 14,144 | | | | 73,502 | |
British American Tobacco PLC | | | 414 | | | | 22,991 | |
BT Group PLC | | | 34,360 | | | | 238,583 | |
Centrica PLC | | | 2,935 | | | | 9,424 | |
Coats Group PLC (a) | | | 43,350 | | | | 15,714 | |
Delphi Automotive PLC | | | 5,330 | | | | 456,941 | |
Delta Topco Ltd. (Acquired 5/02/12, cost $227,998) (e) | | | 369,427 | | | | 161,809 | |
Diageo PLC | | | 557 | | | | 15,211 | |
Diageo PLC — ADR | | | 2,545 | | | | 277,583 | |
HSBC Holdings PLC | | | 151,364 | | | | 1,194,907 | |
Imperial Tobacco Group PLC | | | 214 | | | | 11,303 | |
Land Securities Group PLC | | | 574 | | | | 9,950 | |
Legal & General Group PLC | | | 42,752 | | | | 168,696 | |
Liberty Global PLC, Class A (a) | | | 3,439 | | | | 145,676 | |
Lloyds Banking Group PLC | | | 134,205 | | | | 144,405 | |
National Grid PLC | | | 18,108 | | | | 249,740 | |
Ophir Energy PLC (a) | | | 84,396 | | | | 121,752 | |
Prudential PLC | | | 16,558 | | | | 373,046 | |
Reckitt Benckiser Group PLC | | | 138 | | | | 12,769 | |
Rio Tinto PLC | | | 15,711 | | | | 457,433 | |
SABMiller PLC | | | 19,784 | | | | 1,183,566 | |
Spire Healthcare Group PLC (c) | | | 70,507 | | | | 325,524 | |
SSE PLC | | | 538 | | | | 12,080 | |
Standard Chartered PLC | | | 20,679 | | | | 171,578 | |
Vodafone Group PLC | | | 124,139 | | | | 402,556 | |
Vodafone Group PLC — ADR | | | 13,214 | | | | 426,284 | |
| | | | | | | | |
| | | | | | | | 7,772,160 | |
United States — 27.7% | | | | | | | | |
3M Co. | | | 316 | | | | 47,602 | |
Abbott Laboratories (d) | | | 4,746 | | | | 213,143 | |
AbbVie, Inc. | | | 6,583 | | | | 389,977 | |
Accenture PLC, Class A | | | 788 | | | | 82,346 | |
ACE Ltd. | | | 356 | | | | 41,599 | |
Activision Blizzard, Inc. (d) | | | 7,056 | | | | 273,138 | |
Adobe Systems, Inc. (a) | | | 842 | | | | 79,097 | |
AES Corp. | | | 11,502 | | | | 110,074 | |
Aetna, Inc. | | | 6,476 | | | | 700,185 | |
Air Products & Chemicals, Inc. | | | 568 | | | | 73,902 | |
Alexion Pharmaceuticals, Inc. (a) | | | 1,064 | | | | 202,958 | |
Alkermes PLC (a) | | | 827 | | | | 65,647 | |
Allergan PLC (a) | | | 1,591 | | | | 497,187 | |
Alliance Data Systems Corp. (a) | | | 160 | | | | 44,251 | |
Allstate Corp. | | | 4,613 | | | | 286,421 | |
Alphabet, Inc., Class A (a) | | | 781 | | | | 607,626 | |
Alphabet, Inc., Class C (a) | | | 2,438 | | | | 1,850,149 | |
Altria Group, Inc. | | | 826 | | | | 48,081 | |
Amazon.com, Inc. (a)(d) | | | 14 | | | | 9,462 | |
Amdocs Ltd. | | | 929 | | | | 50,696 | |
Ameren Corp. | | | 163 | | | | 7,046 | |
American Airlines Group, Inc. | | | 5,800 | | | | 245,630 | |
American Electric Power Co., Inc. | | | 3,361 | | | | 195,845 | |
| | | | | | | | |
| Common Stocks | | Shares | | | Value | |
United States (continued) | | | | | | | | |
American International Group, Inc. | | | 7,780 | | | $ | 482,127 | |
American Tower Corp. | | | 400 | | | | 38,780 | |
American Water Works Co., Inc. | | | 4,577 | | | | 273,476 | |
Ameriprise Financial, Inc. | | | 380 | | | | 40,440 | |
AmerisourceBergen Corp. | | | 573 | | | | 59,426 | |
Amgen, Inc. | | | 4,106 | | | | 666,527 | |
Anacor Pharmaceuticals, Inc. (a) | | | 44 | | | | 4,971 | |
Anadarko Petroleum Corp. | | | 21,405 | | | | 1,039,855 | |
Anthem, Inc. | | | 3,471 | | | | 483,996 | |
Apple Inc. | | | 12,433 | | | | 1,308,698 | |
Applied Materials, Inc. | | | 356 | | | | 6,647 | |
Archer-Daniels-Midland Co. | | | 917 | | | | 33,636 | |
AT&T Inc. | | | 26,846 | | | | 923,771 | |
Automatic Data Processing, Inc. | | | 141 | | | | 11,946 | |
AvalonBay Communities, Inc. | | | 134 | | | | 24,673 | |
Axalta Coating Systems Ltd. (a) | | | 9,000 | | | | 239,850 | |
AXIS Capital Holdings Ltd. | | | 956 | | | | 53,746 | |
Baker Hughes, Inc. | | | 463 | | | | 21,367 | |
Bank of America Corp. | | | 60,557 | | | | 1,019,174 | |
Bank of New York Mellon Corp. (d) | | | 4,388 | | | | 180,873 | |
Baxter International, Inc. (d) | | | 3,907 | | | | 149,052 | |
Becton Dickinson & Co. | | | 118 | | | | 18,183 | |
Bed Bath & Beyond, Inc. (a) | | | 2,381 | | | | 114,883 | |
Berkshire Hathaway, Inc., Class A (a) | | | 2 | | | | 395,600 | |
Berkshire Hathaway, Inc., Class B (a) | | | 4,975 | | | | 656,899 | |
Biogen, Inc. (a) | | | 1,049 | | | | 321,361 | |
Boeing Co. | | | 301 | | | | 43,522 | |
Boston Properties, Inc. | | | 156 | | | | 19,896 | |
Bristol-Myers Squibb Co. | | | 6,162 | | | | 423,884 | |
Broadcom Corp., Class A | | | 159 | | | | 9,193 | |
Calpine Corp. (a) | | | 13,027 | | | | 188,501 | |
Cameron International Corp. (a) | | | 438 | | | | 27,682 | |
Capital One Financial Corp. | | | 668 | | | | 48,216 | |
Cardinal Health, Inc. | | | 690 | | | | 61,596 | |
Catalent, Inc. (a) | | | 10,250 | | | | 256,557 | |
Caterpillar, Inc. (b) | | | 1,516 | | | | 103,027 | |
Celgene Corp. (a) | | | 1,747 | | | | 209,221 | |
Charles Schwab Corp. | | | 6,411 | | | | 211,114 | |
Chevron Corp. | | | 2,367 | | | | 212,935 | |
Chubb Corp. | | | 6,227 | | | | 825,949 | |
Cintas Corp. | | | 636 | | | | 57,908 | |
Cisco Systems, Inc. | | | 27,505 | | | | 746,898 | |
Citigroup, Inc. | | | 21,543 | | | | 1,114,850 | |
Citizens Financial Group, Inc. | | | 978 | | | | 25,614 | |
CME Group, Inc. | | | 2,219 | | | | 201,041 | |
CMS Energy Corp. | | | 201 | | | | 7,252 | |
CNA Financial Corp. | | | 985 | | | | 34,623 | |
Coca-Cola Co. | | | 19,522 | | | | 838,665 | |
Coca-Cola Enterprises, Inc. | | | 446 | | | | 21,961 | |
Cognizant Technology Solutions Corp., Class A (a) | | | 178 | | | | 10,684 | |
Colfax Corp. (a) | | | 5,709 | | | | 133,305 | |
Colgate-Palmolive Co. | | | 4,779 | | | | 318,377 | |
Comcast Corp., Class A | | | 11,526 | | | | 650,412 | |
Computer Sciences Corp. | | | 906 | | | | 29,608 | |
ConocoPhillips | | | 1,308 | | | | 61,071 | |
CONSOL Energy, Inc. (b) | | | 38,256 | | | | 302,222 | |
Consolidated Edison, Inc. | | | 225 | | | | 14,461 | |
Constellation Brands, Inc., Class A | | | 561 | | | | 79,909 | |
Corning, Inc. | | | 374 | | | | 6,837 | |
Costco Wholesale Corp. | | | 134 | | | | 21,641 | |
Crown Castle International Corp. | | | 2,638 | | | | 228,055 | |
CSX Corp. | | | 6,185 | | | | 160,501 | |
CVS Health Corp. | | | 5,918 | | | | 578,603 | |
DaVita HealthCare Partners, Inc. (a) | | | 2,308 | | | | 160,891 | |
Delta Air Lines, Inc. | | | 3,875 | | | | 196,424 | |
See Notes to Financial Statements.
| | | | | | |
| | | BLACKROCK SERIES FUND, INC. | | DECEMBER 31, 2015 | | 53 |
| | | | |
| Consolidated Schedule of Investments (continued) | | | BlackRock Global Allocation Portfolio | |
| | | | |
| | | | | | | | |
| Common Stocks | | Shares | | | Value | |
United States (continued) | | | | | | | | |
Discover Financial Services | | | 852 | | | $ | 45,684 | |
DISH Network Corp., Class A (a) | | | 4,920 | | | | 281,326 | |
Dominion Resources, Inc. | | | 3,107 | | | | 210,157 | |
Dover Corp. | | | 402 | | | | 24,647 | |
Dr. Pepper Snapple Group, Inc. | | | 301 | | | | 28,053 | |
DTE Energy Co. | | | 117 | | | | 9,382 | |
Duke Energy Corp. | | | 485 | | | | 34,624 | |
Eaton Corp. PLC | | | 9,859 | | | | 513,062 | |
eBay, Inc. (a) | | | 4,941 | | | | 135,779 | |
Ecolab, Inc. | | | 797 | | | | 91,161 | |
Edgewell Personal Care Co. | | | 2,348 | | | | 184,013 | |
Edison International | | | 235 | | | | 13,914 | |
Electronic Arts, Inc. (a) | | | 662 | | | | 45,493 | |
Eli Lilly & Co. | | | 7,269 | | | | 612,486 | |
EMC Corp. | | | 594 | | | | 15,254 | |
Emerson Electric Co. | | | 5,673 | | | | 271,340 | |
Entergy Corp. | | | 141 | | | | 9,639 | |
Envision Healthcare Holdings, Inc. (a) | | | 1,714 | | | | 44,513 | |
EOG Resources, Inc. | | | 1,750 | | | | 123,883 | |
EQT Corp. | | | 6,052 | | | | 315,491 | |
Equinix, Inc. | | | 56 | | | | 16,934 | |
Equity Residential | | | 366 | | | | 29,862 | |
Essex Property Trust, Inc. | | | 64 | | | | 15,322 | |
Eversource Energy | | | 231 | | | | 11,797 | |
Exelon Corp. | | | 682 | | | | 18,939 | |
Expedia, Inc. | | | 557 | | | | 69,235 | |
Exxon Mobil Corp. | | | 4,479 | | | | 349,138 | |
Facebook, Inc., Class A (a) | | | 5,226 | | | | 546,953 | |
FedEx Corp. | | | 3,471 | | | | 517,144 | |
Fidelity National Information Services, Inc. | | | 928 | | | | 56,237 | |
Fifth Third Bancorp (b) | | | 1,262 | | | | 25,366 | |
FirstEnergy Corp. | | | 305 | | | | 9,678 | |
Fitbit, Inc., Class A (a)(b) | | | 1,251 | | | | 37,017 | |
FMC Corp. (b) | | | 4,316 | | | | 168,885 | |
Ford Motor Co. | | | 31,820 | | | | 448,344 | |
Freeport-McMoRan, Inc. (b) | | | 11,463 | | | | 77,604 | |
Garmin Ltd. (b) | | | 1,505 | | | | 55,941 | |
General Dynamics Corp. | | | 440 | | | | 60,438 | |
General Electric Co. (d) | | | 46,252 | | | | 1,440,750 | |
General Growth Properties, Inc. (b) | | | 576 | | | | 15,673 | |
General Mills, Inc. | | | 185 | | | | 10,667 | |
Gilead Sciences, Inc. (d) | | | 3,365 | | | | 340,504 | |
Global Payments, Inc. | | | 423 | | | | 27,288 | |
GoDaddy, Inc., Class A (a)(b) | | | 2,248 | | | | 72,071 | |
Goldman Sachs Group, Inc. (d) | | | 1,481 | | | | 266,921 | |
Goodyear Tire & Rubber Co. | | | 924 | | | | 30,187 | |
Hain Celestial Group, Inc. (a) | | | 1,130 | | | | 45,641 | |
Halliburton Co. | | | 907 | | | | 30,874 | |
Hartford Financial Services Group, Inc. | | | 2,553 | | | | 110,953 | |
HCA Holdings, Inc. (a) | | | 3,928 | | | | 265,651 | |
HCP, Inc. (b) | | | 437 | | | | 16,711 | |
Helmerich & Payne, Inc. (b) | | | 538 | | | | 28,810 | |
Hewlett Packard Enterprise Co. | | | 11,008 | | | | 167,322 | |
Hewlett-Packard Co. (a) | | | 14,847 | | | | 175,789 | |
Home Depot, Inc. | | | 404 | | | | 53,429 | |
Host Hotels & Resorts, Inc. | | | 717 | | | | 10,999 | |
HTG Molecular Diagnostics, Inc. (a)(b) | | | 1,700 | | | | 7,412 | |
Ingersoll-Rand PLC | | | 3,073 | | | | 169,906 | |
Intel Corp. | | | 10,119 | | | | 348,600 | |
International Business Machines Corp. | | | 3,179 | | | | 437,494 | |
International Paper Co. | | | 934 | | | | 35,212 | |
Intuit, Inc. | | | 621 | | | | 59,927 | |
| | | | | | | | |
| Common Stocks | | Shares | | | Value | |
United States (continued) | | | | | | | | |
Invitae Corp. (a)(b) | | | 9,620 | | | $ | 78,980 | |
Johnson & Johnson | | | 6,358 | | | | 653,094 | |
JPMorgan Chase & Co. | | | 17,386 | | | | 1,147,998 | |
Kansas City Southern | | | 1,564 | | | | 116,784 | |
Kimberly-Clark Corp. (d) | | | 1,836 | | | | 233,723 | |
Kinder Morgan, Inc. | | | 1,819 | | | | 27,139 | |
KLA-Tencor Corp. | | | 491 | | | | 34,051 | |
Kraft Heinz Co. | | | 1,581 | | | | 115,034 | |
Kroger Co. | | | 1,952 | | | | 81,652 | |
Las Vegas Sands Corp. | | | 2,510 | | | | 110,038 | |
Lear Corp. | | | 639 | | | | 78,488 | |
Liberty Broadband Corp., Class A (a) | | | 2,125 | | | | 109,756 | |
Liberty Broadband Corp., Class C (a) | | | 4,724 | | | | 244,987 | |
Liberty Media Corp., Class A (a) | | | 6,176 | | | | 242,408 | |
Liberty Media Corp., Class C (a) | | | 11,580 | | | | 440,966 | |
Lincoln National Corp. | | | 1,533 | | | | 77,049 | |
Lookout, Inc. (Acquired 3/04/15, cost $16,643) (e) | | | 1,457 | | | | 16,643 | |
Lowe’s Cos., Inc. | | | 612 | | | | 46,536 | |
LyondellBasell Industries NV, Class A | | | 2,479 | | | | 215,425 | |
Macerich Co. (b) | | | 139 | | | | 11,216 | |
Macy’s, Inc. | | | 2,180 | | | | 76,256 | |
Marathon Petroleum Corp. | | | 31,984 | | | | 1,658,051 | |
Marsh & McLennan Cos., Inc. | | | 4,985 | | | | 276,418 | |
MasterCard, Inc., Class A | | | 4,289 | | | | 417,577 | |
McDonald’s Corp. | | | 374 | | | | 44,184 | |
McKesson Corp. | | | 4,523 | | | | 892,071 | |
Merck & Co., Inc. (d) | | | 5,554 | | | | 293,362 | |
MetLife, Inc. (d) | | | 2,408 | | | | 116,090 | |
Michael Kors Holdings Ltd. (a) | | | 6,730 | | | | 269,604 | |
Micron Technology, Inc. (a) | | | 15,349 | | | | 217,342 | |
Microsoft Corp. | | | 16,384 | | | | 908,984 | |
Mondelez International, Inc., Class A | | | 491 | | | | 22,016 | |
Monsanto Co. | | | 1,474 | | | | 145,218 | |
Morgan Stanley (d) | | | 8,411 | | | | 267,554 | |
Mylan NV (a) | | | 8,433 | | | | 455,972 | |
NextEra Energy Partners LP | | | 5,998 | | | | 179,040 | |
NextEra Energy, Inc. | | | 2,781 | | | | 288,918 | |
NIKE, Inc., Class B | | | 476 | | | | 29,750 | |
Northrop Grumman Corp. | | | 379 | | | | 71,559 | |
NRG Energy, Inc. | | | 9,586 | | | | 112,827 | |
NRG Yield, Inc., Class A (b) | | | 1,627 | | | | 22,632 | |
NRG Yield, Inc., Class C | | | 1,791 | | | | 26,435 | |
Nuance Communications, Inc. (a) | | | 6,226 | | | | 123,835 | |
Nucor Corp. | | | 1,864 | | | | 75,119 | |
Occidental Petroleum Corp. | | | 830 | | | | 56,116 | |
Oceaneering International, Inc. | | | 8,056 | | | | 302,261 | |
Oracle Corp. | | | 15,166 | | | | 554,014 | |
PACCAR, Inc. | | | 3,483 | | | | 165,094 | |
PayPal Holdings, Inc. (a) | | | 1,903 | | | | 68,889 | |
PepsiCo, Inc. | | | 4,000 | | | | 399,680 | |
Pfizer, Inc. | | | 22,176 | | | | 715,841 | |
PG&E Corp. | | | 358 | | | | 19,042 | |
Philip Morris International, Inc. | | | 6,013 | | | | 528,603 | |
Pioneer Natural Resources Co. | | | 3,287 | | | | 412,124 | |
PPG Industries, Inc. | | | 811 | | | | 80,143 | |
PPL Corp. | | | 493 | | | | 16,826 | |
Praxair, Inc. | | | 860 | | | | 88,064 | |
Procter & Gamble Co. | | | 14,382 | | | | 1,142,075 | |
Prologis, Inc. | | | 5,575 | | | | 239,279 | |
Prudential Financial, Inc. (d) | | | 479 | | | | 38,995 | |
Public Service Enterprise Group, Inc. | | | 358 | | | | 13,851 | |
See Notes to Financial Statements.
| | | | | | |
| 54 | | BLACKROCK SERIES FUND, INC. | | DECEMBER 31, 2015 | | |
| | | | |
| Consolidated Schedule of Investments (continued) | | | BlackRock Global Allocation Portfolio | |
| | | | |
| | | | | | | | |
| Common Stocks | | Shares | | | Value | |
United States (continued) | | | | | | | | |
Public Storage | | | 144 | | | $ | 35,669 | |
Pure Storage, Inc., Class A (a)(b) | | | 7,716 | | | | 120,138 | |
Qorvo, Inc. (a) | | | 1,489 | | | | 75,790 | |
QUALCOMM, Inc. (d) | | | 13,012 | | | | 650,405 | |
Raytheon Co. | | | 460 | | | | 57,284 | |
Realty Income Corp. (b) | | | 235 | | | | 12,133 | |
Regeneron Pharmaceuticals, Inc. (a) | | | 168 | | | | 91,202 | |
Regions Financial Corp. | | | 17,265 | | | | 165,744 | |
Reinsurance Group of America, Inc. | | | 525 | | | | 44,914 | |
Reynolds American, Inc. | | | 250 | | | | 11,538 | |
Rockwell Automation, Inc. | | | 534 | | | | 54,794 | |
Salesforce.com, Inc. (a)(d) | | | 171 | | | | 13,406 | |
Schlumberger Ltd. | | | 10,344 | | | | 721,494 | |
Scripps Networks Interactive, Inc., Class A (b) | | | 218 | | | | 12,036 | |
Sealed Air Corp. | | | 469 | | | | 20,917 | |
Sempra Energy | | | 3,591 | | | | 337,590 | |
Simon Property Group, Inc. | | | 304 | | | | 59,110 | |
Skyworks Solutions, Inc. (b) | | | 583 | | | | 44,792 | |
SL Green Realty Corp. | | | 100 | | | | 11,298 | |
Southern Co. | | | 630 | | | | 29,478 | |
Southwest Airlines Co. | | | 3,060 | | | | 131,764 | |
Square, Inc., Class A (a)(b) | | | 5,480 | | | | 71,733 | |
St. Joe Co. (a) | | | 31,003 | | | | 573,866 | |
Starbucks Corp. | | | 282 | | | | 16,928 | |
Steel Dynamics, Inc. | | | 383 | | | | 6,844 | |
Stryker Corp. | | | 422 | | | | 39,221 | |
SunTrust Banks, Inc. (d) | | | 2,896 | | | | 124,065 | |
Surgery Partners, Inc. (a) | | | 4,451 | | | | 91,201 | |
Synchrony Financial (a) | | | 6,899 | | | | 209,799 | |
Tahoe Resources, Inc. | | | 22,122 | | | | 191,371 | |
Target Corp. | | | 3,175 | | | | 230,537 | |
Tenet Healthcare Corp. (a)(b) | | | 8,038 | | | | 243,551 | |
TerraForm Power, Inc., Class A (b) | | | 5,305 | | | | 66,737 | |
TESARO, Inc. (a) | | | 1,388 | | | | 72,620 | |
Texas Instruments, Inc. | | | 1,401 | | | | 76,789 | |
Textron, Inc. | | | 1,894 | | | | 79,567 | |
Thermo Fisher Scientific, Inc. | | | 1,217 | | | | 172,631 | |
Tiffany & Co. | | | 2,084 | | | | 158,988 | |
Time Warner Cable, Inc. | | | 1,000 | | | | 185,590 | |
Travelers Cos., Inc. | | | 1,147 | | | | 129,450 | |
Twitter, Inc. (a)(b) | | | 9,660 | | | | 223,532 | |
Tyco International PLC | | | 7,458 | | | | 237,836 | |
U.S. Bancorp | | | 7,933 | | | | 338,501 | |
Ultragenyx Pharmaceutical, Inc. (a) | | | 548 | | | | 61,475 | |
United Continental Holdings, Inc. (a)(d) | | | 8,348 | | | | 478,340 | |
United Parcel Service, Inc., Class B | | | 4,147 | | | | 399,066 | |
United Rentals, Inc. (a)(b) | | | 4,961 | | | | 359,871 | |
United Technologies Corp. | | | 3,426 | | | | 329,136 | |
UnitedHealth Group, Inc. | | | 778 | | | | 91,524 | |
Univar, Inc. (a) | | | 9,512 | | | | 161,799 | |
Unum Group | | | 6,721 | | | | 223,742 | |
Urban Outfitters, Inc. (a)(b) | | | 7,936 | | | | 180,544 | |
Valero Energy Corp. | | | 1,631 | | | | 115,328 | |
Veeva Systems, Inc., Class A (a) | | | 12,887 | | | | 371,790 | |
Ventas, Inc. (b) | | | 303 | | | | 17,098 | |
VeriSign, Inc. (a)(b) | | | 769 | | | | 67,180 | |
Verizon Communications, Inc. | | | 20,935 | | | | 968,523 | |
Vertex Pharmaceuticals, Inc. (a) | | | 526 | | | | 66,187 | |
Visa, Inc., Class A | | | 8,519 | | | | 660,648 | |
VMware, Inc., Class A (a) | | | 1,594 | | | | 90,173 | |
Vornado Realty Trust (b) | | | 165 | | | | 16,493 | |
WABCO Holdings, Inc. (a) | | | 2,325 | | | | 237,755 | |
| | | | | | | | | | | | |
| Common Stocks | | | | | Shares | | | Value | |
United States (continued) | | | | | | | | | | | | |
Walgreens Boots Alliance, Inc. | | | | | | | 4,595 | | | $ | 391,287 | |
Wal-Mart Stores, Inc. | | | | | | | 10,461 | | | | 641,259 | |
WEC Energy Group, Inc. | | | | | | | 236 | | | | 12,109 | |
Wells Fargo & Co. (d) | | | | | | | 22,984 | | | | 1,249,410 | |
Welltower, Inc. | | | | | | | 358 | | | | 24,355 | |
Western Digital Corp. | | | | | | | 1,106 | | | | 66,415 | |
WestRock Co. | | | | | | | 5,196 | | | | 237,042 | |
Weyerhaeuser Co. | | | | | | | 487 | | | | 14,600 | |
Whirlpool Corp. | | | | | | | 1,784 | | | | 262,016 | |
Whiting Petroleum Corp. (a)(b) | | | | | | | 22,405 | | | | 211,503 | |
Whole Foods Market, Inc. (b) | | | | | | | 3,755 | | | | 125,793 | |
Williams Cos., Inc. | | | | | | | 720 | | | | 18,504 | |
Williams-Sonoma, Inc. | | | | | | | 788 | | | | 46,027 | |
Wyndham Worldwide Corp. (b) | | | | | | | 575 | | | | 41,774 | |
Xcel Energy, Inc. | | | | | | | 398 | | | | 14,292 | |
Yahoo!, Inc. (a) | | | | | | | 3,526 | | | | 117,275 | |
Zoetis, Inc. | | | | | | | 3,642 | | | | 174,525 | |
| | | | | | | | | | | | |
| | | | | | | | | | | | 63,730,040 | |
Total Common Stocks — 53.1% | | | | | | | | | | | 122,041,496 | |
| | | | | | | | | | | | |
| Corporate Bonds | | | | | Par
(000) | | | | |
Argentina — 0.0% | | | | | | | | | | | | |
Empresa Distribuidora Y Comercializadora Norte, 9.75%, 10/25/22 (c) | | | USD | | | | 25 | | | | 24,000 | |
Australia — 0.2% | | | | | | | | | | | | |
TFS Corp. Ltd., 11.00%, 7/15/18 (c) | | | | | | | 383 | | | | 398,320 | |
Canada — 0.1% | | | | | | | | | | | | |
First Quantum Minerals Ltd.: | | | | | | | | | | | | |
6.75%, 2/15/20 | | | | | | | 57 | | | | 36,765 | |
7.00%, 2/15/21 | | | | | | | 238 | | | | 149,345 | |
| | | | | | | | | | | | |
| | | | | | | | | | | | 186,110 | |
Chile — 0.1% | | | | | | | | | | | | |
Banco Santander Chile, 2.33%, 6/07/18 (c)(f) | | | | | | | 265 | | | | 265,000 | |
Inversiones Alsacia SA, 8.00%, 12/31/18 (c) | | | | | | | 167 | | | | 48,368 | |
| | | | | | | | | | | | |
| | | | | | | | | | | | 313,368 | |
China — 0.1% | | | | | | | | | | | | |
Alibaba Group Holding Ltd., 3.13%, 11/28/21 | | | | | | | 200 | | | | 193,975 | |
Celestial Nutrifoods Ltd.,
0.00%, 6/12/11 (a)(g)(h) | | | SGD | | | | 400 | | | | 2,821 | |
China Milk Products Group Ltd., 0.00%, 1/05/12 (a)(g)(h) | | | USD | | | | 300 | | | | 3,000 | |
SINA Corp., 1.00%, 12/01/18 (g) | | | | | | | 136 | | | | 131,410 | |
| | | | | | | | | | | | |
| | | | | | | | | | | | 331,206 | |
France — 0.2% | | | | | | | | | | | | |
BNP Paribas SA, 2.40%, 12/12/18 | | | | | | | 362 | | | | 364,846 | |
Germany — 0.1% | | | | | | | | | | | | |
Deutsche Bank AG, 1.88%, 2/13/18 | | | | | | | 145 | | | | 143,767 | |
India — 0.2% | | | | | | | | | | | | |
REI Agro Ltd.: | | | | | | | | | | | | |
5.50%, 11/13/14 (a)(c)(g)(h) | | | | | | | 220 | | | | 1,100 | |
5.50%, 11/13/14 (a)(g)(h) | | | | | | | 152 | | | | 760 | |
Suzlon Energy Ltd., 3.25%, 7/16/19 (c)(g)(i) | | | | | | | 412 | | | | 506,760 | |
| | | | | | | | | | | | |
| | | | | | | | | | | | 508,620 | |
Italy — 0.2% | | | | | | | | | | | | |
Intesa Sanpaolo SpA, 3.88%, 1/15/19 | | | | | | | 300 | | | | 308,888 | |
See Notes to Financial Statements.
| | | | | | |
| | | BLACKROCK SERIES FUND, INC. | | DECEMBER 31, 2015 | | 55 |
| | | | |
| Consolidated Schedule of Investments (continued) | | | BlackRock Global Allocation Portfolio | |
| | | | |
| | | | | | | | | | | | |
| Corporate Bonds | | | | | Par
(000) | | | Value | |
Telecom Italia SpA, 5.30%, 5/30/24 (c) | | | USD | | | | 200 | | | $ | 197,500 | |
| | | | | | | | | | | | |
| | | | | | | | | | | | 506,388 | |
Japan — 0.1% | | | | | | | | | | | | |
Sumitomo Mitsui Banking Corp., 2.45%, 1/10/19 | | | | | | | 250 | | | | 250,892 | |
Luxembourg — 0.2% | | | | | | | | | | | | |
Intelsat Jackson Holdings SA, 7.50%, 4/01/21 | | | | | | | 172 | | | | 149,640 | |
Telecom Italia Finance SA, 6.13%, 11/15/16 (c)(g) | | | EUR | | | | 200 | | | | 320,158 | |
| | | | | | | | | | | | |
| | | | | | | | | | | | 469,798 | |
Mexico — 0.1% | | | | | | | | | | | | |
Trust F/1401, 5.25%, 12/15/24 (c) | | | USD | | | | 200 | | | | 198,500 | |
Netherlands — 0.1% | | | | | | | | | | | | |
Bio City Development Co. BV,
8.00%, 7/06/18 (a)(c)(g)(h) | | | | | | | 800 | | | | 338,800 | |
Singapore — 0.3% | | | | | | | | | | | | |
CapitaLand Ltd.: | | | | | | | | | | | | |
2.10%, 11/15/16 (g) | | | SGD | | | | 250 | | | | 175,215 | |
1.95%, 10/17/23 (c)(g) | | | | | | | 250 | | | | 180,284 | |
Global Logistic Properties Ltd., 3.88%, 6/04/25 | | | USD | | | | 382 | | | | 373,121 | |
| | | | | | | | | | | | |
| | | | | | | | | | | | 728,620 | |
Spain — 0.2% | | | | | | | | | | | | |
Telefonica Participaciones SAU, 4.90%, 9/25/17 (g) | | | EUR | | | | 300 | | | | 310,540 | |
Telefonica SA, 6.00%, 7/24/17 (g) | | | | | | | 100 | | | | 135,486 | |
| | | | | | | | | | | | |
| | | | | | | | | | | | 446,026 | |
Switzerland — 0.1% | | | | | | | | | | | | |
UBS Group Funding Jersey Ltd., 4.13%, 9/24/25 (c) | | | USD | | | | 200 | | | | 199,793 | |
United Arab Emirates — 0.2% | | | | | | | | | | | | |
Dana Gas Sukuk Ltd., 7.00%, 10/31/17 (c)(g) | | | | | | | 463 | | | | 398,533 | |
United Kingdom — 0.2% | | | | | | | | | | | | |
Delta Topco Ltd. (Acquired 5/02/12-1/02/15, cost $346,165), 10.00%, 11/24/60 (e) | | | | | | | 341 | | | | 341,809 | |
United States — 3.7% | | | | | | | | | | | | |
AbbVie, Inc., 2.50%, 5/14/20 | | | | | | | 250 | | | | 247,487 | |
Actavis Funding SCS, 3.00%, 3/12/20 | | | | | | | 203 | | | | 202,839 | |
AliphCom (Acquired 11/11/15, cost $48,000), 12.00%, 4/28/20 (e)(f)(g) | | | | | | | 48 | | | | 68,112 | |
AliphCom (Acquired 4/27/15-7/21/15, cost $945,000), 12.00%, 4/28/20 (e)(f)(g) | | | | | | | 945 | | | | 1,343,790 | |
Ally Financial, Inc.: | | | | | | | | | | | | |
2.75%, 1/30/17 | | | | | | | 184 | | | | 183,540 | |
3.50%, 1/27/19 | | | | | | | 126 | | | | 124,267 | |
American Tower Corp., 3.40%, 2/15/19 | | | | | | | 60 | | | | 61,547 | |
AT&T Inc.: | | | | | | | | | | | | |
2.38%, 11/27/18 | | | | | | | 302 | | | | 304,058 | |
3.00%, 6/30/22 | | | | | | | 495 | | | | 483,129 | |
Bank of America Corp.: | | | | | | | | | | | | |
2.00%, 1/11/18 | | | | | | | 171 | | | | 170,782 | |
1.33%, 3/22/18 (f) | | | | | | | 99 | | | | 99,318 | |
6.88%, 4/25/18 | | | | | | | 117 | | | | 129,081 | |
Series L, 2.60%, 1/15/19 | | | | | | | 116 | | | | 116,378 | |
BioMarin Pharmaceutical, Inc.: | | | | | | | | | | | | |
0.75%, 10/15/18 (g) | | | | | | | 51 | | | | 65,471 | |
1.50%, 10/15/20 (g) | | | | | | | 51 | | | | 68,149 | |
| | | | | | | | | | | | |
| Corporate Bonds | | | | | Par
(000) | | | Value | |
Cablevision Systems Corp., 5.88%, 9/15/22 | | | USD | | | | 71 | | | $ | 60,350 | |
Capital One Bank USA NA, 2.15%, 11/21/18 | | | | | | | 250 | | | | 247,846 | |
Chesapeake Energy Corp., 8.00%, 12/15/22 (c) | | | | | | | 72 | | | | 35,280 | |
Citigroup, Inc., 1.80%, 2/05/18 | | | | | | | 347 | | | | 345,672 | |
Cobalt International Energy, Inc.: | | | | | | | | | | | | |
2.63%, 12/01/19 (g) | | | | | | | 280 | | | | 156,975 | |
3.13%, 5/15/24 (g) | | | | | | | 349 | | | | 182,353 | |
eBay, Inc., 2.20%, 8/01/19 | | | | | | | 82 | | | | 81,068 | |
Edgewell Personal Care Co.: | | | | | | | | | | | | |
4.70%, 5/19/21 | | | | | | | 70 | | | | 70,631 | |
4.70%, 5/24/22 | | | | | | | 44 | | | | 43,679 | |
Ford Motor Credit Co. LLC, 5.00%, 5/15/18 | | | | | | | 200 | | | | 210,079 | |
Forest Laboratories LLC: | | | | | | | | | | | | |
4.38%, 2/01/19 (c) | | | | | | | 149 | | | | 156,089 | |
5.00%, 12/15/21 (c) | | | | | | | 110 | | | | 119,526 | |
General Electric Capital Corp., 5.55%, 5/04/20 | | | | | | | 96 | | | | 108,579 | |
General Motors Financial Co., Inc., 3.50%, 7/10/19 | | | | | | | 184 | | | | 184,616 | |
Gilead Sciences, Inc., Series D, 1.63%, 5/01/16 (g) | | | | | | | 89 | | | | 397,663 | |
Hewlett Packard Enterprise Co.,
2.85%, 10/05/18 (c) | | | | | | | 452 | | | | 451,748 | |
HSBC USA, Inc., 1.63%, 1/16/18 | | | | | | | 162 | | | | 161,198 | |
Hughes Satellite Systems Corp., 7.63%, 6/15/21 | | | | | | | 58 | | | | 61,480 | |
Hyundai Capital America, 2.00%, 3/19/18 (c) | | | | | | | 85 | | | | 83,990 | |
JPMorgan Chase & Co., 4.35%, 8/15/21 | | | | | | | 102 | | | | 108,552 | |
Medtronic, Inc., 3.15%, 3/15/22 | | | | | | | 275 | | | | 278,002 | |
Morgan Stanley, 7.30%, 5/13/19 | | | | | | | 100 | | | | 114,871 | |
Mylan, Inc., 2.55%, 3/28/19 | | | | | | | 165 | | | | 162,841 | |
QUALCOMM, Inc., 3.00%, 5/20/22 | | | | | | | 405 | | | | 400,941 | |
Sabine Pass Liquefaction LLC, 5.63%, 4/15/23 | | | | | | | 112 | | | | 98,280 | |
Take-Two Interactive Software, Inc., 1.75%, 12/01/16 (g) | | | | | | | 108 | | | | 197,235 | |
Twitter, Inc., 1.00%, 9/15/21 (g) | | | | | | | 108 | | | | 90,247 | |
Volkswagen Group of America Finance LLC, 2.45%, 11/20/19 | | | | | | | 200 | | | | 191,704 | |
Xerox Corp., 6.35%, 5/15/18 | | | | | | | 77 | | | | 82,321 | |
| | | | | | | | | | | | |
| | | | | | | | | | | | 8,551,764 | |
Total Corporate Bonds — 6.4% | | | | | | | | | | | 14,701,160 | |
| | | | | | | | | | | | |
| Floating Rate Loan Interests (f) | | | | | | | | | |
Canada — 0.1% | | | | | | | | | | | | |
Novelis, Inc., Initial Term Loan, 4.00%, 6/02/22 | | | | | | | 109 | | | | 104,134 | |
Cyprus — 0.0% | | | | | | | | | | | | |
Drillships Ocean Ventures, Inc., Term Loan, 5.50%, 7/25/21 | | | | | | | 98 | | | | 45,730 | |
Ireland — 0.1% | | | | | | | | | | | | |
Grifols Worldwide Operations Ltd., U.S. Tranche B Term Loan, 3.42%, 2/27/21 | | | | | | | 244 | | | | 241,070 | |
Luxembourg — 0.1% | | | | | | | | | | | | |
Endo Luxembourg Finance Co. I S.à r.l., 2015 Incremental Term B Loan, 3.75%, 9/26/22 | | | | | | | 190 | | | | 187,230 | |
See Notes to Financial Statements.
| | | | | | |
| 56 | | BLACKROCK SERIES FUND, INC. | | DECEMBER 31, 2015 | | |
| | | | |
| Consolidated Schedule of Investments (continued) | | | BlackRock Global Allocation Portfolio | |
| | | | |
| | | | | | | | | | | | |
| Floating Rate Loan Interests | | | | | Par
(000) | | | Value | |
Mallinckrodt International Finance SA, Initial Term B Loan, 3.25%, 3/19/21 | | | USD | | | | 68 | | | $ | 65,779 | |
| | | | | | | | | | | | |
| | | | | | | | | | | | 253,009 | |
Netherlands — 0.1% | | | | | | | | | | | | |
Promontoria Blue Holding 2 BV, Mezzanine Loan, 7.00%, 4/17/20 | | | EUR | | | | 307 | | | | 332,042 | |
Norway — 0.0% | | | | | | | | | | | | |
Drillships Financing Holding, Inc. (Ocean Rig), Tranche B-1 Term Loan, 6.00%, 3/31/21 | | | USD | | | | 147 | | | | 58,204 | |
United States — 0.7% | | | | | | | | | | | | |
Calpine Corp., Term Loan, 3.50%, 5/27/22 | | | | | | | 194 | | | | 184,615 | |
Fieldwood Energy LLC, Closing Date Loan (Second Lien), 8.38%, 9/30/20 | | | | | | | 202 | | | | 30,250 | |
Hilton Worldwide Finance LLC, Initial Term Loan, 3.50%, 10/26/20 | | | | | | | 533 | | | | 531,525 | |
Seadrill Operating LP (Seadrill Partners Finco LLC), Initial Term Loan, 4.00%, 2/21/21 | | | | | | | 196 | | | | 80,846 | |
Sheridan Investment Partners II LP, Senior Secured Term Loan, 4.25%, 12/16/20 | | | | | | | 292 | | | | 165,807 | |
Sheridan Production Partners II-A LP, Senior Secured Term Loan, 4.25%, 12/16/20 | | | | | | | 41 | | | | 23,062 | |
Sheridan Production Partners II-M LP, Senior Secured Term Loan, 4.25%, 12/16/20 | | | | | | | 15 | | | | 8,602 | |
Univar USA, Inc., Initial Dollar Term Loan, 4.25%, 7/01/22 | | | | | | | 185 | | | | 178,258 | |
Univision Communications, Inc., Replacement First-Lien Term Loan, 4.00%, 3/01/20 | | | | | | | 304 | | | | 297,295 | |
| | | | | | | | | | | | |
| | | | | | | | | | | | 1,500,260 | |
Total Floating Rate Loan Interests — 1.1% | | | | 2,534,449 | |
| | | | | | | | | | | | |
| Foreign Agency Obligations | | | | | | | | | |
Argentina — 0.2% | | | | | | | | | | | | |
YPF SA: | | | | | | | | | | | | |
8.88%, 12/19/18 (c) | | | | | | | 156 | | | | 157,755 | |
8.50%, 7/28/25 (c) | | | | | | | 445 | | | | 423,863 | |
| | | | | | | | | | | | |
| | | | | | | | | | | | 581,618 | |
Brazil — 0.0% | | | | | | | | | | | | |
Petrobras Global Finance BV, 2.43%, 1/15/19 (f) | | | | | | | 46 | | | | 34,960 | |
Mexico — 0.2% | | | | | | | | | | | | |
Petroleos Mexicanos: | | | | | | | | | | | | |
5.75%, 3/01/18 | | | | | | | 165 | | | | 171,765 | |
3.50%, 7/23/20 (c) | | | | | | | 228 | | | | 215,802 | |
| | | | | | | | | | | | |
| | | | | | | | | | | | 387,567 | |
South Korea — 0.1% | | | | | | | | | | | | |
Export-Import Bank of Korea, 2.63%, 12/30/20 | | | | | | | 252 | | | | 251,686 | |
Total Foreign Agency Obligations — 0.5% | | | | 1,255,831 | |
| | | | | | | | | | | | |
| Foreign Government Obligations | | | | | | | | | |
Argentina — 0.2% | | | | | | | | | | | | |
Republic of Argentina, 8.75%, 5/07/24 | | | | | | | 482 | | | | 514,381 | |
| | | | | | | | | | | | |
| Foreign Government Obligations | | | | | Par (000) | | | Value | |
Brazil — 0.4% | | | | | | | | | | | | |
Federative Republic of Brazil: | | | | | | | | | | | | |
6.00%, 1/17/17 | | | USD | | | | 200 | | | $ | 205,500 | |
Series F, 10.00%, 1/01/21 | | | BRL | | | | 4 | | | | 709,651 | |
| | | | | | | | | | | | |
| | | | | | | | | | | | 915,151 | |
Colombia — 0.1% | | | | | | | | | | | | |
Republic of Colombia, 7.38%, 1/27/17 | | | USD | | | | 201 | | | | 211,050 | |
Hungary — 0.5% | | | | | | | | | | | | |
Republic of Hungary: | | | | | | | | | | | | |
6.38%, 3/29/21 | | | | | | | 512 | | | | 583,680 | |
5.50%, 6/24/25 | | | HUF | | | | 126,100 | | | | 507,631 | |
| | | | | | | | | | | | |
| | | | | | | | | | | | 1,091,311 | |
Indonesia — 0.4% | | | | | | | | | | | | |
Republic of Indonesia: | | | | | | | | | | | | |
6.88%, 1/17/18 (c) | | | USD | | | | 200 | | | | 216,908 | |
8.25%, 7/15/21 | | | IDR | | | | 7,950,000 | | | | 562,515 | |
8.38%, 3/15/24 | | | | | | | 884,000 | | | | 62,349 | |
| | | | | | | | | | | | |
| | | | | | | | | | | | 841,772 | |
Italy — 0.6% | | | | | | | | | | | | |
Republic of Italy: | | | | | | | | | | | | |
2.50%, 12/01/24 | | | EUR | | | | 302 | | | | 356,445 | |
1.50%, 6/01/25 | | | | | | | 1,060 | | | | 1,152,733 | |
| | | | | | | | | | | | |
| | | | | | | | | | | | 1,509,178 | |
Japan — 0.2% | | | | | | | | | | | | |
Government of Japan (2 Year Issue),
0.10%, 3/15/17 | | | JPY | | | | 51,850 | | | | 432,193 | |
Mexico — 0.6% | | | | | | | | | | | | |
United Mexican States: | | | | | | | | | | | | |
5.95%, 3/19/19 | | | USD | | | | 74 | | | | 82,140 | |
6.50%, 6/10/21 | | | MXN | | | | 219 | | | | 1,316,672 | |
| | | | | | | | | | | | |
| | | | | | | | | | | | 1,398,812 | |
Poland — 0.6% | | | | | | | | | | | | |
Republic of Poland: | | | | | | | | | | | | |
5.25%, 10/25/20 | | | PLN | | | | 2,251 | | | | 652,177 | |
5.75%, 10/25/21 | | | | | | | 1,107 | | | | 332,355 | |
3.25%, 7/25/25 | | | | | | | 1,543 | | | | 404,571 | |
| | | | | | | | | | | | |
| | | | | | | | | | | | 1,389,103 | |
United Kingdom — 1.1% | | | | | | | | | | | | |
United Kingdom Gilt, 2.00%, 9/07/25 | | | GBP | | | | 1,724 | | | | 2,555,452 | |
Total Foreign Government Obligations — 4.7% | | | | 10,858,403 | |
| | | | | | | | | | | | |
| Investment Companies | | | | | Shares | | | | |
ETFS Gold Trust (a)(j) | | | | | | | 5,694 | | | | 589,329 | |
ETFS Physical Palladium Shares (a)(j) | | | | | | | 1,649 | | | | 89,326 | |
ETFS Physical Platinum Shares (a)(j) | | | | | | | 1,392 | | | | 119,476 | |
iShares Gold Trust (a)(j)(k) | | | | | | | 55,980 | | | | 572,676 | |
SPDR Gold Shares (a)(j) | | | | | | | 6,994 | | | | 709,611 | |
Total Investment Companies — 0.9% | | | | 2,080,418 | |
| | | | | | | | | | | | |
| | |
See Notes to Financial Statements.
| | | | | | |
| | | BLACKROCK SERIES FUND, INC. | | DECEMBER 31, 2015 | | 57 |
| | | | |
| Consolidated Schedule of Investments (continued) | | | BlackRock Global Allocation Portfolio | |
| | | | |
| | | | | | | | | | | | |
| Non-Agency Mortgage-Backed Securities | | | | | Par
(000) | | | Value | |
Commercial Mortgage-Backed Securities — 0.1% | | | | | | | | | | | | |
Logistics UK PLC, Series 2015-1A, Class F,
4.20%, 8/20/25 (c)(f) | | | GBP | | | | 140 | | | $ | 197,226 | |
| | | | | | | | | | | | |
| Preferred Securities | | | | | | | | | |
Capital Trusts | | | | | | | | | | | | |
Germany — 0.0% | | | | | | | | | | | | |
Deutsche Bank Capital Funding Trust VII,
5.63% (c)(f)(l) | | | USD | | | | 25 | | | | 25,033 | |
Netherlands — 0.1% | | | | | | | | | | | | |
ING Groep NV, 6.00% (f)(l) | | | | | | | 200 | | | | 200,000 | |
Switzerland — 0.1% | | | | | | | | | | | | |
Credit Suisse Group Guernsey I Ltd.,
7.88%, 2/24/41 (f) | | | | | | | 174 | | | | 179,220 | |
United Kingdom — 0.5% | | | | | | | | | | | | |
HSBC Holdings PLC, 6.38% (f)(l) | | | | | | | 435 | | | | 429,563 | |
Lloyds Bank PLC, 13.00% (f)(l) | | | GBP | | | | 255 | | | | 649,620 | |
Standard Chartered PLC, 6.50% (c)(f)(l) | | | USD | | | | 200 | | | | 193,236 | |
| | | | | | | | | | | | |
| | | | | | | | | | | | 1,272,419 | |
United States — 1.1% | | | | | | | | | | | | |
American Express Co., Series C, 4.90% (f)(l) | | | | | | | 129 | | | | 122,550 | |
Citigroup, Inc.: | | | | | | | | | | | | |
5.95% (f)(l) | | | | | | | 94 | | | | 91,979 | |
Series O, 5.88% (f)(l) | | | | | | | 239 | | | | 237,207 | |
General Electric Capital Corp., 6.38%, 11/15/67 (f) | | | | | | | 136 | | | | 142,025 | |
General Electric Co., 4.10% (f)(l) | | | | | | | 236 | | | | 235,410 | |
Goldman Sachs Group, Inc.: | | | | | | | | | | | | |
Series L, 5.70% (f)(l) | | | | | | | 205 | | | | 203,719 | |
Series M, 5.38% (f)(l) | | | | | | | 208 | | | | 206,700 | |
Intel Corp., 3.25%, 8/01/39 (g) | | | | | | | 71 | | | | 118,082 | |
JPMorgan Chase & Co.: | | | | | | | | | | | | |
Series Q, 5.15% (f)(l) | | | | | | | 236 | | | | 223,020 | |
Series X, 6.10% (f)(l) | | | | | | | 455 | | | | 457,321 | |
Morgan Stanley, Series H, 5.45% (f)(l) | | | | | | | 151 | | | | 147,414 | |
NBCUniversal Enterprise, Inc., 5.25% (c)(l) | | | | | | | 100 | | | | 106,000 | |
USB Capital IX, 3.50% (f)(l) | | | | | | | 175 | | | | 134,750 | |
| | | | | | | | | | | | |
| | | | | | | | | | | | 2,426,177 | |
Total Capital Trusts – 1.8% | | | | | | | | | | | 4,102,849 | |
| | | | | | | | | | | | |
| Preferred Stocks | | | | | Shares | | | | |
Brazil — 0.0% | | | | | | | | | | | | |
Cia Brasileira de Distribuicao,
Preference Shares, 0.00% | | | | | | | 3,478 | | | | 36,800 | |
Germany — 0.2% | | | | | | | | | | | | |
Henkel AG & Co. KGaA, Preference Shares, 0.00% | | | | | | | 1,937 | | | | 216,174 | |
Volkswagen AG, Preference Shares, 0.00% | | | | | | | 2,493 | | | | 359,940 | |
| | | | | | | | | | | | |
| | | | | | | | | | | | 576,114 | |
Ireland — 0.3% | | | | | | | | | | | | |
Allergan PLC, Series A, 5.50% | | | | | | | 641 | | | | 660,345 | |
Israel — 0.3% | | | | | | | | | | | | |
Teva Pharmaceutical Industries Ltd., 7.00% | | | | | | | 589 | | | | 599,224 | |
South Korea — 0.1% | | | | | | | | | | | | |
Samsung Electronics Co. Ltd., Preference Shares, 0.00% | | | | | | | 167 | | | | 154,373 | |
| | | | | | | | | | | | |
| Preferred Stocks | | | | | Shares | | | Value | |
United Kingdom — 0.1% | | | | | | | | | | | | |
HSBC Holdings PLC, Series 2, 8.00% | | | | | | | 4,828 | | | $ | 125,866 | |
Royal Bank of Scotland Group PLC, Series T, 7.25% | | | | | | | 4,665 | | | | 120,590 | |
| | | | | | | | | | | | |
| | | | | | | | | | | | 246,456 | |
United States — 1.8% | | | | | | | | | | | | |
American Tower Corp., Series A, 5.25% (g) | | | | | | | 1,070 | | | | 109,418 | |
Anthem, Inc., 5.25% (g) | | | | | | | 5,931 | | | | 273,123 | |
Cliffs Natural Resources, Inc., 7.00% (g) | | | | | | | 3,934 | | | | 5,704 | |
Crown Castle International Corp., Series A, 4.50% (g) | | | | | | | 2,769 | | | | 295,702 | |
Dominion Resources, Inc., 6.38% (g) | | | | | | | 2,270 | | | | 109,142 | |
Domo, Inc., Series D-2 (Acquired 4/01/15-7/06/15,
cost $380,451), 0.00% (a)(e) | | | | | | | 45,122 | | | | 380,699 | |
Dropbox, Inc., Series C (Acquired 1/28/14,
cost $695,990), 0.00% (a)(e) | | | | | | | 36,437 | | | | 444,531 | |
Forestar Group, Inc., 6.00% (g) | | | | | | | 4,750 | | | | 73,016 | |
Grand Rounds, Inc., Series C (Acquired 3/31/15,
cost $127,944), 0.00% (a)(e) | | | | | | | 46,081 | | | | 131,718 | |
Lookout, Inc., Series F (Acquired 9/19/14-10/22/14,
cost $243,061), 0.00% (a)(e) | | | | | | | 21,278 | | | | 243,061 | |
Palantir Technologies, Inc., Series I (Acquired 3/27/14, cost $272,246), 0.00% (a)(e) | | | | | | | 44,412 | | | | 505,409 | |
U.S. Bancorp: | | | | | | | | | | | | |
Series F, 6.50% (b)(f) | | | | | | | 4,518 | | | | 129,667 | |
Series G, 6.00% (f) | | | | | | | 3,150 | | | | 84,483 | |
Uber Technologies, Inc., Series D (Acquired 6/06/14,
cost $418,728), 0.00% (a)(e) | | | | | | | 26,992 | | | | 1,316,459 | |
Wells Fargo & Co., Series L, 7.50% (g) | | | | | | | 84 | | | | 97,524 | |
| | | | | | | | | | | | |
| | | | | | | | | | | | 4,199,656 | |
Total Preferred Stocks — 2.8% | | | | | | | | | | | 6,472,968 | |
| | | | | | | | | | | | |
| Trust Preferreds | | | | | | | | | |
United States — 0.5% | | | | | | | | | | | | |
Citigroup Capital XIII, 7.88%, 10/30/40 (f) | | | | | | | 7,916 | | | | 205,737 | |
GMAC Capital Trust I, Series 2, 8.13%, 2/15/40 (f) | | | | | | | 10,664 | | | | 270,439 | |
RBS Capital Funding Trust V, Series E, 5.90% (l) | | | | | | | 6,896 | | | | 169,228 | |
RBS Capital Funding Trust VII, Series G, 6.08% (l) | | | | | | | 8,172 | | | | 203,728 | |
Welltower, Inc., Series I, 6.50% (g)(l) | | | | | | | 4,039 | | | | 246,015 | |
Total Trust Preferreds — 0.5% | | | | | | | | | | | 1,095,147 | |
Total Preferred Securities — 5.1% | | | | | | | | | | | 11,670,964 | |
| | | | | | | | | | | | |
| Rights | | | | | | | | | |
Italy — 0.0% | | | | | | | | | | | | |
Unione di Banche Italiane SCpA (Expires 12/01/16, Strike Price EUR 2.50) | | | | | | | 2,000 | | | | – | |
| | | | | | | | | | | | |
| U.S. Government Sponsored Agency Securities | | | | | Par
(000) | | | | |
Mortgage-Backed Securities — 0.4% | | | | | | | | | | | | |
Fannie Mae Mortgage-Backed Securities, 3.00%, 1/01/46 (m) | | | USD | | | | 870 | | | | 870,008 | |
| | | | | | | | | | | | |
| | | | | | | | | | |
See Notes to Financial Statements.
| | | | | | |
| 58 | | BLACKROCK SERIES FUND, INC. | | DECEMBER 31, 2015 | | |
| | | | |
| Consolidated Schedule of Investments (continued) | | | BlackRock Global Allocation Portfolio | |
| | | | |
| | | | | | | | | | | | |
| U.S. Treasury Obligations | | | | | Par (000) | | | Value | |
U.S. Treasury Inflation Indexed Notes: | | | | | | | | | | | | |
0.13%, 4/15/20 | | | USD | | | | 254 | | | | $ 250,333 | |
0.25%, 1/15/25 | | | | | | | 104 | | | | 99,475 | |
0.38%, 7/15/25 | | | | | | | 1,477 | | | | 1,429,521 | |
U.S. Treasury Notes: | | | | | | | | | | | | |
0.38%, 3/15/16 (j) | | | | | | | 3,950 | | | | 3,950,924 | |
1.75%, 3/31/22-9/30/22 | | | | | | | 2,324 | | | | 2,282,175 | |
1.88%, 8/31/22-10/31/22 | | | | | | | 2,538 | | | | 2,507,524 | |
2.00%, 2/15/25-8/15/25 | | | | | | | 6,931 | | | | 6,759,506 | |
2.13%, 5/15/25 (n) | | | | | | | 1,918 | | | | 1,892,680 | |
Total U.S. Treasury Obligations — 8.4% | | | | | | | | | | | 19,172,138 | |
| | | | | | | | | | | | |
| Warrants | | | | | Shares | | | | |
Australia — 0.0% | | | | | | | | | | | | |
TFS Corp. Ltd. (Issued/exercisable 8/01/11, 1 share for 1 warrant, Expires 7/15/18, Strike Price AUD 1.28) | | | | | | | 124,320 | | | | 41,036 | |
Total Long-Term Investments (Cost — $190,973,139) — 80.7% | | | | | | | | | | | 185,423,129 | |
| | | | | | | | | | | | |
| Short-Term Securities | | | | | | | | | |
| Foreign Agency Obligations (o) | | | | | Par (000) | | | | |
Japan Treasury Discount Bill: | | | | | | | | | | | | |
0.03%, 1/13/16 | | | JPY | | | | 100,000 | | | | 831,969 | |
0.01%, 1/25/16 | | | | | | | 100,000 | | | | 831,978 | |
0.05%, 2/10/16 | | | | | | | 120,000 | | | | 998,396 | |
0.04%, 2/22/16 | | | | | | | 110,000 | | | | 915,202 | |
0.05%, 2/29/16 | | | | | | | 250,000 | | | | 2,080,010 | |
0.06%, 3/07/16 | | | | | | | 250,000 | | | | 2,080,018 | |
0.10%, 3/14/16 | | | | | | | 130,000 | | | | 1,081,614 | |
0.02%, 3/22/16 | | | | | | | 160,000 | | | | 1,331,222 | |
Mexico Cetes: | | | | | | | | | | | | |
2.03%, 1/07/16 | | | MXN | | | | 623 | | | | 361,096 | |
3.13%, 2/18/16 | | | | | | | 375 | | | | 216,450 | |
3.25%, 3/31/16 | | | | | | | 420 | | | | 241,694 | |
3.27%, 4/14/16 | | | | | | | 770 | | | | 442,485 | |
Total Foreign Agency Obligations — 5.0% | | | | | | | | | | | 11,412,134 | |
| | | | | | | | | | | | |
| Money Market Funds | | | | | Shares | | | | |
BlackRock Liquidity Funds, TempFund, Institutional Class, 0.23% (k)(p) | | | | | | | 661,486 | | | | 661,486 | |
| | | | | | Beneficial
Interest
(000) | | | | |
BlackRock Liquidity Series, LLC, Money Market Series, 0.39% (k)(p)(q) | | | USD | | | | 4,986 | | | | 4,986,152 | |
Total Money Market Funds — 2.5% | | | | | | | | | | | 5,647,638 | |
| | | | | | | | | | | | |
| Time Deposits | | | | | Par
(000) | | | Value | |
United Kingdom — 0.0% | | | | | | | | | | | | |
Brown Brothers Harriman & Co.,
0.08%, 1/01/16 | | | GBP | | | | 13 | | | | $ 13,334 | |
United States — 0.0% | | | | | | | | | | | | |
Brown Brothers Harriman & Co.,
0.25%, 1/01/16 | | | USD | | | | 14 | | | | 14,141 | |
Total Time Deposits — 0.0% | | | | | | | | | | | 27,475 | |
| | | | | | | | | | | | |
| U.S. Treasury Obligations | | | | | | | | | |
U.S. Treasury Bills (o): | | | | | | | | | | | | |
0.12%, 1/14/16 | | | | | | | 2,861 | | | | 2,860,911 | |
0.07%, 1/28/16-4/14/16 | | | | | | | 12,029 | | | | 12,025,355 | |
0.09%, 2/11/16 | | | | | | | 1,000 | | | | 999,861 | |
0.20%, 2/18/16 | | | | | | | 12,000 | | | | 11,998,320 | |
0.10%, 3/03/16 | | | | | | | 2,000 | | | | 1,999,648 | |
0.13%, 3/24/16 | | | | | | | 2,777 | | | | 2,775,906 | |
Total U.S. Treasury Obligations — 14.2% | | | | | | | | | | | 32,660,001 | |
Total Short-Term Securities (Cost — $49,589,228) — 21.7% | | | | | | | | | | | 49,747,248 | |
| | | | | | | | | | | | |
| Options Purchased | | | | | | | | | |
(Cost — $1,916,117) — 0.6% | | | | | | | | | | | 1,277,915 | |
Total Investments Before Investments Sold Short and Options Written | | | | | | | | | | | | |
(Cost — $242,478,484) — 103.0% | | | | | | | | | | | 236,448,292 | |
| | | | | | | | | | | | |
| Investments Sold Short | | | | | Shares | | | | |
Aeon Co. Ltd. | | | | | | | 7,700 | | | | (118,639 | ) |
Autoliv, Inc. | | | | | | | 918 | | | | (114,539 | ) |
Avery Dennison Corp. | | | | | | | 141 | | | | (8,835 | ) |
Franklin Resources, Inc. | | | | | | | 2,456 | | | | (90,430 | ) |
Gentex Corp. | | | | | | | 6,943 | | | | (111,157 | ) |
T. Rowe Price Group, Inc. | | | | | | | 1,331 | | | | (95,153 | ) |
Waddell & Reed Financial, Inc., Class A | | | | | | | 2,452 | | | | (70,274 | ) |
Total Investments Sold Short (Proceeds — $622,421) — (0.3)% | | | | | | | | | | | (609,027 | ) |
| | | | | | | | | | | | |
| Options Written | | | | | | | | | |
(Premiums Received — $995,473) — (0.4)% | | | | (910,925 | ) |
| | |
Total Investments Net of Investments Sold Short and Options Written — 102.3% | | | | | | | | 234,928,340 | |
Liabilities in Excess of Other Assets — (2.3)% | | | | | | | | (5,279,476 | ) |
| | | | | | | | | | | | |
Net Assets — 100.0% | | | | | | | | | | | $229,648,864 | |
| | | | | | | | | | | | |
|
| Notes to Consolidated Schedule of Investments |
| (a) | Non-income producing security. |
| (b) | Security, or a portion of security, is on loan. |
| (c) | Security exempt from registration pursuant to Rule 144A under the Securities Act of 1933, as amended. These securities may be resold in transactions exempt from registration to qualified institutional investors. |
| (d) | All or a portion of security has been pledged and/or segregated as collateral in connection with outstanding exchange-traded options written. |
| (e) | Restricted security as to resale, excluding 144A securities. As of period end, the Fund held restricted securities with a current value of $4,954,040 and an original cost of $3,722,226 which was 2.2% of its net assets. |
See Notes to Financial Statements.
| | | | | | |
| | | BLACKROCK SERIES FUND, INC. | | DECEMBER 31, 2015 | | 59 |
| | | | |
| Consolidated Schedule of Investments (continued) | | | BlackRock Global Allocation Portfolio | |
| (f) | Variable rate security. Rate as of period end. |
| (h) | Issuer filed for bankruptcy and/or is in default of interest payments. |
| (i) | Step-up bond that pays an initial coupon rate for the first period and then a higher coupon rate for the following periods. Rate as of period end. |
| (j) | All or a portion of security is held by a wholly owned subsidiary. See Note 1 of the Notes to Financial Statements for details on the wholly owned subsidiary. |
| (k) | During the year ended December 31, 2015, investments in issuers considered to be an affiliate of the Fund for purposes of Section 2(a)(3) of the Investment Company Act of 1940, as amended, were as follows: |
| | | | | | | | | | | | | | | | | | | | | | | | | | | | |
| Affiliate | | Shares/Beneficial
Interest Held at
December 31, 2014 | | | Shares/Beneficial
Interest Purchased | | | Shares
Sold | | | Shares/Beneficial
Interest Held at
December 31, 2015 | | | Value at
December 31,
2015 | | | Income | | | Realized
Gain | |
BlackRock Liquidity Funds, TempFund, Institutional Class | | | 410,233 | | | | 251,2531 | | | | — | | | | 661,486 | | | $ | 661,486 | | | $ | 2,146 | | | | $48 | |
BlackRock Liquidity Series, LLC, Money Market Series | | | $785,664 | | | | $4,200,4881 | | | | — | | | | $4,986,152 | | | $ | 4,986,152 | | | $ | 47,061 | 2 | | | — | |
iShares Gold Trust | | | 53,697 | | | | 2,283 | | | | — | | | | 55,980 | | | $ | 572,676 | | | | — | | | | — | |
| | 1 | | Represents net shares/beneficial interest purchased. |
| | 2 | | Represents securities lending income earned from the reinvestment of cash collateral from loaned securities, net of fees and collateral investment expenses, and other payments to and from borrowers of securities. |
| (l) | Perpetual security with no stated maturity date. |
| (m) | Represents or includes a TBA transaction. As of period end, unsettled TBA transactions were as follows: |
| | | | | | | | |
| Counterparty | | Value | | | Unrealized
Depreciation | |
Merrill Lynch, Pierce, Fenner & Smith, Inc. | | $ | 870,008 | | | | $(196 | ) |
| (n) | All or a portion of security has been pledged in connection with outstanding financial futures contracts. |
| (o) | Rates are discount rates or a range of discount rates at the time of purchase. |
| (p) | Current yield as of period end. |
| (q) | Security was purchased with the cash collateral from loaned securities. The Fund may withdraw up to 25% of its investment daily, although the manager of the BlackRock Liquidity Series, LLC, Money Market Series, in its sole discretion, may permit an investor to withdraw more than 25% on any one day. |
|
| Derivative Financial Instruments Outstanding as of Period End |
| | | | | | | | | | | | | | | | | | |
| Financial Futures Contracts | | | | | | | | | | | | |
Contracts
Long (Short) | | Issue | | Expiration | | | Notional Value | | | Unrealized
Appreciation
(Depreciation) | |
| (10) | | Euro STOXX 50 Index | | | March 2016 | | | | USD | | | | 356,673 | | | | $ (4,648 | ) |
| (3) | | FTSE 100 Index | | | March 2016 | | | | USD | | | | 274,114 | | | | (10,132 | ) |
| (37) | | Mini MSCI Emerging Markets Index Futures | | | March 2016 | | | | USD | | | | 1,456,875 | | | | (21,365 | ) |
| (5) | | NASDAQ 100 E-Mini Index | | | March 2016 | | | | USD | | | | 458,775 | | | | (1,344 | ) |
| (3) | | Nikkei 225 Yen Index | | | March 2016 | | | | USD | | | | 234,120 | | | | 7,541 | |
| (16) | | Russell 2000 Mini Index | | | March 2016 | | | | USD | | | | 1,810,400 | | | | (978 | ) |
| (42) | | S&P 500 E-Mini Index | | | March 2016 | | | | USD | | | | 4,274,340 | | | | (24,256 | ) |
| 13 | | TOPIX Index | | | March 2016 | | | | USD | | | | 1,673,739 | | | | (1,485 | ) |
Total | | | | | | | | | | | | | | | | | $(56,667 | ) |
| | | | | | | | | | | | | | | | | | |
| | | | | | | | | | | | | | | | | | | | |
| Forward Foreign Currency Exchange Contracts | |
Currency Purchased | | | Currency Sold | | | Counterparty | | Settlement
Date | | | Unrealized
Appreciation
(Depreciation) | |
| JPY | | | 96,701,000 | | | USD | | | 801,693 | | | JPMorgan Chase Bank N.A. | | | 1/07/16 | | | $ | 2,963 | |
| USD | | | 784,853 | | | JPY | | | 96,701,000 | | | JPMorgan Chase Bank N.A. | | | 1/07/16 | | | | (19,802 | ) |
| USD | | | 144,688 | | | MXN | | | 2,490,000 | | | HSBC Bank USA N.A. | | | 1/07/16 | | | | 285 | |
| USD | | | 219,545 | | | MXN | | | 3,736,990 | | | Morgan Stanley Capital Services LLC | | | 1/07/16 | | | | 2,826 | |
| USD | | | 466,366 | | | SGD | | | 665,000 | | | HSBC Bank USA N.A. | | | 1/07/16 | | | | (2,520 | ) |
| JPY | | | 27,939,000 | | | USD | | | 229,203 | | | Credit Suisse International | | | 1/08/16 | | | | 3,285 | |
| JPY | | | 35,351,000 | | | USD | | | 289,709 | | | Credit Suisse International | | | 1/08/16 | | | | 4,455 | |
| USD | | | 513,182 | | | JPY | | | 63,290,000 | | | Credit Suisse International | | | 1/08/16 | | | | (13,469 | ) |
| USD | | | 209,040 | | | MXN | | | 3,515,000 | | | Deutsche Bank AG | | | 1/08/16 | | | | 5,210 | |
| USD | | | 209,237 | | | MXN | | | 3,518,000 | | | Deutsche Bank AG | | | 1/08/16 | | | | 5,233 | |
See Notes to Financial Statements.
| | | | | | |
| 60 | | BLACKROCK SERIES FUND, INC. | | DECEMBER 31, 2015 | | |
| | | | |
| Consolidated Schedule of Investments (continued) | | | BlackRock Global Allocation Portfolio | |
| | | | | | | | | | | | | | | | | | | | |
Currency Purchased | | | Currency Sold | | | Counterparty | | Settlement
Date | | | Unrealized
Appreciation
(Depreciation) | |
USD | | | 228,499 | | | SGD | | | 326,000 | | | Deutsche Bank AG | | | 1/08/16 | | | $ | (1,352 | ) |
EUR | | | 341,000 | | | USD | | | 373,139 | | | Deutsche Bank AG | | | 1/11/16 | | | | (2,453 | ) |
EUR | | | 737,000 | | | USD | | | 807,811 | | | Goldman Sachs International | | | 1/11/16 | | | | (6,651 | ) |
USD | | | 238,430 | | | BRL | | | 899,000 | | | Citibank N.A. | | | 1/11/16 | | | | 12,108 | |
USD | | | 224,615 | | | BRL | | | 845,000 | | | Deutsche Bank AG | | | 1/11/16 | | | | 11,887 | |
USD | | | 814,460 | | | EUR | | | 737,000 | | | Goldman Sachs International | | | 1/11/16 | | | | 13,299 | |
USD | | | 817,916 | | | JPY | | | 100,000,000 | | | Morgan Stanley Capital Services LLC | | | 1/13/16 | | | | (14,298 | ) |
EUR | | | 110,000 | | | USD | | | 120,139 | | | Citibank N.A. | | | 1/14/16 | | | | (554 | ) |
EUR | | | 221,000 | | | USD | | | 242,134 | | | Credit Suisse International | | | 1/14/16 | | | | (1,877 | ) |
EUR | | | 216,000 | | | USD | | | 235,717 | | | Goldman Sachs International | | | 1/14/16 | | | | (895 | ) |
JPY | | | 61,680,000 | | | USD | | | 505,336 | | | Morgan Stanley Capital Services LLC | | | 1/14/16 | | | | 7,985 | |
USD | | | 572,971 | | | AUD | | | 797,000 | | | JPMorgan Chase Bank N.A. | | | 1/14/16 | | | | (7,390 | ) |
USD | | | 580,000 | | | CAD | | | 796,015 | | | Morgan Stanley Capital Services LLC | | | 1/14/16 | | | | 4,702 | |
USD | | | 509,630 | | | JPY | | | 61,680,000 | | | Morgan Stanley Capital Services LLC | | | 1/14/16 | | | | (3,691 | ) |
USD | | | 409,412 | | | BRL | | | 1,559,000 | | | Goldman Sachs International | | | 1/15/16 | | | | 17,509 | |
USD | | | 239,262 | | | SGD | | | 337,000 | | | Morgan Stanley Capital Services LLC | | | 1/15/16 | | | | 1,715 | |
EUR | | | 219,000 | | | USD | | | 235,440 | | | Deutsche Bank AG | | | 1/21/16 | | | | 2,685 | |
JPY | | | 28,406,000 | | | USD | | | 232,846 | | | Citibank N.A. | | | 1/21/16 | | | | 3,594 | |
USD | | | 554,306 | | | JPY | | | 67,989,000 | | | Citibank N.A. | | | 1/21/16 | | | | (11,605 | ) |
USD | | | 235,337 | | | MXN | | | 3,901,000 | | | Citibank N.A. | | | 1/21/16 | | | | 9,343 | |
USD | | | 579,000 | | | MXN | | | 10,089,828 | | | Credit Suisse International | | | 1/21/16 | | | | (5,528 | ) |
EUR | | | 219,000 | | | USD | | | 238,477 | | | Citibank N.A. | | | 1/22/16 | | | | (345 | ) |
USD | | | 232,204 | | | MYR | | | 990,000 | | | Credit Suisse International | | | 1/22/16 | | | | 2,006 | |
USD | | | 843,562 | | | JPY | | | 100,000,000 | | | Goldman Sachs International | | | 1/25/16 | | | | 11,133 | |
USD | | | 465,880 | | | KRW | | | 532,641,000 | | | Credit Suisse International | | | 1/25/16 | | | | 11,944 | |
USD | | | 567,640 | | | KRW | | | 647,450,000 | | | Deutsche Bank AG | | | 1/25/16 | | | | 15,859 | |
USD | | | 139,145 | | | AUD | | | 194,000 | | | Morgan Stanley Capital Services LLC | | | 1/28/16 | | | | (2,022 | ) |
USD | | | 215,128 | | | BRL | | | 845,000 | | | Deutsche Bank AG | | | 1/28/16 | | | | 3,714 | |
USD | | | 216,003 | | | IDR | | | 3,097,487,000 | | | Credit Suisse International | | | 1/28/16 | | | | (7,110 | ) |
EUR | | | 656,000 | | | USD | | | 694,593 | | | Credit Suisse International | | | 1/29/16 | | | | 18,840 | |
EUR | | | 1,079,000 | | | USD | | | 1,143,326 | | | Goldman Sachs International | | | 1/29/16 | | | | 30,141 | |
USD | | | 608,406 | | | EUR | | | 560,000 | | | Goldman Sachs International | | | 1/29/16 | | | | (622 | ) |
USD | | | 516,159 | | | JPY | | | 63,374,000 | | | Deutsche Bank AG | | | 1/29/16 | | | | (11,430 | ) |
USD | | | 969,701 | | | JPY | | | 120,000,000 | | | Deutsche Bank AG | | | 2/10/16 | | | | (29,549 | ) |
USD | | | 481,067 | | | BRL | | | 1,851,000 | | | Morgan Stanley Capital Services LLC | | | 2/16/16 | | | | 20,470 | |
USD | | | 218,925 | | | MXN | | | 3,745,660 | | | BNP Paribas S.A. | | | 2/18/16 | | | | 2,371 | |
USD | | | 894,309 | | | JPY | | | 110,000,000 | | | Deutsche Bank AG | | | 2/22/16 | | | | (21,899 | ) |
USD | | | 2,032,752 | | | JPY | | | 250,000,000 | | | Morgan Stanley Capital Services LLC | | | 2/29/16 | | | | (49,841 | ) |
USD | | | 2,042,317 | | | JPY | | | 250,000,000 | | | Credit Suisse International | | | 3/07/16 | | | | (40,872 | ) |
USD | | | 559,490 | | | KRW | | | 659,779,000 | | | Morgan Stanley Capital Services LLC | | | 3/09/16 | | | | (2,311 | ) |
USD | | | 228,317 | | | CLP | | | 163,121,000 | | | Goldman Sachs International | | | 3/10/16 | | | | (34 | ) |
USD | | | 1,057,943 | | | JPY | | | 130,000,000 | | | HSBC Bank USA N.A. | | | 3/14/16 | | | | (25,626 | ) |
USD | | | 574,000 | | | CNH | | | 3,803,324 | | | Deutsche Bank AG | | | 3/15/16 | | | | 1,303 | |
USD | | | 1,323,775 | | | JPY | | | 160,000,000 | | | JPMorgan Chase Bank N.A. | | | 3/22/16 | | | | (10,285 | ) |
USD | | | 251,121 | | | MXN | | | 4,200,000 | | | Goldman Sachs International | | | 3/31/16 | | | | 9,032 | |
USD | | | 458,170 | | | MXN | | | 7,700,000 | | | JPMorgan Chase Bank N.A. | | | 4/14/16 | | | | 14,769 | |
USD | | | 116,519 | | | TWD | | | 3,823,000 | | | Credit Suisse International | | | 5/12/16 | | | | (109 | ) |
USD | | | 236,851 | | | TWD | | | 7,786,000 | | | Deutsche Bank AG | | | 5/12/16 | | | | (676 | ) |
USD | | | 626,000 | | | CNH | | | 4,162,305 | | | Goldman Sachs International | | | 5/17/16 | | | | 3,111 | |
See Notes to Financial Statements.
| | | | | | |
| | | BLACKROCK SERIES FUND, INC. | | DECEMBER 31, 2015 | | 61 |
| | | | |
| Consolidated Schedule of Investments (continued) | | | BlackRock Global Allocation Portfolio | |
| | | | | | | | | | | | | | | | | | | | |
Currency Purchased | | | Currency Sold | | | Counterparty | | Settlement
Date | | | Unrealized
Appreciation
(Depreciation) | |
USD | | | 494,000 | | | CNH | | | 3,280,061 | | | Goldman Sachs International | | | 5/17/16 | | | $ | 3,139 | |
USD | | | 585,248 | | | CNH | | | 3,803,000 | | | Deutsche Bank AG | | | 11/04/16 | | | | 23,205 | |
Total | | | | | | | | | | | | | | | | | | $ | (14,695 | ) |
| | | | | | | | | | | | | | | | | | | | |
| | | | | | | | | | | | | | | | | | |
| Exchange-Traded Options Purchased | | | | | | | | | | | | | |
| Description | | Put/
Call | | Expiration
Date | | Strike Price | | | Contracts | | | Value | |
Amazon.com, Inc. | | Call | | 1/15/16 | | USD | | | 580.00 | | | | 1 | | | | $9,680 | |
SPDR Gold Trust ETF1 | | Call | | 1/15/16 | | USD | | | 111.00 | | | | 92 | | | | 276 | |
Salesforce.com, Inc. | | Call | | 3/18/16 | | USD | | | 80.00 | | | | 5 | | | | 1,962 | |
SPDR Gold Trust ETF1 | | Call | | 3/18/16 | | USD | | | 114.00 | | | | 118 | | | | 3,186 | |
SPDR Gold Trust ETF1 | | Call | | 3/18/16 | | USD | | | 113.00 | | | | 68 | | | | 2,108 | |
Total | | | | | | | | | | | | | | | | | $17,212 | |
| | | | | | | | | | | | | | | | | | |
| | 1 | | All or a portion of security is held by a wholly owned subsidiary. See Note 1 of the Notes to Financial Statements for details on the wholly owned subsidiary. |
| | | | | | | | | | | | | | | | | | | | |
| OTC Options Purchased | | | | | | | | | | | | | | | | | |
| Description | | Put/
Call | | Counterparty | | Expiration
Date | | Strike Price | | | Contracts | | | Value | |
Abbott Laboratories | | Call | | Citibank N.A. | | 1/15/16 | | USD | | | 49.00 | | | | 12,800 | | | $ | 73 | |
Activision Blizzard, Inc. | | Call | | Deutsche Bank AG | | 1/15/16 | | USD | | | 19.00 | | | | 12,901 | | | | 281,242 | |
Gilead Sciences, Inc. | | Call | | Citibank N.A. | | 1/15/16 | | USD | | | 95.00 | | | | 2,600 | | | | 17,550 | |
Goldman Sachs Group, Inc. | | Call | | Deutsche Bank AG | | 1/15/16 | | USD | | | 220.00 | | | | 1,900 | | | | 133 | |
| | | | Morgan Stanley & Co. | | | | | | | | | | | | | | | | |
Ingersoll-Rand PLC | | Call | | International PLC | | 1/15/16 | | USD | | | 63.50 | | | | 4,045 | | | | 3 | |
International Business Machines Corp. | | Call | | Barclays Bank PLC | | 1/15/16 | | USD | | | 182.00 | | | | 2,550 | | | | — | |
International Business Machines Corp. | | Call | | Deutsche Bank AG | | 1/15/16 | | USD | | | 182.00 | | | | 2,551 | | | | — | |
Merck & Co., Inc. | | Call | | Goldman Sachs International | | 1/15/16 | | USD | | | 59.00 | | | | 25,524 | | | | 13 | |
| | | | Morgan Stanley & Co. | | | | | | | | | | | | | | | | |
S&P 500 Index | | Call | | International PLC | | 1/15/16 | | USD | | | 2,100.00 | | | | 293 | | | | 952 | |
| | | | Morgan Stanley & Co. | | | | | | | | | | | | | | | | |
S&P 500 Index | | Call | | International PLC | | 2/19/16 | | USD | | | 2,150.00 | | | | 293 | | | | 1,216 | |
Morgan Stanley Japan Custom Index | | | | Morgan Stanley & Co. | | | | | | | | | | | | | | | | |
| | Call | | International PLC | | 3/11/16 | | JPY | | | 148.58 | | | | 443,560 | | | | 20,427 | |
Morgan Stanley Japan Custom Index | | | | Morgan Stanley & Co. | | | | | | | | | | | | | | | | |
| | Call | | International PLC | | 3/11/16 | | JPY | | | 155.62 | | | | 114,093 | | | | 5,928 | |
Baxter International, Inc. | | Call | | Goldman Sachs International | | 3/18/16 | | USD | | | 72.75 | | | | 5,033 | | | | 29,959 | |
| | | | Morgan Stanley & Co. | | | | | | | | | | | | | | | | |
S&P 500 Index | | Call | | International PLC | | 3/18/16 | | USD | | | 2,200.00 | | | | 293 | | | | 762 | |
United Continental Holdings, Inc. | | | | Morgan Stanley & Co. | | | | | | | | | | | | | | | | |
| | Call | | International PLC | | 3/18/16 | | USD | | | 60.00 | | | | 295 | | | | 729 | |
TOPIX Index | | Call | | Citibank N.A. | | 4/08/16 | | JPY | | | 1,625.00 | | | | 94,713 | | | | 17,390 | |
Johnson & Johnson | | Call | | Goldman Sachs International | | 4/15/16 | | USD | | | 103.00 | | | | 25,184 | | | | 80,745 | |
Bank of New York Mellon Corp. | | Call | | Deutsche Bank AG | | 5/20/16 | | USD | | | 46.00 | | | | 18,800 | | | | 10,311 | |
Gilead Sciences, Inc. | | Call | | Deutsche Bank AG | | 5/20/16 | | USD | | | 99.00 | | | | 2,440 | | | | 19,200 | |
Goldman Sachs Group, Inc. | | Call | | Deutsche Bank AG | | 5/20/16 | | USD | | | 220.00 | | | | 4,500 | | | | 3,281 | |
KeyCorp | | Call | | Deutsche Bank AG | | 5/20/16 | | USD | | | 15.75 | | | | 25,066 | | | | 3,963 | |
Morgan Stanley | | Call | | Deutsche Bank AG | | 5/20/16 | | USD | | | 40.75 | | | | 18,800 | | | | 2,395 | |
SunTrust Banks, Inc. | | Call | | Deutsche Bank AG | | 5/20/16 | | USD | | | 45.50 | | | | 18,800 | | | | 22,138 | |
Teva Pharmaceutical Industries Ltd. | | Call | | Deutsche Bank AG | | 5/20/16 | | USD | | | 63.50 | | | | 5,000 | | | | 24,849 | |
Wells Fargo & Co. | | Call | | Deutsche Bank AG | | 5/20/16 | | USD | | | 59.00 | | | | 18,800 | | | | 23,858 | |
TOPIX Index | | Call | | Citibank N.A. | | 6/10/16 | | JPY | | | 1,675.00 | | | | 80,641 | | | | 14,377 | |
See Notes to Financial Statements.
| | | | | | |
| 62 | | BLACKROCK SERIES FUND, INC. | | DECEMBER 31, 2015 | | |
| | | | |
| Consolidated Schedule of Investments (continued) | | | BlackRock Global Allocation Portfolio | |
| | | | | | | | | | | | | | | | | | | | | | | | |
| Description | | Put/
Call | | | Counterparty | | Expiration
Date | | Strike Price | | | Contracts | | | Value | |
TOPIX Index | | | Call | | | Morgan Stanley & Co.
International PLC | | 6/10/16 | | | JPY | | | | 1,675.00 | | | | 42,800 | | | | $ 7,630 | |
STOXX Europe 600 Index | | | Call | | | JPMorgan Chase Bank N.A. | | 6/17/16 | �� | | EUR | | | | 380.00 | | | | 1,582 | | | | 14,566 | |
STOXX Europe 600 Index | | | Call | | | Credit Suisse International | | 9/16/16 | | | EUR | | | | 375.00 | | | | 1,951 | | | | 32,692 | |
Taiwan Stock Exchange Weighted Index | | | Call | | | Citibank N.A. | | 9/21/16 | | | TWD | | | | 9,000.77 | | | | 2,200 | | | | . 9,453 | |
MetLife, Inc. | | | Call | | | UBS AG | | 1/20/17 | | | USD | | | | 50.00 | | | | 3,834 | | | | 14,487 | |
MetLife, Inc. | | | Call | | | UBS AG | | 1/20/17 | | | USD | | | | 52.50 | | | | 3,500 | | | | 9,938 | |
Prudential Financial, Inc. | | | Call | | | Morgan Stanley & Co.
International PLC | | 1/20/17 | | | USD | | | | 87.50 | | | | 4,300 | | | | 18,376 | |
EURO STOXX 50 Index | | | Call | | | Morgan Stanley & Co.
International PLC | | 3/17/17 | | | EUR | | | | 3,450.00 | | | | 181 | | | | 30,847 | |
STOXX Europe 600 Index | | | Call | | | Credit Suisse International | | 3/17/17 | | | EUR | | | | 355.61 | | | | 1,670 | | | | 49,726 | |
QUALCOMM, Inc. | | | Call | | | Deutsche Bank AG | | 5/19/17 | | | USD | | | | 52.50 | | | | 7,571 | | | | 35,729 | |
EURO STOXX 50 Index | | | Call | | | Citibank N.A. | | 6/16/17 | | | EUR | | | | 3,500.00 | | | | 168 | | | | 27,495 | |
EURO STOXX 50 Index | | | Call | | | Bank of America N.A. | | 9/15/17 | | | EUR | | | | 3,600.00 | | | | 181 | | | | 27,977 | |
STOXX Europe 600 Index | | | Call | | | JPMorgan Chase Bank N.A. | | 9/15/17 | | | EUR | | | | 372.06 | | | | 1,076 | | | | 26,603 | |
Taiwan Capitalization Weighted Stock Index | | | Call | | | Morgan Stanley & Co.
International PLC | | 9/20/17 | | | TWD | | | | 9,000.00 | | | | 1,949 | | | | 20,460 | |
EURO STOXX 50 Index | | | Call | | | Barclays Bank PLC | | 12/15/17 | | | EUR | | | | 3,500.00 | | | | 185 | | | | 38,496 | |
Taiwan Capitalization Weighted Stock Index | | | Call | | | Morgan Stanley & Co.
International PLC | | 12/20/17 | | | TWD | | | | 9,000.00 | | | | 1,987 | | | | 21,188 | |
Nikkei 225 Index | | | Call | | | Goldman Sachs International | | 3/09/18 | | | JPY | | | | 21,968.28 | | | | 5,319 | | | | 41,687 | |
EURO STOXX 50 Index | | | Call | | | Goldman Sachs International | | 3/16/18 | | | EUR | | | | 3,500.00 | | | | 154 | | | | 33,287 | |
EURO STOXX 50 Index | | | Call | | | UBS AG | | 6/15/18 | | | EUR | | | | 3,600.00 | | | | 74 | | | | 14,076 | |
EURO STOXX 50 Index | | | Call | | | Deutsche Bank AG | | 9/21/18 | | | EUR | | | | 3,426.55 | | | | 77 | | | | 20,777 | |
Russell 2000 Index | | | Put | | | Credit Suisse International | | 1/15/16 | | | USD | | | | 1,150.00 | | | | 427 | | | | 10,739 | |
Russell 2000 Index | | | Put | | | Société Générale | | 1/15/16 | | | USD | | | | 1,135.00 | | | | 281 | | | | 4,889 | |
S&P 500 Index | | | Put | | | UBS AG | | 1/15/16 | | | USD | | | | 2,000.00 | | | | 596 | | | | 7,480 | |
Ibovespa Brasil Sao Paulo Stock Exchange Index | | | Put | | | BNP Paribas S.A. | | 2/17/16 | | | BRL | | | | 46,600.00 | | | | 13 | | | | 10,364 | |
Ibovespa Brasil Sao Paulo Stock Exchange Index | | | Put | | | Goldman Sachs International | | 2/17/16 | | | BRL | | | | 44,000.00 | | | | 10 | | | | 4,158 | |
Ibovespa Brasil Sao Paulo Stock Exchange Index | | | Put | | | Morgan Stanley & Co.
International PLC | | 2/17/16 | | | BRL | | | | 47,000.00 | | | | 15 | | | | 13,104 | |
Russell 2000 Index | | | Put | | | Bank of America N.A. | | 2/19/16 | | | USD | | | | 1,110.00 | | | | 987 | | | | 22,849 | |
S&P 500 Index | | | Put | | | BNP Paribas S.A. | | 2/19/16 | | | USD | | | | 1,990.00 | | | | 740 | | | | 23,310 | |
Gentex Corp. | | | Put | | | Morgan Stanley & Co.
International PLC | | 3/18/16 | | | USD | | | | 15.00 | | | | 7,364 | | | | 3,130 | |
Gentex Corp. | | | Put | | | UBS AG | | 3/18/16 | | | USD | | | | 15.00 | | | | 2,436 | | | | 1,035 | |
Ibovespa Brasil Sao Paulo Stock Exchange Index | | | Put | | | Bank of America N.A. | | 8/17/16 | | | BRL | | | | 51,369.43 | | | | 31 | | | | 47,878 | |
Ibovespa Brasil Sao Paulo Stock Exchange Index | | | Put | | | Bank of America N.A. | | 8/17/16 | | | BRL | | | | 49,122.00 | | | | 13 | | | | 15,828 | |
Total | | | | | | | | | | | | | | | | | | | | | | | $1,241,748 | |
| | | | | | | | | | | | | | | | | | | | | | | | |
See Notes to Financial Statements.
| | | | | | |
| | | BLACKROCK SERIES FUND, INC. | | DECEMBER 31, 2015 | | 63 |
| | | | |
| Consolidated Schedule of Investments (continued) | | | BlackRock Global Allocation Portfolio | |
OTC Interest Rate Swaptions Purchased
| | | | | | | | | | | | | | | | | | | | | | | | |
| Description | | Counterparty | | Put/
Call | | Exercise Rate | | Pay/Receive
Exercise Rate | | Floating Rate
Index | | Expiration Date | | Notional Amount (000) | | | Value | |
10-Year Interest Rate Swap | | Goldman Sachs
International | | Call | | 2.05% | | Receive | | 3-month LIBOR | | 1/19/16 | | | USD | | | | 7,430 | | | | $ 8,642 | |
2-Year Forward/1-Year Interest Rate Swap | | Deutsche Bank AG | | Call | | 1.80% | | Receive | | 3-month LIBOR | | 5/13/16 | | | USD | | | | 6,198 | | | | 8,989 | |
10-Year Interest Rate Swap | | Goldman Sachs
International | | Put | | 1.35% | | Pay | | 6-month JPY
LIBOR | | 1/25/16 | | | JPY | | | | 112,455 | | | | — | |
10-Year Interest Rate Swap | | Goldman Sachs
International | | Put | | 1.35% | | Pay | | 6-month JPY
LIBOR | | 1/25/16 | | | JPY | | | | 55,805 | | | | — | |
10-Year Interest Rate Swap | | Deutsche Bank AG | | Put | | 1.25% | | Pay | | 6-month JPY
LIBOR | | 7/29/16 | | | JPY | | | | 64,600 | | | | 240 | |
5-Year Interest Rate Swap | | Deutsche Bank AG | | Put | | 1.07% | | Pay | | 6-month JPY
LIBOR | | 4/04/18 | | | JPY | | | | 64,546 | | | | 1,084 | |
Total | | | | | | | | | | | | | | | | | | | | | | | $18,955 | |
| | | | | | | | | | | | | | | | | | | | | | | | |
Exchange-Traded Options Written
| | | | | | | | | | | | | | | | |
| Description | | Put/
Call | | Expiration
Date | | Strike Price | | | Contracts | | Value | |
Amazon.com, Inc. | | Call | | 1/15/2016 | | USD | | | 660.00 | | | 1 | | | $(2,378) | |
Kimberly Clark Corp. | | Call | | 1/15/2016 | | USD | | | 120.00 | | | 8 | | | (6,720) | |
Salesforce.com, Inc. | | Call | | 3/18/2016 | | USD | | | 90.00 | | | 5 | | | (465) | |
Kimberly Clark Corp. | | Call | | 4/15/2016 | | USD | | | 125.00 | | | 5 | | | (2,950) | |
Total | | | | | | | | | | | | | | | $(12,513) | |
| | | | | | | | | | | | | | | | |
OTC Barrier Put Options Written
| | | | | | | | | | | | | | | | | | | | | | | | |
| Description | | Type of Options | | Counterparty | | Expiration
Date | | Strike Price | | Barrier Price | | | Contracts | | | Value | |
| | | | Goldman
Sachs | | | | | | | | | | | | | | | | | | | | |
Nikkei 225 Index | | Down-and-In | | International | | 3/09/18 | | JPY | | 17,974.04 | | JPY | | | 14,978.37 | | | | 5,319 | | | | $(78,851) | |
EURO STOXX 50 Index | | Down-and-In | | Deutsche
Bank AG | | 9/21/18 | | EUR | | 2,586.07 | | EUR | | | 2,165.83 | | | | 77 | | | | (19,990) | |
Total | | | | | | | | | | | | | | | | | | | | | | | $(98,841) | |
| | | | | | | | | | | | | | | | | | | | | | | | |
OTC Options Written
| | | | | | | | | | | | | | | | | | | | | | | | | | |
| Description | | Put/
Call | | | Counterparty | | Expiration
Date | | | Strike Price | | | Contracts | | | Value | |
Abbott Laboratories | | | Call | | | Citibank N.A. | | | 1/15/16 | | | | USD | | | | 55.00 | | | | 12,800 | | | | $ (384) | |
Activision Blizzard, Inc. | | | Call | | | Deutsche Bank AG | | | 1/15/16 | | | | USD | | | | 24.00 | | | | 12,901 | | | | (194,160) | |
Merck & Co., Inc. | | | Call | | | Goldman Sachs International | | | 1/15/16 | | | | USD | | | | 65.00 | | | | 25,524 | | | | (510) | |
United Continental Holdings, Inc. | | | Call | | | Citibank N.A. | | | 1/15/16 | | | | USD | | | | 60.00 | | | | 2,207 | | | | (1,148) | |
Ibovespa Brasil Sao Paulo Stock Exchange Index | | | Call | | | BNP Paribas S.A. | | | 2/17/16 | | | | BRL | | | | 51,000.00 | | | | 13 | | | | (177) | |
Ibovespa Brasil Sao Paulo Stock Exchange Index | | | Call | | | Morgan Stanley & Co.
International PLC | | | 2/17/16 | | | | BRL | | | | 51,500.00 | | | | 15 | | | | (154) | |
Lloyds Banking Group PLC | | | Call | | | Goldman Sachs International | | | 2/19/16 | | | | GBP | | | | 0.74 | | | | 92,000 | | | | (2,477) | |
Russell 2000 Index | | | Call | | | Bank of America N.A. | | | 2/19/16 | | | | USD | | | | 1,210.00 | | | | 987 | | | | (3,529) | |
S&P 500 Index | | | Call | | | BNP Paribas S.A. | | | 2/19/16 | | | | USD | | | | 2,115.00 | | | | 740 | | | | (8,473) | |
Baxter International, Inc. | | | Call | | | Goldman Sachs International | | | 3/18/16 | | | | USD | | | | 82.00 | | | | 5,033 | | | | (7,856) | |
United Continental Holdings, Inc. | | | Call | | | Morgan Stanley & Co.
International PLC | | | 3/18/16 | | | | USD | | | | 70.00 | | | | 295 | | | | (97) | |
Bank of New York Mellon Corp. | | | Call | | | Deutsche Bank AG | | | 5/20/16 | | | | USD | | | | 51.25 | | | | 18,800 | | | | (2,919) | |
See Notes to Financial Statements.
| | | | | | |
| 64 | | BLACKROCK SERIES FUND, INC. | | DECEMBER 31, 2015 | | |
| | | | |
| Consolidated Schedule of Investments (continued) | | | BlackRock Global Allocation Portfolio | |
| | | | | | | | | | | | | | | | | | | | | | | | |
| Description | | Put/
Call | | | Counterparty | | Expiration
Date | | Strike Price | | | Contracts | | | Value | |
Gilead Sciences, Inc. | | | Call | | | Deutsche Bank AG | | 5/20/16 | | | USD | | | | 107.50 | | | | 2,440 | | | | $ (9,689) | |
Goldman Sachs Group, Inc. | | | Call | | | Deutsche Bank AG | | 5/20/16 | | | USD | | | | 245.00 | | | | 4,500 | | | | (1,188) | |
KeyCorp | | | Call | | | Deutsche Bank AG | | 5/20/16 | | | USD | | | | 17.90 | | | | 25,066 | | | | (2,182) | |
Morgan Stanley | | | Call | | | Deutsche Bank AG | | 5/20/16 | | | USD | | | | 46.00 | | | | 18,800 | | | | (301) | |
SunTrust Banks, Inc. | | | Call | | | Deutsche Bank AG | | 5/20/16 | | | USD | | | | 51.75 | | | | 18,800 | | | | (5,205) | |
Teva Pharmaceutical Industries Ltd. | | | Call | | | Deutsche Bank AG | | 5/20/16 | | | USD | | | | 73.00 | | | | 5,000 | | | | (4,473) | |
Wells Fargo & Co. | | | Call | | | Deutsche Bank AG | | 5/20/16 | | | USD | | | | 66.00 | | | | 18,800 | | | | (1,077) | |
Ibovespa Brasil Sao Paulo Stock Exchange Index | | | Call | | | Bank of America N.A. | | 8/17/16 | | | BRL | | | | 60,785.00 | | | | 13 | | | | (1,119) | |
Ibovespa Brasil Sao Paulo Stock Exchange Index | | | Call | | | Bank of America N.A. | | 8/17/16 | | | BRL | | | | 63,004.60 | | | | 31 | | | | (1,705) | |
General Electric Co. | | | Call | | | Deutsche Bank AG | | 1/20/17 | | | USD | | | | 32.50 | | | | 19,470 | | | | (24,126) | |
MetLife, Inc. | | | Call | | | UBS AG | | 1/20/17 | | | USD | | | | 57.50 | | | | 3,500 | | | | (6,125) | |
MetLife, Inc. | | | Call | | | UBS AG | | 1/20/17 | | | USD | | | | 55.00 | | | | 3,834 | | | | (7,400) | |
Prudential Financial, Inc. | | | Call | | | Morgan Stanley & Co.
International PLC | | 1/20/17 | | | USD | | | | 93.50 | | | | 4,300 | | | | (17,721) | |
QUALCOMM, Inc. | | | Call | | | Deutsche Bank AG | | 5/19/17 | | | USD | | | | 70.00 | | | | 7,571 | | | | (7,199) | |
Ingersoll-Rand PLC | | | Put | | | Morgan Stanley & Co.
International PLC | | 1/15/16 | | | USD | | | | 56.00 | | | | 4,045 | | | | (5,206) | |
Mylan, Inc. | | | Put | | | Barclays Bank PLC | | 1/15/16 | | | USD | | | | 60.00 | | | | 1,850 | | | | (10,684) | |
Russell 2000 Index | | | Put | | | Credit Suisse International | | 1/15/16 | | | USD | | | | 1,050.00 | | | | 427 | | | | (651) | |
Russell 2000 Index | | | Put | | | Société Générale | | 1/15/16 | | | USD | | | | 1,035.00 | | | | 281 | | | | (274) | |
S&P 500 Index | | | Put | | | UBS AG | | 1/15/16 | | | USD | | | | 1,850.00 | | | | 596 | | | | (760) | |
Twitter, Inc. | | | Put | | | Citibank N.A. | | 1/15/16 | | | USD | | | | 30.00 | | | | 4,167 | | | | (28,544) | |
Russell 2000 Index | | | Put | | | Bank of America N.A. | | 2/19/16 | | | USD | | | | 1,010.00 | | | | 987 | | | | (5,527) | |
S&P 500 Index | | | Put | | | BNP Paribas S.A. | | 2/19/16 | | | USD | | | | 1,885.00 | | | | 740 | | | | (9,953) | |
Morgan Stanley Japan Custom Index | | | Put | | | Morgan Stanley & Co.
International PLC | | 3/11/16 | | | JPY | | | | 155.62 | | | | 114,093 | | | | (3,648) | |
Morgan Stanley Japan Custom Index | | | Put | | | Morgan Stanley & Co.
International PLC | | 3/11/16 | | | JPY | | | | 148.58 | | | | 443,560 | | | | (14,476) | |
United Continental Holdings, Inc. | | | Put | | | Morgan Stanley & Co.
International PLC | | 3/18/16 | | | USD | | | | 53.50 | | | | 295 | | | | (643) | |
TOPIX Index | | | Put | | | Citibank N.A. | | 4/08/16 | | | JPY | | | | 1,500.00 | | | | 94,713 | | | | (30,668) | |
Gilead Sciences, Inc. | | | Put | | | Deutsche Bank AG | | 5/20/16 | | | USD | | | | 90.00 | | | | 2,440 | | | | (6,844) | |
Teva Pharmaceutical Industries Ltd. | | | Put | | | Deutsche Bank AG | | 5/20/16 | | | USD | | | | 55.00 | | | | 5,000 | | | | (5,308) | |
TOPIX Index | | | Put | | | Citibank N.A. | | 6/10/16 | | | JPY | | | | 1,475.00 | | | | 40,320 | | | | (16,476) | |
TOPIX Index | | | Put | | | Citibank N.A. | | 6/10/16 | | | JPY | | | | 1,500.00 | | | | 40,321 | | | | (19,457) | |
TOPIX Index | | | Put | | | Morgan Stanley & Co.
International PLC | | 6/10/16 | | | JPY | | | | 1,450.00 | | | | 42,800 | | | | (14,761) | |
EURO STOXX 50 Index | | | Put | | | Goldman Sachs
International | | 6/17/16 | | | EUR | | | | 3,050.00 | | | | 227 | | | | (33,113) | |
EURO STOXX 50 Index | | | Put | | | Morgan Stanley & Co.
International PLC | | 6/17/16 | | | EUR | | | | 3,150.00 | | | | 227 | | | | (42,435) | |
Taiwan Stock Exchange Weighted Index | | | Put | | | Citibank N.A. | | 9/21/16 | | | TWD | | | | 8,100.70 | | | | 2,200 | | | | (35,850) | |
MetLife, Inc. | | | Put | | | UBS AG | | 1/20/17 | | | USD | | | | 46.00 | | | | 1,750 | | | | (8,618) | |
MetLife, Inc. | | | Put | | | UBS AG | | 1/20/17 | | | USD | | | | 45.00 | | | | 1,917 | | | | (7,504) | |
Prudential Financial, Inc. | | | Put | | | Morgan Stanley & Co.
International PLC | | 1/20/17 | | | USD | | | | 77.50 | | | | 2,150 | | | | (16,986) | |
QUALCOMM, Inc. | | | Put | | | Deutsche Bank AG | | 5/19/17 | | | USD | | | | 40.00 | | | | 7,571 | | | | (23,235) | |
Taiwan Capitalization Weighted Stock Index | | | Put | | | Morgan Stanley & Co.
International PLC | | 9/20/17 | | | TWD | | | | 8,600.00 | | | | 1,949 | | | | (66,718) | |
Taiwan Capitalization Weighted Stock Index | | | Put | | | Morgan Stanley & Co.
International PLC | | 12/20/17 | | | TWD | | | | 8,600.00 | | | | 1,987 | | | | (75,089) | |
Total | | | | | | | | | | | | | | | | | | | | | | | $(794,822) | |
| | | | | | | | | | | | | | | | | | | | | | | | |
See Notes to Financial Statements.
| | | | | | |
| | | BLACKROCK SERIES FUND, INC. | | DECEMBER 31, 2015 | | 65 |
| | | | |
| Consolidated Schedule of Investments (continued) | | | BlackRock Global Allocation Portfolio | |
OTC Interest Rate Swaptions Written
| | | | | | | | | | | | | | | | | | | | | | | | |
| Description | | Counterparty | | Put/ Call | | Exercise Rate | | Pay/Receive
Exercise Rate | | Floating Rate
Index | | Expiration
Date | | Notional
Amount
(000) | | | Value | |
10-Year Interest Rate Swap | | Goldman Sachs
International | | Call | | 1.80% | | Pay | | 3-month LIBOR | | 1/19/16 | | | USD | | | | 7,430 | | | | $ (209 | ) |
2-Year Forward/1-Year Interest Rate Swap | | Deutsche Bank AG | | Put | | 2.35% | | Receive | | 3-month LIBOR | | 5/13/16 | | | USD | | | | 6,198 | | | | (4,540 | ) |
Total | | | | | | | | | | | | | | | | | | | | | | | $(4,749 | ) |
| | | | | | | | | | | | | | | | | | | | | | | | |
Centrally Cleared Credit Default Swaps — Buy Protection
| | | | | | | | | | | | | | | | | | |
| Index | | Pay
Fixed
Rate | | Expiration
Date | | | Notional
Amount
(000) | | | Unrealized
Depreciation | |
CDX.NA.HY Series 25 Version 1 | | 5.00% | | | 12/20/20 | | | | USD | | | | 935 | | | | $(18,883 | ) |
Centrally Cleared Credit Default Swaps — Sell Protection
| | | | | | | | | | | | | | | | | | |
| Issuer/Index | | Receive
Fixed
Rate | | Expiration
Date | | Credit
Rating1 | | Notional
Amount
(000)2 | | | Unrealized
Appreciation
(Depreciation) | |
CDX.NA.IG Series 25 Version 1 | | 1.00% | | 12/20/20 | | BBB+ | | | USD | | | | 1,411 | | | | $(3,088 | ) |
iTraxx Crossover Series 24 Version 1 | | 5.00% | | 12/20/20 | | B+ | | | EUR | | | | 624 | | | | 6,284 | |
Total | | | | | | | | | | | | | | | | | $ 3,196 | |
| | | | | | | | | | | | | | | | | | |
| | 1 | | Using S&P’s rating of the issuer or the underlying securities of the index, as applicable. |
| | 2 | | The maximum potential amount the Fund may pay should a negative credit event take place as defined under the terms of the agreement. |
Centrally Cleared Interest Rate Swaps
| | | | | | | | | | | | | | |
Fixed
Rate | | Floating Rate | | Effective
Date | | Expiration
Date | | Notional Amount (000) | | | Unrealized
Appreciation
(Depreciation) | |
1.03%1 | | 3-month LIBOR | | N/A | | 3/11/17 | | | USD 5,880 | | | | $(24,337 | ) |
0.75%1 | | 3-month LIBOR | | N/A | | 3/11/17 | | | USD 2,027 | | | | 332 | |
1.08%1 | | 3-month LIBOR | | N/A | | 4/07/17 | | | USD 13,120 | | | | (46,493 | ) |
0.77%1 | | 3-month LIBOR | | N/A | | 4/07/17 | | | USD 2,015 | | | | 2,281 | |
1.88%2 | | 3-month LIBOR | | N/A | | 3/11/20 | | | USD 2,420 | | | | 39,908 | |
1.95%1 | | 3-month LIBOR | | N/A | | 9/11/22 | | | USD 1,240 | | | | (9,727 | ) |
1.64%1 | | 3-month LIBOR | | N/A | | 10/19/22 | | | USD 1,240 | | | | 19,922 | |
1.83%1 | | 3-month LIBOR | | N/A | | 11/03/22 | | | USD 1,240 | | | | 5,817 | |
2.22%2 | | 3-month LIBOR | | N/A | | 4/07/25 | | | USD 2,630 | | | | 30,809 | |
1.55%2 | | 6-month EURIBOR | | 10/20/203 | | 10/20/25 | | | EUR 2,477 | | | | (13,207 | ) |
Total | | | | | | | | | | | | | $ 5,305 | |
| | | | | | | | | | | | | | |
| | 1 | | Fund pays the fixed rate and receives the floating rate. |
| | 2 | | Fund pays the floating rate and receives the fixed rate. |
OTC Currency Swaps
| | | | | | | | | | | | | | | | | | | | | | | | | | | | |
| | | | | Notional Amount (000) | | | | | | | | | | | | | |
Fund
Pays | | Fund
Receives | | Fund Pays | | | Fund Receives | | Counterparty | | Expiration
Date | | Value | | | Premiums
Paid
(Received) | | | Unrealized Appreciation | |
0.10% | | 1.23% | | | USD | | | | 431 | | | JPY 51,850 | | Bank of
America N.A. | | 3/15/2017 | | | $507 | | | | — | | | | $507 | |
See Notes to Financial Statements.
| | | | | | |
| 66 | | BLACKROCK SERIES FUND, INC. | | DECEMBER 31, 2015 | | |
| | | | |
| Consolidated Schedule of Investments (continued) | | | BlackRock Global Allocation Portfolio | |
OTC Interest Rate Swaps
| | | | | | | | | | | | | | | | | | | | | | | | | | |
Fixed Rate | | Floating Rate | | Counterparty | | Expiration
Date | | Notional Amount (000) | | | Value | | | Premiums
Paid
(Received) | | | Unrealized
Appreciation | |
2.06%1 | | 6-month WIBOR | | Deutsche Bank AG | | 3/17/20 | | | PLN | | | | 777 | | | | $3,550 | | | | — | | | | $3,550 | |
2.05%1 | | 6-month WIBOR | | Deutsche Bank AG | | 3/19/20 | | | PLN | | | | 259 | | | | 1,218 | | | | — | | | | 1,218 | |
Total | | | | | | | | | | | | | | | | | $4,768 | | | | — | | | | $4,768 | |
| | | | | | | | | | | | | | | | | | |
| | 1 | | Fund pays the floating rate and receives the fixed rate. |
OTC Total Return Swaps
| | | | | | | | | | | | | | | | | | | | |
| Reference Entity | | Fixed Rate
(Amount)/
Floating Rate | | Counterparty | | Expiration
Date | | Notional Amount
(000)/Contract
Amount | | Value | | | Premiums
Paid
(Received) | | | Unrealized
Appreciation
(Depreciation) | |
Siloam International Hospitals | | 1-month LIBOR plus
0.50%1 | | Credit Suisse
International | | 2/08/16 | | USD 66 | | | $ 866 | | | | — | | | | $ 866 | |
SGX Nikkei Stock Average Dividend Point Index Future December 2015 | | JPY 13,175,0002 | | BNP Paribas S.A. | | 3/31/16 | | JPY 53 | | | 26,166 | | | | — | | | | 26,166 | |
SGX Nikkei Stock Average Dividend Point Index Future December 2015 | | JPY 13,400,0002 | | BNP Paribas S.A. | | 3/31/16 | | JPY 53 | | | 24,294 | | | | — | | | | 24,294 | |
SGX Nikkei Stock Average Dividend Point Index Future December 2016 | | JPY 13,925,0002 | | BNP Paribas S.A. | | 3/31/17 | | JPY 53 | | | 37,023 | | | | — | | | | 37,023 | |
SGX Nikkei Stock Average Dividend Point Index Future December 2016 | | JPY 14,175,0002 | | BNP Paribas S.A. | | 3/31/17 | | JPY 53 | | | 34,943 | | | | — | | | | 34,943 | |
EURO STOXX 50 Index Dividend Future December 2017 | | EUR 114,2002 | | BNP Paribas S.A. | | 12/15/17 | | EUR 103 | | | (4,999 | ) | | | — | | | | (4,999 | ) |
EURO STOXX 50 Index Dividend Future December 2017 | | EUR 115,2732 | | BNP Paribas S.A. | | 12/15/17 | | EUR 103 | | | (6,165 | ) | | | — | | | | (6,165 | ) |
EURO STOXX 50 Index Dividend Future December 2018 | | EUR 113,4752 | | BNP Paribas S.A. | | 12/21/18 | | EUR 103 | | | (7,797 | ) | | | — | | | | (7,797 | ) |
EURO STOXX 50 Index Dividend Future December 2018 | | EUR 67,8002 | | BNP Paribas S.A. | | 12/21/18 | | EUR 63 | | | (4,369 | ) | | | — | | | | (4,369 | ) |
EURO STOXX 50 Index Dividend Future December 2018 | | EUR 55,9502 | | BNP Paribas S.A. | | 12/21/18 | | EUR 53 | | | (3,043 | ) | | | — | | | | (3,043 | ) |
Total | | | | | | | | | | | $96,919 | | | | — | | | | $96,919 | |
| | | | | | | | | | | | |
| | 1 | | Fund receives the total return of the reference entity and pays the floating rate. Net payment made at termination. |
| | 2 | | Fund receives the total return of the reference entity and pays the fixed amount. Net payment made at termination. |
See Notes to Financial Statements.
| | | | | | |
| | | BLACKROCK SERIES FUND, INC. | | DECEMBER 31, 2015 | | 67 |
| | | | |
| Consolidated Schedule of Investments (continued) | | | BlackRock Global Allocation Portfolio | |
|
| Transactions in Options Written for the Year Ended December 31, 2015 |
| | | | | | | | | | | | | | | | | | | | | | | | | | | | |
| | | Calls | | | Puts | |
| | | | | | | | |
| | | | | | Notional (000) | | | | | | | | | Notional (000) | | | | |
| | | Contracts | | | USD | | | Premiums
Received | | | Contracts | | | EUR | | | USD | | | Premiums
Received | |
| | | | | | | | |
Outstanding options, beginning of year | | | 518,173 | | | | 10,423 | | | $ | 420,841 | | | | 1,132,104 | | | | — | | | | — | | | $ | 628,940 | |
Options written | | | 806,836 | | | | 111,050 | | | | 983,200 | | | | 2,399,034 | | | | 2,477 | | | | 14,979 | | | | 1,324,413 | |
Options exercised | | | (56,260 | ) | | | — | | | | (131,670) | | | | (40,116 | ) | | | — | | | | — | | | | (115,152 | ) |
Options expired | | | (132,784 | ) | | | (35,000 | ) | | | (143,035) | | | | (51,139 | ) | | | — | | | | — | | | | (51,144 | ) |
Options closed | | | (832,506 | ) | | | (79,043 | ) | | | (783,719) | | | | (2,617,874 | ) | | | (2,477 | ) | | | (8,781 | ) | | | (1,137,201 | ) |
| | | | | | | | |
Outstanding options, end of year | | | 303,459 | | | | 7,430 | | | $ | 345,617 | | | | 822,009 | | | | — | | | | 6,198 | | | $ | 649,856 | |
| | | | | | | | |
As of December 31, 2015, the value of portfolio holdings subject to covered call options written was $4,836,915.
|
| Derivative Financial Instruments Categorized by Risk Exposure |
As of period end, the fair values of derivative financial instruments located in the Statements of Assets and Liabilities were as follows:
| | | | | | | | | | | | | | | | | | | | | | | | | | |
| Assets — Derivative Financial Instruments | | Commodity
Contracts | | Credit
Contracts | | | Equity
Contracts | | | Foreign
Currency
Exchange
Contracts | | | Interest
Rate
Contracts | | | Other
Contracts | | Total | |
Financial futures contracts | | Net unrealized appreciation1 | | — | | | — | | | $ | 7,541 | | | | — | | | | — | | | — | | $ | 7,541 | |
Forward foreign currency exchange contracts | | Unrealized appreciation on forward foreign currency exchange contracts | | — | | | — | | | | — | | | $ | 280,121 | | | | — | | | — | | | 280,121 | |
Options purchased | | Investments at value — unaffiliated2 | | — | | | — | | | | 1,258,960 | | | | — | | | $ | 18,955 | | | — | | | 1,277,915 | |
Swaps — centrally cleared | | Net unrealized appreciation1 | | — | | $ | 6,284 | | | | — | | | | — | | | | 99,069 | | | — | | | 105,353 | |
Swaps — OTC | | Unrealized appreciation on OTC swaps | | — | | | — | | | | 123,292 | | | | — | | | | 5,275 | | | — | | | 128,567 | |
| | | |
Total | | | | — | | $ | 6,284 | | | $ | 1,389,793 | | | $ | 280,121 | | | $ | 123,299 | | | — | | $ | 1,799,497 | |
| | | |
| | | | | | | | | | | | | | | | | | | | | | | | | | |
| Liabilities — Derivative Financial Instruments | | | | | | | | | | | | | | | | | | | |
Financial futures contracts | | Net unrealized depreciation1 | | — | | | — | | | $ | 64,208 | | | | — | | | | — | | | — | | $ | 64,208 | |
Forward foreign currency exchange contracts | | Unrealized depreciation on forward foreign currency exchange contracts | | — | | | — | | | | — | | | $ | 294,816 | | | | — | | | — | | | 294,816 | |
Options written | | Options written, at value | | — | | | — | | | | 906,176 | | | | — | | | $ | 4,749 | | | — | | | 910,925 | |
Swaps — centrally cleared | | Net unrealized depreciation1 | | — | | $ | 21,971 | | | | — | | | | — | | | | 93,764 | | | — | | | 115,735 | |
Swaps — OTC | | Unrealized depreciation on OTC swaps | | — | | | — | | | | 26,373 | | | | — | | | | — | | | — | | | 26,373 | |
| | | |
Total | | | | — | | $ | 21,971 | | | $ | 996,757 | | | $ | 294,816 | | | $ | 98,513 | | | — | | $ | 1,412,057 | |
| | | |
| | 1 | | Includes cumulative appreciation (depreciation) on financial futures contracts and centrally cleared swaps, if any, as reported in the Consolidated Schedule of Investments. Only current day’s variation margin is reported within the Consolidated Statements of Assets and Liabilities. |
| | 2 | | Includes options purchased at value as reported in the Consolidated Schedule of Investments. |
For the year ended December 31, 2015, the effect of derivative financial instruments in the Statements of Operations were as follows:
| | | | | | | | | | | | | | | | | | | | | | | | |
| Net Realized Gain (Loss) from: | | Commodity Contracts | | Credit
Contracts | | | Equity
Contracts | | | Foreign
Currency
Exchange
Contracts | | | Interest
Rate
Contracts | | | Other
Contracts | | Total | |
Financial futures contracts | | — | | | — | | | $ | 1,178,709 | | | | — | | | | — | | | — | | $ | 1,178,709 | |
Foreign currency transactions | | — | | | — | | | | — | | | $ | 3,214,635 | | | | — | | | — | | | 3,214,635 | |
Options purchased3 | | — | | | — | | | | (451,345 | ) | | | (124,135 | ) | | $ | (65,913 | ) | | — | | | (641,393 | ) |
Options written | | — | | | — | | | | 763,440 | | | | — | | | | 27,636 | | | — | | | 791,076 | |
Swaps | | — | | $ | 117,363 | | | | (641 | ) | | | — | | | | 145,111 | | | — | | | 261,833 | |
| | | |
Total | | — | | $ | 117,363 | | | $ | 1,490,163 | | | $ | 3,090,500 | | | $ | 106,834 | | | — | | $ | 4,804,860 | |
| | | |
| | | | | | | |
| | | | | | | | | | | | | | | | | | | | | | | | |
| Net Change in Unrealized Appreciation (Depreciation) on: | | | | | | | | | | | | | | | | | | | |
Financial futures contracts | | — | | | — | | | $ | 32,932 | | | | — | | | | — | | | — | | $ | 32,932 | |
Foreign currency translations | | — | | | — | | | | — | | | $ | (1,297,219 | ) | | | — | | | — | | | (1,297,219 | ) |
Options purchased3 | | — | | | — | | | | (1,197,636 | ) | | | 85,172 | | | $ | (63,929 | ) | | — | | | (1,176,393 | ) |
Options written | | — | | | — | | | | 488,277 | | | | — | | | | 46,315 | | | — | | | 534,592 | |
Swaps | | — | | $ | (105,002 | ) | | | 34,175 | | | | — | | | | (64,961 | ) | | — | | | (135,788 | ) |
| | | |
Total | | — | | $ | (105,002 | ) | | $ | (642,252 | ) | | $ | (1,212,047 | ) | | $ | (82,575 | ) | | — | | $ | (2,041,876 | ) |
| | | |
| | 3 | | Options purchased are included in the net realized gain (loss) from investments and the net change in unrealized appreciation (depreciation) on investments. |
See Notes to Financial Statements.
| | | | | | |
| 68 | | BLACKROCK SERIES FUND, INC. | | DECEMBER 31, 2015 | | |
| | | | |
| Consolidated Schedule of Investments (continued) | | | BlackRock Global Allocation Portfolio | |
| | |
| Average Quarterly Balances of Outstanding Derivative Financial Instruments | | |
| | | | |
| |
Financial futures contracts: | | | | |
Average notional value of contracts - long | | $ | 2,737,052 | |
Average notional value of contracts - short | | $ | 11,348,473 | |
Forward foreign currency exchange contracts: | | | | |
Average amounts purchased - in USD | | $ | 29,145,382 | |
Average amounts sold - USD | | $ | 5,346,133 | |
Options: | | | | |
Average value of option contracts purchased | | $ | 2,270,972 | |
Average value of option contracts written | | $ | 1,061,147 | |
Average notional value of swaption contracts purchased | | $ | 29,476,570 | |
Average notional value of swaption contracts written | | $ | 15,164,500 | |
Credit default swaps: | | | | |
Average notional value - buy protection | | $ | 437,250 | |
Average notional value - sell protection | | $ | 1,719,871 | |
Interest rate swaps: | | | | |
Average notional value - pays fixed rate | | $ | 26,313,500 | |
Average notional value - receives fixed rate | | $ | 10,816,121 | |
Currency swaps: | | | | |
Average notional value - pays | | $ | 431,000 | |
Average notional value - receives | | $ | 429,893 | |
Total return swaps: | | | | |
Average notional value | | $ | 1,006,543 | |
| |
For more information about the Fund’s investment risks regarding derivative financial instruments, refer to the Notes to Financial Statements.
|
| Derivative Financial Instruments - Offsetting as of Period End |
The Fund’s derivative assets and liabilities (by type) were as follows:
| | | | | | | | |
| |
| | | Assets | | | Liabilities | |
| |
Derivative Financial Instruments: | | | | | | | | |
Financial futures contracts | | | $ 71,355 | | | | — | |
Forward foreign currency exchange contracts | | | 280,121 | | | | $ 294,816 | |
Options | | | 1,277,915 | 1 | | | 910,925 | |
Swaps - Centrally cleared | | | 4,173 | | | | — | |
Swaps - OTC2 | | | 128,567 | | | | 26,373 | |
| | | | |
Total derivative assets and liabilities in the Statements of Assets and Liabilities | | | $1,762,131 | | | | $1,232,114 | |
Derivatives not subject to a Master Netting Agreement or similar agreement (“MNA”) | | | (92,740 | ) | | | (12,513 | ) |
| | | | |
Total derivative assets and liabilities subject to an MNA | | | $1,669,391 | | | | $1,219,601 | |
| | | | |
| | 1 | | Includes options purchased at value which is included in Investments at value - unaffiliated in the Consolidated Statements of Assets and Liabilities and reported in the Consolidated Schedule of Investments. |
| | 2 | | Includes unrealized appreciation (depreciation) on OTC swaps in the Consolidated Statements of Assets and Liabilities. |
See Notes to Financial Statements.
| | | | | | |
| | | BLACKROCK SERIES FUND, INC. | | DECEMBER 31, 2015 | | 69 |
| | | | |
| Consolidated Schedule of Investments (continued) | | | BlackRock Global Allocation Portfolio | |
The following tables present the Fund’s derivative assets and liabilities by counterparty net of amounts available for offset under an MNA and net of the related collateral received and pledged by the Fund.
| | | | | | | | | | |
| Counterparty | | Derivative Assets
Subject to an MNA by
Counterparty | | Derivatives Available
for Offset1 | | Non-cash
Collateral
Received | | Cash
Collateral
Received2 | | Net Amount of
Derivative Assets3 |
Bank of America N.A. | | $ 115,039 | | $ (11,880) | | — | | — | | $103,159 |
Barclays Bank PLC | | 38,496 | | (10,684) | | — | | — | | 27,812 |
BNP Paribas S.A. | | 158,471 | | (44,976) | | — | | — | | 113,495 |
Citibank N.A. | | 111,383 | | (111,383) | | — | | — | | — |
Credit Suisse International | | 134,553 | | (69,616) | | — | | — | | 64,937 |
Deutsche Bank AG | | 532,053 | | (379,795) | | — | | $ (90,000) | | 62,258 |
Goldman Sachs International | | 285,855 | | (131,218) | | — | | (154,637) | | — |
HSBC Bank USA N.A. | | 285 | | (285) | | — | | — | | — |
JPMorgan Chase Bank N.A. | | 58,901 | | (37,477) | | — | | — | | 21,424 |
Morgan Stanley & Co. International PLC | | 144,752 | | (144,752) | | — | | — | | — |
Morgan Stanley Capital Services LLC | | 37,698 | | (37,698) | | — | | — | | — |
Société Générale | | 4,889 | | (274) | | — | | — | | 4,615 |
UBS AG | | 47,016 | | (30,407) | | — | | — | | 16,609 |
| | |
Total | | $1,669,391 | | $(1,010,445) | | — | | $(244,637) | | $414,309 |
| | |
| | |
| Counterparty | | Derivative Liabilities
Subject to an MNA by
Counterparty | | Derivatives Available
for Offset1 | | Non-cash
Collateral
Pledged | | Cash
Collateral
Pledged | | Net Amount of
Derivative Liabilities4 |
Bank of America N.A. | | $ 11,880 | | $ (11,880) | | — | | — | | — |
Barclays Bank PLC | | 10,684 | | (10,684) | | — | | — | | — |
BNP Paribas S.A. | | 44,976 | | (44,976) | | — | | — | | — |
Citibank N.A. | | 145,031 | | (111,383) | | — | | — | | $ 33,648 |
Credit Suisse International | | 69,616 | | (69,616) | | — | | — | | — |
Deutsche Bank AG | | 379,795 | | (379,795) | | — | | — | | — |
Goldman Sachs International | | 131,218 | | (131,218) | | — | | — | | — |
HSBC Bank USA N.A. | | 28,146 | | (285) | | — | | — | | 27,861 |
JPMorgan Chase Bank N.A. | | 37,477 | | (37,477) | | — | | — | | — |
Morgan Stanley & Co. International PLC | | 257,934 | | (144,752) | | — | | — | | 113,182 |
Morgan Stanley Capital Services LLC | | 72,163 | | (37,698) | | — | | — | | 34,465 |
Société Générale | | 274 | | (274) | | — | | — | | — |
UBS AG | | 30,407 | | (30,407) | | — | | — | | — |
| | |
Total | | $1,219,601 | | $(1,010,445) | | — | | — | | $209,156 |
| | |
| | 1 | | The amount of derivatives available for offset is limited to the amount of assets and/or liabilities that are subject to an MNA. |
| | 2 | | Excess collateral received from the individual counterparty is not shown for financial reporting purposes. |
| | 3 | | Net amount represents the net amount receivable from the counterparty in the event of default. |
| | 4 | | Net amount represents the net amount payable due to the counterparty in the event of default. Net amount may be offset further by the options written receivable/payable on the Statements of Assets and Liabilities. |
|
| Fair Value Hierarchy as of Period End |
Various inputs are used in determining the fair value of investments and derivative financial instruments. For information about the Fund’s policy regarding valuation of investments and derivative financial instruments, refer to the Notes to Financial Statements.
See Notes to Financial Statements.
| | | | | | |
| 70 | | BLACKROCK SERIES FUND, INC. | | DECEMBER 31, 2015 | | |
| | | | |
| Consolidated Schedule of Investments (continued) | | | BlackRock Global Allocation Portfolio | |
The following tables summarize the Fund’s investments and derivative financial instruments in the disclosure hierarchy:
| | | | | | | | | | | | | | | | |
| |
| | | Level 1 | | | Level 2 | | | Level 3 | | | Total | |
| |
Assets: | | | | | | | | | | | | | | | | |
Investments: | | | | | | | | | | | | | | | | |
Long-Term Investments: | | | | | | | | | | | | | | | | |
Common Stocks: | | | | | | | | | | | | | | | | |
Australia | | | — | | | $ | 313,502 | | | | — | | | $ | 313,502 | |
Austria | | | — | | | | 12,376 | | | | — | | | | 12,376 | |
Belgium | | $ | 36,190 | | | | 216,536 | | | | — | | | | 252,726 | |
Brazil | | | 190,577 | | | | — | | | | — | | | | 190,577 | |
Canada | | | 2,054,672 | | | | — | | | | — | | | | 2,054,672 | |
China | | | 352,143 | | | | 315,944 | | | | — | | | | 668,087 | |
Cyprus | | | 9,713 | | | | — | | | | — | | | | 9,713 | |
Egypt | | | 39,372 | | | | — | | | | — | | | | 39,372 | |
France | | | 311,942 | | | | 5,554,889 | | | | — | | | | 5,866,831 | |
Germany | | | — | | | | 1,752,651 | | | | — | | | | 1,752,651 | |
Hong Kong | | | — | | | | 1,944,184 | | | | — | | | | 1,944,184 | |
India | | | — | | | | 936,000 | | | | — | | | | 936,000 | |
Indonesia | | | — | | | | 82,328 | | | | — | | | | 82,328 | |
Ireland | | | 229,595 | | | | 173,715 | | | | — | | | | 403,310 | |
Israel | | | 1,052,349 | | | | — | | | | — | | | | 1,052,349 | |
Italy | | | 184,009 | | | | 1,482,279 | | | | — | | | | 1,666,288 | |
Japan | | | 149,965 | | | | 19,774,194 | | | | — | | | | 19,924,159 | |
Kazakhstan | | | 56,505 | | | | — | | | | — | | | | 56,505 | |
Luxembourg | | | — | | | | 44,636 | | | | — | | | | 44,636 | |
Malaysia | | | 213,331 | | | | 138,221 | | | | — | | | | 351,552 | |
Mexico | | | 630,129 | | | | — | | | | — | | | | 630,129 | |
Netherlands | | | 364,651 | | | | 2,337,615 | | | | — | | | | 2,702,266 | |
Norway | | | — | | | | 499,880 | | | | — | | | | 499,880 | |
Peru | | | 358,131 | | | | — | | | | — | | | | 358,131 | |
Portugal | | | — | | | | 180,405 | | | | — | | | | 180,405 | |
Singapore | | | 10,741 | | | | 1,530,578 | | | | — | | | | 1,541,319 | |
South Korea | | | — | | | | 1,088,856 | | | | — | | | | 1,088,856 | |
Spain | | | — | | | | 1,476,231 | | | | — | | | | 1,476,231 | |
Sweden | | | — | | | | 241,623 | | | | — | | | | 241,623 | |
Switzerland | | | 7,689 | | | | 3,104,625 | | | | — | | | | 3,112,314 | |
Taiwan | | | — | | | | 389,541 | | | | — | | | | 389,541 | |
Thailand | | | 293,600 | | | | — | | | | — | | | | 293,600 | |
United Arab Emirates | | | 226,936 | | | | 176,247 | | | | — | | | | 403,183 | |
United Kingdom | | | 1,345,352 | | | | 6,264,999 | | | $ | 161,809 | | | | 7,772,160 | |
United States | | | 63,713,397 | | | | — | | | | 16,643 | | | | 63,730,040 | |
Corporate Bonds | | | — | | | | 12,552,600 | | | | 2,148,560 | | | | 14,701,160 | |
Floating Rate Loan Interests | | | — | | | | 2,202,407 | | | | 332,042 | | | | 2,534,449 | |
Foreign Agency Obligations | | | — | | | | 1,255,831 | | | | — | | | | 1,255,831 | |
Foreign Government Obligations | | | — | | | | 10,858,403 | | | | — | | | | 10,858,403 | |
Investment Companies | | | 2,080,418 | | | | — | | | | — | | | | 2,080,418 | |
Non-Agency Mortgage-Backed Securities | | | — | | | | — | | | | 197,226 | | | | 197,226 | |
Preferred Securities | | | 3,815,751 | | | | 4,833,336 | | | | 3,021,877 | | | | 11,670,964 | |
Rights | | | — | | | | — | | | | — | | | | — | |
U.S. Government Sponsored Agency Securities | | | — | | | | 870,008 | | | | — | | | | 870,008 | |
U.S. Treasury Obligations | | | — | | | | 19,172,138 | | | | — | | | | 19,172,138 | |
Warrants | | | 41,036 | | | | — | | | | — | | | | 41,036 | |
Short-Term Securities: | | | | | | | | | | | | | | | | |
Foreign Agency Obligations | | | — | | | | 11,412,134 | | | | — | | | | 11,412,134 | |
Money Market Funds | | | 661,486 | | | | 4,986,152 | | | | — | | | | 5,647,638 | |
Time Deposits | | | — | | | | 27,475 | | | | — | | | | 27,475 | |
U.S. Treasury Obligations | | | — | | | | 32,660,001 | | | | — | | | | 32,660,001 | |
Options Purchased: | | | | | | | | | | | | | | | | |
Equity Contracts | | | 17,212 | | | | 1,215,393 | | | | 26,355 | | | | 1,258,960 | |
Interest Rate Contracts | | | — | | | | 18,955 | | | | — | | | | 18,955 | |
Liabilities: | | | | | | | | | | | | | | | | |
Investments: | | | | | | | | | | | | | | | | |
Investments Sold Short | | | (490,388 | ) | | | (118,639 | ) | | | — | | | | (609,027 | ) |
| | | | |
Total | | $ | 77,956,504 | | | $ | 151,978,249 | | | $ | 5,904,512 | | | $ | 235,839,265 | |
| | | | |
See Notes to Financial Statements.
| | | | | | |
| | | BLACKROCK SERIES FUND, INC. | | DECEMBER 31, 2015 | | 71 |
| | |
| Consolidated Schedule of Investments (continued) | | BlackRock Global Allocation Portfolio |
| | | | | | | | | | | | | | | | |
| | | Level 1 | | | Level 2 | | | Level 3 | | | Total | |
Derivative Financial Instruments1 | | | | | | | | | | | | | | | | |
Assets: | | | | | | | | | | | | | | | | |
Credit contracts | | | — | | | $ | 6,284 | | | | — | | | $ | 6,284 | |
Equity contracts | | $ | 7,541 | | | | 123,292 | | | | — | | | | 130,833 | |
Foreign currency exchange contracts | | | — | | | | 280,121 | | | | — | | | | 280,121 | |
Interest rate contracts | | | — | | | | 104,344 | | | | — | | | | 104,344 | |
Liabilities: | | | | | | | | | | | | | | | | |
Credit contracts | | | — | | | | (21,971 | ) | | | — | | | | (21,971 | ) |
Equity contracts | | | (76,721 | ) | | | (901,912 | ) | | $ | (18,124 | ) | | | (996,757 | ) |
Foreign currency exchange contracts | | | — | | | | (294,816 | ) | | | — | | | | (294,816 | ) |
Interest rate contracts | | | — | | | | (98,513 | ) | | | — | | | | (98,513 | ) |
| | | | |
Total | | $ | (69,180 | ) | | $ | (803,171 | ) | | $ | (18,124 | ) | | $ | (890,475 | ) |
| | | | |
| | | | | | | | | | | | | | | | |
1 Derivative financial instruments are swaps, financial futures contracts, forward foreign currency exchange contracts and options written. Swaps, financial futures contracts and forward foreign currency exchange contracts are valued at the unrealized appreciation (depreciation) on the instrument and options written are shown at value. | |
|
| The Fund may hold assets and/or liabilities in which the fair value approximates the carrying amount for financial statement purposes. As of period end, such assets and/or liabilities are categorized within the disclosure hierarchy as follows: | |
| | | | | | | | | | | | | | | | |
| | | Level 1 | | | Level 2 | | | Level 3 | | | Total | |
Assets: | | | | | | | | | | | | | | | | |
Cash | | $ | 5,150 | | | | — | | | | — | | | $ | 5,150 | |
Cash held for securities sold short | | | 577,245 | | | | — | | | | — | | | | 577,245 | |
Foreign currency at value | | | 9,236 | | | | — | | | | — | | | | 9,236 | |
Cash pledged for centrally cleared swaps | | | 156,750 | | | | — | | | | — | | | | 156,750 | |
Liabilities: | | | | | | | | | | | | | | | | |
Cash received as collateral for OTC derivatives | | | — | | | $ | (390,000 | ) | | | — | | | | (390,000 | ) |
Collateral on securities loaned at value | | | — | | | | (4,986,152 | ) | | | — | | | | (4,986,152 | ) |
| | | | |
Total | | $ | 748,381 | | | $ | (5,376,152 | ) | | | — | | | $ | (4,627,771 | ) |
| | | | |
| | | | | | | | | | | | | | | | |
|
| During the year ended December 31, 2015, there were no transfers between Level 1 and Level 2. | |
A reconciliation of Level 3 investments and derivative financial instruments is presented when the Fund had a significant amount of Level 3 investments and derivative financial instruments at the beginning and/or end of the year in relation to net assets. The following table is a reconciliation of Level 3 investments for which significant unobservable inputs were used in determining fair value: | |
| | | | | | | | | | | | | | | | | | | | | | | | | | | | |
| | | Common
Stocks | | | Corporate
Bonds | | | Floating
Rate Loan
Interests | | | Non-Agency
Mortgage-
Backed
Securities | | | Preferred
Securities | | | Options
Purchased | | | Total | |
Assets: | | | | | | | | | | | | | | | | | | | | | | | | | | | | |
Opening balance, as of December 31, 2014 | | $ | 211,645 | | | $ | 1,141,486 | | | $ | 457,843 | | | | — | | | $ | 2,276,451 | | | | — | | | $ | 4,087,425 | |
Transfers into Level 3 | | | — | | | | 94,029 | | | | — | | | | — | | | | — | | | | — | | | | 94,029 | |
Transfers out of Level 3 | | | — | | | | (359,520 | ) | | | (277,698 | ) | | | — | | | | (129,630 | ) | | | — | | | | (766,848 | ) |
Accrued discounts/premiums | | | — | | | | 2,909 | | | | 426 | | | | $ 1,127 | | | | — | | | | — | | | | 4,462 | |
Net realized gain (loss) | | | — | | | | 167 | | | | 268 | | | | — | | | | �� | | | | | | | | 435 | |
Net change in unrealized appreciation (depreciation)2,3 | | | (49,836 | ) | | | 216,657 | | | | 6,885 | | | | (13,817 | ) | | | 366,662 | | | | $ 795 | | | | 527,346 | |
Purchases | | | 16,643 | | | | 1,054,661 | | | | 355,494 | | | | 209,916 | | | | 508,394 | | | | 25,560 | | | | 2,170,668 | |
Sales | | | — | | | | (1,829 | ) | | | (211,176 | ) | | | — | | | | — | | | | — | | | | (213,005 | ) |
| | | | |
Closing balance, as of December 31, 2015 | | $ | 178,452 | | | $ | 2,148,560 | | | $ | 332,042 | | | | $197,226 | | | $ | 3,021,877 | | | | $26,355 | | | $ | 5,904,512 | |
| | | | |
Net change in unrealized appreciation (depreciation) on investments still held at December 31, 20153 | | $ | (49,836 | ) | | $ | 216,657 | | | $ | 5,893 | | | | $ (13,817 | ) | | $ | 366,662 | | | | $ 795 | | | $ | 526,354 | |
| | | | |
2 Included in the related change in unrealized appreciation (depreciation) in the Consolidated Statements of Operations. | |
3 Any difference between net change in unrealized appreciation (depreciation) and net change in unrealized appreciation (depreciation) on investments still held at December 31, 2015 is generally due to investments no longer held or categorized as Level 3 at period end. | |
See Notes to Financial Statements.
| | | | | | |
| 72 | | BLACKROCK SERIES FUND, INC. | | DECEMBER 31, 2015 | | |
| | |
| Consolidated Schedule of Investments (concluded) | | BlackRock Global Allocation Portfolio |
The following table is a reconciliation of Level 3 derivative financial instruments for which significant unobservable inputs were used in determining fair value:
| | | | |
| |
| | | Equity Contracts | |
| | | | |
| | | Liabilities | |
| |
Opening balance, as of December 31, 2014 | | | — | |
Transfers into Level 3 | | | — | |
Transfers out of Level 3 | | | — | |
Accrued discounts/premiums | | | — | |
Net realized gain (loss) | | | — | |
Net change in unrealized appreciation (depreciation)1,2 | | | $ 845 | |
Purchases | | | (18,969 | ) |
Issues | | | — | |
Sales | | | — | |
| | | | |
Closing balance, as of December 31, 2015 | | | $(18,124 | ) |
| | | | |
Net change in unrealized appreciation (depreciation) on derivative financial instruments still held at December 31, 20152 | | | $ 845 | |
| | | | |
| | 1 | | Included in the related change in unrealized appreciation (depreciation) in the Consolidated Statements of Operations. |
| | 2 | | Any difference between net change in unrealized appreciation (depreciation) and net change in unrealized appreciation (depreciation) on derivative financial instruments still held at December 31, 2015 is generally due to derivative financial instruments no longer held or categorized as Level 3 at period end. |
The Fund’s investments that are categorized as Level 3 were valued utilizing third party pricing information without adjustment. Such valuations are based on unobservable inputs. A significant change in third party information could result in a significantly lower or higher value of such Level 3 investments.
The following table summarizes the valuation techniques used and unobservable inputs utilized by the BlackRock Global Valuation Methodologies Committee (“Global Valuation Committee”) to determine the value of certain of the Fund’s Level 3 investments as of period end. The table does not include Level 3 investments with values based upon unadjusted third party pricing information in the amount of $608,851.
| | | | | | | | | | | | | | | | |
| |
| | | Value | | | Valuation Techniques | | Unobservable Inputs | | Range of
Unobservable Inputs
Utilized | | | Weighted Average of
Unobservable Inputs | |
| |
Assets: | | | | | | | | | | | | | | | | |
Common Stocks4 | | | $ 178,452 | | | Market Comparables | | Run Rate EBITDA Multiple2 | | | 21.00x | | | | | |
| | | | | | Last Transaction Price | | Transaction Price1 | | | $11.42 | | | | | |
Corporate Bonds3 | | | 2,095,332 | | | Discounted Cash Flow | | Discount Rate2 | | | 15.00% | | | | | |
| | | | | | Estimated Recovery Value | | Recovery Rate1 | | | — | | | | | |
| | | | | | Market Comparables | | Run Rate EBITDA Multiple2 | | | 21.00x | | | | | |
| | | | | | Hybrid Approach | | Revenue Multiple1 | | | 3.06x - 3.74x | | | | | |
| | | | | | | | Risk Free Rate2 | | | 0.46% - 0.75% | | | | | |
| | | | | | | | Merger & Acquisition Probability1 | | | 50.00% | | | | | |
| | | | | | | | IPO Exit Probability1 | | | 50.00% | | | | | |
| | | | | | | | Volatility1 | | | 47.00% | | | | | |
| | | | | | | | Time to Exit2 | | | 1-2 years | | | | | |
Preferred Stocks4 | | | 3,021,877 | | | Market Comparables | | Revenue Multiple1 | | | 32.79x | | | | | |
| | | | | | | | Revenue Growth Rate1 | | | 373.00% | | | | | |
| | | | | | | | Revenue Multiple1 | | | 6.50x - 22.92x | | | | 15.24x | |
| | | | | | | | Revenue Growth Rate1 | | | 64.10% - 94.00% | | | | 80.01 | % |
| | | | | | Last Transaction Price | | Transaction Price1 | | | $11.42 | | | | | |
| | | | | | Probability-Weighted Expected Return Model | | Discount Rate2 | | | 20.00% - 25.00% | | | | 21.29 | % |
| | | | | | | | IPO Exit Probability1 | | | 70.00% - 85.00% | | | | 81.14 | % |
| | | | | | | | Revenue Growth Rate1 | | | 55.77% - 159.00% | | | | 132.46 | % |
| | | | | | | | Revenue Multiple1 | | | 7.00x - 15.00x | | | | | |
| | | | | | | | Revenue Multiple1 | | | 16.75x - 26.75x | | | | | |
| | | | | | | | Time to Exit2 | | | 1-2 years | | | | | |
| | | | |
Total | | | $5,295,661 | | | | | | | | | | | | | |
| | | | |
| | 1 | | Increase in unobservable input may result in a significant increase to value, while a decrease in unobservable input may result in a significant decrease to value. |
| | 2 | | Decrease in unobservable input may result in a significant increase to value, while an increase in unobservable input may result in a significant decrease to value. |
| | 3 | | For the period ended December 31, 2015, the valuation technique for certain investments classified as corporate bonds changed to a Hybrid Approach. The investment was previously valued utilizing a market comparable and option pricing model approach. A Hybrid Approach was considered to be a more relevant measure of fair value for this investment, which leverages the market comparables and option pricing model approach previously used along with a Probability-Weighted Expected Return Model. |
| | 4 | | For the period ended December 31, 2015, the valuation technique for certain investments classified as common stocks and preferred stocks changed to Last Transaction Price. The investments were previously valued utilizing an income approach. Last Transaction Price was considered to be a more relevant measure of fair value for these investments which leverages the most recent market transactions. |
See Notes to Financial Statements.
| | | | | | |
| | | BLACKROCK SERIES FUND, INC. | | DECEMBER 31, 2015 | | 73 |
| | |
| Schedule of Investments December 31, 2015 | | BlackRock Government Money Market Portfolio |
| | (Percentages shown are based on Net Assets) |
| | | | | | | | |
| U.S. Government Sponsored Agency Securities | | Par (000) | | | Value | |
Fannie Mae Discount Notes: (a) | | | | | | | | |
0.13%, 1/14/16 | | $ | 1,000 | | | $ | 999,964 | |
0.30%, 1/20/16 | | | 350 | | | | 349,953 | |
0.13%, 2/10/16 | | | 2,837 | | | | 2,836,621 | |
Fannie Mae Variable Rate Notes: (b) | | | | | | | | |
0.42%, 07/20/17 | | | 2,000 | | | | 1,999,820 | |
0.35%, 08/16/17 | | | 1,500 | | | | 1,499,755 | |
0.28%, 10/05/17 | | | 1,000 | | | | 999,732 | |
Federal Farm Credit Bank Variable Rate Notes: (b) | | | | | | | | |
0.33%, 11/14/16 | | | 2,000 | | | | 1,999,445 | |
0.36%, 3/16/17 | | | 2,000 | | | | 1,999,138 | |
0.42%, 9/22/17 | | | 2,000 | | | | 1,999,826 | |
0.47%, 11/20/17 | | | 1,000 | | | | 999,652 | |
0.24%, 1/23/18 | | | 430 | | | | 430,009 | |
Federal Home Loan Bank Discount Notes: (a) | | | | | | | | |
0.11%, 1/08/16 | | | 7,000 | | | | 6,999,918 | |
0.28%, 1/14/16 | | | 400 | | | | 399,969 | |
0.14%, 1/20/16 | | | 3,300 | | | | 3,299,608 | |
0.15%, 1/29/16 | | | 4,900 | | | | 4,899,490 | |
0.19%, 2/03/16 | | | 3,000 | | | | 2,999,525 | |
0.23%, 2/10/16 | | | 2,000 | | | | 1,999,538 | |
0.30%, 2/17/16 | | | 500 | | | | 499,817 | |
0.23%, 2/19/16 | | | 6,500 | | | | 6,498,064 | |
0.29%, 2/26/16 | | | 1,500 | | | | 1,499,360 | |
0.32%, 3/02/16 | | | 3,000 | | | | 2,998,478 | |
0.44%, 3/28/16 | | | 500 | | | | 499,487 | |
0.39%, 5/26/16 | | | 1,000 | | | | 998,451 | |
Federal Home Loan Bank Variable Rate Notes: (b) | | | | | | | | |
0.34%, 11/25/16 | | | 2,000 | | | | 2,000,000 | |
0.18%, 02/07/17 | | | 1,000 | | | | 999,826 | |
0.34%, 08/25/17 | | | 880 | | | | 880,000 | |
Freddie Mac Discount Notes: (a) | | | | | | | | |
0.22%, 1/05/16 | | | 4,000 | | | | 3,999,976 | |
0.16%, 1/15/16 | | | 2,000 | | | | 1,999,902 | |
0.30%, 1/20/16 | | | 200 | | | | 199,973 | |
0.20%, 2/05/16 | | | 1,450 | | | | 1,449,742 | |
0.20%, 2/17/16 | | | 2,000 | | | | 1,999,511 | |
0.19%, 2/25/16 | | | 1,675 | | | | 1,674,540 | |
0.23%, 3/10/16 | | | 1,500 | | | | 1,499,368 | |
0.30%, 3/21/16 | | | 4,000 | | | | 3,997,476 | |
Total U.S. Government Sponsored Agency Securities — 56.0% | | | | 70,405,934 | |
| | | | | | | | |
| U.S. Treasury Obligations | | | | | | |
U.S. Treasury Bills, 0.60%, 6/16/16 (a) | | | 7,000 | | | | 6,981,345 | |
U.S. Treasury Notes: | | | | | | | | |
4.50%, 2/15/16 | | | 3,000 | | | | 3,014,707 | |
0.33%, 4/30/17 (b) | | | 2,000 | | | | 1,999,946 | |
0.43%, 10/31/17 (b) | | | 1,249 | | | | 1,247,965 | |
Total U.S. Treasury Obligations — 10.6% | | | | | | | 13,243,963 | |
| | | | | | | | |
| | | | | | | |
| | | | | | | | |
| Repurchase Agreements | | Par (000) | | | Value | |
Bank of Montreal,
0.28%, 1/04/16
(Purchased on 12/31/15 to be repurchased at $6,723,209, collateralized by various U.S. treasury obligations, 1.25% to 2.25% due from 1/31/20 to 2/15/25, aggregate original par and fair value of $6,805,304 and $6,857,556, respectively) | |
$ |
6,723 |
| |
$ |
6,723,000 |
|
Total Value of Bank of Montreal (collateral value of $6,857,556) | | | | | | | 6,723,000 | |
BNP Paribas Securities Corp.,
0.31%, 1/04/16
(Purchased on 12/31/15 to be repurchased at $6,000,207, collateralized by various U.S. government sponsored agency obligations, 1.88% to 5.50% due from 2/20/39 to 3/15/44, aggregate original par and fair value of $7,316,635 and $6,120,001, respectively) | |
|
6,000 |
| |
|
6,000,000 |
|
Total Value of BNP Paribas Securities Corp. (collateral value of $6,120,001) | | | | | | | 6,000,000 | |
Goldman Sachs & Co.,
0.34%, 1/05/16
(Purchased on 12/29/15 to be repurchased at $4,000,264, collateralized by various U.S. government sponsored agency obligations, 4.00% to 5.00% due from 8/20/33 to 11/20/45, aggregate original par and fair value of $12,833,547 and $4,080,000, respectively) | |
|
4,000 |
| |
|
4,000,000 |
|
Total Value of Goldman Sachs & Co. (collateral value of $4,080,000) | | | | | | | 4,000,000 | |
JP Morgan Securities LLC,
0.32%, 1/04/16
(Purchased on 12/31/15 to be repurchased at $9,000,320, collateralized by a U.S. treasury obligation, 1.75% due at 2/28/22, aggregate original par and fair value of $9,285,000 and $9,184,436, respectively) | | ��
|
9,000 |
| |
|
9,000,000 |
|
Total Value of JP Morgan Securities LLC (collateral value of $9,184,436) | | | | | | | 9,000,000 | |
See Notes to Financial Statements.
| | | | | | |
| 74 | | BLACKROCK SERIES FUND, INC. | | DECEMBER 31, 2015 | | |
| | | | |
| Schedule of Investments (concluded) | | | BlackRock Government Money Market Portfolio | |
| | | | | | | | |
| Repurchase Agreements | | Par (000) | | | Value | |
Merrill Lynch, Pierce, Fenner & Smith, Inc., 0.31%, 1/04/16
(Purchased on 12/31/15 to be repurchased at $10,000,344, collateralized by a U.S. government sponsored agency obligation, 3.50% due at 3/20/45, aggregate original par and fair value of $10,660,253 and $10,200,001, respectively) | | $ | 10,000 | | | $ | 10,000,000 | |
Total Value of Merrill Lynch, Pierce, Fenner & Smith, Inc. (collateral value of $10,200,001) | | | | | | | 10,000,000 | |
Mizuho Securities USA, Inc., 0.27%, 1/04/16
(Purchased on 12/31/15 to be repurchased at $3,000,090, collateralized by a U.S. government sponsored agency obligation, 3.50% due at 8/20/45, aggregate original par and fair value of $25,565,379 and $3,330,000, respectively) | | | 3,000 | | | | 3,000,000 | |
Total Value of Mizuho Securities USA, Inc. (collateral value of $3,330,000) | | | | | | | 3,000,000 | |
| |
| | | | | | | | |
| Repurchase Agreements | | Par
(000) | | | Value | |
Morgan Stanley & Co. LLC, 0.29%, 1/04/16
(Purchased on 12/31/15 to be repurchased at $3,000,097, collateralized by various U.S. government sponsored agency obligations, 2.57% to 9.50% due from 4/01/18 to 3/01/45, aggregate original par and fair value of $3,934,729 and $3,090,000, respectively) | | $ | 3,000 | | | $ | 3,000,000 | |
Total Value of Morgan Stanley & Co. LLC (collateral value of $3,090,000) | | | | | | | 3,000,000 | |
Total Repurchase Agreements — 33.2% | | | | | | | 41,723,000 | |
Total Investments (Cost — $125,372,897*) — 99.8% | | | | | | | 125,372,897 | |
Other Assets Less Liabilities — 0.2% | | | | | | | 267,803 | |
| | | | | | | | |
Net Assets — 100.0% | | | | | | $ | 125,640,700 | |
| | | | | | | | |
|
| Notes to Schedule of Investments |
| * | Cost for federal income tax purposes. |
| (a) | Rates are discount rates or a range of discount rates at the time of purchase. |
| (b) | Variable rate security. Rate as of period end. |
|
| Fair Value Hierarchy as of Period End |
Various inputs are used in determining the fair value of investments. For information about the Fund’s policy regarding valuation of investments, refer to the Notes to Financial Statements.
The following table summarizes the Fund’s investments categorized in the disclosure hierarchy:
| | | | | | | | | | | | | | | | | | | | | | | | |
| |
| | | Level 1 | | | | | | Level 2 | | | Level 3 | | | | | | Total | |
| |
Assets: | | | | | | | | | | | | | | | | | | | | | | | | |
Investments: | | | | | | | | | | | | | | | | | | | | | | | | |
Short-Term Securities1 | | | — | | | $ | | | | | 125,372,897 | | | | — | | | $ | | | | | 125,372,897 | |
| |
| | 1 | | See above Schedule of Investments for values in each security type. |
During the year ended December 31, 2015, there were no transfers between levels.
See Notes to Financial Statements.
| | | | | | |
| | | BLACKROCK SERIES FUND, INC. | | DECEMBER 31, 2015 | | 75 |
| | | | |
| Schedule of Investments December 31, 2015 | | | BlackRock High Yield Portfolio | |
| | | (Percentages shown are based on Net Assets) | |
| | | | | | | | |
| Common Stocks | | Shares | | | Value | |
Capital Markets — 1.5% | | | | | | | | |
American Capital Ltd. (a) | | | 34,630 | | | $ | 477,548 | |
Chemicals — 0.0% | | | | | | | | |
Advanced Emissions Solutions, Inc. (a) | | | 660 | | | | 4,712 | |
Communications Equipment — 0.3% | | | | | | | | |
Nokia OYJ — ADR | | | 13,999 | | | | 98,273 | |
Consumer Finance — 1.4% | | | | | | | | |
Ally Financial, Inc. (a) | | | 17,050 | | | | 317,812 | |
Ally Financial, Inc. (a) | | | 6,472 | | | | 120,638 | |
| | | | | | | | |
| | | | | | | | 438,450 | |
Diversified Telecommunication Services — 0.0% | | | | | | | | |
Broadview Networks Holdings, Inc. (a) | | | 5,362 | | | | 7,775 | |
Hotels, Restaurants & Leisure — 0.7% | | | | | | | | |
Amaya, Inc. (a) | | | 18,250 | | | | 229,889 | |
Insurance — 0.3% | | | | | | | | |
American International Group, Inc. | | | 1,350 | | | | 83,659 | |
Real Estate Investment Trusts (REITs) — 0.0% | | | | | | | | |
Ovation Acquisition I, LLC (Acquired 12/28/15,
cost $195) (a)(b) | | | 195 | | | | 195 | |
Wireless Telecommunication Services — 0.2% | | | | | | | | |
T-Mobile U.S., Inc. (a) | | | 1,150 | | | | 44,988 | |
Total Common Stocks — 4.4% | | | | | | | 1,385,489 | |
| | | | | | | | |
| | | | | | | | | | | | |
| Corporate Bonds | | | | | Par (000) | | | | |
Aerospace & Defense — 1.0% | | | | | | | | | | | | |
Bombardier, Inc., 7.50%, 3/15/25 (c) | | | USD | | | | 29 | | | | 20,300 | |
TransDigm, Inc.: | | | | | | | | | | | | |
5.50%, 10/15/20 | | | | | | | 19 | | | | 18,383 | |
6.00%, 7/15/22 | | | | | | | 174 | | | | 170,085 | |
6.50%, 7/15/24 | | | | | | | 124 | | | | 123,318 | |
| | | | | | | | | | | | |
| | | | | | | | | | | | 332,086 | |
Air Freight & Logistics — 0.9% | | | | | | | | | | | | |
WFS Global Holding SAS, 9.50%, 7/15/22 | | | EUR | | | | 100 | | | | 113,798 | |
XPO Logistics, Inc.: | | | | | | | | | | | | |
7.88%, 9/01/19 (c) | | | USD | | | | 85 | | | | 86,425 | |
6.50%, 6/15/22 (c) | | | | | | | 77 | | | | 71,225 | |
| | | | | | | | | | | | |
| | | | | | | | | | | | 271,448 | |
Airlines — 1.6% | | | | | | | | | | | | |
Air Medical Merger Sub Corp., 6.38%, 5/15/23 (c) | | | | | | | 26 | | | | 23,140 | |
American Airlines Pass-Through Trust, Series 2013-2, Class C, 6.00%, 1/15/17 (c) | | | | | | | 197 | | | | 201,305 | |
Continental Airlines Pass-Through Certificates, Series 2012-3, Class C, 6.13%, 4/29/18 | | | | | | | 120 | | | | 122,400 | |
National Air Cargo Group, Inc.: | | | | | | | | | | | | |
11.88%, 5/02/18 | | | | | | | 36 | | | | 35,686 | |
11.88%, 5/08/18 | | | | | | | 37 | | | | 36,572 | |
Virgin Australia Trust, Series 2013-1C, 7.13%, 10/23/18 (c) | | | | | | | 83 | | | | 84,100 | |
| | | | | | | | | | | | |
| | | | | | | | | | | | 503,203 | |
| | | | | | | | | | | | |
| Corporate Bonds | | | | | Par
(000) | | | Value | |
Auto Components — 0.9% | | | | | | | | | | | | |
Affinia Group, Inc., 7.75%, 5/01/21 | | | USD | | | | 15 | | | $ | 15,267 | |
Goodyear Tire & Rubber Co., 6.50%, 3/01/21 | | | | | | | 60 | | | | 63,075 | |
Icahn Enterprises LP/Icahn Enterprises Finance Corp.: | | | | | | | | | | | | |
6.00%, 8/01/20 | | | | | | | 5 | | | | 5,042 | |
5.88%, 2/01/22 | | | | | | | 108 | | | | 105,570 | |
ZF North America Capital, Inc., 2.75%, 4/27/23 | | | EUR | | | | 100 | | | | 103,742 | |
| | | | | | | | | | | | |
| | | | | | | | | | | | 292,696 | |
Banks — 1.3% | | | | | | | | | | | | |
Banco Espirito Santo SA, 4.75%, 1/15/18 (a)(d) | | | | | | | 100 | | | | 12,389 | |
Bankia SA, 4.00%, 5/22/24 (e) | | | | | | | 100 | | | | 107,725 | |
CIT Group, Inc., 5.00%, 8/01/23 | | | USD | | | | 160 | | | | 162,400 | |
UniCredit SpA, 6.95%, 10/31/22 | | | EUR | | | | 100 | | | | 126,993 | |
| | | | | | | | | | | | |
| | | | | | | | | | | | 409,507 | |
Beverages — 0.0% | | | | | | | | | | | | |
Constellation Brands, Inc., 4.25%, 5/01/23 | | | USD | | | | 10 | | | | 10,000 | |
Building Products — 1.5% | | | | | | | | | | | | |
Builders FirstSource, Inc., 10.75%, 8/15/23 (c) | | | | | | | 14 | | | | 13,895 | |
Building Materials Corp. of America, 6.00%, 10/15/25 (c) | | | | | | | 105 | | | | 107,100 | |
CPG Merger Sub LLC, 8.00%, 10/01/21 (c) | | | | | | | 92 | | | | 90,160 | |
Hillman Group, Inc., 6.38%, 7/15/22 (c) | | | | | | | 30 | | | | 24,900 | |
Masonite International Corp., 5.63%, 3/15/23 (c) | | | | | | | 27 | | | | 27,877 | |
Ply Gem Industries, Inc., 6.50%, 2/01/22 | | | | | | | 105 | | | | 96,075 | |
USG Corp.: | | | | | | | | | | | | |
9.75%, 1/15/18 | | | | | | | 80 | | | | 89,000 | |
5.88%, 11/01/21 (c) | | | | | | | 8 | | | | 8,320 | |
5.50%, 3/01/25 (c) | | | | | | | 10 | | | | 10,150 | |
| | | | | | | | | | | | |
| | | | | | | | | | | | 467,477 | |
Capital Markets — 0.4% | | | | | | | | | | | | |
E*TRADE Financial Corp.: | | | | | | | | | | | | |
0.00%, 8/31/19 (c)(f)(g) | | | | | | | 37 | | | | 107,458 | |
5.38%, 11/15/22 | | | | | | | 24 | | | | 25,140 | |
Series A, 0.00%, 8/31/19 (f)(g) | | | | | | | 1 | | | | 2,904 | |
| | | | | | | | | | | | |
| | | | | | | | | | | | 135,502 | |
Chemicals — 0.7% | | | | | | | | | | | | |
Chemours Co., 7.00%, 5/15/25 (c) | | | | | | | 20 | | | | 13,650 | |
Huntsman International LLC, 4.88%, 11/15/20 | | | | | | | 41 | | | | 37,413 | |
Momentive Performance Materials, Inc.: | | | | | | | | | | | | |
3.88%, 10/24/21 | | | | | | | 82 | | | | 56,580 | |
Escrow, 8.88%, 10/15/20 (a)(d) | | | | | | | 82 | | | | — | |
Platform Specialty Products Corp.: | | | | | | | | | | | | |
10.38%, 5/01/21 (c) | | | | | | | 6 | | | | 5,985 | |
6.50%, 2/01/22 (c) | | | | | | | 109 | | | | 94,285 | |
WR Grace & Co-Conn, 5.13%, 10/01/21 (c) | | | | | | | 8 | | | | 8,080 | |
| | | | | | | | | | | | |
| | | | | | | | | | | | 215,993 | |
Commercial Services & Supplies — 0.9% | | | | | | | | | | | | |
Acosta, Inc., 7.75%, 10/01/22 (c) | | | | | | | 55 | | | | 48,537 | |
ADS Waste Holdings, Inc., 8.25%, 10/01/20 | | | | | | | 33 | | | | 33,247 | |
Ceridian HCM Holding, Inc., 11.00%, 3/15/21 (c) | | | | | | | 28 | | | | 21,980 | |
See Notes to Financial Statements.
| | | | | | |
| 76 | | BLACKROCK SERIES FUND, INC. | | DECEMBER 31, 2015 | | |
| | | | |
| Schedule of Investments (continued) | | | BlackRock High Yield Portfolio | |
| | | | |
| | | | | | | | | | | | |
| Corporate Bonds | | | | | Par
(000) | | | Value | |
Commercial Services & Supplies (continued) | | | | | | | | | | | | |
Igloo Holdings Corp., 8.25% (8.25% Cash or 9.00% PIK), 12/15/17 (c)(h) | | | USD | | | | 30 | | | $ | 30,000 | |
Laureate Education, Inc., 9.25%, 9/01/19 (c) | | | | | | | 24 | | | | 14,880 | |
Mobile Mini, Inc., 7.88%, 12/01/20 | | | | | | | 50 | | | | 51,750 | |
Safway Group Holding LLC/Safway Finance Corp., 7.00%, 5/15/18 (c) | | | | | | | 15 | | | | 14,963 | |
WaveDivision Escrow LLC/WaveDivision Escrow Corp., 8.13%, 9/01/20 (c) | | | | | | | 62 | | | | 59,287 | |
| | | | | | | | | | | | |
| | | | | | | | | | | | 274,644 | |
Communications Equipment — 1.7% | | | | | | | | | | | | |
Alcatel-Lucent USA, Inc., 6.45%, 3/15/29 | | | | | | | 232 | | | | 234,900 | |
Blue Coat Holdings, Inc., 8.38%, 6/01/23 (c) | | | | | | | 48 | | | | 48,240 | |
CommScope Technologies Finance LLC, 6.00%, 6/15/25 (c) | | | | | | | 49 | | | | 47,163 | |
CommScope, Inc.: | | | | | | | | | | | | |
4.38%, 6/15/20 (c) | | | | | | | 42 | | | | 42,315 | |
5.50%, 6/15/24 (c) | | | | | | | 48 | | | | 45,600 | |
Nokia OYJ, 6.63%, 5/15/39 | | | | | | | 67 | | | | 68,550 | |
Riverbed Technology, Inc., 8.88%, 3/01/23 (c) | | | | | | | 61 | | | | 56,425 | |
| | | | | | | | | | | | |
| | | | | | | | | | | | 543,193 | |
Construction & Engineering — 1.1% | | | | | | | | | | | | |
AECOM, 5.88%, 10/15/24 | | | | | | | 44 | | | | 44,880 | |
Aguila 3 SA, 7.88%, 1/31/18 (c) | | | | | | | 150 | | | | 150,375 | |
Aldesa Financial Services SA, 7.25%, 4/01/21 | | | EUR | | | | 100 | | | | 84,495 | |
Brand Energy & Infrastructure Services, Inc., 8.50%, 12/01/21 (c) | | | USD | | | | 31 | | | | 26,660 | |
Modular Space Corp., 10.25%, 1/31/19 (c) | | | | | | | 121 | | | | 48,400 | |
| | | | | | | | | | | | |
| | | | | | | | | | | | 354,810 | |
Construction Materials — 0.0% | | | | | | | | | | | | |
Vulcan Materials Co., 7.50%, 6/15/21 | | | | | | | 2 | | | | 2,330 | |
Consumer Finance — 1.5% | | | | | | | | | | | | |
Ally Financial, Inc.: | | | | | | | | | | | | |
5.13%, 9/30/24 | | | | | | | 48 | | | | 49,140 | |
4.63%, 3/30/25 | | | | | | | 44 | | | | 43,450 | |
8.00%, 11/01/31 | | | | | | | 292 | | | | 337,260 | |
DFC Finance Corp., 10.50%, 6/15/20 (c) | | | | | | | 40 | | | | 23,600 | |
Navient Corp.: | | | | | | | | | | | | |
5.50%, 1/25/23 | | | | | | | 5 | | | | 4,000 | |
6.13%, 3/25/24 | | | | | | | 5 | | | | 4,075 | |
5.88%, 10/25/24 | | | | | | | 5 | | | | 4,000 | |
| | | | | | | | | | | | |
| | | | | | | | | | | | 465,525 | |
Containers & Packaging — 0.6% | | | | | | | | | | | | |
Ball Corp., 4.38%, 12/15/20 | | | | | | | 15 | | | | 15,234 | |
Beverage Packaging Holdings Luxembourg II SA: | | | | | | | | | | | | |
5.63%, 12/15/16 (c) | | | | | | | 14 | | | | 13,843 | |
6.00%, 6/15/17 (c) | | | | | | | 20 | | | | 19,350 | |
Reynolds Group Issuer, Inc., 5.75%, 10/15/20 | | | | | | | 67 | | | | 68,152 | |
Sealed Air Corp.: | | | | | | | | | | | | |
4.88%, 12/01/22 (c) | | | | | | | 21 | | | | 21,053 | |
5.13%, 12/01/24 (c) | | | | | | | 40 | | | | 40,000 | |
6.88%, 7/15/33 (c) | | | | | | | 20 | | | | 20,450 | |
| | | | | | | | | | | | |
| | | | | | | | | | | | 198,082 | |
Distributors — 0.3% | | | | | | | | | | | | |
American Tire Distributors, Inc., 10.25%, 3/01/22 (c) | | | | | | | 95 | | | | 86,925 | |
Diversified Consumer Services — 0.2% | | | | | | | | | | | | |
Service Corp. International, 5.38%, 5/15/24 | | | | | | | 47 | | | | 48,410 | |
Diversified Financial Services — 0.7% | | | | | | | | | | | | |
Altice Financing SA, 6.63%, 2/15/23 (c) | | | | | | | 200 | | | | 197,500 | |
MSCI, Inc., 5.75%, 8/15/25 (c) | | | | | | | 28 | | | | 28,700 | |
| | | | | | | | | | | | 226,200 | |
| | | | | | | | | | | | |
| Corporate Bonds | | | | | Par
(000) | | | Value | |
Diversified Telecommunication Services — 6.0% | | | | | | | | | | | | |
Avaya, Inc.: | | | | | | | | | | | | |
7.00%, 4/01/19 (c) | | | USD | | | | 28 | | | $ | 20,720 | |
10.50%, 3/01/21 (c) | | | | | | | 28 | | | | 9,520 | |
CenturyLink, Inc., Series S, 6.45%, 6/15/21 | | | | | | | 15 | | | | 14,625 | |
Frontier Communications Corp.: | | | | | | | | | | | | |
6.25%, 9/15/21 | | | | | | | 40 | | | | 33,900 | |
7.13%, 1/15/23 | | | | | | | 40 | | | | 34,500 | |
7.63%, 4/15/24 | | | | | | | 33 | | | | 27,720 | |
6.88%, 1/15/25 | | | | | | | 59 | | | | 48,601 | |
11.00%, 9/15/25 (c) | | | | | | | 35 | | | | 34,650 | |
Intelsat Jackson Holdings SA: | | | | | | | | | | | | |
6.63%, 12/15/22 | | | | | | | 31 | | | | 19,763 | |
5.50%, 8/01/23 | | | | | | | 129 | | | | 101,265 | |
Level 3 Financing, Inc.: | | | | | | | | | | | | |
6.13%, 1/15/21 | | | | | | | 10 | | | | 10,350 | |
5.38%, 8/15/22 | | | | | | | 31 | | | | 31,465 | |
5.63%, 2/01/23 | | | | | | | 86 | | | | 87,720 | |
5.13%, 5/01/23 (c) | | | | | | | 78 | | | | 77,415 | |
5.38%, 1/15/24 (c) | | | | | | | 33 | | | | 33,165 | |
5.38%, 5/01/25 (c) | | | | | | | 205 | | | | 203,975 | |
Telecom Italia Capital SA: | | | | | | | | | | | | |
6.00%, 9/30/34 | | | | | | | 60 | | | | 55,350 | |
7.20%, 7/18/36 | | | | | | | 20 | | | | 20,200 | |
Telecom Italia SpA, 3.25%, 1/16/23 | | | EUR | | | | 100 | | | | 110,089 | |
Telenet Finance III Luxembourg SCA, 6.63%, 2/15/21 | | | | | | | 100 | | | | 112,207 | |
Virgin Media Secured Finance PLC, 5.25%, 1/15/26 (c) | | | USD | | | | 200 | | | | 194,500 | |
Wind Acquisition Finance SA, 4.00%, 7/15/20 | | | EUR | | | | 110 | | | | 118,945 | |
Zayo Group LLC/Zayo Capital, Inc.: | | | | | | | | | | | | |
10.13%, 7/01/20 | | | USD | | | | 139 | | | | 149,773 | |
6.00%, 4/01/23 | | | | | | | 149 | | | | 140,805 | |
6.38%, 5/15/25 | | | | | | | 50 | | | | 46,500 | |
Ziggo Bond Finance BV, 5.88%, 1/15/25 (c) | | | | | | | 200 | | | | 185,500 | |
| | | | | | | | | | | | |
| | | | | | | | | | | | 1,923,223 | |
Electric Utilities — 0.3% | | | | | | | | | | | | |
Texas Competitive Electric Holdings Co. | | | | | | | | | | | | |
LLC/TCEH Finance, Inc.: | | | | | | | | | | | | |
10.25%, 11/01/15 (a)(d) | | | | | | | 9 | | | | 585 | |
10.50% (10.50% Cash or 11.25% PIK), 11/01/16 (a)(d)(h) | | | | | | | 1,546 | | | | 100,490 | |
| | | | | | | | | | | | |
| | | | | | | | | | | | 101,075 | |
Electrical Equipment — 0.2% | | | | | | | | | | | | |
GrafTech International Ltd., 6.38%, 11/15/20 | | | | | | | 17 | | | | 9,860 | |
Sensata Technologies BV: | | | | | | | | | | | | |
5.63%, 11/01/24 (c) | | | | | | | 17 | | | | 17,383 | |
5.00%, 10/01/25 (c) | | | | | | | 38 | | | | 37,145 | |
| | | | | | | | | | | | |
| | | | | | | | | | | | 64,388 | |
Electronic Equipment, Instruments & Components — 0.5% | | | | | | | | | |
CDW LLC/CDW Finance Corp.: | | | | | | | | | | | | |
6.00%, 8/15/22 | | | | | | | 30 | | | | 31,650 | |
5.00%, 9/01/23 | | | | | | | 26 | | | | 26,390 | |
5.50%, 12/01/24 | | | | | | | 112 | | | | 117,320 | |
| | | | | | | | | | | | |
| | | | | | | | | | | | 175,360 | |
Energy Equipment & Services — 0.3% | | | | | | | | | | | | |
Transocean, Inc.: | | | | | | | | | | | | |
3.00%, 10/15/17 | | | | | | | 35 | | | | 31,041 | |
6.00%, 3/15/18 | | | | | | | 50 | | | | 44,500 | |
6.50%, 11/15/20 | | | | | | | 15 | | | | 10,350 | |
4.30%, 10/15/22 | | | | | | | 5 | | | | 2,650 | |
| | | | | | | | | | | | |
| | | | | | | | | | | | 88,541 | |
See Notes to Financial Statements.
| | | | | | |
| | | BLACKROCK SERIES FUND, INC. | | DECEMBER 31, 2015 | | 77 |
| | | | |
| Schedule of Investments (continued) | | | BlackRock High Yield Portfolio | |
| | | | |
| | | | | | | | | | | | |
| Corporate Bonds | | | | | Par (000) | | | Value | |
Food & Staples Retailing — 0.9% | | | | | | | | | | | | |
Rite Aid Corp.: | | | | | | | | | | | | |
9.25%, 3/15/20 | | | USD | | | | 20 | | | $ | 21,150 | |
6.75%, 6/15/21 | | | | | | | 37 | | | | 38,757 | |
6.13%, 4/01/23 (c) | | | | | | | 195 | | | | 201,825 | |
7.70%, 2/15/27 | | | | | | | 15 | | | | 17,475 | |
| | | | | | | | | | | | |
| | | | | | | | | | | | 279,207 | |
Food Products — 0.6% | | | | | | | | | | | | |
JBS USA LLC/JBS USA Finance, Inc., 5.75%, 6/15/25 (c) | | | | | | | 41 | | | | 35,670 | |
Post Holdings, Inc.: | | | | | | | | | | | | |
7.75%, 3/15/24 (c) | | | | | | | 82 | | | | 85,895 | |
8.00%, 7/15/25 (c) | | | | | | | 32 | | | | 33,920 | |
Smithfield Foods, Inc., 5.88%, 8/01/21 (c) | | | | | | | 11 | | | | 11,330 | |
WhiteWave Foods Co., 5.38%, 10/01/22 | | | | | | | 25 | | | | 26,437 | |
| | | | | | | | | | | | |
| | | | | | | | | | | | 193,252 | |
Health Care Equipment & Supplies — 0.7% | | | | | | | | | | | | |
Alere, Inc.: | | | | | | | | | | | | |
7.25%, 7/01/18 | | | | | | | 30 | | | | 30,675 | |
6.50%, 6/15/20 | | | | | | | 13 | | | | 12,480 | |
6.38%, 7/01/23 (c) | | | | | | | 40 | | | | 37,400 | |
DJO Finco, Inc./DJO Finance LLC/DJO Finance Corp., 8.13%, 6/15/21 (c) | | | | | | | 101 | | | | 89,637 | |
Hologic, Inc., 5.25%, 7/15/22 (c) | | | | | | | 59 | | | | 60,180 | |
| | | | | | | | | | | | |
| | | | | | | | | | | | 230,372 | |
Health Care Providers & Services — 4.8% | | | | | | | | | | | | |
Acadia Healthcare Co., Inc.: | | | | | | | | | | | | |
5.13%, 7/01/22 | | | | | | | 25 | | | | 23,375 | |
5.63%, 2/15/23 | | | | | | | 19 | | | | 17,955 | |
Amsurg Corp., 5.63%, 7/15/22 | | | | | | | 138 | | | | 136,620 | |
Centene Corp., 4.75%, 5/15/22 | | | | | | | 46 | | | | 44,505 | |
CHS/Community Health Systems, Inc., 6.88%, 2/01/22 | | | | | | | 37 | | | | 35,104 | |
DaVita HealthCare Partners, Inc.: | | | | | | | | | | | | |
5.13%, 7/15/24 | | | | | | | 70 | | | | 70,000 | |
5.00%, 5/01/25 | | | | | | | 90 | | | | 86,850 | |
Envision Healthcare Corp., 5.13%, 7/01/22 (c) | | | | | | | 45 | | | | 44,100 | |
ExamWorks Group, Inc., 5.63%, 4/15/23 | | | | | | | 35 | | | | 34,825 | |
Fresenius Medical Care U.S. Finance II, Inc., 4.75%, 10/15/24 (c) | | | | | | | 39 | | | | 38,025 | |
Fresenius U.S. Finance II, Inc., 4.50%, 1/15/23 (c) | | | | | | | 19 | | | | 19,190 | |
HCA Holdings, Inc., 6.25%, 2/15/21 | | | | | | | 10 | | | | 10,575 | |
HCA, Inc.: | | | | | | | | | | | | |
7.50%, 2/15/22 | | | | | | | 133 | | | | 147,297 | |
5.88%, 3/15/22 | | | | | | | 38 | | | | 40,090 | |
4.75%, 5/01/23 | | | | | | | 23 | | | | 22,770 | |
5.00%, 3/15/24 | | | | | | | 47 | | | | 46,883 | |
5.38%, 2/01/25 | | | | | | | 157 | | | | 155,037 | |
5.25%, 4/15/25 | | | | | | | 28 | | | | 28,210 | |
5.88%, 2/15/26 | | | | | | | 48 | | | | 48,180 | |
Series 1, 5.88%, 5/01/23 | | | | | | | 36 | | | | 36,900 | |
HealthSouth Corp.: | | | | | | | | | | | | |
5.75%, 11/01/24 | | | | | | | 28 | | | | 26,705 | |
5.75%, 11/01/24 (c) | | | | | | | 25 | | | | 23,844 | |
5.75%, 9/15/25 (c) | | | | | | | 30 | | | | 27,900 | |
MEDNAX, Inc., 5.25%, 12/01/23 (c) | | | | | | | 26 | | | | 26,130 | |
MPH Acquisition Holdings LLC, 6.63%, 4/01/22 (c) | | | | | | | 25 | | | | 25,063 | |
Surgical Care Affiliates, Inc., 6.00%, 4/01/23 (c) | | | | | | | 17 | | | | 16,575 | |
Tenet Healthcare Corp.: | | | | | | | | | | | | |
4.75%, 6/01/20 | | | | | | | 40 | | | | 40,200 | |
4.50%, 4/01/21 | | | | | | | 16 | | | | 15,600 | |
4.38%, 10/01/21 | | | | | | | 3 | | | | 2,895 | |
| | | | | | | | | | | | |
| Corporate Bonds | | | | | Par (000) | | | Value | |
Health Care Providers & Services (continued) | | | | | | | | | | | | |
8.13%, 4/01/22 | | | USD | | | | 105 | | | $ | 104,737 | |
6.75%, 6/15/23 | | | | | | | 68 | | | | 63,070 | |
Truven Health Analytics, Inc., 10.63%, 6/01/20 | | | | | | | 40 | | | | 40,200 | |
WellCare Health Plans, Inc., 5.75%, 11/15/20 | | | | | | | 21 | | | | 21,630 | |
| | | | | | | | | | | | |
| | | | | | | | | | | | 1,521,040 | |
Hotels, Restaurants & Leisure — 3.0% | | | | | | | | | | | | |
Aramark Services, Inc., 5.13%, 1/15/24 (c) | | | | | | | 33 | | | | 33,619 | |
BC ULC/New Red Finance, Inc., 6.00%, 4/01/22 (c) | | | | | | | 50 | | | | 51,500 | |
Boyd Gaming Corp., 6.88%, 5/15/23 | | | | | | | 122 | | | | 125,355 | |
Caesars Entertainment Resort Properties LLC, 8.00%, 10/01/20 | | | | | | | 60 | | | | 57,000 | |
MGM Resorts International: | | | | | | | | | | | | |
5.25%, 3/31/20 | | | | | | | 17 | | | | 16,830 | |
6.75%, 10/01/20 | | | | | | | 60 | | | | 61,650 | |
6.63%, 12/15/21 | | | | | | | 49 | | | | 50,164 | |
7.75%, 3/15/22 | | | | | | | 26 | | | | 27,625 | |
6.00%, 3/15/23 | | | | | | | 110 | | | | 109,175 | |
Pinnacle Entertainment, Inc., 6.38%, 8/01/21 | | | | | | | 75 | | | | 78,844 | |
Snai SpA, 7.63%, 6/15/18 | | | EUR | | | | 100 | | | | 103,868 | |
Station Casinos LLC, 7.50%, 3/01/21 | | | USD | | | | 93 | | | | 94,860 | |
Sterling Entertainment Enterprises LLC, 9.75%, 11/25/19 (c) | | | | | | | 150 | | | | 148,500 | |
| | | | | | | | | | | | |
| | | | | | | | | | | | 958,990 | |
Household Durables — 1.2% | | | | | | | | | | | | |
Beazer Homes USA, Inc.: | | | | | | | | | | | | |
6.63%, 4/15/18 | | | | | | | 9 | | | | 9,101 | |
7.50%, 9/15/21 | | | | | | | 17 | | | | 15,597 | |
CalAtlantic Group, Inc.: | | | | | | | | | | | | |
6.63%, 5/01/20 | | | | | | | 6 | | | | 6,540 | |
8.38%, 1/15/21 | | | | | | | 109 | | | | 126,440 | |
Jarden Corp., 5.00%, 11/15/23 (c) | | | | | | | 20 | | | | 20,450 | |
K. Hovnanian Enterprises, Inc., 7.25%, 10/15/20 (c) | | | | | | | 3 | | | | 2,580 | |
KB Home, 4.75%, 5/15/19 | | | | | | | 20 | | | | 19,400 | |
Lennar Corp.: | | | | | | | | | | | | |
4.50%, 11/15/19 | | | | | | | 18 | | | | 18,304 | |
4.75%, 11/15/22 | | | | | | | 4 | | | | 3,966 | |
4.88%, 12/15/23 | | | | | | | 34 | | | | 33,830 | |
PulteGroup, Inc., 6.38%, 5/15/33 | | | | | | | 10 | | | | 10,150 | |
Shea Homes LP/Shea Homes Funding Corp., 6.13%, 4/01/25 (c) | | | | | | | 46 | | | | 47,265 | |
TRI Pointe Holdings, Inc.: | | | | | | | | | | | | |
4.38%, 6/15/19 | | | | | | | 30 | | | | 29,325 | |
5.88%, 6/15/24 | | | | | | | 35 | | | | 34,037 | |
| | | | | | | | | | | | |
| | | | | | | | | | | | 376,985 | |
Household Products — 0.6% | | | | | | | | | | | | |
HRG Group, Inc., 7.88%, 7/15/19 (c) | | | | | | | 26 | | | | 27,170 | |
Spectrum Brands, Inc.: | | | | | | | | | | | | |
6.63%, 11/15/22 | | | | | | | 40 | | | | 42,200 | |
6.13%, 12/15/24 (c) | | | | | | | 53 | | | | 55,120 | |
5.75%, 7/15/25 (c) | | | | | | | 63 | | | | 64,575 | |
| | | | | | | | | | | | |
| | | | | | | | | | | | 189,065 | |
Independent Power and Renewable Electricity Producers — 1.1% | | | | | |
AES Corp., 5.50%, 3/15/24 | | | | | | | 7 | | | | 6,247 | |
Calpine Corp.: | | | | | | | | | | | | |
6.00%, 1/15/22 (c) | | | | | | | 10 | | | | 10,322 | |
5.38%, 1/15/23 | | | | | | | 6 | | | | 5,385 | |
5.88%, 1/15/24 (c) | | | | | | | 30 | | | | 30,750 | |
5.50%, 2/01/24 | | | | | | | 165 | | | | 145,613 | |
Dynegy, Inc., 6.75%, 11/01/19 | | | | | | | 65 | | | | 61,100 | |
See Notes to Financial Statements.
| | | | | | |
| 78 | | BLACKROCK SERIES FUND, INC. | | DECEMBER 31, 2015 | | |
| | | | |
| Schedule of Investments (continued) | | | BlackRock High Yield Portfolio | |
| | | | |
| | | | | | | | | | | | |
| Corporate Bonds | | | | | Par (000) | | | Value | |
Independent Power and Renewable Electricity Producers (continued) | | | | | |
NRG Energy, Inc.: | | | | | | | | | | | | |
6.25%, 7/15/22 | | | USD | | | | 26 | | | $ | 22,152 | |
6.63%, 3/15/23 | | | | | | | 3 | | | | 2,603 | |
6.25%, 5/01/24 | | | | | | | 44 | | | | 36,969 | |
NRG Yield Operating LLC, 5.38%, 8/15/24 | | | | | | | 30 | | | | 24,863 | |
TerraForm Power Operating LLC, 6.13%, 6/15/25 (c) | | | | | | | 13 | | | | 10,465 | |
| | | | | | | | | | | | |
| | | | | | | | | | | | 356,469 | |
Insurance — 0.3% | | | | | | | | | | | | |
CNO Financial Group, Inc., 4.50%, 5/30/20 | | | | | | | 13 | | | | 13,260 | |
Genworth Holdings, Inc., 4.80%, 2/15/24 | | | | | | | 25 | | | | 16,875 | |
HUB International Ltd., 7.88%, 10/01/21 (c) | | | | | | | 46 | | | | 41,400 | |
Radian Group, Inc., 5.25%, 6/15/20 | | | | | | | 38 | | | | 36,754 | |
| | | | | | | | | | | | |
| | | | | | | | | | | | 108,289 | |
Internet & Catalog Retail — 0.2% | | | | | | | | | | | | |
Netflix, Inc., 5.38%, 2/01/21 | | | | | | | 60 | | | | 63,000 | |
IT Services — 0.4% | | | | | | | | | | | | |
Alliance Data Systems Corp., 5.38%, 8/01/22 (c) | | | | | | | 35 | | | | 33,337 | |
Sabre GLBL, Inc.: | | | | | | | | | | | | |
5.38%, 4/15/23 (c) | | | | | | | 34 | | | | 33,830 | |
5.25%, 11/15/23 (c) | | | | | | | 14 | | | | 13,843 | |
WEX, Inc., 4.75%, 2/01/23 (c) | | | | | | | 50 | | | | 45,500 | |
| | | | | | | | | | | | |
| | | | | | | | | | | | 126,510 | |
Life Sciences Tools & Services — 0.7% | | | | | | | | | | | | |
Crimson Merger Sub, Inc., 6.63%, 5/15/22 (c) | | | | | | | 85 | | | | 58,225 | |
DPx Holdings BV, 7.50%, 2/01/22 (c) | | | | | | | 35 | | | | 34,125 | |
Jaguar Holding Co. II/Pharmaceutical Product Development LLC, 6.38%, 8/01/23 (c) | | | | | | | 117 | | | | 114,075 | |
Sterigenics-Nordion Holdings LLC, 6.50%, 5/15/23 (c) | | | | | | | 12 | | | | 11,460 | |
| | | | | | | | | | | | |
| | | | | | | | | | | | 217,885 | |
Machinery — 0.9% | | | | | | | | | | | | |
CNH Industrial Finance Europe SA, 2.75%, 3/18/19 | | | EUR | | | | 100 | | | | 107,767 | |
Gates Global LLC/Gates Global Co., 5.75%, 7/15/22 | | | | | | | 100 | | | | 77,349 | |
Schaeffler Holding Finance BV, 6.88% (6.88% Cash or 7.38% PIK), 8/15/18 (h) | | | | | | | 100 | | | | 112,523 | |
| | | | | | | | | | | | |
| | | | | | | | | | | | 297,639 | |
Media — 8.9% | | | | | | | | | | | | |
Altice Luxembourg SA, 7.25%, 5/15/22 | | | | | | | 100 | | | | 101,612 | |
Altice U.S. Finance I Corp., 5.38%, 7/15/23 (c) | | | USD | | | | 200 | | | | 200,500 | |
AMC Networks, Inc., 4.75%, 12/15/22 | | | | | | | 57 | | | | 57,000 | |
CCO Holdings LLC/CCO Holdings Capital Corp.: | | | | | | | | | | | | |
6.50%, 4/30/21 | | | | | | | 15 | | | | 15,600 | |
5.88%, 5/01/27 (c) | | | | | | | 156 | | | | 155,220 | |
CCOH Safari LLC, 5.75%, 2/15/26 (c) | | | | | | | 95 | | | | 95,237 | |
Cengage Learning Acquisitions, Inc.,
0.00%, 4/15/20 (a)(d)(g) | | | | | | | 166 | | | | — | |
Cequel Communications Holdings I LLC/Cequel Capital Corp., 5.13%, 12/15/21 (c) | | | | | | | 20 | | | | 18,000 | |
Clear Channel International BV, 8.75%, 12/15/20 (c) | | | | | | | 55 | | | | 54,725 | |
Clear Channel Worldwide Holdings, Inc., 7.63%, 3/15/20 | | | | | | | 64 | | | | 59,120 | |
Clear Channel Worldwide Holdings, Inc., Series B, 6.50%, 11/15/22 | | | | | | | 161 | | | | 156,975 | |
CSC Holdings LLC, 5.25%, 6/01/24 | | | | | | | 40 | | | | 35,100 | |
DISH DBS Corp.: | | | | | | | | | | | | |
5.13%, 5/01/20 | | | | | | | 41 | | | | 40,590 | |
| | | | | | | | | | | | |
| Corporate Bonds | | | | | Par (000) | | | Value | |
Media (continued) | | | | | | | | | | | | |
6.75%, 6/01/21 | | | USD | | | | 25 | | | $ | 25,187 | |
5.00%, 3/15/23 | | | | | | | 10 | | | | 8,675 | |
5.88%, 11/15/24 | | | | | | | 98 | | | | 87,220 | |
DreamWorks Animation SKG, Inc., 6.88%, 8/15/20 (c) | | | | | | | 4 | | | | 3,940 | |
Gray Television, Inc., 7.50%, 10/01/20 | | | | | | | 16 | | | | 16,440 | |
iHeartCommunications, Inc.: | | | | | | | | | | | | |
9.00%, 12/15/19 | | | | | | | 36 | | | | 26,280 | |
9.00%, 3/01/21 | | | | | | | 74 | | | | 51,615 | |
9.00%, 9/15/22 | | | | | | | 80 | | | | 55,200 | |
Interactive Data Corp., 5.88%, 4/15/19 (c) | | | | | | | 70 | | | | 71,400 | |
Live Nation Entertainment, Inc., 7.00%, 9/01/20 (c) | | | | | | | 23 | | | | 23,805 | |
Midcontinent Communications & Midcontinent Finance Corp., 6.25%, 8/01/21 (c) | | | | | | | 40 | | | | 40,400 | |
Neptune Finco Corp., 10.13%, 1/15/23 (c) | | | | | | | 200 | | | | 208,500 | |
Nielsen Finance LLC/Nielsen Finance Co., 5.00%, 4/15/22 (c) | | | | | | | 72 | | | | 71,100 | |
Numericable-SFR SAS, 6.00%, 5/15/22 (c) | | | | | | | 400 | | | | 388,000 | |
Outfront Media Capital LLC/Outfront Media Capital Corp., 5.63%, 2/15/24 | | | | | | | 22 | | | | 22,605 | |
Radio One, Inc., 7.38%, 4/15/22 (c) | | | | | | | 10 | | | | 8,900 | |
RCN Telecom Services LLC/RCN Capital Corp., 8.50%, 8/15/20 (c) | | | | | | | 30 | | | | 30,300 | |
Regal Entertainment Group, 5.75%, 2/01/25 | | | | | | | 18 | | | | 17,370 | |
Sirius XM Radio, Inc.: | | | | | | | | | | | | |
4.25%, 5/15/20 (c) | | | | | | | 20 | | | | 20,200 | |
4.63%, 5/15/23 (c) | | | | | | | 10 | | | | 9,800 | |
6.00%, 7/15/24 (c) | | | | | | | 20 | | | | 20,900 | |
5.38%, 4/15/25 (c) | | | | | | | 109 | | | | 109,681 | |
Townsquare Media, Inc., 6.50%, 4/01/23 (c) | | | | | | | 7 | | | | 6,405 | |
Trader Corp., 9.88%, 8/15/18 (c) | | | | | | | 65 | | | | 67,600 | |
Tribune Media Co., 5.88%, 7/15/22 (c) | | | | | | | 55 | | | | 55,000 | |
Unitymedia Hessen GmbH & Co. KG/Unitymedia NRW GmbH, 4.00%, 1/15/25 | | | EUR | | | | 100 | | | | 104,600 | |
Univision Communications, Inc.: | | | | | | | | | | | | |
8.50%, 5/15/21 (c) | | | USD | | | | 23 | | | | 23,517 | |
5.13%, 5/15/23 (c) | | | | | | | 136 | | | | 130,900 | |
5.13%, 2/15/25 (c) | | | | | | | 132 | | | | 125,400 | |
| | | | | | | | | | | | |
| | | | | | | | | | | | 2,820,619 | |
Metals & Mining — 2.9% | | | | | | | | | | | | |
Alcoa, Inc.: | | | | | | | | | | | | |
5.13%, 10/01/24 | | | | | | | 54 | | | | 49,140 | |
5.90%, 2/01/27 | | | | | | | 2 | | | | 1,835 | |
6.75%, 1/15/28 | | | | | | | 7 | | | | 6,650 | |
5.95%, 2/01/37 | | | | | | | 3 | | | | 2,415 | |
ArcelorMittal, 6.13%, 6/01/18 | | | | | | | 4 | | | | 3,660 | |
Constellium NV: | | | | | | | | | | | | |
8.00%, 1/15/23 (c) | | | | | | | 250 | | | | 195,625 | |
5.75%, 5/15/24 (c) | | | | | | | 250 | | | | 170,000 | |
Eco-Bat Finance PLC, 7.75%, 2/15/17 | | | EUR | | | | 100 | | | | 105,959 | |
First Quantum Minerals Ltd., 7.25%, 5/15/22 (c) | | | USD | | | | 30 | | | | 18,750 | |
Joseph T. Ryerson & Son, Inc., 9.00%, 10/15/17 | | | | | | | 35 | | | | 26,950 | |
Novelis, Inc.: | | | | | | | | | | | | |
8.38%, 12/15/17 | | | | | | | 25 | | | | 24,313 | |
8.75%, 12/15/20 | | | | | | | 140 | | | | 128,450 | |
Steel Dynamics, Inc.: | | | | | | | | | | | | |
5.13%, 10/01/21 | | | | | | | 35 | | | | 32,375 | |
5.25%, 4/15/23 | | | | | | | 42 | | | | 38,325 | |
5.50%, 10/01/24 | | | | | | | 8 | | | | 7,300 | |
SunCoke Energy Partners LP/SunCoke Energy Partners Finance Corp., 7.38%, 2/01/20 (c) | | | | | | | 22 | | | | 13,640 | |
See Notes to Financial Statements.
| | | | | | |
| | | BLACKROCK SERIES FUND, INC. | | DECEMBER 31, 2015 | | 79 |
| | | | |
| Schedule of Investments (continued) | | | BlackRock High Yield Portfolio | |
| | | | |
| | | | | | | | | | | | |
| Corporate Bonds | | | | | Par (000) | | | Value | |
Metals & Mining (continued) | | | | | | | | | | | | |
Teck Resources Ltd.: | | | | | | | | | | | | |
3.00%, 3/01/19 | | | USD | | | | 23 | | | $ | 14,260 | |
5.20%, 3/01/42 | | | | | | | 15 | | | | 6,300 | |
5.40%, 2/01/43 | | | | | | | 7 | | | | 2,940 | |
Wise Metals Group LLC/Wise Alloys Finance Corp., 8.75%, 12/15/18 (c) | | | | | | | 77 | | | | 58,327 | |
| | | | | | | | | | | | |
| | | | | | | | | | | | 907,214 | |
Multiline Retail — 1.0% | | | | | | | | | | | | |
Dollar Tree, Inc.: | | | | | | | | | | | | |
5.25%, 3/01/20 (c) | | | | | | | 15 | | | | 15,487 | |
5.75%, 3/01/23 (c) | | | | | | | 246 | | | | 254,610 | |
Family Dollar Stores, Inc., 5.00%, 2/01/21 | | | | | | | 34 | | | | 34,810 | |
| | | | | | | | | | | | |
| | | | | | | | | | | | 304,907 | |
Oil, Gas & Consumable Fuels — 9.1% | | | | | | | | | | | | |
Antero Resources Corp.: | | | | | | | | | | | | |
5.38%, 11/01/21 | | | | | | | 37 | | | | 29,600 | |
5.13%, 12/01/22 | | | | | | | 24 | | | | 18,240 | |
Bonanza Creek Energy, Inc.: | | | | | | | | | | | | |
6.75%, 4/15/21 | | | | | | | 38 | | | | 22,990 | |
5.75%, 2/01/23 | | | | | | | 34 | | | | 17,680 | |
Calfrac Holdings LP, 7.50%, 12/01/20 (c) | | | | | | | 88 | | | | 34,980 | |
California Resources Corp.: | | | | | | | | | | | | |
5.50%, 9/15/21 | | | | | | | 24 | | | | 7,560 | |
8.00%, 12/15/22 (c) | | | | | | | 148 | | | | 77,885 | |
6.00%, 11/15/24 | | | | | | | 30 | | | | 9,150 | |
Carrizo Oil & Gas, Inc., 6.25%, 4/15/23 | | | | | | | 36 | | | | 29,160 | |
Concho Resources, Inc.: | | | | | | | | | | | | |
6.50%, 1/15/22 | | | | | | | 7 | | | | 6,720 | |
5.50%, 10/01/22 | | | | | | | 13 | | | | 11,830 | |
5.50%, 4/01/23 | | | | | | | 37 | | | | 34,225 | |
CONSOL Energy, Inc., 5.88%, 4/15/22 | | | | | | | 196 | | | | 121,520 | |
CrownRock LP/CrownRock Finance, Inc.: | | | | | | | | | | | | |
7.13%, 4/15/21 (c) | | | | | | | 51 | | | | 47,813 | |
7.75%, 2/15/23 (c) | | | | | | | 20 | | | | 18,800 | |
Denbury Resources, Inc.: | | | | | | | | | | | | |
5.50%, 5/01/22 | | | | | | | 36 | | | | 11,951 | |
4.63%, 7/15/23 | | | | | | | 4 | | | | 1,288 | |
Diamondback Energy, Inc., 7.63%, 10/01/21 | | | | | | | 51 | | | | 51,510 | |
Energy Transfer Equity LP: | | | | | | | | | | | | |
7.50%, 10/15/20 | | | | | | | 26 | | | | 24,050 | |
5.88%, 1/15/24 | | | | | | | 89 | | | | 72,535 | |
EP Energy LLC/Everest Acquisition Finance, Inc.: | | | | | | | | | | | | |
9.38%, 5/01/20 | | | | | | | 72 | | | | 45,900 | |
6.38%, 6/15/23 | | | | | | | 16 | | | | 8,000 | |
Genesis Energy LP/Genesis Energy Finance Corp.: | | | | | | | | | | | | |
5.75%, 2/15/21 | | | | | | | 9 | | | | 7,605 | |
6.75%, 8/01/22 | | | | | | | 10 | | | | 8,500 | |
6.00%, 5/15/23 | | | | | | | 12 | | | | 9,600 | |
Gulfport Energy Corp., 7.75%, 11/01/20 | | | | | | | 38 | | | | 34,010 | |
Halcon Resources Corp., 8.63%, 2/01/20 (c) | | | | | | | 28 | | | | 19,320 | |
Hilcorp Energy I LP/Hilcorp Finance Co., 5.00%, 12/01/24 (c) | | | | | | | 30 | | | | 24,900 | |
Laredo Petroleum, Inc., 7.38%, 5/01/22 | | | | | | | 26 | | | | 23,920 | |
Linn Energy LLC/Linn Energy Finance Corp.: | | | | | | | | | | | | |
8.63%, 4/15/20 | | | | | | | 2 | | | | 343 | |
12.00%, 12/15/20 (c) | | | | | | | 18 | | | | 9,000 | |
7.75%, 2/01/21 | | | | | | | 37 | | | | 5,365 | |
Matador Resources Co., 6.88%, 4/15/23 | | | | | | | 13 | | | | 12,090 | |
MEG Energy Corp.: | | | | | | | | | | | | |
6.50%, 3/15/21 (c) | | | | | | | 53 | | | | 37,100 | |
| | | | | | | | | | | | |
| Corporate Bonds | | | | | Par (000) | | | Value | |
Oil, Gas & Consumable Fuels (continued) | | | | | | | | | | | | |
6.38%, 1/30/23 (c) | | | USD | | | | 48 | | | $ | 32,880 | |
7.00%, 3/31/24 (c) | | | | | | | 227 | | | | 161,170 | |
Memorial Production Partners LP/Memorial Production Finance Corp.: | | | | | | | | | | | | |
7.63%, 5/01/21 | | | | | | | 16 | | | | 4,800 | |
6.88%, 8/01/22 | | | | | | | 32 | | | | 9,600 | |
Memorial Resource Development Corp., 5.88%, 7/01/22 | | | | | | | 107 | | | | 93,625 | |
MPLX LP, 4.88%, 6/01/25 (c) | | | | | | | 46 | | | | 41,170 | |
Newfield Exploration Co., 5.63%, 7/01/24 | | | | | | | 9 | | | | 7,673 | |
NGPL PipeCo LLC: | | | | | | | | | | | | |
7.12%, 12/15/17 (c) | | | | | | | 12 | | | | 11,160 | |
9.63%, 6/01/19 (c) | | | | | | | 25 | | | | 23,375 | |
7.77%, 12/15/37 (c) | | | | | | | 54 | | | | 42,660 | |
Oasis Petroleum, Inc.: | | | | | | | | | | | | |
6.50%, 11/01/21 | | | | | | | 33 | | | | 21,863 | |
6.88%, 1/15/23 | | | | | | | 35 | | | | 21,700 | |
ONEOK, Inc., 7.50%, 9/01/23 | | | | | | | 20 | | | | 16,650 | |
Paramount Resources Ltd., 6.88%, 6/30/23 (c) | | | | | | | 30 | | | | 23,700 | |
Parsley Energy LLC/Parsley Finance Corp., 7.50%, 2/15/22 (c) | | | | | | | 23 | | | | 21,965 | |
PBF Logistics LP/PBF Logistics Finance Corp., 6.88%, 5/15/23 | | | | | | | 10 | | | | 9,100 | |
Peabody Energy Corp., 6.00%, 11/15/18 | | | | | | | 45 | | | | 8,325 | |
Precision Drilling Corp., 5.25%, 11/15/24 | | | | | | | 95 | | | | 64,600 | |
QEP Resources, Inc.: | | | | | | | | | | | | |
5.38%, 10/01/22 | | | | | | | 14 | | | | 10,080 | |
5.25%, 5/01/23 | | | | | | | 50 | | | | 35,500 | |
Range Resources Corp., 5.00%, 8/15/22 | | | | | | | 13 | | | | 9,717 | |
Rockies Express Pipeline LLC: | | | | | | | | | | | | |
6.85%, 7/15/18 (c) | | | | | | | 5 | | | | 4,900 | |
6.00%, 1/15/19 (c) | | | | | | | 75 | | | | 71,250 | |
6.88%, 4/15/40 (c) | | | | | | | 53 | | | | 45,580 | |
Rose Rock Midstream LP/Rose Rock Finance Corp.: | | | | | | | | | | | | |
5.63%, 7/15/22 | | | | | | | 6 | | | | 4,260 | |
5.63%, 11/15/23 (c) | | | | | | | 22 | | | | 15,620 | |
RSP Permian, Inc.: | | | | | | | | | | | | |
6.63%, 10/01/22 | | | | | | | 28 | | | | 25,760 | |
6.63%, 10/01/22 (c) | | | | | �� | | 12 | | | | 11,040 | |
Sabine Pass Liquefaction LLC: | | | | | | | | | | | | |
5.63%, 4/15/23 | | | | | | | 177 | | | | 155,317 | |
5.75%, 5/15/24 | | | | | | | 300 | | | | 261,000 | |
5.63%, 3/01/25 (c) | | | | | | | 96 | | | | 81,240 | |
Sabine Pass LNG LP, 6.50%, 11/01/20 | | | | | | | 40 | | | | 38,800 | |
Sanchez Energy Corp., 6.13%, 1/15/23 | | | | | | | 111 | | | | 59,940 | |
SandRidge Energy, Inc., 8.13%, 10/16/22 (f) | | | | | | | 54 | | | | 10,361 | |
Seven Generations Energy Ltd.: | | | | | | | | | | | | |
8.25%, 5/15/20 (c) | | | | | | | 121 | | | | 108,900 | |
6.75%, 5/01/23 (c) | | | | | | | 24 | | | | 20,160 | |
SM Energy Co.: | | | | | | | | | | | | |
6.50%, 11/15/21 | | | | | | | 22 | | | | 16,390 | |
6.13%, 11/15/22 | | | | | | | 155 | | | | 113,925 | |
6.50%, 1/01/23 | | | | | | | 10 | | | | 7,350 | |
5.00%, 1/15/24 | | | | | | | 24 | | | | 15,600 | |
5.63%, 6/01/25 | | | | | | | 5 | | | | 3,300 | |
Southern Star Central Corp., 5.13%, 7/15/22 (c) | | | | | | | 13 | | | | 10,725 | |
Tesoro Logistics LP/Tesoro Logistics Finance Corp., 6.25%, 10/15/22 (c) | | | | | | | 60 | | | | 56,850 | |
Whiting Petroleum Corp.: | | | | | | | | | | | | |
1.25%, 4/01/20 (c)(f) | | | | | | | 146 | | | | 99,280 | |
6.25%, 4/01/23 | | | | | | | 33 | | | | 23,760 | |
See Notes to Financial Statements.
| | | | | | |
| 80 | | BLACKROCK SERIES FUND, INC. | | DECEMBER 31, 2015 | | |
| | | | |
| Schedule of Investments (continued) | | | BlackRock High Yield Portfolio | |
| | | | |
| | | | | | | | | | | | |
| Corporate Bonds | | | | | Par (000) | | | Value | |
Oil, Gas & Consumable Fuels (continued) | | | | | | | | | | | | |
Williams Cos., Inc.: | | | | | | | | | | | | |
3.70%, 1/15/23 | | | USD | | | | 12 | | | $ | 8,289 | |
4.55%, 6/24/24 | | | | | | | 37 | | | | 25,699 | |
WPX Energy, Inc., 5.25%, 9/15/24 | | | | | | | 26 | | | | 17,160 | |
| | | | | | | | | | | | |
| | | | | | | | | | | | 2,878,909 | |
Paper & Forest Products — 0.2% | | | | | | | | | | | | |
Clearwater Paper Corp., 4.50%, 2/01/23 | | | | | | | 4 | | | | 3,760 | |
Norbord, Inc., 6.25%, 4/15/23 (c) | | | | | | | 20 | | | | 19,750 | |
PH Glatfelter Co., 5.38%, 10/15/20 | | | | | | | 8 | | | | 8,000 | |
Unifrax I LLC/Unifrax Holding Co., 7.50%, 2/15/19 (c) | | | | | | | 32 | | | | 28,320 | |
| | | | | | | | | | | | |
| | | | | | | | | | | | 59,830 | |
Pharmaceuticals — 2.9% | | | | | | | | | | | | |
Capsugel SA, 7.00% (7.00% Cash or 7.75% PIK), 5/15/19 (c)(h) | | | | | | | 22 | | | | 21,450 | |
Concordia Healthcare Corp., 7.00%, 4/15/23 (c) | | | | | | | 12 | | | | 10,410 | |
Endo Ltd./Endo Finance LLC/Endo Finco, Inc., 6.00%, 2/01/25 (c) | | | | | | | 200 | | | | 197,000 | |
Mallinckrodt International Finance SA/Mallinckrodt CB LLC: | | | | | | | | | | | | |
4.88%, 4/15/20 (c) | | | | | | | 9 | | | | 8,663 | |
5.75%, 8/01/22 (c) | | | | | | | 5 | | | | 4,800 | |
PRA Holdings, Inc., 9.50%, 10/01/23 (c) | | | | | | | 14 | | | | 15,225 | |
Valeant Pharmaceuticals International, Inc.: | | | | | | | | | | | | |
6.75%, 8/15/18 (c) | | | | | | | 14 | | | | 13,874 | |
5.38%, 3/15/20 (c) | | | | | | | 159 | | | | 149,460 | |
7.00%, 10/01/20 (c) | | | | | | | 50 | | | | 49,875 | |
6.38%, 10/15/20 (c) | | | | | | | 48 | | | | 46,320 | |
7.50%, 7/15/21 (c) | | | | | | | 78 | | | | 77,805 | |
5.63%, 12/01/21 (c) | | | | | | | 35 | | | | 32,200 | |
5.50%, 3/01/23 (c) | | | | | | | 161 | | | | 141,680 | |
5.88%, 5/15/23 (c) | | | | | | | 160 | | | | 142,800 | |
6.13%, 4/15/25 (c) | | | | | | | 19 | | | | 16,957 | |
| | | | | | | | | | | | |
| | | | | | | | | | | | 928,519 | |
Real Estate Investment Trusts (REITs) — 1.1% | | | | | | | | | |
Communications Sales & Leasing, Inc./CSL Capital LLC, 8.25%, 10/15/23 | | | | | | | 61 | | | | 51,545 | |
Corrections Corp. of America, 4.63%, 5/01/23 | | | | | | | 5 | | | | 4,825 | |
Crown Castle International Corp.: | | | | | | | | | | | | |
4.88%, 4/15/22 | | | | | | | 18 | | | | 18,675 | |
5.25%, 1/15/23 | | | | | | | 38 | | | | 39,947 | |
Equinix, Inc., 5.88%, 1/15/26 | | | | | | | 47 | | | | 48,410 | |
ESH Hospitality, Inc., 5.25%, 5/01/25 (c) | | | | | | | 13 | | | | 12,675 | |
FelCor Lodging LP, 6.00%, 6/01/25 | | | | | | | 56 | | | | 56,840 | |
GEO Group, Inc., 5.88%, 10/15/24 | | | | | | | 50 | | | | 48,500 | |
Iron Mountain, Inc., 6.00%, 10/01/20 (c) | | | | | | | 15 | | | | 15,825 | |
RHP Hotel Properties LP/RHP Finance Corp., 5.00%, 4/15/21 | | | | | | | 42 | | | | 42,735 | |
| | | | | | | | | | | | |
| | | | | | | | | | | | 339,977 | |
Real Estate Management & Development — 0.5% | | | | | | | | | | | | |
Ashton Woods USA LLC/Ashton Woods Finance Co., 6.88%, 2/15/21 (c) | | | | | | | 38 | | | | 32,300 | |
Crescent Resources LLC/Crescent Ventures, Inc., 10.25%, 8/15/17 (c) | | | | | | | 18 | | | | 18,000 | |
Realogy Group LLC/Realogy Co-Issuer Corp.: | | | | | | | | | | | | |
4.50%, 4/15/19 (c) | | | | | | | 15 | | | | 15,413 | |
5.25%, 12/01/21 (c) | | | | | | | 81 | | | | 83,025 | |
Taylor Morrison Communities, Inc./Monarch Communities, Inc., 5.25%, 4/15/21 (c) | | | | | | | 15 | | | | 15,000 | |
Tropicana Entertainment LLC/Tropicana Finance Corp., 9.63%, 12/15/14 (a)(d) | | | | | | | 15 | | | | — | |
| | | | | | | | | | | | |
| | | | | | | | | | | | 163,738 | |
| | | | | | | | | | | | |
| Corporate Bonds | | | | | Par (000) | | | Value | |
Road & Rail — 0.9% | | | | | | | | | | | | |
Avis Budget Car Rental LLC/Avis Budget Finance, Inc.: | | | | | | | | | | | | |
5.13%, 6/01/22 (c) | | | USD | | | | 10 | | | $ | 9,875 | |
5.25%, 3/15/25 (c) | | | | | | | 96 | | | | 90,960 | |
Florida East Coast Holdings Corp., 6.75%, 5/01/19 (c) | | | | | | | 41 | | | | 37,515 | |
Hertz Corp.: | | | | | | | | | | | | |
6.75%, 4/15/19 | | | | | | | 20 | | | | 20,430 | |
7.38%, 1/15/21 | | | | | | | 30 | | | | 31,125 | |
JCH Parent, Inc., 10.50% (10.50% Cash or 11.25% PIK), 3/15/19 (c)(h) | | | | | | | 101 | | | | 61,656 | |
Watco Cos. LLC/Watco Finance Corp., 6.38%, 4/01/23 (c) | | | | | | | 34 | | | | 33,490 | |
| | | | | | | | | | | | |
| | | | | | | | | | | | 285,051 | |
Semiconductors & Semiconductor Equipment — 0.1% | | | | | | | | | |
Advanced Micro Devices, Inc., 7.50%, 8/15/22 | | | | | | | 10 | | | | 6,800 | |
Micron Technology, Inc., 5.25%, 1/15/24 (c) | | | | | | | 25 | | | | 22,000 | |
| | | | | | | | | | | | |
| | | | | | | | | | | | 28,800 | |
Software — 3.1% | | | | | | | | | | | | |
Audatex North America, Inc.: | | | | | | | | | | | | |
6.00%, 6/15/21 (c) | | | | | | | 20 | | | | 20,150 | |
6.13%, 11/01/23 (c) | | | | | | | 60 | | | | 60,375 | |
Ensemble S Merger Sub, Inc., 9.00%, 9/30/23 (c) | | | | | | | 21 | | | | 20,291 | |
First Data Corp.: | | | | | | | | | | | | |
5.38%, 8/15/23 (c) | | | | | | | 51 | | | | 51,255 | |
7.00%, 12/01/23 (c) | | | | | | | 317 | | | | 317,000 | |
5.00%, 1/15/24 (c) | | | | | | | 75 | | | | 74,625 | |
5.75%, 1/15/24 (c) | | | | | | | 247 | | | | 243,295 | |
Infor Software Parent LLC/Infor Software Parent, Inc., 7.13% (7.13% Cash or 7.88% PIK), 5/01/21 (c)(h) | | | | | | | 66 | | | | 47,685 | |
Infor U.S., Inc., 6.50%, 5/15/22 (c) | | | | | | | 42 | | | | 35,490 | |
Informatica LLC, 7.13%, 7/15/23 (c) | | | | | | | 72 | | | | 65,160 | |
SS&C Technologies Holdings, Inc., 5.88%, 7/15/23 (c) | | | | | | | 47 | | | | 48,527 | |
| | | | | | | | | | | | |
| | | | | | | | | | | | 983,853 | |
Specialty Retail — 0.9% | | | | | | | | | | | | |
Asbury Automotive Group, Inc., 6.00%, 12/15/24 | | | | | | | 29 | | | | 29,943 | |
L Brands, Inc., 6.88%, 11/01/35 (c) | | | | | | | 65 | | | | 66,787 | |
Neiman Marcus Group Ltd. LLC, 8.00%, 10/15/21 (c) | | | | | | | 89 | | | | 65,860 | |
Party City Holdings, Inc., 6.13%, 8/15/23 (c) | | | | | | | 12 | | | | 11,640 | |
Penske Automotive Group, Inc.: | | | | | | | | | | | | |
5.75%, 10/01/22 | | | | | | | 59 | | | | 60,623 | |
5.38%, 12/01/24 | | | | | | | 17 | | | | 17,170 | |
Sally Holdings LLC/Sally Capital, Inc., 5.50%, 11/01/23 | | | | | | | 22 | | | | 22,495 | |
Sonic Automotive, Inc., 5.00%, 5/15/23 | | | | | | | 13 | | | | 12,350 | |
| | | | | | | | | | | | |
| | | | | | | | | | | | 286,868 | |
Technology Hardware, Storage & Peripherals — 0.0% | | | | | | | | | |
Dell, Inc., 6.50%, 4/15/38 | | | | | | | 7 | | | | 5,740 | |
Textiles, Apparel & Luxury Goods — 0.2% | | | | | | | | | | | | |
Levi Strauss & Co.: | | | | | | | | | | | | |
6.88%, 5/01/22 | | | | | | | 20 | | | | 21,400 | |
5.00%, 5/01/25 | | | | | | | 5 | | | | 4,975 | |
Springs Industries, Inc., 6.25%, 6/01/21 | | | | | | | 44 | | | | 43,560 | |
| | | | | | | | | | | | |
| | | | | | | | | | | | 69,935 | |
Thrifts & Mortgage Finance — 0.7% | | | | | | | | | | | | |
Jefferies Finance LLC/JFIN Co-Issuer Corp., 7.38%, 4/01/20 (c) | | | | | | | 200 | | | | 177,500 | |
See Notes to Financial Statements.
| | | | | | |
| | | BLACKROCK SERIES FUND, INC. | | DECEMBER 31, 2015 | | 81 |
| | | | |
| Schedule of Investments (continued) | | | BlackRock High Yield Portfolio | |
| | | | |
| | | | | | | | | | | | |
Corporate Bonds | | | | | Par (000) | | | Value | |
Thrifts & Mortgage Finance (continued) | | | | | | | | | | | | |
Rialto Holdings LLC/Rialto Corp., 7.00%, 12/01/18 (c) | | | USD | | | | 30 | | | $ | 30,450 | |
| | | | | | | | | | | | |
| | | | | | | | | | | | 207,950 | |
Trading Companies & Distributors — 3.0% | | | | | | | | | | | | |
Aircastle Ltd.: | | | | | | | | | | | | |
7.63%, 4/15/20 | | | | | | | 4 | | | | 4,500 | |
5.13%, 3/15/21 | | | | | | | 27 | | | | 27,743 | |
5.50%, 2/15/22 | | | | | | | 20 | | | | 20,500 | |
American Builders & Contractors Supply Co., Inc., 5.75%, 12/15/23 (c) | | | | | | | 18 | | | | 18,135 | |
Beacon Roofing Supply, Inc., 6.38%, 10/01/23 (c) | | | | | | | 16 | | | | 16,300 | |
HD Supply, Inc.: | | | | | | | | | | | | |
7.50%, 7/15/20 | | | | | | | 282 | | | | 293,280 | |
5.25%, 12/15/21 (c) | | | | | | | 203 | | | | 207,060 | |
International Lease Finance Corp.: | | | | | | | | | | | | |
8.25%, 12/15/20 | | | | | | | 150 | | | | 177,375 | |
4.63%, 4/15/21 | | | | | | | 17 | | | | 17,425 | |
5.88%, 8/15/22 | | | | | | | 80 | | | | 85,200 | |
United Rentals North America, Inc.: | | | | | | | | | | | | |
8.25%, 2/01/21 | | | | | | | 37 | | | | 38,711 | |
5.75%, 11/15/24 | | | | | | | 15 | | | | 14,850 | |
5.50%, 7/15/25 | | | | | | | 46 | | | | 44,620 | |
| | | | | | | | | | | | |
| | | | | | | | | | | | 965,699 | |
Wireless Telecommunication Services — 2.5% | | | | | | | | | | | | |
SBA Communications Corp.: | | | | | | | | | | | | |
5.63%, 10/01/19 | | | | | | | 10 | | | | 10,425 | |
4.88%, 7/15/22 | | | | | | | 70 | | | | 68,950 | |
Sprint Capital Corp.: | | | | | | | | | | | | |
6.88%, 11/15/28 | | | | | | | 40 | | | | 27,900 | |
8.75%, 3/15/32 | | | | | | | 45 | | | | 33,750 | |
Sprint Communications, Inc.: | | | | | | | | | | | | |
9.00%, 11/15/18 (c) | | | | | | | 222 | | | | 233,655 | |
7.00%, 3/01/20 (c) | | | | | | | 31 | | | | 31,077 | |
Sprint Corp.: | | | | | | | | | | | | |
7.88%, 9/15/23 | | | | | | | 94 | | | | 70,594 | |
7.13%, 6/15/24 | | | | | | | 126 | | | | 90,877 | |
T-Mobile USA, Inc.: | | | | | | | | | | | | |
6.63%, 4/28/21 | | | | | | | 22 | | | | 22,825 | |
6.13%, 1/15/22 | | | | | | | 10 | | | | 10,275 | |
6.73%, 4/28/22 | | | | | | | 5 | | | | 5,213 | |
6.00%, 3/01/23 | | | | | | | 28 | | | | 28,350 | |
6.84%, 4/28/23 | | | | | | | 10 | | | | 10,350 | |
6.50%, 1/15/24 | | | | | | | 75 | | | | 76,500 | |
6.50%, 1/15/26 | | | | | | | 88 | | | | 88,835 | |
| | | | | | | | | | | | |
| | | | | | | | | | | | 809,576 | |
Total Corporate Bonds — 76.0% | | | | | | | | | | | 24,156,506 | |
| | | | | | | | | | | | |
| Floating Rate Loan Interests (e) | | | | | | | | | |
Aerospace & Defense — 0.0% | | | | | | | | | | | | |
Sequa Corp., Initial Term Loan, 5.25%, 6/19/17 | | | | | | | 13 | | | | 9,152 | |
Air Freight & Logistics — 0.3% | | | | | | | | | | | | |
Ceva Group PLC (FKA Louis No.1 PLC/TNT Logistics), Pre-Funded L/C Loan, 6.50%, 3/19/21 | | | | | | | 33 | | | | 27,176 | |
| | | | | | | | | | | | |
| Floating Rate Loan Interests (e) | | | | | Par (000) | | | Value | |
Air Freight & Logistics (continued) | | | | | | | | | | | | |
Ceva Intercompany B.V., Dutch BV Term Loan, 6.50%, 3/19/21 | | | USD | | | | 34 | | | $ | 28,157 | |
Ceva Logistics Canada, ULC (FKA TNT Canada ULC), Canadian Term Loan, 6.50%, 3/19/21 | | | | | | | 6 | | | | 4,855 | |
Ceva Logistics U.S. Holdings, Inc. (FKA Louis U.S. Holdco, Inc.), US Term Loan, 6.50%, 3/19/21 | | | | | | | 47 | | | | 38,837 | |
| | | | | | | | | | | | |
| | | | | | | | | | | | 99,025 | |
Airlines — 0.2% | | | | | | | | | | | | |
Air Medical Group Holdings, Inc., Initial Term Loan, 4.50%, 4/28/22 | | | | | | | 30 | | | | 28,824 | |
Northwest Airlines, Inc.: | | | | | | | | | | | | |
Loan B757-200, 1.77%, 9/10/18 | | | | | | | 10 | | | | 9,215 | |
Loan B757-200, 1.77%, 9/10/18 | | | | | | | 9 | | | | 8,730 | |
Loan B757-300, 1.77%, 3/10/17 | | | | | | | 9 | | | | 8,730 | |
Loan B757-300, 2.39%, 3/10/17 | | | | | | | 8 | | | | 7,590 | |
Loan B757-300, 2.39%, 3/10/17 | | | | | | | 7 | | | | 7,260 | |
| | | | | | | | | | | | |
| | | | | | | | | | | | 70,349 | |
Chemicals — 0.6% | | | | | | | | | | | | |
Ascend Performance Materials Operations LLC, Term B Loan, 6.75%, 4/10/18 | | | | | | | 188 | | | | 174,433 | |
MacDermid, Inc. (Platform Specialty Products Corp.), Term Loan B3, 5.50%, 6/07/20 | | | | | | | 21 | | | | 20,282 | |
| | | | | | | | | | | | |
| | | | | | | | | | | | 194,715 | |
Communications Equipment — 0.1% | | | | | | | | | | | | |
Blue Coat Holdings, Inc., Initial Term Loan, 4.50%, 5/20/22 | | | | | | | 11 | | | | 10,606 | |
Commscope, Inc., Tranche 5 Term Loan (2015), 3.75% - 3.83%, 12/29/22 | | | | | | | 18 | | | | 17,668 | |
| | | | | | | | | | | | |
| | | | | | | | | | | | 28,274 | |
Construction & Engineering — 0.1% | | | | | | | | | | | | |
Brand Energy & Infrastructure Services, Inc. (FKA FR Brand Acquisition Corp.), Initial Term Loan, 4.75%, 11/26/20 | | | | | | | 45 | | | | 42,082 | |
Construction Materials — 0.1% | | | | | | | | | | | | |
Stardust Finance Holdings, Inc., Senior Lien Term Loan, 6.50%, 3/14/22 | | | | | | | 13 | | | | 12,743 | |
Diversified Consumer Services — 0.1% | | | | | | | | | | | | |
Houghton Mifflin Harcourt Co., Term Loan, 4.00%, 5/28/21 | | | | | | | 15 | | | | 14,243 | |
Diversified Telecommunication Services — 0.5% | | | | | | | | | | | | |
Avaya, Inc., Term B-7 Loan, 6.25%, 5/29/20 | | | | | | | 30 | | | | 20,900 | |
LightSquared LP, Term Loan, 9.75%, 6/15/20 | | | | | | | 150 | | | | 136,875 | |
| | | | | | | | | | | | |
| | | | | | | | | | | | 157,775 | |
Electric Utilities — 0.5% | | | | | | | | | | | | |
Energy Future Intermediate Holding Co. LLC (EFIH Finance, Inc.), Term Loan, 4.25%, 6/19/16 | | | | | | | 48 | | | | 47,959 | |
Texas Competitive Electric Holdings Co., LLC (TXU), DIP Delayed Draw Term Loan (2014), 3.75%, 11/07/16 | | | | | | | 121 | | | | 120,123 | |
| | | | | | | | | | | | |
| | | | | | | | | | | | 168,082 | |
Food & Staples Retailing — 0.1% | | | | | | | | | | | | |
BJ’s Wholesale Club, Inc., 2013 (November) Replacement Loan (Second Lien), 8.50%, 3/26/20 | | | | | | | 30 | | | | 26,650 | |
| |
See Notes to Financial Statements.
| | | | | | |
| 82 | | BLACKROCK SERIES FUND, INC. | | DECEMBER 31, 2015 | | |
| | |
| Schedule of Investments (continued) | | BlackRock High Yield Portfolio |
| | | | | | | | | | | | |
| Floating Rate Loan Interests (e) | | | | | Par
(000) | | | Value | |
Health Care Equipment & Supplies — 0.2% | |
Alere, Inc. (FKA IM US Holdings, LLC), B Term Loan, 4.25%, 6/20/22 | | | USD | | | | 14 | | | $ | 13,760 | |
DJO Finance LLC, Initial Term Loan, 4.25%, 6/08/20 | | | | | | | 35 | | | | 33,548 | |
| | | | | | | | | | | | |
| | | | | | | | | | | | 47,308 | |
Health Care Providers & Services — 0.1% | | | | | | | | | | | | |
Envision Healthcare Corp. (FKA Emergency Medical Services Corp.), Tranche B-2 Term Loan,
4.50%, 10/28/22 | | | | | | | 24 | | | | 23,820 | |
Surgery Center Holdings, Inc., Initial Term Loan (First Lien), 5.25%, 11/03/20 | | | | | | | 19 | | | | 19,158 | |
| | | | | | | | | | | | |
| | | | | | | | | | | | 42,978 | |
Hotels, Restaurants & Leisure — 0.9% | | | | | | | | | | | | |
Amaya Holdings B.V.: | | | | | | | | | | | | |
Initial Term B Loan (First Lien), 5.00%, 8/01/21 | | | | | | | 33 | | | | 31,032 | |
Initial Term B Loan (Second Lien),
8.00%, 8/01/22 | | | | | | | 53 | | | | 52,369 | |
Caesars Entertainment Resort Properties LLC, Term B Loan, 7.00%, 10/11/20 | | | | | | | 216 | | | | 195,672 | |
Station Casinos LLC, B Term Loan, 4.25%, 3/02/20 | | | | | | | 19 | | | | 18,714 | |
| | | | | | | | | | | | |
| | | | | | | | | | | | 297,787 | |
Insurance — 0.1% | | | | | | | | | | | | |
AssuredPartners, Inc., First Lien Term Loan,
5.75%, 10/21/22 | | | | | | | 22 | | | | 21,817 | |
Life Sciences Tools & Services — 0.2% | | | | | | | | | | | | |
Jaguar Holding Co. I (AKA Pharmaceutical Product Development, Inc.), Initial Term Loan,
4.25%, 8/18/22 | | | | | | | 50 | | | | 48,136 | |
Sterigenics-Nordion Holdings, LLC, Initial Term Loan, 4.25%, 5/16/22 | | | | | | | 11 | | | | 10,780 | |
| | | | | | | | | | | | |
| | | | | | | | | | | | 58,916 | |
Machinery — 0.3% | | | | | | | | | | | | |
Accudyne Industries Borrower S.C.A./Accudyne Industries, LLC (AKA Hamilton Sundstrand), Refinancing Term Loan, 4.00%, 12/13/19 | | | | | | | 64 | | | | 53,703 | |
Gates Global LLC, Initial Dollar Term Loan,
4.25%, 7/06/21 | | | | | | | 41 | | | | 38,380 | |
| | | | | | | | | | | | |
| | | | | | | | | | | | 92,083 | |
Media — 0.5% | | | | | | | | | | | | |
Advantage Sales & Marketing, Inc., Initial Term Loan (First Lien), 4.25%, 7/23/21 | | | | | | | 35 | | | | 33,170 | |
Cengage Learning Acquisitions, Inc. (FKA TL Acquisitions, Inc.): | | | | | | | | | | | | |
Term Loan, 7.00%, 3/31/20 | | | | | | | 82 | | | | 79,875 | |
Term Loan, 0.00%, 6/30/16 (a)(d) | | | | | | | 20 | | | | — | |
iHeartCommunications, Inc. (FKA Clear Channel Communications, Inc.), Tranche D Term Loan, 7.17%, 1/30/19 | | | | | | | 57 | | | | 40,071 | |
Univision Communications, Inc., Replacement First-Lien Term Loan, 4.00%, 3/01/20 | | | | | | | 13 | | | | 12,362 | |
| | | | | | | | | | | | |
| | | | | | | | | | | | 165,478 | |
Metals & Mining — 0.1% | | | | | | | | | | | | |
Novelis, Inc., Initial Term Loan, 4.00%, 6/02/22 | | | | | | | 26 | | | | 24,646 | |
Oil, Gas & Consumable Fuels — 0.1% | | | | | | | | | | | | |
CITGO Holding, Inc., Term Loan, 9.50%, 5/12/18 | | | | | | | 27 | | | | 27,130 | |
| | | | | | | | | | | | |
| Floating Rate Loan Interests (e) | | | | | Par (000) | | | Value | |
Pharmaceuticals — 0.2% | |
Valeant Pharmaceuticals International, Inc.: | | | | | | | | | | | | |
Series E1 Tranche B Term Loan, 3.75%, 8/05/20 | | | USD | | | | 27 | | | $ | 25,853 | |
Series F-1 Tranche B Term Loan, 4.00%, 4/01/22 | | | | | | | 39 | | | | 37,389 | |
| | | | | | | | | | | | |
| | | | | | | | | | | | 63,242 | |
Real Estate Management & Development — 0.0% | |
Realogy Group LLC (FKA Realogy Corp.), Extended Synthetic Commitment,
0.27% — 4.40%, 10/10/16 | | | | | | | 6 | | | | 5,672 | |
Road & Rail — 0.2% | | | | | | | | | | | | |
Hertz Corp., Tranche B-2 Term Loan,
3.00%, 3/11/18 | | | | | | | 61 | | | | 60,399 | |
Semiconductors & Semiconductor Equipment — 0.4% | |
Avago Technologies, Term Loan B,
3.50%, 11/11/22 | | | | | | | 85 | | | | 83,991 | |
Microsemi Corp., Term Loan,
4.50%, 12/17/22 | | | | | | | 12 | | | | 11,766 | |
NXP BV (NXP Funding LLC), Tranche B Loan, 3.75%, 12/07/20 | | | | | | | 32 | | | | 31,414 | |
| | | | | | | | | | | | |
| | | | | | | | | | | | 127,171 | |
Software — 0.9% | | | | | | | | | | | | |
Epicor Software Corp. (FKA Eagle Parent, Inc.), Term B Loan, 4.75%, 6/01/22 | | | | | | | 52 | | | | 50,391 | |
First Data Corp., 2018 New Dollar Term Loan, 3.92%, 3/23/18 | | | | | | | 115 | | | | 113,449 | |
Informatica Corp., Dollar Term Loan,
4.50%, 8/05/22 | | | | | | | 33 | | | | 31,613 | |
Kronos, Inc., Initial Term Loan (Second Lien), 9.75%, 4/30/20 | | | | | | | 90 | | | | 89,082 | |
TIBCO Software, Inc., Term Loan, 6.50%, 12/04/20 | | | | 10 | | | | 8,949 | |
| | | | | | | | | | | | |
| | | | | | | | | | | | 293,484 | |
Total Floating Rate Loan Interests — 6.8% | | | | | | | | | | | 2,151,201 | |
| | | | | | | | | | | | |
| Non-Agency Mortgage-Backed Securities | | | | | | | | | |
Commercial Mortgage-Backed Securities — 0.3% | |
Hilton USA Trust, Series 2013-HLT, Class EFX, 4.45%, 11/05/30 (c)(e) | | | | | | | 113 | | | | 112,955 | |
| | | | | | | | | | | | |
| Other Interests (i) | | | | | Beneficial
Interest
(000) | | | | |
Auto Components — 0.0% | | | | | | | | | | | | |
Lear Corp., Escrow (a)(d) | | | | | | | 150 | | | | 1,313 | |
Lear Corp., Escrow (a)(d) | | | | | | | 100 | | | | 875 | |
| | | | | | | | | | | | |
| | | | | | | | | | | | 2,188 | |
Capital Markets — 0.1% | | | | | | | | | | | | |
Lehman Brothers Holdings Capital Trust VII Escrow Bonds (a)(d) | | | | | | | 110 | | | | 8,113 | |
Lehman Brothers Holdings Capital Trust VII Escrow Bonds (a)(d) | | | | | | | 30 | | | | 2,213 | |
| | | | | | | | | | | | |
| | | | | | | | | | | | 10,326 | |
See Notes to Financial Statements.
| | | | | | |
| | | BLACKROCK SERIES FUND, INC. | | DECEMBER 31, 2015 | | 83 |
| | |
| Schedule of Investments (continued) | | BlackRock High Yield Portfolio |
| | | | | | | | | | | | |
| Other Interests (i) | | | | | Beneficial
Interest
(000) | | | Value | |
Household Durables — 0.2% | | | | | | | | | | | | |
Stanley-Martin, Class B Membership Units (a) | | | USD | | | | — | (j) | | $ | 69,400 | |
Total Other Interests — 0.3% | | | | | | | | | | | 81,914 | |
| | | | | | | | | | | | |
| Preferred Securities | | | | | | | | | |
| Capital Trusts | | | | | Par (000) | | | | |
Banks — 2.4% | | | | | | | | | | | | |
Bank of America Corp.: | | | | | | | | | | | | |
Series AA, 6.10% (e)(k) | | | | | | | 22 | | | | 22,303 | |
Series V, 5.13% (e)(k) | | | | | | | 70 | | | | 66,675 | |
Series X, 6.25% (e)(k) | | | | | | | 115 | | | | 115,287 | |
Series Z, 6.50% (e)(k) | | | | | | | 55 | | | | 57,956 | |
Citigroup, Inc.: | | | | | | | | | | | | |
5.95% (e)(k) | | | | | | | 75 | | | | 73,387 | |
Series N, 5.80% (e)(k) | | | | | | | 40 | | | | 39,660 | |
Series P, 5.95% (e)(k) | | | | | | | 70 | | | | 67,375 | |
Series R, 6.13% (e)(k) | | | | | | | 23 | | | | 23,460 | |
JPMorgan Chase & Co.: | | | | | | | | | | | | |
Series 1, 7.90% (e)(k) | | | | | | | 75 | | | | 76,350 | |
Series V, 5.00% (e)(k) | | | | | | | 65 | | | | 61,750 | |
Series Z, 5.30% (e)(k) | | | | | | | 84 | | | | 83,685 | |
Wells Fargo & Co.: | | | | | | | | | | | | |
Series S, 5.90% (e)(k) | | | | | | | 15 | | | | 15,131 | |
Series U, 5.88% (e)(k) | | | | | | | 69 | | | | 72,623 | |
| | | | | | | | | | | | |
| | | | | | | | | | | | 775,642 | |
Capital Markets — 0.5% | | | | | | | | | | | | |
Goldman Sachs Group, Inc., Series L, 5.70% (e)(k) | | | | | | | 86 | | | | 85,463 | |
Morgan Stanley: | | | | | | | | | | | | |
Series H, 5.45% (e)(k) | | | | | | | 30 | | | | 29,287 | |
Series J, 5.55% (e)(k) | | | | | | | 30 | | | | 30,000 | |
State Street Corp., Series F, 5.25% (e)(k) | | | | | | | 5 | | | | 5,006 | |
| | | | | | | | | | | | |
| | | | | | | | | | | | 149,756 | |
Consumer Finance — 0.2% | | | | | | | | | | | | |
American Express Co., Series C, 4.90% (e)(k) | | | | 60 | | | | 57,000 | |
Wireless Telecommunication Services — 0.3% | | | | | | | | | |
Telefonica Europe BV, 4.20% (e)(k) | | | EUR | | | | 100 | | | | 106,910 | |
Total Capital Trusts — 3.4% | | | | | | | | | | | 1,089,308 | |
| | | | | | | | |
| Preferred Stocks | | Shares | | | Value | |
Consumer Finance — 0.0% | | | | | | | | |
Ally Financial, Inc., Series A, 8.50% (e) | | | 536 | | | | $ 13,807 | |
Diversified Financial Services — 0.2% | | | | | | | | |
RBS Capital Funding Trust VI, Series F, 6.25% | | | 2,075 | | | | 52,145 | |
Total Preferred Stocks — 0.2% | | | | | | | 65,952 | |
| | | | | | | | |
| Trust Preferreds | | | | | | |
Consumer Finance — 0.7% | | | | | | | | |
GMAC Capital Trust I, Series 2, 8.13%, 2/15/40 (e) | | | 8,676 | | | | 220,023 | |
Diversified Financial Services — 0.2% | | | | | | | | |
RBS Capital Funding Trust VII, Series G, 6.08% (k) | | | 2,668 | | | | 66,513 | |
Total Trust Preferreds — 0.9% | | | | | | | 286,536 | |
Total Preferred Securities — 4.5% | | | | | | | 1,441,796 | |
Total Long-Term Investments (Cost — $32,360,636) — 92.3% | | | | | | | 29,329,861 | |
| | | | | | | | |
| Short-Term Securities | | | | | | |
BlackRock Liquidity Funds, TempFund, Institutional Class, 0.23% (l)(m) | | | 1,971,388 | | | | 1,971,388 | |
Total Short-Term Securities (Cost — $1,971,388) — 6.2% | | | | | | | 1,971,388 | |
Total Investments (Cost — $34,332,024) — 98.5% | | | | | | | 31,301,249 | |
Other Assets Less Liabilities — 1.5% | | | | | | | 486,608 | |
| | | | | | | | |
Net Assets — 100.0% | | | | | | $ | 31,787,857 | |
| | | | | | | | |
|
| Notes to Schedule of Investments |
| (a) | Non-income producing security. |
| (b) | Restricted security as to resale, excluding 144A securities. As of period end, the Fund held restricted securities with a current value of $195 and an original cost of $195 which was 0.0% of its net assets. |
| (c) | Security exempt from registration pursuant to Rule 144A under the Securities Act of 1933, as amended. These securities may be resold in transactions exempt from registration to qualified institutional investors. |
| (d) | Issuer filed for bankruptcy and/or is in default of interest payments. |
| (e) | Variable rate security. Rate as of period end. |
| (h) | Payment-in-kind security which may pay interest/dividends in additional par/shares and/or in cash. Rates shown are the current rate and possible payment rates. |
| (i) | Other interests represent beneficial interests in liquidation trusts and other reorganization or private entities. |
| (j) | Amount is less than $500. |
| (k) | Perpetual security with no stated maturity date. |
See Notes to Financial Statements.
| | | | | | |
| 84 | | BLACKROCK SERIES FUND, INC. | | DECEMBER 31, 2015 | | |
| | |
| Schedule of Investments (continued) | | BlackRock High Yield Portfolio |
| (i) | During the year ended December 31, 2015, investments in issuers considered to be an affiliate of the Fund for purposes of Section 2(a)(3) of the Investment Company Act of 1940, as amended, were as follows: |
| | | | | | | | | | | | | | | | | | | | | | | | | | | | |
| Affiliate | | Shares Held at December 31, 2014 | | | Shares Purchased | | | Shares Sold | | | Shares Held at December 31, 2015 | | | Value Held at December 31, 2015 | | | Income | | | Realized Gain (Loss) | |
BlackRock Liquidity Funds, TempFund, Institutional Class | | | 433,841 | | | | 1,537,547 | 1 | | | — | | | | 1,971,388 | | | | $1,971,388 | | | $ | 746 | | | $ | 28 | |
iShares iBoxx $ High Yield Corporate Bond ETF | | | 2,399 | | | | 18,547 | | | | (20,946 | ) | | | — | | | | — | | | $ | 21,025 | | | $ | (54,696 | ) |
| | 1 | | Represents net shares purchased. |
| (m) | Current yield as of period end. |
| • | | For Fund compliance purposes, the Fund’s industry classifications refer to any one or more of the industry sub-classifications used by one or more widely recognized market indexes or ratings group indexes, and/or as defined by the investment advisor. These definitions may not apply for purposes of this report, which may combine such industry sub-classifications for reporting ease. |
|
| Derivative Financial Instruments Outstanding as of Period End |
| | | | | | | | | | | | | | | | |
Financial Futures Contract | |
Contracts
Short | | Issue | | Expiration | | Notional Value | | | Unrealized
Appreciation
(Depreciation) | |
| (1) | | Euro-Bobl | | March 2016 | | | USD | | | | 142,006 | | | | $ 1,260 | |
| (2) | | Euro-Bund | | March 2016 | | | USD | | | | 343,241 | | | | 4,910 | |
| (3) | | Russell 2000 Mini Index | | March 2016 | | | USD | | | | 339,450 | | | | (7,233 | ) |
| (22) | | S&P 500 E-Mini Index | | March 2016 | | | USD | | | | 2,238,940 | | | | (32,207 | ) |
| Total | | | | | | | | | | | | | | | $(33,270 | ) |
| | | | | | | | | | | | | | | | |
| | | | | | | | | | | | | | | | | | | | |
Forward Foreign Currency Exchange Contracts | |
Currency Purchased | | | Currency
Sold | | | Counterparty | | Settlement
Date | | | Unrealized
Appreciation
(Depreciation) | |
| USD | | | 361,375 | | | CAD | | | 483,000 | | | HSBC Bank PLC | | | 1/06/16 | | | | $ 12,307 | |
| USD | | | 1,313,417 | | | EUR | | | 1,240,000 | | | UBS AG | | | 1/06/16 | | | | (34,363 | ) |
| Total | | | | | | | | | | | | | | | | | | | $(22,056 | ) |
| | | | | | | | | | | | | | | | | | | | |
| | | | | | | | | | | | | | | | | | |
Centrally Cleared Credit Default Swaps — Sell Protection | | | | | | | | | | | | | | | | | | |
| Index | | Receive Fixed Rate | | Expiration Date | | Credit Rating1 | | Notional Amount (000)2 | | | Unrealized Appreciation | |
CDX.NA.HY Series 25 Version 1 | | 5.00% | | 12/20/20 | | B+ | | | USD | | | | 650 | | | | $6,915 | |
| | 1 | | Using S&P’s rating of the underlying securities of the index. |
| | 2 | | The maximum potential amount the Fund may pay should a negative credit event take place as defined under the terms of the agreement. |
|
| Transactions in Options Written for the Year Ended December 31, 2015 |
| | | | | | | | |
| | | | Puts | |
| | | | Contracts | | |
| Premiums
Received |
|
Outstanding options, beginning of year | | | — | | | | — | |
Options written | | | 252 | | | | $ 25,281 | |
Options closed | | | (252 | ) | | | (25,281 | ) |
| | | | |
Outstanding options, end of year | | | — | | | | — | |
| | | | |
See Notes to Financial Statements.
| | | | | | |
| | | BLACKROCK SERIES FUND, INC. | | DECEMBER 31, 2015 | | 85 |
| | | | |
| Schedule of Investments (continued) | | | BlackRock High Yield Portfolio | |
|
| Derivative Financial Instruments Categorized by Risk Exposure |
As of period end, the fair values of derivative financial instruments located in the Statements of Assets and Liabilities were as follows:
| | | | | | | | | | | | | | | | | | | | | | | | | | |
| Assets — Derivative Financial Instruments | | Commodity
Contracts | | Credit
Contracts | | | Equity
Contracts | | | Foreign
Currency
Exchange
Contracts | | | Interest
Rate
Contracts | | | Other
Contracts | | Total | |
Financial futures contracts | | Net unrealized appreciation1 | | — | | | — | | | | — | | | | — | | | | $6,170 | | | — | | $ | 6,170 | |
Forward foreign currency exchange contracts | | Unrealized appreciation on
forward foreign currency exchange contracts | | — | | | — | | | | — | | | | $12,307 | | | | — | | | — | | | 12,307 | |
Swaps — centrally cleared | | Net unrealized appreciation1 | | — | | | $6,915 | | | | — | | | | — | | | | — | | | — | | | 6,915 | |
Total | | | | — | | | $6,915 | | | | — | | | | $12,307 | | | | $6,170 | | | — | | $ | 25,392 | |
| | | |
| Liabilities — Derivative Financial Instruments | | | | | | | | | | | | | | | | | | | |
Financial futures contracts | | Net unrealized depreciation1 | | — | | | — | | | | $39,440 | | | | — | | | | — | | | — | | $ | 39,440 | |
Forward foreign currency exchange contracts | | Unrealized depreciation on
forward foreign currency exchange contracts | | — | | | — | | | | — | | | | $34,363 | | | | — | | | — | | | 34,363 | |
Total | | | | — | | | — | | | | $39,440 | | | | $34,363 | | | | — | | | — | | $ | 73,803 | |
| | 1 | | Includes cumulative appreciation (depreciation) on financial futures contracts and centrally cleared swaps, if any, as reported in the Schedule of Investments. Only current day’s variation margin is reported within the Statements of Assets and Liabilities. |
For the year ended December 31, 2015, the effect of derivative financial instruments in the Statements of Operations were as follows:
| | | | | | | | | | | | | | | | | | | | | | | | | | | | | | | | | | | |
| Net Realized Gain (Loss) from: | | Commodity
Contracts | | Credit
Contracts | | Equity
Contracts | | Foreign
Currency
Exchange
Contracts | | Interest
Rate
Contracts | | Other
Contracts | | Total |
Financial futures contracts | | — | | | | — | | | | $ | (126,506 | ) | | | | — | | | | | $(4,915 | ) | | — | | | $ | (131,421 | ) |
Foreign currency transactions | | — | | | | — | | | | | — | | | | $ | 589,529 | | | | | — | | | — | | | | 589,529 | |
Options purchased1 | | — | | | | — | | | | | (7,978 | ) | | | | — | | | | | — | | | — | | | | (7,978 | ) |
Options written | | — | | | | — | | | | | 4,104 | | | | | — | | | | | — | | | — | | | | 4,104 | |
Swaps | | — | | | | $28,822 | | | | | — | | | | | — | | | | | — | | | — | | | | 28,822 | |
Total | | — | | | | $28,822 | | | | $ | (130,380 | ) | | | $ | 589,529 | | | | | $(4,915 | ) | | — | | | $ | 483,056 | |
| | | | | |
| Net Change in Unrealized Appreciation (Depreciation) on: | | | | | | | | | | | | | | |
Financial futures contracts | | — | | | | — | | | | $ | 68,417 | | | | | — | | | | | $ 6,170 | | | — | | | $ | 74,587 | |
Foreign currency translations | | — | | | | — | | | | | — | | | | $ | (218,491 | ) | | | | — | | | — | | | | (218,491 | ) |
Swaps | | — | | | | $10,126 | | | | | — | | | | | — | | | | | — | | | — | | | | 10,126 | |
Total | | — | | | | $10,126 | | | | $ | 68,417 | | | | $ | (218,491 | ) | | | | $ 6,170 | | | — | | | $ | (133,778 | ) |
| | 1 | | Options purchased are included in the net realized gain (loss) from investments. |
| | |
| Average Quarterly Balances of Outstanding Derivative Financial Instruments | | |
| | | | |
Financial futures contracts: | | | | |
Average notional value of contracts - short | | $ | 2,473,471 | |
Forward foreign currency exchange contracts: | | | | |
Average amounts purchased - in USD | | $ | 2,607,460 | |
Average amounts sold - USD | | $ | 405,044 | |
Options: | | | | |
Average value of option contracts purchased | | $ | 4,524 | |
Average value of option contracts written | | $ | 1,334 | |
Credit default swaps: | | | | |
Average notional value - sell protection | | $ | 1,108,500 | |
For more information about the Fund’s investment risks regarding derivative financial instruments, refer to the Notes to Financial Statements.
See Notes to Financial Statements.
| | | | | | |
| 86 | | BLACKROCK SERIES FUND, INC. | | DECEMBER 31, 2015 | | |
| | | | |
| Schedule of Investments (continued) | | | BlackRock High Yield Portfolio | |
|
| Derivative Financial Instruments — Offsetting as of Period End |
The Fund’s derivative assets and liabilities (by type) were as follows:
| | | | | | | | |
| | | Assets | | | Liabilities | |
Derivative Financial Instruments: | | | | | | | | |
Financial futures contracts | | $ | 24,570 | | | | — | |
Forward foreign currency exchange contracts | | | 12,307 | | | | $34,363 | |
Swaps — Centrally cleared | | | — | | | | 294 | |
| | | | |
Total derivative assets and liabilities in the Statements of Assets and Liabilities | | $ | 36,877 | | | | $34,657 | |
Derivatives not subject to a Master Netting Agreement or similar agreement (“MNA”) | | | (24,570 | ) | | | (294 | ) |
| | | | |
Total derivative assets and liabilities subject to an MNA | | $ | 12,307 | | | | $34,363 | |
| | | | |
The following tables present the Fund’s derivative assets and liabilities by counterparty net of amounts available for offset under an MNA and net of the related collateral received and pledged by the Fund.
| | | | | | | | | | | | | | | | | | | | | | | | | |
| Counterparty | | Derivative Assets
Subject to an MNA by
Counterparty | | Derivatives Available
for Offset | | Non-cash
Collateral
Received | | Cash
Collateral
Received | | Net Amount of
Derivative Assets1 |
HSBC Bank PLC | | | $ | 12,307 | | | — | | — | | — | | | $ | 12,307 | |
| | | | | | | | | | | | | | | | | | | |
| Counterparty | | Derivative Liabilities
Subject to an MNA by
Counterparty | | Derivatives Available
for Offset | | Non-cash
Collateral
Pledged | | Cash
Collateral
Pledged | | Net Amount of
Derivative Liabilities2 |
UBS AG | | | $ | 34,363 | | | — | | — | | — | | | $ | 34,363 | |
| | 1 | | Net amount represents the net amount receivable due to the counterparty in the event of default. |
| | 2 | | Net amount represents the net amount payable due to the counterparty in the event of default. |
|
| Fair Value Hierarchy as of Period End |
Various inputs are used in determining the fair value of investments and derivative financial instruments. For information about the Fund’s policy regarding valuation of investments and derivative financial instruments, refer to the Notes to Financial Statements.
The following tables summarize the Fund’s investments and derivative financial instruments in the disclosure hierarchy:
| | | | | | | | | | | | | | | | |
| | | Level 1 | | | Level 2 | | | Level 3 | | | Total | |
Assets: | | | | | | | | | | | | | | | | |
Investments: | | | | | | | | | | | | | | | | |
Long-Term Investments3: | | | | | | | | | | | | | | | | |
Common Stocks | | $ | 946,844 | | | $ | 438,450 | | | $ | 195 | | | $ | 1,385,489 | |
Corporate Bonds | | | — | | | | 23,935,748 | | | | 220,758 | | | | 24,156,506 | |
Floating Rate Loan Interests | | | — | | | | 2,078,981 | | | | 72,220 | | | | 2,151,201 | |
Non-Agency Mortgage-Backed Securities | | | — | | | | 112,955 | | | | — | | | | 112,955 | |
Other Interests | | | — | | | | 10,326 | | | | 71,588 | | | | 81,914 | |
Preferred Securities | | | 352,488 | | | | 1,089,308 | | | | — | | | | 1,441,796 | |
Short-Term Securities | | | 1,971,388 | | | | — | | | | — | | | | 1,971,388 | |
| | | | |
Total | | $ | 3,270,720 | | | $ | 27,665,768 | | | $ | 364,761 | | | $ | 31,301,249 | |
| | | | |
| | 3 | | See above Schedule of Investments for values in each industry. |
See Notes to Financial Statements.
| | | | | | |
| | | BLACKROCK SERIES FUND, INC. | | DECEMBER 31, 2015 | | 87 |
| | | | |
| Schedule of Investments (concluded) | | | BlackRock High Yield Portfolio | |
| | | | | | | | | | | | | | |
| | | Level 1 | | | Level 2 | | | Level 3 | | Total | |
Derivative Financial Instruments1 | | | | | | | | | | | | | | |
Assets: | | | | | | | | | | | | | | |
Credit contracts | | | — | | | $ | 6,915 | | | — | | $ | 6,915 | |
Foreign currency exchange contracts | | | — | | | | 12,307 | | | — | | | 12,307 | |
Interest rate contracts | | $ | 6,170 | | | | — | | | — | | | 6,170 | |
Liabilities: | | | | | | | | | | | | | | |
Equity contracts | | | (39,440 | ) | | | — | | | — | | | (39,440 | ) |
Foreign currency exchange contracts | | | — | | | | (34,363 | ) | | — | | | (34,363 | ) |
| | | | |
Total | | $ | (33,270 | ) | | $ | (15,141 | ) | | — | | $ | (48,411 | ) |
| | | | |
| | 1 | | Derivative financial instruments are swaps, financial futures contracts and forward foreign currency exchange contracts. Swaps, financial futures contracts and forward foreign currency exchange contracts are valued at the unrealized appreciation (depreciation) on the instrument. |
The Fund may hold assets and/or liabilities in which the fair value approximates the carrying amount for financial statement purposes. As of period end, such assets and/or liabilities are categorized within the disclosure hierarchy as follows:
| | | | | | | | | | | | |
| | | Level 1 | | | Level 2 | | Level 3 | | Total | |
Assets: | | | | | | | | | | | | |
Foreign currency at value | | $ | 8,915 | | | — | | — | | $ | 8,915 | |
Cash pledged for financial futures contracts | | | 124,800 | | | — | | — | | | 124,800 | |
Cash pledged for centrally cleared swaps | | | 40,190 | | | — | | — | | | 40,190 | |
| | | | |
Total | | $ | 173,905 | | | — | | — | | $ | 173,905 | |
| | | | |
During the year ended December 31, 2015, there were no transfers between Level 1 and Level 2.
A reconciliation of Level 3 investments is presented when the Fund had a significant amount of Level 3 investments at the beginning and/or end of the year in relation to net assets. The following table is a reconciliation of Level 3 investments for which significant unobservable inputs were used in determining fair value:
| | | | | | | | | | | | | | | | | | | | |
| | | Common
Stocks | | | Corporate
Bonds | | | Floating Rate
Loan Interests | | | Other
Interests | | | Total | |
Assets: | | | | | | | | | | | | | | | | | | | | |
Opening Balance, as of December 31, 2014 | | $ | — | | | $ | 258,807 | | | | $ 435,457 | | | | $ 72,538 | | | $ | 766,802 | |
Transfers into Level 3 | | | — | | | | — | | | | — | | | | — | | | | — | |
Transfers out of Level 3 | | | — | | | | — | | | | (191,186 | ) | | | — | | | | (191,186 | ) |
Accrued discounts/premiums | | | — | | | | — | | | | 1,373 | | | | — | | | | 1,373 | |
Net realized gain (loss) | | | (305,426 | ) | | | (41,275 | ) | | | (1,872 | ) | | | — | | | | (348,573 | ) |
Net change in unrealized appreciation (depreciation)2,3 | | | 305,426 | | | | 42,798 | | | | 18,949 | | | | (950 | ) | | | 366,223 | |
Purchases | | | 195 | | | | 82,479 | | | | 81,408 | | | | — | | | | 164,082 | |
Sales | | | — | | | | (122,051 | ) | | | (271,909 | ) | | | — | | | | (393,960 | ) |
| | | | |
Closing Balance, as of December 31, 2015 | | $ | 195 | | | $ | 220,758 | | | | $ 72,220 | | | | $ 71,588 | | | $ | 364,761 | |
| | | | |
Net change in unrealized appreciation (depreciation) on investments still held at December 31, 20153 | | | — | | | $ | (4,500 | ) | | | $ (1,318 | ) | | | $ (950 | ) | | $ | (6,768 | ) |
| | | | |
| | 2 | | Included in the related change in unrealized appreciation (depreciation) in the Statements of Operations. |
| | 3 | | Any difference between net change in unrealized appreciation (depreciation) and net change in unrealized appreciation (depreciation) on investments still held at December 31, 2015 is generally due to investments no longer held or categorized as Level 3 at period end. |
The Fund’s investments that are categorized as Level 3 were valued utilizing third party pricing information without adjustment. Such valuations are based on unobservable inputs. A significant change in third party information could result in a significantly lower or higher value of such Level 3 investments.
See Notes to Financial Statements.
| | | | | | |
| 88 | | BLACKROCK SERIES FUND, INC. | | DECEMBER 31, 2015 | | |
| | | | |
| Schedule of Investments December 31, 2015 | | | BlackRock Large Cap Core Portfolio | |
| | | (Percentages shown are based on Net Assets) | |
| | | | | | | | |
| Common Stocks | | Shares | | | Value | |
Aerospace & Defense — 1.3% | | | | | | | | |
Raytheon Co. | | | 17,330 | | | $ | 2,158,105 | |
Air Freight & Logistics — 1.3% | | | | | | | | |
FedEx Corp. | | | 14,280 | | | | 2,127,577 | |
Airlines — 2.1% | | | | | | | | |
Southwest Airlines Co. | | | 58,400 | | | | 2,514,704 | |
United Continental Holdings, Inc. (a) | | | 18,600 | | | | 1,065,780 | |
| | | | | | | | |
| | | | | | | | 3,580,484 | |
Auto Components — 2.3% | | | | | | | | |
Goodyear Tire & Rubber Co. | | | 30,900 | | | | 1,009,503 | |
Lear Corp. | | | 22,900 | | | | 2,812,807 | |
| | | | | | | | |
| | | | | | | | 3,822,310 | |
Banks — 12.0% | | | | | | | | |
Bank of America Corp. | | | 235,879 | | | | 3,969,844 | |
Citigroup, Inc. | | | 79,493 | | | | 4,113,763 | |
JPMorgan Chase & Co. | | | 87,165 | | | | 5,755,505 | |
SunTrust Banks, Inc. | | | 58,730 | | | | 2,515,993 | |
U.S. Bancorp | | | 93,765 | | | | 4,000,952 | |
| | | | | | | | |
| | | | | | | | 20,356,057 | |
Beverages — 2.3% | | | | | | | | |
Dr. Pepper Snapple Group, Inc. | | | 26,000 | | | | 2,423,200 | |
Molson Coors Brewing Co., Class B | | | 15,800 | | | | 1,483,936 | |
| | | | | | | | |
| | | | | | | | 3,907,136 | |
Biotechnology — 2.8% | | | | | | | | |
Amgen, Inc. | | | 20,980 | | | | 3,405,683 | |
Gilead Sciences, Inc. | | | 13,800 | | | | 1,396,422 | |
| | | | | | | | |
| | | | | | | | 4,802,105 | |
Building Products — 0.5% | | | | | | | | |
Owens Corning | | | 19,300 | | | | 907,679 | |
Capital Markets — 1.7% | | | | | | | | |
Goldman Sachs Group, Inc. | | | 16,470 | | | | 2,968,388 | |
Chemicals — 1.5% | | | | | | | | |
Dow Chemical Co. | | | 22,700 | | | | 1,168,596 | |
Eastman Chemical Co. | | | 19,570 | | | | 1,321,171 | |
| | | | | | | | |
| | | | | | | | 2,489,767 | |
Communications Equipment — 2.9% | | | | | | | | |
Brocade Communications Systems, Inc. | | | 116,856 | | | | 1,072,738 | |
Cisco Systems, Inc. | | | 140,450 | | | | 3,813,920 | |
| | | | | | | | |
| | | | | | | | 4,886,658 | |
Consumer Finance — 0.6% | | | | | | | | |
SLM Corp. (a) | | | 161,658 | | | | 1,054,010 | |
Containers & Packaging — 0.5% | | | | | | | | |
Packaging Corp. of America | | | 13,641 | | | | 860,065 | |
Electronic Equipment, Instruments & Components — 0.6% | | | | | |
CDW Corp. | | | 26,060 | | | | 1,095,562 | |
Energy Equipment & Services — 2.1% | | | | | | | | |
Atwood Oceanics, Inc. (b) | | | 43,100 | | | | 440,913 | |
Schlumberger Ltd. | | | 40,040 | | | | 2,792,790 | |
Weatherford International PLC (a)(b) | | | 45,550 | | | | 382,165 | |
| | | | | | | | |
| | | | | | | | 3,615,868 | |
Food & Staples Retailing — 2.8% | | | | | | | | |
CVS Health Corp. | | | 45,875 | | | | 4,485,199 | |
Kroger Co. | | | 5,300 | | | | 221,699 | |
| | | | | | | | |
| | | | | | | | 4,706,898 | |
Food Products — 1.1% | | | | | | | | |
Pilgrim’s Pride Corp. (b) | | | 13,900 | | | | 307,051 | |
| | | | | | | | |
| Common Stocks | | Shares | | | Value | |
Food Products (continued) | | | | | | | | |
Tyson Foods, Inc., Class A | | | 30,270 | | | $ | 1,614,299 | |
| | | | | | | | |
| | | | | | | | 1,921,350 | |
Health Care Equipment & Supplies — 0.1% | | | | | | | | |
Medtronic PLC | | | 2,470 | | | | 189,992 | |
Health Care Providers & Services — 11.7% | | | | | | | | |
Aetna, Inc. | | | 35,800 | | | | 3,870,696 | |
Centene Corp. (a)(b) | | | 28,200 | | | | 1,855,842 | |
Cigna Corp. | | | 26,100 | | | | 3,819,213 | |
Express Scripts Holding Co. (a) | | | 6,200 | | | | 541,942 | |
Humana, Inc. | | | 9,500 | | | | 1,695,845 | |
Laboratory Corp. of America Holdings (a) | | | 15,570 | | | | 1,925,075 | |
McKesson Corp. | | | 7,700 | | | | 1,518,671 | |
UnitedHealth Group, Inc. | | | 25,400 | | | | 2,988,056 | |
Universal Health Services, Inc., Class B | | | 12,922 | | | | 1,544,050 | |
| | | | | | | | |
| | | | | | | | 19,759,390 | |
Hotels, Restaurants & Leisure — 2.5% | | | | | | | | |
Carnival Corp. | | | 69,508 | | | | 3,786,796 | |
Las Vegas Sands Corp. | | | 8,500 | | | | 372,640 | |
| | | | | | | | |
| | | | | | | | 4,159,436 | |
Household Durables — 1.3% | | | | | | | | |
DR Horton, Inc. (b) | | | 23,972 | | | | 767,823 | |
Lennar Corp., Class A (b) | | | 13,500 | | | | 660,285 | |
NVR, Inc. (a) | | | 242 | | | | 397,606 | |
Toll Brothers, Inc. (a) | | | 11,144 | | | | 371,095 | |
| | | | | | | | |
| | | | | | | | 2,196,809 | |
Industrial Conglomerates — 0.4% | | | | | | | | |
3M Co. | | | 4,175 | | | | 628,922 | |
| |
Insurance — 3.4% | | | | | | | | |
American International Group, Inc. | | | 62,200 | | | | 3,854,534 | |
Travelers Cos., Inc. | | | 17,320 | | | | 1,954,735 | |
| | | | | | | | |
| | | | | | | | 5,809,269 | |
Internet & Catalog Retail — 1.0% | | | | | | | | |
Priceline Group, Inc. (a) | | | 1,350 | | | | 1,721,183 | |
Internet Software & Services — 5.2% | | | | | | | | |
Alphabet, Inc., Class A (a) | | | 3,985 | | | | 3,100,370 | |
Alphabet, Inc., Class C (a) | | | 4,166 | | | | 3,161,494 | |
Facebook, Inc., Class A (a) | | | 24,070 | | | | 2,519,166 | |
| | | | | | | | |
| | | | | | | | 8,781,030 | |
IT Services — 5.7% | | | | | | | | |
Amdocs Ltd. | | | 25,796 | | | | 1,407,688 | |
Cognizant Technology Solutions Corp., Class A (a) | | | 44,800 | | | | 2,688,896 | |
DST Systems, Inc. | | | 6,743 | | | | 769,107 | |
MasterCard, Inc., Class A | | | 36,100 | | | | 3,514,696 | |
Total System Services, Inc. | | | 24,890 | | | | 1,239,522 | |
| | | | | | | | |
| | | | | | | | 9,619,909 | |
Machinery — 0.3% | | | | | | | | |
WABCO Holdings, Inc. (a)(b) | | | 5,500 | | | | 562,430 | |
Media — 3.9% | | | | | | | | |
Comcast Corp., Class A | | | 79,500 | | | | 4,486,185 | |
Omnicom Group, Inc. (b) | | | 16,050 | | | | 1,214,343 | |
Viacom, Inc., Class B | | | 20,900 | | | | 860,244 | |
| | | | | | | | |
| | | | | | | | 6,560,772 | |
Multi-Utilities — 0.8% | | | | | | | | |
Public Service Enterprise Group, Inc. | | | 36,200 | | | | 1,400,578 | |
See Notes to Financial Statements.
| | | | | | |
| | | BLACKROCK SERIES FUND, INC. | | DECEMBER 31, 2015 | | 89 |
| | | | |
| Schedule of Investments (continued) | | | BlackRock Large Cap Core Portfolio | |
| | | | | | | | |
| Common Stocks | | Shares | | | Value | |
Oil, Gas & Consumable Fuels — 3.2% | | | | | | | | |
BP PLC - ADR | | | 52,040 | | | $ | 1,626,770 | |
Exxon Mobil Corp. | | | 1,360 | | | | 106,012 | |
Hess Corp. | | | 5,068 | | | | 245,697 | |
PBF Energy, Inc., Class A | | | 6,960 | | | | 256,198 | |
Suncor Energy, Inc. | | | 69,650 | | | | 1,796,970 | |
Tesoro Corp. | | | 5,518 | | | | 581,432 | |
Valero Energy Corp. | | | 10,400 | | | | 735,384 | |
| | | | | | | | |
| | | | | | | | 5,348,463 | |
Paper & Forest Products — 0.4% | | | | | | | | |
Domtar Corp. | | | 19,800 | | | | 731,610 | |
Pharmaceuticals — 3.3% | | | | | | | | |
Allergan PLC (a) | | | 3,600 | | | | 1,125,000 | |
Johnson & Johnson | | | 6,150 | | | | 631,728 | |
Merck & Co., Inc. | | | 4,548 | | | | 240,225 | |
Pfizer, Inc. | | | 5,570 | | | | 179,800 | |
Teva Pharmaceutical Industries Ltd. - ADR | | | 51,161 | | | | 3,358,208 | |
| | | | | | | | |
| | | | | | | | 5,534,961 | |
Semiconductors & Semiconductor Equipment — 1.8% | | | | | |
Intel Corp. | | | 29,590 | | | | 1,019,375 | |
Micron Technology, Inc. (a) | | | 39,640 | | | | 561,302 | |
NVIDIA Corp. | | | 42,800 | | | | 1,410,688 | |
| | | | | | | | |
| | | | | | | | 2,991,365 | |
Software — 3.9% | | | | | | | | |
Activision Blizzard, Inc. | | | 60,850 | | | | 2,355,503 | |
Microsoft Corp. | | | 57,040 | | | | 3,164,579 | |
Oracle Corp. | | | 30,040 | | | | 1,097,361 | |
| | | | | | | | |
| | | | | | | | 6,617,443 | |
Specialty Retail — 5.9% | | | | | | | | |
Home Depot, Inc. | | | 31,400 | | | | 4,152,650 | |
Lowe’s Cos., Inc. | | | 56,400 | | | | 4,288,656 | |
Ross Stores, Inc. | | | 27,528 | | | | 1,481,282 | |
| | | | | | | | |
| | | | | | | | 9,922,588 | |
| | | | | | | | |
| Common Stocks | | Shares | | | Value | |
Technology Hardware, Storage & Peripherals — 3.7% | | | | | |
Apple Inc. | | | 36,900 | | | $ | 3,884,094 | |
EMC Corp. | | | 20,770 | | | | 533,374 | |
Western Digital Corp. | | | 29,740 | | | | 1,785,887 | |
| | | | | | | | |
| | | | | | | | 6,203,355 | |
Textiles, Apparel & Luxury Goods — 0.2% | | | | | | | | |
Fossil Group, Inc. (a) | | | 7,900 | | | | 288,824 | |
Tobacco — 2.0% | | | | | | | | |
Altria Group, Inc. | | | 58,525 | | | | 3,406,740 | |
Total Common Stocks — 99.1% | | | | | | | 167,695,088 | |
| | | | | | | | |
| Investment Companies — 0.4% | | | | | | |
Utilities Select Sector SPDR Fund (b) | | | 14,300 | | | | 618,904 | |
Total Long-Term Investments (Cost — $135,649,678) — 99.5% | | | | | | | 168,313,992 | |
| | | | | | | | |
| Short-Term Securities | | | | | | |
BlackRock Liquidity Funds, TempFund, Institutional Class, 0.23% (c)(d) | | | 914,407 | | | | 914,407 | |
| | | Beneficial
Interest
(000) | | | | |
BlackRock Liquidity Series, LLC, Money Market Series, 0.39% (c)(d)(e) | | | $ 6,717 | | | | 6,716,532 | |
Total Short-Term Securities (Cost — $7,630,939) — 4.5% | | | | | | | 7,630,939 | |
Total Investments (Cost — $143,280,617) — 104.0% | | | | 175,944,931 | |
Liabilities in Excess of Other Assets — (4.0)% | | | | | | | (6,771,859 | ) |
| | | | | | | | |
Net Assets — 100.0% | | | | | | $ | 169,173,072 | |
| | | | | | | | |
|
| Notes to Schedule of Investments |
| (a) | Non-income producing security. |
| (b) | Security, or a portion of security, is on loan. |
| (c) | During the year ended December 31, 2015, investments in issuers considered to be an affiliate of the Fund for purposes of Section 2(a)(3) of the Investment Company Act of 1940, as amended, were as follows: |
| | | | | | | | | | | | | | | | | | | | |
| Affiliate | | Shares/Beneficial
Interest Held at
December 31, 2014 | | | Net
Activity | | | Shares/Beneficial
Interest Held at
December 31, 2015 | | | Income | | | Realized
Gain | |
BlackRock Liquidity Funds, TempFund, Institutional Class | | | 3,805,787 | | | | (2,891,380 | ) | | | 914,407 | | | $ | 2,036 | | | | $41 | |
BlackRock Liquidity Series, LLC, Money Market Series | | | — | | | $ | 6,716,532 | | | | $6,716,532 | | | $ | 10,155 | 1 | | | — | |
| 1 | | Represents securities lending income earned from the reinvestment of cash collateral from loaned securities, net of fees, and other payments to and from borrowers of securities, and less the collateral investment expenses. |
| (d) | Current yield as of period end. |
| (e) | Security was purchased with the cash collateral from loaned securities. The Fund may withdraw up to 25% of its investment daily, although the manager of the BlackRock Liquidity Series, LLC, Money Market Series, in its sole discretion, may permit an investor to withdraw more than 25% on any one day. |
| • | | For Fund compliance purposes, the Fund’s industry classifications refer to any one or more of the industry sub-classifications used by one or more widely recognized market indexes or ratings group indexes, and/or as defined by the investment advisor. These definitions may not apply for purposes of this report, which may combine such industry sub-classifications for reporting ease. |
See Notes to Financial Statements.
| | | | | | |
| 90 | | BLACKROCK SERIES FUND, INC. | | DECEMBER 31, 2015 | | |
| | | | |
| Schedule of Investments (concluded) | | | BlackRock Large Cap Core Portfolio | |
|
| Fair Value Hierarchy as of Period End |
Various inputs are used in determining the fair value of investments. For information about the Fund’s policy regarding valuation of investments, refer to the Notes to Financial Statements.
The following table summarizes the Fund’s investments categorized in the disclosure hierarchy:
| | | | | | | | | | | | | | |
| | | Level 1 | | | Level 2 | | | Level 3 | | Total | |
Assets: | | | | | | | | | | | | | | |
Investments: | | | | | | | | | | | | | | |
Long-Term Investments: | | | | | | | | | | | | | | |
Common Stocks1 | | $ | 167,695,088 | | | | — | | | — | | $ | 167,695,088 | |
Investment Companies | | | 618,904 | | | | — | | | — | | | 618,904 | |
Short-Term Securities | | | 914,407 | | | $ | 6,716,532 | | | — | | | 7,630,939 | |
| | | | |
Total | | $ | 169,228,399 | | | $ | 6,716,532 | | | — | | $ | 175,944,931 | |
| | | | |
| | 1 | | See above Schedule of Investments for values in each industry. |
The Fund may hold liabilities in which the fair value approximates the carrying amount for financial statement purposes. As of period end, collateral on securities loaned at value of $6,716,532 is categorized as level 2 within the disclosure hierarchy.
During the year ended December 31, 2015, there were no transfers between levels.
See Notes to Financial Statements.
| | | | | | |
| | | BLACKROCK SERIES FUND, INC. | | DECEMBER 31, 2015 | | 91 |
| | | | |
| Schedule of Investments December 31, 2015 | | | BlackRock Total Return Portfolio | |
| | | (Percentages shown are based on Net Assets) | |
| | | | | | | | | | | | |
| Asset-Backed Securities | | | | | Par (000) | | | Value | |
ACAS CLO Ltd., Series 2012-1AR, Class BR,
2.64%, 9/20/23 (a)(b) | | | USD | | | | 250 | | | $ | 248,712 | |
ACE Securities Corp. Home Equity Loan Trust: | | | | | | | | | | | | |
Series 2003-OP1, Class A2, 1.14%, 12/25/33 (b) | | | | | | | 23 | | | | 18,614 | |
Series 2006-CW1, Class A2D, 0.68%, 7/25/36 (b) | | | | | | | 195 | | | | 108,596 | |
B2R Mortgage Trust: | | | | | | | | | | | | |
Series 2015-1, Class A1, 2.52%, 5/15/48 (a) | | | | | | | 98 | | | | 95,671 | |
Series 2015-2, Class A, 3.34%, 11/15/48 (a) | | | | | | | 100 | | | | 99,507 | |
Bayview Opportunity Master Fund IIIA Trust, Series 2014-16RP, Class A, 3.84%, 11/28/29 (a)(c) | | | | | | | 49 | | | | 48,130 | |
BCMSC Trust: | | | | | | | | | | | | |
Series 2000-A, Class A2, 7.58%, 6/15/30 (b) | | | | | | | 20 | | | | 10,154 | |
Series 2000-A, Class A3, 7.83%, 6/15/30 (b) | | | | | | | 18 | | | | 9,717 | |
Series 2000-A, Class A4, 8.29%, 6/15/30 (b) | | | | | | | 32 | | | | 17,845 | |
Bear Stearns Asset-Backed Securities I Trust, Series 2006-HE10, Class 22A, 0.56%, 11/25/36-3/25/37 (b) | | | | | | | 123 | | | | 97,354 | |
CHLUPA Trust, Series 2013-VM, Class A,
3.33%, 8/15/20 (a) | | | | | | | 44 | | | | 43,805 | |
CIFC Funding Ltd.: | | | | | | | | | | | | |
Series 2011-1AR, Class A1R,
1.59%, 1/19/23 (a)(b) | | | | | | | 98 | | | | 97,799 | |
Series 2014-2A, Class A1L,
1.86%, 5/24/26 (a)(b) | | | | | | | 250 | | | | 247,020 | |
Citigroup Mortgage Loan Trust, Series 2006-NC1, Class A2D, 0.67%, 8/25/36 (b) | | | | | | | 30 | | | | 22,078 | |
Citigroup Mortgage Loan Trust, Inc., Series 2007-WFH3, Class A3, 0.67%, 6/25/37 (b) | | | | | | | 30 | | | | 24,692 | |
Countrywide Asset-Backed Certificates: | | | | | | | | | | | | |
Series 2003-BC3, Class A2, 1.04%, 9/25/33 (b) | | | | | | | 27 | | | | 25,094 | |
Series 2004-5, Class A, 1.32%, 10/25/34 (b) | | | | | | | 32 | | | | 31,137 | |
Series 2006-8, Class 2A3, 0.58%, 1/25/46 (b) | | | | | | | 41 | | | | 37,111 | |
Series 2006-S10, Class A3, 0.74%, 10/25/36 (b) | | | | | | | 39 | | | | 30,932 | |
Series 2006-S3, Class A4, 6.43%, 1/25/29 (c) | | | | | | | 22 | | | | 21,288 | |
Series 2006-SPS1, Class A, 0.64%, 12/25/25 (b) | | | | | | | 2 | | | | 7,756 | |
CT CDO IV Ltd., Series 2006-4A, Class A1,
0.71%, 10/20/43 (a)(b) | | | | | | | 15 | | | | 14,964 | |
CWHEQ Home Equity Loan Trust: | | | | | | | | | | | | |
Series 2006-S5, Class A4, 5.84%, 6/25/35 | | | | | | | 18 | | | | 17,222 | |
Series 2006-S5, Class A5, 6.16%, 6/25/35 | | | | | | | 18 | | | | 16,069 | |
Series 2007-S1, Class A3, 5.81%, 11/25/36 (b) | | | | | | | 36 | | | | 35,934 | |
CWHEQ Revolving Home Equity Loan Resecuritization Trust, Series 2006-RES, Class 4Q1B, 0.50%, 12/15/33 (a)(b) | | | | | | | 42 | | | | 35,695 | |
CWHEQ Revolving Home Equity Loan Trust, Series 2005-B, Class 2A, 0.51%, 5/15/35 (b) | | | | | | | 16 | | | | 13,168 | |
DCP Rights LLC, Series 2014-1A, Class A,
5.46%, 10/25/44 (a) | | | | | | | 110 | | | | 109,169 | |
| | | | | | | | | | | | |
| Asset-Backed Securities | | | | | Par (000) | | | Value | |
Ford Credit Floorplan Master Owner Trust, Series 2012-5, Class C, 2.14%, 9/15/19 | | | USD | | | | 100 | | | $ | 100,066 | |
GSAMP Trust, Series 2007-H1, Class A1B,
0.62%, 1/25/47 (b) | | | | | | | 18 | | | | 12,001 | |
Home Equity Mortgage Trust, Series 2006-2, Class 1A1, 5.37%, 7/25/36 | | | | | | | 17 | | | | 7,329 | |
Home Loan Mortgage Loan Trust, Series 2005-1, Class A3, 0.69%, 4/15/36 (b) | | | | | | | 23 | | | | 20,452 | |
JPMorgan Mortgage Acquisition Trust, Series 2006-WF1, Class A3A, 5.83%, 7/25/36 (c) | | | | | | | 65 | | | | 39,114 | |
Lehman ABS Manufactured Housing Contract Trust, Series 2001-B, Class M1, 6.63%, 3/15/28 (b) | | | | | | | 40 | | | | 42,718 | |
Litigation Fee Residual Funding LLC, Series 2015-1, Class A, 3.50%, 10/01/27 (a) | | | | | | | 106 | | | | 105,788 | |
Long Beach Mortgage Loan Trust: | | | | | | | | | | | | |
Series 2006-1, Class 1A,
0.64%, 2/25/36-11/25/36 (b) | | | | | | | 68 | | | | 47,581 | |
Series 2006-2, Class 2A3, 0.61%, 3/25/46 (b) | | | | | | | 30 | | | | 12,045 | |
Morgan Stanley ABS Capital I, Inc., Trust, Series 2005-HE1, Class A2MZ, 1.02%, 12/25/34 (b) | | | | | | | 35 | | | | 31,156 | |
Navient Private Education Loan Trust, Series 2014-CTA, Class B, 2.08%, 10/17/44 (a)(b) | | | | | | | 100 | | | | 94,848 | |
New Century Home Equity Loan Trust, Series 2006-1, Class A2C, 0.70%, 5/25/36 (b) | | | | | | | 60 | | | | 32,065 | |
OHA Loan Funding Ltd., Series 2013-2A, Class A,
1.65%, 8/23/24 (a)(b) | | | | | | | 200 | | | | 198,532 | |
OneMain Financial Issuance Trust, Series 2014-1A, Class A, 2.43%, 6/18/24 (a) | | | | | | | 125 | | | | 124,569 | |
Option One Mortgage Acceptance Corp. Asset Back Certificates, Series 2003-4, Class A2,
1.06%, 7/25/33 (b) | | | | | | | 50 | | | | 47,107 | |
OZLM Funding IV Ltd., Series 2013-4A, Class A1,
1.47%, 7/22/25 (a)(b) | | | | | | | 250 | | | | 245,625 | |
OZLM Funding Ltd., Series 2012-2A, Class A1,
1.80%, 10/30/23 (a)(b) | | | | | | | 250 | | | | 249,417 | |
PFS Financing Corp., Series 2013-AA, Class B,
1.43%, 2/16/18 (a)(b) | | | | | | | 170 | | | | 169,800 | |
RASC Trust, Series 2003-KS5, Class AIIB,
1.00%, 7/25/33 (b) | | | | | | | 19 | | | | 17,185 | |
RCO Mortgage LLC, Series 2015-NQM1, Class A,
3.50%, 6/25/23 (a)(b) | | | | | | | 50 | | | | 49,960 | |
Santander Drive Auto Receivables Trust: | | | | | | | | | | | | |
Series 2014-S4, Class R,
1.43%, 4/16/19-6/18/19 (a) | | | | | | | 31 | | | | 31,323 | |
Series 2014-S6, Class R, 1.43%, 12/17/19 (a) | | | | | | | 4 | | | | 4,103 | |
SASCO Mortgage Loan Trust, Series 2005-GEL2, Class A, 0.70%, 4/25/35 (b) | | | | | | | 2 | | | | 2,068 | |
Scholar Funding Trust: | | | | | | | | | | | | |
Series 2011-A, Class A, 1.22%, 10/28/43 (a)(b) | | | | | | | 63 | | | | 60,259 | |
Series 2013-A, Class A, 1.07%, 1/30/45 (a)(b) | | | | | | | 187 | | | | 174,226 | |
Silvermore CLO Ltd., Series 2014-1A, Class A1,
1.81%, 5/15/26 (a)(b) | | | | | | | 250 | | | | 246,760 | |
SLM Private Credit Student Loan Trust: | | | | | | | | | | | | |
Series 2004-B, Class A2, 0.71%, 6/15/21 (b) | | | | | | | 47 | | | | 46,236 | |
Series 2004-B, Class A3, 0.84%, 3/15/24 (b) | | | | | | | 25 | | | | 23,592 | |
See Notes to Financial Statements.
| | | | | | |
| 92 | | BLACKROCK SERIES FUND, INC. | | DECEMBER 31, 2015 | | |
| | | | |
| Schedule of Investments (continued) | | | BlackRock Total Return Portfolio | |
| | | | |
| | | | | | | | | | | | |
| Asset-Backed Securities | | | | | Par (000) | | | Value | |
SLM Private Education Loan Trust, Series 2013-B, Class A2A, 1.85%, 6/17/30 (a) | | | USD | | | | 320 | | | $ | 311,225 | |
SLM Student Loan Trust, Series 2013-C, Class A2B, 1.73%, 10/15/31 (a)(b) | | | | | | | 100 | | | | 100,137 | |
SMB Private Education Loan Trust, Series 2015-B, Class A3, 2.08%, 5/17/32 (a)(b) | | | | | | | 100 | | | | 97,779 | |
SoFi Professional Loan Program LLC, Series 2015-B, Class A2, 2.51%, 9/27/32 (a) | | | | | | | 87 | | | | 85,563 | |
SpringCastle America Funding LLC, Series 2014-AA, Class B, 4.61%, 10/25/27 (a) | | | | | | | 25 | | | | 25,047 | |
Structured Asset Securities Corp. Mortgage Pass-Through Certificates, Series 2004-23XS, Class 2A1,
0.72%, 1/25/35 (b) | | | | | | | 51 | | | | 47,369 | |
SWAY Residential Trust, Series 2014-1, Class A,
1.65%, 1/17/20 (a)(b) | | | | | | | 99 | | | | 97,233 | |
Symphony CLO XV Ltd., Series 2014-15A, Class B1,
2.52%, 10/17/26 (a)(b) | | | | | | | 250 | | | | 247,879 | |
TICP CLO III Ltd., Series 2014-3A, Class A,
1.86%, 1/20/27 (a)(b) | | | | | | | 250 | | | | 246,626 | |
Tricon American Homes Trust, Series 2015-SFR1, Class A, 1.57%, 5/17/32 (a)(b) | | | | | | | 100 | | | | 97,943 | |
U.S. Residential Opportunity Fund Trust, Series 2015-1III, Class A, 3.72%, 1/27/35 (a) | | | | | | | 75 | | | | 74,159 | |
Venture XIX CLO Ltd., Series 2014-19A, Class A,
1.92%, 1/15/26 (a)(b) | | | | | | | 250 | | | | 248,369 | |
Wachovia Asset Securitization Issuance II LLC Trust, Series 2007-HE2A, Class A, 0.55%, 7/25/37 (a)(b) | | | | | | | 37 | | | | 32,866 | |
Total Asset-Backed Securities — 8.9% | | | | | | | | | | | 5,533,353 | |
| | | | | | | | | | | | |
| Corporate Bonds | | | | | | | | | |
Aerospace & Defense — 0.4% | | | | | | | | | | | | |
BAE Systems Holdings, Inc.: | | | | | | | | | | | | |
2.85%, 12/15/20 (a) | | | | | | | 12 | | | | 11,969 | |
3.85%, 12/15/25 (a) | | | | | | | 8 | | | | 7,920 | |
4.75%, 10/07/44 (a) | | | | | | | 3 | | | | 2,920 | |
Boeing Co.: | | | | | | | | | | | | |
2.20%, 10/30/22 | | | | | | | 4 | | | | 3,861 | |
2.60%, 10/30/25 | | | | | | | 6 | | | | 5,808 | |
Lockheed Martin Corp.: | | | | | | | | | | | | |
3.10%, 1/15/23 | | | | | | | 5 | | | | 4,997 | |
3.55%, 1/15/26 | | | | | | | 14 | | | | 14,049 | |
3.60%, 3/01/35 | | | | | | | 19 | | | | 16,991 | |
4.50%, 5/15/36 | | | | | | | 5 | | | | 5,062 | |
4.07%, 12/15/42 | | | | | | | 16 | | | | 14,807 | |
4.70%, 5/15/46 | | | | | | | 16 | | | | 16,390 | |
Northrop Grumman Corp., 3.85%, 4/15/45 | | | | | | | 12 | | | | 10,783 | |
Raytheon Co., 3.15%, 12/15/24 | | | | | | | 10 | | | | 10,020 | |
United Technologies Corp.: | | | | | | | | | | | | |
1.78%, 5/04/18 (c) | | | | | | | 78 | | | | 77,213 | |
4.15%, 5/15/45 | | | | | | | 19 | | | | 18,154 | |
| | | | | | | | | | | | |
| | | | | | | | | | | | 220,944 | |
Air Freight & Logistics — 0.1% | | | | | | | | | | | | |
FedEx Corp.: | | | | | | | | | | | | |
4.90%, 1/15/34 | | | | | | | 32 | | | | 32,874 | |
3.90%, 2/01/35 | | | | | | | 3 | | | | 2,731 | |
| | | | | | | | | | | | |
| Corporate Bonds | | | | | Par (000) | | | Value | |
Air Freight & Logistics (continued) | | | | | | | | | | | | |
4.10%, 2/01/45 | | | USD | | | | 20 | | | $ | 17,822 | |
4.75%, 11/15/45 | | | | | | | 16 | | | | 15,852 | |
| | | | | | | | | | | | |
| | | | | | | | | | | | 69,279 | |
Airlines — 0.3% | | | | | | | | | | | | |
American Airlines Group, Inc., 4.63%, 3/01/20 (a) | | | | | | | 34 | | | | 32,385 | |
American Airlines Pass-Through Trust, Series 2015-1, Class A, 3.38%, 5/01/27 | | | | | | | 84 | | | | 81,312 | |
Southwest Airlines Co.: | | | | | | | | | | | | |
2.75%, 11/06/19 | | | | | | | 11 | | | | 11,085 | |
2.65%, 11/05/20 | | | | | | | 25 | | | | 24,873 | |
Turkish Airlines Pass-Through Trust, Series 2015-1, Class A, 4.20%, 9/15/28 (a) | | | | | | | 21 | | | | 20,638 | |
United Airlines Pass-Through Trust, Series 2014-1, Class B, 4.75%, 10/11/23 | | | | | | | 7 | | | | 6,656 | |
| | | | | | | | | | | | |
| | | | | | | | | | | | 176,949 | |
Auto Components — 0.2% | | | | | | | | | | | | |
BorgWarner, Inc., 3.38%, 3/15/25 | | | | | | | 23 | | | | 21,713 | |
Delphi Automotive PLC, 4.25%, 1/15/26 | | | | | | | 30 | | | | 30,134 | |
Icahn Enterprises LP/Icahn Enterprises Finance Corp.: | | | | | | | | | | | | |
3.50%, 3/15/17 | | | | | | | 20 | | | | 20,100 | |
4.88%, 3/15/19 | | | | | | | 25 | | | | 24,775 | |
6.00%, 8/01/20 | | | | | | | 30 | | | | 30,252 | |
| | | | | | | | | | | | |
| | | | | | | | | | | | 126,974 | |
Banks — 4.0% | | | | | | | | | | | | |
Bank of America Corp.: | | | | | | | | | | | | |
2.25%, 4/21/20 | | | | | | | 155 | | | | 151,259 | |
3.30%, 1/11/23 | | | | | | | 76 | | | | 74,809 | |
4.00%, 1/22/25 | | | | | | | 65 | | | | 63,630 | |
3.95%, 4/21/25 | | | | | | | 82 | | | | 79,849 | |
3.88%, 8/01/25 | | | | | | | 129 | | | | 130,952 | |
4.88%, 4/01/44 | | | | | | | 5 | | | | 5,177 | |
Bank of Nova Scotia: | | | | | | | | | | | | |
1.30%, 7/21/17 | | | | | | | 248 | | | | 247,222 | |
2.80%, 7/21/21 | | | | | | | 110 | | | | 110,605 | |
BB&T Corp., 2.45%, 1/15/20 | | | | | | | 40 | | | | 40,268 | |
Citigroup, Inc.: | | | | | | | | | | | | |
1.80%, 2/05/18 | | | | | | | 58 | | | | 57,778 | |
2.50%, 9/26/18 | | | | | | | 106 | | | | 106,921 | |
2.50%, 7/29/19 | | | | | | | 153 | | | | 152,769 | |
3.50%, 5/15/23 | | | | | | | 39 | | | | 38,345 | |
3.88%, 3/26/25 | | | | | | | 40 | | | | 38,932 | |
HSBC Bank Brasil SA - Banco Multiplo,
4.00%, 5/11/16 (a) | | | | | | | 330 | | | | 330,825 | |
HSBC USA, Inc.: | | | | | | | | | | | | |
2.35%, 3/05/20 | | | | | | | 162 | | | | 160,117 | |
2.75%, 8/07/20 | | | | | | | 100 | | | | 100,010 | |
JPMorgan Chase & Co.: | | | | | | | | | | | | |
1.35%, 2/15/17 | | | | | | | 152 | | | | 151,694 | |
2.20%, 10/22/19 | | | | | | | 35 | | | | 34,717 | |
2.75%, 6/23/20 | | | | | | | 7 | | | | 7,031 | |
3.88%, 9/10/24 | | | | | | | 112 | | | | 111,411 | |
3.90%, 7/15/25 | | | | | | | 64 | | | | 65,953 | |
4.25%, 10/01/27 | | | | | | | 30 | | | | 29,928 | |
U.S. Bancorp, 2.95%, 7/15/22 | | | | | | | 71 | | | | 70,591 | |
Wells Fargo & Co.: | | | | | | | | | | | | |
2.60%, 7/22/20 | | | | | | | 69 | | | | 68,823 | |
2.55%, 12/07/20 | | | | | | | 27 | | | | 26,867 | |
3.55%, 9/29/25 | | | | | | | 35 | | | | 35,315 | |
See Notes to Financial Statements.
| | | | | | |
| | | BLACKROCK SERIES FUND, INC. | | DECEMBER 31, 2015 | | 93 |
| | | | |
| Schedule of Investments (continued) | | | BlackRock Total Return Portfolio | |
| | | | |
| | | | | | | | | | | | |
| Corporate Bonds | | | | | Par (000) | | | Value | |
Banks (continued) | | | | | | | | | | | | |
4.90%, 11/17/45 | | | USD | | | | 16 | | | $ | 16,143 | |
| | | | | | | | | | | | |
| | | | | | | | | | | | 2,507,941 | |
Beverages — 0.1% | | | | | | | | | | | | |
Anheuser-Busch InBev Worldwide, Inc.,
3.75%, 7/15/42 | | | | | | | 12 | | | | 10,311 | |
Coca-Cola Co., 2.88%, 10/27/25 | | | | | | | 59 | | | | 58,165 | |
Molson Coors Brewing Co., 5.00%, 5/01/42 | | | | | | | 10 | | | | 9,630 | |
| | | | | | | | | | | | |
| | | | | | | | | | | | 78,106 | |
Biotechnology — 0.4% | | | | | | | | | | | | |
Amgen, Inc.: | | | | | | | | | | | | |
2.13%, 5/01/20 | | | | | | | 40 | | | | 39,455 | |
5.65%, 6/15/42 | | | | | | | 30 | | | | 32,463 | |
4.40%, 5/01/45 | | | | | | | 20 | | | | 18,530 | |
Biogen, Inc.: | | | | | | | | | | | | |
2.90%, 9/15/20 | | | | | | | 15 | | | | 14,961 | |
3.63%, 9/15/22 | | | | | | | 26 | | | | 26,288 | |
4.05%, 9/15/25 | | | | | | | 22 | | | | 22,100 | |
5.20%, 9/15/45 | | | | | | | 18 | | | | 18,007 | |
Celgene Corp.: | | | | | | | | | | | | |
2.25%, 5/15/19 | | | | | | | 25 | | | | 24,780 | |
3.25%, 8/15/22 | | | | | | | 25 | | | | 24,802 | |
Gilead Sciences, Inc.: | | | | | | | | | | | | |
2.35%, 2/01/20 | | | | | | | 10 | | | | 10,007 | |
3.65%, 3/01/26 | | | | | | | 8 | | | | 8,068 | |
4.60%, 9/01/35 | | | | | | | 9 | | | | 9,152 | |
4.50%, 2/01/45 | | | | | | | 13 | | | | 12,716 | |
4.75%, 3/01/46 | | | | | | | 7 | | | | 7,084 | |
| | | | | | | | | | | | |
| | | | | | | | | | | | 268,413 | |
Building Products — 0.1% | | | | | | | | | | | | |
Building Materials Corp. of America,
6.00%, 10/15/25 (a) | | | | | | | 75 | | | | 76,500 | |
Capital Markets — 1.7% | | | | | | | | | | | | |
Bank of New York Mellon Corp.: | | | | | | | | | | | | |
2.10%, 1/15/19 | | | | | | | 71 | | | | 71,330 | |
3.00%, 2/24/25 | | | | | | | 51 | | | | 50,153 | |
Deutsche Bank AG, 1.88%, 2/13/18 | | | | | | | 37 | | | | 36,685 | |
Goldman Sachs Group, Inc.: | | | | | | | | | | | | |
3.63%, 2/07/16 | | | | | | | 58 | | | | 58,147 | |
2.63%, 1/31/19 | | | | | | | 125 | | | | 125,894 | |
2.60%, 4/23/20 | | | | | | | 46 | | | | 45,651 | |
2.75%, 9/15/20 | | | | | | | 20 | | | | 19,987 | |
3.50%, 1/23/25 | | | | | | | 25 | | | | 24,570 | |
3.75%, 5/22/25 | | | | | | | 166 | | | | 167,107 | |
4.25%, 10/21/25 | | | | | | | 11 | | | | 10,916 | |
4.80%, 7/08/44 | | | | | | | 15 | | | | 14,913 | |
4.75%, 10/21/45 | | | | | | | 25 | | | | 24,834 | |
Jefferies Group LLC, 6.50%, 1/20/43 | | | | | | | 10 | | | | 9,246 | |
Lehman Brothers Holdings, Inc., 0.00%, 7/19/17 (b)(d) | | | | | | | 150 | | | | — | |
Morgan Stanley: | | | | | | | | | | | | |
2.80%, 6/16/20 | | | | | | | 76 | | | | 76,242 | |
3.75%, 2/25/23 | | | | | | | 153 | | | | 156,713 | |
3.70%, 10/23/24 | | | | | | | 56 | | | | 56,269 | |
4.00%, 7/23/25 | | | | | | | 77 | | | | 79,293 | |
4.30%, 1/27/45 | | | | | | | 29 | | | | 27,669 | |
| | | | | | | | | | | | |
| | | | | | | | | | | | 1,055,619 | |
Chemicals — 0.3% | | | | | | | | | | | | |
Agrium, Inc., 4.13%, 3/15/35 | | | | | | | 14 | | | | 11,909 | |
CF Industries, Inc.: | | | | | | | | | | | | |
3.45%, 6/01/23 | | | | | | | 20 | | | | 18,615 | |
5.38%, 3/15/44 | | | | | | | 31 | | | | 26,961 | |
Dow Chemical Co.: | | | | | | | | | | | | |
4.38%, 11/15/42 | | | | | | | 9 | | | | 7,838 | |
| | | | | | | | | | | | |
| Corporate Bonds | | | | | Par (000) | | | Value | |
| |
Chemicals (continued) | | | | | | | | | | | | |
4.63%, 10/01/44 | | | USD | | | | 11 | | | $ | 9,943 | |
Eastman Chemical Co., 4.80%, 9/01/42 | | | | | | | 15 | | | | 13,772 | |
Ecolab, Inc., 2.25%, 1/12/20 | | | | | | | 19 | | | | 18,891 | |
Huntsman International LLC, 5.13%, 11/15/22 (a) | | | | | | | 20 | | | | 18,000 | |
Monsanto Co., 3.60%, 7/15/42 | | | | | | | 25 | | | | 18,089 | |
Sherwin-Williams Co., 4.00%, 12/15/42 | | | | | | | 10 | | | | 9,447 | |
| | | | | | | | | | | | |
| | | | | | | | | | | | 153,465 | |
Commercial Services & Supplies — 0.2% | | | | | | | | | | | | |
Aviation Capital Group Corp., 2.88%, 9/17/18 (a) | | | | | | | 55 | | | | 54,684 | |
Republic Services, Inc., 3.20%, 3/15/25 | | | | | | | 36 | | | | 34,657 | |
Waste Management, Inc.: | | | | | | | | | | | | |
3.13%, 3/01/25 | | | | | | | 13 | | | | 12,652 | |
3.90%, 3/01/35 | | | | | | | 16 | | | | 14,899 | |
| | | | | | | | | | | | |
| | | | | | | | | | | | 116,892 | |
Communications Equipment — 0.1% | | | | | | | | | | | | |
Harris Corp.: | | | | | | | | | | | | |
2.70%, 4/27/20 | | | | | | | 14 | | | | 13,735 | |
4.85%, 4/27/35 | | | | | | | 30 | | | | 29,519 | |
5.05%, 4/27/45 | | | | | | | 15 | | | | 14,688 | |
Juniper Networks, Inc., 3.30%, 6/15/20 | | | | | | | 21 | | | | 20,909 | |
| | | | | | | | | | | | |
| | | | | | | | | | | | 78,851 | |
Consumer Finance — 1.9% | | | | | | | | | | | | |
Ally Financial, Inc.: | | | | | | | | | | | | |
4.13%, 2/13/22 | | | | | | | 60 | | | | 59,400 | |
5.13%, 9/30/24 | | | | | | | 65 | | | | 66,544 | |
American Express Credit Corp.: | | | | | | | | | | | | |
1.13%, 6/05/17 | | | | | | | 145 | | | | 144,331 | |
2.25%, 8/15/19 | | | | | | | 65 | | | | 65,011 | |
Capital One Financial Corp., 4.20%, 10/29/25 | | | | | | | 34 | | | | 33,570 | |
Discover Financial Services, 3.75%, 3/04/25 | | | | | | | 23 | | | | 22,087 | |
Ford Motor Credit Co. LLC, 1.72%, 12/06/17 | | | | | | | 235 | | | | 231,380 | |
General Motors Financial Co., Inc.: | | | | | | | | | | | | |
2.75%, 5/15/16 | | | | | | | 70 | | | | 70,205 | |
2.63%, 7/10/17 | | | | | | | 100 | | | | 100,305 | |
4.75%, 8/15/17 | | | | | | | 90 | | | | 93,280 | |
3.10%, 1/15/19 | | | | | | | 13 | | | | 12,981 | |
3.70%, 11/24/20 | | | | | | | 37 | | | | 37,100 | |
3.45%, 4/10/22 | | | | | | | 35 | | | | 33,574 | |
4.00%, 1/15/25 | | | | | | | 56 | | | | 53,130 | |
Synchrony Financial: | | | | | | | | | | | | |
2.60%, 1/15/19 | | | | | | | 36 | | | | 35,871 | |
2.70%, 2/03/20 | | | | | | | 19 | | | | 18,636 | |
4.50%, 7/23/25 | | | | | | | 35 | | | | 34,917 | |
Toyota Motor Credit Corp., 2.75%, 5/17/21 | | | | | | | 81 | | | | 81,874 | |
| | | | | | | | | | | | |
| | | | | | | | | | | | 1,194,196 | |
Containers & Packaging — 0.2% | | | | | | | | | | | | |
Reynolds Group Issuer, Inc., 6.88%, 2/15/21 | | | | | | | 130 | | | | 133,900 | |
Diversified Financial Services — 0.8% | | | | | | | | | | | | |
BP Capital Markets PLC, 2.24%, 5/10/19 | | | | | | | 86 | | | | 86,114 | |
General Electric Capital Corp.: | | | | | | | | | | | | |
3.15%, 9/07/22 | | | | | | | 50 | | | | 51,174 | |
3.10%, 1/09/23 | | | | | | | 102 | | | | 103,531 | |
Intercontinental Exchange, Inc.: | | | | | | | | | | | | |
2.75%, 12/01/20 | | | | | | | 18 | | | | 17,996 | |
3.75%, 12/01/25 | | | | | | | 12 | | | | 12,033 | |
Moody’s Corp., 4.50%, 9/01/22 | | | | | | | 24 | | | | 25,436 | |
Shell International Finance BV: | | | | | | | | | | | | |
2.13%, 5/11/20 | | | | | | | 83 | | | | 81,652 | |
4.13%, 5/11/35 | | | | | | | 70 | | | | 66,817 | |
3.63%, 8/21/42 | | | | | | | 16 | | | | 13,350 | |
See Notes to Financial Statements.
| | | | | | |
| 94 | | BLACKROCK SERIES FUND, INC. | | DECEMBER 31, 2015 | | |
| | | | |
| Schedule of Investments (continued) | | | BlackRock Total Return Portfolio | |
| | | | |
| | | | | | | | | | | | |
| Corporate Bonds | | | | | Par
(000) | | | Value | |
Diversified Financial Services (continued) | | | | | | | | | | | | |
Woodside Finance Ltd., 3.65%, 3/05/25 (a) | | | USD | | | | 9 | | | $ | 7,971 | |
| | | | | | | | | | | | |
| | | | | | | | | | | | 466,074 | |
Diversified Telecommunication Services — 1.3% | | | | | | | | | | | | |
AT&T Inc.: | | | | | | | | | | | | |
2.38%, 11/27/18 | | | | | | | 21 | | | | 21,143 | |
2.30%, 3/11/19 | | | | | | | 30 | | | | 29,985 | |
2.45%, 6/30/20 | | | | | | | 68 | | | | 66,968 | |
3.88%, 8/15/21 | | | | | | | 32 | | | | 33,014 | |
3.00%, 6/30/22 | | | | | | | 96 | | | | 93,698 | |
3.40%, 5/15/25 | | | | | | | 79 | | | | 75,926 | |
4.30%, 12/15/42 | | | | | | | 33 | | | | 28,198 | |
4.75%, 5/15/46 | | | | | | | 17 | | | | 15,565 | |
Intelsat Jackson Holdings SA, 5.50%, 8/01/23 | | | | | | | 20 | | | | 15,700 | |
Verizon Communications, Inc.: | | | | | | | | | | | | |
2.63%, 2/21/20 | | | | | | | 106 | | | | 106,369 | |
3.45%, 3/15/21 | | | | | | | 66 | | | | 67,524 | |
5.05%, 3/15/34 | | | | | | | 17 | | | | 16,937 | |
4.40%, 11/01/34 | | | | | | | 110 | | | | 101,489 | |
3.85%, 11/01/42 | | | | | | | 98 | | | | 80,104 | |
4.86%, 8/21/46 | | | | | | | 40 | | | | 37,869 | |
| | | | | | | | | | | | |
| | | | | | | | | | | | 790,489 | |
Electric Utilities — 1.2% | | | | | | | | | | | | |
Alabama Power Co., 2.80%, 4/01/25 | | | | | | | 8 | | | | 7,719 | |
Commonwealth Edison Co., 4.70%, 1/15/44 | | | | | | | 25 | | | | 26,296 | |
Duke Energy Carolinas LLC: | | | | | | | | | | | | |
4.25%, 12/15/41 | | | | | | | 40 | | | | 39,870 | |
3.75%, 6/01/45 | | | | | | | 19 | | | | 17,597 | |
Duke Energy Corp.: | | | | | | | | | | | | |
3.05%, 8/15/22 | | | | | | | 2 | | | | 1,972 | |
3.75%, 4/15/24 | | | | | | | 27 | | | | 27,356 | |
4.80%, 12/15/45 | | | | | | | 25 | | | | 25,257 | |
Duke Energy Florida LLC, 3.85%, 11/15/42 | | | | | | | 19 | | | | 17,777 | |
Entergy Arkansas, Inc., 3.70%, 6/01/24 | | | | | | | 69 | | | | 70,374 | |
Exelon Corp., 2.85%, 6/15/20 | | | | | | | 51 | | | | 50,721 | |
Florida Power & Light Co., 3.80%, 12/15/42 | | | | | | | 14 | | | | 13,257 | |
Georgia Power Co., 3.00%, 4/15/16 | | | | | | | 156 | | | | 156,866 | |
PacifiCorp: | | | | | | | | | | | | |
3.60%, 4/01/24 | | | | | | | 91 | | | | 94,038 | |
3.35%, 7/01/25 | | | | | | | 70 | | | | 70,568 | |
Progress Energy, Inc., 4.88%, 12/01/19 | | | | | | | 5 | | | | 5,361 | |
Public Service Co. of Colorado, 2.50%, 3/15/23 | | | | | | | 33 | | | | 32,151 | |
Puget Sound Energy, Inc., 4.30%, 5/20/45 | | | | | | | 39 | | | | 39,502 | |
Southern California Edison Co., 1.25%, 11/01/17 | | | | | | | 19 | | | | 18,896 | |
Trans-Allegheny Interstate Line Co., 3.85%, 6/01/25 (a) | | | | | | | 57 | | | | 57,004 | |
| | | | | | | | | | | | |
| | | | | | | | | | | | 772,582 | |
Electrical Equipment — 0.0% | | | | | | | | | | | | |
Rockwell Automation, Inc., 2.88%, 3/01/25 | | | | | | | 25 | | | | 24,381 | |
Electronic Equipment, Instruments & Components — 0.0% | |
CDW LLC/CDW Finance Corp., 5.00%, 9/01/23 | | | | | | | 20 | | | | 20,300 | |
Energy Equipment & Services — 0.1% | | | | | | | | | | | | |
Ensco PLC, 5.75%, 10/01/44 | | | | | | | 7 | | | | 4,614 | |
Schlumberger Holdings Corp., 3.00%, 12/21/20 (a) | | | | | | | 48 | | | | 47,380 | |
Transocean, Inc., 6.80%, 3/15/38 | | | | | | | 10 | | | | 5,388 | |
| | | | | | | | | | | | |
| | | | | | | | | | | | 57,382 | |
Food & Staples Retailing — 0.2% | | | | | | | | | | | | |
CVS Health Corp.: | | | | | | | | | | | | |
4.00%, 12/05/23 | | | | | | | 28 | | | | 29,098 | |
| | | | | | | | | | | | |
| Corporate Bonds | | | | | Par
(000) | | | Value | |
Food & Staples Retailing (continued) | | | | | | | | | | | | |
4.88%, 7/20/35 | | | USD | | | | 66 | | | $ | 68,144 | |
5.30%, 12/05/43 | | | | | | | 10 | | | | 10,741 | |
Walgreens Boots Alliance, Inc., 4.80%, 11/18/44 | | | | | | | 20 | | | | 18,092 | |
Wal-Mart Stores, Inc.: | | | | | | | | | | | | |
2.55%, 4/11/23 | | | | | | | 17 | | | | 16,765 | |
4.00%, 4/11/43 | | | | | | | 10 | | | | 9,711 | |
| | | | | | | | | | | | |
| | | | | | | | | | | | 152,551 | |
Food Products — 0.0% | | | | | | | | | | | | |
Kraft Foods Group, Inc., 6.88%, 1/26/39 | | | | | | | 11 | | | | 13,037 | |
Health Care Equipment & Supplies — 0.9% | | | | | | | | | | | | |
Abbott Laboratories, 2.55%, 3/15/22 | | | | | | | 98 | | | | 97,390 | |
Becton Dickinson and Co.: | | | | | | | | | | | | |
1.45%, 5/15/17 | | | | | | | 30 | | | | 29,873 | |
1.80%, 12/15/17 | | | | | | | 11 | | | | 10,984 | |
2.68%, 12/15/19 | | | | | | | 38 | | | | 38,207 | |
3.13%, 11/08/21 | | | | | | | 17 | | | | 17,143 | |
4.69%, 12/15/44 | | | | | | | 8 | | | | 8,071 | |
Boston Scientific Corp.: | | | | | | | | | | | | |
2.65%, 10/01/18 | | | | | | | 28 | | | | 28,147 | |
2.85%, 5/15/20 | | | | | | | 37 | | | | 36,807 | |
3.85%, 5/15/25 | | | | | | | 41 | | | | 40,342 | |
Medtronic, Inc.: | | | | | | | | | | | | |
2.50%, 3/15/20 | | | | | | | 24 | | | | 24,170 | |
3.13%, 3/15/22 | | | | | | | 22 | | | | 22,223 | |
3.63%, 3/15/24 | | | | | | | 30 | | | | 30,728 | |
4.63%, 3/15/44 | | | | | | | 33 | | | | 33,583 | |
4.63%, 3/15/45 | | | | | | | 22 | | | | 22,692 | |
St. Jude Medical, Inc.: | | | | | | | | | | | | |
2.80%, 9/15/20 | | | | | | | 26 | | | | 26,010 | |
3.88%, 9/15/25 | | | | | | | 9 | | | | 9,084 | |
Stryker Corp., 3.38%, 11/01/25 | | | | | | | 12 | | | | 11,844 | |
Zimmer Biomet Holdings, Inc.: | | | | | | | | | | | | |
3.55%, 4/01/25 | | | | | | | 11 | | | | 10,689 | |
4.25%, 8/15/35 | | | | | | | 32 | | | | 29,832 | |
| | | | | | | | | | | | |
| | | | | | | | | | | | 527,819 | |
Health Care Providers & Services — 1.4% | | | | | | | | | | | | |
Aetna, Inc.: | | | | | | | | | | | | |
4.50%, 5/15/42 | | | | | | | 26 | | | | 25,541 | |
4.13%, 11/07/42 | | | | | | | 14 | | | | 13,100 | |
AmerisourceBergen Corp.: | | | | | | | | | | | | |
1.15%, 5/15/17 | | | | | | | 42 | | | | 41,699 | |
3.25%, 3/01/25 | | | | | | | 10 | | | | 9,682 | |
4.25%, 3/01/45 | | | | | | | 10 | | | | 9,191 | |
Anthem, Inc.: | | | | | | | | | | | | |
1.88%, 1/15/18 | | | | | | | 130 | | | | 129,436 | |
2.30%, 7/15/18 | | | | | | | 164 | | | | 163,691 | |
3.30%, 1/15/23 | | | | | | | 65 | | | | 63,168 | |
4.65%, 8/15/44 | | | | | | | 17 | | | | 16,203 | |
Baylor Scott & White Holdings, 4.19%, 11/15/45 | | | | | | | 15 | | | | 14,185 | |
Catholic Health Initiatives, 4.35%, 11/01/42 | | | | | | | 10 | | | | 9,353 | |
Cigna Corp., 3.25%, 4/15/25 | | | | | | | 60 | | | | 58,876 | |
Dignity Health, 5.27%, 11/01/64 | | | | | | | 25 | | | | 25,647 | |
Express Scripts Holding Co.: | | | | | | | | | | | | |
1.25%, 6/02/17 | | | | | | | 25 | | | | 24,833 | |
3.90%, 2/15/22 | | | | | | | 16 | | | | 16,435 | |
HCA, Inc., 5.25%, 4/15/25 | | | | | | | 65 | | | | 65,488 | |
Laboratory Corp. of America Holdings, 2.63%, 2/01/20 | | | | | | | 20 | | | | 19,745 | |
Ochsner Clinic Foundation, 5.90%, 5/15/45 | | | | | | | 10 | | | | 10,743 | |
Southern Baptist Hospital of Florida, Inc., 4.86%, 7/15/45 | | | | | | | 10 | | | | 10,331 | |
See Notes to Financial Statements.
| | | | | | |
| | | BLACKROCK SERIES FUND, INC. | | DECEMBER 31, 2015 | | 95 |
| | | | |
| Schedule of Investments (continued) | | | BlackRock Total Return Portfolio | |
| | | | |
| | | | | | | | | | | | |
| Corporate Bonds | | | | | Par (000) | | | Value | |
Health Care Providers & Services (continued) | | | | | | | | | | | | |
UnitedHealth Group, Inc.: | | | | | | | | | | | | |
2.70%, 7/15/20 | | | USD | | | | 15 | | | $ | 15,157 | |
2.88%, 12/15/21 | | | | | | | 34 | | | | 34,472 | |
3.35%, 7/15/22 | | | | | | | 15 | | | | 15,343 | |
4.63%, 7/15/35 | | | | | | | 7 | | | | 7,267 | |
3.95%, 10/15/42 | | | | | | | 39 | | | | 36,300 | |
| | | | | | | | | | | | |
| | | | | | | | | | | | 835,886 | |
Hotels, Restaurants & Leisure — 0.1% | | | | | | | | | | | | |
McDonald’s Corp.: | | | | | | | | | | | | |
2.75%, 12/09/20 | | | | | | | 10 | | | | 9,993 | |
3.70%, 1/30/26 | | | | | | | 10 | | | | 9,992 | |
4.70%, 12/09/35 | | | | | | | 8 | | | | 7,970 | |
4.60%, 5/26/45 | | | | | | | 10 | | | | 9,622 | |
4.88%, 12/09/45 | | | | | | | 9 | | | | 9,055 | |
| | | | | | | | | | | | |
| | | | | | | | | | | | 46,632 | |
Household Durables — 0.1% | | | | | | | | | | | | |
Newell Rubbermaid, Inc., 2.88%, 12/01/19 | | | | | | | 71 | | | | 68,492 | |
Household Products — 0.1% | | | | | | | | | | | | |
Kimberly-Clark Corp.: | | | | | | | | | | | | |
1.90%, 5/22/19 | | | | | | | 70 | | | | 69,708 | |
2.65%, 3/01/25 | | | | | | | 11 | | | | 10,618 | |
| | | | | | | | | | | | |
| | | | | | | | | | | | 80,326 | |
Industrial Conglomerates — 0.2% | | | | | | | | | | | | |
Eaton Corp., 2.75%, 11/02/22 | | | | | | | 40 | | | | 38,706 | |
General Electric Co., 4.50%, 3/11/44 | | | | | | | 54 | | | | 55,573 | |
| | | | | | | | | | | | |
| | | | | | | | | | | | 94,279 | |
Insurance — 1.3% | | | | | | | | | | | | |
Aflac, Inc., 3.63%, 6/15/23 | | | | | | | 21 | | | | 21,741 | |
Allstate Corp., 3.15%, 6/15/23 | | | | | | | 21 | | | | 20,984 | |
American International Group, Inc.: | | | | | | | | | | | | |
3.38%, 8/15/20 | | | | | | | 37 | | | | 38,042 | |
3.75%, 7/10/25 | | | | | | | 25 | | | | 24,777 | |
3.88%, 1/15/35 | | | | | | | 22 | | | | 19,405 | |
4.50%, 7/16/44 | | | | | | | 28 | | | | 25,893 | |
4.38%, 1/15/55 | | | | | | | 16 | | | | 13,749 | |
Aon PLC, 4.75%, 5/15/45 | | | | | | | 13 | | | | 12,852 | |
Lincoln National Corp., 3.35%, 3/09/25 | | | | | | | 11 | | | | 10,606 | |
Loews Corp., 2.63%, 5/15/23 | | | | | | | 21 | | | | 20,010 | |
Marsh & McLennan Cos., Inc., 3.75%, 3/14/26 | | | | | | | 6 | | | | 6,008 | |
MetLife, Inc., 4.05%, 3/01/45 | | | | | | | 45 | | | | 41,760 | |
Metropolitan Life Global Funding I: | | | | | | | | | | | | |
1.30%, 4/10/17 (a) | | | | | | | 265 | | | | 264,899 | |
2.30%, 4/10/19 (a) | | | | | | | 150 | | | | 150,036 | |
Prudential Financial, Inc., 4.60%, 5/15/44 | | | | | | | 53 | | | | 52,738 | |
Travelers Cos., Inc., 4.60%, 8/01/43 | | | | | | | 30 | | | | 31,525 | |
XLIT Ltd., 2.30%, 12/15/18 | | | | | | | 35 | | | | 35,006 | |
| | | | | | | | | | | | |
| | | | | | | | | | | | 790,031 | |
Internet & Catalog Retail — 0.1% | | | | | | | | | | | | |
Amazon.com, Inc., 2.60%, 12/05/19 | | | | | | | 38 | | | | 38,596 | |
IT Services — 0.6% | | | | | | | | | | | | |
Fidelity National Information Services, Inc., 3.63%, 10/15/20 | | | | | | | 4 | | | | 4,052 | |
Hewlett Packard Enterprise Co.: | | | | | | | | | | | | |
2.85%, 10/05/18 (a) | | | | | | | 65 | | | | 64,964 | |
3.60%, 10/15/20 (a) | | | | | | | 57 | | | | 57,131 | |
International Business Machines Corp., 2.88%, 11/09/22 | | | | | | | 100 | | | | 99,239 | |
MasterCard, Inc., 3.38%, 4/01/24 | | | | | | | 31 | | | | 31,680 | |
| | | | | | | | | | | | |
| Corporate Bonds | | | | | Par (000) | | | Value | |
IT Services (continued) | | | | | | | | | | | | |
Visa, Inc.: | | | | | | | | | | | | |
2.80%, 12/14/22 | | | USD | | | | 56 | | | $ | 56,231 | |
3.15%, 12/14/25 | | | | | | | 47 | | | | 47,058 | |
4.15%, 12/14/35 | | | | | | | 16 | | | | 16,153 | |
4.30%, 12/14/45 | | | | | | | 22 | | | | 22,320 | |
| | | | | | | | | | | | |
| | | | | | | | | | | | 398,828 | |
Life Sciences Tools & Services — 0.1% | | | | | | | | | | | | |
Thermo Fisher Scientific, Inc.: | | | | | | | | | | | | |
3.30%, 2/15/22 | | | | | | | 24 | | | | 23,941 | |
3.65%, 12/15/25 | | | | | | | 9 | | | | 8,949 | |
| | | | | | | | | | | | |
| | | | | | | | | | | | 32,890 | |
Machinery — 0.2% | | | | | | | | | | | | |
Caterpillar, Inc., 4.75%, 5/15/64 | | | | | | | 39 | | | | 37,567 | |
Ingersoll-Rand Luxembourg Finance SA: | | | | | | | | | | | | |
2.63%, 5/01/20 | | | | | | | 25 | | | | 24,633 | |
4.65%, 11/01/44 | | | | | | | 5 | | | | 4,785 | |
John Deere Capital Corp., 3.35%, 6/12/24 | | | | | | | 50 | | | | 50,808 | |
| | | | | | | | | | | | |
| | | | | | | | | | | | 117,793 | |
Media — 1.5% | | | | | | | | | | | | |
21st Century Fox America, Inc.: | | | | | | | | | | | | |
3.70%, 9/15/24 | | | | | | | 19 | | | | 19,157 | |
3.70%, 10/15/25 (a) | | | | | | | 8 | | | | 7,980 | |
4.75%, 9/15/44 | | | | | | | 13 | | | | 12,504 | |
4.95%, 10/15/45 (a) | | | | | | | 4 | | | | 3,950 | |
CBS Corp., 2.30%, 8/15/19 | | | | | | | 25 | | | | 24,723 | |
CCO Safari II LLC: | | | | | | | | | | | | |
3.58%, 7/23/20 (a) | | | | | | | 43 | | | | 42,742 | |
4.46%, 7/23/22 (a) | | | | | | | 87 | | | | 86,696 | |
6.38%, 10/23/35 (a) | | | | | | | 36 | | | | 36,372 | |
CCOH Safari LLC, 5.75%, 2/15/26 (a) | | | | | | | 15 | | | | 15,038 | |
Comcast Corp.: | | | | | | | | | | | | |
3.38%, 8/15/25 | | | | | | | 49 | | | | 49,606 | |
4.25%, 1/15/33 | | | | | | | 10 | | | | 9,826 | |
4.40%, 8/15/35 | | | | | | | 50 | | | | 50,298 | |
4.60%, 8/15/45 | | | | | | | 17 | | | | 17,213 | |
DIRECTV Holdings LLC/DIRECTV Financing Co., Inc.: | | | | | | | | | | | | |
4.60%, 2/15/21 | | | | | | | 70 | | | | 74,142 | |
6.38%, 3/01/41 | | | | | | | 13 | | | | 13,953 | |
Discovery Communications LLC: | | | | | | | | | | | | |
3.45%, 3/15/25 | | | | | | | 18 | | | | 16,295 | |
4.88%, 4/01/43 | | | | | | | 10 | | | | 8,231 | |
DISH DBS Corp., 5.00%, 3/15/23 | | | | | | | 20 | | | | 17,350 | |
Interpublic Group of Cos., Inc.: | | | | | | | | | | | | |
4.00%, 3/15/22 | | | | | | | 22 | | | | 22,032 | |
3.75%, 2/15/23 | | | | | | | 16 | | | | 15,395 | |
NBCUniversal Media LLC, 4.45%, 1/15/43 | | | | | | | 25 | | | | 24,494 | |
Scripps Networks Interactive, Inc., 2.75%, 11/15/19 | | | | | | | 19 | | | | 18,689 | |
Time Warner Cable, Inc.: | | | | | | | | | | | | |
5.00%, 2/01/20 | | | | | | | 30 | | | | 31,757 | |
4.13%, 2/15/21 | | | | | | | 58 | | | | 59,222 | |
4.00%, 9/01/21 | | | | | | | 8 | | | | 8,078 | |
5.50%, 9/01/41 | | | | | | | 22 | | | | 19,880 | |
4.50%, 9/15/42 | | | | | | | 3 | | | | 2,354 | |
Time Warner, Inc.: | | | | | | | | | | | | |
2.10%, 6/01/19 | | | | | | | 100 | | | | 99,450 | |
3.60%, 7/15/25 | | | | | | | 39 | | | | 37,966 | |
4.65%, 6/01/44 | | | | | | | 40 | | | | 36,694 | |
Viacom, Inc.: | | | | | | | | | | | | |
2.75%, 12/15/19 | | | | | | | 49 | | | | 48,338 | |
See Notes to Financial Statements.
| | | | | | |
| 96 | | BLACKROCK SERIES FUND, INC. | | DECEMBER 31, 2015 | | |
| | | | |
| Schedule of Investments (continued) | | | BlackRock Total Return Portfolio | |
| | | | |
| | | | | | | | | | | | |
| Corporate Bonds | | | | | Par
(000) | | | Value | |
Media (continued) | | | | | | | | | | | | |
4.50%, 3/01/21 | | | USD | | | | 24 | | | $ | 24,777 | |
| | | | | | | | | | | | |
| | | | | | | | | | | | 955,202 | |
Metals & Mining — 0.3% | | | | | | | | | | | | |
Freeport-McMoRan, Inc.: | | | | | | | | | | | | |
4.00%, 11/14/21 | | | | | | | 30 | | | | 18,000 | |
5.40%, 11/14/34 | | | | | | | 17 | | | | 9,010 | |
Newmont Mining Corp., 3.50%, 3/15/22 | | | | | | | 14 | | | | 12,478 | |
Novelis, Inc., 8.75%, 12/15/20 | | | | | | | 145 | | | | 133,038 | |
Nucor Corp., 5.20%, 8/01/43 | | | | | | | 12 | | | | 10,890 | |
| | | | | | | | | | | | |
| | | | | | | | | | | | 183,416 | |
Multiline Retail — 0.1% | | | | | | | | | | | | |
Macy’s Retail Holdings, Inc., 4.50%, 12/15/34 | | | | | | | 16 | | | | 13,373 | |
Target Corp.: | | | | | | | | | | | | |
3.50%, 7/01/24 | | | | | | | 11 | | | | 11,414 | |
4.00%, 7/01/42 | | | | | | | 14 | | | | 13,669 | |
| | | | | | | | | | | | |
| | | | | | | | | | | | 38,456 | |
Multi-Utilities — 0.8% | | | | | | | | | | | | |
Berkshire Hathaway Energy Co.: | | | | | | | | | | | | |
2.40%, 2/01/20 | | | | | | | 17 | | | | 16,841 | |
3.50%, 2/01/25 | | | | | | | 17 | | | | 16,858 | |
CenterPoint Energy Houston Electric LLC, 4.50%, 4/01/44 | | | | | | | 16 | | | | 16,506 | |
CMS Energy Corp., 3.88%, 3/01/24 | | | | | | | 58 | | | | 58,878 | |
Consumers Energy Co., 3.95%, 5/15/43 | | | | | | | 14 | | | | 13,550 | |
Dominion Resources, Inc.: | | | | | | | | | | | | |
1.95%, 8/15/16 | | | | | | | 58 | | | | 58,146 | |
2.50%, 12/01/19 | | | | | | | 40 | | | | 39,852 | |
DTE Electric Co., 3.95%, 6/15/42 | | | | | | | 19 | | | | 18,189 | |
DTE Energy Co.: | | | | | | | | | | | | |
2.40%, 12/01/19 | | | | | | | 13 | | | | 12,945 | |
3.50%, 6/01/24 | | | | | | | 48 | | | | 48,053 | |
NiSource Finance Corp., 3.85%, 2/15/23 | | | | | | | 30 | | | | 30,583 | |
Pacific Gas & Electric Co.: | | | | | | | | | | | | |
4.75%, 2/15/44 | | | | | | | 19 | | | | 19,744 | |
4.30%, 3/15/45 | | | | | | | 14 | | | | 13,811 | |
PG&E Corp., 2.40%, 3/01/19 | | | | | | | 29 | | | | 28,938 | |
Sempra Energy, 2.88%, 10/01/22 | | | | | | | 12 | | | | 11,612 | |
Virginia Electric & Power Co.: | | | | | | | | | | | | |
3.45%, 2/15/24 | | | | | | | 20 | | | | 20,418 | |
4.45%, 2/15/44 | | | | | | | 14 | | | | 14,399 | |
4.20%, 5/15/45 | | | | | | | 32 | | | | 31,775 | |
| | | | | | | | | | | | |
| | | | | | | | | | | | 471,098 | |
Oil, Gas & Consumable Fuels — 2.1% | | | | | | | | | | | | |
Anadarko Petroleum Corp.: | | | | | | | | | | | | |
7.95%, 6/15/39 | | | | | | | 18 | | | | 19,233 | |
4.50%, 7/15/44 | | | | | | | 18 | | | | 13,780 | |
California Resources Corp.: | | | | | | | | | | | | |
8.00%, 12/15/22 (a) | | | | | | | 12 | | | | 6,315 | |
6.00%, 11/15/24 | | | | | | | 5 | | | | 1,525 | |
Chevron Corp.: | | | | | | | | | | | | |
2.19%, 11/15/19 | | | | | | | 10 | | | | 9,996 | |
1.96%, 3/03/20 | | | | | | | 102 | | | | 100,515 | |
CONSOL Energy, Inc., 5.88%, 4/15/22 | | | | | | | 20 | | | | 12,400 | |
Continental Resources, Inc.: | | | | | | | | | | | | |
3.80%, 6/01/24 | | | | | | | 18 | | | | 12,680 | |
4.90%, 6/01/44 | | | | | | | 28 | | | | 16,883 | |
Devon Energy Corp., 5.60%, 7/15/41 | | | | | | | 21 | | | | 15,872 | |
Energy Transfer Partners LP: | | | | | | | | | | | | |
4.15%, 10/01/20 | | | | | | | 20 | | | | 18,450 | |
4.65%, 6/01/21 | | | | | | | 32 | | | | 30,043 | |
4.90%, 3/15/35 | | | | | | | 21 | | | | 15,269 | |
6.63%, 10/15/36 | | | | | | | 15 | | | | 12,990 | |
5.15%, 2/01/43 | | | | | | | 19 | | | | 13,583 | |
| | | | | | | | | | | | |
| Corporate Bonds | | | | | Par
(000) | | | Value | |
Oil, Gas & Consumable Fuels (continued) | | | | | | | | | | | | |
Enterprise Products Operating LLC: | | | | | | | | | | | | |
3.90%, 2/15/24 | | | USD | | | | 22 | | | $ | 20,526 | |
3.70%, 2/15/26 | | | | | | | 56 | | | | 50,232 | |
4.45%, 2/15/43 | | | | | | | 49 | | | | 37,382 | |
Exxon Mobil Corp., 1.82%, 3/15/19 | | | | | | | 99 | | | | 99,072 | |
Halcon Resources Corp., 8.63%, 2/01/20 (a) | | | | | | | 20 | | | | 13,800 | |
Kinder Morgan Energy Partners LP: | | | | | | | | | | | | |
3.50%, 3/01/21 | | | | | | | 251 | | | | 224,614 | |
4.70%, 11/01/42 | | | | | | | 38 | | | | 26,739 | |
Kinder Morgan, Inc., 3.05%, 12/01/19 | | | | | | | 21 | | | | 19,436 | |
Laredo Petroleum, Inc., 7.38%, 5/01/22 | | | | | | | 5 | | | | 4,600 | |
Marathon Petroleum Corp., 4.75%, 9/15/44 | | | | | | | 12 | | | | 9,809 | |
MEG Energy Corp.: | | | | | | | | | | | | |
6.50%, 3/15/21 (a) | | | | | | | 8 | | | | 5,600 | |
7.00%, 3/31/24 (a) | | | | | | | 50 | | | | 35,500 | |
Peabody Energy Corp., 6.00%, 11/15/18 | | | | | | | 12 | | | | 2,220 | |
Phillips 66, 4.88%, 11/15/44 | | | | | | | 11 | | | | 9,814 | |
Plains All American Pipeline LP/PAA Finance Corp.: | | | | | | | | | | | | |
2.85%, 1/31/23 | | | | | | | 67 | | | | 55,266 | |
5.15%, 6/01/42 | | | | | | | 15 | | | | 10,883 | |
4.90%, 2/15/45 | | | | | | | 14 | | | | 10,069 | |
Regency Energy Partners LP/Regency Energy Finance Corp., 5.00%, 10/01/22 | | | | | | | 38 | | | | 33,663 | |
Spectra Energy Partners LP, 3.50%, 3/15/25 | | | | | | | 96 | | | | 83,971 | |
Sunoco Logistics Partners Operations LP, 3.45%, 1/15/23 | | | | | | | 33 | | | | 27,853 | |
TransCanada PipeLines Ltd.: | | | | | | | | | | | | |
1.88%, 1/12/18 | | | | | | | 18 | | | | 17,929 | |
2.50%, 8/01/22 | | | | | | | 26 | | | | 23,870 | |
4.63%, 3/01/34 | | | | | | | 39 | | | | 36,873 | |
Valero Energy Corp., 3.65%, 3/15/25 | | | | | | | 63 | | | | 59,423 | |
Western Gas Partners LP, 4.00%, 7/01/22 | | | | | | | 30 | | | | 26,535 | |
Williams Partners LP: | | | | | | | | | | | | |
4.00%, 11/15/21 | | | | | | | 49 | | | | 40,870 | |
4.50%, 11/15/23 | | | | | | | 12 | | | | 9,713 | |
4.90%, 1/15/45 | | | | | | | 42 | | | | 26,739 | |
| | | | | | | | | | | | |
| | | | | | | | | | | | 1,322,535 | |
Paper & Forest Products — 0.1% | | | | | | | | | | | | |
International Paper Co.: | | | | | | | | | | | | |
3.65%, 6/15/24 | | | | | | | 17 | | | | 16,627 | |
4.80%, 6/15/44 | | | | | | | 25 | | | | 22,743 | |
| | | | | | | | | | | | |
| | | | | | | | | | | | 39,370 | |
Pharmaceuticals — 1.2% | | | | | | | | | | | | |
AbbVie, Inc.: | | | | | | | | | | | | |
2.50%, 5/14/20 | | | | | | | 56 | | | | 55,437 | |
2.90%, 11/06/22 | | | | | | | 35 | | | | 33,860 | |
4.50%, 5/14/35 | | | | | | | 27 | | | | 26,449 | |
4.40%, 11/06/42 | | | | | | | 27 | | | | 25,216 | |
Actavis Funding SCS: | | | | | | | | | | | | |
2.35%, 3/12/18 | | | | | | | 132 | | | | 132,138 | |
3.00%, 3/12/20 | | | | | | | 155 | | | | 154,877 | |
AstraZeneca PLC: | | | | | | | | | | | | |
3.38%, 11/16/25 | | | | | | | 45 | | | | 44,674 | |
4.38%, 11/16/45 | | | | | | | 13 | | | | 13,026 | |
Bristol-Myers Squibb Co., 4.50%, 3/01/44 | | | | | | | 23 | | | | 24,864 | |
Eli Lilly & Co., 3.70%, 3/01/45 | | | | | | | 13 | | | | 12,160 | |
Endo Finance LLC/Endo Finco, Inc., 5.88%, 1/15/23 (a) | | | | | | | 20 | | | | 19,600 | |
GlaxoSmithKline Capital PLC, 2.85%, 5/08/22 | | | | | | | 22 | | | | 22,171 | |
Mylan, Inc., 3.13%, 1/15/23 (a) | | | | | | | 18 | | | | 16,517 | |
Novartis Capital Corp.: | | | | | | | | | | | | |
4.40%, 4/24/20 | | | | | | | 35 | | | | 38,330 | |
See Notes to Financial Statements.
| | | | | | |
| | | BLACKROCK SERIES FUND, INC. | | DECEMBER 31, 2015 | | 97 |
| | | | |
| Schedule of Investments (continued) | | | BlackRock Total Return Portfolio | |
| | | | | | | | | | | | |
| Corporate Bonds | | | | | Par
(000) | | | Value | |
Pharmaceuticals (continued) | | | | | | | | | | | | |
3.00%, 11/20/25 | | | USD | | | | 20 | | | $ | 19,721 | |
4.00%, 11/20/45 | | | | | | | 10 | | | | 9,795 | |
Pfizer, Inc.: | | | | | | | | | | | | |
4.30%, 6/15/43 | | | | | | | 15 | | | | 15,011 | |
4.40%, 5/15/44 | | | | | | | 11 | | | | 11,171 | |
Teva Pharmaceutical Finance Co. BV, 3.65%, 11/10/21 | | | | | | | 17 | | | | 17,240 | |
Valeant Pharmaceuticals International, Inc., | | | | | | | | | | | | |
6.13%, 4/15/25 (a) | | | | | | | 55 | | | | 49,088 | |
Zoetis, Inc., 3.25%, 2/01/23 | | | | | | | 12 | | | | 11,458 | |
| | | | | | | | | | | | |
| | | | | | | | | | | | 752,803 | |
Real Estate Investment Trusts (REITs) — 0.3% | | | | | | | | | | | | |
American Tower Corp.: | | | | | | | | | | | | |
3.45%, 9/15/21 | | | | | | | 22 | | | | 22,108 | |
3.50%, 1/31/23 | | | | | | | 8 | | | | 7,819 | |
5.00%, 2/15/24 | | | | | | | 8 | | | | 8,468 | |
AvalonBay Communities, Inc., 3.50%, 11/15/25 | | | | | | | 4 | | | | 3,961 | |
Communications Sales & Leasing, Inc./CSL Capital LLC, 8.25%, 10/15/23 | | | | | | | 20 | | | | 16,900 | |
ERP Operating LP, 3.38%, 6/01/25 | | | | | | | 19 | | | | 18,788 | |
Omega Healthcare Investors, Inc., 4.50%, 4/01/27 | | | | | | | 16 | | | | 15,065 | |
Prologis LP, 3.75%, 11/01/25 | | | | | | | 7 | | | | 6,944 | |
Simon Property Group LP: | | | | | | | | | | | | |
3.38%, 10/01/24 | | | | | | | 28 | | | | 28,265 | |
4.25%, 10/01/44 | | | | | | | 20 | | | | 19,913 | |
Ventas Realty LP, 3.75%, 5/01/24 | | | | | | | 40 | | | | 39,197 | |
| | | | | | | | | | | | |
| | | | | | | | | | | | 187,428 | |
Road & Rail — 0.4% | | | | | | | | | | | | |
Burlington Northern Santa Fe LLC: | | | | | | | | | | | | |
3.45%, 9/15/21 | | | | | | | 10 | | | | 10,221 | |
3.00%, 3/15/23 | | | | | | | 24 | | | | 23,651 | |
4.15%, 4/01/45 | | | | | | | 10 | | | | 9,063 | |
4.70%, 9/01/45 | | | | | | | 10 | | | | 9,978 | |
CSX Corp.: | | | | | | | | | | | | |
3.35%, 11/01/25 | | | | | | | 14 | | | | 13,597 | |
4.10%, 3/15/44 | | | | | | | 12 | | | | 10,872 | |
Norfolk Southern Corp., 4.45%, 6/15/45 | | | | | | | 19 | | | | 17,903 | |
Penske Truck Leasing Co. LP/PTL Finance Corp., 3.38%, 2/01/22 (a) | | | | | | | 42 | | | | 40,781 | |
Ryder System, Inc., 2.45%, 9/03/19 | | | | | | | 28 | | | | 27,584 | |
Union Pacific Corp.: | | | | | | | | | | | | |
3.38%, 2/01/35 | | | | | | | 11 | | | | 9,935 | |
4.05%, 11/15/45 | | | | | | | 3 | | | | 2,903 | |
4.38%, 11/15/49 | | | | | | | 15 | | | | 13,905 | |
3.88%, 2/01/55 | | | | | | | 30 | | | | 26,454 | |
Union Pacific Railroad Co. Pass-Through Trust, Series 2014-1, 3.23%, 5/14/26 | | | | | | | 55 | | | | 54,911 | |
| | | | | | | | | | | | |
| | | | | | | | | | | | 271,758 | |
Semiconductors & Semiconductor Equipment — 0.1% | | | | | | | | | |
Analog Devices, Inc.: | | | | | | | | | | | | |
3.90%, 12/15/25 | | | | | | | 7 | | | | 7,067 | |
5.30%, 12/15/45 | | | | | | | 7 | | | | 7,212 | |
Applied Materials, Inc.: | | | | | | | | | | | | |
2.63%, 10/01/20 | | | | | | | 22 | | | | 21,975 | |
3.90%, 10/01/25 | | | | | | | 16 | | | | 16,086 | |
| | | | | | | | | | | | |
| | | | | | | | | | | | 52,340 | |
Software — 0.6% | | | | | | | | | | | | |
First Data Corp.: | | | | | | | | | | | | |
8.75%, 1/15/22 (a) | | | | | | | 48 | | | | 50,153 | |
5.00%, 1/15/24 (a) | | | | | | | 7 | | | | 6,965 | |
5.75%, 1/15/24 (a) | | | | | | | 15 | | | | 14,775 | |
| | | | | | | | | | | | |
| Corporate Bonds | | | | | Par
(000) | | | Value | |
Software (continued) | | | | | | | | | | | | |
Microsoft Corp.: | | | | | | | | | | | | |
3.13%, 11/03/25 | | | USD | | | | 16 | | | $ | 16,085 | |
3.50%, 2/12/35 | | | | | | | 40 | | | | 36,970 | |
4.45%, 11/03/45 | | | | | | | 3 | | | | 3,094 | |
Oracle Corp.: | | | | | | | | | | | | |
2.80%, 7/08/21 | | | | | | | 146 | | | | 147,884 | |
3.25%, 5/15/30 | | | | | | | 56 | | | | 52,591 | |
4.38%, 5/15/55 | | | | | | | 23 | | | | 21,041 | |
| | | | | | | | | | | | |
| | | | | | | | | | | | 349,558 | |
Specialty Retail — 0.2% | | | | | | | | | | | | |
Home Depot, Inc.: | | | | | | | | | | | | |
3.35%, 9/15/25 | | | | | | | 7 | | | | 7,153 | |
5.40%, 9/15/40 | | | | | | | 11 | | | | 12,818 | |
4.40%, 3/15/45 | | | | | | | 11 | | | | 11,369 | |
Lowe’s Cos., Inc.: | | | | | | | | | | | | |
3.38%, 9/15/25 | | | | | | | 8 | | | | 8,122 | |
4.25%, 9/15/44 | | | | | | | 12 | | | | 11,943 | |
4.38%, 9/15/45 | | | | | | | 6 | | | | 6,167 | |
QVC, Inc.: | | | | | | | | | | | | |
3.13%, 4/01/19 | | | | | | | 12 | | | | 11,844 | |
5.13%, 7/02/22 | | | | | | | 28 | | | | 27,911 | |
| | | | | | | | | | | | |
| | | | | | | | | | | | 97,327 | |
Technology Hardware, Storage & Peripherals — 0.4% | | | | | | | | | |
Apple Inc.: | | | | | | | | | | | | |
2.10%, 5/06/19 | | | | | | | 139 | | | | 140,625 | |
2.00%, 5/06/20 | | | | | | | 59 | | | | 58,939 | |
3.45%, 2/09/45 | | | | | | | 12 | | | | 10,332 | |
HP, Inc., 3.75%, 12/01/20 | | | | | | | 6 | | | | 5,953 | |
| | | | | | | | | | | | |
| | | | | | | | | | | | 215,849 | |
Textiles, Apparel & Luxury Goods — 0.0% | | | | | | | | | | | | |
NIKE, Inc., 3.88%, 11/01/45 | | | | | | | 20 | | | | 19,300 | |
Tobacco — 0.3% | | | | | | | | | | | | |
Altria Group, Inc.: | | | | | | | | | | | | |
2.63%, 1/14/20 | | | | | | | 23 | | | | 23,043 | |
2.85%, 8/09/22 | | | | | | | 12 | | | | 11,699 | |
4.25%, 8/09/42 | | | | | | | 12 | | | | 11,010 | |
Philip Morris International, Inc.: | | | | | | | | | | | | |
1.13%, 8/21/17 | | | | | | | 50 | | | | 49,928 | |
4.13%, 3/04/43 | | | | | | | 19 | | | | 17,960 | |
4.88%, 11/15/43 | | | | | | | 23 | | | | 24,316 | |
Reynolds American, Inc.: | | | | | | | | | | | | |
2.30%, 6/12/18 | | | | | | | 22 | | | | 22,138 | |
3.25%, 6/12/20 | | | | | | | 18 | | | | 18,293 | |
3.25%, 11/01/22 | | | | | | | 12 | | | | 11,865 | |
4.75%, 11/01/42 | | | | | | | 19 | | | | 18,135 | |
| | | | | | | | | | | | |
| | | | | | | | | | | | 208,387 | |
Trading Companies & Distributors — 0.1% | | | | | | | | | | | | |
GATX Corp., 2.60%, 3/30/20 | | | | | | | 26 | | | | 25,295 | |
HD Supply, Inc., 5.25%, 12/15/21 (a) | | | | | | | 20 | | | | 20,400 | |
United Rentals North America, Inc., 7.63%, 4/15/22 | | | | | | | 20 | | | | 21,374 | |
| | | | | | | | | | | | |
| | | | | | | | | | | | 67,069 | |
Wireless Telecommunication Services — 0.9% | | | | | | | | | | | | |
America Movil SAB de CV, 2.38%, 9/08/16 | | | | | | | 205 | | | | 205,752 | |
Orange SA, 5.50%, 2/06/44 | | | | | | | 18 | | | | 19,110 | |
Rogers Communications, Inc.: | | | | | | | | | | | | |
3.63%, 12/15/25 | | | | | | | 8 | | | | 7,869 | |
5.00%, 3/15/44 | | | | | | | 8 | | | | 8,054 | |
Sprint Communications, Inc., 9.00%, 11/15/18 (a) | | | | | | | 210 | | | | 221,025 | |
Sprint Corp., 7.88%, 9/15/23 | | | | | | | 45 | | | | 33,795 | |
See Notes to Financial Statements.
| | | | | | |
| 98 | | BLACKROCK SERIES FUND, INC. | | DECEMBER 31, 2015 | | |
| | | | |
| Schedule of Investments (continued) | | | BlackRock Total Return Portfolio | |
| | | | |
| | | | | | | | | | | | |
| Corporate Bonds | | | | | Par (000) | | | Value | |
Wireless Telecommunication Services (continued) | | | | | | | | | |
T-Mobile USA, Inc.: | | | | | | | | | | | | |
6.63%, 4/28/21 | | | USD | | | | 30 | | | $ | 31,125 | |
6.73%, 4/28/22 | | | | | | | 25 | | | | 26,063 | |
6.84%, 4/28/23 | | | | | | | 10 | | | | 10,350 | |
Vodafone Group PLC, 2.50%, 9/26/22 | | | | | | | 20 | | | | 18,526 | |
| | | | | | | | | | | | |
| | | | | | | | | | | | 581,669 | |
Total Corporate Bonds — 28.1% | | | | | | | | | | | 17,399,962 | |
| | | | | | | | | | | | |
| Foreign Agency Obligations | | | | | | | | | |
| | | | | | | | | | | | |
Norway — 0.2% | | | | | | | | | | | | |
Statoil ASA, 2.90%, 11/08/20 | | | | | | | 145 | | | | 147,371 | |
| | | | | | | | | | | | |
| Foreign Government Obligations | | | | | | | | | |
Germany — 0.5% | | | | | | | | | | | | |
Deutsche Bundesrepublik Inflation Linked Bonds, 0.10%, 4/15/26 | | | EUR | | | | 250 | | | | 287,868 | |
Indonesia — 0.0% | | | | | | | | | | | | |
Republic of Indonesia, 8.38%, 3/15/34 | | | IDR | | | | 336,000 | | | | 22,825 | |
Mexico — 1.0% | | | | | | | | | | | | |
United Mexican States: | | | | | | | | | | | | |
4.75%, 6/14/18 | | | MXN | | | | 1,545 | | | | 90,057 | |
4.00%, 10/02/23 | | | USD | | | | 480 | | | | 486,240 | |
8.00%, 12/07/23 | | | MXN | | | | 1,000 | | | | 64,943 | |
| | | | | | | | | | | | |
| | | | | | | | | | | | 641,240 | |
Poland — 0.2% | | | | | | | | | | | | |
Republic of Poland: | | | | | | | | | | | | |
3.25%, 7/25/25 | | | PLN | | | | 163 | | | | 42,738 | |
2.50%, 7/25/26 | | | | | | | 284 | | | | 68,155 | |
| | | | | | | | | | | | |
| | | | | | | | | | | | 110,893 | |
Russia — 0.0% | | | | | | | | | | | | |
Russian Federation, 7.00%, 8/16/23 | | | RUB | | | | 310 | | | | 3,670 | |
Slovenia — 0.2% | | | | | | | | | | | | |
Republic of Slovenia, 2.25%, 3/25/22 | | | EUR | | | | 101 | | | | 117,740 | |
Turkey — 0.4% | | | | | | | | | | | | |
Republic of Turkey, 5.75%, 3/22/24 | | | USD | | | | 200 | | | | 211,304 | |
Total Foreign Government Obligations — 2.3% | | | | | | | | 1,395,540 | |
| | | | | | | | | | | | |
| Investment Companies — 1.2% | | | | | Shares | | | | |
iShares iBoxx $ High Yield Corporate Bond ETF (e) | | | | | | | 9,267 | | | | 746,735 | |
| | | | | | | | | | | | |
| Non-Agency Mortgage-Backed Securities | | | | | Par (000) | | | | |
Collateralized Mortgage Obligations — 2.9% | | | | | | | | | | | | |
American Home Mortgage Assets Trust, Series 2006-3, Class 2A11, 1.20%, 10/25/46 (b) | | | USD | | | | 50 | | | | 35,370 | |
Bear Stearns Mortgage Funding Trust: | | | | | | | | | | | | |
Series 2007-AR2, Class A1, 0.59%, 3/25/37 (b) | | | | | | | 10 | | | | 8,104 | |
Series 2007-AR4, Class 1A1, 0.62%, 9/25/47 (b) | | | | | | | 35 | | | | 28,138 | |
| | | | | | | | | | |
| Non-Agency Mortgage-Backed Securities | | | | Par
(000) | | | Value | |
Collateralized Mortgage Obligations (continued) | | | | | | | | | | |
Countrywide Alternative Loan Trust: | | | | | | | | | | |
Series 2005-72, Class A3, 0.72%, 1/25/36 (b) | | USD | | | 15 | | | $ | 12,668 | |
Series 2006-15CB, Class A1, 6.50%, 6/25/36 | | | | | 7 | | | | 5,623 | |
Series 2006-OA10, Class 4A1,
0.61%, 8/25/46 (b) | | | | | 58 | | | | 44,448 | |
Series 2006-OA14, Class 1A1,
1.99%, 11/25/46 (b) | | | | | 78 | | | | 65,423 | |
Series 2006-OA6, Class 1A2,
0.63%, 7/25/46 (b) | | | | | 40 | | | | 33,060 | |
Series 2006-OA8, Class 1A1,
0.61%, 7/25/46 (b) | | | | | 12 | | | | 9,930 | |
Series 2007-22, Class 2A16, 6.50%, 9/25/37 | | | | | 440 | | | | 342,870 | |
Series 2007-OA3, Class 1A1,
0.36%, 4/25/47 (b) | | | | | 18 | | | | 14,713 | |
Countrywide Home Loan Mortgage Pass-Through Trust: | | | | | | | | | | |
Series 2006-OA4, Class A1, 1.22%, 4/25/46 (b) | | | | | 111 | | | | 61,711 | |
Series 2006-OA5, Class 2A1, 0.62%, 4/25/46 (b) | | | | | 120 | | | | 97,260 | |
Credit Suisse Commercial Mortgage Trust, Series 2014-9R, Class 3A1, 2.03%, 11/27/37 (a)(b) | | | | | 42 | | | | 39,285 | |
Credit Suisse Mortgage Capital Certificates: Series 2011-2R, Class 1A1, 2.43%, 3/27/37 (a)(b) | | | | | 41 | | | | 40,045 | |
Series 2013-5R, Class 1A6,
0.46%, 2/27/36 (a)(b) | | | | | 25 | | | | 19,500 | |
Series 2014-11R, Class 16A1, 3.17%, 9/27/47 (a)(b) | | | | | 50 | | | | 48,353 | |
Series 2015-5R, Class 3A1, 4.75%, 1/29/37 (a) | | | | | 30 | | | | 28,676 | |
Series 2015-PR1, Class A-1,
3.50%, 2/25/55 (a)(c) | | | | | 95 | | | | 91,682 | |
Deutsche Alt-A Securities Mortgage Loan Trust, Series 2007-RMP1, Class A2, 0.57%, 12/25/36 (b) | | | | | 95 | | | | 76,804 | |
GreenPoint Mortgage Funding Trust, Series 2006-AR2, Class 4A1, 2.26%, 3/25/36 (b) | | | | | 9 | | | | 7,022 | |
Impac Secured Assets CMN Owner Trust, Series 2004-3, Class 1A4, 1.22%, 11/25/34 (b) | | | | | 23 | | | | 22,753 | |
LSTAR Securities Investment Trust: | | | | | | | | | | |
Series 2014-1, Class Note,
3.34%, 9/01/21 (a)(b) | | | | | 180 | | | | 179,434 | |
Series 2014-2, Class A,
2.24%, 12/01/21 (a)(b) | | | | | 115 | | | | 113,700 | |
Series 2015-10, Class A1,
2.24%, 11/02/20 (a)(b) | | | | | 98 | | | | 96,235 | |
RALI Trust: | | | | | | | | | | |
Series 2006-QO2, Class A1, 0.64%, 2/25/46 (b) | | | | | 106 | | | | 45,287 | |
Series 2007-QH6, Class A1, 0.61%, 7/25/37 (b) | | | | | 18 | | | | 14,382 | |
Series 2007-QH9, Class A1, 1.53%, 11/25/37 (b) | | | | | 39 | | | | 24,528 | |
Structured Adjustable Rate Mortgage Loan Trust, Series 2007-3, Class 3A1, 2.70%, 4/25/47 (b) | | | | | 217 | | | | 169,720 | |
Structured Asset Mortgage Investments II Trust, Series 2006-AR4, Class 3A1, 0.61%, 6/25/36 (b) | | | | | 21 | | | | 16,658 | |
| | | | | | | | | | |
| | | | | | | | | | 1,793,382 | |
See Notes to Financial Statements.
| | | | | | |
| | | BLACKROCK SERIES FUND, INC. | | DECEMBER 31, 2015 | | 99 |
| | | | |
| Schedule of Investments (continued) | | | BlackRock Total Return Portfolio | |
| | | | |
| | | | | | | | | | | | |
| Non-Agency Mortgage-Backed Securities | | | | | Par
(000) | | | Value | |
Commercial Mortgage-Backed Securities — 5.6% | | | | | | | | | | | | |
Banc of America Commercial Mortgage Trust: | | | | | | | | | | | | |
Series 2007-1, Class AMFX, 5.48%, 1/15/49 (b) | | | USD | | | | 15 | | | $ | 15,360 | |
Series 2007-3, Class A1A, 5.56%, 6/10/49 (b) | | | | | | | 127 | | | | 130,992 | |
Series 2007-3, Class A4, 5.56%, 6/10/49 (b) | | | | | | | 247 | | | | 253,758 | |
Series 2007-3, Class AJ, 5.56%, 6/10/49 (b) | | | | | | | 20 | | | | 20,264 | |
Series 2007-5, Class AM, 5.77%, 2/10/51 (b) | | | | | | | 40 | | | | 41,612 | |
Bayview Commercial Asset Trust, Series 2006-3A, Class A2, 0.72%, 10/25/36 (a)(b) | | | | | | | 35 | | | | 28,406 | |
Bear Stearns Commercial Mortgage Securities Trust: | | | | | | | | | | | | |
Series 2007-PW15, Class A1A, 5.32%, 2/11/44 | | | | | | | 87 | | | | 89,719 | |
Series 2007-PW16, Class AM,
5.72%, 6/11/40 (b) | | | | | | | 25 | | | | 26,023 | |
CDGJ Commercial Mortgage Trust, Series 2014-BXCH, Class A, 1.73%, 12/15/27 (a)(b) | | | | | | | 100 | | | | 99,373 | |
Citigroup Commercial Mortgage Trust, Series 2014-388G, Class A, 1.08%, 6/15/33 (a)(b) | | | | | | | 100 | | | | 98,961 | |
Citigroup/Deutsche Bank Commercial Mortgage Trust, Series 2007-CD5, Class AMA, 6.12%, 11/15/44 (b) | | | | | | | 46 | | | | 48,808 | |
COBALT CMBS Commercial Mortgage Trust, Series 2007-C3, Class AM, 5.77%, 5/15/46 (b) | | | | | | | 80 | | | | 83,978 | |
Commercial Mortgage Pass-Through Certificates: | | | | | | | | | | | | |
Series 2007-C9, Class AJFL,
0.98%, 12/10/49 (a)(b) | | | | | | | 40 | | | | 38,207 | |
Series 2010-RR1, Class GEB,
5.54%, 12/11/49 (a)(b) | | | | | | | 100 | | | | 102,895 | |
Series 2013-GAM, Class A2, 3.37%, 2/10/28 (a) | | | | | | | 110 | | | | 110,835 | |
Series 2014-FL5, Class D,
4.33%, 10/15/31 (a)(b) | | | | | | | 100 | | | | 96,531 | |
Credit Suisse Commercial Mortgage Trust, Series 2015-DEAL, Class A, 1.65%, 4/15/29 (a)(b) | | | | | | | 100 | | | | 99,735 | |
Credit Suisse First Boston Mortgage Securities Corp., Series 2005-C3, Class AJ, 4.77%, 7/15/37 | | | | | | | -(k) | | | | 395 | |
Credit Suisse Mortgage Capital Certificates, Series 2010-RR2, Class 2A, 5.95%, 9/15/39 (a)(b) | | | | | | | 141 | | | | 146,127 | |
CSAIL Commercial Mortgage Trust, Series 2015-C1, Class D, 3.80%, 4/17/50 (a)(b) | | | | | | | 100 | | | | 78,622 | |
Del Coronado Trust, Series 2013-HDMZ, Class M, 5.33%, 3/15/18 (a)(b) | | | | | | | 100 | | | | 99,820 | |
Deutsche Bank Re-REMIC Trust, Series 2013-EZ3, Class A, 1.64%, 12/18/49 (a)(b) | | | | | | | 49 | | | | 49,327 | |
Extended Stay America Trust, Series 2013-ESH7, Class A27, 2.96%, 12/05/31 (a) | | | | | | | 100 | | | | 100,088 | |
GS Mortgage Securities Corp. II, Series 2013-KING, Class E, 3.44%, 12/10/27 (a)(b) | | | | | | | 180 | | | | 171,928 | |
Hilton USA Trust, Series 2013-HLT, Class EFX, 4.45%, 11/05/30 (a)(b) | | | | | | | 150 | | | | 149,941 | |
JPMorgan Chase Commercial Mortgage Securities Trust: | | | | | | | | | | | | |
Series 2006-CB16, Class AM, 5.59%, 5/12/45 | | | | | | | 30 | | | | 30,381 | |
| | | | | | | | | | | | |
| Non-Agency Mortgage-Backed Securities | | | | | Par
(000) | | | Value | |
Commercial Mortgage-Backed Securities (continued) | | | | | | | | | |
Series 2007-CB20, Class AJ, 6.08%, 2/12/51 (b) | | | USD | | | | 10 | | | $ | 10,162 | |
Series 2007-LDPX, Class AM, 5.46%, 1/15/49 (b) | | | | | | | 75 | | | | 76,399 | |
Series 2008-C2, Class ASB, 6.13%, 2/12/51 (b) | | | | | | | 70 | | | | 71,478 | |
Series 2015-CSMO, Class D, 3.63%, 1/15/32 (a)(b) | | | | | | | 100 | | | | 99,286 | |
Series 2015-JP1, Class D, 4.40%, 1/15/49 (b) | | | | | | | 10 | | | | 8,345 | |
LB-UBS Commercial Mortgage Trust, Series 2007-C1, Class AJ, 5.48%, 2/15/40 | | | | | | | 10 | | | | 10,100 | |
Merrill Lynch Mortgage Trust, Series 2007-C1, Class A1A, 5.84%, 6/12/50 (b) | | | | | | | 57 | | | | 59,105 | |
Morgan Stanley Bank of America Merrill Lynch Trust: | | | | | | | | | | | | |
Series 2015-C25, Class D, 3.07%, 10/15/48 | | | | | | | 10 | | | | 6,894 | |
Series 2015-C26, Class D, 3.06%, 10/15/48 (a) | | | | | | | 10 | | | | 7,043 | |
Morgan Stanley Capital I Trust: | | | | | | | | | | | | |
Series 2007-HQ11, Class AMFL, 0.49%, 2/12/44 (b) | | | | | | | 25 | | | | 24,379 | |
Series 2007-HQ12, Class AM, 5.72%, 4/12/49 (b) | | | | | | | 50 | | | | 51,809 | |
Series 2007-IQ13, Class AM, 5.41%, 3/15/44 | | | | | | | 60 | | | | 61,588 | |
Morgan Stanley Re-REMIC Trust: | | | | | | | | | | | | |
Series 2011-IO, Class C,
0.00%, 3/23/51 (a)(f) | | | | | | | 37 | | | | 35,998 | |
Series 2012-IO, Class AXB2, 1.00%, 3/27/51 (a) | | | | | | | 19 | | | | 18,759 | |
Series 2012-XA, Class A, 2.00%, 7/27/49 (a) | | | | | | | 43 | | | | 42,549 | |
RBSCF Trust, Series 2010-RR3, Class WBTA, 5.95%, 2/16/51 (a)(b) | | | | | | | 349 | | | | 354,018 | |
SCG Trust, Series 2013-SRP1, Class AJ, 2.28%, 11/15/26 (a)(b) | | | | | | | 100 | | �� | | 99,396 | |
STRIPs Ltd.: | | | | | | | | | | | | |
Series 2012-1A, Class A, 1.50%, 12/25/44 (a) | | | | | | | 34 | | | | 33,721 | |
Series 2012-1A, Class B, 0.50%, 12/25/44 (a)(b) | | | | | | | 100 | | | | 90,540 | |
Wachovia Bank Commercial Mortgage Trust: | | | | | | | | | | | | |
Series 2006-C29, Class AM, 5.34%, 11/15/48 | | | | | | | 15 | | | | 15,310 | |
Series 2007-C33, Class AJ, 5.95%, 2/15/51 (b) | | | | | | | 20 | | | | 20,383 | |
Wells Fargo Commercial Mortgage Trust, Series 2015-C31, Class D, 3.85%, 11/15/48 | | | | | | | 10 | | | | 7,348 | |
Wells Fargo Resecuritization Trust, Series 2012-IO, Class A, 1.75%, 8/20/21 (a) | | | | | | | 25 | | | | 25,345 | |
| | | | | | | | | | | | |
| | | | | | | | | | | | 3,442,041 | |
Interest Only Commercial Mortgage-Backed Securities — 0.7% | | | | | |
BB-UBS Trust, Series 2012-SHOW, Class XA, 0.60%, 11/05/36 (a)(b) | | | | | | | 1,760 | | | | 83,798 | |
Commercial Mortgage Pass-Through Certificates: | | | | | | | | | | | | |
Series 2013-LC6, Class XA, 1.74%, 1/10/46 (b) | | | | | | | 988 | | | | 67,913 | |
Series 2015-3BP, Class XA, 0.06%, 2/10/35 (a)(b) | | | | | | | 939 | | | | 7,456 | |
Series 2015-CR23, Class XA, 1.01%, 5/10/48 (b) | | | | | | | 299 | | | | 18,518 | |
GS Mortgage Securities Corp. II, Series 2013-GC10, Class XA, 1.62%, 2/10/46 (b) | | | | | | | 1,250 | | | | 103,938 | |
See Notes to Financial Statements.
| | | | | | |
| 100 | | BLACKROCK SERIES FUND, INC. | | DECEMBER 31, 2015 | | |
| | | | |
| Schedule of Investments (continued) | | | BlackRock Total Return Portfolio | |
| | | | |
| | | | | | | | | | | | |
| Non-Agency Mortgage-Backed Securities | | | Par (000) | | | Value | |
Interest Only Commercial Mortgage-Backed Securities
(continued) | | | | | |
Hilton USA Trust, Series 2013-HLT, Class X1FX, 0.09%, 11/05/30 (a)(b) | | | USD | | | | 1,225 | | | $ | 12 | |
JPMorgan Chase Commercial Mortgage Securities Corp., Series 2012-LC9, Class XA, 0.00%, 12/15/47 (b) | | | | | | | 961 | | | | 73,349 | |
Morgan Stanley Bank of America Merrill Lynch Trust, Series 2014-C19, Class XA, 1.16%, 12/15/47 (b) | | | | | | | 201 | | | | 12,996 | |
WF-RBS Commercial Mortgage Trust: | | | | | | | | | | | | |
Series 2014-C24, Class XA, 0.98%, 11/15/47 (b) | | | | | | | 413 | | | | 25,064 | |
Series 2014-LC14, Class XA, 1.43%, 3/15/47 (b) | | | | | | | 980 | | | | 70,402 | |
| | | | | | | | | | | | |
| | | | | | | | | | | | 463,446 | |
Total Non-Agency Mortgage-Backed Securities — 9.2% | | | | 5,698,869 | |
| | | | | | | | | | | | |
| Other Interests (g) | | | | | Beneficial Interest (000) | | | | |
Capital Markets — 0.0% | | | | | | | | | | | | |
Lehman Brothers Holdings Capital Trust VII (d)(h) | | | | | | | 55 | | | | 6 | |
Lehman Brothers Holdings, Inc. (d)(h) | | | | | | | 325 | | | | 33 | |
Total Other Interests — 0.0% | | | | | | | | 39 | |
| | | | | | | | | | | | |
| Preferred Securities | | | | | | | | | |
| Capital Trusts | | | | | Par (000) | | | | |
Banks — 0.3% | | | | | | | | | | | | |
Bank of America Corp., 6.10% (b)(i) | | | | | | | 14 | | | | 14,193 | |
Citigroup, Inc., 5.90% (b)(i) | | | | | | | 17 | | | | 16,703 | |
Citigroup, Inc., 5.95% (b)(i) | | | | | | | 56 | | | | 55,825 | |
Citigroup, Inc., 5.95% (b)(i) | | | | | | | 50 | | | | 48,125 | |
Citigroup, Inc., 6.13% (b)(i) | | | | | | | 38 | | | | 38,760 | |
| | | | | | | | | | | | |
| | | | | | | | | | | | 173,606 | |
Capital Markets — 0.0% | | | | | | | | | | | | |
State Street Capital Trust IV, 1.51%, 6/01/77 (b) | | | | | | | 20 | | | | 16,350 | |
Consumer Finance — 0.1% | | | | | | | | | | | | |
Capital One Financial Corp., 5.55% (b)(i) | | | | | | | 31 | | | | 30,845 | |
Insurance — 0.0% | | | | | | | | | | | | |
MetLife, Inc., 5.25% (b)(i) | | | | | | | 16 | | | | 16,280 | |
Total Capital Trusts — 0.4% | | | | | | | | 237,081 | |
| | | | | | | | | | | | |
| Trust Preferreds | | | | | Shares | | | | |
Banks — 0.3% | | | | | | | | | | | | |
Citigroup Capital XIII, 7.88%, 10/30/40 (b) | | | | | | | 6,917 | | | | 179,773 | |
Consumer Finance — 0.1% | | | | | | | | | | | | |
GMAC Capital Trust I, 8.13%, 2/15/40 (b) | | | | | | | 4,000 | | | | 101,440 | |
Total Trust Preferreds — 0.4% | | | | | | | | 281,213 | |
Total Preferred Securities — 0.8% | | | | | | | | 518,294 | |
| | | | | | | | | | | | |
| | | | | | | | | | |
| | | | | | | | | | | | |
| Taxable Municipal Bonds | | | | | Par
(000) | | | Value | |
Arizona Health Facilities Authority RB, 1.03%, 1/01/37 (b) | | | USD | | | | 20 | | | $ | 18,079 | |
Bay Area Toll Authority RB, 6.92%, 4/01/40 | | | | | | | 20 | | | | 26,344 | |
California State Public Works Board RB, 8.36%, 10/01/34 | | | | | | | 10 | | | | 14,124 | |
City of Charleston, SC Waterworks & Sewer System Revenue RB, 5.00%, 1/01/45 | | | | | | | 10 | | | | 11,662 | |
City of San Jose, CA Airport Revenue RB, AMBAC, 5.00%, 3/01/37 | | | | | | | 15 | | | | 15,548 | |
Clark County School District GO, 5.00%, 6/15/26-6/15/28 | | | | | | | 30 | | | | 36,654 | |
Contra Costa Community College District GO, 6.50%, 8/01/34 | | | | | | | 10 | | | | 12,415 | |
County of Miami-Dade, FL Aviation Revenue RB, 5.00%, 10/01/38 | | | | | | | 30 | | | | 33,847 | |
County of Sacramento, CA Airport System Revenue RB, AGM, 5.25%, 7/01/39 | | | | | | | 10 | | | | 10,768 | |
Delaware Transportation Authority RB, 5.00%, 6/01/55 | | | | | | | 10 | | | | 11,280 | |
Golden State Tobacco Securitization Corp. RB, 5.00%, 6/01/40 | | | | | | | 25 | | | | 28,655 | |
Grant County Public Utility District No. 2 RB, 4.58%, 1/01/40 | | | | | | | 5 | | | | 4,972 | |
Los Angeles Community College District GO, 6.60%, 8/01/42 | | | | | | | 20 | | | | 27,343 | |
Los Angeles Department of Water & Power RB, 6.60%, 7/01/50 | | | | | | | 10 | | | | 13,640 | |
Massachusetts Development Finance Agency RB, 5.00%, 7/01/44-8/15/45 | | | | | | | 50 | | | | 54,975 | |
Metropolitan Pier & Exposition Authority RB, 5.00%, 6/15/52 | | | | | | | 10 | | | | 10,350 | |
Metropolitan St. Louis Sewer District RB, 5.00%, 5/01/45 | | | | | | | 25 | | | | 29,287 | |
Metropolitan Transportation Authority RB: | | | | | | | | | | | | |
6.69%, 11/15/40 | | | | | | | 10 | | | | 13,088 | |
6.81%, 11/15/40 | | | | | | | 20 | | | | 26,486 | |
Metropolitan Washington Airports Authority Dulles Toll Road Revenue RB, 7.46%, 10/01/46 | | | | | | | 10 | | | | 13,447 | |
Miami-Dade County Educational Facilities Authority RB, 5.07%, 4/01/50 | | | | | | | 15 | | | | 15,643 | |
Municipal Electric Authority of Georgia RB, 6.64%, 4/01/57 | | | | | | | 15 | | | | 17,865 | |
New Jersey State Turnpike Authority RB, 7.41%, 1/01/40 | | | | | | | 23 | | | | 32,691 | |
New York City Transitional Finance Authority Building Aid Revenue RB, 5.00%, 7/15/36 | | | | | | | 10 | | | | 11,675 | |
New York City Water & Sewer System RB: | | | | | | | | | | | | |
5.75%, 6/15/41 | | | | | | | 10 | | | | 12,629 | |
5.38%, 6/15/43 | | | | | | | 95 | | | | 110,583 | |
5.50%, 6/15/43 | | | | | | | 115 | | | | 134,718 | |
5.88%, 6/15/44 | | | | | | | 20 | | | | 25,832 | |
New York State Dormitory Authority RB, 5.39%, 3/15/40 | | | | | | | 15 | | | | 17,827 | |
New York State Thruway Authority RB, 5.00%, 1/01/31 | | | | | | | 10 | | | | 11,888 | |
Orange County Local Transportation Authority RB, 6.91%, 2/15/41 | | | | | | | 25 | | | | 33,686 | |
Pennsylvania Economic Development Financing Authority RB, 5.00%, 12/31/38 | | | | | | | 20 | | | | 21,863 | |
Port Authority of New York & New Jersey RB, 4.96%, 8/01/46 | | | | | | | 30 | | | | 32,406 | |
Regents of the University of California Medical Center Pooled Revenue RB, 6.58%, 5/15/49 | | | | | | | 25 | | | | 32,098 | |
See Notes to Financial Statements.
| | | | | | |
| | | BLACKROCK SERIES FUND, INC. | | DECEMBER 31, 2015 | | 101 |
| | | | |
| Schedule of Investments (continued) | | | BlackRock Total Return Portfolio | |
| | | | |
| | | | | | | | | | | | |
| Taxable Municipal Bonds | | | | | Par (000) | | | Value | |
Salt River Project Agricultural Improvement & Power District RB, 5.00%, 12/01/45 | | | USD | | | | 25 | | | $ | 29,119 | |
State of California GO: | | | | | | | | | | | | |
7.50%, 4/01/34 | | | | | | | 20 | | | | 28,003 | |
7.55%, 4/01/39 | | | | | | | 10 | | | | 14,537 | |
4.99%, 4/01/39 | | | | | | | 15 | | | | 15,330 | |
7.60%, 11/01/40 | | | | | | | 85 | | | | 126,344 | |
State of Connecticut GO, 5.00%, 11/15/32 | | | | | | | 10 | | | | 11,848 | |
State of Illinois GO, 5.10%, 6/01/33 | | | | | | | 80 | | | | 75,684 | |
State of Washington GO, 5.00%, 7/01/28 | | | | | | | 10 | | | | 12,139 | |
University of California RB, 4.86%, 5/15/12 | | | | | | | 15 | | | | 14,349 | |
Utility Debt Securitization Authority RB, 5.00%, 12/15/36-12/15/37 | | | | | | | 25 | | | | 29,951 | |
Wisconsin Department of Transportation RB, 5.00%, 7/01/31 | | | | | | | 10 | | | | 11,997 | |
Total Taxable Municipal Bonds — 2.1% | | | | | | | | 1,293,669 | |
| | | | | | | | | | | | |
| U.S. Government Sponsored Agency Securities | | | | | | | | | |
Collateralized Mortgage Obligations — 0.3% | | | | | | | | | | | | |
Fannie Mae: | | | | | | | | | | | | |
Series 2013-C01, Class M2, 5.67%, 10/25/23 (b) | | | | | | | 115 | | | | 119,177 | |
Series 2014-C01, Class M2, 4.82%, 1/25/24 (b) | | | | | | | 41 | | | | 40,700 | |
| | | | | | | | | | | | |
| | | | | | | | | | | | 159,877 | |
Commercial Mortgage-Backed Securities — 0.0% | | | | | | | | | | | | |
Freddie Mac, Series K050, Class A2, 3.33%, 8/25/25 | | | | | | | 20 | | | | 20,463 | |
Interest Only Commercial Mortgage-Backed Securities — 0.1% | | | | | |
Fannie Mae: | | | | | | | | | | | | |
Series 2013-M5, Class X2, 2.33%, 1/25/22 (b) | | | | | | | 274 | | | | 26,069 | |
Series 2014-M13, Class X2, 0.14%, 2/25/24 (b) | | | | | | | 1,867 | | | | 20,912 | |
Ginnie Mae, Series 2012-120, Class IO, 0.91%, 2/16/53 (b) | | | | | | | 512 | | | | 32,573 | |
| | | | | | | | | | | | |
| | | | | | | | | | | | 79,554 | |
Mortgage-Backed Securities — 42.7% | | | | | | | | | | | | |
Fannie Mae Mortgage-Backed Securities: | | | | | | | | | | | | |
2.35%, 8/01/38 (b) | | | | | | | 56 | | | | 59,405 | |
2.50%, 4/01/30-1/01/31 (j) | | | | | | | 565 | | | | 570,044 | |
2.96%, 3/01/41 (b) | | | | | | | 19 | | | | 20,110 | |
3.00%, 11/01/26-6/01/43 (j) | | | | | | | 2,677 | | | | 2,724,082 | |
3.13%, 3/01/41 (b) | | | | | | | 37 | | | | 39,645 | |
3.15%, 12/01/40 (b) | | | | | | | 48 | | | | 49,918 | |
3.35%, 6/01/41 (b) | | | | | | | 44 | | | | 46,329 | |
3.50%, 7/01/26-1/01/46 (j) | | | | | | | 4,397 | | | | 4,571,186 | |
3.50%, 9/01/41 (b) | | | | | | | 32 | | | | 33,215 | |
4.00%, 2/01/25-1/01/46 (j) | | | | | | | 2,113 | | | | 2,246,624 | |
4.50%, 2/01/25-1/01/46 (j) | | | | | | | 1,977 | | | | 2,134,501 | |
5.00%, 9/01/33-1/01/46 (j) | | | | | | | 706 | | | | 778,099 | |
5.50%, 2/01/35-1/01/46 (j) | | | | | | | 691 | | | | 773,733 | |
6.00%, 2/01/17-9/01/40 | | | | | | | 336 | | | | 381,604 | |
6.50%, 5/01/40 | | | | | | | 164 | | | | 187,902 | |
7.00%, 2/01/16 | | | | | | | — | (k) | | | 1 | |
Freddie Mac Mortgage-Backed Securities: | | | | | | | | | | | | |
2.38%, 4/01/38 (b) | | | | | | | 72 | | | | 75,978 | |
2.50%, 3/01/30-1/01/31 (j) | | | | | | | 294 | | | | 296,766 | |
2.99%, 2/01/41 (b) | | | | | | | 49 | | | | 52,263 | |
3.00%, 5/01/27-1/01/46 (j) | | | | | | | 850 | | | | 858,990 | |
3.50%, 4/01/42-1/01/46 (j) | | | | | | | 2,889 | | | | 2,978,015 | |
| | | | | | | | | | | | |
| U.S. Government Sponsored Agency Securities | | | | | Par (000) | | | Value | |
Mortgage-Backed Securities (concluded) | | | | | | | | | | | | |
4.00%, 8/01/40-1/01/46 (j) | | | USD | | | | 1,064 | | | $ | 1,125,677 | |
4.50%, 2/01/39-7/01/45 | | | | | | | 467 | | | | 504,480 | |
5.00%, 8/01/40-1/01/46 (j) | | | | | | | 563 | | | | 616,019 | |
5.50%, 6/01/41 | | | | | | | 96 | | | | 107,165 | |
6.00%, 6/01/35 | | | | | | | 70 | | | | 79,063 | |
Ginnie Mae Mortgage-Backed Securities: | | | | | | | | | | | | |
3.00%, 7/20/45-1/15/46 (j) | | | | | | | 939 | | | | 952,436 | |
3.50%, 10/20/42-10/20/45 | | | | | | | 1,458 | | | | 1,522,020 | |
4.00%, 12/20/40-1/15/46 (j) | | | | | | | 855 | | | | 908,955 | |
4.50%, 12/20/39-2/15/42 | | | | | | | 1,022 | | | | 1,108,882 | |
5.00%, 7/15/39-1/15/46 (j) | | | | | | | 388 | | | | 425,566 | |
5.50%, 5/20/36-1/15/46 (j) | | | | | | | 207 | | | | 229,765 | |
| | | | | | | | | | | | |
| | | | | | | | | | | | 26,458,438 | |
Total U.S. Government Sponsored Agency Securities — 43.1% | | | | 26,718,332 | |
| | | | | | | | | | | | |
| U.S. Treasury Obligations | | | | | | | | | |
U.S. Treasury Bonds: | | | | | | | | | | | | |
2.88%, 8/15/45 | | | | | | | 1,765 | | | | 1,714,090 | |
3.00%, 11/15/45 | | | | | | | 249 | | | | 247,752 | |
U.S. Treasury Inflation Indexed Notes: | | | | | | | | | | | | |
0.25%, 1/15/25 | | | | | | | 2,089 | | | | 1,993,516 | |
0.38%, 7/15/25 | | | | | | | 341 | | | | 330,099 | |
U.S. Treasury Notes: | | | | | | | | | | | | |
0.75%, 10/31/17 | | | | | | | 2,490 | | | | 2,476,773 | |
0.88%, 10/15/18 (l) | | | | | | | 2,800 | | | | 2,769,155 | |
1.38%, 10/31/20 (l) | | | | | | | 1,066 | | | | 1,047,179 | |
1.63%, 11/30/20 (l) | | | | | | | 2,358 | | | | 2,343,998 | |
1.88%, 10/31/22 (m) | | | | | | | 1,240 | | | | 1,224,307 | |
2.25%, 11/15/25 (l) | | | | | | | 474 | | | | 472,645 | |
Total U.S. Treasury Obligations — 23.6% | | | | | | | | 14,619,514 | |
Total Long-Term Investments (Cost — $74,832,164) — 119.5% | | | | | | | | 74,071,678 | |
| | | | | | | | | | | | |
| Short-Term Securities | | | | | | | | | |
Borrowed Bond Agreements — 3.1%(n) | | | | | | | | | | | | |
Barclays Capital, Inc., 0.30%, 1/06/16
(Purchased on 12/30/15 to be repurchased at $27,582, collateralized by U.S. Treasury Notes, 1.38% due at 9/30/20, par and fair value of USD 28,000 and $27,517, respectively) | | | | | | | 28 | | | | 27,580 | |
Deutsche Bank Securities, Inc., 0.35%, 1/06/16
(Purchased on 12/30/15 to be repurchased at $24,845, collateralized by U.S. Treasury Bonds, 3.00% due at 5/15/45, par and fair value of USD 25,000 and $24,886, respectively) | | | | | | | 25 | | | | 24,844 | |
Merrill Lynch, Pierce, Fenner & Smith, Inc., 0.30%, 1/04/16
(Purchased on 12/30/15 to be repurchased at $1,914,499, collateralized by U.S. Treasury Notes, 2.00% due at 8/15/25, par and fair value of USD 1,951,000 and $1,902,301, respectively) | | | | | | | 1,914 | | | | 1,914,419 | |
| | | | | | | | | | | | |
| | | | | | | | | | | | 1,966,843 | |
See Notes to Financial Statements.
| | | | | | |
| 102 | | BLACKROCK SERIES FUND, INC. | | DECEMBER 31, 2015 | | |
| | | | |
| Schedule of Investments (continued) | | | BlackRock Total Return Portfolio | |
| | | | | | | | | | | | |
| Money Market Funds | | | | | Shares | | | Value | |
BlackRock Liquidity Funds, TempFund, Institutional Class, 0.23% (e)(o) | | | | 667,056 | | | $ | 667,056 | |
Total Short-Term Securities (Cost — $2,633,899) — 4.2% | | | | | | | | | | | 2,633,899 | |
| | | | | | | | | | | | |
| Options Purchased | | | | | | | | | |
(Cost — $8,073) — 0.0% | | | | | | | | | | | 5,224 | |
Total Investments Before Borrowed Bonds and TBA Sale Commitments (Cost — $77,474,136) — 123.7% | | | | 76,710,801 | |
| | | | | | | | | | | | |
| Borrowed Bonds | | | | | Par (000) | | | | |
U.S. Treasury Obligations — (3.1)% | | | | | | | | | | | | |
U.S. Treasury Bonds, 3.00%, 5/15/45 (p) | | | USD | | | | 25 | | | | (24,886 | ) |
U.S. Treasury Notes: | | | | | | | | | | | | |
1.38%, 9/30/20 (p) | | | | | | | 28 | | | | (27,517 | ) |
2.00%, 8/15/25 (p) | | | | | | | 1,951 | | | | (1,902,301 | ) |
(Proceeds — $1,970,084) — (3.1)% | | | | | | | | | | | (1,954,704 | ) |
| | | | | | | | | | | | |
| | | | | | | | | | |
| | | | | | | | | | | | |
| TBA Sale Commitments (j) | | | | | Par (000) | | | Value | |
Fannie Mae Mortgage-Backed Securities: | | | | | | | | | | | | |
3.00%, 1/01/31-1/01/46 | | | USD | | | | 764 | | | $ | (784,408 | ) |
3.50%, 1/01/31-1/01/46 | | | | | | | 3,336 | | | | (3,452,592 | ) |
4.00%, 1/01/31-1/01/46 | | | | | | | 566 | | | | (594,271 | ) |
4.50%, 1/01/46 | | | | | | | 900 | | | | (971,723 | ) |
5.00%, 1/01/46 | | | | | | | 600 | | | | (660,265 | ) |
5.50%, 1/01/46 | | | | | | | 500 | | | | (557,135 | ) |
6.00%, 1/01/46 | | | | | | | 100 | | | | (112,983 | ) |
6.50%, 1/01/46 | | | | | | | 100 | | | | (114,514 | ) |
Freddie Mac Mortgage-Backed Securities: | | | | | | | | | | | | |
3.00%, 1/01/31 | | | | | | | 73 | | | | (75,225 | ) |
3.50%, 1/01/46 | | | | | | | 1,965 | | | | (2,020,772 | ) |
4.00%, 1/01/46 | | | | | | | 124 | | | | (130,992 | ) |
4.50%, 1/01/46 | | | | | | | 21 | | | | (22,622 | ) |
5.00%, 1/01/46 | | | | | | | 200 | | | | (218,460 | ) |
Ginnie Mae Mortgage-Backed Securities: | | | | | | | | | | | | |
3.00%, 1/15/46 | | | | | | | 45 | | | | (45,610 | ) |
3.50%, 1/15/46 | | | | | | | 28 | | | | (29,189 | ) |
4.50%, 1/15/46 | | | | | | | 346 | | | | (372,359 | ) |
Total TBA Sale Commitments (Proceeds — $10,160,554) — (16.4)% | | | | (10,163,120 | ) |
Total Investments Net of Borrowed Bonds and TBA Sale Commitments — 104.2% | | | | 64,592,977 | |
Liabilities in Excess of Other Assets — (4.2)% | | | | (2,591,040 | ) |
| | | | | | | | | | | | |
Net Assets — 100.0% | | | | | | | | | | $ | 62,001,937 | |
| | | | | | | | | | | | |
|
| Notes to Schedule of Investments |
| (a) | Security exempt from registration pursuant to Rule 144A under the Securities Act of 1933, as amended. These securities may be resold in transactions exempt from registration to qualified institutional investors. |
| (b) | Variable rate security. Rate as of period end. |
| (c) | Step-up bond that pays an initial coupon rate for the first period and then a higher coupon rate for the following periods. Rate as of period end. |
| (d) | Issuer filed for bankruptcy and/or is in default of interest payments. |
| (e) | During the year ended December 31, 2015, investments in issuers considered to be an affiliate of the Fund for purposes of Section 2(a)(3) of the Investment Company Act of 1940, as amended, were as follows: |
| | | | | | | | | | | | | | | | | | | | | | | | | | | | | | | | | | | |
| Affiliate | | Shares Held at
December 31, 2014 | | Shares
Purchased | | Shares
Sold | | Shares Held at
December 31, 2015 | | Value at
December 31, 2015 | | Income | | Realized
Gain |
BlackRock Liquidity Funds, TempFund, Institutional Class | | | | 741,711 | | | | | — | | | | | 74,655 | 1 | | | | 667,056 | | | | | $667,056 | | | | $ | 1,773 | | | | | $32 | |
iShares iBoxx $ High Yield Corporate Bond ETF | | | | — | | | | | 9,267 | | | | | — | | | | | 9,267 | | | | | $746,735 | | | | $ | 13,380 | | | | | — | |
| | 1 | | Represents net shares sold. |
| (g) | Other interests represent beneficial interests in liquidation trusts and other reorganization or private entities. |
| (h) | Non-income producing security. |
| (i) | Perpetual security with no stated maturity date. |
| (j) | Represents or includes a TBA transaction. As of period end, unsettled TBA transactions were as follows: |
| | | | | | | | |
| Counterparty | | Value | | | Unrealized
Appreciation
(Depreciation) | |
Barclays Capital, Inc. | | $ | (557,430 | ) | | | $ 716 | |
BNP Paribas Securities Corp. | | $ | 40,316 | | | | $ (34 | ) |
Citigroup Global Markets, Inc. | | $ | (575,358 | ) | | | $ 448 | |
Credit Suisse Securities (USA) LLC | | $ | 98,772 | | | | $ 232 | |
Deutsche Bank Securities, Inc. | | $ | 261,673 | | | | $ 481 | |
Goldman Sachs & Co. | | $ | (1,192,522 | ) | | | $(1,097 | ) |
J.P. Morgan Securities LLC | | $ | (2,145,907 | ) | | | $ 730 | |
Merrill Lynch, Pierce, Fenner & Smith, Inc. | | $ | (285,804 | ) | | | $ (876 | ) |
Morgan Stanley & Co. LLC | | $ | 259,120 | | | | $ 58 | |
Nomura Securities International, Inc. | | $ | 101,355 | | | | $ 246 | |
RBC Capital Markets, LLC | | $ | (31,904 | ) | | | $ (50 | ) |
Wells Fargo Securities, LLC | | $ | 50,395 | | | | $ (58 | ) |
| (k) | Amount is less than $500. |
See Notes to Financial Statements.
| | | | | | |
| | | BLACKROCK SERIES FUND, INC. | | DECEMBER 31, 2015 | | 103 |
| | | | |
| Schedule of Investments (continued) | | | BlackRock Total Return Portfolio | |
| (l) | All or a portion of security has been pledged as collateral in connection with outstanding reverse repurchase agreements. |
| (m) | All or a portion of security has been pledged in connection with outstanding financial futures contracts. |
| (n) | Certain agreements have no stated maturity and can be terminated by either party at any time. |
| (o) | Current yield as of period end. |
| (p) | All or a portion of security has been pledged as collateral in connection with outstanding borrowed bonds. |
| • | | For Fund compliance purposes, the Fund’s industry classifications refer to any one or more of the industry sub-classifications used by one or more widely recognized market indexes or ratings group indexes, and/or as defined by the investment advisor. These definitions may not apply for purposes of this report, which may combine such industry sub-classifications for reporting ease. |
Reverse repurchase agreements
| | | | | | | | | | | | | | | | | | | | |
| Counterparty | | Interest
Rate | | Trade
Date | | Maturity
Date | | Face Value | | | Face Value
Including
Accrued
Interest | | | Type of Underlying
Collateral | | Remaining
Contractual
Maturity of the
Agreements | |
Merrill Lynch, Pierce, Fenner & Smith, Inc. | | 0.10% | | 12/01/15 | | 1/05/16 | | | $ 495,000 | | | | $ 495,045 | | | U.S. Treasury Obligations | | | Up to 30 Days | |
J.P. Morgan Securities LLC | | 0.62% | | 12/29/15 | | 1/04/16 | | | 2,772,000 | | | | 2,772,239 | | | U.S. Treasury Obligations | | | Up to 30 Days | |
Merrill Lynch, Pierce, Fenner & Smith, Inc. | | 0.20% | | 12/29/15 | | 1/04/16 | | | 472,516 | | | | 472,529 | | | U.S. Treasury Obligations | | | Up to 30 Days | |
Merrill Lynch, Pierce, Fenner & Smith, Inc. | | 0.40% | | 12/29/15 | | 1/04/16 | | | 556,095 | | | | 556,126 | | | U.S. Treasury Obligations | | | Up to 30 Days | |
Merrill Lynch, Pierce, Fenner & Smith, Inc. | | 0.50% | | 12/29/15 | | 1/04/16 | | | 2,343,263 | | | | 2,343,425 | | | U.S. Treasury Obligations | | | Up to 30 Days | |
Total | | | | | | | | | $6,638,874 | | | | $6,639,364 | | | | | | | |
| | | | | | | | | | | | | | | | |
|
| Derivative Financial Instruments Outstanding as of Period End |
Financial Futures Contracts
| | | | | | | | | | | | | | |
Contracts Long (Short) | | Issue | | Expiration | | Notional Value | | Unrealized
Appreciation
(Depreciation) | |
(1) | | Euro-Bobl | | March 2016 | | | USD | | | 142,006 | | | $ 293 | |
(1) | | Euro-Bund | | March 2016 | | | USD | | | 171,620 | | | (816 | ) |
4 | | U.S. Treasury Bonds (30 Year) | | March 2016 | | | USD | | | 615,000 | | | 1,734 | |
17 | | U.S. Treasury Notes (10 Year) | | March 2016 | | | USD | | | 2,140,406 | | | (7,077 | ) |
15 | | U.S. Treasury Notes (2 Year) | | March 2016 | | | USD | | | 3,258,516 | | | (5,222 | ) |
15 | | U.S. Treasury Notes (5 Year) | | March 2016 | | | USD | | | 1,774,805 | | | (3,536 | ) |
8 | | U.S. Ultra Treasury Bonds | | March 2016 | | | USD | | | 1,269,500 | | | 5,594 | |
(39) | | Euro Dollar Futures | | December 2017 | | | USD | | | 9,576,938 | | | 12,134 | |
Total | | | | | | | | | | | | | $ 3,104 | |
| | | | | | | | | | | | | | |
Forward Foreign Currency Exchange Contracts
| | | | | | | | | | | | | | | | | | | | |
Currency Purchased | | | | | Currency Sold | | | | | Counterparty | | Settlement Date | | | Unrealized
Appreciation
(Depreciation) | |
MXN | | | 830,000 | | | USD | | | 48,713 | | | The Bank of New York Mellon | | | 1/06/16 | | | | $ (575 | ) |
USD | | | 43,152 | | | AUD | | | 60,000 | | | Goldman Sachs International | | | 1/06/16 | | | | (557 | ) |
USD | | | 17,413 | | | EUR | | | 16,000 | | | The Bank of New York Mellon | | | 1/06/16 | | | | 23 | |
USD | | | 257,387 | | | EUR | | | 243,000 | | | UBS AG | | | 1/06/16 | | | | (6,734 | ) |
USD | | | 109,620 | | | MXN | | | 1,821,000 | | | Société Générale | | | 1/06/16 | | | | 4,008 | |
USD | | | 12,214 | | | JPY | | | 1,500,000 | | | Goldman Sachs International | | | 1/07/16 | | | | (267 | ) |
USD | | | 24,598 | | | IDR | | | 349,539,831 | | | HSBC Bank PLC | | | 1/14/16 | | | | (669 | ) |
MXN | | | 397,175 | | | USD | | | 23,126 | | | State Street Bank and Trust Co. | | | 1/15/16 | | | | (107 | ) |
PLN | | | 192,871 | | | USD | | | 48,631 | | | Standard Chartered Bank | | | 1/15/16 | | | | 519 | |
PLN | | | 334,365 | | | USD | | | 84,590 | | | Standard Chartered Bank | | | 1/15/16 | | | | 619 | |
USD | | | 115,293 | | | EUR | | | 104,528 | | | Royal Bank of Scotland PLC | | | 1/15/16 | | | | 1,654 | |
USD | | | 49,098 | | | MXN | | | 815,259 | | | Morgan Stanley & Co. International PLC | | | 1/15/16 | | | | 1,847 | |
USD | | | 231,229 | | | PLN | | | 934,766 | | | Citibank N.A. | | | 1/15/16 | | | | (6,984 | ) |
See Notes to Financial Statements.
| | | | | | |
| 104 | | BLACKROCK SERIES FUND, INC. | | DECEMBER 31, 2015 | | |
| | | | |
| Schedule of Investments (continued) | | | BlackRock Total Return Portfolio | |
| | | | | | | | | | | | | | | | | | | | |
Currency
Purchased | | | Currency Sold | | | Counterparty | | Settlement
Date | | Unrealized
Appreciation
(Depreciation) | |
| USD | | | 14,444 | | | | PLN | | | | 57,131 | | | Goldman Sachs International | | 1/15/16 | | | $ (115) | |
| MXN | | | 452,291 | | | | USD | | | | 26,564 | | | State Street Bank and Trust Co. | | 1/20/16 | | | (360) | |
| USD | | | 69,437 | | | | MXN | | | | 1,168,868 | | | Royal Bank of Scotland PLC | | 1/20/16 | | | 1,717 | |
| MXN | | | 570,156 | | | | USD | | | | 33,220 | | | Citibank N.A. | | 1/26/16 | | | (202) | |
| RUB | | | 1,029,528 | | | | USD | | | | 14,667 | | | BNP Paribas S.A. | | 2/09/16 | | | (718) | |
| USD | | | 19,425 | | | | RUB | | | | 1,363,484 | | | BNP Paribas S.A. | | 2/09/16 | | | 951 | |
| MXN | | | 397,918 | | | | USD | | | | 23,337 | | | State Street Bank and Trust Co. | | 2/10/16 | | | (318) | |
| USD | | | 71,556 | | | | MXN | | | | 1,214,212 | | | Goldman Sachs International | | 2/10/16 | | | 1,317 | |
| Total | | | | | | | | | | | | | | | $(4,951) | |
| | | | | | | | | | | | |
Exchange-Traded Options Purchased | | | | | | | | | | |
| | | | | | | | | | | | | | |
| Description | | Put/
Call | | Expiration
Date | | Strike Price | | Contracts | | Value |
| | | | | | |
Euro Dollar 90-Day | | Put | | 3/11/16 | | | USD | | | 98.38 | | 64 | | $4,400 |
|
OTC Interest Rate Swaptions Purchased |
| | | | | | | | | | | | | | | | | | | | | | | | | | |
| Description | | Counterparty | | Put/ Call | | | Exercise Rate | | Pay/Receive
Exercise Rate | | Floating Rate
Index | | | Expiration
Date | | Notional
Amount (000) | | | Value |
| | | | | | | | | |
10-Year Interest Rate Swap | | JPMorgan Chase
Bank N.A. | | | Call | | | 2.00% | | Receive | | | 3-month LIBOR | | | 1/19/16 | | | USD | | | | 1,349 | | | $824 |
| | | | | | | | | | | | | | | | | | | | |
| Centrally Cleared Credit Default Swaps — Buy Protection | | | | | | | | | | |
| | | | | | | | | | | | | | | | | | | | |
| Index | | Pay
Fixed
Rate | | | Expiration
Date | | | Notional Amount (000) | | | Unrealized Depreciation | |
CDX.NA.HY Series 25 Version 1 | | | 5.00 | % | | | 12/20/20 | | | | USD | | | | 310 | | | | $(4,724) | |
| |
| | | | | | | | | | | | | | | | | | |
Centrally Cleared Interest Rate Swaps | |
Fixed Rate | | Floating Rate | | Effective
Date | | Expiration
Date | | | | | Notional Amount (000) | | | Unrealized
Appreciation
(Depreciation) | |
0.65%1 | | 3-month LIBOR | | N/A | | 11/26/16 | | | USD | | | | 220 | | | | $ 296 | |
1.26%1 | | 3-month LIBOR | | 1/12/162 | | 1/12/17 | | | USD | | | | 3,506 | | | | (12,912) | |
2.13%3 | | 3-month LIBOR | | N/A | | 8/25/25 | | | USD | | | | 20 | | | | 84 | |
2.27%1 | | 3-month LIBOR | | N/A | | 9/11/25 | | | USD | | | | 31 | | | | (501) | |
| Total | | | | | | | | | | | | | | $(13,033) | |
| | 1 | | Fund pays the fixed rate and receives the floating rate. |
| | 3 | | Fund pays the floating rate and receives the fixed rate. |
| | | | | | | | | | | | | | | | |
OTC Credit Default Swaps — Buy Protection | | | | | | | | | | | | |
| | | | | | | | | | | | | | | | | | | | | | | | | | |
| Issuer | | Pay
Fixed
Rate | | Counterparty | | Expiration
Date | | Notional
Amount
(000) | | | Value | | | Premiums
Paid
(Received) | | | Unrealized
Appreciation
(Depreciation) | |
United Mexican States | | 1.00% | | JPMorgan Chase Bank N.A. | | 6/20/20 | | | USD | | | | 66 | | | $ | 1,602 | | | | $ 518 | | | | $ 1,084 | |
United Mexican States | | 1.00% | | Bank of America N.A. | | 9/20/20 | | | USD | | | | 66 | | | | 1,850 | | | | 781 | | | | 1,069 | |
Deutsche Bank AG | | 1.00% | | Bank of America N.A. | | 12/20/20 | | | EUR | | | | 110 | | | | (319 | ) | | | (756 | ) | | | 437 | |
Standard Chartered PLC | | 1.00% | | Bank of America N.A. | | 12/20/20 | | | EUR | | | | 120 | | | | 2,143 | | | | 2,314 | | | | (171 | ) |
HSBC Bank PLC | | 1.00% | | BNP Paribas S.A. | | 12/20/20 | | | EUR | | | | 110 | | | | (1,738 | ) | | | (285 | ) | | | (1,453 | ) |
See Notes to Financial Statements.
| | | | | | |
| | | BLACKROCK SERIES FUND, INC. | | DECEMBER 31, 2015 | | 105 |
| | | | |
| Schedule of Investments (continued) | | | BlackRock Total Return Portfolio | |
| | | | | | | | | | | | | | | | | | | | | | | | | | | | |
| Issuer | | Pay
Fixed
Rate | | Counterparty | | | Expiration
Date | | Notional
Amount
(000) | | | Value | | | Premiums
Paid
(Received) | | | Unrealized
Appreciation
(Depreciation) | |
Standard Chartered PLC | | 1.00% | | | BNP Paribas S.A. | | | 12/20/20 | | | EUR | | | | 40 | | | | $ 714 | | | | $ 1,019 | | | | $ (305) | |
Standard Chartered PLC | | 1.00% | | | BNP Paribas S.A. | | | 12/20/20 | | | EUR | | | | 30 | | | | 536 | | | | 797 | | | | (261) | |
HSBC Holdings PLC | | 1.00% | | | Citibank N.A. | | | 12/20/20 | | | EUR | | | | 140 | | | | (2,213 | ) | | | (515 | ) | | | (1,698) | |
HSBC Holdings PLC | | 1.00% | | | Citibank N.A. | | | 12/20/20 | | | EUR | | | | 80 | | | | (1,265 | ) | | | (251 | ) | | | (1,014) | |
Standard Chartered PLC | | 1.00% | | | Citibank N.A. | | | 12/20/20 | | | EUR | | | | 110 | | | | 1,964 | | | | 1,238 | | | | 726 | |
Standard Chartered PLC | | 1.00% | | | Citibank N.A. | | | 12/20/20 | | | EUR | | | | 80 | | | | 1,428 | | | | 2,250 | | | | (822) | |
Standard Chartered PLC | | 1.00% | |
| Goldman Sachs
International |
| | 12/20/20 | | | EUR | | | | 60 | | | | 1,071 | | | | 681 | | | | 390 | |
HSBC Bank PLC | | 1.00% | | | JPMorgan Chase Bank N.A. | | | 12/20/20 | | | EUR | | | | 120 | | | | (1,897 | ) | | | (1,799 | ) | | | (98) | |
HSBC Bank PLC | | 1.00% | | | JPMorgan Chase Bank N.A. | | | 12/20/20 | | | EUR | | | | 120 | | | | (1,897 | ) | | | (1,031 | ) | | | (866) | |
Standard Chartered PLC | | 1.00% | |
| Morgan Stanley Capital
Services LLC |
| | 12/20/20 | | | EUR | | | | 50 | | | | 892 | | | | 816 | | | | 76 | |
Standard Chartered PLC | | 1.00% | |
| Morgan Stanley Capital
Services LLC |
| | 12/20/20 | | | EUR | | | | 20 | | | | 357 | | | | 542 | | | | (185) | |
Federation of Malaysia | | 1.00% | | | Bank of America N.A. | | | 12/20/20 | | | USD | | | | 11 | | | | 408 | | | | 581 | | | | (173) | |
Republic of South Africa | | 1.00% | | | Bank of America N.A. | | | 12/20/20 | | | USD | | | | 15 | | | | 1,535 | | | | 1,534 | | | | 1 | |
Federation of Malaysia | | 1.00% | | | Barclays Bank PLC | | | 12/20/20 | | | USD | | | | 10 | | | | 376 | | | | 507 | | | | (131) | |
Federation of Malaysia | | 1.00% | | | Barclays Bank PLC | | | 12/20/20 | | | USD | | | | 6 | | | | 231 | | | | 385 | | | | (154) | |
Loews Corp. | | 1.00% | | | Barclays Bank PLC | | | 12/20/20 | | | USD | | | | 35 | | | | (1,283 | ) | | | (1,225 | ) | | | (58) | |
Republic of South Africa | | 1.00% | | | Barclays Bank PLC | | | 12/20/20 | | | USD | | | | 30 | | | | 3,070 | | | | 3,079 | | | | (9) | |
Federation of Malaysia | | 1.00% | | | BNP Paribas S.A. | | | 12/20/20 | | | USD | | | | 10 | | | | 378 | | | | 567 | | | | (189) | |
Federation of Malaysia | | 1.00% | | | BNP Paribas S.A. | | | 12/20/20 | | | USD | | | | 6 | | | | 234 | | | | 394 | | | | (160) | |
Federation of Malaysia | | 1.00% | | | Citibank N.A. | | | 12/20/20 | | | USD | | | | 10 | | | | 379 | | | | 523 | | | | (144) | |
Federation of Malaysia | | 1.00% | | | Citibank N.A. | | | 12/20/20 | | | USD | | | | 10 | | | | 378 | | | | 535 | | | | (157) | |
Republic of the Philippines | | 1.00% | | | Citibank N.A. | | | 12/20/20 | | | USD | | | | 33 | | | | 144 | | | | (44 | ) | | | 188 | |
Republic of the Philippines | | 1.00% | | | Citibank N.A. | | | 12/20/20 | | | USD | | | | 17 | | | | 73 | | | | (6 | ) | | | 79 | |
Republic of the Philippines | | 1.00% | | | Citibank N.A. | | | 12/20/20 | | | USD | | | | 16 | | | | 72 | | | | (6 | ) | | | 78 | |
Australia and New Zealand Banking Group Ltd. | | 1.00% | | | Deutsche Bank AG | | | 12/20/20 | | | USD | | | | 130 | | | | (1,211 | ) | | | (1,025 | ) | | | (186) | |
Australia and New Zealand Banking Ltd. | | 1.00% | |
| Goldman Sachs
International |
| | 12/20/20 | | | USD | | | | 371 | | | | (3,457 | ) | | | (2,072 | ) | | | (1,385) | |
Federation of Malaysia | | 1.00% | | | HSBC Bank PLC | | | 12/20/20 | | | USD | | | | 10 | | | | 378 | | | | 548 | | | | (170) | |
Republic of South Africa | | 1.00% | | | HSBC Bank PLC | | | 12/20/20 | | | USD | | | | 17 | | | | 1,739 | | | | 1,654 | | | | 85 | |
Australia and New Zealand Banking Group Ltd. | | 1.00% | | | JPMorgan Chase Bank N.A. | | | 12/20/20 | | | USD | | | | 41 | | | | (384 | ) | | | (150 | ) | | | (234) | |
Australia and New Zealand Banking Group Ltd. | | 1.00% | | | JPMorgan Chase Bank N.A. | | | 12/20/20 | | | USD | | | | 37 | | | | (349 | ) | | | (105 | ) | | | (244) | |
Republic of South Africa | | 1.00% | | | JPMorgan Chase Bank N.A. | | | 12/20/20 | | | USD | | | | 15 | | | | 1,535 | | | | 1,552 | | | | (17) | |
Total | | | | | | | | | | | | | | | | | | $ | 7,474 | | | | $13,545 | | | | $(6,071) | |
| | | | | | | | | | | | | | | | | | | | |
| | | | | | | | | | | | | | | | | | | | | | | | | | | | |
OTC Credit Default Swaps — Sell Protection | |
| Issuer/Index | | Receive
Fixed
Rate | | Counterparty | | Expiration
Date | | Credit
Rating1 | | Notional
Amount
(000)2 | | | Value | | | Premiums
Received | | | Unrealized
Appreciation
(Depreciation) | |
Transocean, Inc. | | 1.00% | | Goldman Sachs
International | | 6/20/19 | | BB+ | | | USD | | | | 50 | | | | $(16,036 | ) | | | $(1,085 | ) | | | $(14,951 | ) |
Transocean, Inc. | | 1.00% | | Goldman Sachs
International | | 6/20/19 | | BB+ | | | USD | | | | 10 | | | | (3,208 | ) | | | (217 | ) | | | (2,991 | ) |
Transocean, Inc. | | 1.00% | | Bank of America N.A. | | 12/20/19 | | BB+ | | | USD | | | | 15 | | | | (5,435 | ) | | | (959 | ) | | | (4,476 | ) |
Transocean, Inc. | | 1.00% | | Bank of America N.A. | | 12/20/19 | | BB+ | | | USD | | | | 10 | | | | (3,623 | ) | | | (618 | ) | | | (3,005 | ) |
Transocean, Inc. | | 1.00% | | Bank of America N.A. | | 12/20/19 | | BB+ | | | USD | | | | 10 | | | | (3,623 | ) | | | (604 | ) | | | (3,019 | ) |
United Mexican States | | 1.00% | | Bank of America N.A. | | 6/20/20 | | BBB+ | | | USD | | | | 66 | | | | (1,602 | ) | | | (600 | ) | | | (1,002 | ) |
United Mexican States | | 1.00% | | JPMorgan Chase Bank N.A. | | 9/20/20 | | BBB+ | | | USD | | | | 66 | | | | (1,850 | ) | | | (680 | ) | | | (1,170 | ) |
Republic of Indonesia | | 1.00% | | Barclays Bank PLC | | 12/20/20 | | BB+ | | | USD | | | | 19 | | | | (1,143 | ) | | | (980 | ) | | | (163 | ) |
Republic of Indonesia | | 1.00% | | Barclays Bank PLC | | 12/20/20 | | BB+ | | | USD | | | | 14 | | | | (858 | ) | | | (754 | ) | | | (104 | ) |
Republic of Indonesia | | 1.00% | | Barclays Bank PLC | | 12/20/20 | | BB+ | | | USD | | | | 9 | | | | (546 | ) | | | (442 | ) | | | (104 | ) |
See Notes to Financial Statements.
| | | | | | |
| 106 | | BLACKROCK SERIES FUND, INC. | | DECEMBER 31, 2015 | | |
| | | | |
| Schedule of Investments (continued) | | | BlackRock Total Return Portfolio | |
| | | | | | | | | | | | | | | | | | | | | | | | | | | | | | | | |
| Issuer/Index | | Receive
Fixed
Rate | | | Counterparty | | | Expiration
Date | | Credit
Rating1 | | Notional
Amount
(000)2 | | | Value | | | Premiums
Received | | | Unrealized
Appreciation
(Depreciation) | |
Republic of Indonesia | | | 1.00 | % | | | Barclays Bank PLC | | | 12/20/20 | | BB+ | | | USD | | | | 9 | | | | $ (547 | ) | | | $ (436 | ) | | | $ (111 | ) |
Republic of Indonesia | | | 1.00 | % | | | Barclays Bank PLC | | | 12/20/20 | | BB+ | | | USD | | | | 9 | | | | (547 | ) | | | (428 | ) | | | (119 | ) |
Republic of Indonesia | | | 1.00 | % | | | Barclays Bank PLC | | | 12/20/20 | | BB+ | | | USD | | | | 8 | | | | (497 | ) | | | (420 | ) | | | (77 | ) |
Republic of Indonesia | | | 1.00 | % | | | Citibank N.A. | | | 12/20/20 | | BB+ | | | USD | | | | 36 | | | | (2,141 | ) | | | (1,760 | ) | | | (381 | ) |
Republic of Indonesia | | | 1.00 | % | | | Citibank N.A. | | | 12/20/20 | | BB+ | | | USD | | | | 19 | | | | (1,113 | ) | | | (954 | ) | | | (159 | ) |
Republic of Indonesia | | | 1.00 | % | | | Citibank N.A. | | | 12/20/20 | | BB+ | | | USD | | | | 18 | | | | (1,070 | ) | | | (895 | ) | | | (175 | ) |
Republic of Indonesia | | | 1.00 | % | | | Citibank N.A. | | | 12/20/20 | | BB+ | | | USD | | | | 18 | | | | (1,062 | ) | | | (888 | ) | | | (174 | ) |
Republic of Indonesia | | | 1.00 | % | | | HSBC Bank PLC | | | 12/20/20 | | BB+ | | | USD | | | | 21 | | | | (1,217 | ) | | | (1,043 | ) | | | (174 | ) |
Russian Federation | | | 1.00 | % | | | Barclays Bank PLC | | | 12/20/20 | | BB+ | | | USD | | | | 31 | | | | (2,818 | ) | | | (2,541 | ) | | | (277 | ) |
CMBX.NA Series 3 AM | | | 0.50 | % | | | Credit Suisse International | | | 12/13/49 | | BBB- | | | USD | | | | 200 | | | | (2,888 | ) | | | (18,443 | ) | | | 15,555 | |
CMBX.NA Series 4 AM | | | 0.50 | % | | | Deutsche Bank AG | | | 2/17/51 | | BB | | | USD | | | | 50 | | | | (1,010 | ) | | | (6,966 | ) | | | 5,956 | |
CMBX.NA Series 8 BBB- | | | 3.00 | % | | | Barclays Bank PLC | | | 10/17/57 | | BBB- | | | USD | | | | 10 | | | | (1,254 | ) | | | (1,093 | ) | | | (161 | ) |
CMBX.NA Series 8 BBB- | | | 3.00 | % | | | Barclays Bank PLC | | | 10/17/57 | | BBB- | | | USD | | | | 10 | | | | (1,254 | ) | | | (1,066 | ) | | | (188 | ) |
CMBX.NA Series 8 BBB- | | | 3.00 | % | | | Credit Suisse International | | | 10/17/57 | | NR | | | USD | | | | 10 | | | | (1,254 | ) | | | (1,063 | ) | | | (191 | ) |
Total | | | | | | | | | | | | | | | | | | | | | | | $(56,596 | ) | | | $(44,935 | ) | | | $(11,661 | ) |
| | | | | | | | | | | | | | | | | | | | | | | | |
| | 1 | | Using S&P’s rating of the issuer or the underlying securities of the index, as applicable. |
| | 2 | | The maximum potential amount the Fund may pay should a negative credit event take place as defined under the terms of the agreement. |
| | | | | | | | | | | | | | | | | | | | | | | | | | |
OTC Interest Rate Swaps | |
Fixed Rate | | Floating Rate | | Counterparty | | Expiration
Date | | Notional Amount (000) | | | Value | | | Premiums
Paid
(Received) | | | Unrealized
Appreciation
(Depreciation) | |
| 12.30%1 | | 1-day BZDIOVER | | Bank of America N.A. | | 1/04/16 | | | BRL | | | | 955 | | | | $ 2,513 | | | | — | | | | $ 2,513 | |
| 12.30%2 | | 1-day BZDIOVER | | Credit Suisse International | | 1/04/16 | | | BRL | | | | 629 | | | | (1,656 | ) | | | — | | | | (1,656 | ) |
| 11.36%2 | | 1-day BZDIOVER | | Credit Suisse International | | 1/04/16 | | | BRL | | | | 449 | | | | (2,177 | ) | | | — | | | | (2,177 | ) |
| 11.12%2 | | 1-day BZDIOVER | | Credit Suisse International | | 1/04/16 | | | BRL | | | | 124 | | | | (709 | ) | | | — | | | | (709 | ) |
| 11.26%2 | | 1-day BZDIOVER | | Deutsche Bank AG | | 1/04/16 | | | BRL | | | | 109 | | | | (575 | ) | | | — | | | | (575 | ) |
| 12.14%1 | | 1-day BZDIOVER | | JPMorgan Chase Bank N.A. | | 1/04/16 | | | BRL | | | | 930 | | | | 2,521 | | | | — | | | | 2,521 | |
| 11.83%2 | | 1-day BZDIOVER | | JPMorgan Chase Bank N.A. | | 1/04/16 | | | BRL | | | | 590 | | | | (1,419 | ) | | | — | | | | (1,419 | ) |
| 11.80%1 | | 1-day BZDIOVER | | JPMorgan Chase Bank N.A. | | 1/04/16 | | | BRL | | | | 577 | | | | 1,704 | | | | — | | | | 1,704 | |
| 12.13%1 | | 1-day BZDIOVER | | JPMorgan Chase Bank N.A. | | 1/04/16 | | | BRL | | | | 423 | | | | 1,159 | | | | — | | | | 1,159 | |
| 11.85%2 | | 1-day BZDIOVER | | JPMorgan Chase Bank N.A. | | 1/04/16 | | | BRL | | | | 277 | | | | (965 | ) | | | — | | | | (965 | ) |
| 11.91%2 | | 1-day BZDIOVER | | JPMorgan Chase Bank N.A. | | 1/04/16 | | | BRL | | | | 255 | | | | (505 | ) | | | — | | | | (505 | ) |
| 5.72%2 | | Colombia
Overnight
Interbank
Reference Rate | | Goldman Sachs International | | 2/24/16 | | | COP | | | | 400,125 | | | | 86 | | | | — | | | | 86 | |
| 5.70%2 | | Colombia
Overnight
Interbank
Reference Rate | | Credit Suisse International | | 2/25/16 | | | COP | | | | 389,726 | | | | 38 | | | | — | | | | 38 | |
See Notes to Financial Statements.
| | | | | | |
| | | BLACKROCK SERIES FUND, INC. | | DECEMBER 31, 2015 | | 107 |
| | | | |
| Schedule of Investments (continued) | | | BlackRock Total Return Portfolio | |
| | | | | | | | | | | | | | | | | | | | | | | | | | |
Fixed Rate | | Floating Rate | | Counterparty | | Expiration
Date | | Notional Amount (000) | | | Value | | | Premiums
Paid
(Received) | | | Unrealized
Appreciation
(Depreciation) | |
| 5.70%2 | | Colombia Overnight
Interbank
Reference Rate | | Credit Suisse International | | 2/25/16 | | | COP | | | | 349,195 | | | $ | 34 | | | | — | | | | $ 34 | |
| 5.70%2 | | Colombia Overnight
Interbank
Reference Rate | | Credit Suisse International | | 2/25/16 | | | COP | | | | 338,829 | | | | 33 | | | | — | | | | 33 | |
| 2.25%2 | | 7-day China Fixing
Repo Rates | | Bank of America N.A. | | 5/22/17 | | | CNY | | | | 711 | | | | 58 | | | | $ (3) | | | | 61 | |
| 2.12%2 | | 7-day China Fixing
Repo Rates | | Deutsche Bank AG | | 7/09/17 | | | CNY | | | | 358 | | | | (91 | ) | | | 1 | | | | (92 | ) |
| 1.92%2 | | 3-month KRW
Certificate of
Deposit | | Deutsche Bank AG | | 11/10/17 | | | KRW | | | | 100,213 | | | | 551 | | | | 246 | | | | 305 | |
| 1.69%1 | | 3-month KRW
Certificate of
Deposit | | Deutsche Bank AG | | 11/10/17 | | | KRW | | | | 100,213 | | | | (160 | ) | | | — | | | | (160 | ) |
| 2.26%2 | | 7-day China Fixing
Repo Rates | | Deutsche Bank AG | | 11/12/17 | | | CNY | | | | 515 | | | | 94 | | | | — | | | | 94 | |
| 4.34%1 | | 28-day MXIBTIIE | | Bank of America N.A. | | 12/15/17 | | | MXN | | | | 260 | | | | 8 | | | | 1 | | | | 7 | |
| 4.35%1 | | 28-day MXIBTIIE | | Goldman Sachs International | | 12/15/17 | | | MXN | | | | 2,880 | | | | 79 | | | | 13 | | | | 66 | |
| 4.33%1 | | 28-day MXIBTIIE | | Goldman Sachs International | | 12/15/17 | | | MXN | | | | 2,528 | | | | 112 | | | | 11 | | | | 101 | |
| 4.30%1 | | 28-day MXIBTIIE | | Bank of America N.A. | | 12/18/17 | | | MXN | | | | 2,236 | | | | 234 | | | | 3 | | | | 231 | |
| 4.30%1 | | 28-day MXIBTIIE | | Goldman Sachs International | | 12/18/17 | | | MXN | | | | 1,664 | | | | 174 | | | | 2 | | | | 172 | |
| 4.32%1 | | 28-day MXIBTIIE | | UBS AG | | 12/18/17 | | | MXN | | | | 1,489 | | | | 122 | | | | 2 | | | | 120 | |
| 4.55%1 | | 28-day MXIBTIIE | | Barclays Bank PLC | | 3/21/18 | | | MXN | | | | 408 | | | | (22 | ) | | | 6 | | | | (28 | ) |
| 4.85%1 | | 28-day MXIBTIIE | | Bank of America N.A. | | 11/01/18 | | | MXN | | | | 358 | | �� | | (53 | ) | | | 1 | | | | (54 | ) |
| 2.57%2 | | 3-month LIBOR | | Deutsche Bank AG | | 10/27/20 | | | USD | | | | 200 | | | | 8,950 | | | | — | | | | 8,950 | |
| 11.41%1 | | 1-day BZDIOVER | | Bank of America N.A. | | 1/04/21 | | | BRL | | | | 82 | | | | 5,059 | | | | — | | | | 5,059 | |
| 12.05%2 | | 1-day BZDIOVER | | Bank of America N.A. | | 1/04/21 | | | BRL | | | | 43 | | | | (2,286 | ) | | | — | | | | (2,286 | ) |
| 11.84%2 | | 1-day BZDIOVER | | HSBC Bank PLC | | 1/04/21 | | | BRL | | | | 29 | | | | (1,605 | ) | | | — | | | | (1,605 | ) |
| 11.72%2 | | 1-day BZDIOVER | | JPMorgan Chase Bank N.A. | | 1/04/21 | | | BRL | | | | 9 | | | | (541 | ) | | | — | | | | (541 | ) |
| 3.27%1 | | 3-month LIBOR | | Deutsche Bank AG | | 5/16/21 | | | USD | | | | 210 | | | | (17,120 | ) | | | — | | | | (17,120 | ) |
| 3.25%1 | | 3-month LIBOR | | UBS AG | | 7/05/21 | | | USD | | | | 300 | | | | (27,850 | ) | | | — | | | | (27,850 | ) |
| 2.16%1 | | 3-month LIBOR | | Bank of America N.A. | | 5/28/23 | | | USD | | | | 100 | | | | (1,369 | ) | | | — | | | | (1,369 | ) |
| 2.32%2 | | 3-month LIBOR | | Bank of America N.A. | | 5/31/23 | | | USD | | | | 200 | | | | 4,997 | | | | — | | | | 4,997 | |
| 2.31%1 | | 3-month LIBOR | | Deutsche Bank AG | | 5/31/23 | | | USD | | | | 100 | | | | (2,445 | ) | | | — | | | | (2,445 | ) |
| 5.84%2 | | 28-day MXIBTIIE | | Deutsche Bank AG | | 11/14/24 | | | MXN | | | | 544 | | | | (938 | ) | | | (3) | | | | (935 | ) |
| 5.85%2 | | 28-day MXIBTIIE | | Deutsche Bank AG | | 11/14/24 | | | MXN | | | | 237 | | | | (400 | ) | | | (1) | | | | (399 | ) |
| 5.73%1 | | 28-day MXIBTIIE | | Bank of America N.A. | | 1/03/25 | | | MXN | | | | 336 | | | | 760 | | | | 5 | | | | 755 | |
| 5.55%2 | | 28-day MXIBTIIE | | Bank of America N.A. | | 1/13/25 | | | MXN | | | | 244 | | | | (743 | ) | | | (1) | | | | (742 | ) |
| 5.56%2 | | 28-day MXIBTIIE | | Goldman Sachs International | | 1/13/25 | | | MXN | | | | 577 | | | | (1,744 | ) | | | (2) | | | | (1,742 | ) |
| 6.43%2 | | 28-day MXIBTIIE | | Bank of America N.A. | | 6/06/25 | | | MXN | | | | 262 | | | | 141 | | | | (4) | | | | 145 | |
| 6.33%2 | | 28-day MXIBTIIE | | Citibank N.A. | | 6/09/25 | | | MXN | | | | 131 | | | | 14 | | | | (1) | | | | 15 | |
| 6.33%2 | | 28-day MXIBTIIE | | Citibank N.A. | | 7/17/25 | | | MXN | | | | 316 | | | | (2 | ) | | | (2) | | | | — | |
| 6.32%2 | | 28-day MXIBTIIE | | Morgan Stanley Capital Services
LLC | | 7/17/25 | | | MXN | | | | 633 | | | | (16 | ) | | | (3) | | | | (13 | ) |
| 6.31%1 | | 28-day MXIBTIIE | | Bank of America N.A. | | 8/11/25 | | | MXN | | | | 318 | | | | 28 | | | | 2 | | | | 26 | |
See Notes to Financial Statements.
| | | | | | |
| 108 | | BLACKROCK SERIES FUND, INC. | | DECEMBER 31, 2015 | | |
| | | | |
| Schedule of Investments (continued) | | | BlackRock Total Return Portfolio | |
| | | | | | | | | | | | | | | | | | | | | | |
Fixed Rate | | Floating Rate | | Counterparty | | Expiration
Date | | Notional Amount (000) | | | Value | | | Premiums
Paid
(Received) | | | Unrealized
Appreciation
(Depreciation) | |
| 6.31%1 | | 28-day MXIBTIIE | | Bank of America N.A. | | 8/11/25 | | MXN | 318 | | | | $ 28 | | | | $ 2 | | | | $ 26 | |
| 6.31%1 | | 28-day MXIBTIIE | | Deutsche Bank AG | | 8/11/25 | | MXN | 1,180 | | | | 116 | | | | 6 | | | | 110 | |
| 6.27%2 | | 28-day MXIBTIIE | | Bank of America N.A. | | 12/05/25 | | MXN | 36 | | | | (16 | ) | | | (1 | ) | | | (15 | ) |
| 6.30%2 | | 28-day MXIBTIIE | | Goldman Sachs International | | 12/05/25 | | MXN | 672 | | | | (206 | ) | | | (9 | ) | | | (197 | ) |
| 6.27%2 | | 28-day MXIBTIIE | | Goldman Sachs International | | 12/05/25 | | MXN | 615 | | | | (270 | ) | | | (8 | ) | | | (262 | ) |
| 6.20%2 | | 28-day MXIBTIIE | | Bank of America N.A. | | 12/08/25 | | MXN | 542 | | | | (422 | ) | | | (2 | ) | | | (420 | ) |
| 6.18%2 | | 28-day MXIBTIIE | | Goldman Sachs International | | 12/08/25 | | MXN | 410 | | | | (347 | ) | | | (2 | ) | | | (345 | ) |
| 6.20%2 | | 28-day MXIBTIIE | | UBS AG | | 12/08/25 | | MXN | 371 | | | | (282 | ) | | | (2 | ) | | | (280 | ) |
| |
| Total | | | | | | | | | | | | | $(37,321 | ) | | | $257 | | | | $(37,578 | ) |
| | | | | | | | | | | | | | |
| | 1 | | Fund pays the fixed rate and receives the floating rate. |
| | 2 | | Fund pays the floating rate and receives the fixed rate. |
| | | | | | | | | | | | | | | | | | | | | | | | | | | | | | |
| Transactions in Options Written for the Year Ended December 31, 2015 | |
| | | | | | | | | | | | | | | | | | | | | | | | | | | | | | |
| |
| | | | | Calls | | | | |
| |
| | | | | Notional (000) | | | | |
| | | Contracts | | BRL | | | EUR | | | KOR | | | MXP | | | USD | | | ZAR | | | Premiums
Received | |
| |
Outstanding options, beginning of year | | 2 | | | 5,830 | | | | — | | | | 100,213 | | | | 4,104 | | | | 600 | | | | 3,151 | | | $ | 23,228 | |
Options written | | 34 | | | — | | | | 1,545 | | | | — | | | | | | | | 4,168 | | | | — | | | | 89,510 | |
Options expired | | | | | (5,830 | ) | | | — | | | | (100,213 | ) | | | (916 | ) | | | | | | | — | | | | (6,025 | ) |
Options closed | | (36) | | | — | | | | (1,545 | ) | | | — | | | | (3,188 | ) | | | (4,768 | ) | | | (3,151) | | | | (106,713 | ) |
| | | |
Outstanding options, end of year | | — | | | — | | | | — | | | | — | | | | — | | | | — | | | | — | | | | — | |
| | | |
| | | |
| |
| | | | | | | | | | | | | | Puts | | | | |
| |
| | | | | | | | | | | | | | Notional (000) | | | | |
| | | | | | | | | | | Contracts | | | BRL | | | EUR | | | USD | | | Premiums
Received | |
| |
Outstanding options, beginning of year | | | | | | | | | | | | | 2 | | | | 2,663 | | | | — | | | | 600 | | | $ | 19,922 | |
Options written | | | | | | | | | | | | | 243 | | | | — | | | | 1,545 | | | | 5,668 | | | | 130,502 | |
Options expired | | | | | | | | | | | | | (4) | | | | (2,130 | ) | | | — | | | | — | | | | (2,309 | ) |
Options closed | | | | | | | | | | | | | (241) | | | | (533 | ) | | | (1,545 | ) | | | (6,268 | ) | | | (148,115 | ) |
| | | | | | | | | | | | | | |
Outstanding options, end of year | | | | | | | | | | | | | — | | | | — | | | | — | | | | — | | | | — | |
| | | | | | | | | | | | | | |
See Notes to Financial Statements.
| | | | | | |
| | | BLACKROCK SERIES FUND, INC. | | DECEMBER 31, 2015 | | 109 |
| | | | |
| Schedule of Investments (continued) | | | BlackRock Total Return Portfolio | |
| | | | | | | | | | | | | | | | |
| Derivative Financial Instruments Categorized by Risk Exposure |
As of period end, the fair values of derivative financial instruments located in the Statements of Assets and Liabilities were as follows: |
| Assets - Derivative Financial Instruments | | Commodity
Contracts | | Credit
Contracts | | Equity
Contracts | | Foreign
Currency
Exchange
Contracts | | Interest
Rate
Contracts | | Other
Contracts | | Total |
Financial futures contracts | | Net unrealized appreciation1 | | — | | — | | — | | — | | $19,755 | | — | | $ 19,755 |
Forward foreign currency exchange contracts | | Unrealized appreciation on forward foreign currency exchange contracts | | — | | — | | — | | $12,655 | | — | | — | | 12,655 |
Options purchased | | Investments at value – unaffiliated2 | | — | | — | | — | | — | | 5,224 | | — | | 5,224 |
Swaps — centrally cleared | | Net unrealized appreciation1 | | — | | — | | — | | — | | 380 | | — | | 380 |
Swaps — OTC | | Unrealized appreciation on OTC swaps Swap premiums paid | | — | | $ 48,539 | | — | | — | | 29,629 | | — | | 78,168 |
| | |
Total | | | | — | | $ 48,539 | | — | | $12,655 | | $54,988 | | — | | $ 116,182 |
| | |
| Liabilities - Derivative Financial Instruments |
Financial futures contracts | | Net unrealized depreciation1 | | — | | — | | — | | — | | $16,651 | | — | | $ 16,651 |
Forward foreign currency exchange contracts | | Unrealized depreciation on forward foreign currency exchange contracts | | — | | — | | — | | $17,606 | | — | | — | | 17,606 |
Swaps — centrally cleared | | Net unrealized depreciation1 | | — | | $ 4,724 | | — | | — | | 13,413 | | — | | 18,137 |
Swaps — OTC | | Unrealized depreciation on OTC swaps; Swap premiums received | | — | | 97,661 | | — | | — | | 66,950 | | — | | 164,611 |
| | |
Total | | | | — | | $102,385 | | — | | $17,606 | | $97,014 | | — | | $217,005 |
| | |
| | 1 | | Includes cumulative appreciation (depreciation) on financial futures contracts and centrally cleared swaps, if any, as reported in the Schedule of Investments. Only current day’s variation margin is reported within the Statement of Assets and Liabilities. |
| | 2 | | Includes options purchased at value as reported in the Schedule of Investments. |
For the year ended December 31, 2015, the effect of derivative financial instruments in the Statements of Operations were as follows:
| | | | | | | | | | | | | | |
| Net Realized Gain (Loss) from: | | Commodity
Contracts | | Credit
Contracts | | Equity
Contracts | | Foreign
Currency
Exchange
Contracts | | Interest
Rate
Contracts | | Other
Contracts | | Total |
Financial futures contracts | | — | | — | | — | | — | | $ (53,059) | | — | | $ (53,059) |
Foreign currency transactions | | — | | — | | — | | $ 331,685 | | — | | — | | 331,685 |
Options purchased1 | | — | | — | | — | | — | | (132,689) | | — | | (132,689) |
Options written | | — | | — | | $185 | | — | | 51,645 | | — | | 51,829 |
Interest rate floors | | — | | — | | — | | — | | (15,651) | | — | | (15,651) |
Swaps | | — | | $ 63,807 | | — | | — | | 30,203 | | — | | 94,010 |
| | |
Total | | — | | $ 63,807 | | $185 | | $ 331,685 | | $(119,552) | | — | | $ 276,125 |
| | |
| | | | | | | | | | | | | | |
| Net Change in Unrealized Appreciation (Depreciation) on: | | | | | | | | | | | | | | |
Financial futures contracts | | — | | — | | — | | — | | $ (57,405) | | — | | $ (57,405) |
Foreign currency translations | | — | | — | | — | | $(104,127) | | — | | — | | (104,127) |
Options purchased1 | | — | | — | | — | | — | | 40,890 | | — | | 40,890 |
Options written | | — | | — | | — | | — | | 418 | | — | | 418 |
Interest rate floors | | — | | — | | — | | — | | 2,856 | | — | | 2,856 |
Swaps | | — | | $(42,270) | | — | | — | | (13,193) | | — | | (55,463) |
| | |
Total | | — | | $(42,270) | | — | | $(104,127) | | $ (26,434) | | — | | $(172,831) |
| | |
| | 1 | | Options purchased are included in the net realized gain (loss) from investments and the net change in unrealized appreciation (depreciation) on investments. |
| | |
| Average Quarterly Balances of Outstanding Derivative Financial Instruments | | |
| | | | |
Financial futures contracts: | | | | |
Average notional value of contracts — long | | $ | 9,741,889 | |
Average notional value of contracts — short | | $ | 9,471,946 | |
Forward foreign currency exchange contracts: | | | | |
Average amounts purchased — in USD | | $ | 1,383,902 | |
Average amounts sold — USD | | $ | 327,474 | |
Options: | | | | |
Average value of option contracts purchased | | $ | 4,763 | |
Average value of option contracts written | | $ | 2,750 | |
See Notes to Financial Statements.
| | | | | | |
| 110 | | BLACKROCK SERIES FUND, INC. | | DECEMBER 31, 2015 | | |
| | | | |
| Schedule of Investments (continued) | | | BlackRock Total Return Portfolio | |
| | | | |
| |
Options (continued): | | | | |
Average notional value of swaption contracts purchased | | $ | 3,299,136 | |
Average notional value of swaption contracts written | | $ | 3,284,736 | |
Average value of interest rate floors purchased | | $ | 5,044 | |
Average value of interest rate floors written | | $ | 914 | |
Credit default swaps: | | | | |
Average notional value - buy protection | | $ | 1,357,496 | |
Average notional value - sell protection | | $ | 1,464,500 | |
Interest rate swaps: | | | | |
Average notional value - pays fixed rate | | $ | 6,304,096 | |
Average notional value - receives fixed rate | | $ | 4,002,578 | |
| |
For more information about the Fund’s investment risks regarding derivative financial instruments, refer to the Notes to Financial Statements.
|
| Derivative Financial Instruments - Offsetting as of Period End |
The Fund’s derivative assets and liabilities (by type) were as follows:
| | | | | | | | |
| |
| | | Assets | | | Liabilities | |
| |
Derivative Financial Instruments: | | | | | | | | |
Financial futures contracts | | | $ 15,719 | | | | $ 1,977 | |
Forward foreign currency exchange contracts | | | 12,655 | | | | 17,606 | |
Options | | | 5,224 | 1 | | | — | |
Swaps - Centrally cleared | | | 163 | | | | — | |
Swaps - OTC2 | | | 78,168 | | | | 164,611 | |
| | | | |
Total derivative assets and liabilities in the Statements of Assets and Liabilities | | | $111,929 | | | | $184,194 | |
Derivatives not subject to a Master Netting Agreement or similar agreement (“MNA”) | | | (20,282 | ) | | | (1,977 | ) |
| | | | |
Total derivative assets and liabilities subject to an MNA | | | $ 91,647 | | | | $182,217 | |
| | | | |
| | 1 | | Includes options purchased at value which is included in Investments at value - unaffiliated in the Statements of Assets and Liabilities and reported in the Schedule of Investments. |
| | 2 | | Includes unrealized appreciation (depreciation) on OTC swaps and swap premiums paid/received in the Statements of Assets and Liabilities. |
The following tables present the Fund’s derivative assets and liabilities by counterparty net of amounts available for offset under an MNA and net of the related collateral received and pledged by the Fund.
| | | | | | | | | | | | | | | | | | | | | | | | | |
| Counterparty | | Derivative Assets Subject to an MNA by Counterparty | | Derivatives Available
for Offset3 | | Non-cash
Collateral
Received | | Cash
Collateral
Received | | Net Amount of Derivative Assets4 |
Bank of America N.A. | | | $ | 20,551 | | | | $ | (20,280 | ) | | | | — | | | | | — | | | | $ | 271 | |
The Bank of New York Mellon | | | | 23 | | | | | (23 | ) | | | | — | | | | | — | | | | | — | |
Barclays Bank PLC | | | | 3,977 | | | | | (3,977 | ) | | | | — | | | | | — | | | | | — | |
BNP Paribas S.A. | | | | 3,728 | | | | | (3,371 | ) | | | | — | | | | | — | | | | | 357 | |
Citibank N.A. | | | | 5,632 | | | | | (5,632 | ) | | | | — | | | | | — | | | | | — | |
Credit Suisse International | | | | 15,660 | | | | | (15,660 | ) | | | | — | | | | | — | | | | | — | |
Deutsche Bank AG | | | | 15,668 | | | | | (15,668 | ) | | | | — | | | | | — | | | | | — | |
Goldman Sachs International | | | | 2,839 | | | | | (2,839 | ) | | | | — | | | | | — | | | | | — | |
HSBC Bank PLC | | | | 2,287 | | | | | (2,287 | ) | | | | — | | | | | — | | | | | — | |
JPMorgan Chase Bank N.A. | | | | 9,362 | | | | | (9,362 | ) | | | | — | | | | | — | | | | | — | |
Morgan Stanley & Co. International PLC | | | | 1,847 | | | | | — | | | | | — | | | | | — | | | | | 1,847 | |
Morgan Stanley Capital Services LLC | | | | 1,434 | | | | | (201 | ) | | | | — | | | | | — | | | | | 1,233 | |
Royal Bank of Scotland PLC | | | | 3,371 | | | | | — | | | | | — | | | | | — | | | | | 3,371 | |
Société Générale | | | | 4,008 | | | | | — | | | | | — | | | | | — | | | | | 4,008 | |
Standard Chartered Bank | | | | 1,138 | | | | | — | | | | | — | | | | | — | | | | | 1,138 | |
UBS AG | | | | 122 | | | | | (122 | ) | | | | — | | | | | — | | | | | — | |
Total | | | $ | 91,647 | | | | $ | (79,422 | ) | | | | — | | | | | — | | | | $ | 12,225 | |
| | 3 | | The amount of derivatives available for offset is limited to the amount of assets and/or liabilities that are subject to an MNA. |
| | 4 | | Net amount represents the net amount receivable from the counterparty in the event of default. |
See Notes to Financial Statements.
| | | | | | |
| | | BLACKROCK SERIES FUND, INC. | | DECEMBER 31, 2015 | | 111 |
| | | | |
| Schedule of Investments (continued) | | | BlackRock Total Return Portfolio | |
| | | | | | | | | | | | | | | | | | | | | | | | | |
| Counterparty | | Derivative Liabilities
Subject to an MNA by
Counterparty | | Derivatives Available
for Offset1 | | Non-cash
Collateral
Pledged | | Cash
Collateral
Pledged | | Net Amount of
Derivative Liabilities2 |
Bank of America N.A. | | | $ | 20,280 | | | | $ | (20,280 | ) | | | | — | | | | | — | | | | | — | |
The Bank of New York Mellon | | | | 575 | | | | | (23 | ) | | | | — | | | | | — | | | | $ | 552 | |
Barclays Bank PLC | | | | 11,069 | | | | | (3,977 | ) | | | | — | | | | | — | | | | | 7,092 | |
BNP Paribas S.A. | | | | 3,371 | | | | | (3,371 | ) | | | | — | | | | | — | | | | | — | |
Citibank N.A. | | | | 17,232 | | | | | (5,632 | ) | | | | — | | | | | — | | | | | 11,600 | |
Credit Suisse International | | | | 24,239 | | | | | (15,660 | ) | | | | — | | | | | — | | | | | 8,579 | |
Deutsche Bank AG | | | | 29,907 | | | | | (15,668 | ) | | | | — | | | | | — | | | | | 14,239 | |
Goldman Sachs International | | | | 26,207 | | | | | (2,839 | ) | | | | — | | | | | — | | | | | 23,368 | |
HSBC Bank PLC | | | | 3,661 | | | | | (2,287 | ) | | | | — | | | | | — | | | | | 1,374 | |
JPMorgan Chase Bank N.A. | | | | 9,824 | | | | | (9,362 | ) | | | | — | | | | | — | | | | | 462 | |
Morgan Stanley Capital Services LLC | | | | 201 | | | | | (201 | ) | | | | — | | | | | — | | | | | — | |
State Street Bank and Trust Co. | | | | 785 | | | | | — | | | | | — | | | | | — | | | | | 785 | |
UBS AG | | | | 34,866 | | | | | (122 | ) | | | | — | | | | | — | | | | | 34,744 | |
Total | | | $ | 182,217 | | | | $ | (79,422 | ) | | | | — | | | | | — | | | | $ | 102,795 | |
| | 1 | | The amount of derivatives available for offset is limited to the amount of assets and/or liabilities that are subject to an MNA. |
| | 2 | | Net amount represents the net amount payable due to the counterparty in the event of default. |
|
| Fair Value Hierarchy as of Period End |
Various inputs are used in determining the fair value of investments and derivative financial instruments. For information about the Fund’s policy regarding valuation of investments and derivative financial instruments, refer to the Notes to Financial Statements.
The following tables summarize the Fund’s investments and derivative financial instruments categorized in the disclosure hierarchy:
| | | | | | | | | | | | | | | | |
| | | Level 1 | | | Level 2 | | | Level 3 | | | Total | |
Assets: | | | | | | | | | | | | | | | | |
Investments: | | | | | | | | | | | | | | | | |
Long-Term Investments: | | | | | | | | | | | | | | | | |
Asset-Backed Securities | | | — | | | $ | 4,548,382 | | | $ | 984,971 | | | $ | 5,533,353 | |
Corporate Bonds | | | — | | | | 17,399,962 | | | | — | | | | 17,399,962 | |
Foreign Agency Obligations | | | — | | | | 147,371 | | | | — | | | | 147,371 | |
Foreign Government Obligations | | | — | | | | 1,395,540 | | | | — | | | | 1,395,540 | |
Investment Companies | | $ | 746,735 | | | | — | | | | — | | | | 746,735 | |
Non-Agency Mortgage-Backed Securities | | | — | | | | 5,200,559 | | | | 498,310 | | | | 5,698,869 | |
Other Interests | | | — | | | | — | | | | 39 | | | | 39 | |
Preferred Securities | | | 281,213 | | | | 237,081 | | | | — | | | | 518,294 | |
Taxable Municipal Bonds | | | — | | | | 1,293,669 | | | | — | | | | 1,293,669 | |
U.S. Government Sponsored Agency Securities | | | — | | | | 26,718,332 | | | | — | | | | 26,718,332 | |
U.S. Treasury Obligations | | | — | | | | 14,619,514 | | | | — | | | | 14,619,514 | |
Short-Term Securities: | | | | | | | | | | | | | | | | |
Borrowed Bond Agreements | | | — | | | | 1,966,843 | | | | — | | | | 1,966,843 | |
Money Market Funds | | | 667,056 | | | | — | | | | — | | | | 667,056 | |
Options Purchased: | | | | | | | | | | | | | | | | |
Interest Rate Contracts | | | 4,400 | | | | 824 | | | | — | | | | 5,224 | |
Liabilities: | | | | | | | | | | | | | | | | |
Investments: | | | | | | | | | | | | | | | | |
Borrowed Bonds | | | — | | | | (1,954,704 | ) | | | — | | | | (1,954,704 | ) |
TBA Sale Commitments | | | — | | | | (10,163,120 | ) | | | — | | | | (10,163,120 | ) |
Total | | $ | 1,699,404 | | | $ | 61,410,253 | | | $ | 1,483,320 | | | $ | 64,592,977 | |
See Notes to Financial Statements.
| | | | | | |
| 112 | | BLACKROCK SERIES FUND, INC. | | DECEMBER 31, 2015 | | |
| | | | |
| Schedule of Investments (concluded) | | | BlackRock Total Return Portfolio | |
| | | | | | | | | | | | | | |
| | | Level 1 | | | Level 2 | | | Level 3 | | Total | |
Derivative Financial Instruments1 | | | | | | | | | | | | | | |
Assets: | | | | | | | | | | | | | | |
Credit contracts | | | — | | | $ | 25,724 | | | — | | $ | 25,724 | |
Foreign currency exchange contracts | | | — | | | | 12,655 | | | — | | | 12,655 | |
Interest rate contracts | | $ | 19,755 | | | | 29,708 | | | — | | | 49,463 | |
Liabilities: | | | | | | | | | | | | | | |
Credit contracts | | | — | | | | (48,180 | ) | | — | | | (48,180 | ) |
Foreign currency exchange contracts | | | — | | | | (17,606 | ) | | — | | | (17,606 | ) |
Interest rate contracts | | | (16,651 | ) | | | (80,319 | ) | | — | | | (96,970 | ) |
| | | | |
Total | | $ | 3,104 | | | $ | (78,018 | ) | | — | | $ | (74,914 | ) |
| | | | |
| | 1 | | Derivative financial instruments are swaps, financial future contracts, forward foreign currency exchange contracts and options written. Swaps, financial futures contracts and forward foreign currency exchange contracts are valued at the unrealized appreciation (depreciation) on the instrument. |
The Fund may hold assets and/or liabilities in which the fair value approximates the carrying amount or face value, including accrued interest, for financial statement purposes. As of period end, such assets and/or liabilities are categorized within the disclosure hierarchy as follows:
| | | | | | | | | | | | | | |
| | | Level 1 | | | Level 2 | | | Level 3 | | Total | |
Assets: | | | | | | | | | | | | | | |
Cash | | $ | 7,000 | | | | — | | | — | | $ | 7,000 | |
Cash pledged for centrally cleared swaps | | | 20,500 | | | | — | | | — | | | 20,500 | |
Foreign currency at value | | | 57,746 | | | | — | | | — | | | 57,746 | |
Liabilities: | | | | | | | | | | | | | | |
Reverse repurchase agreements | | | — | | | $ | (6,639,364 | ) | | — | | | (6,639,364 | ) |
| | | | |
Total | | $ | 85,246 | | | $ | (6,639,364 | ) | | — | | $ | (6,554,118 | ) |
| | | | |
During the year ended December 31, 2015, there were no transfers between Level 1 and Level 2.
A reconciliation of Level 3 investments is presented when the Fund had a significant amount of Level 3 investments at the beginning and/or end of the year in relation to net assets. The following table is a reconciliation of Level 3 investments for which significant unobservable inputs were used in determining fair value:
| | | | | | | | | | | | | | | | | | | | |
| | | Asset-
Backed
Securities | | | Floating
Rate Loan
Interests | | | Non-Agency
Mortgage-Backed
Securities | | | Other
Interests | | | Total | |
Assets: | | | | | | | | | | | | | | | | | | | | |
Opening Balance, as of December 31, 2014 | | $ | 1,265,336 | | | $ | 147,350 | | | $ | 902,586 | | | | — | | | $ | 2,315,272 | |
Transfers into Level 32 | | | 564,663 | | | | — | | | | — | | | | — | | | | 564,663 | |
Transfers out of Level 33 | | | (597,799 | ) | | | — | | | | (213,814 | ) | | | — | | | | (811,613 | ) |
Accrued discounts/premiums | | | (478 | ) | | | — | | | | 942 | | | | — | | | | 464 | |
Net realized gain (loss) | | | 6,639 | | | | — | | | | 7,304 | | | | — | | | | 13,943 | |
Net change in unrealized appreciation (depreciation)4,5 | | | (17,350 | ) | | | (733 | ) | | | (9,888 | ) | | | $39 | | | | (27,932 | ) |
Purchases | | | 295,512 | | | | — | | | | 237,829 | | | | — | | | | 533,341 | |
Sales | | | (531,552 | ) | | | (146,617 | ) | | | (426,649 | ) | | | — | | | | (1,104,818 | ) |
| | | | |
Closing Balance, as of December 31, 2015 | | $ | 984,971 | | | | — | | | $ | 498,310 | | | | $39 | | | $ | 1,483,320 | |
| | | | |
Net change in unrealized appreciation (depreciation) on investments still held at December 31, 20155 | | $ | (19,233 | ) | | | — | | | $ | (9,965 | ) | | | $39 | | | $ | (29,159 | ) |
| | | | |
| | 2 | | As of December 31, 2014, the Fund used observable inputs in determining the value of certain investments. As of December 31, 2015, the Fund used significant unobservable inputs in determining the value of the same investments. As a result, investments with a beginning of period value of $564,663 transferred from Level 2 to Level 3 in the disclosure hierarchy. |
| | 3 | | As of December 31, 2014, the Fund used significant unobservable inputs in determining the value of certain investments. As of December 31, 2015, the Fund used observable inputs in determining the value of the same investments. As a result, investments with a beginning of period value of $811,613 transferred from Level 3 to Level 2 in the disclosure hierarchy. |
| | 4 | | Included in the related net change in unrealized appreciation (depreciation) in the Statements of Operations. |
| | 5 | | Any difference between net change in unrealized appreciation (depreciation) and net change in unrealized appreciation (depreciation) on investments still held at December 31, 2015 is generally due to investments no longer held or categorized as level 3 at period end. |
The Fund’s investments that are categorized as Level 3 were valued utilizing third party pricing information without adjustment. Such valuations are based on unobservable inputs. A significant change in third party information could result in a significantly lower or higher value of such Level 3 investments.
See Notes to Financial Statements.
| | | | | | |
| | | BLACKROCK SERIES FUND, INC. | | DECEMBER 31, 2015 | | 113 |
| | | | |
| Schedule of Investments December 31, 2015 | | | BlackRock U.S. Government Bond Portfolio | |
| | | (Percentages shown are based on Net Assets) | |
| | | | | | | | | | | | |
| Asset-Backed Securities | | | | | Par
(000) | | | Value | |
Dryden XXVIII Senior Loan Fund, Series 2013-28A, Class A1L, 1.46%, 8/15/25 (a)(b) | | | USD | | | | 500 | | | $ | 489,272 | |
OCP CLO Ltd., Series 2012-2A, Class A2,
1.86%, 11/22/23 (a)(b) | | | | | | | 600 | | | | 599,150 | |
Progress Residential Trust, Series 2015-SFR1, Class A, 1.76%, 2/17/32 (a)(b) | | | | | | | 400 | | | | 394,727 | |
SMB Private Education Loan Trust, Series 2015-C, Class A3, 2.28%, 8/15/24 (a)(b) | | | | | | | 100 | | | | 98,167 | |
Tricon American Homes Trust, Series 2015-SFR1, Class A, 1.57%, 5/17/32 (a)(b) | | | | | | | 200 | | | | 195,887 | |
Washington Mill CLO Ltd., Series 2014-1A, Class A1, 1.82%, 4/20/26 (a)(b) | | | | | | | 400 | | | | 397,000 | |
Total Asset-Backed Securities — 3.3% | | | | | | | | | | | 2,174,203 | |
| | | | | | | | | | | | |
| Corporate Bonds | | | | | | | | | |
Banks — 3.4% | | | | | | | | | | | | |
Bank of Nova Scotia, 1.75%, 3/22/17 (a) | | | | | | | 470 | | | | 472,317 | |
Bank of Scotland PLC, 5.25%, 2/21/17 (a) | | | | | | | 150 | | | | 156,384 | |
Toronto-Dominion Bank, 1.50%, 3/13/17 (a) | | | | | | | 1,630 | | | | 1,632,624 | |
Total Corporate Bonds — 3.4% | | | | | | | | | | | 2,261,325 | |
| | | | | | | | | | | | |
| |
| Foreign Government Obligations — 0.3% | |
Mexico — 0.3% | | | | | | | | | | | | |
United Mexican States, 8.00%, 12/07/23 | | | MXN | | | | 3,200 | | | | 207,818 | |
| | | | | | | | | | | | |
| |
| Non-Agency Mortgage-Backed Securities | |
Commercial Mortgage-Backed Securities — 3.1% | | | | | | | | | | | | |
Banc of America Commercial Mortgage Trust,
Series 2007-1, Class A4, 5.45%, 1/15/49 | | | USD | | | | 352 | | | | 360,690 | |
BHMS Mortgage Trust, Series 2014-ATLS,
Class AFL, 1.77%, 7/05/33 (a)(b) | | | | | | | 600 | | | | 600,059 | |
Commercial Mortgage Pass-Through Certificates, Series 2015-CR25, Class A4, 3.76%, 8/10/48 | | | | | | | 300 | | | | 305,951 | |
GAHR Commercial Mortgage Trust,
Series 2015-NRF, Class AFL1,
1.63%, 12/15/16 (a)(b) | | | | | | | 800 | | | | 797,265 | |
| | | | | | | | | | | | |
| | | | | | | | | | | | 2,063,965 | |
Interest Only Commercial Mortgage-Backed Securities — 2.9% | |
Commercial Mortgage Pass-Through Certificates: | | | | | | | | | | | | |
Series 2013-CR7, Class XA,
1.50%, 3/10/46 (b) | | | | | | | 2,756 | | | | 187,062 | |
Series 2014-CR14, Class XA,
0.87%, 2/10/47 (b) | | | | | | | 1,097 | | | | 44,116 | |
Series 2015-CR22, Class XA,
1.03%, 3/10/48 (b) | | | | | | | 1,890 | | | | 116,862 | |
Series 2015-CR24, Class XA,
0.89%, 8/10/55 (b) | | | | | | | 1,196 | | | | 75,070 | |
Series 2015-CR25, Class XA,
0.98%, 8/10/48 (b) | | | | | | | 1,796 | | | | 120,831 | |
Series 2015-LC21, Class XA,
0.89%, 7/10/48 (b) | | | | | | | 5,976 | | | | 309,169 | |
| | | | | | | | | | | | |
| Non-Agency Mortgage-Backed Securities | | | | | Par
(000) | | | Value | |
Interest Only Commercial Mortgage-Backed Securities (continued) | |
Commercial Mortgage Trust: | | | | | | | | | | | | |
Series 2015-DC1, Class XA,
1.19%, 2/10/48 (b) | | | USD | | | | 2,908 | | | $ | 207,456 | |
Series 2015-LC19, Class XA,
1.23%, 2/10/48 (b) | | | | | | | 1,292 | | | | 104,897 | |
Core Industrial Trust: | | | | | | | | | | | | |
Series 2015-CALW, Class XA,
0.81%, 2/10/34 (a)(b) | | | | | | | 3,120 | | | | 136,094 | |
Series 2015-TEXW, Class XA,
0.77%, 2/10/34 (a)(b) | | | | | | | 2,600 | | | | 108,342 | |
Series 2015-WEST, Class XA,
0.93%, 2/10/37 (a)(b) | | | | | | | 1,300 | | | | 94,094 | |
CSAIL Commercial Mortgage Trust, Series 2015-C1, Class XA, 0.97%, 4/15/50 (b) | | | | | | | 2,091 | | | | 129,349 | |
FREMF Mortgage Trust, Series 2015-K718,
Class X2A, 0.10%, 2/25/22 (a)(b) | | | | | | | 18,836 | | | | 93,657 | |
Morgan Stanley Bank of America Merrill Lynch Trust, Series 2015-C25, Class XA, 1.16%, 10/15/48 (b) | | | | | | | 599 | | | | 47,473 | |
Wells Fargo Commercial Mortgage Trust,
Series 2015-C30, Class XA, 1.03%, 9/15/58 (b) | | | | | | | 997 | | | | 69,630 | |
WF-RBS Commercial Mortgage Trust,
Series 2014-LC14, Class XA, 1.43%, 3/15/47 (b) | | | | | | | 1,250 | | | | 89,784 | |
| | | | | | | | | | | | |
| | | | | | | | | | | | 1,933,886 | |
Total Non-Agency Mortgage-Backed Securities — 6.0% | | | | 3,997,851 | |
| | | | | | | | | | | | |
| U.S. Government Sponsored Agency Securities | | | | | | | |
Agency Obligations — 3.7% | | | | | | | | | | | | |
Fannie Mae, 5.50%, 3/01/20 | | | | | | | 49 | | | | 50,327 | |
Federal Home Loan Bank, 4.00%, 4/10/28 | | | | | | | 400 | | | | 437,935 | |
Freddie Mac, 6.25%, 7/15/32 | | | | | | | 1,400 | | | | 1,946,343 | |
| | | | | | | | | | | | |
| | | | | | | | | | | | 2,434,605 | |
Collateralized Mortgage Obligations — 0.4% | | | | | | | | | | | | |
Ginnie Mae, Series 2014-107, Class WX,
6.84%, 7/20/39 (b) | | | | | | | 223 | | | | 260,956 | |
Commercial Mortgage-Backed Securities — 1.0% | | | | | | | | | | | | |
Freddie Mac: | | | | | | | | | | | | |
Series K043, Class A2, 3.06%, 12/25/24 | | | | | | | 300 | | | | 301,661 | |
Series K049, Class A2, 3.01%, 7/25/25 | | | | | | | 400 | | | | 398,747 | |
| | | | | | | | | | | | |
| | | | | | | | | | | | 700,408 | |
Interest Only Commercial Mortgage-Backed Securities — 0.2% | |
Freddie Mac: | | | | | | | | | | | | |
Series K043, Class X1, 0.55%, 12/25/24 (b) | | | | | | | 2,595 | | | | 107,338 | |
Series K718, Class X1, 0.65%, 1/25/22 (b) | | | | | | | 334 | | | | 11,182 | |
Ginnie Mae: | | | | | | | | | | | | |
Series 2002-83, Class IO,
0.00%, 10/16/42 (b) | | | | | | | 498 | | | | — | |
Series 2003-109, Class IO,
0.00%, 3/16/43-11/16/43 (b) | | | | | | | 2,470 | | | | 14 | |
| | | | | | | | | | | | |
| | | | | | | | | | | | 118,534 | |
See Notes to Financial Statements.
| | | | | | |
| 114 | | BLACKROCK SERIES FUND, INC. | | DECEMBER 31, 2015 | | |
| | | | |
| Schedule of Investments (continued) | | | BlackRock U.S. Government Bond Portfolio | |
| | | | | | | | | | | | |
| U.S. Government Sponsored Agency Securities | | | | | Par
(000) | | | Value | |
Mortgage-Backed Securities — 97.3% | | | | | | | | | | | | |
Fannie Mae Mortgage-Backed Securities: | | | | | | | | | | | | |
2.50%, 4/01/30-1/01/31 (c) | | | USD | | | | 1,310 | | | $ | 1,320,870 | |
2.96%, 3/01/41 (b) | | | | | | | 38 | | | | 40,220 | |
3.00%, 11/01/26-1/01/46 (c) | | | | | | | 7,454 | | | | 7,563,809 | |
3.13%, 3/01/41 (b) | | | | | | | 56 | | | | 59,468 | |
3.15%, 12/01/40 (b) | | | | | | | 63 | | | | 65,448 | |
3.35%, 6/01/41 (b) | | | | | | | 88 | | | | 92,657 | |
3.50%, 7/01/26-1/01/46 (c) | | | | | | | 8,866 | | | | 9,194,966 | |
3.50%, 9/01/41 (b) | | | | | | | 63 | | | | 66,430 | |
4.00%, 2/01/25-1/01/46 (c) | | | | | | | 3,658 | | | | 3,884,828 | |
4.50%, 6/01/26-1/01/46 (c) | | | | | | | 4,901 | | | | 5,299,782 | |
5.00%, 1/01/31-1/01/46 (c) | | | | | | | 4,102 | | | | 4,436,009 | |
5.50%, 11/01/21-1/01/46 (c) | | | | | | | 988 | | | | 1,099,078 | |
6.00%, 4/01/35-1/01/46 (c) | | | | | | | 655 | | | | 742,630 | |
6.50%, 5/01/40 | | | | | | | 463 | | | | 528,837 | |
Freddie Mac Mortgage-Backed Securities: | | | | | | | | | | | | |
2.50%, 3/01/30-9/01/30 | | | | | | | 289 | | | | 291,972 | |
2.99%, 2/01/41 (b) | | | | | | | 74 | | | | 78,394 | |
3.00%, 5/01/27-1/01/46 (c) | | | | | | | 4,780 | | | | 4,786,607 | |
3.50%, 4/01/42-1/01/46 (c) | | | | | | | 6,286 | | | | 6,476,406 | |
4.00%, 8/01/40-1/01/46 (c) | | | | | | | 2,913 | | | | 3,078,798 | |
4.50%, 2/01/39-1/01/46 (c) | | | | | | | 1,538 | | | | 1,660,283 | |
5.00%, 8/01/40-1/01/46 (c) | | | | | | | 1,845 | | | | 2,015,901 | |
5.50%, 6/01/41-1/01/46 (c) | | | | | | | 341 | | | | 378,510 | |
8.00%, 3/01/30-6/01/31 | | | | | | | 18 | | | | 18,909 | |
Ginnie Mae Mortgage-Backed Securities: | | | | | | | | | | | | |
3.00%, 7/20/45-1/15/46 (c) | | | | | | | 2,307 | | | | 2,339,522 | |
3.50%, 5/15/43-1/15/46 (c) | | | | | | | 3,477 | | | | 3,628,362 | |
4.00%, 10/20/40-1/15/46 (c) | | | | | | | 2,212 | | | | 2,350,990 | |
4.50%, 12/20/39-2/15/42 (c) | | | | | | | 2,586 | | | | 2,809,383 | |
5.00%, 7/15/39-12/15/40 | | | | | | | 126 | | | | 139,075 | |
| | | | | | | | | | | | |
| | | | | | | | | | | | 64,448,144 | |
Total U.S. Government Sponsored Agency Securities — 102.6% | | | | 67,962,647 | |
| | | | | | | | | | | | |
| U.S. Treasury Obligations | | | | | | | | | |
U.S. Treasury Bonds: | | | | | | | | | | | | |
2.88%, 8/15/45 | | | | | | | 5,276 | | | | 5,124,498 | |
3.00%, 11/15/45 | | | | | | | 422 | | | | 420,731 | |
U.S. Treasury Inflation Indexed Notes: | | | | | | | | | | | | |
0.25%, 1/15/25 | | | | | | | 1,953 | | | | 1,863,854 | |
0.38%, 7/15/25 | | | | | | | 366 | | | | 354,371 | |
U.S. Treasury Notes: | | | | | | | | | | | | |
0.88%, 6/15/17 (d) | | | | | | | 4,350 | | | | 4,345,242 | |
0.63%, 8/31/17-11/30/17 | | | | | | | 9,070 | | | | 8,999,490 | |
0.75%, 10/31/17 | | | | | | | 1,850 | | | | 1,840,173 | |
1.25%, 10/30/18 (d) | | | | | | | 680 | | | | 678,858 | |
1.63%, 3/31/19-11/30/20 (d) | | | | | | | 3,935 | | | | 3,929,480 | |
1.50%, 10/31/19 (d) | | | | | | | 1,105 | | | | 1,101,547 | |
1.38%, 10/31/20 (d) | | | | | | | 2,085 | | | | 2,048,187 | |
1.88%, 10/31/22 | | | | | | | 2,400 | | | | 2,369,626 | |
2.50%, 8/15/23 (d) | | | | | | | 1,255 | | | | 1,287,601 | |
2.38%, 8/15/24 (d) | | | | | | | 1,218 | | | | 1,231,108 | |
2.00%, 8/15/25 | | | | | | | 1,590 | | | | 1,550,312 | |
2.25%, 11/15/25 (d) | | | | | | | 1,255 | | | | 1,252,205 | |
Total U.S. Treasury Obligations — 58.0% | | | | | | | | | | | 38,397,283 | |
Total Long-Term Investments (Cost — $115,351,764) — 173.6% | | | | | | | | | | | 115,001,127 | |
| | | | | | | | | | | | |
| | | | | | | | | | |
| | | | | | | | | | | | |
| Short-Term Securities | | | | | Par
(000) | | | Value | |
Borrowed Bond Agreements — 1.0% (e) | | | | | | | | | | | | |
Deutsche Bank Securities, Inc., 0.46%, Open (f)
(Purchased on 9/08/15 to be repurchased at $609,265, collateralized by U.S. Treasury Notes, 0.63% due at 8/31/17, par and fair value of USD 610,000 and $609,547, respectively) | | | USD | | | | 609 | | | $ | 609,238 | |
Deutsche Bank Securities, Inc., 0.52%, Open (f)
(Purchased on 9/16/15 to be repurchased at $49,875, collateralized by U.S. Treasury Notes, 1.00% due at 8/15/18, par and fair value of USD 50,000 and $49,676, respectively) | | | | | | | 50 | | | | 49,875 | |
Total Short-Term Securities (Cost — $659,113) — 1.0% | | | | | | | | | | | 659,113 | |
| | | | | | | | | | | | |
| Options Purchased | | | | | | | | | |
(Cost — $14,705) — 0.0% | | | | | | | | | | | 14,121 | |
Total Investments Before Options Written, Borrowed Bonds and TBA Sale Commitments (Cost — $116,025,582) — 174.6% | | | | 115,674,361 | |
| | | | | | | | | | | | |
| Options Written | | | | | | | | | |
(Premiums Received — $ 106,970) — (0.1)% | | | | | | | | | | | (76,044 | ) |
| | | | | | | | | | | | |
| Borrowed Bonds | | | | | | | | | |
U.S. Treasury Obligations — (1.0)% | | | | | | | | | | | | |
U.S. Treasury Notes: | | | | | | | | | | | | |
0.63%, 8/31/17 | | | | | | | 610 | | | | (609,547 | ) |
1.00%, 8/15/18 | | | | | | | 50 | | | | (49,676 | ) |
(Proceeds — $658,818) — (1.0)% | | | | | | | | | | | (659,223 | ) |
| | | |
TBA Sale Commitments (c) | | | | | | | | | | | | |
Fannie Mae Mortgage-Backed Securities: | | | | | | | | | | | | |
3.00%, 1/01/31-1/01/46 | | | | | | | 8,605 | | | | (8,661,275 | ) |
3.50%, 1/01/31-1/01/46 | | | | | | | 6,949 | | | | (7,192,883 | ) |
4.00%, 1/01/46 | | | | | | | 2,184 | | | | (2,311,048 | ) |
4.50%, 1/01/46 | | | | | | | 1,670 | | | | (1,803,391 | ) |
5.50%, 1/01/46 | | | | | | | 800 | | | | (891,438 | ) |
Freddie Mac Mortgage-Backed Securities: | | | | | | | | | | | | |
2.50%, 1/01/31 | | | | | | | 197 | | | | (198,748 | ) |
3.00%, 1/01/31 | | | | | | | 292 | | | | (300,898 | ) |
3.50%, 1/01/46 | | | | | | | 8,226 | | | | (8,459,844 | ) |
4.00%, 1/01/46 | | | | | | | 533 | | | | (563,054 | ) |
5.00%, 1/01/46 | | | | | | | 800 | | | | (873,841 | ) |
Ginnie Mae Mortgage-Backed Securities: | | | | | | | | | | | | |
3.00%, 1/15/46 | | | | | | | 800 | | | | (810,844 | ) |
3.50%, 1/15/46 | | | | | | | 1,033 | | | | (1,076,653 | ) |
4.00%, 1/15/46 | | | | | | | 800 | | | | (849,562 | ) |
4.50%, 1/15/46 | | | | | | | 523 | | | | (561,898 | ) |
Total TBA Sale Commitments (Proceeds — $34,560,038) — (52.2)% | | | | | | | | | | | (34,555,377 | ) |
Total Investments Net of Options Written, Borrowed Bonds and TBA Sale Commitments — 121.3% | | | | 80,383,717 | |
Liabilities in Excess of Other Assets — (21.3)% | | | | | | | | | | | (14,120,745 | ) |
| | | | | | | | | | | | |
Net Assets — 100.0% | | | | | | | | | | $ | 66,262,972 | |
| | | | | | | | | | | | |
See Notes to Financial Statements.
| | | | | | |
| | | BLACKROCK SERIES FUND, INC. | | DECEMBER 31, 2015 | | 115 |
| | | | |
| Schedule of Investments (continued) | | | BlackRock U.S. Government Bond Portfolio | |
|
| Notes to Schedule of Investments |
| (a) | Security exempt from registration pursuant to Rule 144A under the Securities Act of 1933, as amended. These securities may be resold in transactions exempt from registration to qualified institutional investors. |
| (b) | Variable rate security. Rate as of period end. |
| (c) | Represents or includes a TBA transaction. As of period end, unsettled TBA transactions were as follows: |
| | | | | | | | |
| Counterparty | | Value | | | Unrealized
Appreciation
(Depreciation) | |
Barclays Capital, Inc. | | $ | (1,818,060 | ) | | $ | 2,385 | |
BNP Paribas Securities Corp. | | $ | 171,344 | | | $ | (144 | ) |
Citigroup Global Markets, Inc. | | $ | (1,799,353 | ) | | $ | 2,179 | |
Credit Suisse Securities (USA) LLC | | $ | 1,764,033 | | | $ | 1,639 | |
Deutsche Bank Securities, Inc. | | $ | 845,492 | | | $ | 1,407 | |
Goldman Sachs & Co. | | $ | 2,318,479 | | | $ | 5,141 | |
J.P. Morgan Securities LLC | | $ | (3,069,479 | ) | | $ | 7,360 | |
Merrill Lynch, Pierce, Fenner & Smith, Inc. | | $ | (1,837,299 | ) | | $ | 4,260 | |
Morgan Stanley & Co. LLC | | $ | 2,820,116 | | | $ | 227 | |
Nomura Securities International, Inc. | | $ | (497,295 | ) | | $ | 3,517 | |
RBC Capital Markets, LLC | | $ | (65,953 | ) | | $ | (190 | ) |
Wells Fargo Securities, LLC | | $ | 485,159 | | | $ | 949 | |
| (d) | All or a portion of security has been pledged as collateral in connection with outstanding reverse repurchase agreements. |
| (e) | Certain agreements have no stated maturity and can be terminated by either party at any time. |
| (f) | The amount to be repurchased assumes the maturity will be the day after the period end. |
| • | | During the year ended December 31, 2015, investments in issuers considered to be an affiliate of the Fund for purposes of Section 2(a)(3) of the Investment Company Act of 1940, as amended, were as follows: |
| | | | | | | | | | | | | | | | | | | | |
| Affiliate | | Shares Held at
December 31, 2014 | | | Net Activity | | | Shares Held at
December 31, 2015 | | | Income | | | Realized
Gain | |
BlackRock Liquidity Funds, TempFund, Institutional Class | | | 1,005,262 | | | | (1,005,262 | ) | | | — | | | | $3,473 | | | | $3 | |
| • | | For Fund compliance purposes, the Fund’s industry classifications refer to any one or more of the industry sub-classifications used by one or more widely recognized market indexes or ratings group indexes, and/or as defined by the investment advisor. These definitions may not apply for purposes of this report, which may combine such industry sub-classifications for reporting ease. |
| | | | | | | | | | | | | | | | | | | | | | | | |
| Reverse repurchase agreements | |
| Counterparty | | Interest
Rate | | Trade
Date | | Maturity
Date1 | | | Face Value | | | Face Value
Including
Accrued
Interest | | | Type of Underlying
Collateral | | | Remaining
Contractual
Maturity of the
Agreements | |
BNP Paribas Securities Corp. | | 0.20% | | 6/10/15 | | | Open | | | $ | 1,220,000 | | | $ | 1,221,383 | | | | U.S. Treasury Obligations | | | | Open/Demand | 1 |
BNP Paribas Securities Corp. | | 0.09% | | 6/10/15 | | | Open | | | | 4,377,000 | | | | 4,379,232 | | | | U.S. Treasury Obligations | | | | Open/Demand | 1 |
Credit Suisse Securities (USA) LLC | | 0.13% | | 11/19/15 | | | Open | | | | 1,298,925 | | | | 1,299,122 | | | | U.S. Treasury Obligations | | | | Open/Demand | 1 |
Credit Suisse Securities (USA) LLC | | 0.13% | | 11/19/15 | | | Open | | | | 1,106,381 | | | | 1,106,549 | | | | U.S. Treasury Obligations | | | | Open/Demand | 1 |
Credit Suisse Securities (USA) LLC | | 0.13% | | 11/19/15 | | | Open | | | | 1,521,931 | | | | 1,522,162 | | | | U.S. Treasury Obligations | | | | Open/Demand | 1 |
Credit Suisse Securities (USA) LLC | | 0.13% | | 11/19/15 | | | Open | | | | 684,250 | | | | 684,354 | | | | U.S. Treasury Obligations | | | | Open/Demand | 1 |
Merrill Lynch, Pierce, Fenner & Smith, Inc. | | 0.10% | | 12/01/15 | | | 1/05/16 | | | | 990,000 | | | | 990,094 | | | | U.S. Treasury Obligations | | | | Up to 30 Days | |
Merrill Lynch, Pierce, Fenner & Smith, Inc. | | 0.20% | | 12/29/15 | | | 1/04/16 | | | | 1,251,862 | | | | 1,251,897 | | | | U.S. Treasury Obligations | | | | Up to 30 Days | |
Merrill Lynch, Pierce, Fenner & Smith, Inc. | | 0.50% | | 12/29/15 | | | 1/04/16 | | | | 2,414,316 | | | | 2,414,483 | | | | U.S. Treasury Obligations | | | | Up to 30 Days | |
Merrill Lynch, Pierce, Fenner & Smith, Inc. | | 0.40% | | 12/29/15 | | | 1/04/16 | | | | 982,500 | | | | 982,555 | | | | U.S. Treasury Obligations | | | | Up to 30 Days | |
Total | | | | | | | | | | $ | 15,847,166 | | | $ | 15,851,831 | | | | | | | | | |
| | | | | | | | | | | | | | | | |
| | 1 | | Certain agreements have no stated maturity and can be terminated by either party at any time. |
See Notes to Financial Statements.
| | | | | | |
| 116 | | BLACKROCK SERIES FUND, INC. | | DECEMBER 31, 2015 | | |
| | | | |
| Schedule of Investments (continued) | | | BlackRock U.S. Government Bond Portfolio | |
|
| Derivative Financial Instruments Outstanding as of Period End |
| | | | | | | | | | |
| Financial Futures Contracts |
| | | | | | | | | | | | |
Contracts Long (Short) | | Issue | | Expiration | | Notional Value | | | Unrealized
Appreciation
(Depreciation) | |
| 17 | | Euro Dollar Futures | | March 2016 | | USD | 4,218,763 | | | | $ 5,252 | |
| 2 | | U.S. Treasury Bonds (30 Year) | | March 2016 | | USD | 307,500 | | | | 868 | |
| 21 | | U.S. Treasury Notes (10 Year) | | March 2016 | | USD | 2,644,031 | | | | (4,186) | |
| (39) | | U.S. Treasury Notes (2 Year) | | March 2016 | | USD | 8,472,141 | | | | 16,552 | |
| (1) | | U.S. Treasury Notes (5 Year) | | March 2016 | | USD | 118,320 | | | | 569 | |
| (1) | | U.S. Ultra Treasury Bonds | | March 2016 | | USD | 158,688 | | | | (2,045) | |
| (4) | | Euro Dollar Futures | | June 2016 | | USD | 991,000 | | | | (849) | |
| 44 | | Euro Dollar Futures | | December 2016 | | USD | 10,864,700 | | | | (15,360) | |
| (64) | | Euro Dollar Futures | | December 2017 | | USD | 15,716,000 | | | | 23,213 | |
| Total | | | | | | | | | | | $ 24,014 | |
| | | | | | | |
Forward Foreign Currency Exchange Contracts
| | | | | | | | | | | | | | | | | | | | | | |
Currency Purchased | | | Currency
Sold | | | Counterparty | | Settlement
Date | | | Unrealized
Appreciation
(Depreciation) | |
| CLP | | | 4,968,810 | | | | USD | | | | 7,000 | | | Credit Suisse International | | | 1/04/16 | | | | $ 9 | |
| USD | | | 7,000 | | | | CLP | | | | 4,940,950 | | | BNP Paribas S.A. | | | 1/04/16 | | | | 30 | |
| USD | | | 10,200 | | | | ZAR | | | | 148,629 | | | BNP Paribas S.A. | | | 1/04/16 | | | | 597 | |
| USD | | | 6,800 | | | | ZAR | | | | 98,012 | | | State Street Bank and Trust Co. | | | 1/04/16 | | | | 467 | |
| ZAR | | | 245,560 | | | | USD | | | | 17,000 | | | Deutsche Bank AG | | | 1/04/16 | | | | (1,134 | ) |
| BRL | | | 11,811 | | | | USD | | | | 3,000 | | | Goldman Sachs International | | | 1/05/16 | | | | (20 | ) |
| BRL | | | 20,115 | | | | USD | | | | 5,000 | | | Royal Bank of Scotland PLC | | | 1/05/16 | | | | 75 | |
| MXN | | | 158,754 | | | | USD | | | | 9,574 | | | Goldman Sachs International | | | 1/05/16 | | | | (366 | ) |
| USD | | | 5,000 | | | | BRL | | | | 19,910 | | | BNP Paribas S.A. | | | 1/05/16 | | | | (23 | ) |
| USD | | | 3,000 | | | | BRL | | | | 11,906 | | | BNP Paribas S.A. | | | 1/05/16 | | | | (4 | ) |
| USD | | | 9,574 | | | | MXN | | | | 164,135 | | | Goldman Sachs International | | | 1/05/16 | | | | 54 | |
| USD | | | 212,920 | | | | MXN | | | | 3,537,000 | | | Société Générale | | | 1/06/16 | | | | 7,784 | |
| MXN | | | 138,158 | | | | USD | | | | 8,000 | | | Goldman Sachs International | | | 1/08/16 | | | | 12 | |
| TWD | | | 392,160 | | | | USD | | | | 12,000 | | | HSBC Bank PLC | | | 1/11/16 | | | | (60 | ) |
| USD | | | 12,000 | | | | TWD | | | | 396,720 | | | JPMorgan Chase Bank N.A. | | | 1/11/16 | | | | (78 | ) |
| EUR | | | 7,219 | | | | RUB | | | | 578,330 | | | BNP Paribas S.A. | | | 1/12/16 | | | | (48 | ) |
| EUR | | | 3,281 | | | | RUB | | | | 256,397 | | | Deutsche Bank AG | | | 1/12/16 | | | | 67 | |
| EUR | | | 5,250 | | | | RUB | | | | 408,489 | | | Deutsche Bank AG | | | 1/12/16 | | | | 130 | |
| EUR | | | 7,000 | | | | RUB | | | | 538,650 | | | JPMorgan Chase Bank N.A. | | | 1/12/16 | | | | 256 | |
| JPY | | | 1,218,120 | | | | USD | | | | 10,000 | | | UBS AG | | | 1/12/16 | | | | 137 | |
| RUB | | | 636,102 | | | | EUR | | | | 9,000 | | | BNP Paribas S.A. | | | 1/12/16 | | | | (1,100 | ) |
| RUB | | | 380,200 | | | | EUR | | | | 5,000 | | | BNP Paribas S.A. | | | 1/12/16 | | | | (245 | ) |
| RUB | | | 676,218 | | | | EUR | | | | 8,750 | | | Deutsche Bank AG | | | 1/12/16 | | | | (280 | ) |
| USD | | | 10,000 | | | | JPY | | | | 1,206,631 | | | Standard Chartered Bank | | | 1/12/16 | | | | (42 | ) |
| TRY | | | 75,954 | | | | USD | | | | 26,000 | | | Morgan Stanley & Co. International PLC | | | 1/14/16 | | | | (65 | ) |
| COP | | | 23,426,690 | | | | USD | | | | 7,000 | | | Credit Suisse International | | | 1/15/16 | | | | 368 | |
| TRY | | | 20,891 | | | | USD | | | | 7,000 | | | Deutsche Bank AG | | | 1/15/16 | | | | 131 | |
| USD | | | 7,000 | | | | COP | | | | 23,114,000 | | | Credit Suisse International | | | 1/15/16 | | | | (270 | ) |
| USD | | | 7,000 | | | | TRY | | | | 21,160 | | | Goldman Sachs International | | | 1/15/16 | | | | (223 | ) |
| USD | | | 9,500 | | | | ZAR | | | | 149,981 | | | JPMorgan Chase Bank N.A. | | | 1/15/16 | | | | (171 | ) |
| EUR | | | 7,000 | | | | RUB | | | | 543,130 | | | Deutsche Bank AG | | | 1/18/16 | | | | 208 | |
See Notes to Financial Statements.
| | | | | | |
| | | BLACKROCK SERIES FUND, INC. | | DECEMBER 31, 2015 | | 117 |
| | | | |
| Schedule of Investments (continued) | | | BlackRock U.S. Government Bond Portfolio | |
| | | | | | | | | | | | | | | | | | | | | | |
Currency Purchased | | | Currency Sold | | | Counterparty | | Settlement
Date | | Unrealized Appreciation
(Depreciation) | |
| RUB | | | 548,520 | | | | EUR | | | | 7,000 | | | Deutsche Bank AG | | 1/18/16 | | | | | $ (135 | ) |
| MXN | | | 84,972 | | | | USD | | | | 5,000 | | | Deutsche Bank AG | | 1/19/16 | | | | | (77 | ) |
| MXN | | | 198,785 | | | | USD | | | | 11,667 | | | Goldman Sachs International | | 1/19/16 | | | | | (149 | ) |
| MXN | | | 141,887 | | | | USD | | | | 8,333 | | | Goldman Sachs International | | 1/19/16 | | | | | (112 | ) |
| MXN | | | 86,817 | | | | USD | | | | 5,000 | | | Goldman Sachs International | | 1/19/16 | | | | | 30 | |
| MXN | | | 86,875 | | | | USD | | | | 5,000 | | | Goldman Sachs International | | 1/19/16 | | | | | 34 | |
| USD | | | 5,000 | | | | COP | | | | 16,617,000 | | | Credit Suisse International | | 1/19/16 | | | | | (224 | ) |
| USD | | | 10,000 | | | | MXN | | | | 174,025 | | | Goldman Sachs International | | 1/19/16 | | | | | (83 | ) |
| CLP | | | 3,488,800 | | | | USD | | | | 5,000 | | | Credit Suisse International | | 1/21/16 | | | | | (89 | ) |
| CLP | | | 3,506,150 | | | | USD | | | | 5,000 | | | Credit Suisse International | | 1/21/16 | | | | | (64 | ) |
| USD | | | 10,000 | | | | CLP | | | | 7,149,500 | | | Credit Suisse International | | 1/21/16 | | | | | (64 | ) |
| RUB | | | 580,676 | | | | EUR | | | | 7,219 | | | BNP Paribas S.A. | | 1/26/16 | | | | | 46 | |
| BRL | | | 20,010 | | | | USD | | | | 5,000 | | | Goldman Sachs International | | 2/02/16 | | | | | (1 | ) |
| USD | | | 5,000 | | | | BRL | | | | 20,322 | | | Royal Bank of Scotland PLC | | 2/02/16 | | | | | (77 | ) |
| JPY | | | 41,196,219 | | | | USD | | | | 340,000 | | | Morgan Stanley & Co. International PLC | | 3/16/16 | | | | | 3,405 | |
| JPY | | | 41,131,568 | | | | USD | | | | 340,000 | | | Royal Bank of Scotland PLC | | 3/16/16 | | | | | 2,866 | |
| USD | | | 336,965 | | | | EUR | | | | 310,000 | | | Deutsche Bank AG | | 3/16/16 | | | | | (593 | ) |
| USD | | | 680,000 | | | | JPY | | | | 82,242,396 | | | Morgan Stanley & Co. International PLC | | 3/16/16 | | | | | (5,558 | ) |
| USD | | | 225,000 | | | | SAR | | | | 858,150 | | | BNP Paribas S.A. | | 11/23/16 | | | | | (1,137 | ) |
| USD | | | 228,333 | | | | SAR | | | | 870,407 | | | Citibank N.A. | | 11/23/16 | | | | | (1,033 | ) |
| USD | | | 169,000 | | | | SAR | | | | 642,285 | | | Citibank N.A. | | 11/23/16 | | | | | (253 | ) |
| Total | | | | | | | | | | | | | | | | | $ 2,928 | |
Exchange-Traded Options Purchased
| | | | | | | | | | | | |
| Description | | Put/
Call | | Expiration
Date | | Strike Price | | Contracts | | Value |
| Euro Dollar 90-Day | | Put | | 3/11/16 | | USD | | 98.38 | | 69 | | $ 4,744 |
| | | | | | | | | | | | | |
OTC Options Purchased
| | | | | | | | | | | | | | | | | | | | | | | | | | |
| Description | | Put/
Call | | Counterparty | | Expiration
Date | | Strike Price | | | Notional
Amount
(000) | | | Value | |
USD Currency | | Call | | BNP Paribas S.A. | | 8/16/16 | | | SAR | | | | 3.78 | | | | USD | | | | 350 | | | | $4,118 | |
USD Currency | | Call | | Citibank N.A. | | 8/16/16 | | | SAR | | | | 3.78 | | | | USD | | | | 350 | | | | 4,118 | |
USD Currency | | Put | | Citibank N.A. | | 2/09/16 | | | JPY | | | | 121.50 | | | | USD | | | | 16 | | | | 256 | |
| Total | | | | | | | | | | | | | | | | | | | | $8,492 | |
OTC Interest Rate Swaptions Purchased
| | | | | | | | | | | | | | | | | | | | | | | | |
| Description | | Counterparty | | Put/
Call | | Exercise Rate | | Pay/Receive
Exercise Rate | | Floating Rate
Index | | Expiration
Date | | Notional
Amount (000) | | | Value | |
10-Year Interest Rate Swap | | JPMorgan Chase Bank N.A. | | Call | | 2.00% | | Receive | | 3-month LIBOR | | 1/19/16 | | | USD | | | | 1,449 | | | | $885 | |
OTC Interest Rate Swaptions Written
| | | | | | | | | | | | | | | | | | | | | | | | |
| Description | | Counterparty | | Put/
Call | | Exercise Rate | | Pay/Receive
Exercise Rate | | Floating Rate
Index | | Expiration
Date | | Notional
Amount
(000) | | | Value | |
10-Year Interest Rate Swap | | Deutsche Bank AG | | Call | | 1.55% | | Pay | | 3-month LIBOR | | 1/21/16 | | | USD | | | | 1,800 | | | | $ (1 | ) |
10-Year Interest Rate Swap | | Deutsche Bank AG | | Call | | 3.45% | | Pay | | 3-month LIBOR | | 5/09/16 | | | USD | | | | 700 | | | | (75,692 | ) |
10-Year Interest Rate Swap | | Deutsche Bank AG | | Put | | 2.55% | | Receive | | 3-month LIBOR | | 1/21/16 | | | USD | | | | 1,800 | | | | (163 | ) |
See Notes to Financial Statements.
| | | | | | |
| 118 | | BLACKROCK SERIES FUND, INC. | | DATE DECEMBER 31, 2015 | | |
| | | | |
| Schedule of Investments (continued) | | | BlackRock U.S. Government Bond Portfolio | |
| | | | | | | | | | | | | | | | | | | | | | | | |
| Description | | Counterparty | | Put/ Call | | Exercise Rate | | Pay/Receive Exercise Rate | | Floating Rate Index | | Expiration Date | | Notional
Amount (000) | | | Value | |
10-Year Interest Rate Swap | | Deutsche Bank AG | | Put | | 3.45% | | Receive | | 3-month LIBOR | | 5/09/16 | | | USD | | | | 700 | | | $ | (188 | ) |
Total | | | | | | | | | | | | | | | | | | | | | | $ | (76,044 | ) |
| | | | | | | | | | | | | | | | | | | | | | | | |
Centrally Cleared Interest Rate Swaps
| | | | | | | | | | | | | | | | | | |
| Fixed Rate | | Floating Rate | | Effective
Date | | Expiration
Date | | | | | Notional Amount (000) | | | Unrealized
Appreciation
(Depreciation) | |
1.26%1 | | 3-month LIBOR | | 1/12/162 | | 1/12/17 | | | USD | | | | 3,847 | | | | $ (14,171 | ) |
1.36%1 | | 3-month LIBOR | | 1/06/162 | | 2/29/20 | | | USD | | | | 430 | | | | 4,293 | |
1.37%1 | | 3-month LIBOR | | 1/06/162 | | 2/29/20 | | | USD | | | | 390 | | | | 3,665 | |
1.32%1 | | 3-month LIBOR | | 1/06/162 | | 2/29/20 | | | USD | | | | 260 | | | | 3,008 | |
1.32%1 | | 3-month LIBOR | | 1/06/162 | | 2/29/20 | | | USD | | | | 210 | | | | 2,452 | |
1.32%1 | | 3-month LIBOR | | 1/06/162 | | 2/29/20 | | | USD | | | | 170 | | | | 1,983 | |
1.35%1 | | 3-month LIBOR | | 1/06/162 | | 2/29/20 | | | USD | | | | 130 | | | | 1,349 | |
3.26%1 | | 3-month LIBOR | | N/A | | 11/18/24 | | | USD | | | | 1,700 | | | | (113,395 | ) |
2.31%1 | | 3-month LIBOR | | N/A | | 3/11/25 | | | USD | | | | 100 | | | | (2,247 | ) |
2.50%1 | | 3-month LIBOR | | N/A | | 5/27/25 | | | USD | | | | 700 | | | | (29,398 | ) |
2.13%3 | | 3-month LIBOR | | N/A | | 8/25/25 | | | USD | | | | 10 | | | | 42 | |
2.18%1 | | 3-month LIBOR | | N/A | | 12/14/25 | | | USD | | | | 1,080 | | | | (313 | ) |
2.38%1 | | 3-month LIBOR | | N/A | | 4/24/45 | | | USD | | | | 110 | | | | 5,144 | |
2.39%1 | | 3-month LIBOR | | N/A | | 4/24/45 | | | USD | | | | 105 | | | | 4,668 | |
2.83%3 | | 3-month LIBOR | | N/A | | 7/10/45 | | | USD | | | | 215 | | | | 12,736 | |
Total | | | | | | | | | | | | | | | | | $(120,184 | ) |
| | | | | | | | | | | | | | | | | | |
| | 1 | | Fund pays the fixed rate and receives the floating rate. |
| | 3 | | Fund pays the floating rate and receives the fixed rate. |
OTC Interest Rate Swaps
| | | | | | | | | | | | | | | | | | | | | | | | | | |
Fixed
Rate | | Floating Rate | | Counterparty | | Expiration
Date | | Notional
Amount (000) | | | Value | | | Premiums
Paid
(Received) | | | Unrealized
Appreciation | |
2.50%1 | | 3-month LIBOR | | Deutsche Bank AG | | 9/30/20 | | | USD | | | | 300 | | | | $13,156 | | | | — | | | | $13,156 | |
2.57%1 | | 3-month LIBOR | | Deutsche Bank AG | | 10/19/20 | | | USD | | | | 300 | | | | 13,642 | | | | — | | | | 13,642 | |
6.32%1 | | 28-day MXIBTIIE | | Goldman Sachs International | | 8/06/25 | | | MXN | | | | 511 | | | | (5 | ) | | | $(3 | ) | | | (2 | ) |
6.31%2 | | 28-day MXIBTIIE | | Bank of America N.A. | | 8/11/25 | | | MXN | | | | 172 | | | | 15 | | | | 1 | | | | 14 | |
6.31%2 | | 28-day MXIBTIIE | | Bank of America N.A. | | 8/11/25 | | | MXN | | | | 172 | | | | 15 | | | | 1 | | | | 14 | |
6.31%2 | | 28-day MXIBTIIE | | Deutsche Bank AG | | 8/11/25 | | | MXN | | | | 640 | | | | 63 | | | | 3 | | | | 60 | |
Total | | | | | | | | | | | | | | | | | $26,886 | | | | $ 2 | | | | $26,884 | |
| | | | | | | | | | | | | | | | | | |
| | 1 | | Fund pays the floating rate and receives the fixed rate. |
| | 2 | | Fund pays the fixed rate and receives the floating rate. |
| | | | | | | | | | | | | | | | |
| Transactions in Options Written for the Year Ended December 31, 2015 |
| | | | | | | | | | | | | | | | | | | | | | | | | | | | | | | | |
| | | Calls | | | | | Puts | |
| | | | | Notional (000) | | | | | | | | | | | Notional (000) | | | | |
| | | Contracts | | EUR | | | USD | | | Premiums
Received | | | | | Contracts | | | EUR | | | USD | | | Premiums
Received | |
| | | | | | | | | |
Outstanding options, beginning of year | | — | | | | | | | 7,811 | | | | $ 210,700 | | | | | | — | | | | — | | | | 8,958 | | | | $ 241,584 | |
Options written | | — | | | 1,675 | | | | 3,405 | | | | 75,439 | | | | | | 233 | | | | 1,675 | | | | 6,523 | | | | 153,415 | |
Options expired | | — | | | | | | | — | | | | — | | | | | | — | | | | — | | | | (723 | ) | | | (9,071 | ) |
Options closed | | — | | | (1,675 | ) | | | (8,716 | ) | | | (242,059 | ) | | | | | (233 | ) | | | (1,675 | ) | | | (12,258 | ) | | | (323,038 | ) |
| | | | | | | | | |
Outstanding options, end of year | | — | | | | | | | 2,500 | | | | $ 44,080 | | | | | | — | | | | — | | | | 2,500 | | | | $ 62,890 | |
| | | | | | | | | |
See Notes to Financial Statements.
| | | | | | |
| | | BLACKROCK SERIES FUND, INC. | | DECEMBER 31, 2015 | | 119 |
| | | | |
| Schedule of Investments (continued) | | | BlackRock U.S. Government Bond Portfolio | |
|
| Derivative Financial Instruments Categorized by Risk Exposure |
As of period end, the fair values of derivative financial instruments located in the Statements of Assets and Liabilities were as follows:
| | | | | | | | | | | | | | | | | | | | | | |
| Assets — Derivative Financial Instruments | | Commodity
Contracts | | Credit
Contracts | | Equity
Contracts | | Foreign
Currency
Exchange
Contracts | | | Interest
Rate
Contracts | | | Other
Contracts | | Total | |
Financial futures contracts | | Net unrealized appreciation1 | | — | | — | | — | | | — | | | | $ 46,454 | | | — | | | $ 46,454 | |
Forward foreign currency exchange contracts | | Unrealized appreciation on forward foreign currency exchange contracts | | — | | — | | — | | | $16,706 | | | | — | | | — | | | 16,706 | |
Options purchased | | Investments at value — unaffiliated2 | | — | | — | | — | | | 8,492 | | | | 5,629 | | | — | | | 14,121 | |
Swaps — centrally cleared | | Net unrealized appreciation1 | | — | | — | | — | | | — | | | | 39,340 | | | — | | | 39,340 | |
Swaps — OTC | | Unrealized appreciation on OTC swaps Swap premiums paid | | — | | — | | — | | | — | | | | 26,891 | | | — | | | 26,891 | |
| | | |
Total | | | | — | | — | | — | | | $25,198 | | | | $118,314 | | | — | | | $143,512 | |
| | | |
| | | | | | | | | | | | | | |
| Liabilities — Derivative Financial Instruments | |
Financial futures contracts | | Net unrealized depreciation1 | | — | | — | | — | | | — | | | | $ 22,440 | | | — | | | $ 22,440 | |
Forward foreign currency exchange contracts | | Unrealized depreciation on forward foreign currency exchange contracts | | — | | — | | — | | | $13,778 | | | | — | | | — | | | 13,778 | |
Options written | | Options written, at value | | — | | — | | — | | | — | | | | 76,044 | | | — | | | 76,044 | |
Swaps — centrally cleared | | Net unrealized depreciation1 | | — | | — | | — | | | — | | | | 159,524 | | | — | | | 159,524 | |
Swaps — OTC | | Unrealized depreciation on OTC swaps; Swap premiums received | | — | | — | | — | | | — | | | | 5 | | | — | | | 5 | |
| | | |
Total | | | | — | | — | | — | | | $13,778 | | | | $258,013 | | | — | | | $271,791 | |
| | | |
| | 1 | | Includes cumulative appreciation (depreciation) on financial futures contracts and centrally cleared swaps, if any, as reported in the Schedule of Investments. Only current day’s variation margin is reported within the Statements of Assets and Liabilities. |
| | 2 | | Includes options purchased at value as reported in the Schedule of Investments. |
For the year ended December 31, 2015, the effect of derivative financial instruments in the Statements of Operations were as follows:
| | | | | | | | | | | | | | | | | | | | |
| Net Realized Gain (Loss) from: | | Commodity
Contracts | | Credit
Contracts | | Equity
Contracts | | Foreign
Currency
Exchange
Contracts | | | Interest
Rate
Contracts | | | Other
Contracts | | Total | |
Financial futures contracts | | — | | — | | — | | | — | | | | $ (75,672) | | | — | | | $ (75,672) | |
Foreign currency transactions | | — | | — | | — | | | $270,336 | | | | — | | | — | | | 270,336 | |
Options purchased1 | | — | | — | | — | | | 32,856 | | | | (72,871) | | | — | | | (40,015) | |
Options written | | — | | — | | — | | | 333 | | | | (127,839) | | | — | | | (127,507) | |
Swaps | | — | | — | | — | | | — | | | | (67,671) | | | — | | | (67,671) | |
| | | |
Total | | — | | — | | — | | | $303,525 | | | | $(344,054) | | | — | | | $ (40,529) | |
| | | |
| | | | | | | | | | | |
| Net Change in Unrealized Appreciation (Depreciation) on: | | | | | | | | | | | | | | | | | |
Financial futures contracts | | — | | — | | — | | | — | | | | $ 73,500 | | | — | | | $ 73,500 | |
Foreign currency translations | | — | | — | | — | | | $ (89,727) | | | | — | | | — | | | (89,727) | |
Options purchased1 | | — | | — | | — | | | (3,496) | | | | 51,333 | | | — | | | 47,837 | |
Options written | | — | | — | | — | | | — | | | | 56,948 | | | — | | | 56,948 | |
Swaps | | — | | — | | — | | | — | | | | (7,136) | | | — | | | (7,136) | |
| | | |
Total | | — | | — | | — | | | $ (93,223) | | | | $ 174,645 | | | — | | | $ 81,422 | |
| | | |
| | 1 | | Options purchased are included in the net realized gain (loss) from investments and the net change in unrealized appreciation (depreciation) on investments. |
See Notes to Financial Statements.
| | | | | | |
| 120 | | BLACKROCK SERIES FUND, INC. | | DECEMBER 31, 2015 | | |
| | | | |
| Schedule of Investments (continued) | | | BlackRock U.S. Government Bond Portfolio | |
|
| Average Quarterly Balances of Outstanding Derivative Financial Instruments |
| | | | |
Financial futures contracts: | | | | |
Average notional value of contracts - long | | $ | 12,186,612 | |
Average notional value of contracts - short | | $ | 25,256,703 | |
Forward foreign currency exchange contracts: | | | | |
Average amounts purchased - in USD | | $ | 2,544,503 | |
Average amounts sold - USD | | $ | 1,379,619 | |
Options: | | | | |
Average value of option contracts purchased | | $ | 14,685 | |
Average value of option contracts written | | $ | 1,631 | |
Average notional value of swaption contracts purchased | | $ | 2,792,500 | |
Average notional value of swaption contracts written | | $ | 7,715,189 | |
Interest rate swaps: | | | | |
Average notional value - pays fixed rate | | $ | 9,460,826 | |
Average notional value - receives fixed rate | | $ | 3,771,219 | |
Total return swaps: | | | | |
Average notional value | | $ | 579,500 | |
For more information about the Fund’s investment risks regarding derivative financial instruments, refer to the Notes to Financial Statements.
|
| Derivative Financial Instruments - Offsetting as of Period End |
The Fund’s derivative assets and liabilities (by type) were as follows:
| | | | | | | | |
| | | Assets | | | Liabilities | |
Derivative Financial Instruments: | | | | | | | | |
Financial futures contracts | | | $ 7,700 | | | | $ 6,421 | |
Forward foreign currency exchange contracts | | | 16,706 | | | | 13,778 | |
Options | | | 14,1211 | | | | 76,044 | |
Swaps - Centrally cleared | | | — | | | | 22,817 | |
Swaps - OTC2 | | | 26,891 | | | | 5 | |
| | | | |
Total derivative assets and liabilities in the Statements of Assets and Liabilities | | | $ 65,418 | | | | $119,065 | |
Derivatives not subject to a Master Netting Agreement or similar agreement (“MNA”) | | | (12,444 | ) | | | (29,238 | ) |
| | | | |
Total derivative assets and liabilities subject to an MNA | | | $ 52,974 | | | | $ 89,827 | |
| | | | |
| | 1 | | Includes options purchased at value which is included in Investments at value - unaffiliated in the Statements of Assets and Liabilities and reported in the Schedule of Investments. |
| | 2 | | Includes unrealized appreciation (depreciation) on OTC swaps and swap premiums paid/received in the Statements of Assets and Liabilities. |
The following tables present the Fund’s derivative assets and liabilities by counterparty net of amounts available for offset under an MNA and net of the related collateral received and pledged by the Fund.
| | | | | | | | | | | | | | | | |
| Counterparty | | Derivative Assets
Subject to an MNA by
Counterparty | | | Derivatives Available
for Offset3 | | | Non-cash
Collateral
Received | | Cash
Collateral
Received | | Net Amount of Derivative Assets4 | |
Bank of America N.A. | | | $ 30 | | | | — | | | — | | — | | | $ 30 | |
BNP Paribas S.A. | | | 4,791 | | | | $ (2,557 | ) | | — | | — | | | 2,234 | |
Citibank N.A. | | | 4,374 | | | | (1,286 | ) | | — | | — | | | 3,088 | |
Credit Suisse International | | | 377 | | | | (377 | ) | | — | | — | | | — | |
Deutsche Bank AG | | | 27,397 | | | | (27,397 | ) | | — | | — | | | — | |
Goldman Sachs International | | | 130 | | | | (130 | ) | | — | | — | | | — | |
JPMorgan Chase Bank N.A. | | | 1,141 | | | | (249 | ) | | — | | — | | | 892 | |
Morgan Stanley & Co. International PLC | | | 3,405 | | | | (3,405 | ) | | — | | — | | | — | |
Royal Bank of Scotland PLC | | | 2,941 | | | | (77 | ) | | — | | — | | | 2,864 | |
Société Générale | | | 7,784 | | | | — | | | — | | — | | | 7,784 | |
State Street Bank and Trust Co. | | | 467 | | | | — | | | — | | — | | | 467 | |
UBS AG | | | 137 | | | | — | | | — | | — | | | 137 | |
| | | | |
Total | | | $52,974 | | | | $(35,478 | ) | | — | | — | | | $17,496 | |
| | | | |
| | 3 | | The amount of derivatives available for offset is limited to the amount of assets and/or liabilities that are subject to an MNA. |
| | 4 | | Net amount represents the net amount receivable from the counterparty in the event of default. |
See Notes to Financial Statements.
| | | | | | |
| | | BLACKROCK SERIES FUND, INC. | | DECEMBER 31, 2015 | | 121 |
| | | | |
| Schedule of Investments (continued) | | | BlackRock U.S. Government Bond Portfolio | |
| | | | | | | | | | | | | | | | |
| Counterparty | | Derivative Liabilities
Subject to an MNA by
Counterparty | | | Derivatives Available
for Offset1 | | | Non-cash
Collateral
Pledged | | Cash
Collateral
Pledged | | Net Amount of
Derivative Liabilities2 | |
BNP Paribas S.A. | | | $ 2,557 | | | | $ (2,557 | ) | | — | | — | | | — | |
Citibank N.A. | | | 1,286 | | | | (1,286 | ) | | — | | — | | | — | |
Credit Suisse International | | | 711 | | | | (377 | ) | | — | | — | | | $ 334 | |
Deutsche Bank AG | | | 78,263 | | | | (27,397 | ) | | — | | — | | | 50,866 | |
Goldman Sachs International | | | 959 | | | | (130 | ) | | — | | — | | | 829 | |
HSBC Bank PLC | | | 60 | | | | — | | | — | | — | | | 60 | |
JPMorgan Chase Bank N.A. | | | 249 | | | | (249 | ) | | — | | — | | | — | |
Morgan Stanley & Co. International PLC | | | 5,623 | | | | (3,405 | ) | | — | | — | | | 2,218 | |
Royal Bank of Scotland PLC | | | 77 | | | | (77 | ) | | — | | — | | | — | |
Standard Chartered Bank | | | 42 | | | | — | | | — | | — | | | 42 | |
| | | | |
Total | | | $89,827 | | | | $(35,478) | | | — | | — | | | $54,349 | |
| | | | |
| | 1 | | The amount of derivatives available for offset is limited to the amount of assets and/or liabilities that are subject to an MNA. |
| | 2 | | Net amount represents the net amount payable due to counterparty in the event of default. |
|
| Fair Value Hierarchy as of Period End |
Various inputs are used in determining the fair value of investments and derivative financial instruments. For information about the Fund’s policy regarding valuation of investments and derivative financial instruments, refer to the Notes to Financial Statements.
The following tables summarize the Fund’s investments and derivative financial instruments categorized in the disclosure hierarchy:
| | | | | | | | | | | | | | | | |
| | | Level 1 | | | Level 2 | | | Level 3 | | | Total | |
Assets: | | | | | | | | | | | | | | | | |
Investments: | | | | | | | | | | | | | | | | |
Long-Term Investments: | | | | | | | | | | | | | | | | |
Asset-Backed Securities | | | — | | | $ | 1,777,203 | | | $ | 397,000 | | | $ | 2,174,203 | |
Corporate Bonds | | | — | | | | 2,261,325 | | | | — | | | | 2,261,325 | |
Foreign Government Obligations | | | — | | | | 207,818 | | | | — | | | | 207,818 | |
Non-Agency Mortgage-Backed Securities | | | — | | | | 3,922,781 | | | | 75,070 | | | | 3,997,851 | |
U.S. Government Sponsored Agency Securities | | | — | | | | 67,962,647 | | | | — | | | | 67,962,647 | |
U.S. Treasury Obligations | | | — | | | | 38,397,283 | | | | — | | | | 38,397,283 | |
Short-Term Securities: | | | | | | | | | | | | | | | | |
Borrowed Bond Agreements | | | — | | | | 659,113 | | | | — | | | | 659,113 | |
Options Purchased: | | | | | | | | | | | | | | | | |
Foreign Currency Exchange Contracts | | | — | | | | 8,492 | | | | — | | | | 8,492 | |
Interest Rate Contracts | | $ | 4,744 | | | | 885 | | | | — | | | | 5,629 | |
Liabilities: | | | | | | | | | | | | | | | | |
Investments: | | | | | | | | | | | | | | | | |
Borrowed Bonds | | | — | | | | (659,223 | ) | | | — | | | | (659,223 | ) |
TBA Sale Commitments | | | — | | | | (34,555,377 | ) | | | — | | | | (34,555,377 | ) |
| | | | |
Total | | | | | | | | | | | | | | | | |
| | $ | 4,744 | | | $ | 79,982,947 | | | $ | 472,070 | | | $ | 80,459,761 | |
| | | | |
| | | | | | | | | | | | | | |
| | | Level 1 | | | Level 2 | | | Level 3 | | Total | |
Derivative Financial Instruments3: | | | | | | | | | | | | | | |
Assets: | | | | | | | | | | | | | | |
Foreign currency exchange contracts | | | — | | | | $ 16,706 | | | — | | | $ 16,706 | |
Interest rate contracts | | $ | 46,454 | | | | 66,226 | | | — | | | 112,680 | |
Liabilities: | | | | | | | | | | | | | | |
Foreign currency exchange contracts | | | — | | | | (13,778 | ) | | — | | | (13,778 | ) |
Interest rate contracts | | | (22,440 | ) | | | (235,570 | ) | | — | | | (258,010 | ) |
| | | | |
Total | | $ | 24,014 | | | | $ (166,416 | ) | | — | | | $ (142,402 | ) |
| | | | |
| | 3 | | Derivative financial instruments are swaps, financial futures contracts, forward foreign currency contracts and options written. Swaps, financial futures contracts and forward foreign currency contracts are valued at the unrealized appreciation (depreciation) on the instrument and options written are shown at value. |
See Notes to Financial Statements.
| | | | | | |
| 122 | | BLACKROCK SERIES FUND, INC. | | DECEMBER 31, 2015 | | |
| | | | |
| Schedule of Investments (concluded) | | | BlackRock U.S. Government Bond Portfolio | |
The Fund may hold assets and/or liabilities in which the fair value approximates the carrying amount or face value, including accrued interest, for financial statement purposes. As of period end, such assets and/or liabilities are categorized within the disclosure hierarchy as follows:
| | | | | | | | | | | | | | |
| | | Level 1 | | | Level 2 | | | Level 3 | | Total | |
Assets: | | | | | | | | | | | | | | |
Cash | | $ | 695,060 | | | | — | | | — | | | $ 695,060 | |
Cash pledged for centrally cleared swaps | | | 119,110 | | | | — | | | — | | | 119,110 | |
Cash pledged for financial futures contracts | | | 42,540 | | | | — | | | — | | | 42,540 | |
Foreign currency at value | | | 44,330 | | | | — | | | — | | | 44,330 | |
Liabilities: | | | | | | | | | | | | | | |
Reverse repurchase agreements | | | — | | | | $ (15,851,831 | ) | | — | | | (15,851,831 | ) |
| | | | |
Total | | $ | 901,040 | | | | $ (15,851,831 | ) | | — | | | $ (14,950,791 | ) |
| | | | |
During the year ended December 31, 2015, there were no transfers between levels.
See Notes to Financial Statements.
| | | | | | |
| | | BLACKROCK SERIES FUND, INC. | | DECEMBER 31, 2015 | | 123 |
| | |
| Statements of Assets and Liabilities | | |
| | | | | | | | | | | | | | | | |
| December 31, 2015 | | BlackRock
Balanced Capital
Portfolio | | | BlackRock
Capital Appreciation
Portfolio | | | BlackRock
Global Allocation
Portfolio1 | | | BlackRock
Government
Money Market
Portfolio | |
| | | | | | | | | | | | | | | | |
| Assets | | | | | | | | | | | | | | | | |
Investments at value — unaffiliated2,3 | | $ | 527,551,503 | | | $ | 156,034,136 | | | $ | 230,227,978 | | | $ | 83,649,897 | |
Investments at value — affiliated4 | | | 6,433,690 | | | | 8,447,035 | | | | 6,220,314 | | | | — | |
Cash | | | 3,654,593 | | | | — | | | | 5,150 | | | | — | |
Cash held for investments sold short | | | — | | | | — | | | | 577,245 | | | | — | |
Cash pledged for centrally cleared swaps | | | 60,182 | | | | — | | | | 156,750 | | | | — | |
Foreign currency at value5 | | | 197,393 | | | | 73 | | | | 9,236 | | | | — | |
Repurchase agreements at value6 | | | — | | | | — | | | | — | | | | 41,723,000 | |
Receivables: | | | | | | | | | | | | | | | | |
Investments sold | | | 5,522 | | | | — | | | | 471,494 | | | | — | |
Options written | | | — | | | | — | | | | 18,969 | | | | — | |
Securities lending income — affiliated | | | 1,509 | | | | 2,362 | | | | 6,620 | | | | — | |
Swaps | | | 115 | | | | — | | | | — | | | | — | |
TBA sale commitments | | | 30,679,859 | | | | — | | | | — | | | | — | |
Capital shares sold | | | — | | | | — | | | | — | | | | 318,465 | |
Dividends | | | 346,473 | | | | 20,159 | | | | 198,536 | | | | — | |
Interest | | | 1,008,799 | | | | — | | | | 519,039 | | | | 55,546 | |
From the Manager | | | 95,922 | | | | 32,597 | | | | 55,061 | | | | 9,527 | |
Principal paydowns | | | 2,324 | | | | — | | | | — | | | | — | |
Swap premiums paid | | | 74,887 | | | | — | | | | — | | | | — | |
Unrealized appreciation on: | | | | | | | | | | | | | | | | |
Forward foreign currency exchange contracts | | | 30,894 | | | | — | | | | 280,121 | | | | — | |
OTC swaps | | | 244,005 | | | | — | | | | 128,567 | | | | — | |
Variation margin receivable on financial futures contracts | | | 58,491 | | | | — | | | | 71,355 | | | | — | |
Variation margin receivable on centrally cleared swaps | | | 924 | | | | — | | | | 4,173 | | | | — | |
Prepaid expenses | | | 2,818 | | | | 870 | | | | 9,002 | | | | 5,000 | |
Other assets | | | 25,674 | | | | — | | | | — | | | | — | |
| | | | |
Total assets | | | 570,475,577 | | | | 164,537,232 | | | | 238,959,610 | | | | 125,761,435 | |
| | | | |
| | | | | | | | | | | | | | | | |
| Liabilities | | | | | | | | | | | | | | | | |
Investments sold short at value7 | | | — | | | | — | | | | 609,027 | | | | — | |
Cash received as collateral for OTC derivatives | | | — | | | | — | | | | 390,000 | | | | — | |
Borrowed bonds at value8 | | | 5,659,517 | | | | — | | | | — | | | | — | |
Collateral on securities loaned at value | | | 3,964,938 | | | | 5,786,479 | | | | 4,986,152 | | | | — | |
Options written at value9 | | | — | | | | — | | | | 910,925 | | | | — | |
TBA sale commitments at value10 | | | 30,683,688 | | | | — | | | | — | | | | — | |
Reverse repurchase agreements | | | 7,741,100 | | | | — | | | | — | | | | — | |
Payables: | | | | | | | | | | | | | | | | |
Investments purchased | | | 21,838,066 | | | | 1,853,032 | | | | 1,473,889 | | | | — | |
Swaps | | | 2,764 | | | | — | | | | — | | | | — | |
Capital shares redeemed | | | 14,661 | | | | 5,115 | | | | 215,485 | | | | 44,162 | |
Interest expense | | | 43,262 | | | | — | | | | — | | | | — | |
Investment advisory fees | | | 155,630 | | | | 48,602 | | | | 69,671 | | | | 227 | |
Officer’s and Directors’ fees | | | 6,506 | | | | 4,700 | | | | 5,183 | | | | 4,619 | |
Other affiliates | | | 1,370 | | | | 418 | | | | 645 | | | | 341 | |
Professional fees | | | 58,034 | | | | 42,263 | | | | 75,850 | | | | 34,240 | |
Transfer agent fees | | | 191,473 | | | | 57,069 | | | | 97,139 | | | | 22,522 | |
Swap premiums received | | | 292,822 | | | | — | | | | — | | | | — | |
Unrealized depreciation on: | | | | | | | | | | | | | | | | |
Forward foreign currency exchange contracts | | | 51,528 | | | | — | | | | 294,816 | | | | — | |
OTC swaps | | | 247,066 | | | | — | | | | 26,373 | | | | — | |
Variation margin payable on financial futures contracts | | | 6,291 | | | | — | | | | — | | | | — | |
Other accrued expenses payable | | | 78,157 | | | | 17,316 | | | | 155,591 | | | | 14,624 | |
| | | | |
Total liabilities | | | 71,036,873 | | | | 7,814,994 | | | | 9,310,746 | | | | 120,735 | |
| | | | |
Net Assets | | $ | 499,438,704 | | | $ | 156,722,238 | | | $ | 229,648,864 | | | $ | 125,640,700 | |
| | | | |
See Notes to Financial Statements.
| | | | | | |
| 124 | | BLACKROCK SERIES FUND, INC. | | DECEMBER 31, 2015 | | |
| | |
| Statements of Assets and Liabilities (continued) | | |
| | | | | | | | | | | | | | | | |
| December 31, 2015 | | BlackRock
Balanced Capital
Portfolio | | | BlackRock
Capital Appreciation
Portfolio | | | BlackRock
Global Allocation
Portfolio1 | | | BlackRock Government Money Market Portfolio | |
| | | | | | | | | | | | | | | | |
| Net Assets Consist of | | | | | | | | | | | | | | | | |
Paid-in capital | | $ | 444,619,003 | | | $ | 130,991,548 | | | $ | 238,401,741 | | | $ | 125,640,216 | |
Undistributed (distributions in excess of) net investment income | | | 67,597 | | | | 23,760 | | | | (960,674 | ) | | | — | |
Accumulated net realized gain (loss) | | | 1,569,313 | | | | 1,820,006 | | | | (1,842,474 | ) | | | 484 | |
Net unrealized appreciation (depreciation) | | | 53,182,791 | | | | 23,886,924 | | | | (5,949,729 | ) | | | — | |
| | | | |
Net Assets | | $ | 499,438,704 | | | $ | 156,722,238 | | | $ | 229,648,864 | | | $ | 125,640,700 | |
| | | | |
Shares outstanding, $0.10 par value11 | | | 29,828,790 | | | | 4,566,472 | | | | 16,116,736 | | | | 125,640,216 | |
| | | | |
Net asset value, offering and redemption price per share | | $ | 16.74 | | | $ | 34.32 | | | $ | 14.25 | | | $ | 1.00 | |
| | | | |
1 Consolidated Statement of Assets and Liabilities | | | | | | | | | | | | | | | | |
2 Investments at cost — unaffiliated | | $ | 474,216,923 | | | $ | 132,147,212 | | | $ | 236,056,891 | | | $ | 83,649,897 | |
3 Securities loaned at value | | $ | 3,849,238 | | | $ | 5,675,340 | | | $ | 4,831,023 | | | | — | |
4 Investments at cost — affiliated | | $ | 6,581,700 | | | $ | 8,447,035 | | | $ | 6,421,593 | | | | — | |
5 Foreign currency at cost | | $ | 199,079 | | | $ | 73 | | | $ | 9,288 | | | | — | |
6 Repurchase agreements at cost | | | — | | | | — | | | | — | | | $ | 41,723,000 | |
7 Proceeds from investments sold short | | | — | | | | — | | | $ | 622,421 | | | | — | |
8 Proceeds received from borrowed bonds | | $ | 5,696,713 | | | | — | | | | — | | | | — | |
9 Premiums received | | | — | | | | — | | | $ | 995,473 | | | | — | |
10 Proceeds from TBA sale commitments | | $ | 30,679,859 | | | | — | | | | — | | | | — | |
11 Authorized shares | | | 300 million | | | | 100 million | | | | 100 million | | | | 2 billion | |
See Notes to Financial Statements.
| | | | | | |
| | | BLACKROCK SERIES FUND, INC. | | DECEMBER 31, 2015 | | 125 |
| | |
| Statements of Assets and Liabilities (continued) | | |
| | | | | | | | | | | | | | | | |
| December 31, 2015 | | BlackRock High Yield Portfolio | | | BlackRock
Large Cap Core
Portfolio | | | BlackRock
Total Return
Portfolio | | | BlackRock
U.S. Government
Bond Portfolio | |
| | | | | | | | | | | | | | | | |
| Assets | | | | | | | | | | | | | | | | |
Investments at value — unaffiliated1,2 | | $ | 29,329,861 | | | $ | 168,313,992 | | | $ | 75,297,010 | | | $ | 115,674,361 | |
Investments at value — affiliated3 | | | 1,971,388 | | | | 7,630,939 | | | | 1,413,791 | | | | — | |
Cash | | | — | | | | — | | | | 7,000 | | | | 695,060 | |
Cash pledged: | | | | | | | | | | | | | | | | |
Financial futures contracts | | | 124,800 | | | | — | | | | — | | | | 42,540 | |
Centrally cleared swaps | | | 40,190 | | | | — | | | | 20,500 | | | | 119,110 | |
Foreign currency at value4 | | | 8,915 | | | | — | | | | 57,746 | | | | 44,330 | |
Receivables: | | | | | | | | | | | | | | | | |
Investments sold | | | 268,857 | | | | — | | | | 2,457 | | | | 118 | |
Securities lending income — affiliated | | | — | | | | 914 | | | | — | | | | — | |
Swaps | | | — | | | | — | | | | 37 | | | | — | |
TBA sale commitments | | | — | | | | — | | | | 10,160,554 | | | | 34,560,038 | |
Capital shares sold | | | 2,813 | | | | — | | | | 64 | | | | — | |
Dividends | | | 256 | | | | 190,416 | | | | 151 | | | | — | |
Interest | | | 488,458 | | | | — | | | | 331,532 | | | | 321,424 | |
From the Manager | | | 6,841 | | | | 30,543 | | | | 12,858 | | | | 13,976 | |
Principal paydowns | | | — | | | | — | | | | 10,515 | | | | 1,743 | |
Swap premiums paid | | | — | | | | — | | | | 23,116 | | | | 5 | |
Unrealized appreciation on: | | | | | | | | | | | | | | | | |
Forward foreign currency exchange contracts | | | 12,307 | | | | — | | | | 12,655 | | | | 16,706 | |
OTC swaps | | | — | | | | — | | | | 55,052 | | | | 26,886 | |
Variation margin receivable on financial futures contracts | | | 24,570 | | | | — | | | | 15,719 | | | | 7,700 | |
Variation margin receivable on centrally cleared swaps | | | — | | | | — | | | | 163 | | | | ��� | |
Prepaid expenses | | | 191 | | | | 1,322 | | | | 350 | | | | 376 | |
Other assets | | | 1,080 | | | | — | | | | 3,109 | | | | 62,657 | |
| | | | |
Total assets | | | 32,280,527 | | | | 176,168,126 | | | | 87,424,379 | | | | 151,587,030 | |
| | | | |
| | | | | | | | | | | | | | | | |
| Liabilities | | | | | | | | | | | | | | | | |
Borrowed bonds at value5 | | | — | | | | — | | | | 1,954,704 | | | | 659,223 | |
Collateral on securities loaned at value | | | — | | | | 6,716,532 | | | | — | | | | — | |
Options written at value6 | | | — | | | | — | | | | — | | | | 76,044 | |
TBA sale commitments at value7 | | | — | | | | — | | | | 10,163,120 | | | | 34,555,377 | |
Reverse repurchase agreements | | | — | | | | — | | | | 6,639,364 | | | | 15,851,831 | |
Payables: | | | | | | | | | | | | | | | | |
Investments purchased | | | 213,468 | | | | — | | | | 6,182,425 | | | | 33,848,902 | |
Swaps | | | — | | | | — | | | | 858 | | | | — | |
Capital shares redeemed | | | 574 | | | | 100,953 | | | | 11,853 | | | | 33,913 | |
Foreign taxes | | | — | | | | — | | | | 13,786 | | | | — | |
Income dividends | | | 153,292 | | | | — | | | | 132,037 | | | | 122,456 | |
Interest expense | | | — | | | | — | | | | 15,152 | | | | 3,743 | |
Investment advisory fees | | | 3,384 | | | | 52,793 | | | | 2,741 | | | | 14,040 | |
Officer’s and Directors’ fees | | | 4,137 | | | | 4,800 | | | | 4,282 | | | | 4,311 | |
Other affiliates | | | 95 | | | | 460 | | | | 173 | | | | 187 | |
Professional fees | | | 46,751 | | | | 39,551 | | | | 57,815 | | | | 60,382 | |
Transfer agent fees | | | 15,782 | | | | 64,047 | | | | 25,098 | | | | 27,573 | |
Swap premiums received | | | — | | | | — | | | | 54,249 | | | | 3 | |
Unrealized depreciation on: | | | | | | | | | | | | | | | | |
Forward foreign currency exchange contracts | | | 34,363 | | | | — | | | | 17,606 | | | | 13,778 | |
OTC swaps | | | — | | | | — | | | | 110,362 | | | | 2 | |
Variation margin payable on financial futures contracts | | | — | | | | — | | | | 1,977 | | | | 6,421 | |
Variation margin payable on centrally cleared swaps | | | 294 | | | | — | | | | — | | | | 22,817 | |
Other accrued expenses payable | | | 20,530 | | | | 15,918 | | | | 34,840 | | | | 23,055 | |
Commitments | | | — | 8 | | | — | | | | — | | | | — | |
| | | | |
Total liabilities | | | 492,670 | | | | 6,995,054 | | | | 25,422,442 | | | | 85,324,058 | |
| | | | |
Net Assets | | $ | 31,787,857 | | | $ | 169,173,072 | | | $ | 62,001,937 | | | $ | 66,262,972 | |
| | | | |
See Notes to Financial Statements.
| | | | | | |
| 126 | | BLACKROCK SERIES FUND, INC. | | DECEMBER 31, 2015 | | |
| | |
| Statements of Assets and Liabilities (concluded) | | |
| | | | | | | | | | | | | | | | |
| December 31, 2015 | | BlackRock High Yield
Portfolio | | | BlackRock Large Cap Core
Portfolio | | | BlackRock Total Return
Portfolio | | | BlackRock U.S. Government Bond Portfolio | |
| | | | | | | | | | | | | | | | |
| Net Assets Consist of | | | | | | | | | | | | | | | | |
Paid-in capital | | $ | 40,914,768 | | | $ | 135,328,309 | | | $ | 66,151,040 | | | $ | 68,420,308 | |
Undistributed (distributions in excess of) net investment income | | | 114,796 | | | | 4,603 | | | | (44,265 | ) | | | 223,960 | |
Accumulated net realized gain (loss) | | | (6,161,709 | ) | | | 1,175,846 | | | | (3,282,161 | ) | | | (2,061,243) | |
Net unrealized appreciation (depreciation) | | | (3,079,998 | ) | | | 32,664,314 | | | | (822,677 | ) | | | (320,053) | |
| | | | |
Net Assets | | $ | 31,787,857 | | | $ | 169,173,072 | | | $ | 62,001,937 | | | $ | 66,262,972 | |
| | | | |
Shares outstanding, $0.10 par value9 | | | 6,472,429 | | | | 6,376,769 | | | | 5,391,849 | | | | 6,081,413 | |
| | | | |
Net asset value, offering and redemption price per share | | $ | 4.91 | | | $ | 26.53 | | | $ | 11.50 | | | $ | 10.90 | |
| | | | |
1 Investments at cost — unaffiliated | | $ | 32,360,636 | | | $ | 135,649,678 | | | $ | 76,014,018 | | | $ | 116,025,582 | |
2 Securities loaned at value | | | — | | | $ | 6,520,609 | | | | — | | | | — | |
3 Investments at cost — affiliated | | $ | 1,971,388 | | | $ | 7,630,939 | | | $ | 1,460,118 | | | | — | |
4 Foreign currency at cost | | $ | 8,983 | | | | — | | | $ | 57,510 | | | $ | 44,534 | |
5 Proceeds received from borrowed bonds | | | — | | | | — | | | $ | 1,970,084 | | | $ | 658,818 | |
6 Premiums received | | | — | | | | — | | | | — | | | $ | 106,970 | |
7 Proceeds from TBA sale commitments | | | — | | | | — | | | $ | 10,160,554 | | | $ | 34,560,038 | |
8 See Note 4 of the Notes to Financial Statements for details of commitments | | | | | | | | | | | | | | | | |
9 Authorized shares | | | 100 million | | | | 100 million | | | | 100 million | | | | 100 million | |
See Notes to Financial Statements.
| | | | | | |
| | | BLACKROCK SERIES FUND, INC. | | DECEMBER 31, 2015 | | 127 |
| | | | | | | | | | | | | | | | |
| Year Ended December 31, 2015 | | BlackRock
Balanced Capital Portfolio | | | BlackRock
Capital
Appreciation
Portfolio | | | BlackRock
Global
Allocation
Portfolio1 | | | BlackRock Government Money Market Portfolio | |
| | | | | | | | | | | | | | | | |
| Investment Income | | | | | | | | | | | | | | | | |
Dividends — unaffiliated | | $ | 5,500,614 | | | $ | 1,020,776 | | | $ | 3,177,511 | | | | — | |
Dividends — affiliated | | | 7,534 | | | | 1,962 | | | | 2,146 | | | | — | |
Interest | | | 5,216,515 | | | | — | | | | 2,099,778 | | | $ | 281,815 | |
Securities lending — affiliated — net | | | 13,586 | | | | 15,829 | | | | 47,061 | | | | — | |
Foreign taxes withheld | | | (38,763 | ) | | | (4,839 | ) | | | (145,782 | ) | | | — | |
| | | | |
Total income | | | 10,699,486 | | | | 1,033,728 | | | | 5,180,714 | | | | 281,815 | |
| | | | |
| | | | | | | | | | | | | | | | |
| Expenses | | | | | | | | | | | | | | | | |
Investment advisory | | | 1,892,344 | | | | 577,476 | | | | 894,991 | | | | 474,336 | |
Transfer agent | | | 749,136 | | | | 224,113 | | | | 367,090 | | | | 92,117 | |
Accounting services | | | 120,384 | | | | 40,122 | | | | 70,518 | | | | 7,280 | |
Custodian | | | 128,378 | | | | 21,721 | | | | 279,104 | | | | 24,654 | |
Professional | | | 107,226 | | | | 58,709 | | | | 102,198 | | | | 56,956 | |
Printing | | | 36,874 | | | | 16,605 | | | | 21,625 | | | | 27,459 | |
Officer and Directors | | | 28,204 | | | | 22,519 | | | | 23,884 | | | | 22,102 | |
Registration | | | 1,200 | | | | 1,200 | | | | 1,200 | | | | 1,200 | |
Miscellaneous | | | 76,130 | | | | 7,909 | | | | 124,235 | | | | 6,635 | |
| | | | |
Total expenses excluding dividend expense, interest expense and stock loan fees | | | 3,139,876 | | | | 970,374 | | | | 1,884,845 | | | | 712,739 | |
Dividend expense | | | — | | | | — | | | | 12,841 | | | | — | |
Interest expense | | | 59,022 | | | | — | | | | — | | | | — | |
Stock loan fees | | | — | | | | — | | | | 426 | | | | — | |
| | | | |
Total expenses | | | 3,198,898 | | | | 970,374 | | | | 1,898,112 | | | | 712,739 | |
Less fees waived by the Manager | | | (7,576 | ) | | | (1,988 | ) | | | (112,874 | ) | | | (334,527) | |
Less transfer agent fees reimbursed | | | (566,800 | ) | | | (155,310 | ) | | | (362,090 | ) | | | (86,910) | |
Less other expenses reimbursed | | | — | | | | — | | | | — | | | | (9,527) | |
| | | | |
Total expenses after fees waived and/or reimbursed | | | 2,624,522 | | | | 813,076 | | | | 1,423,148 | | | | 281,775 | |
| | | | |
Net investment income | | | 8,074,964 | | | | 220,652 | | | | 3,757,566 | | | | 40 | |
| | | | |
| | | | | | | | | | | | | | | | |
| Realized and Unrealized Gain (Loss) | | | | | | | | | | | | | | | | |
Net realized gain (loss) from: | | | | | | | | | | | | | | | | |
Investments — unaffiliated | | | 23,335,426 | | | | 10,671,356 | | | | 5,201,062 | | | | 8,416 | |
Capital gain distributions received from affiliated investment companies | | | 139 | | | | 49 | | | | 48 | | | | — | |
Financial futures contracts | | | (190,019 | ) | | | — | | | | 1,178,709 | | | | — | |
Interest rate floors | | | (41,840 | ) | | | — | | | | — | | | | — | |
Foreign currency transactions | | | 387,240 | | | | (137 | ) | | | 3,318,695 | | | | — | |
Options written | | | 158,509 | | | | — | | | | 791,076 | | | | — | |
Short sales | | | — | | | | — | | | | (12,768 | ) | | | — | |
Swaps | | | 342,678 | | | | — | | | | 261,833 | | | | — | |
Borrowed bonds | | | (44,202 | ) | | | — | | | | — | | | | — | |
| | | | |
| | | 23,947,931 | | | | 10,671,268 | | | | 10,738,655 | | | | 8,416 | |
| | | | |
Net change in unrealized appreciation (depreciation) on: | | | | | | | | | | | | | | | | |
Investments — unaffiliated2 | | | (28,204,298 | ) | | | (32,804 | ) | | | (14,992,968 | ) | | | — | |
Investments — affiliated | | | (148,010 | ) | | | — | | | | (65,836 | ) | | | — | |
Financial futures contracts | | | (107,736 | ) | | | — | | | | 32,932 | | | | — | |
Interest rate floors | | | 7,634 | | | | — | | | | — | | | | — | |
Foreign currency translations | | | (292,313 | ) | | | — | | | | (1,287,435 | ) | | | — | |
Options written | | | 1,605 | | | | — | | | | 534,592 | | | | — | |
Short sales | | | — | | | | — | | | | 19,739 | | | | — | |
Swaps | | | (174,689 | ) | | | — | | | | (135,788 | ) | | | — | |
Borrowed bonds | | | 37,196 | | | | — | | | | — | | | | — | |
| | | | |
| | | (28,880,611 | ) | | | (32,804 | ) | | | (15,894,764 | ) | | | — | |
| | | | |
Total realized and unrealized gain (loss) | | | (4,932,680 | ) | | | 10,638,464 | | | | (5,156,109 | ) | | | 8,416 | |
| | | | |
Net Increase (Decrease) in Net Assets Resulting from Operations | | $ | 3,142,284 | | | $ | 10,859,116 | | | $ | (1,398,543 | ) | | $ | 8,456 | |
| | | | |
1 Consolidated Statement of Operations | | | | | | | | | | | | | | | | |
2 Net of foreign capital gain tax | | | — | | | | — | | | $ | 3,493 | | | | — | |
See Notes to Financial Statements.
| | | | | | |
| 128 | | BLACKROCK SERIES FUND, INC. | | DECEMBER 31, 2015 | | |
| | |
| Statements of Operations (concluded) | | |
| | | | | | | | | | | | | | | | |
| Year Ended December 31, 2015 | | BlackRock High Yield Portfolio | | | BlackRock Large Cap Core Portfolio | | | BlackRock Total Return Portfolio | | | BlackRock U.S. Government
Bond Portfolio | |
| | | | | | | | | | | | | | | | |
| Investment Income | | | | | | | | | | | | | | | | |
Dividends — unaffiliated | | $ | 43,762 | | | $ | 2,916,625 | | | $ | 21,742 | | | | — | |
Dividends — affiliated | | | 21,771 | | | | 2,036 | | | | 15,153 | | | $ | 3,473 | |
Interest | | | 2,088,345 | | | | — | | | | 1,839,594 | | | | 1,492,938 | |
Securities lending — affiliated — net | | | — | | | | 10,155 | | | | — | | | | — | |
Foreign taxes withheld | | | (697 | ) | | | (22,382 | ) | | | (80 | ) | | | — | |
| | | | |
Total income | | | 2,153,181 | | | | 2,906,434 | | | | 1,876,409 | | | | 1,496,411 | |
| | | | |
| | | | | | | | | | | | | | | | |
| Expenses | | | | | | | | | | | | | | | | |
Investment advisory | | | 134,258 | | | | 641,100 | | | | 236,975 | | | | 256,565 | |
Transfer agent | | | 56,812 | | | | 248,082 | | | | 95,141 | | | | 105,501 | |
Professional | | | 55,346 | | | | 57,579 | | | | 65,229 | | | | 72,630 | |
Custodian | | | 24,769 | | | | 16,264 | | | | 88,255 | | | | 51,739 | |
Officer and Directors | | | 20,653 | | | | 22,820 | | | | 21,099 | | | | 21,178 | |
Accounting services | | | 14,433 | | | | 43,716 | | | | 20,519 | | | | 21,699 | |
Printing | | | 10,381 | | | | 17,270 | | | | 11,736 | | | | 11,559 | |
Registration | | | 1,200 | | | | 4,003 | | | | 1,200 | | | | 1,200 | |
Miscellaneous | | | 19,410 | | | | 8,088 | | | | 50,304 | | | | 14,650 | |
| | | | |
Total expenses excluding interest expense | | | 337,262 | | | | 1,058,922 | | | | 590,458 | | | | 556,721 | |
Interest expense | | | — | | | | — | | | | 25,758 | | | | 20,199 | |
| | | | |
Total expenses | | | 337,262 | | | | 1,058,922 | | | | 616,216 | | | | 576,920 | |
Less fees waived by the Manager | | | (99,353 | ) | | | (2,268 | ) | | | (172,400 | ) | | | (101,233) | |
Less transfer agent fees reimbursed | | | (51,812 | ) | | | (175,073 | ) | | | (90,141 | ) | | | (100,501) | |
| | | | |
Total expenses after fees waived and/or reimbursed | | | 186,097 | | | | 881,581 | | | | 353,675 | | | | 375,186 | |
| | | | |
Net investment income | | | 1,967,084 | | | | 2,024,853 | | | | 1,522,734 | | | | 1,121,225 | |
| | | | |
| | | | | | | | | | | | | | | | |
| Realized and Unrealized Gain (Loss) | | | | | | | | | | | | | | | | |
Net realized gain (loss) from: | | | | | | | | | | | | | | | | |
Investments — unaffiliated | | | (1,907,071 | ) | | | 8,868,248 | | | | 181,889 | | | | 590,518 | |
Investments — affiliated | | | (54,696 | ) | | | — | | | | — | | | | — | |
Capital gain distributions received from affiliated investment companies | | | 28 | | | | 41 | | | | 32 | | | | 3 | |
Financial futures contracts | | | (131,421 | ) | | | — | | | | (53,059 | ) | | | (75,672) | |
Interest rate floors | | | — | | | | — | | | | (15,651 | ) | | | — | |
Foreign currency transactions | | | 587,986 | | | | — | | | | 141,082 | | | | 75,828 | |
Options written | | | 4,104 | | | | — | | | | 51,829 | | | | (127,507) | |
Borrowed bonds | | | — | | | | — | | | | (29,004 | ) | | | 1,280 | |
Swaps | | | 28,822 | | | | — | | | | 94,010 | | | | (67,671) | |
| | | | |
| | | (1,472,248 | ) | | | 8,868,289 | | | | 371,128 | | | | 396,779 | |
| | | | |
Net change in unrealized appreciation (depreciation) on: | | | | | | | | | | | | | | | | |
Investments — unaffiliated | | | (1,806,942 | ) | | | (9,751,131 | ) | | | (1,392,909 | ) | | | (1,159,951) | |
Investments — affiliated | | | 3,358 | | | | — | | | | (46,327 | ) | | | — | |
Financial futures contracts | | | 74,587 | | | | — | | | | (57,405 | ) | | | 73,500 | |
Interest rate floors | | | — | | | | — | | | | 2,856 | | | | — | |
Foreign currency translations | | | (215,108 | ) | | | — | | | | (103,574 | ) | | | (90,438) | |
Options written | | | — | | | | — | | | | 418 | | | | 56,948 | |
Swaps | | | 10,126 | | | | — | | | | (55,463 | ) | | | (7,136) | |
Borrowed bonds | | | — | | | | — | | | | 15,380 | | | | (405) | |
| | | | |
| | | (1,933,979 | ) | | | (9,751,131 | ) | | | (1,637,024 | ) | | | (1,127,482) | |
| | | | |
Total realized and unrealized loss | | | (3,406,227 | ) | | | (882,842 | ) | | | (1,265,896 | ) | | | (730,703) | |
| | | | |
Net Increase (Decrease) in Net Assets Resulting from Operations | | $ | (1,439,143 | ) | | $ | 1,142,011 | | | $ | 256,838 | | | $ | 390,522 | |
| | | | |
See Notes to Financial Statements.
| | | | | | |
| | | BLACKROCK SERIES FUND, INC. | | DECEMBER 31, 2015 | | 129 |
| | |
| Statements of Changes in Net Assets | | |
| | | | | | | | | | | | | | | | |
| | | BlackRock
Balanced Capital
Portfolio | | | BlackRock
Capital Appreciation
Portfolio | |
| | | Year Ended December 31, | | | Year Ended December 31, | |
| Increase (Decrease) in Net Assets: | | 2015 | | | 2014 | | | 2015 | | | 2014 | |
| | | | | | | | | | | | | | | | |
| Operations | | | | | | | | | | | | | | | | |
Net investment income | | $ | 8,074,964 | | | $ | 9,228,518 | | | $ | 220,652 | | | $ | 289,238 | |
Net realized gain | | | 23,947,931 | | | | 55,728,082 | | | | 10,671,268 | | | | 25,648,369 | |
Net change in unrealized appreciation (depreciation) | | | (28,880,611 | ) | | | (8,549,774 | ) | | | (32,804 | ) | | | (12,530,655 | ) |
| | | | | | | | |
Net increase in net assets resulting from operations | | | 3,142,284 | | | | 56,406,826 | | | | 10,859,116 | | | | 13,406,952 | |
| | | | | | | | |
| | | | | | | | | | | | | | | | |
| Distributions to Shareholders From1 | | | | | | | | | | | | | | | | |
Net investment income | | | (8,478,495 | ) | | | (9,881,631 | ) | | | (200,002 | ) | | | (266,239 | ) |
Net realized gain | | | (24,468,344 | ) | | | (57,418,669 | ) | | | (12,402,083 | ) | | | (26,403,560 | ) |
| | | | | | | | |
Decrease in net assets resulting from distributions to shareholders | | | (32,946,839 | ) | | | (67,300,300 | ) | | | (12,602,085 | ) | | | (26,669,799 | ) |
| | | | | | | | |
| | | | | | | | | | | | | | | | |
| Capital Share Transactions | | | | | | | | | | | | | | | | |
Net increase (decrease) in net assets derived from capital share transactions | | | (16,810,274 | ) | | | 19,306,262 | | | | 1,077,712 | | | | 12,599,186 | |
| | | | | | | | |
| | | | | | | | | | | | | | | | |
| Net Assets | | | | | | | | | | | | | | | | |
Total increase (decrease) in net assets | | | (46,614,829 | ) | | | 8,412,788 | | | | (665,257 | ) | | | (663,661 | ) |
Beginning of year | | | 546,053,533 | | | | 537,640,745 | | | | 157,387,495 | | | | 158,051,156 | |
| | | | | | | | |
End of year | | $ | 499,438,704 | | | $ | 546,053,533 | | | $ | 156,722,238 | | | $ | 157,387,495 | |
| | | | | | | | |
Undistributed (distributions in excess of) net investment income, end of year | | $ | 67,597 | | | $ | (70,474 | ) | | $ | 23,760 | | | $ | 3,247 | |
| | | | | | | | |
| 1 | | Distributions for annual periods determined in accordance with federal income tax regulations. |
See Notes to Financial Statements.
| | | | | | |
| 130 | | BLACKROCK SERIES FUND, INC. | | DECEMBER 31, 2015 | | |
| | |
| Statements of Changes in Net Assets (continued) | | |
| | | | | | | | | | | | | | | | |
| | | BlackRock
Global Allocation
Portfolio1 | | | BlackRock
Government Money Market
Portfolio | |
| | | Year Ended December 31, | | | Year Ended December 31, | |
| Increase (Decrease) in Net Assets: | | 2015 | | | 2014 | | | 2015 | | | 2014 | |
| | | | | | | | | | | | | | | | |
| Operations | | | | | | | | | | | | | | | | |
Net investment income | | $ | 3,757,566 | | | $ | 4,883,393 | | | $ | 40 | | | $ | 40 | |
Net realized gain | | | 10,738,655 | | | | 24,388,201 | | | | 8,416 | | | | 7,165 | |
Net change in unrealized appreciation (depreciation) | | | (15,894,764 | ) | | | (22,367,982 | ) | | | — | | | | — | |
| | | | | | | | |
Net increase (decrease) in net assets resulting from operations | | | (1,398,543 | ) | | | 6,903,612 | | | | 8,456 | | | | 7,205 | |
| | | | | | | | |
| | | | | | | | | | | | | | | | |
| Distributions to Shareholders From2 | | | | | | | | | | | | | | | | |
Net investment income | | | (4,714,207 | ) | | | (6,467,763 | ) | | | (40 | ) | | | (40 | ) |
Net realized gain | | | (13,479,210 | ) | | | (21,285,481 | ) | | | (8,064 | ) | | | (7,293 | ) |
Tax return of capital | | | (1,548 | ) | | | — | | | | — | | | | — | |
| | | | | | | | |
Decrease in net assets resulting from distributions to shareholders | | | (18,194,965 | ) | | | (27,753,244 | ) | | | (8,104 | ) | | | (7,333 | ) |
| | | | | | | | |
| | | | | | | | | | | | | | | | |
| Capital Share Transactions | | | | | | | | | | | | | | | | |
Net increase (decrease) in net assets derived from capital share transactions | | | (8,453,675 | ) | | | 1,923,293 | | | | (12,392,352 | ) | | | (10,451,710 | ) |
| | | | | | | | |
| | | | | | | | | | | | | | | | |
| Net Assets | | | | | | | | | | | | | | | | |
Total decrease in net assets | | | (28,047,183 | ) | | | (18,926,339 | ) | | | (12,392,000 | ) | | | (10,451,838 | ) |
Beginning of year | | | 257,696,047 | | | | 276,622,386 | | | | 138,032,700 | | | | 148,484,538 | |
| | | | | | | | |
End of year | | $ | 229,648,864 | | | $ | 257,696,047 | | | $ | 125,640,700 | | | $ | 138,032,700 | |
| | | | | | | | |
Distributions in excess of net investment income, end of year | | $ | (960,674 | ) | | $ | (168,597 | ) | | | — | | | | — | |
| | | | | | | | |
| | 1 | | Consolidated Statements of Changes in Net Assets. |
| | 2 | | Distributions for annual periods determined in accordance with federal income tax regulations. |
See Notes to Financial Statements.
| | | | | | |
| | | BLACKROCK SERIES FUND, INC. | | DECEMBER 31, 2015 | | 131 |
| | |
| Statements of Changes in Net Assets (continued) | | |
| | | | | | | | | | | | | | | | |
| | | BlackRock
High Yield
Portfolio | | | BlackRock
Large Cap Core
Portfolio | |
| | | Year Ended December 31, | | | Year Ended December 31, | |
| Increase (Decrease) in Net Assets: | | 2015 | | | 2014 | | | 2015 | | | 2014 | |
| | | | | | | | | | | | | | | | |
| Operations | | | | | | | | | | | | | | | | |
Net investment income | | $ | 1,967,084 | | | $ | 2,534,260 | | | $ | 2,024,853 | | | $ | 1,842,721 | |
Net realized gain (loss) | | | (1,472,248 | ) | | | 807,724 | | | | 8,868,289 | | | | 23,552,869 | |
Net change in unrealized appreciation (depreciation) | | | (1,933,979 | ) | | | (2,358,761 | ) | | | (9,751,131 | ) | | | (3,782,001 | ) |
| | | | | | | | |
Net increase (decrease) in net assets resulting from operations | | | (1,439,143 | ) | | | 983,223 | | | | 1,142,011 | | | | 21,613,589 | |
| | | | | | | | |
| | | | | | | | | | | | | | | | |
| Distributions to Shareholders From1 | | | | | | | | | | | | | | | | |
Net investment income | | | (2,026,889 | ) | | | (2,871,368 | ) | | | (2,025,002 | ) | | | (1,888,456 | ) |
Net realized gain | | | — | | | | — | | | | (8,645,660 | ) | | | (15,500,781 | ) |
| | | | | | | | |
Decrease in net assets resulting from distributions to shareholders | | | (2,026,889 | ) | | | (2,871,368 | ) | | | (10,670,662 | ) | | | (17,389,237 | ) |
| | | | | | | | |
| | | | | | | | | | | | | | | | |
| Capital Share Transactions | | | | | | | | | | | | | | | | |
Net increase (decrease) in net assets derived from capital share transactions | | | (3,827,439 | ) | | | (7,553,392 | ) | | | (6,152,545 | ) | | | 1,368,548 | |
| | | | | | | | |
| | | | | | | | | | | | | | | | |
| Net Assets | | | | | | | | | | | | | | | | |
Total increase (decrease) in net assets | | | (7,293,471 | ) | | | (9,441,537 | ) | | | (15,681,196 | ) | | | 5,592,900 | |
Beginning of year | | | 39,081,328 | | | | 48,522,865 | | | | 184,854,268 | | | | 179,261,368 | |
| | | | | | | | |
End of year | | $ | 31,787,857 | | | $ | 39,081,328 | | | $ | 169,173,072 | | | $ | 184,854,268 | |
| | | | | | | | |
Undistributed (distributions in excess of) net investment income, end of year | | $ | 114,796 | | | $ | (76,225 | ) | | $ | 4,603 | | | $ | 403 | |
| | | | | | | | |
| 1 | | Distributions for annual periods determined in accordance with federal income tax regulations. |
See Notes to Financial Statements.
| | | | | | |
| 132 | | BLACKROCK SERIES FUND, INC. | | DECEMBER 31, 2015 | | |
| | |
| Statements of Changes in Net Assets (concluded) | | |
| | | | | | | | | | | | | | | | |
| | | BlackRock
Total Return
Portfolio | | | BlackRock
U.S. Government Bond
Portfolio | |
| | | Year Ended December 31, | | | Year Ended December 31, | |
| Increase (Decrease) in Net Assets: | | 2015 | | | 2014 | | | 2015 | | | 2014 | |
| | | | | | | | | | | | | | | | |
| Operations | | | | | | | | | | | | | | | | |
Net investment income | | $ | 1,522,734 | | | $ | 2,024,622 | | | $ | 1,121,225 | | | $ | 1,382,806 | |
Net realized gain | | | 371,128 | | | | 1,760,262 | | | | 396,779 | | | | 2,384,231 | |
Net change in unrealized appreciation (depreciation) | | | (1,637,024 | ) | | | 946,047 | | | | (1,127,482 | ) | | | 732,092 | |
| | | | | | | | |
Net increase in net assets resulting from operations | | | 256,838 | | | | 4,730,931 | | | | 390,522 | | | | 4,499,129 | |
| | | | | | | | |
| | | | | | | | | | | | | | | | |
| Distributions to Shareholders From1 | | | | | | | | | | | | | | | | |
Net investment income | | | (1,656,708 | ) | | | (2,158,307 | ) | | | (1,474,856 | ) | | | (1,631,628 | ) |
| | | | | | | | |
| | | | | | | | | | | | | | | | |
| Capital Share Transactions | | | | | | | | | | | | | | | | |
Net decrease in net assets derived from capital share transactions | | | (4,666,858 | ) | | | (7,008,872 | ) | | | (7,578,112 | ) | | | (8,243,720 | ) |
| | | | | | | | |
| | | | | | | | | | | | | | | | |
| Net Assets | | | | | | | | | | | | | | | | |
Total decrease in net assets | | | (6,066,728 | ) | | | (4,436,248 | ) | | | (8,662,446 | ) | | | (5,376,219 | ) |
Beginning of year | | | 68,068,665 | | | | 72,504,913 | | | | 74,925,418 | | | | 80,301,637 | |
| | | | | | | | |
End of year | | $ | 62,001,937 | | | $ | 68,068,665 | | | $ | 66,262,972 | | | $ | 74,925,418 | |
| | | | | | | | |
Undistributed (distributions in excess of) net investment income, end of year | | $ | (44,265 | ) | | $ | (103,755 | ) | | $ | 223,960 | | | $ | 48,544 | |
| | | | | | | | |
| 1 | | Distributions for annual periods determined in accordance with federal income tax regulations. |
See Notes to Financial Statements.
| | | | | | |
| | | BLACKROCK SERIES FUND, INC. | | DECEMBER 31, 2015 | | 133 |
| | | | |
| Financial Highlights | | | BlackRock Balanced Capital Portfolio | |
| | | | | | | | | | | | | | | | | | | | |
| | | Year Ended December 31, | |
| | | 2015 | | | 2014 | | | 2013 | | | 2012 | | | 2011 | |
| | | | | | | | | | | | | | | | | | | | |
| Per Share Operating Performance | | | | | | | | | | | | | | | | | | | | |
Net asset value, beginning of year | | $ | 17.81 | | | $ | 18.26 | | | $ | 15.51 | | | $ | 14.33 | | | $ | 14.09 | |
| | | | |
Net investment income1 | | | 0.28 | | | | 0.33 | | | | 0.31 | | | | 0.36 | | | | 0.37 | |
Net realized and unrealized gain (loss) | | | (0.19 | ) | | | 1.67 | | | | 2.83 | | | | 1.19 | | | | 0.28 | |
| | | | |
Net increase from investment operations | | | 0.09 | | | | 2.00 | | | | 3.14 | | | | 1.55 | | | | 0.65 | |
| | | | |
Distributions from2: | | | | | | | | | | | | | | | | | | | | |
Net investment income | | | (0.30 | ) | | | (0.36 | ) | | | (0.35 | ) | | | (0.37 | ) | | | (0.41 | ) |
Net realized gain | | | (0.86 | ) | | | (2.09 | ) | | | (0.04 | ) | | | — | | | | — | |
| | | | |
Total distributions | | | (1.16 | ) | | | (2.45 | ) | | | (0.39 | ) | | | (0.37 | ) | | | (0.41 | ) |
| | | | |
Net asset value, end of year | | $ | 16.74 | | | $ | 17.81 | | | $ | 18.26 | | | $ | 15.51 | | | $ | 14.33 | |
| | | | |
| | | | | | | | | | | | | | | | | | | | |
| Total Return3 | | | | | | | | | | | | | | | | | | | | |
Based on net asset value | | | 0.52 | % | | | 11.07 | % | | | 20.29 | % | | | 10.79 | % | | | 4.58 | % |
| | | | |
| | | | �� | | | | | | | | | | | | | | | | |
| Ratios to Average Net Assets | | | | | | | | | | | | | | | | | | | | |
Total expenses | | | 0.61 | % | | | 0.57 | % | | | 0.61 | % | | | 0.55 | % | | | 0.45 | % |
| | | | |
Total expenses after fees waived and/or reimbursed | | | 0.50 | % | | | 0.48 | % | | | 0.51 | % | | | 0.48 | % | | | 0.44 | % |
| | | | |
Total expenses after fees waived and/or reimbursed and excluding interest expense | | | 0.49 | % | | | 0.47 | % | | | 0.49 | % | | | 0.47 | % | | | 0.44 | % |
| | | | |
Net investment income | | | 1.54 | % | | | 1.72 | % | | | 1.83 | % | | | 2.36 | % | | | 2.55 | % |
| | | | |
| | | | | | | | | | | | | | | | | | | | |
| Supplemental Data | | | | | | | | | | | | | | | | | | | | |
Net assets, end of year (000) | | $ | 499,439 | | | $ | 546,054 | | | $ | 537,641 | | | $ | 496,992 | | | $ | 499,851 | |
| | | | |
Portfolio turnover rate4 | | | 340 | % | | | 345 | % | | | 349 | % | | | 499 | % | | | 612 | % |
| | | | |
| | 1 | | Based on average shares outstanding. |
| | 2 | | Distributions for annual periods determined in accordance with federal income tax regulations. |
| | 3 | | Where applicable, excludes insurance-related fees and expenses and assumes the reinvestment of distributions. |
| | 4 | | Includes mortgage dollar roll transactions (“MDRs”). Additional information regarding portfolio turnover rate is as follows: |
| | | | | | | | | | | | | | | | | | | | |
| | | Year Ended December 31, | |
| | | 2015 | | | 2014 | | | 2013 | | | 2012 | | | 2011 | |
| | | | |
Portfolio turnover rate (excluding MDRs) | | | 240 | % | | | 259 | % | | | 252 | % | | | 398 | % | | | 415% | |
| | | | |
See Notes to Financial Statements.
| | | | | | |
| 134 | | BLACKROCK SERIES FUND, INC. | | DECEMBER 31, 2015 | | |
| | | | |
| Financial Highlights (continued) | | | BlackRock Capital Appreciation Portfolio | |
| | | | | | | | | | | | | | | | | | | | |
| | | Year Ended December 31, | |
| | | 2015 | | | 2014 | | | 2013 | | | 2012 | | | 2011 | |
| | | | | | | | | | | | | | | | | | | | |
| Per Share Operating Performance | | | | | | | | | | | | | | | | | | | | |
Net asset value, beginning of year | | $ | 34.75 | | | $ | 38.16 | | | $ | 28.43 | | | $ | 25.13 | | | $ | 27.72 | |
| | | | |
Net investment income1 | | | 0.05 | | | | 0.07 | | | | 0.08 | | | | 0.31 | | | | 0.17 | |
Net realized and unrealized gain (loss) | | | 2.45 | | | | 3.33 | | | | 9.74 | | | | 3.33 | | | | (2.57 | ) |
| | | | |
Net increase (decrease) from investment operations | | | 2.50 | | | | 3.40 | | | | 9.82 | | | | 3.64 | | | | (2.40 | ) |
| | | | |
Distributions from2: | | | | | | | | | | | | | | | | | | | | |
Net investment income | | | (0.05 | ) | | | (0.07 | ) | | | (0.09 | ) | | | (0.34 | ) | | | (0.19 | ) |
Net realized gain | | | (2.88 | ) | | | (6.74 | ) | | | — | | | | — | | | | — | |
| | | | |
Total distributions | | | (2.93 | ) | | | (6.81 | ) | | | (0.09 | ) | | | (0.34 | ) | | | (0.19 | ) |
| | | | |
Net asset value, end of year | | $ | 34.32 | | | $ | 34.75 | | | $ | 38.16 | | | $ | 28.43 | | | $ | 25.13 | |
| | | | |
| | | | | | | | | | | | | | | | | | | | |
| Total Return3 | | | | | | | | | | | | | | | | | | | | |
Based on net asset value | | | 7.09 | % | | | 9.12 | % | | | 34.53 | % | | | 14.48 | % | | | (8.66 | )% |
| | | | |
Ratios to Average Net Assets | | | | | | | | | | | | | | | | | | | | |
Total expenses | | | 0.61 | % | | | 0.60 | % | | | 0.62 | % | | | 0.56 | % | | | 0.45 | % |
| | | | |
Total expenses after fees waived and/or reimbursed | | | 0.51 | % | | | 0.51 | % | | | 0.53 | % | | | 0.50 | % | | | 0.44 | % |
| | | | |
Net investment income | | | 0.14 | % | | | 0.19 | % | | | 0.26 | % | | | 1.11 | % | | | 0.62 | % |
| | | | |
| | | | | | | | | | | | | | | | | | | | |
| Supplemental Data | | | | | | | | | | | | | | | | | | | | |
Net assets, end of year (000) | | $ | 156,722 | | | $ | 157,387 | | | $ | 158,051 | | | $ | 130,685 | | | $ | 132,310 | |
| | | | |
Portfolio turnover rate | | | 71 | % | | | 99 | % | | | 151 | % | | | 61 | % | | | 79 | % |
| | | | |
| | 1 | | Based on average shares outstanding. |
| | 2 | | Distributions for annual periods determined in accordance with federal income tax regulations. |
| | 3 | | Where applicable, excludes insurance-related fees and expenses and assumes the reinvestment of distributions. |
See Notes to Financial Statements.
| | | | | | |
| | | BLACKROCK SERIES FUND, INC. | | DECEMBER 31, 2015 | | 135 |
| | | | |
| Financial Highlights (continued) | | | BlackRock Global Allocation Portfolio | |
| | | | | | | | | | | | | | | | | | | | | | | | | |
| | | Year Ended December 31,1 |
| | | | | |
| | | 2015 | | 2014 | | 2013 | | 2012 | | 2011 |
| | | | | | | | | | | | | | | | | | | | | | | | | |
| Per Share Operating Performance | | | | | | | | | | | | | | | | | | | | | | | | | |
Net asset value, beginning of year | | | $ | 15.55 | | | | $ | 16.97 | | | | $ | 15.03 | | | | $ | 13.80 | | | | $ | 15.59 | |
| | | | | |
Net investment income2 | | | | 0.24 | | | | | 0.31 | | | | | 0.24 | | | | | 0.25 | | | | | 0.33 | |
Net realized and unrealized gain (loss) | | | | (0.35 | ) | | | | 0.12 | | | | | 2.00 | | | | | 1.19 | | | | | (0.86 | ) |
| | | | | |
Net increase (decrease) from investment operations | | | | (0.11 | ) | | | | 0.43 | | | | | 2.24 | | | | | 1.44 | | | | | (0.53 | ) |
| | | | | |
Distributions from3: | | | | | | | | | | | | | | | | | | | | | | | | | |
Net investment income | | | | (0.30 | ) | | | | (0.43 | ) | | | | (0.30 | ) | | | | (0.21 | ) | | | | (1.05 | ) |
Net realized gain | | | | (0.89 | ) | | | | (1.42 | ) | | | | — | | | | | — | | | | | — | |
Tax return of capital | | | | — | 4 | | | | — | | | | | — | | | | | — | | | | | (0.21 | ) |
| | | | | |
Total distributions | | | | (1.19 | ) | | | | (1.85 | ) | | | | (0.30 | ) | | | | (0.21 | ) | | | | (1.26 | ) |
| | | | | |
Net asset value, end of year | | | $ | 14.25 | | | | $ | 15.55 | | | | $ | 16.97 | | | | $ | 15.03 | | | | $ | 13.80 | |
| | | | | |
| | | | | | | | | | | | | | | | | | | | | | | | | |
| Total Return5 | | | | | | | | | | | | | | | | | | | | | | | | | |
Based on net asset value | | | | (0.74 | )% | | | | 2.52 | % | | | | 14.94 | % | | | | 10.46 | % | | | | (3.39 | )% |
| | | | | |
| | | | | | | | | | | | | | | | | | | | | | | | | |
| Ratios to Average Net Assets | | | | | | | | | | | | | | | | | | | | | | | | | |
Total expenses | | | | 0.77 | % | | | | 0.72 | % | | | | 0.69 | % | | | | 0.61 | % | | | | 0.47 | % |
| | | | | |
Total expenses after fees waived and/or reimbursed | | | | 0.58 | % | | | | 0.57 | % | | | | 0.56 | % | | | | 0.53 | % | | | | 0.44 | % |
| | | | | |
Total expenses after fees waived and/or reimbursed and excluding dividend expense, interest expense and stock loan fees | | | | 0.57 | % | | | | 0.57 | % | | | | 0.56 | % | | | | 0.53 | % | | | | 0.44 | % |
| | | | | |
Net investment income | | | | 1.52 | % | | | | 1.81 | % | | | | 1.49 | % | | | | 1.73 | % | | | | 2.04 | % |
| | | | | |
| | | | | | | | | | | | | | | | | | | | | | | | | |
| Supplemental Data | | | | | | | | | �� | | | | | | | | | | | | | | | | |
Net assets, end of year (000) | | | $ | 229,649 | | | | $ | 257,696 | | | | $ | 276,622 | | | | $ | 268,888 | | | | $ | 272,553 | |
| | | | | |
Portfolio turnover rate6 | | | | 89 | % | | | | 70 | % | | | | 56 | % | | | | 44 | % | | | | 65 | % |
| | | | | |
1 Consolidated Financial Highlights. 2 Based on average shares outstanding. 3 Distributions for annual periods determined in accordance with federal income tax regulations. 4 Amount is greater than $(0.005) per share. 5 Where applicable, excludes insurance-related fees and expenses and assumes the reinvestment of distributions. 6 Includes mortgage dollar roll transactions (“MDRs”). Additional information regarding portfolio turnover rate is as follows: | |
| | | | | Year Ended December 31, | | |
| | | | | |
| | | 2015 | | 2014 | | 2013 | | 2012 | | 2011 |
| | | | | |
Portfolio turnover rate (excluding MDRs) | | | | 87 | % | | | | 70 | % | | | | 56 | % | | | | 44 | % | | | | 65 | % |
| | | | | |
See Notes to Financial Statements.
| | | | | | |
| 136 | | BLACKROCK SERIES FUND, INC. | | DECEMBER 31, 2015 | | |
| | | | |
| Financial Highlights (continued) | | | BlackRock Government Money Market Portfolio | |
| | | | | | | | | | | | | | | | | | | | |
| | | Year Ended December 31, | |
| | | 2015 | | | 2014 | | | 2013 | | | 2012 | | | 2011 | |
| | | | | | | | | | | | | | | | | | | | |
| Per Share Operating Performance | | | | | | | | | | | | | | | | | | | | |
Net asset value, beginning of year | | $ | 1.00 | | | $ | 1.00 | | | $ | 1.00 | | | $ | 1.00 | | | $ | 1.00 | |
| | | | |
Net investment income | | | 0.0000 | 1 | | | 0.0000 | 1 | | | 0.0000 | 1 | | | 0.0000 | 1 | | | 0.0000 | 1 |
Net realized gain | | | 0.0001 | | | | 0.0001 | | | | 0.0000 | 1 | | | 0.0000 | 1 | | | 0.0000 | 1 |
| | | | |
Net increase from investment operations | | | 0.0001 | | | | 0.0001 | | | | 0.0000 | | | | 0.0000 | | | | 0.0000 | |
| | | | |
Distributions from2: | | | | | | | | | | | | | | | | | | | | |
Net investment income | | | (0.0000 | )3 | | | (0.0000 | )3 | | | (0.0000 | )3 | | | (0.0000 | )3 | | | (0.0000 | )3 |
Net realized gain | | | (0.0001 | ) | | | (0.0001 | ) | | | (0.0000 | )3 | | | (0.0000 | )3 | | | (0.0000 | )3 |
| | | | |
Total distributions | | | (0.0001 | ) | | | (0.0001 | ) | | | (0.0000 | ) | | | (0.0000 | ) | | | (0.0000 | ) |
| | | | |
Net asset value, end of year | | $ | 1.00 | | | $ | 1.00 | | | $ | 1.00 | | | $ | 1.00 | | | $ | 1.00 | |
| | | | |
| | | | | | | | | | | | | | | | | | | | |
| Total Return4 | | | | | | | | | | | | | | | | | | | | |
Based on net asset value | | | 0.01 | % | | | 0.01 | % | | | 0.00 | % | | | 0.00 | % | | | 0.00 | % |
| | | | |
| | | | | | | | | | | | | | | | | | | | |
| Ratios to Average Net Assets | | | | | | | | | | | | | | | | | | | | |
Total expenses | | | 0.54 | % | | | 0.49 | % | | | 0.55 | % | | | 0.50 | % | | | 0.43 | % |
| | | | |
Total expenses after fees waived and/or reimbursed | | | 0.22 | % | | | 0.23 | % | | | 0.25 | % | | | 0.29 | % | | | 0.29 | % |
| | | | |
Net investment income | | | 0.00 | % | | | 0.00 | % | | | 0.00 | % | | | 0.00 | % | | | 0.00 | % |
| | | | |
| | | | | | | | | | | | | | | | | | | | |
| Supplemental Data | | | | | | | | | | | | | | | | | | | | |
Net assets, end of year (000) | | $ | 125,641 | | | $ | 138,033 | | | $ | 148,485 | | | $ | 163,347 | | | $ | 195,061 | |
| | | | |
| | 1 | | Amount is less than $0.00005 per share. |
| | 2 | | Distributions for annual periods determined in accordance with federal income tax regulations. |
| | 3 | | Amount is greater than $(0.00005) per share. |
| | 4 | | Where applicable, excludes insurance-related fees and expenses and assumes the reinvestment of distributions. |
See Notes to Financial Statements.
| | | | | | |
| | | BLACKROCK SERIES FUND, INC. | | DECEMBER 31, 2015 | | 137 |
| | | | |
| Financial Highlights (continued) | | | BlackRock High Yield Portfolio | |
| | | | | | | | | | | | | | | | | | | | |
| | | Year Ended December 31, | |
| | | 2015 | | | 2014 | | | 2013 | | | 2012 | | | 2011 | |
| | | | | | | | | | | | | | | | | | | | |
| Per Share Operating Performance | | | | | | | | | | | | | | | | | | | | |
Net asset value, beginning of year | | $ | 5.44 | | | $ | 5.69 | | | $ | 5.50 | | | $ | 5.06 | | | $ | 5.33 | |
| | | | |
Net investment income1 | | | 0.28 | | | | 0.32 | | | | 0.34 | | | | 0.36 | | | | 0.38 | |
Net realized and unrealized gain (loss) | | | (0.52 | ) | | | (0.21 | ) | | | 0.21 | | | | 0.43 | | | | (0.27 | ) |
| | | | |
Net increase (decrease) from investment operations | | | (0.24 | ) | | | 0.11 | | | | 0.55 | | | | 0.79 | | | | 0.11 | |
| | | | |
Distributions from net investment income2 | | | (0.29 | ) | | | (0.36 | ) | | | (0.36 | ) | | | (0.35 | ) | | | (0.38 | ) |
| | | | |
Net asset value, end of year | | $ | 4.91 | | | $ | 5.44 | | | $ | 5.69 | | | $ | 5.50 | | | $ | 5.06 | |
| | | | |
| | | | | | | | | | | | | | | | | | | | |
| Total Return3 | | | | | | | | | | | | | | | | | | | | |
Based on net asset value | | | (4.65 | )% | | | 1.88 | % | | | 10.28 | % | | | 16.17 | % | | | 2.04 | % |
| | | | |
| | | | | | | | | | | | | | | | | | | | |
| Ratios to Average Net Assets | | | | | | | | | | | | | | | | | | | | |
Total expenses | | | 0.91 | % | | | 0.84 | % | | | 0.89 | % | | | 0.82 | % | | | 0.66 | % |
| | | | |
Total expenses after fees waived and/or reimbursed | | | 0.50 | % | | | 0.51 | % | | | 0.52 | % | | | 0.50 | % | | | 0.50 | % |
| | | | |
Total expenses after fees waived and/or reimbursed and excluding interest expense | | | 0.50 | % | | | 0.50 | % | | | 0.50 | % | | | 0.50 | % | | | 0.50 | % |
| | | | |
Net investment income | | | 5.30 | % | | | 5.54 | % | | | 6.01 | % | | | 6.72 | % | | | 7.18 | % |
| | | | |
| | | | | | | | | | | | | | | | | | | | |
| Supplemental Data | | | | | | | | | | | | | | | | | | | | |
Net assets, end of year (000) | | $ | 31,788 | | | $ | 39,081 | | | $ | 48,523 | | | $ | 49,756 | | | $ | 46,804 | |
| | | | |
Portfolio turnover rate | | | 84 | % | | | 78 | % | | | 102 | % | | | 102 | % | | | 96 | % |
| | | | |
| | 1 | | Based on average shares outstanding. |
| | 2 | | Distributions for annual periods determined in accordance with federal income tax regulations. |
| | 3 | | Where applicable, excludes insurance-related fees and expenses and assumes the reinvestment of distributions. |
See Notes to Financial Statements.
| | | | | | |
| 138 | | BLACKROCK SERIES FUND, INC. | | DECEMBER 31, 2015 | | |
| | | | |
| Financial Highlights (continued) | | | BlackRock Large Cap Core Portfolio | |
| | | | | | | | | | | | | | | | | | | | |
| | | Year Ended December 31, | |
| | | 2015 | | | 2014 | | | 2013 | | | 2012 | | | 2011 | |
| | | | | | | | | | | | | | | | | | | | |
| Per Share Operating Performance | | | | | | | | | | | | | | | | | | | | |
Net asset value, beginning of year | | $ | 28.11 | | | $ | 27.50 | | | $ | 20.70 | | | $ | 18.65 | | | $ | 18.42 | |
| | | | |
Net investment income1 | | | 0.32 | | | | 0.29 | | | | 0.27 | | | | 0.34 | | | | 0.25 | |
Net realized and unrealized gain (loss) | | | (0.15 | ) | | | 3.23 | | | | 6.82 | | | | 2.07 | | | | 0.23 | |
| | | | |
Net increase from investment operations | | | 0.17 | | | | 3.52 | | | | 7.09 | | | | 2.41 | | | | 0.48 | |
| | | | |
Distributions from2: | | | | | | | | | | | | | | | | | | | | |
Net investment income | | | (0.33 | ) | | | (0.32 | ) | | | (0.29 | ) | | | (0.36 | ) | | | (0.25 | ) |
Net realized gain | | | (1.42 | ) | | | (2.59 | ) | | | — | | | | — | | | | — | |
| | | | |
Total distributions | | | (1.75 | ) | | | (2.91 | ) | | | (0.29 | ) | | | (0.36 | ) | | | (0.25 | ) |
| | | | |
Net asset value, end of year | | $ | 26.53 | | | $ | 28.11 | | | $ | 27.50 | | | $ | 20.70 | | | $ | 18.65 | |
| | | | |
| | | | | | | | | | | | | | | | | | | | |
| Total Return3 | | | | | | | | | | | | | | | | | | | | |
Based on net asset value | | | 0.60 | % | | | 12.79 | % | | | 34.29 | % | | | 12.95 | % | | | 2.61 | % |
| | | | |
| | | | | | | | | | | | | | | | | | | | |
| Ratios to Average Net Assets | | | | | | | | | | | | | | | | | | | | |
Total expenses | | | 0.60 | % | | | 0.59 | % | | | 0.60 | % | | | 0.56 | % | | | 0.44 | % |
| | | | |
Total expenses after fees waived and/or reimbursed | | | 0.50 | % | | | 0.49 | % | | | 0.49 | % | | | 0.48 | % | | | 0.44 | % |
| | | | |
Net investment income | | | 1.14 | % | | | 1.03 | % | | | 1.12 | % | | | 1.69 | % | | | 1.32 | % |
| | | | |
| | | | | | | | | | | | | | | | | | | | |
| Supplemental Data | | | | | | | | | | | | | | | | | | | | |
Net assets, end of year (000) | | $ | 169,173 | | | $ | 184,854 | | | $ | 179,261 | | | $ | 151,411 | | | $ | 149,950 | |
| | | | |
Portfolio turnover rate | | | 31 | % | | | 47 | % | | | 39 | % | | | 115 | % | | | 104 | % |
| | | | |
| | 1 | | Based on average shares outstanding. |
| | 2 | | Distributions for annual periods determined in accordance with federal income tax regulations. |
| | 3 | | Where applicable, excludes insurance-related fees and expenses and assumes the reinvestment of distributions. |
See Notes to Financial Statements.
| | | | | | |
| | | BLACKROCK SERIES FUND, INC. | | DECEMBER 31, 2015 | | 139 |
| | | | |
| Financial Highlights (continued) | | | BlackRock Total Return Portfolio | |
| | | | | | | | | | | | | | | | | | | | | | | | | |
| | | Year Ended December 31, |
| | | 2015 | | 2014 | | 2013 | | 2012 | | 2011 |
| | | | | | | | | | | | | | | | | | | | | | | | | |
| Per Share Operating Performance | | | | | | | | | | | | | | | | | | | | | | | | | |
Net asset value, beginning of year | | | $ | 11.76 | | | | $ | 11.34 | | | | $ | 11.83 | | | | $ | 11.37 | | | | $ | 11.17 | |
| | | | | |
Net investment income1 | | | | 0.27 | | | | | 0.33 | | | | | 0.33 | | | | | 0.38 | | | | | 0.47 | |
Net realized and unrealized gain (loss) | | | | (0.23 | ) | | | | 0.45 | | | | | (0.45 | ) | | | | 0.49 | | | | | 0.22 | |
| | | | | |
Net increase (decrease) from investment operations | | | | 0.04 | | | | | 0.78 | | | | | (0.12 | ) | | | | 0.87 | | | | | 0.69 | |
| | | | | |
Distributions from net investment income2 | | | | (0.30 | ) | | | | (0.36 | ) | | | | (0.37 | ) | | | | (0.41 | ) | | | | (0.49 | ) |
| | | | | |
Net asset value, end of year | | | $ | 11.50 | | | | $ | 11.76 | | | | $ | 11.34 | | | | $ | 11.83 | | | | $ | 11.37 | |
| | | | | |
| | | | | | | | | | | | | | | | | | | | | | | | | |
| Total Return3 | | | | | | | | | | | | | | | | | | | | | | | | | |
Based on net asset value | | | | 0.29 | % | | | | 6.90 | % | | | | (1.05 | )% | | | | 7.78 | % | | | | 6.34 | % |
| | | | | |
| | | | | | | | | | | | | | | | | | | | | | | | | |
| Ratios to Average Net Assets | | | | | | | | | | | | | | | | | | | | | | | | | |
Total expenses | | | | 0.94 | % | | | | 0.84 | % | | | | 0.85 | % | | | | 0.80 | % | | | | 0.60 | % |
| | | | | |
Total expenses after fees waived and/or reimbursed and paid indirectly | | | | 0.54 | % | | | | 0.57 | % | | | | 0.53 | % | | | | 0.52 | % | | | | 0.53 | % |
| | | | | |
Total expenses after fees waived and/or reimbursed and paid indirectly and excluding interest expense | | | | 0.50 | % | | | | 0.50 | % | | | | 0.50 | % | | | | 0.50 | % | | | | 0.50 | % |
| | | | | |
Net investment income | | | | 2.33 | % | | | | 2.86 | % | | | | 2.85 | % | | | | 3.25 | % | | | | 4.28 | % |
| | | | | |
| | | | | | | | | | | | | | | | | | | | | | | | | |
| Supplemental Data | | | | | | | | | | | | | | | | | | | | | | | | | |
Net assets, end of year (000) | | | $ | 62,002 | | | | $ | 68,069 | | | | $ | 72,505 | | | | $ | 83,353 | | | | $ | 84,332 | |
| | | | | |
Portfolio turnover rate4 | | | | 783 | % | | | | 762 | % | | | | 806 | % | | | | 952 | % | | | | 1,237 | % |
| | | | | |
1 Based on average shares outstanding. 2 Distributions for annual periods determined in accordance with federal income tax regulations. 3 Where applicable, excludes insurance-related fees and expenses and assumes the reinvestment of distributions. 4 Includes mortgage dollar roll transactions (“MDRs”). Additional information regarding portfolio turnover rate is as follows: | |
| | | Year Ended December 31, |
| | | 2015 | | 2014 | | 2013 | | 2012 | | 2011 |
| | | | | | | | | | | | | | | | | | | | | | | | | |
| | | | | |
Portfolio turnover rate (excluding MDRs) | | | | 548 | % | | | | 556 | % | | | | 582 | % | | | | 731 | % | | | | 793 | % |
| | | | | |
See Notes to Financial Statements.
| | | | | | |
| 140 | | BLACKROCK SERIES FUND, INC. | | DECEMBER 31, 2015 | | |
| | | | |
| Financial Highlights (concluded) | | | BlackRock U.S. Government Bond Portfolio | |
| | | | | | | | | | | | | | | | | | | | | | | | | |
| | | Year Ended December 31, |
| | | 2015 | | 2014 | | 2013 | | 2012 | | 2011 |
| | | | | | | | | | | | | | | | | | | | | | | | | |
| Per Share Operating Performance | | | | | | | | | | | | | | | | | | | | | | | | | |
Net asset value, beginning of year | | | $ | 11.07 | | | | $ | 10.67 | | | | $ | 11.27 | | | | $ | 11.56 | | | | $ | 11.26 | |
| | | | | |
Net investment income1 | | | | 0.17 | | | | | 0.20 | | | | | 0.16 | | | | | 0.22 | | | | | 0.29 | |
Net realized and unrealized gain (loss) | | | | (0.11 | ) | | | | 0.43 | | | | | (0.49 | ) | | | | 0.07 | | | | | 0.43 | |
| | | | | |
Net increase (decrease) from investment operations | | | | 0.06 | | | | | 0.63 | | | | | (0.33 | ) | | | | 0.29 | | | | | 0.72 | |
| | | | | |
Distributions from2: | | | | | | | | | | | | | | | | | | | | | | | | | |
Net investment income | | | | (0.23 | ) | | | | (0.23 | ) | | | | (0.25 | ) | | | | (0.25 | ) | | | | (0.31 | ) |
Net realized gain | | | | — | | | | | — | | | | | — | | | | | (0.33 | ) | | | | (0.11 | ) |
Tax return of capital | | | | — | | | | | — | | | | | (0.02 | ) | | | | — | | | | | — | |
| | | | | |
Total distributions | | | | (0.23 | ) | | | | (0.23 | ) | | | | (0.27 | ) | | | | (0.58 | ) | | | | (0.42 | ) |
| | | | | |
Net asset value, end of year | | | $ | 10.90 | | | | $ | 11.07 | | | | $ | 10.67 | | | | $ | 11.27 | | | | $ | 11.56 | |
| | | | | |
| | | | | | | | | | | | | | | | | | | | | | | | | |
| Total Return3 | | | | | | | | | | | | | | | | | | | | | | | | | |
Based on net asset value | | | | 0.54 | % | | | | 5.95 | % | | | | (2.99 | )% | | | | 2.55 | % | | | | 6.54 | % |
| | | | | |
| | | | | | | | | | | | | | | | | | | | | | | | | |
| Ratios to Average Net Assets | | | | | | | | | | | | | | | | | | | | | | | | | |
Total expenses | | | | 0.81 | %4 | | | | 0.76 | % | | | | 0.78 | %4 | | | | 0.67 | % | | | | 0.53 | % |
| | | | | |
Total expenses after fees waived and/or reimbursed | | | | 0.53 | %4 | | | | 0.53 | % | | | | 0.50 | %4 | | | | 0.50 | % | | | | 0.50 | % |
| | | | | |
Total expenses after fees waived and/or reimbursed and excluding interest expense | | | | 0.50 | %4 | | | | 0.50 | % | | | | 0.50 | %4 | | | | 0.50 | % | | | | 0.50 | % |
| | | | | |
Net investment income | | | | 1.58 | %4 | | | | 1.79 | % | | | | 1.44 | %4 | | | | 1.86 | % | | | | 2.62 | % |
| | | | | |
| | | | | | | | | | | | | | | | | | | | | | | | | |
| Supplemental Data | | | | | | | | | | | | | | | | | | | | | | | | | |
Net assets, end of year (000) | | | $ | 66,263 | | | | $ | 74,925 | | | | $ | 80,302 | | | | $ | 99,492 | | | | $ | 107,890 | |
| | | | | |
Portfolio turnover rate5 | | | | 1,421 | % | | | | 1,374 | % | | | | 2,125 | % | | | | 1,572 | % | | | | 2,756 | % |
| | | | | |
1 Based on average shares outstanding. 2 Distributions for annual periods determined in accordance with federal income tax regulations. 3 Where applicable, excludes insurance-related fees and expenses and assumes the reinvestment of distributions. 4 Ratios do not include expenses incurred indirectly as a result of investments in underlying funds of approximately 0.01%. 5 Includes mortgage dollar roll transactions (“MDRs”). Additional information regarding portfolio turnover rate is as follows: | |
| | | Year Ended December 31, |
| | | 2015 | | 2014 | | 2013 | | 2012 | | 2011 |
| | | | | | | | | | | | | | | | | | | | | | | | | |
| | | | | |
Portfolio turnover rate (excluding MDRs) | | | | 891 | % | | | | 723 | % | | | | 1,614 | % | | | | 1,194 | % | | | | 1,937 | % |
| | | | | |
See Notes to Financial Statements.
| | | | | | |
| | | BLACKROCK SERIES FUND, INC. | | DECEMBER 31, 2015 | | 141 |
| | |
| Notes to Financial Statements | | |
1. Organization:
BlackRock Series Fund, Inc. (the “Company”) is registered under the Investment Company Act of 1940, as amended (the “1940 Act”), as an open-end management investment company. The following are referred to herein collectively as the “Funds” or individually, a “Fund”:
| | | | |
| Fund Name | | Herein Referred To As | | Diversification Classification |
BlackRock Balanced Capital Portfolio | | Balanced Capital | | Diversified |
BlackRock Capital Appreciation Portfolio | | Capital Appreciation | | Diversified |
BlackRock Global Allocation Portfolio | | Global Allocation | | Diversified |
BlackRock Government Money Market Portfolio | | Government Money Market | | Diversified |
BlackRock High Yield Portfolio | | High Yield | | Diversified |
BlackRock Large Cap Core Portfolio | | Large Cap Core | | Diversified |
BlackRock Total Return Portfolio | | Total Return | | Diversified |
BlackRock U.S. Government Bond Portfolio | | U.S. Government Bond | | Diversified |
Effective September 1, 2015, BlackRock Money Market Portfolio changed its name to BlackRock Government Money Market Portfolio.
The Company is organized as a Maryland corporation that is comprised of eight separate portfolios. The Funds offer shares to insurance companies for their separate accounts to fund benefits under certain variable annuity and variable life insurance contracts.
The Funds, together with certain other registered investment companies advised by BlackRock Advisors, LLC (the “Manager”) or its affiliates, are included in a complex of open-end funds referred to as the Equity-Bond Complex.
Basis of Consolidation: The accompanying consolidated financial statements of Global Allocation include the accounts of BlackRock Cayman Global Allocation Portfolio I, Ltd. (the “Subsidiary”), which is a wholly owned subsidiary of Global Allocation and primarily invests in commodity-related instruments. The Subsidiary enables the Fund to hold these commodity-related instruments and satisfy regulated investment company tax requirements. Global Allocation may invest up to 25% of its total assets in the Subsidiary. The net assets of the Subsidiary as of period end were $6,041,307, which is 2.6% of Global Allocation’s consolidated net assets. Intercompany accounts and transactions, if any, have been eliminated. The Subsidiary is subject to the same investment policies and restrictions that apply to Global Allocation, except that the Subsidiary may invest without limitation in commodity-related instruments.
2. Significant Accounting Policies:
The financial statements are prepared in conformity with accounting principles generally accepted in the United States of America (“U.S. GAAP”), which may require management to make estimates and assumptions that affect the reported amounts of assets and liabilities in the financial statements, disclosure of contingent assets and liabilities at the date of the financial statements and the reported amounts of increases and decreases in net assets from operations during the reporting period. Actual results could differ from those estimates. Each Fund is considered an investment company under U.S. GAAP and follows the accounting and reporting guidance applicable to investment companies. Below is a summary of significant accounting policies:
Foreign Currency: Each Fund’s books and records are maintained in U.S. dollars. Purchases and sales of investments are recorded at the rates of exchange prevailing on the respective dates of such transactions. Generally, when the U.S. dollar rises in value against a foreign currency, the investments denominated in that currency will lose value; the opposite effect occurs if the U.S. dollar falls in relative value.
Each Fund does not isolate changes in the exchange rates from the changes in the market prices of investments held or sold for financial reporting purposes. Accordingly, the effects of changes in exchange rates on investments are not segregated in the Statements of Operations from the effects of changes in market prices of those investments, but are included as a component of net realized and unrealized gain (loss) from investments. Each Fund reports realized currency gains (losses) on foreign currency related transactions as components of net realized gain (loss) for financial reporting purposes, whereas such components are generally treated as ordinary income for federal income tax purposes.
Segregation and Collateralization: In cases where a Fund enters into certain investments (e.g., dollar rolls, TBA sale commitments, financial futures contracts, forward foreign currency exchange contracts, options written, swaps and short sales), or certain borrowings (e.g., reverse repurchase agreements) that would be treated as “senior securities” for 1940 Act purposes, a Fund may segregate or designate on its books and records cash or liquid assets having a market value at least equal to the amount of its future obligations under such investments or borrowings. Doing so allows the investment or borrowing to be excluded from treatment as a “senior security.” Furthermore, if required by an exchange or counterparty agreement, the Funds may be required to deliver/deposit cash and/or securities to/with an exchange, or broker-dealer or custodian as collateral for certain investments or obligations.
Investment Transactions and Investment Income: For financial reporting purposes, investment transactions are recorded on the dates the transactions are entered into (the trade dates). Realized gains and losses on investment transactions are determined on the identified cost basis. Dividend income is recorded on the ex-dividend date. Dividends from foreign securities where the ex-dividend date may have passed are subsequently recorded when
| | | | | | |
| 142 | | BLACKROCK SERIES FUND, INC. | | DECEMBER 31, 2015 | | |
| | |
| Notes to Financial Statements (continued) | | |
the Funds are informed of the ex-dividend date. Under the applicable foreign tax laws, a withholding tax at various rates may be imposed on capital gains, dividends and interest. Upon notification from issuers, some of the dividend income received from a real estate investment trust may be redesignated as a reduction of cost of the related investment and/or realized gain. Interest income, including amortization and accretion of premiums and discounts on debt securities, is recognized on the accrual basis.
Distributions: For Government Money Market, distributions from net investment income are declared daily and paid monthly. Distributions are declared from the total of net investment income. For Balanced Capital, Capital Appreciation, Global Allocation and Large Cap Core, distributions from net investment income are declared and paid at least annually. For High Yield, Total Return and U.S. Government, distributions from net investment income are declared daily and paid monthly. For each Fund, distributions of capital gains are recorded on the ex-dividend dates.
Portions of return of capital distributions under U.S. GAAP may be taxed at ordinary income rates. The character of distributions is determined in accordance with federal income tax regulations, which may differ from U.S. GAAP. The portion of distributions that exceeds a Fund’s current and accumulated earnings and profits, as measured on a tax basis, constitute a non-taxable return of capital. Realized net capital gains can be offset by capital losses carried forward from prior years. However, certain Funds have capital loss carryforwards from pre-2012 tax years that offset realized net capital gains but do not offset current and accumulated earnings and profits. Consequently, if distributions in any tax year are less than the Fund’s current earnings and profits but greater than net investment income and net realized capital gains (taxable income), distributions in excess of taxable income are not treated as non-taxable return of capital, but rather may be taxable to shareholders at ordinary income rates. Under certain circumstances, taxable excess distributions could be significant. See Note 8, Income Tax Information, for the tax character of each Fund’s distributions paid during the period.
Net income and realized gains from investments held by the Subsidiary are treated as ordinary income for tax purposes. If a net loss is realized by the Subsidiary in any taxable year, the loss will generally not be available to offset the Fund’s ordinary income and/or capital gains for that year.
Indemnifications: In the normal course of business, a Fund enters into contracts that contain a variety of representations that provide general indemnification. A Fund’s maximum exposure under these arrangements is unknown because it involves future potential claims against a Fund, which cannot be predicted with any certainty.
Other: Expenses directly related to a Fund are charged to that Fund. Other operating expenses shared by several funds, including other funds managed by the Manager, are prorated among those funds on the basis of relative net assets or other appropriate methods.
The Funds have an arrangement with their custodian whereby fees may be reduced by credits earned on uninvested cash balances, which, if applicable, are shown as fees paid indirectly in the Statements of Operations. The custodian imposes fees on overdrawn cash balances, which can be offset by accumulated credits earned or may result in additional custody charges.
3. Investment Valuation and Fair Value Measurements:
Investment Valuation Policies: The Funds’ investments are valued at fair value (also referred to as “market value” within the financial statements) as of the close of trading on the New York Stock Exchange (“NYSE”) (generally 4:00 p.m., Eastern time). U.S. GAAP defines fair value as the price the Funds would receive to sell an asset or pay to transfer a liability in an orderly transaction between market participants at the measurement date. For all Funds except Government Money Market, the Funds determine the fair values of their financial instruments using independent dealers or pricing services under policies approved by the Board of Directors of the Fund (the “Board”). The BlackRock Global Valuation Methodologies Committee (the “Global Valuation Committee”) is the committee formed by management to develop global pricing policies and procedures and to provide oversight of the pricing function for the Funds for all financial instruments.
For Government Money Market, the Fund’s investments are valued under the amortized cost method which approximates current market value in accordance with Rule 2a-7 under the 1940 Act. Under this method, investments are valued at cost when purchased and, thereafter, a constant proportionate accretion of discounts and amortization of premiums are recorded until the maturity of the security. The Fund seeks to maintain its net asset value per share at $1.00, although there is no assurance that it will be able to do so on a continuing basis.
Fair Value Inputs and Methodologies: The following methods (or “techniques”) and inputs are used to establish the fair value of each Fund’s assets and liabilities:
| • | | Equity investments traded on a recognized securities exchange are valued at the official close price each day, if available. For equity investments traded on more than one exchange, the official close price on the exchange where the stock is primarily traded is used. Equity investments traded on a recognized exchange for which there were no sales on that day may be valued at the last available bid (long positions) or ask (short positions) price. |
| • | | Bond investments are valued on the basis of last available bid prices or current market quotations provided by dealers or pricing services. Floating rate loan interests are valued at the mean of the bid prices from one or more brokers or dealers as obtained from a pricing service. In determining |
| | | | | | |
| | | BLACKROCK SERIES FUND, INC. | | DECEMBER 31, 2015 | | 143 |
| | |
| Notes to Financial Statements (continued) | | |
| | the value of a particular investment, pricing services may use certain information with respect to transactions in such investments, quotations from dealers, pricing matrixes, market transactions in comparable investments, various relationships observed in the market between investments and calculated yield measures. Asset-backed and mortgage-backed securities are valued by independent pricing services using models that consider estimated cash flows of each tranche of the security, establish a benchmark yield and develop an estimated tranche-specific spread to the benchmark yield based on the unique attributes of the tranche. |
| • | | Generally, trading in foreign instruments is substantially completed each day at various times prior to the close of business on the NYSE. Occasionally, events affecting the values of such instruments may occur between the foreign market close and the close of business on the NYSE that may not be reflected in the computation of the Funds’ net assets. Each business day, the Funds use a pricing service to assist with the valuation of certain foreign exchange-traded equity securities and foreign exchange-traded and over-the-counter (“OTC”) options (the “Systematic Fair Value Price”). Using current market factors, the Systematic Fair Value Price is designed to value such foreign securities and foreign options at fair value as of the close of business on the NYSE, which follows the close of the local markets. |
| • | | Municipal investments (including commitments to purchase such investments on a “when-issued” basis) are valued on the basis of prices provided by dealers or pricing services. In determining the value of a particular investment, pricing services may use certain information with respect to transactions in such investments, quotations from dealers, pricing matrixes, market transactions in comparable investments and information with respect to various relationships between investments. |
| • | | To-be-announced (“TBA”) commitments are valued on the basis of last available bid prices or current market quotations provided by pricing services. |
| • | | Investments in open-end U.S. mutual funds are valued at NAV each business day. |
| • | | The Funds value their investment in BlackRock Liquidity Series, LLC, Money Market Series (the “Money Market Series”) at fair value, which is ordinarily based upon its pro rata ownership in the underlying fund’s net assets. The Money Market Series seeks current income consistent with maintaining liquidity and preserving capital. Although the Money Market Series is not registered under the 1940 Act, its investments may follow the parameters of investments by a money market fund that is subject to Rule 2a-7 under the 1940 Act. The Funds may withdraw up to 25% of its investment daily, although the manager of the Money Market Series, in its sole discretion, may permit an investor to withdraw more than 25% on any one day. |
| • | | Financial futures contracts traded on exchanges are valued at their last sale price. |
| • | | Securities and other assets and liabilities denominated in foreign currencies are translated into U.S. dollars using exchange rates determined as of the close of business on the NYSE. Forward foreign currency exchange contracts are valued at the mean between the bid and ask prices and are determined as of the close of business on the NYSE. Interpolated values are derived when the settlement date of the contract is an interim date for which quotations are not available. |
| • | | Exchange-traded options are valued at the mean between the last bid and ask prices at the close of the options market in which the options trade. An exchange-traded option for which there is no mean price is valued at the last bid (long positions) or ask (short positions) price. If no bid or ask price is available, the prior day’s price will be used, unless it is determined that the prior day’s price no longer reflects the fair value of the option. OTC options and options on swaps (“swaptions”) are valued by an independent pricing service using a mathematical model, which incorporates a number of market data factors, such as the trades and prices of the underlying instruments. |
| • | | Swap agreements are valued utilizing quotes received daily by the Funds’ pricing service or through brokers, which are derived using daily swap curves and models that incorporate a number of market data factors, such as discounted cash flows, trades and values of the underlying reference instruments. |
If events (e.g., a company announcement, market volatility or a natural disaster) occur that are expected to materially affect the value of such instruments, or in the event that the application of these methods of valuation results in a price for an investment that is deemed not to be representative of the market value of such investment, or if a price is not available, the investment will be valued by the Global Valuation Committee, or its delegate, in accordance with a policy approved by the Board as reflecting fair value (“Fair Valued Investments”). When determining the price for Fair Valued Investments, the Global Valuation Committee, or its delegate, seeks to determine the price that each Fund might reasonably expect to receive or pay from the current sale or purchase of that asset or liability in an arm’s-length transaction. Fair value determinations shall be based upon all available factors that the Global Valuation Committee, or its delegate, deems relevant consistent with the principles of fair value measurement which include the market approach, income approach and/or in the case of recent investments, the cost approach, as appropriate. The market approach generally consists of using comparable market transactions. The income approach generally is used to discount future cash flows to present value and is adjusted for liquidity as appropriate. These factors include but are not limited to: (i) attributes specific to the investment or asset; (ii) the principal market for the investment or asset; (iii) the customary participants in the principal market for the investment or asset; (iv) data assumptions by market participants for the investment or asset, if reasonably available; (v) quoted prices for similar investments or assets in active markets; and (vi) other factors, such as future cash flows, interest rates, yield curves, volatilities, prepayment speeds, loss severities, credit risks, recovery rates, liquidation amounts and/or default rates. Due to the inherent uncertainty of valuations of such investments, the fair values may differ from the values that would have been used had an active market existed. The Global Valuation Committee, or its delegate, employs various methods for calibrating valuation approaches for investments where an active market does not exist, including regular due diligence of the Funds’ pricing vendors, regular reviews of key inputs and
| | | | | | |
| 144 | | BLACKROCK SERIES FUND, INC. | | DECEMBER 31, 2015 | | |
| | |
| Notes to Financial Statements (continued) | | |
assumptions, transactional back-testing or disposition analysis to compare unrealized gains and losses to realized gains and losses, reviews of missing or stale prices and large movements in market values and reviews of any market related activity. The pricing of all Fair Value Investments is subsequently reported to the Board or a committee thereof on a quarterly basis.
Fair Value Hierarchy: Various inputs are used in determining the fair value of investments and derivative financial instruments. These inputs to valuation techniques are categorized into a fair value hierarchy consisting of three broad levels for financial statement purposes as follows:
| • | | Level 1 — unadjusted price quotations in active markets/exchanges for identical assets or liabilities that the Fund has the ability to access |
| • | | Level 2 — other observable inputs (including, but not limited to, quoted prices for similar assets or liabilities in markets that are active, quoted prices for identical or similar assets or liabilities in markets that are not active, inputs other than quoted prices that are observable for the assets or liabilities (such as interest rates, yield curves, volatilities, prepayment speeds, loss severities, credit risks and default rates) or other market–corroborated inputs) |
| • | | Level 3 — unobservable inputs based on the best information available in the circumstances, to the extent observable inputs are not available (including the Fund’s own assumptions used in determining the fair value of investments and derivative financial instruments) |
The hierarchy gives the highest priority to unadjusted quoted prices in active markets for identical assets or liabilities (Level 1 measurements) and the lowest priority to unobservable inputs (Level 3 measurements). Accordingly, the degree of judgment exercised in determining fair value is greatest for instruments categorized in Level 3. The inputs used to measure fair value may fall into different levels of the fair value hierarchy. In such cases, for disclosure purposes, the fair value hierarchy classification is determined based on the lowest level input that is significant to the fair value measurement in its entirety. The significant unobservable inputs used by the Global Valuation Committee in determining the price for Fair Valued Investments are typically categorized as Level 3. The fair value hierarchy for each Fund’s investments and derivative financial instruments have been included in the Schedules of Investments.
Changes in valuation techniques may result in transfers into or out of an assigned level within the hierarchy. In accordance with the Funds’ policy, transfers between different levels of the fair value hierarchy are deemed to have occurred as of the beginning of the reporting period. The categorization of a value determined for investments and derivative financial instruments is based on the pricing transparency of the investments and derivative financial instruments and is not necessarily an indication of the risks associated with investing in those securities.
4. Securities and Other Investments:
Asset-Backed and Mortgage-Backed Securities: Asset-backed securities are generally issued as pass-through certificates or as debt instruments. Asset-backed securities issued as pass-through certificates represent undivided fractional ownership interests in an underlying pool of assets. Asset-backed securities issued as debt instruments, which are also known as collateralized obligations, are typically issued as the debt of a special purpose entity organized solely for the purpose of owning such assets and issuing such debt. Asset-backed securities are often backed by a pool of assets representing the obligations of a number of different parties. The yield characteristics of certain asset-backed securities may differ from traditional debt securities. One such major difference is that all or a principal part of the obligations may be prepaid at any time because the underlying assets (i.e., loans) may be prepaid at any time. As a result, a decrease in interest rates in the market may result in increases in the level of prepayments as borrowers, particularly mortgagors, refinance and repay their loans. An increased prepayment rate with respect to an asset-backed security will have the effect of shortening the maturity of the security. In addition, a Fund may subsequently have to reinvest the proceeds at lower interest rates. If a Fund has purchased such an asset-backed security at a premium, a faster than anticipated prepayment rate could result in a loss of principal to the extent of the premium paid.
For mortgage pass-through securities (“Mortgage Assets”), there are a number of important differences among the agencies and instrumentalities of the U.S. Government that issue mortgage-related securities and among the securities that they issue. For example, mortgage-related securities guaranteed by Ginnie Mae are guaranteed as to the timely payment of principal and interest by Ginnie Mae and such guarantee is backed by the full faith and credit of the United States. However, mortgage-related securities issued by Freddie Mac and Fannie Mae, including Freddie Mac and Fannie Mae guaranteed mortgage pass-through certificates, which are solely the obligations of Freddie Mac and Fannie Mae, are not backed by or entitled to the full faith and credit of the United States, but are supported by the right of the issuer to borrow from the U.S. Treasury.
Non-agency mortgage-backed securities are securities issued by non-governmental issuers and have no direct or indirect government guarantees of payment and are subject to various risks. Non-agency mortgage loans are obligations of the borrowers thereunder only and are not typically insured or guaranteed by any other person or entity. The ability of a borrower to repay a loan is dependent upon the income or assets of the borrower. A number of factors, including a general economic downturn, acts of God, terrorism, social unrest and civil disturbances, may impair a borrower’s ability to repay its loans.
Collateralized Debt Obligations: Collateralized debt obligations (“CDOs”), which include collateralized bond obligations (“CBOs”) and collateralized loan obligations (“CLOs”), are types of asset-backed securities. A CDO is an entity that is backed by a diversified pool of debt securities (CBOs) or
| | | | | | |
| | | BLACKROCK SERIES FUND, INC. | | DECEMBER 31, 2015 | | 145 |
| | |
| Notes to Financial Statements (continued) | | |
syndicated bank loans (CLOs). The cash flows of the CDO can be split into multiple segments, called “tranches,” which will vary in risk profile and yield. The riskiest segment is the subordinated or “equity” tranche. This tranche bears the greatest risk of defaults from the underlying assets in the CDO and serves to protect the other, more senior, tranches from default in all but the most severe circumstances. Since it is shielded from defaults by the more junior tranches, a “senior” tranche will typically have higher credit ratings and lower yields than their underlying securities, and often receive investment grade ratings from one or more of the nationally recognized rating agencies. Despite the protection from the more junior tranches, senior tranches can experience substantial losses due to actual defaults, increased sensitivity to future defaults and the disappearance of one or more protecting tranches as a result of changes in the credit profile of the underlying pool of assets.
Inflation-Indexed Bonds: Inflation-indexed bonds are fixed income securities whose principal value is periodically adjusted according to the rate of inflation. If the index measuring inflation rises or falls, the principal value of inflation-indexed bonds will be adjusted upward or downward, and consequently the interest payable on these securities (calculated with respect to a larger or smaller principal amount) will be increased or reduced, respectively. Any upward or downward adjustment in the principal amount of an inflation-indexed bond will be included as interest income in the Statements of Operations, even though investors do not receive their principal until maturity. Repayment of the original bond principal upon maturity (as adjusted for inflation) is guaranteed in the case of U.S. Treasury inflation-indexed bonds. For bonds that do not provide a similar guarantee, the adjusted principal value of the bond repaid at maturity may be less than the original principal.
Multiple Class Pass-Through Securities: Multiple class pass-through securities, including collateralized mortgage obligations (“CMOs”) and commercial mortgage-backed securities may be issued by Ginnie Mae, U.S. Government agencies or instrumentalities or by trusts formed by private originators of, or investors in, mortgage loans. In general, CMOs are debt obligations of a legal entity that are collateralized by, a pool of residential or commercial mortgage loans or Mortgage Assets. The payments on these are used to make payments on the CMOs or multiple pass-through securities. Multiple class pass-through securities represent direct ownership interests in the Mortgage Assets. Classes of CMOs include interest only (“IOs”), principal only (“POs”), planned amortization classes and targeted amortization classes. IOs and POs are stripped mortgage-backed securities representing interests in a pool of mortgages, the cash flow from which has been separated into interest and principal components. IOs receive the interest portion of the cash flow while POs receive the principal portion. IOs and POs can be extremely volatile in response to changes in interest rates. As interest rates rise and fall, the value of IOs tends to move in the same direction as interest rates. POs perform best when prepayments on the underlying mortgages rise since this increases the rate at which the principal is returned and the yield to maturity on the PO. When payments on mortgages underlying a PO are slower than anticipated, the life of the PO is lengthened and the yield to maturity is reduced. If the underlying Mortgage Assets experience greater than anticipated pre-payments of principal, a Fund’s initial investment in the IOs may not fully recoup.
Stripped Mortgage-Backed Securities: Stripped mortgage-backed securities issued by the U.S. Government, its agencies and instrumentalities. Stripped mortgage-backed securities are usually structured with two classes that receive different proportions of the interest (IOs) and principal (POs) distributions on a pool of Mortgage Assets. A Fund also may invest in stripped mortgage-backed securities that are privately issued.
Zero-Coupon Bonds: Zero-coupon bonds, are normally issued at a significant discount from face value and do not provide for periodic interest payments. These bonds may experience greater volatility in market value than other debt obligations of similar maturity which provide for regular interest payments.
Capital Securities and Trust Preferred Securities: Capital securities, including trust preferred securities are typically issued by corporations, generally in the form of interest-bearing notes with preferred securities characteristics, or in the case of trust preferred securities, by an affiliated business trust of a corporation, generally in the form of beneficial interests in subordinated debentures or similarly structured securities. The securities can be structured as either fixed or adjustable coupon securities that can have either a perpetual or stated maturity date. For trust preferred securities, the issuing bank or corporation pays interest to the trust, which is then distributed to holders of the trust preferred securities as a dividend. Dividends can be deferred without creating an event of default or acceleration, although maturity cannot take place unless all cumulative payment obligations have been met. The deferral of payments does not affect the purchase or sale of these securities in the open market. Payments on these securities are treated as interest rather than dividends for federal income tax purposes. These securities generally are rated below that of the issuing company’s senior debt securities and are freely callable at the issuer’s option.
Preferred Stock: Preferred stock has a preference over common stock in liquidation (and generally in receiving dividends as well) but is subordinated to the liabilities of the issuer in all respects. As a general rule, the market value of preferred stock with a fixed dividend rate and no conversion element varies inversely with interest rates and perceived credit risk, while the market price of convertible preferred stock generally also reflects some element of conversion value. Because preferred stock is junior to debt securities and other obligations of the issuer, deterioration in the credit quality of the issuer will cause greater changes in the value of a preferred stock than in a more senior debt security with similar stated yield characteristics. Unlike interest payments on debt securities, preferred stock dividends are payable only if declared by the issuer’s board of directors. Preferred stock also may be subject to optional or mandatory redemption provisions.
| | | | | | |
| 146 | | BLACKROCK SERIES FUND, INC. | | DECEMBER 31, 2015 | | |
| | |
| Notes to Financial Statements (continued) | | |
Warrants: Warrants entitle a Fund to purchase a specified number of shares of common stock and are non-income producing. The purchase price and number of shares are subject to adjustment under certain conditions until the expiration date of the warrants, if any. If the price of the underlying stock does not rise above the exercise price before the warrant expires, the warrant generally expires without any value and a Fund will lose any amount it paid for the warrant. Thus, investments in warrants may involve more risk than investments in common stock. Warrants may trade in the same markets as their underlying stock; however, the price of the warrant does not necessarily move with the price of the underlying stock.
Floating Rate Loan Interests: Floating rate loan interests are typically issued to companies (the “borrower”) by banks, other financial institutions, or privately and publicly offered corporations (the “lender”). Floating rate loan interests are generally non-investment grade, often involve borrowers whose financial condition is troubled or uncertain and companies that are highly leveraged. A Fund may invest in obligations of borrowers who are in bankruptcy proceedings. In addition, transactions in floating rate loan interests may settle on a delayed basis, which may result to proceeds from the sale to not be readily available for a Fund to make additional investments or meet its redemption obligations. Floating rate loan interests may include fully funded term loans or revolving lines of credit. Floating rate loan interests are typically senior in the corporate capital structure of the borrower. Floating rate loan interests generally pay interest at rates that are periodically determined by reference to a base lending rate plus a premium. The base lending rates are generally the lending rate offered by one or more European banks, such as the London Interbank Offered Rate (“LIBOR”), the prime rate offered by one or more U.S. banks or the certificate of deposit rate. Floating rate loan interests may involve foreign borrowers, and investments may be denominated in foreign currencies. These investments are treated as investments in debt securities for purposes of a Fund’s investment policies.
When a Fund purchases a floating rate loan interest, it may receive a facility fee and when it sells a floating rate loan interest, it may pay a facility fee. On an ongoing basis, a Fund may receive a commitment fee based on the undrawn portion of the underlying line of credit amount of a floating rate loan interest. Facility and commitment fees are typically amortized to income over the term of the loan or term of the commitment, respectively. Consent and amendment fees are recorded to income as earned. Prepayment penalty fees, which may be received by a Fund upon the prepayment of a floating rate loan interest by a borrower, are recorded as realized gains. A Fund may invest in multiple series or tranches of a loan. A different series or tranche may have varying terms and carry different associated risks.
Floating rate loan interests are usually freely callable at the borrower’s option. A Fund may invest in such loans in the form of participations in loans (“Participations”) or assignments (“Assignments”) of all or a portion of loans from third parties. Participations typically will result in a Fund having a contractual relationship only with the lender, not with the borrower. A Fund has the right to receive payments of principal, interest and any fees to which it is entitled only from the lender selling the Participation and only upon receipt by the lender of the payments from the borrower. In connection with purchasing Participations, a Fund generally will have no right to enforce compliance by the borrower with the terms of the loan agreement, nor any rights of offset against the borrower. A Fund may not benefit directly from any collateral supporting the loan in which it has purchased the Participation. As a result, a Fund assumes the credit risk of both the borrower and the lender that is selling the Participation. A Fund’s investment in loan participation interests involves the risk of insolvency of the financial intermediaries who are parties to the transactions. In the event of the insolvency of the lender selling the Participation, a Fund may be treated as a general creditor of the lender and may not benefit from any offset between the lender and the borrower. Assignments typically result in a Fund having a direct contractual relationship with the borrower, and a Fund may enforce compliance by the borrower with the terms of the loan agreement.
Forward Commitments and When-Issued Delayed Delivery Securities: Certain Funds may purchase securities on a when-issued basis and may purchase or sell securities on a forward commitment basis. Settlement of such transactions normally occurs within a month or more after the purchase or sale commitment is made. A Fund may purchase securities under such conditions with the intention of actually acquiring them, but may enter into a separate agreement to sell the securities before the settlement date. Since the value of securities purchased may fluctuate prior to settlement, the Fund may be required to pay more at settlement than the security is worth. In addition, the Fund is not entitled to any of the interest earned prior to settlement. When purchasing a security on a delayed delivery basis, a Fund assumes the rights and risks of ownership of the security, including the risk of price and yield fluctuations. In the event of default by the counterparty, the Fund’s maximum amount of loss is the unrealized appreciation of unsettled when-issued transactions.
TBA Commitments: TBA commitments are forward agreements for the purchase or sale of mortgage-backed securities for a fixed price, with payment and delivery on an agreed upon future settlement date. The specific securities to be delivered are not identified at the trade date. However, delivered securities must meet specified terms, including issuer, rate and mortgage terms. When entering into TBA commitments, a Fund may take possession of or deliver the underlying mortgage-backed securities but can extend the settlement or roll the transaction. TBA commitments involve a risk of loss if the value of the security to be purchased or sold declines or increases, respectively, prior to settlement date.
In order to better define contractual rights and to secure rights that will help a Fund mitigate its counterparty risk, TBA commitments may be entered into by a Fund under Master Securities Forward Transaction Agreements (each, an “MSFTA”). An MSFTA typically contains, among other things, collateral posting terms and netting provisions in the event of default and/or termination event. The collateral requirements are typically calculated by netting the mark-to-market amount for each transaction under such agreement and comparing that amount to the value of the collateral currently pledged by a Fund and the counterparty. Cash collateral that has been pledged to cover the obligations of a Fund and cash collateral received from the
| | | | | | |
| | | BLACKROCK SERIES FUND, INC. | | DECEMBER 31, 2015 | | 147 |
| | |
| Notes to Financial Statements (continued) | | |
counterparty, if any, is reported separately on the Statements of Assets and Liabilities as cash pledged as collateral for TBA commitments or cash received as collateral for TBA commitments, respectively. Non-cash collateral pledged by a Fund, if any, is noted in the Schedules of Investments. Typically, a Fund is permitted to sell, repledge or use the collateral it receives; however, the counterparty is not permitted to do so. To the extent amounts due to a Fund are not fully collateralized, contractually or otherwise, a Fund bears the risk of loss from counterparty non-performance.
Mortgage Dollar Roll Transactions: Certain Funds may sell TBA mortgage-backed securities and simultaneously contract to repurchase substantially similar (i.e., same type, coupon and maturity) securities on a specific future date at an agreed upon price. During the period between the sale and repurchase, the Fund is not entitled to receive interest and principal payments on the securities sold. Mortgage dollar roll transactions are treated as purchases and sales and realize gains and losses on these transactions. Mortgage dollar rolls involve the risk that the market value of the securities that the Fund is required to purchase may decline below the agreed upon repurchase price of those securities.
Commitments: Certain Funds may enter into commitments, or agreements, to acquire an investment at a future date (subject to certain conditions) in connection with a potential public or non-public offering. Such agreements may obligate the Fund to make future cash payments. As of December 31, 2015, High Yield had an outstanding commitment of $1,080,000 in connection with the Chapter 11 cases of Energy Future Holdings Corp., et al. This commitment is not included in the net assets of High Yield as of December 31, 2015.
Repurchase Agreements: Repurchase agreements are commitments to purchase a security from a counterparty who agrees to repurchase the same security at a mutually agreed upon date and price. On a daily basis, the counterparty is required to maintain eligible collateral subject to the agreement and in value no less than the agreed repurchase amount. Pursuant to the custodial undertaking associated with a tri-party repo arrangement, an unaffiliated third party custodian maintains accounts to hold collateral for a Fund and its counterparties. Typically, a Fund and counterparty are not permitted to sell, re-pledge or use the collateral absent a default by the counterparty or a Fund, respectively.
In the event the counterparty defaults and the fair value of the collateral declines, a Fund could experience losses, delays and costs in liquidating the collateral.
Repurchase agreements are entered into by a Fund under Master Repurchase Agreements (each, an “MRA”). The MRA permits a Fund, under certain circumstances including an event of default (such as bankruptcy or insolvency), to offset payables and/or receivables with collateral held by and/or posted to the counterparty. As a result, one single net payment is created. Bankruptcy or insolvency laws of a particular jurisdiction may impose restrictions on or prohibitions against such a right of offset in the event of the MRA counterparty’s bankruptcy or insolvency. Based on the terms of the MRA, a Fund receives securities as collateral with a market value in excess of the repurchase price at maturity. Upon a bankruptcy or insolvency of the MRA counterparty, a Fund would recognize a liability with respect to such excess collateral. The liability reflects a Fund’s obligation under bankruptcy law to return the excess to the counterparty.
Borrowed Bond Agreements: Repurchase agreements may be referred to as borrowed bond agreements when entered into in connection with short sales of bonds. In a borrowed bond agreement, a Fund borrows a bond from a counterparty in exchange for cash collateral. The agreement contains a commitment that the security and the cash will be returned to the counterparty and a Fund at a mutually agreed upon date. Certain agreements have no stated maturity and can be terminated by either party at any time. Earnings on cash collateral and compensation to the lender of the bond are based on agreed upon rates between a Fund and the counterparty. The value of the underlying cash collateral approximates the market value and accrued interest of the borrowed bond. To the extent that a borrowed bond transaction exceeds one business day, the value of the cash collateral in the possession of the counterparty is monitored on a daily basis to ensure the adequacy of the collateral. As the market value of the borrowed bond changes, the cash collateral is periodically increased or decreased with a frequency and in amounts prescribed in the borrowed bond agreement. A Fund may also experience delays in gaining access to the collateral.
Reverse Repurchase Agreements: Reverse repurchase agreements are agreements with qualified third party broker-dealers in which a Fund sells securities to a bank or broker-dealer and agrees to repurchase the same securities at a mutually agreed upon date and price. A Fund receives cash from the sale to use for other investment purposes. During the term of the reverse repurchase agreement, a Fund continues to receive the principal and interest payments on the securities sold. Certain agreements have no stated maturity and can be terminated by either party at any time. Interest on the value of the reverse repurchase agreements issued and outstanding is based upon competitive market rates determined at the time of issuance. A Fund may utilize reverse repurchase agreements when it is anticipated that the interest income to be earned from the investment of the proceeds of the transaction is greater than the interest expense of the transaction. Reverse repurchase agreements involve leverage risk. If a Fund suffers a loss on its investment of the transaction proceeds from a reverse repurchase agreement, a Fund would still be required to pay the full repurchase price. Further, a Fund remains subject to the risk that the market value of the securities repurchased declines below the repurchase price. In such cases, a Fund would be required to return a portion of the cash received from the transaction or provide additional securities to the counterparty.
Cash received in exchange for securities delivered plus accrued interest due to the counterparty is recorded as a liability in the Statements of Assets and Liabilities at face value including accrued interest. Due to the short-term nature of the reverse repurchase agreements, face value approximates
| | | | | | |
| 148 | | BLACKROCK SERIES FUND, INC. | | DECEMBER 31, 2015 | | |
| | |
| Notes to Financial Statements (continued) | | |
fair value. Interest payments made by a Fund to the counterparties are recorded as a component of interest expense in the Statements of Operations. In periods of increased demand for the security, the Fund may receive a fee for use of the security by the counterparty, which may result in interest income to a Fund.
For the year ended December 31, 2015, the average amount of reverse repurchase agreements and the daily weighted average interest rate for the Funds were as follows:
| | | | | | | | | | | | |
| | | Balanced Capital | | | Total Return | | | U.S. Government
Bond | |
Average Borrowings | | | $8,693,661 | | | | $6,736,741 | | | | $18,230,123 | |
Daily Weighted Average Interest Rate | | | (0.19)% | | | | (0.09 | )% | | | (0.11)% | |
Borrowed bond agreements and reverse repurchase transactions are entered into by a Fund under Master Repurchase Agreements (each, an “MRA”), which permit the Fund, under certain circumstances, including an event of default (such as bankruptcy or insolvency), to offset payables and/or receivables under the MRA with collateral held and/or posted to the counterparty and create one single net payment due to or from the Fund. With reverse repurchase transactions, typically, the Fund and counterparty under an MRA are permitted to sell, re-pledge, or use the collateral associated with the transaction. Bankruptcy or insolvency laws of a particular jurisdiction may impose restrictions on or prohibitions against such a right of offset in the event of the MRA counterparty’s bankruptcy or insolvency. Pursuant to the terms of the MRA, the Fund receives or posts securities as collateral with a market value in excess of the repurchase price to be paid or received by the Fund upon the maturity of the transaction. Upon a bankruptcy or insolvency of the MRA counterparty, the Fund is considered an unsecured creditor with respect to excess collateral and, as such, the return of excess collateral may be delayed.
As of period end, the following table is a summary of the Funds’ open borrowed bond agreements and reverse repurchase agreements by counterparty which are subject to offset under an MRA on a net basis:
| | | | | | | | | | | | | | | | | | | | | | | | | | | | | | | | | | | |
| Counterparty | | Borrowed Bond Agreements1 | | Reverse Repurchase Agreements | | Borrowed Bonds at Value Including Accrued Interest2 | | Net Amount before Collateral | | Non-cash Collateral Pledged | | Net Collateral Pledged | | Net Exposure Due (to)/from Counterparty3 |
Balanced Capital | | | | | | | | | | | | | | | | | | | | | | | | | | | | | | | | | | | |
Barclays Capital, Inc. | | | | $ 94,166 | | | | | — | | | | | $ (94,283 | ) | | | | $ (117 | ) | | | | — | | | | | — | | | | | $ (117 | ) |
Deutsche Bank Securities, Inc. | | | | 49,688 | | | | | $ (7,741,100 | ) | | | | (49,966 | ) | | | | (7,741,378 | ) | | | | $ 7,708,803 | | | | | $ 7,708,803 | | | | | (32,575 | ) |
Merrill Lynch, Pierce, Fenner & Smith, Inc. | | | | 5,550,931 | | | | | — | | | | | (5,558,531 | ) | | | | (7,600 | ) | | | | — | | | | | — | | | | | (7,600 | ) |
| | | | | |
Total | | | | $5,694,785 | | | | | $ (7,741,100 | ) | | | | $(5,702,780 | ) | | | | $ (7,749,095 | ) | | | | $ 7,708,803 | | | | | $ 7,708,803 | | | | | $(40,292 | ) |
| | | | | |
| | | | | | | | | | | | | | | | | | | | | | | | | | | | | | | | | | | |
| | | | | | | | | | | | | | | | | | | | | | | | | | | | | | | | | | | | |
Total Return | | | | | | | | | | | | | | | | | | | | | | | | | | | | | | | | | | | |
Barclays Capital, Inc. | | | | $ 27,580 | | | | | — | | | | | $ (27,618 | ) | | | | $ (38 | ) | | | | — | | | | | — | | | | | $ (38 | ) |
Deutsche Bank Securities, Inc. | | | | 24,844 | | | | | — | | | | | (24,989 | ) | | | | (145 | ) | | | | — | | | | | — | | | | | (145 | ) |
J.P. Morgan Securities LLC | | | | — | | | | | $ (2,772,239 | ) | | | | — | | | | | (2,772,239 | ) | | | | $ 2,772,239 | | | | | $ 2,772,239 | | | | | — | |
Merrill Lynch, Pierce, Fenner & Smith, Inc. | | | | 1,914,419 | | | | | (3,867,125 | ) | | | | (1,917,357 | ) | | | | (3,870,063 | ) | | | | 3,870,063 | | | | | 3,870,063 | | | | | — | |
| | | | | |
Total | | | | $1,966,843 | | | | | $ (6,639,364 | ) | | | | $(1,969,964 | ) | | | | $ (6,642,485 | ) | | | | $ 6,642,302 | | | | | $ 6,642,302 | | | | | $ (183 | ) |
| | | | | |
| | | | | | | | | | | | | | | | | | | | | | | | | | | | | | | | | | | |
| | | | | | | | | | | | | | | | | | | | | | | | | | | | | | | | | | | | |
U.S. Government Bond | | | | | | | | | | | | | | | | | | | | | | | | | | | | | | | | | | | |
BNP Paribas Securities Corp. | | | | — | | | | | $ (5,600,615 | ) | | | | — | | �� | | | $ (5,600,615 | ) | | | | $ 5,589,187 | | | | | $ 5,589,187 | | | | | $(11,428 | ) |
Credit Suisse Securities (USA) LLC | | | | — | | | | | (4,612,187 | ) | | | | — | | | | | (4,612,187 | ) | | | | 4,604,706 | | | | | 4,604,706 | | | | | (7,481 | ) |
Deutsche Bank Securities, Inc. | | | | $ 659,113 | | | | | — | | | | | $ (660,636 | ) | | | | (1,523 | ) | | | | — | | | | | — | | | | | (1,523 | ) |
Merrill Lynch, Pierce, Fenner & Smith, Inc. | | | | — | | | | | (5,639,029 | ) | | | | — | | | | | (5,639,029 | ) | | | | 5,639,029 | | | | | 5,639,029 | | | | | — | |
| | | | | |
Total | | | | $ 659,113 | | | | | $(15,851,831 | ) | | | | $ (660,636 | ) | | | | $(15,853,354 | ) | | | | $15,832,922 | | | | | $15,832,922 | | | | | $(20,432 | ) |
| | | | | |
| | 1 | | Included in Investments at value-unaffiliated in the Statements of Assets and Liabilities. |
| | 2 | | Includes accrued interest on borrowed bonds in the amount of $43,263 and $15,260 and $1,413, for Balanced Capital, Total Return and U.S. Government Bond, respectively, which is included in interest expense payable in the Statements of Assets and Liabilities. |
| | 3 | | Net exposure represents the net receivable (payable) that would be due from/to the counterparty in the event of default. |
In the event the counterparty of securities under an MRA files for bankruptcy or becomes insolvent, a Fund’s use of the proceeds of the agreement may be restricted while the other party, or its trustee or receiver, determines whether or not to enforce the Fund’s obligation to repurchase the securities.
Short Sales: Certain Funds may enter into short sale transactions in which a Fund sells a security it does not hold in anticipation of a decline in the market price of that security. When the Fund makes a short sale, it will borrow the security sold short from a broker/counterparty and deliver the security to the purchaser. To close out a short position, the Fund delivers the same security to the broker and records a liability to reflect the obligation to return the security to the broker. The amount of the liability is subsequently marked-to-market to reflect the market value of the short sale. The
| | | | | | |
| | | BLACKROCK SERIES FUND, INC. | | DECEMBER 31, 2015 | | 149 |
| | |
| Notes to Financial Statements (continued) | | |
Fund maintains a segregated account of securities or deposits cash with the broker-dealer as collateral for the short sales. Cash deposited with the broker is recorded as an asset in the Statements of Assets and Liabilities. Securities segregated as collateral are denoted in the Schedules of Investments. The Fund may pay a financing fee for the difference between the market value of the short position and the cash collateral deposited with the broker which would be recorded as interest expense. The Fund is required to repay the counterparty any dividends received on the security sold short, which is shown as dividend expense in the Statements of Operations. The Fund may pay a fee on the assets borrowed from the counterparty, which is shown as stock loan fees in the Statements of Operations. The Funds are exposed to market risk based on the amount, if any, that the market value of the security increases beyond the market value at which the position was sold. Thus, a short sale of a security involves the risk that instead of declining, the price of the security sold short will rise. The short sale of securities involves the possibility of a theoretically unlimited loss since there is a theoretically unlimited potential for the market price of the security sold short to increase. A gain, limited to the price at which the Funds sold the security short, or a loss, unlimited as to the dollar amount, will be recognized upon the termination of a short sale if the market price is either less than or greater than the proceeds originally received. There is no assurance the Funds will be able to close out a short position at a particular time or at an acceptable price.
Securities Lending: Certain Funds may lend their securities to approved borrowers, such as brokers, dealers and other financial institutions. The borrower pledges and maintains with the Funds collateral consisting of cash, an irrevocable letter of credit issued by a bank, or securities issued or guaranteed by the U.S. Government. The initial collateral received by each Fund is required to have a value of at least 102% of the current value of the loaned securities for securities traded on U.S. exchanges and a value of at least 105% for all other securities. The collateral is maintained thereafter, at a value equal to at least 100% of the current market value of the securities on loan. The market value of the loaned securities is determined at the close of each business day of the Fund and any additional required collateral is delivered to the Fund, or excess collateral returned by the Fund, on the next business day. During the term of the loan, each Fund is entitled to all distributions made on or in respect of the loaned securities. Loans of securities are terminable at any time and the borrower, after notice, is required to return borrowed securities within the standard time period for settlement of securities transactions.
The market value of any securities on loan, all of which were classified as common stocks in the Funds’ Schedules of Investments, and the value of any related collateral are shown separately in the Statements of Assets and Liabilities as a component of investments at value — unaffiliated, and collateral on securities loaned at value, respectively. As of period end, any securities on loan were collateralized by cash. The cash collateral invested by the securities lending agent, BlackRock Investment Management, LLC (“BIM”), if any, is disclosed in the Schedules of Investments.
Securities lending transactions are entered into by the Funds under Master Securities Lending Agreements (each, an “MSLA”), which provide the right, in the event of default (including bankruptcy or insolvency), for the non-defaulting party to liquidate the collateral and calculate a net exposure to the defaulting party or request additional collateral. In the event that a borrower defaults, the Funds, as lender, would offset the market value of the collateral received against the market value of the securities loaned. When the value of the collateral is greater than that of the market value of the securities loaned, the lender is left with a net amount payable to the defaulting party. However, bankruptcy or insolvency laws of a particular jurisdiction may impose restrictions on or prohibitions against such a right of offset in the event of an MSLA counterparty’s bankruptcy or insolvency. Under the MSLA, absent an event of default the borrower can resell or re-pledge the loaned securities, and a Fund can reinvest cash collateral received in connection with loaned securities. Upon an event of default, the parties’ obligations to return the securities or collateral to the other party are extinguished, and the parties can resell or re-pledge the loaned securities or the collateral received in connection with the loaned securities in order to satisfy the defaulting party’s net payment obligation for all transactions under the MSLA. The defaulting party remains liable for any deficiency.
As of period end, the following tables are a summary of the Funds’ securities lending agreements by counterparty which are subject to offset under an MSLA:
| | | | | | | | | | |
Balanced Capital | | | | | | | | | | |
| Counterparty | | Securities Loaned at Value | | | Cash Collateral Received1 | | | Net Amount |
Citigroup Global Markets, Inc. | | | $ 921,906 | | | | $ (921,906 | ) | | — |
Credit Suisse Securities (USA) LLC | | | 317,130 | | | | (317,130 | ) | | — |
Goldman Sachs & Co. | | | 321,728 | | | | (321,728 | ) | | — |
JP Morgan Securities LLC | | | 1,178,731 | | | | (1,178,731 | ) | | — |
State Street Bank and Trust Co. | | | 1,109,743 | | | | (1,109,743 | ) | | — |
| | | |
Total | | | $3,849,238 | | | | $(3,849,238 | ) | | — |
| | | |
| | 1 | | Collateral with a value of $3,964,938 has been received by Balanced Capital in connection with securities lending agreements. Collateral received in excess of the value of securities loaned from the individual counterparty is not shown for financial reporting purposes. |
| | | | | | |
| 150 | | BLACKROCK SERIES FUND, INC. | | DECEMBER 31, 2015 | | |
| | |
| Notes to Financial Statements (continued) | | |
| | | | | | | | | | |
| Capital Appreciation | | | | | | | | |
| Counterparty | | Securities
Loaned
at Value | | | Cash
Collateral
Received1 | | | Net Amount |
Barclays Capital, Inc. | | $ | 2,334,750 | | | $ | (2,334,750 | ) | | — |
Goldman Sachs & Co. | | | 1,562,796 | | | | (1,562,796 | ) | | — |
Morgan Stanley | | | 1,777,794 | | | | (1,777,794 | ) | | — |
| | | |
Total | | $ | 5,675,340 | | | $ | (5,675,340 | ) | | — |
| | | |
| | | | | | | | | | |
| Global Allocation | | | | | | | | |
| Counterparty | | | | | | | | |
Barclays Capital, Inc. | | $ | 97,780 | | | $ | (97,780 | ) | | — |
BNP Paribas S.A. | | | 287,769 | | | | (287,769 | ) | | — |
Citigroup Global Markets, Inc. | | | 317,614 | | | | (317,614 | ) | | — |
Credit Suisse Securities (USA) LLC | | | 382,325 | | | | (382,325 | ) | | — |
Deutsche Bank Securities, Inc. | | | 412,339 | | | | (412,339 | ) | | — |
Goldman Sachs & Co. | | | 406,109 | | | | (406,109 | ) | | — |
JP Morgan Securities LLC | | | 444,854 | | | | (444,854 | ) | | — |
Merrill Lynch, Pierce, Fenner & Smith Inc. | | | 237,816 | | | | (237,816 | ) | | — |
Morgan Stanley | | | 1,460,233 | | | | (1,460,233 | ) | | — |
State Street Bank and Trust Co. | | | 647,930 | | | | (647,930 | ) | | — |
UBS Securities LLC | | | 136,254 | | | | (136,254 | ) | | — |
| | | |
Total | | $ | 4,831,023 | | | $ | (4,831,023 | ) | | — |
| | | |
| | | | | | | | | | |
| Large Cap Core | | | | | | | | |
| Counterparty | | | | | | | | |
Barclays Capital, Inc. | | $ | 579,952 | | | $ | (579,952 | ) | | — |
Citigroup Global Markets, Inc. | | | 436,504 | | | | (436,504 | ) | | — |
Goldman Sachs & Co. | | | 118,093 | | | | (118,093 | ) | | — |
JP Morgan Securities LLC | | | 651,334 | | | | (651,334 | ) | | — |
Morgan Stanley | | | 4,734,726 | | | | (4,734,726 | ) | | — |
| | | |
Total | | $ | 6,520,609 | | | $ | (6,520,609 | ) | | — |
| | | |
| | 1 | | Collateral with a value of $5,786,479, $4,986,152 and $6,716,532 has been received by Capital Appreciation, Global Allocation and Large Cap Core, respectively, in connection with securities lending agreements. Collateral received in excess of the value of securities loaned from the individual counterparty is not shown for financial reporting purposes. |
The risks of securities lending include the risk that the borrower may not provide additional collateral when required or may not return the securities when due. To mitigate these risks, the Funds benefit from a borrower default indemnity provided by BIM. BIM’s indemnity allows for full replacement of the securities loaned if the collateral received does not cover the value on the securities loaned in the event of borrower default. Each Fund could suffer a loss if the value of an investment purchased with cash collateral falls below the market value of loaned securities or if the value of an investment purchased with cash collateral falls below the value of the original cash collateral received.
5. Derivative Financial Instruments:
Certain Funds engage in various portfolio investment strategies using derivative contracts both to increase their returns and/or to manage economically their exposure to certain risks such as credit risk, equity risk, interest rate risk, foreign currency exchange rate risk, commodity price risk or other risk (e.g., inflation risk). These contracts may be transacted on an exchange or OTC.
Financial Futures Contracts: Certain Funds invest in long and/or short positions in financial futures contracts and options on financial futures contracts to gain exposure to, or economically hedge against, changes in interest rates (interest rate risk), changes in the value of equity securities (equity risk) or foreign currencies (foreign currency exchange rate risk). Financial futures contracts are agreements between a Fund and a counterparty to buy or sell a specific quantity of an underlying instrument at a specified price and at a specified date. Depending on the terms of the particular contract, financial futures contracts are settled either through physical delivery of the underlying instrument on the settlement date or by payment of a cash settlement amount on the settlement date.
Upon entering into a financial futures contract, the Funds are required to deposit initial margin with the broker in the form of cash or securities in an amount that varies depending on a contract’s size and risk profile. The initial margin deposit must then be maintained at an established level over the life of the contract. Securities deposited as initial margin are designated on the Schedules of Investments and cash deposited, if any, is recorded on the Statements of Assets and Liabilities as cash pledged for financial futures contracts. Pursuant to the contract, the Funds agree to receive from or pay
| | | | | | |
| | | BLACKROCK SERIES FUND, INC. | | DECEMBER 31, 2015 | | 151 |
| | |
| Notes to Financial Statements (continued) | | |
to the broker an amount of cash equal to the daily fluctuation in value of the contract. Such receipts or payments are known as variation margin. Variation margin is recorded by the Funds as unrealized appreciation (depreciation), and if applicable, as a receivable or payable for variation margin in the Statements of Assets and Liabilities.
When the contract is closed, the Funds record a realized gain or loss equal to the difference between the value of the contract at the time it was opened and the value at the time it was closed. The use of financial futures contracts involves the risk of an imperfect correlation in the movements in the price of financial futures contracts, interest or foreign currency exchange rates and the underlying assets.
Forward Foreign Exchange Contracts: Certain Funds enter into forward foreign currency exchange contracts as an economic hedge against either specific transactions or portfolio instruments or to obtain exposure to or hedge exposure away from foreign currencies (foreign currency exchange rate risk). A forward foreign currency exchange contract is an agreement between two parties to buy and sell a currency at a set exchange rate on a future date. Foreign currency exchange contracts, when used by a Fund, help to manage the overall exposure to the currencies in which some of the investments held by the Fund are denominated. Non-deliverable forward foreign currency exchange contracts are settled with the counterparty in cash without the delivery of foreign currency. The contract is marked-to-market daily and the change in market value is recorded by a Fund as an unrealized gain or loss. When the contract is closed, the Fund records a realized gain or loss equal to the difference between the value at the time it was opened and the value at the time it was closed. The use of forward foreign currency exchange contracts involves the risk that the value of a forward foreign currency exchange contract changes unfavorably due to movements in the value of the referenced foreign currencies.
Options: Certain Funds purchase and write call and put options to increase or decrease their exposure to underlying instruments (including equity risk, interest rate risk and/or commodity price risk) and/or, in the case of options written, to generate gains from options premiums. A call option gives the purchaser (holder) of the option the right (but not the obligation) to buy, and obligates the seller (writer) to sell (when the option is exercised) the underlying instrument at the exercise or strike price at any time or at a specified time during the option period. A put option gives the holder the right to sell and obligates the writer to buy the underlying instrument at the exercise or strike price at any time or at a specified time during the option period. When the Funds purchase (write) an option, an amount equal to the premium paid (received) by the Funds is reflected as an asset (liability). The amount of the asset (liability) is subsequently marked-to-market to reflect the current market value of the option purchased (written). When an instrument is purchased or sold through an exercise of an option, the related premium paid (or received) is added to (or deducted from) the basis of the instrument acquired or deducted from (or added to) the proceeds of the instrument sold. When an option expires (or the Funds enter into a closing transaction), the Funds realize a gain or loss on the option to the extent of the premiums received or paid (or gain or loss to the extent the cost of the closing transaction exceeds the premiums received or paid). When the Funds write a call option, such option is “covered,” meaning that the Funds hold the underlying instrument subject to being called by the option counterparty. When the Funds write a put option, such option is covered by cash in an amount sufficient to cover the obligation.
Options on swaps (“swaptions”) are similar to options on securities except that instead of selling or purchasing the right to buy or sell a security, the writer or purchaser of the swaptions is granting or buying the right to enter into a previously agreed upon interest rate or credit default swap agreement (interest rate risk and/or credit risk) at any time before the expiration of the option.
Certain Funds also purchase or sell listed or OTC foreign currency options, foreign currency futures and related options on foreign currency futures as a short or long hedge against possible variations in foreign exchange rates or to gain exposure to foreign currencies (foreign currency exchange rate risk). When foreign currency is purchased or sold through an exercise of a foreign currency option, the related premium paid (or received) is added to (or deducted from) the basis of the foreign currency acquired or deducted from (or added to) the proceeds of the foreign currency sold (receipts from the foreign currency purchased). Such transactions may be effected with respect to hedges on non-US dollar denominated instruments owned by the Funds but not yet delivered, or committed or anticipated to be purchased by the Funds.
Certain Funds may also purchase and write a variety of options with non-standard payout structures or other features (“barrier options”). Barrier options are generally traded OTC. The Funds may invest in various types of barrier options including down-and-in options. Down-and-in options expire worthless to the purchaser of the option unless the price of the underlying instrument falls below a specific barrier price level prior to the option’s expiration date.
In purchasing and writing options, the Funds bear the risk of an unfavorable change in the value of the underlying instrument or the risk that the Funds may not be able to enter into a closing transaction due to an illiquid market. Exercise of a written option could result in the Funds purchasing or selling a security when they otherwise would not, or at a price different from the current market value.
Swaps: Certain Funds may enter into swap agreements in which a Fund and a counterparty agree either to make periodic net payments on a specified notional amount or a net payment upon termination. Swap agreements are privately negotiated in the OTC market and may be entered into as a bilateral contract (“OTC swaps”) or centrally cleared (“centrally cleared swaps”). Swaps are marked-to-market daily and changes in value are recorded as unrealized appreciation (depreciation).
| | | | | | |
| 152 | | BLACKROCK SERIES FUND, INC. | | DECEMBER 31, 2015 | | |
| | |
| Notes to Financial Statements (continued) | | |
For OTC swaps, any upfront premiums paid are recorded as assets and any upfront fees received are recorded as liabilities and are shown as swap premiums paid and swap premiums received, respectively, in the Statements of Assets and Liabilities and amortized over the term of the OTC swap. Payments received or made by the Funds for OTC swaps are recorded in the Statements of Operations as realized gains or losses, respectively. When an OTC swap is terminated, the Funds will record a realized gain or loss equal to the difference between the proceeds from (or cost of) the closing transaction and the Funds’ basis in the contract, if any. Generally, the basis of the contract is the premium received or paid.
In a centrally cleared swap, immediately following execution of the swap agreement, the swap agreement is novated to a central counterparty (the “CCP”) and a Fund’s counterparty on the swap agreement becomes the CCP. The Fund is required to interface with the CCP through a broker. Upon entering into a centrally cleared swap, the Funds are required to deposit initial margin with the broker in the form of cash or securities in an amount that varies depending on the size and risk profile of the particular swap. Securities deposited as initial margin are designated on the Schedules of Investments and cash deposited is recorded on the Statements of Assets and Liabilities as cash pledged for centrally cleared swaps. The daily change in valuation of centrally cleared swaps is recorded as a receivable or payable for variation margin in the Statements of Assets and Liabilities. Payments received from (paid to) the counterparty, including at termination, are recorded as realized gain (loss) in the Statements of Operations.
Swap transactions involve, to varying degrees, elements of interest rate, credit and market risk in excess of the amounts recognized in the Statements of Assets and Liabilities. Such risks involve the possibility that there will be no liquid market for these agreements, that the counterparty to the agreements may default on its obligation to perform or disagree as to the meaning of the contractual terms in the agreements, and that there may be unfavorable changes in interest rates and/or market values associated with these transactions.
| • | | Credit default swaps — Certain Funds may enter into credit default swaps to manage their exposure to the market or certain sectors of the market, to reduce their risk exposure to defaults of corporate and/or sovereign issuers or to create exposure to corporate and/or sovereign issuers to which they are not otherwise exposed (credit risk). The Funds may either buy or sell (write) credit default swaps on single-name issuers (corporate or sovereign), a combination or basket of single-name issuers or traded indexes. Credit default swaps on single-name issuers are agreements in which the protection buyer pays fixed periodic payments to the seller in consideration for a guarantee from the protection seller to make a specific payment should a negative credit event take place with respect to the referenced entity (e.g., bankruptcy, failure to pay, obligation accelerators, repudiation, moratorium or restructuring). Credit default swaps on traded indexes are agreements in which the buyer pays fixed periodic payments to the seller in consideration for a guarantee from the seller to make a specific payment should a write-down, principal or interest shortfall or default of all or individual underlying securities included in the index occur. As a buyer, if an underlying credit event occurs, the Funds will either (i) receive from the seller an amount equal to the notional amount of the swap and deliver the referenced security or underlying securities comprising the index or (ii) receive a net settlement of cash equal to the notional amount of the swap less the recovery value of the security or underlying securities comprising the index. As a seller (writer), if an underlying credit event occurs, the Funds will either pay the buyer an amount equal to the notional amount of the swap and take delivery of the referenced security or underlying securities comprising the index or pay a net settlement of cash equal to the notional amount of the swap less the recovery value of the security or underlying securities comprising the index. |
| • | | Total return swaps — Certain Funds may enter into total return swaps to obtain exposure to a security or market without owning such security or investing directly in that market or to transfer the risk/return of one market (e.g., fixed-income) to another market (e.g., equity or commodity prices) (equity risk, commodity price risk and/or interest rate risk). Total return swaps are agreements in which there is an exchange of cash flows whereby one party commits to make payments based on the total return (coupons plus capital gains/losses) of an underlying instrument in exchange for fixed or floating rate interest payments. To the extent the total return of the instrument or index underlying the transaction exceeds or falls short of the offsetting interest rate obligation, the Funds will receive a payment from or make a payment to the counterparty. |
| • | | Interest rate swaps — Certain Funds may enter into interest rate swaps to gain or reduce exposure to interest rates or to manage duration, the yield curve or interest rate risk by economically hedging the value of the fixed rate bonds, which may decrease when interest rates rise (interest rate risk). Interest rate swaps are agreements in which one party pays a stream of interest payments, either fixed or floating, for another party’s stream of interest payments, either fixed or floating, on the same notional amount for a specified period of time. |
| • | | Currency swaps — Certain Funds may enter into currency swaps to gain or reduce exposure to foreign currencies or as an economic hedge against either specific transactions or portfolio instruments (foreign currency exchange rate and/or interest rate risk). Currency swaps are interest rate swaps in which one party pays a stream of interest payments, either fixed or floating, in exchange for another party’s stream of interest payments, either fixed or floating, based on the notional amounts of two different currencies. The notional amounts are typically determined based on the spot exchange rates at the inception of the trade. Currency swaps may also involve an exchange of notional amounts at the start, during and/or at expiration of the contract, either at the current spot rate or another specified rate. |
| • | | Forward interest rate swaps — Certain Funds may enter into forward interest rate swaps and forward total return swaps. In a forward swap, each Fund and the counterparty agree to make either periodic net payments beginning on a specified future effective date or a net payment at termination, unless terminated earlier. |
| • | | Interest rate floors — Certain Funds may enter into interest rate floors to gain or reduce exposure to interest rates (interest rate risk). Floors are agreements whereby one party agrees to make payments to the other, in return for a premium, to the extent that interest rates indexes fall below a specified rate, or “floor.” When a Fund purchases (writes) a cap or floor, an amount equal to the premium paid (received) by the Fund is reflected |
| | | | | | |
| | | BLACKROCK SERIES FUND, INC. | | DECEMBER 31, 2015 | | 153 |
| | |
| Notes to Financial Statements (continued) | | |
| | as an asset (liability). The amount of the asset (liability) is subsequently marked to market to reflect the current value of the cap or floor. The maximum potential amount of future payments that a Fund would be required to make under an interest rate floor would be the notional amount times the percentage increase in interest rates determined by the difference between the interest rates index’s current value and the value at the time the floor was entered into. |
Master Netting Arrangements: In order to better define certain Funds’ contractual rights and to secure rights that will help them mitigate their counterparty risk, the Funds may enter into an International Swaps and Derivatives Association, Inc. Master Agreement (“ISDA Master Agreement”) or similar agreement with their counterparties. An ISDA Master Agreement is a bilateral agreement between each Fund and a counterparty that governs certain OTC derivatives and typically contains, among other things, collateral posting terms and netting provisions in the event of a default and/or termination event. Under an ISDA Master Agreement, each Fund may, under certain circumstances, offset with the counterparty certain derivative financial instruments’ payables and/or receivables with collateral held and/or posted and create one single net payment. The provisions of the ISDA Master Agreement typically permit a single net payment in the event of default including the bankruptcy or insolvency of the counterparty. Bankruptcy or insolvency laws of a particular jurisdiction may restrict or prohibit the right of offset in bankruptcy, insolvency or other events. In addition, certain ISDA Master Agreements allow counterparties to terminate derivative contracts prior to maturity in the event the Funds’ net assets decline by a stated percentage or the Funds fail to meet the terms of their ISDA Master Agreements. The result would cause the Funds to accelerate payment of any net liability owed to the counterparty.
Collateral Requirements: For derivatives traded under an ISDA Master Agreement, the collateral requirements are typically calculated by netting the mark-to-market amount for each transaction under such agreement and comparing that amount to the value of any collateral currently pledged by a Fund and the counterparty.
Cash collateral that has been pledged to cover obligations of the Funds and cash collateral received from the counterparty, if any, is reported separately on the Statements of Assets and Liabilities as cash pledged as collateral and cash received as collateral, respectively. Non-cash collateral pledged by the Funds, if any, is noted in the Schedules of Investments. Generally, the amount of collateral due from or to a party has to exceed a minimum transfer amount threshold (typically either $250,000 or $500,000) before a transfer is required, which is determined at the close of business of the Funds. Any additional required collateral is delivered to/pledged by the Funds on the next business day. Typically, a Fund’s counterparty is not permitted to sell, re-pledge or use cash and non-cash collateral it receives. A Fund generally agrees not to use non-cash collateral that it receives but may, absent default or certain other circumstances defined in the underlying ISDA Master Agreement, be permitted to use cash collateral received. In such cases, a Fund may pay interest pursuant to the collateral arrangement with the counterparty. To the extent amounts due to the Funds from their counterparties are not fully collateralized, the Funds bear the risk of loss from counterparty non-performance. Likewise, to the extent the Funds have delivered collateral to a counterparty and stand ready to perform under the terms of their agreement with such counterparty, the Funds bear the risk of loss from a counterparty in the amount of the value of the collateral in the event the counterparty fails to return such collateral. Based on the terms of agreements, collateral may not be required to all derivative contracts.
For financial reporting purposes, the Funds do not offset derivative assets and derivative liabilities that are subject to netting arrangements, if any, in the Statements of Assets and Liabilities.
6. Investment Advisory Agreements and Other Transactions with Affiliates:
The PNC Financial Services Group, Inc. is the largest stockholder and an affiliate of BlackRock, Inc. (“BlackRock”) for 1940 Act purposes.
The Company, on behalf of the Funds, entered into an Investment Advisory Agreement with the Manager, the Funds’ investment advisor, an indirect, wholly owned subsidiary of BlackRock, to provide investment advisory and administration services. The Manager is responsible for the management of each Fund’s portfolio and provides the necessary personnel, facilities, equipment and certain other services to the operations of each Fund. For such services, each Fund pays the Manager a monthly fee based on the percentage of the eight combined Funds’ average daily net assets at the following annual rates:
| | | | | |
Average Daily Net Assets of the Eight Combined Funds | | Investment
Advisory Fee |
First $250 Million | | | | 0.50 | % |
$250 Million — $300 Million | | | | 0.45 | % |
$300 Million — $400 Million | | | | 0.40 | % |
$400 Million — $800 Million | | | | 0.35 | % |
Greater than $800 Million | | | | 0.30 | % |
The portion of the assets of a Fund to which the rate of each breakpoint level applies will be determined on a “uniform percentage” basis. The uniform percentage applicable to a breakpoint level is determined by dividing the amount of the aggregate average daily net assets of the eight combined Funds that falls within that breakpoint level by the aggregate average daily net assets of the eight combined Funds. The amount of the fee for a Fund at each breakpoint level is determined by multiplying the average net assets of that Fund by the uniform percentage applicable to that breakpoint level and multiplying the product by the applicable advisory fee rate.
| | | | | | |
| 154 | | BLACKROCK SERIES FUND, INC. | | DECEMBER 31, 2015 | | |
| | |
| Notes to Financial Statements (continued) | | |
The Manager provides investment management and other services to the Subsidiary of Global Allocation. The Manager does not receive separate compensation from the Subsidiary for providing investment management or administrative services. However, Global Allocation pays the Manager based on the Fund’s net assets, which includes the assets of the Subsidiary.
The Company, on behalf of the Funds, entered into a Distribution Agreement and a Distribution Plan with BlackRock Investments, LLC (“BRIL”), an affiliate of the Manager.
The Manager contractually agreed to waive and/or reimburse fees or expenses in order to limit expenses, excluding interest expense, dividend expense, tax expense, acquired fund fees and expenses, and certain other fund expenses, which constitute extraordinary expenses not incurred in the ordinary course of the Funds’ business. The Manager has agreed not to reduce or discontinue this contractual expense limitation, for all Funds other than Government Money Market, prior to May 1, 2016, and for Government Money Market, prior to May 1, 2017, unless approved by the Board, including a majority of Independent Directors.
The current expense limitations as a percentage of net assets is as follows:
| | | | | | | | | | | | | | |
Balanced
Capital | | Capital
Appreciation | | Global
Allocation | | Government
Money
Market | | High
Yield | | Large
Cap Core | | Total
Return | | U.S.
Government
Bond |
| 0.50% | | 0.57% | | 0.57% | | 0.50% | | 0.50% | | 0.50% | | 0.50% | | 0.50% |
The following Funds had waivers that are included in fees waived by the Manager in the Statements of Operations. For the year ended December 31, 2015, the amounts were as follows:
| | | | | | | | | | | | | | | | | | | | |
| | | Global Allocation | | High Yield | | Total Return | | U.S. Government
Bond |
Fees Waived by Manager | | | $ | 110,099 | | | | $ | 98,763 | | | | $ | 170,932 | | | | $ | 98,320 | |
The Manager and BRIL voluntarily agreed to waive a portion of management fees and/or reimburse operating expenses to enable Government Money Market to maintain minimum levels of daily net investment income. This amount of $334,527 is reported in the Statements of Operations as fees waived by the Manager. The Manager and BRIL may discontinue the waiver or reimbursement at any time.
The Manager voluntarily agreed to waive its investment advisory fees by the amount of investment advisory fees certain Funds pay to the Manager indirectly through their investment in affiliated money market funds. These amounts are included in fees waived by the Manager in the Statements of Operations. However, the Manager does not waive its investment advisory fees by the amount of investment advisory fees paid in connection with certain Funds’ investments in other affiliated investment companies, if any. For the year ended December 31, 2015, the amounts waived were as follows:
| | | | | | | | | | | | | | | | | | | | | | | | | | | | | | | | | | | |
| | | Balanced
Capital | | Capital
Appreciation | | Global
Allocation | | High
Yield | | Large
Cap Core | | Total
Return | | U.S.
Government
Bond |
Fees Waived by Manager | | | $ | 7,576 | | | | $ | 1,988 | | | | $ | 2,775 | | | | $ | 590 | | | | $ | 2,268 | | | | $ | 1,468 | | | | $ | 2,913 | |
For the year ended December 31, 2015, each Fund reimbursed the Manager for certain accounting services, which is included in Accounting services in the Statements of Operations. The reimbursements were as follows:
| | | | | | | | | | | | | | |
Balanced
Capital | | Capital
Appreciation | | Global
Allocation | | Government
Money
Market | | High
Yield | | Large
Cap Core | | Total
Return | | U.S.
Government
Bond |
| $5,544 | | $1,704 | | $2,581 | | $1,370 | | $370 | | $1,884 | | $679 | | $743 |
The Manager, on behalf of the Funds, entered into agreements with insurance companies and other financial intermediaries (“Service Organizations”), some of which may be affiliates. Pursuant to these agreements, the Service Organizations provide the Funds with administrative, networking, recordkeeping, sub-transfer agency and shareholder services to sub-accounts they service. For these services, the Service Organizations receive an annual fee per shareholder account, which will vary depending on share class and/or net assets of Fund shareholders serviced by the Service Organizations. For the year ended December 31, 2015, the Funds did not pay any amounts to affiliates in return for these services. The Manager has contractually agreed to reimburse such fees in order to limit such expenses as a percentage of average daily net assets as follows:
| | | | | | | | | | | | | | |
Balanced
Capital | | Capital
Appreciation | | Global
Allocation | | Government
Money
Market | | High
Yield | | Large
Cap Core | | Total
Return | | U.S.
Government
Bond |
| 0.04% | | 0.04% | | 0.04% | | 0.02% | | 0.05% | | 0.04% | | 0.05% | | 0.05% |
The Manager has agreed not to reduce or discontinue this contractual expense limitation, for all Funds other than Government Money Market, prior to May 1, 2016, and for Government Money Market, prior to May 1, 2017, unless approved by the Board, including a majority of Independent Directors
| | | | | | |
| | | BLACKROCK SERIES FUND, INC. | | DECEMBER 31, 2015 | | 155 |
| | |
| Notes to Financial Statements (continued) | | |
or by a majority of the outstanding voting securities of the Funds. These amounts are shown as or included in transfer agent fees reimbursed in the Statements of Operations. For the year ended December 31, 2015, the amounts reimbursed were as follows:
| | | | | | | | | | | | | | |
Balanced
Capital | | Capital
Appreciation | | Global
Allocation | | Government
Money
Market | | High
Yield | | Large
Cap Core | | Total
Return | | U.S.
Government
Bond |
| $566,800 | | $155,310 | | $362,090 | | $86,910 | | $51,812 | | $175,073 | | $90,141 | | $100,501 |
The U.S. Securities and Exchange Commission has issued an exemptive order which permits BIM, an affiliate of the Manager, to serve as securities lending agent for the Funds, subject to applicable conditions. As securities lending agent, BIM bears all operational costs directly related to securities lending. The Funds are responsible for expenses in connection with the investment of cash collateral received for securities on loan (the “collateral investment expenses”). The cash collateral is invested in a private investment company managed by the Manager or its affiliates. However, BIM has agreed to cap the collateral investment expenses of the private investment company to an annual rate of 0.04%. The investment advisor to the private investment company will not charge any advisory fees with respect to shares purchased by the Funds.
Securities lending income is equal to the total of income earned from the reinvestment of cash collateral, net of fees and other payments to and from borrowers of securities, and less the collateral investment expenses. Each Fund retains a portion of securities lending income and remits a remaining portion to BIM as compensation for its services as securities lending agent.
Pursuant to a securities lending agreement effective January 1, 2015, Balanced Capital, Capital Appreciation and Large Cap Core retain 71.5% of securities lending income, and this amount retained can never be less than 65% of the total of securities lending income plus the collateral investment expenses. In addition, commencing the business day following the date that the aggregate securities lending income earned across the Equity-Bond Complex in a calendar year exceeds a specified threshold, Balanced Capital, Capital Appreciation and Large Cap Core, pursuant to the securities lending agreement, will retain for the remainder of that calendar year securities lending income as follows: 75% of securities lending income, and this amount retained can never be less than 65% of the total of securities lending income plus the collateral investment expenses.
Pursuant to a securities lending agreement effective January 1, 2015, Global Allocation retains 80% of securities lending income, and this amount retained can never be less than 70% of the total of securities lending income plus the collateral investment expenses. In addition, commencing the business day following the date that the aggregate securities lending income earned across the Equity-Bond Complex in a calendar year exceeds a specified threshold, Global Allocation, pursuant to the securities lending agreement, will retain for the remainder of that calendar year securities lending income as follows: 85% of securities lending income, and this amount retained can never be less than 70% of the total of securities lending income plus the collateral investment fees.
The share of securities lending income earned by each Fund is shown as securities lending — affiliated — net in the Statements of Operations. For the year ended December 31, 2015, each Fund paid BIM the following amounts for securities lending agent services:
| | | | | | |
Balanced
Capital | | Capital
Appreciation | | Global
Allocation | | Large Cap
Core |
$4,942 | | $5,008 | | $9,822 | | $3,709 |
Certain officers and/or directors of the Company are officers and/or directors of BlackRock or its affiliates. The Funds reimburse the Manager for a portion of the compensation paid to the Company’s Chief Compliance Officer, which is included in officer and directors in the Statements of Operations.
The Funds may purchase securities from, or sell securities to, an affiliated fund provided the affiliation is due solely to having a common investment advisor, common officers, or common directors. For the year ended December 31, 2015, the purchase and sale transactions with an affiliated fund in compliance with Rule 17a-7 of the 1940 Act were as follows:
| | | | | | | | | | | | | | | | | | | | | | | | | | | | | | | | | | | |
| | | Balanced
Capital | | Capital
Appreciation | | Global
Allocation | | Government
Money
Market | | High
Yield | | Large
Cap Core | | Total
Return |
Purchases | | | | $514,993 | | | | | $285,647 | | | | | $145,925 | | | | | — | | | | | $28,555 | | | | | $42,755 | | | | | $169,614 | |
Sales | | | | $230,875 | | | | | $732,459 | | | | | $238,353 | | | | | $4,435,032 | | | | | — | | | | | — | | | | | $ 12,484 | |
| | | | | | |
| 156 | | BLACKROCK SERIES FUND, INC. | | DECEMBER 31, 2015 | | |
| | |
| Notes to Financial Statements (continued) | | |
7. Purchases and Sales:
For the year ended December 31, 2015, purchases and sales of investments, including mortgage dollar rolls and excluding short-term securities, were as follows:
| | | | | | | | | | | | | | | | | | | | | | | | | | | | | | | | | | | |
| Purchases | | | | | | | | | | | | | | |
| | | Balanced
Capital | | Capital
Appreciation | | Global
Allocation | | High Yield | | Large
Cap Core | | Total Return | | U.S.
Government
Bond |
Non-U.S. Government Securities | | | | $1,322,693,884 | | | | | $111,424,017 | | | | | $140,692,298 | | | | | $30,111,081 | | | | | $53,709,590 | | | | | $375,197,940 | | | | | $1,033,662,088 | |
U.S. Government Securities | | | | 446,945,659 | | | | | — | | | | | 35,158,971 | | | | | — | | | | | — | | | | | 171,451,770 | | | | | 203,356,098 | |
Total Purchases | | | | $1,769,639,543 | | | | | $111,424,017 | | | | | $175,851,269 | | | | | $30,111,081 | | | | | $53,709,590 | | | | | $546,649,710 | | | | | $1,237,018,186 | |
| | | | | | | | | | | | | | | | | | | | | | | | | | | | | | | | | | | |
| Sales | | | | | | | | | | | | | | |
| | | Balanced
Capital | | Capital
Appreciation | | Global
Allocation | | High Yield | | Large
Cap Core | | Total Return | | U.S.
Government
Bond |
Non-U.S. Government Securities (includes paydowns) | | | | $1,407,821,061 | | | | | $122,998,208 | | | | | $161,556,271 | | | | | $34,490,863 | | | | | $65,484,867 | | | | | $394,010,820 | | | | | $1,075,525,708 | |
U.S. Government Securities | | | | 448,422,314 | | | | | — | | | | | 34,617,771 | | | | | — | | | | | — | | | | | 174,040,649 | | | | | 202,148,341 | |
Total Sales | | | | $1,856,243,375 | | | | | $122,998,208 | | | | | $196,174,042 | | | | | $34,490,863 | | | | | $65,484,867 | | | | | $568,051,469 | | | | | $1,277,674,049 | |
| | | | | | | | | | | | | | | | | | | | | | | | | | | | | | | | | | | |
| Purchases and Sales — MDRs | | | | | | | | Balanced
Capital | | Global
Allocation | | Total Return | | U.S.
Government
Bond |
Purchases | | | | | | | | | | | | | | | | | | | $517,430,295 | | �� | | | $4,489,544 | | | | | $164,414,074 | | | | | $461,116,199 | |
Sales | | | | | | | | | | | | | | | | | | | $517,546,187 | | | | | $4,529,019 | | | | | $164,421,904 | | | | | $461,197,003 | |
8. Income Tax Information:
It is each Fund’s policy to comply with the requirements of the Internal Revenue Code of 1986, as amended, applicable to regulated investment companies, and to distribute substantially all of its taxable income to its shareholders. Therefore, no federal income tax provision is required.
Each Fund files U.S. federal and various state and local tax returns. No income tax returns are currently under examination. The statute of limitations on each Fund’s U.S. federal tax returns remains open for each of the four years ended December 31, 2015. The statutes of limitations on each Fund’s state and local tax returns may remain open for an additional year depending upon the jurisdiction.
Management has analyzed tax laws and regulations and their application to the Funds as of December 31, 2015, inclusive of the open tax years, and does not believe there are any uncertain tax positions that require recognition of a tax liability in the Funds’ financial statements.
U.S. GAAP requires that certain components of net assets be adjusted to reflect permanent differences between financial and tax reporting. These reclassifications have no effect on net assets or net asset values per share. As of December 31, 2015 the following permanent differences attributable to the accounting for swap agreements, the classification of investments, amortization and accretion methods on fixed income securities, foreign currency transactions, the sale of stock of passive foreign investment companies by the Portfolio, net paydown losses, the reclassification of distributions, investment in wholly owned subsidiaries, and distributions received from a regulated investment company were reclassified to the following accounts:
| | | | | | | | | | | | | | | | | | | | | | | | | | | | | | | | | | | |
| | | Balanced
Capital | | Capital
Appreciation | | Global
Allocation | | High
Yield | | Large Cap
Core | | Total
Return | | U.S.
Government
Bond |
Paid-in capital | | | | — | | | | | — | | | | $ | (186,833 | ) | | | | — | | | | | — | | | | | — | | | | | — | |
Undistributed (distributions in excess of) net investment income | | | $ | 541,602 | | | | $ | (137 | ) | | | $ | 164,564 | | | | $ | 250,826 | | | | $ | 4,349 | | | | $ | 193,464 | | | | $ | 529,047 | |
Accumulated net realized gain (loss) | | | $ | (541,602 | ) | | | $ | 137 | | | | $ | 22,269 | | | | $ | (250,826 | ) | | | $ | (4,349 | ) | | | $ | (193,464 | ) | | | $ | (529,047 | ) |
| | | | | | |
| | | BLACKROCK SERIES FUND, INC. | | DECEMBER 31, 2015 | | 157 |
| | |
| Notes to Financial Statements (continued) | | |
The tax character of distributions paid was as follows:
| | | | | | | | | | |
| | | Balanced Capital | | Capital
Appreciation | | Global Allocation | | Government
Money Market | |
Ordinary income | | | | | | | | | | |
12/31/15 | | $ 8,637,654 | | $ 1,434,440 | | $6,820,350 | | | $8,104 | |
12/31/14 | | $16,153,868 | | $ 5,886,531 | | $8,704,965 | | | $7,323 | |
| |
Long-term capital gains | | | | | | | | | | |
12/31/15 | | 24,309,185 | | 11,167,645 | | 11,373,067 | | | — | |
12/31/14 | | 51,146,432 | | 20,783,268 | | 19,048,279 | | | 10 | |
| |
Tax return of capital | | | | | | | | | | |
12/31/15 | | — | | — | | 1,548 | | | — | |
| |
Total | | | | | | | | | | |
12/31/15 | | $32,946,839 | | $12,602,085 | | $18,194,965 | | | $8,104 | |
| | | |
12/31/14 | | $67,300,300 | | $26,669,799 | | $27,753,244 | | | $7,333 | |
| | | |
| | | | | | | | | | |
| | | High Yield | | Large Cap Core | | Total Return | | U.S.
Government
Bond | |
Ordinary income | | | | | | | | | | |
12/31/15 | | $2,026,899 | | $ 2,025,002 | | $1,656,708 | | | $1,474,856 | |
12/31/14 | | $2,871,368 | | $ 1,888,456 | | $2,158,307 | | | $1,631,328 | |
| |
Long-term capital gains | | | | | | | | | | |
12/31/15 | | — | | 8,645,660 | | — | | | — | |
12/31/14 | | — | | 15,500,781 | | — | | | — | |
| |
Total | | | | | | | | | | |
12/31/15 | | $2,026,899 | | $10,670,662 | | $1,656,708 | | | $1,474,856 | |
| | | |
12/31/14 | | $2,871,368 | | $17,389,237 | | $2,158,307 | | | $1,631,328 | |
| | | |
As of period end, the tax components of accumulated net earnings (losses) were as follows: | | | | | | | | |
| | | Balanced Capital | | Capital Appreciation | | Global Allocation | | Government
Money Market | |
Undistributed ordinary income | | — | | $ 35,936 | | — | | | $169 | |
Undistributed long-term capital gains | | $ 2,719,554 | | 2,247,935 | | — | | | 315 | |
Capital loss carryforwards | | — | | — | | — | | | — | |
Net unrealized gains (losses)1 | | 52,357,068 | | 23,446,819 | | $(8,739,652) | | | — | |
Qualified late-year losses2 | | (256,921) | | — | | (13,225) | | | — | |
| | | |
Total | | $54,819,701 | | $25,730,690 | | $(8,752,877) | | | $484 | |
| | | |
| | | | | | | | | | |
| | | High Yield | | Large Cap Core | | Total Return | | U.S.
Government
Bond | |
Undistributed ordinary income | | $ 102,825 | | $ 3,142 | | — | | | $ 229,703 | |
Undistributed long-term capital gains | | — | | 1,692,786 | | — | | | — | |
Capital loss carryforwards | | (6,128,804) | | — | | $(3,087,673) | | | (1,899,590 | ) |
Net unrealized gains1 | | (3,100,932) | | 32,148,835 | | (925,313) | | | (487,449 | ) |
Qualified late-year losses2 | | — | | — | | (136,117) | | | — | |
| | | |
Total | | $(9,126,911) | | $33,844,763 | | $(4,149,103) | | | $(2,157,336 | ) |
| | | |
| | | | | | | | | | |
| |
| 1 | | The difference between book-basis and tax-basis net unrealized gains (losses) was attributable primarily to the tax deferral of losses on wash sales and straddles, amortization and accretion methods of premiums and discounts on fixed income securities, the realization for tax purposes of unrealized gains/losses on certain futures, options and foreign currency contracts, the timing and recognition of partnership income, the accounting for swap agreements, the classification of investments and the deferral of post-October capital losses for tax purposes. |
| 2 | | The Fund has elected to defer certain qualified late-year losses and recognize such losses in the next taxable year. |
| | | | | | |
| 158 | | BLACKROCK SERIES FUND, INC. | | DECEMBER 31, 2015 | | |
| | |
| Notes to Financial Statements (continued) | | |
As of period end, the following Funds had capital loss carryforwards available to offset future realized capital gains through the indicated expiration dates as follows:
| | | | | | | | | | |
| Expires December 31, | | High Yield | | | | Total Return | | | | U.S.
Government
Bond |
No expiration date1 | | $1,790,214 | | | | — | | | | $1,899,590 |
2016 | | 1,256,976 | | | | — | | | | — |
2017 | | 3,081,614 | | | | $3,087,673 | | | | — |
| | |
Total | | $6,128,804 | | | | $3,087,673 | | | | $1,899,590 |
| | |
| | | | | | | | | | |
|
| | 1 | | Must be utilized prior to losses subject to expiration. |
During the year ended December 31, 2015, the Funds listed below utilized the following amounts of their respective capital loss carryforward:
| | | | | | | | |
| | | Total
Return | | | | | U.S.
Government
Bond |
| | | | $218,376 | | | | | $15,634 |
As of period end, gross unrealized appreciation and depreciation based on cost for federal income tax purposes were as follows:
| | | | | | | | | | | | | | | | | | | | | | |
| |
| | | Balanced Capital | | | | | Capital
Appreciation | | | | | Global
Allocation | | | | | High Yield | |
| |
Tax cost | | $ | 481,687,208 | | | | | $ | 141,034,352 | | | | | $ | 244,270,886 | | | | | $ | 34,407,292 | |
| | | | |
Gross unrealized appreciation | | $ | 69,421,897 | | | | | $ | 25,662,427 | | | | | $ | 13,839,103 | | | | | $ | 244,239 | |
Gross unrealized depreciation | | | (17,123,912 | ) | | | | | (2,215,608 | ) | | | | | (21,661,697 | ) | | | | | (3,350,282 | ) |
| | | | |
Net unrealized appreciation (depreciation) | | $ | 52,297,985 | | | | | $ | 23,446,819 | | | | | $ | (7,822,594 | ) | | | | $ | (3,106,043 | ) |
| | | | |
| | | | | | | | | | | | | | | | |
| | | Large Cap Core | | | | | Total Return | | | | | U.S.
Government
Bond | |
Tax cost | | $ | 143,796,096 | | | | | $ | 77,533,944 | | | | | $ | 116,167,816 | |
| | | | |
Gross unrealized appreciation | | $ | 39,764,417 | | | | | $ | 397,804 | | | | | $ | 419,322 | |
Gross unrealized depreciation | | | (7,615,582 | ) | | | | | (1,220,947 | ) | | | | | (912,777 | ) |
| | | | |
Net unrealized appreciation (depreciation) | | $ | 32,148,835 | | | | | $ | (823,143 | ) | | | | $ | (493,455 | ) |
| | | | |
9. Bank Borrowings:
The Company, on behalf of the Funds (except for Government Money Market), along with certain other funds managed by the Manager and its affiliates (“Participating Funds”), is a party to a 364-day, $2.1 billion credit agreement with a group of lenders, under which the Funds may borrow to fund shareholder redemptions. Excluding commitments designated for certain funds, the Participating Funds, including the Funds, can borrow up to an aggregate commitment amount of $1.6 billion, subject to asset coverage and other limitations as specified in the agreement. The credit agreement has the following terms: a fee of 0.06% per annum on unused commitment amounts and interest at a rate equal to the higher of (a) one-month LIBOR (but, in any event, not less than 0.00%) on the date the loan is made plus 0.80% per annum or (b) the Fed Funds rate (but, in any event, not less than 0.00%) in effect from time to time plus 0.80% per annum on amounts borrowed. The agreement expires in April 2016 unless extended or renewed. Participating Funds paid administration, legal and arrangement fees, which are included in miscellaneous expenses in the Statements of Operations, and along with commitment fees, were allocated among such funds based upon portions of the aggregate commitment available to them and relative net assets of Participating Funds. During the year ended December 31, 2015, the Funds did not borrow under the credit agreement.
10. Principal Risks:
Many municipalities insure repayment of their bonds, which may reduce the potential for loss due to credit risk. The market value of these bonds may fluctuate for other reasons, including market perception of the value of such insurance, and there is no guarantee that the insurer will meet its obligation.
Inventories of municipal bonds held by brokers and dealers may decrease, which would lessen their ability to make a market in these securities. Such a reduction in market making capacity could potentially decrease a Fund’s ability to buy or sell bonds. As a result, a Fund may sell a security at a lower price, sell other securities to raise cash, or give up an investment opportunity, any of which could have a negative impact on performance. If a Fund needed to sell large blocks of bonds, those sales could further reduce the bonds’ prices and impact performance.
| | | | | | |
| | | BLACKROCK SERIES FUND, INC. | | DECEMBER 31, 2015 | | 159 |
| | |
| Notes to Financial Statements (continued) | | |
In the normal course of business, certain Funds invest in securities and enter into transactions where risks exist due to fluctuations in the market (market risk) or failure of the issuer to meet all its obligations, including the ability to pay principal and interest when due (issuer credit risk). The value of securities held by the Funds may decline in response to certain events, including those directly involving the issuers of securities owned by the Funds. Changes arising from the general economy, the overall market and local, regional or global political or/and social instability, as well as currency, interest rate and price fluctuations, may also affect the securities’ value.
On July 23, 2014, the U.S. Securities and Exchange Commission adopted amendments to money market fund regulations, which structurally change the way that certain money market funds will be required to operate. The compliance period for amendments ranges between July 2015 and October 2016. When implemented, the changes may affect BlackRock Government Money Market Portfolio’s investment strategies, fees and expenses, portfolio and share liquidity and return potential.
Counterparty Credit Risk: Similar to issuer credit risk, the Funds may be exposed to counterparty credit risk, or the risk that an entity with which the Funds have unsettled or open transactions may fail to or be unable to perform on its commitments. The Funds manage counterparty credit risk by entering into transactions only with counterparties that the Manager believes have the financial resources to honor their obligations and by monitoring the financial stability of those counterparties. Financial assets, which potentially expose the Funds to market, issuer and counterparty credit risks, consist principally of financial instruments and receivables due from counterparties. The extent of the Funds’ exposure to market, issuer and counterparty credit risks with respect to these financial assets is generally approximated by their value recorded in the Statements of Assets and Liabilities, less any collateral held by the Funds.
A derivative contract may suffer a mark-to-market loss if the value of the contract decreases due to an unfavorable change in the market rates or values of the underlying instrument. Losses can also occur if the counterparty does not perform under the contract.
A Fund’s risk of loss from counterparty credit risk on OTC derivatives is generally limited to the aggregate unrealized gain less the value of any collateral held by such Fund. For OTC options purchased, each Fund bears the risk of loss of the amount of the premiums paid plus the positive change in market values net of any collateral held by such Fund should the counterparty fail to perform under the contracts. Options written by the Funds do not typically give rise to counterparty credit risk, as options written generally obligate the Funds, and not the counterparty, to perform.
With exchange-traded options purchased and futures and centrally cleared swaps, there is less counterparty credit risk to the Funds since the exchange or clearinghouse, as counterparty to such instruments, guarantees against a possible default. The clearinghouse stands between the buyer and the seller of the contract; therefore, credit risk is limited to failure of the clearinghouse. While offset rights may exist under applicable law, a Fund does not have a contractual right of offset against a clearing broker or clearinghouse in the event of a default (including the bankruptcy or insolvency) of the clearing broker or clearinghouse. Additionally, credit risk exists in exchange-traded futures and centrally cleared swaps with respect to initial and variation margin that is held in a clearing broker’s customer accounts. While clearing brokers are required to segregate customer margin from their own assets, in the event that a clearing broker becomes insolvent or goes into bankruptcy and at that time there is a shortfall in the aggregate amount of margin held by the clearing broker for all its clients, typically the shortfall would be allocated on a pro rata basis across all the clearing broker’s customers, potentially resulting in losses to the Funds.
Certain Funds may invest in municipal bonds below investment grade quality (sometimes called “junk bonds”), which are predominantly speculative, have greater credit risk and generally are less liquid and have more volatile prices than higher quality securities.
Certain Funds invest a significant portion of their assets in fixed-income securities and/or use derivatives tied to the fixed-income markets. Changes in market interest rates or economic conditions may affect the value and/or liquidity of such investments. Interest rate risk is the risk that prices of bonds and other fixed-income securities will increase as interest rates fall and decrease as interest rates rise. Certain Funds may be subject to a greater risk of rising interest rates due to the current period of historically low rates.
As of period end, Capital Appreciation invested a significant portion of its assets in securities in the information technology sector. Changes in economic conditions affecting such sectors would have a greater impact on the Funds and could affect the value, income and/or liquidity of positions in such securities.
Certain Funds invest a significant portion of their assets in securities backed by commercial or residential mortgage loans or in issuers that hold mortgage and other asset-backed securities. Investment percentages in these securities are presented in the Schedules of Investments. Changes in economic conditions, including delinquencies and/or defaults on assets underlying these securities, can affect the value, income and/or liquidity of such positions.
Global Allocation invests a significant portion of its assets in securities of issuers located in Europe or with significant exposure to European issuers or countries. The European financial markets have recently experienced volatility and adverse trends due to concerns about economic downturns in, or
| | | | | | |
| 160 | | BLACKROCK SERIES FUND, INC. | | DECEMBER 31, 2015 | | |
| | |
| Notes to Financial Statements (continued) | | |
rising government debt levels of several European countries. These events may spread to other countries in Europe and may affect the value and liquidity of certain of the Fund’s investments.
Certain obligations held by Government Money Market have a credit enhancement or liquidity feature that may, under certain circumstances, provide for repayment of principal and interest on the obligation when due. These enhancements, which may include letters of credit, stand-by bond purchase agreements and/or third party insurance, are issued by financial institutions. The value of the obligations may be affected by changes in creditworthiness of the entities that provide the credit enhancements or liquidity features. The Fund monitors its exposure by reviewing the creditworthiness of the issuers, as well as the financial institutions issuing the credit enhancements and by limiting the amount of holdings with credit enhancements from one financial institution.
11. Capital Share Transactions:
Transactions in capital shares were as follows:
| | | | | | | | | | | | | | | | | | |
| | | Year Ended December 31, 2015 | | | | | Year Ended December 31, 2014 | |
| Balanced Capital | | Shares | | | Amount | | | | | Shares | | | Amount | |
Shares sold | | | 117,058 | | | $ | 2,101,260 | | | | | | 173,956 | | | $ | 3,292,339 | |
Shares issued in reinvestment of distributions. | | | 1,951,620 | | | | 32,946,839 | | | | | | 3,756,338 | | | | 67,300,299 | |
Shares redeemed | | | (2,905,305) | | | | (51,858,373) | | | | | | (2,712,300) | | | | (51,286,376) | |
Net increase (decrease) | | | (836,627) | | | $ | (16,810,274) | | | | | | 1,217,994 | | | $ | 19,306,262 | |
| Capital Appreciation | | | | | | | | | | | | | | |
Shares sold | | | 121,301 | | | $ | 4,316,430 | | | | | | 48,197 | | | $ | 1,838,801 | |
Shares issued in reinvestment of distributions | | | 356,988 | | | | 12,602,085 | | | | | | 756,743 | | | | 26,669,799 | |
Shares redeemed | | | (441,299) | | | | (15,840,803) | | | | | | (416,960) | | | | (15,909,414) | |
Net increase | | | 36,990 | | | $ | 1,077,712 | | | | | | 387,980 | | | $ | 12,599,186 | |
| Global Allocation | | | | | | | | | | | | | | |
Shares sold | | | 255,119 | | | $ | 4,044,874 | | | | | | 252,878 | | | $ | 4,362,238 | |
Shares issued in reinvestment of distributions | | | 1,254,008 | | | | 18,194,965 | | | | | | 1,773,070 | | | | 27,753,243 | |
Shares redeemed | | | (1,959,571) | | | | (30,693,514) | | | | | | (1,759,364) | | | | (30,192,188) | |
Net increase (decrease) | | | (450,444) | | | $ | (8,453,675) | | | | | | 266,584 | | | $ | 1,923,293 | |
| Government Money Market | | | | | | | | | | | | | | |
Shares sold | | | 67,981,846 | | | $ | 67,981,846 | | | | | | 75,570,233 | | | $ | 75,570,233 | |
Shares issued in reinvestment of distributions | | | 8,112 | | | | 8,112 | | | | | | 7,344 | | | | 7,344 | |
Shares redeemed | | | (80,382,310) | | | | (80,382,310) | | | | | | (86,029,287) | | | | (86,029,287) | |
Net decrease | | | (12,392,352) | | | $ | (12,392,352) | | | | | | (10,451,710) | | | $ | (10,451,710) | |
| High Yield | | | | | | | | | | | | | | |
Shares sold | | | 840,318 | | | $ | 4,545,912 | | | | | | 1,792,824 | | | $ | 10,148,869 | |
Shares issued in reinvestment of distributions | | | 385,166 | | | | 2,069,099 | | | | | | 510,156 | | | | 2,902,396 | |
Shares redeemed | | | (1,940,771) | | | | (10,442,450) | | | | | | (3,647,902) | | | | (20,604,657) | |
Net decrease | | | (715,287) | | | $ | (3,827,439) | | | | | | (1,344,922) | | | $ | (7,553,392) | |
| Large Cap Core | | | | | | | | | | | | | | |
Shares sold | | | 83,560 | | | $ | 2,333,322 | | | | | | 132,699 | | | $ | 3,836,037 | |
Shares issued in reinvestment of distributions | | | 398,524 | | | | 10,670,662 | | | | | | 618,571 | | | | 17,389,237 | |
Shares redeemed | | | (682,256) | | | | (19,156,529) | | | | | | (692,810) | | | | (19,856,726) | |
Net increase (decrease) | | | (200,172) | | | $ | (6,152,545) | | | | | | 58,460 | | | $ | 1,368,548 | |
| | | | | | |
| | | BLACKROCK SERIES FUND, INC. | | DECEMBER 31, 2015 | | 161 |
| | |
| Notes to Financial Statements (concluded) | | |
| | | | | | | | | | | | | | | | | | |
| |
| Year Ended
December 31, 2015 |
| | | |
| Year Ended
December 31, 2014 |
|
| Total Return | | Shares | | | Amount | | | | | Shares | | | Amount | |
Shares sold | | | 226,581 | | | | $ 2,653,107 | | | | | | 182,324 | | | | $ 2,123,158 | |
Shares issued in reinvestment of distributions | | | 144,019 | | | | 1,691,408 | | | | | | 186,494 | | | | 2,170,907 | |
Shares redeemed | | | (768,918) | | | | (9,011,373) | | | | | | (970,390) | | | | (11,302,937) | |
Net decrease | | | (398,318) | | | | $(4,666,858) | | | | | | (601,572) | | | | $ (7,008,872) | |
| U.S. Government Bond | | | | | | | | | | | | | | |
Shares sold | | | 108,747 | | | | $ 1,201,268 | | | | | | 88,058 | | | | $ 963,326 | |
Shares issued in reinvestment of distributions | | | 134,501 | | | | 1,487,025 | | | | | | 146,676 | | | | 1,601,037 | |
Shares redeemed | | | (931,280) | | | | (10,266,405) | | | | | | (992,062) | | | | (10,808,083) | |
Net decrease | | | (688,032) | | | | $ (7,578,112) | | | | | | (757,328) | | | | $ (8,243,720) | |
12. Subsequent Events:
Management has evaluated the impact of all subsequent events on the Funds through the date the financial statements were issued and has determined that there were no subsequent events requiring adjustment or additional disclosure in the financial statements.
| | | | | | |
| 162 | | BLACKROCK SERIES FUND, INC. | | DECEMBER 31, 2015 | | |
| | |
| Report of Independent Registered Public Accounting Firm | | |
To the Shareholders and Board of Directors of BlackRock Series Fund, Inc.:
We have audited the accompanying statements of assets and liabilities, including the schedules of investments, of BlackRock Balanced Capital Portfolio, BlackRock Capital Appreciation Portfolio, BlackRock High Yield Portfolio, BlackRock Large Cap Core Portfolio, BlackRock Government Money Market Portfolio (formerly BlackRock Money Market Portfolio), BlackRock Total Return Portfolio and BlackRock U.S. Government Bond Portfolio (collectively, the “Portfolios”) comprising the BlackRock Series Fund, Inc., as of December 31, 2015, the related statements of operations for the year then ended, the statements of changes in net assets for each of the two years in the period then ended, and the financial highlights for each of the five years in the period then ended. We have also audited the accompanying consolidated statement of assets and liabilities, including the consolidated schedule of investments, of BlackRock Global Allocation Portfolio (collectively, with the Portfolios, the “Series”), an additional portfolio of the BlackRock Series Fund, Inc., as of December 31, 2015, the related consolidated statement of operations, the consolidated statements of changes in net assets for each of the two years in the period then ended, and the consolidated financial highlights for each of the five years in the period then ended. These financial statements and financial highlights, including the consolidated financial statements and consolidated financial highlights of BlackRock Global Allocation Portfolio, are the responsibility of the Series’ management. Our responsibility is to express an opinion on these financial statements and financial highlights based on our audits.
We conducted our audits in accordance with the standards of the Public Company Accounting Oversight Board (United States). Those standards require that we plan and perform the audits to obtain reasonable assurance about whether the financial statements and financial highlights are free of material misstatement. The Series is not required to have, nor were we engaged to perform, an audit of its internal control over financial reporting. Our audits included consideration of internal control over financial reporting as a basis for designing audit procedures that are appropriate in the circumstances, but not for the purpose of expressing an opinion on the effectiveness of the Series’ internal control over financial reporting. Accordingly, we express no such opinion. An audit also includes examining, on a test basis, evidence supporting the amounts and disclosures in the financial statements, assessing the accounting principles used and significant estimates made by management, as well as evaluating the overall financial statement presentation. Our procedures included confirmation of securities owned as of December 31, 2015, by correspondence with the custodian, brokers, and agent banks; where replies were not received from brokers or agent banks, we performed other auditing procedures. We believe that our audits provide a reasonable basis for our opinion.
In our opinion, the financial statements and financial highlights referred to above present fairly, in all material respects, the financial positions of BlackRock Balanced Capital Portfolio, BlackRock Capital Appreciation Portfolio, BlackRock High Yield Portfolio, BlackRock Large Cap Core Portfolio, BlackRock Government Money Market Portfolio (formerly BlackRock Money Market Portfolio), BlackRock Total Return Portfolio and BlackRock U.S. Government Bond Portfolio as of December 31, 2015, the results of their operations for the year then ended, the changes in their net assets for each of the two years in the period then ended, and their financial highlights for each the five years in the period then ended, in conformity with accounting principles generally accepted in the United States of America. Additionally, in our opinion, the consolidated financial statements and financial highlights referred to above present fairly, in all material respects, the consolidated financial position of BlackRock Global Allocation Portfolio as of December 31, 2015, the consolidated results of its operations for the year then ended, the consolidated changes in its net assets for each of the two years in the period then ended, and the consolidated financial highlights for each of the five years in the period then ended, in conformity with accounting principles generally accepted in the United States of America.
Deloitte & Touche LLP
Philadelphia, Pennsylvania
February 17, 2016
| | | | | | |
| | | BLACKROCK SERIES FUND, INC. | | DECEMBER 31, 2015 | | 163 |
| | | | | | | | | | |
Name, Address1, and Year of Birth | | Position(s) Held with the Company | | Length of Time Served as a Director3 | | Principal Occupation(s) During Past Five Years | | Number of BlackRock- Advised Registered Investment Companies (“RICs”) Consisting of Investment Portfolios (“Portfolios”) Overseen | | Public Directorships |
| Independent Directors2 | | |
Robert M. Hernandez 1944 | | Chairman of the Board and Director | | Since 2007 | | Director, Vice Chairman and Chief Financial Officer of USX Corporation (energy and steel business) from 1991 to 2001; Director, TE Connectivity (electronics) from 2006 to 2012. | | 28 RICs consisting of 98 Portfolios | | ACE Limited (insurance company); Eastman Chemical Company. |
Fred G. Weiss 1941 | | Vice Chair of the Board and Director | | Since 2007 | | Managing Director, FGW Consultancy LLC (consulting and investment company) since 1997; Director and Treasurer, Michael J. Fox Foundation for Parkinson’s Research since 2000; Director, BTG International plc (medical technology commercialization company) from 2001 to 2007. | | 28 RICs consisting of 98 Portfolios | | Allergan PLC (pharmaceuticals) |
James H. Bodurtha 1944 | | Director | | Since 2007 | | Director, The China Business Group, Inc. (consulting and investing firm) from 1996 to 2013 and Executive Vice President thereof from 1996 to 2003; Chairman of the Board, Berkshire Holding Corporation since 1980. | | 28 RICs consisting of 98 Portfolios | | None |
Bruce R. Bond 1946 | | Director | | Since 2007 | | Trustee and Member of the Governance Committee, State Street Research Mutual Funds from 1997 to 2005; Board Member of Governance, Audit and Finance Committee, Avaya Inc. (computer equipment) from 2003 to 2007. | | 28 RICs consisting of 98 Portfolios | | None |
Valerie G. Brown 1956 | | Director | | Since 2015 | | Chief Executive Officer and Director, Cetera Financial Group (broker-dealer and registered investment adviser services) from 2010 to 2014; Director and Vice Chairman of the Board, Financial Services Institute (trade organization) from 2009 to 2014; Director and Committee Chair, Securities Industry and Financial Markets Association (trade organization) from 2006 to 2014. | | 28 RICs consisting of 98 Portfolios | | None |
Donald W. Burton 1944 | | Director | | Since 2007 | | Managing General Partner, The Burton Partnership, LP (an investment partnership) since 1979; Managing General Partner, The Burton Partnership (QP), LP (an investment partnership) since 2000; Managing General Partner, The South Atlantic Venture Funds from 1983 to 2012; Director, IDology, Inc. (technology solutions) since 2006; Director, Knology, Inc. (telecommunications) from 1996 to 2012; Director, Capital Southwest (financial) from 2006 to 2012. | | 28 RICs consisting of 98 Portfolios | | None |
Honorable Stuart E. Eizenstat 1943 | | Director | | Since 2007 | | Partner and Head of International Practice, Covington and Burling LLP (law firm) since 2001; International Advisory Board Member, The Coca-Cola Company from 2002 to 2011; Advisory Board Member, Veracity Worldwide, LLC (risk management) from 2007 to 2012; Member of the International Advisory Board GML Ltd. (energy) since 2003; Advisory Board Member, BT Americas (telecommunications) from 2004 to 2009. | | 28 RICs consisting of 98 Portfolios | | Alcatel-Lucent (telecommunications); Global Specialty Metallurgical; UPS Corporation (delivery service) |
Kenneth A. Froot 1957 | | Director | | Since 2007 | | Professor, Harvard University from 1993 to 2012. | | 28 RICs consisting of 98 Portfolios | | None |
John F. O’Brien 1943 | | Director | | Since 2007 | | Chairman, Woods Hole Oceanographic Institute since 2009 and Trustee thereof from 2003 to 2009. | | 28 RICs consisting of 98 Portfolios | | Cabot Corporation (chemicals); LKQ Corporation (auto parts manufacturing); TJX Companies, Inc. (retailer) |
Donald C. Opatrny 1952 | | Director | | Since 2015 | | Trustee, Member of the Executive Committee and Chair of the Investment Committee, Cornell University since 2004; Member of the Board and Investment Committee, University School since 2007; Member of the Investment Committee, Mellon Foundation from 2009 to 2015; President and Trustee, the Center for the Arts, Jackson Hole since 2011; Director, Athena Capital Advisors LLC (investment management firm) since 2013; Trustee and Chair of the Investment Committee, Community Foundation of Jackson Hole since 2014; Trustee, Artstor (a Mellon Foundation affiliate) since 2010; President, Trustee and Member of the Investment Committee, The Aldrich Contemporary Art Museum from 2007 to 2014. | | 28 RICs consisting of 98 Portfolios | | None |
| | | | | | |
| 164 | | BLACKROCK SERIES FUND, INC. | | DECEMBER 31, 2015 | | |
| | |
| Officers and Directors (continued) | | |
| | | | | | | | | | |
Name, Address1, and Year of Birth | | Position(s) Held with the Company | | Length of Time Served as a Director3 | | Principal Occupation(s) During Past Five Years | | Number of BlackRock- Advised Registered Investment Companies (“RICs”) Consisting of Investment Portfolios (“Portfolios”) Overseen | | Public Directorships |
| Independent Directors1 (concluded) | | |
Roberta Cooper Ramo 1942 | | Director | | Since 2007 | | Shareholder and Attorney, Modrall, Sperling, Roehl, Harris & Sisk, P.A. (law firm) since 1993; Chairman of the Board, Cooper’s Inc. (retail) since 1999; Director, ECMC Group (service provider to students, schools and lenders) since 2001; President, The American Law Institute (non-profit) since 2008; Vice President, Santa Fe Opera (non-profit) since 2011; Chair, Think New Mexico (non-profit), since 2013. | | 28 RICs consisting of 98 Portfolios | | None |
David H. Walsh 1941 | | Director | | Since 2007 | | Director, National Museum of Wildlife Art since 2007; Trustee, University of Wyoming Foundation from 2008 to 2012; Director, The American Museum of Fly Fishing since 1997. | | 28 RICs consisting of 98 Portfolios | | None |
| | 1 The address of each Director and Officer is c/o BlackRock, Inc., Park Avenue Plaza 55 East 52nd Street New York, NY 10055. 2 Each Independent Director holds office until his or her successor is duly elected and qualifies or until his or her earlier death, resignation, retirement or removal as provided by the Company’s by-laws or charter or statute. In no event may an Independent Director hold office beyond December 31 of the year in which he or she turns 75. 3 Date shown is the earliest date a person has served for the Company. Following the combination of Merrill Lynch Investment Managers, L.P. (“MLIM”) and BlackRock, Inc. (“BlackRock”) in September 2006, the various legacy MLIM and legacy BlackRock fund boards were realigned and consolidated into three new fund boards in 2007. As a result, although the chart shows certain Directors as joining the Company’s board in 2007, those Directors first became members of the boards of other legacy MLIM or legacy BlackRock funds as follows: James H. Bodurtha, 1995; Bruce R. Bond, 2005; Donald W. Burton, 2002; Honorable Stuart E. Eizenstat, 2001; Kenneth A. Froot, 2005; Robert M. Hernandez, 1996; John F. O’Brien, 2005; Roberta Cooper Ramo, 1999; David H. Walsh, 2003; and Fred G. Weiss, 1998. |
| Interested Directors4 | | |
Robert Fairbairn 1965 | | Director | | Since 2015 | | Senior Managing Director of BlackRock since 2010; Global Head of BlackRock’s Retail and iShares businesses since 2012; Member of BlackRock’s Global Executive and Global Operating Committees; Head of BlackRock’s Global Client Group from 2009 to 2012; Chairman of BlackRock’s international businesses from 2007 to 2010. | | 28 RICs consisting of 98 Portfolios | | None |
Henry Gabbay 1947 | | Director | | Since 2007 | | Consultant, BlackRock from 2007 to 2008; Managing Director, BlackRock from 1989 to 2007; Chief Administrative Officer, BlackRock Advisors, LLC from 1998 to 2007; President of BlackRock Funds and BlackRock Allocation Target Shares (formerly, BlackRock Bond Allocation Target Shares) from 2005 to 2007 and Treasurer of certain closed-end funds in the BlackRock fund complex from 1989 to 2006. | | 28 RICs consisting of 98 Portfolios | | None |
John M. Perlowski 1964 | | Director | | Director (Since 2015); President and Chief Executive Officer (Since 2010) | | Managing Director of BlackRock since 2009; Head of BlackRock Global Fund Services since 2009; Managing Director and Chief Operating Officer of the Global Product Group at Goldman Sachs Asset Management, L.P. from 2003 to 2009; Treasurer of Goldman Sachs Mutual Funds from 2003 to 2009 and Senior Vice President thereof from 2007 to 2009; Director of Goldman Sachs Offshore Funds from 2002 to 2009; Director of Family Resource Network (charitable foundation) since 2009. | | 136 RICs consisting of 328 Portfolios | | None |
| | 4 Messrs. Fairbairn and Perlowski are both “interested persons,” as defined in the 1940 Act, of the Company based on their positions with BlackRock and its affiliates. Mr. Gabbay may be deemed an “interested person” of the Company based on his former positions with BlackRock and its affiliates. Mr. Gabbay does not currently serve as an officer or employee of BlackRock or its affiliates or own any securities of BlackRock or The PNC Financial Services Group, Inc. Mr. Gabbay is a non-management Interested Director. Interested Directors serve until their successor is duly elected and qualifies or until their earlier death, resignation, retirement or removal as provided by the Company’s by-laws or charter or statute,or until December 31 of the year in which they turn 72. Officers of the Company serve at the pleasure of the Board. |
| | | | | | |
| | | BLACKROCK SERIES FUND, INC. | | DECEMBER 31, 2015 | | 165 |
| | |
| Officers and Directors (concluded) | | |
| | | | | | |
Name, Address1, and Year of Birth | | Position(s) Held with the Company | | Length of Time Served | | Principal Occupation(s) During Past Five Years |
| Officers2 | | | | | | |
John M. Perlowski 1964 | | Director, President and Chief Executive Officer | | Since 2015 (Director) Since 2010 (President and Chief Executive Officer) | | Managing Director of BlackRock since 2009; Head of BlackRock Global Fund Services since 2009; Managing Director and Chief Operating Officer of the Global Product Group at Goldman Sachs Asset Management, L.P. from 2003 to 2009; Treasurer of Goldman Sachs Mutual Funds from 2003 to 2009 and Senior Vice President thereof from 2007 to 2009; Director of Goldman Sachs Offshore Funds from 2002 to 2009; Director of Family Resource Network (charitable foundation) since 2009. |
Jennifer McGovern 1977 | | Vice President | | Since 2014 | | Director of BlackRock, since 2011; Head of Product Structure and Oversight for BlackRock’s U.S. Wealth Advisory Group since 2013; Vice President of BlackRock, Inc. from 2008 to 2010. |
Neal Andrews 1966 | | Chief Financial Officer | | Since 2007 | | Managing Director of BlackRock since 2006; Senior Vice President and Line of Business Head of Fund Accounting and Administration at PNC Global Investment Servicing (U.S.) Inc. from 1992 to 2006. |
Jay Fife 1970 | | Treasurer | | Since 2007 | | Managing Director of BlackRock since 2007; Director of BlackRock in 2006; Assistant Treasurer of the MLIM and Fund Asset Management, L.P. advised funds from 2005 to 2006; Director of MLIM Fund Services Group from 2001 to 2006. |
Charles Park 1967 | | Chief Compliance Officer | | Since 2014 | | Anti-Money Laundering Compliance Officer for the BlackRock-advised Funds in the Equity-Bond Complex, the Equity-Liquidity Complex and the Closed-End Complex from 2014 to 2015; Chief Compliance Officer of BlackRock Advisors, LLC and the BlackRock-advised Funds in the Equity-Bond Complex, the Equity-Liquidity Complex and the Closed-End Complex since 2014; Principal of and Chief Compliance Officer for iShares® Delaware Trust Sponsor LLC since 2012 and BlackRock Fund Advisors (“BFA”) since 2006; Chief Compliance Officer for the BFA-advised iShares exchange traded funds since 2006; Chief Compliance Officer for BlackRock Asset Management International Inc. since 2012. |
Fernanda Piedra 1969 | | Anti-Money Laundering Compliance Officer | | Since 2015 | | Director of BlackRock since 2014; Anti-Money Laundering Compliance Officer and Regional Head of Financial Crime for the Americas at BlackRock since 2014; Head of Regulatory Changes and Remediation for the Asset Wealth Management Division of Deutsche Bank from 2010 to 2014; Vice President of Goldman Sachs (Anti-Money Laundering/Suspicious Activities Group) from 2004 to 2010. |
Benjamin Archibald 1975 | | Secretary | | Since 2012 | | Managing Director of BlackRock since 2014; Director of BlackRock from 2010 to 2013; Secretary of the iShares exchange traded funds since 2015; Secretary of the BlackRock-advised mutual funds since 2012. |
| | 1 The address of each Officer is c/o BlackRock, Inc., Park Avenue Plaza, 55 East 52nd Street, New York, NY 10055 2 Officers of the Company serve at the pleasure of the Board. |
| | | Further information about the Fund’s Officers and Directors is available in the Fund’s Statement of Additional Information, which can be obtained without charge by calling 1-800-441-7762. |
| | | | | | |
| | | | |
Investment Advisor BlackRock Advisors, LLC Wilmington, DE 19809 | | Accounting Agent and Transfer Agent BNY Mellon Investment Servicing (US) Inc. Wilmington, DE 19809 | | Independent Registered Public Accounting Firm Deloitte & Touche LLP Philadelphia, PA 19103 | | Address of the Funds 100 Bellevue Parkway Wilmington, DE 19809 |
| | | | | | |
Custodian The Bank of New York Mellon1 New York, NY 10286 Brown Brothers Harriman & Co.2 Boston, MA 02109 | | Independent Registered Public Accounting Firm Deloitte & Touche LLP Philadelphia, PA 19103 | | Legal Counsel Willkie Farr & Gallagher LLP New York, NY 10019 | | |
| 1 | For all Funds except BlackRock Global Allocation Portfolio. |
| 2 | For BlackRock Global Allocation Portfolio. |
| | | | | | |
| 166 | | BLACKROCK SERIES FUND, INC. | | DECEMBER 31, 2015 | | |
Availability of Quarterly Schedule of Investments
The Funds file their complete schedule of portfolio holdings with the SEC for the first and third quarters of each fiscal year on Form N-Q. The Funds’ Forms N-Q are available on the SEC’s website at http://www.sec.gov and may also be reviewed and copied at the SEC’s Public Reference Room in Washington, DC. Information on how to access documents on the SEC’s website without charge may be obtained by calling (800) SEC-0330. The Funds’ Forms N-Q may also be obtained upon request and without charge by calling (800) 441-7762.
Availability of Proxy Voting Policies and Procedures
A description of the policies and procedures that the Funds use to determine how to vote proxies relating to portfolio securities is available (1) without charge, upon request, by calling (800) 441-7762; (2) at http://www.blackrock.com/prospectus/insurance; and (3) on the SEC’s website at http:// www.sec.gov.
Availability of Proxy Voting Record
Information about how the Funds voted proxies relating to securities held in the Funds’ portfolios during the most recent 12-month period ended June 30 is available, upon request and without charge (1) at http://www.blackrock.com/prospectus/insurance or by calling (800) 441-7762 and (2) on the SEC’s website at http://www.sec.gov.
|
| BlackRock Privacy Principles |
BlackRock is committed to maintaining the privacy of its current and former fund investors and individual clients (collectively, “Clients”) and to safeguarding their non-public personal information. The following information is provided to help you understand what personal information BlackRock collects, how we protect that information and why in certain cases we share such information with select parties.
If you are located in a jurisdiction where specific laws, rules or regulations require BlackRock to provide you with additional or different privacy-related rights beyond what is set forth below, then BlackRock will comply with those specific laws, rules or regulations.
BlackRock obtains or verifies personal non-public information from and about you from different sources, including the following: (i) information we receive from you or, if applicable, your financial intermediary, on applications, forms or other documents; (ii) information about your transactions with us, our affiliates, or others; (iii) information we receive from a consumer reporting agency; and (iv) from visits to our websites.
BlackRock does not sell or disclose to non-affiliated third parties any non-public personal information about its Clients, except as permitted by lawor as is necessary to respond to regulatory requests or to service Client accounts. These non-affiliated third parties are required to protect the confidentiality and security of this information and to use it only for its intended purpose.
We may share information with our affiliates to service your account or to provide you with information about other BlackRock products or services that may be of interest to you. In addition, BlackRock restricts access to non-public personal information about its Clients to those BlackRock employees with a legitimate business need for the information. BlackRock maintains physical, electronic and procedural safeguards that are designed to protect the non-public personal information of its Clients, including procedures relating to the proper storage and disposal of such information.
| | | | | | |
| | | BLACKROCK SERIES FUND, INC. | | DECEMBER 31, 2015 | | 167 |
This report is authorized for distribution only to Policyowners of certain variable life insurance policies, which are funded by shares of BlackRock Series Fund, Inc. This report is not authorized for use as an offer of sale or a solicitation of an offer to buy shares of the Fund or the policies. Past performance results shown in this report should not be considered a representation of future performance. Investment returns and principal value of shares will fluctuate so that shares, when redeemed, may be worth more or less than their original cost. Performance information used throughout this report does not include insurance-related fees and expenses. An investment in BlackRock Government Money Market Portfolio is not insured or guaranteed by the Federal Deposit Insurance Corporation or any other Government agency. Although BlackRock Government Money Market Portfolio seeks to preserve the value of your investment at $1.00 per share, it is possible to lose money by investing in the Portfolio. Statements and other information herein are as dated and are subject to change. Please see the Fund’s prospectus for a description of risks associated with global investments.

| | |
| |
Series8-12/15-AR | |  |
| | |
| Item 2 – | | Code of Ethics – The registrant (or the “Fund”) has adopted a code of ethics, as of the end of the period covered by this report, applicable to the registrant’s principal executive officer, principal financial officer, principal accounting officer or controller, or persons performing similar functions. During the period covered by this report, the code of ethics was amended to update certain information and to make other non-material changes. During the period covered by this report, there have been no waivers granted under the code of ethics. The registrant undertakes to provide a copy of the code of ethics to any person upon request, without charge, by calling 1-800-441-7762. |
| |
| Item 3 – | | Audit Committee Financial Expert – The registrant’s board of directors (the “board of directors”), has determined that (i) the registrant has the following audit committee financial experts serving on its audit committee and (ii) each audit committee financial expert is independent: |
| |
| | Robert M. Hernandez |
| | Fred G. Weiss |
| | Stuart E. Eizenstat |
| | Bruce R. Bond |
| |
| | Under applicable securities laws, a person determined to be an audit committee financial expert will not be deemed an “expert” for any purpose, including without limitation for the purposes of Section 11 of the Securities Act of 1933, as a result of being designated or identified as an audit committee financial expert. The designation or identification of a person as an audit committee financial expert does not impose on such person any duties, obligations, or liabilities greater than the duties, obligations, and liabilities imposed on such person as a member of the audit committee and board of directors in the absence of such designation or identification. |
| |
| Item 4 – | | Principal Accountant Fees and Services |
| |
| | The following table presents fees billed by Deloitte & Touche LLP (“D&T”) in each of the last two fiscal years for the services rendered to the Fund: |
| | | | | | | | | | | | | | | | |
| | | (a) Audit Fees | | (b) Audit-Related Fees1 | | (c) Tax Fees2 | | (d) All Other Fees3 |
| Entity Name | | Current Fiscal Year End | | Previous Fiscal Year End | | Current Fiscal Year End | | Previous Fiscal Year End | | Current Fiscal Year End | | Previous Fiscal Year End | | Current Fiscal Year End | | Previous Fiscal Year End |
| BlackRock Balanced Capital Portfolio | | $35,263 | | $35,439 | | $0 | | $0 | | $15,657 | | $15,350 | | $0 | | $0 |
| BlackRock Capital Appreciation Portfolio | | $26,538 | | $24,859 | | $0 | | $0 | | $13,107 | | $12,850 | | $0 | | $0 |
| BlackRock Global Allocation Portfolio | | $39,488 | | $30,869 | | $0 | | $0 | | $20,000 | | $15,350 | | $0 | | $0 |
| BlackRock Government Money Market Portfolio (Formerly BlackRock Money Market Portfolio) | | $22,188 | | $22,233 | | $0 | | $0 | | $9,792 | | $9,600 | | $0 | | $0 |
| BlackRock High Yield Portfolio | | $33,838 | | $31,348 | | $0 | | $0 | | $10,149 | | $9,950 | | $0 | | $0 |
| BlackRock Large Cap Core Portfolio | | $23,788 | | $23,849 | | $0 | | $0 | | $13,107 | | $13,850 | | $0 | | $0 |
| BlackRock Total Return Portfolio | | $40,688 | | $40,918 | | $0 | | $0 | | $14,535 | | $14,250 | | $0 | | $0 |
2
| | | | | | | | | | | | | | | | |
| BlackRock U.S. Government Bond Portfolio | | $42,963 | | $43,216 | | $0 | | $0 | | $15,402 | | $15,100 | | $0 | | $0 |
| | |
| | The following table presents fees billed by D&T that were required to be approved by the registrant’s audit committee (the “Committee”) for services that relate directly to the operations or financial reporting of the Fund and that are rendered on behalf of BlackRock Advisors, LLC (“Investment Adviser” or “BlackRock”) and entities controlling, controlled by, or under common control with BlackRock (not including any sub-adviser whose role is primarily portfolio management and is subcontracted with or overseen by another investment adviser) that provide ongoing services to the Fund (“Fund Service Providers”): |
| | | | |
| | | Current Fiscal Year End | | Previous Fiscal Year End |
(b) Audit-Related Fees1 | | $0 | | $0 |
(c) Tax Fees2 | | $0 | | $0 |
(d) All Other Fees3 | | $2,391,000 | | $2,555,000 |
1 The nature of the services includes assurance and related services reasonably related to the performance of the audit of financial statements not included in Audit Fees.
2 The nature of the services includes tax compliance, tax advice and tax planning.
3 Aggregate fees borne by BlackRock in connection with the review of compliance procedures and attestation thereto performed by D&T with respect to all of the registered closed-end funds and some of the registered open-end funds advised by BlackRock.
(e)(1) Audit Committee Pre-Approval Policies and Procedures:
| | |
| | The Committee has adopted policies and procedures with regard to the pre-approval of services. Audit, audit-related and tax compliance services provided to the registrant on an annual basis require specific pre-approval by the Committee. The Committee also must approve other non-audit services provided to the registrant and those non-audit services provided to the Investment Adviser and Fund Service Providers that relate directly to the operations and the financial reporting of the registrant. Certain of these non-audit services that the Committee believes are (a) consistent with the SEC’s auditor independence rules and (b) routine and recurring services that will not impair the independence of the independent accountants may be approved by the Committee without consideration on a specific case-by-case basis (“general pre-approval”). The term of any general pre-approval is 12 months from the date of the pre-approval, unless the Committee provides for a different period. Tax or other non-audit services provided to the registrant which have a direct impact on the operations or financial reporting of the registrant will only be deemed pre-approved provided that any individual project does not exceed $10,000 attributable to the registrant or $50,000 per project. For this purpose, multiple projects will be aggregated to determine if they exceed the previously mentioned cost levels. |
| |
| | Any proposed services exceeding the pre-approved cost levels will require specific pre-approval by the Committee, as will any other services not subject to general pre-approval (e.g., unanticipated but permissible services). The Committee is informed of each service approved subject to general pre-approval at the next regularly scheduled in-person board meeting. At this meeting, an analysis of such services is presented to the Committee for ratification. The Committee may delegate to the Committee Chairman the authority to approve the provision of and fees for any |
3
| | |
| | specific engagement of permitted non-audit services, including services exceeding pre-approved cost levels. |
| |
| | (e)(2) None of the services described in each of Items 4(b) through (d) were approved by the Committee pursuant to the de minimis exception in paragraph (c)(7)(i)(C) of Rule 2-01 of Regulation S-X. |
| |
| | (f) Not Applicable |
| |
| | (g) The aggregate non-audit fees paid to the accountant for services rendered by the accountant to the registrant, the Investment Adviser and the Fund Service Providers were: |
| | | | | | |
| | Entity Name | | Current Fiscal Year End | | Previous Fiscal Year End |
| | BlackRock Balanced Capital Portfolio | | $15,657 | | $15,350 |
| | BlackRock Capital Appreciation Portfolio | | $13,107 | | $12,850 |
| | BlackRock Global Allocation Portfolio | | $20,000 | | $15,350 |
| | BlackRock Government Money Market Portfolio (Formerly BlackRock Money Market Portfolio) | | $9,792 | | $9,600 |
| | BlackRock High Yield Portfolio | | $10,149 | | $9,950 |
| | BlackRock Large Cap Core Portfolio | | $13,107 | | $12,850 |
| | BlackRock Total Return Portfolio | | $14,535 | | $14,250 |
| | BlackRock U.S. Government Bond Portfolio | | $15,402 | | $15,100 |
| | | | |
| | Additionally, SSAE 16 Review (Formerly, SAS No. 70) fees for the current and previous fiscal years of $2,391,000 and $2,555,000, respectively, were billed by D&T to the Investment Adviser. | | |
| | |
| | (h) The Committee has considered and determined that the provision of non-audit services that were rendered to the Investment Adviser and the Fund Service Providers that were not pre-approved pursuant to paragraph (c)(7)(ii) of Rule 2-01 of Regulation S-X is compatible with maintaining the principal accountant’s independence. | | |
| | |
| Item 5 – | | Audit Committee of Listed Registrants – Not Applicable | | |
| | |
| Item 6 – | | Investments | | |
| | (a) The registrant’s Schedule of Investments is included as part of the Report to Stockholders filed under Item 1 of this Form. | | |
| | |
| | (b) Not Applicable due to no such divestments during the semi-annual period covered since the previous Form N-CSR filing. | | |
| | |
| Item 7 – | | Disclosure of Proxy Voting Policies and Procedures for Closed-End Management Investment Companies – Not Applicable | | |
4
| | | | |
| Item 8 – | | Portfolio Managers of Closed-End Management Investment Companies – Not Applicable | | |
| | |
| Item 9 – | | Purchases of Equity Securities by Closed-End Management Investment Company and Affiliated Purchasers – Not Applicable | | |
| | |
| Item 10 – | | Submission of Matters to a Vote of Security Holders – There have been no material changes to these procedures. | | |
| | |
| Item 11 – | | Controls and Procedures | | |
| | |
| | (a) – The registrant’s principal executive and principal financial officers, or persons performing similar functions, have concluded that the registrant’s disclosure controls and procedures (as defined in Rule 30a-3(c) under the Investment Company Act of 1940, as amended (the “1940 Act”)) are effective as of a date within 90 days of the filing of this report based on the evaluation of these controls and procedures required by Rule 30a-3(b) under the 1940 Act and Rule 15d-15(b) under the Securities Exchange Act of 1934, as amended. | | |
| | |
| | (b) – There were no changes in the registrant’s internal control over financial reporting (as defined in Rule 30a-3(d) under the 1940 Act) that occurred during the second fiscal quarter of the period covered by this report that have materially affected, or are reasonably likely to materially affect, the registrant’s internal control over financial reporting. | | |
| | |
| Item 12 – | | Exhibits attached hereto | | |
| | |
| | (a)(1) – Code of Ethics – See Item 2 | | |
| | |
| | (a)(2) – Certifications – Attached hereto | | |
| | |
| | (a)(3) – Not Applicable | | |
| | |
| | (b) – Certifications – Attached hereto | | |
5
Pursuant to the requirements of the Securities Exchange Act of 1934 and the Investment Company Act of 1940, the registrant has duly caused this report to be signed on its behalf by the undersigned, thereunto duly authorized.
BlackRock Series Fund, Inc.
| | | | |
| By: | | /s/ John M. Perlowski | | |
| | John M. Perlowski | | |
| | Chief Executive Officer (principal executive officer) of |
| | BlackRock Series Fund, Inc. |
Date: February 26, 2016
Pursuant to the requirements of the Securities Exchange Act of 1934 and the Investment Company Act of 1940, this report has been signed below by the following persons on behalf of the registrant and in the capacities and on the dates indicated.
| | | | |
| By: | | /s/ John M. Perlowski | | |
| | John M. Perlowski | | |
| | Chief Executive Officer (principal executive officer) of |
| | BlackRock Series Fund, Inc. |
|
| Date: February 26, 2016 |
| | |
| By: | | /s/ Neal J. Andrews | | |
| | Neal J. Andrews | | |
| | Chief Financial Officer (principal financial officer) of |
| | BlackRock Series Fund, Inc. |
Date: February 26, 2016
6