UNITED STATES
SECURITIES AND EXCHANGE COMMISSION
Washington, D.C. 20549
Form N-CSR
CERTIFIED SHAREHOLDER REPORT OF REGISTERED
MANAGEMENT INVESTMENT COMPANIES
Investment Company Act File Number: 811-03101
CALVERT MANAGEMENT SERIES
(Exact Name of Registrant as Specified in Charter)
1825 Connecticut Avenue NW, Suite 400, Washington, DC 20009
(Address of Principal Executive Offices)
Maureen A. Gemma
Two International Place, Boston, Massachusetts 02110
(Name and Address of Agent for Services)
(202) 238-2200
(Registrant’s Telephone Number)
September 30
Date of Fiscal Year End
September 30, 2020
Date of Reporting Period
| Item 1. | Reports to Stockholders |


| % Average Annual Total Returns1,2 | Class Inception Date | Performance Inception Date | One Year | Five Years | Since Inception |
| Class A at NAV | 10/10/2017 | 10/10/2017 | (1.05)% | —% | 1.54% |
| Class A with 3.75% Maximum Sales Charge | — | — | (4.77) | — | 0.24 |
| Class I at NAV | 10/10/2017 | 10/10/2017 | (0.83) | — | 1.74 |
| Class R6 at NAV | 10/10/2017 | 10/10/2017 | (0.83) | — | 1.61 |
| S&P/LSTA Leveraged Loan Index | — | — | 1.06% | 4.01% | 3.05% |
| % Total Annual Operating Expense Ratios3 | Class A | Class I | Class R6 |
| Gross | 2.29% | 2.04% | 1.99% |
| Net | 1.98 | 1.73 | 1.73 |
| % Total Leverage4 | |
| Borrowings | 18.85% |
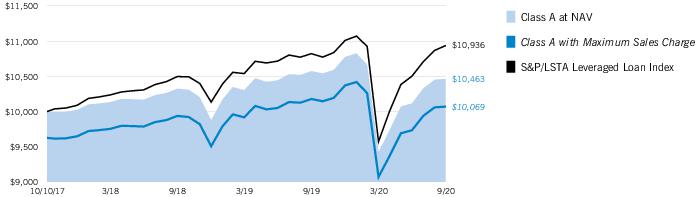
| Growth of Investment | Amount Invested | Period Beginning | At NAV | With Maximum Sales Charge |
| Class I | $250,000 | 10/10/2017 | $263,166 | N.A. |
| Class R6 | $1,000,000 | 10/10/2017 | $1,048,793 | N.A. |
| Top 10 Sectors (% of total investments)* | |
| Electronics/Electrical | 17.6% |
| Health Care | 12.1 |
| Business Equipment and Services | 8.4 |
| Telecommunications | 6.2 |
| Industrial Equipment | 5.8 |
| Insurance | 3.8 |
| Radio and Television | 3.2 |
| Cable and Satellite Television | 3.1 |
| Leisure Goods/Activities/Movies | 3.0 |
| Chemicals and Plastics | 2.3 |
| Total | 65.5% |
| * | Excludes cash and cash equivalents. |
| † | The views expressed in this report are those of the portfolio manager(s) and are current only through the date stated at the top of this page. These views are subject to change at any time based upon market or other conditions, and Calvert and the Fund(s) disclaim any responsibility to update such views. These views may not be relied upon as investment advice and, because investment decisions are based on many factors, may not be relied upon as an indication of trading intent on behalf of any Calvert fund. This commentary may contain statements that are not historical facts, referred to as “forward-looking statements.” The Fund’s actual future results may differ significantly from those stated in any forward-looking statement, depending on factors such as changes in securities or financial markets or general economic conditions, the volume of sales and purchases of Fund shares, the continuation of investment advisory, administrative and service contracts, and other risks discussed from time to time in the Fund’s filings with the Securities and Exchange Commission. |
| 1 | S&P/LSTA Leveraged Loan Index is an unmanaged index of the institutional leveraged loan market. S&P/LSTA Leveraged Loan indices are a product of S&P Dow Jones Indices LLC (“S&P DJI”) and have been licensed for use. S&P® is a registered trademark of S&P DJI; Dow Jones® is a registered trademark of Dow Jones Trademark Holdings LLC (“Dow Jones”); LSTA is a trademark of Loan Syndications and Trading Association, Inc. S&P DJI, Dow Jones, their respective affiliates and their third party licensors do not sponsor, endorse, sell or promote the Fund, will not have any liability with respect thereto and do not have any liability for any errors, omissions, or interruptions of the S&P Dow Jones Indices. Unless otherwise stated, index returns do not reflect the effect of any applicable sales charges, commissions, expenses, taxes or leverage, as applicable. It is not possible to invest directly in an index. |
| 2 | Total Returns at NAV do not include applicable sales charges. If sales charges were deducted, the returns would be lower. Total Returns shown with maximum sales charge reflect the stated maximum sales charge. Unless otherwise stated, performance does not reflect the deduction of taxes on Fund distributions or redemptions of Fund shares. Performance since inception for an index, if presented, is the performance since the Fund’s or oldest share class’ inception, as applicable. |
| 3 | Source: Fund prospectus. Net expense ratios reflect a contractual expense reimbursement that continues through 1/31/21. Without the reimbursement, performance would have been lower. The expense ratios for the current reporting period can be found in the Financial Highlights section of this report. |
| 4 | Total leverage is shown as a percentage of the Fund’s aggregate net assets plus borrowings outstanding. The Fund employs leverage through borrowings. Use of leverage creates an opportunity for income, but creates risks including greater volatility of NAV. The cost of borrowings rises and falls with changes in short-term interest rates. The Fund may be required to maintain prescribed asset coverage for its borrowings and may be required to reduce its borrowings at an inopportune time.Fund profile subject to change due to active management. |
| Beginning Account Value (4/1/20) | Ending Account Value (9/30/20) | Expenses Paid During Period* (4/1/20 – 9/30/20) | Annualized Expense Ratio | |
| Actual | ||||
| Class A | $1,000.00 | $1,110.00 | $6.86 ** | 1.30% |
| Class I | $1,000.00 | $1,111.40 | $5.54 ** | 1.05% |
| Class R6 | $1,000.00 | $1,111.40 | $5.54 ** | 1.05% |
| Hypothetical | ||||
| (5% return per year before expenses) | ||||
| Class A | $1,000.00 | $1,018.50 | $6.56 ** | 1.30% |
| Class I | $1,000.00 | $1,019.75 | $5.30 ** | 1.05% |
| Class R6 | $1,000.00 | $1,019.75 | $5.30 ** | 1.05% |
| * | Expenses are equal to the Fund's annualized expense ratio for the indicated Class, multiplied by the average account value over the period, multiplied by 183/366 (to reflect the one-half year period). The Example assumes that the $1,000 was invested at the net asset value per share determined at the close of business on March 31, 2020. |
| ** | Absent a waiver and/or reimbursement of expenses by an affiliate, expenses would be higher. |
| Common Stocks — 0.2% |
| Security | Shares | Value | |
| Software — 0.2% | |||
| Software Luxembourg Holdings S.A., Class A(1)(2) | 957 | $ 138,765 | |
| Total Common Stocks (identified cost $138,765) | $ 138,765 | ||
| Corporate Bonds — 4.7% |
| Security | Principal Amount (000's omitted) | Value | |
| Air Transport — 0.4% | |||
| Delta Air Lines, Inc., 7.00%, 5/1/25(3) | $ | 50 | $ 54,967 |
| Delta Air Lines, Inc./SkyMiles IP, Ltd.: | |||
| 4.50%, 10/20/25(3) | 100 | 102,712 | |
| 4.75%, 10/20/28(3) | 100 | 103,898 | |
| Spirit Loyalty Cayman, Ltd./Spirit IP Cayman, Ltd., 8.00%, 9/20/25(3) | 50 | 53,038 | |
| $ 314,615 | |||
| Automotive — 0.1% | |||
| Clarios Global, L.P.: | |||
| 6.25%, 5/15/26(3) | $ | 25 | $ 26,260 |
| 6.75%, 5/15/25(3) | 25 | 26,352 | |
| $ 52,612 | |||
| Building and Development — 0.2% | |||
| American Builders & Contractors Supply Co., Inc., 4.00%, 1/15/28(3) | $ | 25 | $ 25,448 |
| Cushman & Wakefield US Borrower, LLC, 6.75%, 5/15/28(3) | 50 | 52,064 | |
| Park Intermediate Holdings, LLC/PK Domestic Property, LLC/PK Finance Co-Issuer, 5.875%, 10/1/28(3) | 100 | 100,500 | |
| $ 178,012 | |||
| Business Equipment and Services — 0.3% | |||
| Allied Universal Holdco, LLC, 6.625%, 7/15/26(3) | $ | 75 | $ 79,969 |
| Garda World Security Corp., 4.625%, 2/15/27(3) | 75 | 75,562 | |
| Prime Security Services Borrower, LLC/Prime Finance, Inc., 5.75%, 4/15/26(3) | 75 | 80,370 | |
| $ 235,901 | |||
| Cable and Satellite Television — 0.1% | |||
| Virgin Media Secured Finance PLC, 4.50%, 8/15/30(3) | $ | 75 | $ 77,133 |
| $ 77,133 | |||
| Security | Principal Amount (000's omitted) | Value | |
| Containers and Glass Products — 0.7% | |||
| Reynolds Group Issuer, Inc./Reynolds Group Issuer, LLC: | |||
| 4.00%, 10/15/27(3)(4) | $ | 75 | $ 75,577 |
| 5.125%, 7/15/23(3) | 405 | 410,265 | |
| $ 485,842 | |||
| Ecological Services and Equipment — 0.1% | |||
| GFL Environmental, Inc., 4.25%, 6/1/25(3) | $ | 75 | $ 75,891 |
| $ 75,891 | |||
| Financial Intermediaries — 0.0%(5) | |||
| AG Issuer, LLC, 6.25%, 3/1/28(3) | $ | 25 | $ 24,938 |
| $ 24,938 | |||
| Food, Beverage & Tobacco — 0.2% | |||
| Del Monte Foods, Inc., 11.875%, 5/15/25(3) | $ | 100 | $ 105,813 |
| $ 105,813 | |||
| Health Care — 1.6% | |||
| Avantor, Inc., 6.00%, 10/1/24(3) | $ | 300 | $ 313,875 |
| HCA, Inc., 5.25%, 4/15/25 | 750 | 866,134 | |
| $ 1,180,009 | |||
| Industrial Equipment — 0.1% | |||
| Clark Equipment Co., 5.875%, 6/1/25(3) | $ | 25 | $ 25,938 |
| Vertical US Newco, Inc., 5.25%, 7/15/27(3) | 50 | 52,057 | |
| $ 77,995 | |||
| Leisure Goods/Activities/Movies — 0.1% | |||
| Sabre GLBL, Inc.: | |||
| 7.375%, 9/1/25(3) | $ | 25 | $ 25,287 |
| 9.25%, 4/15/25(3) | 25 | 27,561 | |
| Six Flags Theme Parks, Inc., 7.00%, 7/1/25(3) | 25 | 26,641 | |
| $ 79,489 | |||
| Radio and Television — 0.1% | |||
| Diamond Sports Group, LLC/Diamond Sports Finance Co., 5.375%, 8/15/26(3) | $ | 50 | $ 35,496 |
| iHeartCommunications, Inc.: | |||
| 4.75%, 1/15/28(3) | 25 | 23,603 | |
| 5.25%, 8/15/27(3) | 25 | 24,417 | |
| $ 83,516 | |||
| Technology — 0.3% | |||
| Boxer Parent Co., Inc., 7.125%, 10/2/25(3) | $ | 50 | $ 53,475 |
| Logan Merger Sub, Inc., 5.50%, 9/1/27(3) | 75 | 76,266 | |
| Security | Principal Amount (000's omitted) | Value | |
| Technology (continued) | |||
| Veritas US, Inc./Veritas Bermuda, Ltd., 7.50%, 9/1/25(3) | $ | 100 | $ 103,250 |
| $ 232,991 | |||
| Telecommunications — 0.4% | |||
| CenturyLink, Inc., 4.00%, 2/15/27(3) | $ | 125 | $ 127,160 |
| Vmed O2 UK Financing I PLC, 4.25%, 1/31/31(3) | 125 | 127,734 | |
| $ 254,894 | |||
| Total Corporate Bonds (identified cost $3,321,875) | $ 3,459,651 | ||
| Exchange-Traded Funds — 1.1% |
| Security | Shares | Value | |
| Invesco Senior Loan ETF | 16,100 | $ 350,014 | |
| SPDR Blackstone / GSO Senior Loan ETF | 10,750 | 480,740 | |
| Total Exchange-Traded Funds (identified cost $866,581) | $ 830,754 | ||
| Senior Floating Rate Loans — 119.4%(6) |
| Security | Principal Amount (000's omitted) | Value | |
| Aerospace and Defense — 1.0% | |||
| Dynasty Acquisition Co., Inc.: | |||
| Term Loan, 3.72%, (3 mo. USD LIBOR + 3.50%), 4/6/26 | $ | 231 | $ 205,308 |
| Term Loan, 3.72%, (3 mo. USD LIBOR + 3.50%), 4/6/26 | 124 | 110,380 | |
| WP CPP Holdings, LLC, Term Loan, 4.50%, (3 mo. USD LIBOR + 3.50%, Floor 1.00%), 4/30/25 | 444 | 391,311 | |
| $ 706,999 | |||
| Air Transport — 1.3% | |||
| Delta Air Lines, Inc.: | |||
| Term Loan, 4.75%, (3 mo. USD LIBOR + 3.75%, Floor 1.00%), 10/20/27 | $ | 225 | $ 227,215 |
| Term Loan, 5.75%, (3 mo. USD LIBOR + 4.75%, Floor 1.00%), 4/29/23 | 199 | 199,477 | |
| JetBlue Airways Corporation, Term Loan, 6.25%, (3 mo. USD LIBOR + 5.25%, Floor 1.00%), 6/17/24 | 494 | 490,911 | |
| $ 917,603 | |||
| Automotive — 2.1% | |||
| Adient US, LLC, Term Loan, 4.421%, (USD LIBOR + 4.25%), 5/6/24(7) | $ | 247 | $ 245,023 |
| American Axle and Manufacturing, Inc., Term Loan, 3.00%, (1 mo. USD LIBOR + 2.25%, Floor 0.75%), 4/6/24 | 500 | 481,429 | |
| Security | Principal Amount (000's omitted) | Value | |
| Automotive (continued) | |||
| Bright Bidco B.V., Term Loan, 4.50%, (6 mo. USD LIBOR + 3.50%, Floor 1.00%), 6/30/24 | $ | 167 | $ 81,302 |
| Thor Industries, Inc., Term Loan, 3.938%, (1 mo. USD LIBOR + 3.75%), 2/1/26 | 110 | 109,636 | |
| TI Group Automotive Systems, LLC, Term Loan, 4.50%, (3 mo. USD LIBOR + 3.75%, Floor 0.75%), 12/16/24 | 610 | 609,203 | |
| $ 1,526,593 | |||
| Automotive & Auto Parts — 0.7% | |||
| Clarios Global, L.P., Term Loan, 3.647%, (1 mo. USD LIBOR + 3.50%), 4/30/26 | $ | 495 | $ 483,244 |
| $ 483,244 | |||
| Brokerage/Securities Dealers/Investment Houses — 0.4% | |||
| Advisor Group, Inc., Term Loan, 5.147%, (1 mo. USD LIBOR + 5.00%), 7/31/26 | $ | 323 | $ 312,966 |
| $ 312,966 | |||
| Building and Development — 2.2% | |||
| ACProducts, Inc., Term Loan, 7.50%, (3 mo. USD LIBOR + 6.50%, Floor 1.00%), 8/18/25 | $ | 149 | $ 149,895 |
| American Builders & Contractors Supply Co., Inc., Term Loan, 2.147%, (1 mo. USD LIBOR + 2.00%), 1/15/27 | 173 | 168,634 | |
| Brookfield Property REIT, Inc., Term Loan, 2.647%, (1 mo. USD LIBOR + 2.50%), 8/27/25 | 245 | 199,947 | |
| Core & Main, L.P., Term Loan, 3.75%, (USD LIBOR + 2.75%, Floor 1.00%), 8/1/24(7) | 249 | 244,369 | |
| Cushman & Wakefield U.S. Borrower, LLC, Term Loan, 2.897%, (1 mo. USD LIBOR + 2.75%), 8/21/25 | 518 | 500,676 | |
| Realogy Group, LLC, Term Loan, 3.00%, (1 mo. USD LIBOR + 2.25%, Floor 0.75%), 2/8/25 | 162 | 155,351 | |
| Werner FinCo L.P., Term Loan, 5.00%, (1 mo. USD LIBOR + 4.00%, Floor 1.00%), 7/24/24 | 194 | 188,165 | |
| $ 1,607,037 | |||
| Business Equipment and Services — 10.6% | |||
| Airbnb, Inc., Term Loan, 8.50%, (3 mo. USD LIBOR + 7.50%, Floor 1.00%), 4/17/25 | $ | 75 | $ 80,423 |
| Allied Universal Holdco, LLC, Term Loan, 4.397%, (1 mo. USD LIBOR + 4.25%), 7/10/26 | 472 | 467,449 | |
| AppLovin Corporation: | |||
| Term Loan, 3.647%, (1 mo. USD LIBOR + 3.50%), 8/15/25 | 393 | 388,578 | |
| Term Loan, 4.147%, (1 mo. USD LIBOR + 4.00%), 8/15/25 | 75 | 73,785 | |
| Asplundh Tree Expert, LLC, Term Loan, 9/7/27(8) | 750 | 750,156 | |
| BidFair MergerRight, Inc., Term Loan, 6.50%, (1 mo. USD LIBOR + 5.50%, Floor 1.00%), 1/15/27 | 198 | 197,897 | |
| Security | Principal Amount (000's omitted) | Value | |
| Business Equipment and Services (continued) | |||
| Brand Energy & Infrastructure Services, Inc., Term Loan, 5.25%, (3 mo. USD LIBOR + 4.25%, Floor 1.00%), 6/21/24 | $ | 194 | $ 181,659 |
| Camelot U.S. Acquisition 1 Co.: | |||
| Term Loan, 3.147%, (1 mo. USD LIBOR + 3.00%), 10/30/26 | 124 | 122,408 | |
| Term Loan, 10/30/26(8) | 125 | 124,714 | |
| CCC Information Services, Inc., Term Loan, 4.00%, (1 mo. USD LIBOR + 3.00%, Floor 1.00%), 4/29/24 | 663 | 659,744 | |
| Ceridian HCM Holding, Inc., Term Loan, 2.60%, (1 week USD LIBOR + 2.50%), 4/30/25 | 838 | 812,710 | |
| Deerfield Dakota Holding, LLC, Term Loan, 4.75%, (1 mo. USD LIBOR + 3.75%, Floor 1.00%), 4/9/27 | 374 | 372,699 | |
| Garda World Security Corporation, Term Loan, 4.90%, (1 mo. USD LIBOR + 4.75%), 10/30/26 | 353 | 351,515 | |
| IG Investment Holdings, LLC, Term Loan, 5.00%, (3 mo. USD LIBOR + 4.00%, Floor 1.00%), 5/23/25 | 296 | 293,472 | |
| Illuminate Buyer, LLC, Term Loan, 4.147%, (1 mo. USD LIBOR + 4.00%), 6/16/27 | 75 | 74,563 | |
| IRI Holdings, Inc., Term Loan, 4.397%, (1 mo. USD LIBOR + 4.25%), 12/1/25 | 419 | 414,503 | |
| KUEHG Corp., Term Loan, 4.75%, (3 mo. USD LIBOR + 3.75%, Floor 1.00%), 2/21/25 | 265 | 243,011 | |
| Outfront Media Capital, LLC, Term Loan, 1.901%, (1 mo. USD LIBOR + 1.75%), 11/18/26 | 75 | 73,367 | |
| Pike Corporation, Term Loan, 3.15%, (1 mo. USD LIBOR + 3.00%), 7/24/26 | 25 | 24,870 | |
| Prime Security Services Borrower, LLC, Term Loan, 4.25%, (USD LIBOR + 3.25%, Floor 1.00%), 9/23/26(7) | 393 | 390,285 | |
| SMG US Midco 2, Inc., Term Loan, 2.727%, (USD LIBOR + 2.50%), 1/23/25(7) | 244 | 213,615 | |
| Spin Holdco, Inc., Term Loan, 4.25%, (3 mo. USD LIBOR + 3.25%, Floor 1.00%), 11/14/22 | 492 | 483,904 | |
| Tempo Acquisition, LLC, Term Loan, 11/2/26(8) | 450 | 438,610 | |
| Trans Union, LLC, Term Loan, 1.897%, (1 mo. USD LIBOR + 1.75%), 11/16/26 | 72 | 70,700 | |
| WASH Multifamily Laundry Systems, LLC, Term Loan, 4.25%, (1 mo. USD LIBOR + 3.25%, Floor 1.00%), 5/14/22 | 213 | 209,535 | |
| West Corporation, Term Loan, 5.00%, (1 mo. USD LIBOR + 4.00%, Floor 1.00%), 10/10/24 | 244 | 222,930 | |
| $ 7,737,102 | |||
| Cable and Satellite Television — 3.9% | |||
| Charter Communications Operating, LLC, Term Loan, 1.90%, (1 mo. USD LIBOR + 1.75%), 2/1/27 | $ | 496 | $ 486,419 |
| CSC Holdings, LLC, Term Loan, 2.402%, (1 mo. USD LIBOR + 2.25%), 7/17/25 | 397 | 385,015 | |
| Telenet Financing USD, LLC, Term Loan, 2.152%, (1 mo. USD LIBOR + 2.00%), 4/30/28 | 275 | 265,948 | |
| Security | Principal Amount (000's omitted) | Value | |
| Cable and Satellite Television (continued) | |||
| UPC Broadband Holding B.V.: | |||
| Term Loan, 2.402%, (1 mo. USD LIBOR + 2.25%), 4/30/28 | $ | 650 | $ 627,737 |
| Term Loan, 1/31/29(8) | 200 | 194,300 | |
| Term Loan, 1/31/29(8) | 200 | 194,300 | |
| Virgin Media Bristol, LLC: | |||
| Term Loan, 2.652%, (1 mo. USD LIBOR + 2.50%), 1/31/28 | 600 | 584,250 | |
| Term Loan, 1/31/29(8) | 125 | 123,170 | |
| $ 2,861,139 | |||
| Capital Goods — 0.4% | |||
| Welbilt, Inc., Term Loan, 2.647%, (1 mo. USD LIBOR + 2.50%), 10/23/25 | $ | 300 | $ 273,563 |
| $ 273,563 | |||
| Chemicals and Plastics — 3.0% | |||
| Alpha 3 B.V., Term Loan, 4.00%, (3 mo. USD LIBOR + 3.00%, Floor 1.00%), 1/31/24 | $ | 304 | $ 300,058 |
| Minerals Technologies, Inc., Term Loan, 3.00%, (USD LIBOR + 2.25%, Floor 0.75%), 2/14/24(7) | 576 | 572,229 | |
| Momentive Performance Materials, Inc., Term Loan, 3.41%, (1 mo. USD LIBOR + 3.25%), 5/15/24 | 346 | 332,376 | |
| PMHC II, Inc., Term Loan, 4.50%, (1 yr. USD LIBOR + 3.50%, Floor 1.00%), 3/31/25 | 244 | 226,441 | |
| Pregis TopCo Corporation, Term Loan, 3.897%, (1 mo. USD LIBOR + 3.75%), 7/31/26 | 50 | 49,067 | |
| Starfruit Finco B.V., Term Loan, 3.151%, (1 mo. USD LIBOR + 3.00%), 10/1/25 | 496 | 481,239 | |
| Univar, Inc., Term Loan, 2.397%, (1 mo. USD LIBOR + 2.25%), 7/1/24 | 264 | 260,761 | |
| $ 2,222,171 | |||
| Containers and Glass Products — 1.5% | |||
| Berry Global, Inc., Term Loan, 2.156%, (1 mo. USD LIBOR + 2.00%), 7/1/26 | $ | 74 | $ 71,959 |
| Flex Acquisition Company, Inc., Term Loan, 4.00%, (3 mo. USD LIBOR + 3.00%, Floor 1.00%), 12/29/23 | 487 | 475,995 | |
| Libbey Glass, Inc.: | |||
| DIP Loan, 4.00%, (1 mo. USD LIBOR + 3.00%, Floor 1.00%), 11/30/20 | 55 | 56,499 | |
| DIP Loan, 12.00%, (USD LIBOR + 11.00%, Floor 1.00%), 11/27/20(7) | 55 | 55,140 | |
| Term Loan, 0.00%, 4/9/21(9) | 194 | 33,483 | |
| Pelican Products, Inc., Term Loan, 4.50%, (3 mo. USD LIBOR + 3.50%, Floor 1.00%), 5/1/25 | 73 | 70,319 | |
| Reynolds Consumer Products, Inc., Term Loan, 1.897%, (1 mo. USD LIBOR + 1.75%), 2/4/27 | 167 | 165,109 | |
| Security | Principal Amount (000's omitted) | Value | |
| Containers and Glass Products (continued) | |||
| Reynolds Group Holdings, Inc., Term Loan, 2/3/26(8) | $ | 150 | $ 149,625 |
| $ 1,078,129 | |||
| Cosmetics/Toiletries — 1.2% | |||
| Kronos Acquisition Holdings, Inc., Term Loan, 5.00%, (3 mo. USD LIBOR + 4.00%, Floor 1.00%), 5/15/23 | $ | 849 | $ 845,589 |
| $ 845,589 | |||
| Diversified Media — 1.3% | |||
| Nielsen Finance, LLC, Term Loan, 4.75%, (1 mo. USD LIBOR + 3.75%, Floor 1.00%), 6/4/25 | $ | 575 | $ 574,813 |
| Terrier Media Buyer, Inc., Term Loan, 4.397%, (1 mo. USD LIBOR + 4.25%), 12/17/26 | 373 | 364,514 | |
| $ 939,327 | |||
| Drugs — 2.9% | |||
| Albany Molecular Research, Inc., Term Loan, 4.25%, (3 mo. USD LIBOR + 3.25%, Floor 1.00%), 8/30/24 | $ | 194 | $ 191,599 |
| Arbor Pharmaceuticals, Inc., Term Loan, 6.00%, (3 mo. USD LIBOR + 5.00%, Floor 1.00%), 7/5/23 | 147 | 136,643 | |
| Catalent Pharma Solutions, Inc., Term Loan, 3.25%, (1 mo. USD LIBOR + 2.25%, Floor 1.00%), 5/18/26 | 499 | 497,487 | |
| Elanco Animal Health Incorporated, Term Loan, 1.905%, (1 mo. USD LIBOR + 1.75%), 8/1/27 | 146 | 142,685 | |
| Grifols Worldwide Operations USA, Inc., Term Loan, 2.10%, (1 week USD LIBOR + 2.00%), 11/15/27 | 49 | 48,710 | |
| Jaguar Holding Company II, Term Loan, 3.50%, (1 mo. USD LIBOR + 2.50%, Floor 1.00%), 8/18/22 | 943 | 940,641 | |
| Packaging Coordinators Midco, Inc., Term Loan, 9/25/27(8) | 125 | 124,766 | |
| $ 2,082,531 | |||
| Ecological Services and Equipment — 1.2% | |||
| GFL Environmental, Inc., Term Loan, 4.00%, (USD LIBOR + 3.00%, Floor 1.00%), 5/30/25(7) | $ | 414 | $ 412,627 |
| US Ecology Holdings, Inc., Term Loan, 2.649%, (1 mo. USD LIBOR + 2.50%), 11/1/26 | 496 | 491,288 | |
| $ 903,915 | |||
| Electronics/Electrical — 22.6% | |||
| Almonde, Inc., Term Loan, 4.50%, (USD LIBOR + 3.50%, Floor 1.00%), 6/13/24(7) | $ | 468 | $ 439,638 |
| Applied Systems, Inc., Term Loan, 4.25%, (3 mo. USD LIBOR + 3.25%, Floor 1.00%), 9/19/24 | 811 | 807,759 | |
| Aptean, Inc., Term Loan, 4.397%, (1 mo. USD LIBOR + 4.25%), 4/23/26 | 399 | 389,262 | |
| Astra Acquisition Corp., Term Loan, 6.50%, (1 mo. USD LIBOR + 5.50%, Floor 1.00%), 3/1/27 | 199 | 199,995 | |
| Security | Principal Amount (000's omitted) | Value | |
| Electronics/Electrical (continued) | |||
| Avast Software B.V., Term Loan, 3.25%, (3 mo. USD LIBOR + 2.25%, Floor 1.00%), 9/29/23 | $ | 51 | $ 51,314 |
| Banff Merger Sub, Inc., Term Loan, 4.397%, (1 mo. USD LIBOR + 4.25%), 10/2/25 | 542 | 527,560 | |
| Buzz Merger Sub, Ltd., Term Loan, 2.897%, (1 mo. USD LIBOR + 2.75%), 1/29/27 | 149 | 146,452 | |
| CommScope, Inc., Term Loan, 3.397%, (1 mo. USD LIBOR + 3.25%), 4/6/26 | 794 | 775,386 | |
| Cornerstone OnDemand, Inc., Term Loan, 4.406%, (1 mo. USD LIBOR + 4.25%), 4/22/27 | 415 | 414,871 | |
| CPI International, Inc., Term Loan, 4.50%, (1 mo. USD LIBOR + 3.50%, Floor 1.00%), 7/26/24 | 113 | 109,664 | |
| Datto, Inc., Term Loan, 4.397%, (1 mo. USD LIBOR + 4.25%), 4/2/26 | 398 | 397,923 | |
| ECI Macola Max Holdings, LLC, Term Loan, 5.25%, (1 mo. USD LIBOR + 4.25%, Floor 1.00%), 9/27/24 | 396 | 393,714 | |
| Epicor Software Corporation, Term Loan, 5.25%, (1 mo. USD LIBOR + 4.25%, Floor 1.00%), 7/30/27 | 783 | 781,610 | |
| EXC Holdings III Corp., Term Loan, 4.50%, (3 mo. USD LIBOR + 3.50%, Floor 1.00%), 12/2/24 | 592 | 586,529 | |
| Fiserv Investment Solutions, Inc., Term Loan, 5.02%, (3 mo. USD LIBOR + 4.75%), 2/18/27 | 349 | 348,361 | |
| Go Daddy Operating Company, LLC: | |||
| Term Loan, 1.897%, (1 mo. USD LIBOR + 1.75%), 2/15/24 | 495 | 485,300 | |
| Term Loan, 2.647%, (1 mo. USD LIBOR + 2.50%), 8/10/27 | 125 | 123,129 | |
| Hyland Software, Inc., Term Loan, 4.00%, (1 mo. USD LIBOR + 3.25%, Floor 0.75%), 7/1/24 | 1,301 | 1,295,855 | |
| Infoblox, Inc., Term Loan, 4.647%, (1 mo. USD LIBOR + 4.50%), 11/7/23 | 432 | 432,904 | |
| Informatica, LLC, Term Loan, 3.397%, (1 mo. USD LIBOR + 3.25%), 2/25/27 | 746 | 730,081 | |
| LogMeIn, Inc., Term Loan, 4.906%, (3 mo. USD LIBOR + 4.75%), 8/31/27 | 150 | 145,250 | |
| MA FinanceCo., LLC, Term Loan, 5.25%, (3 mo. USD LIBOR + 4.25%, Floor 1.00%), 6/5/25 | 175 | 174,453 | |
| Marcel LUX IV S.a.r.l., Term Loan, 3.395%, (1 mo. USD LIBOR + 3.25%), 3/15/26 | 348 | 339,966 | |
| Milano Acquisition Corp., Term Loan, 8/17/27(8) | 300 | 297,563 | |
| NCR Corporation, Term Loan, 2.65%, (1 mo. USD LIBOR + 2.50%), 8/28/26 | 223 | 217,599 | |
| Redstone Buyer, LLC, Term Loan, 6.00%, (3 mo. USD LIBOR + 5.00%, Floor 1.00%), 9/1/27 | 425 | 423,672 | |
| Refinitiv US Holdings, Inc., Term Loan, 3.397%, (1 mo. USD LIBOR + 3.25%), 10/1/25 | 222 | 220,181 | |
| SGS Cayman L.P., Term Loan, 5.595%, (3 mo. USD LIBOR + 5.38%), 4/23/21 | 64 | 56,115 | |
| Security | Principal Amount (000's omitted) | Value | |
| Electronics/Electrical (continued) | |||
| SkillSoft Corporation: | |||
| Term Loan, 8.50%, (3 mo. USD LIBOR + 7.50%, Floor 1.00%), 12/27/24 | $ | 31 | $ 31,237 |
| Term Loan - Second Lien, 8.50%, (3 mo. USD LIBOR + 7.50%, Floor 1.00%), 4/27/25 | 102 | 101,164 | |
| SolarWinds Holdings, Inc., Term Loan, 2.897%, (1 mo. USD LIBOR + 2.75%), 2/5/24 | 952 | 936,988 | |
| Solera, LLC, Term Loan, 2.938%, (2 mo. USD LIBOR + 2.75%), 3/3/23 | 692 | 679,267 | |
| STG-Fairway Holdings, LLC, Term Loan, 3.47%, (3 mo. USD LIBOR + 3.25%), 1/31/27 | 199 | 194,596 | |
| Sutherland Global Services, Inc., Term Loan, 6.38%, (3 mo. USD LIBOR + 5.38%, Floor 1.00%), 4/23/21 | 277 | 241,065 | |
| Tech Data Corporation, Term Loan, 3.645%, (1 mo. USD LIBOR + 3.50%), 6/30/25 | 125 | 125,417 | |
| Tibco Software, Inc., Term Loan, 3.90%, (1 mo. USD LIBOR + 3.75%), 6/30/26 | 617 | 602,815 | |
| TTM Technologies, Inc., Term Loan, 2.655%, (1 mo. USD LIBOR + 2.50%), 9/28/24 | 101 | 99,219 | |
| Ultimate Software Group, Inc. (The): | |||
| Term Loan, 3.897%, (1 mo. USD LIBOR + 3.75%), 5/4/26 | 421 | 418,515 | |
| Term Loan, 4.75%, (3 mo. USD LIBOR + 4.00%, Floor 0.75%), 5/4/26 | 425 | 424,369 | |
| Ultra Clean Holdings, Inc., Term Loan, 4.647%, (1 mo. USD LIBOR + 4.50%), 8/27/25 | 82 | 81,607 | |
| Veritas US, Inc., Term Loan, 6.50%, (3 mo. USD LIBOR + 5.50%, Floor 1.00%), 9/1/25 | 275 | 269,225 | |
| Vero Parent, Inc., Term Loan, 6.506%, (3 mo. USD LIBOR + 6.25%), 8/16/24 | 146 | 143,816 | |
| VS Buyer, LLC, Term Loan, 3.397%, (1 mo. USD LIBOR + 3.25%), 2/28/27 | 672 | 662,390 | |
| Vungle, Inc., Term Loan, 5.647%, (1 mo. USD LIBOR + 5.50%), 9/30/26 | 249 | 248,123 | |
| $ 16,571,919 | |||
| Equipment Leasing — 2.5% | |||
| Avolon TLB Borrower 1 (US), LLC, Term Loan, 2.50%, (1 mo. USD LIBOR + 1.75%, Floor 0.75%), 1/15/25 | $ | 950 | $ 929,812 |
| Delos Finance S.a.r.l., Term Loan, 1.97%, (3 mo. USD LIBOR + 1.75%), 10/6/23 | 950 | 931,000 | |
| $ 1,860,812 | |||
| Financial Intermediaries — 3.0% | |||
| Apollo Commercial Real Estate Finance, Inc., Term Loan, 2.901%, (1 mo. USD LIBOR + 2.75%), 5/15/26 | $ | 444 | $ 424,378 |
| Aretec Group, Inc., Term Loan, 4.397%, (1 mo. USD LIBOR + 4.25%), 10/1/25 | 494 | 472,308 | |
| FinCo I, LLC, Term Loan, 2.648%, (1 mo. USD LIBOR + 2.50%), 6/27/25 | 372 | 370,564 | |
| Security | Principal Amount (000's omitted) | Value | |
| Financial Intermediaries (continued) | |||
| Focus Financial Partners, LLC, Term Loan, 2.147%, (1 mo. USD LIBOR + 2.00%), 7/3/24 | $ | 74 | $ 72,271 |
| Harbourvest Partners, LLC, Term Loan, 2.525%, (3 mo. USD LIBOR + 2.25%), 3/3/25 | 40 | 39,283 | |
| Victory Capital Holdings, Inc., Term Loan, 2.799%, (3 mo. USD LIBOR + 2.50%), 7/1/26 | 319 | 315,548 | |
| Virtus Investment Partners, Inc., Term Loan, 3.00%, (3 mo. USD LIBOR + 2.25%, Floor 0.75%), 6/1/24 | 480 | 477,315 | |
| $ 2,171,667 | |||
| Food Products — 2.1% | |||
| Clover Merger Sub, Inc., Term Loan, 3.647%, (1 mo. USD LIBOR + 3.50%), 9/26/24 | $ | 348 | $ 339,848 |
| Froneri International, Ltd.: | |||
| Term Loan, 2.397%, (1 mo. USD LIBOR + 2.25%), 1/31/27 | 524 | 505,604 | |
| Term Loan - Second Lien, 5.897%, (1 mo. USD LIBOR + 5.75%), 1/31/28 | 350 | 349,125 | |
| Hearthside Food Solutions, LLC, Term Loan, 6.00%, (1 mo. USD LIBOR + 5.00%, Floor 1.00%), 5/23/25 | 50 | 49,667 | |
| Nomad Foods Europe Midco Limited, Term Loan, 2.402%, (1 mo. USD LIBOR + 2.25%), 5/15/24 | 297 | 290,241 | |
| $ 1,534,485 | |||
| Food Service — 0.9% | |||
| IRB Holding Corp., Term Loan, 3.75%, (3 mo. USD LIBOR + 2.75%, Floor 1.00%), 2/5/25 | $ | 316 | $ 302,196 |
| Restaurant Technologies, Inc., Term Loan, 3.396%, (1 mo. USD LIBOR + 3.25%), 10/1/25 | 246 | 236,721 | |
| US Foods, Inc., Term Loan, 2.147%, (1 mo. USD LIBOR + 2.00%), 9/13/26 | 148 | 142,676 | |
| $ 681,593 | |||
| Food/Drug Retailers — 0.3% | |||
| BW Gas & Convenience Holdings, LLC, Term Loan, 6.40%, (1 mo. USD LIBOR + 6.25%), 11/18/24 | $ | 244 | $ 245,042 |
| $ 245,042 | |||
| Health Care — 14.2% | |||
| Accelerated Health Systems, LLC, Term Loan, 3.651%, (1 mo. USD LIBOR + 3.50%), 10/31/25 | $ | 49 | $ 47,897 |
| ADMI Corp., Term Loan, 2.897%, (1 mo. USD LIBOR + 2.75%), 4/30/25 | 323 | 312,150 | |
| Alliance Healthcare Services, Inc., Term Loan, 5.50%, (1 mo. USD LIBOR + 4.50%, Floor 1.00%), 10/24/23 | 183 | 140,221 | |
| athenahealth, Inc., Term Loan, 4.75%, (3 mo. USD LIBOR + 4.50%), 2/11/26 | 645 | 637,347 | |
| Security | Principal Amount (000's omitted) | Value | |
| Health Care (continued) | |||
| Avantor Funding, Inc., Term Loan, 3.25%, (1 mo. USD LIBOR + 2.25%, Floor 1.00%), 11/21/24 | $ | 716 | $ 707,268 |
| BioClinica Holding I, L.P., Term Loan, 5.25%, (1 mo. USD LIBOR + 4.25%, Floor 1.00%), 10/20/23 | 294 | 284,151 | |
| Change Healthcare Holdings, LLC, Term Loan, 3.50%, (USD LIBOR + 2.50%, Floor 1.00%), 3/1/24(7) | 644 | 632,634 | |
| CHG Healthcare Services, Inc., Term Loan, 4.00%, (6 mo. USD LIBOR + 3.00%, Floor 1.00%), 6/7/23 | �� 347 | 341,868 | |
| Ensemble RCM, LLC, Term Loan, 4.011%, (3 mo. USD LIBOR + 3.75%), 8/3/26 | 50 | 49,067 | |
| Envision Healthcare Corporation, Term Loan, 3.897%, (1 mo. USD LIBOR + 3.75%), 10/10/25 | 491 | 354,314 | |
| Greatbatch, Ltd., Term Loan, 3.50%, (1 mo. USD LIBOR + 2.50%, Floor 1.00%), 10/27/22 | 344 | 344,263 | |
| Hanger, Inc., Term Loan, 3.647%, (1 mo. USD LIBOR + 3.50%), 3/6/25 | 697 | 694,303 | |
| IQVIA, Inc., Term Loan, 1.97%, (3 mo. USD LIBOR + 1.75%), 6/11/25 | 496 | 490,688 | |
| Medical Solutions, LLC, Term Loan, 5.50%, (6 mo. USD LIBOR + 4.50%, Floor 1.00%), 6/14/24 | 248 | 239,456 | |
| MPH Acquisition Holdings, LLC, Term Loan, 3.75%, (3 mo. USD LIBOR + 2.75%, Floor 1.00%), 6/7/23 | 737 | 725,891 | |
| National Mentor Holdings, Inc.: | |||
| Term Loan, 4.40%, (1 mo. USD LIBOR + 4.25%), 3/9/26 | 259 | 257,089 | |
| Term Loan, 4.40%, (1 mo. USD LIBOR + 4.25%), 3/9/26 | 12 | 11,735 | |
| Navicure, Inc.: | |||
| Term Loan, 4.147%, (1 mo. USD LIBOR + 4.00%), 10/22/26 | 299 | 292,530 | |
| Term Loan, 4.75%, (1 mo. USD LIBOR + 4.00%, Floor 0.75%), 10/22/26 | 50 | 49,000 | |
| One Call Corporation, Term Loan, 6.25%, (3 mo. USD LIBOR + 5.25%, Floor 1.00%), 11/25/22 | 167 | 146,638 | |
| Ortho-Clinical Diagnostics S.A., Term Loan, 3.406%, (1 mo. USD LIBOR + 3.25%), 6/30/25 | 417 | 400,403 | |
| Radiology Partners, Inc., Term Loan, 5.667%, (USD LIBOR + 4.25%), 7/9/25(7) | 391 | 376,439 | |
| RadNet, Inc., Term Loan, 4.75%, (6 mo. USD LIBOR + 3.75%, Floor 1.00%), 6/30/23 | 473 | 467,296 | |
| Select Medical Corporation, Term Loan, 2.78%, (3 mo. USD LIBOR + 2.50%), 3/6/25 | 822 | 803,829 | |
| Surgery Center Holdings, Inc., Term Loan, 9.00%, (1 mo. USD LIBOR + 8.00%, Floor 1.00%), 9/3/24 | 249 | 252,689 | |
| Tecomet, Inc., Term Loan, 4.675%, (6 mo. USD LIBOR + 3.50%), 5/1/24 | 221 | 216,622 | |
| U.S. Anesthesia Partners, Inc., Term Loan, 4.00%, (6 mo. USD LIBOR + 3.00%, Floor 1.00%), 6/23/24 | 199 | 188,339 | |
| Verscend Holding Corp., Term Loan, 4.647%, (1 mo. USD LIBOR + 4.50%), 8/27/25 | 492 | 489,817 | |
| Security | Principal Amount (000's omitted) | Value | |
| Health Care (continued) | |||
| Wink Holdco, Inc., Term Loan, 12/2/24(8) | $ | 400 | $ 399,562 |
| $ 10,353,506 | |||
| Home Furnishings — 0.8% | |||
| Serta Simmons Bedding, LLC: | |||
| Term Loan, 8.50%, (1 mo. USD LIBOR + 7.50%, Floor 1.00%), 8/10/23 | $ | 153 | $ 153,255 |
| Term Loan - Second Lien, 8.50%, (1 mo. USD LIBOR + 7.50%, Floor 1.00%), 8/10/23 | 506 | 413,999 | |
| $ 567,254 | |||
| Industrial Equipment — 7.4% | |||
| Altra Industrial Motion Corp., Term Loan, 2.147%, (1 mo. USD LIBOR + 2.00%), 10/1/25 | $ | 62 | $ 60,240 |
| Apex Tool Group, LLC, Term Loan, 6.50%, (1 mo. USD LIBOR + 5.25%, Floor 1.25%), 8/1/24 | 159 | 150,379 | |
| Carlisle Foodservice Products, Inc., Term Loan, 4.00%, (6 mo. USD LIBOR + 3.00%, Floor 1.00%), 3/20/25 | 145 | 129,616 | |
| Clark Equipment Company, Term Loan, 1.97%, (3 mo. USD LIBOR + 1.75%), 5/18/24 | 596 | 578,811 | |
| CPM Holdings, Inc., Term Loan, 3.905%, (1 mo. USD LIBOR + 3.75%), 11/17/25 | 320 | 301,998 | |
| DexKo Global, Inc., Term Loan, 4.50%, (1 mo. USD LIBOR + 3.50%, Floor 1.00%), 7/24/24 | 243 | 237,871 | |
| EWT Holdings III Corp., Term Loan, 2.897%, (1 mo. USD LIBOR + 2.75%), 12/20/24 | 668 | 660,319 | |
| Filtration Group Corporation, Term Loan, 3.147%, (1 mo. USD LIBOR + 3.00%), 3/29/25 | 492 | 484,138 | |
| Gardner Denver, Inc.: | |||
| Term Loan, 1.897%, (1 mo. USD LIBOR + 1.75%), 3/1/27 | 25 | 24,113 | |
| Term Loan, 2.897%, (1 mo. USD LIBOR + 2.75%), 3/1/27 | 623 | 615,905 | |
| Gates Global, LLC, Term Loan, 3.75%, (1 mo. USD LIBOR + 2.75%, Floor 1.00%), 4/1/24 | 412 | 407,252 | |
| Ingersoll-Rand Services Company, Term Loan, 1.897%, (1 mo. USD LIBOR + 1.75%), 3/1/27 | 100 | 96,453 | |
| LTI Holdings, Inc., Term Loan, 3.647%, (1 mo. USD LIBOR + 3.50%), 9/6/25 | 249 | 231,320 | |
| Robertshaw US Holding Corp., Term Loan, 4.25%, (3 mo. USD LIBOR + 3.25%, Floor 1.00%), 2/28/25 | 414 | 360,851 | |
| Terex Corporation, Term Loan, 3.50%, (1 mo. USD LIBOR + 2.75%, Floor 0.75%), 1/31/24 | 813 | 796,372 | |
| Titan Acquisition Limited, Term Loan, 3.361%, (6 mo. USD LIBOR + 3.00%), 3/28/25 | 292 | 276,826 | |
| $ 5,412,464 | |||
| Insurance — 4.9% | |||
| Alliant Holdings Intermediate, LLC, Term Loan, 3.401%, (1 mo. USD LIBOR + 3.25%), 5/9/25 | $ | 247 | $ 242,940 |
| Security | Principal Amount (000's omitted) | Value | |
| Insurance (continued) | |||
| AmWINS Group, Inc., Term Loan, 3.75%, (1 mo. USD LIBOR + 2.75%, Floor 1.00%), 1/25/24 | $ | 683 | $ 679,047 |
| AssuredPartners, Inc., Term Loan, 3.647%, (1 mo. USD LIBOR + 3.50%), 2/12/27 | 373 | 362,531 | |
| Asurion, LLC: | |||
| Term Loan, 3.147%, (1 mo. USD LIBOR + 3.00%), 8/4/22 | 752 | 743,576 | |
| Term Loan - Second Lien, 6.647%, (1 mo. USD LIBOR + 6.50%), 8/4/25 | 94 | 94,350 | |
| Hub International Limited, Term Loan, 3.264%, (3 mo. USD LIBOR + 3.00%), 4/25/25 | 513 | 496,765 | |
| NFP Corp., Term Loan, 3.397%, (1 mo. USD LIBOR + 3.25%), 2/15/27 | 347 | 332,959 | |
| Ryan Specialty Group, LLC, Term Loan, 4.00%, (1 mo. USD LIBOR + 3.25%, Floor 0.75%), 9/1/27 | 200 | 199,000 | |
| USI, Inc., Term Loan, 3.22%, (3 mo. USD LIBOR + 3.00%), 5/16/24 | 440 | 426,749 | |
| $ 3,577,917 | |||
| Leisure Goods/Activities/Movies — 3.7% | |||
| AMC Entertainment Holdings, Inc., Term Loan, 3.22%, (3 mo. USD LIBOR + 3.00%), 4/22/26 | $ | 292 | $ 189,081 |
| Bombardier Recreational Products, Inc.: | |||
| Term Loan, 2.147%, (1 mo. USD LIBOR + 2.00%), 5/24/27 | 634 | 615,839 | |
| Term Loan, 6.00%, (3 mo. USD LIBOR + 5.00%, Floor 1.00%), 5/24/27 | 75 | 76,219 | |
| ClubCorp Club Operations, Inc., Term Loan, 2.97%, (3 mo. USD LIBOR + 2.75%), 9/18/24 | 199 | 171,512 | |
| Crown Finance US, Inc., Term Loan, 2.769%, (6 mo. USD LIBOR + 2.50%), 2/28/25 | 386 | 262,734 | |
| Delta 2 (LUX) S.a.r.l., Term Loan, 3.50%, (1 mo. USD LIBOR + 2.50%, Floor 1.00%), 2/1/24 | 500 | 487,674 | |
| Emerald Expositions Holding, Inc., Term Loan, 2.647%, (1 mo. USD LIBOR + 2.50%), 5/22/24 | 156 | 141,319 | |
| Match Group, Inc., Term Loan, 2.004%, (3 mo. USD LIBOR + 1.75%), 2/13/27 | 500 | 493,125 | |
| Travel Leaders Group, LLC, Term Loan, 4.147%, (1 mo. USD LIBOR + 4.00%), 1/25/24 | 394 | 291,942 | |
| $ 2,729,445 | |||
| Lodging and Casinos — 1.7% | |||
| ESH Hospitality, Inc., Term Loan, 2.147%, (1 mo. USD LIBOR + 2.00%), 9/18/26 | $ | 377 | $ 367,274 |
| Playa Resorts Holding B.V., Term Loan, 3.75%, (1 mo. USD LIBOR + 2.75%, Floor 1.00%), 4/29/24 | 418 | 370,340 | |
| RHP Hotel Properties L.P., Term Loan, 2.146%, (1 mo. USD LIBOR + 2.00%), 5/11/24 | 500 | 479,290 | |
| $ 1,216,904 | |||
| Security | Principal Amount (000's omitted) | Value | |
| Metals/Mining — 0.2% | |||
| GrafTech Finance, Inc., Term Loan, 4.50%, (1 mo. USD LIBOR + 3.50%, Floor 1.00%), 2/12/25 | $ | 161 | $ 159,405 |
| $ 159,405 | |||
| Publishing — 2.5% | |||
| Ascend Learning, LLC, Term Loan, 7/12/24(8) | $ | 830 | $ 822,211 |
| Getty Images, Inc., Term Loan, 4.688%, (1 mo. USD LIBOR + 4.50%), 2/19/26 | 267 | 250,975 | |
| LSC Communications, Inc., Term Loan, 0.00%, 9/30/22(9) | 142 | 20,448 | |
| ProQuest, LLC, Term Loan, 3.647%, (1 mo. USD LIBOR + 3.50%), 10/23/26 | 733 | 725,616 | |
| $ 1,819,250 | |||
| Radio and Television — 4.0% | |||
| Diamond Sports Group, LLC, Term Loan, 3.40%, (1 mo. USD LIBOR + 3.25%), 8/24/26 | $ | 247 | $ 193,050 |
| Entercom Media Corp., Term Loan, 2.645%, (1 mo. USD LIBOR + 2.50%), 11/18/24 | 343 | 324,467 | |
| Gray Television, Inc., Term Loan, 2.655%, (1 mo. USD LIBOR + 2.50%), 1/2/26 | 673 | 662,157 | |
| iHeartCommunications, Inc., Term Loan, 3.147%, (1 mo. USD LIBOR + 3.00%), 5/1/26 | 422 | 401,143 | |
| Nexstar Broadcasting, Inc., Term Loan, 2.395%, (1 mo. USD LIBOR + 2.25%), 1/17/24 | 543 | 529,777 | |
| Sinclair Television Group, Inc., Term Loan, 2.647%, (1 mo. USD LIBOR + 2.50%), 9/30/26 | 598 | 586,070 | |
| Univision Communications, Inc., Term Loan, 4.75%, (1 mo. USD LIBOR + 3.75%, Floor 1.00%), 3/13/26 | 234 | 227,813 | |
| $ 2,924,477 | |||
| Retailers (Except Food and Drug) — 1.4% | |||
| Bass Pro Group, LLC, Term Loan, 5.75%, (3 mo. USD LIBOR + 5.00%, Floor 0.75%), 9/25/24 | $ | 342 | $ 340,603 |
| BJ's Wholesale Club, Inc., Term Loan, 2.151%, (1 mo. USD LIBOR + 2.00%), 2/3/24 | 381 | 374,710 | |
| Coinamatic Canada, Inc., Term Loan, 4.25%, (1 mo. USD LIBOR + 3.25%, Floor 1.00%), 5/14/22 | 33 | 32,466 | |
| Hoya Midco, LLC, Term Loan, 4.50%, (6 mo. USD LIBOR + 3.50%, Floor 1.00%), 6/30/24 | 194 | 167,530 | |
| LSF9 Atlantis Holdings, LLC, Term Loan, 7.00%, (1 mo. USD LIBOR + 6.00%, Floor 1.00%), 5/1/23 | 137 | 133,744 | |
| $ 1,049,053 | |||
| Services — 0.7% | |||
| AlixPartners, LLP, Term Loan, 2.647%, (1 mo. USD LIBOR + 2.50%), 4/4/24 | $ | 496 | $ 484,672 |
| Security | Principal Amount (000's omitted) | Value | |
| Services (continued) | |||
| KAR Auction Services, Inc., Term Loan, 2.438%, (1 mo. USD LIBOR + 2.25%), 9/19/26 | $ | 49 | $ 47,953 |
| $ 532,625 | |||
| Steel — 1.7% | |||
| Atkore International, Inc., Term Loan, 3.75%, (3 mo. USD LIBOR + 2.75%, Floor 1.00%), 12/22/23 | $ | 286 | $ 285,322 |
| Phoenix Services International, LLC, Term Loan, 4.75%, (1 mo. USD LIBOR + 3.75%, Floor 1.00%), 3/1/25 | 244 | 234,609 | |
| Zekelman Industries, Inc., Term Loan, 2.145%, (1 mo. USD LIBOR + 2.00%), 1/24/27 | 771 | 748,835 | |
| $ 1,268,766 | |||
| Super Retail — 0.9% | |||
| PetSmart, Inc., Term Loan, 4.50%, (3 mo. USD LIBOR + 3.50%, Floor 1.00%), 3/11/22 | $ | 666 | $ 665,646 |
| $ 665,646 | |||
| Surface Transport — 0.6% | |||
| Avis Budget Car Rental, LLC, Term Loan, 2.40%, (1 mo. USD LIBOR + 2.25%), 8/6/27 | $ | 521 | $ 463,746 |
| $ 463,746 | |||
| Technology — 0.6% | |||
| SS&C Technologies Holdings Europe S.a.r.l., Term Loan, 1.897%, (1 mo. USD LIBOR + 1.75%), 4/16/25 | $ | 199 | $ 193,296 |
| SS&C Technologies, Inc., Term Loan, 1.897%, (1 mo. USD LIBOR + 1.75%), 4/16/25 | 284 | 275,126 | |
| $ 468,422 | |||
| Telecommunications — 7.7% | |||
| CenturyLink, Inc., Term Loan, 2.397%, (1 mo. USD LIBOR + 2.25%), 3/15/27 | $ | 969 | $ 932,563 |
| Colorado Buyer, Inc., Term Loan, 4.00%, (6 mo. USD LIBOR + 3.00%, Floor 1.00%), 5/1/24 | 390 | 343,458 | |
| Digicel International Finance Limited, Term Loan, 3.80%, (6 mo. USD LIBOR + 3.25%), 5/28/24 | 243 | 214,533 | |
| Intelsat Jackson Holdings S.A.: | |||
| DIP Loan, 5.05%, (6 mo. USD LIBOR + 5.50%, Floor 1.00%), 7/13/22(10) | 170 | 173,526 | |
| Term Loan, 8.00%, (USD Prime + 4.75%), 11/27/23 | 574 | 578,449 | |
| Level 3 Financing, Inc., Term Loan, 1.897%, (1 mo. USD LIBOR + 1.75%), 3/1/27 | 439 | 425,292 | |
| SBA Senior Finance II, LLC, Term Loan, 1.90%, (1 mo. USD LIBOR + 1.75%), 4/11/25 | 679 | 663,567 | |
| Syniverse Holdings, Inc., Term Loan, 6.00%, (3 mo. USD LIBOR + 5.00%, Floor 1.00%), 3/9/23 | 244 | 189,922 | |
| Security | Principal Amount (000's omitted) | Value | |
| Telecommunications (continued) | |||
| Telesat Canada, Term Loan, 2.90%, (1 mo. USD LIBOR + 2.75%), 12/7/26 | $ | 99 | $ 96,273 |
| T-Mobile USA, Inc., Term Loan, 3.147%, (1 mo. USD LIBOR + 3.00%), 4/1/27 | 949 | 949,673 | |
| Zayo Group Holdings, Inc., Term Loan, 3.147%, (1 mo. USD LIBOR + 3.00%), 3/9/27 | 174 | 169,387 | |
| Ziggo Financing Partnership, Term Loan, 2.652%, (1 mo. USD LIBOR + 2.50%), 4/30/28 | 900 | 869,875 | |
| $ 5,606,518 | |||
| Utilities — 1.3% | |||
| Calpine Corporation, Term Loan, 2.40%, (1 mo. USD LIBOR + 2.25%), 1/15/24 | $ | 496 | $ 483,982 |
| USIC Holdings, Inc., Term Loan, 4.25%, (1 mo. USD LIBOR + 3.25%, Floor 1.00%), 12/8/23 | 498 | 491,594 | |
| $ 975,576 | |||
| Total Senior Floating Rate Loans (identified cost $88,517,962) | $ 87,354,400 | ||
| Short-Term Investments — 4.6% |
| Description | Units | Value | |
| Calvert Cash Reserves Fund, LLC, 0.13%(11) | 3,378,521 | $ 3,378,858 | |
| Total Short-Term Investments (identified cost $3,379,180) | $ 3,378,858 | ||
| Total Investments — 130.0% (identified cost $96,224,363) | $ 95,162,428 | ||
| Less Unfunded Loan Commitments — (0.1)% | $ (85,027) | ||
| Net Investments — 129.9% (identified cost $96,139,336) | $ 95,077,401 | |
| Note Payable — (23.2)% | $ (17,000,000) |
| Other Assets, Less Liabilities — (6.7)% | $ (4,890,709) | ||
| Net Assets — 100.0% | $ 73,186,692 |
| The percentage shown for each investment category in the Schedule of Investments is based on net assets. | ||
| (1) | Non-income producing security. | |
| (2) | Security was acquired in connection with a restructuring of a Senior Loan and may be subject to restrictions on resale. | |
| (3) | Security exempt from registration under Rule 144A of the Securities Act of 1933, as amended. These securities may be sold in certain transactions in reliance on an exemption from registration (normally to qualified institutional buyers). At September 30, 2020, the aggregate value of these securities is $2,593,517 or 3.5% of the Fund's net assets. |
| (4) | When-issued security. |
| (5) | Amount is less than 0.05%. |
| (6) | Senior floating-rate loans (Senior Loans) often require prepayments from excess cash flows or permit the borrowers to repay at their election. The degree to which borrowers repay, whether as a contractual requirement or at their election, cannot be predicted with accuracy. As a result, the actual remaining maturity may be substantially less than the stated maturities shown. However, Senior Loans will typically have an expected average life of approximately two to four years. Senior Loans typically have rates of interest which are redetermined periodically by reference to a base lending rate, plus a spread. These base lending rates are primarily the London Interbank Offered Rate ("LIBOR") and secondarily, the prime rate offered by one or more major United States banks (the "Prime Rate"). Base lending rates may be subject to a floor, or minimum rate. Senior Loans are generally subject to contractual restrictions that must be satisfied before they can be bought or sold. |
| (7) | The stated interest rate represents the weighted average interest rate at September 30, 2020 of contracts within the senior loan facility. Interest rates on contracts are primarily redetermined either weekly, monthly or quarterly by reference to the indicated base lending rate and spread and the reset period. |
| (8) | This Senior Loan will settle after September 30, 2020, at which time the interest rate will be determined. |
| (9) | Issuer is in default with respect to interest and/or principal payments. For a variable rate security, interest rate has been adjusted to reflect non-accrual status. |
| (10) | Unfunded or partially unfunded loan commitments. The stated interest rate reflects the weighted average of the reference rate and spread for the funded portion, if any, and the commitment fees on the portion of the loan that is unfunded. At September 30, 2020, the total value of unfunded loan commitments is $86,763. See Note 1E for description. |
| (11) | Affiliated investment company, available to Calvert portfolios and funds, which invests in high quality, U.S. dollar denominated money market instruments. The rate shown is the annualized seven-day yield as of September 30, 2020. |
| Abbreviations: | |
| DIP | – Debtor In Possession |
| LIBOR | – London Interbank Offered Rate |
| Currency Abbreviations: | |
| USD | – United States Dollar |
| September 30, 2020 | |
| Assets | |
| Investments in securities of unaffiliated issuers, at value (identified cost $92,760,156) | $ 91,698,543 |
| Investments in securities of affiliated issuers, at value (identified cost $3,379,180) | 3,378,858 |
| Cash | 1,353,900 |
| Receivable for investments sold | 357,322 |
| Receivable for capital shares sold | 147,085 |
| Interest receivable | 168,882 |
| Dividends receivable - affiliated | 298 |
| Receivable from affiliate | 11,391 |
| Trustees' deferred compensation plan | 953 |
| Prepaid upfront fees on note payable | 10,224 |
| Prepaid expenses | 5,814 |
| Total assets | $97,133,270 |
| Liabilities | |
| Payable for investments purchased | $ 5,870,143 |
| Payable for when-issued securities | 75,000 |
| Payable for capital shares redeemed | 858,020 |
| Distributions payable | 13,231 |
| Payable to affiliates: | |
| Investment advisory fee | 34,796 |
| Administrative fee | 7,296 |
| Distribution and service fees | 480 |
| Sub-transfer agency fee | 254 |
| Trustees' deferred compensation plan | 953 |
| Accrued expenses | 86,405 |
| Note payable | 17,000,000 |
| Total liabilities | $23,946,578 |
| Net Assets | $73,186,692 |
| Sources of Net Assets | |
| Paid-in capital | $ 76,493,040 |
| Accumulated loss | (3,306,348) |
| Total | $73,186,692 |
| Class A Shares | |
| Net Assets | $ 2,329,463 |
| Shares Outstanding | 252,313 |
| Net Asset Value and Redemption Price Per Share (net assets ÷ shares of beneficial interest outstanding) | $ 9.23 |
| Maximum Offering Price Per Share (100 ÷ 96.25 of net asset value per share) | $ 9.59 |
| Class I Shares | |
| Net Assets | $ 26,957,928 |
| Shares Outstanding | 2,922,870 |
| Net Asset Value, Offering Price and Redemption Price Per Share (net assets ÷ shares of beneficial interest outstanding) | $ 9.22 |
| Class R6 Shares | |
| Net Assets | $ 43,899,301 |
| Shares Outstanding | 4,760,783 |
| Net Asset Value, Offering Price and Redemption Price Per Share (net assets ÷ shares of beneficial interest outstanding) | $ 9.22 |
| Year Ended | |
| September 30, 2020 | |
| Investment Income | |
| Dividend income | $ 38,395 |
| Dividend income - affiliated issuers | 1,178 |
| Interest and other income | 3,342,485 |
| Securities lending income, net | 516 |
| Total investment income | $3,382,574 |
| Expenses | |
| Investment advisory fee | $ 340,944 |
| Administrative fee | 72,259 |
| Distribution and service fees: | |
| Class A | 6,494 |
| Trustees' fees and expenses | 2,855 |
| Custodian fees | 9,151 |
| Transfer agency fees and expenses | 26,099 |
| Accounting fees | 14,810 |
| Professional fees | 46,666 |
| Registration fees | 51,627 |
| Reports to shareholders | 10,957 |
| Interest expense and fees | 293,442 |
| Miscellaneous | 13,906 |
| Total expenses | $ 889,210 |
| Waiver and/or reimbursement of expenses by affiliate | $ (140,883) |
| Reimbursement of expenses - other | (803) |
| Net expenses | $ 747,524 |
| Net investment income | $2,635,050 |
| Realized and Unrealized Gain (Loss) | |
| Net realized gain (loss): | |
| Investment securities | $ (566,741) |
| Investment securities - affiliated issuers | 473 |
| Net realized loss | $ (566,268) |
| Change in unrealized appreciation (depreciation): | |
| Investment securities | $ 82,599 |
| Investment securities - affiliated issuers | (322) |
| Net change in unrealized appreciation (depreciation) | $ 82,277 |
| Net realized and unrealized loss | $ (483,991) |
| Net increase in net assets from operations | $2,151,059 |
| Year Ended September 30, | ||
| 2020 | 2019 | |
| Increase (Decrease) in Net Assets | ||
| From operations: | ||
| Net investment income | $ 2,635,050 | $ 3,271,083 |
| Net realized loss | (566,268) | (1,550,361) |
| Net change in unrealized appreciation (depreciation) | 82,277 | (1,054,707) |
| Net increase in net assets from operations | $ 2,151,059 | $ 666,015 |
| Distributions to shareholders: | ||
| Class A | $ (109,415) | $ (162,102) |
| Class I | (831,086) | (1,282,602) |
| Class R6 | (1,704,071) | (1,822,024) |
| Total distributions to shareholders | $ (2,644,572) | $ (3,266,728) |
| Capital share transactions: | ||
| Class A | $ (795,507) | $ 281,569 |
| Class I | 12,269,624 | (10,310,001) |
| Class R6 | 12,159,621 | (19,458,423) |
| Net increase (decrease) in net assets from capital share transactions | $23,633,738 | $(29,486,855) |
| Net increase (decrease) in net assets | $23,140,225 | $(32,087,568) |
| Net Assets | ||
| At beginning of year | $ 50,046,467 | $ 82,134,035 |
| At end of year | $73,186,692 | $ 50,046,467 |
| Year Ended | |
| September 30, 2020 | |
| Cash Flows From Operating Activities | |
| Net increase in net assets from operations | $ 2,151,059 |
| Adjustments to reconcile net increase in net assets from operations to net cash used in operating activities: | |
| Investments purchased | (47,516,525) |
| Investments sold and principal repayments | 25,039,134 |
| Increase in short-term investments, net | (2,573,948) |
| Net amortization/accretion of premium (discount) | (179,604) |
| Amortization of prepaid upfront fees on note payable | 26,357 |
| Decrease in interest receivable | 28,364 |
| Increase in dividends receivable - affiliated | (298) |
| Decrease in securities lending income receivable | 414 |
| Decrease in receivable from affiliate | 1,421 |
| Increase in prepaid expenses | (4,284) |
| Increase in Trustee's deferred compensation plan | (356) |
| Decrease in other assets | 3,091 |
| Decrease in deposits for securities loaned | (804,759) |
| Increase in payable to affiliate for investment advisory fee | 5,746 |
| Increase in payable to affiliate for administrative fee | 1,871 |
| Decrease in payable to affiliate for distribution and services fees | (195) |
| Decrease in payable to affiliate for sub-transfer agency fee | (36) |
| Increase in payable to affiliate for Trustees' deferred compensation plan | 356 |
| Decrease in accrued expenses | (34,278) |
| Increase in unfunded loan committments | 11,243 |
| Net change in unrealized (appreciation) depreciation on investments | (82,277) |
| Net realized loss from investments | 566,268 |
| Net cash used in operating activities | $(23,361,236) |
| Cash Flows From Financing Activities | |
| Cash distributions paid to shareholders | $ (139,225) |
| Proceeds from capital shares sold | 38,295,866 |
| Capital shares redeemed | (16,573,315) |
| Prepaid upfront fees on note payable | (22,500) |
| Proceeds from note payable | 22,500,000 |
| Repayments of note payable | (22,500,000) |
| Net cash provided by financing activities | $ 21,560,826 |
| Net decrease in cash | $ (1,800,410) |
| Cash at beginning of year | $ 3,154,310 |
| Cash at end of year | $ 1,353,900 |
| Supplemental disclosure of cash flow information: | |
| Noncash financing activities not included herein consist of: | |
| Reinvestment of dividends and distributions | $ 2,499,668 |
| Cash paid for interest and fees on borrowings | $ 327,061 |
| Class A | |||
| Year Ended September 30, | Period Ended September 30, | ||
| 2020 | 2019 | 2018 (1) | |
| Net asset value — Beginning of period | $ 9.73 | $ 9.97 | $10.00 |
| Income (Loss) From Operations | |||
| Net investment income(2) | $ 0.39 | $ 0.47 | $ 0.38 |
| Net realized and unrealized loss | (0.50) | (0.24) | (0.06) |
| Total income (loss) from operations | $ (0.11) | $ 0.23 | $ 0.32 |
| Less Distributions | |||
| From net investment income | $ (0.39) | $ (0.47) | $ (0.35) |
| Total distributions | $ (0.39) | $ (0.47) | $ (0.35) |
| Net asset value — End of period | $ 9.23 | $ 9.73 | $ 9.97 |
| Total Return(3) | (1.05)% | 2.42% | 3.25% (4) |
| Ratios/Supplemental Data | |||
| Net assets, end of period (000’s omitted) | $2,329 | $3,286 | $3,090 |
| Ratios (as a percentage of average daily net assets):(5) | |||
| Total expenses(6) | 1.83% | 2.29% | 2.48% (7) |
| Net expenses(6) | 1.53% | 1.98% | 2.13% (7) |
| Net investment income | 4.20% | 4.86% | 3.93% (7) |
| Portfolio Turnover | 32% | 44% | 35% (4) |
| (1) | For the period from the start of business, October 10, 2017, to September 30, 2018. |
| (2) | Computed using average shares outstanding. |
| (3) | Returns are historical and are calculated by determining the percentage change in net asset value with all distributions reinvested and do not reflect the effect of sales charges, if any. |
| (4) | Not annualized. |
| (5) | Total expenses do not reflect amounts reimbursed and/or waived by the adviser and certain of its affiliates, if applicable. Net expenses are net of all reductions and represent the net expenses paid by the Fund. |
| (6) | Includes interest expense and fees and other borrowing costs of 0.54%, 0.96% and 1.07% for the years ended September 30, 2020, 2019 and the period ended September 30, 2018, respectively. |
| (7) | Annualized. |
| Class I | |||
| Year Ended September 30, | Period Ended September 30, | ||
| 2020 | 2019 | 2018 (1) | |
| Net asset value — Beginning of period | $ 9.73 | $ 9.97 | $ 10.00 |
| Income (Loss) From Operations | |||
| Net investment income(2) | $ 0.40 | $ 0.49 | $ 0.40 |
| Net realized and unrealized loss | (0.50) | (0.23) | (0.06) |
| Total income (loss) from operations | $ (0.10) | $ 0.26 | $ 0.34 |
| Less Distributions | |||
| From net investment income | $ (0.41) | $ (0.50) | $ (0.37) |
| Total distributions | $ (0.41) | $ (0.50) | $ (0.37) |
| Net asset value — End of period | $ 9.22 | $ 9.73 | $ 9.97 |
| Total Return(3) | (0.83)% | 2.57% | 3.48% (4) |
| Ratios/Supplemental Data | |||
| Net assets, end of period (000’s omitted) | $26,958 | $14,749 | $26,452 |
| Ratios (as a percentage of average daily net assets):(5) | |||
| Total expenses(6) | 1.50% | 2.02% | 2.06% (7) |
| Net expenses(6) | 1.21% | 1.70% | 1.67% (7) |
| Net investment income | 4.34% | 5.05% | 4.10% (7) |
| Portfolio Turnover | 32% | 44% | 35% (4) |
| (1) | For the period from the start of business, October 10, 2017, to September 30, 2018. |
| (2) | Computed using average shares outstanding. |
| (3) | Returns are historical and are calculated by determining the percentage change in net asset value with all distributions reinvested and do not reflect the effect of sales charges, if any. |
| (4) | Not annualized. |
| (5) | Total expenses do not reflect amounts reimbursed and/or waived by the adviser and certain of its affiliates, if applicable. Net expenses are net of all reductions and represent the net expenses paid by the Fund. |
| (6) | Includes interest expense and fees and other borrowing costs of 0.47%, 0.93% and 0.91% for the years ended September 30, 2020, 2019 and the period ended September 30, 2018, respectively. |
| (7) | Annualized. |
| Class R6 | |||
| Year Ended September 30, | Period Ended September 30, | ||
| 2020 | 2019 | 2018 (1) | |
| Net asset value — Beginning of period | $ 9.72 | $ 9.96 | $ 10.00 |
| Income (Loss) From Operations | |||
| Net investment income(2) | $ 0.41 | $ 0.50 | $ 0.37 |
| Net realized and unrealized loss | (0.50) | (0.24) | (0.04) |
| Total income (loss) from operations | $ (0.09) | $ 0.26 | $ 0.33 |
| Less Distributions | |||
| From net investment income | $ (0.41) | $ (0.50) | $ (0.37) |
| Total distributions | $ (0.41) | $ (0.50) | $ (0.37) |
| Net asset value — End of period | $ 9.22 | $ 9.72 | $ 9.96 |
| Total Return(3) | (0.83)% | 2.67% | 3.35% (4) |
| Ratios/Supplemental Data | |||
| Net assets, end of period (000’s omitted) | $43,899 | $32,011 | $52,592 |
| Ratios (as a percentage of average daily net assets):(5) | |||
| Total expenses(6) | 1.44% | 1.99% | 1.74% (7) |
| Net expenses(6) | 1.23% | 1.72% | 1.44% (7) |
| Net investment income | 4.40% | 5.08% | 3.81% (7) |
| Portfolio Turnover | 32% | 44% | 35% (4) |
| (1) | For the period from the start of business, October 10, 2017, to September 30, 2018. |
| (2) | Computed using average shares outstanding. |
| (3) | Returns are historical and are calculated by determining the percentage change in net asset value with all distributions reinvested and do not reflect the effect of sales charges, if any. |
| (4) | Not annualized. |
| (5) | Total expenses do not reflect amounts reimbursed and/or waived by the adviser and certain of its affiliates, if applicable. Net expenses are net of all reductions and represent the net expenses paid by the Fund. |
| (6) | Includes interest expense and fees and other borrowing costs of 0.49%, 0.95% and 0.69% for the years ended September 30, 2020, 2019 and the period ended September 30, 2018, respectively. |
| (7) | Annualized. |
| Asset Description | Level 1 | Level 2 | Level 3 | Total |
| Common Stocks | $ — | $ 138,765 | $ — | $ 138,765 |
| Corporate Bonds | — | 3,459,651 | — | 3,459,651 |
| Exchange-Traded Funds | 830,754 | — | — | 830,754 |
| Senior Floating-Rate Loans (Less Unfunded Loan Commitments) | — | 87,269,373 | — | 87,269,373 |
| Short-Term Investments | — | 3,378,858 | — | 3,378,858 |
| Total Investments | $830,754 | $94,246,647 | $ — | $95,077,401 |
| Year Ended September 30, | ||
| 2020 | 2019 | |
| Ordinary income | $2,644,572 | $3,266,728 |
| Undistributed ordinary income | $ 33,572 |
| Deferred capital losses | $(2,257,453) |
| Net unrealized depreciation | $(1,069,236) |
| Distributions payable | $ (13,231) |
| Aggregate cost | $96,146,637 |
| Gross unrealized appreciation | $ 1,395,668 |
| Gross unrealized depreciation | (2,464,904) |
| Net unrealized depreciation | $ (1,069,236) |
| Name | Value, beginning of period | Purchases | Sales proceeds | Net realized gain (loss) | Change in unrealized appreciation (depreciation) | Value, end of period | Dividend income | Units, end of period |
| Short-Term Investments | ||||||||
| Calvert Cash Reserves Fund, LLC | $ — | $22,833,820 | $(19,455,113) | $473 | $(322) | $3,378,858 | $1,178 | 3,378,521 |
| Year Ended September 30, 2020 | Year Ended September 30, 2019 | ||||
| Shares | Amount | Shares | Amount | ||
| Class A | |||||
| Shares sold | 106,942 | $ 998,770 | 195,738 | $ 1,914,479 | |
| Reinvestment of distributions | 10,050 | 93,732 | 15,456 | 150,430 | |
| Shares redeemed | (202,449) | (1,888,009) | (183,374) | (1,783,340) | |
| Net increase (decrease) | (85,457) | $ (795,507) | 27,820 | $ 281,569 | |
| Class I | |||||
| Shares sold | 2,526,158 | $ 22,563,948 | 2,630,684 | $ 25,817,573 | |
| Reinvestment of distributions | 84,292 | 778,225 | 125,395 | 1,219,564 | |
| Shares redeemed | (1,204,052) | (11,072,549) | (3,893,622) | (37,347,138) | |
| Net increase (decrease) | 1,406,398 | $ 12,269,624 | (1,137,543) | $(10,310,001) | |
| Class R6 | |||||
| Shares sold | 1,769,601 | $ 14,855,170 | 459,476 | $ 4,476,567 | |
| Reinvestment of distributions | 175,811 | 1,627,711 | 155,916 | 1,517,346 | |
| Shares redeemed | (477,523) | (4,323,260) | (2,601,279) | (25,452,336) | |
| Net increase (decrease) | 1,467,889 | $ 12,159,621 | (1,985,887) | $(19,458,423) | |
Calvert Management Series:

November 20, 2020
| Name and Year of Birth | Trust Position(s) | Position Start Date | Principal Occupation(s) and Other Directorships During Past Five Years and Other Relevant Experience | |
| Interested Trustee | ||||
| John H. Streur(1) 1960 | Trustee & President | 2015 | President and Chief Executive Officer of Calvert Research and Management (since December 31, 2016). President and Chief Executive Officer of Calvert Investments, Inc. (January 2015 - December 2016); Chief Executive Officer of Calvert Investment Distributors, Inc. (August 2015 - December 2016); Chief Compliance Officer of Calvert Investment Management, Inc. (August 2015 - April 2016); President and Director, Portfolio 21 Investments, Inc. (through October 2014); President, Chief Executive Officer and Director, Managers Investment Group LLC (through January 2012); President and Director, The Managers Funds and Managers AMG Funds (through January 2012). Other Directorships in the Last Five Years. Portfolio 21 Investments, Inc. (asset management) (through October 2014); Managers Investment Group LLC (asset management) (through January 2012); The Managers Funds (asset management) (through January 2012); Managers AMG Funds (asset management) (through January 2012); Calvert Impact Capital, Inc. | |
| Independent Trustees | ||||
| Richard L. Baird, Jr. 1948 | Trustee | 1980 | Regional Disaster Recovery Lead, American Red Cross of Greater Pennsylvania (since 2017). Volunteer, American Red Cross (since 2015). Former President and CEO of Adagio Health Inc. (retired in 2014) in Pittsburgh, PA. Other Directorships in the Last Five Years. None. | |
| Alice Gresham Bullock 1950 | Chair & Trustee | 2016 | Professor Emerita at Howard University School of Law. Dean Emerita of Howard University School of Law and Deputy Director of the Association of American Law Schools (1992-1994). Other Directorships in the Last Five Years. None. | |
| Cari M. Dominguez 1949 | Trustee | 2016 | Former Chair of the U.S. Equal Employment Opportunity Commission. Other Directorships in the Last Five Years. Manpower, Inc. (employment agency); Triple S Management Corporation (managed care); National Association of Corporate Directors. | |
| John G. Guffey, Jr.(2) 1948 | Trustee | 1982 | President of Aurora Press Inc., a privately held publisher of trade paperbacks (since January 1997). Other Directorships in the Last Five Years. Calvert Impact Capital, Inc. (through December 31, 2018); Calvert Ventures, LLC. | |
| Miles D. Harper, III 1962 | Trustee | 2016 | Partner, Carr Riggs & Ingram (public accounting firm) since October 2014. Partner, Gainer Donnelly & Desroches (public accounting firm) (now Carr Riggs & Ingram), (November 1999-September 2014). Other Directorships in the Last Five Years. Bridgeway Funds (9) (asset management). | |
| Joy V. Jones 1950 | Trustee | 2016 | Attorney. Other Directorships in the Last Five Years. Conduit Street Restaurants SUD 2 Limited; Palm Management Restaurant Corporation. | |
| Name and Year of Birth | Trust Position(s) | Position Start Date | Principal Occupation(s) and Other Directorships During Past Five Years and Other Relevant Experience | |
| Independent Trustees (continued) | ||||
| Anthony A. Williams 1951 | Trustee | 2010 | CEO and Executive Director of the Federal City Council (July 2012 to present); Senior Adviser and Independent Consultant for King and Spalding LLP (September 2015 to present); Executive Director of Global Government Practice at the Corporate Executive Board (January 2010 to January 2012). Other Directorships in the Last Five Years. Freddie Mac; Evoq Properties/Meruelo Maddux Properties, Inc. (real estate management); Weston Solutions, Inc. (environmental services); Bipartisan Policy Center’s Debt Reduction Task Force; Chesapeake Bay Foundation; Catholic University of America; Urban Institute (research organization). | |
| Name and Year of Birth | Trust Position(s) | Position Start Date | Principal Occupation(s) During Past Five Years | |
| Principal Officers who are not Trustees | ||||
| Hope L. Brown 1973 | Chief Compliance Officer | 2014 | Chief Compliance Officer of 39 registered investment companies advised by CRM (since 2014). Vice President and Chief Compliance Officer, Wilmington Funds (2012-2014). | |
| Maureen A. Gemma(3) 1960 | Secretary, Vice President and Chief Legal Officer | 2016 | Vice President of CRM and officer of 39 registered investment companies advised by CRM (since 2016). Also Vice President of Eaton Vance and certain of its affiliates and officer of 156 registered investment companies advised or administered by Eaton Vance. | |
| James F. Kirchner(3) 1967 | Treasurer | 2016 | Vice President of CRM and officer of 39 registered investment companies advised by CRM (since 2016). Also Vice President of Eaton Vance and certain of its affiliates and officer of 156 registered investment companies advised or administered by Eaton Vance. | |
| (1) Mr. Streur is an interested person of the Fund because of his positions with the Fund’s adviser and certain affiliates. | ||||
| (2) Mr. Guffey is currently married to Rebecca L. Adamson, who served as a member of the Advisory Council through December 31, 2019. | ||||
| (3) The business address for Ms. Gemma and Mr. Kirchner is Two International Place, Boston, MA 02110. | ||||
| • | At the time of opening an account, Eaton Vance generally requires you to provide us with certain information such as name, address, social security number, tax status, account numbers, and account balances. This information is necessary for us to both open an account for you and to allow us to satisfy legal requirements such as applicable anti-money laundering reviews and know-your-customer requirements. |
| • | On an ongoing basis, in the normal course of servicing your account, Eaton Vance may share your information with unaffiliated third parties that perform various services for Eaton Vance and/or your account. These third parties include transfer agents, custodians, broker/dealers and our professional advisers, including auditors, accountants, and legal counsel. Eaton Vance may additionally share your personal information with our affiliates. |
| • | We believe our Privacy Program is reasonably designed to protect the confidentiality of your personal information and to prevent unauthorized access to that information. |
| • | We reserve the right to change our Privacy Program at any time upon proper notification to you. You may want to review our Privacy Program periodically for changes by accessing the link on our homepage: www.calvert.com. |

| Item 2. | Code of Ethics |
The registrant has adopted a code of ethics applicable to its Principal Executive Officer, Principal Financial Officer and Principal Accounting Officer. The registrant undertakes to provide a copy of such code of ethics to any person upon request, without charge, by calling 1-800-368-2745. The registrant has not amended the code of ethics as described in Form N-CSR during the period covered by this report. The registrant has not granted any waiver, including an implicit waiver, from a provision of the code of ethics as described in Form N-CSR during the period covered by this report.
| Item 3. | Audit Committee Financial Expert |
The registrant’s Board of Trustees has determined that Miles D. Harper III, an “independent” Trustee serving on the registrant’s audit committee, is an “audit committee financial expert,” as defined in Item 3 of Form N-CSR. Under applicable securities laws, a person who is determined to be an audit committee financial expert will not be deemed an “expert” for any purpose, including without limitation for the purposes of Section 11 of the Securities Act of 1933, as a result of being designated or identified as an audit committee financial expert. The
designation or identification of a person as an audit committee financial expert does not impose on such person any duties, obligations, or liabilities that are greater than the duties, obligations, and liabilities imposed on such person as a member of the audit committee and Board of Trustees in the absence of such designation or identification.
| Item 4. | Principal Accountant Fees and Services |
(a) –(d)
The various Series comprising the Trust have differing fiscal year ends (September 30 and December 31). The following table presents the aggregate audit, audit-related, tax, and other fees billed to all of the Series in the Trust by KPMG for the last two fiscal years of each Series.
Fiscal Years Ended | 12/31/18 | %* | 9/30/19 | %* | 12/31/19 | %* | 9/30/20 | %* | ||||||||||||||||||||||||
Audit Fees | $ | 48,616 | 0 | % | $ | 56,591 | 0 | % | $ | 53,282 | 0 | % | $ | 33,047 | 0 | % | ||||||||||||||||
Audit-Related Fees(1) | $ | 0 | 0 | % | $ | 0 | 0 | % | $ | 0 | 0 | % | $ | 0 | 0 | % | ||||||||||||||||
Tax Fees(2) | $ | 11,700 | 0 | % | $ | 12,600 | 0 | % | $ | 12,600 | 0 | % | $ | 4,950 | 0 | % | ||||||||||||||||
All Other Fees(3) | $ | 0 | 0 | % | $ | 0 | 0 | % | $ | 0 | 0 | % | $ | 0 | 0 | % | ||||||||||||||||
|
|
|
|
|
|
|
|
|
|
|
|
|
|
|
| |||||||||||||||||
Total | $ | 60,316 | 0 | % | $ | 69,191 | 0 | % | $ | 65,882 | 0 | % | $ | 37,997 | 0 | % | ||||||||||||||||
|
|
|
|
|
|
|
|
|
|
|
|
|
|
|
| |||||||||||||||||
| * | Percentage of fees approved by the Audit Committee pursuant to (c)(7)(i)(C) of Rule 2-01 of Reg. S-X (statutory de minimus waiver of Committee’s requirement to pre-approve). |
| (1) | Audit-related fees consist of the aggregate fees billed for assurance and related services that are reasonably related to the performance of the audit of the registrant’s financial statements and are not reported under the category of audit fees. |
| (2) | Tax fees consist of the aggregate fees billed for professional services rendered by the principal accountant relating to tax compliance, tax advice, and tax planning and specifically include fees for tax return preparation and other related tax compliance/planning matters. |
| (3) | All other fees consist of the aggregate fees billed for products and services provided by the principal accountant other than audit, audit-related, and tax services. |
(e) The Audit Committee is required to pre-approve all audit and non-audit services provided to the registrant by the auditors, and to the registrant’s investment adviser, and any entity controlling, controlled by, or under common control with the adviser that provides ongoing services to the registrant. In determining whether to pre-approve non-audit services, the Audit Committee considers whether the services are consistent with maintaining the independence of the auditors. The Committee may delegate its authority to pre-approve certain matters to one or more of its members. In this regard, the Committee has delegated authority jointly to the Audit Committee Chair together with another Committee member with respect to non-audit services not exceeding $25,000 in each instance. In addition, the Committee has pre-approved the retention of the auditors to provide tax-related services related to the tax treatment and tax accounting of newly acquired securities, upon request by the investment adviser in each instance.
(f) Not applicable.
(g) Aggregate non-audit fees billed by the registrant’s accountant for services rendered to the registrant, and rendered to the registrant’s investment adviser, and any entity controlling, controlled by, or under common control with the adviser that provides ongoing services to the registrant for each of the last two fiscal years of each Series.
| Fiscal Year ended 12/31/18 | Fiscal Year ended 9/30/19 | Fiscal Year ended 12/31/19 | Fiscal Year ended 9/30/20 | |||||||||||
| $ | %* | $ | %* | $ | %* | $ | %* | |||||||
| $11,700 | 0% | $12,600 | 0% | $12,600 | 0% | $4,950 | 0% | |||||||
| * | Percentage of fees approved by the Audit Committee pursuant to (c)(7)(i)(C) of Rule 2-01 of Reg. S-X (statutory de minimus waiver of Committee’s requirement to pre-approve). |
(h) The registrant’s audit committee has considered whether the provision by the registrant’s principal accountant of non-audit services to the registrant’s investment adviser and any entity controlling, controlled by, or under common control with the adviser that provides ongoing services to the registrant that were not pre-approved pursuant to Rule 2-01(c)(7)(ii) of Regulation S-X is compatible with maintaining the principal accountant’s independence.
| Item 5. | Audit Committee of Listed Registrants |
Not applicable.
| Item 6. | Schedule of Investments |
Please see schedule of investments contained in the Report to Stockholders included under Item 1 of this Form N-CSR.
| Item 7. | Disclosure of Proxy Voting Policies and Procedures for Closed-End Management Investment Companies |
Not applicable.
| Item 8. | Portfolio Managers of Closed-End Management Investment Companies |
Not applicable.
| Item 9. | Purchases of Equity Securities by Closed-End Management Investment Company and Affiliated Purchasers |
Not applicable.
| Item 10. | Submission of Matters to a Vote of Security Holders |
No material changes.
| Item 11. | Controls and Procedures |
(a) The registrant’s principal executive and principal financial officers have concluded that the registrant’s disclosure controls and procedures (as defined in Rule 30a-3(c) under the Investment Company Act of 1940
Act, as amended (the “1940 Act”) are effective, based on the evaluation of these controls and procedures required by Rule 30a-3(b) under the 1940 Act and Rules 13a-15(b) or 15d-15(b) under the Securities Exchange Act of 1934 (“Exchange Act”), as of a date within 90 days of the filing date of this report.
(b) There was no change in the registrant’s internal control over financial reporting (as defined in Rule 30a-3(d) under the 1940 Act) that occurred during the period covered by this report that has materially affected, or is reasonably likely to materially affect, the registrant’s internal control over financial reporting.
| Item 12. | Disclosure of Securities Lending Activities for Closed-End Management Investment Companies |
Not applicable.
| Item 13. | Exhibits |
(a)(1) | Registrant’s Code of Ethics – Not applicable (please see Item 2). | |
| Treasurer’s Section 302 certification. | ||
| President’s Section 302 certification. | ||
| Combined Section 906 certification. | ||
Signatures
Pursuant to the requirements of the Securities Exchange Act of 1934 and the Investment Company Act of 1940, the registrant has duly caused this report to be signed on its behalf by the undersigned, thereunto duly authorized.
| CALVERT MANAGEMENT SERIES | ||
| By: | /s/ John H. Streur | |
| John H. Streur | ||
| President | ||
| Date: | November 20, 2020 | |
Pursuant to the requirements of the Securities Exchange Act of 1934 and the Investment Company Act of 1940, this report has been signed below by the following persons on behalf of the registrant and in the capacities and on the dates indicated.
| By: | /s/ James F. Kirchner | |
| James F. Kirchner | ||
| Treasurer | ||
| Date: | November 20, 2020 | |
| By: | /s/ John H. Streur | |
| John H. Streur | ||
| President | ||
| Date: | November 20, 2020 | |