UNITED STATES
SECURITIES AND EXCHANGE COMMISSION
Washington, D.C. 20549
Form N-CSR
CERTIFIED SHAREHOLDER REPORT OF REGISTERED
MANAGEMENT INVESTMENT COMPANIES
Investment Company Act File Number: 811-03101
CALVERT MANAGEMENT SERIES
(Exact Name of Registrant as Specified in Charter)
1825 Connecticut Avenue NW, Suite 400, Washington, DC 20009
(Address of Principal Executive Offices)
Deidre E. Walsh
Two International Place, Boston, Massachusetts 02110
(Name and Address of Agent for Services)
(202) 238-2200
(Registrant’s Telephone Number)
December 31
Date of Fiscal Year End
December 31, 2021
Date of Reporting Period
Item 1. Reports to Stockholders
Calvert
Flexible Bond Fund
Annual Report
December 31, 2021
Commodity Futures Trading Commission Registration. The Commodity Futures Trading Commission (“CFTC”) has adopted regulations that subject registered investment companies and advisers to regulation by the CFTC if a fund invests more than a prescribed level of its assets in certain CFTC-regulated instruments (including futures, certain options and swap agreements) or markets itself as providing investment exposure to such instruments. The adviser has claimed an exclusion from the definition of “commodity pool operator” under the Commodity Exchange Act with respect to its management of the Fund and the other funds it manages. Accordingly, neither the Fund nor the adviser is subject to CFTC regulation.
Fund shares are not insured by the FDIC and are not deposits or other obligations of, or guaranteed by, any depository institution. Shares are subject to investment risks, including possible loss of principal invested.
This report must be preceded or accompanied by a current summary prospectus or prospectus. Before investing, investors should consider carefully the investment objective, risks, and charges and expenses of a mutual fund. This and other important information is contained in the summary prospectus and prospectus, which can be obtained from a financial intermediary. Prospective investors should read the prospectus carefully before investing. For further information, please call 1-800-368-2745.
Choose Planet-friendly E-delivery!
Sign up now for on-line statements, prospectuses, and fund reports. In less than five minutes you can help reduce paper mail and lower fund costs.
Just go to www.calvert.com. If you already have an online account with the Calvert funds, click on Login to access your Account and select the documents you would like to receive via e-mail.
If you’re new to online account access, click on Login, then Register to create your user name and password. Once you’re in, click on the E-delivery sign-up on the Account Portfolio page and follow the quick, easy steps.
Note: If your shares are not held directly with the Calvert funds but through a brokerage firm, you must contact your broker for electronic delivery options available through their firm.
Annual Report December 31, 2021
Calvert
Flexible Bond Fund
Calvert
Flexible Bond Fund
December 31, 2021
Management's Discussion of Fund Performance†
Economic and Market Conditions
During the 12-month period ended December 31, 2021, the U.S. fixed-income market was influenced by several key events: a change in U.S. federal government leadership, the introduction of COVID-19 vaccines, and the reopening of the U.S. economy. Against that background, fixed-income returns were generally weak, while equity markets posted strong returns as optimism about the economic reopening returned to the market.
The period began with multiple drugmakers announcing successful clinical trials in the development of COVID-19 vaccines. During the first quarter of the period, the U.S. Federal Reserve (the Fed) maintained accommodative monetary policies and Congress passed $900 billion in additional fiscal stimulus. Stocks performed well, credit spreads tightened, and long-term U.S. Treasury yields rose as the U.S. dollar weakened during the first quarter. Bond markets suffered in the first quarter as the Bloomberg U.S. Aggregate Bond Index posted its worst quarterly return in 40 years.
During the second quarter of 2021, global equity markets grew in value, while fixed-income markets staged a bounce back as the U.S. Treasury yield curve flattened. The tighter monetary stance taken by the Fed in June raised expectations of potential interest rate hikes to help manage inflation. At the same time, the Fed announced plans to taper its monthly bond purchases.
As 2021 progressed, inflation became a growing concern among investors. Strong demand for goods and services, ongoing supply-side constraints, and rising commodity prices contributed to inflationary fears. As a result, many central banks worldwide began to take less accommodative postures.
In the fall, the Fed accelerated the tapering of its bond-buying policy and in December indicated it might raise interest rates as much as three times in 2022. Although this caused a further flattening of the U.S. Treasury yield curve, it was not accompanied by the significant yield spread widening that typically comes with a flattening curve. Investment-grade corporate credit spreads widened modestly during the fourth quarter, while high yield bond spreads tightened. The Bloomberg U.S. Aggregate Bond Index was essentially flat during the final quarter of the period, capping a year of weak returns.
The Bloomberg U.S. Aggregate Bond Index returned (1.54)% in 2021, which was its first calendar-year loss since 2013. The ICE BofA U.S. High Yield and S&P/LSTA Leveraged Loan indexes gained 5.36% and 5.20%, respectively, during the period. The S& P 500® Index returned 28.71% and the Nasdaq Composite Index returned 22.18% during the period.
Fund Performance
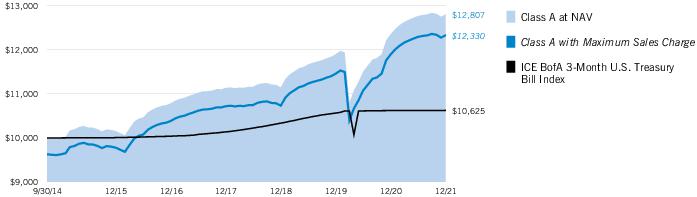
For the 12-month period ended December 31, 2021, Calvert Flexible Bond Fund (the Fund) returned 3.62% for Class A shares at net asset value (NAV), outperforming its benchmark, the ICE BofA 3-Month U.S. Treasury Bill Index (the Index), which returned 0.05%.
The Fund’s sector allocations contributed most to outperformance relative to the Index during the period. Its allocation to investment-grade corporate bonds was especially beneficial. Allocations to asset-backed securities, commercial mortgage-backed securities, and high yield corporate securities also made strong contributions to performance relative to the Index during the period. Allocations to mortgage-backed securities, Treasury Inflation-Protected Securities, and bank loans further enhanced relative performance.
The Fund’s duration and yield-curve positioning detracted from returns during the period.
The use of derivatives had a minor positive impact on returns relative to the Index during the period.
See Endnotes and Additional Disclosures in this report.
Past performance is no guarantee of future results. Returns are historical and are calculated by determining the percentage change in net asset value (NAV) or offering price (as applicable) with all distributions reinvested. Investment return and principal value will fluctuate so that shares, when redeemed, may be worth more or less than their original cost. Performance for periods less than or equal to one year is cumulative. Performance is for the stated time period only; due to market volatility, current Fund performance may be lower or higher than the quoted return. For performance as of the most recent month-end, please refer to www.calvert.com.
Calvert
Flexible Bond Fund
December 31, 2021
Performance
Portfolio Manager(s) Vishal Khanduja, CFA and Brian S. Ellis, CFA, each of Calvert Research and Management
| % Average Annual Total Returns1,2 | Class
Inception Date | Performance
Inception Date | One Year | Five Years | Since
Inception |
| Class A at NAV | 09/30/2014 | 09/30/2014 | 3.62% | 3.49% | 3.47% |
| Class A with 3.75% Maximum Sales Charge | — | — | (0.29) | 2.70 | 2.93 |
| Class C at NAV | 09/30/2014 | 09/30/2014 | 2.77 | 2.70 | 2.69 |
| Class C with 1% Maximum Sales Charge | — | — | 1.77 | 2.70 | 2.69 |
| Class I at NAV | 09/30/2014 | 09/30/2014 | 3.81 | 3.78 | 3.81 |
| Class R6 at NAV | 05/01/2019 | 09/30/2014 | 3.96 | 3.83 | 3.85 |
|
| ICE BofA 3-Month U.S. Treasury Bill Index | — | — | 0.05% | 1.14% | 0.84% |
| % Total Annual Operating Expense Ratios3 | Class A | Class C | Class I | Class R6 |
| Gross | 0.95% | 1.70% | 0.70% | 0.62% |
| Net | 0.92 | 1.67 | 0.67 | 0.59 |
| % SEC Yield4 | Class A | Class C | Class I | Class R6 |
| SEC 30-day Yield - Subsidized | 2.02% | 1.34% | 2.36% | 2.43% |
| SEC 30-day Yield - Unsubsidized | 2.02 | 1.34 | 2.36 | 2.43 |
Growth of $10,000
This graph shows the change in value of a hypothetical investment of $10,000 in Class A of the Fund for the period indicated. For comparison, the same investment is shown in the indicated index.
| Growth of Investment2 | Amount Invested | Period Beginning | At NAV | With Maximum Sales Charge |
| Class C | $10,000 | 09/30/2014 | $12,121 | N.A. |
| Class I | $250,000 | 09/30/2014 | $327,859 | N.A. |
| Class R6 | $1,000,000 | 09/30/2014 | $1,315,032 | N.A. |
See Endnotes and Additional Disclosures in this report.
Past performance is no guarantee of future results. Returns are historical and are calculated by determining the percentage change in net asset value (NAV) or offering price (as applicable) with all distributions reinvested. Investment return and principal value will fluctuate so that shares, when redeemed, may be worth more or less than their original cost. Performance for periods less than or equal to one year is cumulative. Performance is for the stated time period only; due to market volatility, current Fund performance may be lower or higher than the quoted return. For performance as of the most recent month-end, please refer to www.calvert.com.
Calvert
Flexible Bond Fund
December 31, 2021
Asset Allocation (% of total investments)
Credit Quality (% of bond holdings)*

* For purposes of the Fund’s rating restrictions, ratings are based on Moody’s Investors Service, Inc. (“Moody’s”), S&P Global Ratings (“S&P”) or Fitch Ratings (“Fitch”), or Kroll Bond Rating Agency, LLC (“Kroll”) for securitized debt instruments only (such as asset-backed securities (“ABS”) and mortgage-backed securities (“MBS”)), as applicable. If securities are rated differently by the ratings agencies, the highest rating is applied. Ratings, which are subject to change, apply to the creditworthiness of the issuers of the underlying securities and not to the Fund or its shares. Credit ratings measure the quality of an issuance based on the issuer’s creditworthiness, with ratings ranging from AAA, being the highest, to D, being the lowest based on S&P’s measures. Ratings of BBB or higher by S&P, Fitch or Kroll (Baa or higher by Moody’s) are considered to be investment-grade quality. Credit ratings are based largely on the ratings agency’s analysis at the time of rating. The rating assigned to any particular security is not necessarily a reflection of the issuer’s current financial condition and does not necessarily reflect its assessment of the volatility of a security’s market value or of the liquidity of an investment in the security. Holdings designated as “Not Rated” (if any) are not rated by the national ratings agencies stated above.
Calvert
Flexible Bond Fund
December 31, 2021
Endnotes and Additional Disclosures
| † | The views expressed in this report are those of the portfolio manager(s) and are current only through the date stated at the top of this page. These views are subject to change at any time based upon market or other conditions, and Calvert and the Fund(s) disclaim any responsibility to update such views. These views may not be relied upon as investment advice and, because investment decisions are based on many factors, may not be relied upon as an indication of trading intent on behalf of any Calvert fund. This commentary may contain statements that are not historical facts, referred to as “forward-looking statements.” The Fund’s actual future results may differ significantly from those stated in any forward-looking statement, depending on factors such as changes in securities or financial markets or general economic conditions, the volume of sales and purchases of Fund shares, the continuation of investment advisory, administrative and service contracts, and other risks discussed from time to time in the Fund’s filings with the Securities and Exchange Commission. |
| | |
| 1 | ICE BofA 3-Month U.S. Treasury Bill Index is an unmanaged index of U.S. Treasury securities maturing in 90 days. ICE® BofA® indices are not for redistribution or other uses; provided “as is”, without warranties, and with no liability. Eaton Vance has prepared this report and ICE Data Indices, LLC does not endorse it, or guarantee, review, or endorse Eaton Vance’s products. BofA® is a licensed registered trademark of Bank of America Corporation in the United States and other countries. Unless otherwise stated, index returns do not reflect the effect of any applicable sales charges, commissions, expenses, taxes or leverage, as applicable. It is not possible to invest directly in an index. |
| 2 | Total Returns at NAV do not include applicable sales charges. If sales charges were deducted, the returns would be lower. Total Returns shown with maximum sales charge reflect the stated maximum sales charge. Unless otherwise stated, performance does not reflect the deduction of taxes on Fund distributions or redemptions of Fund shares.Performance prior to the inception date of a class may be linked to the performance of an older class of the Fund. This linked performance is adjusted for any applicable sales charge, but is not adjusted for class expense differences. If adjusted for such differences, the performance would be different. The performance of Class R6 is linked to Class I. Performance since inception for an index, if presented, is the performance since the Fund’s or oldest share class’ inception, as applicable. Performance presented in the Financial Highlights included in the financial statements is not linked.Calvert Research and Management became the investment adviser to the Fund on December 31, 2016. Performance reflected prior to such date is that of the Fund’s former investment adviser. |
| 3 | Source: Fund prospectus. Net expense ratios reflect a contractual expense reimbursement that continues through 4/30/22. The expense ratios for the current reporting period can be found in the Financial Highlights section of this report. Performance reflects expenses waived and/or reimbursed, if applicable. Without such waivers and/or reimbursements, performance would have been lower. |
| 4 | SEC Yield is a standardized measure based on the estimated yield to maturity of a fund’s investments over a 30-day period and is based on the maximum offer price at the date specified. The SEC Yield is not based on the distributions made by the Fund, which may differ. Subsidized yield reflects the effect of fee waivers and expense reimbursements. |
| Fund profile subject to change due to active management. |
| | Additional Information |
| | Bloomberg U.S. Aggregate Bond Index is an unmanaged index of domestic investment-grade bonds, including corporate, government and mortgage-backed securities. ICE BofA U.S. High Yield Index is an unmanaged index of below investment grade U.S. corporate bonds. ICE® BofA® indices are not for redistribution or other uses; provided “as is”, without warranties, and with no liability. Eaton Vance has prepared this report and ICE Data Indices, LLC does not endorse it, or guarantee, review, or endorse Eaton Vance’s products. BofA® is a licensed registered trademark of Bank of America Corporation in the United States and other countries. S&P/LSTA Leveraged Loan Index is an unmanaged index of the institutional leveraged loan market. S&P 500® Index is an unmanaged index of large-cap stocks commonly used as a measure of U.S. stock market performance. S&P/LSTA Leveraged Loan indices and S&P Dow Jones Indices are products of S&P Dow Jones Indices LLC (“S&P DJI”) and have been licensed for use. S&P® and S&P 500® are registered trademarks of S&P DJI; Dow Jones® is a registered trademark of Dow Jones Trademark Holdings LLC (“Dow Jones”); LSTA is a trademark of Loan Syndications and Trading Association, Inc. S&P DJI, Dow Jones, their respective affiliates and their third party licensors do not sponsor, endorse, sell or promote the Fund, will not have any liability with respect thereto and do not have any liability for any errors, omissions, or interruptions of the S&P Dow Jones Indices. Nasdaq Composite Index is a market capitalization-weighted index of all domestic and international securities listed on Nasdaq. Source: Nasdaq, Inc. The information is provided by Nasdaq (with its affiliates, are referred to as the “Corporations”) and Nasdaq’s third party licensors on an “as is” basis and the Corporations make no guarantees and bear no liability of any kind with respect to the information or the Fund. |
| | Credit spread is the difference in yield between a U.S. Treasury bond and another debt security of the same maturity but different credit quality. |
Calvert
Flexible Bond Fund
December 31, 2021
Endnotes and Additional Disclosures — continued
Yield curve is a graphical representation of the yields offered by bonds of various maturities. The yield curve flattens when long-term interest rates fall and/or short-term interest rates increase, and the yield curve steepens when long-term interest rates increase and/or short-term interest rates fall.
Duration is a measure of the expected change in price of a bond — in percentage terms — given a one percent change in interest rates, all else being constant. Securities with lower durations tend to be less sensitive to interest rate changes.
Calvert
Flexible Bond Fund
December 31, 2021
Example
As a Fund shareholder, you incur two types of costs: (1) transaction costs, including sales charges (loads) on purchases and redemption fees (if applicable); and (2) ongoing costs, including management fees; distribution and/or service fees; and other Fund expenses. This Example is intended to help you understand your ongoing costs (in dollars) of Fund investing and to compare these costs with the ongoing costs of investing in other mutual funds. The Example is based on an investment of $1,000 invested at the beginning of the period and held for the entire period (July 1, 2021 to December 31, 2021).
Actual Expenses
The first section of the table below provides information about actual account values and actual expenses. You may use the information in this section, together with the amount you invested, to estimate the expenses that you paid over the period. Simply divide your account value by $1,000 (for example, an $8,600 account value divided by $1,000 = 8.6), then multiply the result by the number in the first section under the heading entitled “Expenses Paid During Period” to estimate the expenses you paid on your account during this period.
Hypothetical Example for Comparison Purposes
The second section of the table below provides information about hypothetical account values and hypothetical expenses based on the actual Fund expense ratio and an assumed rate of return of 5% per year (before expenses), which is not the actual Fund return. The hypothetical account values and expenses may not be used to estimate the actual ending account balance or expenses you paid for the period. You may use this information to compare the ongoing costs of investing in the Fund and other funds. To do so, compare this 5% hypothetical example with the 5% hypothetical examples that appear in the shareholder reports of the other funds.
Please note that the expenses shown in the table are meant to highlight your ongoing costs only and do not reflect any transactional costs, such as sales charges (loads) or redemption fees (if applicable). Therefore, the second section of the table is useful in comparing ongoing costs only, and will not help you determine the relative total costs of owning different funds. In addition, if these transactional costs were included, your costs would be higher.
| | Beginning
Account Value
(7/1/21) | Ending
Account Value
(12/31/21) | Expenses Paid
During Period*
(7/1/21 – 12/31/21) | Annualized
Expense
Ratio |
| Actual | | | | |
| Class A | $1,000.00 | $1,002.90 | $4.54 ** | 0.90% |
| Class C | $1,000.00 | $ 998.40 | $8.31 ** | 1.65% |
| Class I | $1,000.00 | $1,003.50 | $3.28 ** | 0.65% |
| Class R6 | $1,000.00 | $1,004.60 | $2.83 ** | 0.56% |
| Hypothetical | | | | |
| (5% return per year before expenses) | | | | |
| Class A | $1,000.00 | $1,020.67 | $4.58 ** | 0.90% |
| Class C | $1,000.00 | $1,016.89 | $8.39 ** | 1.65% |
| Class I | $1,000.00 | $1,021.93 | $3.31 ** | 0.65% |
| Class R6 | $1,000.00 | $1,022.38 | $2.85 ** | 0.56% |
| * | Expenses are equal to the Fund's annualized expense ratio for the indicated Class, multiplied by the average account value over the period, multiplied by 184/365 (to reflect the one-half year period). The Example assumes that the $1,000 was invested at the net asset value per share determined at the close of business on June 30, 2021. |
| ** | Absent a waiver and/or reimbursement of expenses by an affiliate, expenses would be higher. |
Calvert
Flexible Bond Fund
December 31, 2021
| Asset-Backed Securities — 20.8% |
| Security | Principal
Amount
(000's omitted) | Value |
| Adams Outdoor Advertising, L.P., Series 2018-1, Class A, 4.81%, 11/15/48(1) | $ | 593 | $ 611,811 |
| Avant Loans Funding Trust: | | | |
| Series 2020-REV1, Class C, 4.17%, 5/15/29(1) | | 1,000 | 1,003,479 |
| Series 2021-REV1, Class D, 4.30%, 7/15/30(1) | | 1,512 | 1,518,469 |
| Business Jet Securities, LLC, Series 2020-1A, Class A, 2.981%, 11/15/35(1) | | 458 | 458,356 |
| Coinstar Funding, LLC, Series 2017-1A, Class A2, 5.216%, 4/25/47(1) | | 2,112 | 2,110,362 |
| Cologix Data Centers US Issuer, LLC, Series 2021-1A, Class B, 3.79%, 12/26/51(1) | | 1,315 | 1,316,386 |
| Conn's Receivables Funding, LLC: | | | |
| Series 2020-A, Class B, 4.27%, 6/16/25(1) | | 697 | 699,889 |
| Series 2020-A, Class C, 4.20%, 6/16/25(1) | | 370 | 371,245 |
| Series 2021-A, Class B, 2.87%, 5/15/26(1) | | 930 | 927,797 |
| Series 2021-A, Class C, 4.59%, 5/15/26(1) | | 2,190 | 2,183,915 |
| Diamond Infrastructure Funding, LLC, Series 2021-1A, Class C, 3.475%, 4/15/49(1) | | 292 | 291,038 |
| Driven Brands Funding, LLC, Series 2018-1A, Class A2, 4.739%, 4/20/48(1) | | 381 | 397,877 |
| ExteNet, LLC, Series 2019-1A, Class B, 4.14%, 7/26/49(1) | | 725 | 738,843 |
| FOCUS Brands Funding, LLC: | | | |
| Series 2017-1A, Class A2IB, 3.857%, 4/30/47(1) | | 1,504 | 1,527,350 |
| Series 2017-1A, Class A2II, 5.093%, 4/30/47(1) | | 76 | 80,739 |
| Hardee's Funding, LLC, Series 2020-1A, Class A2, 3.981%, 12/20/50(1) | | 544 | 572,213 |
| Jack in the Box Funding, LLC, Series 2019-1A, Class A2I, 3.982%, 8/25/49(1) | | 700 | 705,672 |
| Jersey Mike's Funding, Series 2019-1A, Class A2, 4.433%, 2/15/50(1) | | 405 | 427,090 |
| Loanpal Solar Loan, Ltd., Series 2020-1GS, Class C, 2.00%, 6/20/47(1) | | 1,267 | 1,163,069 |
| Lunar Aircraft, Ltd., Series 2020-1A, Class B, 4.335%, 2/15/45(1) | | 117 | 106,725 |
| Marlette Funding Trust, Series 2020-2A, Class C, 2.83%, 9/16/30(1) | | 545 | 552,407 |
| Mosaic Solar Loan Trust: | | | |
| Series 2019-2A, Class B, 3.28%, 9/20/40(1) | | 474 | 484,005 |
| Series 2020-1A, Class B, 3.10%, 4/20/46(1) | | 64 | 65,877 |
| Series 2020-1A, Class C, 4.47%, 4/20/46(1) | | 191 | 193,055 |
| Series 2020-2A, Class B, 2.21%, 8/20/46(1) | | 221 | 220,575 |
| Series 2021-3A, Class C, 1.77%, 6/20/52(1) | | 345 | 338,688 |
| Series 2021-3A, Class D, 3.28%, 6/20/52(1) | | 632 | 624,757 |
| Neighborly Issuer, LLC, Series 2021-1A, Class A2, 3.584%, 4/30/51(1) | | 791 | 797,692 |
| NRZ Excess Spread-Collateralized Notes: | | | |
| Series 2021-FHT1, Class A, 3.104%, 7/25/26(1) | | 169 | 168,476 |
| Security | Principal
Amount
(000's omitted) | Value |
| NRZ Excess Spread-Collateralized Notes: (continued) | | | |
| Series 2021-GNT1, Class A, 3.474%, 11/25/26(1) | $ | 2,009 | $ 2,008,792 |
| Oportun Issuance Trust: | | | |
| Series 2021-B, Class C, 3.65%, 5/8/31(1) | | 976 | 977,852 |
| Series 2021-C, Class B, 2.67%, 10/8/31(1) | | 2,995 | 2,974,033 |
| Series 2021-C, Class C, 3.61%, 10/8/31(1) | | 470 | 466,866 |
| Pagaya AI Debt Selection Trust: | | | |
| Series 2020-3, Class B, 3.22%, 5/17/27(1) | | 1,570 | 1,589,970 |
| Series 2021-2, 3.00%, 1/25/29(1) | | 1,608 | 1,609,090 |
| Series 2021-3, Class C, 3.27%, 5/15/29(1) | | 3,950 | 3,897,615 |
| Series 2021-5, Class C, 3.93%, 8/15/29(1) | | 1,262 | 1,260,487 |
| Planet Fitness Master Issuer, LLC: | | | |
| Series 2018-1A, Class A2I, 4.262%, 9/5/48(1) | | 798 | 801,268 |
| Series 2018-1A, Class A2II, 4.666%, 9/5/48(1) | | 343 | 351,760 |
| Series 2019-1A, Class A2, 3.858%, 12/5/49(1) | | 529 | 545,006 |
| Prodigy Finance, Series 2021-1A, Class C, 3.852%, (1 mo. USD LIBOR + 3.75%), 7/25/51(1)(2) | | 986 | 990,691 |
| Prosper Marketplace Issuance Trust, Series 2019-4A, Class C, 4.95%, 2/17/26(1) | | 1,190 | 1,201,893 |
| ServiceMaster Funding, LLC: | | | |
| Series 2020-1, Class A2I, 2.841%, 1/30/51(1) | | 195 | 194,690 |
| Series 2020-1, Class A2II, 3.337%, 1/30/51(1) | | 424 | 428,549 |
| SERVPRO Master Issuer, LLC, Series 2019-1A, Class A2, 3.882%, 10/25/49(1) | | 1,667 | 1,710,389 |
| Small Business Lending Trust, Series 2020-A, Class A, 2.62%, 12/15/26(1) | | 63 | 62,598 |
| Sonic Capital, LLC, Series 2020-1A, Class A2I, 3.845%, 1/20/50(1) | | 1,346 | 1,399,511 |
| Stack Infrastructure Issuer, LLC: | | | |
| Series 2019-1A, Class A2, 4.54%, 2/25/44(1) | | 1,833 | 1,900,496 |
| Series 2019-2A, Class A2, 3.08%, 10/25/44(1) | | 200 | 204,049 |
| Sunnova Helios II Issuer, LLC, Series 2021-A, Class B, 3.15%, 2/20/48(1) | | 912 | 895,011 |
| Sunnova Sol II Issuer, LLC, Series 2020-2A, Class B, 5.47%, 11/1/55(1) | | 676 | 692,770 |
| Sunrun Xanadu Issuer, LLC, Series 2019-1A, Class A, 3.98%, 6/30/54(1) | | 176 | 186,284 |
| Theorem Funding Trust: | | | |
| Series 2020-1A, Class A, 2.48%, 10/15/26(1) | | 62 | 62,747 |
| Series 2020-1A, Class B, 3.95%, 10/15/26(1) | | 2,269 | 2,298,850 |
| Series 2021-1A, Class B, 1.84%, 12/15/27(1) | | 891 | 881,239 |
| Thunderbolt Aircraft Lease, Ltd., Series 2017-A, Class C, 4.50%, 5/17/32(1) | | 353 | 233,843 |
| Upstart Securitization Trust: | | | |
| Series 2020-1, Class C, 4.899%, 4/22/30(1) | | 1,934 | 1,988,425 |
| Series 2020-3, Class C, 6.25%, 11/20/30(1) | | 2,300 | 2,432,800 |
| Series 2021-1, Class B, 1.89%, 3/20/31(1) | | 750 | 746,858 |
8
See Notes to Financial Statements.
Calvert
Flexible Bond Fund
December 31, 2021
Schedule of Investments — continued
| Security | Principal
Amount
(000's omitted) | Value |
| Vantage Data Centers Issuer, LLC: | | | |
| Series 2019-1A, Class A2, 3.188%, 7/15/44(1) | $ | 1,232 | $ 1,259,128 |
| Series 2020-2A, Class A2, 1.992%, 9/15/45(1) | | 820 | 805,652 |
| Willis Engine Structured Trust V: | | | |
| Series 2020-A, Class B, 4.212%, 3/15/45(1) | | 244 | 227,349 |
| Series 2020-A, Class C, 6.657%, 3/15/45(1) | | 194 | 140,855 |
Total Asset-Backed Securities
(identified cost $58,127,257) | | | $ 58,085,273 |
| Collateralized Mortgage Obligations — 12.0% |
| Security | Principal
Amount
(000's omitted) | Value |
| Bellemeade Re, Ltd.: | | | |
| Series 2017-1, Class B1, 4.852%, (1 mo. USD LIBOR + 4.75%), 10/25/27(1)(2) | $ | 655 | $ 669,570 |
| Series 2020-4A, Class M2A, 2.702%, (1 mo. USD LIBOR + 2.60%), 6/25/30(1)(2) | | 53 | 53,506 |
| Series 2021-1A, Class M1C, 3.00%, (30-day average SOFR + 2.95%), 3/25/31(1)(2) | | 900 | 927,227 |
| Series 2021-3A, Class M1B, 1.45%, (30-day average SOFR + 1.40%), 9/25/31(1)(2) | | 2,220 | 2,211,570 |
| Eagle Re, Ltd., Series 2021-2, Class M1C, 3.50%, (30-day average SOFR + 3.45%), 4/25/34(1)(2) | | 861 | 864,820 |
| Federal Home Loan Mortgage Corp. Structured Agency Credit Risk Debt Notes: | | | |
| Series 2015-HQ2, Class M3, 3.353%, (1 mo. USD LIBOR + 3.25%), 5/25/25(2) | | 349 | 354,511 |
| Series 2017-DNA3, Class M2, 2.603%, (1 mo. USD LIBOR + 2.50%), 3/25/30(2) | | 880 | 898,069 |
| Series 2018-DNA1, Class M2, 1.903%, (1 mo. USD LIBOR + 1.80%), 7/25/30(2) | | 1,991 | 2,004,126 |
| Series 2018-DNA1, Class M2AT, 1.153%, (1 mo. USD LIBOR + 1.05%), 7/25/30(2) | | 665 | 667,525 |
| Series 2019-DNA2, Class M2, 2.553%, (1 mo. USD LIBOR + 2.45%), 3/25/49(1)(2) | | 489 | 495,195 |
| Series 2019-DNA3, Class B2, 8.253%, (1 mo. USD LIBOR + 8.15%), 7/25/49(1)(2) | | 1,270 | 1,347,654 |
| Series 2019-DNA3, Class M2, 2.153%, (1 mo. USD LIBOR + 2.05%), 7/25/49(1)(2) | | 1,955 | 1,972,152 |
| Series 2019-HQA2, Class B1, 4.203%, (1 mo. USD LIBOR + 4.10%), 4/25/49(1)(2) | | 795 | 814,771 |
| Series 2019-HQA3, Class B1, 3.103%, (1 mo. USD LIBOR + 3.00%), 9/25/49(1)(2) | | 410 | 413,703 |
| Series 2019-HQA4, Class B1, 3.053%, (1 mo. USD LIBOR + 2.95%), 11/25/49(1)(2) | | 290 | 292,267 |
| Series 2020-DNA4, Class M2, 3.853%, (1 mo. USD LIBOR + 3.75%), 8/25/50(1)(2) | | 62 | 62,539 |
| Series 2020-DNA5, Class M2, 2.85%, (30-day average SOFR + 2.80%), 10/25/50(1)(2) | | 234 | 236,057 |
| Series 2020-DNA6, Class B1, 3.05%, (30-day average SOFR + 3.00%), 12/25/50(1)(2) | | 275 | 278,859 |
| Security | Principal
Amount
(000's omitted) | Value |
| Federal Home Loan Mortgage Corp. Structured Agency Credit Risk Debt Notes: (continued) | | | |
| Series 2020-HQA2, Class B1, 4.203%, (1 mo. USD LIBOR + 4.10%), 3/25/50(1)(2) | $ | 569 | $ 589,473 |
| Federal National Mortgage Association Connecticut Avenue Securities: | | | |
| Series 2014-C04, Class 1M2, 5.003%, (1 mo. USD LIBOR + 4.90%), 11/25/24(2) | | 580 | 603,946 |
| Series 2018-C06, Class 1M2, 2.103%, (1 mo. USD LIBOR + 2.00%), 3/25/31(2) | | 319 | 321,715 |
| Series 2018-R07, Class 1M2, 2.502%, (1 mo. USD LIBOR + 2.40%), 4/25/31(1)(2) | | 252 | 254,051 |
| Series 2019-R01, Class 2B1, 4.453%, (1 mo. USD LIBOR + 4.35%), 7/25/31(1)(2) | | 795 | 818,821 |
| Series 2019-R02, Class 1B1, 4.253%, (1 mo. USD LIBOR + 4.15%), 8/25/31(1)(2) | | 795 | 816,211 |
| Series 2019-R03, Class 1B1, 4.203%, (1 mo. USD LIBOR + 4.10%), 9/25/31(1)(2) | | 795 | 817,039 |
| Series 2019-R05, Class 1B1, 4.203%, (1 mo. USD LIBOR + 4.10%), 7/25/39(1)(2) | | 1,375 | 1,400,285 |
| Series 2019-R06, Class 2B1, 3.852%, (1 mo. USD LIBOR + 3.75%), 9/25/39(1)(2) | | 950 | 962,899 |
| Series 2019-R07, Class 1B1, 3.503%, (1 mo. USD LIBOR + 3.40%), 10/25/39(1)(2) | | 1,173 | 1,185,426 |
| Series 2020-R02, Class 2B1, 3.103%, (1 mo. USD LIBOR + 3.00%), 1/25/40(1)(2) | | 494 | 497,323 |
| Series 2021-R01, Class 1B2, 6.05%, (30-day average SOFR + 6.00%), 10/25/41(1)(2) | | 836 | 856,212 |
| Series 2021-R02, Class 2B1, 3.35%, (30-day average SOFR + 3.30%), 11/25/41(1)(2) | | 180 | 180,877 |
| FMC GMSR Issuer Trust: | | | |
| Series 2021-GT1, Class A, 3.62%, 7/25/26(1)(3) | | 655 | 651,079 |
| Series 2021-GT2, Class A, 3.85%, 10/25/26(1)(3) | | 1,029 | 1,023,172 |
| Home Re, Ltd.: | | | |
| Series 2018-1, Class M2, 3.102%, (1 mo. USD LIBOR + 3.00%), 10/25/28(1)(2) | | 4,385 | 4,424,930 |
| Series 2021-1, Class M1C, 2.402%, (1 mo. USD LIBOR + 2.30%), 7/25/33(1)(2) | | 325 | 320,740 |
| Series 2021-1, Class M2, 2.952%, (1 mo. USD LIBOR + 2.85%), 7/25/33(1)(2) | | 1,295 | 1,265,662 |
| Radnor Re, Ltd., Series 2021-2, Class M1A, 1.90%, (30-day average SOFR + 1.85%), 11/25/31(1)(2) | | 455 | 457,088 |
| Toorak Mortgage Corp., Ltd., Series 2020-1, Class A1, 2.734% to 1/25/23, 3/25/23(1)(4) | | 640 | 641,624 |
| ZH Trust: | | | |
| Series 2021-1, Class A, 2.253%, 2/18/27(1) | | 450 | 448,697 |
| Series 2021-2, Class A, 2.349%, 10/17/27(1) | | 393 | 391,204 |
Total Collateralized Mortgage Obligations
(identified cost $33,228,058) | | | $ 33,492,595 |
9
See Notes to Financial Statements.
Calvert
Flexible Bond Fund
December 31, 2021
Schedule of Investments — continued
| Commercial Mortgage-Backed Securities — 10.2% |
| Security | Principal
Amount
(000's omitted) | Value |
| BAMLL Commercial Mortgage Securities Trust: | | | |
| Series 2019-BPR, Class ENM, 3.719%, 11/5/32(1)(3) | $ | 3,865 | $ 3,622,630 |
| Series 2019-BPR, Class FNM, 3.719%, 11/5/32(1)(3) | | 1,555 | 1,248,125 |
| BBCMS Mortgage Trust, Series 2018-RRI, Class F, 4.759%, (1 mo. USD LIBOR + 4.65%), 2/15/33(1)(2) | | 1,198 | 1,203,472 |
| BX Commercial Mortgage Trust, Series 2021-VOLT, Class D, 1.759%, (1 mo. USD LIBOR + 1.65%), 9/15/36(1)(2) | | 2,362 | 2,347,091 |
| CGMS Commercial Mortgage Trust: | | | |
| Series 2017-MDRB, Class A, 1.21%, (1 mo. USD LIBOR + 1.10%), 7/15/30(1)(2) | | 406 | 405,002 |
| Series 2017-MDRC, Class C, 1.41%, (1 mo. USD LIBOR + 1.30%), 7/15/30(1)(2) | | 600 | 593,604 |
| Series 2017-MDRC, Class D, 2.36%, (1 mo. USD LIBOR + 2.25%), 7/15/30(1)(2) | | 2,175 | 2,136,329 |
| Extended Stay America Trust, Series 2021-ESH, Class D, 2.36%, (1 mo. USD LIBOR + 2.25%), 7/15/38(1)(2) | | 2,827 | 2,831,565 |
| Federal National Mortgage Association Multifamily Connecticut Avenue Securities Trust: | | | |
| Series 2019-01, Class M10, 3.352%, (1 mo. USD LIBOR + 3.25%), 10/15/49(1)(2) | | 970 | 960,307 |
| Series 2020-01, Class M10, 3.852%, (1 mo. USD LIBOR + 3.75%), 3/25/50(1)(2) | | 2,252 | 2,291,462 |
| JPMorgan Chase Commercial Mortgage Securities Trust, Series 2014-DSTY, Class B, 3.771%, 6/10/27(1) | | 605 | 177,870 |
| Med Trust, Series 2021-MDLN, Class G, 5.36%, (1 mo. USD LIBOR + 5.25%), 11/15/38(1)(2) | | 1,130 | 1,121,549 |
| Morgan Stanley Capital I Trust: | | | |
| Series 2017-CLS, Class E, 2.06%, (1 mo. USD LIBOR + 1.95%), 11/15/34(1)(2)(5) | | 671 | 670,116 |
| Series 2017-CLS, Class F, 2.71%, (1 mo. USD LIBOR + 2.60%), 11/15/34(1)(2)(5) | | 2,196 | 2,189,100 |
| Series 2019-BPR, Class B, 2.21%, (1 mo. USD LIBOR + 2.10%), 5/15/36(1)(2)(5) | | 2,621 | 2,501,861 |
| Series 2019-BPR, Class C, 3.16%, (1 mo. USD LIBOR + 3.05%), 5/15/36(1)(2)(5) | | 960 | 874,265 |
| Motel Trust, Series 2021-MTL6, Class D, 2.21%, (1 mo. USD LIBOR + 2.10%), 9/15/38(1)(2) | | 171 | 171,385 |
| VMC Finance, LLC, Series 2021-HT1, Class B, 4.603%, (1 mo. USD LIBOR + 4.50%), 1/18/37(1)(2) | | 3,122 | 3,125,688 |
Total Commercial Mortgage-Backed Securities
(identified cost $29,214,847) | | | $ 28,471,421 |
| Security | Shares | Value |
| Diversified Telecommunication Services — 0.1% | |
| Verizon Communications, Inc. | | 8,000 | $ 415,680 |
Total Common Stocks
(identified cost $446,149) | | | $ 415,680 |
| Security | Principal
Amount
(000's omitted) | Value |
| Technology — 0.7% | |
| ams AG, 0.875%, 9/28/22(6) | $ | 2,000 | $ 1,971,113 |
Total Convertible Bonds
(identified cost $1,967,180) | | | $ 1,971,113 |
| Security | Principal
Amount
(000's omitted) | Value |
| Basic Materials — 0.2% | |
| WR Grace Holdings, LLC, 5.625%, 8/15/29(1) | $ | 670 | $ 687,588 |
| | | | $ 687,588 |
| Communications — 4.1% | |
| AT&T, Inc.: | | | |
| 3.10%, 2/1/43 | $ | 677 | $ 659,529 |
| 3.50%, 9/15/53 | | 560 | 566,037 |
| 3.65%, 6/1/51 | | 885 | 918,551 |
| CCO Holdings, LLC/CCO Holdings Capital Corp., 5.00%, 2/1/28(1) | | 1,993 | 2,076,706 |
| Charter Communications Operating, LLC/Charter Communications Operating Capital, 4.80%, 3/1/50 | | 1,350 | 1,515,213 |
| Level 3 Financing, Inc., 3.75%, 7/15/29(1) | | 450 | 428,229 |
| Nokia Oyj: | | | |
| 4.375%, 6/12/27 | | 600 | 648,729 |
| 6.625%, 5/15/39 | | 750 | 1,038,847 |
| SES Global Americas Holdings GP, 5.30%, 3/25/44(1) | | 410 | 469,694 |
| SES S.A., 5.30%, 4/4/43(1) | | 245 | 281,303 |
| Sprint Corp., 7.875%, 9/15/23 | | 1,204 | 1,327,681 |
| T-Mobile USA, Inc.: | | | |
| 2.25%, 2/15/26(7) | | 277 | 278,115 |
| 2.625%, 4/15/26 | | 412 | 414,598 |
| Ziggo B.V., 5.50%, 1/15/27(1) | | 730 | 750,922 |
| | | | $ 11,374,154 |
10
See Notes to Financial Statements.
Calvert
Flexible Bond Fund
December 31, 2021
Schedule of Investments — continued
| Security | Principal
Amount
(000's omitted) | Value |
| Consumer, Cyclical — 5.7% | |
| American Airlines Pass-Through Trust, 5.25%, 1/15/24 | $ | 78 | $ 77,131 |
| American Airlines, Inc./AAdvantage Loyalty IP, Ltd.: | | | |
| 5.50%, 4/20/26(1) | | 1,617 | 1,683,992 |
| 5.75%, 4/20/29(1) | | 267 | 285,892 |
| Dave & Buster's, Inc., 7.625%, 11/1/25(1) | | 1,239 | 1,322,341 |
| Delta Air Lines, Inc./SkyMiles IP, Ltd., 4.75%, 10/20/28(1) | | 757 | 827,236 |
| Ford Motor Credit Co., LLC: | | | |
| 1.221%, (3 mo. USD LIBOR + 1.08%), 8/3/22(2) | | 3,225 | 3,230,862 |
| 3.087%, 1/9/23 | | 481 | 489,764 |
| 3.375%, 11/13/25 | | 1,294 | 1,346,064 |
| Lithia Motors, Inc.: | | | |
| 3.875%, 6/1/29(1) | | 475 | 485,699 |
| 4.375%, 1/15/31(1)(7) | | 945 | 1,010,143 |
| Macy's Retail Holdings, LLC: | | | |
| 3.625%, 6/1/24 | | 549 | 561,932 |
| 4.30%, 2/15/43 | | 495 | 435,085 |
| MDC Holdings, Inc., 2.50%, 1/15/31 | | 894 | 865,989 |
| Nordstrom, Inc.: | | | |
| 4.25%, 8/1/31(7) | | 521 | 512,674 |
| 4.375%, 4/1/30(7) | | 778 | 786,013 |
| 5.00%, 1/15/44(7) | | 713 | 665,985 |
| Powdr Corp., 6.00%, 8/1/25(1) | | 1,285 | 1,340,191 |
| | | | $ 15,926,993 |
| Consumer, Non-cyclical — 3.2% | |
| Ashtead Capital, Inc.: | | | |
| 4.00%, 5/1/28(1) | $ | 441 | $ 461,060 |
| 4.25%, 11/1/29(1) | | 514 | 548,547 |
| Avantor Funding, Inc., 4.625%, 7/15/28(1) | | 1,258 | 1,313,560 |
| Avon Products, Inc., 8.45%, 3/15/43 | | 429 | 528,273 |
| Block Financial, LLC, 3.875%, 8/15/30 | | 1,108 | 1,186,801 |
| Centene Corp.: | | | |
| 3.375%, 2/15/30 | | 469 | 478,406 |
| 4.25%, 12/15/27 | | 897 | 936,674 |
| 4.625%, 12/15/29 | | 543 | 586,543 |
| Hikma Finance USA, LLC, 3.25%, 7/9/25(6) | | 958 | 985,475 |
| Natura Cosmeticos S.A., 4.125%, 5/3/28(1) | | 976 | 959,281 |
| Smithfield Foods, Inc.: | | | |
| 2.625%, 9/13/31(1)(7) | | 437 | 423,286 |
| 5.20%, 4/1/29(1) | | 595 | 680,220 |
| | | | $ 9,088,126 |
| Energy — 1.3% | |
| NuStar Logistics, L.P.: | | | |
| 5.75%, 10/1/25 | $ | 583 | $ 627,964 |
| Security | Principal
Amount
(000's omitted) | Value |
| Energy (continued) | |
| NuStar Logistics, L.P.: (continued) | | | |
| 6.00%, 6/1/26 | $ | 340 | $ 369,255 |
| 6.375%, 10/1/30 | | 440 | 489,073 |
| TerraForm Power Operating, LLC: | | | |
| 4.75%, 1/15/30(1) | | 1,442 | 1,513,927 |
| 5.00%, 1/31/28(1) | | 625 | 662,891 |
| | | | $ 3,663,110 |
| Financial — 12.2% | |
| AerCap Holdings N.V., 5.875% to 10/10/24, 10/10/79(8) | $ | 173 | $ 179,308 |
| Alliance Data Systems Corp., 4.75%, 12/15/24(1) | | 1,634 | 1,668,968 |
| Alliant Holdings Intermediate, LLC/Alliant Holdings Co-Issuer, 6.75%, 10/15/27(1) | | 670 | 695,822 |
| American Assets Trust, L.P., 3.375%, 2/1/31 | | 1,010 | 1,032,446 |
| Banco BTG Pactual S.A./Cayman Islands, 4.50%, 1/10/25(1) | | 1,290 | 1,302,848 |
| Banco do Brasil S.A., 3.25%, 9/30/26(1) | | 1,735 | 1,690,931 |
| BankUnited, Inc., 5.125%, 6/11/30 | | 526 | 599,740 |
| BBVA Bancomer S.A./Texas, 5.125% to 1/18/28, 1/18/33(1)(7)(8) | | 1,538 | 1,580,856 |
| Broadstone Net Lease, LLC, 2.60%, 9/15/31 | | 305 | 296,390 |
| CI Financial Corp.: | | | |
| 3.20%, 12/17/30 | | 1,140 | 1,171,038 |
| 4.10%, 6/15/51(7) | | 352 | 382,369 |
| Citigroup, Inc., 4.00% to 12/10/25(8)(9) | | 659 | 665,590 |
| Enact Holdings, Inc., 6.50%, 8/15/25(1) | | 2,477 | 2,708,612 |
| EPR Properties, 3.75%, 8/15/29 | | 1,218 | 1,230,489 |
| HAT Holdings I, LLC/HAT Holdings II, LLC: | | | |
| 3.375%, 6/15/26(1) | | 1,105 | 1,117,531 |
| 6.00%, 4/15/25(1) | | 774 | 805,734 |
| Iron Mountain, Inc.: | | | |
| 4.50%, 2/15/31(1) | | 929 | 940,612 |
| 5.00%, 7/15/28(1) | | 1,114 | 1,146,312 |
| Macquarie Bank, Ltd.: | | | |
| 3.052% to 3/3/31, 3/3/36(1)(8) | | 864 | 852,804 |
| 3.624%, 6/3/30(1) | | 631 | 659,099 |
| Newmark Group, Inc., 6.125%, 11/15/23 | | 1,445 | 1,547,595 |
| OneMain Finance Corp.: | | | |
| 3.50%, 1/15/27 | | 693 | 686,060 |
| 7.125%, 3/15/26 | | 1,065 | 1,215,671 |
| Radian Group, Inc.: | | | |
| 4.875%, 3/15/27 | | 1,490 | 1,600,353 |
| 6.625%, 3/15/25 | | 505 | 558,623 |
| Sabra Health Care, L.P., 3.20%, 12/1/31 | | 1,244 | 1,217,042 |
| Societe Generale S.A., 4.75% to 5/26/26(1)(8)(9) | | 329 | 334,892 |
| Stewart Information Services Corp., 3.60%, 11/15/31 | | 814 | 825,113 |
11
See Notes to Financial Statements.
Calvert
Flexible Bond Fund
December 31, 2021
Schedule of Investments — continued
| Security | Principal
Amount
(000's omitted) | Value |
| Financial (continued) | |
| Synovus Bank/Columbus, GA, 4.00% to 10/29/25, 10/29/30(8) | $ | 729 | $ 759,905 |
| Synovus Financial Corp., 5.90% to 2/7/24, 2/7/29(8) | | 979 | 1,046,927 |
| Texas Capital Bancshares, Inc., 4.00% to 5/6/26, 5/6/31(8) | | 981 | 1,014,793 |
| Truist Financial Corp., 5.10% to 3/1/30(8)(9) | | 868 | 972,160 |
| UBS Group AG, 4.375% to 2/10/31(1)(7)(8)(9) | | 534 | 528,820 |
| UniCredit SpA: | | | |
| 5.459% to 6/30/30, 6/30/35(1)(8) | | 332 | 362,100 |
| 5.861% to 6/19/27, 6/19/32(1)(8) | | 700 | 768,482 |
| | | | $ 34,166,035 |
| Industrial — 0.9% | |
| Hexcel Corp., 4.20%, 2/15/27 | $ | 112 | $ 120,342 |
| Imola Merger Corp., 4.75%, 5/15/29(1) | | 1,148 | 1,179,989 |
| Valmont Industries, Inc., 5.00%, 10/1/44 | | 937 | 1,160,962 |
| | | | $ 2,461,293 |
| Technology — 1.7% | |
| DXC Technology Co., 2.375%, 9/15/28 | $ | 458 | $ 448,076 |
| Kyndryl Holdings, Inc., 2.70%, 10/15/28(1) | | 1,587 | 1,537,129 |
| Seagate HDD Cayman: | | | |
| 3.375%, 7/15/31 | | 500 | 488,665 |
| 5.75%, 12/1/34(7) | | 1,170 | 1,350,086 |
| Western Digital Corp., 4.75%, 2/15/26 | | 833 | 911,931 |
| | | | $ 4,735,887 |
| Utilities — 1.2% | |
| Clearway Energy Operating, LLC, 3.75%, 1/15/32(1) | $ | 401 | $ 398,568 |
| Engie Energia Chile S.A., 3.40%, 1/28/30(1) | | 790 | 801,009 |
| NextEra Energy Operating Partners, L.P., 4.50%, 9/15/27(1) | | 800 | 864,800 |
| Pattern Energy Operations, L.P./Pattern Energy Operations, Inc., 4.50%, 8/15/28(1) | | 1,260 | 1,309,215 |
| | | | $ 3,373,592 |
Total Corporate Bonds
(identified cost $83,940,811) | | | $ 85,476,778 |
| High Social Impact Investments — 0.2% |
| Security | Principal
Amount
(000's omitted) | Value |
| Calvert Impact Capital, Inc., Community Investment Notes, 1.50%, 12/15/23(10)(11) | $ | 500 | $ 489,530 |
Total High Social Impact Investments
(identified cost $500,000) | | | $ 489,530 |
| Security | Shares | Value |
| Fixed-Income Mutual Funds — 3.1% | |
| Calvert Floating-Rate Advantage Fund, Class R6(12) | | 917,630 | $ 8,680,782 |
Total Mutual Funds
(identified cost $8,331,125) | | | $ 8,680,782 |
| Security | Shares | Value |
| Oil, Gas & Consumable Fuels — 0.4% | |
| NuStar Energy, L.P., Series B, 7.625% to 6/15/22(8) | | 53,308 | $ 1,199,430 |
| | | | $ 1,199,430 |
| Real Estate Management & Development — 0.7% | |
| Brookfield Property Partners, L.P., Series A, 5.75% | | 78,480 | $ 1,848,989 |
| | | | $ 1,848,989 |
| Wireless Telecommunication Services — 0.5% | |
| United States Cellular Corp.: | | | |
| 5.50% | | 27,725 | $ 731,940 |
| 6.25% | | 27,000 | 731,700 |
| | | | $ 1,463,640 |
Total Preferred Stocks
(identified cost $4,356,709) | | | $ 4,512,059 |
| Senior Floating-Rate Loans — 4.3%(13) |
| Borrower/Description | Principal
Amount
(000's omitted) | Value |
| Air Transport — 0.4% | |
| SkyMiles IP, Ltd., Term Loan, 4.75%, (3 mo. USD LIBOR + 3.75%, Floor 1.00%), 10/20/27 | $ | 1,100 | $ 1,165,862 |
| | | | $ 1,165,862 |
| Automotive — 0.2% | |
| Clarios Global, L.P., Term Loan, 4/30/26(14) | $ | 600 | $ 597,313 |
| | | | $ 597,313 |
| Building and Development — 0.2% | |
| Cushman & Wakefield U.S. Borrower, LLC, Term Loan, 2.852%, (1 mo. USD LIBOR + 2.75%), 8/21/25 | $ | 588 | $ 585,369 |
| | | | $ 585,369 |
12
See Notes to Financial Statements.
Calvert
Flexible Bond Fund
December 31, 2021
Schedule of Investments — continued
| Borrower/Description | Principal
Amount
(000's omitted) | Value |
| Cable and Satellite Television — 0.5% | |
| CSC Holdings, LLC, Term Loan, 2.36%, (1 mo. USD LIBOR + 2.25%), 7/17/25 | $ | 546 | $ 538,074 |
| UPC Financing Partnership, Term Loan, 3.11%, (1 mo. USD LIBOR + 3.00%), 1/31/29 | | 500 | 499,000 |
| Virgin Media Bristol, LLC, Term Loan, 3.36%, (1 mo. USD LIBOR + 3.25%), 1/31/29 | | 500 | 500,313 |
| | | | $ 1,537,387 |
| Electronics/Electrical — 1.0% | |
| Banff Merger Sub, Inc., Term Loan, 3.974%, (3 mo. USD LIBOR + 3.75%), 10/2/25 | $ | 445 | $ 443,735 |
| Hyland Software, Inc., Term Loan, 4.25%, (1 mo. USD LIBOR + 3.50%, Floor 0.75%), 7/1/24 | | 709 | 710,441 |
| Informatica, LLC, Term Loan, 2.875%, (1 mo. USD LIBOR + 2.75%), 10/27/28 | | 300 | 299,288 |
| MA FinanceCo., LLC, Term Loan, 2.854%, (1 mo. USD LIBOR + 2.75%), 6/21/24 | | 60 | 60,159 |
| Seattle Spinco, Inc., Term Loan, 2.854%, (1 mo. USD LIBOR + 2.75%), 6/21/24 | | 408 | 406,268 |
| SS&C European Holdings S.a.r.l., Term Loan, 1.854%, (1 mo. USD LIBOR + 1.75%), 4/16/25 | | 119 | 118,175 |
| SS&C Technologies, Inc., Term Loan, 1.854%, (1 mo. USD LIBOR + 1.75%), 4/16/25 | | 150 | 147,927 |
| Ultimate Software Group, Inc. (The), Term Loan, 3.854%, (1 mo. USD LIBOR + 3.75%), 5/4/26 | | 500 | 498,924 |
| | | | $ 2,684,917 |
| Equipment Leasing — 0.1% | |
| Avolon TLB Borrower 1 (US), LLC, Term Loan, 2.50%, (1 mo. USD LIBOR + 1.75%, Floor 0.75%), 1/15/25 | $ | 175 | $ 175,641 |
| | | | $ 175,641 |
| Health Care — 0.8% | |
| Change Healthcare Holdings, LLC, Term Loan, 3.50%, (1 mo. USD LIBOR + 2.50%, Floor 1.00%), 3/1/24 | $ | 472 | $ 472,049 |
| ICON Luxembourg S.a.r.l.: | | | |
| Term Loan, 2.75%, (3 mo. USD LIBOR + 2.25%, Floor 0.50%), 7/3/28 | | 544 | 545,449 |
| Term Loan, 2.75%, (3 mo. USD LIBOR + 2.25%, Floor 0.50%), 7/3/28 | | 136 | 135,899 |
| Ortho-Clinical Diagnostics S.A., Term Loan, 3.103%, (1 mo. USD LIBOR + 3.00%), 6/30/25 | | 650 | 650,583 |
| Select Medical Corporation, Term Loan, 2.36%, (1 mo. USD LIBOR + 2.25%), 3/6/25 | | 550 | 546,992 |
| | | | $ 2,350,972 |
| Borrower/Description | Principal
Amount
(000's omitted) | Value |
| Insurance — 0.5% | |
| Asurion, LLC: | | | |
| Term Loan, 3.229%, (1 mo. USD LIBOR + 3.125%), 11/3/23 | $ | 509 | $ 508,806 |
| Term Loan, 3.354%, (1 mo. USD LIBOR + 3.25%), 12/23/26 | | 297 | 295,299 |
| USI, Inc., Term Loan, 3.224%, (3 mo. USD LIBOR + 3.00%), 5/16/24 | | 499 | 495,480 |
| | | | $ 1,299,585 |
| Leisure Goods/Activities/Movies — 0.2% | |
| Bombardier Recreational Products, Inc., Term Loan, 2.101%, (1 mo. USD LIBOR + 2.00%), 5/24/27 | $ | 136 | $ 134,362 |
| Delta 2 (LUX) S.a.r.l., Term Loan, 2/1/24(14) | | 500 | 500,134 |
| | | | $ 634,496 |
| Telecommunications — 0.4% | |
| CenturyLink, Inc., Term Loan, 2.354%, (1 mo. USD LIBOR + 2.25%), 3/15/27 | $ | 509 | $ 503,499 |
| Level 3 Financing, Inc., Term Loan, 1.854%, (1 mo. USD LIBOR + 1.75%), 3/1/27 | | 142 | 139,995 |
| Ziggo Financing Partnership, Term Loan, 2.61%, (3 mo. USD LIBOR + 2.50%), 4/30/28 | | 510 | 505,219 |
| | | | $ 1,148,713 |
Total Senior Floating-Rate Loans
(identified cost $12,182,342) | | | $ 12,180,255 |
| Sovereign Government Bonds — 0.2% |
| Security | Principal
Amount
(000's omitted) | Value |
| Kreditanstalt fuer Wiederaufbau, 1.25%, 8/28/23 | NOK | 6,040 | $ 684,841 |
Total Sovereign Government Bonds
(identified cost $658,683) | | | $ 684,841 |
| U.S. Treasury Obligations — 11.1% |
| Security | Principal
Amount
(000's omitted) | Value |
| U.S. Treasury Notes: | | | |
| 0.25%, 3/15/24 | $ | 14,274 | $ 14,105,054 |
| 0.25%, 5/31/25 | | 14,310 | 13,922,065 |
| 1.00%, 7/31/28 | | 1,048 | 1,020,531 |
| 1.25%, 4/30/28 | | 1,050 | 1,040,689 |
13
See Notes to Financial Statements.
Calvert
Flexible Bond Fund
December 31, 2021
Schedule of Investments — continued
| Security | Principal
Amount
(000's omitted) | Value |
| U.S. Treasury Notes: (continued) | | | |
| 1.375%, 10/31/28 | $ | 860 | $ 856,775 |
Total U.S. Treasury Obligations
(identified cost $30,976,872) | | | $ 30,945,114 |
| Short-Term Investments — 6.9% | | | |
| Affiliated Fund — 5.2% |
| Description | Units | Value |
| Calvert Cash Reserves Fund, LLC, 0.06%(15) | | 14,462,361 | $ 14,462,361 |
Total Affiliated Fund
(identified cost $14,461,914) | | | $ 14,462,361 |
| Securities Lending Collateral — 1.7% |
| Security | Shares | Value |
| State Street Navigator Securities Lending Government Money Market Portfolio, 0.03%(16) | | 4,683,635 | $ 4,683,635 |
Total Securities Lending Collateral
(identified cost $4,683,635) | | | $ 4,683,635 |
Total Short-Term Investments
(identified cost $19,145,549) | | | $ 19,145,996 |
Total Purchased Options — 0.0%(17)
(identified cost $101,832) | | | $ 83,125 |
Total Investments — 101.7%
(identified cost $283,177,414) | | | $284,634,562 |
| Other Assets, Less Liabilities — (1.7)% | | | $ (4,781,462) |
| Net Assets — 100.0% | | | $ 279,853,100 |
| The percentage shown for each investment category in the Schedule of Investments is based on net assets. |
| (1) | Security exempt from registration under Rule 144A of the Securities Act of 1933, as amended. These securities may be sold in certain transactions in reliance on an exemption from registration (normally to qualified institutional buyers). At December 31, 2021, the aggregate value of these securities is $156,667,238 or 56.0% of the Fund's net assets. |
| (2) | Variable rate security. The stated interest rate represents the rate in effect at December 31, 2021. |
| (3) | Weighted average fixed-rate coupon that changes/updates monthly. Rate shown is the rate at December 31, 2021. |
| (4) | Step coupon security. Interest rate represents the rate in effect at
December 31, 2021. |
| (5) | Represents an investment in an issuer that may be deemed to be an affiliate effective March 1, 2021 (see Note 8). |
| (6) | Security exempt from registration under Regulation S of the Securities Act of 1933, as amended, which exempts from registration securities offered and sold outside the United States. Security may not be offered or sold in the United States except pursuant to an exemption from, or in a transaction not subject to, the registration requirements of the Securities Act of 1933, as amended. At December 31, 2021, the aggregate value of these securities is $2,956,588 or 1.1% of the Fund's net assets. |
| (7) | All or a portion of this security was on loan at December 31, 2021. The aggregate market value of securities on loan at December 31, 2021 was $5,293,123. |
| (8) | Security converts to variable rate after the indicated fixed-rate coupon period. |
| (9) | Perpetual security with no stated maturity date but may be subject to calls by the issuer. |
| (10) | May be deemed to be an affiliated company (see Note 8). |
| (11) | Restricted security. Total market value of restricted securities amounts to $489,530, which represents 0.2% of the net assets of the Fund as of December 31, 2021. |
| (12) | Affiliated fund (see Note 8). |
| (13) | Senior floating-rate loans (Senior Loans) often require prepayments from excess cash flows or permit the borrowers to repay at their election. The degree to which borrowers repay, whether as a contractual requirement or at their election, cannot be predicted with accuracy. As a result, the actual remaining maturity may be substantially less than the stated maturities shown. However, Senior Loans will typically have an expected average life of approximately two to four years. Senior Loans typically have rates of interest which are redetermined periodically by reference to a base lending rate, plus a spread. These base lending rates are primarily the London Interbank Offered Rate ("LIBOR") and secondarily, the prime rate offered by one or more major United States banks (the "Prime Rate"). Base lending rates may be subject to a floor, or minimum rate. Senior Loans are generally subject to contractual restrictions that must be satisfied before they can be bought or sold. |
| (14) | This Senior Loan will settle after December 31, 2021, at which time the interest rate will be determined. |
| (15) | Affiliated investment company, available to Calvert portfolios and funds, which invests in high quality, U.S. dollar denominated money market instruments. The rate shown is the annualized seven-day yield as of December 31, 2021. |
| (16) | Represents investment of cash collateral received in connection with securities lending. |
| (17) | Amount is less than 0.05%. |
14
See Notes to Financial Statements.
Calvert
Flexible Bond Fund
December 31, 2021
Schedule of Investments — continued
Purchased Put Options — 0.0%(1)
Exchange-Traded Options — 0.0%(1)
| Description | Number of
Contracts | Notional
Amount | Exercise
Price | Expiration
Date | Value |
| U.S. 10-Year Treasury Note Futures 3/2022 | 280 | $36,531,250 | $128.50 | 2/18/22 | $ 83,125 |
| Total | | | | | $83,125 |
| (1) | Amount is less than 0.05%. |
Futures Contracts
| Description | Number of
Contracts | Position | Expiration
Date | Notional
Amount | Value/
Unrealized
Appreciation
(Depreciation) |
| Interest Rate Futures | | | | | |
| U.S. 2-Year Treasury Note | 197 | Long | 3/31/22 | $ 42,979,860 | $ (3,956) |
| U.S. 5-Year Treasury Note | 82 | Long | 3/31/22 | 9,920,078 | 40,859 |
| U.S. 10-Year Treasury Note | (15) | Short | 3/22/22 | (1,957,031) | (19,246) |
| U.S. Long Treasury Bond | (11) | Short | 3/22/22 | (1,764,813) | (18,583) |
| U.S. Ultra 10-Year Treasury Note | (140) | Short | 3/22/22 | (20,501,250) | (282,608) |
| U.S. Ultra-Long Treasury Bond | (62) | Short | 3/22/22 | (12,221,750) | (282,960) |
| | | | | | $(566,494) |
Restricted Securities
| Description | Acquisition Date | Cost |
| Calvert Impact Capital, Inc., Community Investment Notes, 1.50%, 12/15/23 | 12/14/20 | $500,000 |
| Abbreviations: |
| LIBOR | – London Interbank Offered Rate |
| SOFR | – Secured Overnight Financing Rate |
| Currency Abbreviations: |
| NOK | – Norwegian Krone |
| USD | – United States Dollar |
15
See Notes to Financial Statements.
Calvert
Flexible Bond Fund
December 31, 2021
Statement of Assets and Liabilities
| | December 31, 2021 |
| Assets | |
Investments in securities of unaffiliated issuers, at value (identified cost $253,477,369) - including
$5,293,123 of securities on loan | $ 254,766,547 |
| Investments in securities of affiliated issuers, at value (identified cost $29,700,045) | 29,868,015 |
| Cash | 429,504 |
| Deposits at broker for futures contracts | 900,000 |
| Receivable for capital shares sold | 1,274,036 |
| Dividends and interest receivable | 1,277,756 |
| Dividends and interest receivable - affiliated | 36,115 |
| Securities lending income receivable | 2,020 |
| Receivable from affiliate | 4,560 |
| Trustees' deferred compensation plan | 135,082 |
| Total assets | $288,693,635 |
| Liabilities | |
| Payable for variation margin on open futures contracts | $ 330,335 |
| Payable for investments purchased | 3,237,487 |
| Payable for capital shares redeemed | 242,110 |
| Distributions payable | 15,102 |
| Deposits for securities loaned | 4,683,635 |
| Payable to affiliates: | |
| Investment advisory fee | 79,818 |
| Administrative fee | 27,366 |
| Distribution and service fees | 7,649 |
| Sub-transfer agency fee | 1,801 |
| Trustees' deferred compensation plan | 135,082 |
| Accrued expenses | 80,150 |
| Total liabilities | $ 8,840,535 |
| Net Assets | $279,853,100 |
| Sources of Net Assets | |
| Paid-in capital | $ 278,397,035 |
| Distributable earnings | 1,456,065 |
| Net Assets | $279,853,100 |
| Class A Shares | |
| Net Assets | $ 30,843,985 |
| Shares Outstanding | 2,009,994 |
Net Asset Value and Redemption Price Per Share
(net assets ÷ shares of beneficial interest outstanding) | $ 15.35 |
Maximum Offering Price Per Share
(100 ÷ 96.25 of net asset value per share) | $ 15.95 |
| Class C Shares | |
| Net Assets | $ 1,248,595 |
| Shares Outstanding | 81,318 |
Net Asset Value and Offering Price Per Share*
(net assets ÷ shares of beneficial interest outstanding) | $ 15.35 |
16
See Notes to Financial Statements.
Calvert
Flexible Bond Fund
December 31, 2021
Statement of Assets and Liabilities — continued
| | December 31, 2021 |
| Class I Shares | |
| Net Assets | $200,170,130 |
| Shares Outstanding | 13,079,964 |
Net Asset Value, Offering Price and Redemption Price Per Share
(net assets ÷ shares of beneficial interest outstanding) | $ 15.30 |
| Class R6 Shares | |
| Net Assets | $ 47,590,390 |
| Shares Outstanding | 3,108,953 |
Net Asset Value, Offering Price and Redemption Price Per Share
(net assets ÷ shares of beneficial interest outstanding) | $ 15.31 |
| On sales of $50,000 or more, the offering price of Class A shares is reduced. |
| * | Redemption price per share is equal to the net asset value less any applicable contingent deferred sales charge. |
17
See Notes to Financial Statements.
Calvert
Flexible Bond Fund
December 31, 2021
| | Year Ended |
| | December 31, 2021 |
| Investment Income | |
| Dividend income (net of foreign taxes withheld of $1,773) | $ 456,636 |
| Dividend income - affiliated issuers | 264,743 |
| Interest and other income (net of foreign taxes withheld of $2,138) | 5,925,654 |
| Interest income - affiliated issuers | 101,865 |
| Securities lending income, net | 19,859 |
| Total investment income | $ 6,768,757 |
| Expenses | |
| Investment advisory fee | $ 770,225 |
| Administrative fee | 264,077 |
| Distribution and service fees: | |
| Class A | 66,230 |
| Class C | 12,200 |
| Trustees' fees and expenses | 9,095 |
| Custodian fees | 11,601 |
| Transfer agency fees and expenses | 180,086 |
| Accounting fees | 49,518 |
| Professional fees | 36,383 |
| Registration fees | 83,353 |
| Reports to shareholders | 12,226 |
| Miscellaneous | 34,632 |
| Total expenses | $ 1,529,626 |
| Waiver and/or reimbursement of expenses by affiliate | $ (42,680) |
| Net expenses | $ 1,486,946 |
| Net investment income | $ 5,281,811 |
| Realized and Unrealized Gain (Loss) | |
| Net realized gain (loss): | |
| Investment securities | $ 3,769,746 |
| Investment securities - affiliated issuers | (2,704) |
| Futures contracts | 1,435,460 |
| Foreign currency transactions | 766 |
| Forward foreign currency exchange contracts | (10,233) |
| Net realized gain | $ 5,193,035 |
| Change in unrealized appreciation (depreciation): | |
| Investment securities | $ (2,156,247) |
| Investment securities - affiliated issuers | 131,847 |
| Futures contracts | (698,490) |
| Foreign currency | (3,040) |
| Forward foreign currency exchange contracts | 14,107 |
| Net change in unrealized appreciation (depreciation) | $(2,711,823) |
| Net realized and unrealized gain | $ 2,481,212 |
| Net increase in net assets from operations | $ 7,763,023 |
18
See Notes to Financial Statements.
Calvert
Flexible Bond Fund
December 31, 2021
Statements of Changes in Net Assets
| | Year Ended December 31, |
| | 2021 | 2020 |
| Increase (Decrease) in Net Assets | | |
| From operations: | | |
| Net investment income | $ 5,281,811 | $ 6,032,794 |
| Net realized gain (loss) | 5,193,035 | (827,600) |
| Net change in unrealized appreciation (depreciation) | (2,711,823) | 1,256,268 |
| Net increase in net assets from operations | $ 7,763,023 | $ 6,461,462 |
| Distributions to shareholders: | | |
| Class A | $ (918,389) | $ (630,250) |
| Class C | (31,820) | (23,523) |
| Class I | (5,856,583) | (4,177,831) |
| Class R6 | (1,401,674) | (1,090,151) |
| Total distributions to shareholders | $ (8,208,466) | $ (5,921,755) |
| Tax return of capital to shareholders: | | |
| Class A | $ — | $ (17,904) |
| Class C | — | (668) |
| Class I | — | (118,686) |
| Class R6 | — | (30,970) |
| Total tax return of capital to shareholders | $ — | $ (168,228) |
| Capital share transactions: | | |
| Class A | $ 7,191,354 | $ (3,153,558) |
| Class C | 26,741 | 185,726 |
| Class I | 50,991,323 | 16,731,556 |
| Class R6 | 17,695,205 | (10,848,498) |
| Net increase in net assets from capital share transactions | $ 75,904,623 | $ 2,915,226 |
| Net increase in net assets | $ 75,459,180 | $ 3,286,705 |
| Net Assets | | |
| At beginning of year | $ 204,393,920 | $ 201,107,215 |
| At end of year | $279,853,100 | $204,393,920 |
19
See Notes to Financial Statements.
Calvert
Flexible Bond Fund
December 31, 2021
| | Class A |
| | Year Ended December 31, |
| | 2021 | 2020 | 2019 | 2018 | 2017 |
| Net asset value — Beginning of year | $ 15.31 | $ 15.15 | $ 14.64 | $ 15.07 | $ 15.08 |
| Income (Loss) From Operations | | | | | |
| Net investment income(1) | $ 0.34 | $ 0.40 | $ 0.46 | $ 0.44 | $ 0.37 |
| Net realized and unrealized gain (loss) | 0.21 | 0.16 | 0.52 | (0.42) | 0.11 |
| Total income from operations | $ 0.55 | $ 0.56 | $ 0.98 | $ 0.02 | $ 0.48 |
| Less Distributions | | | | | |
| From net investment income | $ (0.34) | $ (0.39) | $ (0.47) | $ (0.45) | $ (0.37) |
| From net realized gain | (0.17) | — | — | — | (0.12) |
| Tax return of capital | — | (0.01) | — | — | — |
| Total distributions | $ (0.51) | $ (0.40) | $ (0.47) | $ (0.45) | $ (0.49) |
| Net asset value — End of year | $ 15.35 | $ 15.31 | $ 15.15 | $ 14.64 | $ 15.07 |
| Total Return(2) | 3.62% | 3.86% | 6.76% | 0.12% | 3.21% |
| Ratios/Supplemental Data | | | | | |
| Net assets, end of year (000’s omitted) | $30,844 | $23,704 | $26,711 | $24,045 | $15,220 |
| Ratios (as a percentage of average daily net assets):(3) | | | | | |
| Total expenses | 0.92% | 0.93% | 0.96% | 0.93% | 1.09% |
| Net expenses | 0.90% | 0.92% | 0.94% | 0.93% | 1.08% |
| Net investment income | 2.18% | 2.70% | 3.05% | 2.96% | 2.41% |
| Portfolio Turnover | 96% (4) | 104% (4) | 87% | 88% | 111% |
| (1) | Computed using average shares outstanding. |
| (2) | Returns are historical and are calculated by determining the percentage change in net asset value with all distributions reinvested and do not reflect the effect of sales charges, if any. |
| (3) | Total expenses do not reflect amounts reimbursed and/or waived by the adviser and certain of its affiliates, if applicable. Net expenses are net of all reductions and represent the net expenses paid by the Fund. |
| (4) | Includes the effect of To Be Announced (TBA) transactions. |
20
See Notes to Financial Statements.
Calvert
Flexible Bond Fund
December 31, 2021
Financial Highlights — continued
| | Class C |
| | Year Ended December 31, |
| | 2021 | 2020 | 2019 | 2018 | 2017 |
| Net asset value — Beginning of year | $ 15.32 | $ 15.16 | $ 14.65 | $ 15.08 | $ 15.09 |
| Income (Loss) From Operations | | | | | |
| Net investment income(1) | $ 0.22 | $ 0.29 | $ 0.35 | $ 0.33 | $ 0.26 |
| Net realized and unrealized gain (loss) | 0.21 | 0.16 | 0.52 | (0.42) | 0.10 |
| Total income (loss) from operations | $ 0.43 | $ 0.45 | $ 0.87 | $ (0.09) | $ 0.36 |
| Less Distributions | | | | | |
| From net investment income | $ (0.23) | $ (0.28) | $ (0.36) | $ (0.34) | $ (0.25) |
| From net realized gain | (0.17) | — | — | — | (0.12) |
| Tax return of capital | — | (0.01) | — | — | — |
| Total distributions | $ (0.40) | $ (0.29) | $ (0.36) | $ (0.34) | $ (0.37) |
| Net asset value — End of year | $15.35 | $15.32 | $15.16 | $14.65 | $15.08 |
| Total Return(2) | 2.77% | 3.08% | 6.03% | (0.68)% | 2.41% |
| Ratios/Supplemental Data | | | | | |
| Net assets, end of year (000’s omitted) | $ 1,249 | $ 1,223 | $ 1,031 | $ 934 | $ 649 |
| Ratios (as a percentage of average daily net assets):(3) | | | | | |
| Total expenses | 1.67% | 1.68% | 1.71% | 1.68% | 3.42% |
| Net expenses | 1.65% | 1.67% | 1.70% | 1.68% | 1.84% |
| Net investment income | 1.42% | 1.95% | 2.30% | 2.20% | 1.69% |
| Portfolio Turnover | 96% (4) | 104% (4) | 87% | 88% | 111% |
| (1) | Computed using average shares outstanding. |
| (2) | Returns are historical and are calculated by determining the percentage change in net asset value with all distributions reinvested and do not reflect the effect of sales charges, if any. |
| (3) | Total expenses do not reflect amounts reimbursed and/or waived by the adviser and certain of its affiliates, if applicable. Net expenses are net of all reductions and represent the net expenses paid by the Fund. |
| (4) | Includes the effect of To Be Announced (TBA) transactions. |
21
See Notes to Financial Statements.
Calvert
Flexible Bond Fund
December 31, 2021
Financial Highlights — continued
| | Class I |
| | Year Ended December 31, |
| | 2021 | 2020 | 2019 | 2018 | 2017 |
| Net asset value — Beginning of year | $ 15.27 | $ 15.11 | $ 14.60 | $ 15.02 | $ 15.04 |
| Income (Loss) From Operations | | | | | |
| Net investment income(1) | $ 0.38 | $ 0.43 | $ 0.50 | $ 0.48 | $ 0.43 |
| Net realized and unrealized gain (loss) | 0.20 | 0.17 | 0.52 | (0.41) | 0.10 |
| Total income from operations | $ 0.58 | $ 0.60 | $ 1.02 | $ 0.07 | $ 0.53 |
| Less Distributions | | | | | |
| From net investment income | $ (0.38) | $ (0.43) | $ (0.51) | $ (0.49) | $ (0.43) |
| From net realized gain | (0.17) | — | — | — | (0.12) |
| Tax return of capital | — | (0.01) | — | — | — |
| Total distributions | $ (0.55) | $ (0.44) | $ (0.51) | $ (0.49) | $ (0.55) |
| Net asset value — End of year | $ 15.30 | $ 15.27 | $ 15.11 | $ 14.60 | $ 15.02 |
| Total Return(2) | 3.81% | 4.12% | 7.06% | 0.43% | 3.59% |
| Ratios/Supplemental Data | | | | | |
| Net assets, end of year (000’s omitted) | $200,170 | $149,364 | $132,062 | $119,207 | $93,868 |
| Ratios (as a percentage of average daily net assets):(3) | | | | | |
| Total expenses | 0.67% | 0.68% | 0.71% | 0.68% | 0.70% |
| Net expenses | 0.65% | 0.67% | 0.67% | 0.65% | 0.65% |
| Net investment income | 2.42% | 2.95% | 3.32% | 3.22% | 2.82% |
| Portfolio Turnover | 96% (4) | 104% (4) | 87% | 88% | 111% |
| (1) | Computed using average shares outstanding. |
| (2) | Returns are historical and are calculated by determining the percentage change in net asset value with all distributions reinvested and do not reflect the effect of sales charges, if any. |
| (3) | Total expenses do not reflect amounts reimbursed and/or waived by the adviser and certain of its affiliates, if applicable. Net expenses are net of all reductions and represent the net expenses paid by the Fund. |
| (4) | Includes the effect of To Be Announced (TBA) transactions. |
22
See Notes to Financial Statements.
Calvert
Flexible Bond Fund
December 31, 2021
Financial Highlights — continued
| | Class R6 |
| | Year Ended December 31, | Period Ended
December 31, |
| | 2021 | 2020 | 2019 (1) |
| Net asset value — Beginning of period | $ 15.27 | $ 15.11 | $ 15.00 |
| Income (Loss) From Operations | | | |
| Net investment income | $ 0.39(2) | $ 0.44(2) | $ 0.33 |
| Net realized and unrealized gain | 0.21 | 0.17 | 0.11 |
| Total income from operations | $ 0.60 | $ 0.61 | $ 0.44 |
| Less Distributions | | | |
| From net investment income | $ (0.39) | $ (0.44) | $ (0.33) |
| From net realized gain | (0.17) | — | — |
| From return of capital | — | (0.01) | — |
| Total distributions | $ (0.56) | $ (0.45) | $ (0.33) |
| Net asset value — End of period | $ 15.31 | $ 15.27 | $ 15.11 |
| Total Return(3) | 3.96% | 4.20% | 2.97% (4) |
| Ratios/Supplemental Data | | | |
| Net assets, end of period (000’s omitted) | $47,590 | $30,102 | $41,304 |
| Ratios (as a percentage of average daily net assets):(5) | | | |
| Total expenses | 0.59% | 0.60% | 0.61% (6) |
| Net expenses | 0.57% | 0.59% | 0.61% (6) |
| Net investment income | 2.49% | 3.05% | 3.27% (6) |
| Portfolio Turnover | 96% (7) | 104% (7) | 87% (8) |
| (1) | For the period from the commencement of operations, May 1, 2019, to December 31, 2019. |
| (2) | Computed using average shares outstanding. |
| (3) | Returns are historical and are calculated by determining the percentage change in net asset value with all distributions reinvested and do not reflect the effect of sales charges, if any. |
| (4) | Not annualized. |
| (5) | Total expenses do not reflect amounts reimbursed and/or waived by the adviser and certain of its affiliates, if applicable. Net expenses are net of all reductions and represent the net expenses paid by the Fund. |
| (6) | Annualized. |
| (7) | Includes the effect of To Be Announced (TBA) transactions. |
| (8) | For the year ended December 31, 2019. |
23
See Notes to Financial Statements.
Calvert
Flexible Bond Fund
December 31, 2021
Notes to Financial Statements
1 Significant Accounting Policies
Calvert Flexible Bond Fund (the Fund) is a diversified series of Calvert Management Series (the Trust). The Trust is a Massachusetts business trust registered under the Investment Company Act of 1940, as amended (the 1940 Act), as an open-end management investment company. The investment objective of the Fund is to seek positive absolute returns over a full market cycle, regardless of market conditions. The Fund invests primarily in bonds and/or instruments that provide exposure to bonds, including debt securities of any maturity.
The Fund offers four classes of shares. Class A shares are generally sold subject to a sales charge imposed at time of purchase. A contingent deferred sales charge of 0.80% may apply to certain redemptions of Class A shares for accounts for which no sales charge was paid, if redeemed within 12 months of purchase. Class C shares are sold without a front-end sales charge, and with certain exceptions, are charged a contingent deferred sales charge of 1% on shares redeemed within 12 months of purchase. Class C shares are only available for purchase through a financial intermediary. Effective January 25, 2019, Class C shares generally automatically convert to Class A shares ten years after their purchase and, effective November 5, 2020, automatically convert to Class A shares eight years after their purchase as described in the Fund's prospectus. Class I and Class R6 shares are sold at net asset value, are not subject to a sales charge and are sold only to certain eligible investors. Each class represents a pro rata interest in the Fund, but votes separately on class-specific matters and is subject to different expenses.
The Fund applies the accounting and reporting guidance in the Financial Accounting Standards Board (FASB) Accounting Standards Codification Topic 946, Financial Services – Investment Companies (ASC 946). Subsequent events, if any, through the date that the financial statements were issued have been evaluated in the preparation of the financial statements.
A Investment Valuation— Net asset value per share is determined every business day as of the close of the regular session of the New York Stock Exchange (generally 4:00 p.m. Eastern time). The Fund uses independent pricing services approved by the Board of Trustees (the Board) to value its investments wherever possible. Investments for which market quotations are not available or deemed not reliable are fair valued in good faith under the direction of the Board.
U.S. generally accepted accounting principles (U.S. GAAP) establishes a disclosure hierarchy that categorizes the inputs to valuation techniques used to value assets and liabilities at measurement date. These inputs are summarized in the three broad levels listed below:
Level 1 - quoted prices in active markets for identical securities
Level 2 - other significant observable inputs (including quoted prices for similar securities, interest rates, prepayment speeds, credit risk, etc.)
Level 3 - significant unobservable inputs (including the Fund’s own assumptions in determining the fair value of investments)
The inputs or methodologies used for valuing securities are not necessarily an indication of the risk associated with investing in those securities.
Valuation techniques used to value the Fund’s investments by major category are as follows:
Debt Securities. Debt securities are generally valued based on valuations provided by third party pricing services, as derived from such services’ pricing models. Inputs to the models may include, but are not limited to, reported trades, executable bid and ask prices, broker/dealer quotations, prices or yields of securities with similar characteristics, interest rates, anticipated prepayments, benchmark curves or information pertaining to the issuer, as well as industry and economic events. Accordingly, debt securities are generally categorized as Level 2 in the hierarchy. Short-term debt securities with a remaining maturity at time of purchase of more than sixty days are valued based on valuations provided by a third party pricing service. Such securities are generally categorized as Level 2 in the hierarchy. Short-term debt securities of sufficient credit quality purchased with remaining maturities of sixty days or less for which a valuation from a third party pricing service is not readily available may be valued at amortized cost, which approximates fair value, and are categorized as Level 2 in the hierarchy.
Senior Floating-Rate Loans. Interests in senior floating-rate loans for which reliable market quotations are readily available are valued generally at the average mean of bid and ask quotations obtained from a third party pricing service, and are categorized as Level 2 in the hierarchy.
Equity Securities. Equity securities (including warrants and rights) listed on a U.S. securities exchange generally are valued at the last sale or closing price as reported by an independent pricing service on the primary market or exchange on which they are traded and are categorized as Level 1 in the hierarchy. Equity securities listed on the NASDAQ National Market System are valued at the NASDAQ official closing price and are categorized as Level 1 in the hierarchy. Unlisted or listed securities for which closing sales prices or closing quotations are not available are valued at the mean between the latest available bid and ask prices and are categorized as Level 2 in the hierarchy.
Other Securities. Investments in registered investment companies (including money market funds) that do not trade on an exchange are valued at the net asset value per share on the valuation day and are categorized as Level 1 in the hierarchy.
Affiliated Fund. The Fund may invest in Calvert Cash Reserves Fund, LLC (Cash Reserves Fund), an affiliated investment company managed by Calvert Research and Management (CRM). While Cash Reserves Fund is not a registered money market mutual fund, it conducts all of its investment activities in accordance with the requirements of Rule 2a-7 under the 1940 Act. Investments in Cash Reserves Fund are valued at the closing net asset value per unit on the valuation day and are categorized as Level 2 in the hierarchy. Cash Reserves Fund generally values its investment securities based on available market quotations provided by a third party pricing service.
Calvert
Flexible Bond Fund
December 31, 2021
Notes to Financial Statements — continued
Derivatives. Futures contracts are valued at unrealized appreciation (depreciation) based on the settlement price established each day by the board of trade or exchange on which they are traded and are categorized as Level 1 in the hierarchy. Forward foreign currency exchange contracts are generally valued at the mean of the average bid and average ask prices that are reported by currency dealers to a third party pricing service at the valuation time. Such third party pricing service valuations are supplied for specific settlement periods and the Fund's forward foreign currency exchange contracts are valued at an interpolated rate between the closest preceding and subsequent settlement period reported by the third party pricing service and are categorized as Level 2 in the hierarchy. U.S. exchange-traded options are valued at the mean between the bid and ask prices at valuation time as reported by the Options Price Reporting Authority and are categorized as Level 1 in the hierarchy.
Fair Valuation. If a market value cannot be determined for a security using the methodologies described above, or if, in the good faith opinion of the Fund's adviser, the market value does not constitute a readily available market quotation, or if a significant event has occurred that would materially affect the value of the security, the security will be fair valued as determined in good faith by or at the direction of the Board in a manner that most fairly reflects the security’s “fair value”, which is the amount that the Fund might reasonably expect to receive for the security upon its current sale in the ordinary course. Each such determination is based on a consideration of relevant factors, which are likely to vary from one pricing context to another. These factors may include, but are not limited to, the type of security, the existence of any contractual restrictions on the security’s disposition, the price and extent of public trading in similar securities of the issuer or of comparable companies or entities, quotations or relevant information obtained from broker/dealers or other market participants, information obtained from the issuer, analysts, and/or the appropriate stock exchange (for exchange-traded securities), an analysis of the company’s or entity’s financial statements, and an evaluation of the forces that influence the issuer and the market(s) in which the security is purchased and sold.
The values assigned to fair value investments are based on available information and do not necessarily represent amounts that might ultimately be realized. Further, due to the inherent uncertainty of valuations of such investments, the fair values may differ significantly from the values that would have been used had an active market existed, and the differences could be material.
The following table summarizes the market value of the Fund's holdings as of December 31, 2021, based on the inputs used to value them:
| Asset Description | Level 1 | Level 2 | Level 3 | Total |
| Asset-Backed Securities | $ — | $ 58,085,273 | $ — | $ 58,085,273 |
| Collateralized Mortgage Obligations | — | 33,492,595 | — | 33,492,595 |
| Commercial Mortgage-Backed Securities | — | 28,471,421 | — | 28,471,421 |
| Common Stocks | 415,680 (1) | — | — | 415,680 |
| Convertible Bonds | — | 1,971,113 | — | 1,971,113 |
| Corporate Bonds | — | 85,476,778 | — | 85,476,778 |
| High Social Impact Investments | — | 489,530 | — | 489,530 |
| Mutual Funds | 8,680,782 | — | — | 8,680,782 |
| Preferred Stocks | 4,512,059 | — | — | 4,512,059 |
| Senior Floating-Rate Loans | — | 12,180,255 | — | 12,180,255 |
| Sovereign Government Bonds | — | 684,841 | — | 684,841 |
| U.S. Treasury Obligations | — | 30,945,114 | — | 30,945,114 |
| Short-Term Investments: | | | | |
| Affiliated Fund | — | 14,462,361 | — | 14,462,361 |
| Securities Lending Collateral | 4,683,635 | — | — | 4,683,635 |
| Purchased Put Options | 83,125 | — | — | 83,125 |
| Total Investments | $18,375,281 | $266,259,281 | $ — | $284,634,562 |
| Futures Contracts | $ 40,859 | $ — | $ — | $ 40,859 |
| Total | $18,416,140 | $266,259,281 | $ — | $284,675,421 |
| Liability Description | | | | |
| Futures Contracts | $ (607,353) | $ — | $ — | $ (607,353) |
| Total | $ (607,353) | $ — | $ — | $ (607,353) |
| (1) | The level classification by major category of investments is the same as the category presentation in the Schedule of Investments. |
Calvert
Flexible Bond Fund
December 31, 2021
Notes to Financial Statements — continued
B Investment Transactions and Income— Investment transactions for financial statement purposes are accounted for on trade date. Realized gains and losses are recorded on an identified cost basis and may include proceeds from litigation. Dividend income is recorded on the ex-dividend date for dividends received in cash and/or securities. Distributions received that represent a return of capital are recorded as a reduction of cost of investments. Distributions received that represent a capital gain are recorded as a realized gain. Interest income, which includes amortization of premium and accretion of discount on debt securities, is accrued as earned. The Fund may earn certain fees in connection with its investments in senior floating-rate loans. These fees are in addition to interest payments earned and may include amendment fees, consent fees and prepayment fees, which are recorded to income as earned.
Inflation adjustments to the principal amount of inflation-adjusted bonds and notes are reflected as interest income. Deflation adjustments to the principal amount of an inflation-adjusted bond or note are reflected as reductions to interest income to the extent of interest income previously recorded on such bond or note.
C Share Class Accounting— Realized and unrealized gains and losses are allocated daily to each class of shares based upon the relative net assets of each class to the total net assets of the Fund. Net investment income, other than class-specific expenses, is allocated daily to each class of shares based upon the ratio of the value of each class’s paid shares to the total value of all paid shares. Expenses arising in connection with a specific class are charged directly to that class. Sub-accounting, recordkeeping and similar administrative fees payable to financial intermediaries, which are a component of transfer agency fees and expenses on the Statement of Operations, are not allocated to Class R6 shares.
D Foreign Currency Transactions— The Fund’s accounting records are maintained in U.S. dollars. For valuation of assets and liabilities on each date of net asset value determination, foreign denominations are converted into U.S. dollars using the current exchange rate. Security transactions, income and expenses are translated at the prevailing rate of exchange on the date of the event. Recognized gains or losses on investment transactions attributable to changes in foreign currency exchange rates are recorded for financial statement purposes as net realized gains and losses on investments. That portion of unrealized gains and losses on investments that results from fluctuations in foreign currency exchange rates is not separately disclosed.
E Senior Floating-Rate Loans— The Fund may invest in direct debt instruments, which are interests in amounts owed to lenders or lending syndicates by corporate, governmental, or other borrowers. The Fund’s investment in loans may be in the form of participations in loans or assignments of all or a portion of loans from third parties. A loan is often administered by a bank or other financial institution (the lender) that acts as agent for all holders. The agent administers the terms of the loan, as specified in the loan agreement. The Fund may invest in multiple series or tranches of a loan, which may have varying terms and carry different associated risks. When the Fund purchases assignments from lenders, it acquires direct rights against the borrower of the loan. When investing in a loan participation, the Fund has the right to receive payments of principal, interest and any fees to which it is entitled only from the lender selling the loan agreement and only upon receipt of such payments by the lender from the borrower. The Fund generally has no right to enforce compliance by the borrower with the terms of the loan agreement. As a result, the Fund may be subject to the credit risk of both the borrower and the lender that is issuing the participation interest.
F Futures Contracts— The Fund may enter into futures contracts to buy or sell a financial instrument for a set price at a future date. Initial margin deposits of either cash or securities as required by the broker are made upon entering into the contract. While the contract is open, daily variation margin payments are made to or received from the broker reflecting the daily change in market value of the contract and are recorded for financial reporting purposes as unrealized gains or losses by the Fund. When a futures contract is closed, a realized gain or loss is recorded equal to the difference between the opening and closing value of the contract. The risks associated with entering into futures contracts may include the possible illiquidity of the secondary market which would limit the Fund’s ability to close out a futures contract prior to the settlement date, an imperfect correlation between the value of the contracts and the underlying financial instruments, or that the counterparty will fail to perform its obligations under the contracts’ terms. Futures contracts are designed by boards of trade, which are designated “contracts markets” by the Commodities Futures Trading Commission. Futures contracts trade on the contracts markets in a manner that is similar to the way a stock trades on a stock exchange, and the boards of trade, through their clearing corporations, guarantee the futures contracts against default. As a result, there is minimal counterparty credit risk to the Fund.
G Forward Foreign Currency Exchange Contracts— The Fund may enter into forward foreign currency exchange contracts for the purchase or sale of a specific foreign currency at a fixed price on a future date. The forward foreign currency exchange contracts are adjusted by the daily exchange rate of the underlying currency and any gains or losses are recorded as unrealized until such time as the contracts have been closed. Risks may arise upon entering these contracts from the potential inability of counterparties to meet the terms of their contracts and from movements in the value of a foreign currency relative to the U.S. dollar.
H Options Contracts— Upon the purchase of a call or put option, the premium paid by the Fund is included in the Statement of Assets and Liabilities as an investment. The amount of the investment is subsequently marked-to-market to reflect the current market value of the option purchased, in accordance with the Fund’s policies on investment valuations discussed above. Premiums paid for purchasing options that expire are treated as realized losses. Premiums paid for purchasing options that are exercised or closed are added to the amounts paid or offset against the proceeds on the underlying investment transaction to determine the realized gain or loss. As the purchaser of an index option, the Fund has the right to receive a cash payment equal to any depreciation in the value of the index below the exercise price of the option (in the case of a put) or equal to any appreciation in the value of the index over the exercise price of the option (in the case of a call) as of the valuation date of the option. The risk associated with purchasing options is limited to the premium originally paid. Purchased options traded over-the-counter involve risk that the issuer or counterparty will fail to perform its contractual obligations.
Calvert
Flexible Bond Fund
December 31, 2021
Notes to Financial Statements — continued
I Restricted Securities— The Fund may invest in securities that are subject to legal or contractual restrictions on resale. Generally, these securities may only be sold publicly upon registration under the Securities Act of 1933 or in transactions exempt from such registration. Information regarding restricted securities (excluding Rule 144A securities) is included at the end of the Schedule of Investments.
J Distributions to Shareholders— Distributions to shareholders are recorded by the Fund on ex-dividend date. The Fund declares income distributions daily to shareholders of record at the time of declaration and generally pays them monthly. The Fund makes distributions of net realized capital gains, if any, at least annually. Distributions are declared separately for each class of shares. Distributions are determined in accordance with income tax regulations, which may differ from U.S. GAAP; accordingly, periodic reclassifications are made within the Fund’s capital accounts to reflect income and gains available for distribution under income tax regulations.
K Estimates— The preparation of financial statements in conformity with U.S. GAAP requires management to make estimates and assumptions that affect the reported amounts of assets and liabilities and disclosure of contingent assets and liabilities at the date of the financial statements and the reported amounts of increases and decreases in net assets from operations during the reporting period. Actual results could differ from those estimates.
L Indemnifications— Under the Trust’s organizational document, its officers and Trustees may be indemnified against certain liabilities and expenses arising out of the performance of their duties to the Fund. Under Massachusetts law, if certain conditions prevail, shareholders of a Massachusetts business trust (such as the Trust) could be deemed to have personal liability for the obligations of the Trust. However, the Trust’s Declaration of Trust contains an express disclaimer of liability on the part of Fund shareholders and provides that the Trust shall assume, upon request by the shareholder, the defense on behalf of any Fund shareholders or former shareholders. Additionally, in the normal course of business, the Fund enters into agreements with service providers that may contain indemnification clauses. The Fund’s maximum exposure under these arrangements is unknown as this would involve future claims that may be made against the Fund that have not yet occurred.
M Federal Income Taxes— No provision for federal income or excise tax is required since the Fund intends to continue to qualify as a regulated investment company under the Internal Revenue Code and to distribute substantially all of its taxable earnings.
Management has analyzed the Fund's tax positions taken for all open federal income tax years and has concluded that no provision for federal income tax is required in the Fund's financial statements. A Fund's federal tax return is subject to examination by the Internal Revenue Service for a period of three years from the date of filing.
N When-Issued Securities and Delayed Delivery Transactions— The Fund may purchase securities on a delayed delivery, when-issued or forward commitment basis, including TBA (To Be Announced) securities. Payment and delivery may take place after the customary settlement period for that security. At the time the transaction is negotiated, the price of the security that will be delivered is fixed. The Fund maintains cash and/or security positions for these commitments such that sufficient liquid assets will be available to make payments upon settlement. Securities purchased on a delayed delivery, when-issued or forward commitment basis are marked-to-market daily and begin earning interest on settlement date. Such security purchases are subject to the risk that when delivered they will be worth less than the agreed upon payment price. Losses may also arise if the counterparty does not perform under the contract. A forward purchase commitment may be closed by entering into an offsetting commitment. If an offsetting commitment is entered into, the Fund will realize a gain or loss on investments based on the price established when the Fund entered into the commitment.
2 Related Party Transactions
The investment advisory fee is earned by CRM as compensation for investment advisory services rendered to the Fund. On March 1, 2021, Morgan Stanley acquired Eaton Vance Corp. (the “Transaction”) and CRM became an indirect, wholly-owned subsidiary of Morgan Stanley. In connection with the Transaction, the Fund entered into a new investment advisory agreement (the “New Agreement”) with CRM, which took effect on March 1, 2021. Pursuant to the New Agreement (and the Fund’s investment advisory agreement with CRM in effect prior to March 1, 2021), the fee is computed at the annual rate of 0.35% of the Fund’s average daily net assets and is payable monthly. For the year ended December 31, 2021, the investment advisory fee amounted to $770,225. The Fund may invest its cash in Cash Reserves Fund. CRM does not currently receive a fee for advisory services provided to Cash Reserves Fund.
CRM has agreed to reimburse the Fund’s expenses to the extent that total annual operating expenses (relating to ordinary operating expenses only and excluding expenses such as brokerage commissions, acquired fund fees and expenses of unaffiliated funds, borrowing costs, taxes or litigation expenses) exceed 0.93%, 1.68%, 0.68% and 0.65% for Class A, Class C, Class I and Class R6, respectively, of such class’s average daily net assets. The expense reimbursement agreement with CRM may be changed or terminated after April 30, 2022. CRM has also agreed to waive its investment advisory fee on the portion of Fund assets allocated to an affiliated fund. For the year ended December 31, 2021, CRM waived or reimbursed expenses of $42,680.
The administrative fee is earned by CRM as compensation for administrative services rendered to the Fund. The fee is computed at an annual rate of 0.12% of the Fund’s average daily net assets attributable to Class A, Class C, Class I and Class R6 and is payable monthly. For the year ended December 31, 2021, CRM was paid administrative fees of $264,077.
Calvert
Flexible Bond Fund
December 31, 2021
Notes to Financial Statements — continued
The Fund has in effect a distribution plan for Class A shares (Class A Plan) pursuant to Rule 12b-1 under the 1940 Act. Pursuant to the Class A Plan, the Fund pays Eaton Vance Distributors, Inc. (EVD), an affiliate of CRM and the Fund’s principal underwriter, a distribution and service fee of 0.25% per annum of its average daily net assets attributable to Class A shares for distribution services and facilities provided to the Fund by EVD, as well as for personal services and/or the maintenance of shareholder accounts. The Fund also has in effect a distribution plan for Class C shares (Class C Plan) pursuant to Rule 12b-1 under the 1940 Act. Pursuant to the Class C Plan, the Fund pays EVD amounts equal to 0.75% per annum of its average daily net assets attributable to Class C shares for providing ongoing distribution services and facilities to the Fund. In addition, pursuant to the Class C Plan, the Fund also makes payments of service fees to EVD, financial intermediaries and other persons in amounts equal to 0.25% per annum of its average daily net assets attributable to that class. Service fees paid or accrued are for personal services and/or the maintenance of shareholder accounts. Distribution and service fees paid or accrued for the year ended December 31, 2021 amounted to $66,230 and $12,200 for Class A shares and Class C shares, respectively.
The Fund was informed that EVD received $7,449 as its portion of the sales charge on sales of Class A shares for the year ended December 31, 2021. The Fund was also informed that EVD received $2,310 and $212 of contingent deferred sales charges paid by Class A and Class C shareholders, respectively, for the same period.
Eaton Vance Management (EVM), an affiliate of CRM, provides sub-transfer agency and related services to the Fund pursuant to a Sub-Transfer Agency Support Services Agreement. For the year ended December 31, 2021, sub-transfer agency fees and expenses incurred to EVM amounted to $10,506 and are included in transfer agency fees and expenses on the Statement of Operations.
Each Trustee of the Fund who is not an employee of CRM or its affiliates receives an annual fee of $154,000 ($214,000 effective January 1, 2022), plus an annual Committee fee ranging from $8,500 to $16,500 depending on the Committee. The Board chair receives an additional $30,000 annual fee, Committee chairs receive an additional $6,000 annual fee and the special equities liaison receives an additional $2,500 annual fee. Eligible Trustees may participate in a Deferred Compensation Plan (the Plan). Amounts deferred under the Plan are treated as though equal dollar amounts had been invested in shares of the Fund or other Calvert funds selected by the Trustees. The Fund purchases shares of the funds selected equal to the dollar amounts deferred under the Plan, resulting in an asset equal to the deferred compensation liability. Obligations of the Plan are paid solely from the Fund's assets. Trustees’ fees are allocated to each of the Calvert funds served. Salaries and fees of officers and Trustees of the Fund who are employees of CRM or its affiliates are paid by CRM.
3 Investment Activity
During the year ended December 31, 2021, the cost of purchases and proceeds from sales of investments, other than U.S. government and agency securities and short-term securities and including paydowns and principal repayments on senior floating-rate loans, were $163,059,968 and $101,080,426, respectively. Purchases and sales of U.S. government and agency securities, including paydowns and TBA transactions, were $91,224,262 and $84,053,152, respectively.
4 Distributions to Shareholders and Income Tax Information
The tax character of distributions declared for the years ended December 31, 2021 and December 31, 2020 was as follows:
| | Year Ended December 31, |
| | 2021 | 2020 |
| Ordinary income | $6,674,301 | $5,921,755 |
| Long-term capital gains | $1,534,165 | $ — |
| Tax return of capital | $ — | $ 168,228 |
During the year ended December 31, 2021, distributable earnings was decreased by $323,660 and paid-in capital was increased by $323,660 due to the Fund's use of equalization accounting. Tax equalization accounting allows the Fund to treat as a distribution that portion of redemption proceeds representing a redeeming shareholder’s portion of undistributed taxable income and net capital gains. These reclassifications had no effect on the net assets or net asset value per share of the Fund.
As of December 31, 2021, the components of distributable earnings (accumulated loss) on a tax basis were as follows:
Calvert
Flexible Bond Fund
December 31, 2021
Notes to Financial Statements — continued
| Undistributed ordinary income | $ 3,680 |
| Undistributed long-term capital gains | 162,342 |
| Net unrealized appreciation | 1,305,145 |
| Distributions payable | (15,102) |
| Distributable earnings | $1,456,065 |
The cost and unrealized appreciation (depreciation) of investments, including open derivative contracts, of the Fund at December 31, 2021, as determined on a federal income tax basis, were as follows:
| Aggregate cost | $283,246,259 |
| Gross unrealized appreciation | $ 3,157,054 |
| Gross unrealized depreciation | (1,851,876) |
| Net unrealized appreciation | $ 1,305,178 |
5 Financial Instruments
The Fund may trade in financial instruments with off-balance sheet risk in the normal course of its investing activities. These financial instruments may include forward foreign currency exchange contracts and futures contracts and may involve, to a varying degree, elements of risk in excess of the amounts recognized for financial statement purposes. The notional or contractual amounts of these instruments represent the investment the Fund has in particular classes of financial instruments and do not necessarily represent the amounts potentially subject to risk. The measurement of the risks associated with these instruments is meaningful only when all related and offsetting transactions are considered. A summary of obligations under these financial instruments at December 31, 2021 is included in the Schedule of Investments. At December 31, 2021, the Fund had sufficient cash and/or securities to cover commitments under these contracts.
In the normal course of pursuing its investment objective, the Fund is subject to the following risks:
Foreign Exchange Risk: During the year ended December 31, 2021, the Fund entered into forward foreign currency exchange contracts to seek to hedge against fluctuations in currency exchange rates.
Interest Rate Risk: During the year ended December 31, 2021, the Fund used futures contracts and options thereon to hedge interest rate risk and to manage duration.
The Fund enters into forward foreign currency exchange contracts that may contain provisions whereby the counterparty may terminate the contract under certain conditions, including but not limited to a decline in the Fund’s net assets below a certain level over a certain period of time, which would trigger a payment by the Fund for those derivatives in a liability position. At December 31, 2021, the Fund had no open derivatives with credit-related contingent features in a net liability position.
The over-the-counter (OTC) derivatives in which the Fund invests are subject to the risk that the counterparty to the contract fails to perform its obligations under the contract. To mitigate this risk, the Fund has entered into an International Swaps and Derivatives Association, Inc. Master Agreement (“ISDA Master Agreement”) with its derivative counterparty. The ISDA Master Agreement is a bilateral agreement between the Fund and the counterparty that governs certain OTC derivatives and typically contains, among other things, set-off provisions in the event of a default and/or termination event as defined under the ISDA Master Agreement. Under the ISDA Master Agreement, the Fund may, under certain circumstances, offset with the counterparty certain derivative financial instruments’ payables and/or receivables with collateral held and/or posted and create one single net payment. The provisions of the ISDA Master Agreement typically permit a single net payment in the event of default including the bankruptcy or insolvency of the counterparty. However, bankruptcy or insolvency laws of a particular jurisdiction may impose restrictions on or prohibitions against the right of offset in bankruptcy or insolvency. The ISDA Master Agreement allows the counterparty to OTC derivatives to terminate derivative contracts prior to maturity in the event the Fund’s net assets decline by a stated percentage or the Fund fails to meet the terms of its ISDA Master Agreement, which would cause the counterparty to accelerate payment by the Fund of any net liability owed to it.
The collateral requirements for derivatives traded under the ISDA Master Agreement are governed by a Credit Support Annex to the ISDA Master Agreement. Collateral requirements are determined at the close of business each day and are typically based on changes in market values for each transaction under the ISDA Master Agreement and netted into one amount for such agreement. Generally, the amount of collateral due from or to a counterparty is subject to a minimum transfer threshold amount before a transfer is required. Collateral pledged for the benefit of the Fund and/or counterparty is held in segregated accounts by the Fund’s custodian and cannot be sold, re-pledged, assigned or otherwise used while pledged. The portion
Calvert
Flexible Bond Fund
December 31, 2021
Notes to Financial Statements — continued
of such collateral representing cash, if any, is reflected as deposits for derivatives collateral and, in the case of cash pledged by a counterparty for the benefit of the Fund, a corresponding liability on the Statement of Assets and Liabilities. Securities pledged by the Fund as collateral, if any, are identified as such in the Schedule of Investments.
At December 31, 2021, the fair value of open derivative instruments (not considered to be hedging instruments for accounting disclosure purposes) and whose primary underlying risk exposure is interest rate risk was as follows:
| Derivative | Statement of Assets and Liabilities Caption | Assets | Liabilities |
| Futures contracts | Distributable earnings | | $ 40,859(1) | $ (607,353)(1) |
| Purchased options | Investments in securities of unaffiliated issuers, at value | | 83,125 | — |
| Total | | | $123,984 | $(607,353) |
| (1) | Only the current day's variation margin is reported within the Statement of Assets and Liabilities as Receivable or Payable for variation margin on open futures contracts, as applicable. |
The effect of derivative instruments (not considered to be hedging instruments for accounting disclosure purposes) on the Statement of Operations by risk exposure for the year ended December 31, 2021 was as follows:
| Statement of Operations Caption | Foreign exchange | Interest rate | Total |
| Net realized gain (loss): | | | |
| Investment securities(1) | $ — | $ 86,233 | $ 86,233 |
| Forward foreign currency exchange contracts | (10,233) | — | (10,233) |
| Futures contracts | — | 1,435,460 | 1,435,460 |
| Total | $(10,233) | $1,521,693 | $1,511,460 |
| Change in unrealized appreciation (depreciation): | | | |
| Investment securities(1) | $ — | $ (18,707) | $ (18,707) |
| Forward foreign currency exchange contracts | 14,107 | — | 14,107 |
| Futures contracts | — | (698,490) | (698,490) |
| Total | $ 14,107 | $ (717,197) | $ (703,090) |
| (1) | Relates to purchased options. |
The average notional cost of futures contracts and average notional amounts of other derivative contracts outstanding during the year ended December 31, 2021, which are indicative of the volume of these derivative types, were approximately as follows:
Futures
Contracts — Long | Futures
Contracts — Short | Forward
Foreign Currency
Exchange Contracts* |
| $7,999,000 | $35,432,000 | $235,000 |
| * | The average notional amount for forward foreign currency exchange contracts is based on the absolute value of notional amounts of currency purchased and currency sold. |
The average number of purchased options contracts outstanding during the year ended December 31, 2021, which is indicative of the volume of this derivative type, was approximately 61 contracts.
Calvert
Flexible Bond Fund
December 31, 2021
Notes to Financial Statements — continued
6 Securities Lending
To generate additional income, the Fund may lend its securities pursuant to a securities lending agency agreement with State Street Bank and Trust Company (SSBT), the securities lending agent. Security loans are subject to termination by the Fund at any time and, therefore, are not considered illiquid investments. The Fund requires that the loan be continuously collateralized by either cash or securities in an amount at least equal to the market value of the securities on loan. The market value of securities loaned is determined daily and any additional required collateral is delivered to the Fund on the next business day. Cash collateral is generally invested in a money market fund registered under the 1940 Act that is managed by an affiliate of SSBT. Any gain or loss in the market price of the loaned securities that might occur and any interest earned or dividends declared during the term of the loan would accrue to the account of the Fund. Income earned on the investment of collateral, net of broker rebates and other expenses incurred by the securities lending agent, is split between the Fund and the securities lending agent based on agreed upon contractual terms. Non-cash collateral, if any, is held by the lending agent on behalf of the Fund and cannot be sold or re-pledged by the Fund; accordingly, such collateral is not reflected in the Statement of Assets and Liabilities.
The risks associated with lending portfolio securities include, but are not limited to, possible delays in receiving additional collateral or in the recovery of the loaned securities, possible loss of rights to the collateral should the borrower fail financially, as well as risk of loss in the value of the collateral or the value of the investments made with the collateral. The securities lending agent shall indemnify the Fund in the case of default of any securities borrower.
At December 31, 2021, the total value of securities on loan, including accrued interest, was $5,367,999 and the total value of collateral received was $5,460,418, comprised of cash of $4,683,635 and U.S. government and/or agencies securities of $776,783.
The following table provides a breakdown of securities lending transactions accounted for as secured borrowings, the obligations by class of collateral pledged, and the remaining contractual maturity of those transactions as of December 31, 2021.
| | Remaining Contractual Maturity of the Transactions |
| | Overnight and
Continuous | <30 days | 30 to 90 days | >90 days | Total |
| Corporate Bonds | $4,683,635 | $ — | $ — | $ — | $4,683,635 |
The carrying amount of the liability for deposits for securities loaned at December 31, 2021 approximated its fair value. If measured at fair value, such liability would have been considered as Level 2 in the fair value hierarchy (see Note 1A) at December 31, 2021.
7 Line of Credit
The Fund participates with other portfolios and funds managed by EVM and its affiliates, including CRM, in an $800 million unsecured line of credit with a group of banks, which is in effect through October 25, 2022. Borrowings are made by the Fund solely for temporary purposes related to redemptions and other short-term cash needs. Interest is charged to the Fund based on its borrowings at an amount above either the Secured Overnight Financing Rate (SOFR) or Federal Funds rate. In addition, a fee computed at an annual rate of 0.15% on the daily unused portion of the line of credit is allocated among the participating portfolios and funds at the end of each quarter. In connection with the renewal of the agreement in October 2021, an arrangement fee of $150,000 was incurred that was allocated to the participating portfolios and funds. Because the line of credit is not available exclusively to the Fund, it may be unable to borrow some or all of its requested amounts at any particular time.
The Fund had no borrowings pursuant to its line of credit during the year ended December 31, 2021.
8 Affiliated Issuers and Funds
The Fund has invested a portion of its assets in notes (the Notes) issued by Calvert Impact Capital, Inc. (CIC) pursuant to exemptive relief granted by the U.S. Securities and Exchange Commission (the SEC). There are certain potential points of affiliation between the Fund and CIC. CRM has licensed use of the Calvert name to CIC and provides other types of support. CRM’s President and Chief Executive Officer (and the only director/trustee on the Fund Board that is an “interested person” of the Fund) serves on the CIC Board. In addition, another director/trustee on the Fund Board serves as a director emeritus on the CIC Board.
Calvert
Flexible Bond Fund
December 31, 2021
Notes to Financial Statements — continued
In addition to the Notes, the Fund invested in issuers that may be deemed to be affiliated with Morgan Stanley. At December 31, 2021, the value of the Fund's investment in the Notes and affiliated issuers and funds was $29,868,015, which represents 10.7% of the Fund's net assets. Transactions in the Notes and affiliated issuers and funds by the Fund for the year ended December 31, 2021 were as follows:
| Name | Value,
beginning
of period | Purchases | Sales
proceeds | Net
realized
gain
(loss) | Change in
unrealized
appreciation
(depreciation) | Value,
end of
period | Interest/
Dividend
income | Principal amount/
Shares/Units,
end of period |
| Commercial Mortgage-Backed Securities | | | | | | | | |
| Morgan Stanley Capital I Trust: | | | | | | | | |
| Series 2017-CLS, Class E, 2.06%, (1 mo. USD LIBOR + 1.95%), 11/15/34(1) | $ — | $ 670,476 | $ — | $ — | $ (360) | $ 670,116 | $ 996 | $ 671,000 |
| Series 2017-CLS, Class F, 2.71%, (1 mo. USD LIBOR + 2.60%), 11/15/34(1) | — | 2,200,118 | — | — | (10,912) | 2,189,100 | 16,808 | 2,196,000 |
| Series 2019-BPR, Class B, 2.206%, (1 mo. USD LIBOR + 2.10%), 5/15/36 (1) | — | — | — | — | 76,000 | 2,501,861 | 50,848 | 2,621,000 |
| Series 2019-BPR, Class C, 3.156%, (1 mo. USD LIBOR + 3.05%), 5/15/36 (1) | — | — | — | — | 51,572 | 874,265 | 25,713 | 960,000 |
| High Social Impact Investments | | | | | | | | |
| Calvert Impact Capital, Inc., Community Investment Notes, 1.50%, 12/15/23(2) | 481,990 | — | — | — | 7,540 | 489,530 | 7,500 | 500,000 |
| Mutual Funds | | | | | | | | |
| Calvert Floating-Rate Advantage Fund, Class R6 | 5,141,432 | 3,531,790 | — | — | 7,560 | 8,680,782 | 242,278 | 917,630 |
| Short-Term Investments | | | | | | |
| Calvert Cash Reserves Fund, LLC | 28,060,227 | 160,822,366 | (174,417,975) | (2,704) | 447 | 14,462,361 | 22,465 | 14,462,361 |
| Totals | | | | $(2,704) | $131,847 | $29,868,015 | $366,608 | |
| (1) | Affiliated issuer as of March 1, 2021 (see Note 2). |
| (2) | Restricted security. |
9 Capital Shares
The Fund’s Declaration of Trust permits the Trustees to issue an unlimited number of full and fractional shares of beneficial interest (without par value). Such shares may be issued in a number of different series (such as the Fund) and classes.
Transactions in capital shares for the years ended December 31, 2021 and December 31, 2020 were as follows:
| | Year Ended
December 31, 2021 | | Year Ended
December 31, 2020 |
| | Shares | Amount | | Shares | Amount |
| Class A | | | | | |
| Shares sold | 924,682 | $ 14,390,599 | | 778,445 | $ 11,348,973 |
| Reinvestment of distributions | 54,856 | 847,704 | | 35,821 | 525,103 |
| Shares redeemed | (519,560) | (8,074,411) | | (1,031,025) | (15,054,899) |
| Converted from Class C | 1,760 | 27,462 | | 1,818 | 27,265 |
| Net increase (decrease) | 461,738 | $ 7,191,354 | | (214,941) | $ (3,153,558) |
Calvert
Flexible Bond Fund
December 31, 2021
Notes to Financial Statements — continued
| | Year Ended
December 31, 2021 | | Year Ended
December 31, 2020 |
| | Shares | Amount | | Shares | Amount |
| Class C | | | | | |
| Shares sold | 33,833 | $ 527,810 | | 31,309 | $ 469,806 |
| Reinvestment of distributions | 1,943 | 30,005 | | 1,544 | 22,597 |
| Shares redeemed | (32,552) | (503,612) | | (19,232) | (279,412) |
| Converted to Class A | (1,759) | (27,462) | | (1,817) | (27,265) |
| Net increase | 1,465 | $ 26,741 | | 11,804 | $ 185,726 |
| Class I | | | | | |
| Shares sold | 8,072,554 | $125,124,841 | | 5,980,100 | $ 87,206,665 |
| Reinvestment of distributions | 362,291 | 5,585,145 | | 276,317 | 4,031,132 |
| Shares redeemed | (5,136,037) | (79,718,663) | | (5,215,987) | (74,506,241) |
| Net increase | 3,298,808 | $ 50,991,323 | | 1,040,430 | $ 16,731,556 |
| Class R6 | | | | | |
| Shares sold | 1,129,019 | $ 17,556,104 | | 265,036 | $ 3,973,834 |
| Reinvestment of distributions | 89,979 | 1,387,151 | | 76,993 | 1,121,121 |
| Shares redeemed | (80,926) | (1,248,050) | | (1,104,495) | (15,943,453) |
| Net increase (decrease) | 1,138,072 | $ 17,695,205 | | (762,466) | $(10,848,498) |
At December 31, 2021, Calvert Conservative Allocation Fund and Calvert Moderate Allocation Fund owned 6.3% and 6.1%, respectively, of the value of the outstanding shares of the Fund.
10 Risks and Uncertainties
Pandemic Risk
An outbreak of respiratory disease caused by a novel coronavirus was first detected in China in late 2019 and subsequently spread internationally. This coronavirus has resulted in closing borders, enhanced health screenings, changes to healthcare service preparation and delivery, quarantines, cancellations, disruptions to supply chains and customer activity, as well as general concern and uncertainty. Health crises caused by outbreaks, such as the coronavirus outbreak, may exacerbate other pre-existing political, social and economic risks and disrupt normal market conditions and operations. The impact of this outbreak has negatively affected the worldwide economy, the economies of individual countries, individual companies, and the market in general, and may continue to do so in significant and unforeseen ways, as may other epidemics and pandemics that may arise in the future. Any such impact could adversely affect the Fund's performance, or the performance of the securities in which the Fund invests.
11 Change in Independent Registered Public Accounting Firm
On July 30, 2021, KPMG LLP (“KPMG”) informed the Audit Committee and Board of the Trust that it was resigning as the independent registered public accounting firm to the Trust, as upon Morgan Stanley’s acquisition of Eaton Vance Corp., the parent company of CRM (the investment adviser to each series of the Trust), KPMG would no longer be independent of the Trust. The Audit Committee of the Board and the Board approved the selection of Deloitte & Touche LLP (“Deloitte”) as the independent registered public accounting firm for the funds that are series of the Trust (the “Funds”) for the fiscal year ending December 31, 2021 to be effective upon KPMG’s resignation and Deloitte’s acceptance of the engagement which became effective July 30, 2021.
KPMG’s reports on the financial statements for the Funds for the fiscal periods ended December 31, 2019 and December 31, 2020 contained no adverse opinion or disclaimer of opinion nor were they qualified or modified as to uncertainty, audit scope or accounting principles. During the fiscal periods ended December 31, 2019 and December 31, 2020, and during the subsequent interim period through July 30, 2021: (i) there were no disagreements with KPMG on any matter of accounting principles or practices, financial statement disclosure or auditing scope or procedure, which disagreements, if not resolved to the satisfaction of KPMG, would have caused KPMG to make reference to the subject matter of the disagreements in connection with its reports on the Funds’ financial statements for such periods; and (ii) there were no “reportable events” of the kind described in Item 304(a)(1)(v) of Regulation S-K under the Securities Exchange Act of 1934, as amended.
Calvert
Flexible Bond Fund
December 31, 2021
Notes to Financial Statements — continued
During the fiscal periods ended December 31, 2019 and December 31, 2020, and during the subsequent interim period through July 30, 2021: neither the Funds, nor anyone on their behalf, consulted with Deloitte on items which: (i) concerned the application of accounting principles to a specified transaction, either completed or proposed, or the type of audit opinion that might be rendered on the Funds’ financial statements; or (ii) concerned the subject of a disagreement (as defined in paragraph (a)(1)(iv) of Item 304 of Regulation S-K) or reportable events (as described in paragraph (a)(1)(v) of Item 304).
Calvert
Flexible Bond Fund
December 31, 2021
Report of Independent Registered Public Accounting Firm
To the Board of Trustees of Calvert Management Series and Shareholders of Calvert Flexible Bond Fund:
Opinion on the Financial Statements and Financial Highlights
We have audited the accompanying statement of assets and liabilities of Calvert Flexible Bond Fund (the "Fund") (one of the funds constituting Calvert Management Series), including the schedule of investments, as of December 31, 2021, the related statements of operations, changes in net assets, and the financial highlights for the year then ended, and the related notes. In our opinion, the financial statements and financial highlights present fairly, in all material respects, the financial position of the Fund as of December 31, 2021, and the results of its operations, changes in its net assets, and the financial highlights for the year then ended in conformity with accounting principles generally accepted in the United States of America. The statement of changes in net assets for the year ended December 31, 2020, and the financial highlights for the years or periods ended December 31, 2020, 2019, 2018, and 2017 were audited by other auditors whose report, dated February 22, 2021, expressed an unqualified opinion on that financial statement and those financial highlights.
Basis for Opinion
These financial statements and financial highlights are the responsibility of the Fund's management. Our responsibility is to express an opinion on the Fund's financial statements and financial highlights based on our audit. We are a public accounting firm registered with the Public Company Accounting Oversight Board (United States) (PCAOB) and are required to be independent with respect to the Fund in accordance with the U.S. federal securities laws and the applicable rules and regulations of the Securities and Exchange Commission and the PCAOB.
We conducted our audit in accordance with the standards of the PCAOB. Those standards require that we plan and perform the audit to obtain reasonable assurance about whether the financial statements and financial highlights are free of material misstatement, whether due to error or fraud. The Fund is not required to have, nor were we engaged to perform, an audit of its internal control over financial reporting. As part of our audit, we are required to obtain an understanding of internal control over financial reporting but not for the purpose of expressing an opinion on the effectiveness of the Fund’s internal control over financial reporting. Accordingly, we express no such opinion.
Our audit included performing procedures to assess the risks of material misstatement of the financial statements and financial highlights, whether due to error or fraud, and performing procedures that respond to those risks. Such procedures included examining, on a test basis, evidence regarding the amounts and disclosures in the financial statements and financial highlights. Our audit also included evaluating the accounting principles used and significant estimates made by management, as well as evaluating the overall presentation of the financial statements and financial highlights. Our procedures included confirmation of securities owned as of December 31, 2021, by correspondence with the custodian, brokers and selling or agent banks; when replies were not received from brokers and selling or agent banks, we performed other auditing procedures. We believe that our audit provides a reasonable basis for our opinion.
/s/ Deloitte & Touche LLP
Boston, Massachusetts
February 24, 2022
We have served as the auditor of one or more Calvert investment companies since 2021.
Calvert
Flexible Bond Fund
December 31, 2021
Federal Tax Information (Unaudited)
The Form 1099-DIV you received in February 2022 showed the tax status of all distributions paid to your account in calendar year 2021. Shareholders are advised to consult their own tax adviser with respect to the tax consequences of their investment in the Fund. As required by the Internal Revenue Code and/or regulations, shareholders must be notified regarding the status of qualified business income, 163(j) interest dividends and capital gains dividends.
Qualified Business Income. For the fiscal year ended December 31, 2021, the Fund designates approximately $4,746, or up to the maximum amount of such dividends allowable pursuant to the Internal Revenue Code, as qualified business income.
163(j) Interest Dividends. For the fiscal year ended December 31, 2021, the Fund designates 70.23% of distributions from net investment income as a 163(j) interest dividend.
Capital Gains Dividends. The Fund hereby designates as a capital gain dividend with respect to the taxable year ended December 31, 2021, $1,995,006 or, if subsequently determined to be different, the net capital gain of such year.
Calvert
Flexible Bond Fund
December 31, 2021
Management and Organization
Fund Management. The Trustees of Calvert Management Series (the Trust) are responsible for the overall management and supervision of the affairs of the Trust. The Board members and officers of the Trust are listed below. Except as indicated, each individual has held the office shown or other offices in the same company for the last five years. Board members hold indefinite terms of office. Each Trustee holds office until his or her successor is elected and qualified, or until his or her earlier death, resignation, retirement, removal or disqualification. Under the terms of the Fund's current Board member retirement policy, an Independent Board member must retire at the end of the calendar year in which he or she turns 75. However, if such retirement would cause the Fund to be out of compliance with Section 16 of the 1940 Act or any other regulations or guidance of the SEC, then such retirement will not become effective until such time as action has been taken for the Fund to be in compliance therewith. The “noninterested Trustees” consist of those Trustees who are not “interested persons” of the Trust, as that term is defined under the 1940 Act. The business address of each Board member and the Chief Compliance Officer is 1825 Connecticut Avenue NW, Suite 400, Washington, DC 20009 and the business address of the Secretary, Vice President and Chief Legal Officer and the Treasurer is Two International Place, Boston, Massachusetts 02110. As used below, “CRM” refers to Calvert Research and Management and “Eaton Vance” refers to Eaton Vance Management. Each Trustee oversees 39 funds in the Calvert fund complex. Effective March 1, 2021, each of Eaton Vance and CRM are indirect, wholly owned subsidiaries of Morgan Stanley. Each officer affiliated with CRM may hold a position with other CRM affiliates that is comparable to his or her position with CRM listed below.
| Name and Year of Birth | Trust
Position(s) | Length of
Service | Principal Occupation(s) and Other Directorships
During Past Five Years and Other Relevant Experience |
| Interested Trustee |
John H. Streur(1)
1960 | Trustee and
President | Since 2015 | President and Chief Executive Officer of CRM (since December 31, 2016). President and Chief Executive Officer of Calvert Investments, Inc.
(January 2015 - December 2016); Chief Executive Officer of Calvert
Investment Distributors, Inc. (August 2015 - December 2016); Chief
Compliance Officer of Calvert Investment Management, Inc. (August 2015 -
April 2016); President and Director, Portfolio 21 Investments, Inc.
(through October 2014); President, Chief Executive Officer and
Director, Managers Investment Group LLC (through January 2012);
President and Director, The Managers Funds and Managers AMG
Funds (through January 2012).
Other Directorships. Portfolio 21 Investments, Inc. (asset management)
(through October 2014); Managers Investment Group LLC (asset management)
(through January 2012); The Managers Funds (asset management)
(through January 2012); Managers AMG Funds (asset management)
(through January 2012); Calvert Impact Capital, Inc. |
| Noninterested Trustees |
Richard L. Baird, Jr.
1948 | Trustee | Since 1980 | Regional Disaster Recovery Lead, American Red Cross of Greater
Pennsylvania (since 2017). Volunteer, American Red Cross (since 2015).
Former President and CEO of Adagio Health Inc. (retired in 2014) in
Pittsburgh, PA.
Other Directorships. None. |
Alice Gresham Bullock
1950 | Chair and
Trustee | Since 2016 | Professor Emerita at Howard University School of Law. Dean Emerita of
Howard University School of Law and Deputy Director of the Association
of American Law Schools (1992-1994).
Other Directorships. None. |
Cari M. Dominguez
1949 | Trustee | Since 2016 | Former Chair of the U.S. Equal Employment Opportunity Commission.
Other Directorships. ManpowerGroup Inc. (workforce solutions company);
Triple S Management Corporation (managed care); National Association of Corporate Directors. |
John G. Guffey, Jr.
1948 | Trustee | Since 1982 | President of Aurora Press Inc., a privately held publisher of trade
paperbacks (since January 1997).
Other Directorships. Calvert Impact Capital, Inc. (through
December 31, 2018); Calvert Ventures, LLC. |
Miles D. Harper, III
1962 | Trustee | Since 2016 | Partner, Carr Riggs & Ingram (public accounting firm) since October 2014.
Partner, Gainer Donnelly & Desroches (public accounting firm) (now Carr
Riggs & Ingram) (November 1999 - September 2014).
Other Directorships. Bridgeway Funds (9) (asset management). |
Joy V. Jones
1950 | Trustee | Since 2016 | Attorney.
Other Directorships. Palm Management Corporation. |
Calvert
Flexible Bond Fund
December 31, 2021
Management and Organization — continued
| Name and Year of Birth | Trust
Position(s) | Length of
Service | Principal Occupation(s) and Other Directorships
During Past Five Years and Other Relevant Experience |
| Noninterested Trustees (continued) |
Anthony A. Williams
1951 | Trustee | Since 2010 | CEO and Executive Director of the Federal City Council (July 2012 to
present); Senior Adviser and Independent Consultant for King and
Spalding LLP (September 2015 to present); Executive Director of Global
Government Practice at the Corporate Executive Board (January 2010 to
January 2012).
Other Directorships. Freddie Mac; Evoq Properties/Meruelo Maddux
Properties, Inc. (real estate management); Weston Solutions, Inc.
(environmental services); Bipartisan Policy Center’s Debt Reduction Task Force;
Chesapeake Bay Foundation; Catholic University of America; Urban Institute (research organization); The Howard Hughes Corporation (real estate development). |
| Name and Year of Birth | Trust
Position(s) | Length of
Service | Principal Occupation(s)
During Past Five Years |
| Principal Officers who are not Trustees |
Hope L. Brown
1973 | Chief
Compliance
Officer | Since 2014 | Chief Compliance Officer of 39 registered investment companies advised
by CRM (since 2014). Vice President and Chief Compliance Officer,
Wilmington Funds (2012-2014). |
Deidre E. Walsh
1971 | Secretary,
Vice President
and Chief
Legal Officer | Since 2021 | Vice President of CRM and officer of 39 registered investment companies
advised by CRM (since 2021). Also Vice President of Eaton Vance and
certain of its affiliates and officer of 138 registered investment companies
advised or administered by Eaton Vance. |
James F. Kirchner
1967 | Treasurer | Since 2016 | Vice President of CRM and officer of 39 registered investment companies
advised by CRM (since 2016). Also Vice President of Eaton Vance and
certain of its affiliates and officer of 138 registered investment companies
advised or administered by Eaton Vance. |
| | | | |
| (1) Mr. Streur is an interested person of the Fund because of his positions with the Fund’s adviser and certain affiliates. |
The SAI for the Fund includes additional information about the Trustees and officers of the Fund and can be obtained without charge on Calvert’s website at www.calvert.com or by calling 1-800-368-2745.
| FACTS | WHAT DOES EATON VANCE DO WITH YOUR
PERSONAL INFORMATION? |
| Why? | Financial companies choose how they share your personal information. Federal law gives consumers the right to limit some but not all sharing. Federal law also requires us to tell you how we collect, share, and protect your personal information. Please read this notice carefully to understand what we do. |
| |
| What? | The types of personal information we collect and share depend on the product or service you have with us. This information can include:■ Social Security number and income
■
investment experience and risk tolerance
■
checking account number and wire transfer instructions |
| |
| How? | All financial companies need to share customers’ personal information to run their everyday business. In the section below, we list the reasons financial companies can share their customers’ personal information; the reasons Eaton Vance chooses to share; and whether you can limit this sharing. |
Reasons we can share your
personal information | Does Eaton Vance
share? | Can you limit
this sharing? |
| For our everyday business purposes — such as to process your transactions, maintain your account(s), respond to court orders and legal investigations, or report to credit bureaus | Yes | No |
| For our marketing purposes — to offer our products and services to you | Yes | No |
| For joint marketing with other financial companies | No | We don’t share |
| For our investment management affiliates’ everyday business purposes — information about your transactions, experiences, and creditworthiness | Yes | Yes |
| For our affiliates’ everyday business purposes — information about your transactions and experiences | Yes | No |
| For our affiliates’ everyday business purposes — information about your creditworthiness | No | We don’t share |
| For our investment management affiliates to market to you | Yes | Yes |
| For our affiliates to market to you | No | We don’t share |
| For nonaffiliates to market to you | No | We don’t share |
To limit our
sharing | Call toll-free 1-800-368-2745 or email: CRMPrivacy@calvert.comPlease note:If you are a new customer, we can begin sharing your information 30 days from the date we sent this notice. When you are no longer our customer, we continue to share your information as described in this notice. However, you can contact us at any time to limit our sharing. |
| Questions? | Call toll-free 1-800-368-2745 or email: CRMPrivacy@calvert.com |
| Privacy Notice — continued | April 2021 |
| Who we are |
| Who is providing this notice? | Eaton Vance Management, Eaton Vance Distributors, Inc., Eaton Vance Trust Company, Eaton Vance Management (International) Limited, Eaton Vance Advisers International Ltd., Eaton Vance Global Advisors Limited, Eaton Vance Management’s Real Estate Investment Group, Boston Management and Research, Calvert Research and Management, Eaton Vance and Calvert Fund Families and our investment advisory affiliates (“Eaton Vance”) (see Investment Management Affiliates definition below) |
| What we do |
How does Eaton Vance
protect my personal
information? | To protect your personal information from unauthorized access and use, we use security measures that comply with federal law. These measures include computer safeguards and secured files and buildings. We have policies governing the proper handling of customer information by personnel and requiring third parties that provide support to adhere to appropriate security standards with respect to such information. |
How does Eaton Vance
collect my personal
information? | We collect your personal information, for example, when you■ open an account or make deposits or withdrawals from your account
■
buy securities from us or make a wire transfer
■
give us your contact informationWe also collect your personal information from others, such as credit bureaus, affiliates, or other companies. |
| Why can’t I limit all sharing? | Federal law gives you the right to limit only■ sharing for affiliates’ everyday business purposes — information about your creditworthiness
■
affiliates from using your information to market to you
■
sharing for nonaffiliates to market to youState laws and individual companies may give you additional rights to limit sharing. See below for more on your rights under state law. |
| Definitions |
Investment Management
Affiliates | Eaton Vance Investment Management Affiliates include registered investment advisers, registered broker- dealers, and registered and unregistered funds. Investment Management Affiliates does not include entities associated with Morgan Stanley Wealth Management, such as Morgan Stanley Smith Barney LLC and Morgan Stanley & Co. |
| Affiliates | Companies related by common ownership or control. They can be financial and nonfinancial companies.■ Our affiliates include companies with a Morgan Stanley name and financial companies such as Morgan Stanley Smith Barney LLC and Morgan Stanley & Co. |
| Nonaffiliates | Companies not related by common ownership or control. They can be financial and nonfinancial companies.■ Eaton Vance does not share with nonaffiliates so they can market to you. |
| Joint marketing | A formal agreement between nonaffiliated financial companies that together market financial products or services to you.■ Eaton Vance doesn’t jointly market. |
| Other important information |
| Vermont: Except as permitted by law, we will not share personal information we collect about Vermont residents with Nonaffiliates unless you provide us with your written consent to share such information.California: Except as permitted by law, we will not share personal information we collect about California residents with Nonaffiliates and we will limit sharing such personal information with our Affiliates to comply with California privacy laws that apply to us. |
Delivery of Shareholder Documents. The Securities and Exchange Commission (SEC) permits funds to deliver only one copy of shareholder documents, including prospectuses, proxy statements and shareholder reports, to fund investors with multiple accounts at the same residential or post office box address. This practice is often called “householding” and it helps eliminate duplicate mailings to shareholders. Calvert funds, or your financial intermediary, may household the mailing of your documents indefinitely unless you instruct Calvert funds, or your financial intermediary, otherwise. If you would prefer that your Calvert fund documents not be householded, please contact Calvert funds at 1-800-368-2745, or contact your financial intermediary. Your instructions that householding not apply to delivery of your Calvert fund documents will typically be effective within 30 days of receipt by Calvert funds or your financial intermediary. Separate statements will be generated for each separate account and will be householded as described above.
Portfolio Holdings. Each Calvert fund files a schedule of portfolio holdings on Part F to Form N-PORT with the SEC. Certain information filed on Form N-PORT may be viewed on the Calvert website at www.calvert.com, by calling Calvert at 1-800-368-2745 or in the EDGAR database on the SEC’s website at www.sec.gov.
Proxy Voting. The Proxy Voting Guidelines that each Calvert fund uses to determine how to vote proxies relating to portfolio securities is provided as an Appendix to the fund’s Statement of Additional Information. The Statement of Additional Information can be obtained free of charge by calling the Calvert funds at 1-800-368-2745, by visiting the Calvert funds’ website at www.calvert.com or visiting the SEC’s website at www.sec.gov. Information regarding how a Calvert fund voted proxies relating to portfolio securities during the most recent 12-month period ended June 30 is available by calling Calvert funds, by visiting the Calvert funds’ website at www.calvert.com or by visiting the SEC’s website at www.sec.gov.
This Page Intentionally Left Blank
This Page Intentionally Left Blank
This Page Intentionally Left Blank
Investment Adviser and Administrator
Calvert Research and Management
1825 Connecticut Avenue NW, Suite 400
Washington, DC 20009
Principal Underwriter*
Eaton Vance Distributors, Inc.
Two International Place
Boston, MA 02110
(617) 482-8260
Custodian
State Street Bank and Trust Company
State Street Financial Center, One Lincoln Street
Boston, MA 02111
Transfer Agent
DST Asset Manager Solutions, Inc.
2000 Crown Colony Drive
Quincy, MA 02169
Independent Registered Public Accounting Firm
Deloitte & Touche LLP
200 Berkeley Street
Boston, MA 02116-5022
Fund Offices
1825 Connecticut Avenue NW, Suite 400
Washington, DC 20009
* FINRA BrokerCheck. Investors may check the background of their Investment Professional by contacting the Financial Industry Regulatory Authority (FINRA). FINRA BrokerCheck is a free tool to help investors check the professional background of current and former FINRA-registered securities firms and brokers. FINRA BrokerCheck is available by calling 1-800-289-9999 and at www.FINRA.org. The FINRA BrokerCheck brochure describing this program is available to investors at www.FINRA.org.
Printed on recycled paper.
24175 12.31.21
Calvert
Responsible Municipal Income Fund
Annual Report
December 31, 2021
Commodity Futures Trading Commission Registration. The Commodity Futures Trading Commission (“CFTC”) has adopted regulations that subject registered investment companies and advisers to regulation by the CFTC if a fund invests more than a prescribed level of its assets in certain CFTC-regulated instruments (including futures, certain options and swap agreements) or markets itself as providing investment exposure to such instruments. The adviser has claimed an exclusion from the definition of “commodity pool operator” under the Commodity Exchange Act with respect to its management of the Fund and the other funds it manages. Accordingly, neither the Fund nor the adviser is subject to CFTC regulation.
Fund shares are not insured by the FDIC and are not deposits or other obligations of, or guaranteed by, any depository institution. Shares are subject to investment risks, including possible loss of principal invested.
This report must be preceded or accompanied by a current summary prospectus or prospectus. Before investing, investors should consider carefully the investment objective, risks, and charges and expenses of a mutual fund. This and other important information is contained in the summary prospectus and prospectus, which can be obtained from a financial intermediary. Prospective investors should read the prospectus carefully before investing. For further information, please call 1-800-368-2745.
Choose Planet-friendly E-delivery!
Sign up now for on-line statements, prospectuses, and fund reports. In less than five minutes you can help reduce paper mail and lower fund costs.
Just go to www.calvert.com. If you already have an online account with the Calvert funds, click on Login to access your Account and select the documents you would like to receive via e-mail.
If you’re new to online account access, click on Login, then Register to create your user name and password. Once you’re in, click on the E-delivery sign-up on the Account Portfolio page and follow the quick, easy steps.
Note: If your shares are not held directly with the Calvert funds but through a brokerage firm, you must contact your broker for electronic delivery options available through their firm.
Annual Report December 31, 2021
Calvert
Responsible Municipal Income Fund
Calvert
Responsible Municipal Income Fund
December 31, 2021
Management's Discussion of Fund Performance†
Economic and Market Conditions
As the 12-month period began on January 1, 2021, municipal bonds were in the midst of a rally that would last through mid-February. The bond rally had begun the previous November, fueled by the announcement that two coronavirus vaccine candidates had proven more than 90% effective in trials, and by Joe Biden’s U.S. presidential victory, which eased some of the political uncertainties that had dogged investment markets through the fall. The beginning of the COVID-19 vaccination process and Congress’ passage of a fiscal stimulus bill added more fuel to the bond rally.
From mid-February through June 2021, however, the bond market reversed course. Municipal and U.S. Treasury yields rose and bond prices declined in anticipation of rising economic growth, driven by new federal stimulus and progress on vaccinations. In late spring-early summer, high year-over-year inflation numbers also raised investor concerns and put further upward pressure on interest rates.
By July, however, the emergence of a more contagious Delta variant of COVID-19 threatened the U.S. economic rebound and diminished inflation concerns. Investors again turned to U.S. Treasurys and municipal bonds as relatively “safe-haven” assets, leading bond prices to rise and interest rates to fall in July.
From August through October, bond prices declined once again due, in part, to anticipation that the U.S. Federal Reserve (the Fed) would begin tapering its monthly bond purchases, which had helped hold interest rates down through much of the pandemic.
In the closing months of the period, the Fed confirmed that tapering would begin in November and accelerate in the months to come. The reduction of monetary stimulus put upward pressure on shorter term interest rates, as did passage of a $1 trillion infrastructure bill during the period. Longer term municipal and Treasury rates, however, declined in November as investors sought assets considered less risky, such as U.S. Treasurys and municipal bonds. As a result, the municipal bond yield curve flattened in November. As the Fed issued more hawkish monetary statements, Treasury rates rose in December against the backdrop of inflationary concerns and potential interest rate hikes. Municipal bond rates, however, were nearly unchanged during the month.
For the period as a whole, interest rates rose across the municipal bond yield curve, but less so at the long (30-year) end of the curve, causing the curve to flatten. Throughout the curve, however, rates remained near historic lows. The Bloomberg Municipal Bond Index (the Index), a broad measure of the municipal bond market, returned 1.52% during the period. Municipal bonds generally outperformed Treasurys, as Treasury interest rates in every part of the curve rose more than municipal rates during the period.
Fund Performance
For the 12-month period ended December 31, 2021, Calvert Responsible Municipal Income Fund (the Fund) returned 0.19% for Class A shares at net asset value (NAV), underperforming its benchmark, the Index, which returned 1.52%.
The Fund’s investment objective is to provide current income exempt from regular federal income tax. The Fund seeks to do so by normally investing at least 80% of its net assets in municipal obligations, the interest on which is exempt from regular federal income tax and federal alternative minimum tax. The Fund also normally invests at least 80% of its net assets (plus any borrowing for investment purposes) in issuers that — as determined by the Fund’s investment adviser — operate in a manner consistent with, or promote the Calvert Principles for Responsible Investment. Such investments may include, among other things, municipal obligations that finance education, health care, community services, housing, water, and public transportation.
Detractors from Fund performance versus the Index during the period included an underweight position relative to the Index in BBB rated bonds, which were the best-performing credit-rating tier in the Index, and an overweight position in AAA rated bonds, which were the worst-performing credit-rating tier in the Index. Security selections in Illinois bonds also hurt relative returns, as did an underweight position in bonds with 17 or more years remaining to maturity, during a period when longer maturity bonds generally outperformed shorter maturity bonds.
In contrast, contributors to Fund performance versus the Index included security selection in the housing sector, an overweight position in 4% coupon bonds, and the Fund’s interest rate hedging strategy.
As a risk management tactic within the Fund’s overall strategy, interest rate hedging is intended to moderate performance on both the upsides and downsides of the market. During the period, management hedged the Fund’s exposure to interest rate risk using U.S. Treasury futures — in effect taking a short position on Treasurys. During a period when Treasury interest rates — as well as municipal interest rates — rose and Treasury prices fell, the Fund’s Treasury futures produced a positive return and helped mitigate some of the negative effect of falling bond prices on Fund performance.
See Endnotes and Additional Disclosures in this report.
Past performance is no guarantee of future results. Returns are historical and are calculated by determining the percentage change in net asset value (NAV) or offering price (as applicable) with all distributions reinvested. Investment return and principal value will fluctuate so that shares, when redeemed, may be worth more or less than their original cost. Performance for periods less than or equal to one year is cumulative. Performance is for the stated time period only; due to market volatility, current Fund performance may be lower or higher than the quoted return. For performance as of the most recent month-end, please refer to www.calvert.com.
Calvert
Responsible Municipal Income Fund
December 31, 2021
Performance
Portfolio Manager(s) Cynthia J. Clemson and William J. Delahunty, CFA, each of Calvert Research and Management
| % Average Annual Total Returns1,2 | Class
Inception Date | Performance
Inception Date | One Year | Five Years | Ten Years | Since Inception |
| Class A at NAV | 08/23/1983 | 08/23/1983 | 0.19% | 3.40% | 2.98% | 5.29% |
| Class A with 3.75% Maximum Sales Charge | — | — | (3.60) | 2.61 | 2.59 | 5.19 |
| Class C at NAV | 07/15/2015 | 07/15/2015 | (0.56) | 2.64 | — | 2.31 |
| Class C with 1% Maximum Sales Charge | — | — | (1.55) | 2.64 | — | 2.31 |
| Class I at NAV | 07/15/2015 | 08/23/1983 | 0.38 | 3.71 | 3.18 | 5.35 |
|
| Bloomberg Municipal Bond Index | — | — | 1.52% | 4.17% | 3.72% | 6.46% |
| % Total Annual Operating Expense Ratios3 | Class A | Class C | Class I |
| Gross | 0.88% | 1.62% | 0.63% |
| Net | 0.75 | 1.50 | 0.50 |
| % SEC Yield4 | Class A | Class C | Class I |
| SEC 30-day Yield - Subsidized | 0.36% | (0.36)% | 0.63% |
| SEC 30-day Yield - Unsubsidized | 0.26 | (0.47) | 0.52 |
Growth of $10,000
This graph shows the change in value of a hypothetical investment of $10,000 in Class A of the Fund for the period indicated. For comparison, the same investment is shown in the indicated index.
| Growth of Investment | Amount Invested | Period Beginning | At NAV | With Maximum Sales Charge |
| Class C | $10,000 | 07/15/2015 | $11,592 | N.A. |
| Class I | $250,000 | 12/31/2011 | $342,097 | N.A. |
See Endnotes and Additional Disclosures in this report.
Past performance is no guarantee of future results. Returns are historical and are calculated by determining the percentage change in net asset value (NAV) or offering price (as applicable) with all distributions reinvested. Investment return and principal value will fluctuate so that shares, when redeemed, may be worth more or less than their original cost. Performance for periods less than or equal to one year is cumulative. Performance is for the stated time period only; due to market volatility, current Fund performance may be lower or higher than the quoted return. For performance as of the most recent month-end, please refer to www.calvert.com.
Calvert
Responsible Municipal Income Fund
December 31, 2021
Credit Quality (% of bonds and municipal obligations)*
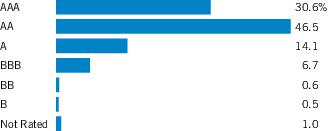
* For purposes of the Fund's rating restrictions, ratings are based on Moody’s Investors Service, Inc. (“Moody’s”), S&P Global Ratings (“S&P”) or Fitch Ratings (“Fitch”), as applicable. If securities are rated differently by the ratings agencies, the highest rating is applied. Ratings, which are subject to change, apply to the creditworthiness of the issuers of the underlying securities and not to the Fund or its shares. Credit ratings measure the quality of a bond based on the issuer’s creditworthiness, with ratings ranging from AAA, being the highest, to D, being the lowest based on S&P’s measures. Ratings of BBB or higher by S&P or Fitch (Baa or higher by Moody’s) are considered to be investment-grade quality. Credit ratings are based largely on the ratings agency’s analysis at the time of rating. The rating assigned to any particular security is not necessarily a reflection of the issuer’s current financial condition and does not necessarily reflect its assessment of the volatility of a security’s market value or of the liquidity of an investment in the security. Holdings designated as “Not Rated” (if any) are not rated by the national ratings agencies stated above.
Calvert
Responsible Municipal Income Fund
December 31, 2021
Endnotes and Additional Disclosures
| † | The views expressed in this report are those of the portfolio manager(s) and are current only through the date stated at the top of this page. These views are subject to change at any time based upon market or other conditions, and Calvert and the Fund(s) disclaim any responsibility to update such views. These views may not be relied upon as investment advice and, because investment decisions are based on many factors, may not be relied upon as an indication of trading intent on behalf of any Calvert fund. This commentary may contain statements that are not historical facts, referred to as “forward-looking statements.” The Fund’s actual future results may differ significantly from those stated in any forward-looking statement, depending on factors such as changes in securities or financial markets or general economic conditions, the volume of sales and purchases of Fund shares, the continuation of investment advisory, administrative and service contracts, and other risks discussed from time to time in the Fund’s filings with the Securities and Exchange Commission. |
| | |
| 1 | Bloomberg Municipal Bond Index is an unmanaged index of municipal bonds traded in the U.S. Unless otherwise stated, index returns do not reflect the effect of any applicable sales charges, commissions, expenses, taxes or leverage, as applicable. It is not possible to invest directly in an index. |
| 2 | Total Returns at NAV do not include applicable sales charges. If sales charges were deducted, the returns would be lower. Total Returns shown with maximum sales charge reflect the stated maximum sales charge. Unless otherwise stated, performance does not reflect the deduction of taxes on Fund distributions or redemptions of Fund shares.Performance prior to the inception date of a class may be linked to the performance of an older class of the Fund. This linked performance is adjusted for any applicable sales charge, but is not adjusted for class expense differences. If adjusted for such differences, the performance would be different. The performance of Class I is linked to Class A. Performance since inception for an index, if presented, is the performance since the Fund’s or oldest share class’ inception, as applicable. Performance presented in the Financial Highlights included in the financial statements is not linked.Calvert Research and Management became the investment adviser to the Fund on December 31, 2016. Performance reflected prior to such date is that of the Fund’s former investment adviser. |
| 3 | Source: Fund prospectus. Net expense ratios reflect a contractual expense reimbursement that continues through 4/30/22. The expense ratios for the current reporting period can be found in the Financial Highlights section of this report. Performance reflects expenses waived and/or reimbursed, if applicable. Without such waivers and/or reimbursements, performance would have been lower. |
| 4 | SEC Yield is a standardized measure based on the estimated yield to maturity of a fund’s investments over a 30-day period and is based on the maximum offer price at the date specified. The SEC Yield is not based on the distributions made by the Fund, which may differ. Subsidized yield reflects the effect of fee waivers and expense reimbursements. |
| | Additional Information |
| | Yield curve is a graphical representation of the yields offered by bonds of various maturities. The yield curve flattens when long-term interest rates fall and/or short-term interest rates increase, and the yield curve steepens when long-term interest rates increase and/or short-term interest rates fall. |
Calvert
Responsible Municipal Income Fund
December 31, 2021
Example
As a Fund shareholder, you incur two types of costs: (1) transaction costs, including sales charges (loads) on purchases and redemption fees (if applicable); and (2) ongoing costs, including management fees; distribution and/or service fees; and other Fund expenses. This Example is intended to help you understand your ongoing costs (in dollars) of Fund investing and to compare these costs with the ongoing costs of investing in other mutual funds. The Example is based on an investment of $1,000 invested at the beginning of the period and held for the entire period (July 1, 2021 to December 31, 2021).
Actual Expenses
The first section of the table below provides information about actual account values and actual expenses. You may use the information in this section, together with the amount you invested, to estimate the expenses that you paid over the period. Simply divide your account value by $1,000 (for example, an $8,600 account value divided by $1,000 = 8.6), then multiply the result by the number in the first section under the heading entitled “Expenses Paid During Period” to estimate the expenses you paid on your account during this period.
Hypothetical Example for Comparison Purposes
The second section of the table below provides information about hypothetical account values and hypothetical expenses based on the actual Fund expense ratio and an assumed rate of return of 5% per year (before expenses), which is not the actual Fund return. The hypothetical account values and expenses may not be used to estimate the actual ending account balance or expenses you paid for the period. You may use this information to compare the ongoing costs of investing in the Fund and other funds. To do so, compare this 5% hypothetical example with the 5% hypothetical examples that appear in the shareholder reports of the other funds.
Please note that the expenses shown in the table are meant to highlight your ongoing costs only and do not reflect any transactional costs, such as sales charges (loads) or redemption fees (if applicable). Therefore, the second section of the table is useful in comparing ongoing costs only, and will not help you determine the relative total costs of owning different funds. In addition, if these transactional costs were included, your costs would be higher.
| | Beginning
Account Value
(7/1/21) | Ending
Account Value
(12/31/21) | Expenses Paid
During Period*
(7/1/21 – 12/31/21) | Annualized
Expense
Ratio |
| Actual | | | | |
| Class A | $1,000.00 | $1,002.00 | $3.78 ** | 0.75% |
| Class C | $1,000.00 | $ 997.70 | $7.55 ** | 1.50% |
| Class I | $1,000.00 | $1,002.70 | $2.52 ** | 0.50% |
| Hypothetical | | | | |
| (5% return per year before expenses) | | | | |
| Class A | $1,000.00 | $1,021.42 | $3.82 ** | 0.75% |
| Class C | $1,000.00 | $1,017.64 | $7.63 ** | 1.50% |
| Class I | $1,000.00 | $1,022.68 | $2.55 ** | 0.50% |
| * | Expenses are equal to the Fund's annualized expense ratio for the indicated Class, multiplied by the average account value over the period, multiplied by 184/365 (to reflect the one-half year period). The Example assumes that the $1,000 was invested at the net asset value per share determined at the close of business on June 30, 2021. |
| ** | Absent a waiver and/or reimbursement of expenses by an affiliate, expenses would be higher. |
Calvert
Responsible Municipal Income Fund
December 31, 2021
| Security | Principal
Amount
(000's omitted) | Value |
| Consumer, Cyclical — 0.1% | |
| YMCA of Greater New York, 2.303%, 8/1/26 | $ | 265 | $ 262,776 |
| | | | $ 262,776 |
| Consumer, Non-cyclical — 0.8% | |
| Conservation Fund (The), Green Bonds, 3.474%, 12/15/29 | $ | 3,493 | $ 3,690,330 |
| | | | $ 3,690,330 |
| Industrial — 0.6% | |
| Nature Conservancy (The): | | | |
| Series A, 0.794%, 7/1/25 | $ | 1,450 | $ 1,419,716 |
| Series A, 0.944%, 7/1/26 | | 1,285 | 1,252,688 |
| | | | $ 2,672,404 |
| Other Revenue — 1.0% | |
| BlueHub Loan Fund, Inc., 3.099%, 1/1/30 | $ | 4,000 | $ 4,143,083 |
| | | | $ 4,143,083 |
Total Corporate Bonds
(identified cost $10,562,460) | | | $ 10,768,593 |
| Tax-Exempt Mortgage-Backed Securities — 1.8% |
| Security | Principal
Amount
(000's omitted) | Value |
| Housing — 1.8% | |
| California Housing Finance Agency, Municipal Certificates: | | | |
| Series 2021-1, Class A, 3.50%, 11/20/35 | $ | 2,597 | $ 2,964,747 |
| Series 2021-3, Class A, 3.25%, 8/20/36 | | 2,497 | 2,831,092 |
| Washington Housing Finance Commission, Municipal Certificates, Series 2021-1, Class A, 3.50%, 12/20/35 | | 1,626 | 1,885,891 |
Total Tax-Exempt Mortgage-Backed Securities
(identified cost $7,502,178) | | | $ 7,681,730 |
| Tax-Exempt Municipal Obligations — 87.0% |
| Security | Principal
Amount
(000's omitted) | Value |
| Bond Bank — 14.5% | |
| California Infrastructure and Economic Development Bank, (Clean Water State Revolving Fund), Green Bonds, 5.00%, 10/1/31 | $ | 1,000 | $ 1,248,820 |
| Security | Principal
Amount
(000's omitted) | Value |
| Bond Bank (continued) | |
| Connecticut, (Revolving Fund): | | | |
| Green Bonds, 4.00%, 2/1/37 | $ | 3,000 | $ 3,560,190 |
| Green Bonds, 5.00%, 5/1/34 | | 1,140 | 1,379,104 |
| Illinois Finance Authority, (Clean Water Initiative Revolving Fund): | | | |
| 5.00%, 7/1/32 | | 1,500 | 1,799,010 |
| Green Bonds, 5.00%, 1/1/28 | | 8,000 | 9,943,280 |
| Indiana Finance Authority, (Revolving Fund): | | | |
| Green Bonds, 5.00%, 2/1/29 | | 2,000 | 2,394,840 |
| Green Bonds, Series 2018A, 5.00%, 2/1/25 | | 2,510 | 2,862,680 |
| Green Bonds, Series 2019E, 5.00%, 2/1/25 | | 1,920 | 2,189,779 |
| Iowa Finance Authority, (State Revolving Fund): | | | |
| Green Bonds, 5.00%, 8/1/27 | | 1,805 | 2,227,370 |
| Green Bonds, 5.00%, 8/1/28 | | 1,425 | 1,804,990 |
| Green Bonds, 5.00%, 8/1/29 | | 875 | 1,133,239 |
| Green Bonds, 5.00%, 8/1/35 | | 1,500 | 1,880,925 |
| Michigan Finance Authority, (Clean Water Revolving Fund): | | | |
| 3.00%, 10/1/36 | | 1,500 | 1,696,020 |
| 3.00%, 10/1/37 | | 1,390 | 1,569,268 |
| New Mexico Finance Authority, (Senior Lien Public Project Revolving Fund), 5.00%, 6/1/26 | | 1,595 | 1,898,194 |
| New York State Environmental Facilities Corp., (State Revolving Fund), Green Bonds, 5.00%, 8/15/27 | | 500 | 617,640 |
| Oklahoma Water Resources Board: | | | |
| 4.00%, 10/1/31 | | 120 | 148,112 |
| 4.00%, 10/1/32 | | 430 | 529,502 |
| 4.00%, 10/1/34 | | 150 | 184,295 |
| Rhode Island Infrastructure Bank, (Safe Drinking Water Revolving Fund), Green Bonds, 4.00%, 10/1/34 | | 2,650 | 3,207,215 |
| Texas Water Development Board, (Revolving Fund): | | | |
| 4.00%, 8/1/34 | | 5,000 | 6,133,850 |
| 4.00%, 8/1/37 | | 2,750 | 3,336,850 |
| Texas Water Development Board, (State Water Implementation Revenue Fund), 5.00%, 10/15/27 | | 2,500 | 3,098,650 |
| Wisconsin, Environmental Improvement Fund Revenue: | | | |
| Green Bonds, 5.00%, 6/1/34 | | 1,295 | 1,655,127 |
| Green Bonds, 5.00%, 6/1/37 | | 5,035 | 6,409,656 |
| | | | $ 62,908,606 |
| Education — 10.3% | |
| Adams County General Authority, PA, (Gettysburg College): | | | |
| 5.00%, 8/15/27 | $ | 1,330 | $ 1,616,748 |
| 5.00%, 8/15/29 | | 1,720 | 2,171,810 |
| Arizona State University: | | | |
| Green Bonds, 5.00%, 7/1/39 | | 2,000 | 2,533,960 |
| Green Bonds, 5.00%, 7/1/41 | | 3,000 | 3,431,610 |
7
See Notes to Financial Statements.
Calvert
Responsible Municipal Income Fund
December 31, 2021
Schedule of Investments — continued
| Security | Principal
Amount
(000's omitted) | Value |
| Education (continued) | |
| Build NYC Resource Corp., NY, (Academic Leadership Charter School): | | | |
| 4.00%, 6/15/22 | $ | 100 | $ 101,532 |
| 4.00%, 6/15/23 | | 100 | 104,790 |
| 4.00%, 6/15/24 | | 120 | 129,217 |
| 4.00%, 6/15/25 | | 110 | 121,398 |
| 4.00%, 6/15/26 | | 110 | 123,673 |
| 4.00%, 6/15/27 | | 80 | 91,435 |
| 4.00%, 6/15/28 | | 125 | 144,951 |
| 4.00%, 6/15/30 | | 100 | 114,440 |
| 4.00%, 6/15/31 | | 100 | 113,990 |
| California Educational Facilities Authority, (Loyola Marymount University): | | | |
| Green Bonds, 5.00%, 10/1/33 | | 920 | 1,139,954 |
| Green Bonds, 5.00%, 10/1/36 | | 765 | 944,010 |
| Green Bonds, 5.00%, 10/1/38 | | 730 | 898,024 |
| Colorado State University: | | | |
| 4.00%, 3/1/26 | | 210 | 239,146 |
| 5.00%, 3/1/27 | | 225 | 273,580 |
| District of Columbia, (Gallaudet University): | | | |
| Social Bonds, 5.00%, 4/1/26 | | 300 | 352,668 |
| Social Bonds, 5.00%, 4/1/27 | | 300 | 362,862 |
| Social Bonds, 5.00%, 4/1/28 | | 325 | 402,561 |
| Social Bonds, 5.00%, 4/1/29 | | 300 | 379,188 |
| Social Bonds, 5.00%, 4/1/30 | | 300 | 386,037 |
| Social Bonds, 5.00%, 4/1/31 | | 325 | 426,725 |
| District of Columbia, (Rocketship DC Obligated Group): | | | |
| 5.00%, 6/1/29(1) | | 360 | 414,288 |
| 5.00%, 6/1/31(1) | | 1,000 | 1,203,300 |
| Georgia Private Colleges and Universities Authority, (Emory University), 5.00%, 9/1/33 | | 500 | 641,390 |
| Grand Valley State University, MI, 5.00%, 12/1/33 | | 1,000 | 1,168,790 |
| Indiana Finance Authority, (Butler University), 5.00%, 2/1/31 | | 1,130 | 1,226,152 |
| Ivy Tech Community College, IN: | | | |
| 5.00%, 7/1/28 | | 1,575 | 1,979,460 |
| 5.00%, 7/1/29 | | 925 | 1,184,268 |
| Kansas Development Finance Authority, (Wichita State University), 3.00%, 6/1/31 | | 1,925 | 2,117,115 |
| Kentucky Bond Development Corp., (Transylvania University): | | | |
| 2.00%, 3/1/23 | | 160 | 162,802 |
| 5.00%, 3/1/27 | | 80 | 95,658 |
| 5.00%, 3/1/28 | | 100 | 122,410 |
| 5.00%, 3/1/29 | | 155 | 193,285 |
| Los Ranchos de Albuquerque, NM, (Albuquerque Academy): | | | |
| 5.00%, 9/1/27 | | 350 | 421,011 |
| 5.00%, 9/1/28 | | 225 | 276,586 |
| Security | Principal
Amount
(000's omitted) | Value |
| Education (continued) | |
| Los Ranchos de Albuquerque, NM, (Albuquerque Academy): (continued) | | | |
| 5.00%, 9/1/29 | $ | 400 | $ 501,200 |
| Louisiana Public Facilities Authority, (Loyola University), 5.00%, 10/1/26 | | 215 | 252,346 |
| Maricopa County Industrial Development Authority, AZ, (Arizona Autism Charter Schools), 4.00%, 7/1/31(1) | | 250 | 282,027 |
| Maricopa County Industrial Development Authority, AZ, (Legacy Traditional Schools), 3.00%, 7/1/31(1) | | 500 | 535,670 |
| Miami University, OH: | | | |
| 5.00%, 9/1/24 | | 600 | 673,062 |
| 5.00%, 9/1/27 | | 730 | 899,185 |
| Monroe County Industrial Development Corp., NY, (True North Rochester Preparatory Charter School), 5.00%, 6/1/40(1) | | 670 | 791,786 |
| Montgomery County Industrial Development Authority, PA, (Germantown Academy), 4.00%, 10/1/36 | | 450 | 496,822 |
| New York Dormitory Authority, (Cornell University), Green Bonds, 5.00%, 7/1/26 | | 500 | 598,310 |
| Ohio State University, 5.00%, 12/1/29 | | 1,915 | 2,496,145 |
| Oregon Health and Science University: | | | |
| Green Bonds, 5.00%, 7/1/33 | | 1,210 | 1,632,169 |
| Green Bonds, 5.00%, 7/1/34 | | 1,300 | 1,742,741 |
| Pennsylvania Higher Educational Facilities Authority, (State System of Higher Education), 4.00%, 6/15/36 | | 1,550 | 1,729,118 |
| Public Finance Authority, WI, (Coral Academy of Science Las Vegas): | | | |
| 4.00%, 7/1/24 | | 300 | 319,593 |
| 4.00%, 7/1/31 | | 325 | 366,363 |
| 4.00%, 7/1/41 | | 1,000 | 1,107,910 |
| University of Arizona, Green Bonds, 5.00%, 6/1/42 | | 2,000 | 2,355,600 |
| | | | $ 44,590,871 |
| Electric Utilities — 1.1% | |
| Mesa, AZ, Utility Systems Revenue, 5.00%, 7/1/31 | $ | 1,000 | $ 1,245,720 |
| Southern California Public Power Authority, Green Bonds, 5.00%, 7/1/30 | | 1,500 | 1,630,650 |
| Trinity Public Utilities District Authority, CA, Green Bonds, 4.00%, 4/1/29 | | 1,120 | 1,271,189 |
| Utah Associated Municipal Power Systems, 5.00%, 9/1/30 | | 655 | 794,685 |
| | | | $ 4,942,244 |
| Escrowed/Prerefunded — 3.1% | |
| Aurora, CO, Water Revenue, Green Bonds, Prerefunded to 8/1/26, 5.00%, 8/1/31 | $ | 2,000 | $ 2,400,520 |
| Build NYC Resource Corp., NY, (YMCA of Greater New York), Prerefunded to 8/1/25, 4.00%, 8/1/36 | | 1,915 | 2,147,290 |
8
See Notes to Financial Statements.
Calvert
Responsible Municipal Income Fund
December 31, 2021
Schedule of Investments — continued
| Security | Principal
Amount
(000's omitted) | Value |
| Escrowed/Prerefunded (continued) | |
| Central Puget Sound Regional Transit Authority, WA, Sales Tax Revenue: | | | |
| Green Bonds, Prerefunded to 11/1/25, 4.00%, 11/1/33 | $ | 1,100 | $ 1,246,652 |
| Green Bonds, Prerefunded to 11/1/25, 5.00%, 11/1/35 | | 1,000 | 1,171,180 |
| Green Bonds, Prerefunded to 11/1/25, 5.00%, 11/1/45 | | 2,500 | 2,927,950 |
| Massachusetts Water Resources Authority, Green Bonds, Prerefunded to 8/1/26, 5.00%, 8/1/40 | | 1,000 | 1,200,260 |
| Ohio State University, Escrowed to Maturity, 5.00%, 12/1/29 | | 85 | 110,975 |
| Rhode Island Clean Water Finance Agency, (Water Pollution Control Revolving Fund): | | | |
| Prerefunded to 10/1/23, 5.00%, 10/1/30 | | 1,000 | 1,082,240 |
| Prerefunded to 10/1/23, 5.00%, 10/1/31 | | 1,000 | 1,082,240 |
| | | | $ 13,369,307 |
| General Obligations — 16.5% | |
| Bexar County, TX, Prerefunded to 6/15/25, 4.00%, 6/15/32 | $ | 2,000 | $ 2,243,780 |
| California: | | | |
| 4.00%, 9/1/32 | | 1,000 | 1,146,470 |
| Green Bonds, 3.75%, 10/1/37 | | 1,000 | 1,073,180 |
| Comal Independent School District, TX, (PSF Guaranteed), 5.00%, 2/1/28 | | 2,000 | 2,493,940 |
| Connecticut, Green Bonds, 5.00%, 11/15/31 | | 1,000 | 1,124,810 |
| Desert Sands Unified School District, CA, (Election of 2014), 5.00%, 8/1/39 | | 2,000 | 2,436,200 |
| Fort Bend Independent School District, TX, (PSF Guaranteed), 5.00%, 8/15/26 | | 750 | 899,392 |
| Franklin Regional School District, PA, 5.00%, 5/1/27 | | 100 | 121,974 |
| Fremont Union High School District, CA, 4.00%, 8/1/36 | | 1,500 | 1,756,200 |
| Hampton, VA, Green Bonds, 3.00%, 9/1/34 | | 500 | 558,505 |
| Hawaii, 4.00%, 10/1/34 | | 2,000 | 2,281,300 |
| Johnson County Unified School District No. 229, KS, 3.00%, 10/1/28 | | 2,000 | 2,273,840 |
| Lake Stevens School District No. 4, WA, 4.00%, 12/1/35 | | 2,460 | 2,775,003 |
| Los Rios Community College District, CA, 4.00%, 8/1/33 | | 2,000 | 2,307,820 |
| Massachusetts, Green Bonds, 5.00%, 4/1/37 | | 2,000 | 2,430,840 |
| Matanuska-Susitna Borough, AK, 4.50%, 7/1/29 | | 1,670 | 1,942,010 |
| Mesa Unified School District No. 4, AZ, 5.00%, 7/1/27 | | 1,000 | 1,227,600 |
| Milwaukee Metropolitan Sewerage District, WI, Green Bonds, 4.00%, 10/1/30 | | 3,615 | 4,408,276 |
| New York, NY, 5.00%, 8/1/26 | | 2,000 | 2,190,720 |
| North East Independent School District, TX, (PSF Guaranteed), 5.25%, 2/1/26 | | 1,000 | 1,189,350 |
| North St. Paul-Maplewood-Oakdale Independent School District No. 622, MN: | | | |
| 4.00%, 2/1/31 | | 1,000 | 1,165,260 |
| 5.00%, 2/1/33 | | 650 | 795,496 |
| Security | Principal
Amount
(000's omitted) | Value |
| General Obligations (continued) | |
| Northside Independent School District, TX: | | | |
| (PSF Guaranteed), 4.00%, 8/1/31 | $ | 930 | $ 1,125,114 |
| (PSF Guaranteed), 4.00%, 8/1/32 | | 400 | 481,868 |
| Oxnard Union High School District, CA, (Election of 2018), 4.00%, 8/1/37 | | 2,000 | 2,361,960 |
| Passaic County Improvement Authority, NJ, (Paterson Board of Education): | | | |
| Green Bonds, 3.00%, 2/1/42 | | 1,175 | 1,283,382 |
| Green Bonds, 4.00%, 2/1/32 | | 300 | 362,016 |
| Green Bonds, 4.00%, 2/1/33 | | 250 | 301,122 |
| Phoenix Union High School District No. 210, AZ, 5.00%, 7/1/25 | | 2,750 | 3,183,785 |
| Salem-Keizer School District No. 24J, OR, 4.00%, 6/15/37 | | 5,000 | 6,038,700 |
| San Diego Unified School District, CA, (Election of 2012), Green Bonds, 5.00%, 7/1/30 | | 2,000 | 2,461,240 |
| San Francisco Bay Area Rapid Transit District, CA, (Election of 2004), Green Bonds, 3.00%, 8/1/38 | | 3,235 | 3,549,863 |
| San Francisco Bay Area Rapid Transit District, CA, (Election of 2016): | | | |
| Green Bonds, 5.00%, 8/1/33 | | 1,000 | 1,227,860 |
| Green Bonds, 5.00%, 8/1/35 | | 1,120 | 1,455,552 |
| Spring Branch Independent School District, TX, (PSF Guaranteed), 5.00%, 2/1/27 | | 1,725 | 2,093,546 |
| West Haven, CT: | | | |
| 4.00%, 9/15/24 | | 260 | 283,143 |
| 4.00%, 9/15/25 | | 255 | 284,718 |
| 4.00%, 9/15/26 | | 255 | 290,343 |
| 4.00%, 9/15/27 | | 245 | 283,286 |
| Will County, IL: | | | |
| Green Bonds, 5.00%, 11/15/26 | | 450 | 541,120 |
| Green Bonds, 5.00%, 11/15/28 | | 1,000 | 1,265,850 |
| Green Bonds, 5.00%, 11/15/29 | | 900 | 1,164,132 |
| Wyandotte County Unified School District No. 203, KS, 4.00%, 9/1/23 | | 1,545 | 1,638,333 |
| Ypsilanti Community Schools, MI, 5.00%, 5/1/30 | | 1,000 | 1,181,800 |
| | | | $ 71,700,699 |
| Hospital — 6.3% | |
| DuBois Hospital Authority, PA, (Penn Highlands Healthcare): | | | |
| 5.00%, 7/15/32 | $ | 820 | $ 1,069,108 |
| 5.00%, 7/15/34 | | 890 | 1,155,861 |
| 5.00%, 7/15/35 | | 930 | 1,205,717 |
| 5.00%, 7/15/36 | | 500 | 646,855 |
| Idaho Health Facilities Authority, (St. Luke's Health System): | | | |
| 4.00%, 3/1/39 | | 710 | 848,230 |
| 4.00%, 3/1/40 | | 845 | 1,007,620 |
| 4.00%, 3/1/41 | | 805 | 957,491 |
9
See Notes to Financial Statements.
Calvert
Responsible Municipal Income Fund
December 31, 2021
Schedule of Investments — continued
| Security | Principal
Amount
(000's omitted) | Value |
| Hospital (continued) | |
| Indiana Finance Authority, (Good Samaritan Hospital): | | | |
| 4.00%, 4/1/35(2) | $ | 1,205 | $ 1,389,269 |
| 4.00%, 4/1/36(2) | | 2,520 | 2,902,435 |
| Massachusetts Development Finance Agency, (Dana-Farber Cancer Institute), 5.00%, 12/1/34 | | 500 | 595,115 |
| Michigan Finance Authority, (Beaumont Health Credit Group), 4.00%, 11/1/46 | | 2,000 | 2,191,480 |
| New York City Health and Hospitals Corp., NY: | | | |
| 4.00%, 2/15/27 | | 2,250 | 2,617,110 |
| 4.00%, 2/15/28 | | 4,700 | 5,565,411 |
| New York Dormitory Authority, (Memorial Sloan Kettering Cancer Center), 4.00%, 7/1/31 | | 2,000 | 2,418,960 |
| Ohio, (Cleveland Clinic Health System), 5.00%, 1/1/27 | | 2,315 | 2,799,182 |
| | | | $ 27,369,844 |
| Housing — 7.3% | |
| California Municipal Finance Authority, (Caritas Corp.), Mobile Home Park Revenue, 5.00%, 8/15/28 | $ | 1,240 | $ 1,480,262 |
| Cuyahoga Metropolitan Housing Authority, OH, 2.00%, 12/1/31 | | 1,250 | 1,263,750 |
| Independent Cities Finance Authority, CA, (Castle Mobile Estates): | | | |
| 3.00%, 5/15/22 | | 170 | 171,537 |
| 3.00%, 5/15/23 | | 170 | 175,374 |
| 3.00%, 5/15/24 | | 175 | 184,377 |
| 3.00%, 5/15/25 | | 185 | 198,033 |
| 3.00%, 5/15/26 | | 190 | 206,439 |
| 3.00%, 5/15/31 | | 500 | 547,245 |
| Independent Cities Finance Authority, CA, (Union City Tropics), Mobile Home Park Revenue: | | | |
| 4.00%, 5/15/31 | | 1,020 | 1,176,682 |
| 4.00%, 5/15/34 | | 1,145 | 1,309,307 |
| Independent Cities Finance Authority, CA, (Vista de Santa Barbara Mobilehome Park): | | | |
| 3.00%, 9/15/26 | | 270 | 295,577 |
| 3.00%, 9/15/27 | | 275 | 304,617 |
| 3.00%, 9/15/28 | | 285 | 317,960 |
| 3.00%, 9/15/29 | | 295 | 331,014 |
| Maryland Community Development Administration, Department of Housing and Community Development: | | | |
| 4.05%, 7/1/40 | | 1,575 | 1,673,642 |
| 4.35%, 7/1/50 | | 1,000 | 1,062,890 |
| Massachusetts Housing Finance Agency, (AMT), 3.30%, 12/1/28 | | 750 | 785,520 |
| New York City Housing Development Corp., NY: | | | |
| 0.90% to 1/1/26 (Put Date), 11/1/60 | | 4,000 | 3,999,080 |
| 3.80%, 11/1/30 | | 1,000 | 1,053,090 |
| Sustainable Development Bonds, 1.70%, 5/1/32 | | 2,100 | 2,097,606 |
| Security | Principal
Amount
(000's omitted) | Value |
| Housing (continued) | |
| New York City Housing Development Corp., NY: (continued) | | | |
| Sustainable Development Bonds, 1.75%, 11/1/32 | $ | 1,060 | $ 1,061,548 |
| New York Housing Finance Agency: | | | |
| Sustainability Bonds, (FHLMC / FNMA / SONYMA), 2.85%, 11/1/39 | | 2,000 | 2,096,260 |
| Sustainability Bonds, (SONYMA), 0.75%, 11/1/25 | | 3,000 | 3,000,030 |
| Pennsylvania Housing Finance Agency, SFMR: | | | |
| 3.90%, 10/1/35 | | 945 | 979,625 |
| (AMT), Social Bonds, 5.00%, 4/1/24 | | 700 | 766,731 |
| (AMT), Social Bonds, 5.00%, 10/1/24 | | 1,000 | 1,113,720 |
| (AMT), Social Bonds, 5.00%, 4/1/25 | | 500 | 566,100 |
| (AMT), Social Bonds, 5.00%, 10/1/25 | | 500 | 575,070 |
| Social Bonds, 0.95%, 10/1/28 | | 1,125 | 1,100,239 |
| Public Finance Authority, WI, (NC A&T Real Estate Foundation, LLC): | | | |
| 5.00%, 6/1/28 | | 665 | 805,335 |
| 5.00%, 6/1/29 | | 365 | 450,217 |
| Utah Housing Corp., 4.00%, 1/1/36 | | 770 | 802,509 |
| | | | $ 31,951,386 |
| Industrial Development Revenue — 0.9% | |
| California Pollution Control Financing Authority, (Waste Management, Inc.), (AMT), 3.00%, 11/1/25 | $ | 850 | $ 922,309 |
| National Finance Authority, NH, (Covanta), (AMT), Green Bonds, 3.75% to 7/2/40 (Put Date), 7/1/45(1) | | 1,955 | 2,059,671 |
| Nez Perce County, ID, (Potlatch Corp.), 2.75%, 10/1/24 | | 1,000 | 1,054,720 |
| | | | $ 4,036,700 |
| Insured - Education — 1.0% | |
| University of Oklahoma: | | | |
| (AGM), 5.00%, 7/1/28 | $ | 1,350 | $ 1,696,680 |
| (AGM), 5.00%, 7/1/29 | | 900 | 1,157,490 |
| (AGM), 5.00%, 7/1/30 | | 1,000 | 1,314,950 |
| | | | $ 4,169,120 |
| Insured - General Obligations — 0.5% | |
| Connecticut, (AGM), 5.00%, 10/15/27 | $ | 1,155 | $ 1,394,859 |
| Long Beach Unified School District, CA, (AGC), 0.00%, 8/1/25 | | 1,000 | 972,500 |
| | | | $ 2,367,359 |
| Insured - Housing — 0.3% | |
| California Municipal Finance Authority, (CHF-Davis II, LLC - Orchard Park Student Housing): | | | |
| (BAM), Green Bonds, 5.00%, 5/15/25 | $ | 350 | $ 400,085 |
| (BAM), Green Bonds, 5.00%, 5/15/27 | | 450 | 544,711 |
| (BAM), Green Bonds, 5.00%, 5/15/29 | | 350 | 443,209 |
| | | | $ 1,388,005 |
10
See Notes to Financial Statements.
Calvert
Responsible Municipal Income Fund
December 31, 2021
Schedule of Investments — continued
| Security | Principal
Amount
(000's omitted) | Value |
| Insured - Solid Waste — 0.3% | |
| South Bayside Waste Management Authority, CA, (Shoreway Environmental Center): | | | |
| (AGM), (AMT), Green Bonds, 5.00%, 9/1/28 | $ | 15 | $ 18,834 |
| (AGM), (AMT), Green Bonds, 5.00%, 9/1/28 | | 485 | 605,993 |
| (AGM), (AMT), Green Bonds, 5.00%, 9/1/30 | | 15 | 19,229 |
| (AGM), (AMT), Green Bonds, 5.00%, 9/1/30 | | 485 | 612,327 |
| | | | $ 1,256,383 |
| Insured - Special Tax Revenue — 0.1% | |
| Martha's Vineyard Land Bank, (BAM), Green Bonds, 5.00%, 5/1/32 | $ | 400 | $ 481,564 |
| | | | $ 481,564 |
| Insured - Transportation — 0.3% | |
| Ohio, (Portsmouth Gateway Group, LLC), (AGM), (AMT), 5.00%, 12/31/30 | $ | 1,000 | $ 1,129,000 |
| | | | $ 1,129,000 |
| Insured - Water and Sewer — 0.3% | |
| Bloomington, IN, Sewage Works Revenue: | | | |
| (BAM), Green Bonds, 2.00%, 1/1/27 | $ | 100 | $ 104,778 |
| (BAM), Green Bonds, 4.00%, 1/1/29 | | 500 | 593,710 |
| (BAM), Green Bonds, 4.00%, 1/1/31 | | 500 | 609,010 |
| | | | $ 1,307,498 |
| Lease Revenue/Certificates of Participation — 1.5% | |
| Connecticut Health and Educational Facilities Authority, (State Supported Child Care): | | | |
| 5.00%, 7/1/25 | $ | 300 | $ 345,066 |
| 5.00%, 7/1/26 | | 435 | 515,640 |
| 5.00%, 7/1/27 | | 255 | 310,126 |
| Kansas City, MO, Special Obligation Bonds: | | | |
| 4.00%, 10/1/34 | | 500 | 554,695 |
| 4.00%, 10/1/35 | | 600 | 664,476 |
| New Jersey Economic Development Authority, (School Facilities Construction): | | | |
| Social Bonds, 5.00%, 6/15/26 | | 555 | 655,594 |
| Social Bonds, 5.00%, 6/15/27 | | 410 | 497,744 |
| University of Mississippi Educational Building Corp., 5.00%, 10/1/28 | | 1,000 | 1,258,510 |
| University of North Dakota, Certificates of Participation, Green Certificates, 5.00%, 4/1/48 | | 1,500 | 1,815,360 |
| | | | $ 6,617,211 |
| Other Revenue — 5.8% | |
| Battery Park City Authority, NY: | | | |
| 5.00%, 11/1/39 | $ | 200 | $ 257,720 |
| Security | Principal
Amount
(000's omitted) | Value |
| Other Revenue (continued) | |
| Battery Park City Authority, NY: (continued) | | | |
| Sustainability Bonds, 5.00%, 11/1/49 | $ | 3,250 | $ 4,137,542 |
| California Community Choice Financing Authority, Green Bonds, 4.00%, 10/1/52 | | 2,000 | 2,309,900 |
| California Infrastructure and Economic Development Bank, Prerefunded to 10/1/25, 5.00%, 10/1/34 | | 2,000 | 2,343,740 |
| California Infrastructure and Economic Development Bank, (California Academy of Sciences), 0.45%, (SIFMA + 0.35%), 8/1/24 (Put Date), 8/1/47(3) | | 2,630 | 2,637,811 |
| Chester County Industrial Development Authority, PA, (Longwood Gardens, Inc.), Sustainability Bonds, 4.00%, 12/1/25 | | 310 | 346,859 |
| Connecticut Health and Educational Facilities Authority, (State Supported Child Care), 4.00%, 7/1/38 | | 1,170 | 1,250,215 |
| Fairfax County Economic Development Authority, VA, (National Wildlife Federation): | | | |
| Green Bonds, 5.00%, 9/1/34 | | 1,310 | 1,620,955 |
| Green Bonds, 5.00%, 9/1/36 | | 1,445 | 1,780,168 |
| Illinois Educational Facilities Authority, (Field Museum of Natural History): | | | |
| 4.00%, 11/1/36 | | 1,000 | 1,147,400 |
| 4.45%, 11/1/36 | | 1,000 | 1,152,250 |
| Massachusetts Water Pollution Abatement Trust, 5.25%, 8/1/29 | | 1,000 | 1,316,780 |
| New York City Trust for Cultural Resources, NY, (Whitney Museum of American Art), Green Bonds, 5.00%, 7/1/31 | | 3,750 | 5,048,100 |
| | | | $ 25,349,440 |
| Senior Living/Life Care — 0.5% | |
| Vermont Economic Development Authority, (Wake Robin Corp.), 5.00%, 5/1/24 | $ | 1,875 | $ 2,029,725 |
| | | | $ 2,029,725 |
| Special Tax Revenue — 6.9% | |
| Allegheny County Port Authority, PA, 5.00%, 3/1/27 | $ | 10,000 | $ 12,040,900 |
| Los Angeles County Metropolitan Transportation Authority, CA, Sales Tax Revenue, Green Bonds, 5.00%, 7/1/39 | | 2,000 | 2,506,640 |
| Massachusetts Bay Transportation Authority, Sales Tax Revenue: | | | |
| 5.00%, 7/1/26 | | 1,000 | 1,194,660 |
| 5.00%, 7/1/28 | | 1,000 | 1,262,550 |
| 5.00%, 7/1/31 | | 1,000 | 1,348,290 |
| Massachusetts School Building Authority, Social Bonds, 5.00%, 8/15/35 | | 1,500 | 1,967,955 |
| Metropolitan Transportation Authority, NY, Dedicated Tax Revenue: | | | |
| Green Bonds, Series 2017A, 5.00%, 11/15/35 | | 1,000 | 1,202,200 |
| Green Bonds, Series 2017B, 5.00%, 11/15/35 | | 2,275 | 2,776,524 |
11
See Notes to Financial Statements.
Calvert
Responsible Municipal Income Fund
December 31, 2021
Schedule of Investments — continued
| Security | Principal
Amount
(000's omitted) | Value |
| Special Tax Revenue (continued) | |
| New York Dormitory Authority, Personal Income Tax Revenue, 5.00%, 8/15/29 | $ | 1,000 | $ 1,000,800 |
| Regional Transportation District, CO, Sales Tax Revenue: | | | |
| 5.00%, 11/1/32 | | 1,000 | 1,376,670 |
| Green Bonds, 5.00%, 11/1/28 | | 2,500 | 3,173,125 |
| | | | $ 29,850,314 |
| Transportation — 0.4% | |
| Washington Metropolitan Area Transit Authority, D.C., Green Bonds, 5.00%, 7/15/30 | $ | 1,250 | $ 1,655,812 |
| | | | $ 1,655,812 |
| Water and Sewer — 9.1% | |
| Austin, TX, Water & Wastewater System Revenue, 5.00%, 11/15/33 | $ | 2,000 | $ 2,459,780 |
| Cary, NC, Combined Enterprise System Revenue, 5.00%, 12/1/24 | | 1,745 | 1,978,935 |
| Cleveland, OH, Water Revenue: | | | |
| 5.00%, 1/1/27 | | 150 | 181,783 |
| 5.00%, 1/1/28 | | 770 | 929,405 |
| Dallas, TX, Waterworks and Sewer System Revenue, 4.00%, 10/1/35 | | 1,000 | 1,222,190 |
| Denver City and County Board of Water Commissioners, CO, 4.00%, 9/15/33 | | 3,000 | 3,695,850 |
| District of Columbia Water and Sewer Authority, 5.00%, 10/1/26 | | 500 | 603,515 |
| East Baton Rouge Sewerage Commission, LA, 4.00%, 2/1/35 | | 1,000 | 1,187,030 |
| East Bay Municipal Utility District, CA, Water System Revenue: | | | |
| Green Bonds, 5.00%, 6/1/35 | | 1,000 | 1,224,850 |
| Green Bonds, 5.00%, 6/1/36 | | 1,650 | 2,124,771 |
| Greensboro, NC, Combined Enterprise System Revenue, 4.00%, 6/1/34 | | 500 | 612,845 |
| Indiana Finance Authority, (CWA Authority): | | | |
| Green Bonds, 5.00%, 10/1/27 | | 615 | 761,112 |
| Green Bonds, 5.00%, 10/1/28 | | 765 | 967,886 |
| Green Bonds, 5.00%, 10/1/30 | | 1,000 | 1,198,530 |
| Green Bonds, 5.00%, 10/1/34 | | 300 | 393,669 |
| Green Bonds, 5.00%, 10/1/35 | | 425 | 556,074 |
| Green Bonds, 5.00%, 10/1/36 | | 1,000 | 1,195,750 |
| Kansas City, MO, Water Revenue, 4.00%, 12/1/33 | | 870 | 1,066,194 |
| Los Angeles, CA, Wastewater System Revenue: | | | |
| Green Bonds, 5.00%, 6/1/34 | | 1,000 | 1,249,560 |
| Green Bonds, 5.00%, 6/1/38 | | 2,000 | 2,431,920 |
| Lubbock,TX, Water and Wastewater System Revenue: | | | |
| 4.00%, 2/15/30 | | 650 | 775,807 |
| 4.00%, 2/15/31 | | 435 | 516,006 |
| Security | Principal
Amount
(000's omitted) | Value |
| Water and Sewer (continued) | |
| Lubbock,TX, Water and Wastewater System Revenue: (continued) | | | |
| 4.00%, 2/15/32 | $ | 325 | $ 385,736 |
| 4.00%, 2/15/33 | | 200 | 236,986 |
| 5.00%, 2/15/25 | | 300 | 341,931 |
| 5.00%, 2/15/26 | | 400 | 471,588 |
| Massachusetts Water Resources Authority, Green Bonds, 5.00%, 8/1/32 | | 1,500 | 1,841,100 |
| Metropolitan Water District of Southern California, 0.24%, (SIFMA + 0.14%), 5/21/24 (Put Date), 7/1/37(3) | | 3,335 | 3,333,733 |
| Northern Kentucky Water District, 4.00%, 2/1/29 | | 1,565 | 1,853,539 |
| Pennsylvania Economic Development Financing Authority, (Pennsylvania-American Water Co.), 3.00%, 4/1/39 | | 2,500 | 2,709,275 |
| Trinity River Authority, TX, (Mountain Creek Regional Wastewater System), 4.00%, 8/1/33 | | 1,000 | 1,229,110 |
| | | | $ 39,736,460 |
Total Tax-Exempt Municipal Obligations
(identified cost $364,490,908) | | | $378,207,548 |
| Taxable Municipal Obligations — 5.7% |
| Security | Principal
Amount
(000's omitted) | Value |
| Education — 0.9% | |
| San Antonio Education Facilities Corp., TX, (University of the Incarnate Word): | | | |
| 1.74%, 4/1/25 | $ | 600 | $ 592,548 |
| 1.99%, 4/1/26 | | 550 | 542,817 |
| 2.19%, 4/1/27 | | 600 | 591,594 |
| 2.38%, 4/1/28 | | 1,190 | 1,173,400 |
| 2.50%, 4/1/29 | | 1,000 | 989,000 |
| | | | $ 3,889,359 |
| Electric Utilities — 0.4% | |
| Confederated Tribes of Warm Springs Reservation, OR, (Pelton-Round Butte Hydroelectric Project): | | | |
| Green Bonds, 2.015%, 11/1/25(1) | $ | 745 | $ 744,158 |
| Green Bonds, 2.52%, 11/1/28(1) | | 1,205 | 1,210,579 |
| | | | $ 1,954,737 |
| General Obligations — 1.0% | |
| Detroit, MI: | | | |
| Social Bonds, 1.817%, 4/1/22 | $ | 800 | $ 800,920 |
| Social Bonds, 2.017%, 4/1/23 | | 375 | 376,384 |
| Social Bonds, 2.189%, 4/1/24 | | 400 | 399,884 |
12
See Notes to Financial Statements.
Calvert
Responsible Municipal Income Fund
December 31, 2021
Schedule of Investments — continued
| Security | Principal
Amount
(000's omitted) | Value |
| General Obligations (continued) | |
| Larkspur-Corte Madera School District, CA, (Election of 2011 and 2014): | | | |
| 1.702%, 8/1/30 | $ | 415 | $ 411,580 |
| 1.802%, 8/1/31 | | 400 | 397,952 |
| 1.902%, 8/1/32 | | 1,100 | 1,099,054 |
| Tustin Unified School District, CA: | | | |
| 1.345%, 8/1/28 | | 280 | 275,405 |
| 1.554%, 8/1/29 | | 535 | 530,549 |
| | | | $ 4,291,728 |
| Hospital — 0.9% | |
| University of Wisconsin Hospitals and Clinics Authority: | | | |
| 1.05%, 4/1/24 | $ | 1,250 | $ 1,245,288 |
| 1.47%, 4/1/25 | | 1,000 | 997,220 |
| 1.89%, 4/1/27 | | 1,255 | 1,258,338 |
| 2.09%, 4/1/28 | | 590 | 593,664 |
| | | | $ 4,094,510 |
| Housing — 0.1% | |
| Independent Cities Finance Authority, CA, (Sahara Mobile Home Park), 2.51%, 6/15/31 | $ | 500 | $ 499,045 |
| | | | $ 499,045 |
| Insured - Housing — 0.2% | |
| Oregon Facilities Authority, (CHF-Ashland, LLC - Southern Oregon University): | | | |
| (AGM), 1.509%, 7/1/25 | $ | 150 | $ 148,320 |
| (AGM), 2.005%, 7/1/27 | | 185 | 183,115 |
| (AGM), 2.429%, 7/1/29 | | 275 | 274,453 |
| (AGM), 2.679%, 7/1/31 | | 350 | 349,989 |
| | | | $ 955,877 |
| Other Revenue — 0.6% | |
| Utah Transit Authority, Sales Tax Revenue, Green Bonds, 1.72%, 12/15/27 | $ | 2,500 | $ 2,514,400 |
| | | | $ 2,514,400 |
| Senior Living/Life Care — 0.1% | |
| California Public Finance Authority, (Enso Village), Green Bonds, 2.875%, 5/15/27(1) | $ | 350 | $ 352,807 |
| | | | $ 352,807 |
| Special Tax Revenue — 1.3% | |
| California Health Facilities Financing Authority, (No Place Like Home Program): | | | |
| 2.02%, 6/1/24 | $ | 1,000 | $ 1,021,960 |
| 2.211%, 6/1/25 | | 1,500 | 1,543,995 |
| Security | Principal
Amount
(000's omitted) | Value |
| Special Tax Revenue (continued) | |
| California Health Facilities Financing Authority, (No Place Like Home Program): (continued) | | | |
| 2.361%, 6/1/26 | $ | 2,000 | $ 2,072,580 |
| Massachusetts Bay Transportation Authority, Sales Tax Revenue, 0.99%, 7/1/25 | | 1,135 | 1,124,501 |
| | | | $ 5,763,036 |
| Water and Sewer — 0.2% | |
| Narragansett Bay Commission, RI, Wastewater System Revenue, Green Bonds, 1.497%, 9/1/24 | $ | 660 | $ 665,075 |
| | | | $ 665,075 |
Total Taxable Municipal Obligations
(identified cost $24,895,597) | | | $ 24,980,574 |
| Short-Term Investments — 3.0% | | | |
| Description | Units | Value |
| Calvert Cash Reserves Fund, LLC, 0.06%(4) | | 13,043,583 | $ 13,043,583 |
Total Short-Term Investments
(identified cost $13,043,287) | | | $ 13,043,583 |
Total Investments — 100.0%
(identified cost $420,494,430) | | | $434,682,028 |
| Other Assets, Less Liabilities — 0.0%(5) | | | $ 81,971 |
| Net Assets — 100.0% | | | $434,763,999 |
| The percentage shown for each investment category in the Schedule of Investments is based on net assets. |
| (1) | Security exempt from registration under Rule 144A of the Securities Act of 1933, as amended. These securities may be sold in certain transactions in reliance on an exemption from registration (normally to qualified institutional buyers). At December 31, 2021, the aggregate value of these securities is $7,594,286 or 1.7% of the Fund's net assets. |
| (2) | When-issued security. |
| (3) | Floating rate security. The stated interest rate represents the rate in effect at December 31, 2021. |
| (4) | Affiliated investment company, available to Calvert portfolios and funds, which invests in high quality, U.S. dollar denominated money market instruments. The rate shown is the annualized seven-day yield as of December 31, 2021. |
| (5) | Amount is less than 0.05%. |
13
See Notes to Financial Statements.
Calvert
Responsible Municipal Income Fund
December 31, 2021
Schedule of Investments — continued
| At December 31, 2021, the concentration of the Fund's investments in the various states, determined as a percentage of net assets, is as follows: |
| California 16.6% |
| New York10.5% |
| Others, representing less than 10% individually67.4% |
| The Fund invests primarily in debt securities issued by municipalities. The ability of the issuers of the debt securities to meet their obligations may be affected by economic developments in a specific industry or municipality. At December 31, 2021, 3.0% of total investments are backed by bond insurance of various financial institutions and financial guaranty assurance agencies. The aggregate percentage insured by an individual financial institution or financial guaranty assurance agency ranged from 0.2% to 2.0% of total investments. |
Futures Contracts
| Description | Number of
Contracts | Position | Expiration
Date | Notional
Amount | Value/
Unrealized
Appreciation
(Depreciation) |
| Interest Rate Futures | | | | | |
| U.S. 10-Year Treasury Note | (94) | Short | 3/22/22 | $(12,264,063) | $ (136,770) |
| | | | | | $(136,770) |
| Abbreviations: |
| AGC | – Assured Guaranty Corp. |
| AGM | – Assured Guaranty Municipal Corp. |
| AMT | – Interest earned from these securities may be considered a tax preference item for purposes of the Federal Alternative Minimum Tax. |
| BAM | – Build America Mutual Assurance Co. |
| FHLMC | – Federal Home Loan Mortgage Corp. |
| FNMA | – Federal National Mortgage Association |
| PSF | – Permanent School Fund |
| SFMR | – Single Family Mortgage Revenue |
| SIFMA | – Securities Industry and Financial Markets Association Municipal Swap Index |
| SONYMA | – State of New York Mortgage Agency |
14
See Notes to Financial Statements.
Calvert
Responsible Municipal Income Fund
December 31, 2021
Statement of Assets and Liabilities
| | December 31, 2021 |
| Assets | |
| Investments in securities of unaffiliated issuers, at value (identified cost $407,451,143) | $ 421,638,445 |
| Investments in securities of affiliated issuers, at value (identified cost $13,043,287) | 13,043,583 |
| Deposits at broker for futures contracts | 141,099 |
| Receivable for investments sold | 30,000 |
| Receivable for capital shares sold | 1,176,463 |
| Interest receivable | 4,286,099 |
| Dividends receivable - affiliated | 698 |
| Receivable from affiliate | 40,184 |
| Trustees' deferred compensation plan | 129,704 |
| Total assets | $440,486,275 |
| Liabilities | |
| Payable for variation margin on open futures contracts | $ 23,521 |
| Payable for when-issued securities | 4,216,209 |
| Payable for capital shares redeemed | 981,742 |
| Distributions payable | 53,046 |
| Payable to affiliates: | |
| Investment advisory fee | 128,795 |
| Administrative fee | 44,158 |
| Distribution and service fees | 29,371 |
| Sub-transfer agency fee | 5,042 |
| Trustees' deferred compensation plan | 129,704 |
| Accrued expenses | 110,688 |
| Total liabilities | $ 5,722,276 |
| Net Assets | $434,763,999 |
| Sources of Net Assets | |
| Paid-in capital | $ 451,393,625 |
| Accumulated loss | (16,629,626) |
| Net Assets | $434,763,999 |
| Class A Shares | |
| Net Assets | $ 128,437,093 |
| Shares Outstanding | 7,695,053 |
Net Asset Value and Redemption Price Per Share
(net assets ÷ shares of beneficial interest outstanding) | $ 16.69 |
Maximum Offering Price Per Share
(100 ÷ 96.25 of net asset value per share) | $ 17.34 |
| Class C Shares | |
| Net Assets | $ 2,258,016 |
| Shares Outstanding | 135,282 |
Net Asset Value and Offering Price Per Share*
(net assets ÷ shares of beneficial interest outstanding) | $ 16.69 |
15
See Notes to Financial Statements.
Calvert
Responsible Municipal Income Fund
December 31, 2021
Statement of Assets and Liabilities — continued
| | December 31, 2021 |
| Class I Shares | |
| Net Assets | $304,068,890 |
| Shares Outstanding | 18,170,318 |
Net Asset Value, Offering Price and Redemption Price Per Share
(net assets ÷ shares of beneficial interest outstanding) | $ 16.73 |
| On sales of $50,000 or more, the offering price of Class A shares is reduced. |
| * | Redemption price per share is equal to the net asset value less any applicable contingent deferred sales charge. |
16
See Notes to Financial Statements.
Calvert
Responsible Municipal Income Fund
December 31, 2021
| | Year Ended |
| | December 31, 2021 |
| Investment Income | |
| Dividend income - affiliated issuers | $ 14,026 |
| Interest income | 7,150,682 |
| Total investment income | $ 7,164,708 |
| Expenses | |
| Investment advisory fee | $ 1,418,912 |
| Administrative fee | 486,484 |
| Distribution and service fees: | |
| Class A | 319,597 |
| Class C | 22,125 |
| Trustees' fees and expenses | 13,765 |
| Custodian fees | 8,059 |
| Transfer agency fees and expenses | 284,590 |
| Accounting fees | 91,458 |
| Professional fees | 37,788 |
| Registration fees | 74,713 |
| Reports to shareholders | 19,801 |
| Miscellaneous | 67,894 |
| Total expenses | $ 2,845,186 |
| Waiver and/or reimbursement of expenses by affiliate | $ (474,266) |
| Net expenses | $ 2,370,920 |
| Net investment income | $ 4,793,788 |
| Realized and Unrealized Gain (Loss) | |
| Net realized gain (loss): | |
| Investment securities | $ (196,132) |
| Investment securities - affiliated issuers | (4,308) |
| Futures contracts | 446,120 |
| Net realized gain | $ 245,680 |
| Change in unrealized appreciation (depreciation): | |
| Investment securities | $ (3,480,388) |
| Investment securities - affiliated issuers | 296 |
| Futures contracts | (136,972) |
| Net change in unrealized appreciation (depreciation) | $(3,617,064) |
| Net realized and unrealized loss | $(3,371,384) |
| Net increase in net assets from operations | $ 1,422,404 |
17
See Notes to Financial Statements.
Calvert
Responsible Municipal Income Fund
December 31, 2021
Statements of Changes in Net Assets
| | Year Ended December 31, |
| | 2021 | 2020 |
| Increase (Decrease) in Net Assets | | |
| From operations: | | |
| Net investment income | $ 4,793,788 | $ 4,108,085 |
| Net realized gain (loss) | 245,680 | (640,427) |
| Net change in unrealized appreciation (depreciation) | (3,617,064) | 8,938,905 |
| Net increase in net assets from operations | $ 1,422,404 | $ 12,406,563 |
| Distributions to shareholders: | | |
| Class A | $ (1,302,502) | $ (1,778,273) |
| Class C | (5,946) | (13,278) |
| Class I | (3,488,209) | (2,316,944) |
| Total distributions to shareholders | $ (4,796,657) | $ (4,108,495) |
| Capital share transactions: | | |
| Class A | $ 1,128,640 | $ 6,964,795 |
| Class C | 27,464 | 680,155 |
| Class I | 64,236,324 | 171,111,169 |
| Net increase in net assets from capital share transactions | $ 65,392,428 | $178,756,119 |
| Net increase in net assets | $ 62,018,175 | $187,054,187 |
| Net Assets | | |
| At beginning of year | $ 372,745,824 | $ 185,691,637 |
| At end of year | $434,763,999 | $372,745,824 |
18
See Notes to Financial Statements.
Calvert
Responsible Municipal Income Fund
December 31, 2021
| | Class A |
| | Year Ended December 31, |
| | 2021 | 2020 | 2019 | 2018 | 2017 |
| Net asset value — Beginning of year | $ 16.83 | $ 16.36 | $ 15.61 | $ 15.91 | $ 15.55 |
| Income (Loss) From Operations | | | | | |
| Net investment income(1) | $ 0.17 | $ 0.24 | $ 0.35 | $ 0.38 | $ 0.41 |
| Net realized and unrealized gain (loss) | (0.14) | 0.47 | 0.75 | (0.30) | 0.36 |
| Total income from operations | $ 0.03 | $ 0.71 | $ 1.10 | $ 0.08 | $ 0.77 |
| Less Distributions | | | | | |
| From net investment income | $ (0.17) | $ (0.24) | $ (0.35) | $ (0.38) | $ (0.41) |
| Total distributions | $ (0.17) | $ (0.24) | $ (0.35) | $ (0.38) | $ (0.41) |
| Net asset value — End of year | $ 16.69 | $ 16.83 | $ 16.36 | $ 15.61 | $ 15.91 |
| Total Return(2) | 0.19% | 4.38% | 7.10% | 0.54% | 5.00% |
| Ratios/Supplemental Data | | | | | |
| Net assets, end of year (000’s omitted) | $128,437 | $128,384 | $117,964 | $108,866 | $119,971 |
| Ratios (as a percentage of average daily net assets):(3) | | | | | |
| Total expenses | 0.87% | 0.88% | 0.96% | 0.95% | 0.94% |
| Net expenses | 0.75% | 0.75% | 0.77% | 0.80% | 0.80% |
| Net investment income | 1.02% | 1.45% | 2.15% | 2.44% | 2.61% |
| Portfolio Turnover | 18% | 14% | 18% | 9% | 27% |
| (1) | Computed using average shares outstanding. |
| (2) | Returns are historical and are calculated by determining the percentage change in net asset value with all distributions reinvested and do not reflect the effect of sales charges, if any. |
| (3) | Total expenses do not reflect amounts reimbursed and/or waived by the adviser and certain of its affiliates, if applicable. Net expenses are net of all reductions and represent the net expenses paid by the Fund. |
19
See Notes to Financial Statements.
Calvert
Responsible Municipal Income Fund
December 31, 2021
Financial Highlights — continued
| | Class C |
| | Year Ended December 31, |
| | 2021 | 2020 | 2019 | 2018 | 2017 |
| Net asset value — Beginning of year | $ 16.83 | $ 16.36 | $ 15.61 | $ 15.91 | $ 15.55 |
| Income (Loss) From Operations | | | | | |
| Net investment income(1) | $ 0.04 | $ 0.11 | $ 0.22 | $ 0.26 | $ 0.29 |
| Net realized and unrealized gain (loss) | (0.13) | 0.48 | 0.76 | (0.29) | 0.37 |
| Total income (loss) from operations | $ (0.09) | $ 0.59 | $ 0.98 | $ (0.03) | $ 0.66 |
| Less Distributions | | | | | |
| From net investment income | $ (0.05) | $ (0.12) | $ (0.23) | $ (0.27) | $ (0.30) |
| Total distributions | $ (0.05) | $ (0.12) | $ (0.23) | $ (0.27) | $ (0.30) |
| Net asset value — End of year | $16.69 | $16.83 | $16.36 | $15.61 | $15.91 |
| Total Return(2) | (0.56)% | 3.60% | 6.29% | (0.19)% | 4.25% |
| Ratios/Supplemental Data | | | | | |
| Net assets, end of year (000’s omitted) | $ 2,258 | $ 2,249 | $ 1,510 | $ 1,195 | $ 1,240 |
| Ratios (as a percentage of average daily net assets):(3) | | | | | |
| Total expenses | 1.62% | 1.62% | 1.71% | 1.69% | 2.87% |
| Net expenses | 1.50% | 1.50% | 1.51% | 1.55% | 1.55% |
| Net investment income | 0.27% | 0.67% | 1.37% | 1.69% | 1.84% |
| Portfolio Turnover | 18% | 14% | 18% | 9% | 27% |
| (1) | Computed using average shares outstanding. |
| (2) | Returns are historical and are calculated by determining the percentage change in net asset value with all distributions reinvested and do not reflect the effect of sales charges, if any. |
| (3) | Total expenses do not reflect amounts reimbursed and/or waived by the adviser and certain of its affiliates, if applicable. Net expenses are net of all reductions and represent the net expenses paid by the Fund. |
20
See Notes to Financial Statements.
Calvert
Responsible Municipal Income Fund
December 31, 2021
Financial Highlights — continued
| | Class I |
| | Year Ended December 31, |
| | 2021 | 2020 | 2019 | 2018 | 2017 |
| Net asset value — Beginning of year | $ 16.88 | $ 16.40 | $ 15.65 | $ 15.93 | $ 15.57 |
| Income (Loss) From Operations | | | | | |
| Net investment income(1) | $ 0.21 | $ 0.26 | $ 0.39 | $ 0.44 | $ 0.46 |
| Net realized and unrealized gain (loss) | (0.15) | 0.50 | 0.76 | (0.30) | 0.36 |
| Total income from operations | $ 0.06 | $ 0.76 | $ 1.15 | $ 0.14 | $ 0.82 |
| Less Distributions | | | | | |
| From net investment income | $ (0.21) | $ (0.28) | $ (0.40) | $ (0.42) | $ (0.46) |
| Total distributions | $ (0.21) | $ (0.28) | $ (0.40) | $ (0.42) | $ (0.46) |
| Net asset value — End of year | $ 16.73 | $ 16.88 | $ 16.40 | $ 15.65 | $ 15.93 |
| Total Return(2) | 0.38% | 4.69% | 7.38% | 0.92% | 5.35% |
| Ratios/Supplemental Data | | | | | |
| Net assets, end of year (000’s omitted) | $304,069 | $242,113 | $66,218 | $35,812 | $23,193 |
| Ratios (as a percentage of average daily net assets):(3) | | | | | |
| Total expenses | 0.62% | 0.63% | 0.71% | 0.69% | 0.76% |
| Net expenses | 0.50% | 0.50% | 0.49% | 0.45% | 0.45% |
| Net investment income | 1.27% | 1.59% | 2.39% | 2.79% | 2.93% |
| Portfolio Turnover | 18% | 14% | 18% | 9% | 27% |
| (1) | Computed using average shares outstanding. |
| (2) | Returns are historical and are calculated by determining the percentage change in net asset value with all distributions reinvested and do not reflect the effect of sales charges, if any. |
| (3) | Total expenses do not reflect amounts reimbursed and/or waived by the adviser and certain of its affiliates, if applicable. Net expenses are net of all reductions and represent the net expenses paid by the Fund. |
21
See Notes to Financial Statements.
Calvert
Responsible Municipal Income Fund
December 31, 2021
Notes to Financial Statements
1 Significant Accounting Policies
Calvert Responsible Municipal Income Fund (the Fund) is a diversified series of Calvert Management Series (the Trust). The Trust is a Massachusetts business trust registered under the Investment Company Act of 1940, as amended (the 1940 Act), as an open-end management investment company. The investment objective of the Fund is to provide current income exempt from regular federal income tax. The Fund invests primarily in municipal bonds whose issuers the investment adviser determines operate in a manner consistent with or promote the Calvert Principles for Responsible Investment.
The Fund offers three classes of shares. Class A shares are generally sold subject to a sales charge imposed at time of purchase. A contingent deferred sales charge of 0.80% may apply to certain redemptions of Class A shares for accounts for which no sales charge was paid, if redeemed within 12 months of purchase. Class C shares are sold without a front-end sales charge, and with certain exceptions, are charged a contingent deferred sales charge of 1% on shares redeemed within 12 months of purchase. Class C shares are only available for purchase through a financial intermediary. Effective January 25, 2019, Class C shares generally automatically convert to Class A shares ten years after their purchase and, effective November 5, 2020, automatically convert to Class A shares eight years after their purchase as described in the Fund's prospectus. Class I shares are sold at net asset value, are not subject to a sales charge and are sold only to certain eligible investors. Each class represents a pro rata interest in the Fund, but votes separately on class-specific matters and is subject to different expenses.
The Fund applies the accounting and reporting guidance in the Financial Accounting Standards Board (FASB) Accounting Standards Codification Topic 946, Financial Services – Investment Companies (ASC 946). Subsequent events, if any, through the date that the financial statements were issued have been evaluated in the preparation of the financial statements.
A Investment Valuation— Net asset value per share is determined every business day as of the close of the regular session of the New York Stock Exchange (generally 4:00 p.m. Eastern time). The Fund uses independent pricing services approved by the Board of Trustees (the Board) to value its investments wherever possible. Investments for which market quotations are not available or deemed not reliable are fair valued in good faith under the direction of the Board.
U.S. generally accepted accounting principles (U.S. GAAP) establishes a disclosure hierarchy that categorizes the inputs to valuation techniques used to value assets and liabilities at measurement date. These inputs are summarized in the three broad levels listed below:
Level 1 - quoted prices in active markets for identical securities
Level 2 - other significant observable inputs (including quoted prices for similar securities, interest rates, prepayment speeds, credit risk, etc.)
Level 3 - significant unobservable inputs (including the Fund’s own assumptions in determining the fair value of investments)
The inputs or methodologies used for valuing securities are not necessarily an indication of the risk associated with investing in those securities.
Valuation techniques used to value the Fund’s investments by major category are as follows:
Debt Securities. Debt securities are generally valued based on valuations provided by third party pricing services, as derived from such services’ pricing models. Inputs to the models may include, but are not limited to, reported trades, executable bid and ask prices, broker/dealer quotations, prices or yields of securities with similar characteristics, interest rates, anticipated prepayments, benchmark curves or information pertaining to the issuer, as well as industry and economic events. Accordingly, debt securities are generally categorized as Level 2 in the hierarchy. Short-term debt securities with a remaining maturity at time of purchase of more than sixty days are valued based on valuations provided by a third party pricing service. Such securities are generally categorized as Level 2 in the hierarchy. Short-term debt securities of sufficient credit quality purchased with remaining maturities of sixty days or less for which a valuation from a third party pricing service is not readily available may be valued at amortized cost, which approximates fair value, and are categorized as Level 2 in the hierarchy.
Affiliated Fund. The Fund may invest in Calvert Cash Reserves Fund, LLC (Cash Reserves Fund), an affiliated investment company managed by Calvert Research and Management (CRM). While Cash Reserves Fund is not a registered money market mutual fund, it conducts all of its investment activities in accordance with the requirements of Rule 2a-7 under the 1940 Act. Investments in Cash Reserves Fund are valued at the closing net asset value per unit on the valuation day and are categorized as Level 2 in the hierarchy. Cash Reserves Fund generally values its investment securities based on available market quotations provided by a third party pricing service.
Derivatives. Futures contracts are valued at unrealized appreciation (depreciation) based on the settlement price established each day by the board of trade or exchange on which they are traded and are categorized as Level 1 in the hierarchy.
Fair Valuation. If a market value cannot be determined for a security using the methodologies described above, or if, in the good faith opinion of the Fund's adviser, the market value does not constitute a readily available market quotation, or if a significant event has occurred that would materially affect the value of the security, the security will be fair valued as determined in good faith by or at the direction of the Board in a manner that most fairly reflects the security’s “fair value”, which is the amount that the Fund might reasonably expect to receive for the security upon its current sale in the ordinary course. Each such determination is based on a consideration of relevant factors, which are likely to vary from one pricing context to another. These factors may include, but are not limited to, the type of security, the existence of any contractual restrictions on the security’s disposition, the price and extent of public
Calvert
Responsible Municipal Income Fund
December 31, 2021
Notes to Financial Statements — continued
trading in similar securities of the issuer or of comparable companies or entities, quotations or relevant information obtained from broker/dealers or other market participants, information obtained from the issuer, analysts, and/or the appropriate stock exchange (for exchange-traded securities), an analysis of the company’s or entity’s financial statements, and an evaluation of the forces that influence the issuer and the market(s) in which the security is purchased and sold.
The values assigned to fair value investments are based on available information and do not necessarily represent amounts that might ultimately be realized. Further, due to the inherent uncertainty of valuations of such investments, the fair values may differ significantly from the values that would have been used had an active market existed, and the differences could be material.
The following table summarizes the market value of the Fund's holdings as of December 31, 2021, based on the inputs used to value them:
| Asset Description | Level 1 | Level 2 | Level 3 | Total |
| Corporate Bonds | $ — | $ 10,768,593 | $ — | $ 10,768,593 |
| Tax-Exempt Mortgage-Backed Securities | — | 7,681,730 | — | 7,681,730 |
| Tax-Exempt Municipal Obligations | — | 378,207,548 | — | 378,207,548 |
| Taxable Municipal Obligations | — | 24,980,574 | — | 24,980,574 |
| Short-Term Investments | — | 13,043,583 | — | 13,043,583 |
| Total Investments | $ — | $434,682,028 | $ — | $434,682,028 |
| Liability Description | | | | |
| Futures Contracts | $ (136,770) | $ — | $ — | $ (136,770) |
| Total | $(136,770) | $ — | $ — | $ (136,770) |
B Investment Transactions and Income— Investment transactions for financial statement purposes are accounted for on trade date. Realized gains and losses are recorded on an identified cost basis and may include proceeds from litigation. Dividend income is recorded on the ex-dividend date for dividends received in cash and/or securities. Interest income, which includes amortization of premium and accretion of discount on debt securities, is accrued as earned.
C Share Class Accounting— Realized and unrealized gains and losses are allocated daily to each class of shares based upon the relative net assets of each class to the total net assets of the Fund. Net investment income, other than class-specific expenses, is allocated daily to each class of shares based upon the ratio of the value of each class's paid shares to the total value of all paid shares. Expenses arising in connection with a specific class are charged directly to that class.
D Futures Contracts— The Fund may enter into futures contracts to buy or sell a financial instrument for a set price at a future date. Initial margin deposits of either cash or securities as required by the broker are made upon entering into the contract. While the contract is open, daily variation margin payments are made to or received from the broker reflecting the daily change in market value of the contract and are recorded for financial reporting purposes as unrealized gains or losses by the Fund. When a futures contract is closed, a realized gain or loss is recorded equal to the difference between the opening and closing value of the contract. The risks associated with entering into futures contracts may include the possible illiquidity of the secondary market which would limit the Fund’s ability to close out a futures contract prior to the settlement date, an imperfect correlation between the value of the contracts and the underlying financial instruments, or that the counterparty will fail to perform its obligations under the contracts’ terms. Futures contracts are designed by boards of trade, which are designated “contracts markets” by the Commodities Futures Trading Commission. Futures contracts trade on the contracts markets in a manner that is similar to the way a stock trades on a stock exchange, and the boards of trade, through their clearing corporations, guarantee the futures contracts against default. As a result, there is minimal counterparty credit risk to the Fund.
E Distributions to Shareholders— Distributions to shareholders are recorded by the Fund on ex-dividend date. The Fund declares income distributions daily to shareholders of record at the time of declaration and generally pays them monthly. The Fund makes distributions of net realized capital gains, if any, at least annually. Distributions are declared separately for each class of shares. Distributions are determined in accordance with income tax regulations, which may differ from U.S. GAAP; accordingly, periodic reclassifications are made within the Fund’s capital accounts to reflect income and gains available for distribution under income tax regulations.
F Estimates— The preparation of financial statements in conformity with U.S. GAAP requires management to make estimates and assumptions that affect the reported amounts of assets and liabilities and disclosure of contingent assets and liabilities at the date of the financial statements and the reported amounts of increases and decreases in net assets from operations during the reporting period. Actual results could differ from those estimates.
G Indemnifications— Under the Trust’s organizational document, its officers and Trustees may be indemnified against certain liabilities and expenses arising out of the performance of their duties to the Fund. Under Massachusetts law, if certain conditions prevail, shareholders of a Massachusetts business trust (such as the Trust) could be deemed to have personal liability for the obligations of the Trust. However, the Trust’s Declaration of Trust contains an
Calvert
Responsible Municipal Income Fund
December 31, 2021
Notes to Financial Statements — continued
express disclaimer of liability on the part of Fund shareholders and provides that the Trust shall assume, upon request by the shareholder, the defense on behalf of any Fund shareholders or former shareholders. Additionally, in the normal course of business, the Fund enters into agreements with service providers that may contain indemnification clauses. The Fund’s maximum exposure under these arrangements is unknown as this would involve future claims that may be made against the Fund that have not yet occurred.
H Federal Income Taxes— No provision for federal income or excise tax is required since the Fund intends to continue to qualify as a regulated investment company under the Internal Revenue Code and to distribute substantially all of its taxable earnings.
Management has analyzed the Fund's tax positions taken for all open federal income tax years and has concluded that no provision for federal income tax is required in the Fund's financial statements. A Fund's federal tax return is subject to examination by the Internal Revenue Service for a period of three years from the date of filing.
I When-Issued Securities and Delayed Delivery Transactions— The Fund may purchase securities on a delayed delivery or when-issued basis. Payment and delivery may take place after the customary settlement period for that security. At the time the transaction is negotiated, the price of the security that will be delivered is fixed. The Fund maintains cash and/or security positions for these commitments such that sufficient liquid assets will be available to make payments upon settlement. Securities purchased on a delayed delivery or when-issued basis are marked-to-market daily and begin earning interest on settlement date. Such security purchases are subject to the risk that when delivered they will be worth less than the agreed upon payment price. Losses may also arise if the counterparty does not perform under the contract.
2 Related Party Transactions
The investment advisory fee is earned by CRM as compensation for investment advisory services rendered to the Fund. On March 1, 2021, Morgan Stanley acquired Eaton Vance Corp. (the “Transaction”) and CRM became an indirect, wholly-owned subsidiary of Morgan Stanley. In connection with the Transaction, the Fund entered into a new investment advisory agreement (the “New Agreement”) with CRM, which took effect on March 1, 2021. Pursuant to the New Agreement (and the Fund’s investment advisory agreement with CRM in effect prior to March 1, 2021), the fee is computed at the annual rate of 0.35% of the Fund’s average daily net assets and is payable monthly. For the year ended December 31, 2021, the investment advisory fee amounted to $1,418,912. The Fund may invest its cash in Cash Reserves Fund. CRM does not currently receive a fee for advisory services provided to Cash Reserves Fund.
CRM has agreed to reimburse the Fund’s operating expenses to the extent that total annual operating expenses (relating to ordinary operating expenses only and excluding expenses such as brokerage commissions, acquired fund fees and expenses of unaffiliated funds, borrowing costs, taxes or litigation expenses) exceed 0.75%, 1.50% and 0.50% for Class A, Class C and Class I, respectively, of such class's average daily net assets. The expense reimbursement agreement with CRM may be changed or terminated after April 30, 2022. For the year ended December 31, 2021, CRM waived or reimbursed expenses of $474,266.
The administrative fee is earned by CRM as compensation for administrative services rendered to the Fund. The fee is computed at an annual rate of 0.12% of the Fund’s average daily net assets attributable to Class A, Class C and Class I and is payable monthly. For the year ended December 31, 2021, CRM was paid administrative fees of $486,484.
The Fund has in effect a distribution plan for Class A shares (Class A Plan) pursuant to Rule 12b-1 under the 1940 Act. Pursuant to the Class A Plan, the Fund pays Eaton Vance Distributors, Inc. (EVD), an affiliate of CRM and the Fund’s principal underwriter, a distribution and service fee of 0.25% per annum of its average daily net assets attributable to Class A shares for distribution services and facilities provided to the Fund by EVD, as well as for personal services and/or the maintenance of shareholder accounts. The Fund also has in effect a distribution plan for Class C shares (Class C Plan) pursuant to Rule 12b-1 under the 1940 Act. Pursuant to the Class C Plan, the Fund pays EVD amounts equal to 0.75% per annum of its average daily net assets attributable to Class C shares for providing ongoing distribution services and facilities to the Fund. In addition, pursuant to the Class C Plan, the Fund also makes payments of service fees to EVD, financial intermediaries and other persons in amounts equal to 0.25% per annum of its average daily net assets attributable to that class. Service fees paid or accrued are for personal services and/or the maintenance of shareholder accounts. Distribution and service fees paid or accrued for the year ended December 31, 2021 amounted to $319,597 and $22,125 for Class A shares and Class C shares, respectively.
The Fund was informed that EVD received $23,564 as its portion of the sales charge on sales of Class A shares for the year ended December 31, 2021. The Fund was also informed that EVD received $1,245 and $753 of contingent deferred sales charges (CDSC) paid by Class A and Class C shareholders, respectively, for the same period.
Eaton Vance Management (EVM), an affiliate of CRM, provides sub-transfer agency and related services to the Fund pursuant to a Sub-Transfer Agency Support Services Agreement. For the year ended December 31, 2021, sub-transfer agency fees and expenses incurred to EVM amounted to $22,414 and are included in transfer agency fees and expenses on the Statement of Operations.
Each Trustee of the Fund who is not an employee of CRM or its affiliates receives an annual fee of $154,000 ($214,000 effective January 1, 2022), plus an annual Committee fee ranging from $8,500 to $16,500 depending on the Committee. The Board chair receives an additional $30,000 annual fee, Committee chairs receive an additional $6,000 annual fee and the special equities liaison receives an additional $2,500 annual fee. Eligible Trustees may
Calvert
Responsible Municipal Income Fund
December 31, 2021
Notes to Financial Statements — continued
participate in a Deferred Compensation Plan (the Plan). Amounts deferred under the Plan are treated as though equal dollar amounts had been invested in shares of the Fund or other Calvert funds selected by the Trustees. The Fund purchases shares of the funds selected equal to the dollar amounts deferred under the Plan, resulting in an asset equal to the deferred compensation liability. Obligations of the Plan are paid solely from the Fund's assets. Trustees’ fees are allocated to each of the Calvert funds served. Salaries and fees of officers and Trustees of the Fund who are employees of CRM or its affiliates are paid by CRM.
3 Investment Activity
During the year ended December 31, 2021, the cost of purchases and proceeds from sales of investments, other than short-term securities, were $157,375,347 and $69,273,199, respectively.
4 Distributions to Shareholders and Income Tax Information
The tax character of distributions declared for the years ended December 31, 2021 and December 31, 2020 was as follows:
| | Year Ended December 31, |
| | 2021 | 2020 |
| Tax-exempt income | $4,331,081 | $3,860,209 |
| Ordinary income | $ 465,576 | $ 248,286 |
As of December 31, 2021, the components of distributable earnings (accumulated loss) on a tax basis were as follows:
| Undistributed tax-exempt income | $ 346,285 |
| Deferred capital losses | (31,102,662) |
| Net unrealized appreciation | 14,179,797 |
| Distributions payable | (53,046) |
| Accumulated loss | $(16,629,626) |
At December 31, 2021, the Fund, for federal income tax purposes, had deferred capital losses of $31,102,662 which would reduce the Fund’s taxable income arising from future net realized gains on investment transactions, if any, to the extent permitted by the Internal Revenue Code, and thus would reduce the amount of distributions to shareholders, which would otherwise be necessary to relieve the Fund of any liability for federal income or excise tax. The deferred capital losses are treated as arising on the first day of the Fund’s next taxable year, can be carried forward for an unlimited period, and retain the same short-term or long-term character as when originally deferred. Of the deferred capital losses at December 31, 2021, $1,214,867 are short-term and $29,887,795 are long-term.
The cost and unrealized appreciation (depreciation) of investments, including open derivative contracts, of the Fund at December 31, 2021, as determined on a federal income tax basis, were as follows:
| Aggregate cost | $420,502,231 |
| Gross unrealized appreciation | $ 14,902,146 |
| Gross unrealized depreciation | (722,349) |
| Net unrealized appreciation | $ 14,179,797 |
5 Financial Instruments
A summary of futures contracts outstanding at December 31, 2021 is included in the Schedule of Investments. During the year ended December 31, 2021, the Fund used futures contracts to hedge interest rate risk and to manage duration.
Calvert
Responsible Municipal Income Fund
December 31, 2021
Notes to Financial Statements — continued
At December 31, 2021, the fair value of open derivative instruments (not considered to be hedging instruments for accounting disclosure purposes) and whose primary underlying risk exposure is interest rate risk was as follows:
| Derivative | Statement of Assets and Liabilities Caption | Assets | Liabilities |
| Futures contracts | Accumulated loss | | $ — | $(136,770) (1) |
| (1) | Only the current day's variation margin is reported within the Statement of Assets and Liabilities as Receivable or Payable for variation margin on open futures contracts, as applicable. |
The effect of derivative instruments (not considered to be hedging instruments for accounting disclosure purposes) on the Statement of Operations and whose primary underlying risk exposure is interest rate risk for the year ended December 31, 2021 was as follows:
| | Statement of Operations Caption | |
| Derivative | Net realized gain (loss): Futures
contracts | Change in unrealized appreciation
(depreciation): Futures contracts |
| Futures contracts | $ 446,120 | $ (136,972) |
The average notional cost of futures contracts (short) outstanding during the year ended December 31, 2021 was approximately $11,884,000.
6 Line of Credit
The Fund participates with other portfolios and funds managed by EVM and its affiliates, including CRM, in an $800 million unsecured line of credit with a group of banks, which is in effect through October 25, 2022. Borrowings are made by the Fund solely for temporary purposes related to redemptions and other short-term cash needs. Interest is charged to the Fund based on its borrowings at an amount above either the Secured Overnight Financing Rate (SOFR) or Federal Funds rate. In addition, a fee computed at an annual rate of 0.15% on the daily unused portion of the line of credit is allocated among the participating portfolios and funds at the end of each quarter. In connection with the renewal of the agreement in October 2021, an arrangement fee of $150,000 was incurred that was allocated to the participating portfolios and funds. Because the line of credit is not available exclusively to the Fund, it may be unable to borrow some or all of its requested amounts at any particular time.
The Fund did not have any significant borrowings or allocated fees during the year ended December 31, 2021.
7 Affiliated Funds
At December 31, 2021, the value of the Fund’s investment in affiliated funds was $13,043,583, which represents 3.0% of the Fund’s net assets. Transactions in affiliated funds by the Fund for the year ended December 31, 2021 were as follows:
| Name | Value,
beginning
of period | Purchases | Sales
proceeds | Net
realized
gain
(loss) | Change in
unrealized
appreciation
(depreciation) | Value,
end of
period | Dividend
income | Units,
end of
period |
| Short-Term Investments | | | | | | |
| Calvert Cash Reserves Fund, LLC | $37,123,010 | $116,293,568 | $(140,368,983) | $(4,308) | $296 | $13,043,583 | $14,026 | 13,043,583 |
8 Capital Shares
The Fund’s Declaration of Trust permits the Trustees to issue an unlimited number of full and fractional shares of beneficial interest (without par value). Such shares may be issued in a number of different series (such as the Fund) and classes.
Calvert
Responsible Municipal Income Fund
December 31, 2021
Notes to Financial Statements — continued
Transactions in capital shares for the years ended December 31, 2021 and December 31, 2020 were as follows:
| | Year Ended
December 31, 2021 | | Year Ended
December 31, 2020 |
| | Shares | Amount | | Shares | Amount |
| Class A | | | | | |
| Shares sold | 850,214 | $ 14,223,778 | | 1,047,301 | $ 17,386,171 |
| Reinvestment of distributions | 70,658 | 1,179,909 | | 97,265 | 1,613,509 |
| Shares redeemed | (853,487) | (14,275,047) | | (737,239) | (12,196,535) |
| Converted from Class C | — | — | | 9,639 | 161,650 |
| Net increase | 67,385 | $ 1,128,640 | | 416,966 | $ 6,964,795 |
| Class C | | | | | |
| Shares sold | 26,654 | $ 445,789 | | 62,014 | $ 1,024,793 |
| Reinvestment of distributions | 355 | 5,933 | | 793 | 13,150 |
| Shares redeemed | (25,331) | (424,258) | | (11,842) | (196,138) |
| Converted to Class A | — | — | | (9,639) | (161,650) |
| Net increase | 1,678 | $ 27,464 | | 41,326 | $ 680,155 |
| Class I | | | | | |
| Shares sold | 8,668,030 | $145,361,153 | | 12,090,071 | $ 200,505,646 |
| Reinvestment of distributions | 178,530 | 2,989,101 | | 129,582 | 2,160,446 |
| Shares redeemed | (5,023,113) | (84,113,930) | | (1,910,053) | (31,554,923) |
| Net increase | 3,823,447 | $ 64,236,324 | | 10,309,600 | $171,111,169 |
9 Risks and Uncertainties
Pandemic Risk
An outbreak of respiratory disease caused by a novel coronavirus was first detected in China in late 2019 and subsequently spread internationally. This coronavirus has resulted in closing borders, enhanced health screenings, changes to healthcare service preparation and delivery, quarantines, cancellations, disruptions to supply chains and customer activity, as well as general concern and uncertainty. Health crises caused by outbreaks, such as the coronavirus outbreak, may exacerbate other pre-existing political, social and economic risks and disrupt normal market conditions and operations. The impact of this outbreak has negatively affected the worldwide economy, the economies of individual countries, individual companies, and the market in general, and may continue to do so in significant and unforeseen ways, as may other epidemics and pandemics that may arise in the future. Any such impact could adversely affect the Fund's performance, or the performance of the securities in which the Fund invests.
10 Change in Independent Registered Public Accounting Firm
On July 30, 2021, KPMG LLP (“KPMG”) informed the Audit Committee and Board of the Trust that it was resigning as the independent registered public accounting firm to the Trust, as upon Morgan Stanley’s acquisition of Eaton Vance Corp., the parent company of CRM (the investment adviser to each series of the Trust), KPMG would no longer be independent of the Trust. The Audit Committee of the Board and the Board approved the selection of Deloitte & Touche LLP (“Deloitte”) as the independent registered public accounting firm for the funds that are series of the Trust (the “Funds”) for the fiscal year ending December 31, 2021 to be effective upon KPMG’s resignation and Deloitte’s acceptance of the engagement which became effective July 30, 2021.
KPMG’s reports on the financial statements for the Funds for the fiscal periods ended December 31, 2019 and December 31, 2020 contained no adverse opinion or disclaimer of opinion nor were they qualified or modified as to uncertainty, audit scope or accounting principles. During the fiscal periods ended December 31, 2019 and December 31, 2020, and during the subsequent interim period through July 30, 2021: (i) there were no disagreements with KPMG on any matter of accounting principles or practices, financial statement disclosure or auditing scope or procedure, which disagreements, if not resolved to the satisfaction of KPMG, would have caused KPMG to make reference to the subject matter of the disagreements in connection with its reports on the Funds’ financial statements for such periods; and (ii) there were no “reportable events” of the kind described in Item 304(a)(1)(v) of Regulation S-K under the Securities Exchange Act of 1934, as amended.
Calvert
Responsible Municipal Income Fund
December 31, 2021
Notes to Financial Statements — continued
During the fiscal periods ended December 31, 2019 and December 31, 2020, and during the subsequent interim period through July 30, 2021: neither the Funds, nor anyone on their behalf, consulted with Deloitte on items which: (i) concerned the application of accounting principles to a specified transaction, either completed or proposed, or the type of audit opinion that might be rendered on the Funds’ financial statements; or (ii) concerned the subject of a disagreement (as defined in paragraph (a)(1)(iv) of Item 304 of Regulation S-K) or reportable events (as described in paragraph (a)(1)(v) of Item 304).
Calvert
Responsible Municipal Income Fund
December 31, 2021
Report of Independent Registered Public Accounting Firm
To the Board of Trustees of Calvert Management Series and Shareholders of Calvert Responsible Municipal Income Fund:
Opinion on the Financial Statements and Financial Highlights
We have audited the accompanying statement of assets and liabilities of Calvert Responsible Municipal Income Fund (the "Fund") (one of the funds constituting Calvert Management Series), including the schedule of investments, as of December 31, 2021, the related statements of operations, changes in net assets, and the financial highlights for the year then ended, and the related notes. In our opinion, the financial statements and financial highlights present fairly, in all material respects, the financial position of the Fund as of December 31, 2021, and the results of its operations, changes in its net assets, and the financial highlights for the year then ended in conformity with accounting principles generally accepted in the United States of America. The statement of changes in net assets for the year ended December 31, 2020, and the financial highlights for the years ended December 31, 2020, 2019, 2018, and 2017 were audited by other auditors whose report, dated February 22, 2021, expressed an unqualified opinion on that financial statement and those financial highlights.
Basis for Opinion
These financial statements and financial highlights are the responsibility of the Fund's management. Our responsibility is to express an opinion on the Fund's financial statements and financial highlights based on our audit. We are a public accounting firm registered with the Public Company Accounting Oversight Board (United States) (PCAOB) and are required to be independent with respect to the Fund in accordance with the U.S. federal securities laws and the applicable rules and regulations of the Securities and Exchange Commission and the PCAOB.
We conducted our audit in accordance with the standards of the PCAOB. Those standards require that we plan and perform the audit to obtain reasonable assurance about whether the financial statements and financial highlights are free of material misstatement, whether due to error or fraud. The Fund is not required to have, nor were we engaged to perform, an audit of its internal control over financial reporting. As part of our audit, we are required to obtain an understanding of internal control over financial reporting but not for the purpose of expressing an opinion on the effectiveness of the Fund’s internal control over financial reporting. Accordingly, we express no such opinion.
Our audit included performing procedures to assess the risks of material misstatement of the financial statements and financial highlights, whether due to error or fraud, and performing procedures that respond to those risks. Such procedures included examining, on a test basis, evidence regarding the amounts and disclosures in the financial statements and financial highlights. Our audit also included evaluating the accounting principles used and significant estimates made by management, as well as evaluating the overall presentation of the financial statements and financial highlights. Our procedures included confirmation of securities owned as of December 31, 2021, by correspondence with the custodian and brokers; when replies were not received from brokers, we performed other auditing procedures. We believe that our audit provides a reasonable basis for our opinion.
/s/ Deloitte & Touche LLP
Boston, Massachusetts
February 24, 2022
We have served as the auditor of one or more Calvert investment companies since 2021.
Calvert
Responsible Municipal Income Fund
December 31, 2021
Federal Tax Information (Unaudited)
The Form 1099-DIV you received in February 2022 showed the tax status of all distributions paid to your account in calendar year 2021. Shareholders are advised to consult their own tax adviser with respect to the tax consequences of their investment in the Fund. As required by the Internal Revenue Code and/or regulations, shareholders must be notified regarding the status of exempt-interest dividends.
Exempt-Interest Dividends. For the fiscal year ended December 31, 2021, the Fund designates 89.56% of distributions from net investment income as an exempt-interest dividend.
Calvert
Responsible Municipal Income Fund
December 31, 2021
Management and Organization
Fund Management. The Trustees of Calvert Management Series (the Trust) are responsible for the overall management and supervision of the affairs of the Trust. The Board members and officers of the Trust are listed below. Except as indicated, each individual has held the office shown or other offices in the same company for the last five years. Board members hold indefinite terms of office. Each Trustee holds office until his or her successor is elected and qualified, or until his or her earlier death, resignation, retirement, removal or disqualification. Under the terms of the Fund's current Board member retirement policy, an Independent Board member must retire at the end of the calendar year in which he or she turns 75. However, if such retirement would cause the Fund to be out of compliance with Section 16 of the 1940 Act or any other regulations or guidance of the SEC, then such retirement will not become effective until such time as action has been taken for the Fund to be in compliance therewith. The “noninterested Trustees” consist of those Trustees who are not “interested persons” of the Trust, as that term is defined under the 1940 Act. The business address of each Board member and the Chief Compliance Officer is 1825 Connecticut Avenue NW, Suite 400, Washington, DC 20009 and the business address of the Secretary, Vice President and Chief Legal Officer and the Treasurer is Two International Place, Boston, Massachusetts 02110. As used below, “CRM” refers to Calvert Research and Management and “Eaton Vance” refers to Eaton Vance Management. Each Trustee oversees 39 funds in the Calvert fund complex. Effective March 1, 2021, each of Eaton Vance and CRM are indirect, wholly owned subsidiaries of Morgan Stanley. Each officer affiliated with CRM may hold a position with other CRM affiliates that is comparable to his or her position with CRM listed below.
| Name and Year of Birth | Trust
Position(s) | Length of
Service | Principal Occupation(s) and Other Directorships
During Past Five Years and Other Relevant Experience |
| Interested Trustee |
John H. Streur(1)
1960 | Trustee and
President | Since 2015 | President and Chief Executive Officer of CRM (since December 31, 2016). President and Chief Executive Officer of Calvert Investments, Inc.
(January 2015 - December 2016); Chief Executive Officer of Calvert
Investment Distributors, Inc. (August 2015 - December 2016); Chief
Compliance Officer of Calvert Investment Management, Inc. (August 2015 -
April 2016); President and Director, Portfolio 21 Investments, Inc.
(through October 2014); President, Chief Executive Officer and
Director, Managers Investment Group LLC (through January 2012);
President and Director, The Managers Funds and Managers AMG
Funds (through January 2012).
Other Directorships. Portfolio 21 Investments, Inc. (asset management)
(through October 2014); Managers Investment Group LLC (asset management)
(through January 2012); The Managers Funds (asset management)
(through January 2012); Managers AMG Funds (asset management)
(through January 2012); Calvert Impact Capital, Inc. |
| Noninterested Trustees |
Richard L. Baird, Jr.
1948 | Trustee | Since 1980 | Regional Disaster Recovery Lead, American Red Cross of Greater
Pennsylvania (since 2017). Volunteer, American Red Cross (since 2015).
Former President and CEO of Adagio Health Inc. (retired in 2014) in
Pittsburgh, PA.
Other Directorships. None. |
Alice Gresham Bullock
1950 | Chair and
Trustee | Since 2016 | Professor Emerita at Howard University School of Law. Dean Emerita of
Howard University School of Law and Deputy Director of the Association
of American Law Schools (1992-1994).
Other Directorships. None. |
Cari M. Dominguez
1949 | Trustee | Since 2016 | Former Chair of the U.S. Equal Employment Opportunity Commission.
Other Directorships. ManpowerGroup Inc. (workforce solutions company);
Triple S Management Corporation (managed care); National Association of Corporate Directors. |
John G. Guffey, Jr.
1948 | Trustee | Since 1982 | President of Aurora Press Inc., a privately held publisher of trade
paperbacks (since January 1997).
Other Directorships. Calvert Impact Capital, Inc. (through
December 31, 2018); Calvert Ventures, LLC. |
Miles D. Harper, III
1962 | Trustee | Since 2016 | Partner, Carr Riggs & Ingram (public accounting firm) since October 2014.
Partner, Gainer Donnelly & Desroches (public accounting firm) (now Carr
Riggs & Ingram) (November 1999 - September 2014).
Other Directorships. Bridgeway Funds (9) (asset management). |
Joy V. Jones
1950 | Trustee | Since 2016 | Attorney.
Other Directorships. Palm Management Corporation. |
Calvert
Responsible Municipal Income Fund
December 31, 2021
Management and Organization — continued
| Name and Year of Birth | Trust
Position(s) | Length of
Service | Principal Occupation(s) and Other Directorships
During Past Five Years and Other Relevant Experience |
| Noninterested Trustees (continued) |
Anthony A. Williams
1951 | Trustee | Since 2010 | CEO and Executive Director of the Federal City Council (July 2012 to
present); Senior Adviser and Independent Consultant for King and
Spalding LLP (September 2015 to present); Executive Director of Global
Government Practice at the Corporate Executive Board (January 2010 to
January 2012).
Other Directorships. Freddie Mac; Evoq Properties/Meruelo Maddux
Properties, Inc. (real estate management); Weston Solutions, Inc.
(environmental services); Bipartisan Policy Center’s Debt Reduction Task Force;
Chesapeake Bay Foundation; Catholic University of America; Urban Institute (research organization); The Howard Hughes Corporation (real estate development). |
| Name and Year of Birth | Trust
Position(s) | Length of
Service | Principal Occupation(s)
During Past Five Years |
| Principal Officers who are not Trustees |
Hope L. Brown
1973 | Chief
Compliance
Officer | Since 2014 | Chief Compliance Officer of 39 registered investment companies advised
by CRM (since 2014). Vice President and Chief Compliance Officer,
Wilmington Funds (2012-2014). |
Deidre E. Walsh
1971 | Secretary,
Vice President
and Chief
Legal Officer | Since 2021 | Vice President of CRM and officer of 39 registered investment companies
advised by CRM (since 2021). Also Vice President of Eaton Vance and
certain of its affiliates and officer of 138 registered investment companies
advised or administered by Eaton Vance. |
James F. Kirchner
1967 | Treasurer | Since 2016 | Vice President of CRM and officer of 39 registered investment companies
advised by CRM (since 2016). Also Vice President of Eaton Vance and
certain of its affiliates and officer of 138 registered investment companies
advised or administered by Eaton Vance. |
| | | | |
| (1) Mr. Streur is an interested person of the Fund because of his positions with the Fund’s adviser and certain affiliates. |
The SAI for the Fund includes additional information about the Trustees and officers of the Fund and can be obtained without charge on Calvert’s website at www.calvert.com or by calling 1-800-368-2745.
| FACTS | WHAT DOES EATON VANCE DO WITH YOUR
PERSONAL INFORMATION? |
| Why? | Financial companies choose how they share your personal information. Federal law gives consumers the right to limit some but not all sharing. Federal law also requires us to tell you how we collect, share, and protect your personal information. Please read this notice carefully to understand what we do. |
| |
| What? | The types of personal information we collect and share depend on the product or service you have with us. This information can include:■ Social Security number and income
■
investment experience and risk tolerance
■
checking account number and wire transfer instructions |
| |
| How? | All financial companies need to share customers’ personal information to run their everyday business. In the section below, we list the reasons financial companies can share their customers’ personal information; the reasons Eaton Vance chooses to share; and whether you can limit this sharing. |
Reasons we can share your
personal information | Does Eaton Vance
share? | Can you limit
this sharing? |
| For our everyday business purposes — such as to process your transactions, maintain your account(s), respond to court orders and legal investigations, or report to credit bureaus | Yes | No |
| For our marketing purposes — to offer our products and services to you | Yes | No |
| For joint marketing with other financial companies | No | We don’t share |
| For our investment management affiliates’ everyday business purposes — information about your transactions, experiences, and creditworthiness | Yes | Yes |
| For our affiliates’ everyday business purposes — information about your transactions and experiences | Yes | No |
| For our affiliates’ everyday business purposes — information about your creditworthiness | No | We don’t share |
| For our investment management affiliates to market to you | Yes | Yes |
| For our affiliates to market to you | No | We don’t share |
| For nonaffiliates to market to you | No | We don’t share |
To limit our
sharing | Call toll-free 1-800-368-2745 or email: CRMPrivacy@calvert.comPlease note:If you are a new customer, we can begin sharing your information 30 days from the date we sent this notice. When you are no longer our customer, we continue to share your information as described in this notice. However, you can contact us at any time to limit our sharing. |
| Questions? | Call toll-free 1-800-368-2745 or email: CRMPrivacy@calvert.com |
| Privacy Notice — continued | April 2021 |
| Who we are |
| Who is providing this notice? | Eaton Vance Management, Eaton Vance Distributors, Inc., Eaton Vance Trust Company, Eaton Vance Management (International) Limited, Eaton Vance Advisers International Ltd., Eaton Vance Global Advisors Limited, Eaton Vance Management’s Real Estate Investment Group, Boston Management and Research, Calvert Research and Management, Eaton Vance and Calvert Fund Families and our investment advisory affiliates (“Eaton Vance”) (see Investment Management Affiliates definition below) |
| What we do |
How does Eaton Vance
protect my personal
information? | To protect your personal information from unauthorized access and use, we use security measures that comply with federal law. These measures include computer safeguards and secured files and buildings. We have policies governing the proper handling of customer information by personnel and requiring third parties that provide support to adhere to appropriate security standards with respect to such information. |
How does Eaton Vance
collect my personal
information? | We collect your personal information, for example, when you■ open an account or make deposits or withdrawals from your account
■
buy securities from us or make a wire transfer
■
give us your contact informationWe also collect your personal information from others, such as credit bureaus, affiliates, or other companies. |
| Why can’t I limit all sharing? | Federal law gives you the right to limit only■ sharing for affiliates’ everyday business purposes — information about your creditworthiness
■
affiliates from using your information to market to you
■
sharing for nonaffiliates to market to youState laws and individual companies may give you additional rights to limit sharing. See below for more on your rights under state law. |
| Definitions |
Investment Management
Affiliates | Eaton Vance Investment Management Affiliates include registered investment advisers, registered broker- dealers, and registered and unregistered funds. Investment Management Affiliates does not include entities associated with Morgan Stanley Wealth Management, such as Morgan Stanley Smith Barney LLC and Morgan Stanley & Co. |
| Affiliates | Companies related by common ownership or control. They can be financial and nonfinancial companies.■ Our affiliates include companies with a Morgan Stanley name and financial companies such as Morgan Stanley Smith Barney LLC and Morgan Stanley & Co. |
| Nonaffiliates | Companies not related by common ownership or control. They can be financial and nonfinancial companies.■ Eaton Vance does not share with nonaffiliates so they can market to you. |
| Joint marketing | A formal agreement between nonaffiliated financial companies that together market financial products or services to you.■ Eaton Vance doesn’t jointly market. |
| Other important information |
| Vermont: Except as permitted by law, we will not share personal information we collect about Vermont residents with Nonaffiliates unless you provide us with your written consent to share such information.California: Except as permitted by law, we will not share personal information we collect about California residents with Nonaffiliates and we will limit sharing such personal information with our Affiliates to comply with California privacy laws that apply to us. |
Delivery of Shareholder Documents. The Securities and Exchange Commission (SEC) permits funds to deliver only one copy of shareholder documents, including prospectuses, proxy statements and shareholder reports, to fund investors with multiple accounts at the same residential or post office box address. This practice is often called “householding” and it helps eliminate duplicate mailings to shareholders. Calvert funds, or your financial intermediary, may household the mailing of your documents indefinitely unless you instruct Calvert funds, or your financial intermediary, otherwise. If you would prefer that your Calvert fund documents not be householded, please contact Calvert funds at 1-800-368-2745, or contact your financial intermediary. Your instructions that householding not apply to delivery of your Calvert fund documents will typically be effective within 30 days of receipt by Calvert funds or your financial intermediary. Separate statements will be generated for each separate account and will be householded as described above.
Portfolio Holdings. Each Calvert fund files a schedule of portfolio holdings on Part F to Form N-PORT with the SEC. Certain information filed on Form N-PORT may be viewed on the Calvert website at www.calvert.com, by calling Calvert at 1-800-368-2745 or in the EDGAR database on the SEC’s website at www.sec.gov.
Proxy Voting. The Proxy Voting Guidelines that each Calvert fund uses to determine how to vote proxies relating to portfolio securities is provided as an Appendix to the fund’s Statement of Additional Information. The Statement of Additional Information can be obtained free of charge by calling the Calvert funds at 1-800-368-2745, by visiting the Calvert funds’ website at www.calvert.com or visiting the SEC’s website at www.sec.gov. Information regarding how a Calvert fund voted proxies relating to portfolio securities during the most recent 12-month period ended June 30 is available by calling Calvert funds, by visiting the Calvert funds’ website at www.calvert.com or by visiting the SEC’s website at www.sec.gov.
This Page Intentionally Left Blank
Investment Adviser and Administrator
Calvert Research and Management
1825 Connecticut Avenue NW, Suite 400
Washington, DC 20009
Principal Underwriter*
Eaton Vance Distributors, Inc.
Two International Place
Boston, MA 02110
(617) 482-8260
Custodian
State Street Bank and Trust Company
State Street Financial Center, One Lincoln Street
Boston, MA 02111
Transfer Agent
DST Asset Manager Solutions, Inc.
2000 Crown Colony Drive
Quincy, MA 02169
Independent Registered Public Accounting Firm
Deloitte & Touche LLP
200 Berkeley Street
Boston, MA 02116-5022
Fund Offices
1825 Connecticut Avenue NW, Suite 400
Washington, DC 20009
* FINRA BrokerCheck. Investors may check the background of their Investment Professional by contacting the Financial Industry Regulatory Authority (FINRA). FINRA BrokerCheck is a free tool to help investors check the professional background of current and former FINRA-registered securities firms and brokers. FINRA BrokerCheck is available by calling 1-800-289-9999 and at www.FINRA.org. The FINRA BrokerCheck brochure describing this program is available to investors at www.FINRA.org.
Printed on recycled paper.
24173 12.31.21
Item 2. Code of Ethics
The registrant has adopted a code of ethics applicable to its Principal Executive Officer, Principal Financial Officer and Principal Accounting Officer. The registrant undertakes to provide a copy of such code of ethics to any person upon request, without charge, by calling 1-800-368-2745. The registrant has not amended the code of ethics as described in Form N-CSR during the period covered by this report. The registrant has not granted any waiver, including an implicit waiver, from a provision of the code of ethics as described in Form N-CSR during the period covered by this report.
Item 3. Audit Committee Financial Expert
The registrant’s Board of Trustees has determined that Miles D. Harper III, an “independent” Trustee serving on the registrant’s audit committee, is an “audit committee financial expert,” as defined in Item 3 of Form N-CSR. Under applicable securities laws, a person who is determined to be an audit committee financial expert will not be deemed an “expert” for any purpose, including without limitation for the purposes of Section 11 of the Securities Act of 1933, as a result of being designated or identified as an audit committee financial expert. The designation or identification of a person as an audit committee financial expert does not impose on such person any duties, obligations, or liabilities that are greater than the duties, obligations, and liabilities imposed on such person as a member of the audit committee and Board of Trustees in the absence of such designation or identification.
Item 4. Principal Accountant Fees and Services
(a) –(d)
The various Series comprising the Trust have differing fiscal year ends (September 30 and December 31). The following table presents the aggregate audit, audit-related, tax, and other fees billed to all of the Series in the Trust by its principal accountant for the last two fiscal years of each Series.
| | | | | | | | | | | | | | | | | | | | | | | | | | | | | | | | |
Fiscal Years Ended | | 9/30/20 | | | %* | | | 12/31/20 | | | %* | | | 9/30/21 | | | %* | | | 12/31/21 | | | %* | |
Audit Fees | | $ | 33,047 | | | | 0 | % | | $ | 53,300 | | | | 0 | % | | $ | 33,000 | | | | 0 | % | | $ | 53,000 | | | | 0 | % |
Audit-Related Fees(1) | | $ | 0 | | | | 0 | % | | $ | 0 | | | | 0 | % | | $ | 0 | | | | 0 | % | | $ | 0 | | | | 0 | % |
Tax Fees(2) | | $ | 4,950 | | | | 0 | % | | $ | 9,900 | | | | 0 | % | | $ | 4,950 | | | | 0 | % | | $ | 9,900 | | | | 0 | % |
All Other Fees(3) | | $ | 0 | | | | 0 | % | | $ | 0 | | | | 0 | % | | $ | 0 | | | | 0 | % | | $ | 0 | | | | 0 | % |
| | | | | | | | | | | | | | | | | | | | | | | | | | | | | | | | |
Total | | $ | 37,997 | | | | 0 | % | | $ | 63,200 | | | | 0 | % | | $ | 37,950 | | | | 0 | % | | $ | 62,900 | | | | 0 | % |
| | | | | | | | | | | | | | | | | | | | | | | | | | | | | | | | |
| * | Percentage of fees approved by the Audit Committee pursuant to (c)(7)(i)(C) of Rule 2-01 of Reg. S-X (statutory de minimus waiver of Committee’s requirement to pre-approve) |
| (1) | Audit-related fees consist of the aggregate fees billed for assurance and related services that are reasonably related to the performance of the audit of the registrant’s financial statements and are not reported under the category of audit fees. |
| (2) | Tax fees consist of the aggregate fees billed for professional services rendered by the principal accountant relating to tax compliance, tax advice, and tax planning and specifically include fees for tax return preparation and other related tax compliance/planning matters. |
| (3) | All other fees consist of the aggregate fees billed for products and services provided by the principal accountant other than audit, audit-related, and tax services. |
(e) The Audit Committee is required to pre-approve all audit and non-audit services provided to the registrant by the auditors, and to the registrant’s investment adviser, and any entity controlling, controlled by, or under common control with the adviser that provides ongoing services to the registrant. In determining whether to pre-approve non-audit services, the Audit Committee considers whether the services are consistent with maintaining the independence of the auditors. The Committee may delegate its authority to pre-approve certain matters to one or more of its members. In this regard, the Committee has delegated authority jointly to the Audit Committee Chair together with another Committee member with respect to non-audit services not exceeding $25,000 in each instance. In addition, the Committee has pre-approved the retention of the auditors to provide tax-related services related to the tax treatment and tax accounting of newly acquired securities, upon request by the investment adviser in each instance.
(f) Not applicable.
(g) Aggregate non-audit fees billed by the registrant’s principal accountant for services rendered to the registrant, and rendered to the registrant’s investment adviser, and any entity controlling, controlled by, or under common control with the adviser that provides ongoing services to the registrant for each of the last two fiscal years of each Series.
| | | | | | | | | | | | | | |
Fiscal Year ended 9/30/20 | | Fiscal Year ended 12/31/20 | | Fiscal Year ended 9/30/21 | | Fiscal Year ended 12/31/21 |
$ | | %* | | $ | | %* | | $ | | %* | | $ | | %* |
| $4,950 | | 0% | | $9,900 | | 0% | | $4,950 | | 0% | | $9,900 | | 0% |
| * | Percentage of fees approved by the Audit Committee pursuant to (c)(7)(i)(C) of Rule 2-01 of Reg. S-X (statutory de minimus waiver of Committee’s requirement to pre-approve). |
(h) The registrant’s audit committee has considered whether the provision by the registrant’s principal accountant of non-audit services to the registrant’s investment adviser and any entity controlling, controlled by, or under common control with the adviser that provides ongoing services to the registrant that were not pre-approved pursuant to Rule 2-01(c)(7)(ii) of Regulation S-X is compatible with maintaining the principal accountant’s independence.
Item 5. Audit Committee of Listed Registrants
Not applicable.
Item 6. Schedule of Investments
Please see schedule of investments contained in the Report to Stockholders included under Item 1 of this Form N-CSR.
Item 7. Disclosure of Proxy Voting Policies and Procedures for Closed-End Management Investment Companies
Not applicable.
Item 8. Portfolio Managers of Closed-End Management Investment Companies
Not applicable.
Item 9. Purchases of Equity Securities by Closed-End Management Investment Company and Affiliated Purchasers
Not applicable.
Item 10. Submission of Matters to a Vote of Security Holders
No material changes.
Item 11. Controls and Procedures
(a) The registrant’s principal executive and principal financial officers have concluded that the registrant’s disclosure controls and procedures (as defined in Rule 30a-3(c) under the Investment Company Act of 1940
Act, as amended (the “1940 Act”) are effective, based on the evaluation of these controls and procedures required by Rule 30a-3(b) under the 1940 Act and Rules 13a-15(b) or 15d-15(b) under the Securities Exchange Act of 1934 (“Exchange Act”), as of a date within 90 days of the filing date of this report.
(b) There was no change in the registrant’s internal control over financial reporting (as defined in Rule 30a-3(d) under the 1940 Act) that occurred during the period covered by this report that has materially affected, or is reasonably likely to materially affect, the registrant’s internal control over financial reporting.
Item 12. Disclosure of Securities Lending Activities for Closed-End Management Investment Companies.
Not applicable.
Item 13. Exhibits
Signatures
Pursuant to the requirements of the Securities Exchange Act of 1934 and the Investment Company Act of 1940, the registrant has duly caused this report to be signed on its behalf by the undersigned, thereunto duly authorized.
| | |
| CALVERT MANAGEMENT SERIES |
| |
| By: | | /s/ John H. Streur |
| | John H. Streur |
| | President |
Date: February 24, 2022
Pursuant to the requirements of the Securities Exchange Act of 1934 and the Investment Company Act of 1940, this report has been signed below by the following persons on behalf of the registrant and in the capacities and on the dates indicated.
| | |
| By: | | /s/ James F. Kirchner |
| | James F. Kirchner |
| | Treasurer |
Date: February 24, 2022
| | |
| By: | | /s/ John H. Streur |
| | John H. Streur |
| | President |
Date: February 24, 2022