UNITED STATES
SECURITIES AND EXCHANGE COMMISSION
Washington, D.C. 20549
FORM N-CSR
CERTIFIED SHAREHOLDER REPORT OF REGISTERED
MANAGEMENT INVESTMENT COMPANIES
Investment Company Act File number: 811-03101
Calvert Management Series
(Exact Name of Registrant as Specified in Charter)
1825 Connecticut Avenue NW, Suite 400, Washington, DC 20009
(Address of Principal Executive Offices)
Deidre E. Walsh
Two International Place, Boston, Massachusetts 02110
(Name and Address of Agent for Service)
(202) 238-2200
(Registrant’s telephone number)
December 31
Date of Fiscal Year End
June 30, 2022
Date of Reporting Period
Item 1. Report to Stockholders


| % Average Annual Total Returns1,2 | Class Inception Date | Performance Inception Date | Six Months | One Year | Five Years | Since Inception |
| Class A at NAV | 09/30/2014 | 09/30/2014 | (5.68)% | (5.41)% | 1.84% | 2.47% |
| Class A with 3.25% Maximum Sales Charge | — | — | (8.77) | (8.51) | 1.17 | 2.03 |
| Class C at NAV | 09/30/2014 | 09/30/2014 | (5.96) | (6.11) | 1.07 | 1.70 |
| Class C with 1% Maximum Sales Charge | — | — | (6.90) | (7.03) | 1.07 | 1.70 |
| Class I at NAV | 09/30/2014 | 09/30/2014 | (5.52) | (5.19) | 2.11 | 2.80 |
| Class R6 at NAV | 05/01/2019 | 09/30/2014 | (5.54) | (5.11) | 2.16 | 2.84 |
| ICE BofA 3-Month U.S. Treasury Bill Index | — | — | 0.14% | 0.17% | 1.11% | 0.80% |
| % Total Annual Operating Expense Ratios3 | Class A | Class C | Class I | Class R6 |
| Gross | 0.95% | 1.70% | 0.70% | 0.62% |
| Net | 0.93 | 1.68 | 0.68 | 0.60 |
| % SEC Yield4 | Class A | Class C | Class I | Class R6 |
| SEC 30-day Yield - Subsidized | 3.42% | 2.80% | 3.82% | 3.89% |
| SEC 30-day Yield - Unsubsidized | 3.41 | 2.79 | 3.81 | 3.88 |

| 1 | ICE BofA 3-Month U.S. Treasury Bill Index is an unmanaged index of U.S. Treasury securities maturing in 90 days. ICE® BofA® indices are not for redistribution or other uses; provided “as is”, without warranties, and with no liability. Eaton Vance has prepared this report and ICE Data Indices, LLC does not endorse it, or guarantee, review, or endorse Eaton Vance’s products. BofA® is a licensed registered trademark of Bank of America Corporation in the United States and other countries. Unless otherwise stated, index returns do not reflect the effect of any applicable sales charges, commissions, expenses, taxes or leverage, as applicable. It is not possible to invest directly in an index. |
| 2 | Total Returns at NAV do not include applicable sales charges. If sales charges were deducted, the returns would be lower. Total Returns shown with maximum sales charge reflect the stated maximum sales charge. Unless otherwise stated, performance does not reflect the deduction of taxes on Fund distributions or redemptions of Fund shares.Performance prior to the inception date of a class may be linked to the performance of an older class of the Fund. This linked performance is adjusted for any applicable sales charge, but is not adjusted for class expense differences. If adjusted for such differences, the performance would be different. The performance of Class R6 is linked to Class I. Performance since inception for an index, if presented, is the performance since the Fund’s or oldest share class’ inception, as applicable. Performance presented in the Financial Highlights included in the financial statements is not linked.Calvert Research and Management became the investment adviser to the Fund on December 31, 2016. Performance reflected prior to such date is that of the Fund’s former investment adviser. |
| 3 | Source: Fund prospectus. Net expense ratios reflect a contractual expense reimbursement that continues through 4/30/23. The expense ratios for the current reporting period can be found in the Financial Highlights section of this report. Performance reflects expenses waived and/or reimbursed, if applicable. Without such waivers and/or reimbursements, performance would have been lower. |
| 4 | SEC Yield is a standardized measure based on the estimated yield to maturity of a fund’s investments over a 30-day period and is based on the maximum offer price at the date specified. The SEC Yield is not based on the distributions made by the Fund, which may differ. Subsidized yield reflects the effect of fee waivers and expense reimbursements. |
| Fund profile subject to change due to active management. |
| Beginning Account Value (1/1/22) | Ending Account Value (6/30/22) | Expenses Paid During Period* (1/1/22 – 6/30/22) | Annualized Expense Ratio | |
| Actual | ||||
| Class A | $1,000.00 | $ 943.20 | $4.34 ** | 0.90% |
| Class C | $1,000.00 | $ 940.40 | $7.94 ** | 1.65% |
| Class I | $1,000.00 | $ 944.80 | $3.13 ** | 0.65% |
| Class R6 | $1,000.00 | $ 944.60 | $2.70 ** | 0.56% |
| Hypothetical | ||||
| (5% return per year before expenses) | ||||
| Class A | $1,000.00 | $1,020.33 | $4.51 ** | 0.90% |
| Class C | $1,000.00 | $1,016.61 | $8.25 ** | 1.65% |
| Class I | $1,000.00 | $1,021.57 | $3.26 ** | 0.65% |
| Class R6 | $1,000.00 | $1,022.02 | $2.81 ** | 0.56% |
| * | Expenses are equal to the Fund's annualized expense ratio for the indicated Class, multiplied by the average account value over the period, multiplied by 181/365 (to reflect the one-half year period). The Example assumes that the $1,000 was invested at the net asset value per share determined at the close of business on December 31, 2021. |
| ** | Absent a waiver and/or reimbursement of expenses by an affiliate, expenses would be higher. |
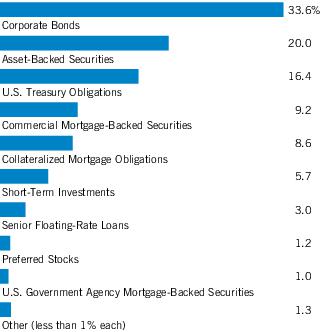
| Asset-Backed Securities — 19.9% |
| Security | Principal Amount (000's omitted) | Value | |
| Adams Outdoor Advertising, L.P., Series 2018-1, Class A, 4.81%, 11/15/48(1) | $ | 576 | $ 568,322 |
| Avant Loans Funding Trust, Series 2021-REV1, Class D, 4.30%, 7/15/30(1) | 1,512 | 1,386,882 | |
| Business Jet Securities, LLC, Series 2020-1A, Class A, 2.981%, 11/15/35(1) | 387 | 356,002 | |
| Coinstar Funding, LLC, Series 2017-1A, Class A2, 5.216%, 4/25/47(1) | 1,137 | 1,103,560 | |
| Cologix Canadian Issuer, L.P., Series 2022-1CAN, Class C, 7.74%, 1/25/52(1)(2) | 1,500 | 1,095,541 | |
| Cologix Data Centers US Issuer, LLC, Series 2021-1A, Class B, 3.79%, 12/26/51(1) | 1,315 | 1,194,797 | |
| Conn's Receivables Funding, LLC: | |||
| Series 2021-A, Class B, 2.87%, 5/15/26(1) | 930 | 902,560 | |
| Series 2021-A, Class C, 4.59%, 5/15/26(1) | 2,190 | 2,083,838 | |
| Consumer Loan Underlying Bond CLUB Credit Trust, Series 2020-P1, Class C, 4.61%, 3/15/28(1) | 1,305 | 1,282,454 | |
| Diamond Infrastructure Funding, LLC, Series 2021-1A, Class C, 3.475%, 4/15/49(1) | 292 | 249,354 | |
| Driven Brands Funding, LLC, Series 2018-1A, Class A2, 4.739%, 4/20/48(1) | 379 | 375,135 | |
| ExteNet, LLC, Series 2019-1A, Class B, 4.14%, 7/26/49(1) | 725 | 701,142 | |
| FMC GMSR Issuer Trust: | |||
| Series 2021-GT1, Class A, 3.62%, 7/25/26(1)(3) | 655 | 594,312 | |
| Series 2021-GT2, Class A, 3.85%, 10/25/26(1)(3) | 1,029 | 921,199 | |
| Series 2022-GT1, Class A, 6.19%, 4/25/27(1) | 903 | 879,358 | |
| FOCUS Brands Funding, LLC, Series 2017-1A, Class A2II, 5.093%, 4/30/47(1) | 76 | 73,436 | |
| Hardee's Funding, LLC, Series 2020-1A, Class A2, 3.981%, 12/20/50(1) | 542 | 493,735 | |
| Jersey Mike's Funding, Series 2019-1A, Class A2, 4.433%, 2/15/50(1) | 403 | 385,062 | |
| Loanpal Solar Loan, Ltd., Series 2020-1GS, Class C, 2.00%, 6/20/47(1) | 1,168 | 978,230 | |
| Lunar Aircraft, Ltd., Series 2020-1A, Class B, 4.335%, 2/15/45(1) | 113 | 88,729 | |
| Marlette Funding Trust, Series 2020-2A, Class C, 2.83%, 9/16/30(1) | 545 | 542,078 | |
| Mill City Solar Loan, Ltd., Series 2020-1A, Class C, 2.00%, 6/20/47(1) | 2,699 | 2,289,238 | |
| Mosaic Solar Loan Trust: | |||
| Series 2019-2A, Class B, 3.28%, 9/20/40(1) | 407 | 378,034 | |
| Series 2020-1A, Class B, 3.10%, 4/20/46(1) | 56 | 51,842 | |
| Series 2020-1A, Class C, 4.47%, 4/20/46(1) | 58 | 58,227 | |
| Series 2020-2A, Class B, 2.21%, 8/20/46(1) | 191 | 168,972 | |
| Series 2021-3A, Class C, 1.77%, 6/20/52(1) | 1,589 | 1,401,308 | |
| Series 2021-3A, Class D, 3.28%, 6/20/52(1) | 632 | 564,036 | |
| Security | Principal Amount (000's omitted) | Value | |
| Neighborly Issuer, LLC, Series 2021-1A, Class A2, 3.584%, 4/30/51(1) | $ | 787 | $ 686,668 |
| NRZ Excess Spread-Collateralized Notes: | |||
| Series 2021-FHT1, Class A, 3.104%, 7/25/26(1) | 151 | 137,597 | |
| Series 2021-GNT1, Class A, 3.474%, 11/25/26(1) | 1,789 | 1,673,021 | |
| Oportun Issuance Trust: | |||
| Series 2021-B, Class C, 3.65%, 5/8/31(1) | 976 | 915,376 | |
| Series 2021-C, Class B, 2.67%, 10/8/31(1) | 2,995 | 2,744,852 | |
| Series 2021-C, Class C, 3.61%, 10/8/31(1) | 470 | 422,196 | |
| Pagaya AI Debt Selection Trust: | |||
| Series 2020-3, Class B, 3.22%, 5/17/27(1) | 1,570 | 1,559,235 | |
| Series 2021-2, 3.00%, 1/25/29(1) | 1,193 | 1,131,193 | |
| Series 2021-3, Class C, 3.27%, 5/15/29(1) | 3,950 | 3,671,988 | |
| Series 2021-5, Class C, 3.93%, 8/15/29(1) | 1,262 | 1,130,203 | |
| Planet Fitness Master Issuer, LLC: | |||
| Series 2018-1A, Class A2II, 4.666%, 9/5/48(1) | 342 | 333,597 | |
| Series 2019-1A, Class A2, 3.858%, 12/5/49(1) | 527 | 469,726 | |
| PMT Issuer Trust, Series 2021-FT1, Class A, 4.624%, (1 mo. USD LIBOR + 3.00%), 3/25/26(1)(4) | 500 | 494,046 | |
| PNMAC GMSR Issuer Trust: | |||
| Series 2018-GT1, Class A, 4.474%, (1 mo. USD LIBOR + 2.85%), 2/25/23(1)(4) | 750 | 745,685 | |
| Series 2018-GT2, Class A, 4.274%, (1 mo. USD LIBOR + 2.65%), 8/25/25(1)(4) | 500 | 493,377 | |
| Prodigy Finance, Series 2021-1A, Class C, 5.374%, (1 mo. USD LIBOR + 3.75%), 7/25/51(1)(4) | 986 | 974,141 | |
| Prosper Marketplace Issuance Trust, Series 2019-4A, Class C, 4.95%, 2/17/26(1) | 769 | 766,363 | |
| ServiceMaster Funding, LLC: | |||
| Series 2020-1, Class A2I, 2.841%, 1/30/51(1) | 195 | 168,293 | |
| Series 2020-1, Class A2II, 3.337%, 1/30/51(1) | 422 | 353,895 | |
| SERVPRO Master Issuer, LLC, Series 2019-1A, Class A2, 3.882%, 10/25/49(1) | 1,658 | 1,552,343 | |
| Sonic Capital, LLC, Series 2020-1A, Class A2I, 3.845%, 1/20/50(1) | 1,339 | 1,270,738 | |
| Stack Infrastructure Issuer, LLC: | |||
| Series 2019-1A, Class A2, 4.54%, 2/25/44(1) | 1,823 | 1,809,954 | |
| Series 2019-2A, Class A2, 3.08%, 10/25/44(1) | 200 | 192,458 | |
| Sunnova Helios II Issuer, LLC, Series 2021-A, Class B, 3.15%, 2/20/48(1) | 1,497 | 1,275,830 | |
| Sunnova Sol II Issuer, LLC, Series 2020-2A, Class B, 5.47%, 11/1/55(1) | 668 | 610,448 | |
| Sunnova Sol Issuer, LLC, Series 2020-1A, Class B, 5.54%, 2/1/55(1) | 1,400 | 1,318,374 | |
| Sunrun Xanadu Issuer, LLC, Series 2019-1A, Class A, 3.98%, 6/30/54(1) | 169 | 159,322 | |
| Theorem Funding Trust: | |||
| Series 2020-1A, Class B, 3.95%, 10/15/26(1) | 1,395 | 1,390,699 | |
| Series 2021-1A, Class B, 1.84%, 12/15/27(1) | 891 | 817,521 | |
| Security | Principal Amount (000's omitted) | Value | |
| Thunderbolt Aircraft Lease, Ltd., Series 2017-A, Class C, 4.50%, 5/17/32(1) | $ | 353 | $ 189,453 |
| Upstart Pass-Through Trust, Series 2020-ST1, Class A, 3.75%, 2/20/28(1) | 1,748 | 1,714,556 | |
| Upstart Securitization Trust: | |||
| Series 2020-1, Class C, 4.899%, 4/22/30(1) | 1,934 | 1,892,220 | |
| Series 2020-3, Class C, 6.25%, 11/20/30(1) | 2,300 | 2,255,353 | |
| Series 2021-1, Class B, 1.89%, 3/20/31(1) | 750 | 721,643 | |
| Vantage Data Centers Issuer, LLC: | |||
| Series 2019-1A, Class A2, 3.188%, 7/15/44(1) | 1,225 | 1,191,802 | |
| Series 2020-2A, Class A2, 1.992%, 9/15/45(1) | 820 | 715,232 | |
| Willis Engine Structured Trust V: | |||
| Series 2020-A, Class B, 4.212%, 3/15/45(1) | 235 | 187,716 | |
| Series 2020-A, Class C, 6.657%, 3/15/45(1) | 174 | 114,238 | |
| Total Asset-Backed Securities (identified cost $63,495,528) | $ 59,418,735 | ||
| Collateralized Mortgage Obligations — 8.5% |
| Security | Principal Amount (000's omitted) | Value | |
| Bellemeade Re, Ltd.: | |||
| Series 2017-1, Class B1, 6.374%, (1 mo. USD LIBOR + 4.75%), 10/25/27(1)(4) | $ | 655 | $ 658,273 |
| Series 2021-1A, Class M1C, 3.876%, (30-day average SOFR + 2.95%), 3/25/31(1)(4) | 900 | 884,622 | |
| Series 2021-3A, Class M1B, 2.326%, (30-day average SOFR + 1.40%), 9/25/31(1)(4) | 2,220 | 2,022,177 | |
| CHL GMSR Issuer Trust, Series 2018-GT1, Class A, 4.374%, (1 mo. USD LIBOR + 2.75%), 5/25/23(1)(4) | 783 | 776,360 | |
| Eagle Re, Ltd.: | |||
| Series 2019-1, Class B1, 6.124%, (1 mo. USD LIBOR + 4.50%), 4/25/29(1)(4) | 500 | 472,954 | |
| Series 2021-2, Class M1C, 4.376%, (30-day average SOFR + 3.45%), 4/25/34(1)(4) | 861 | 844,652 | |
| Federal Home Loan Mortgage Corp. Structured Agency Credit Risk Debt Notes: | |||
| Series 2015-HQ2, Class M3, 4.874%, (1 mo. USD LIBOR + 3.25%), 5/25/25(4) | 253 | 254,729 | |
| Series 2019-DNA3, Class B2, 9.774%, (1 mo. USD LIBOR + 8.15%), 7/25/49(1)(4) | 1,270 | 1,277,462 | |
| Series 2019-HQA2, Class B1, 5.724%, (1 mo. USD LIBOR + 4.10%), 4/25/49(1)(4) | 889 | 876,556 | |
| Series 2019-HQA3, Class B1, 4.624%, (1 mo. USD LIBOR + 3.00%), 9/25/49(1)(4) | 410 | 385,198 | |
| Series 2019-HQA4, Class B1, 4.574%, (1 mo. USD LIBOR + 2.95%), 11/25/49(1)(4) | 290 | 277,318 | |
| Series 2020-DNA6, Class B1, 3.926%, (30-day average SOFR + 3.00%), 12/25/50(1)(4) | 275 | 236,524 | |
| Series 2020-HQA2, Class B1, 5.724%, (1 mo. USD LIBOR + 4.10%), 3/25/50(1)(4) | 569 | 531,095 | |
| Security | Principal Amount (000's omitted) | Value | |
| Federal National Mortgage Association Connecticut Avenue Securities: | |||
| Series 2014-C04, Class 1M2, 6.524%, (1 mo. USD LIBOR + 4.90%), 11/25/24(4) | $ | 484 | $ 500,625 |
| Series 2019-R01, Class 2B1, 5.974%, (1 mo. USD LIBOR + 4.35%), 7/25/31(1)(4) | 795 | 795,300 | |
| Series 2019-R02, Class 1B1, 5.774%, (1 mo. USD LIBOR + 4.15%), 8/25/31(1)(4) | 795 | 788,335 | |
| Series 2019-R03, Class 1B1, 5.724%, (1 mo. USD LIBOR + 4.10%), 9/25/31(1)(4) | 795 | 786,778 | |
| Series 2019-R05, Class 1B1, 5.724%, (1 mo. USD LIBOR + 4.10%), 7/25/39(1)(4) | 1,275 | 1,249,356 | |
| Series 2019-R06, Class 2B1, 5.374%, (1 mo. USD LIBOR + 3.75%), 9/25/39(1)(4) | 1,809 | 1,716,358 | |
| Series 2019-R07, Class 1B1, 5.024%, (1 mo. USD LIBOR + 3.40%), 10/25/39(1)(4) | 1,518 | 1,414,801 | |
| Series 2020-R02, Class 2B1, 4.624%, (1 mo. USD LIBOR + 3.00%), 1/25/40(1)(4) | 494 | 443,159 | |
| Series 2021-R01, Class 1B2, 6.926%, (30-day average SOFR + 6.00%), 10/25/41(1)(4) | 2,287 | 1,921,163 | |
| Series 2021-R02, Class 2B1, 4.226%, (30-day average SOFR + 3.30%), 11/25/41(1)(4) | 180 | 154,780 | |
| Home Re, Ltd.: | |||
| Series 2018-1, Class M2, 4.624%, (1 mo. USD LIBOR + 3.00%), 10/25/28(1)(4) | 4,385 | 4,295,832 | |
| Series 2021-1, Class M1C, 3.924%, (1 mo. USD LIBOR + 2.30%), 7/25/33(1)(4) | 325 | 308,953 | |
| Series 2021-1, Class M2, 4.474%, (1 mo. USD LIBOR + 2.85%), 7/25/33(1)(4) | 1,295 | 1,182,955 | |
| Radnor Re, Ltd., Series 2021-2, Class M1A, 2.776%, (30-day average SOFR + 1.85%), 11/25/31(1)(4) | 455 | 451,644 | |
| Total Collateralized Mortgage Obligations (identified cost $26,937,081) | $ 25,507,959 | ||
| Commercial Mortgage-Backed Securities — 9.2% |
| Security | Principal Amount (000's omitted) | Value | |
| BAMLL Commercial Mortgage Securities Trust: | |||
| Series 2019-BPR, Class ENM, 3.843%, 11/5/32(1)(3) | $ | 3,865 | $ 3,241,822 |
| Series 2019-BPR, Class FNM, 3.843%, 11/5/32(1)(3) | 1,555 | 1,284,409 | |
| BBCMS Mortgage Trust, Series 2017-DELC, Class F, 4.824%, (1 mo. USD LIBOR + 3.50%), 8/15/36(1)(4) | 1,610 | 1,511,616 | |
| BX Commercial Mortgage Trust, Series 2021-VOLT, Class D, 2.974%, (1 mo. USD LIBOR + 1.65%), 9/15/36(1)(4) | 2,362 | 2,215,123 | |
| CGMS Commercial Mortgage Trust, Series 2017-MDRB, Class A, 2.424%, (1 mo. USD LIBOR + 1.10%), 7/15/30(1)(4) | 406 | 405,848 | |
| Credit Suisse Mortgage Trust, Series 2022-CNTR, Class A, 5.223%, (1 mo. SOFR + 3.944%), 1/15/24(1)(4) | 1,481 | 1,369,360 | |
| Extended Stay America Trust, Series 2021-ESH, Class D, 3.575%, (1 mo. USD LIBOR + 2.25%), 7/15/38(1)(4) | 2,251 | 2,178,113 | |
| Security | Principal Amount (000's omitted) | Value | |
| Federal National Mortgage Association Multifamily Connecticut Avenue Securities Trust: | |||
| Series 2019-01, Class M10, 4.874%, (1 mo. USD LIBOR + 3.25%), 10/15/49(1)(4) | $ | 1,660 | $ 1,547,414 |
| Series 2020-01, Class M10, 5.374%, (1 mo. USD LIBOR + 3.75%), 3/25/50(1)(4) | 2,252 | 2,032,039 | |
| JPMorgan Chase Commercial Mortgage Securities Trust, Series 2014-DSTY, Class B, 3.771%, 6/10/27(1) | 605 | 171,518 | |
| Med Trust, Series 2021-MDLN, Class G, 6.575%, (1 mo. USD LIBOR + 5.25%), 11/15/38(1)(4) | 1,130 | 1,026,318 | |
| Morgan Stanley Capital I Trust: | |||
| Series 2017-CLS, Class E, 3.274%, (1 mo. USD LIBOR + 1.95%), 11/15/34(1)(4)(5) | 671 | 653,748 | |
| Series 2017-CLS, Class F, 3.924%, (1 mo. USD LIBOR + 2.60%), 11/15/34(1)(4)(5) | 2,946 | 2,860,674 | |
| Series 2019-BPR, Class B, 3.674%, (1 mo. USD LIBOR + 2.35%), 5/15/36(1)(4)(5) | 2,621 | 2,507,944 | |
| Series 2019-BPR, Class C, 4.624%, (1 mo. USD LIBOR + 3.30%), 5/15/36(1)(4)(5) | 960 | 905,098 | |
| VMC Finance, LLC, Series 2021-HT1, Class B, 6.112%, (1 mo. USD LIBOR + 4.50%), 1/18/37(1)(4) | 3,728 | 3,491,755 | |
| Total Commercial Mortgage-Backed Securities (identified cost $29,594,820) | $ 27,402,799 | ||
| Convertible Bonds — 0.9% |
| Security | Principal Amount (000's omitted) | Value | |
| Technology — 0.9% | |||
| 1Life Healthcare, Inc., 3.00%, 6/15/25 | $ | 1,051 | $ 867,600 |
| ams-OSRAM AG, 0.875%, 9/28/22(6) | 2,000 | 1,956,789 | |
| Total Convertible Bonds (identified cost $2,910,467) | $ 2,824,389 | ||
| Corporate Bonds — 33.5% |
| Security | Principal Amount (000's omitted) | Value | |
| Basic Materials — 0.2% | |||
| South32 Treasury, Ltd., 4.35%, 4/14/32(1) | $ | 744 | $ 695,871 |
| $ 695,871 | |||
| Communications — 2.7% | |||
| AT&T, Inc.: | |||
| 3.50%, 9/15/53 | $ | 1,059 | $ 804,507 |
| 3.65%, 6/1/51 | 221 | 173,186 | |
| Security | Principal Amount (000's omitted) | Value | |
| Communications (continued) | |||
| CCO Holdings, LLC/CCO Holdings Capital Corp., 5.00%, 2/1/28(1) | $ | 2,493 | $ 2,308,904 |
| Charter Communications Operating, LLC/Charter Communications Operating Capital, 4.80%, 3/1/50 | 1,350 | 1,072,392 | |
| Level 3 Financing, Inc., 3.75%, 7/15/29(1) | 450 | 348,750 | |
| Nokia Oyj: | |||
| 4.375%, 6/12/27 | 1,301 | 1,230,827 | |
| 6.625%, 5/15/39 | 750 | 743,003 | |
| SES Global Americas Holdings GP, 5.30%, 3/25/44(1) | 410 | 350,254 | |
| SES S.A., 5.30%, 4/4/43(1) | 245 | 209,110 | |
| T-Mobile USA, Inc.: | |||
| 2.25%, 2/15/26 | 277 | 249,786 | |
| 2.625%, 4/15/26 | 776 | 705,671 | |
| $ 8,196,390 | |||
| Consumer, Cyclical — 5.3% | |||
| Air Canada, 3.875%, 8/15/26(1) | $ | 1,040 | $ 881,863 |
| American Airlines, Inc./AAdvantage Loyalty IP, Ltd.: | |||
| 5.50%, 4/20/26(1) | 2,932 | 2,704,184 | |
| 5.75%, 4/20/29(1) | 267 | 228,864 | |
| Bath & Body Works, Inc.: | |||
| 6.625%, 10/1/30(1) | 625 | 541,462 | |
| 6.875%, 11/1/35(7) | 621 | 506,407 | |
| 7.60%, 7/15/37 | 306 | 248,073 | |
| Brunswick Corp., 5.10%, 4/1/52 | 1,100 | 822,810 | |
| Dave & Buster's, Inc., 7.625%, 11/1/25(1) | 1,505 | 1,487,956 | |
| Delta Air Lines, Inc./SkyMiles IP, Ltd., 4.75%, 10/20/28(1) | 757 | 715,662 | |
| Dick's Sporting Goods, Inc., 4.10%, 1/15/52 | 709 | 472,310 | |
| Ford Motor Co., 4.75%, 1/15/43 | 728 | 520,913 | |
| Ford Motor Credit Co., LLC, 3.375%, 11/13/25 | 1,294 | 1,169,284 | |
| Lithia Motors, Inc.: | |||
| 3.875%, 6/1/29(1) | 635 | 540,744 | |
| 4.375%, 1/15/31(1) | 1,274 | 1,088,251 | |
| Macy's Retail Holdings, LLC, 4.30%, 2/15/43 | 495 | 312,776 | |
| Magallanes, Inc., 5.05%, 3/15/42(1) | 1,762 | 1,501,811 | |
| MDC Holdings, Inc., 2.50%, 1/15/31 | 894 | 660,757 | |
| Powdr Corp., 6.00%, 8/1/25(1) | 1,285 | 1,281,884 | |
| $ 15,686,011 | |||
| Consumer, Non-cyclical — 3.3% | |||
| Ashtead Capital, Inc.: | |||
| 4.00%, 5/1/28(1) | $ | 441 | $ 398,467 |
| 4.25%, 11/1/29(1) | 514 | 452,695 | |
| Avantor Funding, Inc., 4.625%, 7/15/28(1) | 1,302 | 1,196,968 | |
| Avon Products, Inc., 8.45%, 3/15/43 | 429 | 415,707 | |
| Block Financial, LLC, 3.875%, 8/15/30 | 1,108 | 997,585 | |
| Security | Principal Amount (000's omitted) | Value | |
| Consumer, Non-cyclical (continued) | |||
| Centene Corp.: | |||
| 3.375%, 2/15/30 | $ | 469 | $ 399,079 |
| 4.25%, 12/15/27 | 897 | 840,103 | |
| 4.625%, 12/15/29 | 543 | 507,941 | |
| Hikma Finance USA, LLC, 3.25%, 7/9/25(6) | 958 | 910,598 | |
| Natura & Co. Luxembourg Holdings S.a.r.l., 6.00%, 4/19/29(1)(7) | 1,410 | 1,244,029 | |
| Natura Cosmeticos S.A., 4.125%, 5/3/28(1) | 526 | 433,845 | |
| Perrigo Finance Unlimited Co., 4.40%, 6/15/30 | 1,119 | 1,000,141 | |
| Smithfield Foods, Inc.: | |||
| 2.625%, 9/13/31(1) | 437 | 345,562 | |
| 5.20%, 4/1/29(1) | 595 | 585,158 | |
| $ 9,727,878 | |||
| Energy — 1.2% | |||
| NuStar Logistics, L.P.: | |||
| 6.00%, 6/1/26 | $ | 340 | $ 318,502 |
| 6.375%, 10/1/30 | 440 | 382,992 | |
| TerraForm Power Operating, LLC: | |||
| 4.75%, 1/15/30(1) | 1,442 | 1,237,589 | |
| 5.00%, 1/31/28(1) | 1,875 | 1,701,787 | |
| $ 3,640,870 | |||
| Financial — 17.3% | |||
| AerCap Holdings N.V., 5.875% to 10/10/24, 10/10/79(7)(8) | $ | 173 | $ 148,449 |
| AerCap Ireland Capital DAC/AerCap Global Aviation Trust: | |||
| 1.65%, 10/29/24 | 1,074 | 992,840 | |
| 1.75%, 10/29/24 | 615 | 567,961 | |
| Air Lease Corp., 2.875%, 1/15/32 | 1,890 | 1,477,149 | |
| Alliance Data Systems Corp., 4.75%, 12/15/24(1) | 1,734 | 1,592,653 | |
| Alliant Holdings Intermediate, LLC/Alliant Holdings Co-Issuer, 6.75%, 10/15/27(1) | 925 | 823,268 | |
| American Assets Trust, L.P., 3.375%, 2/1/31 | 1,010 | 865,341 | |
| American National Group, Inc., 6.144%, 6/13/32(1) | 1,140 | 1,130,650 | |
| Bank of America Corp.: | |||
| 2.60%, (SOFR + 1.10%), 4/25/25(4) | 1,570 | 1,561,414 | |
| 2.83%, (SOFR + 1.33%), 4/2/26(4) | 1,576 | 1,556,056 | |
| 3.846% to 3/8/32, 3/8/37(8) | 4,962 | 4,294,499 | |
| BankUnited, Inc., 5.125%, 6/11/30 | 526 | 510,005 | |
| BBVA Bancomer S.A./Texas, 5.125% to 1/18/28, 1/18/33(1)(8) | 1,538 | 1,304,947 | |
| Broadstone Net Lease, LLC, 2.60%, 9/15/31 | 305 | 249,075 | |
| CI Financial Corp.: | |||
| 3.20%, 12/17/30 | 1,140 | 892,548 | |
| 4.10%, 6/15/51 | 352 | 228,621 | |
| Citigroup, Inc.: | |||
| 2.17%, (SOFR + 0.67%), 5/1/25(4) | 1,609 | 1,578,706 | |
| Security | Principal Amount (000's omitted) | Value | |
| Financial (continued) | |||
| Citigroup, Inc.: (continued) | |||
| 3.785% to 3/17/32, 3/17/33(8) | $ | 1,485 | $ 1,339,283 |
| 4.00% to 12/10/25(8)(9) | 659 | 571,683 | |
| Enact Holdings, Inc., 6.50%, 8/15/25(1) | 2,577 | 2,435,239 | |
| EPR Properties, 3.75%, 8/15/29 | 2,408 | 2,006,373 | |
| Goldman Sachs Group, Inc. (The): | |||
| 2.08%, (SOFR + 0.58%), 3/8/24(4) | 2,415 | 2,376,201 | |
| 3.102% to 2/24/32, 2/24/33(8) | 1,509 | 1,290,264 | |
| HAT Holdings I, LLC/HAT Holdings II, LLC: | |||
| 3.375%, 6/15/26(1) | 2,804 | 2,418,716 | |
| 6.00%, 4/15/25(1) | 774 | 742,518 | |
| Iron Mountain, Inc.: | |||
| 4.50%, 2/15/31(1) | 929 | 761,780 | |
| 5.00%, 7/15/28(1) | 1,114 | 988,727 | |
| JPMorgan Chase & Co., 2.10%, (SOFR + 0.60%), 12/10/25(4) | 1,611 | 1,558,714 | |
| Liberty Mutual Group, Inc., 4.125% to 9/15/26, 12/15/51(1)(8) | 1,457 | 1,164,486 | |
| Macquarie Bank, Ltd.: | |||
| 3.052% to 3/3/31, 3/3/36(1)(8) | 864 | 686,027 | |
| 3.624%, 6/3/30(1) | 631 | 550,930 | |
| Newmark Group, Inc., 6.125%, 11/15/23 | 1,445 | 1,442,099 | |
| OneMain Finance Corp.: | |||
| 3.50%, 1/15/27 | 693 | 555,381 | |
| 7.125%, 3/15/26 | 966 | 895,067 | |
| PennyMac Financial Services, Inc., 4.25%, 2/15/29(1) | 842 | 620,423 | |
| Radian Group, Inc.: | |||
| 4.875%, 3/15/27 | 1,415 | 1,270,283 | |
| 6.625%, 3/15/25 | 505 | 493,935 | |
| Rocket Mortgage, LLC/Rocket Mortgage Co-Issuer, Inc.: | |||
| 2.875%, 10/15/26(1) | 447 | 370,666 | |
| 3.875%, 3/1/31(1) | 1,426 | 1,072,559 | |
| Sabra Health Care, L.P., 3.20%, 12/1/31 | 1,244 | 988,636 | |
| Societe Generale S.A., 6.221% to 6/15/32, 6/15/33(1)(8) | 545 | 520,774 | |
| Synovus Bank/Columbus, GA, 4.00% to 10/29/25, 10/29/30(8) | 729 | 707,439 | |
| Synovus Financial Corp., 5.90% to 2/7/24, 2/7/29(8) | 979 | 946,559 | |
| Texas Capital Bancshares, Inc., 4.00% to 5/6/26, 5/6/31(8) | 981 | 904,129 | |
| Truist Financial Corp., 5.10% to 3/1/30(8)(9) | 868 | 789,880 | |
| UBS Group AG, 4.375% to 2/10/31(1)(8)(9) | 534 | 392,009 | |
| UniCredit SpA: | |||
| 5.459% to 6/30/30, 6/30/35(1)(8) | 332 | 268,588 | |
| 5.861% to 6/19/27, 6/19/32(1)(8) | 700 | 616,760 | |
| $ 51,520,310 | |||
| Industrial — 0.7% | |||
| Imola Merger Corp., 4.75%, 5/15/29(1) | $ | 1,423 | $ 1,195,306 |
| Security | Principal Amount (000's omitted) | Value | |
| Industrial (continued) | |||
| Valmont Industries, Inc., 5.00%, 10/1/44 | $ | 937 | $ 857,512 |
| $ 2,052,818 | |||
| Technology — 1.4% | |||
| DXC Technology Co., 2.375%, 9/15/28 | $ | 248 | $ 213,649 |
| Kyndryl Holdings, Inc., 2.70%, 10/15/28(1) | 2,135 | 1,702,444 | |
| Seagate HDD Cayman: | |||
| 3.375%, 7/15/31 | 500 | 389,537 | |
| 5.75%, 12/1/34 | 2,038 | 1,797,112 | |
| $ 4,102,742 | |||
| Utilities — 1.4% | |||
| Clearway Energy Operating, LLC, 3.75%, 1/15/32(1) | $ | 401 | $ 318,424 |
| Engie Energia Chile S.A., 3.40%, 1/28/30(1) | 790 | 672,416 | |
| NextEra Energy Operating Partners, L.P., 4.50%, 9/15/27(1) | 1,861 | 1,726,877 | |
| Pattern Energy Operations, L.P./Pattern Energy Operations, Inc., 4.50%, 8/15/28(1) | 1,760 | 1,534,483 | |
| $ 4,252,200 | |||
| Total Corporate Bonds (identified cost $112,842,350) | $ 99,875,090 | ||
| High Social Impact Investments — 0.2% |
| Security | Principal Amount (000's omitted) | Value | |
| Calvert Impact Capital, Inc., Community Investment Notes, 1.50%, 12/15/23(10)(11) | $ | 500 | $ 463,820 |
| Total High Social Impact Investments (identified cost $500,000) | $ 463,820 | ||
| Mutual Funds — 0.2% |
| Security | Shares | Value | |
| Fixed-Income Mutual Funds — 0.2% | |||
| Calvert Floating-Rate Advantage Fund, Class R6(12) | 77,929 | $ 672,524 | |
| Total Mutual Funds (identified cost $715,385) | $ 672,524 | ||
| Preferred Stocks — 1.2% |
| Security | Shares | Value | |
| Oil, Gas & Consumable Fuels — 0.4% | |||
| NuStar Energy, L.P., Series B, 7.673%, (3 mo. USD LIBOR + 5.643%)(4) | 53,308 | $ 1,097,612 | |
| $ 1,097,612 | |||
| Real Estate Management & Development — 0.5% | |||
| Brookfield Property Partners, L.P., Series A, 5.75% | 78,480 | $ 1,340,438 | |
| $ 1,340,438 | |||
| Wireless Telecommunication Services — 0.3% | |||
| United States Cellular Corp.: | |||
| 5.50% | 25,650 | $ 476,320 | |
| 6.25% | 27,000 | 553,500 | |
| $ 1,029,820 | |||
| Total Preferred Stocks (identified cost $4,304,833) | $ 3,467,870 | ||
| Senior Floating-Rate Loans — 3.0%(13) |
| Borrower/Description | Principal Amount (000's omitted) | Value | |
| Airlines — 0.4% | |||
| SkyMiles IP, Ltd., Term Loan, 4.813%, (3 mo. USD LIBOR + 3.75%), 10/20/27 | $ | 1,100 | $ 1,091,063 |
| $ 1,091,063 | |||
| Auto Components — 0.2% | |||
| Clarios Global, L.P., Term Loan, 4.916%, (1 mo. USD LIBOR + 3.25%), 4/30/26 | $ | 600 | $ 559,500 |
| $ 559,500 | |||
| Automobiles — 0.0%(14) | |||
| Bombardier Recreational Products, Inc., Term Loan, 3.666%, (1 mo. USD LIBOR + 2.00%), 5/24/27 | $ | 135 | $ 125,056 |
| $ 125,056 | |||
| Diversified Telecommunication Services — 0.7% | |||
| CenturyLink, Inc., Term Loan, 3.916%, (1 mo. USD LIBOR + 2.25%), 3/15/27 | $ | 506 | $ 466,580 |
| Level 3 Financing, Inc., Term Loan, 3.416%, (1 mo. USD LIBOR + 1.75%), 3/1/27 | 142 | 131,642 | |
| UPC Financing Partnership, Term Loan, 4.324%, (1 mo. USD LIBOR + 3.00%), 1/31/29 | 500 | 474,583 | |
| Virgin Media Bristol, LLC, Term Loan, 4.574%, (1 mo. USD LIBOR + 3.25%), 1/31/29 | 500 | 479,375 | |
| Borrower/Description | Principal Amount (000's omitted) | Value | |
| Diversified Telecommunication Services (continued) | |||
| Ziggo Financing Partnership, Term Loan, 3.824%, (1 mo. USD LIBOR + 2.50%), 4/30/28 | $ | 510 | $ 476,531 |
| $ 2,028,711 | |||
| Health Care Providers & Services — 0.1% | |||
| Select Medical Corporation, Term Loan, 4.17%, (1 mo. USD LIBOR + 2.50%), 3/6/25 | $ | 325 | $ 311,458 |
| $ 311,458 | |||
| Health Care Technology — 0.1% | |||
| Change Healthcare Holdings, LLC, Term Loan, 4.166%, (1 mo. USD LIBOR + 2.50%), 3/1/24 | $ | 272 | $ 265,190 |
| $ 265,190 | |||
| IT Services — 0.3% | |||
| Asurion, LLC: | |||
| Term Loan, 4.791%, (1 mo. USD LIBOR + 3.125%), 11/3/23 | $ | 509 | $ 489,958 |
| Term Loan, 4.916%, (1 mo. USD LIBOR + 3.25%), 12/23/26 | 296 | 268,720 | |
| Informatica, LLC, Term Loan, 4.438%, (1 mo. USD LIBOR + 2.75%), 10/27/28 | 299 | 284,849 | |
| $ 1,043,527 | |||
| Real Estate Management & Development — 0.2% | |||
| Cushman & Wakefield U.S. Borrower, LLC, Term Loan, 4.416%, (1 mo. USD LIBOR + 2.75%), 8/21/25 | $ | 586 | $ 551,844 |
| $ 551,844 | |||
| Software — 0.6% | |||
| Banff Merger Sub, Inc., Term Loan, 5.416%, (1 mo. USD LIBOR + 3.75%), 10/2/25 | $ | 442 | $ 412,321 |
| Hyland Software, Inc., Term Loan, 5.166%, (1 mo. USD LIBOR + 3.50%), 7/1/24 | 705 | 682,834 | |
| Seattle Spinco, Inc., Term Loan, 4.416%, (1 mo. USD LIBOR + 2.75%), 6/21/24 | 232 | 220,934 | |
| Ultimate Software Group, Inc. (The), Term Loan, 5.416%, (1 mo. USD LIBOR + 3.75%), 5/4/26 | 497 | 469,895 | |
| $ 1,785,984 | |||
| Specialty Retail — 0.4% | |||
| Petsmart, Inc., Term Loan, 4.50%, (3 mo. USD LIBOR + 3.75%, Floor 0.75%), 2/11/28 | $ | 1,197 | $ 1,128,532 |
| $ 1,128,532 | |||
| Total Senior Floating-Rate Loans (identified cost $9,387,785) | $ 8,890,865 | ||
| U.S. Government Agency Mortgage-Backed Securities — 1.0% |
| Security | Principal Amount (000's omitted) | Value | |
| Federal National Mortgage Association, 4.50%, 30-Year, TBA(15) | $ | 3,000 | $ 3,011,485 |
| Total U.S. Government Agency Mortgage-Backed Securities (identified cost $3,027,422) | $ 3,011,485 | ||
| U.S. Treasury Obligations — 16.4% |
| Security | Principal Amount (000's omitted) | Value | |
| U.S. Treasury Notes: | |||
| 0.25%, 3/15/24 | $ | 16,288 | $ 15,554,404 |
| 0.25%, 5/31/25 | 14,310 | 13,206,845 | |
| 1.25%, 4/30/28 | 50 | 45,109 | |
| 1.743%, (3 mo. Treasury Bill Rate - 0.015%), 1/31/24(4) | 14,818 | 14,835,271 | |
| 2.75%, 4/30/27 | 5,250 | 5,179,658 | |
| Total U.S. Treasury Obligations (identified cost $50,124,680) | $ 48,821,287 | ||
| Short-Term Investments — 5.7% | |||
| Affiliated Fund — 5.1% | |||
| Security | Shares | Value | |
| Morgan Stanley Institutional Liquidity Funds - Government Portfolio, Institutional Class, 1.38%(16) | 15,254,123 | $ 15,254,123 | |
| Total Affiliated Fund (identified cost $15,254,123) | $ 15,254,123 | ||
| Securities Lending Collateral — 0.6% | |||
| Security | Shares | Value | |
| State Street Navigator Securities Lending Government Money Market Portfolio, 1.56%(17) | 1,610,435 | $ 1,610,435 | |
| Total Securities Lending Collateral (identified cost $1,610,435) | $ 1,610,435 | ||
| Total Short-Term Investments (identified cost $16,864,558) | $ 16,864,558 | ||
| Total Investments — 99.7% (identified cost $320,704,909) | $297,221,381 | ||
| Other Assets, Less Liabilities — 0.3% | $ 957,445 | ||
| Net Assets — 100.0% | $298,178,826 | ||
| The percentage shown for each investment category in the Schedule of Investments is based on net assets. | |
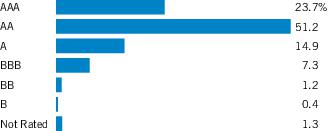
| (1) | Security exempt from registration under Rule 144A of the Securities Act of 1933, as amended. These securities may be sold in certain transactions in reliance on an exemption from registration (normally to qualified institutional buyers). At June 30, 2022, the aggregate value of these securities is $159,667,479 or 53.5% of the Fund's net assets. |
| (2) | Principal Amount is denominated in Canadian dollars. |
| (3) | Weighted average fixed-rate coupon that changes/updates monthly. Rate shown is the rate at June 30, 2022. |
| (4) | Variable rate security. The stated interest rate represents the rate in effect at June 30, 2022. |
| (5) | Represents an investment in an issuer that may be deemed to be an affiliate (see Note 8). |
| (6) | Security exempt from registration under Regulation S of the Securities Act of 1933, as amended, which exempts from registration securities offered and sold outside the United States. Security may not be offered or sold in the United States except pursuant to an exemption from, or in a transaction not subject to, the registration requirements of the Securities Act of 1933, as amended. At June 30, 2022, the aggregate value of these securities is $2,867,387 or 1.0% of the Fund’s net assets. |
| (7) | All or a portion of this security was on loan at June 30, 2022. The aggregate market value of securities on loan at June 30, 2022 was $1,553,161. |
| (8) | Security converts to variable rate after the indicated fixed-rate coupon period. |
| (9) | Perpetual security with no stated maturity date but may be subject to calls by the issuer. |
| (10) | May be deemed to be an affiliated company (see Note 8). |
| (11) | Restricted security. Total market value of restricted securities amounts to $463,820, which represents 0.2% of the net assets of the Fund as of June 30, 2022. |
| (12) | Affiliated fund (see Note 8). |
| (13) | Senior floating-rate loans (Senior Loans) often require prepayments from excess cash flows or permit the borrowers to repay at their election. The degree to which borrowers repay, whether as a contractual requirement or at their election, cannot be predicted with accuracy. As a result, the actual remaining maturity may be substantially less than the stated maturities shown. However, Senior Loans will typically have an expected average life of approximately two to four years. Senior Loans typically have rates of interest which are redetermined periodically by reference to a base lending rate, plus a spread. These base lending rates are primarily the London Interbank Offered Rate (“LIBOR”) or the Secured Overnight Financing Rate (“SOFR”) and secondarily, the prime rate offered by one or more major United States banks (the “Prime Rate”). Base lending rates may be subject to a floor, or minimum rate. Rates for SOFR are generally 1 or 3-month tenors and may also be subject to a credit spread adjustment. Senior Loans are generally subject to contractual restrictions that must be satisfied before they can be bought or sold. |
| (14) | Amount is less than 0.05%. |
| (15) | TBA (To Be Announced) securities are purchased on a forward commitment basis with an approximate principal amount and maturity date. The actual principal amount and maturity date are determined upon settlement. |
| (16) | May be deemed to be an affiliated investment company. The rate shown is the annualized seven-day yield as of June 30, 2022. |
| (17) | Represents investment of cash collateral received in connection with securities lending. |
| Currency Purchased | Currency Sold | Counterparty | Settlement Date | Unrealized Appreciation | Unrealized (Depreciation) | ||
| USD | 634,275 | CAD | 813,200 | State Street Bank and Trust Company | 8/31/22 | $ 2,440 | $ — |
| USD | 535,159 | CAD | 686,265 | State Street Bank and Trust Company | 8/31/22 | 1,950 | — |
| $4,390 | $ — | ||||||
| Reference Entity | Notional Amount* (000's omitted) | Contract Annual Fixed Rate** | Current Market Annual Fixed Rate*** | Termination Date | Value | Unamortized Upfront Receipts (Payments) | Unrealized Appreciation (Depreciation) |
| Markit CDX North America High Yield Index (CDX.NA.HY.38.V2) | $ 1,510 | 5.00% (pays quarterly)(1) | 5.78% | 6/20/27 | $ (42,778) | $ 50,911 | $ 8,133 |
| Total | $1,510 | $(42,778) | $50,911 | $8,133 |
| * | If the Fund is the seller of credit protection, the notional amount is the maximum potential amount of future payments the Fund could be required to make if a credit event, as defined in the credit default swap agreement, were to occur. At June 30, 2022, such maximum potential amount for all open credit default swaps in which the Fund is the seller was $1,509,750. |
| ** | The contract annual fixed rate represents the fixed rate of interest received by the Fund (as a seller of protection) or paid by the Fund (as a buyer of protection) on the notional amount of the credit default swap contract. |
| *** | Current market annual fixed rates, utilized in determining the net unrealized appreciation or depreciation as of period end, serve as an indicator of the market’s perception of the current status of the payment/performance risk associated with the credit derivative. The current market annual fixed rate of a particular reference entity reflects the cost, as quoted by the pricing vendor, of selling protection against default of that entity as of period end and may include upfront payments required to be made to enter into the agreement. The higher the fixed rate, the greater the market perceived risk of a credit event involving the reference entity. A rate identified as “Defaulted” indicates a credit event has occurred for the reference entity. |
| (1) | Upfront payment is exchanged with the counterparty as a result of the standardized trading coupon. |
| Description | Number of Contracts | Position | Expiration Date | Notional Amount | Value/ Unrealized Appreciation (Depreciation) |
| Interest Rate Futures | |||||
| U.S. Long Treasury Bond | (6) | Short | 9/21/22 | $ (831,750) | $ 16,676 |
| U.S. Ultra 10-Year Treasury Note | (196) | Short | 9/21/22 | (24,965,500) | 300,452 |
| U.S. Ultra-Long Treasury Bond | (64) | Short | 9/21/22 | (9,878,000) | 218,767 |
| $535,895 |
| Description | Acquisition Date | Cost |
| Calvert Impact Capital, Inc., Community Investment Notes, 1.50%, 12/15/23 | 12/14/20 | $500,000 |
| Abbreviations: | |
| LIBOR | – London Interbank Offered Rate |
| SOFR | – Secured Overnight Financing Rate |
| TBA | – To Be Announced |
| Currency Abbreviations: | |
| CAD | – Canadian Dollar |
| USD | – United States Dollar |
| June 30, 2022 | |
| Assets | |
| Investments in securities of unaffiliated issuers, at value (identified cost $297,085,214) - including $1,553,161 of securities on loan | $ 273,903,450 |
| Investments in securities of affiliated issuers, at value (identified cost $23,619,695) | 23,317,931 |
| Receivable for open forward foreign currency exchange contracts | 4,390 |
| Cash | 204,154 |
| Deposits for derivatives collateral: | |
| Futures contracts | 970,000 |
| Centrally cleared swaps | 137,940 |
| Receivable for investments sold | 3,058,878 |
| Receivable for capital shares sold | 805,556 |
| Receivable for variation margin on open centrally cleared swap contracts | 19,998 |
| Dividends and interest receivable | 1,607,499 |
| Dividends and interest receivable - affiliated | 38,194 |
| Securities lending income receivable | 599 |
| Trustees' deferred compensation plan | 269,878 |
| Total assets | $304,338,467 |
| Liabilities | |
| Payable for variation margin on open futures contracts | $ 415,951 |
| Payable for when-issued/delayed delivery/forward commitment securities | 3,032,297 |
| Payable for capital shares redeemed | 587,698 |
| Distributions payable | 18,929 |
| Deposits for securities loaned | 1,610,435 |
| Payable to affiliates: | |
| Investment advisory fee | 84,669 |
| Administrative fee | 29,730 |
| Distribution and service fees | 7,155 |
| Sub-transfer agency fee | 2,786 |
| Trustees' deferred compensation plan | 269,878 |
| Other | 22,494 |
| Accrued expenses | 77,619 |
| Total liabilities | $ 6,159,641 |
| Net Assets | $298,178,826 |
| Sources of Net Assets | |
| Paid-in capital | $ 317,760,307 |
| Accumulated loss | (19,581,481) |
| Net Assets | $298,178,826 |
| Class A Shares | |
| Net Assets | $ 29,206,511 |
| Shares Outstanding | 2,042,140 |
| Net Asset Value and Redemption Price Per Share (net assets ÷ shares of beneficial interest outstanding) | $ 14.30 |
| Maximum Offering Price Per Share (100 ÷ 96.75 of net asset value per share) | $ 14.78 |
| June 30, 2022 | |
| Class C Shares | |
| Net Assets | $ 1,238,761 |
| Shares Outstanding | 86,559 |
| Net Asset Value and Offering Price Per Share* (net assets ÷ shares of beneficial interest outstanding) | $ 14.31 |
| Class I Shares | |
| Net Assets | $ 228,689,129 |
| Shares Outstanding | 16,034,021 |
| Net Asset Value, Offering Price and Redemption Price Per Share (net assets ÷ shares of beneficial interest outstanding) | $ 14.26 |
| Class R6 Shares | |
| Net Assets | $ 39,044,425 |
| Shares Outstanding | 2,736,573 |
| Net Asset Value, Offering Price and Redemption Price Per Share (net assets ÷ shares of beneficial interest outstanding) | $ 14.27 |
| On sales of $100,000 or more, the offering price of Class A shares is reduced. | |
| * | Redemption price per share is equal to the net asset value less any applicable contingent deferred sales charge. |
| Six Months Ended | |
| June 30, 2022 | |
| Investment Income | |
| Dividend income | $ 145,946 |
| Dividend income - affiliated issuers | 102,492 |
| Interest and other income | 4,562,465 |
| Interest income - affiliated issuers | 105,972 |
| Securities lending income, net | 7,649 |
| Total investment income | $ 4,924,524 |
| Expenses | |
| Investment advisory fee | $ 517,150 |
| Administrative fee | 177,309 |
| Distribution and service fees: | |
| Class A | 37,788 |
| Class C | 6,191 |
| Trustees' fees and expenses | 7,463 |
| Custodian fees | 6,121 |
| Transfer agency fees and expenses | 133,703 |
| Accounting fees | 33,568 |
| Professional fees | 19,016 |
| Registration fees | 41,468 |
| Reports to shareholders | 12,428 |
| Miscellaneous | 12,317 |
| Total expenses | $ 1,004,522 |
| Waiver and/or reimbursement of expenses by affiliate | $ (14,470) |
| Net expenses | $ 990,052 |
| Net investment income | $ 3,934,472 |
| Realized and Unrealized Gain (Loss) | |
| Net realized gain (loss): | |
| Investment securities | $ (1,147,862) |
| Investment securities - affiliated issuers | 239,289 |
| Swap contracts | 1,232 |
| Futures contracts | 3,761,694 |
| Foreign currency transactions | 7,284 |
| Forward foreign currency exchange contracts | 6,642 |
| Net realized gain | $ 2,868,279 |
| Change in unrealized appreciation (depreciation): | |
| Investment securities | $ (24,470,942) |
| Investment securities - affiliated issuers | (469,734) |
| Futures contracts | 1,102,389 |
| Swap contracts | 8,133 |
| Foreign currency | 38 |
| Forward foreign currency exchange contracts | 4,390 |
| Net change in unrealized appreciation (depreciation) | $(23,825,726) |
| Net realized and unrealized loss | $(20,957,447) |
| Net decrease in net assets from operations | $(17,022,975) |
| Six Months Ended June 30, 2022 (Unaudited) | Year Ended December 31, 2021 | |
| Increase (Decrease) in Net Assets | ||
| From operations: | ||
| Net investment income | $ 3,934,472 | $ 5,281,811 |
| Net realized gain | 2,868,279 | 5,193,035 |
| Net change in unrealized appreciation (depreciation) | (23,825,726) | (2,711,823) |
| Net increase (decrease) in net assets from operations | $ (17,022,975) | $ 7,763,023 |
| Distributions to shareholders: | ||
| Class A | $ (374,338) | $ (918,389) |
| Class C | (10,774) | (31,820) |
| Class I | (3,036,588) | (5,856,583) |
| Class R6 | (592,871) | (1,401,674) |
| Total distributions to shareholders | $ (4,014,571) | $ (8,208,466) |
| Capital share transactions: | ||
| Class A | $ 514,922 | $ 7,191,354 |
| Class C | 77,824 | 26,741 |
| Class I | 44,329,206 | 50,991,323 |
| Class R6 | (5,558,680) | 17,695,205 |
| Net increase in net assets from capital share transactions | $ 39,363,272 | $ 75,904,623 |
| Net increase in net assets | $ 18,325,726 | $ 75,459,180 |
| Net Assets | ||
| At beginning of period | $ 279,853,100 | $ 204,393,920 |
| At end of period | $298,178,826 | $279,853,100 |
| Class A | ||||||
| Six Months Ended June 30, 2022 (Unaudited) | Year Ended December 31, | |||||
| 2021 | 2020 | 2019 | 2018 | 2017 | ||
| Net asset value — Beginning of period | $ 15.35 | $ 15.31 | $ 15.15 | $ 14.64 | $ 15.07 | $ 15.08 |
| Income (Loss) From Operations | ||||||
| Net investment income(1) | $ 0.18 | $ 0.34 | $ 0.40 | $ 0.46 | $ 0.44 | $ 0.37 |
| Net realized and unrealized gain (loss) | (1.05) | 0.21 | 0.16 | 0.52 | (0.42) | 0.11 |
| Total income (loss) from operations | $ (0.87) | $ 0.55 | $ 0.56 | $ 0.98 | $ 0.02 | $ 0.48 |
| Less Distributions | ||||||
| From net investment income | $ (0.18) | $ (0.34) | $ (0.39) | $ (0.47) | $ (0.45) | $ (0.37) |
| From net realized gain | — | (0.17) | — | — | — | (0.12) |
| Tax return of capital | — | — | (0.01) | — | — | — |
| Total distributions | $ (0.18) | $ (0.51) | $ (0.40) | $ (0.47) | $ (0.45) | $ (0.49) |
| Net asset value — End of period | $ 14.30 | $ 15.35 | $ 15.31 | $ 15.15 | $ 14.64 | $ 15.07 |
| Total Return(2) | (5.68)% (3) | 3.62% | 3.86% | 6.76% | 0.12% | 3.21% |
| Ratios/Supplemental Data | ||||||
| Net assets, end of period (000’s omitted) | $29,207 | $30,844 | $23,704 | $26,711 | $24,045 | $15,220 |
| Ratios (as a percentage of average daily net assets):(4) | ||||||
| Total expenses | 0.91% (5) | 0.92% | 0.93% | 0.96% | 0.93% | 1.09% |
| Net expenses | 0.90% (5)(6) | 0.90% | 0.92% | 0.94% | 0.93% | 1.08% |
| Net investment income | 2.43% (5) | 2.18% | 2.70% | 3.05% | 2.96% | 2.41% |
| Portfolio Turnover | 26% (3)(7) | 96% (7) | 104% (7) | 87% | 88% | 111% |
| (1) | Computed using average shares outstanding. |
| (2) | Returns are historical and are calculated by determining the percentage change in net asset value with all distributions reinvested and do not reflect the effect of sales charges, if any. |
| (3) | Not annualized. |
| (4) | Total expenses do not reflect amounts reimbursed and/or waived by the adviser and certain of its affiliates, if applicable. Net expenses are net of all reductions and represent the net expenses paid by the Fund. |
| (5) | Annualized. |
| (6) | Includes a reduction by the investment adviser of a portion of its advisory fee due to the Fund's investment in the Liquidity Fund (equal to less than 0.005% of average daily net assets for the six months ended June 30, 2022). |
| (7) | Includes the effect of To Be Announced (TBA) transactions. |
| Class C | ||||||
| Six Months Ended June 30, 2022 (Unaudited) | Year Ended December 31, | |||||
| 2021 | 2020 | 2019 | 2018 | 2017 | ||
| Net asset value — Beginning of period | $ 15.35 | $ 15.32 | $ 15.16 | $ 14.65 | $ 15.08 | $ 15.09 |
| Income (Loss) From Operations | ||||||
| Net investment income(1) | $ 0.12 | $ 0.22 | $ 0.29 | $ 0.35 | $ 0.33 | $ 0.26 |
| Net realized and unrealized gain (loss) | (1.03) | 0.21 | 0.16 | 0.52 | (0.42) | 0.10 |
| Total income (loss) from operations | $ (0.91) | $ 0.43 | $ 0.45 | $ 0.87 | $ (0.09) | $ 0.36 |
| Less Distributions | ||||||
| From net investment income | $ (0.13) | $ (0.23) | $ (0.28) | $ (0.36) | $ (0.34) | $ (0.25) |
| From net realized gain | — | (0.17) | — | — | — | (0.12) |
| Tax return of capital | — | — | (0.01) | — | — | — |
| Total distributions | $ (0.13) | $ (0.40) | $ (0.29) | $ (0.36) | $ (0.34) | $ (0.37) |
| Net asset value — End of period | $14.31 | $15.35 | $15.32 | $15.16 | $14.65 | $15.08 |
| Total Return(2) | (5.96)% (3) | 2.77% | 3.08% | 6.03% | (0.68)% | 2.41% |
| Ratios/Supplemental Data | ||||||
| Net assets, end of period (000’s omitted) | $ 1,239 | $ 1,249 | $ 1,223 | $ 1,031 | $ 934 | $ 649 |
| Ratios (as a percentage of average daily net assets):(4) | ||||||
| Total expenses | 1.66% (5) | 1.67% | 1.68% | 1.71% | 1.68% | 3.42% |
| Net expenses | 1.65% (5)(6) | 1.65% | 1.67% | 1.70% | 1.68% | 1.84% |
| Net investment income | 1.69% (5) | 1.42% | 1.95% | 2.30% | 2.20% | 1.69% |
| Portfolio Turnover | 26% (3)(7) | 96% (7) | 104% (7) | 87% | 88% | 111% |
| (1) | Computed using average shares outstanding. |
| (2) | Returns are historical and are calculated by determining the percentage change in net asset value with all distributions reinvested and do not reflect the effect of sales charges, if any. |
| (3) | Not annualized. |
| (4) | Total expenses do not reflect amounts reimbursed and/or waived by the adviser and certain of its affiliates, if applicable. Net expenses are net of all reductions and represent the net expenses paid by the Fund. |
| (5) | Annualized. |
| (6) | Includes a reduction by the investment adviser of a portion of its advisory fee due to the Fund's investment in the Liquidity Fund (equal to less than 0.005% of average daily net assets for the six months ended June 30, 2022). |
| (7) | Includes the effect of To Be Announced (TBA) transactions. |
| Class I | ||||||
| Six Months Ended June 30, 2022 (Unaudited) | Year Ended December 31, | |||||
| 2021 | 2020 | 2019 | 2018 | 2017 | ||
| Net asset value — Beginning of period | $ 15.30 | $ 15.27 | $ 15.11 | $ 14.60 | $ 15.02 | $ 15.04 |
| Income (Loss) From Operations | ||||||
| Net investment income(1) | $ 0.20 | $ 0.38 | $ 0.43 | $ 0.50 | $ 0.48 | $ 0.43 |
| Net realized and unrealized gain (loss) | (1.04) | 0.20 | 0.17 | 0.52 | (0.41) | 0.10 |
| Total income (loss) from operations | $ (0.84) | $ 0.58 | $ 0.60 | $ 1.02 | $ 0.07 | $ 0.53 |
| Less Distributions | ||||||
| From net investment income | $ (0.20) | $ (0.38) | $ (0.43) | $ (0.51) | $ (0.49) | $ (0.43) |
| From net realized gain | — | (0.17) | — | — | — | (0.12) |
| Tax return of capital | — | — | (0.01) | — | — | — |
| Total distributions | $ (0.20) | $ (0.55) | $ (0.44) | $ (0.51) | $ (0.49) | $ (0.55) |
| Net asset value — End of period | $ 14.26 | $ 15.30 | $ 15.27 | $ 15.11 | $ 14.60 | $ 15.02 |
| Total Return(2) | (5.52)% (3) | 3.81% | 4.12% | 7.06% | 0.43% | 3.59% |
| Ratios/Supplemental Data | ||||||
| Net assets, end of period (000’s omitted) | $228,689 | $200,170 | $149,364 | $132,062 | $119,207 | $93,868 |
| Ratios (as a percentage of average daily net assets):(4) | ||||||
| Total expenses | 0.66% (5) | 0.67% | 0.68% | 0.71% | 0.68% | 0.70% |
| Net expenses | 0.65% (5)(6) | 0.65% | 0.67% | 0.67% | 0.65% | 0.65% |
| Net investment income | 2.68% (5) | 2.42% | 2.95% | 3.32% | 3.22% | 2.82% |
| Portfolio Turnover | 26% (3)(7) | 96% (7) | 104% (7) | 87% | 88% | 111% |
| (1) | Computed using average shares outstanding. |
| (2) | Returns are historical and are calculated by determining the percentage change in net asset value with all distributions reinvested and do not reflect the effect of sales charges, if any. |
| (3) | Not annualized. |
| (4) | Total expenses do not reflect amounts reimbursed and/or waived by the adviser and certain of its affiliates, if applicable. Net expenses are net of all reductions and represent the net expenses paid by the Fund. |
| (5) | Annualized. |
| (6) | Includes a reduction by the investment adviser of a portion of its advisory fee due to the Fund's investment in the Liquidity Fund (equal to less than 0.005% of average daily net assets for the six months ended June 30, 2022). |
| (7) | Includes the effect of To Be Announced (TBA) transactions. |
| Class R6 | ||||
| Six Months Ended June 30, 2022 (Unaudited) | Year Ended December 31, | Period Ended December 31, | ||
| 2021 | 2020 | 2019 (1) | ||
| Net asset value — Beginning of period | $ 15.31 | $ 15.27 | $ 15.11 | $ 15.00 |
| Income (Loss) From Operations | ||||
| Net investment income | $ 0.20(2) | $ 0.39(2) | $ 0.44(2) | $ 0.33 |
| Net realized and unrealized gain (loss) | (1.03) | 0.21 | 0.17 | 0.11 |
| Total income (loss) from operations | $ (0.83) | $ 0.60 | $ 0.61 | $ 0.44 |
| Less Distributions | ||||
| From net investment income | $ (0.21) | $ (0.39) | $ (0.44) | $ (0.33) |
| From net realized gain | — | (0.17) | — | — |
| From return of capital | — | — | (0.01) | ���— |
| Total distributions | $ (0.21) | $ (0.56) | $ (0.45) | $ (0.33) |
| Net asset value — End of period | $ 14.27 | $ 15.31 | $ 15.27 | $ 15.11 |
| Total Return(3) | (5.54)% (4) | 3.96% | 4.20% | 2.97% (4) |
| Ratios/Supplemental Data | ||||
| Net assets, end of period (000’s omitted) | $39,044 | $47,590 | $30,102 | $41,304 |
| Ratios (as a percentage of average daily net assets):(5) | ||||
| Total expenses | 0.57% (6) | 0.59% | 0.60% | 0.61% (6) |
| Net expenses | 0.56% (6)(7) | 0.57% | 0.59% | 0.61% (6) |
| Net investment income | 2.76% (6) | 2.49% | 3.05% | 3.27% (6) |
| Portfolio Turnover | 26% (4)(8) | 96% (8) | 104% (8) | 87% (9) |
| (1) | For the period from the commencement of operations, May 1, 2019, to December 31, 2019. |
| (2) | Computed using average shares outstanding. |
| (3) | Returns are historical and are calculated by determining the percentage change in net asset value with all distributions reinvested and do not reflect the effect of sales charges, if any. |
| (4) | Not annualized. |
| (5) | Total expenses do not reflect amounts reimbursed and/or waived by the adviser and certain of its affiliates, if applicable. Net expenses are net of all reductions and represent the net expenses paid by the Fund. |
| (6) | Annualized. |
| (7) | Includes a reduction by the investment adviser of a portion of its advisory fee due to the Fund's investment in the Liquidity Fund (equal to less than 0.005% of average daily net assets for the six months ended June 30, 2022). |
| (8) | Includes the effect of To Be Announced (TBA) transactions. |
| (9) | For the year ended December 31, 2019. |
| Asset Description | Level 1 | Level 2 | Level 3 | Total |
| Asset-Backed Securities | $ — | $ 59,418,735 | $ — | $ 59,418,735 |
| Collateralized Mortgage Obligations | — | 25,507,959 | — | 25,507,959 |
| Commercial Mortgage-Backed Securities | — | 27,402,799 | — | 27,402,799 |
| Convertible Bonds | — | 2,824,389 | — | 2,824,389 |
| Corporate Bonds | — | 99,875,090 | — | 99,875,090 |
| High Social Impact Investments | — | 463,820 | — | 463,820 |
| Mutual Funds | 672,524 | — | — | 672,524 |
| Preferred Stocks | 3,467,870 | — | — | 3,467,870 |
| Senior Floating-Rate Loans | — | 8,890,865 | — | 8,890,865 |
| U.S. Government Agency Mortgage-Backed Securities | — | 3,011,485 | — | 3,011,485 |
| U.S. Treasury Obligations | — | 48,821,287 | — | 48,821,287 |
| Short-Term Investments: | ||||
| Affiliated Fund | 15,254,123 | — | — | 15,254,123 |
| Securities Lending Collateral | 1,610,435 | — | — | 1,610,435 |
| Total Investments | $21,004,952 | $276,216,429 | $ — | $297,221,381 |
| Forward Foreign Currency Exchange Contracts | $ — | $ 4,390 | $ — | $ 4,390 |
| Futures Contracts | 535,895 | — | — | 535,895 |
| Total | $21,540,847 | $276,220,819 | $ — | $297,761,666 |
| Liability Description | ||||
| Swap Contracts | $ — | $ (42,778) | $ — | $ (42,778) |
| Total | $ — | $ (42,778) | $ — | $ (42,778) |
| Aggregate cost | $320,942,951 |
| Gross unrealized appreciation | $ 560,365 |
| Gross unrealized depreciation | (23,733,517) |
| Net unrealized depreciation | $ (23,173,152) |
| Risk | Derivative | Statement of Assets and Liabilities Caption | Assets | Liabilities |
| Credit | Swap contracts (centrally cleared) | Accumulated loss | $ — | $ (42,778)(1) |
| Foreign exchange | Forward foreign currency exchange contracts | Receivable/Payable for open forward foreign currency exchange contracts | 4,390 | — |
| Interest rate | Futures contracts | Accumulated loss | 535,895 (1) | — |
| Total | $540,285 | $(42,778) | ||
| Derivatives not subject to master netting agreements | $535,895 | $(42,778) | ||
| Total Derivatives subject to master netting agreements | $ 4,390 | $ — | ||
| (1) | Only the current day's variation margin is reported within the Statement of Assets and Liabilities as Receivable or Payable for variation margin on open futures contracts and centrally cleared swap contracts, as applicable. |
| Counterparty | Derivative Assets Subject to Master Netting Agreement | Derivatives Available for Offset | Non-cash Collateral Received(a) | Cash Collateral Received(a) | Net Amount of Derivative Assets(b) |
| State Street Bank and Trust Company | $4,390 | $ — | $ — | $ — | $4,390 |
| (a) | In some instances, the total collateral received and/or pledged may be more than the amount shown due to overcollateralization. |
| (b) | Net amount represents the net amount due from the counterparty in the event of default. |
| Statement of Operations Caption | Credit | Foreign exchange | Interest rate | Total |
| Net realized gain (loss): | ||||
| Investment securities(1) | $ — | $ — | $ 99,178 | $ 99,178 |
| Forward foreign currency exchange contracts | — | 6,642 | — | 6,642 |
| Futures contracts | — | — | 3,761,694 | 3,761,694 |
| Swap contracts (centrally cleared) | 1,232 | — | — | 1,232 |
| Total | $1,232 | $6,642 | $3,860,872 | $3,868,746 |
| Change in unrealized appreciation (depreciation): | ||||
| Investment securities(1) | $ — | $ — | $ 18,707 | $ 18,707 |
| Forward foreign currency exchange contracts | — | 4,390 | — | 4,390 |
| Futures contracts | — | — | 1,102,389 | 1,102,389 |
| Swap contracts (centrally cleared) | 8,133 | — | — | 8,133 |
| Total | $8,133 | $4,390 | $1,121,096 | $1,133,619 |
| (1) | Relates to purchased options. |
| Futures Contracts — Long | Futures Contracts — Short | Forward Foreign Currency Exchange Contracts* | Swap Contracts |
| $27,303,000 | $36,451,000 | $835,000 | $216,000 |
| * | The average notional amount for forward foreign currency exchange contracts is based on the absolute value of notional amounts of currency purchased and currency sold. |
| Remaining Contractual Maturity of the Transactions | |||||
| Overnight and Continuous | <30 days | 30 to 90 days | >90 days | Total | |
| Corporate Bonds | $1,610,435 | $ — | $ — | $ — | $1,610,435 |
| Name | Value, beginning of period | Purchases | Sales proceeds | Net realized gain (loss) | Change in unrealized appreciation (depreciation) | Value, end of period | Interest/ Dividend income | Principal amount/ Shares/Units, end of period |
| Commercial Mortgage-Backed Securities | ||||||||
| Morgan Stanley Capital I Trust: | ||||||||
| Series 2017-CLS, Class E, 3.274%, (1 mo. USD LIBOR + 1.95%), 11/15/34 | $ 670,116 | $ — | $ — | $ — | $ (16,373) | $ 653,748 | $ 8,208 | $ 671,000 |
| Series 2017-CLS, Class F, 3.924%, (1 mo. USD LIBOR + 2.60%), 11/15/34 | 2,189,100 | 744,258 | — | — | (70,713) | 2,860,674 | 43,068 | 2,946,000 |
| Series 2019-BPR, Class B, 3.674%, (1 mo. USD LIBOR + 2.35%), 5/15/36 | 2,501,861 | — | — | — | 5,194 | 2,507,944 | 33,932 | 2,621,000 |
| Series 2019-BPR, Class C, 4.624%, (1 mo. USD LIBOR + 3.30%) 5/15/36 | 874,265 | — | — | — | 30,833 | 905,098 | 17,014 | 960,000 |
| High Social Impact Investments | ||||||||
| Calvert Impact Capital, Inc., Community Investment Notes, 1.50%, 12/15/23(1) | 489,530 | — | — | — | (25,710) | 463,820 | 3,750 | 500,000 |
| Name | Value, beginning of period | Purchases | Sales proceeds | Net realized gain (loss) | Change in unrealized appreciation (depreciation) | Value, end of period | Interest/ Dividend income | Principal amount/ Shares/Units, end of period |
| Mutual Funds | ||||||||
| Calvert Floating-Rate Advantage Fund, Class R6 | $ 8,680,782 | $ 3,000,000 | $(10,856,391) | $ 240,651 | $ (392,518) | $ 672,524 | $ 69,024 | 77,929 |
| Short-Term Investments | ||||||||
| Cash Reserves Fund | 14,462,361 | 67,066,629 | (81,527,181) | (1,362) | (447) | — | 7,310 | — |
| Liquidity Fund | — | 63,857,974 | (48,603,851) | — | — | 15,254,123 | 26,158 | 15,254,123 |
| Total | $239,289 | $ (469,734) | $23,317,931 | $208,464 | ||||
| (1) | Restricted security. |
| Six Months Ended June 30, 2022 (Unaudited) | Year Ended December 31, 2021 | ||||
| Shares | Amount | Shares | Amount | ||
| Class A | |||||
| Shares sold | 406,444 | $ 6,072,036 | 924,682 | $ 14,390,599 | |
| Reinvestment of distributions | 24,101 | 355,823 | 54,856 | 847,704 | |
| Shares redeemed | (398,444) | (5,913,610) | (519,560) | (8,074,411) | |
| Converted from Class C | 45 | 673 | 1,760 | 27,462 | |
| Net increase | 32,146 | $ 514,922 | 461,738 | $ 7,191,354 | |
| Class C | |||||
| Shares sold | 7,888 | $ 117,424 | 33,833 | $ 527,810 | |
| Reinvestment of distributions | 694 | 10,242 | 1,943 | 30,005 | |
| Shares redeemed | (3,296) | (49,169) | (32,552) | (503,612) | |
| Converted to Class A | (45) | (673) | (1,759) | (27,462) | |
| Net increase | 5,241 | $ 77,824 | 1,465 | $ 26,741 | |
| Class I | |||||
| Shares sold | 6,110,560 | $ 91,048,405 | 8,072,554 | $125,124,841 | |
| Reinvestment of distributions | 200,492 | 2,949,648 | 362,291 | 5,585,145 | |
| Shares redeemed | (3,356,995) | (49,668,847) | (5,136,037) | (79,718,663) | |
| Net increase | 2,954,057 | $ 44,329,206 | 3,298,808 | $ 50,991,323 | |
| Class R6 | |||||
| Shares sold | 42,808 | $ 643,486 | 1,129,019 | $ 17,556,104 | |
| Reinvestment of distributions | 40,209 | 592,768 | 89,979 | 1,387,151 | |
| Shares redeemed | (455,397) | (6,794,934) | (80,926) | (1,248,050) | |
| Net increase (decrease) | (372,380) | $ (5,558,680) | 1,138,072 | $ 17,695,205 | |
| Officers |
| Hope L. Brown Chief Compliance Officer |
| Deidre E. Walsh Secretary, Vice President and Chief Legal Officer |
| James F. Kirchner Treasurer |
| Trustees |
| Alice Gresham Bullock Chairperson |
| Richard L. Baird, Jr. |
| Cari M. Dominguez |
| John G. Guffey, Jr. |
| Miles D. Harper, III |
| Joy V. Jones |
| John H. Streur* |
| Anthony A. Williams |
| *Interested Trustee and President |
| Privacy Notice | April 2021 |
| FACTS | WHAT DOES EATON VANCE DO WITH YOUR PERSONAL INFORMATION? |
| Why? | Financial companies choose how they share your personal information. Federal law gives consumers the right to limit some but not all sharing. Federal law also requires us to tell you how we collect, share, and protect your personal information. Please read this notice carefully to understand what we do. |
| What? | The types of personal information we collect and share depend on the product or service you have with us. This information can include:■ Social Security number and income ■ investment experience and risk tolerance ■ checking account number and wire transfer instructions |
| How? | All financial companies need to share customers’ personal information to run their everyday business. In the section below, we list the reasons financial companies can share their customers’ personal information; the reasons Eaton Vance chooses to share; and whether you can limit this sharing. |
| Reasons we can share your personal information | Does Eaton Vance share? | Can you limit this sharing? |
| For our everyday business purposes — such as to process your transactions, maintain your account(s), respond to court orders and legal investigations, or report to credit bureaus | Yes | No |
| For our marketing purposes — to offer our products and services to you | Yes | No |
| For joint marketing with other financial companies | No | We don’t share |
| For our investment management affiliates’ everyday business purposes — information about your transactions, experiences, and creditworthiness | Yes | Yes |
| For our affiliates’ everyday business purposes — information about your transactions and experiences | Yes | No |
| For our affiliates’ everyday business purposes — information about your creditworthiness | No | We don’t share |
| For our investment management affiliates to market to you | Yes | Yes |
| For our affiliates to market to you | No | We don’t share |
| For nonaffiliates to market to you | No | We don’t share |
| To limit our sharing | Call toll-free 1-800-368-2745 or email: CRMPrivacy@calvert.comPlease note:If you are a new customer, we can begin sharing your information 30 days from the date we sent this notice. When you are no longer our customer, we continue to share your information as described in this notice. However, you can contact us at any time to limit our sharing. |
| Questions? | Call toll-free 1-800-368-2745 or email: CRMPrivacy@calvert.com |
| Privacy Notice — continued | April 2021 |
| Who we are | |
| Who is providing this notice? | Eaton Vance Management, Eaton Vance Distributors, Inc., Eaton Vance Trust Company, Eaton Vance Management (International) Limited, Eaton Vance Advisers International Ltd., Eaton Vance Global Advisors Limited, Eaton Vance Management’s Real Estate Investment Group, Boston Management and Research, Calvert Research and Management, Eaton Vance and Calvert Fund Families and our investment advisory affiliates (“Eaton Vance”) (see Investment Management Affiliates definition below) |
| What we do | |
| How does Eaton Vance protect my personal information? | To protect your personal information from unauthorized access and use, we use security measures that comply with federal law. These measures include computer safeguards and secured files and buildings. We have policies governing the proper handling of customer information by personnel and requiring third parties that provide support to adhere to appropriate security standards with respect to such information. |
| How does Eaton Vance collect my personal information? | We collect your personal information, for example, when you■ open an account or make deposits or withdrawals from your account ■ buy securities from us or make a wire transfer ■ give us your contact informationWe also collect your personal information from others, such as credit bureaus, affiliates, or other companies. |
| Why can’t I limit all sharing? | Federal law gives you the right to limit only■ sharing for affiliates’ everyday business purposes — information about your creditworthiness ■ affiliates from using your information to market to you ■ sharing for nonaffiliates to market to youState laws and individual companies may give you additional rights to limit sharing. See below for more on your rights under state law. |
| Definitions | |
| Investment Management Affiliates | Eaton Vance Investment Management Affiliates include registered investment advisers, registered broker- dealers, and registered and unregistered funds. Investment Management Affiliates does not include entities associated with Morgan Stanley Wealth Management, such as Morgan Stanley Smith Barney LLC and Morgan Stanley & Co. |
| Affiliates | Companies related by common ownership or control. They can be financial and nonfinancial companies.■ Our affiliates include companies with a Morgan Stanley name and financial companies such as Morgan Stanley Smith Barney LLC and Morgan Stanley & Co. |
| Nonaffiliates | Companies not related by common ownership or control. They can be financial and nonfinancial companies.■ Eaton Vance does not share with nonaffiliates so they can market to you. |
| Joint marketing | A formal agreement between nonaffiliated financial companies that together market financial products or services to you.■ Eaton Vance doesn’t jointly market. |
| Other important information | |
| Vermont: Except as permitted by law, we will not share personal information we collect about Vermont residents with Nonaffiliates unless you provide us with your written consent to share such information.California: Except as permitted by law, we will not share personal information we collect about California residents with Nonaffiliates and we will limit sharing such personal information with our Affiliates to comply with California privacy laws that apply to us. | |


| % Average Annual Total Returns1,2 | Class Inception Date | Performance Inception Date | Six Months | One Year | Five Years | Ten Years | Since Inception |
| Class A at NAV | 08/23/1983 | 08/23/1983 | (8.76)% | (8.57)% | 0.89% | 1.69% | 4.98% |
| Class A with 3.25% Maximum Sales Charge | — | — | (11.72) | (11.53) | 0.23 | 1.36 | 4.89 |
| Class C at NAV | 07/15/2015 | 07/15/2015 | (9.10) | (9.31) | 0.13 | — | 0.75 |
| Class C with 1% Maximum Sales Charge | — | — | (10.01) | (10.22) | 0.13 | — | 0.75 |
| Class I at NAV | 07/15/2015 | 08/23/1983 | (8.68) | (8.43) | 1.17 | 1.90 | 5.03 |
| Bloomberg Municipal Bond Index | — | — | (8.98)% | (8.57)% | 1.51% | 2.38% | 6.12% |
| % Total Annual Operating Expense Ratios3 | Class A | Class C | Class I |
| Gross | 0.87% | 1.62% | 0.62% |
| Net | 0.75 | 1.50 | 0.50 |
| % SEC Yield4 | Class A | Class C | Class I |
| SEC 30-day Yield - Subsidized | 1.93% | 1.24% | 2.27% |
| SEC 30-day Yield - Unsubsidized | 1.82 | 1.13 | 2.15 |
| 1 | Bloomberg Municipal Bond Index is an unmanaged index of municipal bonds traded in the U.S. Unless otherwise stated, index returns do not reflect the effect of any applicable sales charges, commissions, expenses, taxes or leverage, as applicable. It is not possible to invest directly in an index. |
| 2 | Total Returns at NAV do not include applicable sales charges. If sales charges were deducted, the returns would be lower. Total Returns shown with maximum sales charge reflect the stated maximum sales charge. Unless otherwise stated, performance does not reflect the deduction of taxes on Fund distributions or redemptions of Fund shares.Performance prior to the inception date of a class may be linked to the performance of an older class of the Fund. This linked performance is adjusted for any applicable sales charge, but is not adjusted for class expense differences. If adjusted for such differences, the performance would be different. The performance of Class I is linked to Class A. Performance since inception for an index, if presented, is the performance since the Fund’s or oldest share class’ inception, as applicable. Performance presented in the Financial Highlights included in the financial statements is not linked.Calvert Research and Management became the investment adviser to the Fund on December 31, 2016. Performance reflected prior to such date is that of the Fund’s former investment adviser. |
| 3 | Source: Fund prospectus. Net expense ratios reflect a contractual expense reimbursement that continues through 4/30/23. The expense ratios for the current reporting period can be found in the Financial Highlights section of this report. Performance reflects expenses waived and/or reimbursed, if applicable. Without such waivers and/or reimbursements, performance would have been lower. |
| 4 | SEC Yield is a standardized measure based on the estimated yield to maturity of a fund’s investments over a 30-day period and is based on the maximum offer price at the date specified. The SEC Yield is not based on the distributions made by the Fund, which may differ. Subsidized yield reflects the effect of fee waivers and expense reimbursements. |
| Fund profile subject to change due to active management. |
| Beginning Account Value (1/1/22) | Ending Account Value (6/30/22) | Expenses Paid During Period* (1/1/22 – 6/30/22) | Annualized Expense Ratio | |
| Actual | ||||
| Class A | $1,000.00 | $ 912.40 | $3.56 ** | 0.75% |
| Class C | $1,000.00 | $ 909.00 | $7.10 ** | 1.50% |
| Class I | $1,000.00 | $ 913.20 | $2.37 ** | 0.50% |
| Hypothetical | ||||
| (5% return per year before expenses) | ||||
| Class A | $1,000.00 | $1,021.08 | $3.76 ** | 0.75% |
| Class C | $1,000.00 | $1,017.36 | $7.50 ** | 1.50% |
| Class I | $1,000.00 | $1,022.32 | $2.51 ** | 0.50% |
| * | Expenses are equal to the Fund's annualized expense ratio for the indicated Class, multiplied by the average account value over the period, multiplied by 181/365 (to reflect the one-half year period). The Example assumes that the $1,000 was invested at the net asset value per share determined at the close of business on December 31, 2021. |
| ** | Absent a waiver and/or reimbursement of expenses by an affiliate, expenses would be higher. |
| Corporate Bonds — 2.2% |
| Security | Principal Amount (000's omitted) | Value | |
| Consumer, Cyclical — 0.1% | |||
| YMCA of Greater New York, 2.303%, 8/1/26 | $ | 265 | $ 242,873 |
| $ 242,873 | |||
| Consumer, Non-cyclical — 0.7% | |||
| Conservation Fund (The), Green Bonds, 3.474%, 12/15/29 | $ | 3,493 | $ 3,228,191 |
| $�� 3,228,191 | |||
| Industrial — 0.6% | |||
| Nature Conservancy (The): | |||
| Series A, 0.794%, 7/1/25 | $ | 1,450 | $ 1,343,523 |
| Series A, 0.944%, 7/1/26 | 1,285 | 1,156,536 | |
| $ 2,500,059 | |||
| Other Revenue — 0.8% | |||
| BlueHub Loan Fund, Inc., 3.099%, 1/1/30 | $ | 4,000 | $ 3,636,957 |
| $ 3,636,957 | |||
| Total Corporate Bonds (identified cost $10,561,784) | $ 9,608,080 | ||
| Tax-Exempt Mortgage-Backed Securities — 2.1% |
| Security | Principal Amount (000's omitted) | Value | |
| Housing — 2.1% | |||
| California Housing Finance Agency, Municipal Certificates: | |||
| Series 2021-1, Class A, 3.50%, 11/20/35 | $ | 2,577 | $ 2,406,949 |
| Series 2021-3, Class A, 3.25%, 8/20/36 | 2,478 | 2,258,887 | |
| National Finance Authority, NH, Municipal Certificates, Series 2022-1, Class A, 4.375%, 9/20/36 | 3,000 | 2,880,870 | |
| Washington Housing Finance Commission, Municipal Certificates, Series 2021-1, Class A, 3.50%, 12/20/35 | 1,615 | 1,477,845 | |
| Total Tax-Exempt Mortgage-Backed Securities (identified cost $10,272,265) | $ 9,024,551 | ||
| Tax-Exempt Municipal Obligations — 90.5% |
| Security | Principal Amount (000's omitted) | Value | |
| Bond Bank — 6.6% | |||
| California Infrastructure and Economic Development Bank, (Clean Water State Revolving Fund): | |||
| Green Bonds, 5.00%, 10/1/25 | $ | 2,165 | $ 2,360,781 |
| Security | Principal Amount (000's omitted) | Value | |
| Bond Bank (continued) | |||
| California Infrastructure and Economic Development Bank, (Clean Water State Revolving Fund): (continued) | |||
| Green Bonds, 5.00%, 10/1/31 | $ | 1,000 | $ 1,120,970 |
| Connecticut, (Revolving Fund), Green Bonds, 5.00%, 5/1/34 | 1,140 | 1,252,746 | |
| Illinois Finance Authority, (Clean Water Initiative Revolving Fund), 5.00%, 7/1/32 | 1,500 | 1,629,735 | |
| Indiana Finance Authority, (Revolving Fund), Green Bonds, 5.00%, 2/1/29 | 2,000 | 2,202,600 | |
| Iowa Finance Authority, (State Revolving Fund), Green Bonds, 5.00%, 8/1/35 | 1,500 | 1,663,560 | |
| Michigan Finance Authority, (Clean Water Revolving Fund): | |||
| 3.00%, 10/1/36 | 1,500 | 1,413,705 | |
| 3.00%, 10/1/37 | 1,390 | 1,284,013 | |
| New York State Environmental Facilities Corp., (New York City Municipal Water Finance Authority), 5.00%, 6/15/25 | 2,000 | 2,166,920 | |
| Oklahoma Water Resources Board: | |||
| 4.00%, 10/1/31 | 120 | 128,165 | |
| 4.00%, 10/1/32 | 430 | 455,895 | |
| 4.00%, 10/1/34 | 150 | 157,008 | |
| Rhode Island Infrastructure Bank, (Safe Drinking Water Revolving Fund), Green Bonds, 4.00%, 10/1/34 | 2,650 | 2,832,585 | |
| Texas Water Development Board, (State Revolving Fund): | |||
| 4.00%, 8/1/37 | 2,750 | 2,811,572 | |
| 5.00%, 8/1/28 | 1,000 | 1,138,390 | |
| 5.00%, 8/1/29 | 1,100 | 1,266,859 | |
| Texas Water Development Board, (State Water Implementation Revenue Fund), 5.00%, 10/15/27 | 2,500 | 2,825,850 | |
| Wisconsin, Environmental Improvement Fund Revenue, Green Bonds, 5.00%, 6/1/34 | 1,295 | 1,477,478 | |
| $ 28,188,832 | |||
| Education — 11.7% | |||
| Arizona State University: | |||
| Green Bonds, 5.00%, 7/1/39 | $ | 2,000 | $ 2,212,180 |
| Green Bonds, 5.00%, 7/1/41 | 3,000 | 3,154,560 | |
| Build NYC Resource Corp., NY, (Academic Leadership Charter School): | |||
| 4.00%, 6/15/23 | 100 | 101,011 | |
| 4.00%, 6/15/24 | 120 | 121,608 | |
| 4.00%, 6/15/25 | 110 | 111,390 | |
| 4.00%, 6/15/26 | 110 | 111,102 | |
| 4.00%, 6/15/27 | 80 | 80,593 | |
| 4.00%, 6/15/28 | 125 | 125,104 | |
| 4.00%, 6/15/30 | 100 | 98,247 | |
| 4.00%, 6/15/31 | 100 | 97,120 | |
| Security | Principal Amount (000's omitted) | Value | |
| Education (continued) | |||
| California Educational Facilities Authority, (Loyola Marymount University): | |||
| Green Bonds, 5.00%, 10/1/33 | $ | 920 | $ 1,004,060 |
| Green Bonds, 5.00%, 10/1/36 | 765 | 830,928 | |
| Green Bonds, 5.00%, 10/1/38 | 730 | 786,166 | |
| Clifton Higher Education Finance Corp., TX, (Idea Public Schools): | |||
| 5.00%, 8/15/25 | 360 | 382,846 | |
| 5.00%, 8/15/28 | 300 | 327,825 | |
| District of Columbia, (Gallaudet University): | |||
| Social Bonds, 5.00%, 4/1/26 | 300 | 322,254 | |
| Social Bonds, 5.00%, 4/1/27 | 300 | 326,625 | |
| Social Bonds, 5.00%, 4/1/28 | 325 | 356,610 | |
| Social Bonds, 5.00%, 4/1/29 | 300 | 331,425 | |
| Social Bonds, 5.00%, 4/1/30 | 300 | 333,618 | |
| Social Bonds, 5.00%, 4/1/31 | 325 | 363,542 | |
| District of Columbia, (Rocketship DC Obligated Group): | |||
| 5.00%, 6/1/29(1) | 360 | 369,432 | |
| 5.00%, 6/1/31(1) | 1,000 | 1,027,560 | |
| Georgia Private Colleges and Universities Authority, (Emory University), 5.00%, 9/1/33 | 500 | 556,105 | |
| Grand Valley State University, MI, 5.00%, 12/1/33 | 1,000 | 1,078,160 | |
| Indiana Finance Authority, (Butler University), 5.00%, 2/1/31 | 1,130 | 1,161,674 | |
| Kansas Development Finance Authority, (Wichita State University), 3.00%, 6/1/31 | 1,925 | 1,908,099 | |
| Kentucky Bond Development Corp., (Transylvania University): | |||
| 2.00%, 3/1/23 | 160 | 160,219 | |
| 5.00%, 3/1/27 | 80 | 87,189 | |
| 5.00%, 3/1/28 | 100 | 109,826 | |
| 5.00%, 3/1/29 | 155 | 171,618 | |
| Lehigh County General Purpose Authority, PA, (Lehigh Valley Academy Regional Charter School): | |||
| 4.00%, 6/1/25 | 965 | 981,723 | |
| 4.00%, 6/1/26 | 500 | 508,500 | |
| 4.00%, 6/1/29 | 1,130 | 1,137,435 | |
| Los Ranchos de Albuquerque, NM, (Albuquerque Academy): | |||
| 5.00%, 9/1/27 | 350 | 385,291 | |
| 5.00%, 9/1/28 | 225 | 249,923 | |
| 5.00%, 9/1/29 | 400 | 448,364 | |
| Louisiana Public Facilities Authority, (Loyola University), 5.00%, 10/1/26 | 215 | 229,005 | |
| Maricopa County Industrial Development Authority, AZ, (Arizona Autism Charter Schools), 4.00%, 7/1/31(1) | 250 | 227,495 | |
| Maricopa County Industrial Development Authority, AZ, (Legacy Traditional Schools), 3.00%, 7/1/31(1) | 500 | 433,245 | |
| Security | Principal Amount (000's omitted) | Value | |
| Education (continued) | |||
| Massachusetts Health and Educational Facilities Authority, (University of Massachusetts), 2.45% to 4/1/26 (Put Date), 11/1/30 | $ | 2,250 | $ 2,231,572 |
| Miami University, OH, 5.00%, 9/1/24 | 600 | 635,070 | |
| Minnesota Higher Education Facilities Authority, (University of St. Thomas): | |||
| Green Bonds, 5.00%, 10/1/28 | 600 | 662,346 | |
| Green Bonds, 5.00%, 10/1/29 | 635 | 702,710 | |
| Green Bonds, 5.00%, 10/1/30 | 445 | 494,306 | |
| Monroe County Industrial Development Corp., NY, (True North Rochester Preparatory Charter School), 5.00%, 6/1/40(1) | 670 | 683,722 | |
| Montgomery County Industrial Development Authority, PA, (Germantown Academy), 4.00%, 10/1/36 | 450 | 423,716 | |
| New York Dormitory Authority, (Cornell University), Green Bonds, 5.00%, 7/1/26 | 500 | 552,810 | |
| Ohio State University, 5.00%, 12/1/29 | 1,915 | 2,187,504 | |
| Pennsylvania Higher Educational Facilities Authority, (State System of Higher Education), 4.00%, 6/15/36 | 1,550 | 1,561,656 | |
| Public Finance Authority, WI, (Coral Academy of Science Las Vegas): | |||
| 4.00%, 7/1/24 | 300 | 301,569 | |
| 4.00%, 7/1/31 | 325 | 306,527 | |
| 4.00%, 7/1/41 | 1,000 | 861,140 | |
| Public Finance Authority, WI, (Roseman University of Health Sciences), 4.00%, 4/1/32(1) | 900 | 867,114 | |
| University of Arizona, Green Bonds, 5.00%, 6/1/42 | 2,000 | 2,124,360 | |
| University of Connecticut: | |||
| 5.00%, 5/1/24 | 2,000 | 2,103,740 | |
| 5.00%, 5/1/26 | 1,600 | 1,754,064 | |
| University of South Carolina, 5.00%, 5/1/24 | 440 | 464,200 | |
| University of Utah, Green Bonds, 5.00%, 8/1/37(2) | 3,150 | 3,665,245 | |
| University of Washington, 4.00% to 8/1/27 (Put Date), 5/1/48 | 2,000 | 2,128,460 | |
| University System of Maryland, 5.00%, 4/1/25 | 2,425 | 2,604,062 | |
| $ 50,125,570 | |||
| Electric Utilities — 2.0% | |||
| Douglas County Public Utility District No. 1, WA: | |||
| 4.00%, 9/1/39 | $ | 2,000 | $ 2,020,960 |
| 4.00%, 9/1/40 | 2,000 | 2,011,220 | |
| Mesa, AZ, Utility Systems Revenue, 5.00%, 7/1/31 | 1,000 | 1,123,730 | |
| Southern California Public Power Authority, Green Bonds, 5.00%, 4/1/24 | 1,460 | 1,526,854 | |
| Trinity Public Utilities District Authority, CA, Green Bonds, 4.00%, 4/1/29 | 1,120 | 1,145,917 | |
| Utah Associated Municipal Power Systems, 5.00%, 9/1/30 | 655 | 723,100 | |
| $ 8,551,781 | |||
| Security | Principal Amount (000's omitted) | Value | |
| Escrowed/Prerefunded — 2.4% | |||
| Build NYC Resource Corp., NY, (YMCA of Greater New York), Prerefunded to 8/1/25, 4.00%, 8/1/36 | $ | 1,915 | $ 2,012,856 |
| Central Puget Sound Regional Transit Authority, WA, Sales Tax Revenue: | |||
| Green Bonds, Prerefunded to 11/1/25, 4.00%, 11/1/33 | 1,100 | 1,164,680 | |
| Green Bonds, Prerefunded to 11/1/25, 5.00%, 11/1/35 | 1,000 | 1,091,360 | |
| Green Bonds, Prerefunded to 11/1/25, 5.00%, 11/1/45 | 2,500 | 2,728,400 | |
| Massachusetts Water Resources Authority, Green Bonds, Prerefunded to 8/1/26, 5.00%, 8/1/40 | 1,000 | 1,108,270 | |
| Ohio State University, Escrowed to Maturity, 5.00%, 12/1/29 | 85 | 98,262 | |
| Rhode Island Clean Water Finance Agency, (Water Pollution Control Revolving Fund): | |||
| Prerefunded to 10/1/23, 5.00%, 10/1/30 | 1,000 | 1,039,880 | |
| Prerefunded to 10/1/23, 5.00%, 10/1/31 | 1,000 | 1,039,880 | |
| $ 10,283,588 | |||
| General Obligations — 27.3% | |||
| Bartow County School District, GA, 5.00%, 10/1/25 | $ | 2,200 | $ 2,395,338 |
| Bexar County, TX, Prerefunded to 6/15/25, 4.00%, 6/15/32 | 2,000 | 2,107,460 | |
| Boston, MA, 5.00%, 11/1/27 | 5,000 | 5,671,250 | |
| Broward County School District, FL, 5.00%, 7/1/27 | 5,155 | 5,782,415 | |
| California: | |||
| 4.00%, 9/1/32 | 1,000 | 1,030,120 | |
| 5.00%, 4/1/35 | 1,500 | 1,672,995 | |
| Green Bonds, 3.75%, 10/1/37 | 1,000 | 999,480 | |
| Chicago Board of Education, IL, 5.00%, 12/1/31 | 2,500 | 2,618,625 | |
| Connecticut: | |||
| 5.00%, 9/15/28 | 1,000 | 1,135,360 | |
| Green Bonds, 5.00%, 11/15/31 | 1,000 | 1,050,220 | |
| Corvallis School District No. 509J, OR, 5.00%, 6/15/26 | 3,790 | 4,185,183 | |
| Desert Sands Unified School District, CA, (Election of 2014), 5.00%, 8/1/39 | 2,000 | 2,163,520 | |
| Fort Bend Independent School District, TX, (PSF Guaranteed), 5.00%, 8/15/26 | 750 | 829,042 | |
| Franklin Regional School District, PA, 5.00%, 5/1/27 | 100 | 111,800 | |
| Grapevine-Colleyville Independent School District, TX, (PSF Guaranteed), 5.00%, 8/15/28 | 4,000 | 4,308,280 | |
| Groton, CT, Green Bonds, 4.125%, 4/1/42 | 1,000 | 998,180 | |
| Hampton, VA, Green Bonds, 3.00%, 9/1/34 | 500 | 466,055 | |
| Hawaii, 4.00%, 10/1/34 | 2,000 | 2,079,300 | |
| Houston Independent School District, TX, (PSF Guaranteed), 3.50% to 6/1/25 (Put Date), 6/1/39 | 2,300 | 2,342,780 | |
| Indianapolis Public Schools, IN: | |||
| Social Bonds, 5.00%, 1/15/25 | 1,000 | 1,065,490 | |
| Social Bonds, 5.00%, 7/15/25 | 1,000 | 1,075,070 | |
| Jackson County Consolidated School District No. 4, MO, 5.00%, 3/1/36 | 3,425 | 3,644,508 | |
| Security | Principal Amount (000's omitted) | Value | |
| General Obligations (continued) | |||
| Johnson City, TN: | |||
| 5.00%, 3/1/26 | $ | 2,385 | $ 2,614,556 |
| 5.00%, 3/1/27 | 2,500 | 2,792,725 | |
| Johnson County Unified School District No. 229, KS, 3.00%, 10/1/28 | 2,000 | 2,020,240 | |
| Lake Stevens School District No. 4, WA, 4.00%, 12/1/35 | 2,460 | 2,547,305 | |
| Los Rios Community College District, CA, 4.00%, 8/1/33 | 2,000 | 2,068,860 | |
| Madison County, TN, 5.00%, 5/1/25 | 1,170 | 1,260,909 | |
| Massachusetts, Green Bonds, 5.00%, 4/1/37 | 2,000 | 2,161,000 | |
| Matanuska-Susitna Borough, AK, 4.50%, 7/1/29 | 1,670 | 1,799,442 | |
| Mesa Unified School District No. 4, AZ, 5.00%, 7/1/27 | 1,000 | 1,121,210 | |
| Montgomery County, TN, 5.00%, 4/1/24 | 3,000 | 3,156,840 | |
| New York, NY, 5.00%, 8/1/26 | 2,000 | 2,089,060 | |
| North East Independent School District, TX, (PSF Guaranteed), 5.25%, 2/1/26 | 1,000 | 1,104,830 | |
| North St. Paul-Maplewood-Oakdale Independent School District No. 622, MN: | |||
| 4.00%, 2/1/31 | 1,000 | 1,066,540 | |
| 5.00%, 2/1/33 | 650 | 724,289 | |
| Northside Independent School District, TX: | |||
| (PSF Guaranteed), 4.00%, 8/1/31 | 930 | 995,593 | |
| (PSF Guaranteed), 4.00%, 8/1/32 | 400 | 425,460 | |
| Passaic County Improvement Authority, NJ, (Paterson Board of Education): | |||
| Green Bonds, 3.00%, 2/1/42 | 1,175 | 1,001,476 | |
| Green Bonds, 4.00%, 2/1/33 | 250 | 265,393 | |
| Ramsey County, MN, 5.00%, 2/1/29 | 1,000 | 1,147,320 | |
| Richardson Independent School District, TX, (PSF Guaranteed), 5.00%, 2/15/24 | 750 | 787,710 | |
| Salem-Keizer School District No. 24J, OR, 4.00%, 6/15/37 | 5,000 | 5,145,200 | |
| San Diego Unified School District, CA, (Election of 2012), Green Bonds, 5.00%, 7/1/30 | 2,000 | 2,210,820 | |
| San Francisco Bay Area Rapid Transit District, CA, (Election of 2016): | |||
| Green Bonds, 5.00%, 8/1/24 | 1,130 | 1,199,744 | |
| Green Bonds, 5.00%, 8/1/26 | 1,000 | 1,108,690 | |
| Green Bonds, 5.00%, 8/1/27 | 1,000 | 1,128,610 | |
| Green Bonds, 5.00%, 8/1/28 | 1,000 | 1,143,840 | |
| Green Bonds, 5.00%, 8/1/33 | 1,000 | 1,102,460 | |
| Green Bonds, 5.00%, 8/1/35 | 1,120 | 1,266,283 | |
| Spring Branch Independent School District, TX, (PSF Guaranteed), 5.00%, 2/1/27 | 1,725 | 1,922,512 | |
| Summit County, UT: | |||
| 5.00%, 6/15/29 | 1,350 | 1,560,789 | |
| 5.00%, 6/15/30 | 2,835 | 3,315,561 | |
| Texas, (AMT), 5.00%, 8/1/34 | 4,185 | 4,801,618 | |
| Security | Principal Amount (000's omitted) | Value | |
| General Obligations (continued) | |||
| Tualatin Hills Park & Recreation District, OR, Green Bonds, 5.00%, 6/1/25 | $ | 2,450 | $ 2,642,153 |
| Waco, TX, 4.00%, 2/1/26 | 2,005 | 2,118,884 | |
| Watertown, MA, Green Bonds, 5.00%, 6/15/31 | 1,325 | 1,566,574 | |
| West Haven, CT, 4.00%, 9/15/24 | 260 | 269,498 | |
| Will County, IL: | |||
| Green Bonds, 5.00%, 11/15/26 | 450 | 498,794 | |
| Green Bonds, 5.00%, 11/15/28 | 1,000 | 1,139,060 | |
| Green Bonds, 5.00%, 11/15/29 | 900 | 1,037,286 | |
| Wyandotte County Unified School District No. 203, KS, 4.00%, 9/1/23 | 1,545 | 1,584,135 | |
| Ypsilanti Community Schools, MI, 5.00%, 5/1/30 | 1,000 | 1,092,460 | |
| $116,738,200 | |||
| Hospital — 4.8% | |||
| Colorado Health Facilities Authority, (Craig Hospital): | |||
| 5.00%, 12/1/26(2) | $ | 1,010 | $ 1,088,649 |
| 5.00%, 12/1/27(2) | 1,075 | 1,169,009 | |
| 5.00%, 12/1/28(2) | 1,125 | 1,232,370 | |
| DuBois Hospital Authority, PA, (Penn Highlands Healthcare): | |||
| 5.00%, 7/15/32 | 820 | 883,427 | |
| 5.00%, 7/15/34 | 890 | 952,033 | |
| 5.00%, 7/15/35 | 930 | 992,645 | |
| Idaho Health Facilities Authority, (St. Luke's Health System): | |||
| 4.00%, 3/1/39 | 710 | 694,046 | |
| 4.00%, 3/1/40 | 845 | 822,084 | |
| 4.00%, 3/1/41 | 805 | 779,699 | |
| Indiana Finance Authority, (Good Samaritan Hospital): | |||
| 4.00%, 4/1/35 | 1,205 | 1,133,869 | |
| 4.00%, 4/1/36 | 2,520 | 2,347,556 | |
| Massachusetts Development Finance Agency, (Boston Medical Center), Green Bonds, 5.00%, 7/1/44 | 3,000 | 3,042,420 | |
| Massachusetts Development Finance Agency, (Dana-Farber Cancer Institute), 5.00%, 12/1/34 | 500 | 525,125 | |
| Michigan Finance Authority, (Beaumont Health Credit Group), 4.00%, 11/1/46 | 2,000 | 1,899,700 | |
| Missouri Health and Educational Facilities Authority, (SSM Health), 5.00%, 6/1/27 | 1,000 | 1,104,010 | |
| New York City Health and Hospitals Corp., NY, 4.00%, 2/15/28 | 1,000 | 1,068,510 | |
| Paulding County Hospital Authority, GA, (WellStar Health System, Inc.): | |||
| 5.00%, 4/1/26 | 300 | 322,476 | |
| 5.00%, 4/1/27 | 175 | 190,692 | |
| 5.00%, 4/1/28 | 420 | 460,849 | |
| $ 20,709,169 | |||
| Security | Principal Amount (000's omitted) | Value | |
| Housing — 7.9% | |||
| Alaska Housing Finance Corp.: | |||
| Social Bonds, 5.00%, 6/1/28(2) | $ | 350 | $ 391,842 |
| Social Bonds, 5.00%, 12/1/28(2) | 400 | 450,320 | |
| Social Bonds, 5.00%, 6/1/29(2) | 440 | 495,053 | |
| Social Bonds, 5.00%, 12/1/29(2) | 360 | 406,836 | |
| California Municipal Finance Authority, (Caritas Corp.), Mobile Home Park Revenue, 5.00%, 8/15/28 | 1,240 | 1,313,780 | |
| Cuyahoga Metropolitan Housing Authority, OH, 2.00%, 12/1/31 | 1,250 | 1,085,387 | |
| District of Columbia Housing Finance Agency, 1.70% to 3/1/25 (Put Date), 9/1/41 | 2,000 | 1,940,340 | |
| Independent Cities Finance Authority, CA, (Castle Mobile Estates): | |||
| 3.00%, 5/15/23 | 170 | 171,396 | |
| 3.00%, 5/15/24 | 175 | 177,839 | |
| 3.00%, 5/15/25 | 185 | 183,831 | |
| 3.00%, 5/15/26 | 190 | 187,302 | |
| 3.00%, 5/15/31 | 500 | 460,990 | |
| Independent Cities Finance Authority, CA, (Union City Tropics): | |||
| 4.00%, 5/15/31 | 1,020 | 1,015,696 | |
| 4.00%, 5/15/34 | 1,145 | 1,121,207 | |
| Independent Cities Finance Authority, CA, (Vista de Santa Barbara Mobilehome Park): | |||
| 3.00%, 9/15/26 | 270 | 265,340 | |
| 3.00%, 9/15/27 | 275 | 267,407 | |
| 3.00%, 9/15/28 | 285 | 273,304 | |
| 3.00%, 9/15/29 | 295 | 278,905 | |
| Maryland Community Development Administration, Department of Housing and Community Development: | |||
| 4.05%, 7/1/40 | 1,575 | 1,579,835 | |
| 4.35%, 7/1/50 | 1,000 | 994,360 | |
| Massachusetts Housing Finance Agency: | |||
| (AMT), 3.30%, 12/1/28 | 750 | 742,027 | |
| Sustainability Bonds, 2.30%, 12/1/24 | 1,500 | 1,495,080 | |
| Sustainability Bonds, 2.80%, 12/1/26 | 1,000 | 990,520 | |
| New York City Housing Development Corp., NY: | |||
| 0.90% to 1/1/26 (Put Date), 11/1/60 | 4,000 | 3,708,120 | |
| 3.80%, 11/1/30 | 1,000 | 1,005,230 | |
| Sustainable Development Bonds, 1.70%, 5/1/32 | 2,100 | 1,704,696 | |
| Sustainable Development Bonds, 1.75%, 11/1/32 | 1,060 | 854,540 | |
| New York Housing Finance Agency: | |||
| Sustainability Bonds, (FHLMC / FNMA / SONYMA), 2.85%, 11/1/39 | 2,000 | 1,672,520 | |
| Sustainability Bonds, (SONYMA), 0.75%, 11/1/25 | 3,000 | 2,792,070 | |
| Sustainability Bonds, (SONYMA), 2.50% to 5/1/27 (Put Date), 11/1/60 | 2,000 | 1,929,720 | |
| Pennsylvania Housing Finance Agency, SFMR: | |||
| 3.90%, 10/1/35 | 930 | 928,121 | |
| Security | Principal Amount (000's omitted) | Value | |
| Housing (continued) | |||
| Pennsylvania Housing Finance Agency, SFMR: (continued) | |||
| Social Bonds, 0.95%, 10/1/28 | $ | 1,125 | $ 981,596 |
| Public Finance Authority, WI, (NC A&T Real Estate Foundation, LLC): | |||
| 5.00%, 6/1/28 | 665 | 694,307 | |
| 5.00%, 6/1/29 | 365 | 381,440 | |
| Utah Housing Corp., 4.00%, 1/1/36 | 755 | 764,724 | |
| $ 33,705,681 | |||
| Industrial Development Revenue — 1.3% | |||
| California Pollution Control Financing Authority, (Waste Management, Inc.), (AMT), 3.00%, 11/1/25 | $ | 850 | $ 832,311 |
| Henderson, KY, (Pratt Paper, LLC), (AMT), 3.70%, 1/1/32(1) | 2,000 | 1,922,380 | |
| National Finance Authority, NH, (Covanta), Green Bonds, (AMT), 3.75% to 7/2/40 (Put Date), 7/1/45(1) | 1,955 | 1,596,453 | |
| Nez Perce County, ID, (Potlatch Corp.), 2.75%, 10/1/24 | 1,000 | 992,880 | |
| $ 5,344,024 | |||
| Insured - Education — 0.5% | |||
| New York Dormitory Authority, (School Districts Financing Program): | |||
| (BAM), 5.00%, 10/1/25 | $ | 1,000 | $ 1,083,230 |
| (BAM), 5.00%, 10/1/28 | 750 | 848,332 | |
| $ 1,931,562 | |||
| Insured - Electric Utilities — 0.6% | |||
| New York Power Authority: | |||
| (AGM), 5.00%, 11/15/25 | $ | 1,450 | $ 1,584,241 |
| (AGM), 5.00%, 11/15/27 | 1,000 | 1,131,620 | |
| $ 2,715,861 | |||
| Insured - General Obligations — 0.2% | |||
| Long Beach Unified School District, CA, (AGC), 0.00%, 8/1/25 | $ | 1,000 | $ 916,500 |
| $ 916,500 | |||
| Insured - Hospital — 0.2% | |||
| Philadelphia Hospitals and Higher Education Facilities Authority, PA, (Temple University Health System Obligated Group): | |||
| (AGM), 5.00%, 7/1/35 | $ | 500 | $ 543,905 |
| (AGM), 5.00%, 7/1/36 | 250 | 271,418 | |
| $ 815,323 | |||
| Security | Principal Amount (000's omitted) | Value | |
| Insured - Housing — 0.1% | |||
| California Municipal Finance Authority, (CHF-Davis II, LLC - Orchard Park Student Housing), Green Bonds, (BAM), 5.00%, 5/15/29 | $ | 350 | $ 383,635 |
| $ 383,635 | |||
| Insured - Solid Waste — 0.3% | |||
| South Bayside Waste Management Authority, CA, (Shoreway Environmental Center): | |||
| Green Bonds, (AGM), (AMT), 5.00%, 9/1/28 | $ | 485 | $ 537,283 |
| Green Bonds, (AGM), (AMT), 5.00%, 9/1/30 | 485 | 540,503 | |
| Green Bonds, (AGM), (AMT), Escrowed to Maturity, 5.00%, 9/1/28 | 15 | 16,967 | |
| Green Bonds, (AGM), (AMT), Escrowed to Maturity, 5.00%, 9/1/30 | 15 | 17,166 | |
| $ 1,111,919 | |||
| Insured - Special Tax Revenue — 0.1% | |||
| Martha's Vineyard Land Bank, Green Bonds, (BAM), 5.00%, 5/1/32 | $ | 400 | $ 434,892 |
| $ 434,892 | |||
| Insured - Transportation — 0.3% | |||
| Ohio, (Portsmouth Gateway Group, LLC), (AGM), (AMT), 5.00%, 12/31/30 | $ | 1,000 | $ 1,053,530 |
| $ 1,053,530 | |||
| Insured - Water and Sewer — 0.7% | |||
| Bloomington, IN, Sewage Works Revenue: | |||
| Green Bonds, (BAM), 2.00%, 1/1/27 | $ | 100 | $ 96,050 |
| Green Bonds, (BAM), 4.00%, 1/1/29 | 500 | 527,665 | |
| Fort Wayne, IN, Sewage Works Revenue: | |||
| Green Bonds, (BAM), 5.00%, 8/1/28 | 1,020 | 1,148,918 | |
| Green Bonds, (BAM), 5.00%, 8/1/29 | 975 | 1,107,405 | |
| $ 2,880,038 | |||
| Lease Revenue/Certificates of Participation — 1.1% | |||
| Kansas City, MO, Special Obligation Bonds: | |||
| 4.00%, 10/1/34 | $ | 500 | $ 513,185 |
| 4.00%, 10/1/35 | 600 | 614,172 | |
| New Jersey Economic Development Authority, (School Facilities Construction): | |||
| Social Bonds, 5.00%, 6/15/26 | 555 | 592,618 | |
| Social Bonds, 5.00%, 6/15/27 | 410 | 442,644 | |
| University of Mississippi Educational Building Corp., 5.00%, 10/1/28 | 1,000 | 1,131,110 | |
| Security | Principal Amount (000's omitted) | Value | |
| Lease Revenue/Certificates of Participation (continued) | |||
| University of North Dakota, Certificates of Participation, Green Certificates, 5.00%, 4/1/48 | $ | 1,500 | $ 1,599,045 |
| $ 4,892,774 | |||
| Other Revenue — 5.4% | |||
| Battery Park City Authority, NY: | |||
| 5.00%, 11/1/39 | $ | 200 | $ 226,274 |
| Sustainability Bonds, 5.00%, 11/1/49 | 3,250 | 3,626,253 | |
| California Community Choice Financing Authority, Green Bonds, 4.00%, 10/1/52 | 2,000 | 2,039,960 | |
| California Infrastructure and Economic Development Bank, (California Academy of Sciences), 1.26%, (SIFMA + 0.35%), 8/1/24 (Put Date), 8/1/47(3) | 2,630 | 2,598,966 | |
| California Infrastructure and Economic Development Bank, (Infrastructure State Revolving Fund), Prerefunded to 10/1/25, 5.00%, 10/1/34 | 2,000 | 2,180,860 | |
| Connecticut Health and Educational Facilities Authority, (State Supported Child Care), 4.00%, 7/1/38 | 1,170 | 1,171,931 | |
| District of Columbia, (DC Smart Lighting), Green Bonds, (AMT), 5.00%, 2/29/28 | 4,430 | 4,760,212 | |
| Fairfax County Economic Development Authority, VA, (National Wildlife Federation): | |||
| Green Bonds, 5.00%, 9/1/34 | 1,310 | 1,455,174 | |
| Green Bonds, 5.00%, 9/1/36 | 1,445 | 1,598,661 | |
| Illinois Educational Facilities Authority, (Field Museum of Natural History): | |||
| 4.00%, 11/1/36 | 1,000 | 1,017,610 | |
| 4.45%, 11/1/36 | 1,000 | 1,036,640 | |
| Massachusetts Water Pollution Abatement Trust, 5.25%, 8/1/29 | 1,000 | 1,173,360 | |
| $ 22,885,901 | |||
| Senior Living/Life Care — 0.5% | |||
| Vermont Economic Development Authority, (Wake Robin Corp.), 5.00%, 5/1/24 | $ | 1,875 | $ 1,904,887 |
| $ 1,904,887 | |||
| Solid Waste — 0.7% | |||
| Los Angeles County Sanitation Districts Financing Authority, CA: | |||
| Green Bonds, 5.00%, 10/1/23 | $ | 1,500 | $ 1,561,710 |
| Green Bonds, 5.00%, 10/1/24 | 1,500 | 1,598,055 | |
| $ 3,159,765 | |||
| Special Tax Revenue — 4.1% | |||
| Florida Department of Environmental Protection, (Everglades Restoration), 5.00%, 7/1/29(2) | $ | 2,730 | $ 3,129,563 |
| Security | Principal Amount (000's omitted) | Value | |
| Special Tax Revenue (continued) | |||
| Idaho Housing and Finance Association, Special Tax Revenue, 5.00%, 8/15/25 | $ | 1,000 | $ 1,081,130 |
| Los Angeles County Metropolitan Transportation Authority, CA, Sales Tax Revenue, Green Bonds, 5.00%, 7/1/39 | 2,000 | 2,207,560 | |
| Massachusetts School Building Authority, Social Bonds, 5.00%, 8/15/35 | 1,500 | 1,694,730 | |
| Metropolitan Transportation Authority, NY, Dedicated Tax Revenue: | |||
| Series 2017A, Green Bonds, 5.00%, 11/15/35 | 1,000 | 1,049,950 | |
| Series 2017B, Green Bonds, 5.00%, 11/15/35 | 2,275 | 2,393,232 | |
| Peninsula Corridor Joint Powers Board, CA: | |||
| Green Bonds, 5.00%, 6/1/26 | 1,280 | 1,412,416 | |
| Green Bonds, 5.00%, 6/1/28 | 1,100 | 1,250,876 | |
| Regional Transportation District, CO, Sales Tax Revenue, 5.00%, 11/1/32 | 1,000 | 1,186,330 | |
| Washington Metropolitan Area Transit Authority, D.C., Green Bonds, 5.00%, 7/15/27 | 2,000 | 2,251,700 | |
| $ 17,657,487 | |||
| Student Loan — 1.3% | |||
| Iowa Student Loan Liquidity Corp., (AMT), 5.00%, 12/1/30 | $ | 3,000 | $ 3,305,670 |
| Massachusetts Educational Financing Authority: | |||
| (AMT), 5.00%, 7/1/30 | 1,000 | 1,100,400 | |
| (AMT), 5.00%, 7/1/31 | 1,000 | 1,101,420 | |
| $ 5,507,490 | |||
| Transportation — 0.6% | |||
| Massachusetts, (Rail Enhancement Program), 5.00%, 6/1/50 | $ | 1,000 | $ 1,107,820 |
| Northern Virginia Transportation Commission, Green Bonds, 5.00%, 6/1/30 | 1,375 | 1,589,376 | |
| $ 2,697,196 | |||
| Water and Sewer — 9.8% | |||
| Austin, TX, Water & Wastewater System Revenue, 5.00%, 11/15/33 | $ | 2,000 | $ 2,200,040 |
| Beaverton, OR, Water Revenue: | |||
| 5.00%, 4/1/24 | 1,290 | 1,357,209 | |
| 5.00%, 4/1/27 | 1,490 | 1,666,952 | |
| Cleveland, OH, Water Revenue: | |||
| 5.00%, 1/1/27 | 150 | 166,722 | |
| 5.00%, 1/1/28 | 770 | 855,493 | |
| Dallas, TX, Waterworks and Sewer System Revenue, 4.00%, 10/1/35 | 1,000 | 1,040,950 | |
| Discovery Clean Water Alliance, WA, Sewer Revenue: | |||
| 5.00%, 12/1/33(2) | 2,180 | 2,534,403 | |
| 5.00%, 12/1/34(2) | 2,290 | 2,642,843 | |
| Security | Principal Amount (000's omitted) | Value | |
| Water and Sewer (continued) | |||
| District of Columbia Water and Sewer Authority, 5.00%, 10/1/26 | $ | 500 | $ 554,465 |
| East Baton Rouge Sewerage Commission, LA, 4.00%, 2/1/35 | 1,000 | 1,021,670 | |
| East Bay Municipal Utility District, CA, Water System Revenue: | |||
| Green Bonds, 5.00%, 6/1/35 | 1,000 | 1,095,540 | |
| Green Bonds, 5.00%, 6/1/36 | 1,650 | 1,856,448 | |
| Greensboro, NC, Combined Enterprise System Revenue, 4.00%, 6/1/34 | 500 | 528,250 | |
| Indiana Finance Authority, (CWA Authority): | |||
| Green Bonds, 5.00%, 10/1/27 | 615 | 690,270 | |
| Green Bonds, 5.00%, 10/1/28 | 765 | 869,063 | |
| Green Bonds, 5.00%, 10/1/30 | 1,000 | 1,087,820 | |
| Green Bonds, 5.00%, 10/1/34 | 300 | 335,688 | |
| Green Bonds, 5.00%, 10/1/35 | 425 | 475,273 | |
| Green Bonds, 5.00%, 10/1/36 | 1,000 | 1,072,090 | |
| Green Bonds, 5.00%, 10/1/44 | 3,000 | 3,249,758 | |
| Los Angeles, CA, Wastewater System Revenue: | |||
| Green Bonds, 5.00%, 6/1/34 | 1,000 | 1,108,300 | |
| Green Bonds, 5.00%, 6/1/38 | 2,000 | 2,169,680 | |
| Lubbock,TX, Water and Wastewater System Revenue: | |||
| 4.00%, 2/15/30 | 650 | 697,456 | |
| 4.00%, 2/15/31 | 435 | 464,141 | |
| 4.00%, 2/15/32 | 325 | 343,561 | |
| 4.00%, 2/15/33 | 200 | 208,318 | |
| 5.00%, 2/15/25 | 300 | 321,516 | |
| 5.00%, 2/15/26 | 400 | 437,532 | |
| Massachusetts Water Resources Authority, Green Bonds, 5.00%, 8/1/32 | 1,500 | 1,650,945 | |
| Metropolitan Water District of Southern California, 1.05%, (SIFMA + 0.14%), 5/21/24 (Put Date), 7/1/37(3) | 3,335 | 3,327,396 | |
| New York City Municipal Water Finance Authority, NY, (Water and Sewer System), (SPA: TD Bank N.A.), 0.60%, 6/15/43(4) | 2,800 | 2,800,000 | |
| Pennsylvania Economic Development Financing Authority, (Pennsylvania-American Water Co.), 3.00%, 4/1/39 | 2,500 | 2,153,400 | |
| Trinity River Authority, TX, (Mountain Creek Regional Wastewater System), 4.00%, 8/1/33 | 1,000 | 1,059,590 | |
| $ 42,042,782 | |||
| Total Tax-Exempt Municipal Obligations (identified cost $399,433,342) | $386,638,387 | ||
| Taxable Municipal Obligations — 4.9% |
| Security | Principal Amount (000's omitted) | Value | |
| Education — 0.8% | |||
| San Antonio Education Facilities Corp., TX, (University of the Incarnate Word): | |||
| 1.74%, 4/1/25 | $ | 600 | $ 558,798 |
| 1.99%, 4/1/26 | 550 | 502,420 | |
| 2.19%, 4/1/27 | 600 | 536,232 | |
| 2.38%, 4/1/28 | 1,190 | 1,044,046 | |
| 2.50%, 4/1/29 | 1,000 | 859,500 | |
| $ 3,500,996 | |||
| Electric Utilities — 0.4% | |||
| Confederated Tribes of Warm Springs Reservation, OR, (Pelton-Round Butte Hydroelectric Project): | |||
| Green Bonds, 2.015%, 11/1/25(1) | $ | 745 | $ 708,100 |
| Green Bonds, 2.52%, 11/1/28(1) | 1,205 | 1,101,804 | |
| $ 1,809,904 | |||
| General Obligations — 0.4% | |||
| Detroit, MI: | |||
| Social Bonds, 2.017%, 4/1/23 | $ | 375 | $ 369,626 |
| Social Bonds, 2.189%, 4/1/24 | 400 | 385,620 | |
| Larkspur-Corte Madera School District, CA, (Election of 2011 and 2014): | |||
| 1.702%, 8/1/30 | 415 | 354,186 | |
| 1.802%, 8/1/31 | 400 | 336,700 | |
| Tustin Unified School District, CA, 1.554%, 8/1/29 | 535 | 462,722 | |
| $ 1,908,854 | |||
| Hospital — 0.9% | |||
| University of Wisconsin Hospitals and Clinics Authority: | |||
| 1.05%, 4/1/24 | $ | 1,250 | $ 1,199,475 |
| 1.47%, 4/1/25 | 1,000 | 944,920 | |
| 1.89%, 4/1/27 | 1,255 | 1,156,119 | |
| 2.09%, 4/1/28 | 590 | 538,587 | |
| $ 3,839,101 | |||
| Housing — 0.1% | |||
| Independent Cities Finance Authority, CA, (Sahara Mobile Home Park), 2.51%, 6/15/31 | $ | 500 | $ 440,425 |
| $ 440,425 | |||
| Insured - Housing — 0.2% | |||
| Oregon Facilities Authority, (CHF-Ashland, LLC - Southern Oregon University): | |||
| (AGM), 1.509%, 7/1/25 | $ | 150 | $ 139,500 |
| (AGM), 2.005%, 7/1/27 | 185 | 166,535 | |
| Security | Principal Amount (000's omitted) | Value | |
| Insured - Housing (continued) | |||
| Oregon Facilities Authority, (CHF-Ashland, LLC - Southern Oregon University): (continued) | |||
| (AGM), 2.429%, 7/1/29 | $ | 275 | $ 241,670 |
| (AGM), 2.679%, 7/1/31 | 350 | 300,454 | |
| $ 848,159 | |||
| Other Revenue — 0.5% | |||
| Utah Transit Authority, Sales Tax Revenue, Green Bonds, 1.72%, 12/15/27 | $ | 2,500 | $ 2,254,675 |
| $ 2,254,675 | |||
| Senior Living/Life Care — 0.1% | |||
| California Public Finance Authority, (Enso Village), Green Bonds, 2.875%, 5/15/27(1) | $ | 350 | $ 329,350 |
| $ 329,350 | |||
| Special Tax Revenue — 1.3% | |||
| California Health Facilities Financing Authority, (No Place Like Home Program): | |||
| 2.02%, 6/1/24 | $ | 1,000 | $ 973,140 |
| 2.211%, 6/1/25 | 1,500 | 1,442,130 | |
| 2.361%, 6/1/26 | 2,000 | 1,903,880 | |
| Massachusetts Bay Transportation Authority, Sales Tax Revenue, 0.99%, 7/1/25 | 1,135 | 1,054,880 | |
| $ 5,374,030 | |||
| Water and Sewer — 0.2% | |||
| Narragansett Bay Commission, RI, Wastewater System Revenue, Green Bonds, 1.497%, 9/1/24 | $ | 660 | $ 634,135 |
| $ 634,135 | |||
| Total Taxable Municipal Obligations (identified cost $22,715,569) | $ 20,939,629 | ||
| Short-Term Investments — 3.1% | |||
| Security | Shares | Value | |
| Morgan Stanley Institutional Liquidity Funds - Government Portfolio, Institutional Class, 1.38%(5) | 13,235,464 | $ 13,235,464 | |
| Total Short-Term Investments (identified cost $13,235,464) | $ 13,235,464 | ||
| Total Investments — 102.8% (identified cost $456,218,424) | $439,446,111 | ||
| Other Assets, Less Liabilities — (2.8)% | $ (12,012,550) | ||
| Net Assets — 100.0% | $ 427,433,561 | ||
| The percentage shown for each investment category in the Schedule of Investments is based on net assets. | |
| (1) | Security exempt from registration under Rule 144A of the Securities Act of 1933, as amended. These securities may be sold in certain transactions in reliance on an exemption from registration (normally to qualified institutional buyers). At June 30, 2022, the aggregate value of these securities is $9,266,655 or 2.2% of the Fund's net assets. |
| (2) | When-issued security. |
| (3) | Floating rate security. The stated interest rate represents the rate in effect at June 30, 2022. |
| (4) | Variable rate demand obligation that may be tendered at par on any day for payment the same or next business day. The stated interest rate, which generally resets daily, is determined by the remarketing agent and represents the rate in effect at June 30, 2022. |
| (5) | May be deemed to be an affiliated investment company. The rate shown is the annualized seven-day yield as of June 30, 2022. |
| At June 30, 2022, the concentration of the Fund's investments in the various states, determined as a percentage of net assets, is as follows: | |
| California 16.4% | |
| Others, representing less than 10% individually81.1% | |
| The Fund invests primarily in debt securities issued by municipalities. The ability of the issuers of the debt securities to meet their obligations may be affected by economic developments in a specific industry or municipality. At June 30, 2022, 3.0% of total investments are backed by bond insurance of various financial institutions and financial guaranty assurance agencies. The aggregate percentage insured by an individual financial institution or financial guaranty assurance agency ranged from 0.2% to 1.5% of total investments. |
| Description | Number of Contracts | Position | Expiration Date | Notional Amount | Value/ Unrealized Appreciation (Depreciation) |
| Interest Rate Futures | |||||
| U.S. 10-Year Treasury Note | (94) | Short | 9/21/22 | $(11,141,938) | $ 63,310 |
| $63,310 |
| Abbreviations: | |
| AGC | – Assured Guaranty Corp. |
| AGM | – Assured Guaranty Municipal Corp. |
| AMT | – Interest earned from these securities may be considered a tax preference item for purposes of the Federal Alternative Minimum Tax. |
| BAM | – Build America Mutual Assurance Co. |
| FHLMC | – Federal Home Loan Mortgage Corp. |
| FNMA | – Federal National Mortgage Association |
| PSF | – Permanent School Fund |
| SFMR | – Single Family Mortgage Revenue |
| SIFMA | – Securities Industry and Financial Markets Association Municipal Swap Index |
| SONYMA | – State of New York Mortgage Agency |
| SPA | – Standby Bond Purchase Agreement |
| June 30, 2022 | |
| Assets | |
| Investments in securities of unaffiliated issuers, at value (identified cost $442,982,960) | $ 426,210,647 |
| Investments in securities of affiliated issuers, at value (identified cost $13,235,464) | 13,235,464 |
| Deposits at broker for futures contracts | 169,761 |
| Receivable for investments sold | 1,297,311 |
| Receivable for capital shares sold | 5,692,751 |
| Interest receivable | 3,625,385 |
| Dividends receivable - affiliated | 13,538 |
| Receivable from affiliate | 88,366 |
| Trustees' deferred compensation plan | 259,784 |
| Total assets | $450,593,007 |
| Liabilities | |
| Payable for variation margin on open futures contracts | $ 95,490 |
| Payable for investments purchased | 3,279,360 |
| Payable for when-issued securities | 17,350,753 |
| Payable for capital shares redeemed | 1,752,535 |
| Distributions payable | 121,411 |
| Payable to affiliates: | |
| Investment advisory fee | 117,735 |
| Administrative fee | 41,040 |
| Distribution and service fees | 24,389 |
| Sub-transfer agency fee | 8,191 |
| Trustees' deferred compensation plan | 259,784 |
| Accrued expenses | 108,758 |
| Total liabilities | $ 23,159,446 |
| Net Assets | $427,433,561 |
| Sources of Net Assets | |
| Paid-in capital | $ 485,535,438 |
| Accumulated loss | (58,101,877) |
| Net Assets | $427,433,561 |
| Class A Shares | |
| Net Assets | $ 113,023,973 |
| Shares Outstanding | 7,472,142 |
| Net Asset Value and Redemption Price Per Share (net assets ÷ shares of beneficial interest outstanding) | $ 15.13 |
| Maximum Offering Price Per Share (100 ÷ 96.75 of net asset value per share) | $ 15.64 |
| Class C Shares | |
| Net Assets | $ 1,560,819 |
| Shares Outstanding | 103,182 |
| Net Asset Value and Offering Price Per Share* (net assets ÷ shares of beneficial interest outstanding) | $ 15.13 |
| June 30, 2022 | |
| Class I Shares | |
| Net Assets | $ 312,848,769 |
| Shares Outstanding | 20,629,794 |
| Net Asset Value, Offering Price and Redemption Price Per Share (net assets ÷ shares of beneficial interest outstanding) | $ 15.16 |
| On sales of $100,000 or more, the offering price of Class A shares is reduced. | |
| * | Redemption price per share is equal to the net asset value less any applicable contingent deferred sales charge. |
| Six Months Ended | |
| June 30, 2022 | |
| Investment Income | |
| Dividend income - affiliated issuers | $ 26,685 |
| Interest income | 4,195,100 |
| Total investment income | $ 4,221,785 |
| Expenses | |
| Investment advisory fee | $ 722,997 |
| Administrative fee | 247,885 |
| Distribution and service fees: | |
| Class A | 147,520 |
| Class C | 9,536 |
| Trustees' fees and expenses | 10,492 |
| Custodian fees | 4,378 |
| Transfer agency fees and expenses | 150,261 |
| Accounting fees | 46,332 |
| Professional fees | 22,552 |
| Registration fees | 37,295 |
| Reports to shareholders | 10,623 |
| Miscellaneous | 34,437 |
| Total expenses | $ 1,444,308 |
| Waiver and/or reimbursement of expenses by affiliate | $ (258,124) |
| Net expenses | $ 1,186,184 |
| Net investment income | $ 3,035,601 |
| Realized and Unrealized Gain (Loss) | |
| Net realized gain (loss): | |
| Investment securities | $ (11,588,110) |
| Investment securities - affiliated issuers | 319 |
| Futures contracts | 877,606 |
| Net realized loss | $(10,710,185) |
| Change in unrealized appreciation (depreciation): | |
| Investment securities | $ (30,959,615) |
| Investment securities - affiliated issuers | (296) |
| Futures contracts | 200,080 |
| Net change in unrealized appreciation (depreciation) | $(30,759,831) |
| Net realized and unrealized loss | $(41,470,016) |
| Net decrease in net assets from operations | $(38,434,415) |
| Six Months Ended June 30, 2022 (Unaudited) | Year Ended December 31, 2021 | |
| Increase (Decrease) in Net Assets | ||
| From operations: | ||
| Net investment income | $ 3,035,601 | $ 4,793,788 |
| Net realized gain (loss) | (10,710,185) | 245,680 |
| Net change in unrealized appreciation (depreciation) | (30,759,831) | (3,617,064) |
| Net increase (decrease) in net assets from operations | $ (38,434,415) | $ 1,422,404 |
| Distributions to shareholders: | ||
| Class A | $ (764,589) | $ (1,302,502) |
| Class C | (5,031) | (5,946) |
| Class I | (2,268,216) | (3,488,209) |
| Total distributions to shareholders | $ (3,037,836) | $ (4,796,657) |
| Capital share transactions: | ||
| Class A | $ (3,491,694) | $ 1,128,640 |
| Class C | (497,460) | 27,464 |
| Class I | 38,130,967 | 64,236,324 |
| Net increase in net assets from capital share transactions | $ 34,141,813 | $ 65,392,428 |
| Net increase (decrease) in net assets | $ (7,330,438) | $ 62,018,175 |
| Net Assets | ||
| At beginning of period | $ 434,763,999 | $ 372,745,824 |
| At end of period | $427,433,561 | $434,763,999 |
| Class A | ||||||
| Six Months Ended June 30, 2022 (Unaudited) | Year Ended December 31, | |||||
| 2021 | 2020 | 2019 | 2018 | 2017 | ||
| Net asset value — Beginning of period | $ 16.69 | $ 16.83 | $ 16.36 | $ 15.61 | $ 15.91 | $ 15.55 |
| Income (Loss) From Operations | ||||||
| Net investment income(1) | $ 0.10 | $ 0.17 | $ 0.24 | $ 0.35 | $ 0.38 | $ 0.41 |
| Net realized and unrealized gain (loss) | (1.56) | (0.14) | 0.47 | 0.75 | (0.30) | 0.36 |
| Total income (loss) from operations | $ (1.46) | $ 0.03 | $ 0.71 | $ 1.10 | $ 0.08 | $ 0.77 |
| Less Distributions | ||||||
| From net investment income | $ (0.10) | $ (0.17) | $ (0.24) | $ (0.35) | $ (0.38) | $ (0.41) |
| Total distributions | $ (0.10) | $ (0.17) | $ (0.24) | $ (0.35) | $ (0.38) | $ (0.41) |
| Net asset value — End of period | $ 15.13 | $ 16.69 | $ 16.83 | $ 16.36 | $ 15.61 | $ 15.91 |
| Total Return(2) | (8.76)% (3) | 0.19% | 4.38% | 7.10% | 0.54% | 5.00% |
| Ratios/Supplemental Data | ||||||
| Net assets, end of period (000’s omitted) | $113,024 | $128,437 | $128,384 | $117,964 | $108,866 | $119,971 |
| Ratios (as a percentage of average daily net assets):(4) | ||||||
| Total expenses | 0.87% (5) | 0.87% | 0.88% | 0.96% | 0.95% | 0.94% |
| Net expenses | 0.75% (5)(6) | 0.75% | 0.75% | 0.77% | 0.80% | 0.80% |
| Net investment income | 1.29% (5) | 1.02% | 1.45% | 2.15% | 2.44% | 2.61% |
| Portfolio Turnover | 39% (3) | 18% | 14% | 18% | 9% | 27% |
| (1) | Computed using average shares outstanding. |
| (2) | Returns are historical and are calculated by determining the percentage change in net asset value with all distributions reinvested and do not reflect the effect of sales charges, if any. |
| (3) | Not annualized. |
| (4) | Total expenses do not reflect amounts reimbursed and/or waived by the adviser and certain of its affiliates, if applicable. Net expenses are net of all reductions and represent the net expenses paid by the Fund. |
| (5) | Annualized. |
| (6) | Includes a reduction by the investment adviser of a portion of its advisory fee due to the Fund's investment in the Liquidity Fund (equal to less than 0.005% of average daily net assets for the six months ended June 30, 2022). |
| Class C | ||||||
| Six Months Ended June 30, 2022 (Unaudited) | Year Ended December 31, | |||||
| 2021 | 2020 | 2019 | 2018 | 2017 | ||
| Net asset value — Beginning of period | $ 16.69 | $ 16.83 | $ 16.36 | $ 15.61 | $ 15.91 | $ 15.55 |
| Income (Loss) From Operations | ||||||
| Net investment income(1) | $ 0.04 | $ 0.04 | $ 0.11 | $ 0.22 | $ 0.26 | $ 0.29 |
| Net realized and unrealized gain (loss) | (1.56) | (0.13) | 0.48 | 0.76 | (0.29) | 0.37 |
| Total income (loss) from operations | $ (1.52) | $ (0.09) | $ 0.59 | $ 0.98 | $ (0.03) | $ 0.66 |
| Less Distributions | ||||||
| From net investment income | $ (0.04) | $ (0.05) | $ (0.12) | $ (0.23) | $ (0.27) | $ (0.30) |
| Total distributions | $ (0.04) | $ (0.05) | $ (0.12) | $ (0.23) | $ (0.27) | $ (0.30) |
| Net asset value — End of period | $15.13 | $16.69 | $16.83 | $16.36 | $15.61 | $15.91 |
| Total Return(2) | (9.10)% (3) | (0.56)% | 3.60% | 6.29% | (0.19)% | 4.25% |
| Ratios/Supplemental Data | ||||||
| Net assets, end of period (000’s omitted) | $ 1,561 | $ 2,258 | $ 2,249 | $ 1,510 | $ 1,195 | $ 1,240 |
| Ratios (as a percentage of average daily net assets):(4) | ||||||
| Total expenses | 1.63% (5) | 1.62% | 1.62% | 1.71% | 1.69% | 2.87% |
| Net expenses | 1.50% (5)(6) | 1.50% | 1.50% | 1.51% | 1.55% | 1.55% |
| Net investment income | 0.53% (5) | 0.27% | 0.67% | 1.37% | 1.69% | 1.84% |
| Portfolio Turnover | 39% (3) | 18% | 14% | 18% | 9% | 27% |
| (1) | Computed using average shares outstanding. |
| (2) | Returns are historical and are calculated by determining the percentage change in net asset value with all distributions reinvested and do not reflect the effect of sales charges, if any. |
| (3) | Not annualized. |
| (4) | Total expenses do not reflect amounts reimbursed and/or waived by the adviser and certain of its affiliates, if applicable. Net expenses are net of all reductions and represent the net expenses paid by the Fund. |
| (5) | Annualized. |
| (6) | Includes a reduction by the investment adviser of a portion of its advisory fee due to the Fund's investment in the Liquidity Fund (equal to less than 0.005% of average daily net assets for the six months ended June 30, 2022). |
| Class I | ||||||
| Six Months Ended June 30, 2022 (Unaudited) | Year Ended December 31, | |||||
| 2021 | 2020 | 2019 | 2018 | 2017 | ||
| Net asset value — Beginning of period | $ 16.73 | $ 16.88 | $ 16.40 | $ 15.65 | $ 15.93 | $ 15.57 |
| Income (Loss) From Operations | ||||||
| Net investment income(1) | $ 0.12 | $ 0.21 | $ 0.26 | $ 0.39 | $ 0.44 | $ 0.46 |
| Net realized and unrealized gain (loss) | (1.57) | (0.15) | 0.50 | 0.76 | (0.30) | 0.36 |
| Total income (loss) from operations | $ (1.45) | $ 0.06 | $ 0.76 | $ 1.15 | $ 0.14 | $ 0.82 |
| Less Distributions | ||||||
| From net investment income | $ (0.12) | $ (0.21) | $ (0.28) | $ (0.40) | $ (0.42) | $ (0.46) |
| Total distributions | $ (0.12) | $ (0.21) | $ (0.28) | $ (0.40) | $ (0.42) | $ (0.46) |
| Net asset value — End of period | $ 15.16 | $ 16.73 | $ 16.88 | $ 16.40 | $ 15.65 | $ 15.93 |
| Total Return(2) | (8.68)% (3) | 0.38% | 4.69% | 7.38% | 0.92% | 5.35% |
| Ratios/Supplemental Data | ||||||
| Net assets, end of period (000’s omitted) | $312,849 | $304,069 | $242,113 | $66,218 | $35,812 | $23,193 |
| Ratios (as a percentage of average daily net assets):(4) | ||||||
| Total expenses | 0.62% (5) | 0.62% | 0.63% | 0.71% | 0.69% | 0.76% |
| Net expenses | 0.50% (5)(6) | 0.50% | 0.50% | 0.49% | 0.45% | 0.45% |
| Net investment income | 1.55% (5) | 1.27% | 1.59% | 2.39% | 2.79% | 2.93% |
| Portfolio Turnover | 39% (3) | 18% | 14% | 18% | 9% | 27% |
| (1) | Computed using average shares outstanding. |
| (2) | Returns are historical and are calculated by determining the percentage change in net asset value with all distributions reinvested and do not reflect the effect of sales charges, if any. |
| (3) | Not annualized. |
| (4) | Total expenses do not reflect amounts reimbursed and/or waived by the adviser and certain of its affiliates, if applicable. Net expenses are net of all reductions and represent the net expenses paid by the Fund. |
| (5) | Annualized. |
| (6) | Includes a reduction by the investment adviser of a portion of its advisory fee due to the Fund's investment in the Liquidity Fund (equal to less than 0.005% of average daily net assets for the six months ended June 30, 2022). |
| Asset Description | Level 1 | Level 2 | Level 3 | Total |
| Corporate Bonds | $ — | $ 9,608,080 | $ — | $ 9,608,080 |
| Tax-Exempt Mortgage-Backed Securities | — | 9,024,551 | — | 9,024,551 |
| Tax-Exempt Municipal Obligations | — | 386,638,387 | — | 386,638,387 |
| Taxable Municipal Obligations | — | 20,939,629 | — | 20,939,629 |
| Short-Term Investments | 13,235,464 | — | — | 13,235,464 |
| Total Investments | $13,235,464 | $426,210,647 | $ — | $439,446,111 |
| Futures Contracts | $ 63,310 | $ — | $ — | $ 63,310 |
| Total | $13,298,774 | $426,210,647 | $ — | $439,509,421 |
| Aggregate cost | $456,228,689 |
| Gross unrealized appreciation | $ 1,561,937 |
| Gross unrealized depreciation | (18,281,205) |
| Net unrealized depreciation | $ (16,719,268) |
| Derivative | Statement of Assets and Liabilities Caption | Assets | Liabilities | |
| Futures contracts | Accumulated loss | $63,310 (1) | $ — | |
| (1) | Only the current day's variation margin is reported within the Statement of Assets and Liabilities as Receivable or Payable for variation margin on open futures contracts, as applicable. |
| Statement of Operations Caption | |||
| Derivative | Net realized gain (loss): Futures contracts | Change in unrealized appreciation (depreciation): Futures contracts | |
| Futures contracts | $ 877,606 | $ 200,080 | |
| Name | Value, beginning of period | Purchases | Sales proceeds | Net realized gain (loss) | Change in unrealized appreciation (depreciation) | Value, end of period | Dividend income | Units/Shares, end of period |
| Short-Term Investments | ||||||||
| Cash Reserves Fund | $13,043,583 | $ 95,449,122 | $(108,492,728) | $ 319 | $ (296) | $ — | $ 4,496 | — |
| Liquidity Fund | — | 102,965,815 | (89,730,351) | — | — | 13,235,464 | 22,189 | 13,235,464 |
| Total | $ 319 | $(296) | $13,235,464 | $26,685 | ||||
| Six Months Ended June 30, 2022 (Unaudited) | Year Ended December 31, 2021 | ||||
| Shares | Amount | Shares | Amount | ||
| Class A | |||||
| Shares sold | 536,685 | $ 8,337,892 | 850,214 | $ 14,223,778 | |
| Reinvestment of distributions | 44,414 | 690,929 | 70,658 | 1,179,909 | |
| Shares redeemed | (804,010) | (12,520,515) | (853,487) | (14,275,047) | |
| Net increase (decrease) | (222,911) | $ (3,491,694) | 67,385 | $ 1,128,640 | |
| Class C | |||||
| Shares sold | 2,858 | $ 44,921 | 26,654 | $ 445,789 | |
| Reinvestment of distributions | 319 | 4,950 | 355 | 5,933 | |
| Shares redeemed | (35,277) | (547,331) | (25,331) | (424,258) | |
| Net increase (decrease) | (32,100) | $ (497,460) | 1,678 | $ 27,464 | |
| Six Months Ended June 30, 2022 (Unaudited) | Year Ended December 31, 2021 | ||||
| Shares | Amount | Shares | Amount | ||
| Class I | |||||
| Shares sold | 10,881,292 | $ 168,815,906 | 8,668,030 | $145,361,153 | |
| Reinvestment of distributions | 120,058 | 1,873,602 | 178,530 | 2,989,101 | |
| Shares redeemed | (8,541,874) | (132,558,541) | (5,023,113) | (84,113,930) | |
| Net increase | 2,459,476 | $ 38,130,967 | 3,823,447 | $ 64,236,324 | |
| Officers |
| Hope L. Brown Chief Compliance Officer |
| Deidre E. Walsh Secretary, Vice President and Chief Legal Officer |
| James F. Kirchner Treasurer |
| Trustees |
| Alice Gresham Bullock Chairperson |
| Richard L. Baird, Jr. |
| Cari M. Dominguez |
| John G. Guffey, Jr. |
| Miles D. Harper, III |
| Joy V. Jones |
| John H. Streur* |
| Anthony A. Williams |
| *Interested Trustee and President |
| Privacy Notice | April 2021 |
| FACTS | WHAT DOES EATON VANCE DO WITH YOUR PERSONAL INFORMATION? |
| Why? | Financial companies choose how they share your personal information. Federal law gives consumers the right to limit some but not all sharing. Federal law also requires us to tell you how we collect, share, and protect your personal information. Please read this notice carefully to understand what we do. |
| What? | The types of personal information we collect and share depend on the product or service you have with us. This information can include:■ Social Security number and income ■ investment experience and risk tolerance ■ checking account number and wire transfer instructions |
| How? | All financial companies need to share customers’ personal information to run their everyday business. In the section below, we list the reasons financial companies can share their customers’ personal information; the reasons Eaton Vance chooses to share; and whether you can limit this sharing. |
| Reasons we can share your personal information | Does Eaton Vance share? | Can you limit this sharing? |
| For our everyday business purposes — such as to process your transactions, maintain your account(s), respond to court orders and legal investigations, or report to credit bureaus | Yes | No |
| For our marketing purposes — to offer our products and services to you | Yes | No |
| For joint marketing with other financial companies | No | We don’t share |
| For our investment management affiliates’ everyday business purposes — information about your transactions, experiences, and creditworthiness | Yes | Yes |
| For our affiliates’ everyday business purposes — information about your transactions and experiences | Yes | No |
| For our affiliates’ everyday business purposes — information about your creditworthiness | No | We don’t share |
| For our investment management affiliates to market to you | Yes | Yes |
| For our affiliates to market to you | No | We don’t share |
| For nonaffiliates to market to you | No | We don’t share |
| To limit our sharing | Call toll-free 1-800-368-2745 or email: CRMPrivacy@calvert.comPlease note:If you are a new customer, we can begin sharing your information 30 days from the date we sent this notice. When you are no longer our customer, we continue to share your information as described in this notice. However, you can contact us at any time to limit our sharing. |
| Questions? | Call toll-free 1-800-368-2745 or email: CRMPrivacy@calvert.com |
| Privacy Notice — continued | April 2021 |
| Who we are | |
| Who is providing this notice? | Eaton Vance Management, Eaton Vance Distributors, Inc., Eaton Vance Trust Company, Eaton Vance Management (International) Limited, Eaton Vance Advisers International Ltd., Eaton Vance Global Advisors Limited, Eaton Vance Management’s Real Estate Investment Group, Boston Management and Research, Calvert Research and Management, Eaton Vance and Calvert Fund Families and our investment advisory affiliates (“Eaton Vance”) (see Investment Management Affiliates definition below) |
| What we do | |
| How does Eaton Vance protect my personal information? | To protect your personal information from unauthorized access and use, we use security measures that comply with federal law. These measures include computer safeguards and secured files and buildings. We have policies governing the proper handling of customer information by personnel and requiring third parties that provide support to adhere to appropriate security standards with respect to such information. |
| How does Eaton Vance collect my personal information? | We collect your personal information, for example, when you■ open an account or make deposits or withdrawals from your account ■ buy securities from us or make a wire transfer ■ give us your contact informationWe also collect your personal information from others, such as credit bureaus, affiliates, or other companies. |
| Why can’t I limit all sharing? | Federal law gives you the right to limit only■ sharing for affiliates’ everyday business purposes — information about your creditworthiness ■ affiliates from using your information to market to you ■ sharing for nonaffiliates to market to youState laws and individual companies may give you additional rights to limit sharing. See below for more on your rights under state law. |
| Definitions | |
| Investment Management Affiliates | Eaton Vance Investment Management Affiliates include registered investment advisers, registered broker- dealers, and registered and unregistered funds. Investment Management Affiliates does not include entities associated with Morgan Stanley Wealth Management, such as Morgan Stanley Smith Barney LLC and Morgan Stanley & Co. |
| Affiliates | Companies related by common ownership or control. They can be financial and nonfinancial companies.■ Our affiliates include companies with a Morgan Stanley name and financial companies such as Morgan Stanley Smith Barney LLC and Morgan Stanley & Co. |
| Nonaffiliates | Companies not related by common ownership or control. They can be financial and nonfinancial companies.■ Eaton Vance does not share with nonaffiliates so they can market to you. |
| Joint marketing | A formal agreement between nonaffiliated financial companies that together market financial products or services to you.■ Eaton Vance doesn’t jointly market. |
| Other important information | |
| Vermont: Except as permitted by law, we will not share personal information we collect about Vermont residents with Nonaffiliates unless you provide us with your written consent to share such information.California: Except as permitted by law, we will not share personal information we collect about California residents with Nonaffiliates and we will limit sharing such personal information with our Affiliates to comply with California privacy laws that apply to us. | |


| % Cumulative Total Returns1,2 | Class Inception Date | Performance Inception Date | Six Months | One Year | Five Years | Since Inception |
| Class A at NAV | 04/29/2022 | 04/29/2022 | —% | —% | —% | (12.78)% |
| Class A with 5.25% Maximum Sales Charge | — | — | — | — | — | (17.33) |
| Class C at NAV | 04/29/2022 | 04/29/2022 | — | — | — | (12.90) |
| Class C with 1% Maximum Sales Charge | — | — | — | — | — | (13.76) |
| Class I at NAV | 04/29/2022 | 04/29/2022 | — | — | — | (12.75) |
| Class R6 at NAV | 04/29/2022 | 04/29/2022 | — | — | — | (12.75) |
| FTSE EPRA Nareit Developed Extended Net Total Return Index | — | — | (19.92)% | (12.08)% | 3.48% | (11.59)% |
| % Total Annual Operating Expense Ratios3 | Class A | Class C | Class I | Class R6 |
| Gross | 1.35% | 2.10% | 1.10% | 1.10% |
| Net | 1.20 | 1.95 | 0.95 | 0.95 |

| Top 10 Holdings (% of net assets)* | |
| American Tower Corp. | 7.6% |
| Prologis, Inc. | 5.6 |
| Welltower, Inc. | 5.1 |
| Digital Realty Trust, Inc. | 4.6 |
| Public Storage | 4.1 |
| Realty Income Corp. | 3.1 |
| Mid-America Apartment Communities, Inc. | 3.0 |
| Equity Residential | 3.0 |
| SBA Communications Corp. | 2.6 |
| UDR, Inc. | 2.4 |
| Total | 41.1% |
| * | Excludes cash and cash equivalents. |
| 1 | The FTSE EPRA Nareit Developed Extended Net Total Return Index is a market capitalization weighted index designed to represent general trends in eligible real estate stocks worldwide. Relevant real estate activities are defined as the ownership, trading and development of income-producing real estate. The FTSE EPRA Nareit Developed Extended Index represents the extension of real estate property sectors (e.g. Infrastructure and Timber) and additional securities beyond what is currently eligible for the FTSE EPRA Nareit Developed Index. The performance of the Index is listed in U.S. dollars and assumes reinvestment of dividends. It is not possible to invest directly in an index. |
| 2 | Cumulative Total Returns at NAV do not include applicable sales charges. If sales charges were deducted, the returns would be lower. Cumulative Total Returns shown with maximum sales charge reflect the stated maximum sales charge. Unless otherwise stated, performance does not reflect the deduction of taxes on Fund distributions or redemptions of Fund shares. Performance since inception for an index, if presented, is the performance since the Fund’s or oldest share class’ inception, as applicable. Performance for periods of more than one year represents the average annual total return for such period. |
| 3 | Source: Fund prospectus. Net expense ratios reflect a contractual expense reimbursement that continues through 4/30/23. The expense ratios for the current reporting period can be found in the Financial Highlights section of this report. Performance reflects expenses waived and/or reimbursed, if applicable. Without such waivers and/or reimbursements, performance would have been lower. |
| Fund profile subject to change due to active management. |
| Beginning Account Value (4/29/22) | Ending Account Value (6/30/22) | Expenses Paid During Period (4/29/22 – 6/30/22) | Annualized Expense Ratio | |
| Actual * | ||||
| Class A | $1,000.00 | $872.20 | $1.88 ** | 1.20% |
| Class C | $1,000.00 | $871.00 | $3.05 ** | 1.95% |
| Class I | $1,000.00 | $872.50 | $1.49 ** | 0.95% |
| Class R6 | $1,000.00 | $872.50 | $1.49 ** | 0.95% |
| Beginning Account Value (1/1/22) | Ending Account Value (6/30/22) | Expenses Paid During Period (1/1/22 – 6/30/22) | Annualized Expense Ratio | |
| Hypothetical *** | ||||
| (5% return per year before expenses) | ||||
| Class A | $1,000.00 | $1,018.84 | $6.01 ** | 1.20% |
| Class C | $1,000.00 | $1,015.12 | $9.74 ** | 1.95% |
| Class I | $1,000.00 | $1,020.08 | $4.76 ** | 0.95% |
| Class R6 | $1,000.00 | $1,020.08 | $4.76 ** | 0.95% |
| * | The Fund had not commenced operations on January 1, 2022. Actual expenses are equal to the Fund’s annualized expense ratio for the indicated Class, multiplied by the average account value over the period, multiplied by 63/365 (to reflect the period from the commencement of operations on April 29, 2022 to June 30, 2022). The Example assumes that the $1,000 was invested at the net asset value per share determined at the opening of business on April 29, 2022. |
| ** | Absent a waiver and/or reimbursement of expenses by an affiliate, expenses would be higher. |
| *** | Hypothetical expenses are equal to the Fund’s annualized expense ratio for the indicated Class, multiplied by the average account value over the period, multiplied by 181/365 (to reflect the one-half year period). The Example assumes that the $1,000 was invested at the net asset value per share determined at the opening of business on April 29, 2022. |
| Common Stocks — 98.0% |
| Security | Shares | Value | |
| Australia — 2.3% | |||
| Dexus | 6,293 | $ 38,700 | |
| GPT Group (The) | 10,356 | 30,267 | |
| National Storage REIT | 20,236 | 30,021 | |
| $ 98,988 | |||
| Belgium — 1.7% | |||
| Aedifica S.A. | 496 | $ 47,657 | |
| Warehouses De Pauw CVA | 819 | 25,843 | |
| $ 73,500 | |||
| Canada — 2.2% | |||
| Chartwell Retirement Residences | 3,766 | $ 32,622 | |
| RioCan Real Estate Investment Trust | 1,978 | 30,764 | |
| Tricon Residential, Inc. | 3,379 | 34,257 | |
| $ 97,643 | |||
| France — 0.7% | |||
| Klepierre S.A. | 1,528 | $ 29,570 | |
| $ 29,570 | |||
| Germany — 1.5% | |||
| Grand City Properties S.A. | 2,091 | $ 28,285 | |
| Vonovia SE | 1,204 | 37,252 | |
| $ 65,537 | |||
| Hong Kong — 5.0% | |||
| Hongkong Land Holdings, Ltd. | 10,500 | $ 52,732 | |
| Link REIT | 7,200 | 58,834 | |
| Sun Hung Kai Properties, Ltd. | 5,500 | 65,120 | |
| Wharf Real Estate Investment Co., Ltd. | 9,000 | 42,977 | |
| $ 219,663 | |||
| Japan — 7.1% | |||
| GLP J-REIT | 19 | $ 23,284 | |
| Japan Metropolitan Fund Investment Corp. | 43 | 33,505 | |
| Japan Real Estate Investment Corp. | 10 | 46,046 | |
| LaSalle Logiport REIT | 19 | 23,378 | |
| Mitsubishi Estate Co., Ltd. | 3,600 | 52,176 | |
| Mitsubishi Estate Logistics REIT Investment Corp. | 7 | 23,777 | |
| Mitsui Fudosan Co., Ltd. | 3,000 | 64,455 | |
| Nippon Building Fund, Inc. | 9 | 44,916 | |
| $ 311,537 | |||
| Netherlands — 0.5% | |||
| Eurocommercial Properties NV | 1,022 | $ 21,958 | |
| $ 21,958 | |||
| Security | Shares | Value | |
| Singapore — 3.3% | |||
| CapitaLand Integrated Commercial Trust | 14,900 | $ 23,292 | |
| City Developments, Ltd. | 4,000 | 23,494 | |
| Digital Core REIT Management Pte, Ltd.(1) | 25,000 | 19,259 | |
| Mapletree Industrial Trust | 19,800 | 37,066 | |
| Suntec Real Estate Investment Trust | 36,700 | 42,819 | |
| $ 145,930 | |||
| Spain — 1.2% | |||
| Inmobiliaria Colonial Socimi S.A. | 2,934 | $ 18,771 | |
| Merlin Properties Socimi S.A. | 3,385 | 32,781 | |
| $ 51,552 | |||
| Sweden — 1.2% | |||
| Catena AB | 709 | $ 25,659 | |
| Fabege AB | 2,669 | 25,295 | |
| $ 50,954 | |||
| United Kingdom — 4.3% | |||
| Derwent London PLC | 963 | $ 30,704 | |
| Empiric Student Property PLC | 13,292 | 13,882 | |
| Helical PLC | 2,281 | 10,344 | |
| Land Securities Group PLC | 3,502 | 28,419 | |
| Safestore Holdings PLC | 1,571 | 20,342 | |
| Segro PLC | 5,337 | 63,711 | |
| UNITE Group PLC (The) | 1,727 | 22,448 | |
| $ 189,850 | |||
| United States — 67.0% | |||
| Agree Realty Corp. | 1,013 | $ 73,069 | |
| American Tower Corp. | 1,302 | 332,778 | |
| Americold Realty Trust, Inc. | 1,357 | 40,764 | |
| AvalonBay Communities, Inc. | 397 | 77,117 | |
| Brixmor Property Group, Inc. | 2,883 | 58,265 | |
| Crown Castle International Corp. | 533 | 89,747 | |
| Digital Realty Trust, Inc. | 1,556 | 202,015 | |
| Duke Realty Corp. | 1,157 | 63,577 | |
| Equity Residential | 1,794 | 129,563 | |
| Extra Space Storage, Inc. | 510 | 86,761 | |
| Healthpeak Properties, Inc. | 2,161 | 55,992 | |
| Host Hotels & Resorts, Inc. | 2,310 | 36,221 | |
| Iron Mountain, Inc. | 1,362 | 66,316 | |
| Kilroy Realty Corp. | 464 | 24,281 | |
| Kimco Realty Corp. | 3,843 | 75,976 | |
| Life Storage, Inc. | 551 | 61,525 | |
| Mid-America Apartment Communities, Inc. | 744 | 129,954 | |
| Outfront Media, Inc. | 1,367 | 23,171 | |
| Park Hotels & Resorts, Inc. | 1,957 | 26,556 | |
| Security | Shares | Value | |
| United States (continued) | |||
| Prologis, Inc. | 2,081 | $ 244,830 | |
| Public Storage | 578 | 180,723 | |
| Realty Income Corp. | 1,958 | 133,653 | |
| RPT Realty | 4,573 | 44,953 | |
| SBA Communications Corp. | 357 | 114,258 | |
| Simon Property Group, Inc. | 413 | 39,202 | |
| SITE Centers Corp. | 4,577 | 61,652 | |
| SL Green Realty Corp. | 704 | 32,490 | |
| Sun Communities, Inc. | 437 | 69,640 | |
| UDR, Inc. | 2,293 | 105,570 | |
| Welltower, Inc. | 2,696 | 222,016 | |
| Weyerhaeuser Co. | 977 | 32,358 | |
| $2,934,993 | |||
| Total Common Stocks (identified cost $4,876,382) | $4,291,675 | ||
| Short-Term Investments — 1.3% |
| Security | Shares | Value | |
| Morgan Stanley Institutional Liquidity Funds - Government Portfolio, Institutional Class, 1.38%(2) | 58,511 | $ 58,511 | |
| Total Short-Term Investments (identified cost $58,511) | $ 58,511 | ||
| Total Investments — 99.3% (identified cost $4,934,893) | $4,350,186 | |
| Other Assets, Less Liabilities — 0.7% | $ 31,715 | |
| Net Assets — 100.0% | $4,381,901 |
| The percentage shown for each investment category in the Schedule of Investments is based on net assets. | |
| (1) | Non-income producing security. |
| (2) | May be deemed to be an affiliated investment company. The rate shown is the annualized seven-day yield as of June 30, 2022. |
| Economic Sectors | % of Net Assets |
| Residential | 14.8% |
| Specialty | 13.5 |
| Retail | 13.0 |
| Industrial | 12.2 |
| Diversified | 11.2 |
| Self Storage | 8.7 |
| Office | 8.4 |
| Health Care | 8.2 |
| Data Centers | 6.6 |
| Lodging/Resorts | 1.4 |
| Total | 98.0% |
| June 30, 2022 | |
| Assets | |
| Investments in securities of unaffiliated issuers, at value (identified cost $4,876,382) | $ 4,291,675 |
| Investments in securities of affiliated issuers, at value (identified cost $58,511) | 58,511 |
| Cash denominated in foreign currency, at value (cost $8,161) | 8,148 |
| Receivable for capital shares sold | 500 |
| Dividends receivable | 15,589 |
| Dividends receivable - affiliated | 50 |
| Tax reclaims receivable | 82 |
| Receivable from affiliate | 42,103 |
| Total assets | $4,416,658 |
| Liabilities | |
| Payable to affiliates: | |
| Investment advisory fee | $ 2,755 |
| Administrative fee | 442 |
| Distribution and service fees | 50 |
| Sub-transfer agency fee | 11 |
| Accrued expenses | 31,499 |
| Total liabilities | $ 34,757 |
| Net Assets | $4,381,901 |
| Sources of Net Assets | |
| Paid-in capital | $ 5,042,754 |
| Accumulated loss | (660,853) |
| Net Assets | $4,381,901 |
| Class A Shares | |
| Net Assets | $ 61,994 |
| Shares Outstanding | 7,142 |
| Net Asset Value and Redemption Price Per Share (net assets ÷ shares of beneficial interest outstanding) | $ 8.68 |
| Maximum Offering Price Per Share (100 ÷ 94.75 of net asset value per share) | $ 9.16 |
| Class C Shares | |
| Net Assets | $ 43,563 |
| Shares Outstanding | 5,018 |
| Net Asset Value and Offering Price Per Share* (net assets ÷ shares of beneficial interest outstanding) | $ 8.68 |
| Class I Shares | |
| Net Assets | $ 4,232,708 |
| Shares Outstanding | 487,502 |
| Net Asset Value, Offering Price and Redemption Price Per Share (net assets ÷ shares of beneficial interest outstanding) | $ 8.68 |
| June 30, 2022 | |
| Class R6 Shares | |
| Net Assets | $ 43,636 |
| Shares Outstanding | 5,026 |
| Net Asset Value, Offering Price and Redemption Price Per Share (net assets ÷ shares of beneficial interest outstanding) | $ 8.68 |
| On sales of $50,000 or more, the offering price of Class A shares is reduced. | |
| * | Redemption price per share is equal to the net asset value less any applicable contingent deferred sales charge. |
| Period Ended | |
| June 30, 2022(1) | |
| Investment Income | |
| Dividend income (net of foreign taxes withheld of $1,958) | $ 36,164 |
| Dividend income - affiliated issuers | 154 |
| Total investment income | $ 36,318 |
| Expenses | |
| Investment advisory fee | $ 5,756 |
| Administrative fee | 921 |
| Distribution and service fees: | |
| Class A | 23 |
| Class C | 76 |
| Custodian fees | 539 |
| Transfer agency fees and expenses | 48 |
| Accounting fees | 293 |
| Professional fees | 14,882 |
| Registration fees | 24,651 |
| Reports to shareholders | 368 |
| Miscellaneous | 1,892 |
| Total expenses | $ 49,449 |
| Waiver and/or reimbursement of expenses by affiliate | $ (42,132) |
| Net expenses | $ 7,317 |
| Net investment income | $ 29,001 |
| Realized and Unrealized Gain (Loss) | |
| Net realized gain (loss): | |
| Investment securities | $ (79,573) |
| Foreign currency transactions | (2,806) |
| Net realized loss | $ (82,379) |
| Change in unrealized appreciation (depreciation): | |
| Investment securities | $ (584,707) |
| Foreign currency | (14) |
| Net change in unrealized appreciation (depreciation) | $(584,721) |
| Net realized and unrealized loss | $(667,100) |
| Net decrease in net assets from operations | $(638,099) |
| (1) | For the period from the commencement of operations on April 29, 2022 to June 30, 2022. |
| Period Ended June 30, 2022(1) (Unaudited) | |
| Increase (Decrease) in Net Assets | |
| From operations: | |
| Net investment income | $ 29,001 |
| Net realized loss | (82,379) |
| Net change in unrealized appreciation (depreciation) | (584,721) |
| Net decrease in net assets from operations | $ (638,099) |
| Distributions to shareholders: | |
| Class A | $ (304) |
| Class C | (155) |
| Class I | (22,067) |
| Class R6 | (228) |
| Total distributions to shareholders | $ (22,754) |
| Capital share transactions: | |
| Class A | $ 70,304 |
| Class C | 50,155 |
| Class I | 4,872,067 |
| Class R6 | 50,228 |
| Net increase in net assets from capital share transactions | $5,042,754 |
| Net increase in net assets | $4,381,901 |
| Net Assets | |
| At beginning of period | $ — |
| At end of period | $4,381,901 |
| (1) | For the period from the commencement of operations on April 29, 2022 to June 30, 2022. |
| Class A | |
| Period Ended June 30, 2022(1) (Unaudited) | |
| Net asset value — Beginning of period | $ 10.00 |
| Income (Loss) From Operations | |
| Net investment income(2) | $ 0.06 |
| Net realized and unrealized loss | (1.34) |
| Total loss from operations | $ (1.28) |
| Less Distributions | |
| From net investment income | $ (0.04) |
| Total distributions | $ (0.04) |
| Net asset value — End of period | $ 8.68 |
| Total Return(3) | (12.78)% (4) |
| Ratios/Supplemental Data | |
| Net assets, end of period (000’s omitted) | $ 62 |
| Ratios (as a percentage of average daily net assets):(5) | |
| Total expenses | 6.71% (6) |
| Net expenses | 1.20% (6)(7) |
| Net investment income | 3.85% (6) |
| Portfolio Turnover | 12% (4) |
| (1) | For the period from the commencement of operations on April 29, 2022 to June 30, 2022. |
| (2) | Computed using average shares outstanding. |
| (3) | Returns are historical and are calculated by determining the percentage change in net asset value with all distributions reinvested and do not reflect the effect of sales charges, if any. |
| (4) | Not annualized. |
| (5) | Total expenses do not reflect amounts reimbursed and/or waived by the adviser and certain of its affiliates, if applicable. Net expenses are net of all reductions and represent the net expenses paid by the Fund. |
| (6) | Annualized. |
| (7) | Includes a reduction by the investment adviser of a portion of its advisory fee due to the Fund’s investment in the Liquidity Fund (equal to less than 0.005% of average daily net assets for the period ended June 30, 2022). |
| Class C | |
| Period Ended June 30, 2022(1) (Unaudited) | |
| Net asset value — Beginning of period | $ 10.00 |
| Income (Loss) From Operations | |
| Net investment income(2) | $ 0.04 |
| Net realized and unrealized loss | (1.33) |
| Total loss from operations | $ (1.29) |
| Less Distributions | |
| From net investment income | $ (0.03) |
| Total distributions | $ (0.03) |
| Net asset value — End of period | $ 8.68 |
| Total Return(3) | (12.90)% (4) |
| Ratios/Supplemental Data | |
| Net assets, end of period (000’s omitted) | $ 44 |
| Ratios (as a percentage of average daily net assets):(5) | |
| Total expenses | 7.43% (6) |
| Net expenses | 1.95% (6)(7) |
| Net investment income | 2.78% (6) |
| Portfolio Turnover | 12% (4) |
| (1) | For the period from the commencement of operations on April 29, 2022 to June 30, 2022. |
| (2) | Computed using average shares outstanding. |
| (3) | Returns are historical and are calculated by determining the percentage change in net asset value with all distributions reinvested and do not reflect the effect of sales charges, if any. |
| (4) | Not annualized. |
| (5) | Total expenses do not reflect amounts reimbursed and/or waived by the adviser and certain of its affiliates, if applicable. Net expenses are net of all reductions and represent the net expenses paid by the Fund. |
| (6) | Annualized. |
| (7) | Includes a reduction by the investment adviser of a portion of its advisory fee due to the Fund’s investment in the Liquidity Fund (equal to less than 0.005% of average daily net assets for the period ended June 30, 2022). |
| Class I | |
| Period Ended June 30, 2022(1) (Unaudited) | |
| Net asset value — Beginning of period | $ 10.00 |
| Income (Loss) From Operations | |
| Net investment income(2) | $ 0.06 |
| Net realized and unrealized loss | (1.33) |
| Total loss from operations | $ (1.27) |
| Less Distributions | |
| From net investment income | $ (0.05) |
| Total distributions | $ (0.05) |
| Net asset value — End of period | $ 8.68 |
| Total Return(3) | (12.75)% (4) |
| Ratios/Supplemental Data | |
| Net assets, end of period (000’s omitted) | $ 4,233 |
| Ratios (as a percentage of average daily net assets):(5) | |
| Total expenses | 6.43% (6) |
| Net expenses | 0.95% (6)(7) |
| Net investment income | 3.78% (6) |
| Portfolio Turnover | 12% (4) |
| (1) | For the period from the commencement of operations on April 29, 2022 to June 30, 2022. |
| (2) | Computed using average shares outstanding. |
| (3) | Returns are historical and are calculated by determining the percentage change in net asset value with all distributions reinvested and do not reflect the effect of sales charges, if any. |
| (4) | Not annualized. |
| (5) | Total expenses do not reflect amounts reimbursed and/or waived by the adviser and certain of its affiliates, if applicable. Net expenses are net of all reductions and represent the net expenses paid by the Fund. |
| (6) | Annualized. |
| (7) | Includes a reduction by the investment adviser of a portion of its advisory fee due to the Fund’s investment in the Liquidity Fund (equal to less than 0.005% of average daily net assets for the period ended June 30, 2022). |
| Class R6 | |
| Period Ended June 30, 2022(1) (Unaudited) | |
| Net asset value — Beginning of period | $ 10.00 |
| Income (Loss) From Operations | |
| Net investment income(2) | $ 0.06 |
| Net realized and unrealized loss | (1.33) |
| Total loss from operations | $ (1.27) |
| Less Distributions | |
| From net investment income | $ (0.05) |
| Total distributions | $ (0.05) |
| Net asset value — End of period | $ 8.68 |
| Total Return(3) | (12.75)% (4) |
| Ratios/Supplemental Data | |
| Net assets, end of period (000’s omitted) | $ 44 |
| Ratios (as a percentage of average daily net assets):(5) | |
| Total expenses | 6.43% (6) |
| Net expenses | 0.95% (6)(7) |
| Net investment income | 3.78% (6) |
| Portfolio Turnover | 12% (4) |
| (1) | For the period from the commencement of operations on April 29, 2022 to June 30, 2022. |
| (2) | Computed using average shares outstanding. |
| (3) | Returns are historical and are calculated by determining the percentage change in net asset value with all distributions reinvested and do not reflect the effect of sales charges, if any. |
| (4) | Not annualized. |
| (5) | Total expenses do not reflect amounts reimbursed and/or waived by the adviser and certain of its affiliates, if applicable. Net expenses are net of all reductions and represent the net expenses paid by the Fund. |
| (6) | Annualized. |
| (7) | Includes a reduction by the investment adviser of a portion of its advisory fee due to the Fund’s investment in the Liquidity Fund (equal to less than 0.005% of average daily net assets for the period ended June 30, 2022). |
| Asset Description | Level 1 | Level 2 | Level 3 | Total |
| Common Stocks: | ||||
| Australia | $ — | $ 98,988 | $ — | $ 98,988 |
| Belgium | — | 73,500 | — | 73,500 |
| Canada | 97,643 | — | — | 97,643 |
| France | — | 29,570 | — | 29,570 |
| Germany | — | 65,537 | — | 65,537 |
| Hong Kong | — | 219,663 | — | 219,663 |
| Japan | — | 311,537 | — | 311,537 |
| Netherlands | — | 21,958 | — | 21,958 |
| Singapore | — | 145,930 | — | 145,930 |
| Spain | — | 51,552 | — | 51,552 |
| Sweden | — | 50,954 | — | 50,954 |
| United Kingdom | — | 189,850 | — | 189,850 |
| United States | 2,934,993 | — | — | 2,934,993 |
| Total Common Stocks | $3,032,636 | $1,259,039 (1) | $ — | $4,291,675 |
| Short-Term Investments | $ 58,511 | $ — | $ — | $ 58,511 |
| Total Investments | $3,091,147 | $1,259,039 | $ — | $4,350,186 |
| (1) | Includes foreign equity securities whose values were adjusted to reflect market trading of comparable securities or other correlated instruments that occurred after the close of trading in their applicable foreign markets. |
| Aggregate cost | $4,934,893 |
| Gross unrealized appreciation | $ 26,385 |
| Gross unrealized depreciation | (611,092) |
| Net unrealized depreciation | $ (584,707) |
| Name | Value, beginning of period | Purchases | Sales proceeds | Net realized gain (loss) | Change in unrealized appreciation (depreciation) | Value, end of period | Dividend income | Shares, end of period |
| Short-Term Investments | ||||||||
| Liquidity Fund | $ — | $1,353,927 | $(1,295,416) | $ — | $ — | $58,511 | $154 | 58,511 |
| Period Ended June 30, 2022(1) (Unaudited) | ||
| Shares | Amount | |
| Class A | ||
| Shares sold | 7,108 | $ 70,000 |
| Reinvestment of distributions | 34 | 304 |
| Net increase | 7,142 | $ 70,304 |
| Period Ended June 30, 2022(1) (Unaudited) | ||
| Shares | Amount | |
| Class C | ||
| Shares sold | 5,000 | $ 50,000 |
| Reinvestment of distributions | 18 | 155 |
| Net increase | 5,018 | $ 50,155 |
| Class I | ||
| Shares sold | 485,000 | $ 4,850,000 |
| Reinvestment of distributions | 2,502 | 22,067 |
| Net increase | 487,502 | $4,872,067 |
| Class R6 | ||
| Shares sold | 5,000 | $ 50,000 |
| Reinvestment of distributions | 26 | 228 |
| Net increase | 5,026 | $ 50,228 |
| (1) | For the period from the commencement of operations on April 29, 2022 to June 30, 2022. |
| Officers |
| Hope L. Brown Chief Compliance Officer |
| Deidre E. Walsh Secretary, Vice President and Chief Legal Officer |
| James F. Kirchner Treasurer |
| Trustees |
| Alice Gresham Bullock Chairperson |
| Richard L. Baird, Jr. |
| Cari M. Dominguez |
| John G. Guffey, Jr. |
| Miles D. Harper, III |
| Joy V. Jones |
| John H. Streur* |
| Anthony A. Williams |
| *Interested Trustee and President |
| Privacy Notice | April 2021 |
| FACTS | WHAT DOES EATON VANCE DO WITH YOUR PERSONAL INFORMATION? |
| Why? | Financial companies choose how they share your personal information. Federal law gives consumers the right to limit some but not all sharing. Federal law also requires us to tell you how we collect, share, and protect your personal information. Please read this notice carefully to understand what we do. |
| What? | The types of personal information we collect and share depend on the product or service you have with us. This information can include:■ Social Security number and income ■ investment experience and risk tolerance ■ checking account number and wire transfer instructions |
| How? | All financial companies need to share customers’ personal information to run their everyday business. In the section below, we list the reasons financial companies can share their customers’ personal information; the reasons Eaton Vance chooses to share; and whether you can limit this sharing. |
| Reasons we can share your personal information | Does Eaton Vance share? | Can you limit this sharing? |
| For our everyday business purposes — such as to process your transactions, maintain your account(s), respond to court orders and legal investigations, or report to credit bureaus | Yes | No |
| For our marketing purposes — to offer our products and services to you | Yes | No |
| For joint marketing with other financial companies | No | We don’t share |
| For our investment management affiliates’ everyday business purposes — information about your transactions, experiences, and creditworthiness | Yes | Yes |
| For our affiliates’ everyday business purposes — information about your transactions and experiences | Yes | No |
| For our affiliates’ everyday business purposes — information about your creditworthiness | No | We don’t share |
| For our investment management affiliates to market to you | Yes | Yes |
| For our affiliates to market to you | No | We don’t share |
| For nonaffiliates to market to you | No | We don’t share |
| To limit our sharing | Call toll-free 1-800-368-2745 or email: CRMPrivacy@calvert.comPlease note:If you are a new customer, we can begin sharing your information 30 days from the date we sent this notice. When you are no longer our customer, we continue to share your information as described in this notice. However, you can contact us at any time to limit our sharing. |
| Questions? | Call toll-free 1-800-368-2745 or email: CRMPrivacy@calvert.com |
| Privacy Notice — continued | April 2021 |
| Who we are | |
| Who is providing this notice? | Eaton Vance Management, Eaton Vance Distributors, Inc., Eaton Vance Trust Company, Eaton Vance Management (International) Limited, Eaton Vance Advisers International Ltd., Eaton Vance Global Advisors Limited, Eaton Vance Management’s Real Estate Investment Group, Boston Management and Research, Calvert Research and Management, Eaton Vance and Calvert Fund Families and our investment advisory affiliates (“Eaton Vance”) (see Investment Management Affiliates definition below) |
| What we do | |
| How does Eaton Vance protect my personal information? | To protect your personal information from unauthorized access and use, we use security measures that comply with federal law. These measures include computer safeguards and secured files and buildings. We have policies governing the proper handling of customer information by personnel and requiring third parties that provide support to adhere to appropriate security standards with respect to such information. |
| How does Eaton Vance collect my personal information? | We collect your personal information, for example, when you■ open an account or make deposits or withdrawals from your account ■ buy securities from us or make a wire transfer ■ give us your contact informationWe also collect your personal information from others, such as credit bureaus, affiliates, or other companies. |
| Why can’t I limit all sharing? | Federal law gives you the right to limit only■ sharing for affiliates’ everyday business purposes — information about your creditworthiness ■ affiliates from using your information to market to you ■ sharing for nonaffiliates to market to youState laws and individual companies may give you additional rights to limit sharing. See below for more on your rights under state law. |
| Definitions | |
| Investment Management Affiliates | Eaton Vance Investment Management Affiliates include registered investment advisers, registered broker- dealers, and registered and unregistered funds. Investment Management Affiliates does not include entities associated with Morgan Stanley Wealth Management, such as Morgan Stanley Smith Barney LLC and Morgan Stanley & Co. |
| Affiliates | Companies related by common ownership or control. They can be financial and nonfinancial companies.■ Our affiliates include companies with a Morgan Stanley name and financial companies such as Morgan Stanley Smith Barney LLC and Morgan Stanley & Co. |
| Nonaffiliates | Companies not related by common ownership or control. They can be financial and nonfinancial companies.■ Eaton Vance does not share with nonaffiliates so they can market to you. |
| Joint marketing | A formal agreement between nonaffiliated financial companies that together market financial products or services to you.■ Eaton Vance doesn’t jointly market. |
| Other important information | |
| Vermont: Except as permitted by law, we will not share personal information we collect about Vermont residents with Nonaffiliates unless you provide us with your written consent to share such information.California: Except as permitted by law, we will not share personal information we collect about California residents with Nonaffiliates and we will limit sharing such personal information with our Affiliates to comply with California privacy laws that apply to us. | |
Item 2. Code of Ethics
Not required in this filing.
Item 3. Audit Committee Financial Expert
Not required in this filing.
Item 4. Principal Accountant Fees and Services
Not required in this filing.
Item 5. Audit Committee of Listed Registrants
Not applicable.
Item 6. Schedule of Investments
Please see schedule of investments contained in the Report to Shareholders included under Item 1 of this Form N-CSR.
Item 7. Disclosure of Proxy Voting Policies and Procedures for Closed-End Management Investment Companies
Not applicable.
Item 8. Portfolio Managers of Closed-End Management Investment Companies
Not applicable.
Item 9. Purchases of Equity Securities by Closed-End Management Investment Company and Affiliated Purchasers
Not applicable.
Item 10. Submission of Matters to a Vote of Security Holders
No material changes.
Item 11. Controls and Procedures
(a) The registrant’s principal executive and principal financial officers have concluded that the registrant’s disclosure controls and procedures (as defined in Rule 30a-3(c) under the Investment Company Act of 1940 Act, as amended (the “1940 Act”) are effective, based on the evaluation of these controls and procedures required by Rule 30a-3(b) under the 1940 Act and Rules 13a-15(b) or 15d-15(b) under the Securities Exchange Act of 1934 (“Exchange Act”), as of a date within 90 days of the filing date of this report.
(b) There was no change in the registrant’s internal control over financial reporting (as defined in Rule 30a-3(d) under the 1940 Act) that occurred during the period covered by this report that has materially affected, or is reasonably likely to materially affect, the registrant’s internal control over financial reporting.
Item 12. Disclosure of Securities Lending Activities for Closed-End Management Investment Companies
Not applicable.
Item 13. Exhibits
| (a)(1) | Registrant’s Code of Ethics- Not applicable (please see Item 2) | |
| (a)(2)(i) | President’s Section 302 certification. | |
| (a)(2)(ii) | Treasurer’s Section 302 certification. | |
| (b) | Combined Section 906 certification. | |
Signatures
Pursuant to the requirements of the Securities Exchange Act of 1934 and the Investment Company Act of 1940, the registrant has duly caused this report to be signed on its behalf by the undersigned, thereunto duly authorized.
| Calvert Management Series | ||
| By: | /s/ John H. Streur | |
| John H. Streur | ||
| President | ||
Date: August 22, 2022
Pursuant to the requirements of the Securities Exchange Act of 1934 and the Investment Company Act of 1940, this report has been signed below by the following persons on behalf of the registrant and in the capacities and on the dates indicated.
| By: | /s/ John H. Streur | |
| John H. Streur | ||
| President |
Date: August 22, 2022
| By: | /s/ James F. Kirchner | |
| James F. Kirchner | ||
| Treasurer |
Date: August 22, 2022