UNITED STATES
SECURITIES AND EXCHANGE COMMISSION
Washington, D.C. 20549
FORM N-CSR
CERTIFIED SHAREHOLDER REPORT OF REGISTERED
MANAGEMENT INVESTMENT COMPANIES
Investment Company Act File number: 811-03101
Calvert Management Series
(Exact Name of Registrant as Specified in Charter)
2050 M Street NW, Suite 200, Washington, DC 20036
(Address of Principal Executive Offices)
Deidre E. Walsh
One Post Office Square, Boston, Massachusetts 02109
(Name and Address of Agent for Service)
(202) 238-2200
(Registrant’s telephone number)
September 30
Date of Fiscal Year End
March 31, 2024
Date of Reporting Period
Item 1. Report to Stockholders.


| % Average Annual Total Returns1,2 | Class Inception Date | Performance Inception Date | Six Months | One Year | Five Years | Since Inception |
| Class A at NAV | 10/10/2017 | 10/10/2017 | 5.56% | 11.96% | 4.16% | 3.68% |
| Class A with 3.25% Maximum Sales Charge | — | — | 2.13 | 8.27 | 3.47 | 3.15 |
| Class I at NAV | 10/10/2017 | 10/10/2017 | 5.57 | 12.12 | 4.37 | 3.90 |
| Class R6 at NAV | 10/10/2017 | 10/10/2017 | 5.57 | 12.12 | 4.37 | 3.89 |
| Morningstar ® LSTA® US Leveraged Loan IndexSM | — | — | 5.40% | 12.47% | 5.47% | 5.05% |
| % Total Annual Operating Expense Ratios3 | Class A | Class I | Class R6 |
| Gross | 3.08% | 2.83% | 2.75% |
| Net | 2.82 | 2.57 | 2.57 |
| % Total Leverage4 | |
| Borrowings | 5.59% |
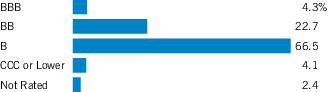
| Credit Quality (% of bond and loan holdings)1 |
| Top 10 Sectors (% of total investments)2 | |
| Software | 14.9% |
| Machinery | 8.9 |
| Health Care Providers & Services | 4.8 |
| Capital Markets | 4.5 |
| Insurance | 3.9 |
| Professional Services | 3.7 |
| Chemicals | 3.6 |
| Commercial Services & Supplies | 3.5 |
| Trading Companies & Distributors | 3.3 |
| Health Care Technology | 2.8 |
| Total | 53.9% |
| 1 | Credit ratings are categorized using S&P Global Ratings (“S&P”). Ratings, which are subject to change, apply to the creditworthiness of the issuers of the underlying securities and not to the Fund or its shares. Credit ratings measure the quality of a bond based on the issuer’s creditworthiness, with ratings ranging from AAA, being the highest, to D, being the lowest based on S&P’s measures. Ratings of BBB or higher by S&P are considered to be investment-grade quality. Credit ratings are based largely on the ratings agency’s analysis at the time of rating. The rating assigned to any particular security is not necessarily a reflection of the issuer’s current financial condition and does not necessarily reflect its assessment of the volatility of a security’s market value or of the liquidity of an investment in the security. Holdings designated as “Not Rated” (if any) are not rated by S&P. |
| 2 | Excludes cash and cash equivalents. |
| 1 | Morningstar® LSTA® US Leveraged Loan IndexSM is an unmanaged index of the institutional leveraged loan market. Morningstar® LSTA® Leveraged Loan indices are a product of Morningstar, Inc. (“Morningstar”) and have been licensed for use. Morningstar® is a registered trademark of Morningstar licensed for certain use. Loan Syndications and Trading Association® and LSTA® are trademarks of the LSTA licensed for certain use by Morningstar, and further sublicensed by Morningstar for certain use. Neither Morningstar nor LSTA guarantees the accuracy and/or completeness of the Morningstar® LSTA® US Leveraged Loan IndexSM or any data included therein, and shall have no liability for any errors, omissions, or interruptions therein. Unless otherwise stated, index returns do not reflect the effect of any applicable sales charges, commissions, expenses, taxes or leverage, as applicable. It is not possible to invest directly in an index. |
| 2 | Total Returns at NAV do not include applicable sales charges. If sales charges were deducted, the returns would be lower. Total Returns shown with maximum sales charge reflect the stated maximum sales charge. Unless otherwise stated, performance does not reflect the deduction of taxes on Fund distributions or redemptions of Fund shares. Performance since inception for an index, if presented, is the performance since the Fund’s or oldest share class’s inception, as applicable. |
| 3 | Source: Fund prospectus. Net expense ratios reflect a contractual expense reimbursement that continues through 2/1/25. The expense ratios for the current reporting period can be found in the Financial Highlights section of this report. Performance reflects expenses waived and/or reimbursed, if applicable. Without such waivers and/or reimbursements, performance would have been lower. |
| 4 | Total leverage is shown as a percentage of the Fund’s aggregate net assets plus borrowings outstanding. The Fund employs leverage through borrowings. Use of leverage creates an opportunity for income, but creates risks including greater volatility of NAV. The cost of borrowings rises and falls with changes in short-term interest rates. The Fund may be required to maintain prescribed asset coverage for its borrowings and may be required to reduce its borrowings at an inopportune time.Fund profile subject to change due to active management. |
| Beginning Account Value (10/1/23) | Ending Account Value (3/31/24) | Expenses Paid During Period* (10/1/23 – 3/31/24) | Annualized Expense Ratio | |
| Actual | ||||
| Class A | $1,000.00 | $1,055.60 | $13.57 ** | 2.64% |
| Class I | $1,000.00 | $1,055.70 | $12.23 ** | 2.38% |
| Class R6 | $1,000.00 | $1,055.70 | $11.82 ** | 2.30% |
| Hypothetical | ||||
| (5% return per year before expenses) | ||||
| Class A | $1,000.00 | $1,011.80 | $13.28 ** | 2.64% |
| Class I | $1,000.00 | $1,013.10 | $11.98 ** | 2.38% |
| Class R6 | $1,000.00 | $1,013.50 | $11.58 ** | 2.30% |
| * | Expenses are equal to the Fund’s annualized expense ratio for the indicated Class, multiplied by the average account value over the period, multiplied by 183/366 (to reflect the one-half year period). The Example assumes that the $1,000 was invested at the net asset value per share determined at the close of business on September 30, 2023. |
| ** | Absent a waiver and/or reimbursement of expenses by affiliate(s), expenses would be higher. |
| Common Stocks — 0.3% |
| Security | Shares | Value | |
| Commercial Services & Supplies — 0.1% | |||
| Phoenix Services International LLC(1)(2) | 9,617 | $ 91,361 | |
| Phoenix Services International LLC(1)(2) | 877 | 8,332 | |
| $ 99,693 | |||
| Containers & Packaging — 0.0%(3) | |||
| LG Parent Holding Co.(1)(2) | 6,015 | $ 32,143 | |
| $ 32,143 | |||
| Entertainment — 0.0%(3) | |||
| New Cineworld Ltd.(1)(2) | 1,348 | $ 24,053 | |
| $ 24,053 | |||
| Financial Services — 0.0%(3) | |||
| Aegletes BV(1)(2) | 1,076 | $ 2,238 | |
| $ 2,238 | |||
| Household Durables — 0.2% | |||
| Serta Simmons Bedding, Inc.(1)(2) | 15,129 | $ 134,270 | |
| Serta SSB Equipment Co.(1)(2)(4) | 15,129 | 0 | |
| $ 134,270 | |||
| Professional Services — 0.0%(3) | |||
| Skillsoft Corp.(1)(2) | 299 | $ 2,692 | |
| $ 2,692 | |||
| Total Common Stocks (identified cost $453,794) | $ 295,089 | ||
| Corporate Bonds — 6.8% |
| Security | Principal Amount (000's omitted) | Value | |
| Air Transport — 0.4% | |||
| American Airlines, Inc./AAdvantage Loyalty IP Ltd.: | |||
| 5.50%, 4/20/26(5) | $ | 187 | $ 186,340 |
| 5.75%, 4/20/29(5) | 200 | 196,750 | |
| $ 383,090 | |||
| Automotive — 0.0%(3) | |||
| Clarios Global LP, 6.75%, 5/15/25(5) | $ | 22 | $ 22,036 |
| Clarios Global LP/Clarios U.S. Finance Co., 6.25%, 5/15/26(5) | 22 | 22,006 | |
| $ 44,042 | |||
| Building and Development — 0.4% | |||
| Cushman & Wakefield U.S. Borrower LLC, 6.75%, 5/15/28(5) | $ | 315 | $ 311,304 |
| Security | Principal Amount (000's omitted) | Value | |
| Building and Development (continued) | |||
| Park Intermediate Holdings LLC/PK Domestic Property LLC/PK Finance Co.-Issuer, 5.875%, 10/1/28(5) | $ | 100 | $ 98,081 |
| $ 409,385 | |||
| Building Products — 0.1% | |||
| Miter Brands Acquisition Holdco, Inc./MIWD Borrower LLC, 6.75%, 4/1/32(5) | $ | 75 | $ 75,303 |
| $ 75,303 | |||
| Business Equipment and Services — 0.2% | |||
| Corelogic, Inc., 4.50%, 5/1/28(5) | $ | 75 | $ 67,331 |
| Garda World Security Corp., 4.625%, 2/15/27(5) | 75 | 71,919 | |
| Prime Security Services Borrower LLC/Prime Finance, Inc., 5.75%, 4/15/26(5) | 75 | 74,833 | |
| $ 214,083 | |||
| Cable and Satellite Television — 0.1% | |||
| Virgin Media Secured Finance PLC, 4.50%, 8/15/30(5) | $ | 75 | $ 64,736 |
| $ 64,736 | |||
| Chemicals and Plastics — 0.1% | |||
| Olympus Water U.S. Holding Corp., 4.25%, 10/1/28(5) | $ | 125 | $ 113,546 |
| $ 113,546 | |||
| Commercial Services & Supplies — 0.2% | |||
| Neptune Bidco U.S., Inc., 9.29%, 4/15/29(5) | $ | 200 | $ 189,279 |
| $ 189,279 | |||
| Containers and Glass Products — 0.1% | |||
| Pactiv Evergreen Group Issuer, Inc./Pactiv Evergreen Group Issuer LLC, 4.00%, 10/15/27(5) | $ | 75 | $ 70,050 |
| $ 70,050 | |||
| Cosmetics/Toiletries — 0.1% | |||
| Kronos Acquisition Holdings, Inc./KIK Custom Products, Inc., 5.00%, 12/31/26(5) | $ | 55 | $ 53,961 |
| $ 53,961 | |||
| Diversified Consumer Services — 0.1% | |||
| Wand NewCo 3, Inc., 7.625%, 1/30/32(5) | $ | 125 | $ 129,383 |
| $ 129,383 | |||
| Drugs — 0.5% | |||
| Jazz Securities DAC, 4.375%, 1/15/29(5) | $ | 550 | $ 512,775 |
| $ 512,775 | |||
| Ecological Services and Equipment — 0.7% | |||
| GFL Environmental, Inc., 4.25%, 6/1/25(5) | $ | 75 | $ 73,828 |
| Security | Principal Amount (000's omitted) | Value | |
| Ecological Services and Equipment (continued) | |||
| Madison IAQ LLC, 4.125%, 6/30/28(5) | $ | 650 | $ 601,760 |
| $ 675,588 | |||
| Electronics/Electrical — 0.3% | |||
| Imola Merger Corp., 4.75%, 5/15/29(5) | $ | 300 | $ 281,561 |
| $ 281,561 | |||
| Financial Intermediaries — 1.0% | |||
| AG Issuer LLC, 6.25%, 3/1/28(5) | $ | 225 | $ 220,513 |
| AG TTMT Escrow Issuer LLC, 8.625%, 9/30/27(5) | 50 | 51,807 | |
| NFP Corp.: | |||
| 7.50%, 10/1/30(5) | 50 | 52,718 | |
| 8.50%, 10/1/31(5) | 150 | 165,205 | |
| Panther Escrow Issuer LLC, 7.125%, 6/1/31(5)(6) | 525 | 534,193 | |
| $ 1,024,436 | |||
| Health Care — 0.3% | |||
| Medline Borrower LP, 3.875%, 4/1/29(5) | $ | 325 | $ 296,030 |
| $ 296,030 | |||
| Industrial Equipment — 0.2% | |||
| Pactiv Evergreen Group Issuer LLC/Pactiv Evergreen Group Issuer, Inc., 4.375%, 10/15/28(5) | $ | 150 | $ 140,091 |
| TK Elevator U.S. Newco, Inc., 5.25%, 7/15/27(5) | 50 | 48,361 | |
| $ 188,452 | |||
| Insurance — 0.1% | |||
| AmWINS Group, Inc., 6.375%, 2/15/29(5) | $ | 100 | $ 100,602 |
| $ 100,602 | |||
| Leisure Goods/Activities/Movies — 0.0%(3) | |||
| Six Flags Theme Parks, Inc., 7.00%, 7/1/25(5) | $ | 13 | $ 13,027 |
| $ 13,027 | |||
| Media — 0.0%(3) | |||
| iHeartCommunications, Inc.: | |||
| 4.75%, 1/15/28(5) | $ | 25 | $ 17,582 |
| 5.25%, 8/15/27(5) | 25 | 18,217 | |
| $ 35,799 | |||
| Radio and Television — 0.1% | |||
| Univision Communications, Inc., 4.50%, 5/1/29(5) | $ | 150 | $ 134,180 |
| $ 134,180 | |||
| Retailers (Except Food and Drug) — 0.0%(3) | |||
| PetSmart, Inc./PetSmart Finance Corp., 4.75%, 2/15/28(5) | $ | 25 | $ 23,430 |
| $ 23,430 | |||
| Security | Principal Amount (000's omitted) | Value | |
| Software — 0.2% | |||
| GoTo Group, Inc.: | |||
| 5.50%, 5/1/28(5) | $ | 124 | $ 107,508 |
| 5.50%, 5/1/28(5) | 124 | 83,688 | |
| $ 191,196 | |||
| Technology — 0.5% | |||
| Boxer Parent Co., Inc., 7.125%, 10/2/25(5) | $ | 50 | $ 50,083 |
| Central Parent, Inc./CDK Global, Inc., 7.25%, 6/15/29(5) | 200 | 204,390 | |
| Clarivate Science Holdings Corp., 3.875%, 7/1/28(5) | 200 | 185,252 | |
| Cloud Software Group, Inc., 9.00%, 9/30/29(5) | 125 | 120,009 | |
| $ 559,734 | |||
| Technology Hardware, Storage & Peripherals — 0.1% | |||
| NCR Atleos Corp., 9.50%, 4/1/29(5) | $ | 125 | $ 133,829 |
| $ 133,829 | |||
| Telecommunications — 1.0% | |||
| Level 3 Financing, Inc., 10.75%, 12/15/30(5) | $ | 875 | $ 897,415 |
| Vmed O2 U.K. Financing I PLC, 4.25%, 1/31/31(5) | 125 | 105,950 | |
| $ 1,003,365 | |||
| Total Corporate Bonds (identified cost $7,100,094) | $ 6,920,862 | ||
| Exchange-Traded Funds — 0.9% |
| Security | Shares | Value | |
| Equity Funds — 0.9% | |||
| SPDR Blackstone Senior Loan ETF | 22,750 | $ 958,003 | |
| Total Exchange-Traded Funds (identified cost $1,045,348) | $ 958,003 | ||
| Senior Floating Rate Loans — 105.1%(7) |
| Borrower/Description | Principal Amount (000's omitted) | Value | |
| Aerospace and Defense — 0.8% | |||
| Dynasty Acquisition Co., Inc.: | |||
| Term Loan, 8.829%, (SOFR + 3.50%), 8/24/28 | $ | 546 | $ 546,640 |
| Term Loan, 8.829%, (SOFR + 3.50%), 8/24/28 | 234 | 234,201 | |
| $ 780,841 | |||
| Airlines — 0.9% | |||
| American Airlines, Inc., Term Loan, 10.329%, (SOFR + 4.75%), 4/20/28 | $ | 829 | $ 862,094 |
| $ 862,094 | |||
| Borrower/Description | Principal Amount (000's omitted) | Value | |
| Auto Components — 2.0% | |||
| Autokiniton US Holdings, Inc., Term Loan, 9.442%, (SOFR + 4.00%), 4/6/28 | $ | 929 | $ 933,152 |
| Clarios Global LP, Term Loan, 8.33%, (SOFR + 3.00%), 5/6/30 | 374 | 375,232 | |
| DexKo Global, Inc., Term Loan, 9.321%, (SOFR + 3.75%), 10/4/28 | 371 | 367,871 | |
| LSF12 Badger Bidco LLC, Term Loan, 11.33%, (SOFR + 6.00%), 8/30/30 | 124 | 125,389 | |
| LTI Holdings, Inc., Term Loan, 8.945%, (SOFR + 3.50%), 9/6/25 | 240 | 238,070 | |
| $ 2,039,714 | |||
| Automobiles — 0.4% | |||
| MajorDrive Holdings IV LLC, Term Loan, 9.571%, (SOFR + 4.00%), 6/1/28 | $ | 395 | $ 396,024 |
| $ 396,024 | |||
| Beverages — 0.5% | |||
| Triton Water Holdings, Inc., Term Loan, 8.81%, (SOFR + 3.25%), 3/31/28 | $ | 499 | $ 494,043 |
| $ 494,043 | |||
| Biotechnology — 0.5% | |||
| Alltech, Inc., Term Loan, 9.445%, (SOFR + 4.00%), 10/13/28 | $ | 489 | $ 486,306 |
| $ 486,306 | |||
| Building Products — 1.5% | |||
| CPG International, Inc., Term Loan, 7.927%, (SOFR + 2.50%), 4/28/29 | $ | 197 | $ 197,369 |
| Ingersoll-Rand Services Co., Term Loan, 7.177%, (SOFR + 1.75%), 3/1/27 | 18 | 18,118 | |
| LHS Borrower LLC, Term Loan, 10.18%, (SOFR + 4.75%), 2/16/29 | 295 | 281,077 | |
| MI Windows and Doors LLC, Term Loan, 3/21/31(8) | 225 | 226,336 | |
| Oscar AcquisitionCo. LLC, Term Loan, 9.902%, (SOFR + 4.50%), 4/29/29 | 549 | 550,512 | |
| Standard Industries, Inc., Term Loan, 7.693%, (SOFR + 2.25%), 9/22/28 | 216 | 216,565 | |
| $ 1,489,977 | |||
| Capital Markets — 5.2% | |||
| Advisor Group, Inc., Term Loan, 9.827%, (SOFR + 4.50%), 8/17/28 | $ | 557 | $ 559,068 |
| AllSpring Buyer LLC, Term Loan, 8.562%, (SOFR + 3.25%), 11/1/28 | 560 | 560,253 | |
| Aretec Group, Inc., Term Loan, 9.927%, (SOFR + 4.50%), 8/9/30 | 625 | 629,336 | |
| Brookfield Property REIT, Inc., Term Loan, 7.927%, (SOFR + 2.50%), 8/27/25 | 171 | 170,300 | |
| Borrower/Description | Principal Amount (000's omitted) | Value | |
| Capital Markets (continued) | |||
| Citco Funding LLC, Term Loan, 8.422%, (SOFR + 3.25%), 4/27/28 | $ | 124 | $ 124,880 |
| Clipper Acquisitions Corp., Term Loan, 7.187%, (SOFR + 1.75%), 3/3/28 | 218 | 217,977 | |
| Edelman Financial Center LLC, Term Loan, 8.945%, (SOFR + 3.50%), 4/7/28 | 584 | 584,291 | |
| FinCo I LLC, Term Loan, 8.313%, (SOFR + 3.00%), 6/27/29 | 223 | 223,894 | |
| Focus Financial Partners LLC: | |||
| Term Loan, 7.83%, (SOFR + 2.50%), 6/30/28 | 420 | 418,577 | |
| Term Loan, 8.08%, (SOFR + 2.75%), 6/30/28 | 317 | 316,349 | |
| HighTower Holdings LLC, Term Loan, 9.586%, (SOFR + 4.00%), 4/21/28 | 538 | 540,066 | |
| Mariner Wealth Advisors LLC, Term Loan, 8.692%, (SOFR + 3.25%), 8/18/28 | 587 | 585,489 | |
| Victory Capital Holdings, Inc.: | |||
| Term Loan, 7.679%, (SOFR + 2.25%), 7/1/26 | 243 | 243,191 | |
| Term Loan, 7.679%, (SOFR + 2.25%), 12/29/28 | 93 | 92,725 | |
| $ 5,266,396 | |||
| Chemicals — 4.2% | |||
| Aruba Investments Holdings LLC, Term Loan, 9.43%, (SOFR + 4.00%), 11/24/27 | $ | 248 | $ 248,402 |
| Axalta Coating Systems U.S. Holdings, Inc., Term Loan, 7.33%, (SOFR + 2.00%), 12/20/29 | 257 | 257,327 | |
| Charter NEX US, Inc., Term Loan, 8.827%, (SOFR + 3.50%), 12/1/27 | 500 | 501,420 | |
| CPC Acquisition Corp., Term Loan, 9.321%, (SOFR + 3.75%), 12/29/27 | 326 | 276,904 | |
| Groupe Solmax, Inc., Term Loan, 10.257%, (SOFR + 4.75%), 5/29/28(9) | 390 | 384,077 | |
| Momentive Performance Materials, Inc., Term Loan, 9.83%, (SOFR + 4.50%), 3/29/28 | 645 | 636,077 | |
| Nouryon Finance BV, Term Loan, 9.419%, (SOFR + 4.00%), 4/3/28 | 224 | 225,269 | |
| Olympus Water US Holding Corp., Term Loan, 9.321%, (SOFR + 3.75%), 11/9/28 | 489 | 489,513 | |
| Rohm Holding GmbH, Term Loan, 10.581%, (SOFR + 5.00%), 7/31/26 | 234 | 227,220 | |
| W.R. Grace & Co. Conn., Term Loan, 9.321%, (SOFR + 3.75%), 9/22/28 | 1,002 | 1,005,590 | |
| $ 4,251,799 | |||
| Commercial Services & Supplies — 3.9% | |||
| Covanta Holding Corp.: | |||
| Term Loan, 11/30/28(8) | $ | 697 | $ 696,186 |
| Term Loan, 11/30/28(8) | 53 | 53,078 | |
| Garda World Security Corp., Term Loan, 9.583%, (SOFR + 4.25%), 2/1/29 | 300 | 300,875 | |
| GFL Environmental, Inc., Term Loan, 7.816%, (SOFR + 2.50%), 5/31/27 | 394 | 396,411 | |
| Harsco Corp., Term Loan, 7.692%, (SOFR + 2.25%), 3/10/28 | 688 | 683,178 | |
| Borrower/Description | Principal Amount (000's omitted) | Value | |
| Commercial Services & Supplies (continued) | |||
| Heritage-Crystal Clean, Inc., Term Loan, 10.317%, (SOFR + 5.00%), 10/17/30 | $ | 125 | $ 125,174 |
| LABL, Inc., Term Loan, 10.427%, (SOFR + 5.00%), 10/29/28 | 147 | 143,670 | |
| Phoenix Services International LLC, Term Loan, 11.43%, (SOFR + 6.10%), 6/30/28 | 117 | 110,275 | |
| Prime Security Services Borrower LLC, Term Loan, 10/14/30(8) | 750 | 751,354 | |
| Tempo Acquisition LLC, Term Loan, 8.08%, (SOFR + 2.75%), 8/31/28 | 676 | 678,599 | |
| $ 3,938,800 | |||
| Communications Equipment — 0.1% | |||
| Ciena Corp., Term Loan, 7.329%, (SOFR + 2.00%), 10/24/30 | $ | 124 | $ 124,496 |
| $ 124,496 | |||
| Construction & Engineering — 1.2% | |||
| Aegion Corp., Term Loan, 9.58%, (SOFR + 4.25%), 5/17/28 | $ | 366 | $ 367,693 |
| American Residential Services LLC, Term Loan, 9.071%, (SOFR + 3.50%), 10/15/27 | 729 | 729,727 | |
| Northstar Group Services, Inc., Term Loan, 10.945%, (SOFR + 5.50%), 11/12/26 | 137 | 137,226 | |
| $ 1,234,646 | |||
| Consumer Staples Distribution & Retail — 0.2% | |||
| Peer Holding III BV, Term Loan, 8.559%, (SOFR + 3.25%), 10/28/30 | $ | 200 | $ 200,688 |
| $ 200,688 | |||
| Containers & Packaging — 0.8% | |||
| Clydesdale Acquisition Holdings, Inc., Term Loan, 9.105%, (SOFR + 3.68%), 4/13/29 | $ | 622 | $ 623,015 |
| Pretium Packaging LLC, Term Loan - Second Lien, 11.309%, (SOFR + 6.00%), 9.906% cash, 1.403% PIK, 10/2/28 | 40 | 36,483 | |
| Proampac PG Borrower LLC, Term Loan, 9.806%, (SOFR + 4.50%), 9/15/28(9) | 200 | 200,098 | |
| $ 859,596 | |||
| Diversified Consumer Services — 1.7% | |||
| Ascend Learning LLC, Term Loan, 8.927%, (SOFR + 3.50%), 12/11/28 | $ | 635 | $ 632,822 |
| Belron Finance US LLC, Term Loan, 7.578%, (SOFR + 2.00%), 4/13/28 | 121 | 121,816 | |
| KUEHG Corp., Term Loan, 10.313%, (SOFR + 5.00%), 6/12/30 | 299 | 300,030 | |
| Sotheby's, Term Loan, 10.076%, (SOFR + 4.50%), 1/15/27 | 409 | 404,174 | |
| Wand NewCo 3, Inc., Term Loan, 9.08%, (SOFR + 3.75%), 1/30/31 | 300 | 301,146 | |
| $ 1,759,988 | |||
| Borrower/Description | Principal Amount (000's omitted) | Value | |
| Diversified Telecommunication Services — 0.6% | |||
| Level 3 Financing, Inc.: | |||
| Term Loan, 11.89%, (SOFR + 6.56%), 4/15/29 | $ | 170 | $ 167,724 |
| Term Loan, 11.89%, (SOFR + 6.56%), 4/15/30 | 170 | 167,441 | |
| Virgin Media Bristol LLC, Term Loan, 8.69%, (SOFR + 3.25%), 1/31/29 | 325 | 322,811 | |
| $ 657,976 | |||
| Electrical Equipment — 0.5% | |||
| Brookfield WEC Holdings, Inc., Term Loan, 8.079%, (SOFR + 2.75%), 1/27/31 | $ | 525 | $ 524,927 |
| $ 524,927 | |||
| Electronic Equipment, Instruments & Components — 1.8% | |||
| Creation Technologies, Inc., Term Loan, 11.092%, (SOFR + 5.50%), 10/5/28 | $ | 224 | $ 218,265 |
| II-VI, Inc., Term Loan, 8.195%, (SOFR + 2.75%), 7/2/29 | 196 | 196,356 | |
| MX Holdings US, Inc., Term Loan, 7/31/28(8) | 1,000 | 1,002,708 | |
| Robertshaw US Holding Corp.: | |||
| Term Loan, 13.313%, (SOFR + 8.00%), 2/28/27 | 0 (10) | 41 | |
| Term Loan, 16.50%, (USD Prime + 8.00%), 11.50% cash, 5.00% PIK, 2/28/27 | 224 | 226,899 | |
| Term Loan - Second Lien, 12.313%, (SOFR + 7.00%), 2/28/27 | 207 | 160,282 | |
| $ 1,804,551 | |||
| Energy Equipment & Services — 0.2% | |||
| PG Investment Company 59 SARL, Term Loan, 2/24/31(8) | $ | 175 | $ 175,656 |
| $ 175,656 | |||
| Entertainment — 0.6% | |||
| Crown Finance US, Inc., Term Loan, 13.942%, (SOFR + 8.50%), 6.942% cash, 7.00% PIK, 7/31/28 | $ | 31 | $ 31,229 |
| EP Purchaser LLC, Term Loan, 9.071%, (SOFR + 3.50%), 11/6/28 | 398 | 395,632 | |
| Renaissance Holding Corp., Term Loan, 9.577%, (SOFR + 4.25%), 4/5/30 | 174 | 174,639 | |
| $ 601,500 | |||
| Equity Real Estate Investment Trusts (REITs) — 0.2% | |||
| Iron Mountain, Inc., Term Loan, 7.58%, (SOFR + 2.25%), 1/31/31 | $ | 175 | $ 174,344 |
| $ 174,344 | |||
| Financial Services — 2.5% | |||
| GTCR W Merger Sub LLC, Term Loan, 8.309%, (SOFR + 3.00%), 1/31/31 | $ | 525 | $ 527,174 |
| NCR Atleos LLC, Term Loan, 10.163%, (SOFR + 4.75%), 3/27/29 | 473 | 476,000 | |
| Walker & Dunlop, Inc., Term Loan, 7.68%, (SOFR + 2.25%), 12/16/28 | 746 | 745,250 | |
| Borrower/Description | Principal Amount (000's omitted) | Value | |
| Financial Services (continued) | |||
| WEX, Inc., Term Loan, 3/31/28(8) | $ | 781 | $ 781,496 |
| $ 2,529,920 | |||
| Food & Staples Retailing — 0.1% | |||
| US Foods, Inc., Term Loan, 7.442%, (SOFR + 2.00%), 9/13/26 | $ | 111 | $ 111,575 |
| $ 111,575 | |||
| Food Products — 0.9% | |||
| Froneri International Ltd., Term Loan, 7.68%, (SOFR + 2.25%), 1/29/27 | $ | 595 | $ 596,377 |
| Monogram Food Solutions LLC, Term Loan, 9.445%, (SOFR + 4.00%), 8/28/28 | 98 | 97,994 | |
| Nomad Foods US LLC, Term Loan, 8.272%, (SOFR + 3.00%), 11/13/29 | 222 | 222,870 | |
| $ 917,241 | |||
| Health Care Equipment & Supplies — 1.4% | |||
| Bayou Intermediate II LLC, Term Loan, 10.077%, (SOFR + 4.50%), 8/2/28 | $ | 342 | $ 339,986 |
| Journey Personal Care Corp., Term Loan, 9.692%, (SOFR + 4.25%), 3/1/28 | 486 | 480,172 | |
| Medline Borrower LP, Term Loan, 8.197%, (SOFR + 2.75%), 10/23/28 | 603 | 604,458 | |
| $ 1,424,616 | |||
| Health Care Providers & Services — 5.6% | |||
| AEA International Holdings (Lux) SARL, Term Loan, 8.809%, (SOFR + 3.50%), 9/7/28(9) | $ | 733 | $ 735,912 |
| Cano Health LLC, Term Loan, 9.463%, (SOFR + 4.00%), 11/23/27(9) | 635 | 178,475 | |
| CCRR Parent, Inc., Term Loan, 9.192%, (SOFR + 3.75%), 3/6/28 | 487 | 442,349 | |
| CNT Holdings I Corp., Term Loan, 8.817%, (SOFR + 3.50%), 11/8/27 | 499 | 499,841 | |
| Ensemble RCM LLC, Term Loan, 8.317%, (SOFR + 3.00%), 8/1/29 | 577 | 579,118 | |
| Midwest Physician Administrative Services LLC, Term Loan, 8.821%, (SOFR + 3.25%), 3/12/28 | 293 | 242,946 | |
| Option Care Health, Inc., Term Loan, 8.195%, (SOFR + 2.75%), 10/27/28 | 589 | 591,058 | |
| Pacific Dental Services LLC, Term Loan, 3/7/31(8) | 500 | 500,000 | |
| Select Medical Corp., Term Loan, 8.33%, (SOFR + 3.00%), 3/6/27 | 787 | 789,636 | |
| Surgery Center Holdings, Inc., Term Loan, 8.829%, (SOFR + 3.50%), 12/19/30 | 550 | 553,128 | |
| TTF Holdings LLC, Term Loan, 9.445%, (SOFR + 4.00%), 3/31/28 | 543 | 544,309 | |
| $ 5,656,772 | |||
| Borrower/Description | Principal Amount (000's omitted) | Value | |
| Health Care Technology — 3.2% | |||
| Cotiviti Corp., Term Loan, 2/21/31(8) | $ | 400 | $ 400,667 |
| Imprivata, Inc., Term Loan, 9.324%, (SOFR + 3.75%), 12/1/27 | 315 | 316,383 | |
| MedAssets Software Intermediate Holdings, Inc.: | |||
| Term Loan, 9.424%, (SOFR + 4.00%), 12/18/28 | 221 | 186,414 | |
| Term Loan - Second Lien, 12.192%, (SOFR + 6.75%), 12/17/29 | 150 | 96,656 | |
| Project Ruby Ultimate Parent Corp., Term Loan, 8.692%, (SOFR + 3.25%), 3/10/28 | 388 | 388,070 | |
| Symplr Software, Inc., Term Loan, 9.913%, (SOFR + 4.50%), 12/22/27 | 364 | 343,717 | |
| Verscend Holding Corp., Term Loan, 9.445%, (SOFR + 4.00%), 8/27/25 | 549 | 549,879 | |
| Waystar Technologies, Inc., Term Loan, 9.33%, (SOFR + 4.00%), 10/22/29 | 945 | 947,699 | |
| $ 3,229,485 | |||
| Hotels, Restaurants & Leisure — 1.7% | |||
| ClubCorp Holdings, Inc., Term Loan, 10.564%, (SOFR + 5.00%), 9/18/26 | $ | 419 | $ 420,857 |
| IRB Holding Corp., Term Loan, 8.077%, (SOFR + 2.75%), 12/15/27 | 317 | 317,282 | |
| Playa Resorts Holding BV, Term Loan, 8.579%, (SOFR + 3.25%), 1/5/29 | 720 | 722,488 | |
| SMG US Midco 2, Inc., Term Loan, 8.074%, (SOFR + 2.50%), 1/23/25 | 235 | 235,395 | |
| $ 1,696,022 | |||
| Household Durables — 1.2% | |||
| ACProducts, Inc., Term Loan, 9.814%, (SOFR + 4.25%), 5/17/28 | $ | 292 | $ 266,830 |
| Libbey Glass, Inc., Term Loan, 11.974%, (SOFR + 6.50%), 11/22/27 | 343 | 326,225 | |
| Serta Simmons Bedding LLC, Term Loan, 12.924%, (SOFR + 7.50%), 6/29/28 | 223 | 201,325 | |
| Solis IV BV, Term Loan, 8.824%, (SOFR + 3.50%), 2/26/29 | 398 | 393,594 | |
| $ 1,187,974 | |||
| Household Products — 0.5% | |||
| Kronos Acquisition Holdings, Inc.: | |||
| Term Loan, 9.314%, (SOFR + 3.75%), 12/22/26 | $ | 437 | $ 437,793 |
| Term Loan, 11.493%, (SOFR + 6.00%), 12/22/26 | 98 | 98,239 | |
| $ 536,032 | |||
| Industrial Conglomerates — 0.2% | |||
| Kohler Energy Co. LLC, Term Loan, 1/30/31(8) | $ | 250 | $ 250,000 |
| $ 250,000 | |||
| Borrower/Description | Principal Amount (000's omitted) | Value | |
| Insurance — 4.4% | |||
| Alliant Holdings Intermediate LLC, Term Loan, 8.827%, (SOFR + 3.50%), 11/6/30 | $ | 497 | $ 499,451 |
| AmWINS Group, Inc.: | |||
| Term Loan, 7.695%, (SOFR + 2.25%), 2/19/28 | 733 | 733,489 | |
| Term Loan, 8.195%, (SOFR + 2.75%), 2/19/28 | 123 | 123,814 | |
| AssuredPartners, Inc., Term Loan, 8.942%, (SOFR + 3.50%), 2/12/27 | 650 | 651,881 | |
| HUB International Ltd., Term Loan, 8.574%, (SOFR + 3.25%), 6/20/30 | 895 | 895,695 | |
| NFP Corp., Term Loan, 8.695%, (SOFR + 3.25%), 2/16/27 | 335 | 335,318 | |
| Ryan Specialty Group LLC, Term Loan, 8.08%, (SOFR + 2.75%), 9/1/27 | 790 | 791,886 | |
| USI, Inc., Term Loan, 8.302%, (SOFR + 3.00%), 11/22/29 | 425 | 425,438 | |
| $ 4,456,972 | |||
| Interactive Media & Services — 1.2% | |||
| Adevinta ASA, Term Loan, 8.332%, (SOFR + 2.75%), 6/26/28 | $ | 472 | $ 473,449 |
| Foundational Education Group, Inc., Term Loan, 9.324%, (SOFR + 3.75%), 8/31/28 | 391 | 387,579 | |
| Getty Images, Inc., Term Loan, 9.909%, (SOFR + 4.50%), 2/19/26 | 388 | 388,795 | |
| $ 1,249,823 | |||
| IT Services — 3.0% | |||
| Asurion LLC: | |||
| Term Loan, 8.692%, (SOFR + 3.25%), 12/23/26 | $ | 725 | $ 712,776 |
| Term Loan, 8.692%, (SOFR + 3.25%), 7/31/27 | 39 | 37,402 | |
| Term Loan - Second Lien, 10.692%, (SOFR + 5.25%), 1/31/28 | 550 | 498,609 | |
| Gainwell Acquisition Corp., Term Loan, 9.409%, (SOFR + 4.00%), 10/1/27 | 620 | 594,767 | |
| Informatica LLC, Term Loan, 8.195%, (SOFR + 2.75%), 10/27/28 | 539 | 540,078 | |
| Rackspace Technology Global, Inc.: | |||
| Term Loan, 11.58%, (SOFR + 6.25%), 5/15/28 | 66 | 65,991 | |
| Term Loan - Second Lien, 8.076%, (SOFR + 2.75%), 5/15/28 | 554 | 274,247 | |
| Sedgwick Claims Management Services, Inc., Term Loan, 9.077%, (SOFR + 3.75%), 2/24/28 | 298 | 298,582 | |
| $ 3,022,452 | |||
| Leisure Products — 1.1% | |||
| Hayward Industries, Inc., Term Loan, 8.195%, (SOFR + 2.75%), 5/30/28 | $ | 608 | $ 609,142 |
| Recess Holdings, Inc., Term Loan, 9.843%, (SOFR + 4.50%), 2/20/30 | 500 | 502,500 | |
| $ 1,111,642 | |||
| Life Sciences Tools & Services — 3.1% | |||
| Avantor Funding, Inc., Term Loan, 11/8/27(8) | $ | 1,097 | $ 1,102,280 |
| Borrower/Description | Principal Amount (000's omitted) | Value | |
| Life Sciences Tools & Services (continued) | |||
| Catalent Pharma Solutions, Inc., Term Loan, 7.443%, (SOFR + 2.00%), 2/22/28 | $ | 397 | $ 397,179 |
| Curia Global, Inc., Term Loan, 9.163%, (SOFR + 3.75%), 8/30/26 | 818 | 780,278 | |
| IQVIA, Inc., Term Loan, 7.309%, (SOFR + 2.00%), 1/2/31 | 224 | 225,518 | |
| Packaging Coordinators Midco, Inc., Term Loan, 9.071%, (SOFR + 3.50%), 11/30/27 | 656 | 658,351 | |
| $ 3,163,606 | |||
| Machinery — 10.2% | |||
| AI Aqua Merger Sub, Inc., Term Loan, 9.072%, (SOFR + 3.75%), 7/31/28 | $ | 591 | $ 592,289 |
| Alliance Laundry Systems LLC, Term Loan, 8.927%, (SOFR + 3.50%), 10/8/27(9) | 497 | 499,940 | |
| American Trailer World Corp., Term Loan, 9.18%, (SOFR + 3.75%), 3/3/28 | 236 | 230,563 | |
| Apex Tool Group LLC: | |||
| Term Loan, 15.329%, (SOFR + 10.00%), 2/8/30 | 174 | 169,215 | |
| Term Loan - Second Lien, 12.579%, (SOFR + 7.25%), 2/8/29 | 75 | 73,829 | |
| Barnes Group, Inc., Term Loan, 7.827%, (SOFR + 2.50%), 9/3/30 | 748 | 748,902 | |
| Conair Holdings LLC, Term Loan, 9.192%, (SOFR + 3.75%), 5/17/28 | 488 | 484,331 | |
| CPM Holdings, Inc., Term Loan, 9.826%, (SOFR + 4.50%), 9/28/28 | 587 | 588,774 | |
| EMRLD Borrower LP, Term Loan, 7.791%, (SOFR + 2.50%), 5/31/30 | 1,631 | 1,631,561 | |
| Engineered Machinery Holdings, Inc., Term Loan, 9.321%, (SOFR + 3.75%), 5/19/28 | 834 | 831,827 | |
| Filtration Group Corp.: | |||
| Term Loan, 8.945%, (SOFR + 3.50%), 10/21/28 | 298 | 298,800 | |
| Term Loan, 9.695%, (SOFR + 4.25%), 10/21/28 | 449 | 451,151 | |
| Gates Global LLC, Term Loan, 7.93%, (SOFR + 2.50%), 3/31/27 | 768 | 770,299 | |
| Icebox Holdco III, Inc., Term Loan, 9.071%, (SOFR + 3.50%), 12/22/28 | 490 | 491,170 | |
| Madison IAQ LLC, Term Loan, 8.693%, (SOFR + 3.25%), 6/21/28 | 876 | 875,389 | |
| SPX Flow, Inc., Term Loan, 9.927%, (SOFR + 4.50%), 4/5/29 | 283 | 284,731 | |
| Titan Acquisition Ltd., Term Loan, 8.442%, (SOFR + 3.00%), 3/28/25 | 282 | 281,999 | |
| TK Elevator US Newco, Inc., Term Loan, 8.791%, (SOFR + 3.50%), 4/30/30 | 1,046 | 1,050,728 | |
| $ 10,355,498 | |||
| Media — 1.5% | |||
| Aragorn Parent Corp., Term Loan, 9.577%, (SOFR + 4.25%), 12/15/28 | $ | 286 | $ 288,024 |
| iHeartCommunications, Inc., Term Loan, 8.445%, (SOFR + 3.00%), 5/1/26 | 377 | 331,185 | |
| Borrower/Description | Principal Amount (000's omitted) | Value | |
| Media (continued) | |||
| Outfront Media Capital LLC, Term Loan, 7.077%, (SOFR + 1.75%), 11/18/26 | $ | 75 | $ 74,965 |
| Sinclair Television Group, Inc., Term Loan, 7.945%, (SOFR + 2.50%), 9/30/26 | 577 | 551,301 | |
| Univision Communications, Inc., Term Loan, 8.695%, (SOFR + 3.25%), 3/15/26 | 224 | 224,053 | |
| $ 1,469,528 | |||
| Metals/Mining — 0.8% | |||
| Arsenal AIC Parent LLC, Term Loan, 9.08%, (SOFR + 3.75%), 8/18/30 | $ | 522 | $ 525,099 |
| WireCo WorldGroup, Inc., Term Loan, 9.068%, (SOFR + 3.75%), 11/13/28 | 282 | 283,042 | |
| $ 808,141 | |||
| Oil, Gas & Consumable Fuels — 0.5% | |||
| ITT Holdings LLC, Term Loan, 10/5/30(8) | $ | 500 | $ 501,313 |
| $ 501,313 | |||
| Passenger Airlines — 0.5% | |||
| WestJet Loyalty LP, Term Loan, 2/14/31(8) | $ | 500 | $ 500,677 |
| $ 500,677 | |||
| Personal Products — 0.3% | |||
| Olaplex, Inc., Term Loan, 8.93%, (SOFR + 3.50%), 2/23/29 | $ | 298 | $ 278,206 |
| $ 278,206 | |||
| Pharmaceuticals — 0.2% | |||
| Jazz Financing Lux SARL, Term Loan, 8.445%, (SOFR + 3.00%), 5/5/28 | $ | 219 | $ 220,239 |
| $ 220,239 | |||
| Professional Services — 4.3% | |||
| AlixPartners LLP, Term Loan, 7.945%, (SOFR + 2.50%), 2/4/28 | $ | 646 | $ 647,859 |
| Camelot U.S. Acquisition LLC, Term Loan, 8.077%, (SOFR + 2.75%), 1/31/31 | 600 | 600,877 | |
| CoreLogic, Inc., Term Loan, 8.945%, (SOFR + 3.50%), 6/2/28 | 461 | 451,579 | |
| EAB Global, Inc., Term Loan, 8.945%, (SOFR + 3.50%), 8/16/28 | 597 | 598,260 | |
| Employbridge Holding Co., Term Loan, 10.343%, (SOFR + 4.75%), 7/19/28 | 390 | 327,194 | |
| Neptune Bidco U.S., Inc., Term Loan, 10.423%, (SOFR + 5.00%), 4/11/29 | 298 | 275,419 | |
| Rockwood Service Corp., Term Loan, 9.692%, (SOFR + 4.25%), 1/23/27 | 306 | 307,642 | |
| Teneo Holdings LLC, Term Loan, 10.08%, (SOFR + 4.75%), 3/13/31 | 200 | 200,875 | |
| Trans Union LLC: | |||
| Term Loan, 7.177%, (SOFR + 1.75%), 11/16/26 | 63 | 62,901 | |
| Borrower/Description | Principal Amount (000's omitted) | Value | |
| Professional Services (continued) | |||
| Trans Union LLC: (continued) | |||
| Term Loan, 7.327%, (SOFR + 2.00%), 12/1/28 | $ | 259 | $ 258,963 |
| Vaco Holdings LLC, Term Loan, 10.434%, (SOFR + 5.00%), 1/21/29 | 248 | 245,926 | |
| Wood Mackenzie Ltd., Term Loan, 8.814%, (SOFR + 3.50%), 1/31/31 | 400 | 401,656 | |
| $ 4,379,151 | |||
| Real Estate Management & Development — 1.0% | |||
| Cushman & Wakefield U.S. Borrower LLC: | |||
| Term Loan, 8.195%, (SOFR + 2.75%), 8/21/25 | $ | 9 | $ 9,357 |
| Term Loan, 9.33%, (SOFR + 4.00%), 1/31/30 | 110 | 110,198 | |
| Greystar Real Estate Partners LLC, Term Loan, 8.576%, (SOFR + 3.25%), 8/21/30 | 399 | 399,997 | |
| Homeserve USA Holding Corp, Term Loan, 8.329%, (SOFR + 3.00%), 10/21/30 | 250 | 250,899 | |
| RE/MAX International, Inc., Term Loan, 7.945%, (SOFR + 2.50%), 7/21/28 | 268 | 252,143 | |
| $ 1,022,594 | |||
| Road & Rail — 1.2% | |||
| Avis Budget Car Rental LLC, Term Loan, 7.195%, (SOFR + 1.75%), 8/6/27 | $ | 503 | $ 501,745 |
| First Student Bidco, Inc., Term Loan, 9.402%, (SOFR + 4.00%), 7/21/28 | 279 | 279,388 | |
| Uber Technologies, Inc., Term Loan, 8.079%, (SOFR + 2.75%), 3/3/30 | 395 | 397,372 | |
| $ 1,178,505 | |||
| Semiconductors & Semiconductor Equipment — 0.3% | |||
| Altar Bidco, Inc., Term Loan, 7.947%, (SOFR + 3.10%), 2/1/29 | $ | 270 | $ 270,139 |
| Bright Bidco BV, Term Loan, 14.317%, (SOFR + 9.00%), 6.317% cash, 8.00% PIK, 10/31/27 | 35 | 9,337 | |
| MaxLinear, Inc., Term Loan, 7.695%, (SOFR + 2.25%), 6/23/28 | 53 | 52,098 | |
| $ 331,574 | |||
| Software — 17.0% | |||
| Applied Systems, Inc., Term Loan, 8.809%, (SOFR + 3.50%), 2/24/31 | $ | 1,183 | $ 1,191,688 |
| AppLovin Corp., Term Loan, 7.83%, (SOFR + 2.50%), 8/16/30 | 378 | 378,420 | |
| Astra Acquisition Corp.: | |||
| Term Loan, 10.57%, (SOFR + 5.25%), 10/25/28 | 223 | 94,340 | |
| Term Loan - Second Lien, 14.439%, (SOFR + 8.88%), 10/25/29 | 350 | 91,853 | |
| Banff Merger Sub, Inc., Term Loan, 9.58%, (SOFR + 4.25%), 12/29/28 | 638 | 642,271 | |
| Cast and Crew Payroll LLC, Term Loan, 9.195%, (SOFR + 3.75%), 2/9/26 | 388 | 389,099 | |
| Borrower/Description | Principal Amount (000's omitted) | Value | |
| Software (continued) | |||
| CCC Intelligent Solutions, Inc., Term Loan, 7.692%, (SOFR + 2.25%), 9/21/28 | $ | 997 | $ 998,072 |
| Central Parent, Inc., Term Loan, 9.309%, (SOFR + 4.00%), 7/6/29 | 397 | 398,560 | |
| CentralSquare Technologies LLC, Term Loan, 9.177%, (SOFR + 3.75%), 8/29/25 | 437 | 426,375 | |
| Cloud Software Group, Inc.: | |||
| Term Loan, 9.909%, (SOFR + 4.50%), 9/29/28(9) | 347 | 346,115 | |
| Term Loan, 3/30/29(8) | 350 | 348,603 | |
| Cloudera, Inc.: | |||
| Term Loan, 9.18%, (SOFR + 3.75%), 10/8/28 | 291 | 290,539 | |
| Term Loan - Second Lien, 11.43%, (SOFR + 6.00%), 10/8/29 | 150 | 149,063 | |
| Constant Contact, Inc., Term Loan, 9.588%, (SOFR + 4.00%), 2/10/28 | 440 | 428,689 | |
| Cornerstone OnDemand, Inc., Term Loan, 9.195%, (SOFR + 3.75%), 10/16/28 | 269 | 264,952 | |
| Delta TopCo, Inc., Term Loan, 9.121%, (SOFR + 3.75%), 12/1/27 | 671 | 672,124 | |
| E2open LLC, Term Loan, 8.945%, (SOFR + 3.50%), 2/4/28 | 535 | 536,683 | |
| ECI Macola Max Holding LLC: | |||
| Term Loan, 9.314%, (SOFR + 3.75%), 11/9/27 | 797 | 800,184 | |
| Term Loan, 5/31/30(8) | 25 | 25,000 | |
| Epicor Software Corp., Term Loan, 8.692%, (SOFR + 3.25%), 7/30/27 | 1,065 | 1,070,261 | |
| Fiserv Investment Solutions, Inc., Term Loan, 9.319%, (SOFR + 4.00%), 2/18/27 | 337 | 324,242 | |
| GoTo Group, Inc.: | |||
| Term Loan, 10.173%, (SOFR + 4.75%), 4/30/28 | 300 | 286,710 | |
| Term Loan - Second Lien, 10.173%, (SOFR + 4.75%), 4/30/28 | 252 | 193,746 | |
| Marcel LUX IV SARL, Term Loan, 9.81%, (SOFR + 4.50%), 11/11/30 | 861 | 868,734 | |
| Open Text Corp., Term Loan, 8.177%, (SOFR + 2.75%), 1/31/30 | 751 | 752,631 | |
| Project Alpha Intermediate Holding, Inc., Term Loan, 10.063%, (SOFR + 4.75%), 10/28/30 | 500 | 503,194 | |
| Proofpoint, Inc., Term Loan, 8.695%, (SOFR + 3.25%), 8/31/28 | 929 | 929,786 | |
| Quartz Acquireco LLC, Term Loan, 8.809%, (SOFR + 3.50%), 6/28/30 | 399 | 400,492 | |
| Quest Software US Holdings, Inc., Term Loan, 9.713%, (SOFR + 4.25%), 2/1/29 | 289 | 219,055 | |
| RealPage, Inc., Term Loan, 8.445%, (SOFR + 3.00%), 4/24/28 | 526 | 512,632 | |
| Redstone Holdco 2 LP, Term Loan, 10.195%, (SOFR + 4.75%), 4/27/28 | 306 | 253,786 | |
| Skillsoft Corp., Term Loan, 10.693%, (SOFR + 5.25%), 7/14/28 | 219 | 196,728 | |
| Sophia, LP, Term Loan, 8.93%, (SOFR + 3.50%), 10/9/29 | 837 | 841,218 | |
| Borrower/Description | Principal Amount (000's omitted) | Value | |
| Software (continued) | |||
| Turing Midco LLC, Term Loan, 7.945%, (SOFR + 2.50%), 3/24/28 | $ | 185 | $ 183,674 |
| Veritas US, Inc., Term Loan, 10.445%, (SOFR + 5.00%), 9/1/25 | 613 | 568,754 | |
| Vision Solutions, Inc., Term Loan, 9.586%, (SOFR + 4.00%), 4/24/28 | 636 | 636,209 | |
| $ 17,214,482 | |||
| Specialty Retail — 2.5% | |||
| Hoya Midco LLC, Term Loan, 8.563%, (SOFR + 3.25%), 2/3/29 | $ | 109 | $ 109,036 |
| Les Schwab Tire Centers, Term Loan, 8.684%, (SOFR + 3.25%), 11/2/27 | 968 | 970,499 | |
| Mattress Firm, Inc., Term Loan, 9.814%, (SOFR + 4.25%), 9/25/28 | 729 | 731,424 | |
| PetSmart, Inc., Term Loan, 9.18%, (SOFR + 3.75%), 2/11/28 | 731 | 730,205 | |
| $ 2,541,164 | |||
| Textiles, Apparel & Luxury Goods — 1.1% | |||
| Gloves Buyer, Inc., Term Loan, 9.442%, (SOFR + 4.00%), 12/29/27 | $ | 656 | $ 656,557 |
| Hanesbrands, Inc., Term Loan, 9.08%, (SOFR + 3.75%), 3/8/30 | 499 | 499,208 | |
| $ 1,155,765 | |||
| Trading Companies & Distributors — 3.8% | |||
| Avolon TLB Borrower 1 (US) LLC, Term Loan, 7.329%, (SOFR + 2.00%), 6/22/28 | $ | 890 | $ 891,770 |
| Core & Main LP, Term Loan, 7.971%, (SOFR + 2.50%), 7/27/28(9) | 494 | 494,264 | |
| Foundation Building Materials Holding Company LLC, Term Loan, 9.313%, (SOFR + 4.00%), 1/29/31 | 225 | 226,195 | |
| Park River Holdings, Inc., Term Loan, 8.843%, (SOFR + 3.25%), 12/28/27 | 586 | 583,247 | |
| Spin Holdco, Inc., Term Loan, 9.585%, (SOFR + 4.00%), 3/4/28 | 650 | 603,503 | |
| SRS Distribution, Inc.: | |||
| Term Loan, 8.68%, (SOFR + 3.25%), 6/2/28 | 98 | 98,490 | |
| Term Loan, 8.945%, (SOFR + 3.50%), 6/2/28 | 639 | 643,246 | |
| Windsor Holdings III LLC, Term Loan, 9.326%, (SOFR + 4.00%), 8/1/30 | 299 | 300,933 | |
| $ 3,841,648 | |||
| Transportation Infrastructure — 1.2% | |||
| Brown Group Holding LLC: | |||
| Term Loan, 8.18%, (SOFR + 2.75%), 6/7/28 | $ | 408 | $ 407,923 |
| Term Loan, 8.325%, (SOFR + 3.00%), 7/2/29(9) | 300 | 300,375 | |
| KKR Apple Bidco LLC, Term Loan, 9/22/28(8) | 500 | 500,078 | |
| $ 1,208,376 | |||
| Borrower/Description | Principal Amount (000's omitted) | Value | |
| Wireless Telecommunication Services — 0.8% | |||
| CCI Buyer, Inc., Term Loan, 12/17/27(8) | $ | 500 | $ 497,678 |
| Digicel International Finance Ltd., Term Loan, 10.469%, (SOFR + 5.15%), 5/25/27 | 245 | 235,518 | |
| SBA Senior Finance II LLC, Term Loan, 7.34%, (SOFR + 2.00%), 1/25/31 | 125 | 125,286 | |
| $ 858,482 | |||
| Total Senior Floating Rate Loans (identified cost $107,795,194) | $106,533,837 | ||
| Short-Term Investments — 2.3% |
| Security | Shares | Value | |
| Morgan Stanley Institutional Liquidity Funds - Government Portfolio, Institutional Class, 5.22%(11) | 2,288,053 | $ 2,288,053 | |
| Total Short-Term Investments (identified cost $2,288,053) | $ 2,288,053 | ||
| Total Investments — 115.4% (identified cost $118,682,483) | $116,995,844 | ||
| Note Payable — (5.9)% | $ (6,000,000) |
| Other Assets, Less Liabilities — (9.5)% | $ (9,622,166) | ||
| Net Assets — 100.0% | $ 101,373,678 |
| The percentage shown for each investment category in the Schedule of Investments is based on net assets. | |
| (1) | Non-income producing security. |
| (2) | Security was acquired in connection with a restructuring of a Senior Loan and may be subject to restrictions on resale. |
| (3) | Amount is less than 0.05%. |
| (4) | For fair value measurement disclosure purposes, security is categorized as Level 3 (see Note 1A). |
| (5) | Security exempt from registration under Rule 144A of the Securities Act of 1933, as amended. These securities may be sold in certain transactions in reliance on an exemption from registration (normally to qualified institutional buyers). At March 31, 2024, the aggregate value of these securities is $6,920,862 or 6.8% of the Fund's net assets. |
| (6) | When-issued security. |
| (7) | Senior floating-rate loans (Senior Loans) often require prepayments from excess cash flows or permit the borrowers to repay at their election. The degree to which borrowers repay, whether as a contractual requirement or at their election, cannot be predicted with accuracy. As a result, the actual remaining maturity may be substantially less than the stated maturities shown. However, Senior Loans will typically have an expected average life of approximately two to four years. Senior Loans typically have rates of interest which are redetermined periodically by reference to a base lending rate, plus a spread. These base lending rates are primarily the Secured Overnight Financing Rate (“SOFR”) (or the London Interbank Offered Rate (“LIBOR”) for those loans whose rates reset prior to the discontinuance of LIBOR on June 30, 2023) and secondarily, the prime rate offered by one or more major United States banks (the “Prime Rate”). Base lending rates may be subject to a floor, or minimum rate. Rates for SOFR are generally 1 or 3-month tenors and may also be subject to a credit spread adjustment. Senior Loans are generally subject to contractual restrictions that must be satisfied before they can be bought or sold. |
| (8) | This Senior Loan will settle after March 31, 2024, at which time the interest rate will be determined. |
| (9) | The stated interest rate represents the weighted average interest rate at March 31, 2024 of contracts within the senior loan facility. Interest rates on contracts are primarily redetermined either weekly, monthly or quarterly by reference to the indicated base lending rate and spread and the reset period. |
| (10) | Principal amount is less than $500. |
| (11) | May be deemed to be an affiliated investment company. The rate shown is the annualized seven-day yield as of March 31, 2024. |
| Abbreviations: | |
| PIK | – Payment In Kind |
| SOFR | – Secured Overnight Financing Rate |
| March 31, 2024 | |
| Assets | |
| Investments in securities of unaffiliated issuers, at value (identified cost $116,394,430) | $ 114,707,791 |
| Investments in securities of affiliated issuers, at value (identified cost $2,288,053) | 2,288,053 |
| Cash | 2,444,487 |
| Receivable for investments sold | 3,613,570 |
| Receivable for capital shares sold | 9,405 |
| Interest receivable | 541,275 |
| Dividends receivable - affiliated | 19,737 |
| Receivable from affiliates | 22,861 |
| Trustees' deferred compensation plan | 3,238 |
| Prepaid upfront fees on note payable | 21,890 |
| Prepaid expenses | 4,730 |
| Total assets | $123,677,037 |
| Liabilities | |
| Note payable | $ 6,000,000 |
| Payable for investments purchased | 14,758,308 |
| Payable for when-issued securities | 525,000 |
| Payable for capital shares redeemed | 101,743 |
| Distributions payable | 652,663 |
| Payable to affiliates: | |
| Investment advisory fee | 42,051 |
| Administrative fee | 9,477 |
| Distribution and service fees | 1,495 |
| Sub-transfer agency fee | 563 |
| Trustees' deferred compensation plan | 3,238 |
| Accrued expenses | 208,821 |
| Total liabilities | $ 22,303,359 |
| Net Assets | $101,373,678 |
| Sources of Net Assets | |
| Paid-in capital | $ 110,172,418 |
| Accumulated loss | (8,798,740) |
| Net Assets | $101,373,678 |
| Class A Shares | |
| Net Assets | $ 6,976,623 |
| Shares Outstanding | 773,210 |
| Net Asset Value and Redemption Price Per Share (net assets ÷ shares of beneficial interest outstanding) | $ 9.02 |
| Maximum Offering Price Per Share (100 ÷ 96.75 of net asset value per share) | $ 9.32 |
| Class I Shares | |
| Net Assets | $ 41,784,816 |
| Shares Outstanding | 4,637,232 |
| Net Asset Value, Offering Price and Redemption Price Per Share (net assets ÷ shares of beneficial interest outstanding) | $ 9.01 |
| March 31, 2024 | |
| Class R6 Shares | |
| Net Assets | $ 52,612,239 |
| Shares Outstanding | 5,839,581 |
| Net Asset Value, Offering Price and Redemption Price Per Share (net assets ÷ shares of beneficial interest outstanding) | $ 9.01 |
| On sales of $100,000 or more, the offering price of Class A shares is reduced. |
| Six Months Ended | |
| March 31, 2024 | |
| Investment Income | |
| Dividend income | $ 43,324 |
| Dividend income - affiliated issuers | 93,286 |
| Interest income | 4,446,201 |
| Other income | 76,376 |
| Total investment income | $ 4,659,187 |
| Expenses | |
| Investment advisory fee | $ 237,125 |
| Administrative fee | 48,485 |
| Distribution and service fees: | |
| Class A | 9,474 |
| Trustees' fees and expenses | 2,591 |
| Custodian fees | 6,587 |
| Transfer agency fees and expenses | 26,842 |
| Accounting fees | 10,532 |
| Professional fees | 34,374 |
| Registration fees | 23,193 |
| Reports to shareholders | 5,852 |
| Interest expense and fees | 644,089 |
| Miscellaneous | 13,008 |
| Total expenses | $ 1,062,152 |
| Waiver and/or reimbursement of expenses by affiliates | $ (99,992) |
| Net expenses | $ 962,160 |
| Net investment income | $ 3,697,027 |
| Realized and Unrealized Gain (Loss) | |
| Net realized gain (loss): | |
| Investment securities | $ (1,331,793) |
| Net realized loss | $(1,331,793) |
| Change in unrealized appreciation (depreciation): | |
| Investment securities | $ 2,094,618 |
| Net change in unrealized appreciation (depreciation) | $ 2,094,618 |
| Net realized and unrealized gain | $ 762,825 |
| Net increase in net assets from operations | $ 4,459,852 |
| Six Months Ended March 31, 2024 (Unaudited) | Year Ended September 30, 2023 | |
| Increase (Decrease) in Net Assets | ||
| From operations: | ||
| Net investment income | $ 3,697,027 | $ 7,390,923 |
| Net realized loss | (1,331,793) | (2,165,411) |
| Net change in unrealized appreciation (depreciation) | 2,094,618 | 5,480,573 |
| Net increase in net assets from operations | $ 4,459,852 | $ 10,706,085 |
| Distributions to shareholders: | ||
| Class A | $ (334,827) | $ (680,985) |
| Class I | (1,934,248) | (4,088,165) |
| Class R6 | (1,390,560) | (2,637,291) |
| Total distributions to shareholders | $ (3,659,635) | $ (7,406,441) |
| Capital share transactions: | ||
| Class A | $ (1,744,186) | $ 540,287 |
| Class I | (3,187,579) | (12,413,278) |
| Class R6 | 23,563,049 | (4,691,045) |
| Net increase (decrease) in net assets from capital share transactions | $ 18,631,284 | $(16,564,036) |
| Net increase (decrease) in net assets | $ 19,431,501 | $(13,264,392) |
| Net Assets | ||
| At beginning of period | $ 81,942,177 | $ 95,206,569 |
| At end of period | $101,373,678 | $ 81,942,177 |
| Six Months Ended | |
| March 31, 2024 (Unaudited) | |
| Cash Flows From Operating Activities | |
| Net increase in net assets from operations | $ 4,459,852 |
| Adjustments to reconcile net increase in net assets from operations to net cash used in operating activities: | |
| Investments purchased | (18,993,838) |
| Investments sold and principal repayments | 10,916,428 |
| Decrease in short-term investments, net | 1,115,683 |
| Net amortization/accretion of premium (discount) | (83,065) |
| Amortization of prepaid upfront fees on note payable | 14,620 |
| Increase in interest receivable | (21,864) |
| Increase in dividends receivable - affiliated | (921) |
| Increase in receivable from affiliate | (13,777) |
| Increase in prepaid expenses | (1,698) |
| Increase in Trustees' deferred compensation plan | (181) |
| Increase in payable to affiliate for investment advisory fee | 2,395 |
| Increase in payable to affiliate for administrative fee | 1,327 |
| Decrease in payable to affiliate for distribution and services fees | (282) |
| Decrease in payable to affiliate for sub-transfer agency fee | (268) |
| Increase in payable to affiliate for Trustees' deferred compensation plan | 181 |
| Decrease in accrued expenses | (69,365) |
| Net change in unrealized (appreciation) depreciation on investments | (2,094,618) |
| Net realized loss from investments | 1,331,793 |
| Net cash used in operating activities | $ (3,437,598) |
| Cash Flows From Financing Activities | |
| Cash distributions paid to shareholders | $ (108,288) |
| Proceeds from capital shares sold | 32,824,871 |
| Capital shares redeemed | (17,006,261) |
| Prepaid upfront fees on note payable | (22,500) |
| Proceeds from note payable | 7,000,000 |
| Repayments of note payable | (19,000,000) |
| Net cash provided by financing activities | $ 3,687,822 |
| Net increase in cash | $ 250,224 |
| Cash at beginning of period | $ 2,194,263 |
| Cash at end of period | $ 2,444,487 |
| Supplemental disclosure of cash flow information: | |
| Noncash financing activities not included herein consist of: | |
| Reinvestment of dividends and distributions | $ 2,911,662 |
| Cash paid for interest and fees on borrowings | $ 707,015 |
| Class A | ||||||
| Six Months Ended March 31, 2024 (Unaudited) | Year Ended September 30, | |||||
| 2023 | 2022 | 2021 | 2020 | 2019 | ||
| Net asset value — Beginning of period | $ 8.93 | $ 8.60 | $ 9.51 | $ 9.23 | $ 9.73 | $ 9.97 |
| Income (Loss) From Operations | ||||||
| Net investment income(1) | $ 0.40 | $ 0.75 | $ 0.43 | $ 0.35 | $ 0.39 | $ 0.47 |
| Net realized and unrealized gain (loss) | 0.09 | 0.33 | (0.93) | 0.29 | (0.50) | (0.24) |
| Total income (loss) from operations | $ 0.49 | $ 1.08 | $ (0.50) | $ 0.64 | $ (0.11) | $ 0.23 |
| Less Distributions | ||||||
| From net investment income | $ (0.40) | $ (0.75) | $ (0.41) | $ (0.36) | $ (0.39) | $ (0.47) |
| Total distributions | $ (0.40) | $ (0.75) | $ (0.41) | $ (0.36) | $ (0.39) | $ (0.47) |
| Net asset value — End of period | $ 9.02 | $ 8.93 | $ 8.60 | $ 9.51 | $ 9.23 | $ 9.73 |
| Total Return(2) | 5.56% (3) | 13.01% | (5.37)% | 6.99% | (1.05)% | 2.42% |
| Ratios/Supplemental Data | ||||||
| Net assets, end of period (000’s omitted) | $6,977 | $ 8,656 | $7,809 | $3,453 | $2,329 | $3,286 |
| Ratios (as a percentage of average daily net assets):(4) | ||||||
| Total expenses(5) | 2.91% (6) | 3.08% | 1.95% | 1.51% | 1.83% | 2.29% |
| Net expenses(5) | 2.64% (6)(7) | 2.81% (7) | 1.73% (7) | 1.32% | 1.53% | 1.98% |
| Net investment income | 8.93% (6) | 8.47% | 4.72% | 3.73% | 4.20% | 4.86% |
| Portfolio Turnover | 14% (3) | 14% | 30% | 37% | 32% | 44% |
| (1) | Computed using average shares outstanding. |
| (2) | Returns are historical and are calculated by determining the percentage change in net asset value with all distributions reinvested and do not reflect the effect of sales charges, if any. |
| (3) | Not annualized. |
| (4) | Total expenses do not reflect amounts reimbursed and/or waived by the adviser and certain of its affiliates, if applicable. Net expenses are net of all reductions and represent the net expenses paid by the Fund. |
| (5) | Includes interest expense and fees and other borrowing costs of 1.63%, 1.76%, 0.70%, 0.31%, 0.54% and 0.96% for the six months ended March 31, 2024 and the years ended September 30, 2023, 2022, 2021, 2020 and 2019, respectively). |
| (6) | Annualized. |
| (7) | Includes a reduction by the investment adviser of a portion of its advisory fee due to the Fund’s investment in the Liquidity Fund (equal to less than 0.01% of average daily net assets for the six months ended March 31, 2024 and the year ended September 30, 2023 and less than 0.005% for the year ended September 30, 2022). |
| Class I | ||||||
| Six Months Ended March 31, 2024 (Unaudited) | Year Ended September 30, | |||||
| 2023 | 2022 | 2021 | 2020 | 2019 | ||
| Net asset value — Beginning of period | $ 8.92 | $ 8.59 | $ 9.50 | $ 9.22 | $ 9.73 | $ 9.97 |
| Income (Loss) From Operations | ||||||
| Net investment income(1) | $ 0.41 | $ 0.76 | $ 0.43 | $ 0.37 | $ 0.40 | $ 0.49 |
| Net realized and unrealized gain (loss) | 0.09 | 0.34 | (0.90) | 0.29 | (0.50) | (0.23) |
| Total income (loss) from operations | $ 0.50 | $ 1.10 | $ (0.47) | $ 0.66 | $ (0.10) | $ 0.26 |
| Less Distributions | ||||||
| From net investment income | $ (0.41) | $ (0.77) | $ (0.44) | $ (0.38) | $ (0.41) | $ (0.50) |
| Total distributions | $ (0.41) | $ (0.77) | $ (0.44) | $ (0.38) | $ (0.41) | $ (0.50) |
| Net asset value — End of period | $ 9.01 | $ 8.92 | $ 8.59 | $ 9.50 | $ 9.22 | $ 9.73 |
| Total Return(2) | 5.57% (3) | 13.29% | (5.14)% | 7.25% | (0.83)% | 2.57% |
| Ratios/Supplemental Data | ||||||
| Net assets, end of period (000’s omitted) | $41,785 | $44,556 | $55,164 | $64,676 | $26,958 | $14,749 |
| Ratios (as a percentage of average daily net assets):(4) | ||||||
| Total expenses(5) | 2.66% (6) | 2.81% | 1.58% | 1.26% | 1.50% | 2.02% |
| Net expenses(5) | 2.38% (6)(7) | 2.55% (7) | 1.36% (7) | 1.07% | 1.21% | 1.70% |
| Net investment income | 9.17% (6) | 8.68% | 4.69% | 3.94% | 4.34% | 5.05% |
| Portfolio Turnover | 14% (3) | 14% | 30% | 37% | 32% | 44% |
| (1) | Computed using average shares outstanding. |
| (2) | Returns are historical and are calculated by determining the percentage change in net asset value with all distributions reinvested and do not reflect the effect of sales charges, if any. |
| (3) | Not annualized. |
| (4) | Total expenses do not reflect amounts reimbursed and/or waived by the adviser and certain of its affiliates, if applicable. Net expenses are net of all reductions and represent the net expenses paid by the Fund. |
| (5) | Includes interest expense and fees and other borrowing costs of 1.62%, 1.75%, 0.58%, 0.31%, 0.47% and 0.93% for the six months ended March 31, 2024 and the years ended September 30, 2023, 2022, 2021, 2020 and 2019, respectively). |
| (6) | Annualized. |
| (7) | Includes a reduction by the investment adviser of a portion of its advisory fee due to the Fund’s investment in the Liquidity Fund (equal to less than 0.01% of average daily net assets for the six months ended March 31, 2024 and the year ended September 30, 2023 and less than 0.005% for the year ended September 30, 2022). |
| Class R6 | ||||||
| Six Months Ended March 31, 2024 (Unaudited) | Year Ended September 30, | |||||
| 2023 | 2022 | 2021 | 2020 | 2019 | ||
| Net asset value — Beginning of period | $ 8.92 | $ 8.59 | $ 9.50 | $ 9.22 | $ 9.72 | $ 9.96 |
| Income (Loss) From Operations | ||||||
| Net investment income(1) | $ 0.41 | $ 0.77 | $ 0.42 | $ 0.38 | $ 0.41 | $ 0.50 |
| Net realized and unrealized gain (loss) | 0.09 | 0.33 | (0.89) | 0.28 | (0.50) | (0.24) |
| Total income (loss) from operations | $ 0.50 | $ 1.10 | $ (0.47) | $ 0.66 | $ (0.09) | $ 0.26 |
| Less Distributions | ||||||
| From net investment income | $ (0.41) | $ (0.77) | $ (0.44) | $ (0.38) | $ (0.41) | $ (0.50) |
| Total distributions | $ (0.41) | $ (0.77) | $ (0.44) | $ (0.38) | $ (0.41) | $ (0.50) |
| Net asset value — End of period | $ 9.01 | $ 8.92 | $ 8.59 | $ 9.50 | $ 9.22 | $ 9.72 |
| Total Return(2) | 5.57% (3) | 13.29% | (5.15)% | 7.26% | (0.83)% | 2.67% |
| Ratios/Supplemental Data | ||||||
| Net assets, end of period (000’s omitted) | $52,612 | $28,730 | $32,233 | $57,343 | $43,899 | $32,011 |
| Ratios (as a percentage of average daily net assets):(4) | ||||||
| Total expenses(5) | 2.49% (6) | 2.74% | 1.43% | 1.19% | 1.44% | 1.99% |
| Net expenses(5) | 2.30% (6)(7) | 2.56% (7) | 1.32% (7) | 1.08% | 1.23% | 1.72% |
| Net investment income | 9.12% (6) | 8.72% | 4.59% | 3.99% | 4.40% | 5.08% |
| Portfolio Turnover | 14% (3) | 14% | 30% | 37% | 32% | 44% |
| (1) | Computed using average shares outstanding. |
| (2) | Returns are historical and are calculated by determining the percentage change in net asset value with all distributions reinvested and do not reflect the effect of sales charges, if any. |
| (3) | Not annualized. |
| (4) | Total expenses do not reflect amounts reimbursed and/or waived by the adviser and certain of its affiliates, if applicable. Net expenses are net of all reductions and represent the net expenses paid by the Fund. |
| (5) | Includes interest expense and fees and other borrowing costs of 1.54%, 1.76%, 0.54%, 0.32%, 0.49% and 0.95% for the six months ended March 31, 2024 and the years ended September 30, 2023, 2022, 2021, 2020 and 2019, respectively). |
| (6) | Annualized. |
| (7) | Includes a reduction by the investment adviser of a portion of its advisory fee due to the Fund’s investment in the Liquidity Fund (equal to less than 0.01% of average daily net assets for the six months ended March 31, 2024 and the year ended September 30, 2023 and less than 0.005% for the year ended September 30, 2022). |
| Asset Description | Level 1 | Level 2 | Level 3(1) | Total |
| Common Stocks | $ 2,692 | $ 292,397 | $ 0 | $ 295,089 |
| Corporate Bonds | — | 6,920,862 | — | 6,920,862 |
| Exchange-Traded Funds | 958,003 | — | — | 958,003 |
| Senior Floating-Rate Loans | — | 106,533,837 | — | 106,533,837 |
| Short-Term Investments | 2,288,053 | — | — | 2,288,053 |
| Total Investments | $3,248,748 | $113,747,096 | $ 0 | $116,995,844 |
| (1) | None of the unobservable inputs for Level 3 assets, individually or collectively, had a material impact on the Fund. |
| Average Daily Gross Assets | Annual Fee Rate |
| Up to and including $1 billion | 0.480% |
| In excess of $1 billion | 0.430% |
| Aggregate cost | $118,685,709 |
| Gross unrealized appreciation | $ 631,677 |
| Gross unrealized depreciation | (2,321,542) |
| Net unrealized depreciation | $ (1,689,865) |
| Name | Value, beginning of period | Purchases | Sales proceeds | Net realized gain (loss) | Change in unrealized appreciation (depreciation) | Value, end of period | Dividend income | Shares, end of period |
| Short-Term Investments | ||||||||
| Liquidity Fund | $3,403,736 | $44,823,780 | $(45,939,463) | $ — | $ — | $2,288,053 | $93,286 | 2,288,053 |
| Six Months Ended March 31, 2024 (Unaudited) | Year Ended September 30, 2023 | ||||
| Shares | Amount | Shares | Amount | ||
| Class A | |||||
| Shares sold | 94,717 | $ 844,164 | 256,513 | $ 2,260,838 | |
| Reinvestment of distributions | 27,952 | 249,592 | 72,287 | 637,099 | |
| Shares redeemed | (318,749) | (2,837,942) | (267,744) | (2,357,650) | |
| Net increase (decrease) | (196,080) | $ (1,744,186) | 61,056 | $ 540,287 | |
| Class I | |||||
| Shares sold | 687,279 | $ 6,149,126 | 1,814,531 | $ 15,994,311 | |
| Reinvestment of distributions | 181,205 | 1,617,209 | 456,814 | 4,017,949 | |
| Shares redeemed | (1,226,758) | (10,953,914) | (3,699,637) | (32,425,538) | |
| Net decrease | (358,274) | $ (3,187,579) | (1,428,292) | $(12,413,278) | |
| Six Months Ended March 31, 2024 (Unaudited) | Year Ended September 30, 2023 | ||||
| Shares | Amount | Shares | Amount | ||
| Class R6 | |||||
| Shares sold | 2,856,044 | $ 25,684,426 | 221 | $ 1,947 | |
| Reinvestment of distributions | 117,081 | 1,044,861 | 292,930 | 2,577,103 | |
| Shares redeemed | (355,027) | (3,166,238) | (825,658) | (7,270,095) | |
| Net increase (decrease) | 2,618,098 | $ 23,563,049 | (532,507) | $ (4,691,045) | |
| Officers |
| Hope L. Brown Chief Compliance Officer |
| Deidre E. Walsh Secretary, Vice President and Chief Legal Officer |
| James F. Kirchner Treasurer |
| Trustees |
| Alice Gresham Bullock Chairperson |
| Cari M. Dominguez |
| Karen Fang |
| Miles D. Harper, III |
| Von M. Hughes*(1) |
| Joy V. Jones |
| Eddie Ramos |
| Anthony A. Williams |
| * Interested Trustee and President |
| (1) Mr. Hughes began serving as Trustee effective December 11, 2023. |
| U.S. Customer Privacy Notice | March 2024 |
| FACTS | WHAT DOES CALVERT DO WITH YOUR PERSONAL INFORMATION? |
| Why? | Financial companies choose how they share your personal information. Federal law gives consumers the right to limit some but not all sharing. Federal law also requires us to tell you how we collect, share, and protect your personal information. Please read this notice carefully to understand what we do. |
| What? | The types of personal information we collect and share depend on the product or service you have with us. This information can include:■ Social Security number and income ■ investment experience and risk tolerance ■ checking account information and wire transfer instructions |
| How? | All financial companies need to share customers’ personal information to run their everyday business. In the section below, we list the reasons financial companies can share their customers’ personal information; the reasons Calvert chooses to share; and whether you can limit this sharing. |
| Reasons we can share your personal information | Does Calvert share? | Can you limit this sharing? |
| For our everyday business purposes — such as to process your transactions, maintain your account(s), respond to court orders and legal investigations, or report to credit bureaus | Yes | No |
| For our marketing purposes — to offer our products and services to you | Yes | No |
| For joint marketing with other financial companies | No | We don’t share |
| For our affiliates’ everyday business purposes — information about your transactions and experiences | Yes | No* |
| For our affiliates’ everyday business purposes — information about your creditworthiness | Yes | Yes* |
| For our affiliates to market to you | Yes | Yes* |
| For nonaffiliates to market to you | No | We don’t share |
| To limit our sharing | Call toll-free 1-800-368-2745 or email: CRMPrivacy@calvert.comPlease note:If you are a new customer, we can begin sharing your information 30 days from the date we sent this notice. When you are no longer our customer, we continue to share your information as described in this notice. However, you can contact us at any time to limit our sharing. |
| Questions? | Call toll-free 1-800-368-2745 or email: CRMPrivacy@calvert.com |
| U.S. Customer Privacy Notice — continued | March 2024 |
| Who we are | |
| Who is providing this notice? | Calvert Research and Management and our investment management affiliates (“Calvert”) (see Affiliates definition below.) |
| What we do | |
| How does Calvert protect my personal information? | To protect your personal information from unauthorized access and use, we use security measures that comply with federal law. These measures include computer safeguards and secured files and buildings. We have policies governing the proper handling of customer information by personnel and requiring third parties that provide support to adhere to appropriate security standards with respect to such information. |
| How does Calvert collect my personal information? | We collect your personal information, for example, when you■ open an account or make deposits or withdrawals from your account ■ buy securities from us or make a wire transfer ■ give us your contact informationWe also collect your personal information from others, such as credit bureaus, affiliates, or other companies. |
| Why can’t I limit all sharing? | Federal law gives you the right to limit only■ sharing for affiliates’ everyday business purposes — information about your creditworthiness ■ affiliates from using your information to market to you ■ sharing for nonaffiliates to market to youState laws and individual companies may give you additional rights to limit sharing. (See below for more on your rights under state law.) |
| What happens when I limit sharing for an account I hold jointly with someone else? | Your choices will apply to everyone on your account. |
| Definitions | |
| Affiliates | Companies related by common ownership or control. They can be financial and nonfinancial companies.■ Our affiliates include registered investment advisers such as Eaton Vance Management, Eaton Vance Advisers International Ltd., Boston Management and Research, Parametric Portfolio Associates LLC, Atlanta Capital Management Company LLC, Morgan Stanley Investment Management Inc., Morgan Stanley Investment Management Co.; registered broker-dealers such as Morgan Stanley Distributors Inc. and Eaton Vance Distributors, Inc. (together, the “Investment Management Affiliates”); and companies with a Morgan Stanley name and financial companies such as Morgan Stanley Smith Barney LLC and Morgan Stanley & Co. (the “Morgan Stanley Affiliates”). |
| Nonaffiliates | Companies not related by common ownership or control. They can be financial and nonfinancial companies.■ Calvert Research and Management does not share with nonaffiliates so they can market to you. |
| Joint marketing | A formal agreement between nonaffiliated financial companies that together market financial products or services to you.■ Calvert Research and Management does not jointly market. |
| U.S. Customer Privacy Notice — continued | March 2024 |
| Other important information | |
| *PLEASE NOTE: Calvert does not share your creditworthiness information or your transactions and experiences information with the Morgan Stanley Affiliates, nor does Calvert enable the Morgan Stanley Affiliates to market to you. Your opt outs will prevent Calvert from sharing your creditworthiness information with the Investment Management Affiliates and will prevent the Investment Management Affiliates from marketing their products to you.Vermont: Except as permitted by law, we will not share personal information we collect about Vermont residents with Nonaffiliates unless you provide us with your written consent to share such information.California: Except as permitted by law, we will not share personal information we collect about California residents with Nonaffiliates and we will limit sharing such personal information with our Affiliates to comply with California privacy laws that apply to us. |


| % Average Annual Total Returns1,2 | Class Inception Date | Performance Inception Date | Six Months | One Year | Five Years | Since Inception |
| Class A at NAV | 12/14/2021 | 12/17/2015 | 19.98% | 19.32% | 11.74% | 9.99% |
| Class A with 5.25% Maximum Sales Charge | — | — | 13.72 | 13.04 | 10.53 | 9.28 |
| Class I at NAV | 12/17/2015 | 12/17/2015 | 20.11 | 19.53 | 11.80 | 10.03 |
| MSCI World Index | — | — | 21.31% | 25.11% | 12.06% | 11.14% |
| % Total Annual Operating Expense Ratios3 | Class A | Class I |
| Gross | 2.45% | 2.20% |
| Net | 1.15 | 0.90 |
| Sector Allocation (% of net assets)1 |

| Country Allocation (% of net assets) | |
| United States | 53.7% |
| France | 8.9 |
| United Kingdom | 7.6 |
| Netherlands | 4.9 |
| Japan | 4.1 |
| Switzerland | 3.6 |
| Germany | 2.8 |
| Belgium | 2.4 |
| Denmark | 2.3 |
| Singapore | 2.0 |
| Australia | 2.0 |
| India | 1.8 |
| Hong Kong | 1.7 |
| Taiwan | 1.7 |
| Total | 99.5% |
| Top 10 Holdings (% of net assets)1 | |
| Microsoft Corp. | 7.1% |
| Amazon.com, Inc. | 5.1 |
| Alphabet, Inc., Class A | 4.9 |
| Visa, Inc., Class A | 3.7 |
| Nestle SA | 3.6 |
| Sanofi SA | 3.2 |
| Walt Disney Co. | 3.0 |
| Compass Group PLC | 2.9 |
| Boston Scientific Corp. | 2.9 |
| Siemens AG | 2.8 |
| Total | 39.2% |
| 1 | Excludes cash and cash equivalents. |
| 1 | MSCI World Index is an unmanaged index of equity securities in the developed markets. MSCI indexes are net of foreign withholding taxes. Source: MSCI. MSCI data may not be reproduced or used for any other purpose. MSCI provides no warranties, has not prepared or approved this report, and has no liability hereunder. Unless otherwise stated, index returns do not reflect the effect of any applicable sales charges, commissions, expenses, taxes or leverage, as applicable. It is not possible to invest directly in an index. |
| 2 | Total Returns at NAV do not include applicable sales charges. If sales charges were deducted, the returns would be lower. Total Returns shown with maximum sales charge reflect the stated maximum sales charge. Unless otherwise stated, performance does not reflect the deduction of taxes on Fund distributions or redemptions of Fund shares.Performance prior to September 16, 2023 is that of Eaton Vance Focused Global Opportunities Fund (the Predecessor Fund). The Fund acquired the performance history of the Predecessor Fund as part of a reorganization that took place at the close of business on September 15, 2023. The Predecessor Fund did not follow the Calvert Principles for Responsible Investment and, accordingly, the performance of the Predecessor Fund may not be indicative of how the Fund may have performed.Performance prior to the inception date of a class may be linked to the performance of an older class of the Fund. This linked performance is adjusted for any applicable sales charge, but is not adjusted for class expense differences. If adjusted for such differences, the performance would be different. The performance of Class A is linked to Class I. Performance since inception for an index, if presented, is the performance since the Fund’s or oldest share class’s inception, as applicable. Performance presented in the Financial Highlights included in the financial statements is not linked. |
| 3 | Source: Fund prospectus. Net expense ratios reflect a contractual expense reimbursement that continues through 9/15/28. The expense ratios for the current reporting period can be found in the Financial Highlights section of this report. Performance reflects expenses waived and/or reimbursed, if applicable. Without such waivers and/or reimbursements, performance would have been lower. |
| Fund profile subject to change due to active management. |
| Beginning Account Value (10/1/23) | Ending Account Value (3/31/24) | Expenses Paid During Period* (10/1/23 – 3/31/24) | Annualized Expense Ratio | |
| Actual | ||||
| Class A | $1,000.00 | $1,199.80 | $6.27 ** | 1.14% |
| Class I | $1,000.00 | $1,201.10 | $4.90 ** | 0.89% |
| Hypothetical | ||||
| (5% return per year before expenses) | ||||
| Class A | $1,000.00 | $1,019.30 | $5.76 ** | 1.14% |
| Class I | $1,000.00 | $1,020.55 | $4.50 ** | 0.89% |
| * | Expenses are equal to the Fund’s annualized expense ratio for the indicated Class, multiplied by the average account value over the period, multiplied by 183/366 (to reflect the one-half year period). The Example assumes that the $1,000 was invested at the net asset value per share determined at the close of business on September 30, 2023. |
| ** | Absent a waiver and/or reimbursement of expenses by affiliate(s), expenses would be higher. |
| Common Stocks — 96.6% |
| Security | Shares | Value | |
| Australia — 2.0% | |||
| CSL Ltd. | 1,191 | $ 223,464 | |
| $ 223,464 | |||
| Belgium — 2.4% | |||
| KBC Group NV | 3,512 | $ 263,302 | |
| $ 263,302 | |||
| Denmark — 2.3% | |||
| Novo Nordisk AS, Class B | 2,030 | $ 260,395 | |
| $ 260,395 | |||
| France — 8.9% | |||
| LVMH Moet Hennessy Louis Vuitton SE | 226 | $ 203,354 | |
| Safran SA | 1,091 | 247,081 | |
| Sanofi SA | 3,595 | 349,737 | |
| Schneider Electric SE | 812 | 183,574 | |
| $ 983,746 | |||
| Germany — 2.8% | |||
| Siemens AG | 1,597 | $ 304,929 | |
| $ 304,929 | |||
| Hong Kong — 1.7% | |||
| AIA Group Ltd. | 27,769 | $ 186,790 | |
| $ 186,790 | |||
| India — 1.8% | |||
| HDFC Bank Ltd. ADR | 3,583 | $ 200,541 | |
| $ 200,541 | |||
| Japan — 4.1% | |||
| Keyence Corp. | 458 | $ 212,631 | |
| Nihon M&A Center Holdings, Inc. | 13,412 | 85,382 | |
| Recruit Holdings Co. Ltd. | 3,668 | 161,050 | |
| $ 459,063 | |||
| Netherlands — 4.9% | |||
| ASML Holding NV | 297 | $ 287,930 | |
| IMCD NV | 1,416 | 249,230 | |
| $ 537,160 | |||
| Singapore — 2.0% | |||
| DBS Group Holdings Ltd. | 8,379 | $ 223,617 | |
| $ 223,617 | |||
| Switzerland — 3.6% | |||
| Nestle SA | 3,730 | $ 396,312 | |
| $ 396,312 | |||
| Security | Shares | Value | |
| Taiwan — 1.7% | |||
| Taiwan Semiconductor Manufacturing Co. Ltd. ADR | 1,348 | $ 183,396 | |
| $ 183,396 | |||
| United Kingdom — 7.6% | |||
| Compass Group PLC | 11,034 | $ 323,656 | |
| London Stock Exchange Group PLC | 2,025 | 242,300 | |
| Reckitt Benckiser Group PLC | 4,789 | 272,997 | |
| $ 838,953 | |||
| United States — 50.8% | |||
| Adobe, Inc.(1) | 364 | $ 183,675 | |
| Alphabet, Inc., Class A(1) | 3,569 | 538,669 | |
| Amazon.com, Inc.(1) | 3,106 | 560,260 | |
| AMETEK, Inc. | 1,502 | 274,716 | |
| Boston Scientific Corp.(1) | 4,623 | 316,629 | |
| CDW Corp. | 1,051 | 268,825 | |
| Danaher Corp. | 1,217 | 303,909 | |
| Dollar Tree, Inc.(1) | 1,409 | 187,608 | |
| Ingersoll Rand, Inc. | 2,280 | 216,486 | |
| Intuit, Inc. | 387 | 251,550 | |
| Intuitive Surgical, Inc.(1) | 541 | 215,908 | |
| Microsoft Corp. | 1,868 | 785,905 | |
| NextEra Energy, Inc. | 3,296 | 210,647 | |
| TJX Cos., Inc. | 2,139 | 216,937 | |
| Verisk Analytics, Inc. | 567 | 133,659 | |
| Visa, Inc., Class A | 1,485 | 414,434 | |
| Walt Disney Co. | 2,724 | 333,309 | |
| Zoetis, Inc. | 1,163 | 196,791 | |
| $ 5,609,917 | |||
| Total Common Stocks (identified cost $7,629,771) | $10,671,585 | ||
| Short-Term Investments — 2.9% |
| Security | Shares | Value | |
| Morgan Stanley Institutional Liquidity Funds - Government Portfolio, Institutional Class, 5.22%(2) | 320,606 | $ 320,606 | |
| Total Short-Term Investments (identified cost $320,606) | $ 320,606 | ||
| Total Investments — 99.5% (identified cost $7,950,377) | $10,992,191 | |
| Other Assets, Less Liabilities — 0.5% | $ 58,239 | |
| Net Assets — 100.0% | $11,050,430 |
| The percentage shown for each investment category in the Schedule of Investments is based on net assets. | |
| (1) | Non-income producing security. |
| (2) | May be deemed to be an affiliated investment company. The rate shown is the annualized seven-day yield as of March 31, 2024. |
| Economic Sectors | % of Net Assets |
| Information Technology | 19.7% |
| Health Care | 16.9 |
| Industrials | 16.8 |
| Financials | 13.8 |
| Consumer Discretionary | 11.8 |
| Communication Services | 7.9 |
| Consumer Staples | 7.8 |
| Utilities | 1.9 |
| Total | 96.6% |
| Abbreviations: | |
| ADR | – American Depositary Receipt |
| March 31, 2024 | |
| Assets | |
| Investments in securities of unaffiliated issuers, at value (identified cost $7,629,771) | $ 10,671,585 |
| Investments in securities of affiliated issuers, at value (identified cost $320,606) | 320,606 |
| Cash | 244 |
| Receivable for investments sold | 210,994 |
| Receivable for capital shares sold | 263 |
| Dividends receivable | 3,926 |
| Dividends receivable - affiliated | 1,123 |
| Tax reclaims receivable | 10,367 |
| Trustees' deferred compensation plan | 10 |
| Prepaid expenses | 8,775 |
| Total assets | $11,227,893 |
| Liabilities | |
| Payable for investments purchased | $ 126,982 |
| Payable to affiliates: | |
| Investment advisory fee | 6,265 |
| Administrative fee | 1,111 |
| Distribution and service fees | 41 |
| Sub-transfer agency fee | 141 |
| Trustees' deferred compensation plan | 10 |
| Other | 8,039 |
| Payable for professional fees | 29,293 |
| Accrued expenses | 5,581 |
| Total liabilities | $ 177,463 |
| Net Assets | $11,050,430 |
| Sources of Net Assets | |
| Paid-in capital | $ 7,930,750 |
| Distributable earnings | 3,119,680 |
| Net Assets | $11,050,430 |
| Class A Shares | |
| Net Assets | $ 270,952 |
| Shares Outstanding | 16,053 |
| Net Asset Value and Redemption Price Per Share (net assets ÷ shares of beneficial interest outstanding) | $ 16.88 |
| Maximum Offering Price Per Share (100 ÷ 94.75 of net asset value per share) | $ 17.82 |
| Class I Shares | |
| Net Assets | $ 10,779,478 |
| Shares Outstanding | 638,916 |
| Net Asset Value, Offering Price and Redemption Price Per Share (net assets ÷ shares of beneficial interest outstanding) | $ 16.87 |
| On sales of $50,000 or more, the offering price of Class A shares is reduced. |
| Six Months Ended | |
| March 31, 2024 | |
| Investment Income | |
| Dividend income (net of foreign taxes withheld of $2,473) | $ 37,998 |
| Dividend income - affiliated issuers | 5,318 |
| Total investment income | $ 43,316 |
| Expenses | |
| Investment advisory fee | $ 32,167 |
| Administrative fee | 5,677 |
| Distribution and service fees: | |
| Class A | 87 |
| Custodian fees | 4,392 |
| Transfer agency fees and expenses | 1,098 |
| Accounting fees | 3,477 |
| Professional fees | 23,424 |
| Registration fees | 39,711 |
| Reports to shareholders | 1,464 |
| Miscellaneous | 5,246 |
| Total expenses | $ 116,743 |
| Waiver and/or reimbursement of expenses by affiliates | $ (74,416) |
| Net expenses | $ 42,327 |
| Net investment income | $ 989 |
| Realized and Unrealized Gain (Loss) | |
| Net realized gain (loss): | |
| Investment securities | $ 99,879 |
| Foreign currency transactions | 95 |
| Net realized gain | $ 99,974 |
| Change in unrealized appreciation (depreciation): | |
| Investment securities | $ 1,615,216 |
| Foreign currency | 162 |
| Net change in unrealized appreciation (depreciation) | $1,615,378 |
| Net realized and unrealized gain | $1,715,352 |
| Net increase in net assets from operations | $1,716,341 |
| Six Months Ended March 31, 2024 (Unaudited) | Ten Months Ended September 30, 2023 | Year Ended November 30, 2022 | |
| Increase (Decrease) in Net Assets | |||
| From operations: | |||
| Net investment income | $ 989 | $ 35,729 | $ 46,050 |
| Net realized gain | 99,974 | 211,084 | 109,561 |
| Net change in unrealized appreciation (depreciation) | 1,615,378 | 102,887 | (941,350) |
| Net increase (decrease) in net assets from operations | $ 1,716,341 | $ 349,700 | $ (785,739) |
| Distributions to shareholders: | |||
| Class A | $ (732) | $ (282) | $ (868)(1) |
| Class I | (202,993) | (175,579) | (751,865) |
| Total distributions to shareholders | $ (203,725) | $ (175,861) | $ (752,733) |
| Capital share transactions: | |||
| Class A | $ 231,159 | $ 14,253 | $ 19,082(1) |
| Class I | 1,776,895 | (2,506,997) | 3,065,908 |
| Net increase (decrease) in net assets from capital share transactions | $ 2,008,054 | $(2,492,744) | $3,084,990 |
| Net increase (decrease) in net assets | $ 3,520,670 | $(2,318,905) | $1,546,518 |
| Net Assets | |||
| At beginning of period | $ 7,529,760 | $ 9,848,665 | $ 8,302,147 |
| At end of period | $11,050,430 | $ 7,529,760 | $9,848,665 |
| (1) | For the period from the commencement of operations, December 14, 2021, to November 30, 2022. |
| Financial information from December 1, 2021 through the close of business on September 15, 2023 is for the Eaton Vance Focused Global Opportunities Fund, which was reorganized into the Calvert Global Equity Fund as of the close of business on September 15, 2023. The Eaton Vance Focused Global Opportunities Fund had a fiscal year-end of November 30. See Notes 1 and 9 to Financial Statements. | |
| Class A | |||
| Six Months Ended March 31, 2024 (Unaudited) | Ten Months Ended September 30, 2023 | Period Ended November 30, 2022(1) | |
| Net asset value — Beginning of period | $ 14.33 | $ 14.00 | $ 17.46 |
| Income (Loss) From Operations | |||
| Net investment income (loss)(2) | $ (0.01) | $ 0.04 | $ 0.04 |
| Net realized and unrealized gain (loss) | 2.86 | 0.52 | (1.98) |
| Total income (loss) from operations | $ 2.85 | $ 0.56 | $ (1.94) |
| Less Distributions | |||
| From net investment income | $ (0.03) | $ (0.04) | $ (0.08) |
| From net realized gain | (0.27) | (0.19) | (1.44) |
| Total distributions | $ (0.30) | $ (0.23) | $ (1.52) |
| Net asset value — End of period | $16.88 | $14.33 | $ 14.00 |
| Total Return(3) | 19.98% (4) | 4.12% (4) | (12.48)% (4) |
| Ratios/Supplemental Data | |||
| Net assets, end of period (000’s omitted) | $ 271 | $ 31 | $ 17 |
| Ratios (as a percentage of average daily net assets):(5) | |||
| Total expenses | 2.66% (6) | 2.46% (6)(7) | 2.91% (6) |
| Net expenses | 1.14% (6)(8) | 1.21% (6)(7)(8) | 1.20% (6)(8) |
| Net investment income (loss) | (0.17)% (6) | 0.26% (6) | 0.31% (6) |
| Portfolio Turnover | 13% (4) | 30% (4) | 29% (9) |
| (1) | For the period from the commencement of operations, December 14, 2021, to November 30, 2022. |
| (2) | Computed using average shares outstanding. |
| (3) | Returns are historical and are calculated by determining the percentage change in net asset value with all distributions reinvested and do not reflect the effect of sales charges, if any. |
| (4) | Not annualized. |
| (5) | Total expenses do not reflect amounts reimbursed and/or waived by the adviser and certain of its affiliates, if applicable. Net expenses are net of all reductions and represent the net expenses paid by the Fund. |
| (6) | Annualized. |
| (7) | Includes interest expense of 0.01%. |
| (8) | Includes a reduction by the investment adviser of a portion of its advisory fee or its advisory and administration fee due to the Fund’s investment in the Liquidity Fund (equal to less than 0.005% of average daily net assets for the six months ended March 31, 2024, the ten months ended September 30, 2023 and the period ended November 30, 2022). |
| (9) | For the year ended November 30, 2022. |
| Financial information from December 1, 2021 through the close of business on September 15, 2023 is for the Eaton Vance Focused Global Opportunities Fund, which was reorganized into the Calvert Global Equity Fund as of the close of business on September 15, 2023. The Eaton Vance Focused Global Opportunities Fund had a fiscal year-end of November 30. See Notes 1 and 9 to Financial Statements. | |
| Class I | |||||||
| Six Months Ended March 31, 2024 (Unaudited) | Ten Months Ended September 30, 2023 | Year Ended November 30, | |||||
| 2022 | 2021 | 2020 | 2019 | 2018 | |||
| Net asset value — Beginning of period | $ 14.33 | $ 13.99 | $ 17.25 | $ 13.78 | $ 12.42 | $ 11.53 | $ 11.83 |
| Income (Loss) From Operations | |||||||
| Net investment income(1) | $ 0.00(2) | $ 0.06 | $ 0.08 | $ 0.03 | $ 0.07 | $ 0.10 | $ 0.14 |
| Net realized and unrealized gain (loss) | 2.86 | 0.53 | (1.82) | 3.49 | 1.42 | 1.65 | (0.01) |
| Total income (loss) from operations | $ 2.86 | $ 0.59 | $ (1.74) | $ 3.52 | $ 1.49 | $ 1.75 | $ 0.13 |
| Less Distributions | |||||||
| From net investment income | $ (0.05) | $ (0.06) | $ (0.08) | $ (0.05) | $ (0.13) | $ (0.12) | $ (0.12) |
| From net realized gain | (0.27) | (0.19) | (1.44) | — | — | (0.74) | (0.31) |
| Total distributions | $ (0.32) | $ (0.25) | $ (1.52) | $ (0.05) | $ (0.13) | $ (0.86) | $ (0.43) |
| Net asset value — End of period | $ 16.87 | $14.33 | $ 13.99 | $17.25 | $13.78 | $12.42 | $11.53 |
| Total Return(3) | 20.11% (4) | 4.38% (4) | (11.48)% | 25.62% | 12.06% | 17.28% | 1.06% |
| Ratios/Supplemental Data | |||||||
| Net assets, end of period (000’s omitted) | $10,779 | $ 7,499 | $ 9,832 | $ 8,302 | $ 5,801 | $ 5,186 | $ 4,350 |
| Ratios (as a percentage of average daily net assets):(5) | |||||||
| Total expenses | 2.46% (6) | 2.20% (6)(7) | 2.66% | 2.32% | 2.90% | 3.03% (7) | 3.27% |
| Net expenses | 0.89% (6)(8) | 0.96% (6)(7)(8) | 0.95% (8) | 0.95% | 0.95% | 0.96% (7) | 0.95% |
| Net investment income | 0.02% (6) | 0.52% (6) | 0.58% | 0.18% | 0.55% | 0.92% | 1.20% |
| Portfolio Turnover | 13% (4) | 30% (4) | 29% | 57% | 54% | 46% | 82% |
| (1) | Computed using average shares outstanding. |
| (2) | Amount is less than $0.005. |
| (3) | Returns are historical and are calculated by determining the percentage change in net asset value with all distributions reinvested and do not reflect the effect of sales charges, if any. |
| (4) | Not annualized. |
| (5) | Total expenses do not reflect amounts reimbursed and/or waived by the adviser and certain of its affiliates, if applicable. Net expenses are net of all reductions and represent the net expenses paid by the Fund. |
| (6) | Annualized. |
| (7) | Includes interest expense of 0.01%. |
| (8) | Includes a reduction by the investment adviser of a portion of its advisory fee or its advisory and administration fee due to the Fund’s investment in the Liquidity Fund (equal to less than 0.005% of average daily net assets for the six months ended March 31, 2024, the ten months ended September 30, 2023 and the year ended November 30, 2022). |
| Financial information from December 1, 2017 through the close of business on September 15, 2023 is for the Eaton Vance Focused Global Opportunities Fund, which was reorganized into the Calvert Global Equity Fund as of the close of business on September 15, 2023. The Eaton Vance Focused Global Opportunities Fund had a fiscal year-end of November 30. See Notes 1 and 9 to Financial Statements. | |
| Asset Description | Level 1 | Level 2 | Level 3 | Total |
| Common Stocks: | ||||
| Australia | $ — | $ 223,464 | $ — | $ 223,464 |
| Belgium | — | 263,302 | — | 263,302 |
| Denmark | — | 260,395 | — | 260,395 |
| France | — | 983,746 | — | 983,746 |
| Germany | — | 304,929 | — | 304,929 |
| Hong Kong | — | 186,790 | — | 186,790 |
| India | 200,541 | — | — | 200,541 |
| Japan | — | 459,063 | — | 459,063 |
| Netherlands | — | 537,160 | — | 537,160 |
| Singapore | — | 223,617 | — | 223,617 |
| Switzerland | — | 396,312 | — | 396,312 |
| Taiwan | 183,396 | — | — | 183,396 |
| United Kingdom | — | 838,953 | — | 838,953 |
| United States | 5,609,917 | — | — | 5,609,917 |
| Total Common Stocks | $5,993,854 | $4,677,731 (1) | $ — | $10,671,585 |
| Short-Term Investments | $ 320,606 | $ — | $ — | $ 320,606 |
| Total Investments | $6,314,460 | $4,677,731 | $ — | $10,992,191 |
| (1) | Includes foreign equity securities whose values were adjusted to reflect market trading of comparable securities or other correlated instruments that occurred after the close of trading in their applicable foreign markets. |
| Average Daily Net Assets | Annual Fee Rate |
| Up to $500 million | 0.680% |
| $500 million but less than $1 billion | 0.655% |
| $1 billion but less than $2.5 billion | 0.630% |
| $2.5 billion but less than $5 billion | 0.610% |
| $5 billion and over | 0.595% |
“Liquidity Fund”), an open-end management investment company managed by Morgan Stanley Investment Management Inc., a wholly-owned subsidiary of
Morgan Stanley. The investment advisory fee paid by the Fund is reduced by an amount equal to its pro rata share of the advisory and administration fees paid by the Fund due to its investment in the Liquidity Fund. For the six months ended March 31, 2024, the investment advisory fee paid was reduced by $164 relating to the Fund’s investment in the Liquidity Fund.
| Aggregate cost | $7,955,276 |
| Gross unrealized appreciation | $ 3,292,038 |
| Gross unrealized depreciation | (255,123) |
| Net unrealized appreciation | $3,036,915 |
| Name | Value, beginning of period | Purchases | Sales proceeds | Net realized gain (loss) | Change in unrealized appreciation (depreciation) | Value, end of period | Dividend income | Shares, end of period |
| Short-Term Investments | ||||||||
| Liquidity Fund | $18,172 | $2,629,529 | $(2,327,095) | $ — | $ — | $320,606 | $5,318 | 320,606 |
| Six Months Ended March 31, 2024 (Unaudited) | Ten Months Ended September 30, 2023 | Year Ended November 30, 2022(1) | ||||||
| Shares | Amount | Shares | Amount | Shares | Amount | |||
| Class A | ||||||||
| Shares sold | 14,072 | $ 234,378 | 935 | $ 13,971 | 1,163 | $ 18,214 | ||
| Reinvestment of distributions | 46 | 732 | 21 | 282 | 52 | 868 | ||
| Shares redeemed | (236) | (3,951) | — | — | — | — | ||
| Net increase | 13,882 | $ 231,159 | 956 | $ 14,253 | 1,215 | $ 19,082 | ||
| Class I | ||||||||
| Shares sold | 117,224 | $ 1,805,041 | 36,775 | $ 535,539 | 264,722 | $ 3,660,472 | ||
| Reinvestment of distributions | 12,799 | 202,993 | 13,322 | 175,579 | 45,348 | 751,865 | ||
| Shares redeemed | (14,270) | (231,139) | (229,511) | (3,218,115) | (88,763) | (1,346,429) | ||
| Net increase (decrease) | 115,753 | $1,776,895 | (179,414) | $(2,506,997) | 221,307 | $ 3,065,908 | ||
| (1) | For Class A, for the period from the commencement of operations, December 14, 2021, to November 30, 2022. |
| Shares Issued | Net Assets | |
| Class A | 2,171 | $32,518 |
| Class I | 523,253 | $7,839,838 |
| Officers |
| Hope L. Brown Chief Compliance Officer |
| Deidre E. Walsh Secretary, Vice President and Chief Legal Officer |
| James F. Kirchner Treasurer |
| Trustees |
| Alice Gresham Bullock Chairperson |
| Cari M. Dominguez |
| Karen Fang |
| Miles D. Harper, III |
| Von M. Hughes*(1) |
| Joy V. Jones |
| Eddie Ramos |
| Anthony A. Williams |
| * Interested Trustee and President |
| (1) Mr. Hughes began serving as Trustee effective December 11, 2023. |
| U.S. Customer Privacy Notice | March 2024 |
| FACTS | WHAT DOES CALVERT DO WITH YOUR PERSONAL INFORMATION? |
| Why? | Financial companies choose how they share your personal information. Federal law gives consumers the right to limit some but not all sharing. Federal law also requires us to tell you how we collect, share, and protect your personal information. Please read this notice carefully to understand what we do. |
| What? | The types of personal information we collect and share depend on the product or service you have with us. This information can include:■ Social Security number and income ■ investment experience and risk tolerance ■ checking account information and wire transfer instructions |
| How? | All financial companies need to share customers’ personal information to run their everyday business. In the section below, we list the reasons financial companies can share their customers’ personal information; the reasons Calvert chooses to share; and whether you can limit this sharing. |
| Reasons we can share your personal information | Does Calvert share? | Can you limit this sharing? |
| For our everyday business purposes — such as to process your transactions, maintain your account(s), respond to court orders and legal investigations, or report to credit bureaus | Yes | No |
| For our marketing purposes — to offer our products and services to you | Yes | No |
| For joint marketing with other financial companies | No | We don’t share |
| For our affiliates’ everyday business purposes — information about your transactions and experiences | Yes | No* |
| For our affiliates’ everyday business purposes — information about your creditworthiness | Yes | Yes* |
| For our affiliates to market to you | Yes | Yes* |
| For nonaffiliates to market to you | No | We don’t share |
| To limit our sharing | Call toll-free 1-800-368-2745 or email: CRMPrivacy@calvert.comPlease note:If you are a new customer, we can begin sharing your information 30 days from the date we sent this notice. When you are no longer our customer, we continue to share your information as described in this notice. However, you can contact us at any time to limit our sharing. |
| Questions? | Call toll-free 1-800-368-2745 or email: CRMPrivacy@calvert.com |
| U.S. Customer Privacy Notice — continued | March 2024 |
| Who we are | |
| Who is providing this notice? | Calvert Research and Management and our investment management affiliates (“Calvert”) (see Affiliates definition below.) |
| What we do | |
| How does Calvert protect my personal information? | To protect your personal information from unauthorized access and use, we use security measures that comply with federal law. These measures include computer safeguards and secured files and buildings. We have policies governing the proper handling of customer information by personnel and requiring third parties that provide support to adhere to appropriate security standards with respect to such information. |
| How does Calvert collect my personal information? | We collect your personal information, for example, when you■ open an account or make deposits or withdrawals from your account ■ buy securities from us or make a wire transfer ■ give us your contact informationWe also collect your personal information from others, such as credit bureaus, affiliates, or other companies. |
| Why can’t I limit all sharing? | Federal law gives you the right to limit only■ sharing for affiliates’ everyday business purposes — information about your creditworthiness ■ affiliates from using your information to market to you ■ sharing for nonaffiliates to market to youState laws and individual companies may give you additional rights to limit sharing. (See below for more on your rights under state law.) |
| What happens when I limit sharing for an account I hold jointly with someone else? | Your choices will apply to everyone on your account. |
| Definitions | |
| Affiliates | Companies related by common ownership or control. They can be financial and nonfinancial companies.■ Our affiliates include registered investment advisers such as Eaton Vance Management, Eaton Vance Advisers International Ltd., Boston Management and Research, Parametric Portfolio Associates LLC, Atlanta Capital Management Company LLC, Morgan Stanley Investment Management Inc., Morgan Stanley Investment Management Co.; registered broker-dealers such as Morgan Stanley Distributors Inc. and Eaton Vance Distributors, Inc. (together, the “Investment Management Affiliates”); and companies with a Morgan Stanley name and financial companies such as Morgan Stanley Smith Barney LLC and Morgan Stanley & Co. (the “Morgan Stanley Affiliates”). |
| Nonaffiliates | Companies not related by common ownership or control. They can be financial and nonfinancial companies.■ Calvert Research and Management does not share with nonaffiliates so they can market to you. |
| Joint marketing | A formal agreement between nonaffiliated financial companies that together market financial products or services to you.■ Calvert Research and Management does not jointly market. |
| U.S. Customer Privacy Notice — continued | March 2024 |
| Other important information | |
| *PLEASE NOTE: Calvert does not share your creditworthiness information or your transactions and experiences information with the Morgan Stanley Affiliates, nor does Calvert enable the Morgan Stanley Affiliates to market to you. Your opt outs will prevent Calvert from sharing your creditworthiness information with the Investment Management Affiliates and will prevent the Investment Management Affiliates from marketing their products to you.Vermont: Except as permitted by law, we will not share personal information we collect about Vermont residents with Nonaffiliates unless you provide us with your written consent to share such information.California: Except as permitted by law, we will not share personal information we collect about California residents with Nonaffiliates and we will limit sharing such personal information with our Affiliates to comply with California privacy laws that apply to us. |


| % Average Annual Total Returns1,2 | Class Inception Date | Performance Inception Date | Six Months | One Year | Five Years | Ten Years |
| Class A at NAV | 03/04/2002 | 03/04/2002 | 16.90% | 10.84% | 7.18% | 6.04% |
| Class A with 5.25% Maximum Sales Charge | — | — | 10.76 | 5.01 | 6.04 | 5.47 |
| Class C at NAV | 03/04/2002 | 03/04/2002 | 16.44 | 10.03 | 6.39 | 5.24 |
| Class C with 1% Maximum Deferred Sales Charge | — | — | 15.44 | 9.03 | 6.39 | 5.24 |
| Class I at NAV | 10/01/2009 | 03/04/2002 | 17.02 | 11.14 | 7.46 | 6.30 |
| MSCI World Small Cap Index | — | — | 17.41% | 15.87% | 7.89% | 6.94% |
| % Total Annual Operating Expense Ratios3 | Class A | Class C | Class I |
| Gross | 1.89% | 2.64% | 1.64% |
| Net | 1.31 | 2.06 | 1.06 |
| Sector Allocation (% of net assets)1 |
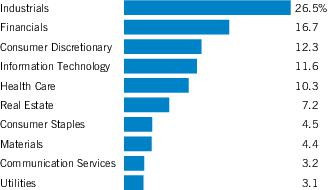
| Country Allocation (% of net assets) | |
| United States | 60.3% |
| Japan | 10.6 |
| United Kingdom | 10.5 |
| Canada | 2.6 |
| Australia | 2.6 |
| Sweden | 2.6 |
| Italy | 2.4 |
| Netherlands | 1.9 |
| Spain | 1.3 |
| Belgium | 1.3 |
| Germany | 1.2 |
| France | 1.0 |
| New Zealand | 0.5 |
| Norway | 0.4 |
| Switzerland | 0.4 |
| Singapore | 0.3 |
| Luxembourg | 0.1 |
| Total | 100.0% |
| Top 10 Holdings (% of net assets)1 | |
| Core & Main, Inc., Class A | 2.4% |
| CBIZ, Inc. | 2.1 |
| AptarGroup, Inc. | 1.8 |
| Chemed Corp. | 1.7 |
| Cooper Cos., Inc. | 1.7 |
| Domino's Pizza, Inc. | 1.7 |
| W.R. Berkley Corp. | 1.6 |
| Dorman Products, Inc. | 1.5 |
| Tradeweb Markets, Inc., Class A | 1.5 |
| Middleby Corp. | 1.4 |
| Total | 17.4% |
| 1 | Excludes cash and cash equivalents. |
| 1 | MSCI World Small Cap Index is an unmanaged index of small-cap equity securities in the developed markets. MSCI indexes are net of foreign withholding taxes. Source: MSCI. MSCI data may not be reproduced or used for any other purpose. MSCI provides no warranties, has not prepared or approved this report, and has no liability hereunder. Unless otherwise stated, index returns do not reflect the effect of any applicable sales charges, commissions, expenses, taxes or leverage, as applicable. It is not possible to invest directly in an index. |
| 2 | Total Returns at NAV do not include applicable sales charges. If sales charges were deducted, the returns would be lower. Total Returns shown with maximum sales charge reflect the stated maximum sales charge. Unless otherwise stated, performance does not reflect the deduction of taxes on Fund distributions or redemptions of Fund shares.Effective November 5, 2020, Class C shares automatically convert to Class A shares eight years after purchase. The average annual total returns listed for Class C reflect conversion to Class A shares after eight years. Prior to November 5, 2020, Class C shares automatically converted to Class A shares ten years after purchase.Prior to August 7, 2015, the Fund’s investment adviser employed an investment objective and strategy of seeking to achieve long-term after-tax returns by investing in value stocks of small-cap companies. From August 7, 2015 until March 1, 2018, the Fund’s investment adviser employed an investment objective and strategy of seeking long-term, after-tax returns by investing in stocks of global small-cap companies. Effective March 1, 2018, the Fund changed its investment objective and strategy to no longer seek after-tax returns. Performance prior to March 1, 2018 reflects the Fund’s performance under its former investment objectives and policies.Performance prior to September 16, 2023 is that of Eaton Vance Global Small-Cap Equity Fund (the Predecessor Fund). The Fund acquired the performance history of the Predecessor Fund as part of a reorganization that took place at the close of business on September 15, 2023. The Predecessor Fund did not follow the Calvert Principles for Responsible Investment and, accordingly, the performance of the Predecessor Fund may not be indicative of how the Fund may have performed. |
| 3 | Source: Fund prospectus. Net expense ratios reflect a contractual expense reimbursement that continues through 9/15/28. The expense ratios for the current reporting period can be found in the Financial Highlights section of this report. Performance reflects expenses waived and/or reimbursed, if applicable. Without such waivers and/or reimbursements, performance would have been lower. |
| Fund profile subject to change due to active management. |
| Beginning Account Value (10/1/23) | Ending Account Value (3/31/24) | Expenses Paid During Period* (10/1/23 – 3/31/24) | Annualized Expense Ratio | |
| Actual | ||||
| Class A | $1,000.00 | $1,169.00 | $ 7.10** | 1.31% |
| Class C | $1,000.00 | $1,164.40 | $11.15 ** | 2.06% |
| Class I | $1,000.00 | $1,170.20 | $ 5.75** | 1.06% |
| Hypothetical | ||||
| (5% return per year before expenses) | ||||
| Class A | $1,000.00 | $1,018.45 | $ 6.61** | 1.31% |
| Class C | $1,000.00 | $1,014.70 | $10.38 ** | 2.06% |
| Class I | $1,000.00 | $1,019.70 | $ 5.35** | 1.06% |
| * | Expenses are equal to the Fund’s annualized expense ratio for the indicated Class, multiplied by the average account value over the period, multiplied by 183/366 (to reflect the one-half year period). The Example assumes that the $1,000 was invested at the net asset value per share determined at the close of business on September 30, 2023. |
| ** | Absent a waiver and/or reimbursement of expenses by affiliate(s), expenses would be higher. |
| Common Stocks — 99.8% |
| Security | Shares | Value | |
| Australia — 2.6% | |||
| BlueScope Steel Ltd. | 3,795 | $ 59,024 | |
| CAR Group Ltd. | 10,935 | 257,037 | |
| Data#3 Ltd. | 34,261 | 184,854 | |
| IGO Ltd. | 10,504 | 48,397 | |
| Steadfast Group Ltd. | 41,358 | 158,465 | |
| $ 707,777 | |||
| Belgium — 1.3% | |||
| Azelis Group NV | 8,031 | $ 169,633 | |
| KBC Ancora | 3,684 | 179,514 | |
| $ 349,147 | |||
| Canada — 2.6% | |||
| Agnico Eagle Mines Ltd. | 1,114 | $ 66,426 | |
| ATS Corp.(1) | 5,407 | 181,943 | |
| Descartes Systems Group, Inc.(1) | 1,956 | 178,915 | |
| Granite Real Estate Investment Trust | 2,571 | 146,738 | |
| Killam Apartment Real Estate Investment Trust | 10,016 | 137,387 | |
| $ 711,409 | |||
| France — 1.0% | |||
| IPSOS SA | 3,996 | $ 281,716 | |
| $ 281,716 | |||
| Germany — 1.2% | |||
| Jenoptik AG | 5,990 | $ 186,071 | |
| Schott Pharma AG & Co. KGaA | 3,402 | 145,548 | |
| $ 331,619 | |||
| Italy — 2.4% | |||
| Amplifon SpA | 4,243 | $ 154,669 | |
| BFF Bank SpA(2) | 20,613 | 275,972 | |
| DiaSorin SpA | 872 | 84,152 | |
| Reply SpA | 1,067 | 150,993 | |
| $ 665,786 | |||
| Japan — 10.6% | |||
| Allegro MicroSystems, Inc.(1) | 3,905 | $ 105,279 | |
| As One Corp. | 8,174 | 143,035 | |
| Asahi Intecc Co. Ltd. | 6,419 | 112,460 | |
| BayCurrent Consulting, Inc. | 8,181 | 160,809 | |
| Chiba Bank Ltd. | 16,754 | 139,413 | |
| Cosmos Pharmaceutical Corp. | 2,242 | 212,603 | |
| Fukuoka Financial Group, Inc. | 5,922 | 158,090 | |
| Goldwin, Inc. | 2,721 | 173,251 | |
| Hoshizaki Corp. | 3,970 | 144,852 | |
| JMDC, Inc.(1) | 4,997 | 121,060 | |
| LaSalle Logiport REIT | 141 | 144,481 | |
| Nihon M&A Center Holdings, Inc. | 13,682 | 87,101 | |
| NOF Corp. | 13,134 | 179,872 | |
| Security | Shares | Value | |
| Japan (continued) | |||
| Riken Keiki Co. Ltd. | 10,334 | $ 260,445 | |
| Sanwa Holdings Corp. | 12,649 | 221,162 | |
| SUMCO Corp. | 9,611 | 151,957 | |
| Toyo Suisan Kaisha Ltd. | 2,780 | 169,985 | |
| USS Co. Ltd. | 24,464 | 202,248 | |
| $ 2,888,103 | |||
| Luxembourg — 0.1% | |||
| APERAM SA | 569 | $ 17,986 | |
| $ 17,986 | |||
| Netherlands — 1.9% | |||
| BE Semiconductor Industries NV | 905 | $ 138,627 | |
| Euronext NV(2) | 1,579 | 150,273 | |
| IMCD NV | 1,270 | 223,533 | |
| $ 512,433 | |||
| New Zealand — 0.5% | |||
| Spark New Zealand Ltd. | 45,494 | $ 129,526 | |
| $ 129,526 | |||
| Norway — 0.4% | |||
| SmartCraft ASA(1) | 45,354 | $ 108,998 | |
| $ 108,998 | |||
| Singapore — 0.3% | |||
| Daiwa House Logistics Trust | 205,782 | $ 89,884 | |
| $ 89,884 | |||
| Spain — 1.3% | |||
| Acciona SA | 2,135 | $ 259,831 | |
| Inmobiliaria Colonial Socimi SA | 15,587 | 92,345 | |
| $ 352,176 | |||
| Sweden — 2.6% | |||
| AddTech AB, Class B | 10,745 | $ 244,450 | |
| Autoliv, Inc. | 1,196 | 144,034 | |
| Boliden AB | 939 | 26,074 | |
| Sdiptech AB, Class B(1) | 11,641 | 283,336 | |
| $ 697,894 | |||
| Switzerland — 0.4% | |||
| Galenica AG(2) | 1,270 | $ 105,977 | |
| $ 105,977 | |||
| United Kingdom — 10.5% | |||
| Cranswick PLC | 3,598 | $ 186,198 | |
| Diploma PLC | 7,706 | 361,962 | |
| DiscoverIE Group PLC | 31,688 | 301,980 | |
| Games Workshop Group PLC | 1,860 | 235,729 | |
| Greggs PLC | 5,077 | 184,159 | |
| JTC PLC(2) | 23,381 | 242,677 | |
| Security | Shares | Value | |
| United Kingdom (continued) | |||
| Nomad Foods Ltd. | 6,980 | $ 136,529 | |
| Rentokil Initial PLC ADR | 11,526 | 347,509 | |
| Shaftesbury Capital PLC | 62,927 | 114,221 | |
| SSP Group PLC | 84,568 | 233,514 | |
| Volution Group PLC | 31,301 | 171,271 | |
| Wise PLC, Class A(1) | 12,082 | 141,231 | |
| Zegona Communications PLC(1) | 71,950 | 205,401 | |
| $ 2,862,381 | |||
| United States — 60.1% | |||
| AAON, Inc. | 2,761 | $ 243,244 | |
| Addus HomeCare Corp.(1) | 1,088 | 112,434 | |
| Albany International Corp., Class A | 3,022 | 282,587 | |
| Alliant Energy Corp. | 5,684 | 286,474 | |
| Altair Engineering, Inc., Class A(1) | 1,353 | 116,561 | |
| AptarGroup, Inc. | 3,486 | 501,601 | |
| Aramark | 10,842 | 352,582 | |
| Atmus Filtration Technologies, Inc.(1) | 3,812 | 122,937 | |
| Axcelis Technologies, Inc.(1) | 966 | 107,728 | |
| AZEK Co., Inc.(1) | 6,735 | 338,232 | |
| Badger Meter, Inc. | 778 | 125,888 | |
| Brunswick Corp. | 1,015 | 97,968 | |
| Burlington Stores, Inc.(1) | 650 | 150,923 | |
| Casey's General Stores, Inc. | 384 | 122,285 | |
| CBIZ, Inc.(1) | 7,154 | 561,589 | |
| Chemed Corp. | 718 | 460,906 | |
| Choice Hotels International, Inc. | 837 | 105,755 | |
| Clearwater Analytics Holdings, Inc., Class A(1) | 6,758 | 119,549 | |
| CMS Energy Corp. | 5,000 | 301,700 | |
| Commerce Bancshares, Inc. | 6,813 | 362,452 | |
| Cooper Cos., Inc. | 4,496 | 456,164 | |
| Core & Main, Inc., Class A(1) | 11,568 | 662,268 | |
| CubeSmart | 5,289 | 239,169 | |
| Dayforce, Inc.(1) | 2,005 | 132,751 | |
| Diodes, Inc.(1) | 1,792 | 126,336 | |
| Domino's Pizza, Inc. | 918 | 456,136 | |
| Dorman Products, Inc.(1) | 4,211 | 405,898 | |
| EastGroup Properties, Inc. | 2,026 | 364,214 | |
| Envestnet, Inc.(1) | 3,859 | 223,475 | |
| Envista Holdings Corp.(1) | 5,322 | 113,784 | |
| Equity LifeStyle Properties, Inc. | 5,116 | 329,470 | |
| Euronet Worldwide, Inc.(1) | 934 | 102,675 | |
| Fair Isaac Corp.(1) | 142 | 177,445 | |
| First American Financial Corp. | 1,767 | 107,875 | |
| First Financial Bankshares, Inc. | 7,879 | 258,510 | |
| Franklin Electric Co., Inc. | 1,496 | 159,788 | |
| Graco, Inc. | 3,014 | 281,688 | |
| Harley-Davidson, Inc. | 2,981 | 130,389 | |
| Herc Holdings, Inc. | 612 | 103,000 | |
| Hexcel Corp. | 1,568 | 114,229 | |
| Janus International Group, Inc.(1) | 10,919 | 165,204 | |
| Security | Shares | Value | |
| United States (continued) | |||
| Jazz Pharmaceuticals PLC(1) | 1,630 | $ 196,285 | |
| Lancaster Colony Corp. | 448 | 93,018 | |
| Landstar System, Inc. | 1,043 | 201,049 | |
| LPL Financial Holdings, Inc. | 839 | 221,664 | |
| MarketAxess Holdings, Inc. | 829 | 181,758 | |
| Middleby Corp.(1) | 2,300 | 369,817 | |
| Neogen Corp.(1) | 11,941 | 188,429 | |
| Neurocrine Biosciences, Inc.(1) | 1,287 | 177,503 | |
| Nordson Corp. | 695 | 190,805 | |
| NV5 Global, Inc.(1) | 1,510 | 147,995 | |
| Performance Food Group Co.(1) | 3,993 | 298,037 | |
| PowerSchool Holdings, Inc., Class A(1) | 6,581 | 140,109 | |
| Progress Software Corp. | 3,283 | 175,017 | |
| Quaker Chemical Corp. | 1,372 | 281,603 | |
| Rexford Industrial Realty, Inc. | 6,188 | 311,256 | |
| Ryan Specialty Holdings, Inc. | 2,202 | 122,211 | |
| Selective Insurance Group, Inc. | 2,989 | 326,309 | |
| SouthState Corp. | 3,491 | 296,840 | |
| SPS Commerce, Inc.(1) | 712 | 131,649 | |
| Teleflex, Inc. | 1,019 | 230,467 | |
| Teradyne, Inc. | 765 | 86,315 | |
| Texas Roadhouse, Inc. | 658 | 101,641 | |
| Tradeweb Markets, Inc., Class A | 3,893 | 405,534 | |
| Tyler Technologies, Inc.(1) | 405 | 172,129 | |
| Visteon Corp.(1) | 695 | 81,739 | |
| W.R. Berkley Corp. | 4,816 | 425,927 | |
| White Mountains Insurance Group Ltd. | 167 | 299,648 | |
| Woodward, Inc. | 1,509 | 232,567 | |
| Wyndham Hotels & Resorts, Inc. | 3,822 | 293,337 | |
| $16,364,521 | |||
| Total Common Stocks (identified cost $21,071,160) | $27,177,333 | ||
| Short-Term Investments — 0.2% |
| Security | Shares | Value | |
| Morgan Stanley Institutional Liquidity Funds - Government Portfolio, Institutional Class, 5.22%(3) | 71,678 | $ 71,678 | |
| Total Short-Term Investments (identified cost $71,678) | $ 71,678 | ||
| Total Investments — 100.0% (identified cost $21,142,838) | $ 27,249,011 | |
| Other Assets, Less Liabilities — (0.0)%(4) | $ (8,906) | |
| Net Assets — 100.0% | $ 27,240,105 |
| The percentage shown for each investment category in the Schedule of Investments is based on net assets. | |
| (1) | Non-income producing security. |
| (2) | Security exempt from registration under Rule 144A of the Securities Act of 1933, as amended. These securities may be sold in certain transactions in reliance on an exemption from registration (normally to qualified institutional buyers). At March 31, 2024, the aggregate value of these securities is $774,899 or 2.8% of the Fund's net assets. |
| (3) | May be deemed to be an affiliated investment company. The rate shown is the annualized seven-day yield as of March 31, 2024. |
| (4) | Amount is less than (0.05)%. |
| Economic Sectors | % of Net Assets |
| Industrials | 26.5% |
| Financials | 16.7 |
| Consumer Discretionary | 12.3 |
| Information Technology | 11.6 |
| Health Care | 10.3 |
| Real Estate | 7.2 |
| Consumer Staples | 4.5 |
| Materials | 4.4 |
| Communication Services | 3.2 |
| Utilities | 3.1 |
| Total | 99.8% |
| Abbreviations: | |
| ADR | – American Depositary Receipt |
| March 31, 2024 | |
| Assets | |
| Investments in securities of unaffiliated issuers, at value (identified cost $21,071,160) | $ 27,177,333 |
| Investments in securities of affiliated issuers, at value (identified cost $71,678) | 71,678 |
| Cash | 3,463 |
| Cash denominated in foreign currency, at value (cost $5,278) | 5,272 |
| Receivable for investments sold | 11,460 |
| Receivable for capital shares sold | 5,897 |
| Dividends and interest receivable | 39,751 |
| Dividends receivable - affiliated | 325 |
| Securities lending income receivable | 1,025 |
| Tax reclaims receivable | 10,958 |
| Trustees' deferred compensation plan | 27 |
| Prepaid expenses | 27,207 |
| Total assets | $27,354,396 |
| Liabilities | |
| Payable for investments purchased | $ 15,631 |
| Payable for capital shares redeemed | 13,828 |
| Payable to affiliates: | |
| Investment advisory fee | 16,576 |
| Administrative fee | 2,744 |
| Distribution and service fees | 4,416 |
| Sub-transfer agency fee | 7,195 |
| Trustees' deferred compensation plan | 27 |
| Other | 8,381 |
| Payable for accounting fees | 5,881 |
| Payable for professional fees | 19,499 |
| Payable for reports to shareholders fees | 6,361 |
| Payable for transfer agency fees and expenses | 9,970 |
| Accrued expenses | 3,782 |
| Total liabilities | $ 114,291 |
| Net Assets | $27,240,105 |
| Sources of Net Assets | |
| Paid-in capital | $ 21,337,646 |
| Distributable earnings | 5,902,459 |
| Net Assets | $27,240,105 |
| Class A Shares | |
| Net Assets | $ 17,313,669 |
| Shares Outstanding | 1,180,448 |
| Net Asset Value and Redemption Price Per Share (net assets ÷ shares of beneficial interest outstanding) | $ 14.67 |
| Maximum Offering Price Per Share (100 ÷ 94.75 of net asset value per share) | $ 15.48 |
| Class C Shares | |
| Net Assets | $ 934,289 |
| Shares Outstanding | 93,795 |
| Net Asset Value and Offering Price Per Share* (net assets ÷ shares of beneficial interest outstanding) | $ 9.96 |
| March 31, 2024 | |
| Class I Shares | |
| Net Assets | $ 8,992,147 |
| Shares Outstanding | 585,795 |
| Net Asset Value, Offering Price and Redemption Price Per Share (net assets ÷ shares of beneficial interest outstanding) | $ 15.35 |
| On sales of $50,000 or more, the offering price of Class A shares is reduced. | |
| * | Redemption price per share is equal to the net asset value less any applicable contingent deferred sales charge. |
| Six Months Ended | |
| March 31, 2024 | |
| Investment Income | |
| Dividend income (net of foreign taxes withheld of $4,678) | $ 147,670 |
| Dividend income - affiliated issuers | 6,483 |
| Securities lending income, net | 2,249 |
| Total investment income | $ 156,402 |
| Expenses | |
| Investment advisory fee | $ 96,765 |
| Administrative fee | 15,483 |
| Distribution and service fees: | |
| Class A | 20,589 |
| Class C | 4,442 |
| Trustees' fees and expenses | 689 |
| Custodian fees | 3,660 |
| Transfer agency fees and expenses | 21,960 |
| Accounting fees | 10,797 |
| Professional fees | 21,594 |
| Registration fees | 47,580 |
| Reports to shareholders | 4,209 |
| Miscellaneous | 8,935 |
| Total expenses | $ 256,703 |
| Waiver and/or reimbursement of expenses by affiliates | $ (93,525) |
| Net expenses | $ 163,178 |
| Net investment loss | $ (6,776) |
| Realized and Unrealized Gain (Loss) | |
| Net realized gain (loss): | |
| Investment securities | $ 423,306 |
| Foreign currency transactions | 979 |
| Net realized gain | $ 424,285 |
| Change in unrealized appreciation (depreciation): | |
| Investment securities | $ 3,616,815 |
| Foreign currency | (554) |
| Net change in unrealized appreciation (depreciation) | $3,616,261 |
| Net realized and unrealized gain | $4,040,546 |
| Net increase in net assets from operations | $4,033,770 |
| Six Months Ended March 31, 2024 (Unaudited) | Eleven Months Ended September 30, 2023 | Year Ended October 31, 2022 | |
| Increase (Decrease) in Net Assets | |||
| From operations: | |||
| Net investment income (loss) | $ (6,776) | $ 133,790 | $ 22,521 |
| Net realized gain (loss) | 424,285 | (217,139) | 903,135 |
| Net change in unrealized appreciation (depreciation) | 3,616,261 | 1,247,962 | (9,467,602) |
| Net increase (decrease) in net assets from operations | $ 4,033,770 | $ 1,164,613 | $ (8,541,946) |
| Distributions to shareholders: | |||
| Class A | $ (109,945) | $ (693,690) | $ (3,839,738) |
| Class C | (2,800) | (54,512) | (351,503) |
| Class I | (81,172) | (238,228) | (1,563,078) |
| Total distributions to shareholders | $ (193,917) | $ (986,430) | $ (5,754,319) |
| Capital share transactions: | |||
| Class A | $ (962,598) | $ (2,408,034) | $ (479,340) |
| Class C | (26,206) | (254,677) | (144,215) |
| Class I | 324,015 | 1,689,181 | (2,389,961) |
| Net decrease in net assets from capital share transactions | $ (664,789) | $ (973,530) | $ (3,013,516) |
| Net increase (decrease) in net assets | $ 3,175,064 | $ (795,347) | $(17,309,781) |
| Net Assets | |||
| At beginning of period | $ 24,065,041 | $ 24,860,388 | $ 42,170,169 |
| At end of period | $27,240,105 | $24,065,041 | $ 24,860,388 |
| Financial information from November 1, 2021 through the close of business on September 15, 2023 is for the Eaton Vance Global Small-Cap Equity Fund, which was reorganized into the Calvert Global Small-Cap Equity Fund as of the close of business on September 15, 2023. The Eaton Vance Global Small-Cap Equity Fund had a fiscal year-end of October 31. See Notes 1 and 10 to Financial Statements. |
| Class A | |||||||
| Six Months Ended March 31, 2024 (Unaudited) | Eleven Months Ended September 30, 2023 | Year Ended October 31, | |||||
| 2022 | 2021 | 2020 | 2019 | 2018 | |||
| Net asset value — Beginning of period | $ 12.63 | $ 12.55 | $ 18.82 | $ 13.99 | $ 14.05 | $ 13.77 | $ 14.01 |
| Income (Loss) From Operations | |||||||
| Net investment income (loss)(1) | $ (0.01) | $ 0.06 | $ 0.01 | $ (0.01) | $ 0.00(2) | $ 0.05 | $ 0.00(2) |
| Net realized and unrealized gain (loss) | 2.14 | 0.52 | (3.70) | 5.00 | 0.44 | 1.38 | 0.13 |
| Total income (loss) from operations | $ 2.13 | $ 0.58 | $ (3.69) | $ 4.99 | $ 0.44 | $ 1.43 | $ 0.13 |
| Less Distributions | |||||||
| From net investment income | $ (0.09) | $ (0.02) | $ (0.03) | $ (0.01) | $ (0.07) | $ (0.03) | $ (0.07) |
| From net realized gain | — | (0.48) | (2.55) | (0.15) | (0.43) | (1.12) | (0.30) |
| Total distributions | $ (0.09) | $ (0.50) | $ (2.58) | $ (0.16) | $ (0.50) | $ (1.15) | $ (0.37) |
| Net asset value — End of period | $ 14.67 | $ 12.63 | $ 12.55 | $ 18.82 | $ 13.99 | $ 14.05 | $ 13.77 |
| Total Return(3) | 16.90% (4) | 4.69% (4) | (22.54)% | 35.88% | 2.98% | 12.20% | 0.84% |
| Ratios/Supplemental Data | |||||||
| Net assets, end of period (000’s omitted) | $17,314 | $15,816 | $17,980 | $28,269 | $21,164 | $24,111 | $22,341 |
| Ratios (as a percentage of average daily net assets):(5)(6) | |||||||
| Total expenses | 2.04% (7) | 1.89% (7) | 1.83% | 1.65% | 1.83% | 1.93% | 1.98% |
| Net expenses | 1.31% (7)(8) | 1.35% (7)(8) | 1.35% (8) | 1.35% | 1.35% | 1.35% | 1.36% |
| Net investment income (loss) | (0.11)% (7) | 0.51% (7) | 0.05% | (0.04)% | 0.00% (9) | 0.34% | 0.01% |
| Portfolio Turnover of the Portfolio(10) | — | — | — | — | — | — | 11 %(4) |
| Portfolio Turnover of the Fund | 29% (4) | 47% (4) | 45% | 58% | 51% | 50% | 41% (4)(11) |
| (1) | Computed using average shares outstanding. |
| (2) | Amount is less than $0.005. |
| (3) | Returns are historical and are calculated by determining the percentage change in net asset value with all distributions reinvested and do not reflect the effect of sales charges, if any. |
| (4) | Not annualized. |
| (5) | Includes the Fund’s share of the Portfolio’s allocated expenses for the period while the Fund was investing in the Portfolio. |
| (6) | Total expenses do not reflect amounts reimbursed and/or waived by the adviser and certain of its affiliates, if applicable. Net expenses are net of all reductions and represent the net expenses paid by the Fund. |
| (7) | Annualized. |
| (8) | Includes a reduction by the investment adviser of a portion of its advisory fee due to the Fund’s investment in the Liquidity Fund (equal to less than 0.005% of average daily net assets for the six months ended March 31, 2024, the eleven months ended September 30, 2023 and the year ended October 31, 2022). |
| (9) | Amount is less than 0.005%. |
| (10) | Portfolio turnover represents the rate of portfolio activity for the period while the Fund was investing in the Portfolio. |
| (11) | For the period from January 22, 2018 through October 31, 2018 when the Fund was making investments directly in securities. |
| References to Portfolio herein are to Tax-Managed Global Small-Cap Portfolio, a Massachusetts business trust in which the Fund invested all of its investable assets prior to the close of business on January 19, 2018 and which had the same investment objective and policies as the Fund during such period. | |
| Financial information from November 1, 2017 through the close of business on September 15, 2023 is for the Eaton Vance Global Small-Cap Equity Fund, which was reorganized into the Calvert Global Small-Cap Equity Fund as of the close of business on September 15, 2023. The Eaton Vance Global Small-Cap Equity Fund had a fiscal year-end of October 31. See Notes 1 and 10 to Financial Statements. | |
| Class C | |||||||
| Six Months Ended March 31, 2024 (Unaudited) | Eleven Months Ended September 30, 2023 | Year Ended October 31, | |||||
| 2022 | 2021 | 2020 | 2019 | 2018 | |||
| Net asset value — Beginning of period | $ 8.58 | $ 8.72 | $ 13.87 | $ 10.42 | $ 10.59 | $ 10.69 | $ 10.97 |
| Income (Loss) From Operations | |||||||
| Net investment loss(1) | $ (0.04) | $ (0.02) | $ (0.07) | $ (0.10) | $ (0.08) | $ (0.05) | $ (0.08) |
| Net realized and unrealized gain (loss) | 1.45 | 0.36 | (2.60) | 3.71 | 0.34 | 1.03 | 0.10 |
| Total income (loss) from operations | $ 1.41 | $ 0.34 | $ (2.67) | $ 3.61 | $ 0.26 | $ 0.98 | $ 0.02 |
| Less Distributions | |||||||
| From net investment income | $ (0.03) | $ — | $ — | $ — | $ — | $ — | $ — |
| From net realized gain | — | (0.48) | (2.48) | (0.16) | (0.43) | (1.08) | (0.30) |
| Total distributions | $ (0.03) | $(0.48) | $ (2.48) | $ (0.16) | $ (0.43) | $ (1.08) | $ (0.30) |
| Net asset value — End of period | $ 9.96 | $ 8.58 | $ 8.72 | $13.87 | $10.42 | $10.59 | $10.69 |
| Total Return(2) | 16.44% (3) | 3.98% (3) | (23.12)% | 34.86% | 2.25% | 11.32% | 0.06% |
| Ratios/Supplemental Data | |||||||
| Net assets, end of period (000’s omitted) | $ 934 | $ 827 | $ 1,081 | $ 1,995 | $ 2,202 | $ 3,227 | $ 8,988 |
| Ratios (as a percentage of average daily net assets):(4)(5) | |||||||
| Total expenses | 2.79% (6) | 2.64% (6) | 2.58% | 2.40% | 2.58% | 2.68% | 2.73% |
| Net expenses | 2.06% (6)(7) | 2.10% (6)(7) | 2.10% (7) | 2.10% | 2.10% | 2.10% | 2.11% |
| Net investment loss | (0.86)% (6) | (0.24)% (6) | (0.70)% | (0.79)% | (0.75)% | (0.45)% | (0.76)% |
| Portfolio Turnover of the Portfolio(8) | — | — | — | — | — | — | 11 %(3) |
| Portfolio Turnover of the Fund | 29% (3) | 47% (3) | 45% | 58% | 51% | 50% | 41% (3)(9) |
| (1) | Computed using average shares outstanding. |
| (2) | Returns are historical and are calculated by determining the percentage change in net asset value with all distributions reinvested and do not reflect the effect of sales charges, if any. |
| (3) | Not annualized. |
| (4) | Includes the Fund’s share of the Portfolio’s allocated expenses for the period while the Fund was investing in the Portfolio. |
| (5) | Total expenses do not reflect amounts reimbursed and/or waived by the adviser and certain of its affiliates, if applicable. Net expenses are net of all reductions and represent the net expenses paid by the Fund. |
| (6) | Annualized. |
| (7) | Includes a reduction by the investment adviser of a portion of its advisory fee due to the Fund’s investment in the Liquidity Fund (equal to less than 0.005% of average daily net assets for the six months ended March 31, 2024, the eleven months ended September 30, 2023 and the year ended October 31, 2022). |
| (8) | Portfolio turnover represents the rate of portfolio activity for the period while the Fund was investing in the Portfolio. |
| (9) | For the period from January 22, 2018 through October 31, 2018 when the Fund was making investments directly in securities. |
| References to Portfolio herein are to Tax-Managed Global Small-Cap Portfolio, a Massachusetts business trust in which the Fund invested all of its investable assets prior to the close of business on January 19, 2018 and which had the same investment objective and policies as the Fund during such period. | |
| Financial information from November 1, 2017 through the close of business on September 15, 2023 is for the Eaton Vance Global Small-Cap Equity Fund, which was reorganized into the Calvert Global Small-Cap Equity Fund as of the close of business on September 15, 2023. The Eaton Vance Global Small-Cap Equity Fund had a fiscal year-end of October 31. See Notes 1 and 10 to Financial Statements. | |
| Class I | |||||||
| Six Months Ended March 31, 2024 (Unaudited) | Eleven Months Ended September 30, 2023 | Year Ended October 31, | |||||
| 2022 | 2021 | 2020 | 2019 | 2018 | |||
| Net asset value — Beginning of period | $ 13.23 | $ 13.13 | $ 19.57 | $ 14.53 | $ 14.58 | $ 14.24 | $ 14.48 |
| Income (Loss) From Operations | |||||||
| Net investment income(1) | $ 0.01 | $ 0.10 | $ 0.04 | $ 0.04 | $ 0.03 | $ 0.08 | $ 0.04 |
| Net realized and unrealized gain (loss) | 2.24 | 0.54 | (3.86) | 5.20 | 0.45 | 1.44 | 0.12 |
| Total income (loss) from operations | $ 2.25 | $ 0.64 | $ (3.82) | $ 5.24 | $ 0.48 | $ 1.52 | $ 0.16 |
| Less Distributions | |||||||
| From net investment income | $ (0.13) | $ (0.06) | $ (0.08) | $ (0.04) | $ (0.11) | $ (0.06) | $ (0.11) |
| From net realized gain | — | (0.48) | (2.54) | (0.16) | (0.42) | (1.12) | (0.29) |
| Total distributions | $ (0.13) | $ (0.54) | $ (2.62) | $ (0.20) | $ (0.53) | $ (1.18) | $ (0.40) |
| Net asset value — End of period | $15.35 | $13.23 | $ 13.13 | $ 19.57 | $14.53 | $14.58 | $14.24 |
| Total Return(2) | 17.02% (3) | 4.94% (3) | (22.34)% | 36.28% | 3.18% | 12.51% | 1.05% |
| Ratios/Supplemental Data | |||||||
| Net assets, end of period (000’s omitted) | $ 8,992 | $ 7,423 | $ 5,800 | $11,906 | $ 8,354 | $ 9,273 | $ 9,078 |
| Ratios (as a percentage of average daily net assets):(4)(5) | |||||||
| Total expenses | 1.79% (6) | 1.64% (6) | 1.58% | 1.40% | 1.58% | 1.68% | 1.73% |
| Net expenses | 1.06% (6)(7) | 1.09% (6)(7) | 1.10% (7) | 1.10% | 1.10% | 1.10% | 1.11% |
| Net investment income | 0.15% (6) | 0.76% (6) | 0.27% | 0.21% | 0.24% | 0.57% | 0.27% |
| Portfolio Turnover of the Portfolio(8) | — | — | — | — | — | — | 11 %(3) |
| Portfolio Turnover of the Fund | 29% (3) | 47% (3) | 45% | 58% | 51% | 50% | 41% (3)(9) |
| (1) | Computed using average shares outstanding. |
| (2) | Returns are historical and are calculated by determining the percentage change in net asset value with all distributions reinvested and do not reflect the effect of sales charges, if any. |
| (3) | Not annualized. |
| (4) | Includes the Fund’s share of the Portfolio’s allocated expenses for the period while the Fund was investing in the Portfolio. |
| (5) | Total expenses do not reflect amounts reimbursed and/or waived by the adviser and certain of its affiliates, if applicable. Net expenses are net of all reductions and represent the net expenses paid by the Fund. |
| (6) | Annualized. |
| (7) | Includes a reduction by the investment adviser of a portion of its advisory fee due to the Fund’s investment in the Liquidity Fund (equal to less than 0.005% of average daily net assets for the six months ended March 31, 2024, the eleven months ended September 30, 2023 and the year ended October 31, 2022). |
| (8) | Portfolio turnover represents the rate of portfolio activity for the period while the Fund was investing in the Portfolio. |
| (9) | For the period from January 22, 2018 through October 31, 2018 when the Fund was making investments directly in securities. |
| References to Portfolio herein are to Tax-Managed Global Small-Cap Portfolio, a Massachusetts business trust in which the Fund invested all of its investable assets prior to the close of business on January 19, 2018 and which had the same investment objective and policies as the Fund during such period. | |
| Financial information from November 1, 2017 through the close of business on September 15, 2023 is for the Eaton Vance Global Small-Cap Equity Fund, which was reorganized into the Calvert Global Small-Cap Equity Fund as of the close of business on September 15, 2023. The Eaton Vance Global Small-Cap Equity Fund had a fiscal year-end of October 31. See Notes 1 and 10 to Financial Statements. | |
| Asset Description | Level 1 | Level 2 | Level 3 | Total |
| Common Stocks: | ||||
| Australia | $ — | $ 707,777 | $ — | $ 707,777 |
| Belgium | — | 349,147 | — | 349,147 |
| Canada | 711,409 | — | — | 711,409 |
| France | — | 281,716 | — | 281,716 |
| Germany | — | 331,619 | — | 331,619 |
| Italy | — | 665,786 | — | 665,786 |
| Japan | 105,279 | 2,782,824 | — | 2,888,103 |
| Luxembourg | — | 17,986 | — | 17,986 |
| Netherlands | — | 512,433 | — | 512,433 |
| New Zealand | — | 129,526 | — | 129,526 |
| Norway | — | 108,998 | — | 108,998 |
| Singapore | — | 89,884 | — | 89,884 |
| Spain | — | 352,176 | — | 352,176 |
| Sweden | 144,034 | 553,860 | — | 697,894 |
| Switzerland | — | 105,977 | — | 105,977 |
| United Kingdom | 484,038 | 2,378,343 | — | 2,862,381 |
| United States | 16,364,521 | — | — | 16,364,521 |
| Total Common Stocks | $17,809,281 | $9,368,052 (1) | $ — | $27,177,333 |
| Short-Term Investments | $ 71,678 | $ — | $ — | $ 71,678 |
| Total Investments | $17,880,959 | $9,368,052 | $ — | $27,249,011 |
| (1) | Includes foreign equity securities whose values were adjusted to reflect market trading of comparable securities or other correlated instruments that occurred after the close of trading in their applicable foreign markets. |
| Average Daily Net Assets | Annual Fee Rate |
| Up to $500 million | 0.750% |
| $500 million but less than $1 billion | 0.725% |
| $1 billion but less than $2.5 billion | 0.700% |
| $2.5 billion but less than $5 billion | 0.680% |
| $5 billion and over | 0.665% |
| Aggregate cost | $21,363,857 |
| Gross unrealized appreciation | $ 6,773,758 |
| Gross unrealized depreciation | (888,604) |
| Net unrealized appreciation | $ 5,885,154 |
| Name | Value, beginning of period | Purchases | Sales proceeds | Net realized gain (loss) | Change in unrealized appreciation (depreciation) | Value, end of period | Dividend income | Shares, end of period |
| Short-Term Investments | ||||||||
| Liquidity Fund | $119,406 | $5,195,244 | $(5,242,972) | $ — | $ — | $71,678 | $6,483 | 71,678 |
| Six Months Ended March 31, 2024 (Unaudited) | Eleven Months Ended September 30, 2023 | Year Ended October 31, 2022 | ||||||
| Shares | Amount | Shares | Amount | Shares | Amount | |||
| Class A | ||||||||
| Shares sold | 28,071 | $ 387,394 | 74,948 | $ 995,709 | 77,477 | $ 1,127,641 | ||
| Reinvestment of distributions | 7,209 | 101,437 | 52,006 | 628,387 | 222,819 | 3,549,501 | ||
| Shares redeemed | (106,921) | (1,451,429) | (307,839) | (4,032,130) | (369,251) | (5,156,482) | ||
| Net decrease | (71,641) | $ (962,598) | (180,885) | $(2,408,034) | (68,955) | $ (479,340) | ||
| Class C | ||||||||
| Shares sold | 3,043 | $ 25,956 | 3,398 | $ 30,848 | 9,484 | $ 99,315 | ||
| Reinvestment of distributions | 293 | 2,800 | 6,452 | 54,455 | 31,457 | 350,428 | ||
| Shares redeemed | (5,856) | (54,962) | (37,519) | (339,980) | (60,810) | (593,958) | ||
| Net decrease | (2,520) | $ (26,206) | (27,669) | $ (254,677) | (19,869) | $ (144,215) | ||
| Class I | ||||||||
| Shares sold | 143,568 | $ 2,023,417 | 377,921 | $ 5,238,326 | 90,384 | $ 1,364,487 | ||
| Reinvestment of distributions | 5,438 | 79,990 | 17,826 | 230,131 | 92,437 | 1,537,221 | ||
| Shares redeemed | (124,216) | (1,779,392) | (276,551) | (3,779,276) | (349,307) | (5,291,669) | ||
| Net increase (decrease) | 24,790 | $ 324,015 | 119,196 | $ 1,689,181 | (166,486) | $(2,389,961) | ||
| Shares Issued | Net Assets | |
| Class A | 1,252,158 | $16,397,376 |
| Class C | 97,244 | $865,314 |
| Class I | 747,837 | $10,256,312 |
| Officers |
| Hope L. Brown Chief Compliance Officer |
| Deidre E. Walsh Secretary, Vice President and Chief Legal Officer |
| James F. Kirchner Treasurer |
| Trustees |
| Alice Gresham Bullock Chairperson |
| Cari M. Dominguez |
| Karen Fang |
| Miles D. Harper, III |
| Von M. Hughes*(1) |
| Joy V. Jones |
| Eddie Ramos |
| Anthony A. Williams |
| * Interested Trustee and President |
| (1) Mr. Hughes began serving as Trustee effective December 11, 2023. |
| U.S. Customer Privacy Notice | March 2024 |
| FACTS | WHAT DOES CALVERT DO WITH YOUR PERSONAL INFORMATION? |
| Why? | Financial companies choose how they share your personal information. Federal law gives consumers the right to limit some but not all sharing. Federal law also requires us to tell you how we collect, share, and protect your personal information. Please read this notice carefully to understand what we do. |
| What? | The types of personal information we collect and share depend on the product or service you have with us. This information can include:■ Social Security number and income ■ investment experience and risk tolerance ■ checking account information and wire transfer instructions |
| How? | All financial companies need to share customers’ personal information to run their everyday business. In the section below, we list the reasons financial companies can share their customers’ personal information; the reasons Calvert chooses to share; and whether you can limit this sharing. |
| Reasons we can share your personal information | Does Calvert share? | Can you limit this sharing? |
| For our everyday business purposes — such as to process your transactions, maintain your account(s), respond to court orders and legal investigations, or report to credit bureaus | Yes | No |
| For our marketing purposes — to offer our products and services to you | Yes | No |
| For joint marketing with other financial companies | No | We don’t share |
| For our affiliates’ everyday business purposes — information about your transactions and experiences | Yes | No* |
| For our affiliates’ everyday business purposes — information about your creditworthiness | Yes | Yes* |
| For our affiliates to market to you | Yes | Yes* |
| For nonaffiliates to market to you | No | We don’t share |
| To limit our sharing | Call toll-free 1-800-368-2745 or email: CRMPrivacy@calvert.comPlease note:If you are a new customer, we can begin sharing your information 30 days from the date we sent this notice. When you are no longer our customer, we continue to share your information as described in this notice. However, you can contact us at any time to limit our sharing. |
| Questions? | Call toll-free 1-800-368-2745 or email: CRMPrivacy@calvert.com |
| U.S. Customer Privacy Notice — continued | March 2024 |
| Who we are | |
| Who is providing this notice? | Calvert Research and Management and our investment management affiliates (“Calvert”) (see Affiliates definition below.) |
| What we do | |
| How does Calvert protect my personal information? | To protect your personal information from unauthorized access and use, we use security measures that comply with federal law. These measures include computer safeguards and secured files and buildings. We have policies governing the proper handling of customer information by personnel and requiring third parties that provide support to adhere to appropriate security standards with respect to such information. |
| How does Calvert collect my personal information? | We collect your personal information, for example, when you■ open an account or make deposits or withdrawals from your account ■ buy securities from us or make a wire transfer ■ give us your contact informationWe also collect your personal information from others, such as credit bureaus, affiliates, or other companies. |
| Why can’t I limit all sharing? | Federal law gives you the right to limit only■ sharing for affiliates’ everyday business purposes — information about your creditworthiness ■ affiliates from using your information to market to you ■ sharing for nonaffiliates to market to youState laws and individual companies may give you additional rights to limit sharing. (See below for more on your rights under state law.) |
| What happens when I limit sharing for an account I hold jointly with someone else? | Your choices will apply to everyone on your account. |
| Definitions | |
| Affiliates | Companies related by common ownership or control. They can be financial and nonfinancial companies.■ Our affiliates include registered investment advisers such as Eaton Vance Management, Eaton Vance Advisers International Ltd., Boston Management and Research, Parametric Portfolio Associates LLC, Atlanta Capital Management Company LLC, Morgan Stanley Investment Management Inc., Morgan Stanley Investment Management Co.; registered broker-dealers such as Morgan Stanley Distributors Inc. and Eaton Vance Distributors, Inc. (together, the “Investment Management Affiliates”); and companies with a Morgan Stanley name and financial companies such as Morgan Stanley Smith Barney LLC and Morgan Stanley & Co. (the “Morgan Stanley Affiliates”). |
| Nonaffiliates | Companies not related by common ownership or control. They can be financial and nonfinancial companies.■ Calvert Research and Management does not share with nonaffiliates so they can market to you. |
| Joint marketing | A formal agreement between nonaffiliated financial companies that together market financial products or services to you.■ Calvert Research and Management does not jointly market. |
| U.S. Customer Privacy Notice — continued | March 2024 |
| Other important information | |
| *PLEASE NOTE: Calvert does not share your creditworthiness information or your transactions and experiences information with the Morgan Stanley Affiliates, nor does Calvert enable the Morgan Stanley Affiliates to market to you. Your opt outs will prevent Calvert from sharing your creditworthiness information with the Investment Management Affiliates and will prevent the Investment Management Affiliates from marketing their products to you.Vermont: Except as permitted by law, we will not share personal information we collect about Vermont residents with Nonaffiliates unless you provide us with your written consent to share such information.California: Except as permitted by law, we will not share personal information we collect about California residents with Nonaffiliates and we will limit sharing such personal information with our Affiliates to comply with California privacy laws that apply to us. |
Item 2. Code of Ethics.
Not required in this filing.
Item 3. Audit Committee Financial Expert.
Not required in this filing.
Item 4. Principal Accountant Fees and Services.
Not required in this filing.
Item 5. Audit Committee of Listed Registrants.
Not applicable.
Item 6. Schedule of Investments.
Please see schedule of investments contained in the Report to Shareholders included under Item 1 of this Form N-CSR.
Item 7. Disclosure of Proxy Voting Policies and Procedures for Closed-End Management Investment Companies.
Not applicable.
Item 8. Portfolio Managers of Closed-End Management Investment Companies.
Not applicable.
Item 9. Purchases of Equity Securities by Closed-End Management Investment Company and Affiliated Purchasers.
Not applicable.
Item 10. Submission of Matters to a Vote of Security Holders.
No material changes.
Item 11. Controls and Procedures.
(a) The registrant’s principal executive and principal financial officers have concluded that the registrant’s disclosure controls and procedures (as defined in Rule 30a-3(c) under the Investment Company Act of 1940 Act, as amended (the “1940 Act”) are effective, based on the evaluation of these controls and procedures required by Rule 30a-3(b) under the 1940 Act and Rules 13a-15(b) or 15d-15(b) under the Securities Exchange Act of 1934 (“Exchange Act”), as of a date within 90 days of the filing date of this report.
(b) There was no change in the registrant’s internal control over financial reporting (as defined in Rule 30a-3(d) under the 1940 Act) that occurred during the period covered by this report that has materially affected, or is reasonably likely to materially affect, the registrant’s internal control over financial reporting.
Item 12. Disclosure of Securities Lending Activities for Closed-End Management Investment Companies
Not applicable.
Item 13. Exhibits.
| (a)(1) | Registrant’s Code of Ethics- Not applicable (please see Item 2) | |
| (a)(2)(i) | Principal Executive Officer’s Section 302 certification. | |
| (a)(2)(ii) | Principal Financial Officer’s Section 302 certification. | |
| (b) | Combined Section 906 certification. | |
Signatures
Pursuant to the requirements of the Securities Exchange Act of 1934 and the Investment Company Act of 1940, the registrant has duly caused this report to be signed on its behalf by the undersigned, thereunto duly authorized.
| Calvert Management Series | ||
| By: | /s/ Von M. Hughes | |
| Von M. Hughes | ||
| Principal Executive Officer | ||
| Date: May 22, 2024 | ||
Pursuant to the requirements of the Securities Exchange Act of 1934 and the Investment Company Act of 1940, this report has been signed below by the following persons on behalf of the registrant and in the capacities and on the dates indicated.
| By: | /s/ Von M. Hughes | |
| Von M. Hughes | ||
| Principal Executive Officer | ||
| Date: May 22, 2024 | ||
| By: | /s/ James F. Kirchner | |
| James F. Kirchner | ||
| Principal Financial Officer | ||
| Date: May 22, 2024 | ||