UNITED STATES SECURITIES AND EXCHANGE COMMISSION
Form N-CSR
CERTIFIED SHAREHOLDER REPORT OF REGISTERED
MANAGEMENT INVESTMENT COMPANIES
Investment Company Act File Number: 811-03101
CALVERT MANAGEMENT SERIES
(Exact Name of Registrant as Specified in Charter)
1825 Connecticut Avenue NW, Suite 400, Washington, DC 20009
(Address of Principal Executive Offices)
Maureen A. Gemma
Two International Place, Boston, Massachusetts 02110
(Name and Address of Agent for Services)
(202) 238-2200
(Registrant’s Telephone Number)
December 31
Date of Fiscal Year End
December 31, 2017
Date of Reporting Period
Item 1. Reports to Stockholders
Calvert Responsible Municipal Income Fund (formerly, Calvert Tax-Free Responsible Impact Bond Fund)
Calvert Absolute Return Bond Fund (formerly, Calvert Unconstrained Bond Fund)
 |  | |
| Calvert Responsible Municipal Income Fund |  | |
 |  | |
Annual Report December 31, 2017 E-Delivery Sign-Up — Details Inside |  |
Commodity Futures Trading Commission Registration. Effective December 31, 2012, the Commodity Futures Trading Commission (“CFTC”) adopted certain regulatory changes that subject registered investment companies and advisers to regulation by the CFTC if a fund invests more than a prescribed level of its assets in certain CFTC-regulated instruments (including futures, certain options and swap agreements) or markets itself as providing investment exposure to such instruments. The Fund and its adviser have claimed an exclusion from the definition of the term “commodity pool operator” under the Commodity Exchange Act. Accordingly, neither the Fund nor the adviser is subject to CFTC regulation. |
Choose Planet-friendly E-delivery! Sign up now for on-line statements, prospectuses, and fund reports. In less than five minutes you can help reduce paper mail and lower fund costs. Just go to www.calvert.com. If you already have an online account with the Calvert funds click on Login to access your Account and select the documents you would like to receive via e-mail. If you’re new to online account access, click on Login, then Register to create your user name and password. Once you’re in, click on the E-delivery sign-up on the Account Portfolio page and follow the quick, easy steps. Note: If your shares are not held directly with the Calvert funds but through a brokerage firm, you must contact your broker for electronic delivery options available through their firm. |
 | TABLE OF CONTENTS | |||
| Management’s Discussion of Fund Performance | ||||
| Performance | ||||
| Fund Profile | ||||
| Endnotes and Additional Disclosures | ||||
| Fund Expenses | ||||
| Financial Statements | ||||
| Report of Independent Registered Public Accounting Firm | ||||
| Federal Tax Information | ||||
| Management and Organization | ||||
| Important Notices | ||||
MANAGEMENT’S DISCUSSION OF FUND PERFORMANCE1
Economic and Market Conditions The 12-month period that began on January 1, 2017 was characterized by a significant flattening of the municipal bond yield curve and a rally in longer-term bonds that lasted for most of the period. As the period opened, municipal bonds were recovering from a post-election slump. Interest rates had risen and bond prices had fallen in November 2016, as markets anticipated that decreasing regulation and lower tax rates under a Trump administration could lead to stronger economic growth and higher inflation. In December 2016, however, longer-term interest rates began to reverse direction - despite a U.S. Federal Reserve (the Fed) rate hike that month and three subsequent hikes in 2017 that put upward pressure on short-term rates. Mixed U.S. economic data, including anemic inflation, put downward pressure on long-term rates that would later increase as the period wore on. After falling modestly in December 2016, long-term rates stabilized in January and February 2017 and then drifted downward from March through July 2017. In August and early September 2017, rising geopolitical tension between the U.S. and North Korea led to a “flight to quality” that drove many investors toward the perceived safety of U.S. Treasurys. As a result, long-term rates declined further as Treasury prices rallied, and through October 2017, the municipal market rallied along with Treasurys. With the Fed pushing up on the short end of the yield curve and the market pushing down on the long end, the Treasury and municipal bond yield curves flattened marginally. In the final two months of the 12-month period ended December 31, 2017, however, the municipal market experienced considerable volatility after the GOP-controlled House and Senate released and then passed new tax legislation. The most significant change for the municipal market was the elimination of an issuer’s ability to refinance debt prior to its call date through the issuance of advanced refunding bonds (which accounted for just under 20% of new issuance over the past 10 years). Consequently, December 2017 witnessed the largest-ever one-month issuance of new municipal debt, as issuers rushed to beat the December 31, 2017 deadline for issuing advanced refunding bonds. Demand, however, outweighed supply as investors sold short-maturity bonds to buy longer maturities in anticipation of significantly lower supply going forward. The net result was rising prices for longer-term debt that drove more dramatic flattening of the yield curve in the final month of the period. For the 12-month period ended December 31, 2017, the Bloomberg Barclays Municipal Bond Index,2 a broad measure of the asset class, returned 5.45%. For the period as a whole, rates rose for municipal bonds with maturities of one to four years and declined for issues with maturities of five to 30 years. The largest rate declines (and the greatest price appreciation) occurred at the long end of the yield curve, causing the curve to flatten. As many investors appeared to have a strong appetite for risk during the period, lower-rated bonds generally outperformed higher-rated issues. Across the yield curve, municipal bonds outperformed comparable U.S. Treasurys. | Fund Performance For the 12-month period ended December 31, 2017, Calvert Responsible Municipal Income Fund (the Fund) had a total return of 5.00% for Class A shares at net asset value (NAV), underperforming the 5.45% return of the Fund’s benchmark, the Bloomberg Barclays Municipal Bond Index (the Index), over the same period. The Fund’s investment objective is to provide current income exempt from regular federal income tax. The Fund seeks to do so by investing primarily in municipal obligations that operate in a manner consistent with or promote the Calvert Principles for Responsible Investment. Such investments include the funding of environmental and/or social initiatives such as projects financing education, health care, community services, housing, water, public transportation and other public purposes; and investments in well managed municipal issuers that adhere to sound financial controls and operational and financial transparency. Detractors from Fund performance versus the Index during the period included an overweight, relative to the Index, in prerefunded, or escrowed, bonds and an underweight in zero-coupon bonds, which were the best-performing coupon structure in the Index during the period. In contrast, contributors to Fund performance relative to the Index included security selection in state and local general obligation bonds, an overweight and security selection in the industrial development revenue sector, and an overweight in longer-maturity bonds. Additionally, management hedges to various degrees using Treasury futures and/or interest-rate swaps. As a risk management tactic within the Fund’s overall strategy, interest rate hedging is intended to moderate performance on both the upside and the downside of the market. During this period of positive performance by municipal bonds, the Fund’s Treasury futures hedge moderated some of the upside and thus detracted modestly from the Fund’s performance relative to the unhedged Index. | |
See Endnotes and Additional Disclosures in this report.
Past performance is no guarantee of future results. Returns are historical and are calculated by determining the percentage change in net asset value (NAV) or offering price (as applicable) with all distributions reinvested. Investment return and principal value will fluctuate so that shares, when redeemed, may be worth more or less than their original cost. Performance less than or equal to one year is cumulative. Performance is for the stated time period only; due to market volatility, the Fund's current performance may be lower or higher than quoted. Returns are before taxes unless otherwise noted. For performance as of the most recent month-end, please refer to www.calvert.com.
www.calvert.com CALVERT RESPONSIBLE MUNICIPAL INCOME FUND ANNUAL REPORT (Unaudited) 2
PERFORMANCE
Performance2,3 | ||||||||||||||
Portfolio Managers Craig R. Brandon, CFA and Cynthia J. Clemson, each of Calvert Research and Management | ||||||||||||||
| % Average Annual Total Returns | Class Inception Date | Performance Inception Date | One Year | Five Years | Ten Years | |||||||||
| Class A at NAV | 08/23/1983 | 08/23/1983 | 5.00 | % | 2.08 | % | 2.97 | % | ||||||
| Class A with 3.75% Maximum Sales Charge | — | — | 1.03 | 1.31 | 2.58 | |||||||||
| Class C at NAV | 07/15/2015 | 08/23/1983 | 4.25 | 1.70 | 2.78 | |||||||||
| Class C with 1% Maximum Sales Charge | — | — | 3.25 | 1.70 | 2.78 | |||||||||
| Class I at NAV | 07/15/2015 | 08/23/1983 | 5.35 | 2.25 | 3.05 | |||||||||
| Bloomberg Barclays Municipal Bond Index | — | — | 5.45 | % | 3.02 | % | 4.45 | % | ||||||
% Total Annual Operating Expense Ratios4 | Class A | Class C | Class I | |||||||||||
| Gross | 0.93 | % | 3.08 | % | 1.10 | % | ||||||||
| Net | 0.80 | 1.55 | 0.45 | |||||||||||
% SEC Yield5 | Class A | Class C | Class I | |||||||||||
| SEC 30-day Yield - Subsidized | 1.51 | % | 0.85 | % | 1.92 | % | ||||||||
| SEC 30-day Yield - Unsubsidized | 1.33 | 0.65 | 1.62 | |||||||||||
| Growth of $10,000 |
| This graph shows the change in value of a hypothetical investment of $10,000 in Class A of the Fund for the period indicated. For comparison, the same investment is shown in the indicated index. |
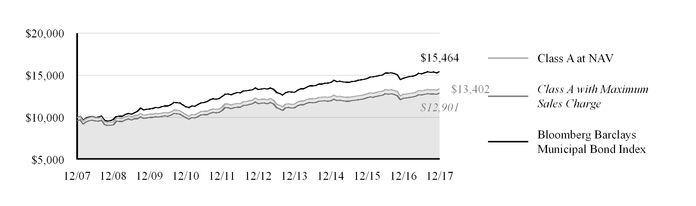
Growth of Investment3 | Amount Invested | Period Beginning | At NAV | With Maximum Sales Charge | ||||
| Class C | $10,000 | 12/31/2007 | $13,158 | N.A. | ||||
| Class I | $250,000 | 12/31/2007 | $337,835 | N.A. | ||||
See Endnotes and Additional Disclosures in this report.
Past performance is no guarantee of future results. Returns are historical and are calculated by determining the percentage change in net asset value (NAV) or offering price (as applicable) with all distributions reinvested. Investment return and principal value will fluctuate so that shares, when redeemed, may be worth more or less than their original cost. Performance less than or equal to one year is cumulative. Performance is for the stated time period only; due to market volatility, the Fund's current performance may be lower or higher than quoted. Returns are before taxes unless otherwise noted. For performance as of the most recent month-end, please refer to www.calvert.com.
3 www.calvert.com CALVERT RESPONSIBLE MUNICIPAL INCOME FUND ANNUAL REPORT (Unaudited)
FUND PROFILE
CREDIT QUALITY (% of total investments)6 | ||||||
| AAA | 21.9 | % | ||||
| AA | 56.7 | % | ||||
| A | 12.2 | % | ||||
| BBB | 2.2 | % | ||||
| BB | 3.0 | % | ||||
| CCC or Lower | 1.5 | % | ||||
| Not Rated | 2.5 | % | ||||
| Total | 100.0 | % | ||||
See Endnotes and Additional Disclosures in this report.
www.calvert.com CALVERT RESPONSIBLE MUNICIPAL INCOME FUND ANNUAL REPORT (Unaudited) 4
| Endnotes and Additional Disclosures | ||
1 The views expressed in this report are those of the portfolio manager(s) and are current only through the date stated at the top of this page. These views are subject to change at any time based upon market or other conditions, and Calvert and the Fund(s) disclaim any responsibility to update such views. These views may not be relied upon as investment advice and, because investment decisions are based on many factors, may not be relied upon as an indication of trading intent on behalf of any Calvert fund. This commentary may contain statements that are not historical facts, referred to as “forward looking statements”. The Fund’s actual future results may differ significantly from those stated in any forward looking statement, depending on factors such as changes in securities or financial markets or general economic conditions, the volume of sales and purchases of Fund shares, the continuation of investment advisory, administrative and service contracts, and other risks discussed from time to time in the Fund’s filings with the Securities and Exchange Commission. 2 Bloomberg Barclays Municipal Bond Index is an unmanaged index of municipal bonds traded in the U.S. Unless otherwise stated, index returns do not reflect the effect of any applicable sales charges, commissions, expenses, taxes or leverage, as applicable. It is not possible to invest directly in an index. Effective December 31, 2016, Calvert Research and Management (“CRM”) became the investment adviser to the Fund and performance reflected prior to such date is that of the Fund’s former investment adviser, Calvert Investment Management, Inc. 3 Total Returns at NAV do not include applicable sales charges. If sales charges were deducted, the returns would be lower. Total Returns shown with maximum sales charge reflect the stated maximum sales charge. Unless otherwise stated, performance does not reflect the deduction of taxes on Fund distributions or redemptions of Fund shares. Performance prior to the inception date of a class may be linked to the performance of an older class of the Fund. This linked performance is adjusted for any applicable sales charge, but is not adjusted for class expense differences. If adjusted for such differences, the performance would be different. The performance of Class C and Class I is linked to Class A. Performance since inception for an index, if presented, is the performance since the Fund’s or oldest share class’ inception, as applicable. Performance presented in the Financial Highlights included in the financial statements is not linked. 4 Source: Fund prospectus. Net expense ratios reflect a contractual expense reimbursement that continues through 4/30/19. Without the reimbursement, performance would have been lower. The expense ratios for the current reporting period can be found in the Financial Highlights section of this report. | 5 SEC Yield is a standardized measure based on the estimated yield to maturity of a fund’s investments over a 30-day period and is based on the maximum offer price at the date specified. The SEC Yield is not based on the distributions made by the Fund, which may differ. Subsidized yield reflects the effect of fee waivers and expense reimbursements. 6 Ratings are based on Moody’s, S&P or Fitch, as applicable. If securities are rated differently by the ratings agencies, the higher rating is applied. Ratings, which are subject to change, apply to the creditworthiness of the issuers of the underlying securities and not to the Fund or its shares. Credit ratings measure the quality of a bond based on the issuer’s creditworthiness, with ratings ranging from AAA, being the highest, to D, being the lowest based on S&P’s measures. Ratings of BBB or higher by S&P or Fitch (Baa or higher by Moody’s) are considered to be investment-grade quality. Credit ratings are based largely on the ratings agency’s analysis at the time of rating. The rating assigned to any particular security is not necessarily a reflection of the issuer’s current financial condition and does not necessarily reflect its assessment of the volatility of a security’s market value or of the liquidity of an investment in the security. Holdings designated as “Not Rated” are not rated by the national ratings agencies stated above. Fund profile subject to change due to active management. Important Notice to Shareholders Effective November 6, 2017, the name of Calvert Responsible Municipal Income Fund was changed from Calvert Tax-Free Responsible Impact Bond Fund. Effective December 8, 2017, the Fund is managed by Craig R. Brandon and Cynthia J. Clemson. In addition, effective December 8, 2017, Class Y shares of the Fund converted to Class I shares at net asset value. Thereafter, Class Y shares were terminated. | |
5 www.calvert.com CALVERT RESPONSIBLE MUNICIPAL INCOME FUND ANNUAL REPORT (Unaudited)
FUND EXPENSES
Example
As a Fund shareholder, you incur two types of costs: (1) transaction costs, including sales charges (loads) on purchases and redemption fees (if applicable); and (2) ongoing costs, including management fees; distribution and/or service fees; and other Fund expenses. This Example is intended to help you understand your ongoing costs (in dollars) of Fund investing and to compare these costs with the ongoing costs of investing in other mutual funds. The Example is based on an investment of $1,000 invested at the beginning of the period and held for the entire period (July 1, 2017 to December 31, 2017).
Actual Expenses
The first section of the table below provides information about actual account values and actual expenses. You may use the information in this section, together with the amount you invested, to estimate the expenses that you paid over the period. Simply divide your account value by $1,000 (for example, an $8,600 account value divided by $1,000 = 8.6), then multiply the result by the number in the first section under the heading entitled “Expenses Paid During Period” to estimate the expenses you paid on your account during this period.
Hypothetical Example for Comparison Purposes
The second section of the table below provides information about hypothetical account values and hypothetical expenses based on the actual Fund expense ratio and an assumed rate of return of 5% per year (before expenses), which is not the actual Fund return. The hypothetical account values and expenses may not be used to estimate the actual ending account balance or expenses you paid for the period. You may use this information to compare the ongoing costs of investing in the Fund and other funds. To do so, compare this 5% hypothetical example with the 5% hypothetical examples that appear in the shareholder reports of the other funds.
Please note that the expenses shown in the table are meant to highlight your ongoing costs only and do not reflect any transactional costs, such as sales charges (loads) or redemption fees (if applicable). Therefore, the second section of the table is useful in comparing ongoing costs only, and will not help you determine the relative total costs of owning different funds. In addition, if these transactional costs were included, your costs would be higher.
| BEGINNING ACCOUNT VALUE (7/1/17) | ENDING ACCOUNT VALUE (12/31/17) | EXPENSES PAID DURING PERIOD* (7/1/17 - 12/31/17) | ANNUALIZED EXPENSE RATIO | |
| Actual | ||||
| Class A | $1,000.00 | $1,017.40 | $4.07** | 0.80% |
| Class C | $1,000.00 | $1,013.20 | $7.87** | 1.55% |
| Class I | $1,000.00 | $1,019.10 | $2.29** | 0.45% |
| Hypothetical | ||||
| (5% return per year before expenses) | ||||
| Class A | $1,000.00 | $1,021.17 | $4.08** | 0.80% |
| Class C | $1,000.00 | $1,017.39 | $7.88** | 1.55% |
| Class I | $1,000.00 | $1,022.94 | $2.29** | 0.45% |
| * Expenses are equal to the Fund's annualized expense ratio for the indicated Class, multiplied by the average account value over the period, multiplied by 184/365 (to reflect the one-half year period). The Example assumes that the $1,000 was invested at the net asset value per share determined at the close of business on June 30, 2017. | ||||
| ** Absent a waiver and/or reimbursement of expenses by an affiliate, expenses would be higher. | ||||
www.calvert.com CALVERT RESPONSIBLE MUNICIPAL INCOME FUND ANNUAL REPORT (Unaudited) 6
CALVERT RESPONSIBLE MUNICIPAL INCOME FUND
SCHEDULE OF INVESTMENTS
DECEMBER 31, 2017
| PRINCIPAL AMOUNT ($) | VALUE ($) | |
| MUNICIPAL OBLIGATIONS - 96.8% | ||
| Bond Bank - 2.1% | ||
| Illinois Finance Authority, Clean Water Initiative Revolving Fund, 5.00%, 7/1/32 | 1,500,000 | 1,800,390 |
| Indiana Finance Authority, State Revolving Fund, Green Bonds, 5.00%, 2/1/29 | 1,000,000 | 1,264,230 |
| 3,064,620 | ||
| Education - 6.2% | ||
| Grand Valley State University, MI, 5.00%, 12/1/33 | 1,000,000 | 1,162,200 |
| Indiana Finance Authority, (Butler University), 5.00%, 2/1/31 | 1,130,000 | 1,280,177 |
| Ohio State University, 5.00%, 12/1/29 | 1,915,000 | 2,444,114 |
| Pennsylvania Higher Educational Facilities Authority, (State System of Higher Education), 4.00%, 6/15/36 | 1,550,000 | 1,641,156 |
| University of Arizona, Green Bonds, 5.00%, 6/1/42 | 2,000,000 | 2,363,820 |
| 8,891,467 | ||
| Electric Utilities - 1.4% | ||
| Trinity Public Utilities District Authority, CA, Green Bonds, 4.00%, 4/1/29 | 1,120,000 | 1,269,733 |
| Utah Associated Municipal Power Systems, 5.00%, 9/1/30 | 655,000 | 788,070 |
| 2,057,803 | ||
| Escrowed/Prerefunded - 7.1% | ||
| Montgomery County, OH, (Catholic Health Initiatives), Prerefunded to 5/1/19, 5.00%, 5/1/39 | 875,000 | 914,147 |
| New Mexico Hospital Equipment Loan Council, (Presbyterian Healthcare Services), Prerefunded to 8/1/19, 5.125%, 8/1/35 | 4,010,000 | 4,231,232 |
| North Carolina Medical Care Commission, (Duke University Health System), Prerefunded to 6/1/19, 5.00%, 6/1/42 | 3,700,000 | 3,877,452 |
| Ohio State University, Escrowed to Maturity, 5.00%, 12/1/29 | 85,000 | 108,689 |
| Washington, Prerefunded to 2/1/19, 5.00%, 2/1/23 | 1,000,000 | 1,037,050 |
| 10,168,570 | ||
| General Obligations - 25.4% | ||
| Bexar County, TX: | ||
| 4.00%, 6/15/32 | 2,000,000 | 2,194,200 |
| Prerefunded to 6/15/19, 5.00%, 6/15/35 | 3,000,000 | 3,147,810 |
| California, 4.00%, 9/1/32 | 1,000,000 | 1,107,100 |
| California, Green Bonds, 3.75%, 10/1/37 | 1,000,000 | 1,038,630 |
| California, Veterans Bonds, 3.75%, 12/1/34 | 1,500,000 | 1,576,800 |
| Connecticut, Green Bonds, 5.00%, 11/15/31 | 1,000,000 | 1,122,580 |
| Hawaii, 4.00%, 10/1/34 | 2,000,000 | 2,202,880 |
| Honolulu City and County, HI, 5.00%, 12/1/34 | 1,000,000 | 1,085,300 |
| Lake Stevens School District No. 4, WA, 4.00%, 12/1/35 | 2,460,000 | 2,681,744 |
| Longview Independent School District, TX, (PSF guaranteed), 0.00%, 2/15/18 | 500,000 | 499,160 |
| Los Rios Community College District, CA, 4.00%, 8/1/33 | 2,000,000 | 2,218,100 |
| Massachusetts, Green Bonds, 5.00%, 4/1/37 | 2,000,000 | 2,399,380 |
7 www.calvert.com CALVERT RESPONSIBLE MUNICIPAL INCOME FUND ANNUAL REPORT
| PRINCIPAL AMOUNT ($) | VALUE ($) | |
| MUNICIPAL OBLIGATIONS - CONT’D | ||
| Matanuska-Susitna Borough, AK, 4.50%, 7/1/29 | 1,670,000 | 1,926,946 |
| Mt. Lebanon School District, PA, Prerefunded to 2/15/19, 5.00%, 2/15/27 | 2,000,000 | 2,077,880 |
| New York, NY, 5.00%, 8/1/26 | 2,000,000 | 2,339,240 |
| North East Independent School District, TX, (PSF guaranteed), 5.25%, 2/1/26 | 1,000,000 | 1,242,130 |
| San Diego Unified School District, CA, (Election of 2012), Green Bonds, 5.00%, 7/1/30 | 2,000,000 | 2,489,100 |
| San Francisco Bay Area Rapid Transit District, CA, (Election of 2016): | ||
| Green Bonds, 5.00%, 8/1/33 | 1,000,000 | 1,230,890 |
| Green Bonds, 5.00%, 8/1/37 | 1,000,000 | 1,219,360 |
| Wyandotte County Unified School District No. 203, KS, 4.00%, 9/1/23 | 1,545,000 | 1,724,483 |
| Ypsilanti Community Schools, MI, 5.00%, 5/1/30 | 1,000,000 | 1,159,960 |
| 36,683,673 | ||
| Hospital - 7.2% | ||
| California Health Facilities Financing Authority, (Kaiser Permanente), Green Bonds, 5.00%, 11/1/27 | 215,000 | 271,407 |
| Highlands County Health Facilities Authority, FL, (Adventist Health System), 5.625%, 11/15/37 | 1,080,000 | 1,158,775 |
| Kansas Development Finance Authority: | ||
| (Adventist Health System), 5.50%, 11/15/29 | 1,000,000 | 1,072,760 |
| (Adventist Health System), 5.75%, 11/15/38 | 1,000,000 | 1,074,850 |
| Massachusetts Development Finance Agency, (Dana-Farber Cancer Institute), 5.00%, 12/1/34 | 500,000 | 588,795 |
| Michigan Finance Authority, (Beaumont Health Credit Group), 4.00%, 11/1/46 | 2,000,000 | 2,079,000 |
| Montgomery County, OH, (Catholic Health Initiatives), 5.00%, 5/1/39 | 1,625,000 | 1,669,070 |
| Ohio, (Cleveland Clinic Health System), 5.00%, 1/1/28 | 2,000,000 | 2,493,880 |
| 10,408,537 | ||
| Housing - 7.2% | ||
| California Municipal Finance Authority, (Caritas Corp.), Mobile Home Park Revenue, 5.00%, 8/15/28 | 1,240,000 | 1,468,557 |
| Idaho Housing and Finance Association, 3.10%, 7/1/24 | 955,000 | 1,001,251 |
| Maryland Community Development Administration, Department of Housing and Community Development: | ||
| 4.05%, 7/1/40 | 1,575,000 | 1,691,125 |
| 4.35%, 7/1/50 | 1,000,000 | 1,061,970 |
| Massachusetts Housing Finance Agency: | ||
| (AMT), 3.30%, 12/1/28 | 750,000 | 758,152 |
| (AMT), 3.85%, 6/1/28 | 110,000 | 110,158 |
| New York City Housing Development Corp., NY, 3.80%, 11/1/30 | 1,000,000 | 1,053,300 |
| North Dakota Housing Finance Agency, 2.55%, 1/1/22 | 500,000 | 512,400 |
| Pennsylvania Housing Finance Agency, 3.90%, 10/1/35 | 1,000,000 | 1,038,720 |
| Utah Housing Corp., 4.00%, 1/1/36 | 1,660,000 | 1,754,305 |
| 10,449,938 | ||
| Industrial Development Revenue - 9.4% | ||
| California Pollution Control Financing Authority, (Waste Management, Inc.), (AMT), 3.00%, 11/1/25 | 350,000 | 363,881 |
| Cobb County Development Authority, GA, (Waste Management, Inc.), 1.875% to 10/1/19 (Put Date), 4/1/33 | 1,000,000 | 1,002,990 |
| Illinois Educational Facilities Authority: | ||
| (Field Museum of Natural History), 4.00%, 11/1/36 | 1,000,000 | 1,052,080 |
| (Field Museum of Natural History), 4.45%, 11/1/36 | 1,000,000 | 1,080,980 |
www.calvert.com CALVERT RESPONSIBLE MUNICIPAL INCOME FUND ANNUAL REPORT 8
| PRINCIPAL AMOUNT ($) | VALUE ($) | |
| MUNICIPAL OBLIGATIONS - CONT’D | ||
| New Hampshire Business Finance Authority, (Casella Waste Systems, Inc.), (AMT), 4.00% to 10/1/19 (Put Date), 4/1/29 (a) | 1,180,000 | 1,178,961 |
| New York State Environmental Facilities Corp., (Casella Waste Systems, Inc.), (AMT), 3.125% to 6/1/26 (Put Date), 12/1/44 (a) | 1,000,000 | 883,260 |
| New York Transportation Development Corp., (American Airlines, Inc.), (AMT), 5.00%, 8/1/20 | 3,000,000 | 3,196,890 |
| Nez Perce County, ID, (Potlatch Corp.), 2.75%, 10/1/24 | 1,000,000 | 998,750 |
| Pennsylvania Economic Development Financing Authority, (Waste Management, Inc.), (AMT), 2.625%, 11/1/21 | 500,000 | 515,000 |
| Rhode Island Clean Water Finance Agency, Water Pollution Control Revolving Fund: | ||
| 5.00%, 10/1/30 | 1,000,000 | 1,170,890 |
| 5.00%, 10/1/31 | 1,000,000 | 1,169,700 |
| Washington Economic Development Finance Authority, (Waste Management, Inc.), 2.125%, 6/1/20 (a) | 1,000,000 | 999,640 |
| 13,613,022 | ||
| Insured - General Obligations - 4.2% | ||
| Hidalgo County Drainage District No. 1, TX, (AGC), Prerefunded to 9/1/18, 5.00%, 9/1/25 | 3,010,000 | 3,080,193 |
| Long Beach Unified School District, CA, (AGC), 0.00%, 8/1/25 | 1,000,000 | 840,890 |
| Miami-Dade County, FL, (AMBAC), 7.75%, 10/1/18 | 2,000,000 | 2,093,500 |
| 6,014,583 | ||
| Insured - Housing - 0.4% | ||
| Maryland Economic Development Corp., (University of Maryland, College Park), (AGM), 5.00%, 6/1/43 | 500,000 | 586,000 |
| Insured - Industrial Development Revenue - 0.8% | ||
| Ohio, (Portsmouth Gateway Group, LLC), (AGM), (AMT), 5.00%, 12/31/30 | 1,000,000 | 1,152,860 |
| Other Revenue - 6.8% | ||
| Build NYC Resource Corp., NY, (YMCA of Greater New York), 4.00%, 8/1/36 | 1,665,000 | 1,752,829 |
| California Infrastructure and Economic Development Bank, 5.00%, 10/1/34 | 2,000,000 | 2,382,560 |
| Connecticut Health and Educational Facilities Authority, (State Supported Child Care), 4.00%, 7/1/38 | 1,170,000 | 1,223,984 |
| Kansas City, MO, Special Obligation Bonds: | ||
| 4.00%, 10/1/34 | 500,000 | 535,380 |
| 4.00%, 10/1/35 | 600,000 | 641,598 |
| Massachusetts Water Pollution Abatement Trust, 5.25%, 8/1/29 | 1,000,000 | 1,304,260 |
| Philadelphia Redevelopment Authority, PA, (Philadelphia Neighborhood Transformation Initiative), 5.00%, 4/15/21 | 1,855,000 | 2,017,980 |
| 9,858,591 | ||
| Senior Living/Life Care - 1.7% | ||
| Miami-Dade County Industrial Development Authority, FL, (Miami Cerebral Palsy Residential Services, Inc.), 8.00%, 6/1/22 | 375,000 | 376,541 |
| Vermont Economic Development Authority, (Wake Robin Corp.), 5.00%, 5/1/24 | 1,875,000 | 2,067,994 |
| 2,444,535 | ||
9 www.calvert.com CALVERT RESPONSIBLE MUNICIPAL INCOME FUND ANNUAL REPORT
| PRINCIPAL AMOUNT ($) | VALUE ($) | |
| MUNICIPAL OBLIGATIONS - CONT’D | ||
| Special Tax Revenue - 8.7% | ||
| Central Puget Sound Regional Transit Authority, WA, Sales Tax Revenue: | ||
| Green Bonds, 4.00%, 11/1/33 | 1,100,000 | 1,200,254 |
| Green Bonds, 5.00%, 11/1/35 | 1,000,000 | 1,190,800 |
| Harris County Flood Control District, TX, Prerefunded to 10/1/20, 5.00%, 10/1/27 | 3,450,000 | 3,742,319 |
| Metropolitan Transportation Authority, NY, Dedicated Tax Revenue: | ||
| Green Bonds, Series 2017A, 5.00%, 11/15/35 | 1,000,000 | 1,203,880 |
| Green Bonds, Series 2017B, 5.00%, 11/15/35 | 2,275,000 | 2,760,644 |
| New York State Dormitory Authority, Personal Income Tax Revenue, 5.00%, 8/15/29 | 1,000,000 | 1,109,320 |
| Regional Transportation District, CO, Sales Tax Revenue, 5.00%, 11/1/32 | 1,000,000 | 1,292,270 |
| 12,499,487 | ||
| Water and Sewer - 8.2% | ||
| Austin, TX, Water & Wastewater System Revenue, 5.00%, 11/15/33 | 2,000,000 | 2,417,240 |
| Boston Water and Sewer Commission, MA, Prerefunded to 11/1/19, 5.00%, 11/1/30 | 1,000,000 | 1,060,980 |
| Cleveland, OH, Water Revenue: | ||
| 5.00%, 1/1/27 | 150,000 | 185,207 |
| 5.00%, 1/1/28 | 770,000 | 950,018 |
| East Bay Municipal Utility District, CA, Green Bonds, 5.00%, 6/1/35 | 1,000,000 | 1,226,340 |
| Indiana Finance Authority, (CWA Authority): | ||
| Green Bonds, 5.00%, 10/1/30 | 1,000,000 | 1,197,840 |
| Green Bonds, 5.00%, 10/1/36 | 1,000,000 | 1,177,190 |
| Los Angeles, CA, Wastewater System Revenue, Green Bonds, 5.00%, 6/1/38 | 1,000,000 | 1,204,750 |
| Massachusetts Water Resources Authority: | ||
| Green Bonds, 5.00%, 8/1/32 | 1,000,000 | 1,227,040 |
| Green Bonds, 5.00%, 8/1/40 | 1,000,000 | 1,191,070 |
| 11,837,675 | ||
| Total Municipal Obligations (Cost $135,278,238) | 139,731,361 | |
| TOTAL INVESTMENTS (Cost $135,278,238) - 96.8% | 139,731,361 | |
| Other assets and liabilities, net - 3.2% | 4,671,777 | |
NET ASSETS - 100.0% | 144,403,138 | |
| NOTES TO SCHEDULE OF INVESTMENTS | |
| (a) Security is exempt from registration under Rule 144A of the Securities Act of 1933. These securities may be resold in transactions exempt from registration, normally to qualified institutional buyers. Total market value of Rule 144A securities amounts to $3,061,861, which represents 2.1% of the net assets of the Fund as of December 31, 2017. | |
| Abbreviations: | |
| AGC: | Assured Guaranty Corp. |
| AGM: | Assured Guaranty Municipal Corp. |
| AMBAC: | AMBAC Financial Group, Inc. |
| AMT: | Interest earned from these securities may be considered a tax preference item for purposes of the Federal Alternative Minimum Tax. |
| PSF: | Permanent School Fund |
www.calvert.com CALVERT RESPONSIBLE MUNICIPAL INCOME FUND ANNUAL REPORT 10
At December 31, 2017, the concentration of the Fund’s investments in the various states, determined as a percentage of net assets, is as follows:
California 13.8%
Texas 11.3%
Others, representing less than 10% individually 71.7%
The Fund invests primarily in debt securities issued by municipalities. The ability of the issuers of the debt securities to meet their obligations may be affected by economic developments in a specific industry or municipality. In order to reduce the risk associated with such economic developments, at December 31, 2017, 5.5% of total investments are backed by bond insurance of various financial institutions and financial guaranty assurance agencies. The aggregate percentage insured by an individual financial institution or financial guaranty assurance agency ranged from 1.2% to 2.8% of total investments.
| FUTURES | NUMBER OF CONTRACTS | EXPIRATION MONTH/YEAR | NOTIONAL AMOUNT | VALUE/NET UNREALIZED APPRECIATION (DEPRECIATION) | ||
| Short: | ||||||
| U.S. 5-Year Treasury Note | (36) | 3/2018 | ($4,181,906) | $25,244 | ||
| U.S. 10-Year Treasury Note | (34) | 3/2018 | (4,217,594) | 12,783 | ||
| U.S. Long Treasury Bond | (35) | 3/2018 | (5,355,000) | 10,865 | ||
| Total Short | $48,892 | |||||
| See notes to financial statements. | ||||||
11 www.calvert.com CALVERT RESPONSIBLE MUNICIPAL INCOME FUND ANNUAL REPORT
CALVERT RESPONSIBLE MUNICIPAL INCOME FUND
STATEMENT OF ASSETS AND LIABILITIES
DECEMBER 31, 2017
| ASSETS | |||
| Investments in securities of unaffiliated issuers, at value (identified cost $135,278,238) | $139,731,361 | ||
| Cash | 2,205,358 | ||
| Receivable for investments sold | 1,288,333 | ||
| Receivable for capital shares sold | 28,531 | ||
| Interest receivable | 1,398,309 | ||
| Receivable from affiliate | 25,031 | ||
| Deposits at broker for futures contracts | 152,700 | ||
| Trustees' deferred compensation plan | 111,807 | ||
| Other assets | 1,552 | ||
| Total assets | 144,942,982 | ||
| LIABILITIES | |||
| Payable for variation margin on open futures contracts | 20,125 | ||
| Payable for capital shares redeemed | 253,256 | ||
| Payable to affiliates: | |||
| Investment advisory fee | 42,859 | ||
| Administrative fee | 12,214 | ||
| Distribution and service fees | 26,693 | ||
| Sub-transfer agency fee | 2,662 | ||
| Trustees' deferred compensation plan | 111,807 | ||
| Accrued expenses | 70,228 | ||
| Total liabilities | 539,844 | ||
| NET ASSETS | $144,403,138 | ||
| NET ASSETS CONSIST OF: | |||
| Paid-in capital applicable to shares of beneficial interest | |||
| (unlimited number of no par value shares authorized) | $177,287,877 | ||
| Accumulated undistributed net investment income | 105,758 | ||
| Accumulated net realized loss | (37,492,512) | ||
| Net unrealized appreciation | 4,502,015 | ||
| Total | $144,403,138 | ||
| NET ASSET VALUE PER SHARE | |||
| Class A (based on net assets of $119,970,506 and 7,541,477 shares outstanding) | $15.91 | ||
| Class C (based on net assets of $1,239,849 and 77,922 shares outstanding) | $15.91 | ||
| Class I (based on net assets of $23,192,783 and 1,455,910 shares outstanding) | $15.93 | ||
| OFFERING PRICE PER SHARE* | |||
| Class A (100/96.25 of net asset value per share) | $16.53 | ||
| * On sales of $50,000 or more, the offering price of Class A shares is reduced. | |||
| See notes to financial statements. | |||
www.calvert.com CALVERT RESPONSIBLE MUNICIPAL INCOME FUND ANNUAL REPORT 12
CALVERT RESPONSIBLE MUNICIPAL INCOME FUND
STATEMENT OF OPERATIONS
YEAR ENDED DECEMBER 31, 2017
| INVESTMENT INCOME | |||
| Interest income | $4,946,567 | ||
| Total investment income | 4,946,567 | ||
| EXPENSES | |||
| Investment advisory fee | 507,727 | ||
| Administrative fee | 174,040 | ||
| Distribution and service fees: | |||
| Class A | 315,418 | ||
| Class C | 10,499 | ||
| Trustees' fees and expenses | 7,589 | ||
| Custodian fees | 19,824 | ||
| Transfer agency fees and expenses: | |||
| Class A | 100,490 | ||
| Class C | 2,823 | ||
| Class I | 3,945 | ||
| Class Y | 7,102 | ||
| Accounting fees | 42,167 | ||
| Professional fees | 39,018 | ||
| Registration fees: | |||
| Class A | 32,418 | ||
| Class C | 10,631 | ||
| Class I | 12,918 | ||
| Class Y | 11,629 | ||
| Reports to shareholders | 21,399 | ||
| Miscellaneous | 40,296 | ||
| Total expenses | 1,359,933 | ||
| Waiver and/or reimbursement of expenses by affiliate | (240,179) | ||
| Reimbursement of expenses-other | (3,271) | ||
| Net expenses | 1,116,483 | ||
| Net investment income | 3,830,084 | ||
| REALIZED AND UNREALIZED GAIN (LOSS) | |||
| Net realized gain (loss) on: | |||
| Investment securities | 2,536,363 | ||
| Futures contracts | (264,342) | ||
| 2,272,021 | |||
| Net change in unrealized appreciation (depreciation) on: | |||
| Investment securities | 1,020,550 | ||
| Futures contracts | (25,059) | ||
| 995,491 | |||
| Net realized and unrealized gain | 3,267,512 | ||
| Net increase in net assets resulting from operations | $7,097,596 | ||
| See notes to financial statements. | |||
13 www.calvert.com CALVERT RESPONSIBLE MUNICIPAL INCOME FUND ANNUAL REPORT
CALVERT RESPONSIBLE MUNICIPAL INCOME FUND
STATEMENTS OF CHANGES IN NET ASSETS
| INCREASE (DECREASE) IN NET ASSETS | Year Ended December 31, 2017 | Year Ended December 31, 2016 | |||||
| Operations: | |||||||
| Net investment income | $3,830,084 | $4,006,823 | |||||
| Net realized gain | 2,272,021 | 1,305,600 | |||||
| Net change in unrealized appreciation (depreciation) | 995,491 | (6,098,399) | |||||
| Net increase (decrease) in net assets resulting from operations | 7,097,596 | (785,976) | |||||
| Distributions to shareholders from: | |||||||
| Net investment income: | |||||||
| Class A shares | (3,253,989) | (3,794,199) | |||||
| Class C shares | (19,750) | (18,274) | |||||
| Class I shares | (295,243) | (92,569) | |||||
| Class Y shares | (226,222) | (94,081) | |||||
| Total distributions to shareholders | (3,795,204) | (3,999,123) | |||||
| Capital share transactions: | |||||||
| Class A shares | (14,416,518) | (4,313,811) | |||||
| Class C shares | 304,951 | 697,109 | |||||
| Class I shares | 13,566,995 | 8,498,193 | |||||
| Class Y shares | (5,330,453) | 3,901,627 | |||||
| Net increase (decrease) in net assets from capital share transactions | (5,875,025) | 8,783,118 | |||||
| TOTAL INCREASE (DECREASE) IN NET ASSETS | (2,572,633) | 3,998,019 | |||||
| NET ASSETS | |||||||
| Beginning of year | 146,975,771 | 142,977,752 | |||||
| End of year (including accumulated undistributed net investment income of $105,758 and $89,414, respectively) | $144,403,138 | $146,975,771 | |||||
| See notes to financial statements. | |||||||
www.calvert.com CALVERT RESPONSIBLE MUNICIPAL INCOME FUND ANNUAL REPORT 14
CALVERT RESPONSIBLE MUNICIPAL INCOME FUND
FINANCIAL HIGHLIGHTS
| Year Ended December 31, | ||||||||||||||
| CLASS A SHARES | 2017 (a) | 2016 (a) | 2015 (a) | 2014 | 2013 | |||||||||
| Net asset value, beginning | $15.55 | $16.03 | $16.00 | $15.33 | $16.54 | |||||||||
| Income from investment operations: | ||||||||||||||
| Net investment income | 0.41 | 0.42 | 0.42 | 0.44 | 0.66 | |||||||||
| Net realized and unrealized gain (loss) | 0.36 | (0.48) | 0.03 | 0.71 | (1.34) | |||||||||
| Total from investment operations | 0.77 | (0.06) | 0.45 | 1.15 | (0.68) | |||||||||
| Distributions from: | ||||||||||||||
| Net investment income | (0.41) | (0.42) | (0.42) | (0.48) | (0.53) | |||||||||
| Total distributions | (0.41) | (0.42) | (0.42) | (0.48) | (0.53) | |||||||||
| Total increase (decrease) in net asset value | 0.36 | (0.48) | 0.03 | 0.67 | (1.21) | |||||||||
| Net asset value, ending | $15.91 | $15.55 | $16.03 | $16.00 | $15.33 | |||||||||
Total return (b) | 5.00 | % | (0.42 | %) | 2.87 | % | 7.54 | % | (4.17 | %) | ||||
Ratios to average net assets: (c) | ||||||||||||||
| Total expenses | 0.94 | % | 0.92 | % | 0.94 | % | 0.91 | % | 0.93 | % | ||||
| Net expenses | 0.80 | % | 0.80 | % | 0.88 | % | 0.91 | % | 0.93 | % | ||||
| Net investment income | 2.61 | % | 2.62 | % | 2.65 | % | 2.76 | % | 4.12 | % | ||||
| Portfolio turnover | 27 | % | 24 | % | 41 | % | 79 | % | 32 | % | ||||
| Net assets, ending (in thousands) | $119,971 | $131,474 | $140,246 | $141,251 | $138,606 | |||||||||
(a) Net investment income per share was computed using average shares outstanding. | ||||||||||||||
(b) Returns are historical and are calculated by determining the percentage change in net asset value with all distributions reinvested and do not reflect the effect of sales charges, if any. Total return is not annualized for periods of less than one year. | ||||||||||||||
(c) Total expenses do not reflect amounts reimbursed and/or waived by the Adviser and certain of its affiliates, if applicable. Net expenses are net of all reductions and represent the net expenses paid by the Fund. | ||||||||||||||
| See notes to financial statements. | ||||||||||||||
15 www.calvert.com CALVERT RESPONSIBLE MUNICIPAL INCOME FUND ANNUAL REPORT
CALVERT RESPONSIBLE MUNICIPAL INCOME FUND
FINANCIAL HIGHLIGHTS
| Year Ended December 31, | Period Ended December 31, | |||||||||
| CLASS C SHARES | 2017 | 2016 | 2015 (a) | |||||||
| Net asset value, beginning | $15.55 | $16.05 | $15.72 | |||||||
| Income from investment operations: | ||||||||||
Net investment income(b) | 0.29 | 0.30 | 0.14 | |||||||
| Net realized and unrealized gain (loss) | 0.37 | (0.49) | 0.33 | |||||||
| Total from investment operations | 0.66 | (0.19) | 0.47 | |||||||
| Distributions from: | ||||||||||
| Net investment income | (0.30) | (0.31) | (0.14) | |||||||
| Total distributions | (0.30) | (0.31) | (0.14) | |||||||
| Total increase (decrease) in net asset value | 0.36 | (0.50) | 0.33 | |||||||
| Net asset value, ending | $15.91 | $15.55 | $16.05 | |||||||
Total return (c) | 4.25 | % | (1.25 | %) | 3.03 | % | ||||
Ratios to average net assets: (d) | ||||||||||
| Total expenses | 2.87 | % | 3.08 | % | 26.80 | % | (e) | |||
| Net expenses | 1.55 | % | 1.55 | % | 1.55 | % | (e) | |||
| Net investment income | 1.84 | % | 1.86 | % | 1.94 | % | (e) | |||
| Portfolio turnover | 27 | % | 24 | % | 41 | % | ||||
| Net assets, ending (in thousands) | $1,240 | $912 | $281 | |||||||
(a) From July 15, 2015 inception. | ||||||||||
(b) Computed using average shares outstanding. | ||||||||||
(c) Returns are historical and are calculated by determining the percentage change in net asset value with all distributions reinvested and do not reflect the effect of sales charges, if any. Total return is not annualized for periods of less than one year. | ||||||||||
(d) Total expenses do not reflect amounts reimbursed and/or waived by the Adviser and certain of its affiliates, if applicable. Net expenses are net of all reductions and represent the net expenses paid by the Fund. | ||||||||||
(e) Annualized. | ||||||||||
| See notes to financial statements. | ||||||||||
www.calvert.com CALVERT RESPONSIBLE MUNICIPAL INCOME FUND ANNUAL REPORT 16
CALVERT RESPONSIBLE MUNICIPAL INCOME FUND
FINANCIAL HIGHLIGHTS
| Year Ended December 31, | Period Ended December 31, | |||||||||
| CLASS I SHARES | 2017 | 2016 | 2015 (a) | |||||||
| Net asset value, beginning | $15.57 | $16.06 | $15.72 | |||||||
| Income from investment operations: | ||||||||||
Net investment income(b) | 0.46 | 0.48 | 0.22 | |||||||
| Net realized and unrealized gain (loss) | 0.36 | (0.49) | 0.34 | |||||||
| Total from investment operations | 0.82 | (0.01) | 0.56 | |||||||
| Distributions from: | ||||||||||
| Net investment income | (0.46) | (0.48) | (0.22) | |||||||
| Total distributions | (0.46) | (0.48) | (0.22) | |||||||
| Total increase (decrease) in net asset value | 0.36 | (0.49) | 0.34 | |||||||
| Net asset value, ending | $15.93 | $15.57 | $16.06 | |||||||
Total return (c) | 5.35 | % | (0.13 | %) | 3.55 | % | ||||
Ratios to average net assets: (d) | ||||||||||
| Total expenses | 0.76 | % | 1.10 | % | 4.51 | % | (e) | |||
| Net expenses | 0.45 | % | 0.45 | % | 0.45 | % | (e) | |||
| Net investment income | 2.93 | % | 2.99 | % | 3.01 | % | (e) | |||
| Portfolio turnover | 27 | % | 24 | % | 41 | % | ||||
| Net assets, ending (in thousands) | $23,193 | $9,434 | $1,035 | |||||||
(a) From July 15, 2015 inception. | ||||||||||
(b) Computed using average shares outstanding. | ||||||||||
(c) Returns are historical and are calculated by determining the percentage change in net asset value with all distributions reinvested and do not reflect the effect of sales charges, if any. Total return is not annualized for periods of less than one year. | ||||||||||
(d) Total expenses do not reflect amounts reimbursed and/or waived by the Adviser and certain of its affiliates, if applicable. Net expenses are net of all reductions and represent the net expenses paid by the Fund. | ||||||||||
(e) Annualized. | ||||||||||
| See notes to financial statements. | ||||||||||
17 www.calvert.com CALVERT RESPONSIBLE MUNICIPAL INCOME FUND ANNUAL REPORT
NOTES TO FINANCIAL STATEMENTS
NOTE 1 — SIGNIFICANT ACCOUNTING POLICIES
Calvert Responsible Municipal Income Fund (formerly, Calvert Tax-Free Responsible Impact Bond Fund) (the Fund) is a diversified series of Calvert Management Series (the Trust). The Trust is a Massachusetts business trust registered under the Investment Company Act of 1940, as amended (the 1940 Act), as an open-end management investment company. The investment objective of the Fund is to provide current income exempt from regular federal income tax. The Fund invests primarily in municipal bonds whose issuers operate in a manner consistent with the Calvert Principles for Responsible Investment.
The Fund offers three classes of shares. Class A shares are generally sold subject to a sales charge imposed at time of purchase. A contingent deferred sales charge of 0.80% may apply to certain redemptions of Class A shares for accounts for which no sales charge was paid, if redeemed within one year of purchase. Class C shares are sold without a front-end sales charge, and with certain exceptions, are charged a contingent deferred sales charge of 1% on shares redeemed within one year of purchase. Class C shares are only available for purchase through a financial intermediary. Class I shares are sold at net asset value, are not subject to a sales charge and are sold only to certain eligible investors. The Fund previously offered Class Y shares. At the close of business on December 8, 2017, Class Y shares were merged into Class I shares. Each class represents a pro rata interest in the Fund, but votes separately on class-specific matters and is subject to different expenses.
The Fund applies the accounting and reporting guidance in the Financial Accounting Standards Board (FASB) Accounting Standards Codification Topic 946, Financial Services – Investment Companies (ASC 946). Subsequent events, if any, through the date that the financial statements were issued have been evaluated in the preparation of the financial statements.
A. Investment Valuation: Net asset value per share is determined every business day as of the close of the regular session of the New York Stock Exchange (generally 4:00 p.m. Eastern time). The Fund uses independent pricing services approved by the Board of Trustees (the Board) to value its investments wherever possible. Investments for which market quotations are not available or deemed not reliable are fair valued in good faith under the direction of the Board.
The Board has adopted Valuation Procedures (the Procedures) to determine the fair value of securities and financial instruments for which market prices are not readily available or which may not be reliably priced. The Board has delegated the day-to-day responsibility for determining the fair value of securities and financial instruments of the Fund to Calvert Research and Management (CRM), the Fund's investment adviser and has provided these Procedures to govern CRM in its valuation duties.
CRM has chartered an internal Valuation Committee to oversee the implementation of these Procedures and to assist it in carrying out the valuation responsibilities that the Board has delegated. The Valuation Committee meets on a regular basis to review investments which may not have readily available market prices. The Valuation Committee’s fair valuation determinations are subject to review, approval and ratification by the Board at its next regularly scheduled meeting covering the calendar quarter in which the fair valuation was determined.
U.S. generally accepted accounting principles (U.S. GAAP) establishes a disclosure hierarchy that categorizes the inputs to valuation techniques used to value assets and liabilities at measurement date. These inputs are summarized in the three broad levels listed below:
Level 1 - quoted prices in active markets for identical securities
Level 2 - other significant observable inputs (including quoted prices for similar securities, interest rates, prepayment speeds, credit risk, etc.)
Level 3 - significant unobservable inputs (including the Fund’s own assumptions in determining the fair value of investments)
The inputs or methodologies used for valuing securities are not necessarily an indication of the risk associated with investing in those securities.
Changes in valuation techniques may result in transfers in or out of an investment’s assigned level within the hierarchy during the period. Transfers in and/or out of levels are determined based on the fair value of such securities at the end of the period. Valuation techniques used to value the Fund’s investments by major category are as follows:
Debt Securities. Debt securities are generally valued on the basis of valuations provided by third party pricing services, as derived from such services’ pricing models. Inputs to the models may include, but are not limited to, reported trades, executable bid and asked prices, broker/dealer quotations, prices or yields of securities with similar characteristics, interest rates, anticipated prepayments, benchmark curves or information pertaining to the issuer, as well as industry and economic events. Accordingly, debt securities are generally categorized as Level 2 in the hierarchy. Short-term securities of sufficient credit quality purchased with remaining maturities of sixty days or less for which a valuation from a third party pricing service is not readily available may be valued at amortized cost, which approximates fair value, and are categorized as Level 2 in the hierarchy.
www.calvert.com CALVERT RESPONSIBLE MUNICIPAL INCOME FUND ANNUAL REPORT 18
The Calvert funds adopted amended Valuation Policies and Procedures effective June 21, 2017. The amended Valuation Policies and Procedures primarily changed from the use of bid price to the mean of the bid and asked price for debt securities and resulted in an increase in the Fund’s NAV per share of $0.027.
Derivatives. Futures contracts are valued at unrealized appreciation (depreciation) based on the settlement price established each day by the board of trade or exchange on which they are traded and are categorized as Level 1 in the hierarchy.
Fair Valuation. If a market value cannot be determined for a security using the methodologies described above, or if, in the good faith opinion of the Fund's adviser, the market value does not constitute a readily available market quotation, or if a significant event has occurred that would materially affect the value of the security, the security will be fair valued as determined in good faith by or at the direction of the Board in a manner that fairly reflects the security’s value, or the amount that the Fund might reasonably expect to receive for the security upon its current sale in the ordinary course. Each such determination is based on a consideration of relevant factors, which are likely to vary from one pricing context to another. These factors may include, but are not limited to, the type of security, the existence of any contractual restrictions on the security’s disposition, the price and extent of public trading in similar securities of the issuer or of comparable companies or entities, quotations or relevant information obtained from broker/dealers or other market participants, information obtained from the issuer, analysts, and/or the appropriate stock exchange (for exchange-traded securities), an analysis of the company’s or entity’s financial condition, and an evaluation of the forces that influence the issuer and the market(s) in which the security is purchased and sold.
The values assigned to fair value investments are based on available information and do not necessarily represent amounts that might ultimately be realized. Further, due to the inherent uncertainty of valuations of such investments, the fair values may differ significantly from the values that would have been used had an active market existed, and the differences could be material. The Valuation Committee employs various methods for calibrating these valuation approaches including a regular review of key inputs and assumptions, transactional back-testing or disposition analysis and reviews of any related market activity.
The following table summarizes the market value of the Fund's holdings as of December 31, 2017, based on the inputs used to value them:
| Investments in Securities - Assets | Level 1 | Level 2 | Level 3 | Total | ||||||||
| Municipal Obligations | $— | $139,731,361 | $— | $139,731,361 | ||||||||
| Total | $— | $139,731,361 | $— | $139,731,361 | ||||||||
| Derivative Instruments - Assets | ||||||||||||
| Futures Contracts* | $48,892 | $— | $— | $48,892 | ||||||||
| * The value listed reflects unrealized appreciation (depreciation) as shown in the Schedule of Investments. | ||||||||||||
The Fund held no investments or other financial instruments as of December 31, 2016 whose fair value was determined using Level 3 inputs. There were no transfers between Level 1 and Level 2 during the year ended December 31, 2017.
B. Investment Transactions and Income: Investment transactions for financial statement purposes are accounted for on trade date. Realized gains and losses are recorded on an identified cost basis and may include proceeds from litigation. Interest income, which includes amortization of premium and accretion of discount on debt securities, is accrued as earned.
C. Share Class Accounting: Realized and unrealized gains and losses and net investment income and losses, other than class-specific expenses, are allocated daily to each class of shares based upon the relative net assets of each class to the total net assets of the Fund. Expenses arising in connection with a specific class are charged directly to that class.
D. Futures Contracts: The Fund may enter into futures contracts to buy or sell a financial instrument for a set price at a future date. Initial margin deposits of either cash or securities as required by the broker are made upon entering into the contract. While the contract is open, daily variation margin payments are made to or received from the broker reflecting the daily change in market value of the contract and are recorded for financial reporting purposes as unrealized gains or losses by the Fund. When a futures contract is closed, a realized gain or loss is recorded equal to the difference between the opening and closing value of the contract. The risks associated with entering into futures contracts may include the possible illiquidity of the secondary market which would limit the Fund’s ability to close out a futures contract prior to the settlement date, an imperfect correlation between the value of the contracts and the underlying financial instruments, or that the counterparty will fail to perform its obligations under the contracts’ terms. Futures contracts are designed by boards of trade which are designated “contracts markets” by the Commodities Futures Trading Commission. Futures contracts trade on the contracts markets in a manner that is similar to the way a stock trades on a stock exchange, and the boards of trade, through their clearing corporations, guarantee the futures contracts against default. As a result, there is minimal counterparty credit risk to the Fund.
19 www.calvert.com CALVERT RESPONSIBLE MUNICIPAL INCOME FUND ANNUAL REPORT
E. Distributions to Shareholders: Distributions to shareholders are recorded by the Fund on ex-dividend date. Dividends from net investment income are declared and paid monthly. Distributions from net realized capital gains, if any, are paid at least annually. Distributions are determined in accordance with income tax regulations which may differ from U.S. GAAP; accordingly, periodic reclassifications are made within the Fund's capital accounts to reflect income and gains available for distribution under income tax regulations.
F. Estimates: The preparation of financial statements in conformity with U.S. GAAP requires management to make estimates and assumptions that affect the reported amounts of assets and liabilities and disclosure of contingent assets and liabilities at the date of the financial statements and the reported amounts of increases and decreases in net assets from operations during the reporting period. Actual results could differ from those estimates.
G. Indemnifications: Under the Trust’s organizational document, its officers and Trustees may be indemnified against certain liabilities and expenses arising out of the performance of their duties to the Fund. Under Massachusetts law, if certain conditions prevail, shareholders of a Massachusetts business trust (such as the Trust) could be deemed to have personal liability for the obligations of the Trust. However, the Trust’s Declaration of Trust contains an express disclaimer of liability on the part of Fund shareholders and provides that upon request, the Trust shall assume the defense on behalf of any Fund shareholders or former shareholders. Additionally, in the normal course of business, the Fund enters into agreements with service providers that may contain indemnification clauses. The Fund’s maximum exposure under these arrangements is unknown as this would involve future claims that may be made against the Fund that have not yet occurred.
H. Federal Income Taxes: No provision for federal income or excise tax is required since the Fund intends to continue to qualify as a regulated investment company under the Internal Revenue Code and to distribute substantially all of its taxable earnings.
Management has analyzed the Fund's tax positions taken for all open federal income tax years and has concluded that no provision for federal income tax is required in the Fund's financial statements. A Fund's federal tax return is subject to examination by the Internal Revenue Service for a period of three years from the date of filing.
NOTE 2 — RELATED PARTY TRANSACTIONS
The investment advisory fee is earned by CRM, a subsidiary of Eaton Vance Management (EVM), as compensation for investment advisory services rendered to the Fund. Pursuant to the investment advisory agreement, CRM receives a fee, payable monthly, at the annual rate of 0.35% of the Fund’s average daily net assets. For the year ended December 31, 2017, the investment advisory fee amounted to $507,727.
CRM has agreed to reimburse the Fund’s operating expenses to the extent that total annual operating expenses (relating to ordinary operating expenses only and excluding expenses such as brokerage commissions, acquired fund fees and expenses of unaffiliated funds, interest expense, taxes or litigation expenses) exceed 0.80%, 1.55% and 0.45% for Class A, Class C and Class I, and prior to the close of business on December 8, 2017, 0.55% for Class Y, respectively, of such class’ average daily net assets. The expense reimbursement agreement with CRM may be changed or terminated after April 30, 2019. For the year ended December 31, 2017, CRM waived or reimbursed expenses of $211,172.
The administrative fee is earned by CRM as compensation for administrative services rendered to the Fund. The fee is computed at an annual rate of 0.12% of the Fund’s average daily net assets attributable to Class A, Class C and Class I, and prior to the close of business on December 8, 2017, Class Y, and is payable monthly. CRM has agreed to contractually waive 0.02% of the administrative fee through April 30, 2018. For the year ended December 31, 2017, CRM was paid administrative fees of $174,040, of which $29,007 were waived.
The Fund has in effect a distribution plan for Class A shares (Class A Plan) pursuant to Rule 12b-1 under the 1940 Act. Pursuant to the Class A Plan, the Fund pays Eaton Vance Distributors, Inc. (EVD), an affiliate of CRM and the Fund’s principal underwriter, a distribution and service fee of 0.25% per annum of its average daily net assets attributable to Class A shares for distribution services and facilities provided to the Fund by EVD, as well as for personal services and/or the maintenance of shareholder accounts. The Fund also has in effect a distribution plan for Class C shares (Class C Plan) pursuant to Rule 12b-1 under the 1940 Act. Pursuant to the Class C Plan, the Fund pays EVD amounts equal to 0.75% per annum of its average daily net assets attributable to Class C shares for providing ongoing distribution services and facilities to the Fund. In addition, pursuant to the Class C Plan, the Fund also makes payments of service fees to EVD, financial intermediaries and other persons in amounts equal to 0.25% per annum of its average daily net assets attributable to that class. Service fees paid or accrued are for personal services and/or the maintenance of shareholder accounts. Distribution and service fees paid or accrued for the year ended December 31, 2017 amounted to $315,418 and $10,499 for Class A shares and Class C shares, respectively.
The Fund was informed that EVD received $13,405 as its portion of the sales charge on sales of Class A shares and $219 of contingent deferred sales charges paid by Fund shareholders for the year ended December 31, 2017.
www.calvert.com CALVERT RESPONSIBLE MUNICIPAL INCOME FUND ANNUAL REPORT 20
EVM provides sub-transfer agency and related services to the Fund pursuant to a Sub-Transfer Agency Support Services Agreement. For the year ended December 31, 2017, sub-transfer agency fees and expenses incurred to EVM amounted to $18,159 and are included in transfer agency fees and expenses on the Statement of Operations.
Each Trustee of the Fund who is not an employee of CRM or its affiliates receives a fee of $3,000 for each Board meeting attended in person and $2,000 for each Board meeting attended by phone plus an annual fee of $52,000, and $1,500 for each Committee meeting attended in person and $1,000 for each Committee meeting attended by phone plus an annual Committee fee of $2,500. The Board chair receives an additional $10,000 annual retainer and Committee chairs receive an additional $6,000 annual retainer. Eligible Trustees may participate in a Deferred Compensation Plan (the Plan). Amounts deferred under the Plan are treated as though equal dollar amounts had been invested in shares of the Fund or other Calvert funds selected by the Trustees. The Fund purchases shares of the funds selected equal to the dollar amounts deferred under the Plan, resulting in an asset equal to the deferred compensation liability. Obligations of the Plan are paid solely from the Fund’s assets. Trustees’ fees are allocated to each of the Calvert funds served. Salaries and fees of officers and Trustees of the Fund who are employees of CRM or its affiliates are paid by CRM. In addition, an advisory council was established to aid the Board and CRM in advancing the cause of responsible investing through original scholarship and thought leadership. The advisory council consists of CRM’s Chief Executive Officer and four additional members. Each member (other than CRM’s Chief Executive Officer) receives annual compensation of $75,000, which is being reimbursed by Calvert Investment Management, Inc. (CIM), the Calvert funds’ former investment adviser and Ameritas Holding Company for a period of up to three years through December 30, 2019. For the year ended December 31, 2017, the Fund’s allocated portion of such expense and reimbursement was $3,271, which are included in miscellaneous expense and reimbursement of expenses-other, respectively, on the Statement of Operations.
NOTE 3 — INVESTMENT ACTIVITY
During the year ended December 31, 2017, the cost of purchases and proceeds from sales of investments, other than short-term securities, were $38,839,825 and $46,393,230, respectively.
NOTE 4 — DISTRIBUTIONS TO SHAREHOLDERS AND INCOME TAX INFORMATION
The tax character of distributions declared for the years ended December 31, 2017 and December 31, 2016 was as follows:
| Year Ended December 31, | ||||||
| 2017 | 2016 | |||||
| Distributions declared from: | ||||||
| Tax-exempt income | $3,757,956 | $3,993,761 | ||||
| Ordinary income | $37,248 | $5,362 | ||||
During the year ended December 31, 2017, accumulated net realized loss was decreased by $18,536 and accumulated undistributed net investment income was decreased by $18,536 due to differences between book and tax accounting for accretion of market discount. These reclassifications had no effect on the net assets or net asset value per share of the Fund.
As of December 31, 2017, the components of distributable earnings (accumulated losses) on a tax basis were as follows:
| Undistributed tax-exempt income | $115,351 | ||
| Capital loss carryforwards and deferred capital losses | ($37,443,620) | ||
| Net unrealized appreciation (depreciation) | $4,443,530 | ||
The differences between components of distributable earnings (accumulated losses) on a tax basis and the amounts reflected in the Statement of Assets and Liabilities are primarily due to temporary book-tax differences that will reverse in a subsequent period. These differences are primarily due to futures contracts and accretion of market discount.
At December 31, 2017, the Fund, for federal income tax purposes, had capital loss carryforwards of $6,629,505 and deferred capital losses of $30,814,115 which would reduce the Fund's taxable income arising from future net realized gains on investment transactions, if any, to the extent permitted by the Internal Revenue Code, and thus would reduce the amount of distributions to shareholders, which would otherwise be necessary to relieve the Fund of any liability for federal income or excise tax. The capital loss carryforwards will expire on December 31, 2018, and their character is short-term. The deferred capital losses are treated as arising on the first day of the Fund's next taxable year and retain the same short-term or long-term character as when originally deferred. Of the deferred capital losses at December 31, 2017, $533,098 are short-term and $30,281,017 are long-term.
21 www.calvert.com CALVERT RESPONSIBLE MUNICIPAL INCOME FUND ANNUAL REPORT
Under tax regulations, capital losses incurred in taxable years beginning after December 2010 can be carried forward to offset future capital gains for an unlimited period. These losses are required to be used prior to capital loss carryforwards, which carry an expiration date. As a result of this ordering rule, capital loss carryforwards may be more likely to expire unused.
The cost and unrealized appreciation (depreciation) of investments, including open derivative contracts, of the Fund at December 31, 2017, as determined on a federal income tax basis, were as follows:
| Federal tax cost of investments | $135,287,831 | ||
| Gross unrealized appreciation | $4,830,704 | ||
| Gross unrealized depreciation | (387,174) | ||
| Net unrealized appreciation (depreciation) | $4,443,530 | ||
NOTE 5 — FINANCIAL INSTRUMENTS
A summary of futures contracts outstanding at December 31, 2017 is included in the Schedule of Investments. During the year ended December 31, 2017, the Fund used futures contracts to hedge against interest rate changes and to manage overall duration of the Fund.
At December 31, 2017, the fair value of open derivative instruments (not considered to be hedging instruments for accounting disclosure purposes) and whose primary underlying risk exposure is interest rate risk was as follows:
| Derivative | Statement of Assets and Liabilities Caption | Assets | Liabilities | |||||
| Futures contracts | Net unrealized appreciation | $48,892 | * | $— | ||||
| * Only the current day's variation margin is reported within the Statement of Assets and Liabilities as Receivable or Payable for variation margin on open futures contracts, as applicable. | ||||||||
The effect of derivative instruments (not considered to be hedging instruments for accounting disclosure purposes) on the Statement of Operations and whose primary underlying risk exposure is interest rate risk for the year ended December 31, 2017 was as follows:
| Statement of Operations Caption | ||
| Derivative | Net realized gain (loss) on futures contracts | Net change in unrealized appreciation (depreciation) on futures contracts |
| Futures contracts | ($264,342) | ($25,059) |
The average notional cost of futures contracts (short) outstanding during the year ended December 31, 2017 was approximately $13,939,000.
NOTE 6 — LINE OF CREDIT
The Fund participates with other funds managed by CRM in a $50 million ($25 million committed and $25 million uncommitted) unsecured line of credit agreement with State Street Bank and Trust Company (SSB), which is in effect through August 7, 2018. Borrowings may be made for temporary or emergency purposes only. Borrowings bear interest at the higher of the One-Month London Interbank Offered Rate (LIBOR) in effect that day or the overnight Federal Funds Rate, plus 1.25% per annum. A commitment fee of 0.25% per annum is incurred on the unused portion of the committed facility. An administrative fee of $30,000 was paid in connection with the renewal of the uncommitted facility. These fees are allocated to all participating funds. Because the line of credit is not available exclusively to the Fund, it may be unable to borrow some or all of its requested amounts at any particular time. The Fund did not have any significant borrowings or allocated fees during the year ended December 31, 2017.
www.calvert.com CALVERT RESPONSIBLE MUNICIPAL INCOME FUND ANNUAL REPORT 22
NOTE 7 — CAPITAL SHARES
Transactions in capital shares for the years ended December 31, 2017 and December 31, 2016 were as follows:
| Year Ended December 31, 2017 | Year Ended December 31, 2016 | |||||||||
| Shares | Amount | Shares | Amount | |||||||
| Class A | ||||||||||
| Shares sold | 584,100 | $9,209,015 | 1,439,544 | $23,239,142 | ||||||
| Reinvestment of distributions | 184,305 | 2,904,307 | 206,234 | 3,313,608 | ||||||
| Shares redeemed | (1,684,406) | (26,529,840) | (1,935,639) | (30,866,561) | ||||||
| Net decrease | (916,001) | ($14,416,518 | ) | (289,861) | ($4,313,811 | ) | ||||
| Class C | ||||||||||
| Shares sold | 36,344 | $573,297 | 86,312 | $1,403,351 | ||||||
| Reinvestment of distributions | 1,250 | 19,731 | 1,135 | 18,266 | ||||||
| Shares redeemed | (18,297) | (288,077) | (46,351) | (724,508) | ||||||
| Net increase | 19,297 | $304,951 | 41,096 | $697,109 | ||||||
| Class I | ||||||||||
| Shares sold | 305,407 | $4,848,106 | 708,444 | $11,213,242 | ||||||
| Reinvestment of distributions | 13,161 | 207,969 | 5,767 | 92,569 | ||||||
| Shares redeemed | (194,244) | (3,069,709) | (172,767) | (2,807,618) | ||||||
| Merger from Class Y shares | 725,662 | 11,580,629 | — | — | ||||||
| Net increase | 849,986 | $13,566,995 | 541,444 | $8,498,193 | ||||||
Class Y(a) | ||||||||||
| Shares sold | 612,980 | $9,664,771 | 297,564 | $4,767,924 | ||||||
| Reinvestment of distributions | 13,615 | 215,012 | 5,144 | 82,512 | ||||||
| Shares redeemed | (231,866) | (3,629,607) | (59,608) | (948,809) | ||||||
| Merger to Class I shares | (725,949) | (11,580,629) | — | — | ||||||
| Net increase (decrease) | (331,220) | ($5,330,453 | ) | 243,100 | $3,901,627 | |||||
| (a) Effective December 8, 2017, Class Y shares of the Fund converted to Class I shares at net asset value. Thereafter, Class Y shares were terminated. | ||||||||||
NOTE 8 — REGULATORY MATTERS
On May 2, 2017, the Securities and Exchange Commission (SEC) issued an administrative order (the Order) relating to the improper use of Calvert fund assets by CIM (the Fund’s adviser prior to December 31, 2016) and Calvert Investment Distributors, Inc. (CID), the Calvert funds’ former adviser and principal underwriter, respectively, to pay for the distribution and marketing of fund shares outside of a Rule 12b-1 plan, as well as to pay expenses in excess of fund expense caps. Pursuant to the Order, CIM and CID are required to pay $21,614,534 to affected shareholders of the Calvert funds, including the Fund’s shareholders. The distributions required to be made by CIM and CID to affected shareholders are the obligations of CIM and CID and will not have an impact on the Fund’s net assets.
NOTE 9 — NAME CHANGE
Effective November 6, 2017, the name of Calvert Responsible Municipal Income Fund was changed from Calvert Tax-Free Responsible Impact Bond Fund.
23 www.calvert.com CALVERT RESPONSIBLE MUNICIPAL INCOME FUND ANNUAL REPORT
REPORT OF INDEPENDENT REGISTERED PUBLIC ACCOUNTING FIRM
To the shareholders and board of trustees
Calvert Management Series:
Opinion on the Financial Statements
We have audited the accompanying statement of assets and liabilities of Calvert Responsible Municipal Income Fund (the “Fund”), formerly, Calvert Tax-Free Responsible Impact Bond Fund, a series of Calvert Management Series, including the schedule of investments, as of December 31, 2017, the related statement of operations for the year then ended, the statements of changes in net assets for each of the years in the two‑year period then ended, and the related notes (collectively, the “financial statements”) and the financial highlights for each of the years in the five‑year period then ended. In our opinion, the financial statements and financial highlights present fairly, in all material respects, the financial position of the Fund as of December 31, 2017, the results of its operations for the year then ended, the changes in its net assets for each of the years in the two‑year period then ended, and the financial highlights for each of the years in the five‑year period then ended, in conformity with U.S. generally accepted accounting principles.
Basis for Opinion
These financial statements and financial highlights are the responsibility of the Fund’s management. Our responsibility is to express an opinion on these financial statements and financial highlights based on our audits. We are a public accounting firm registered with the Public Company Accounting Oversight Board (United States) (“PCAOB”) and are required to be independent with respect to the Fund in accordance with the U.S. federal securities laws and the applicable rules and regulations of the Securities and Exchange Commission and the PCAOB.
We conducted our audits in accordance with the standards of the PCAOB. Those standards require that we plan and perform the audit to obtain reasonable assurance about whether the financial statements and financial highlights are free of material misstatement, whether due to error or fraud. Our audits included performing procedures to assess the risks of material misstatement of the financial statements and financial highlights, whether due to error or fraud, and performing procedures that respond to those risks. Such procedures included examining, on a test basis, evidence regarding the amounts and disclosures in the financial statements and financial highlights. Such procedures also included confirmation of securities owned as of December 31, 2017, by correspondence with custodians and brokers. Our audits also included evaluating the accounting principles used and significant estimates made by management, as well as evaluating the overall presentation of the financial statements and financial highlights. We believe that our audits provide a reasonable basis for our opinion.
/s/ KPMG LLP
We have served as the auditor of one or more of the Calvert Funds since 2002.
Philadelphia, Pennsylvania
February 23, 2018
www.calvert.com CALVERT RESPONSIBLE MUNICIPAL INCOME FUND ANNUAL REPORT 24
FEDERAL TAX INFORMATION
The Form 1099-DIV you received in February 2018 showed the tax status of all distributions paid to your account in calendar year 2017. Shareholders are advised to consult their own tax adviser with respect to the tax consequences of their investment in the Fund. As required by the Internal Revenue Code and/or regulations, shareholders must be notified regarding the status of exempt-interest dividends.
Exempt-Interest Dividends. For the fiscal year ended December 31, 2017, the Fund designates 99.02% of distributions from net investment income as an exempt-interest dividend.
25 www.calvert.com CALVERT RESPONSIBLE MUNICIPAL INCOME FUND ANNUAL REPORT (Unaudited)
MANAGEMENT AND ORGANIZATION
Fund Management. The Trustees of Calvert Management Series (the Trust) are responsible for the overall management and supervision of the Trust’s affairs. The Trustees and officers of the Trust are listed below. Except as indicated, each individual has held the office shown or other offices in the same company for the last five years. Trustees and officers of the Trust hold indefinite terms of office. The “Independent Trustees” consist of those Trustees who are not “interested persons” of the Trust, as that term is defined under the 1940 Act. The business address of each Trustee and officer, with the exception of Ms. Gemma and Mr. Kirchner, is 1825 Connecticut Avenue NW, Suite 400, Washington, DC 20009. As used below, “CRM” refers to Calvert Research and Management. Each Trustee oversees 38 funds in the Calvert fund complex. Each officer serves as an officer of certain other Calvert funds.
| Name and Year of Birth | Position with the Trust | Position Start Date | Principal Occupation(s) and Directorships During Past Five Years and Other Relevant Experience |
| Interested Trustee | |||
John H. Streur(1) 1960 | Trustee and President | 2015 | President and Chief Executive Officer of Calvert Research and Management (since December 31, 2016). President and Chief Executive Officer of Calvert Investments, Inc. (January 2015 - December 2016); Chief Executive Officer Elect of Calvert Investments, Inc. (October 2014 - January 2015); Chief Compliance Officer of Calvert Investment Distributors, Inc. (August 2015 - December 2016); Chief Compliance Officer of Calvert Investment Management (August 2015 - April 2016); President and Director, Portfolio 21 Investments, Inc. (through October 2014); President, Chief Executive Officer and Director, Managers Investment Group LLC (through January 2012); President and Director, The Managers Funds and Managers AMG Funds (through January 2012). Directorships in the Last Five Years. Portfolio 21 Investments, Inc. (asset management) (through October 2014); Managers Investment Group LLC (asset management) (through January 2012); The Managers Funds (asset management) (through January 2012); Managers AMG Funds (asset management) (through January 2012); Calvert Impact Capital, Inc. |
| Independent Trustees | |||
Richard L. Baird, Jr 1948 | Trustee | 1980 | Former President and CEO of Adagio Health Inc. (retired in 2014) in Pittsburgh, PA, a non-profit corporation which provides family planning services, nutrition, maternal/child health care, and various health screening services and community preventive health programs. Directorships in the Last Five Years. None. |
Alice Gresham Bullock(2) 1950 | Chair and Trustee | 2016 | Professor at Howard University School of Law (retired June 2016). She is former Dean of Howard University School of Law (1996-2002) and Deputy Director of the Association of American Law Schools (1992-1994). Directorships in the Last Five Years. None. |
Cari M. Dominguez(2) 1949 | Trustee | 2016 | Former Chair of the U.S. Equal Employment Opportunity Commission. Directorships in the Last Five Years. Manpower, Inc. (employment agency); Triple S Management Corporation (managed care); National Association of Corporate Directors. |
John G. Guffey, Jr. 1948 | Trustee | 1982 | President of Aurora Press Inc., a privately held publisher of trade paperbacks (since January 1997). Directorships in the Last Five Years. Calvert Impact Capital, Inc.; Calvert Ventures, LLC. |
Miles D. Harper, III(2) 1962 | Trustee | 2016 | Partner, Carr Riggs & Ingram (public accounting firm) since October 2014. Partner, Gainer Donnelly & Desroches (now Carr Riggs & Ingram) (public accounting firm), November 1999 - September 2014). Directorships in the Last Five Years. Bridgeway Funds (14) (asset management). |
Joy V. Jones(2) 1950 | Trustee | 2016 | Attorney. Directorships in the Last Five Years. Conduit Street Restaurants SUD 2 Limited; Palm Management Restaurant Corporation. |
www.calvert.com CALVERT RESPONSIBLE MUNICIPAL INCOME FUND ANNUAL REPORT (Unaudited) 26
| Name and Year of Birth | Position with the Trust | Position Start Date | Principal Occupation(s) and Directorships During Past Five Years and Other Relevant Experience |
| Independent Directors (continued) | |||
Anthony A. Williams 1951 | Trustee | 2010 | CEO and Executive Director of the Federal City Council (July 2012 to present); Senior Adviser and Independent Consultant for McKenna Long & Aldridge LLP (September 2011 to present); Executive Director of Global Government Practice at the Corporate Executive Board (January 2010 to January 2012). Directorships in the Last Five Years. Freddie Mac; Evoq Properties/ Meruelo Maddux Properties, Inc. (real estate management); Weston Solutions, Inc. (environmental services); Bipartisan Policy Center’s Debt Reduction Task Force; Chesapeake Bay Foundation; Catholic University of America; Urban Institute (research organization). |
| Principal Officers who are not Trustees | |||
| Name and Year of Birth | Position(s) with the Trust | Position Start Date | Principal Occupation(s) During Past Five Years |
Hope Brown 1973 | Chief Compliance Officer | 2014 | Chief Compliance Officer of 38 registered investment companies advised by CRM (since 2014). Vice President and Chief Compliance Officer, Wilmington Funds (2012-2014). Vice President and Senior Compliance Officer, Wilmington Trust Investment Advisors, Inc. (2010-2012). |
Maureen A. Gemma (3) 1960 | Vice President, Secretary and Chief Legal Officer | 2016 | Vice President of CRM and officer of 38 registered investment companies advised by CRM. Also Vice President of Eaton Vance Management (“EVM”) and certain of its affiliates and officer of 177 registered investment companies advised or administered by EVM. |
James F. Kirchner (3) 1967 | Treasurer | 2016 | Vice President of CRM and officer of 38 registered investment companies advised by CRM. Also Vice President of EVM and certain of its affiliates and officer of 177 registered investment companies advised or administered by EVM. |
(1) Mr. Streur is an interested person of the Fund because of his positions with the Fund’s Adviser and certain affiliates.
(2) Mmes. Bullock, Dominguez and Jones and Mr. Harper began serving as Trustees effective December 23, 2016.
(3) The business address for Ms. Gemma and Mr. Kirchner is Two International Place, Boston, MA 02110. Ms. Gemma and Mr. Kirchner began serving as Officers effective December 31, 2016.
The SAI for the Fund includes additional information about the Trustees and officers of the Fund and can be obtained without charge on Calvert’s website at www.calvert.com or by calling 1-800-368-2745.
27 www.calvert.com CALVERT RESPONSIBLE MUNICIPAL INCOME FUND ANNUAL REPORT (Unaudited)
IMPORTANT NOTICES
Privacy. The Calvert organization is committed to ensuring your financial privacy. Each of the financial institutions identified below has in effect the following policy (“Privacy Policy”) with respect to nonpublic personal information about its customers:
| • | Only such information received from you, through application forms or otherwise, and information about your Calvert fund transactions will be collected. This may include information such as name, address, social security number, tax status, account balances and transactions. |
| • | None of such information about you (or former customers) will be disclosed to anyone, except as permitted by law (which includes disclosure to employees necessary to service your account). In the normal course of servicing a customer’s account, the Calvert organization may share information with unaffiliated third parties that perform various required services such as transfer agents, custodians and broker-dealers. |
| • | Policies and procedures (including physical, electronic and procedural safeguards) are in place that are designed to protect the confidentiality of such information. |
| • | We reserve the right to change our Privacy Policy at any time upon proper notification to you. Customers may want to review our Privacy Policy periodically for changes by accessing the link on our homepage: www.calvert.com. |
Our pledge of privacy applies to the following entities within the Calvert organization: the Calvert family of funds and Calvert Research and Management. In addition, our Privacy Policy applies only to those Calvert customers who are individuals and who have a direct relationship with us. If a customer’s account (i.e., fund shares) is held in the name of a third-party financial advisor/broker-dealer, it is likely that only such advisor’s privacy policies apply to the customer. This notice supersedes all previously issued privacy disclosures. For more information about Calvert’s Privacy Policy, please call 1-800-368-2745.
Delivery of Shareholder Documents. The Securities and Exchange Commission (SEC) permits funds to deliver only one copy of shareholder documents, including prospectuses, proxy statements and shareholder reports, to fund investors with multiple accounts at the same residential or post office box address. This practice is often called “householding” and it helps eliminate duplicate mailings to shareholders. Calvert funds, or your financial advisor, may household the mailing of your documents indefinitely unless you instruct Calvert funds, or your financial advisor, otherwise. If you would prefer that your Calvert fund documents not be householded, please contact Calvert funds at 1-800-368-2745, or contact your financial advisor. Your instructions that householding not apply to delivery of your Calvert fund documents will typically be effective within 30 days of receipt by Calvert funds or your financial advisor. Separate statements will be generated for each separate account and will be householded as described above.
Portfolio Holdings. Each Calvert fund will file a schedule of portfolio holdings on Form N-Q with the SEC for the first and third quarters of each fiscal year. The Form N-Q will be available on the Calvert funds’ website at www.calvert.com, by calling Calvert funds at 1-800-368-2745 or in the EDGAR database on the SEC’s website at www.sec.gov. Form N-Q may also be reviewed and copied at the SEC’s public reference room in Washington, D.C. (call 1-800-732-0330 for information on the operation of the public reference room).
Proxy Voting. The Proxy Voting Guidelines that each Calvert fund uses to determine how to vote proxies relating to portfolio securities is provided as an Appendix to the fund’s Statement of Additional Information. The Statement of Additional Information can be obtained free of charge by calling the Calvert funds at 1-800-368-2745, by visiting the Calvert funds’ website at www.calvert.com or visiting the SEC’s website at www.sec.gov. Information regarding how a Calvert fund voted proxies relating to portfolio securities during the most recent 12-month period ended June 30 is available by calling Calvert funds, by visiting the Calvert funds’ website at www.calvert.com or by visiting the SEC’s website at www.sec.gov.
www.calvert.com CALVERT RESPONSIBLE MUNICIPAL INCOME FUND ANNUAL REPORT (Unaudited) 28
| CALVERT RESPONSIBLE MUNICIPAL INCOME FUND | |
Investment Adviser and Administrator Calvert Research and Management 1825 Connecticut Avenue NW, Suite 400 Washington, DC 20009 | Transfer Agent DST Asset Manager Solutions, Inc. (formerly known as Boston Financial Data Services, Inc. (“BFDS”)) 2000 Crown Colony Drive Quincy, MA 02169 |
Principal Underwriter* Eaton Vance Distributors, Inc. Two International Place Boston, MA 02110 (617) 482-8260 | Independent Registered Public Accounting Firm KPMG LLP 1601 Market Street Philadelphia, Pennsylvania 19103-2499 |
Custodian State Street Bank and Trust Company State Street Financial Center, One Lincoln Street Boston, MA 02111 | Fund Offices 1825 Connecticut Avenue NW, Suite 400 Washington, DC 20009 |
* FINRA BrokerCheck. Investors may check the background of their Investment Professional by contacting the Financial Industry Regulatory Authority (FINRA). FINRA BrokerCheck is a free tool to help investors check the professional background of current and former FINRA-registered securities firms and brokers. FINRA BrokerCheck is available by calling 1-800-289-9999 and at www.FINRA.org. The FINRA BrokerCheck brochure describing this program is available to investors at www.FINRA.org.
Fund shares are not insured by the FDIC and are not deposits or other obligations of, or guaranteed by, any depository institution. Shares are subject to investment risks, including possible loss of principal invested. This report is intended to provide fund information to shareholders. It is not authorized for distribution to prospective investors unless preceded or accompanied by a prospectus. Note: The information on our website is not incorporated by reference into this report; our website address is included as an inactive textual reference only. Investors should carefully consider the investment objectives, risks, charges and expenses of the Calvert funds. This and other important information is contained in the fund’s summary prospectus and prospectus, which can be obtained from your financial professional and should be read carefully before investing. You may also call Calvert funds at 800-368-2745. Printed on recycled paper. | |
| 24173 12.31.17 | |
| | |
| Calvert Absolute Return Bond Fund | | |
| | |
Annual Report December 31, 2017 E-Delivery Sign-Up — Details Inside | |
Commodity Futures Trading Commission Registration. Effective December 31, 2012, the Commodity Futures Trading Commission (“CFTC”) adopted certain regulatory changes that subject registered investment companies and advisers to regulation by the CFTC if a fund invests more than a prescribed level of its assets in certain CFTC-regulated instruments (including futures, certain options and swap agreements) or markets itself as providing investment exposure to such instruments. The Fund and its adviser have claimed an exclusion from the definition of the term “commodity pool operator” under the Commodity Exchange Act. Accordingly, neither the Fund nor the adviser is subject to CFTC regulation. |
Choose Planet-friendly E-delivery! Sign up now for on-line statements, prospectuses, and fund reports. In less than five minutes you can help reduce paper mail and lower fund costs. Just go to www.calvert.com. If you already have an online account with the Calvert funds click on Login to access your Account and select the documents you would like to receive via e-mail. If you’re new to online account access, click on Login, then Register to create your user name and password. Once you’re in, click on the E-delivery sign-up on the Account Portfolio page and follow the quick, easy steps. Note: If your shares are not held directly with the Calvert funds but through a brokerage firm, you must contact your broker for electronic delivery options available through their firm. |
| TABLE OF CONTENTS | |||
| Management’s Discussion of Fund Performance | ||||
| Performance | ||||
| Fund Profile | ||||
| Endnotes and Additional Disclosures | ||||
| Fund Expenses | ||||
| Financial Statements | ||||
| Report of Independent Registered Public Accounting Firm | ||||
| Federal Tax Information | ||||
| Management and Organization | ||||
| Important Notices | ||||
MANAGEMENT’S DISCUSSION OF FUND PERFORMANCE1
Economic and Market Conditions U.S. investment-grade fixed-income securities recorded modest gains for the 12-month period ended December 31, 2017, as the Bloomberg Barclays U.S. Aggregate Bond Index2 rose 3.54% on a total return basis. However, total returns varied widely among bond market segments within the Bloomberg Barclays U.S. Aggregate Bond Index, ranging from 6.42% for investment-grade corporate bonds to 2.31% for U.S. Treasurys and 1.55% for asset-backed securities. Early in the period, mixed U.S. economic data, along with worries that President Trump’s pro-business agenda could be delayed or derailed, put downward pressure on long-term interest rates. As a result, U.S. Treasury and corporate bond prices rose during the first half of 2017. Toward the end of the 12-month period, rising geopolitical tensions between the U.S. and North Korea and devastating hurricanes in the U.S. drove investors toward the perceived safety of U.S. Treasurys, putting further downward pressure on interest rates. However, market reaction to these issues was mild and fleeting. In September 2017, the U.S. Federal Reserve (the Fed) disclosed details of its plan to begin paring back its balance sheet, starting in October 2017, at the measured pace of $10 billion per month. In December 2017, the Fed raised its benchmark short-term interest rate for the third time in 2017 and indicated that further rate increases were likely in 2018. Despite the Fed interest rate hikes and positive U.S. economic data, U.S. Treasury bond yields remained essentially unchanged from year-end 2016. At year-end 2017, the yield on the benchmark 10-year Treasury note stood at 2.41%, down slightly from 2.44% at the end of 2016. Treasury yields briefly moved higher in December 2017 with the approval of the Republican tax package, but retreated by year-end. The persistence of flat Treasury yields amid a growing economy bred skepticism among some investors about the sharp rally in stocks and other risky assets. The strengthening economy and low Treasury yields fueled demand for investment-grade corporate bonds during the 12-month period. Consequently, credit spreads - the yield difference between corporate bonds and U.S. Treasurys of similar maturities - tightened, driving bond prices higher. Longer-maturity corporate bonds benefited the most from tightening spreads. Elsewhere in fixed-income markets, lower-quality,7 high-yield bonds returned 7.48% for the 12-month period ended December 31, 2017, as measured by the ICE BofAML U.S. High Yield Index, outperforming investment-grade corporate bonds. Municipal bonds delivered a 5.45% return for the period, as measured by the Bloomberg Barclays Municipal Bond Index. | Fund Performance For the 12-month period ended December 31, 2017, Calvert Absolute Return Bond Fund (the Fund) Class A shares at net asset value (NAV) returned 3.21%, outperforming the benchmark, the Bloomberg Barclays 1-3 Month U.S. Treasury Bill Index (the Index), which returned 0.82% for the period. Throughout the 12-month period, low volatility, accommodative central bank policies, rising corporate earnings and synchronized global expansion provided support for solid fixed-income returns. Allocations to sectors other than high-quality government securities in general contributed to Fund outperformance versus the Index as spreads - the yield difference between corporate bonds and U.S. Treasurys of similar maturities - tightened. The Fund’s allocations to securitized assets in particular, and especially to asset-backed and mortgage-backed securities, were leading contributors during the period. Given our view that valuations were stretched during the period, the Fund maintained a conservative stance within investment-grade and high-yield corporate fixed-income securities, tending to hold shorter-maturity or higher-quality securities. However, these securities offered strong yields and contributed meaningfully to the Fund’s total return. The Fund’s slightly positive duration8 was mostly beneficial as intermediate- and long-term interest rates declined. Only in the final quarter of 2017 did the Fund’s duration positioning detract from performance as short-term interest rates rose. | |
See Endnotes and Additional Disclosures in this report.
Past performance is no guarantee of future results. Returns are historical and are calculated by determining the percentage change in net asset value (NAV) or offering price (as applicable) with all distributions reinvested. Investment return and principal value will fluctuate so that shares, when redeemed, may be worth more or less than their original cost. Performance less than or equal to one year is cumulative. Performance is for the stated time period only; due to market volatility, the Fund's current performance may be lower or higher than quoted. Returns are before taxes unless otherwise noted. For performance as of the most recent month-end, please refer to www.calvert.com.
www.calvert.com CALVERT ABSOLUTE RETURN BOND FUND ANNUAL REPORT (Unaudited) 2
PERFORMANCE
Performance2,3 | ||||||||||||||
Portfolio Managers Vishal Khanduja, CFA and Brian S. Ellis, CFA, each of Calvert Research and Management | ||||||||||||||
| % Average Annual Total Returns | Class Inception Date | Performance Inception Date | One Year | Five Years | Since Inception | |||||||||
| Class A at NAV | 09/30/2014 | 09/30/2014 | 3.21 | % | — | 3.36 | % | |||||||
| Class A with 3.75% Maximum Sales Charge | — | — | -0.68 | — | 2.16 | |||||||||
| Class C at NAV | 09/30/2014 | 09/30/2014 | 2.41 | — | 2.58 | |||||||||
| Class C with 1% Maximum Sales Charge | — | — | 1.41 | — | 2.58 | |||||||||
| Class I at NAV | 09/30/2014 | 09/30/2014 | 3.59 | — | 3.78 | |||||||||
| Bloomberg Barclays 1-3 Month U.S. Treasury Bill Index | — | — | 0.82 | % | 0.23 | % | 0.34 | % | ||||||
% Total Annual Operating Expense Ratios4 | Class A | Class C | Class I | |||||||||||
| Gross | 1.14 | % | 3.27 | % | 0.69 | % | ||||||||
| Net | 1.02 | 1.77 | 0.65 | |||||||||||
% SEC Yield5 | Class A | Class C | Class I | |||||||||||
| SEC 30-day Yield - Subsidized | 2.06 | % | 1.46 | % | 2.58 | % | ||||||||
| SEC 30-day Yield - Unsubsidized | 2.02 | 1.46 | 2.36 | |||||||||||
| Growth of $10,000 |
| This graph shows the change in value of a hypothetical investment of $10,000 in Class A of the Fund for the period indicated. For comparison, the same investment is shown in the indicated index. |
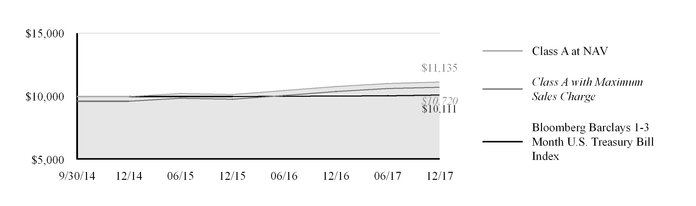
| Growth of Investment | Amount Invested | Period Beginning | At NAV | With Maximum Sales Charge | ||||
| Class C | $10,000 | 9/30/2014 | $10,865 | N.A. | ||||
| Class I | $250,000 | 9/30/2014 | $282,124 | N.A. | ||||
See Endnotes and Additional Disclosures in this report.
Past performance is no guarantee of future results. Returns are historical and are calculated by determining the percentage change in net asset value (NAV) or offering price (as applicable) with all distributions reinvested. Investment return and principal value will fluctuate so that shares, when redeemed, may be worth more or less than their original cost. Performance less than or equal to one year is cumulative. Performance is for the stated time period only; due to market volatility, the Fund's current performance may be lower or higher than quoted. Returns are before taxes unless otherwise noted. For performance as of the most recent month-end, please refer to www.calvert.com.
3 www.calvert.com CALVERT ABSOLUTE RETURN BOND FUND ANNUAL REPORT (Unaudited)
FUND PROFILE
PORTFOLIO COMPOSITION (% of total investments)6 | ||||||
| Corporate Bonds | 39.7 | % | ||||
| Asset-Backed Securities | 36.8 | % | ||||
| U.S. Treasury Obligations | 12.3 | % | ||||
| Collateralized Mortgage-Backed Obligations | 7.7 | % | ||||
| Floating Rate Loans | 1.6 | % | ||||
| Commercial Mortgage-Backed Securities | 1.5 | % | ||||
| Time Deposit | 0.4 | % | ||||
| Total | 100.0 | % | ||||
See Endnotes and Additional Disclosures in this report.
www.calvert.com CALVERT ABSOLUTE RETURN BOND FUND ANNUAL REPORT (Unaudited) 4
| Endnotes and Additional Disclosures | ||
1 The views expressed in this report are those of the portfolio manager(s) and are current only through the date stated at the top of this page. These views are subject to change at any time based upon market or other conditions, and Calvert and the Fund(s) disclaim any responsibility to update such views. These views may not be relied upon as investment advice and, because investment decisions are based on many factors, may not be relied upon as an indication of trading intent on behalf of any Calvert fund. This commentary may contain statements that are not historical facts, referred to as “forward looking statements”. The Fund’s actual future results may differ significantly from those stated in any forward looking statement, depending on factors such as changes in securities or financial markets or general economic conditions, the volume of sales and purchases of Fund shares, the continuation of investment advisory, administrative and service contracts, and other risks discussed from time to time in the Fund’s filings with the Securities and Exchange Commission.2 Bloomberg Barclays U.S. Aggregate Bond Index is an unmanaged index of domestic investment-grade bonds, including corporate, government and mortgage-backed securities. Bloomberg Barclays Municipal Bond Index is an unmanaged index of municipal bonds traded in the U.S. Bloomberg Barclays 1-3 Month U.S. Treasury Bill Index measures the performance of U.S. Treasury Bills with a maturity between one and three months. ICE BofAML U.S. High Yield Index is an unmanaged index of below-investment grade U.S. corporate bonds. ICE Data Indices, LLC indices not for redistribution or other uses; provided “as is”, without warranties, and with no liability. Eaton Vance has prepared this report, ICE Data Indices, LLC does not endorse it, or guarantee, review, or endorse Eaton Vance’s products. Unless otherwise stated, index returns do not reflect the effect of any applicable sales charges, commissions, expenses, taxes or leverage, as applicable. It is not possible to invest directly in an index.Effective December 31, 2016, Calvert Research and Management (“CRM”) became the investment adviser to the Fund and performance reflected prior to such date is that of the Fund’s former investment adviser, Calvert Investment Management, Inc. 3 Total Returns at NAV do not include applicable sales charges. If sales charges were deducted, the returns would be lower. Total Returns shown with maximum sales charge reflect the stated maximum sales charge. Unless otherwise stated, performance does not reflect the deduction of taxes on Fund distributions or redemptions of Fund shares.4 Source: Fund prospectus. Net expense ratios reflect a contractual expense reimbursement that continues through 4/30/19. Without the reimbursement, performance would have been lower. The expense ratios for the current reporting period can be found in the Financial Highlights section of this report. | 5 SEC Yield is a standardized measure based on the estimated yield to maturity of a fund’s investments over a 30-day period and is based on the maximum offer price at the date specified. The SEC Yield is not based on the distributions made by the Fund, which may differ. Subsidized yield reflects the effect of fee waivers and expense reimbursements. 6 Does not include Short Term Investment of Cash Collateral for Securities Loaned. 7 Ratings are based on Moody’s, S&P or Fitch, as applicable. If securities are rated differently by the ratings agencies, the highest rating is applied. Ratings, which are subject to change, apply to the creditworthiness of the issuers of the underlying securities and not to the Fund or its shares. Credit ratings measure the quality of a bond based on the issuer’s creditworthiness, with ratings ranging from AAA, being the highest, to D, being the lowest based on S&P’s measures. Ratings of BBB or higher by S&P or Fitch (Baa or higher by Moody’s) are considered to be investment-grade quality. Credit ratings are based largely on the ratings agency’s analysis at the time of rating. The rating assigned to any particular security is not necessarily a reflection of the issuer’s current financial condition and does not necessarily reflect its assessment of the volatility of a security’s market value or of the liquidity of an investment in the security. 8 Duration is a measure of the expected change in price of a bond — in percentage terms — given a one percent change in interest rates, all else being constant. Securities with lower durations tend to be less sensitive to interest rate changes. Fund profile subject to change due to active management. Important Notice to Shareholders Effective October 23, 2017, the BofA Merrill Lynch indices have been rebranded as Intercontinental Exchange’s (“ICE”) BofAML indices. Effective November 6, 2017, the name of Calvert Absolute Return Bond Fund was changed from Calvert Unconstrained Bond Fund. Effective December 8, 2017, Class Y shares of the Fund converted to Class I shares at net asset value. Thereafter, Class Y shares were terminated. | |
5 www.calvert.com CALVERT ABSOLUTE RETURN BOND FUND ANNUAL REPORT (Unaudited)
FUND EXPENSES
Example
As a Fund shareholder, you incur two types of costs: (1) transaction costs, including sales charges (loads) on purchases and redemption fees (if applicable); and (2) ongoing costs, including management fees; distribution and/or service fees; and other Fund expenses. This Example is intended to help you understand your ongoing costs (in dollars) of Fund investing and to compare these costs with the ongoing costs of investing in other mutual funds. The Example is based on an investment of $1,000 invested at the beginning of the period and held for the entire period (July 1, 2017 to December 31, 2017).
Actual Expenses
The first section of the table below provides information about actual account values and actual expenses. You may use the information in this section, together with the amount you invested, to estimate the expenses that you paid over the period. Simply divide your account value by $1,000 (for example, an $8,600 account value divided by $1,000 = 8.6), then multiply the result by the number in the first section under the heading entitled “Expenses Paid During Period” to estimate the expenses you paid on your account during this period.
Hypothetical Example for Comparison Purposes
The second section of the table below provides information about hypothetical account values and hypothetical expenses based on the actual Fund expense ratio and an assumed rate of return of 5% per year (before expenses), which is not the actual Fund return. The hypothetical account values and expenses may not be used to estimate the actual ending account balance or expenses you paid for the period. You may use this information to compare the ongoing costs of investing in the Fund and other funds. To do so, compare this 5% hypothetical example with the 5% hypothetical examples that appear in the shareholder reports of the other funds.
Please note that the expenses shown in the table are meant to highlight your ongoing costs only and do not reflect any transactional costs, such as sales charges (loads) or redemption fees (if applicable). Therefore, the second section of the table is useful in comparing ongoing costs only, and will not help you determine the relative total costs of owning different funds. In addition, if these transactional costs were included, your costs would be higher.
| BEGINNING ACCOUNT VALUE (7/1/17) | ENDING ACCOUNT VALUE (12/31/17) | EXPENSES PAID DURING PERIOD* (7/1/17 - 12/31/17) | ANNUALIZED EXPENSE RATIO | |
| Actual | ||||
| Class A | $1,000.00 | $1,009.60 | $5.37** | 1.06% |
| Class C | $1,000.00 | $1,005.50 | $9.10** | 1.80% |
| Class I | $1,000.00 | $1,011.00 | $3.29** | 0.65% |
| Hypothetical | ||||
| (5% return per year before expenses) | ||||
| Class A | $1,000.00 | $1,019.86 | $5.40** | 1.06% |
| Class C | $1,000.00 | $1,016.13 | $9.15** | 1.80% |
| Class I | $1,000.00 | $1,021.93 | $3.31** | 0.65% |
| * Expenses are equal to the Fund's annualized expense ratio for the indicated Class, multiplied by the average account value over the period, multiplied by 184/365 (to reflect the one-half year period). The Example assumes that the $1,000 was invested at the net asset value per share determined at the close of business on June 30, 2017. | ||||
| ** Absent a waiver and/or reimbursement of expenses by an affiliate, expenses would be higher. | ||||
www.calvert.com CALVERT ABSOLUTE RETURN BOND FUND ANNUAL REPORT (Unaudited) 6
CALVERT ABSOLUTE RETURN BOND FUND
SCHEDULE OF INVESTMENTS
DECEMBER 31, 2017
| PRINCIPAL AMOUNT ($) | VALUE ($) | |
| CORPORATE BONDS - 40.1% | ||
| Communications - 1.6% | ||
| AT&T, Inc.: | ||
| 2.303%, (3 mo. USD LIBOR + 0.89%), 2/14/23 (a) | 1,194,000 | 1,204,171 |
| 4.25%, 3/1/27 | 540,000 | 551,352 |
| 1,755,523 | ||
| Consumer, Cyclical - 8.5% | ||
| American Airlines Pass-Through Trust: | ||
| Series B, 5.25%, 7/15/25 | 151,105 | 159,696 |
| Series B, 5.60%, 1/15/22 (b) | 1,579,017 | 1,637,677 |
| Azul Investments LLP, 5.875%, 10/26/24 (b) | 290,000 | 288,912 |
| Carrols Restaurant Group, Inc., 8.00%, 5/1/22 | 600,000 | 634,500 |
| Ford Motor Credit Co. LLC: | ||
| 2.339%, (3 mo. USD LIBOR + 0.79%), 6/12/20 (a) | 725,000 | 730,006 |
| 2.875%, 10/1/18 | 3,509,000 | 3,530,281 |
| New Albertsons, Inc., 7.75%, 6/15/26 | 500,000 | 451,250 |
| Nordstrom, Inc.: | ||
| 4.00%, 3/15/27 | 185,000 | 184,606 |
| 5.00%, 1/15/44 | 270,000 | 261,021 |
| Virgin Australia Pass-Through Trust, 6.00%, 4/23/22 (b) | 668,247 | 685,789 |
| Wyndham Worldwide Corp.: | ||
| 4.15%, 4/1/24 | 395,000 | 397,298 |
| 4.50%, 4/1/27 | 367,000 | 373,518 |
| 9,334,554 | ||
| Energy - 0.7% | ||
| Oceaneering International, Inc., 4.65%, 11/15/24 | 790,000 | 769,556 |
| Financial - 18.8% | ||
| Ally Financial, Inc.: | ||
| 3.25%, 2/13/18 | 1,100,000 | 1,101,100 |
| 3.25%, 11/5/18 | 1,100,000 | 1,104,125 |
| 3.50%, 1/27/19 | 1,135,000 | 1,143,512 |
| 3.60%, 5/21/18 | 2,070,000 | 2,078,797 |
| Banco Santander S.A., 2.552%, (3 mo. USD LIBOR + 1.09%), 2/23/23 (a) | 1,165,000 | 1,172,979 |
| Bank of America Corp.: | ||
| 2.023%, (3 mo. USD LIBOR + 0.66%), 7/21/21 (a) | 1,105,000 | 1,110,663 |
| 2.543%, (3 mo. USD LIBOR + 1.18%), 10/21/22 (a) | 828,000 | 844,809 |
| Capital One NA, 2.217%, (3 mo. USD LIBOR + 0.82%), 8/8/22 (a) | 520,000 | 519,970 |
| CBL & Associates LP, 5.95%, 12/15/26 | 420,000 | 391,279 |
7 www.calvert.com CALVERT ABSOLUTE RETURN BOND FUND ANNUAL REPORT
| PRINCIPAL AMOUNT ($) | VALUE ($) | |
| CORPORATE BONDS - CONT’D | ||
| Citigroup, Inc.: | ||
| 2.315%, (3 mo. USD LIBOR + 0.95%), 7/24/23 (a) | 1,150,000 | 1,160,125 |
| 2.593%, (3 mo. USD LIBOR + 1.07%), 12/8/21 (a) | 1,000,000 | 1,016,662 |
| Credit Acceptance Corp.: | ||
| 6.125%, 2/15/21 | 500,000 | 507,500 |
| 7.375%, 3/15/23 | 80,000 | 84,200 |
| Crown Castle International Corp.: | ||
| 3.20%, 9/1/24 | 89,000 | 88,188 |
| 3.65%, 9/1/27 | 156,000 | 155,886 |
| EPR Properties, 4.50%, 6/1/27 | 310,000 | 312,260 |
| Goldman Sachs Group, Inc. (The): | ||
| 2.365%, (3 mo. USD LIBOR + 1.00%), 7/24/23 (a) | 775,000 | 782,156 |
| 2.405%, (3 mo. USD LIBOR + 0.73%), 12/27/20 (a) | 2,300,000 | 2,309,132 |
| 2.876% to 10/31/21, 10/31/22 (c) | 413,000 | 411,993 |
| 3.691% to 6/5/27, 6/5/28 (c) | 260,000 | 263,996 |
| Morgan Stanley: | ||
| 2.213%, (3 mo. USD LIBOR + 0.80%), 2/14/20 (a) | 1,000,000 | 1,004,151 |
| 2.293%, (3 mo. USD LIBOR + 0.93%), 7/22/22 (a) | 775,000 | 781,621 |
| OneMain Financial Holdings LLC, 6.75%, 12/15/19 (b) | 525,000 | 542,483 |
| SBA Communications Corp., 4.00%, 10/1/22 (b) | 388,000 | 390,425 |
| Synchrony Financial: | ||
| 2.615%, (3 mo. USD LIBOR + 1.23%), 2/3/20 (a) | 720,000 | 730,355 |
| 3.00%, 8/15/19 | 422,000 | 425,052 |
| VFH Parent LLC / Orchestra Co-Issuer, Inc., 6.75%, 6/15/22 (b) | 222,000 | 234,210 |
| 20,667,629 | ||
| Technology - 10.5% | ||
| Dell International LLC / EMC Corp.: | ||
| 3.48%, 6/1/19 (b) | 975,000 | 987,466 |
| 4.42%, 6/15/21 (b) | 240,000 | 250,256 |
| DXC Technology Co., 2.431%, (3 mo. USD LIBOR + 0.95%), 3/1/21 (a) | 2,100,000 | 2,105,336 |
| EMC Corp., 1.875%, 6/1/18 | 4,786,000 | 4,763,603 |
| Hewlett Packard Enterprise Co., 2.85%, 10/5/18 | 947,000 | 951,736 |
| NXP BV / NXP Funding LLC: | ||
| 3.875%, 9/1/22 (b) | 330,000 | 334,538 |
| 4.125%, 6/1/21 (b) | 200,000 | 204,500 |
| 4.625%, 6/15/22 (b) | 560,000 | 587,300 |
| 4.625%, 6/1/23 (b) | 300,000 | 314,550 |
| Seagate HDD Cayman, 4.875%, 6/1/27 | 1,020,000 | 976,836 |
| 11,476,121 | ||
| Total Corporate Bonds (Cost $43,888,122) | 44,003,383 | |
www.calvert.com CALVERT ABSOLUTE RETURN BOND FUND ANNUAL REPORT 8
| PRINCIPAL AMOUNT ($) | VALUE ($) | |
| ASSET-BACKED SECURITIES - 37.2% | ||
| Automobile - 0.6% | ||
| Avis Budget Rental Car Funding LLC, Series 2013-1A, Class B, 2.62%, 9/20/19 (b) | 290,000 | 290,406 |
| Skopos Auto Receivables Trust, Series 2015-1A, Class B, 5.43%, 12/15/23 (b) | 378,332 | 380,215 |
| 670,621 | ||
| Consumer Loan - 20.7% | ||
| Citi Held For Asset Issuance: | ||
| Series 2015-PM1, Class C, 5.01%, 12/15/21 (b) | 2,827,870 | 2,861,656 |
| Series 2015-PM2, Class B, 4.00%, 3/15/22 (b) | 316,389 | 316,989 |
| Series 2015-PM3, Class B, 4.31%, 5/16/22 (b) | 424,661 | 426,331 |
| Series 2016-MF1, Class A, 4.48%, 8/15/22 (b) | 254,923 | 256,391 |
| Conn Funding II LP: | ||
| Series 2016-B, Class B, 7.34%, 3/15/19 (b) | 870,825 | 878,146 |
| Series 2017-B, Class A, 2.73%, 7/15/20 (b) | 425,000 | 424,857 |
| Series 2017-B, Class B, 4.52%, 11/15/20 (b) | 690,000 | 690,559 |
| Consumer Credit Origination Loan Trust, Series 2015-1, Class B, 5.21%, 3/15/21 (b) | 109,020 | 109,079 |
| Consumer Loan Underlying Bond Credit Trust: | ||
| Series 2017-NP1, Class A, 2.39%, 4/17/23 (b) | 429,888 | 430,370 |
| Series 2017-P1, Class A, 2.42%, 9/15/23 (b) | 3,179,546 | 3,178,406 |
| Series 2017-P2, Class A, 2.61%, 1/15/24 (b) | 430,000 | 430,101 |
| Marlette Funding Trust: | ||
| Series 2017-1A, Class B, 4.114%, 3/15/24 (b) | 750,000 | 761,705 |
| Series 2017-3A, Class A, 2.36%, 12/15/24 (b) | 322,819 | 322,754 |
| Murray Hill Marketplace Trust, Series 2016-LC1, Class B, 6.15%, 11/25/22 (b) | 2,150,000 | 2,183,516 |
| OneMain Financial Issuance Trust: | ||
| Series 2014-2A, Class A, 2.47%, 9/18/24 (b) | 102,427 | 102,573 |
| Series 2014-2A, Class B, 3.02%, 9/18/24 (b) | 1,195,000 | 1,197,027 |
| Series 2015-2A, Class A, 2.57%, 7/18/25 (b) | 534,550 | 534,870 |
| Oportun Funding II LLC, Series 2016-A, Class A, 4.70%, 3/8/21 (b) | 1,620,000 | 1,634,494 |
| Prosper Marketplace Issuance Trust: | ||
| Series 2017-1A, Class A, 2.56%, 6/15/23 (b) | 802,719 | 805,427 |
| Series 2017-1A, Class B, 3.65%, 6/15/23 (b) | 1,400,000 | 1,413,229 |
| Series 2017-2A, Class A, 2.41%, 9/15/23 (b) | 814,765 | 815,799 |
| Series 2017-2A, Class B, 3.48%, 9/15/23 (b) | 550,000 | 551,918 |
| Series 2017-3A, Class A, 2.36%, 11/15/23 (b) | 1,787,614 | 1,789,096 |
| RenewFund Receivables Trust, Series 2015-1, Class A, 3.51%, 4/15/25 (b) | 41,259 | 41,124 |
| SpringCastle America Funding LLC, Series 2016-AA, Class A, 3.05%, 4/25/29 (b) | 492,693 | 496,365 |
| 22,652,782 | ||
| Other - 5.4% | ||
| Colony Starwood Homes Trust: | ||
| Series 2016-1A, Class C, 4.11%, (1 mo. USD LIBOR + 2.65%), 7/17/33 (a)(b) | 1,000,000 | 1,014,563 |
| Series 2016-1A, Class D, 4.56%, (1 mo. USD LIBOR + 3.10%), 7/17/33 (a)(b) | 960,000 | 985,025 |
| GMAT Trust, Series 2015-1A, Class A1, 4.25% to 9/25/18, 9/25/20 (b)(d) | 186,725 | 188,255 |
| InSite Issuer LLC, Series 2016-1A, Class C, 6.414%, 11/15/46 (b) | 200,000 | 204,960 |
9 www.calvert.com CALVERT ABSOLUTE RETURN BOND FUND ANNUAL REPORT
| PRINCIPAL AMOUNT ($) | VALUE ($) | |
| ASSET-BACKED SECURITIES - CONT’D | ||
| Invitation Homes Trust: | ||
| Series 2015-SFR1, Class D, 4.46%, (1 mo. USD LIBOR + 3.00%), 3/17/32 (a)(b) | 480,000 | 485,087 |
| Series 2015-SFR2, Class E, 4.641%, (1 mo. USD LIBOR + 3.15%), 6/17/32 (a)(b) | 100,000 | 101,148 |
| Series 2015-SFR2, Class F, 5.191%, (1 mo. USD LIBOR + 3.70%), 6/17/32 (a)(b) | 350,000 | 354,716 |
| Series 2017-SFR2, Class D, 3.05%, (1 mo. USD LIBOR + 1.80%), 12/17/36 (a)(b) | 353,000 | 356,690 |
| Sierra Timeshare Receivables Funding LLC: | ||
| Series 2013-1A, Class B, 2.39%, 11/20/29 (b) | 7,704 | 7,702 |
| Series 2014-1A, Class B, 2.42%, 3/20/30 (b) | 43,153 | 43,070 |
| Series 2014-2A, Class B, 2.40%, 6/20/31 (b) | 321,060 | 320,104 |
| Series 2014-3A, Class B, 2.80%, 10/20/31 (b) | 80,816 | 80,709 |
| Series 2015-3A, Class B, 3.08%, 9/20/32 (b) | 269,491 | 268,726 |
| SolarCity LMC: | ||
| Series 2014-1, Class A, 4.59%, 4/20/44 (b) | 323,489 | 329,926 |
| Series 2014-2, Class A, 4.02%, 7/20/44 (b) | 87,184 | 84,127 |
| Series 2014-2, Class B, 5.44%, 7/20/44 (b) | 268,763 | 253,898 |
| Thunderbolt Aircraft Lease Ltd.: | ||
| Series 2017-A, Class B, 5.75% to 4/15/24, 5/17/32 (b)(d) | 239,583 | 242,066 |
| Series 2017-A, Class C, 4.50%, 5/17/32 (b) | 664,583 | 627,695 |
| 5,948,467 | ||
| Student Loan - 0.0% (e) | ||
| Commonbond Student Loan Trust, Series 2015-A, Class A, 3.20%, 6/25/32 (b) | 31,051 | 31,356 |
| Whole Business - 10.5% | ||
| CKE Restaurant Holdings, Inc., Series 2013-1A, Class A2, 4.474%, 3/20/43 (b) | 1,830,089 | 1,834,803 |
| Coinstar Funding LLC, Series 2017-1A, Class A2, 5.216%, 4/25/47 (b) | 666,650 | 693,072 |
| DB Master Finance LLC: | ||
| Series 2015-1A, Class A2II, 3.98%, 2/20/45 (b) | 1,556,000 | 1,590,652 |
| Series 2017-1A, Class A2I, 3.629%, 11/20/47 (b) | 150,000 | 151,165 |
| Driven Brands Funding LLC: | ||
| Series 2015-1A, Class A2, 5.216%, 7/20/45 (b) | 294,000 | 304,539 |
| Series 2016-1A, Class A2, 6.125%, 7/20/46 (b) | 888,750 | 952,161 |
| FOCUS Brands Funding LLC: | ||
| Series 2017-1A, Class A2I, 3.857%, 4/30/47 (b) | 721,375 | 731,385 |
| Series 2017-1A, Class A2II, 5.093%, 4/30/47 (b) | 79,600 | 83,371 |
| Taco Bell Funding LLC, Series 2016-1A, Class A2I, 3.832%, 5/25/46 (b) | 2,073,750 | 2,106,180 |
| Wendys Funding LLC: | ||
| Series 2015-1A, Class A2I, 3.371%, 6/15/45 (b) | 1,984,325 | 1,994,974 |
| Series 2015-1A, Class A2II, 4.08%, 6/15/45 (b) | 1,075,250 | 1,103,157 |
| 11,545,459 | ||
| Total Asset-Backed Securities (Cost $40,621,124) | 40,848,685 | |
www.calvert.com CALVERT ABSOLUTE RETURN BOND FUND ANNUAL REPORT 10
| PRINCIPAL AMOUNT ($) | VALUE ($) | |
| U.S. TREASURY OBLIGATIONS - 12.5% | ||
| U.S. Treasury Inflation Index Bonds, 1.75%, 1/15/28 (f) | 3,296,804 | 3,710,401 |
| U.S. Treasury Inflation Index Notes, 0.125%, 4/15/18 (f) | 1,120,445 | 1,119,401 |
| U.S. Treasury Notes: | ||
| 0.75%, 10/31/18 | 4,000,000 | 3,967,278 |
| 2.25%, 11/15/27 | 4,950,000 | 4,879,393 |
| Total U.S. Treasury Obligations (Cost $13,681,350) | 13,676,473 | |
| COLLATERALIZED MORTGAGE-BACKED OBLIGATIONS - 7.7% | ||
| Bellemeade Re Ltd.: | ||
| Series 2015-1A, Class B1, 7.629%, (1 mo. USD LIBOR + 6.30%), 7/25/25 (a)(b) | 300,000 | 310,931 |
| Series 2015-1A, Class M2, 5.629%, (1 mo. USD LIBOR + 4.30%), 7/25/25 (a)(b) | 1,588,237 | 1,620,356 |
| Federal Home Loan Mortgage Corp. Structured Agency Credit Risk Debt Notes: | ||
| Series 2015-HQ2, Class M3, 4.802%, (1 mo. USD LIBOR + 3.25%), 5/25/25 (a) | 1,000,000 | 1,134,263 |
| Series 2015-HQA2, Class B, 12.052%, (1 mo. USD LIBOR + 10.50%), 5/25/28 (a) | 324,508 | 448,227 |
| Series 2015-HQA2, Class M2, 4.352%, (1 mo. USD LIBOR + 2.80%), 5/25/28 (a) | 1,187,539 | 1,227,395 |
| Series 2017-DNA3, Class B1, 6.002%, (1 mo. USD LIBOR + 4.45%), 3/25/30 (a) | 321,667 | 342,311 |
| Federal National Mortgage Association Connecticut Avenue Securities: | ||
| Series 2014-C04, Class 1M2, 6.452%, (1 mo. USD LIBOR + 4.90%), 11/25/24 (a) | 977,562 | 1,119,154 |
| Series 2016-C05, Class 2M1, 2.902%, (1 mo. USD LIBOR + 1.35%), 1/25/29 (a) | 198,293 | 199,871 |
| Series 2017-C05, Class 1B1, 5.152%, (1 mo. USD LIBOR + 3.60%), 1/25/30 (a) | 210,000 | 208,339 |
| Series 2017-C05, Class 1M2, 3.752%, (1 mo. USD LIBOR + 2.20%), 1/25/30 (a) | 1,570,000 | 1,584,885 |
| Series 2017-C06, Class 1B1, 5.702%, (1 mo. USD LIBOR + 4.15%), 2/25/30 (a) | 270,000 | 278,903 |
| Total Collateralized Mortgage-Backed Obligations (Cost $8,033,351) | 8,474,635 | |
| COMMERCIAL MORTGAGE-BACKED SECURITIES - 1.5% | ||
| Barclays Commercial Mortgage Securities Trust, Series 2015-RRI, Class D, 4.251%, (1 mo. USD LIBOR + 3.00%), 5/15/32 (a)(b) | 400,000 | 401,702 |
| Citigroup Commercial Mortgage Trust, Series 2015-SSHP, Class E, 4.877%, (1 mo. USD LIBOR + 3.40%), 9/15/27 (a)(b) | 200,000 | 199,850 |
| Colony Multifamily Mortgage Trust, Series 2014-1, Class A, 2.543%, 4/20/50 (b) | 121,681 | 121,019 |
| Motel 6 Trust: | ||
| Series 2017-MTL6, Class D, 3.627%, (1 mo. USD LIBOR + 2.15%), 8/15/34 (a)(b) | 401,946 | 403,142 |
| Series 2017-MTL6, Class E, 4.727%, (1 mo. USD LIBOR + 3.25%), 8/15/34 (a)(b) | 545,852 | 548,622 |
| Total Commercial Mortgage-Backed Securities (Cost $1,649,195) | 1,674,335 | |
11 www.calvert.com CALVERT ABSOLUTE RETURN BOND FUND ANNUAL REPORT
| PRINCIPAL AMOUNT ($) | VALUE ($) | |
| FLOATING RATE LOANS (g) - 1.6% | ||
| Consumer, Cyclical - 1.6% | ||
| VFH Parent LLC: | ||
| Term Loan, 12/30/21 (h) | 1,695,652 | 1,711,196 |
| Term Loan, 5.135%, (3 mo. USD LIBOR + 3.75%), 12/30/21 | 78,261 | 79,223 |
| Total Floating Rate Loans (Cost $1,773,825) | 1,790,419 | |
| TIME DEPOSIT - 0.5% | ||
| State Street Bank and Trust Eurodollar Time Deposit, 0.12%, 1/2/18 | 479,522 | 479,522 |
| Total Time Deposit (Cost $479,522) | 479,522 | |
| Total Options Purchased (Cost $42,201) - 0.0% (e) | 28,750 | |
| TOTAL INVESTMENTS (Cost $110,168,690) - 101.1% | 110,976,202 | |
| Other assets and liabilities, net - (1.1%) | (1,238,909) | |
NET ASSETS - 100.0% | 109,737,293 | |
| NOTES TO SCHEDULE OF INVESTMENTS | |
| (a) Variable rate security. The stated interest rate represents the rate in effect at December 31, 2017. | |
| (b) Security is exempt from registration under Rule 144A of the Securities Act of 1933. These securities may be resold in transactions exempt from registration, normally to qualified institutional buyers. Total market value of Rule 144A securities amounts to $50,912,413, which represents 46.4% of the net assets of the Fund as of December 31, 2017. | |
| (c) Security converts to floating rate after the indicated fixed-rate coupon period. | |
| (d) Multi-step coupon security. The interest rate disclosed is that which is in effect on December 31, 2017. | |
| (e) Amount is less than 0.05%. | |
| (f) Inflation-linked security whose principal is adjusted for inflation based on changes in the U.S. Consumer Price Index. Interest is calculated based on the inflation-adjusted principal. | |
| (g) Remaining maturities of floating rate loans may be less than the stated maturities shown as a result of contractual or optional prepayments by the borrower. Such prepayments cannot be predicted with certainty. Floating rate loans generally pay interest at rates which are periodically re-determined at a margin above the London InterBank Offered Rate (“LIBOR”) or other short-term rates. The rate shown is the rate in effect at December 31, 2017. Floating rate loans are generally considered restrictive in that the Fund is ordinarily contractually obligated to receive consent from the Agent Bank and/or Borrower prior to disposition of a floating rate loan. | |
| (h) This floating rate loan will settle after December 31, 2017, at which time the interest rate will be determined. | |
| Abbreviations: | |
| LIBOR: | London Interbank Offered Rate |
| USD: | United States Dollar |
| PUT OPTIONS PURCHASED - 0.0% (e) | |||||||||||
| EXCHANGE-TRADED OPTIONS - 0.0% (e) | |||||||||||
| DESCRIPTION | NUMBER OF CONTRACTS | NOTIONAL AMOUNT | EXERCISE PRICE | EXPIRATION DATE | VALUE | ||||||
| U.S. 10-Year Treasury Note Futures 3/2018 | 80 | $9,923,750 | $122.00 | 2/23/18 | $10,000 | ||||||
| U.S. 10-Year Treasury Note Futures 3/2018 | 100 | 12,404,688 | 122.50 | 2/23/18 | 18,750 | ||||||
| Total | $28,750 | ||||||||||
www.calvert.com CALVERT ABSOLUTE RETURN BOND FUND ANNUAL REPORT 12
| FUTURES | NUMBER OF CONTRACTS | EXPIRATION MONTH/YEAR | NOTIONAL AMOUNT | VALUE/NET UNREALIZED APPRECIATION (DEPRECIATION) | ||||
| Long: | ||||||||
| U.S. 5-Year Treasury Note | 34 | 3/2018 | $3,949,578 | ($17,231 | ) | |||
| Short: | ||||||||
| U.S. Ultra-Long Treasury Bond | (7) | 3/2018 | ($1,173,594 | ) | ($5,263 | ) | ||
| See notes to financial statements. | ||||||||
13 www.calvert.com CALVERT ABSOLUTE RETURN BOND FUND ANNUAL REPORT
CALVERT ABSOLUTE RETURN BOND FUND
STATEMENT OF ASSETS AND LIABILITIES
DECEMBER 31, 2017
| ASSETS | |||
| Investments in securities of unaffiliated issuers, at value (identified cost $110,168,690) | $110,976,202 | ||
| Receivable for variation margin on open futures contracts | 125 | ||
| Cash | 67,503 | ||
| Receivable for capital shares sold | 145,014 | ||
| Interest receivable | 429,528 | ||
| Securities lending income receivable | 564 | ||
| Receivable from affiliate | 17,068 | ||
| Deposits at brokers for futures contracts | 7,615 | ||
| Trustees' deferred compensation plan | 83,961 | ||
| Other assets | 1,219 | ||
| Total assets | 111,728,799 | ||
| LIABILITIES | |||
| Payable for investments purchased | 1,695,652 | ||
| Payable for capital shares redeemed | 105,733 | ||
| Payable to affiliates: | |||
| Investment advisory fee | 33,380 | ||
| Administrative fee | 9,870 | ||
| Distribution and service fees | 3,675 | ||
| Sub-transfer agency fee | 927 | ||
| Trustees' deferred compensation plan | 83,961 | ||
| Accrued expenses | 58,308 | ||
| Total liabilities | 1,991,506 | ||
| NET ASSETS | $109,737,293 | ||
| NET ASSETS CONSIST OF: | |||
| Paid-in capital applicable to shares of beneficial interest | |||
| (unlimited number of no par value shares authorized) | $109,076,693 | ||
| Accumulated net realized loss | (124,418) | ||
| Net unrealized appreciation | 785,018 | ||
| Total | $109,737,293 | ||
| NET ASSET VALUE PER SHARE | |||
| Class A (based on net assets of $15,220,393 and 1,010,213 shares outstanding) | $15.07 | ||
| Class C (based on net assets of $649,210 and 43,060 shares outstanding) | $15.08 | ||
| Class I (based on net assets of $93,867,690 and 6,247,621 shares outstanding) | $15.02 | ||
| OFFERING PRICE PER SHARE* | |||
| Class A (100/96.25 of net asset value per share) | $15.66 | ||
| * On sales of $50,000 or more, the offering price of Class A shares is reduced. | |||
| See notes to financial statements. | |||
www.calvert.com CALVERT ABSOLUTE RETURN BOND FUND ANNUAL REPORT 14
CALVERT ABSOLUTE RETURN BOND FUND
STATEMENT OF OPERATIONS
YEAR ENDED DECEMBER 31, 2017
| INVESTMENT INCOME | |||
| Interest income | $3,509,255 | ||
| Securities lending income, net | 1,030 | ||
| Total investment income | 3,510,285 | ||
| EXPENSES | |||
| Investment advisory fee | 353,437 | ||
| Administrative fee | 121,098 | ||
| Distribution and service fees: | |||
| Class A | 42,623 | ||
| Class C | 7,359 | ||
| Trustees' fees and expenses | 5,657 | ||
| Custodian fees | 37,306 | ||
| Transfer agency fees and expenses: | |||
| Class A | 21,142 | ||
| Class C | 2,589 | ||
| Class I | 17,496 | ||
| Class Y | 10,017 | ||
| Accounting fees | 34,597 | ||
| Professional fees | 36,120 | ||
| Registration fees: | |||
| Class A | 14,961 | ||
| Class C | 10,620 | ||
| Class I | 31,385 | ||
| Class Y | 14,175 | ||
| Reports to shareholders | 17,024 | ||
| Miscellaneous | 24,846 | ||
| Total expenses | 802,452 | ||
| Waiver and/or reimbursement of expenses by affiliate | (43,914) | ||
| Reimbursement of expenses-other | (2,422) | ||
| Net expenses | 756,116 | ||
| Net investment income | 2,754,169 | ||
| REALIZED AND UNREALIZED GAIN (LOSS) | |||
| Net realized gain (loss) on: | |||
| Investment securities | 699,910 | ||
| Futures contracts | (63,468) | ||
| 636,442 | |||
| Net change in unrealized appreciation (depreciation) on: | |||
| Investment securities | 41,645 | ||
| Futures contracts | (54,319) | ||
| (12,674) | |||
| Net realized and unrealized gain | 623,768 | ||
| Net increase in net assets resulting from operations | $3,377,937 | ||
| See notes to financial statements. | |||
15 www.calvert.com CALVERT ABSOLUTE RETURN BOND FUND ANNUAL REPORT
CALVERT ABSOLUTE RETURN BOND FUND
STATEMENTS OF CHANGES IN NET ASSETS
| INCREASE (DECREASE) IN NET ASSETS | Year Ended December 31, 2017 | Year Ended December 31, 2016 | |||||
| Operations: | |||||||
| Net investment income | $2,754,169 | $2,638,165 | |||||
| Net realized gain | 636,442 | 818,302 | |||||
| Net change in unrealized appreciation (depreciation) | (12,674) | 1,304,840 | |||||
| Net increase in net assets resulting from operations | 3,377,937 | 4,761,307 | |||||
| Distributions to shareholders from: | |||||||
| Net investment income: | |||||||
| Class A shares | (407,200) | (434,727) | |||||
| Class C shares | (12,059) | (25,418) | |||||
| Class I shares | (1,900,613) | (1,956,870) | |||||
| Class Y shares | (462,841) | (181,504) | |||||
| Net realized gain: | |||||||
| Class A shares | (121,614) | (138,598) | |||||
| Class C shares | (5,175) | (8,987) | |||||
| Class I shares | (746,654) | (450,086) | |||||
| Class Y shares | — | (64,035) | |||||
| Total distributions to shareholders | (3,656,156) | (3,260,225) | |||||
| Capital share transactions: | |||||||
| Class A shares | (1,831,113) | 4,296,549 | |||||
| Class C shares | (479,097) | 203,042 | |||||
| Class I shares | 39,897,563 | 14,117,434 | |||||
| Class Y shares | (10,487,140) | 6,021,702 | |||||
| Net increase in net assets from capital share transactions | 27,100,213 | 24,638,727 | |||||
| TOTAL INCREASE IN NET ASSETS | 26,821,994 | 26,139,809 | |||||
| NET ASSETS | |||||||
| Beginning of year | 82,915,299 | 56,775,490 | |||||
| End of year (including accumulated undistributed net investment income of $0 and $24,662, respectively) | $109,737,293 | $82,915,299 | |||||
| See notes to financial statements. | |||||||
www.calvert.com CALVERT ABSOLUTE RETURN BOND FUND ANNUAL REPORT 16
CALVERT ABSOLUTE RETURN BOND FUND
FINANCIAL HIGHLIGHTS
| Year Ended December 31, | Period Ended December 31, | ||||||||||||
| CLASS A SHARES | 2017 | 2016 | 2015 | 2014 (a) | |||||||||
| Net asset value, beginning | $15.08 | $14.78 | $14.93 | $15.00 | |||||||||
| Income from investment operations: | |||||||||||||
Net investment income(b) | 0.37 | 0.49 | 0.43 | 0.08 | |||||||||
| Net realized and unrealized gain (loss) | 0.11 | 0.42 | (0.19) | (0.08) | |||||||||
| Total from investment operations | 0.48 | 0.91 | 0.24 | — | |||||||||
| Distributions from: | |||||||||||||
| Net investment income | (0.37) | (0.48) | (0.38) | (0.05) | |||||||||
| Net realized gain | (0.12) | (0.13) | (0.01) | (0.02) | |||||||||
| Total distributions | (0.49) | (0.61) | (0.39) | (0.07) | |||||||||
| Total increase (decrease) in net asset value | (0.01) | 0.30 | (0.15) | (0.07) | |||||||||
| Net asset value, ending | $15.07 | $15.08 | $14.78 | $14.93 | |||||||||
Total return (c) | 3.21 | % | 6.24 | % | 1.57 | % | (0.02 | %) | |||||
Ratios to average net assets: (d) | |||||||||||||
| Total expenses | 1.09 | % | 1.20 | % | 1.64 | % | 53.67 | % | (e) | ||||
| Net expenses | 1.08 | % | 1.10 | % | 1.10 | % | 1.10 | % | (e) | ||||
| Net investment income | 2.41 | % | 3.30 | % | 2.90 | % | 2.42 | % | (e) | ||||
| Portfolio turnover | 111 | % | 104 | % | 132 | % | 114 | % | |||||
| Net assets, ending (in thousands) | $15,220 | $17,022 | $12,497 | $326 | |||||||||
(a) From September 30, 2014 inception. | |||||||||||||
(b) Computed using average shares outstanding. | |||||||||||||
(c) Returns are historical and are calculated by determining the percentage change in net asset value with all distributions reinvested and do not reflect the effect of sales charges, if any. Total return is not annualized for periods of less than one year. | |||||||||||||
(d) Total expenses do not reflect amounts reimbursed and/or waived by the Adviser and certain of its affiliates, if applicable. Net expenses are net of all reductions and represent the net expenses paid by the Fund. | |||||||||||||
(e) Annualized. | |||||||||||||
| See notes to financial statements. | |||||||||||||
17 www.calvert.com CALVERT ABSOLUTE RETURN BOND FUND ANNUAL REPORT
CALVERT ABSOLUTE RETURN BOND FUND
FINANCIAL HIGHLIGHTS
| Year Ended December 31, | Period Ended December 31, | ||||||||||||
| CLASS C SHARES | 2017 | 2016 | 2015 | 2014 (a) | |||||||||
| Net asset value, beginning | $15.09 | $14.79 | $14.93 | $15.00 | |||||||||
| Income from investment operations: | |||||||||||||
Net investment income(b) | 0.26 | 0.38 | 0.32 | 0.04 | |||||||||
| Net realized and unrealized gain (loss) | 0.10 | 0.42 | (0.19) | (0.07) | |||||||||
| Total from investment operations | 0.36 | 0.80 | 0.13 | (0.03) | |||||||||
| Distributions from: | |||||||||||||
| Net investment income | (0.25) | (0.37) | (0.26) | (0.02) | |||||||||
| Net realized gain | (0.12) | (0.13) | (0.01) | (0.02) | |||||||||
| Total distributions | (0.37) | (0.50) | (0.27) | (0.04) | |||||||||
| Total increase (decrease) in net asset value | (0.01) | 0.30 | (0.14) | (0.07) | |||||||||
| Net asset value, ending | $15.08 | $15.09 | $14.79 | $14.93 | |||||||||
Total return (c) | 2.41 | % | 5.46 | % | 0.82 | % | (0.22 | %) | |||||
Ratios to average net assets: (d) | |||||||||||||
| Total expenses | 3.42 | % | 3.33 | % | 4.43 | % | 2,859.43 | % | (e) | ||||
| Net expenses | 1.84 | % | 1.85 | % | 1.85 | % | 1.85 | % | (e) | ||||
| Net investment income | 1.69 | % | 2.57 | % | 2.13 | % | 1.11 | % | (e) | ||||
| Portfolio turnover | 111 | % | 104 | % | 132 | % | 114 | % | |||||
| Net assets, ending (in thousands) | $649 | $1,126 | $900 | $5 | |||||||||
(a) From September 30, 2014 inception. | |||||||||||||
(b) Computed using average shares outstanding. | |||||||||||||
(c) Returns are historical and are calculated by determining the percentage change in net asset value with all distributions reinvested and do not reflect the effect of sales charges, if any. Total return is not annualized for periods of less than one year. | |||||||||||||
(d) Total expenses do not reflect amounts reimbursed and/or waived by the Adviser and certain of its affiliates, if applicable. Net expenses are net of all reductions and represent the net expenses paid by the Fund. | |||||||||||||
(e) Annualized. | |||||||||||||
| See notes to financial statements. | |||||||||||||
www.calvert.com CALVERT ABSOLUTE RETURN BOND FUND ANNUAL REPORT 18
CALVERT ABSOLUTE RETURN BOND FUND
FINANCIAL HIGHLIGHTS
| Year Ended December 31, | Period Ended December 31, | ||||||||||||
| CLASS I SHARES | 2017 | 2016 | 2015 | 2014 (a) | |||||||||
| Net asset value, beginning | $15.04 | $14.74 | $14.93 | $15.00 | |||||||||
| Income from investment operations: | |||||||||||||
Net investment income(b) | 0.43 | 0.56 | 0.48 | 0.08 | |||||||||
| Net realized and unrealized gain (loss) | 0.10 | 0.42 | (0.19) | (0.06) | |||||||||
| Total from investment operations | 0.53 | 0.98 | 0.29 | 0.02 | |||||||||
| Distributions from: | |||||||||||||
| Net investment income | (0.43) | (0.55) | (0.47) | (0.07) | |||||||||
| Net realized gain | (0.12) | (0.13) | (0.01) | (0.02) | |||||||||
| Total distributions | (0.55) | (0.68) | (0.48) | (0.09) | |||||||||
| Total increase (decrease) in net asset value | (0.02) | 0.30 | (0.19) | (0.07) | |||||||||
| Net asset value, ending | $15.02 | $15.04 | $14.74 | $14.93 | |||||||||
Total return (c) | 3.59 | % | 6.73 | % | 1.93 | % | 0.13 | % | |||||
Ratios to average net assets: (d) | |||||||||||||
| Total expenses | 0.70 | % | 0.68 | % | 1.11 | % | 2.72 | % | (e) | ||||
| Net expenses | 0.65 | % | 0.65 | % | 0.65 | % | 0.65 | % | (e) | ||||
| Net investment income | 2.82 | % | 3.76 | % | 3.25 | % | 2.01 | % | (e) | ||||
| Portfolio turnover | 111 | % | 104 | % | 132 | % | 114 | % | |||||
| Net assets, ending (in thousands) | $93,868 | $54,389 | $39,101 | $10,011 | |||||||||
(a) From September 30, 2014 inception. | |||||||||||||
(b) Computed using average shares outstanding. | |||||||||||||
(c) Returns are historical and are calculated by determining the percentage change in net asset value with all distributions reinvested and do not reflect the effect of sales charges, if any. Total return is not annualized for periods of less than one year. | |||||||||||||
(d) Total expenses do not reflect amounts reimbursed and/or waived by the Adviser and certain of its affiliates, if applicable. Net expenses are net of all reductions and represent the net expenses paid by the Fund. | |||||||||||||
(e) Annualized. | |||||||||||||
| See notes to financial statements. | |||||||||||||
19 www.calvert.com CALVERT ABSOLUTE RETURN BOND FUND ANNUAL REPORT
NOTES TO FINANCIAL STATEMENTS
NOTE 1 — SIGNIFICANT ACCOUNTING POLICIES
Calvert Absolute Return Bond Fund (formerly, Calvert Unconstrained Bond Fund) (the Fund) is a diversified series of Calvert Management Series (the Trust). The Trust is a Massachusetts business trust registered under the Investment Company Act of 1940, as amended (the 1940 Act), as an open-end management investment company. The investment objective of the Fund is to seek positive absolute returns over a full market cycle, regardless of market conditions. The Fund invests primarily in bonds and/or instruments that provide exposure to bonds, including debt securities of any maturity.
The Fund offers three classes of shares. Class A shares are generally sold subject to a sales charge imposed at time of purchase. A contingent deferred sales charge of 0.80% may apply to certain redemptions of Class A shares for accounts for which no sales charge was paid, if redeemed within one year of purchase. Class C shares are sold without a front-end sales charge, and with certain exceptions, are charged a contingent deferred sales charge of 1% on shares redeemed within one year of purchase. Class C shares are only available for purchase through a financial intermediary. Class I shares are sold at net asset value, are not subject to a sales charge and are sold only to certain eligible investors. The Fund previously offered Class Y shares. At the close of business on December 8, 2017, Class Y shares were merged into Class I shares. Each class represents a pro rata interest in the Fund, but votes separately on class-specific matters and is subject to different expenses.
The Fund applies the accounting and reporting guidance in the Financial Accounting Standards Board (FASB) Accounting Standards Codification Topic 946, Financial Services – Investment Companies (ASC 946). Subsequent events, if any, through the date that the financial statements were issued have been evaluated in the preparation of the financial statements.
A. Investment Valuation: Net asset value per share is determined every business day as of the close of the regular session of the New York Stock Exchange (generally 4:00 p.m. Eastern time). The Fund uses independent pricing services approved by the Board of Trustees (the Board) to value its investments wherever possible. Investments for which market quotations are not available or deemed not reliable are fair valued in good faith under the direction of the Board.
The Board has adopted Valuation Procedures (the Procedures) to determine the fair value of securities and financial instruments for which market prices are not readily available or which may not be reliably priced. The Board has delegated the day-to-day responsibility for determining the fair value of securities and financial instruments of the Fund to Calvert Research and Management (CRM), the Fund's investment adviser and has provided these Procedures to govern CRM in its valuation duties.
CRM has chartered an internal Valuation Committee to oversee the implementation of these Procedures and to assist it in carrying out the valuation responsibilities that the Board has delegated. The Valuation Committee meets on a regular basis to review investments which may not have readily available market prices. The Valuation Committee’s fair valuation determinations are subject to review, approval and ratification by the Board at its next regularly scheduled meeting covering the calendar quarter in which the fair valuation was determined.
U.S. generally accepted accounting principles (U.S. GAAP) establishes a disclosure hierarchy that categorizes the inputs to valuation techniques used to value assets and liabilities at measurement date. These inputs are summarized in the three broad levels listed below:
Level 1 - quoted prices in active markets for identical securities
Level 2 - other significant observable inputs (including quoted prices for similar securities, interest rates, prepayment speeds, credit risk, etc.)
Level 3 - significant unobservable inputs (including the Fund’s own assumptions in determining the fair value of investments)
The inputs or methodologies used for valuing securities are not necessarily an indication of the risk associated with investing in those securities.
Changes in valuation techniques may result in transfers in or out of an investment’s assigned level within the hierarchy during the period. Transfers in and/or out of levels are determined based on the fair value of such securities at the end of the period. Valuation techniques used to value the Fund’s investments by major category are as follows:
Debt Securities. Debt securities are generally valued on the basis of valuations provided by third party pricing services, as derived from such services’ pricing models. Inputs to the models may include, but are not limited to, reported trades, executable bid and asked prices, broker/dealer quotations, prices or yields of securities with similar characteristics, interest rates, anticipated prepayments, benchmark curves or information pertaining to the issuer, as well as industry and economic events. Accordingly, debt securities are generally categorized as Level 2 in the hierarchy. Short-term securities of sufficient credit quality purchased with remaining maturities of sixty days or less for which a valuation from a third party pricing service is not readily available may be valued at amortized cost, which approximates fair value, and are categorized as Level 2 in the hierarchy.
www.calvert.com CALVERT ABSOLUTE RETURN BOND FUND ANNUAL REPORT 20
The Calvert funds adopted amended Valuation Policies and Procedures effective June 21, 2017. The amended Valuation Policies and Procedures primarily changed from the use of bid price to the mean of the bid and asked price for debt securities and resulted in an increase in the Fund’s NAV per share of $0.014.
Floating Rate Loans. Interests in floating-rate loans for which reliable market quotations are readily available are valued generally at the average mean of bid and ask quotations obtained from a third party pricing service, and are categorized as Level 2 in the hierarchy.
Other Securities. Investments in registered investment companies (including money market funds) that do not trade on an exchange are valued at the net asset value per share on the valuation day and are categorized as Level 1 in the hierarchy.
Derivatives. Futures contracts are valued at unrealized appreciation (depreciation) based on the settlement price established each day by the board of trade or exchange on which they are traded and are categorized as Level 1 in the hierarchy. U.S. exchange-traded options are valued at the mean between the bid and asked prices at valuation time as reported by the Options Price Reporting Authority and are categorized as Level 1 in the hierarchy.
Fair Valuation. If a market value cannot be determined for a security using the methodologies described above, or if, in the good faith opinion of the Fund's adviser, the market value does not constitute a readily available market quotation, or if a significant event has occurred that would materially affect the value of the security, the security will be fair valued as determined in good faith by or at the direction of the Board in a manner that fairly reflects the security’s value, or the amount that the Fund might reasonably expect to receive for the security upon its current sale in the ordinary course. Each such determination is based on a consideration of relevant factors, which are likely to vary from one pricing context to another. These factors may include, but are not limited to, the type of security, the existence of any contractual restrictions on the security’s disposition, the price and extent of public trading in similar securities of the issuer or of comparable companies or entities, quotations or relevant information obtained from broker/dealers or other market participants, information obtained from the issuer, analysts, and/or the appropriate stock exchange (for exchange-traded securities), an analysis of the company’s or entity’s financial condition, and an evaluation of the forces that influence the issuer and the market(s) in which the security is purchased and sold.
The values assigned to fair value investments are based on available information and do not necessarily represent amounts that might ultimately be realized. Further, due to the inherent uncertainty of valuations of such investments, the fair values may differ significantly from the values that would have been used had an active market existed, and the differences could be material. The Valuation Committee employs various methods for calibrating these valuation approaches including a regular review of key inputs and assumptions, transactional back-testing or disposition analysis and reviews of any related market activity.
The following table summarizes the market value of the Fund's holdings as of December 31, 2017, based on the inputs used to value them:
| Investments in Securities - Assets | Level 1 | Level 2 | Level 3 | Total | ||||||||
| Corporate Bonds | $— | $44,003,383 | $— | $44,003,383 | ||||||||
| Asset-Backed Securities | — | 40,848,685 | — | 40,848,685 | ||||||||
| U.S. Treasury Obligations | — | 13,676,473 | — | 13,676,473 | ||||||||
| Collateralized Mortgage-Backed Obligations | — | 8,474,635 | — | 8,474,635 | ||||||||
| Commercial Mortgage-Backed Securities | — | 1,674,335 | — | 1,674,335 | ||||||||
| Floating Rate Loans | — | 1,790,419 | — | 1,790,419 | ||||||||
| Time Deposit | — | 479,522 | — | 479,522 | ||||||||
| Total | $— | $110,947,452 | $— | $110,947,452 | ||||||||
| Derivative Instruments - Assets | ||||||||||||
| Options Purchased | $28,750 | $— | $— | $28,750 | ||||||||
| Derivative Instruments - Liabilities | ||||||||||||
| Futures Contracts* | ($22,494 | ) | $— | $— | ($22,494 | ) | ||||||
| * The value listed reflects unrealized appreciation (depreciation) as shown in the Schedule of Investments. | ||||||||||||
The Fund held no investments or other financial instruments as of December 31, 2016 whose fair value was determined using Level 3 inputs. There were no transfers between Level 1 and Level 2 during the year ended December 31, 2017.
21 www.calvert.com CALVERT ABSOLUTE RETURN BOND FUND ANNUAL REPORT
B. Investment Transactions and Income: Investment transactions for financial statement purposes are accounted for on trade date. Realized gains and losses are recorded on an identified cost basis and may include proceeds from litigation. Interest income, which includes amortization of premium and accretion of discount on debt securities, is accrued as earned. The Fund earns certain fees in connection with its investments in floating rate loans. These fees are in addition to interest payments earned and may include amendment fees, consent fees and prepayment fees, which are recorded to income as earned. Inflation adjustments to the principal amount of inflation-adjusted bonds and notes are reflected as interest income. Deflation adjustments to the principal amount of an inflation-adjusted bond or note are reflected as reductions to interest income to the extent of interest income previously recorded on such bond or note.
C. Share Class Accounting: Realized and unrealized gains and losses and net investment income and losses, other than class-specific expenses, are allocated daily to each class of shares based upon the relative net assets of each class to the total net assets of the Fund. Expenses arising in connection with a specific class are charged directly to that class.
D. Floating Rate Loans: The Fund may invest in direct debt instruments which are interests in amounts owed to lenders or lending syndicates by corporate, governmental, or other borrowers. The Fund’s investment in loans may be in the form of participations in loans or assignments of all or a portion of loans from third parties. A loan is often administered by a bank or other financial institution (the lender) that acts as agent for all holders. The agent administers the terms of the loan, as specified in the loan agreement. The Fund may invest in multiple series or tranches of a loan, which may have varying terms and carry different associated risks. The Fund generally has no right to enforce compliance with the terms of the loan agreement with the borrower. As a result, the Fund may be subject to the credit risk of both the borrower and the lender that is selling the loan agreement. When the Fund purchases assignments from lenders, it acquires direct rights against the borrower of the loan. When investing in a loan participation, the Fund has the right to receive payments of principal, interest and any fees to which it is entitled only from the lender selling the loan agreement and only upon receipt of payments by the lender from the borrower.
E. Futures Contracts: The Fund may enter into futures contracts to buy or sell a financial instrument for a set price at a future date. Initial margin deposits of either cash or securities as required by the broker are made upon entering into the contract. While the contract is open, daily variation margin payments are made to or received from the broker reflecting the daily change in market value of the contract and are recorded for financial reporting purposes as unrealized gains or losses by the Fund. When a futures contract is closed, a realized gain or loss is recorded equal to the difference between the opening and closing value of the contract. The risks associated with entering into futures contracts may include the possible illiquidity of the secondary market which would limit the Fund’s ability to close out a futures contract prior to the settlement date, an imperfect correlation between the value of the contracts and the underlying financial instruments, or that the counterparty will fail to perform its obligations under the contracts’ terms. Futures contracts are designed by boards of trade which are designated “contracts markets” by the Commodities Futures Trading Commission. Futures contracts trade on the contracts markets in a manner that is similar to the way a stock trades on a stock exchange, and the boards of trade, through their clearing corporations, guarantee the futures contracts against default. As a result, there is minimal counterparty credit risk to the Fund.
F. Options Contracts: Upon the purchase of a call or put option, the premium paid by the Fund is included in the Statement of Assets and Liabilities as an investment. The amount of the investment is subsequently marked-to-market to reflect the current market value of the option purchased, in accordance with the Fund’s policies on investment valuations discussed above. As the purchaser of an index option or option on a futures contract, the Fund has the right to receive a cash payment equal to any depreciation in the value of the index or futures contract below the strike price of the option (in the case of a put) or equal to any appreciation in the value of the index or futures contract over the strike price of the option (in the case of a call) as of the valuation date of the option. If an option which the Fund had purchased expires on the stipulated expiration date, the Fund will realize a loss in the amount of the cost of the option. If the Fund enters into a closing sale transaction, the Fund will realize a gain or loss, depending on whether the sales proceeds from the closing sale transaction are greater or less than the cost of the option. The risk associated with purchasing options is limited to the premium originally paid. Purchased options traded over-the-counter involve risk that the issuer or counterparty will fail to perform its contractual obligations.
Upon the writing of a call or a put option, the premium received by the Fund is included in the Statement of Assets and Liabilities as a liability. The amount of the liability is subsequently marked-to-market to reflect the current market value of the option written, in accordance with the Fund’s policies on investment valuations discussed above. Premiums received from writing options which expire are treated as realized gains. Premiums received from writing options which are exercised or are closed are added to or offset against the proceeds or amount paid on the transaction to determine the realized gain or loss. When an index option or option on a futures contract is exercised, the Fund is required to deliver an amount of cash determined by the excess of the strike price of the option over the value of the index or futures contract (in the case of a put) or the excess of the value of the index or futures contract over the strike price of the option (in the case of a call) at contract termination. The Fund, as a writer of an option, may have no control over whether the underlying instrument may be sold (call) or purchased (put) and, as a result, bears the market risk of an unfavorable change in the price of the instrument underlying the written option. The Fund may also bear the risk of not being able to enter into a closing transaction if a liquid secondary market does not exist.
www.calvert.com CALVERT ABSOLUTE RETURN BOND FUND ANNUAL REPORT 22
G. Distributions to Shareholders: Distributions to shareholders are recorded by the Fund on ex-dividend date. Dividends from net investment income are declared and paid monthly. Distributions from net realized capital gains, if any, are paid at least annually. Distributions are determined in accordance with income tax regulations which may differ from U.S. GAAP; accordingly, periodic reclassifications are made within the Fund's capital accounts to reflect income and gains available for distribution under income tax regulations.
H. Estimates: The preparation of financial statements in conformity with U.S. GAAP requires management to make estimates and assumptions that affect the reported amounts of assets and liabilities and disclosure of contingent assets and liabilities at the date of the financial statements and the reported amounts of increases and decreases in net assets from operations during the reporting period. Actual results could differ from those estimates.
I. Indemnifications: Under the Trust’s organizational document, its officers and Trustees may be indemnified against certain liabilities and expenses arising out of the performance of their duties to the Fund. Under Massachusetts law, if certain conditions prevail, shareholders of a Massachusetts business trust (such as the Trust) could be deemed to have personal liability for the obligations of the Trust. However, the Trust’s Declaration of Trust contains an express disclaimer of liability on the part of Fund shareholders and provides that upon request, the Trust shall assume the defense on behalf of any Fund shareholders or former shareholders. Additionally, in the normal course of business, the Fund enters into agreements with service providers that may contain indemnification clauses. The Fund’s maximum exposure under these arrangements is unknown as this would involve future claims that may be made against the Fund that have not yet occurred.
J. Federal Income Taxes: No provision for federal income or excise tax is required since the Fund intends to continue to qualify as a regulated investment company under the Internal Revenue Code and to distribute substantially all of its taxable earnings.
Management has analyzed the Fund's tax positions taken for all open federal income tax years and has concluded that no provision for federal income tax is required in the Fund's financial statements. A Fund's federal tax return is subject to examination by the Internal Revenue Service for a period of three years from the date of filing.
NOTE 2 — RELATED PARTY TRANSACTIONS
The investment advisory fee is earned by CRM, a subsidiary of Eaton Vance Management (EVM), as compensation for investment advisory services rendered to the Fund. Pursuant to the investment advisory agreement, CRM receives a fee, payable monthly, at the annual rate of 0.35% of the Fund’s average daily net assets. For the year ended December 31, 2017, the investment advisory fee amounted to $353,437.
CRM has agreed to reimburse the Fund's expenses to the extent that total annual fund operating expenses (relating to ordinary operating expenses only and excluding expenses such as brokerage commissions, acquired fund fees and expenses of unaffiliated funds, interest expense, taxes or litigation expenses) exceed 1.02%, 1.77% and 0.65% for Class A, Class C and Class I, and prior to the close of business on December 8, 2017, 0.85% for Class Y, respectively, of such class’s average daily net assets (1.10%, 1.85%, 0.65% and 0.85% for Class A, Class C, Class I and Class Y prior to October 1, 2017). The expense reimbursement agreement with CRM may be changed or terminated after April 30, 2019. For the year ended December 31, 2017, CRM waived or reimbursed expenses of $30,759.
The administrative fee is earned by CRM as compensation for administrative services rendered to the Fund. The fee is computed at an annual rate of 0.12% of the Fund’s average daily net assets attributable to Class A, Class C, Class I, and prior to the close of business on December 8, 2017, Class Y, and is payable monthly. CRM has agreed to contractually waive 0.02% of the administrative fee through April 30, 2018 for Class I. For the year ended December 31, 2017, CRM was paid administrative fees of $121,098, of which $13,155 were waived.
The Fund has in effect a distribution plan for Class A shares (Class A Plan) pursuant to Rule 12b-1 under the 1940 Act. Pursuant to the Class A Plan, the Fund pays Eaton Vance Distributors, Inc. (EVD), an affiliate of CRM and the Fund’s principal underwriter, a distribution and service fee of 0.25% per annum of its average daily net assets attributable to Class A shares for distribution services and facilities provided to the Fund by EVD, as well as for personal services and/or the maintenance of shareholder accounts. The Fund also has in effect a distribution plan for Class C shares (Class C Plan) pursuant to Rule 12b-1 under the 1940 Act. Pursuant to the Class C Plan, the Fund pays EVD amounts equal to 0.75% per annum of its average daily net assets attributable to Class C shares for providing ongoing distribution services and facilities to the Fund. In addition, pursuant to the Class C Plan, the Fund also makes payments of service fees to EVD, financial intermediaries and other persons in amounts equal to 0.25% per annum of its average daily net assets attributable to that class. Service fees paid or accrued are for personal services and/or the maintenance of shareholder accounts. Distribution and service fees paid or accrued for the year ended December 31, 2017 amounted to $42,623 and $7,359 for Class A shares and Class C shares, respectively.
23 www.calvert.com CALVERT ABSOLUTE RETURN BOND FUND ANNUAL REPORT
The Fund was informed that EVD received $4,659 as its portion of the sales charge on sales of Class A shares for the year ended December 31, 2017. The Fund was also informed that EVD received less than $100 and $2,830 of contingent deferred sales charges paid by Class A and Class C shareholders, respectively, for the same period.
EVM provides sub-transfer agency and related services to the Fund pursuant to a Sub-Transfer Agency Support Services Agreement. For the year ended December 31, 2017, sub-transfer agency fees and expenses incurred to EVM amounted to $5,650 and are included in transfer agency fees and expenses on the Statement of Operations.
Each Trustee of the Fund who is not an employee of CRM or its affiliates receives a fee of $3,000 for each Board meeting attended in person and $2,000 for each Board meeting attended by phone plus an annual fee of $52,000, and $1,500 for each Committee meeting attended in person and $1,000 for each Committee meeting attended by phone plus an annual Committee fee of $2,500. The Board chair receives an additional $10,000 annual retainer and Committee chairs receive an additional $6,000 annual retainer. Eligible Trustees may participate in a Deferred Compensation Plan (the Plan). Amounts deferred under the Plan are treated as though equal dollar amounts had been invested in shares of the Fund or other Calvert funds selected by the Trustees. The Fund purchases shares of the funds selected equal to the dollar amounts deferred under the Plan, resulting in an asset equal to the deferred compensation liability. Obligations of the Plan are paid solely from the Fund’s assets. Trustees’ fees are allocated to each of the Calvert funds served. Salaries and fees of officers and Trustees of the Fund who are employees of CRM or its affiliates are paid by CRM. In addition, an advisory council was established to aid the Board and CRM in advancing the cause of responsible investing through original scholarship and thought leadership. The advisory council consists of CRM’s Chief Executive Officer and four additional members. Each member (other than CRM’s Chief Executive Officer) receives annual compensation of $75,000, which is being reimbursed by Calvert Investment Management, Inc. (CIM), the Calvert funds’ former investment adviser and Ameritas Holding Company for a period of up to three years through December 30, 2019. For the year ended December 31, 2017, the Fund’s allocated portion of such expense and reimbursement was $2,422, which are included in miscellaneous expense and reimbursement of expenses-other, respectively, on the Statement of Operations.
NOTE 3 — INVESTMENT ACTIVITY
During the year ended December 31, 2017, the cost of purchases and proceeds from sales of investments, other than U.S. government and agency securities and short-term securities, were $103,992,489 and $71,563,039, respectively. Purchases and sales of U.S. government and agency securities were $23,683,829 and $22,867,431, respectively.
NOTE 4 — DISTRIBUTIONS TO SHAREHOLDERS AND INCOME TAX INFORMATION
The tax character of distributions declared for the years ended December 31, 2017 and December 31, 2016 was as follows:
| Year Ended December 31, | ||||||
| 2017 | 2016 | |||||
| Distributions declared from: | ||||||
| Ordinary income | $3,287,782 | $3,260,225 | ||||
| Long-term capital gains | $368,374 | $— | ||||
During the year ended December 31, 2017, accumulated net realized loss was decreased by $14,908, accumulated distributions in excess of net investment income was decreased by $3,882 and paid-in capital was decreased by $18,790 due to dividend redesignations and differences between book and tax accounting for paydown gain (loss). These reclassifications had no effect on the net assets or net asset value per share of the Fund.
As of December 31, 2017, the components of distributable earnings (accumulated losses) on a tax basis were as follows:
| Post October capital losses | ($160,363 | ) | |
| Net unrealized appreciation (depreciation) | $820,963 | ||
The differences between components of distributable earnings (accumulated losses) on a tax basis and the amounts reflected in the Statement of Assets and Liabilities are primarily due to temporary book-tax differences that will reverse in a subsequent period. These differences are primarily due to option contracts and futures contracts.
At December 31, 2017, the Fund had a net capital loss of $160,363 attributable to security transactions incurred after October 31, 2017 that it has elected to defer. This net capital loss is treated as arising on the first day of the Fund’s taxable year ending December 31, 2018.
www.calvert.com CALVERT ABSOLUTE RETURN BOND FUND ANNUAL REPORT 24
The cost and unrealized appreciation (depreciation) of investments, including open derivative contracts, of the Fund at December 31, 2017, as determined on a federal income tax basis, were as follows:
| Federal tax cost of investments | $110,126,489 | ||
| Gross unrealized appreciation | $1,025,337 | ||
| Gross unrealized depreciation | (204,374) | ||
| Net unrealized appreciation (depreciation) | $820,963 | ||
NOTE 5 — FINANCIAL INSTRUMENTS
A summary of futures contracts and options contracts outstanding at December 31, 2017 is included in the Schedule of Investments. During the year ended December 31, 2017, the Fund used futures contracts and options on futures contracts to hedge against interest rate changes and to manage overall duration of the Fund.
At December 31, 2017, the fair value of open derivative instruments (not considered to be hedging instruments for accounting disclosure purposes) and whose primary underlying risk exposure is interest rate risk was as follows:
| Derivative | Statement of Assets and Liabilities Caption | Assets | Liabilities | |||||
| Futures contracts | Net unrealized appreciation | $— | ($22,494 | ) | * | |||
| Options purchased | Investments in securities of unaffiliated issuers, at value | $28,750 | $— | |||||
| Total | $28,750 | ($22,494 | ) | |||||
| * Only the current day's variation margin is reported within the Statement of Assets and Liabilities as Receivable or Payable for variation margin on open futures contracts, as applicable. | ||||||||
The effect of derivative instruments (not considered to be hedging instruments for accounting disclosure purposes) on the Statement of Operations and whose primary underlying risk exposure is interest rate risk for the year ended December 31, 2017 was as follows:
| Statement of Operations Caption | ||||||
| Derivative | Net realized gain (loss) on investment securities and futures contracts, respectively | Net change in unrealized appreciation (depreciation) on investment securities and futures contracts, respectively | ||||
| Options purchased | $— | ($13,451 | ) | |||
| Futures contracts | ($63,468 | ) | ($54,319 | ) | ||
| Total | ($63,468 | ) | ($67,770 | ) | ||
The average notional cost of futures contracts (long) and futures contracts (short) outstanding during the year ended December 31, 2017 was approximately $1,595,000 and $4,529,000, respectively. The average number of purchased options contracts outstanding during the year ended December 31, 2017 was 14 contracts.
NOTE 6 — SECURITIES LENDING
To generate additional income, the Fund may lend its securities pursuant to a securities lending agency agreement with State Street Bank and Trust Company (SSB), the securities lending agent. Security loans are subject to termination by the Fund at any time and, therefore, are not considered to be illiquid investments. The Fund requires that the loan be continuously collateralized by either cash or securities as collateral equal at all times to at least 102% of the market value of the domestic securities loaned and 105% of the market value of the international securities loaned (if applicable). The market value of securities loaned is determined daily and any additional required collateral is delivered to the Fund on the next business day. Cash collateral is generally invested in a money market fund registered under the 1940 Act that is managed by an affiliate of SSB. Any gain or loss in the market price of the loaned securities that might occur and any interest earned or dividends declared during the term of the loan would accrue to the account of the Fund. Income earned on the investment of collateral, net of broker rebates and other expenses incurred by the securities lending agent, is split between the Fund and the securities lending agent on the basis of agreed upon contractual terms. Non-cash collateral, if any, is held by the lending agent on behalf of the Fund and cannot be sold or re-pledged by the Fund; accordingly, such collateral is not reflected in the Statement of Assets and Liabilities.
The risks associated with lending portfolio securities include, but are not limited to, possible delays in receiving additional collateral or in the recovery of the loaned securities, possible loss of rights to the collateral should the borrower fail financially, as
25 www.calvert.com CALVERT ABSOLUTE RETURN BOND FUND ANNUAL REPORT
well as risk of loss in the value of the collateral or the value of the investments made with the collateral. The securities lending agent shall indemnify the Fund in the case of default of any securities borrower.
The Fund did not have any securities on loan at December 31, 2017.
NOTE 7 — LINE OF CREDIT
The Fund participates with other funds managed by CRM in a $50 million ($25 million committed and $25 million uncommitted) unsecured line of credit agreement with SSB, which is in effect through August 7, 2018. Borrowings may be made for temporary or emergency purposes only. Borrowings bear interest at the higher of the One-Month London Interbank Offered Rate (LIBOR) in effect that day or the overnight Federal Funds Rate, plus 1.25% per annum. A commitment fee of 0.25% per annum is incurred on the unused portion of the committed facility. An administrative fee of $30,000 was paid in connection with the renewal of the uncommitted facility. These fees are allocated to all participating funds. Because the line of credit is not available exclusively to the Fund, it may be unable to borrow some or all of its requested amounts at any particular time. The Fund did not have any significant borrowings or allocated fees during the year ended December 31, 2017.
NOTE 8 — CAPITAL SHARES
Transactions in capital shares for the years ended December 31, 2017 and December 31, 2016 were as follows:
| Year Ended December 31, 2017 | Year Ended December 31, 2016 | |||||||||
| Shares | Amount | Shares | Amount | |||||||
| Class A | ||||||||||
| Shares sold | 811,038 | $12,308,566 | 588,493 | $8,850,842 | ||||||
| Reinvestment of distributions | 23,453 | 355,021 | 26,068 | 389,685 | ||||||
| Shares redeemed | (952,814) | (14,494,700) | (331,605) | (4,943,978) | ||||||
| Net increase (decrease) | (118,323) | ($1,831,113 | ) | 282,956 | $4,296,549 | |||||
| Class C | ||||||||||
| Shares sold | 20,664 | $313,956 | 31,597 | $470,857 | ||||||
| Reinvestment of distributions | 1,010 | 15,291 | 2,122 | 31,799 | ||||||
| Shares redeemed | (53,212) | (808,344) | (19,994) | (299,614) | ||||||
| Net increase (decrease) | (31,538) | ($479,097 | ) | 13,725 | $203,042 | |||||
| Class I | ||||||||||
| Shares sold | 2,087,260 | $31,607,686 | 1,380,469 | $20,419,670 | ||||||
| Reinvestment of distributions | 169,677 | 2,561,748 | 161,021 | 2,406,768 | ||||||
| Shares redeemed | (1,227,010) | (18,576,592) | (578,455) | (8,709,004) | ||||||
| Merger from Class Y shares | 1,601,935 | 24,304,721 | — | — | ||||||
| Net increase | 2,631,862 | $39,897,563 | 963,035 | $14,117,434 | ||||||
| Class Y(a) | ||||||||||
| Shares sold | 1,331,944 | $20,229,120 | 572,563 | $8,605,838 | ||||||
| Reinvestment of distributions | 27,929 | 424,007 | 14,250 | 213,858 | ||||||
| Shares redeemed | (449,661) | (6,835,546) | (187,925) | (2,797,994) | ||||||
| Merger to Class I shares | (1,598,700) | (24,304,721) | — | — | ||||||
| Net increase (decrease) | (688,488) | ($10,487,140 | ) | 398,888 | $6,021,702 | |||||
| (a) Effective December 8, 2017, Class Y shares of the Fund converted to Class I shares at net asset value. Thereafter, Class Y shares were terminated. | ||||||||||
At December 31, 2017, Calvert Conservative Allocation Fund, Calvert Moderate Allocation Fund and Eaton Vance Multi-Strategy Absolute Return Fund owned 23.3%, 28.9% and 4.6%, respectively, of the value of the outstanding shares of the Fund.
www.calvert.com CALVERT ABSOLUTE RETURN BOND FUND ANNUAL REPORT 26
NOTE 9 — NAME CHANGE
Effective November 6, 2017, the name of Calvert Absolute Return Bond Fund was changed from Calvert Unconstrained Bond Fund.
27 www.calvert.com CALVERT ABSOLUTE RETURN BOND FUND ANNUAL REPORT
REPORT OF INDEPENDENT REGISTERED PUBLIC ACCOUNTING FIRM
To the shareholders and board of trustees
Calvert Management Series:
Opinion on the Financial Statements
We have audited the accompanying statement of assets and liabilities of Calvert Absolute Return Bond Fund (the “Fund”), formerly, Calvert Unconstrained Bond Fund, a series of Calvert Management Series, including the schedule of investments, as of December 31, 2017, the related statement of operations for the year then ended, the statements of changes in net assets for each of the years in the two‑year period then ended, and the related notes (collectively, the “financial statements”) and the financial highlights for each of the years or periods in the four‑year period then ended. In our opinion, the financial statements and financial highlights present fairly, in all material respects, the financial position of the Fund as of December 31, 2017, the results of its operations for the year then ended, the changes in its net assets for each of the years in the two‑year period then ended, and the financial highlights for each of the years or periods in the four‑year period then ended, in conformity with U.S. generally accepted accounting principles.
Basis for Opinion
These financial statements and financial highlights are the responsibility of the Fund’s management. Our responsibility is to express an opinion on these financial statements and financial highlights based on our audits. We are a public accounting firm registered with the Public Company Accounting Oversight Board (United States) (“PCAOB”) and are required to be independent with respect to the Fund in accordance with the U.S. federal securities laws and the applicable rules and regulations of the Securities and Exchange Commission and the PCAOB.
We conducted our audits in accordance with the standards of the PCAOB. Those standards require that we plan and perform the audit to obtain reasonable assurance about whether the financial statements and financial highlights are free of material misstatement, whether due to error or fraud. Our audits included performing procedures to assess the risks of material misstatement of the financial statements and financial highlights, whether due to error or fraud, and performing procedures that respond to those risks. Such procedures included examining, on a test basis, evidence regarding the amounts and disclosures in the financial statements and financial highlights. Such procedures also included confirmation of securities owned as of December 31, 2017, by correspondence with custodians and brokers. Our audits also included evaluating the accounting principles used and significant estimates made by management, as well as evaluating the overall presentation of the financial statements and financial highlights. We believe that our audits provide a reasonable basis for our opinion.
/s/ KPMG LLP
We have served as the auditor of one or more of the Calvert Funds since 2002.
Philadelphia, Pennsylvania
February 23, 2018
www.calvert.com CALVERT ABSOLUTE RETURN BOND FUND ANNUAL REPORT 28
FEDERAL TAX INFORMATION
The Form 1099-DIV you received in February 2018 showed the tax status of all distributions paid to your account in calendar year 2017. Shareholders are advised to consult their own tax adviser with respect to the tax consequences of their investment in the Fund. As required by the Internal Revenue Code and/or regulations, shareholders must be notified regarding the status of capital gains dividends.
Capital Gains Dividends. The Fund hereby designates as a capital gain dividend with respect to the taxable year ended December 31, 2017, $683,291 or, if subsequently determined to be different, the net capital gain of such year.
29 www.calvert.com CALVERT ABSOLUTE RETURN BOND FUND ANNUAL REPORT (Unaudited)
MANAGEMENT AND ORGANIZATION
Fund Management. The Trustees of Calvert Management Series (the Trust) are responsible for the overall management and supervision of the Trust’s affairs. The Trustees and officers of the Trust are listed below. Except as indicated, each individual has held the office shown or other offices in the same company for the last five years. Trustees and officers of the Trust hold indefinite terms of office. The “Independent Trustees” consist of those Trustees who are not “interested persons” of the Trust, as that term is defined under the 1940 Act. The business address of each Trustee and officer, with the exception of Ms. Gemma and Mr. Kirchner, is 1825 Connecticut Avenue NW, Suite 400, Washington, DC 20009. As used below, “CRM” refers to Calvert Research and Management. Each Trustee oversees 38 funds in the Calvert fund complex. Each officer serves as an officer of certain other Calvert funds.
| Name and Year of Birth | Position with the Trust | Position Start Date | Principal Occupation(s) and Directorships During Past Five Years and Other Relevant Experience |
| Interested Trustee | |||
John H. Streur(1) 1960 | Trustee and President | 2015 | President and Chief Executive Officer of Calvert Research and Management (since December 31, 2016). President and Chief Executive Officer of Calvert Investments, Inc. (January 2015 - December 2016); Chief Executive Officer Elect of Calvert Investments, Inc. (October 2014 - January 2015); Chief Compliance Officer of Calvert Investment Distributors, Inc. (August 2015 - December 2016); Chief Compliance Officer of Calvert Investment Management (August 2015 - April 2016); President and Director, Portfolio 21 Investments, Inc. (through October 2014); President, Chief Executive Officer and Director, Managers Investment Group LLC (through January 2012); President and Director, The Managers Funds and Managers AMG Funds (through January 2012). Directorships in the Last Five Years. Portfolio 21 Investments, Inc. (asset management) (through October 2014); Managers Investment Group LLC (asset management) (through January 2012); The Managers Funds (asset management) (through January 2012); Managers AMG Funds (asset management) (through January 2012); Calvert Impact Capital, Inc. |
| Independent Trustees | |||
Richard L. Baird, Jr 1948 | Trustee | 1980 | Former President and CEO of Adagio Health Inc. (retired in 2014) in Pittsburgh, PA, a non-profit corporation which provides family planning services, nutrition, maternal/child health care, and various health screening services and community preventive health programs. Directorships in the Last Five Years. None. |
Alice Gresham Bullock(2) 1950 | Chair and Trustee | 2016 | Professor at Howard University School of Law (retired June 2016). She is former Dean of Howard University School of Law (1996-2002) and Deputy Director of the Association of American Law Schools (1992-1994). Directorships in the Last Five Years. None. |
Cari M. Dominguez(2) 1949 | Trustee | 2016 | Former Chair of the U.S. Equal Employment Opportunity Commission. Directorships in the Last Five Years. Manpower, Inc. (employment agency); Triple S Management Corporation (managed care); National Association of Corporate Directors. |
John G. Guffey, Jr. 1948 | Trustee | 1982 | President of Aurora Press Inc., a privately held publisher of trade paperbacks (since January 1997). Directorships in the Last Five Years. Calvert Impact Capital, Inc.; Calvert Ventures, LLC. |
Miles D. Harper, III(2) 1962 | Trustee | 2016 | Partner, Carr Riggs & Ingram (public accounting firm) since October 2014. Partner, Gainer Donnelly & Desroches (now Carr Riggs & Ingram) (public accounting firm), November 1999 - September 2014). Directorships in the Last Five Years. Bridgeway Funds (14) (asset management). |
Joy V. Jones(2) 1950 | Trustee | 2016 | Attorney. Directorships in the Last Five Years. Conduit Street Restaurants SUD 2 Limited; Palm Management Restaurant Corporation. |
www.calvert.com CALVERT ABSOLUTE RETURN BOND FUND ANNUAL REPORT (Unaudited) 30
| Name and Year of Birth | Position with the Trust | Position Start Date | Principal Occupation(s) and Directorships During Past Five Years and Other Relevant Experience |
| Independent Directors (continued) | |||
Anthony A. Williams 1951 | Trustee | 2010 | CEO and Executive Director of the Federal City Council (July 2012 to present); Senior Adviser and Independent Consultant for McKenna Long & Aldridge LLP (September 2011 to present); Executive Director of Global Government Practice at the Corporate Executive Board (January 2010 to January 2012). Directorships in the Last Five Years. Freddie Mac; Evoq Properties/ Meruelo Maddux Properties, Inc. (real estate management); Weston Solutions, Inc. (environmental services); Bipartisan Policy Center’s Debt Reduction Task Force; Chesapeake Bay Foundation; Catholic University of America; Urban Institute (research organization). |
| Principal Officers who are not Trustees | |||
| Name and Year of Birth | Position(s) with the Trust | Position Start Date | Principal Occupation(s) During Past Five Years |
Hope Brown 1973 | Chief Compliance Officer | 2014 | Chief Compliance Officer of 38 registered investment companies advised by CRM (since 2014). Vice President and Chief Compliance Officer, Wilmington Funds (2012-2014). Vice President and Senior Compliance Officer, Wilmington Trust Investment Advisors, Inc. (2010-2012). |
Maureen A. Gemma (3) 1960 | Vice President, Secretary and Chief Legal Officer | 2016 | Vice President of CRM and officer of 38 registered investment companies advised by CRM. Also Vice President of Eaton Vance Management (“EVM”) and certain of its affiliates and officer of 177 registered investment companies advised or administered by EVM. |
James F. Kirchner (3) 1967 | Treasurer | 2016 | Vice President of CRM and officer of 38 registered investment companies advised by CRM. Also Vice President of EVM and certain of its affiliates and officer of 177 registered investment companies advised or administered by EVM. |
(1) Mr. Streur is an interested person of the Fund because of his positions with the Fund’s Adviser and certain affiliates.
(2) Mmes. Bullock, Dominguez and Jones and Mr. Harper began serving as Trustees effective December 23, 2016.
(3) The business address for Ms. Gemma and Mr. Kirchner is Two International Place, Boston, MA 02110. Ms. Gemma and Mr. Kirchner began serving as Officers effective December 31, 2016.
The SAI for the Fund includes additional information about the Trustees and officers of the Fund and can be obtained without charge on Calvert’s website at www.calvert.com or by calling 1-800-368-2745.
31 www.calvert.com CALVERT ABSOLUTE RETURN BOND FUND ANNUAL REPORT (Unaudited)
IMPORTANT NOTICES
Privacy. The Calvert organization is committed to ensuring your financial privacy. Each of the financial institutions identified below has in effect the following policy (“Privacy Policy”) with respect to nonpublic personal information about its customers:
| • | Only such information received from you, through application forms or otherwise, and information about your Calvert fund transactions will be collected. This may include information such as name, address, social security number, tax status, account balances and transactions. |
| • | None of such information about you (or former customers) will be disclosed to anyone, except as permitted by law (which includes disclosure to employees necessary to service your account). In the normal course of servicing a customer’s account, the Calvert organization may share information with unaffiliated third parties that perform various required services such as transfer agents, custodians and broker-dealers. |
| • | Policies and procedures (including physical, electronic and procedural safeguards) are in place that are designed to protect the confidentiality of such information. |
| • | We reserve the right to change our Privacy Policy at any time upon proper notification to you. Customers may want to review our Privacy Policy periodically for changes by accessing the link on our homepage: www.calvert.com. |
Our pledge of privacy applies to the following entities within the Calvert organization: the Calvert family of funds and Calvert Research and Management. In addition, our Privacy Policy applies only to those Calvert customers who are individuals and who have a direct relationship with us. If a customer’s account (i.e., fund shares) is held in the name of a third-party financial advisor/broker-dealer, it is likely that only such advisor’s privacy policies apply to the customer. This notice supersedes all previously issued privacy disclosures. For more information about Calvert’s Privacy Policy, please call 1-800-368-2745.
Delivery of Shareholder Documents. The Securities and Exchange Commission (SEC) permits funds to deliver only one copy of shareholder documents, including prospectuses, proxy statements and shareholder reports, to fund investors with multiple accounts at the same residential or post office box address. This practice is often called “householding” and it helps eliminate duplicate mailings to shareholders. Calvert funds, or your financial advisor, may household the mailing of your documents indefinitely unless you instruct Calvert funds, or your financial advisor, otherwise. If you would prefer that your Calvert fund documents not be householded, please contact Calvert funds at 1-800-368-2745, or contact your financial advisor. Your instructions that householding not apply to delivery of your Calvert fund documents will typically be effective within 30 days of receipt by Calvert funds or your financial advisor. Separate statements will be generated for each separate account and will be householded as described above.
Portfolio Holdings. Each Calvert fund will file a schedule of portfolio holdings on Form N-Q with the SEC for the first and third quarters of each fiscal year. The Form N-Q will be available on the Calvert funds’ website at www.calvert.com, by calling Calvert funds at 1-800-368-2745 or in the EDGAR database on the SEC’s website at www.sec.gov. Form N-Q may also be reviewed and copied at the SEC’s public reference room in Washington, D.C. (call 1-800-732-0330 for information on the operation of the public reference room).
Proxy Voting. The Proxy Voting Guidelines that each Calvert fund uses to determine how to vote proxies relating to portfolio securities is provided as an Appendix to the fund’s Statement of Additional Information. The Statement of Additional Information can be obtained free of charge by calling the Calvert funds at 1-800-368-2745, by visiting the Calvert funds’ website at www.calvert.com or visiting the SEC’s website at www.sec.gov. Information regarding how a Calvert fund voted proxies relating to portfolio securities during the most recent 12-month period ended June 30 is available by calling Calvert funds, by visiting the Calvert funds’ website at www.calvert.com or by visiting the SEC’s website at www.sec.gov.
www.calvert.com CALVERT ABSOLUTE RETURN BOND FUND ANNUAL REPORT (Unaudited) 32
| CALVERT ABSOLUTE RETURN BOND FUND | |
Investment Adviser and Administrator Calvert Research and Management 1825 Connecticut Avenue NW, Suite 400 Washington, DC 20009 | Transfer Agent DST Asset Manager Solutions, Inc. (formerly known as Boston Financial Data Services, Inc. (“BFDS”)) 2000 Crown Colony Drive Quincy, MA 02169 |
Principal Underwriter* Eaton Vance Distributors, Inc. Two International Place Boston, MA 02110 (617) 482-8260 | Independent Registered Public Accounting Firm KPMG LLP 1601 Market Street Philadelphia, Pennsylvania 19103-2499 |
Custodian State Street Bank and Trust Company State Street Financial Center, One Lincoln Street Boston, MA 02111 | Fund Offices 1825 Connecticut Avenue NW, Suite 400 Washington, DC 20009 |
* FINRA BrokerCheck. Investors may check the background of their Investment Professional by contacting the Financial Industry Regulatory Authority (FINRA). FINRA BrokerCheck is a free tool to help investors check the professional background of current and former FINRA-registered securities firms and brokers. FINRA BrokerCheck is available by calling 1-800-289-9999 and at www.FINRA.org. The FINRA BrokerCheck brochure describing this program is available to investors at www.FINRA.org.
Fund shares are not insured by the FDIC and are not deposits or other obligations of, or guaranteed by, any depository institution. Shares are subject to investment risks, including possible loss of principal invested. This report is intended to provide fund information to shareholders. It is not authorized for distribution to prospective investors unless preceded or accompanied by a prospectus. Note: The information on our website is not incorporated by reference into this report; our website address is included as an inactive textual reference only. Investors should carefully consider the investment objectives, risks, charges and expenses of the Calvert funds. This and other important information is contained in the fund’s summary prospectus and prospectus, which can be obtained from your financial professional and should be read carefully before investing. You may also call Calvert funds at 800-368-2745. Printed on recycled paper. | |
| 24175 12.31.17 | |
Item 2. Code of Ethics
The registrant has adopted a code of ethics applicable to its Principal Executive Officer, Principal Financial Officer and Principal Accounting Officer. The registrant undertakes to provide a copy of such code of ethics to any person upon request, without charge, by calling 1-800-368-2745. The registrant has amended the code of ethics as described in Form N-CSR during the period covered by this report to make immaterial changes. The registrant has not granted any waiver, including an implicit waiver, from a provision of the code of ethics as described in Form N-CSR during the period covered by this report.
Item 3. Audit Committee Financial Expert
The registrant's Board of Trustees has determined that Miles D. Harper III, an “independent” Trustee serving on the registrant’s audit committee, is an “audit committee financial expert,” as defined in Item 3 of Form N-CSR. Under applicable securities laws, a person who is determined to be an audit committee financial expert will not be deemed an "expert" for any purpose, including without limitation for the purposes of Section 11 of the Securities Act of 1933, as a result of being designated or identified as an audit committee financial expert. The designation or identification of a person as an audit committee financial expert does not impose on such person any duties, obligations, or liabilities that are greater than the duties, obligations, and liabilities imposed on such person as a member of the audit committee and Board of Trustees in the absence of such designation or identification.
Item 4. Principal Accountant Fees and Services
(a) -(d)
The following table presents the aggregate fees billed to the registrant for the registrant’s fiscal years ended December 31, 2016 and December 31, 2017 by KPMG for professional services rendered for the audit of the registrant’s annual financial statements and fees billed for other services rendered by KPMG during such periods.
| Fiscal Years Ended | 12/31/16 | %* | 12/31/17 | %* |
| Audit Fees | $47,630 | 0% | $44,959 | 0% |
| Audit-Related Fees | $0 | 0% | $0 | 0% |
Tax Fees(1) | $8,600 | 0% | $11,000 | 0% |
| All Other Fees | $0 | 0% | $0 | 0% |
| Total | $56,230 | 0% | $55,959 | 0% |
*Percentage of fees approved by the Audit Committee pursuant to (c)(7)(i)(C) of Rule 2-01 of Reg. S-X (statutory de minimus waiver of Committee’s requirement to pre-approve)
(1) | Tax fees consist of the aggregate fees billed for professional services rendered by the principal accountant relating to tax compliance, tax advice, and tax planning and specifically include fees for tax return preparation and other related tax compliance/planning matters. |
(e) The Audit Committee is required to pre-approve all audit and non-audit services provided to the registrant by the auditors, and to the registrant’s investment adviser, and any entity controlling, controlled by, or under common control with the adviser that provides ongoing services to the registrant. In determining whether to pre-approve non-audit services, the Audit Committee considers whether the services are consistent with maintaining the independence of the auditors. The Committee may delegate its authority to pre-approve certain matters to one or more of its members. In this regard, the Committee has delegated authority jointly to the Audit Committee Chair together with another Committee member with respect to non-audit services not exceeding $25,000 in each instance. In addition, the Committee has pre-approved the retention of the auditors to provide tax-related services related to the tax treatment and tax accounting of newly acquired securities, upon request by the investment adviser in each instance.
(f) Not applicable.
(g) Aggregate non-audit fees billed by the registrant’s accountant for services rendered to the registrant, and rendered to the registrant’s investment adviser, and any entity controlling, controlled by, or under common control with the adviser that provides ongoing services to the registrant for each of the last two fiscal years of the registrant:
| Fiscal Year ended 12/31/16 | Fiscal Year ended 12/31/17 | ||
| $ | %* | $ | %* |
| $0 | 0% | $0 | 0% |
*Percentage of fees approved by the Audit Committee pursuant to (c)(7)(i)(C) of Rule 2-01 of Reg. S-X (statutory de minimus waiver of Committee’s requirement to pre-approve)
(h) The registrant’s audit committee has considered whether the provision by the registrant’s principal accountant of non-audit services to the registrant’s investment adviser and any entity controlling, controlled by, or under common control with the adviser that provides ongoing services to the registrant that were not pre-approved pursuant to Rule 2-01(c)(7)(ii) of Regulation S-X is compatible with maintaining the principal accountant’s independence.
Item 5. Audit Committee of Listed Registrants
Not applicable.
Item 6. Schedule of Investments
Please see schedule of investments contained in the Report to Stockholders included under Item 1 of this Form N-CSR.
Item 7. Disclosure of Proxy Voting Policies and Procedures for Closed-End Management Investment Companies
Not applicable.
Item 8. Portfolio Managers of Closed-End Management Investment Companies
Not applicable.
Item 9. Purchases of Equity Securities by Closed-End Management Investment Company and Affiliated Purchasers
Not applicable.
Item 10. Submission of Matters to a Vote of Security Holders
No material changes.
Item 11. Controls and Procedures
(a) The registrant’s principal executive and principal financial officers have concluded that the registrant's disclosure controls and procedures (as defined in Rule 30a-3(c) under the Investment Company Act of 1940 Act, as amended (the “1940
Act”) are effective, based on the evaluation of these controls and procedures required by Rule 30a-3(b) under the 1940 Act and Rules 13a-15(b) or 15d-15(b) under the Securities Exchange Act of 1934 (“Exchange Act”), as of a date within 90 days of the filing date of this report.
(b) There was no change in the registrant's internal control over financial reporting (as defined in Rule 30a-3(d) under the 1940 Act) that occurred during the second fiscal quarter of the period covered by this report that has materially affected, or is reasonably likely to materially affect, the registrant's internal control over financial reporting.
Item 12. Disclosure of Securities Lending Activities for Closed-End Management Investment Companies.
Not applicable.
Item 13. Exhibits
(a)(1) Registrant’s Code of Ethics - Not applicable (please see Item 2).
(a)(2)(i) Treasurer’s Section 302 certification.
(a)(2)(ii) President’s Section 302 certification.
(b) Combined Section 906 certification.
Signatures
Pursuant to the requirements of the Securities Exchange Act of 1934 and the Investment Company Act of 1940, the registrant has duly caused this report to be signed on its behalf by the undersigned, thereunto duly authorized.
CALVERT MANAGEMENT SERIES
By: /s/ John H. Streur
John H. Streur
President
Date: February 23, 2018
Pursuant to the requirements of the Securities Exchange Act of 1934 and the Investment Company Act of 1940, this report has been signed below by the following persons on behalf of the registrant and in the capacities and on the dates indicated.
By: /s/ James F. Kirchner
James F. Kirchner
Treasurer
Date: February 23, 2018
By: /s/ John H. Streur
John H. Streur
President
Date: February 23, 2018