UNITED STATES SECURITIES AND EXCHANGE COMMISSION
Form N-CSR
CERTIFIED SHAREHOLDER REPORT OF REGISTERED
MANAGEMENT INVESTMENT COMPANIES
Investment Company Act File Number: 811-03101
CALVERT MANAGEMENT SERIES
(Exact Name of Registrant as Specified in Charter)
1825 Connecticut Avenue NW, Suite 400, Washington, DC 20009
(Address of Principal Executive Offices)
Maureen A. Gemma
Two International Place, Boston, Massachusetts 02110
(Name and Address of Agent for Services)
(202) 238-2200
(Registrant’s Telephone Number)
September 30
Date of Fiscal Year End
September 30, 2018
Date of Reporting Period
____________________________________________________________________________________
Item 1. Reports to Stockholders
Calvert Floating-Rate Advantage Fund
Calvert Ultra-Short Duration Income NextShares
 |  | |
Calvert Floating-Rate Advantage Fund |  | |
 |  | |
Annual Report September 30, 2018 E-Delivery Sign-Up — Details Inside |  |
Commodity Futures Trading Commission Registration. Effective December 31, 2012, the Commodity Futures Trading Commission (“CFTC”) adopted certain regulatory changes that subject registered investment companies and advisers to regulation by the CFTC if a fund invests more than a prescribed level of its assets in certain CFTC-regulated instruments (including futures, certain options and swap agreements) or markets itself as providing investment exposure to such instruments. The Fund and its adviser have claimed an exclusion from the definition of the term “commodity pool operator” under the Commodity Exchange Act. Accordingly, neither the Fund nor the adviser is subject to CFTC regulation. |
Choose Planet-friendly E-delivery! Sign up now for on-line statements, prospectuses, and fund reports. In less than five minutes you can help reduce paper mail and lower fund costs. Just go to www.calvert.com. If you already have an online account with the Calvert funds, click on Login to access your Account and select the documents you would like to receive via e-mail. If you’re new to online account access, click on Login, then Register to create your user name and password. Once you’re in, click on the E-delivery sign-up on the Account Portfolio page and follow the quick, easy steps. Note: If your shares are not held directly with the Calvert funds but through a brokerage firm, you must contact your broker for electronic delivery options available through their firm. |
2 www.calvert.com CALVERT FLOATING-RATE ADVANTAGE FUND ANNUAL REPORT (UNAUDITED)
 | TABLE OF CONTENTS | |||
| Management’s Discussion of Fund Performance | ||||
| Performance | ||||
| Fund Profile | ||||
| Endnotes and Additional Disclosures | ||||
| Fund Expenses | ||||
| Financial Statements | ||||
| Report of Independent Registered Public Accounting Firm | ||||
| Federal Tax Information | ||||
| Management and Organization | ||||
| Important Notices | ||||
3 www.calvert.com CALVERT FLOATING-RATE ADVANTAGE FUND ANNUAL REPORT (UNAUDITED)
MANAGEMENT’S DISCUSSION OF FUND PERFORMANCE1
Economic and Market Conditions
The U.S. floating-rate market experienced a positive return and limited price volatility for the 12-month period ended September 30, 2018, with the S&P/LSTA Leveraged Loan Index (the Index),2 a broad barometer of the U.S. loan market, returning 5.19%. For the period as a whole, performance was composed almost entirely of coupon generation, with loan prices mostly moving sideways.
The U.S. Federal Reserve Board increased interest rates four times during the period and projected another rate hike before the end of 2018, as well as three more potential increases in 2019. Unlike fixed-income securities, the impact of interest rate changes on the value of floating-rate loans is typically reduced by periodic interest rate resets. As a result, the loan market was helped by increasing investor demand for floating-rate loans during this rising rate environment.
Technical conditions were positive for most of the period, with demand generally outpacing supply. The collateralized loan obligation market was a constantly strong driver of demand, and retail mutual funds saw positive inflows during the period. Loan prices were relatively stable, due to firm technical conditions.
With the U.S. economy’s recovery accelerating modestly during the period, health in corporate fundamentals continued to reflect relatively benign conditions. While the high-profile default of iHeart Media, an Index component, pushed up the default rate to 1.98% on a last-twelve-month basis in June 2018, the default rate settled down to close the period at 1.81%, well below its long-term average.
Fund Performance
From its inception on October 10, 2017 through September 30, 2018, Calvert Floating-Rate Advantage Fund (the Fund) Class A shares at net asset value (NAV) had a total return of 3.25%, underperforming its benchmark, the Index, which returned 4.95%.
The Index is unmanaged and returns do not reflect the effect of any applicable sales charges, commissions, expenses, or leverage. The Fund’s performance relative to the Index during the period was a function of credit quality positioning, sector allocation, and loan selection.
The Fund’s credit quality positioning acted as a headwind for relative performance versus the Index during the period. At the distressed-end of the market, loans rated CCC6 outperformed the broader market, while loans rated D (defaulted) underperformed. As a result, the Fund’s underweight to loans rated CCC was a relative detractor to performance versus the Index during the period.
Within sector allocations, the Fund’s underweight to the retailers (except food and drug) sector relative to the Index detracted from performance versus the Index. Similarly, the Fund’s underweight to the oil and gas sector also detracted from performance versus the Index as oil prices rallied during the period. The Fund’s overweight to the steel sector and underweight to both the lodging and casinos and aerospace and defense sectors contributed to relative performance versus the Index. Meanwhile, loan selection contributed to Fund performance versus the Index within the business equipment and services and publishing sectors.
The Fund’s employment of investment leverage5 contributed to performance versus the Index as well. Utilization of leverage was helpful in that it enhanced the positive return of the Fund’s underlying portfolio. The Index does not use leverage.
See Endnotes and Additional Disclosures in this report. Past performance is no guarantee of future results. Returns are historical and are calculated by determining the percentage change in net asset value (NAV) or offering price (as applicable) with all distributions reinvested. Investment return and principal value will fluctuate so that shares, when redeemed, may be worth more or less than their original cost. Performance less than or equal to one year is cumulative. Performance is for the stated time period only; due to market volatility, the Fund’s current performance may be lower or higher than quoted. Returns are before taxes unless otherwise noted. For performance as of the most recent month-end, please refer to www.calvert.com. |
2 www.calvert.com CALVERT FLOATING-RATE ADVANTAGE FUND ANNUAL REPORT (Unaudited)
PERFORMANCE
Performance2,3 | ||||||||||||||
Portfolio Managers Scott H. Page, CFA, Craig P. Russ, and Catherine C. McDermott, each of Calvert Research and Management | ||||||||||||||
| % Cumulative Total Returns | Class Inception Date | Performance Inception Date | One Year | Five Years | Since Inception | |||||||||
| Class A at NAV | 10/10/2017 | 10/10/2017 | — | % | — | % | 3.25 | % | ||||||
| Class A with 3.75% Maximum Sales Charge | — | — | — | — | -0.62 | |||||||||
| Class I at NAV | 10/10/2017 | 10/10/2017 | — | — | 3.48 | |||||||||
| Class R6 at NAV | 10/10/2017 | 10/10/2017 | — | — | 3.35 | |||||||||
| S&P/LSTA Leveraged Loan Index | — | — | 5.19 | % | 4.13 | % | 4.95 | % | ||||||
% Total Annual Operating Expense Ratios4 | Class A | Class I | Class R6 | |||||||||||
| Gross | 1.83 | % | 1.58 | % | 1.53 | % | ||||||||
| Net | 1.59 | 1.34 | 1.29 | |||||||||||
% Total Leverage5 | ||||||||||||||
| Borrowings | 18.79 | % | ||||||||||||
| Growth of $10,000 |
| This graph shows the change in value of a hypothetical investment of $10,000 in Class A of the Fund for the period indicated. For comparison, the same investment is shown in the indicated index. |
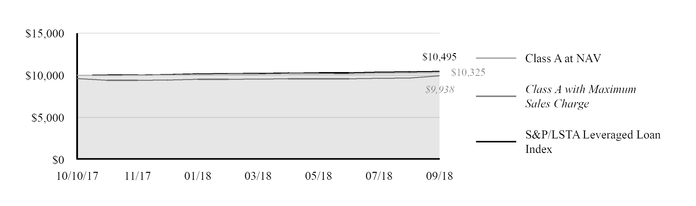
| Growth of Investment | Amount Invested | Period Beginning | At NAV | With Maximum Sales Charge | ||||
| Class I | $250,000 | 10/10/2017 | $258,700 | N.A. | ||||
| Class R6 | $1,000,000 | 10/10/2017 | $1,033,500 | N.A. | ||||
See Endnotes and Additional Disclosures in this report.
Past performance is no guarantee of future results. Returns are historical and are calculated by determining the percentage change in net asset value (NAV) or offering price (as applicable) with all distributions reinvested. Investment return and principal value will fluctuate so that shares, when redeemed, may be worth more or less than their original cost. Performance less than or equal to one year is cumulative. Performance is for the stated time period only; due to market volatility, the Fund’s current performance may be lower or higher than quoted. Returns are before taxes unless otherwise noted. For performance as of the most recent month-end, please refer to www.calvert.com.
www.calvert.com CALVERT FLOATING-RATE ADVANTAGE FUND ANNUAL REPORT (Unaudited) 3
FUND PROFILE
| TEN LARGEST SECTORS (% of total investments) | TEN LARGEST ISSUERS (% of total investments) | ||||||
| Health Care | 12.0 | % | Reynolds Group Holdings, Inc. | 1.2 | % | ||
| Electronics/Electrical | 11.9 | % | Jaguar Holding Company II | 1.2 | % | ||
| Business Equipment and Services | 9.1 | % | Sprint Communications, Inc. | 1.1 | % | ||
| Telecommunications | 6.8 | % | US Foods, Inc. | 1.0 | % | ||
| Industrial Equipment | 6.7 | % | Virgin Media Investment Holdings Limited | 1.0 | % | ||
| Financial Intermediaries | 4.3 | % | Kronos Incorporated | 1.0 | % | ||
| Containers and Glass Products | 4.3 | % | SBA Senior Finance II, LLC | 1.0 | % | ||
| Chemicals and Plastics | 4.2 | % | Burger King | 1.0 | % | ||
| Cable and Satellite Television | 4.0 | % | Post Holdings, Inc. | 1.0 | % | ||
| Leisure Goods/Activities/Movies | 4.0 | % | Infor (US), Inc. | 1.0 | % | ||
| Total | 67.3 | % | Total | 10.5 | % | ||
CREDIT QUALITY (% of loan holdings)6 | |||||||
| BBB | 7.7 | % | |||||
| BB | 36.4 | % | |||||
| B | 53.4 | % | |||||
| CCC or Lower | 0.8 | % | |||||
| Not Rated | 1.7 | % | |||||
| Total | 100.0 | % | |||||
See Endnotes and Additional Disclosures in this report.
4 www.calvert.com CALVERT FLOATING-RATE ADVANTAGE FUND ANNUAL REPORT (Unaudited)
| Endnotes and Additional Disclosures | ||
1 The views expressed in this report are those of the portfolio manager(s) and are current only through the date stated on the cover. These views are subject to change at any time based upon market or other conditions, and Calvert and the Fund(s) disclaim any responsibility to update such views. These views may not be relied upon as investment advice and, because investment decisions are based on many factors, may not be relied upon as an indication of trading intent on behalf of any Calvert fund. This commentary may contain statements that are not historical facts, referred to as “forward looking statements.” The Fund’s actual future results may differ significantly from those stated in any forward looking statement, depending on factors such as changes in securities or financial markets or general economic conditions, the volume of sales and purchases of Fund shares, the continuation of investment advisory, administrative and service contracts, and other risks discussed from time to time in the Fund’s filings with the Securities and Exchange Commission.
2 | S&P/LSTA Leveraged Loan Index is an unmanaged index of the institutional leveraged loan market. Unless otherwise stated, index returns do not reflect the effect of any applicable sales charges, commissions, expenses, taxes or leverage, as applicable. It is not possible to invest directly in an index. |
3 | Cumulative Total Returns at NAV do not include applicable sales charges. If sales charges were deducted, the returns would be lower. Cumulative Total Returns shown with maximum sales charge reflect the stated maximum sales charge. Unless otherwise stated, performance does not reflect the deduction of taxes on Fund distributions or redemptions of Fund shares. Performance since inception for an index, if presented, is the performance since the Fund’s or oldest share class’ inception, as applicable. |
4 | Net expense ratio reflects a contractual expense reimbursement that continues through 1/31/19. Without the reimbursement, performance would have been lower. The expense ratios for the current reporting period can be found in the Financial Highlights section of this report. |
5 | Total leverage is shown as a percentage of the Fund’s aggregate net assets plus borrowings outstanding. The Fund employs leverage through borrowings. Use of leverage creates an opportunity for income, but creates risks including greater volatility of NAV. The cost of borrowings rises and falls with changes in short-term interest rates. The Fund may be required to maintain prescribed asset coverage for its borrowings and may be required to reduce its borrowings at an inopportune time. |
6 | Credit ratings are categorized using S&P Global Ratings (“S&P”). Ratings, which are subject to change, apply to the creditworthiness of the issuers of the underlying securities and not to the Fund or its shares. Credit ratings measure the quality of a bond based on the issuer’s creditworthiness, with ratings ranging from AAA, being the highest, to D, being the lowest based on S&P’s measures. Ratings of BBB or higher by S&P are considered to be investment-grade quality. Credit ratings are based largely on the ratings agency’s analysis at the time of rating. The rating assigned to any particular security is not necessarily a reflection of the issuer’s current financial condition and does not necessarily reflect its assessment of the volatility of a security’s market value or of the liquidity of an investment in the security. Holdings designated as Not Rated (if any) are not rated by S&P. |
Fund profile subject to change due to active management.
www.calvert.com CALVERT FLOATING-RATE ADVANTAGE FUND ANNUAL REPORT (Unaudited) 5
FUND EXPENSES
Example
As a Fund shareholder, you incur two types of costs: (1) transaction costs, including sales charges (loads) on purchases and redemption fees (if applicable); and (2) ongoing costs, including management fees; distribution and/or service fees; and other Fund expenses. This Example is intended to help you understand your ongoing costs (in dollars) of Fund investing and to compare these costs with the ongoing costs of investing in other mutual funds. The Example is based on an investment of $1,000 invested at the beginning of the period and held for the entire period (April 1, 2018 to September 30, 2018).
Actual Expenses
The first section of the table below provides information about actual account values and actual expenses. You may use the information in this section, together with the amount you invested, to estimate the expenses that you paid over the period. Simply divide your account value by $1,000 (for example, an $8,600 account value divided by $1,000 = 8.6), then multiply the result by the number in the first section under the heading entitled “Expenses Paid During Period” to estimate the expenses you paid on your account during this period.
Hypothetical Example for Comparison Purposes
The second section of the table below provides information about hypothetical account values and hypothetical expenses based on the actual Fund expense ratio and an assumed rate of return of 5% per year (before expenses), which is not the actual Fund return. The hypothetical account values and expenses may not be used to estimate the actual ending account balance or expenses you paid for the period. You may use this information to compare the ongoing costs of investing in the Fund and other funds. To do so, compare this 5% hypothetical example with the 5% hypothetical examples that appear in the shareholder reports of the other funds.
Please note that the expenses shown in the table are meant to highlight your ongoing costs only and do not reflect any transactional costs, such as sales charges (loads) or redemption fees (if applicable). Therefore, the second section of the table is useful in comparing ongoing costs only, and will not help you determine the relative total costs of owning different funds. In addition, if these transactional costs were included, your costs would be higher.
| BEGINNING ACCOUNT VALUE (4/1/18) | ENDING ACCOUNT VALUE (9/30/18) | EXPENSES PAID DURING PERIOD* (4/1/18 - 9/30/18) | ANNUALIZED EXPENSE RATIO | |
| Actual | ||||
| Class A | $1,000.00 | $1,018.90 | $10.83** | 2.14% |
| Class I | $1,000.00 | $1,020.20 | $9.07** | 1.79% |
| Class R6 | $1,000.00 | $1,018.80 | $9.21** | 1.82% |
| Hypothetical | ||||
| (5% return per year before expenses) | ||||
| Class A | $1,000.00 | $1,014.34 | $10.81** | 2.14% |
| Class I | $1,000.00 | $1,016.09 | $9.05** | 1.79% |
| Class R6 | $1,000.00 | $1,015.94 | $9.20** | 1.82% |
| * Expenses are equal to the Fund’s annualized expense ratio for the indicated Class, multiplied by the average account value over the period, multiplied by 183/365 (to reflect the one-half year period). The Example assumes that the $1,000 was invested at the net asset value per share determined at the close of business on March 31, 2018. | ||||
| ** Absent a waiver and/or reimbursement of expenses by an affiliate, expenses would be higher. | ||||
6 www.calvert.com CALVERT FLOATING-RATE ADVANTAGE FUND ANNUAL REPORT (Unaudited)
CALVERT FLOATING-RATE ADVANTAGE FUND
SCHEDULE OF INVESTMENTS
SEPTEMBER 30, 2018
| PRINCIPAL AMOUNT ($) | VALUE ($) | |
| SENIOR FLOATING RATE LOANS (1) - 119.9% | ||
| Aerospace and Defense - 0.6% | ||
| Accudyne Industries, LLC, Term Loan, 5.242%, (1 mo. USD LIBOR + 3.00%), 8/18/24 | 227,197 | 228,427 |
| WP CPP Holdings, LLC, Term Loan, 4/30/25 (2) | 250,000 | 251,927 |
| 480,354 | ||
| Automotive - 2.9% | ||
| American Axle and Manufacturing, Inc., Term Loan, 4.462%, (USD LIBOR + 2.25%), 4/6/24 (3) | 641,772 | 642,775 |
| CS Intermediate Holdco 2, LLC, Term Loan, 4.242%, (1 mo. USD LIBOR + 2.00%), 11/2/23 | 643,451 | 646,366 |
| Dayco Products, LLC, Term Loan, 6.563%, (3 mo. USD LIBOR + 4.25%), 5/19/23 | 196,386 | 198,227 |
| TI Group Automotive Systems, LLC, Term Loan, 4.742%, (1 mo. USD LIBOR + 2.50%), 6/30/22 | 407,061 | 408,842 |
| Tower Automotive Holdings USA, LLC, Term Loan, 4.875%, (1 mo. USD LIBOR + 2.75%), 3/7/24 | 522,448 | 525,714 |
| 2,421,924 | ||
| Brokerage/Securities Dealers/Investment Houses - 0.6% | ||
| Advisor Group, Inc., Term Loan, 5.908%, (1 mo. USD LIBOR + 3.75%), 8/15/25 | 350,000 | 352,406 |
| Cetera Financial Group, Inc., Term Loan, 8/15/25 (2) | 125,000 | 125,781 |
| 478,187 | ||
| Building and Development - 4.1% | ||
| American Builders & Contractors Supply Co., Inc., Term Loan, 4.242%, (1 mo. USD LIBOR + 2.00%), 10/31/23 | 893,199 | 891,980 |
| Core & Main L.P., Term Loan, 5.317%, (3 mo. USD LIBOR + 3.00%), 8/1/24 | 547,750 | 550,571 |
| DTZ U.S. Borrower, LLC, Term Loan, 5.492%, (1 mo. USD LIBOR + 3.25%), 8/21/25 | 575,000 | 577,635 |
| GGP, Inc., Term Loan, 4.742%, (1 mo. USD LIBOR + 2.50%), 8/27/25 | 250,000 | 249,018 |
| Henry Company, LLC, Term Loan, 6.242%, (1 mo. USD LIBOR + 4.00%), 10/5/23 | 272,917 | 274,793 |
| Realogy Group, LLC, Term Loan, 4.398%, (1 mo. USD LIBOR + 2.25%), 2/8/25 | 643,500 | 646,396 |
| Werner FinCo L.P., Term Loan, 6.104%, (1 mo. USD LIBOR + 4.00%), 7/24/24 | 198,998 | 199,122 |
| 3,389,515 | ||
| Business Equipment and Services - 10.9% | ||
| AlixPartners, LLP, Term Loan, 4.992%, (1 mo. USD LIBOR + 2.75%), 4/4/24 | 297,733 | 299,408 |
| AppLovin Corporation, Term Loan, 6.064%, (3 mo. USD LIBOR + 3.75%), 8/15/25 | 350,000 | 352,990 |
| Brand Energy & Infrastructure Services, Inc., Term Loan, 6.596%, (3 mo. USD LIBOR + 4.25%), 6/21/24 | 197,995 | 199,480 |
| Camelot UK Holdco Limited, Term Loan, 5.492%, (1 mo. USD LIBOR + 3.25%), 10/3/23 | 198,000 | 198,566 |
| Cast and Crew Payroll, LLC, Term Loan, 5.00%, (1 mo. USD LIBOR + 2.75%), 9/27/24 | 248,120 | 248,586 |
| Ceridian HCM Holding Inc., Term Loan, 5.492%, (1 mo. USD LIBOR + 3.25%), 4/5/25 | 500,000 | 501,640 |
| Change Healthcare Holdings, LLC, Term Loan, 4.992%, (1 mo. USD LIBOR + 2.75%), 3/1/24 | 834,403 | 838,111 |
| CPM Holdings, Inc., Term Loan, 5.742%, (1 mo. USD LIBOR + 3.50%), 4/11/22 | 197,356 | 198,466 |
| Cypress Intermediate Holdings III, Inc., Term Loan, 5.25%, (1 mo. USD LIBOR + 3.00%), 4/27/24 | 372,553 | 374,474 |
| EIG Investors Corp., Term Loan, 6.061%, (3 mo. USD LIBOR + 3.75%), 2/9/23 | 458,008 | 462,188 |
| Garda World Security Corporation, Term Loan, 5.826%, (3 mo. USD LIBOR + 3.50%), 5/24/24 | 494,987 | 497,875 |
| Iron Mountain, Inc., Term Loan, 3.992%, (1 mo. USD LIBOR + 1.75%), 1/2/26 | 99,500 | 98,464 |
www.calvert.com CALVERT FLOATING-RATE ADVANTAGE FUND ANNUAL REPORT 7
| PRINCIPAL AMOUNT ($) | VALUE ($) | |
| SENIOR FLOATING RATE LOANS (1) - CONT’D | ||
| J.D. Power and Associates, Term Loan, 6.492%, (1 mo. USD LIBOR + 4.25%), 9/7/23 | 296,970 | 298,918 |
| KAR Auction Services, Inc., Term Loan, 4.938%, (3 mo. USD LIBOR + 2.50%), 3/9/23 | 645,090 | 648,715 |
| Kronos Incorporated, Term Loan, 5.343%, (3 mo. USD LIBOR + 3.00%), 11/1/23 | 993,375 | 999,303 |
| LegalZoom.com, Inc., Term Loan, 6.462%, (1 mo. USD LIBOR + 4.25%), 11/21/24 | 248,098 | 252,130 |
| Pre-Paid Legal Services, Inc., Term Loan, 5.492%, (1 mo. USD LIBOR + 3.25%), 5/1/25 | 333,231 | 335,678 |
| Prime Security Services Borrower, LLC, Term Loan, 4.992%, (1 mo. USD LIBOR + 2.75%), 5/2/22 | 457,815 | 460,549 |
| ServiceMaster Company, Term Loan, 4.742%, (1 mo. USD LIBOR + 2.50%), 11/8/23 | 255,316 | 256,687 |
| SMG Holdings, Inc., Term Loan, 5.242%, (1 mo. USD LIBOR + 3.00%), 1/23/25 | 248,750 | 250,382 |
| Spin Holdco, Inc., Term Loan, 5.589%, (3 mo. USD LIBOR + 3.25%), 11/14/22 | 297,739 | 299,153 |
| Tempo Acquisition, LLC, Term Loan, 5.242%, (1 mo. USD LIBOR + 3.00%), 5/1/24 | 248,116 | 249,325 |
| Travelport Finance (Luxembourg) S.a.r.l., Term Loan, 4.814%, (3 mo. USD LIBOR + 2.50%), 3/17/25 | 198,929 | 199,227 |
| Vestcom Parent Holdings, Inc., Term Loan, 6.242%, (1 mo. USD LIBOR + 4.00%), 12/19/23 | 197,992 | 198,982 |
| West Corporation, Term Loan, 6.242%, (1 mo. USD LIBOR + 4.00%), 10/10/24 | 248,747 | 248,315 |
| 8,967,612 | ||
| Cable and Satellite Television - 4.8% | ||
| CSC Holdings, LLC, Term Loan, 4.408%, (1 mo. USD LIBOR + 2.25%), 7/17/25 | 646,725 | 647,399 |
| Radiate Holdco, LLC, Term Loan, 5.242%, (1 mo. USD LIBOR + 3.00%), 2/1/24 | 197,990 | 197,878 |
| Telenet Financing USD, LLC, Term Loan, 4.408%, (1 mo. USD LIBOR + 2.25%), 8/15/26 | 275,000 | 274,083 |
| UPC Financing Partnership, Term Loan, 4.658%, (1 mo. USD LIBOR + 2.50%), 1/15/26 | 832,911 | 833,259 |
| Virgin Media Bristol, LLC, Term Loan, 4.658%, (1 mo. USD LIBOR + 2.50%), 1/15/26 | 1,000,000 | 1,002,687 |
| Ziggo Secured Finance Partnership, Term Loan, 4.658%, (1 mo. USD LIBOR + 2.50%), 4/15/25 | 1,000,000 | 982,969 |
| 3,938,275 | ||
| Chemicals and Plastics - 5.0% | ||
| Alpha 3 B.V., Term Loan, 5.386%, (3 mo. USD LIBOR + 3.00%), 1/31/24 | 342,891 | 344,712 |
| Axalta Coating Systems US Holdings, Inc., Term Loan, 4.136%, (3 mo. USD LIBOR + 1.75%), 6/1/24 | 796,000 | 798,487 |
| Invictus US, LLC, Term Loan, 5.195%, (2 mo. USD LIBOR + 3.00%), 3/28/25 | 248,750 | 250,771 |
| Minerals Technologies, Inc., Term Loan, 4.463%, (USD LIBOR + 2.25%), 2/14/24 (3) | 604,096 | 609,375 |
| PMHC II, Inc., Term Loan, 6.151%, (USD LIBOR + 3.50%), 3/31/25 (3) | 249,373 | 243,763 |
| PQ Corporation, Term Loan, 4.742%, (1 mo. USD LIBOR + 2.50%), 2/8/25 | 551,392 | 552,598 |
| Starfruit Finco B.V., Term Loan, 9/20/25 (2) | 325,000 | 326,770 |
| Unifrax Corporation, Term Loan, 5.886%, (3 mo. USD LIBOR + 3.50%), 4/4/24 | 198,000 | 200,970 |
| Univar, Inc., Term Loan, 4.492%, (1 mo. USD LIBOR + 2.25%), 7/1/24 | 815,256 | 818,200 |
| 4,145,646 | ||
| Conglomerates - 0.9% | ||
| Penn Engineering & Manufacturing Corp., Term Loan, 4.992%, (1 mo. USD LIBOR + 2.75%), 6/27/24 | 743,103 | 750,051 |
| Containers and Glass Products - 5.1% | ||
| Berlin Packaging, LLC, Term Loan, 5.16%, (USD LIBOR + 3.00%), 11/7/25 (3) | 249,375 | 249,706 |
| Berry Global, Inc., Term Loan, 4.186%, (1 mo. USD LIBOR + 2.00%), 10/1/22 | 610,480 | 612,028 |
| BWAY Holding Company, Term Loan, 5.581%, (3 mo. USD LIBOR + 3.25%), 4/3/24 | 347,995 | 348,212 |
| Consolidated Container Company, LLC, Term Loan, 4.992%, (1 mo. USD LIBOR + 2.75%), 5/22/24 | 397,995 | 400,047 |
8 www.calvert.com CALVERT FLOATING-RATE ADVANTAGE FUND ANNUAL REPORT
| PRINCIPAL AMOUNT ($) | VALUE ($) | |
| SENIOR FLOATING RATE LOANS (1) - CONT’D | ||
| Flex Acquisition Company, Inc.: | ||
| Term Loan, 5.337%, (3 mo. USD LIBOR + 3.00%), 12/29/23 | 496,231 | 496,696 |
| Term Loan, 5.751%, (3 mo. USD LIBOR + 3.25%), 6/29/25 | 150,000 | 150,469 |
| Libbey Glass, Inc., Term Loan, 5.133%, (1 mo. USD LIBOR + 3.00%), 4/9/21 | 247,855 | 248,010 |
| Pelican Products, Inc., Term Loan, 5.604%, (1 mo. USD LIBOR + 3.50%), 5/1/25 | 74,813 | 74,988 |
| Reynolds Group Holdings, Inc., Term Loan, 4.992%, (1 mo. USD LIBOR + 2.75%), 2/5/23 | 1,140,919 | 1,147,416 |
| SIG Combibloc US Acquisition, Inc, Term Loan, 7.00%, (3 mo. USD Prime + 1.75%), 3/13/22 | 470,997 | 472,469 |
| 4,200,041 | ||
| Cosmetics/Toiletries - 0.7% | ||
| KIK Custom Products, Inc., Term Loan, 6.242%, (1 mo. USD LIBOR + 4.00%), 5/15/23 | 550,000 | 548,109 |
| Drugs - 3.9% | ||
| Albany Molecular Research, Inc., Term Loan, 5.492%, (1 mo. USD LIBOR + 3.25%), 8/30/24 | 198,000 | 198,557 |
| Amneal Pharmaceuticals, LLC, Term Loan, 5.75%, (1 mo. USD LIBOR + 3.50%), 5/4/25 | 623,293 | 629,915 |
| Arbor Pharmaceuticals, Inc., Term Loan, 7.485%, (3 mo. USD LIBOR + 5.00%), 7/5/23 | 292,308 | 294,622 |
| Endo Luxembourg Finance Company I S.a.r.l., Term Loan, 6.50%, (1 mo. USD LIBOR + 4.25%), 4/29/24 | 941,222 | 949,458 |
| Jaguar Holding Company II, Term Loan, 4.742%, (1 mo. USD LIBOR + 2.50%), 8/18/22 | 1,139,504 | 1,141,641 |
| 3,214,193 | ||
| Ecological Services and Equipment - 1.1% | ||
| GFL Environmental, Inc.: | ||
| Term Loan, 2.75%, 5/30/25 (4) | 30,387 | 30,463 |
| Term Loan, 5.136%, (3 mo. USD LIBOR + 2.75%), 5/30/25 | 244,002 | 244,612 |
| Wrangler Buyer Corp., Term Loan, 4.992%, (1 mo. USD LIBOR + 2.75%), 9/27/24 | 595,500 | 599,780 |
| 874,855 | ||
| Electronics/Electrical - 14.3% | ||
| Almonde, Inc., Term Loan, 5.886%, (USD LIBOR + 3.50%), 6/13/24 (3) | 476,891 | 477,748 |
| Applied Systems, Inc., Term Loan, 5.386%, (3 mo. USD LIBOR + 3.00%), 9/19/24 | 594,744 | 598,999 |
| Aptean, Inc., Term Loan, 6.64%, (3 mo. USD LIBOR + 4.25%), 12/20/22 | 178,350 | 179,316 |
| Avast Software B.V., Term Loan, 4.886%, (3 mo. USD LIBOR + 2.50%), 9/30/23 | 377,989 | 380,646 |
| Barracuda Networks, Inc., Term Loan, 5.408%, (1 mo. USD LIBOR + 3.25%), 2/12/25 | 249,375 | 250,076 |
| Blackhawk Network Holdings, Inc., Term Loan, 5.386%, (3 mo. USD LIBOR + 3.00%), 6/15/25 | 74,813 | 75,381 |
| BMC Software Finance, Inc., Term Loan, 9/1/25 (2) | 500,000 | 505,371 |
| Epicor Software Corporation, Term Loan, 5.50%, (1 mo. USD LIBOR + 3.25%), 6/1/22 | 595,385 | 598,042 |
| EXC Holdings III Corp., Term Loan, 5.886%, (3 mo. USD LIBOR + 3.50%), 12/2/24 | 198,500 | 200,361 |
| Eze Castle Software, Inc., Term Loan, 5.242%, (1 mo. USD LIBOR + 3.00%), 4/6/20 | 296,888 | 298,187 |
| GlobalLogic Holdings, Inc.: | ||
| Term Loan, 8/1/25 (2) | 50,000 | 50,484 |
| Term Loan, 8/1/25 (2) | 350,000 | 353,391 |
| Go Daddy Operating Company, LLC, Term Loan, 4.492%, (1 mo. USD LIBOR + 2.25%), 2/15/24 | 813,812 | 817,809 |
| GTCR Valor Companies, Inc., Term Loan, 5.636%, (3 mo. USD LIBOR + 3.25%), 6/16/23 | 236,013 | 237,724 |
| Hyland Software, Inc., Term Loan, 5.492%, (1 mo. USD LIBOR + 3.25%), 7/1/22 | 321,859 | 324,440 |
| Infoblox, Inc., Term Loan, 6.742%, (1 mo. USD LIBOR + 4.50%), 11/7/23 | 248,125 | 250,296 |
| Infor (US), Inc., Term Loan, 5.136%, (3 mo. USD LIBOR + 2.75%), 2/1/22 | 982,963 | 986,736 |
www.calvert.com CALVERT FLOATING-RATE ADVANTAGE FUND ANNUAL REPORT 9
| PRINCIPAL AMOUNT ($) | VALUE ($) | |
| SENIOR FLOATING RATE LOANS (1) - CONT’D | ||
| Informatica, LLC, Term Loan, 5.492%, (1 mo. USD LIBOR + 3.25%), 8/5/22 | 423,273 | 426,599 |
| MA FinanceCo., LLC, Term Loan, 4.742%, (1 mo. USD LIBOR + 2.50%), 6/21/24 | 64,167 | 63,926 |
| Microchip Technology Incorporated, Term Loan, 4.25%, (1 mo. USD LIBOR + 2.00%), 5/29/25 | 455,500 | 456,352 |
| Rocket Software, Inc., Term Loan, 6.136%, (3 mo. USD LIBOR + 3.75%), 10/14/23 | 424,875 | 428,486 |
| Seattle Spinco, Inc., Term Loan, 4.742%, (1 mo. USD LIBOR + 2.50%), 6/21/24 | 433,333 | 431,383 |
| SGS Cayman L.P., Term Loan, 7.761%, (3 mo. USD LIBOR + 5.38%), 4/23/21 | 65,746 | 62,911 |
| SkillSoft Corporation, Term Loan, 6.992%, (1 mo. USD LIBOR + 4.75%), 4/28/21 | 598,454 | 571,399 |
| SolarWinds Holdings, Inc., Term Loan, 5.242%, (1 mo. USD LIBOR + 3.00%), 2/5/24 | 571,807 | 575,559 |
| SS&C Technologies Holdings Europe S.a.r.l., Term Loan, 4.492%, (1 mo. USD LIBOR + 2.25%), 4/16/25 | 264,498 | 265,015 |
| SS&C Technologies, Inc., Term Loan, 4.492%, (1 mo. USD LIBOR + 2.25%), 4/16/25 | 681,404 | 682,735 |
| Sutherland Global Services, Inc., Term Loan, 7.761%, (3 mo. USD LIBOR + 5.38%), 4/23/21 | 282,441 | 270,261 |
| Tibco Software, Inc., Term Loan, 5.75%, (1 mo. USD LIBOR + 3.50%), 12/4/20 | 296,977 | 298,831 |
| Ultra Clean Holdings, Inc., Term Loan, 8/27/25 (2) | 100,000 | 99,125 |
| Veritas Bermuda, Ltd., Term Loan, 6.778%, (USD LIBOR + 4.50%), 1/27/23 (3) | 147,867 | 144,289 |
| Wall Street Systems Delaware, Inc., Term Loan, 5.386%, (3 mo. USD LIBOR + 3.00%), 11/21/24 | 347,375 | 346,941 |
| 11,708,819 | ||
| Equipment Leasing - 1.1% | ||
| Avolon TLB Borrower 1 (US), LLC, Term Loan, 4.165%, (1 mo. USD LIBOR + 2.00%), 1/15/25 | 893,873 | 897,786 |
| Financial Intermediaries - 5.1% | ||
| Citco Funding, LLC, Term Loan, 5.242%, (1 mo. USD LIBOR + 3.00%), 3/31/22 | 643,467 | 646,484 |
| Clipper Acquisitions Corp., Term Loan, 3.864%, (1 mo. USD LIBOR + 1.75%), 12/27/24 | 645,125 | 648,746 |
| Financial & Risk Holdings, Inc., Term Loan, 9/17/25 (2) | 125,000 | 124,877 |
| Freedom Mortgage Corporation, Term Loan, 6.992%, (1 mo. USD LIBOR + 4.75%), 2/23/22 | 487,342 | 491,809 |
| Harbourvest Partners, LLC, Term Loan, 4.408%, (1 mo. USD LIBOR + 2.25%), 3/1/25 | 48,940 | 49,073 |
| LPL Holdings, Inc., Term Loan, 4.424%, (1 mo. USD LIBOR + 2.25%), 9/23/24 | 891,620 | 894,407 |
| Sesac Holdco II, LLC, Term Loan, 5.242%, (1 mo. USD LIBOR + 3.00%), 2/23/24 | 347,355 | 346,921 |
| Victory Capital Holdings, Inc., Term Loan, 5.136%, (3 mo. USD LIBOR + 2.75%), 2/12/25 | 272,222 | 273,470 |
| Virtus Investment Partners, Inc., Term Loan, 4.604%, (1 mo. USD LIBOR + 2.50%), 6/1/24 | 727,415 | 731,962 |
| 4,207,749 | ||
| Food Products - 1.2% | ||
| Post Holdings, Inc., Term Loan, 4.22%, (1 mo. USD LIBOR + 2.00%), 5/24/24 | 990,846 | 992,208 |
| Food Service - 3.6% | ||
| 1011778 B.C. Unlimited Liability Company, Term Loan, 4.492%, (1 mo. USD LIBOR + 2.25%), 2/16/24 | 991,682 | 993,187 |
| IRB Holding Corp., Term Loan, 5.46%, (2 mo. USD LIBOR + 3.25%), 2/5/25 | 498,250 | 500,780 |
| Restaurant Technologies, Inc., Term Loan, 9/21/25 (2) | 425,000 | 427,391 |
| US Foods, Inc., Term Loan, 4.242%, (1 mo. USD LIBOR + 2.00%), 6/27/23 | 1,013,942 | 1,018,378 |
| 2,939,736 | ||
| Food/Drug Retailers - 0.8% | ||
| Albertsons, LLC, Term Loan, 5.381%, (3 mo. USD LIBOR + 3.00%), 12/21/22 | 643,484 | 644,811 |
10 www.calvert.com CALVERT FLOATING-RATE ADVANTAGE FUND ANNUAL REPORT
| PRINCIPAL AMOUNT ($) | VALUE ($) | |
| SENIOR FLOATING RATE LOANS (1) - CONT’D | ||
| Health Care - 14.3% | ||
| ADMI Corp., Term Loan, 5.492%, (1 mo. USD LIBOR + 3.25%), 4/30/25 | 249,375 | 250,934 |
| Alliance Healthcare Services, Inc., Term Loan, 6.742%, (1 mo. USD LIBOR + 4.50%), 10/24/23 | 246,250 | 248,097 |
| Argon Medical Devices, Inc., Term Loan, 5.992%, (1 mo. USD LIBOR + 3.75%), 1/23/25 | 199,000 | 200,586 |
| Auris Luxembourg III S.a.r.l., Term Loan, 5.386%, (3 mo. USD LIBOR + 3.00%), 1/17/22 | 643,350 | 653,001 |
| Avantor, Inc., Term Loan, 6.242%, (1 mo. USD LIBOR + 4.00%), 11/21/24 | 347,375 | 351,872 |
| BioClinica, Inc., Term Loan, 6.625%, (3 mo. USD LIBOR + 4.25%), 10/20/23 | 197,985 | 188,086 |
| CHG Healthcare Services, Inc., Term Loan, 5.306%, (USD LIBOR + 3.00%), 6/7/23 (3) | 597,000 | 600,917 |
| Concentra, Inc., Term Loan, 4.86%, (1 mo. USD LIBOR + 2.75%), 6/1/22 | 900,000 | 904,500 |
| DaVita, Inc., Term Loan, 4.992%, (1 mo. USD LIBOR + 2.75%), 6/24/21 | 643,282 | 646,900 |
| DJO Finance, LLC, Term Loan, 5.54%, (USD LIBOR + 3.25%), 6/8/20 (3) | 297,698 | 298,101 |
| Greatbatch Ltd., Term Loan, 5.14%, (1 mo. USD LIBOR + 3.00%), 10/27/22 | 376,902 | 379,863 |
| Grifols Worldwide Operations USA, Inc., Term Loan, 4.417%, (1 week USD LIBOR + 2.25%), 1/31/25 | 643,467 | 647,489 |
| Hanger, Inc., Term Loan, 5.742%, (1 mo. USD LIBOR + 3.50%), 2/26/25 | 99,500 | 99,376 |
| Indivior Finance S.a.r.l., Term Loan, 6.85%, (3 mo. USD LIBOR + 4.50%), 12/18/22 | 220,869 | 220,041 |
| Kinetic Concepts, Inc., Term Loan, 5.636%, (3 mo. USD LIBOR + 3.25%), 2/2/24 | 296,992 | 299,183 |
| KUEHG Corp., Term Loan, 6.136%, (3 mo. USD LIBOR + 3.75%), 2/21/25 | 421,418 | 424,210 |
| MPH Acquisition Holdings, LLC, Term Loan, 5.136%, (3 mo. USD LIBOR + 2.75%), 6/7/23 | 867,621 | 870,265 |
| National Mentor Holdings, Inc., Term Loan, 5.386%, (3 mo. USD LIBOR + 3.00%), 1/31/21 | 496,365 | 498,537 |
| One Call Corporation, Term Loan, 7.384%, (1 mo. USD LIBOR + 5.25%), 11/25/22 | 196,704 | 187,155 |
| Ortho-Clinical Diagnostics S.A., Term Loan, 5.492%, (1 mo. USD LIBOR + 3.25%), 6/30/25 | 739,242 | 742,344 |
| Parexel International Corporation, Term Loan, 4.992%, (1 mo. USD LIBOR + 2.75%), 9/27/24 | 498,741 | 496,402 |
| Press Ganey Holdings, Inc., Term Loan, 4.992%, (1 mo. USD LIBOR + 2.75%), 10/23/23 | 197,985 | 199,098 |
| RadNet, Inc., Term Loan, 6.09%, (3 mo. USD LIBOR + 3.75%), 6/30/23 | 189,474 | 191,072 |
| Sotera Health Holdings, LLC, Term Loan, 5.242%, (1 mo. USD LIBOR + 3.00%), 5/15/22 | 546,985 | 548,557 |
| Team Health Holdings, Inc., Term Loan, 4.992%, (1 mo. USD LIBOR + 2.75%), 2/6/24 | 643,467 | 626,576 |
| Tecomet, Inc., Term Loan, 5.62%, (1 mo. USD LIBOR + 3.50%), 5/1/24 | 498,737 | 501,075 |
| U.S. Anesthesia Partners, Inc., Term Loan, 5.242%, (1 mo. USD LIBOR + 3.00%), 6/23/24 | 346,616 | 349,053 |
| Verscend Holding Corp., Term Loan, 6.742%, (1 mo. USD LIBOR + 4.50%), 8/27/25 | 150,000 | 150,844 |
| 11,774,134 | ||
| Home Furnishings - 0.9% | ||
| Bright Bidco B.V., Term Loan, 5.84%, (USD LIBOR + 3.50%), 6/30/24 (3) | 297,004 | 294,034 |
| Serta Simmons Bedding, LLC, Term Loan, 5.61%, (1 mo. USD LIBOR + 3.50%), 11/8/23 | 496,222 | 450,941 |
| 744,975 | ||
| Industrial Equipment - 8.0% | ||
| Altra Industrial Motion Corp., Term Loan, 9/5/25 (2) | 75,000 | 75,281 |
| Apex Tool Group, LLC, Term Loan, 5.992%, (1 mo. USD LIBOR + 3.75%), 2/1/22 | 294,375 | 295,610 |
| CFSP Acquisition Corp.: | ||
| Term Loan, 1.00%, 3/20/25 (4) | 55,215 | 55,008 |
| Term Loan, 5.212%, (1 mo. USD LIBOR + 3.00%), 3/20/25 | 243,561 | 242,648 |
| Clark Equipment Company, Term Loan, 4.371%, (USD LIBOR + 2.00%), 5/18/24 (3) | 898,252 | 900,708 |
| DexKo Global, Inc., Term Loan, 5.742%, (1 mo. USD LIBOR + 3.50%), 7/24/24 | 249,141 | 251,165 |
| Engineered Machinery Holdings, Inc., Term Loan, 5.636%, (3 mo. USD LIBOR + 3.25%), 7/19/24 | 322,563 | 318,934 |
| EWT Holdings III Corp., Term Loan, 5.242%, (1 mo. USD LIBOR + 3.00%), 12/20/24 | 594,248 | 598,890 |
www.calvert.com CALVERT FLOATING-RATE ADVANTAGE FUND ANNUAL REPORT 11
| PRINCIPAL AMOUNT ($) | VALUE ($) | |
| SENIOR FLOATING RATE LOANS (1) - CONT’D | ||
| Filtration Group Corporation, Term Loan, 5.242%, (1 mo. USD LIBOR + 3.00%), 3/29/25 | 522,375 | 526,347 |
| Gardner Denver, Inc., Term Loan, 4.992%, (1 mo. USD LIBOR + 2.75%), 7/30/24 | 399,012 | 401,913 |
| Gates Global, LLC, Term Loan, 4.992%, (1 mo. USD LIBOR + 2.75%), 4/1/24 | 841,996 | 847,982 |
| Milacron, LLC, Term Loan, 4.742%, (1 mo. USD LIBOR + 2.50%), 9/28/23 | 506,001 | 506,528 |
| Paladin Brands Holding, Inc., Term Loan, 7.886%, (3 mo. USD LIBOR + 5.50%), 8/15/22 | 241,235 | 242,140 |
| Rexnord, LLC, Term Loan, 4.242%, (1 mo. USD LIBOR + 2.00%), 8/21/24 | 86,371 | 86,926 |
| Robertshaw US Holding Corp., Term Loan, 5.75%, (1 mo. USD LIBOR + 3.50%), 2/28/25 | 422,875 | 420,496 |
| Shape Technologies Group, Inc., Term Loan, 5.227%, (USD LIBOR + 3.00%), 4/21/25 (3) | 498,750 | 499,062 |
| Titan Acquisition Limited, Term Loan, 5.242%, (1 mo. USD LIBOR + 3.00%), 3/28/25 | 298,500 | 289,895 |
| 6,559,533 | ||
| Insurance - 3.6% | ||
| Alliant Holdings I, Inc., Term Loan, 5.148%, (1 mo. USD LIBOR + 3.00%), 5/9/25 | 249,375 | 250,186 |
| AmWINS Group, Inc., Term Loan, 4.96%, (1 mo. USD LIBOR + 2.75%), 1/25/24 | 494,962 | 496,907 |
| Asurion, LLC: | ||
| Term Loan, 5.242%, (1 mo. USD LIBOR + 3.00%), 8/4/22 | 624,629 | 630,583 |
| Term Loan, 11/3/24 (2) | 250,000 | 251,942 |
| Term Loan - Second Lien, 8.742%, (1 mo. USD LIBOR + 6.50%), 8/4/25 | 100,000 | 103,021 |
| Hub International Limited, Term Loan, 5.335%, (3 mo. USD LIBOR + 3.00%), 4/25/25 | 523,688 | 525,176 |
| NFP Corp., Term Loan, 5.242%, (1 mo. USD LIBOR + 3.00%), 1/8/24 | 396,722 | 397,218 |
| USI, Inc., Term Loan, 5.386%, (3 mo. USD LIBOR + 3.00%), 5/16/24 | 297,000 | 297,424 |
| 2,952,457 | ||
| Leisure Goods/Activities/Movies - 4.8% | ||
| AMC Entertainment Holdings, Inc., Term Loan, 4.384%, (1 mo. USD LIBOR + 2.25%), 12/15/23 | 643,467 | 644,942 |
| Ancestry.com Operations, Inc., Term Loan, 5.50%, (1 mo. USD LIBOR + 3.25%), 10/19/23 | 544,959 | 547,273 |
| Bombardier Recreational Products, Inc., Term Loan, 4.24%, (1 mo. USD LIBOR + 2.00%), 5/23/25 | 646,721 | 647,395 |
| CDS U.S. Intermediate Holdings, Inc., Term Loan, 6.136%, (3 mo. USD LIBOR + 3.75%), 7/8/22 | 98,998 | 97,736 |
| Crown Finance US, Inc., Term Loan, 4.742%, (1 mo. USD LIBOR + 2.50%), 2/28/25 | 597,000 | 596,710 |
| Delta 2 (LUX) S.a.r.l., Term Loan, 4.742%, (1 mo. USD LIBOR + 2.50%), 2/1/24 | 350,000 | 347,506 |
| Emerald Expositions Holding, Inc., Term Loan, 4.992%, (1 mo. USD LIBOR + 2.75%), 5/22/24 | 287,066 | 289,398 |
| Match Group, Inc., Term Loan, 4.665%, (1 mo. USD LIBOR + 2.50%), 11/16/22 | 650,000 | 655,476 |
| Travel Leaders Group, LLC, Term Loan, 6.158%, (1 mo. USD LIBOR + 4.00%), 1/25/24 | 99,750 | 101,059 |
| 3,927,495 | ||
| Lodging and Casinos - 2.6% | ||
| ESH Hospitality, Inc., Term Loan, 4.242%, (1 mo. USD LIBOR + 2.00%), 8/30/23 | 613,445 | 614,164 |
| Four Seasons Hotels Limited, Term Loan, 4.242%, (1 mo. USD LIBOR + 2.00%), 11/30/23 | 643,451 | 644,773 |
| Playa Resorts Holding B.V., Term Loan, 4.99%, (1 mo. USD LIBOR + 2.75%), 4/29/24 | 222,871 | 221,455 |
| RHP Hotel Properties L.P., Term Loan, 4.34%, (3 mo. USD LIBOR + 2.00%), 5/11/24 | 645,101 | 646,471 |
| 2,126,863 | ||
| Oil and Gas - 0.2% | ||
| Green Plains Renewable Energy, Inc., Term Loan, 7.75%, (1 mo. USD LIBOR + 5.50%), 8/18/23 | 198,000 | 200,723 |
12 www.calvert.com CALVERT FLOATING-RATE ADVANTAGE FUND ANNUAL REPORT
| PRINCIPAL AMOUNT ($) | VALUE ($) | |
| SENIOR FLOATING RATE LOANS (1) - CONT’D | ||
| Publishing - 1.9% | ||
| Ascend Learning, LLC, Term Loan, 7/12/24 (2) | 600,000 | 601,313 |
| Harland Clarke Holdings Corp., Term Loan, 7.136%, (3 mo. USD LIBOR + 4.75%), 11/3/23 | 189,772 | 182,537 |
| LSC Communications, Inc., Term Loan, 7.742%, (1 mo. USD LIBOR + 5.50%), 9/30/22 | 176,000 | 177,320 |
| ProQuest, LLC, Term Loan, 5.992%, (1 mo. USD LIBOR + 3.75%), 10/24/21 | 595,272 | 598,620 |
| 1,559,790 | ||
| Radio and Television - 2.1% | ||
| Entravision Communications Corporation, Term Loan, 4.992%, (1 mo. USD LIBOR + 2.75%), 11/29/24 | 495,000 | 489,844 |
| Gray Television, Inc., Term Loan, 4.354%, (1 mo. USD LIBOR + 2.25%), 2/7/24 | 607,323 | 609,547 |
| Univision Communications, Inc., Term Loan, 4.992%, (1 mo. USD LIBOR + 2.75%), 3/15/24 | 642,971 | 626,208 |
| 1,725,599 | ||
| Retailers (Except Food and Drug) - 1.6% | ||
| Bass Pro Group, LLC, Term Loan, 7.242%, (1 mo. USD LIBOR + 5.00%), 9/25/24 | 248,120 | 250,950 |
| BJ's Wholesale Club, Inc., Term Loan, 5.148%, (1 mo. USD LIBOR + 3.00%), 2/3/24 | 482,957 | 486,188 |
| LSF9 Atlantis Holdings, LLC, Term Loan, 8.12%, (1 mo. USD LIBOR + 6.00%), 5/1/23 | 145,606 | 140,964 |
| Party City Holdings, Inc., Term Loan, 5.139%, (USD LIBOR + 2.75%), 8/19/22 (3) | 165,543 | 166,874 |
| Shutterfly, Inc., Term Loan, 5.00%, (1 mo. USD LIBOR + 2.75%), 8/17/24 | 49,875 | 50,118 |
| Vivid Seats, Ltd., Term Loan, 5.742%, (1 mo. USD LIBOR + 3.50%), 6/30/24 | 197,995 | 197,500 |
| 1,292,594 | ||
| Steel - 2.8% | ||
| Atkore International, Inc., Term Loan, 5.14%, (3 mo. USD LIBOR + 2.75%), 12/22/23 | 645,125 | 648,512 |
| GrafTech Finance, Inc., Term Loan, 5.742%, (1 mo. USD LIBOR + 3.50%), 2/12/25 | 490,551 | 494,536 |
| Phoenix Services International, LLC, Term Loan, 5.87%, (1 mo. USD LIBOR + 3.75%), 3/1/25 | 248,750 | 251,859 |
| Zekelman Industries, Inc., Term Loan, 4.623%, (3 mo. USD LIBOR + 2.25%), 6/14/21 | 891,932 | 893,493 |
| 2,288,400 | ||
| Surface Transport - 1.3% | ||
| Avis Budget Car Rental, LLC, Term Loan, 4.25%, (1 mo. USD LIBOR + 2.00%), 2/13/25 | 813,850 | 815,371 |
| PODS, LLC, Term Loan, 4.883%, (1 mo. USD LIBOR + 2.75%), 12/6/24 | 277,598 | 278,535 |
| 1,093,906 | ||
| Telecommunications - 8.2% | ||
| CenturyLink, Inc., Term Loan, 4.992%, (1 mo. USD LIBOR + 2.75%), 1/31/25 | 846,250 | 841,666 |
| Ciena Corporation, Term Loan, 9/26/25 (2) | 250,000 | 249,688 |
| Colorado Buyer, Inc., Term Loan, 5.11%, (1 mo. USD LIBOR + 3.00%), 5/1/24 | 398,362 | 399,607 |
| Digicel International Finance Limited, Term Loan, 5.57%, (3 mo. USD LIBOR + 3.25%), 5/28/24 | 248,000 | 236,944 |
| Level 3 Financing, Inc., Term Loan, 4.432%, (1 mo. USD LIBOR + 2.25%), 2/22/24 | 650,000 | 652,302 |
| Plantronics, Inc., Term Loan, 4.742%, (1 mo. USD LIBOR + 2.50%), 7/2/25 | 150,000 | 150,539 |
| SBA Senior Finance II, LLC, Term Loan, 4.25%, (1 mo. USD LIBOR + 2.00%), 4/11/25 | 994,149 | 996,324 |
| Sprint Communications, Inc., Term Loan, 4.75%, (1 mo. USD LIBOR + 2.50%), 2/2/24 | 1,040,445 | 1,043,696 |
| Syniverse Holdings, Inc., Term Loan, 7.148%, (1 mo. USD LIBOR + 5.00%), 3/9/23 | 248,750 | 249,760 |
www.calvert.com CALVERT FLOATING-RATE ADVANTAGE FUND ANNUAL REPORT 13
| PRINCIPAL AMOUNT ($) | VALUE ($) | |
| SENIOR FLOATING RATE LOANS (1) - CONT’D | ||
| TDC A/S, Term Loan, 5.839%, (3 mo. USD LIBOR + 3.50%), 5/31/25 | 199,500 | 202,069 |
| Telesat Canada, Term Loan, 4.89%, (3 mo. USD LIBOR + 2.50%), 11/17/23 | 872,494 | 876,093 |
| Zayo Group, LLC, Term Loan, 1/19/24 (2) | 800,000 | 804,391 |
| 6,703,079 | ||
| Utilities - 0.9% | ||
| Granite Acquisition, Inc., Term Loan, 5.886%, (3 mo. USD LIBOR + 3.50%), 12/19/21 | 500,000 | 504,740 |
| USIC Holdings, Inc., Term Loan, 5.492%, (1 mo. USD LIBOR + 3.25%), 12/8/23 | 249,386 | 251,516 |
| 756,256 | ||
| Total Senior Floating Rate Loans (Cost $98,595,180) | 98,505,675 | |
| TOTAL INVESTMENTS (Cost $98,595,180) - 119.9% | 98,505,675 | |
| Less Unfunded Loan Commitments - (0.1%) | (85,601) | |
| NET INVESTMENTS (Cost $98,509,579) - 119.8% | 98,420,074 | |
| Notes Payable - (23.1%) | (19,000,000) | |
| Other assets and liabilities, net - 3.3% | 2,713,961 | |
NET ASSETS - 100.0% | 82,134,035 | |
| NOTES TO SCHEDULE OF INVESTMENTS | |
| (1) Remaining maturities of senior floating rate loans may be less than the stated maturities shown as a result of contractual or optional prepayments by the borrower. Such prepayments cannot be predicted with certainty. Senior floating rate loans generally pay interest at rates which are periodically re-determined at a spread above the London Interbank Offered Rate (“LIBOR”) or other short-term rates. The rate shown is the rate in effect at September 30, 2018. Senior floating rate loans are generally considered restrictive in that the Fund is ordinarily contractually obligated to receive consent from the Agent Bank and/or Borrower prior to disposition of a senior floating rate loan. | |
| (2) This Senior Loan will settle after September 30, 2018, at which time the interest rate will be determined. | |
| (3) The stated interest rate represents the weighted average interest rate at September 30, 2018 of contracts within the senior loan facility. Interest rates on contracts are primarily redetermined either weekly, monthly or quarterly by reference to the indicated base lending rate and spread and the reset period. | |
| (4) Unfunded or partially unfunded loan commitments. The stated interest rate reflects the weighted average of the reference rate and spread for the funded portion, if any, and the commitment fees on the portion of the loan that is unfunded. | |
| Abbreviations: | |
| LIBOR: | London Interbank Offered Rate |
| Currency Abbreviations: | |
| USD: | United States Dollar |
| See notes to financial statements. | |
14 www.calvert.com CALVERT FLOATING-RATE ADVANTAGE FUND ANNUAL REPORT
CALVERT FLOATING-RATE ADVANTAGE FUND
STATEMENT OF ASSETS AND LIABILITIES
SEPTEMBER 30, 2018
| ASSETS | |||
| Investments in securities of unaffiliated issuers, at value (identified cost $98,509,579) | $98,420,074 | ||
| Cash | 9,519,744 | ||
| Receivable for investments sold | 6,401 | ||
| Receivable for capital shares sold | 539,491 | ||
| Interest receivable | 166,427 | ||
| Receivable from affiliate | 22,276 | ||
| Trustees’ deferred compensation plan | 80 | ||
| Prepaid expenses | 14,383 | ||
| Other assets | 1,281 | ||
| Total assets | 108,690,157 | ||
| LIABILITIES | |||
| Payable for investments purchased | 7,369,469 | ||
| Payable for capital shares redeemed | 18,872 | ||
| Payable to affiliates: | |||
| Investment advisory fee | 38,420 | ||
| Administrative fee | 7,573 | ||
| Distribution and service fees | 566 | ||
| Sub-transfer agency fee | 95 | ||
| Trustees’ deferred compensation plan | 80 | ||
| Accrued expenses | 121,047 | ||
| Note payable | 19,000,000 | ||
| Total liabilities | 26,556,122 | ||
| NET ASSETS | $82,134,035 | ||
| NET ASSETS CONSIST OF: | |||
| Paid-in capital applicable to shares of beneficial interest, | |||
| (unlimited number of no par value shares authorized) | $82,317,514 | ||
| Accumulated loss | (183,479) | ||
| Total | $82,134,035 | ||
| NET ASSET VALUE PER SHARE | |||
| Class A (based on net assets of $3,089,869 and 309,950 shares outstanding) | $9.97 | ||
| Class I (based on net assets of $26,452,020 and 2,654,015 shares outstanding) | $9.97 | ||
| Class R6 (based on net assets of $52,592,146 and 5,278,781 shares outstanding) | $9.96 | ||
| OFFERING PRICE PER SHARE* | |||
| Class A (100/96.25 of net asset value per share) | $10.36 | ||
| * On sales of $50,000 or more, the offering price of Class A shares is reduced. | |||
| See notes to financial statements. | |||
www.calvert.com CALVERT FLOATING-RATE ADVANTAGE FUND ANNUAL REPORT 15
CALVERT FLOATING-RATE ADVANTAGE FUND
STATEMENT OF OPERATIONS
PERIOD ENDED SEPTEMBER 30, 2018(1)
| INVESTMENT INCOME | |||
| Interest income | $3,540,006 | ||
| Total investment income | 3,540,006 | ||
| EXPENSES | |||
| Investment advisory fee | 376,769 | ||
| Administrative fee | 79,107 | ||
| Distribution and service fees: | |||
| Class A | 2,645 | ||
| Trustees’ fees and expenses | 3,790 | ||
| Custodian fees | 29,000 | ||
| Transfer agency fees and expenses | 22,118 | ||
| Accounting fees | 16,144 | ||
| Professional fees | 37,139 | ||
| Registration fees | 116,907 | ||
| Reports to shareholders | 6,576 | ||
| Interest expense and fees and other borrowing costs | 488,107 | ||
| Miscellaneous | 18,844 | ||
| Total expenses | 1,197,146 | ||
| Waiver and/or reimbursement of expenses by affiliate | (208,727) | ||
| Reimbursement of expenses-other | (1,281) | ||
| Net expenses | 987,138 | ||
| Net investment income | 2,552,868 | ||
| REALIZED AND UNREALIZED GAIN (LOSS) | |||
| Net realized loss on investment securities | (146,700) | ||
| Net change in unrealized appreciation (depreciation) on investment securities | (89,505) | ||
| Net realized and unrealized loss | (236,205) | ||
| Net increase in net assets resulting from operations | $2,316,663 | ||
(1) For the period from the start of business, October 10, 2017, to September 30, 2018. | |||
| See notes to financial statements. | |||
16 www.calvert.com CALVERT FLOATING-RATE ADVANTAGE FUND ANNUAL REPORT
CALVERT FLOATING-RATE ADVANTAGE FUND
STATEMENT OF CHANGES IN NET ASSETS
| INCREASE (DECREASE) IN NET ASSETS | Period Ended September 30, 2018(1) | ||
| Operations: | |||
| Net investment income | $2,552,868 | ||
| Net realized loss | (146,700) | ||
| Net change in unrealized appreciation (depreciation) | (89,505) | ||
| Net increase in net assets resulting from operations | 2,316,663 | ||
| Distributions to shareholders: | |||
| Class A shares | (41,317) | ||
| Class I shares | (553,234) | ||
| Class R6 shares | (1,961,208) | ||
| Total distributions to shareholders | (2,555,759) | ||
| Capital share transactions: | |||
| Class A shares | 3,090,163 | ||
| Class I shares | 26,491,733 | ||
| Class R6 shares | 52,791,235 | ||
| Net increase in net assets from capital share transactions | 82,373,131 | ||
| TOTAL INCREASE IN NET ASSETS | 82,134,035 | ||
| NET ASSETS | |||
| Beginning of Period | — | ||
| End of Period | $82,134,035 | ||
(1) For the period from the start of business, October 10, 2017, to September 30, 2018. | |||
| See notes to financial statements. | |||
www.calvert.com CALVERT FLOATING-RATE ADVANTAGE FUND ANNUAL REPORT 17
CALVERT FLOATING-RATE ADVANTAGE FUND
STATEMENT OF CASH FLOWS
| CASH FLOWS FROM OPERATING ACTIVITIES | Period Ended September 30, 2018(a) | ||
| Net increase in net assets from operations | $2,316,663 | ||
| Adjustments to reconcile net increase in net assets from operations to net cash used in operating activities: | |||
| Investments purchased | (120,754,577 | ) | |
| Investments sold and principal repayments | 29,329,607 | ||
| Net amortization/accretion of premium (discount) | 47,086 | ||
| Amortization of prepaid upfront fees on notes payable | 17,752 | ||
| Increase in interest receivable | (166,427 | ) | |
| Increase in receivable from affiliate | (22,276 | ) | |
| Increase in prepaid expenses | (14,383 | ) | |
| Increase in trustees’ deferred compensation plan | (80 | ) | |
| Increase in other assets | (1,281 | ) | |
| Increase in payable to affiliate for investment advisory fee | 38,420 | ||
| Increase in payable to affiliate for administrative fee | 7,573 | ||
| Increase in payable to affiliate for distribution and service fees | 566 | ||
| Increase in payable to affiliate for sub-transfer agency fee | 95 | ||
| Increase in payable to affiliate for trustees’ deferred compensation plan | 80 | ||
| Increase in accrued expenses | 121,047 | ||
| Increase in unfunded loan commitments | 85,601 | ||
| Net change in unrealized (appreciation) depreciation from investments | 89,505 | ||
| Net realized loss from investments | 146,700 | ||
| Net cash used in operating activities | ($91,074,992 | ) | |
| CASH FLOWS FROM FINANCING ACTIVITIES | |||
| Cash distributions paid to shareholders | ($237,927 | ) | |
| Proceeds from capital shares sold | 103,989,214 | ||
| Capital shares redeemed | (24,454,534 | ) | |
| Prepaid upfront fees on notes payable | (18,680 | ) | |
| Proceeds from notes payable | 54,000,000 | ||
| Repayments of notes payable | (35,000,000 | ) | |
| Net cash provided by financing activities | $98,278,073 | ||
| Net increase in cash | $9,519,744 | ||
| Cash at beginning of period | $— | ||
| Cash at end of period | $9,519,744 | ||
| SUPPLEMENTAL DISCLOSURE OF CASH FLOW INFORMATION: | |||
Noncash financing activities not included herein consist of: Reinvestment of dividends and distributions | $2,317,832 | ||
| Cash paid for interest and fees on borrowings | $430,481 | ||
(a) For the period from the start of business, October 10, 2017, to September 30, 2018. | |||
| See notes to financial statements. | |||
18 www.calvert.com CALVERT FLOATING-RATE ADVANTAGE FUND ANNUAL REPORT
CALVERT FLOATING-RATE ADVANTAGE FUND
FINANCIAL HIGHLIGHTS
Period Ended September 30, 2018 (1) | ||||
| CLASS A SHARES | ||||
| Net asset value, beginning | $10.00 | |||
| Income from investment operations: | ||||
Net investment income (2) | 0.38 | |||
| Net realized and unrealized loss | (0.06) | |||
| Total from investment operations | 0.32 | |||
| Distributions from: | ||||
| Net investment income | (0.35) | |||
| Total distributions | (0.35) | |||
| Total decrease in net asset value | (0.03) | |||
| Net asset value, ending | $9.97 | |||
Total return (3) | 3.25 | % | (4) | |
Ratios to average net assets: (5) | ||||
| Total expenses | 2.48 | % | (6)(7) | |
| Net expenses | 2.13 | % | (6)(7) | |
| Net investment income | 3.93 | % | (6) | |
| Portfolio turnover | 35 | % | (4) | |
| Net assets, ending (in thousands) | $3,090 | |||
(1) For the period from the start of business, October 10, 2017, to September 30, 2018. | ||||
(2) Computed using average shares outstanding. | ||||
(3) Returns are historical and are calculated by determining the percentage change in net asset value with all distributions reinvested and do not reflect the effect of sales charges, if any. | ||||
(4) Not annualized. | ||||
(5) Total expenses do not reflect amounts reimbursed and/or waived by the adviser and certain of its affiliates, if applicable. Net expenses are net of all reductions and represent the net expenses paid by the Fund. | ||||
(6) Annualized. | ||||
(7) Includes interest expense and fees and other borrowing costs of 1.07%. | ||||
| See notes to financial statements. | ||||
www.calvert.com CALVERT FLOATING-RATE ADVANTAGE FUND ANNUAL REPORT 19
CALVERT FLOATING-RATE ADVANTAGE FUND
FINANCIAL HIGHLIGHTS
Period Ended September 30, 2018 (1) | ||||
| CLASS I SHARES | ||||
| Net asset value, beginning | $10.00 | |||
| Income from investment operations: | ||||
Net investment income (2) | 0.40 | |||
| Net realized and unrealized loss | (0.06) | |||
| Total from investment operations | 0.34 | |||
| Distributions from: | ||||
| Net investment income | (0.37) | |||
| Total distributions | (0.37) | |||
| Total decrease in net asset value | (0.03) | |||
| Net asset value, ending | $9.97 | |||
Total return (3) | 3.48 | % | (4) | |
Ratios to average net assets: (5) | ||||
| Total expenses | 2.06 | % | (6)(7) | |
| Net expenses | 1.67 | % | (6)(7) | |
| Net investment income | 4.10 | % | (6) | |
| Portfolio turnover | 35 | % | (4) | |
| Net assets, ending (in thousands) | $26,452 | |||
(1) For the period from the start of business, October 10, 2017, to September 30, 2018. | ||||
(2) Computed using average shares outstanding. | ||||
(3) Returns are historical and are calculated by determining the percentage change in net asset value with all distributions reinvested and do not reflect the effect of sales charges, if any. | ||||
(4) Not annualized. | ||||
(5) Total expenses do not reflect amounts reimbursed and/or waived by the adviser and certain of its affiliates, if applicable. Net expenses are net of all reductions and represent the net expenses paid by the Fund. | ||||
(6) Annualized. | ||||
(7) Includes interest expense and fees and other borrowing costs of 0.91%. | ||||
| See notes to financial statements. | ||||
20 www.calvert.com CALVERT FLOATING-RATE ADVANTAGE FUND ANNUAL REPORT
CALVERT FLOATING-RATE ADVANTAGE FUND
FINANCIAL HIGHLIGHTS
Period Ended September 30, 2018 (1) | ||||
| CLASS R6 SHARES | ||||
| Net asset value, beginning | $10.00 | |||
| Income from investment operations: | ||||
Net investment income (2) | 0.37 | |||
| Net realized and unrealized loss | (0.04) | |||
| Total from investment operations | 0.33 | |||
| Distributions from: | ||||
| Net investment income | (0.37) | |||
| Total distributions | (0.37) | |||
| Total decrease in net asset value | (0.04) | |||
| Net asset value, ending | $9.96 | |||
Total return (3) | 3.35 | % | (4) | |
Ratios to average net assets: (5) | ||||
| Total expenses | 1.74 | % | (6)(7) | |
| Net expenses | 1.44 | % | (6)(7) | |
| Net investment income | 3.81 | % | (6) | |
| Portfolio turnover | 35 | % | (4) | |
| Net assets, ending (in thousands) | $52,592 | |||
(1) For the period from the start of business, October 10, 2017, to September 30, 2018. | ||||
(2) Computed using average shares outstanding. | ||||
(3) Returns are historical and are calculated by determining the percentage change in net asset value with all distributions reinvested and do not reflect the effect of sales charges, if any. | ||||
(4) Not annualized. | ||||
(5) Total expenses do not reflect amounts reimbursed and/or waived by the adviser and certain of its affiliates, if applicable. Net expenses are net of all reductions and represent the net expenses paid by the Fund. | ||||
(6) Annualized. | ||||
(7) Includes interest expense and fees and other borrowing costs of 0.69%. | ||||
| See notes to financial statements. | ||||
www.calvert.com CALVERT FLOATING-RATE ADVANTAGE FUND ANNUAL REPORT 21
NOTES TO FINANCIAL STATEMENTS
NOTE 1 — SIGNIFICANT ACCOUNTING POLICIES
Calvert Floating-Rate Advantage Fund (the Fund) is a diversified series of Calvert Management Series (the Trust). The Trust is a Massachusetts business trust registered under the Investment Company Act of 1940, as amended (the 1940 Act), as an open-end management investment company. The investment objective of the Fund is to provide a high level of current income. The Fund commenced operations on October 10, 2017. The Fund invests primarily in senior floating-rate loans of domestic and foreign borrowers.
The Fund offers three classes of shares. Class A shares are generally sold subject to a sales charge imposed at time of purchase. A contingent deferred sales charge of 0.80% may apply to certain redemptions of Class A shares for accounts for which no sales charge was paid, if redeemed within 12 months of purchase. Class I and Class R6 shares are sold at net asset value, are not subject to a sales charge and are sold only to certain eligible investors. Each class represents a pro rata interest in the Fund, but votes separately on class-specific matters and is subject to different expenses.
The Fund applies the accounting and reporting guidance in the Financial Accounting Standards Board (FASB) Accounting Standards Codification Topic 946, Financial Services – Investment Companies (ASC 946). Subsequent events, if any, through the date that the financial statements were issued have been evaluated in the preparation of the financial statements.
A. Investment Valuation: Net asset value per share is determined every business day as of the close of the regular session of the New York Stock Exchange (generally 4:00 p.m. Eastern time). The Fund uses independent pricing services approved by the Board of Trustees (the Board) to value its investments wherever possible. Investments for which market quotations are not available or deemed not reliable are fair valued in good faith under the direction of the Board.
U.S. generally accepted accounting principles (U.S. GAAP) establishes a disclosure hierarchy that categorizes the inputs to valuation techniques used to value assets and liabilities at measurement date. These inputs are summarized in the three broad levels listed below:
Level 1 - quoted prices in active markets for identical securities
Level 2 - other significant observable inputs (including quoted prices for similar securities, interest rates, prepayment speeds, credit risk, etc.)
Level 3 - significant unobservable inputs (including the Fund’s own assumptions in determining the fair value of investments)
The inputs or methodologies used for valuing securities are not necessarily an indication of the risk associated with investing in those securities.
Valuation techniques used to value the Fund’s investments by major category are as follows:
Senior Floating Rate Loans. Interests in senior floating rate loans for which reliable market quotations are readily available are valued generally at the average mean of bid and ask quotations obtained from a third party pricing service, and are categorized as Level 2 in the hierarchy.
Fair Valuation. If a market value cannot be determined for a security using the methodologies described above, or if, in the good faith opinion of the Fund’s adviser, the market value does not constitute a readily available market quotation, or if a significant event has occurred that would materially affect the value of the security, the security will be fair valued as determined in good faith by or at the direction of the Board in a manner that fairly reflects the security’s value, or the amount that the Fund might reasonably expect to receive for the security upon its current sale in the ordinary course. Each such determination is based on a consideration of relevant factors, which are likely to vary from one pricing context to another. These factors may include, but are not limited to, the type of security, the existence of any contractual restrictions on the security’s disposition, the price and extent of public trading in similar securities of the issuer or of comparable companies or entities, quotations or relevant information obtained from broker/ dealers or other market participants, information obtained from the issuer, analysts, and/or the appropriate stock exchange (for exchange-traded securities), an analysis of the company’s or entity’s financial condition, and an evaluation of the forces that influence the issuer and the market(s) in which the security is purchased and sold.
The values assigned to fair value investments are based on available information and do not necessarily represent amounts that might ultimately be realized. Further, due to the inherent uncertainty of valuations of such investments, the fair values may differ significantly from the values that would have been used had an active market existed, and the differences could be material.
22 www.calvert.com CALVERT FLOATING-RATE ADVANTAGE FUND ANNUAL REPORT
The following table summarizes the market value of the Fund’s holdings as of September 30, 2018, based on the inputs used to value them:
| Assets | Level 1 | Level 2 | Level 3 | Total | ||||||||
| Senior Floating Rate Loans (less Unfunded Loan Commitments) | $ | — | $ | 98,420,074 | $ | — | $ | 98,420,074 | ||||
| Total Investments | $ | — | $ | 98,420,074 | $ | — | $ | 98,420,074 | ||||
B. Investment Transactions and Income: Investment transactions for financial statement purposes are accounted for on trade date. Realized gains and losses are recorded on an identified cost basis and may include proceeds from litigation. Interest income, which includes amortization of premium and accretion of discount, is accrued as earned. The Fund earns certain fees in connection with its investments in senior floating rate loans. These fees are in addition to interest payments earned and may include amendment fees, consent fees and prepayment fees, which are recorded to income as earned.
C. Share Class Accounting: Realized and unrealized gains and losses are allocated daily to each class of shares based upon the relative net assets of each class to the total net assets of the Fund. Net investment income, other than class-specific expenses, is allocated daily to each class of shares based upon the ratio of the value of each class’s paid shares to the total value of all paid shares. Expenses arising in connection with a specific class are charged directly to that class. Sub-accounting, recordkeeping and similar administrative fees payable to financial intermediaries, which are a component of transfer and dividend disbursing agent fees on the Statement of Operations, are not allocated to Class R6 shares.
D. Senior Floating Rate Loans: The Fund may invest in direct debt instruments, which are interests in amounts owed to lenders or lending syndicates by corporate, governmental, or other borrowers. The Fund’s investment in loans may be in the form of participations in loans or assignments of all or a portion of loans from third parties. A loan is often administered by a bank or other financial institution (the lender) that acts as agent for all holders. The agent administers the terms of the loan, as specified in the loan agreement. The Fund may invest in multiple series or tranches of a loan, which may have varying terms and carry different associated risks. When the Fund purchases assignments from lenders, it acquires direct rights against the borrower of the loan. When investing in a loan participation, the Fund has the right to receive payments of principal, interest and any fees to which it is entitled only from the lender selling the loan agreement and only upon receipt of such payments by the lender from the borrower. The Fund generally has no right to enforce compliance by the borrower with the terms of the loan agreement. As a result, the Fund may be subject to the credit risk of both the borrower and the lender that is issuing the participation interest.
E. Unfunded Loan Commitments: The Fund may enter into certain loan agreements all or a portion of which may be unfunded. The Fund is obligated to fund these commitments at the borrower’s discretion. These commitments are disclosed in the accompanying Schedule of Investments. At September 30, 2018, the Fund had sufficient cash and/or securities to cover these commitments.
F. Distributions to Shareholders: Distributions to shareholders are recorded by the Fund on ex-dividend date. The Fund declares income distributions daily to shareholders of record at the time of declaration and generally pays them monthly. Distributions of realized capital gains are made at least annually. Distributions are determined in accordance with income tax regulations which may differ from U.S. GAAP; accordingly, periodic reclassifications are made within the Fund’s capital accounts to reflect income and gains available for distribution under income tax regulations.
G. Estimates: The preparation of financial statements in conformity with U.S. GAAP requires management to make estimates and assumptions that affect the reported amounts of assets and liabilities and disclosure of contingent assets and liabilities at the date of the financial statements and the reported amounts of increases and decreases in net assets from operations during the reporting period. Actual results could differ from those estimates.
H. Indemnifications: Under the Trust’s organizational document, its officers and Trustees may be indemnified against certain liabilities and expenses arising out of the performance of their duties to the Fund. Under Massachusetts law, if certain conditions prevail, shareholders of a Massachusetts business trust (such as the Trust) could be deemed to have personal liability for the obligations of the Trust. However, the Trust’s Declaration of Trust contains an express disclaimer of liability on the part of Fund shareholders and provides that upon request, the Trust shall assume the defense on behalf of any Fund shareholders or former shareholders. Additionally, in the normal course of business, the Fund enters into agreements with service providers that may contain indemnification clauses. The Fund’s maximum exposure under these arrangements is unknown as this would involve future claims that may be made against the Fund that have not yet occurred.
I. Federal Income Taxes: No provision for federal income or excise tax is required since the Fund intends to qualify as a regulated investment company under the Internal Revenue Code and to distribute substantially all of its taxable earnings.
www.calvert.com CALVERT FLOATING-RATE ADVANTAGE FUND ANNUAL REPORT 23
Management has analyzed the Fund’s tax positions taken for all open federal income tax years and has concluded that no provision for federal income tax is required in the Fund’s financial statements. A Fund’s federal tax return is subject to examination by the Internal Revenue Service for a period of three years from the date of filing.
NOTE 2 — RELATED PARTY TRANSACTIONS
The investment advisory fee is earned by Calvert Research and Management (CRM), a subsidiary of Eaton Vance Management (EVM), as compensation for investment advisory services rendered to the Fund. Pursuant to the investment advisory agreement, CRM receives a fee, payable monthly, at the following annual rates of the Fund’s average daily gross assets: 0.48% up to and including $1 billion and 0.43% on the excess of $1 billion. Gross assets of the Fund are calculated by deducting all liabilities of the Fund except the principal amount of any indebtness for money borrowed, including debt securities issued by the Fund. For the period ended September 30, 2018, the investment advisory fee amounted to $376,769 or 0.57% (annualized) of the Fund’s average daily net assets.
CRM has agreed to reimburse certain of the Fund’s operating expenses (excluding investment advisory, administrative and distribution and service fees) in excess of 0.06% annually for each of Class A, Class I and Class R6 of such class’ average daily net assets. The expense reimbursement relates to ordinary operating expenses only and does not include expenses such as: brokerage commissions, acquired fund fees and expenses of unaffiliated funds, interest expense and other borrowing costs, taxes or litigation expenses. The expense reimbursement agreement with CRM may be changed or terminated after January 31, 2019. For the period ended September 30, 2018, CRM waived or reimbursed expenses of $208,727.
The administrative fee is earned by CRM as compensation for administrative services rendered to the Fund. The fee is computed at an annual rate of 0.12% of the Fund’s average daily net assets attributable to Class A, Class I and Class R6 and is payable monthly. For the period ended September 30, 2018, CRM was paid administrative fees of $79,107.
The Fund has in effect a distribution plan for Class A shares (Class A Plan) pursuant to Rule 12b-1 under the 1940 Act. Pursuant to the Class A Plan, the Fund pays Eaton Vance Distributors, Inc. (EVD), an affiliate of CRM and the Fund’s principal underwriter, a distribution and service fee of 0.25% per annum of its average daily net assets attributable to Class A for distribution services and facilities provided to the Fund by EVD, as well as for personal services and/or the maintenance of shareholder accounts. Distribution and service fees paid or accrued for the period ended September 30, 2018 amounted to $2,645 for Class A shares.
The Fund was informed that EVD received $2,465 as its portion of the sales charge on sales of Class A shares and no contingent deferred sales charges paid by Fund shareholders for the period ended September 30, 2018.
EVM provides sub-transfer agency and related services to the Fund pursuant to a Sub-Transfer Agency Support Services Agreement. For the period ended September 30, 2018, sub-transfer agency fees and expenses incurred to EVM amounted to $550 and are included in transfer agency fees and expenses on the Statement of Operations.
Each Trustee of the Fund who is not an employee of CRM or its affiliates receives a fee of $3,000 for each Board meeting attended in person and $2,000 for each Board meeting attended by phone plus an annual fee of $52,000, and $1,500 for each Committee meeting attended in person and $1,000 for each Committee meeting attended by phone plus an annual Committee fee of $2,500. The Board chair receives an additional $10,000 annual retainer and Committee chairs receive an additional $6,000 annual retainer. Eligible Trustees may participate in a Deferred Compensation Plan (the Plan). Amounts deferred under the Plan are treated as though equal dollar amounts had been invested in shares of the Fund or other Calvert funds selected by the Trustees. The Fund purchases shares of the funds selected equal to the dollar amounts deferred under the Plan, resulting in an asset equal to the deferred compensation liability. Obligations of the Plan are paid solely from the Fund’s assets. Trustees’ fees are allocated to each of the Calvert funds served. Salaries and fees of officers and Trustees of the Fund who are employees of CRM or its affiliates are paid by CRM. In addition, an advisory council was established to aid the Board and CRM in advancing the cause of responsible investing through original scholarship and thought leadership. The advisory council consists of CRM’s Chief Executive Officer and four additional members. Each member (other than CRM’s Chief Executive Officer) receives annual compensation of $75,000, which is being reimbursed by Calvert Investment Management, Inc. (CIM), the Calvert funds’ former investment adviser and Ameritas Holding Company, CIM’s parent company, through the end of 2019. For the period ended September 30, 2018, the Fund’s allocated portion of such expense and reimbursement was $1,281, which are included in miscellaneous expense and reimbursement of expenses-other, respectively, on the Statement of Operations.
NOTE 3 — INVESTMENT ACTIVITY
During the period ended September 30, 2018, the cost of purchases and proceeds from sales of investments, other than short-term securities and including paydowns and principal repayments on senior floating rate loans, were $128,124,046 and $29,336,008, respectively.
24 www.calvert.com CALVERT FLOATING-RATE ADVANTAGE FUND ANNUAL REPORT
NOTE 4 — DISTRIBUTIONS TO SHAREHOLDERS AND INCOME TAX INFORMATION
The tax character of distributions declared for the period ended September 30, 2018 was as follows:
| Period Ended September 30, | |||
| 2018 | |||
| Ordinary income | $2,555,759 | ||
During the period ended September 30, 2018, accumulated loss was decreased by $55,617 and paid-in capital was decreased by $55,617 due to differences between book and tax accounting for non-deductible expenses. These reclassifications had no effect on the net assets or net asset value per share of the Fund.
As of September 30, 2018, the components of distributable earnings (accumulated loss) on a tax basis were as follows:
| Undistributed ordinary income | $52,726 | ||
| Deferred capital losses | ($97,798 | ) | |
| Net unrealized appreciation (depreciation) | ($138,407 | ) | |
At September 30, 2018, the Fund, for federal income tax purposes, had deferred capital losses of $97,798 which would reduce the Fund’s taxable income arising from future net realized gains on investment transactions, if any, to the extent permitted by the Internal Revenue Code, and thus would reduce the amount of distributions to shareholders, which would otherwise be necessary to relieve the Fund of any liability for federal income or excise tax. The deferred capital losses are treated as arising on the first day of the Fund’s next taxable year and retain the same short-term or long-term character as when originally deferred. Of the deferred capital losses at September 30, 2018, $97,798 are short-term.
The cost and unrealized appreciation (depreciation) of investments of the Fund at September 30, 2018, as determined on a federal income tax basis, were as follows:
| Aggregate cost | $98,558,481 | ||
| Gross unrealized appreciation | $206,502 | ||
| Gross unrealized depreciation | (344,909) | ||
| Net unrealized appreciation (depreciation) | ($138,407 | ) | |
NOTE 5 — CREDIT AGREEMENT
The Fund has entered into a Credit Agreement (the Agreement) with a bank to borrow up to a limit of $45 million ($20 million prior to February 16, 2018) pursuant to a 364-day revolving line of credit. Borrowings under the Agreement are secured by the assets of the Fund. Borrowings may be made for the purchase of investment securities and temporary or emergency purposes only. Borrowings bear interest at the higher of the prime rate or Federal Funds rate in effect on that day for the applicable interest period plus 0.85%, or the London Interbank Offered Rate (LIBOR) in effect on that day for the applicable interest period plus 0.85%. Under the terms of the Agreement, in effect through October 24, 2018, the Fund pays a facility fee of 0.15% per annum on the commitment amount. In connection with the execution of the Agreement on October 25, 2017 and subsequent increase in borrowing limit on February 16, 2018, the Fund paid upfront fees of $18,680, which are being amortized to interest expense through October 24, 2018. The unamortized balance at September 30, 2018 is approximately $1,000 and is included in prepaid upfront fees on notes payable on the Statement of Assets and Liabilities. The Fund is required to maintain certain net assets levels during the term of the Agreement. At September 30, 2018, the Fund had borrowings outstanding under the Agreement of $19,000,000 at an interest rate of 3.02%. Based on the short-term nature of the borrowings under the Agreement and the variable interest rate, the carrying amount of the borrowings at September 30, 2018 approximated its fair value. If measured at fair value, borrowings under the Agreement would have been considered as Level 2 in the fair value hierarchy (see Note 1A) at September 30, 2018. For the period from October 25, 2017, the date the Agreement was entered into, through September 30, 2018, the average borrowings under the Agreement and the average interest rate (excluding fees) were $13,727,273 and 2.55% respectively.
Effective October 24, 2018, the Fund renewed the Agreement, which expires March 19, 2019, at substantially the same terms.
www.calvert.com CALVERT FLOATING-RATE ADVANTAGE FUND ANNUAL REPORT 25
NOTE 6 — CAPITAL SHARES
Transactions in capital shares for the period ended September 30, 2018 were as follows:
Period Ended September 30, 2018 (1) | ||||
| Shares | Amount | |||
| Class A | ||||
| Shares sold | 322,089 | 3,210,796 | ||
| Reinvestment of distributions | 4,105 | 40,844 | ||
| Shares redeemed | (16,244 | ) | (161,477 | ) |
| Net increase | 309,950 | $3,090,163 | ||
| Class I | ||||
| Shares sold | 4,708,181 | 47,007,516 | ||
| Reinvestment of distributions | 31,113 | 309,507 | ||
| Shares redeemed | (2,085,279 | ) | (20,825,290 | ) |
| Net increase | 2,654,015 | $26,491,733 | ||
| Class R6 | ||||
| Shares sold | 5,432,328 | 54,310,393 | ||
| Reinvestment of distributions | 197,468 | 1,967,481 | ||
| Shares redeemed | (351,015 | ) | (3,486,639 | ) |
| Net increase | 5,278,781 | $52,791,235 | ||
| (1) For the period from the start of business, October 10, 2017, to September 30, 2018. | ||||
NOTE 7 – CREDIT RISK
The Fund invests primarily in below investment grade senior floating rate loans, which have speculative characteristics because of the credit risk associated with their issuers. Changes in economic conditions or other circumstances are more likely to reduce the capacity of issuers of these securities to make principal and interest payments. Such companies are more likely to default on their payments of interest and principal owed than issuers of investment grade bonds. An economic downturn generally leads to a higher non-payment rate, and a loan or other debt obligation may lose significant value before a default occurs. Lower rated investments also may be subject to greater price volatility than higher rated investments. Moreover, the specific collateral used to secure a loan may decline in value or become illiquid, which would adversely affect the loan’s value.
26 www.calvert.com CALVERT FLOATING-RATE ADVANTAGE FUND ANNUAL REPORT
REPORT OF INDEPENDENT REGISTERED PUBLIC ACCOUNTING FIRM
To the Shareholders and Board of Trustees
Calvert Management Series:
Opinion on the Financial Statements
We have audited the accompanying statement of assets and liabilities of Calvert Floating-Rate Advantage Fund (the Fund), a series of Calvert Management Series, including the schedule of investments, as of September 30, 2018, the related statement of operations and changes in net assets for the period from October 10, 2017 (commencement of operations) to September 30, 2018, and the related notes (collectively, the financial statements) and the financial highlights for the period from October 10, 2017 to September 30, 2018. In our opinion, the financial statements and financial highlights present fairly, in all material respects, the financial position of the Fund as of September 30, 2018, the results of its operations and the changes in its net assets, and the financial highlights for the period from October 10, 2017 to September 30, 2018, in conformity with U.S. generally accepted accounting principles.
Basis for Opinion
These financial statements and financial highlights are the responsibility of the Fund’s management. Our responsibility is to express an opinion on these financial statements and financial highlights based on our audit. We are a public accounting firm registered with the Public Company Accounting Oversight Board (United States) (PCAOB) and are required to be independent with respect to the Fund in accordance with the U.S. federal securities laws and the applicable rules and regulations of the Securities and Exchange Commission and the PCAOB.
We conducted our audit in accordance with the standards of the PCAOB. Those standards require that we plan and perform the audit to obtain reasonable assurance about whether the financial statements and financial highlights are free of material misstatement, whether due to error or fraud. Our audits included performing procedures to assess the risks of material misstatement of the financial statements and financial highlights, whether due to error or fraud, and performing procedures that respond to those risks. Such procedures included examining, on a test basis, evidence regarding the amounts and disclosures in the financial statements and financial highlights. Such procedures also included confirmation of securities owned as of September 30, 2018, by correspondence with custodians, brokers and agent banks. Our audits also included evaluating the accounting principles used and significant estimates made by management, as well as evaluating the overall presentation of the financial statements and financial highlights. We believe that our audits provide a reasonable basis for our opinion.
We have served as the auditor of one or more of the Calvert Funds since 2002.
Philadelphia, Pennsylvania
November 21, 2018
www.calvert.com CALVERT FLOATING-RATE ADVANTAGE FUND ANNUAL REPORT 27
FEDERAL TAX INFORMATION
The Form 1099-DIV you receive in February 2019 will show the tax status of all distributions paid to your account in calendar year 2018. Shareholders are advised to consult their own tax adviser with respect to the tax consequences of their investment in the Fund.
28 www.calvert.com CALVERT FLOATING-RATE ADVANTAGE FUND ANNUAL REPORT (Unaudited)
MANAGEMENT AND ORGANIZATION
Fund Management. The Trustees of Calvert Management Series (the Trust) are responsible for the overall management and supervision of the Trust’s affairs. The Trustees and officers of the Trust are listed below. Except as indicated, each individual has held the office shown or other offices in the same company for the last five years. Trustees and officers of the Trust hold indefinite terms of office. The “Independent Trustees” consist of those Trustees who are not “interested persons” of the Trust, as that term is defined under the 1940 Act. The business address of each Trustee and officer, with the exception of Ms. Gemma and Mr. Kirchner, is 1825 Connecticut Avenue NW, Suite 400, Washington, DC 20009. As used below, “CRM” refers to Calvert Research and Management. Each Trustee oversees 39 funds in the Calvert fund complex. Each officer serves as an officer of certain other Calvert funds.
| Name and Year of Birth | Position with Trust | Position Start Date | Principal Occupation(s) and Directorships During Past Five Years and Other Relevant Experience |
| Interested Trustee | |||
John H. Streur(1) 1960 | Trustee & President | 2015 | President and Chief Executive Officer of Calvert Research and Management (since December 31, 2016). President and Chief Executive Officer of Calvert Investments, Inc. (January 2015 - December 2016); Chief Executive Officer of Calvert Investment Distributors, Inc. (August 2015 - December 2016); Chief Compliance Officer of Calvert Investment Management, Inc. (August 2015 - April 2016); President and Director, Portfolio 21 Investments, Inc. (through October 2014); President, Chief Executive Officer and Director, Managers Investment Group LLC (through January 2012); President and Director, The Managers Funds and Managers AMG Funds (through January 2012). Directorships in the Last Five Years. Portfolio 21 Investments, Inc. (asset management) (through October 2014); Managers Investment Group LLC (asset management) (through January 2012); The Managers Funds (asset management) (through January 2012); Managers AMG Funds (asset management) (through January 2012); Calvert Impact Capital, Inc. |
| Independent Trustees | |||
| Richard L. Baird, Jr 1948 | Trustee | 1980 | Former President and CEO of Adagio Health Inc. (retired in 2014) in Pittsburgh, PA, a non-profit corporation which provides family planning services, nutrition, maternal/child health care, and various health screening services and community preventive health programs. Directorships in the Last Five Years. None. |
| Alice Gresham Bullock 1950 | Chair & Trustee | 2016 | Professor at Howard University School of Law (retired June 2016). She is former Dean of Howard University School of Law (1996-2002) and Deputy Director of the Association of American Law Schools (1992-1994). Directorships in the Last Five Years. None. |
| Cari M. Dominguez 1949 | Trustee | 2016 | Former Chair of the U.S. Equal Employment Opportunity Commission. Directorships in the Last Five Years. Manpower, Inc. (employment agency); Triple S Management Corporation (managed care); National Association of Corporate Directors. |
| John G. Guffey, Jr. 1948 | Trustee | 1982 | President of Aurora Press Inc., a privately held publisher of trade paperbacks (since January 1997). Directorships in the Last Five Years. Calvert Impact Capital, Inc.; Calvert Ventures, LLC. |
| Miles D. Harper, III 1962 | Trustee | 2016 | Partner, Carr Riggs & Ingram (public accounting firm) since October 2014. Partner, Gainer Donnelly & Desroches (public accounting firm) (now Carr Riggs & Ingram), November 1999 - September 2014). Directorships in the Last Five Years. Bridgeway Funds (10) (asset management). |
www.calvert.com CALVERT FLOATING-RATE ADVANTAGE FUND ANNUAL REPORT (Unaudited) 29
| Name and Year of Birth | Position with Trust | Position Start Date | Principal Occupation(s) and Directorships During Past Five Years and Other Relevant Experience |
| Joy V. Jones 1950 | Trustee | 2016 | Attorney. Directorships in the Last Five Years. Conduit Street Restaurants SUD 2 Limited; Palm Management Restaurant Corporation. |
| Anthony A. Williams 1951 | Trustee | 2010 | CEO and Executive Director of the Federal City Council (July 2012 to present); Senior Adviser and Independent Consultant for McKenna Long & Aldridge LLP (September 2011 to present); Executive Director of Global Government Practice at the Corporate Executive Board (January 2010 to January 2012). Directorships in the Last Five Years. Freddie Mac; Evoq Properties/ Meruelo Maddux Properties, Inc. (real estate management); Weston Solutions, Inc. (environmental services); Bipartisan Policy Center’s Debt Reduction Task Force; Chesapeake Bay Foundation; Catholic University of America; Urban Institute (research organization). |
| Principal Officers who are not Trustees | |||
| Name and Year of Birth | Position with Trust | Position Start Date | Principal Occupation During Past Five Years |
| Hope L. Brown 1973 | Chief Compliance Officer | 2014 | Chief Compliance Officer of 39 registered investment companies advised by CRM (since 2014). Vice President and Chief Compliance Officer, Wilmington Funds (2012-2014). Vice President and Senior Compliance Officer, Wilmington Trust Investment Advisors, Inc. (2010-2012). |
Maureen A. Gemma(2) 1960 | Secretary, Vice President and Chief Legal Officer | 2016 | Vice President of CRM and officer of 39 registered investment companies advised by CRM (since 2016). Also Vice President of Eaton Vance Management (“EVM”) and certain of its affiliates and officer of 174 registered investment companies advised or administered by EVM. |
James F. Kirchner(2) 1967 | Treasurer | 2016 | Vice President of CRM and officer of 39 registered investment companies advised by CRM (since 2016). Also Vice President of EVM and certain of its affiliates and officer of 174 registered investment companies advised or administered by EVM. |
(1) | Mr. Streur is an interested person of the Fund because of his positions with the Fund’s Adviser and certain affiliates. |
(2) | The business address for Ms. Gemma and Mr. Kirchner is Two International Place, Boston, MA 02110. |
The SAI for the Fund includes additional information about the Trustees and officers of the Fund and can be obtained without charge on Calvert’s website at www.calvert.com or by calling 1-800-368-2745.
30 www.calvert.com CALVERT FLOATING-RATE ADVANTAGE FUND ANNUAL REPORT (Unaudited)
IMPORTANT NOTICES
Privacy. The Calvert Funds and Calvert Research and Management are committed to ensuring your financial privacy. Each of the financial institutions identified below has in effect the following policy (“Privacy Policy”) with respect to nonpublic personal information about its customers:
| • | Only such information received from you, through application forms or otherwise, and information about your Calvert fund transactions will be collected. This may include information such as name, address, social security number, tax status, account balances and transactions. |
| • | None of such information about you (or former customers) will be disclosed to anyone, except as permitted by law (which includes disclosure to employees necessary to service your account). In the normal course of servicing a customer’s account, Calvert Research and Management may share information with unaffiliated third parties that perform various required services such as transfer agents, custodians and broker-dealers. |
| • | Policies and procedures (including physical, electronic and procedural safeguards) are in place that are designed to protect the confidentiality of such information. |
| • | The Funds reserve the right to change this Privacy Policy at any time upon proper notification to you. Customers may want to review the Funds’ Privacy Policy periodically for changes by accessing the link on our homepage: www.calvert.com. |
Our pledge of privacy applies to the following entities: the Calvert Family of Funds, Calvert Research and Management and their affiliated service providers, Eaton Vance Management and Eaton Vance Distributors, Inc. In addition, our Privacy Policy applies only to those Calvert customers who are individuals and who have a direct relationship with us. If a customer’s account (i.e., fund shares) is held in the name of a third-party financial advisor/broker-dealer, it is likely that only such advisor’s privacy policies apply to the customer. This notice supersedes all previously issued privacy disclosures. For more information about Calvert’s Privacy Policy, please call 1-800-368-2745.
Delivery of Shareholder Documents. The Securities and Exchange Commission (SEC) permits funds to deliver only one copy of shareholder documents, including prospectuses, proxy statements and shareholder reports, to fund investors with multiple accounts at the same residential or post office box address. This practice is often called “householding” and it helps eliminate duplicate mailings to shareholders. Calvert funds, or your financial advisor, may household the mailing of your documents indefinitely unless you instruct Calvert funds, or your financial advisor, otherwise. If you would prefer that your Calvert fund documents not be householded, please contact Calvert funds at 1-800-368-2745, or contact your financial advisor. Your instructions that householding not apply to delivery of your Calvert fund documents will typically be effective within 30 days of receipt by Calvert funds or your financial advisor. Separate statements will be generated for each separate account and will be householded as described above.
Portfolio Holdings. Each Calvert fund will file a schedule of portfolio holdings on Form N-Q with the SEC for the first and third quarters of each fiscal year. The Form N-Q will be available on the Calvert funds’ website at www.calvert.com, by calling Calvert funds at 1-800-368-2745 or in the EDGAR database on the SEC’s website at www.sec.gov. Form N-Q may also be reviewed and copied at the SEC’s public reference room in Washington, D.C. (call 1-800-732-0330 for information on the operation of the public reference room).
Proxy Voting. The Proxy Voting Guidelines that each Calvert fund uses to determine how to vote proxies relating to portfolio securities is provided as an Appendix to the fund’s Statement of Additional Information. The Statement of Additional Information can be obtained free of charge by calling the Calvert funds at 1-800-368-2745, by visiting the Calvert funds’ website at www.calvert.com or visiting the SEC’s website at www.sec.gov. Information regarding how a Calvert fund voted proxies relating to portfolio securities during the most recent 12-month period ended June 30 is available by calling Calvert funds, by visiting the Calvert funds’ website at www.calvert.com or by visiting the SEC’s website at www.sec.gov.
www.calvert.com CALVERT FLOATING-RATE ADVANTAGE FUND ANNUAL REPORT (Unaudited) 31
| This page intentionally left blank. |
| CALVERT FLOATING-RATE ADVANTAGE FUND | |
Investment Adviser and Administrator Calvert Research and Management 1825 Connecticut Avenue NW, Suite 400 Washington, DC 20009 | Transfer Agent DST Asset Manager Solutions, Inc. 2000 Crown Colony Drive Quincy, MA 02169 |
Principal Underwriter* Eaton Vance Distributors, Inc. Two International Place Boston, MA 02110 (617) 482-8260 | Independent Registered Public Accounting Firm KPMG LLP 1601 Market Street Philadelphia, PA 19103-2499 |
Custodian State Street Bank and Trust Company State Street Financial Center, One Lincoln Street Boston, MA 02111 | Fund Offices 1825 Connecticut Avenue NW, Suite 400 Washington, DC 20009 |
* FINRA BrokerCheck. Investors may check the background of their Investment Professional by contacting the Financial Industry Regulatory Authority (FINRA). FINRA BrokerCheck is a free tool to help investors check the professional background of current and former FINRA-registered securities firms and brokers. FINRA BrokerCheck is available by calling 1-800-289-9999 and at www.FINRA.org. The FINRA BrokerCheck brochure describing this program is available to investors at www.FINRA.org.
Fund shares are not insured by the FDIC and are not deposits or other obligations of, or guaranteed by, any depository institution. Shares are subject to investment risks, including possible loss of principal invested. This report is intended to provide fund information to shareholders. It is not authorized for distribution to prospective investors unless preceded or accompanied by a prospectus. Note: The information on our website is not incorporated by reference into this report; our website address is included as an inactive textual reference only. Investors should carefully consider the investment objectives, risks, charges and expenses of the Calvert funds. This and other important information is contained in the fund’s summary prospectus and prospectus, which can be obtained from your financial professional and should be read carefully before investing. You may also call the Calvert funds at 800-368-2745. Printed on recycled paper. | |
| 29940 9.30.18 | |
| | |
Calvert Ultra-Short Duration Income NextShares (CRUSC) Listing Exchange: The NASDAQ Stock Market LLC | | |
| | |
Annual Report September 30, 2018 | E-Delivery Sign-Up — Details Inside | |
 | | |
NextShares® is a registered trademark of NextShares Solutions LLC. All rights reserved. | ||
Commodity Futures Trading Commission Registration. Effective December 31, 2012, the Commodity Futures Trading Commission (“CFTC”) adopted certain regulatory changes that subject registered investment companies and advisers to regulation by the CFTC if a fund invests more than a prescribed level of its assets in certain CFTC-regulated instruments (including futures, certain options and swap agreements) or markets itself as providing investment exposure to such instruments. The Fund and its adviser have claimed an exclusion from the definition of the term “commodity pool operator” under the Commodity Exchange Act. Accordingly, neither the Fund nor the adviser is subject to CFTC regulation. |
Choose Planet-friendly E-delivery! On-line statements, prospectuses, and fund reports may be available through your brokerage firm. Please contact your broker for electronic delivery options available through their firm. |
| TABLE OF CONTENTS | |||
| Management’s Discussion of Fund Performance | ||||
| Performance | ||||
| Fund Profile | ||||
| Endnotes and Additional Disclosures | ||||
| Fund Expenses | ||||
| Financial Statements | ||||
| Report of Independent Registered Public Accounting Firm | ||||
| Federal Tax Information | ||||
| Management and Organization | ||||
| Important Notices | ||||
MANAGEMENT’S DISCUSSION OF FUND PERFORMANCE1
Economic and Market Conditions
For the 12-month period ended September 30, 2018, U.S. investment-grade, fixed-income securities declined, with the Bloomberg Barclays U.S. Aggregate Bond Index2 returning -1.22%. In comparison, high-yield credits showed strength with the ICE BofAML U.S. High Yield Index rising 2.94% during the period.
Although geopolitical tensions involving North Korea rattled markets early in the period, accommodative central banks, strong corporate earnings, and global growth muffled the impact of these potential sources of volatility. However, as the year progressed, the growing threat of an international trade war and mounting uncertainties about the course of Brexit raised market worries. Signs of decelerating growth outside the U.S. ─ as well as concerns about rising inflation and interest rates inside the U.S. ─ led to an uptick in volatility.
U.S. gross domestic product (GDP) growth accelerated through most of the period, reaching a quarterly annualized rate of 4.2% in the second quarter of 2018, the highest level in four years. Corporate earnings and balance sheets also steadily strengthened and the unemployment rate fell to 3.9% during the period from 4.2% at the start of the period. Wages, which had remained stagnant even as the jobless rate fell, began to rise in the latter stages of the period. Inflation increased modestly with the personal consumption expenditures index rising to nearly 2%, mirroring the U.S. Federal Reserve Board (the Fed) target level.
As the U.S. economy showed signs of building strength, the Fed raised the federal funds rate four times during the period and projected another rate hike before the end of 2018 as well as three more potential increases in 2019.
Outside the U.S., growth in major economies in the eurozone and China slowed during the period. Eurozone countries shifted away from monetary-easing policies while the Central Bank of China cut interest rates. Both actions contributed to a stronger U.S. dollar. Meanwhile, the Bank of Japan curtailed the easing policies it had pursued since the 2008 financial crisis.
As the Fed adhered to its tightening course, spreads between the yields of issues of longer- and shorter-term maturities ─ already unusually narrow at the beginning of the period ─ converged, further flattening the yield curve. Early in the calendar year, a major U.S. tax cut supported a surge in Treasury bill issuances and large-scale corporate cash repatriation, putting pressure on short-term interest rates.
Later in the period, a strong supply of issuances from merger-and-acquisition transactions ─ in addition to concerns about increased leverage and weakening fundamentals in the latter stages of the credit cycle ─ contributed to widening spreads.
Fund Performance
Since its inception on January 10, 2018 through September 30, 2018, Calvert Ultra-Short Duration Income NextShares at net asset value (NAV) returned 1.57%, outperforming its benchmark, the Bloomberg Barclays 9-12 Months Short Treasury Index (the Index), which returned 1.15%.
The Fund’s asset allocation contributed to outperformance versus the Index during the period. An allocation to investment-grade corporate fixed-income securities had a positive impact on Index-relative performance. Allocations to securitized assets, including asset-backed securities, commercial mortgage-backed securities, and mortgage-backed securities, also made positive contributions. An allocation to high yield issues further benefited Index-relative performance. These sectors ─ none of which are included in the Index ─ outperformed the Index as U.S. Treasurys were negatively affected by increases in short-term interest rates.
The Fund’s shorter-than-Index duration also added to positive performance relative to the Index as short-term interest rates rose during the period. Duration is a measure of the expected change in the price of a bond - in percentage terms - given a one-percent change in interest rates, all else being constant. Securities with lower durations tend to be less sensitive to interest-rate changes. An overweight to securities with maturities longer than the average maturity of securities in the Index was a slight detractor from performance as interest rates continued to rise.
At period end, while the Fed had projected a tightening fiscal course to offset the prospect of modest inflation, no one knew whether, when, or how much interest rates would increase. Other areas of uncertainty included how trade tensions with China would play out, the impact of U.S. midterm elections, the looming Brexit deadline, the fiscal policy of Italy’s new government, and the imbalances facing several emerging economies.
Against this backdrop, the Fund was conservatively positioned at period end, including a slightly shorter-than-Index duration. Fund management believed that the rapid growth in BBB-rated6 bonds during the period warranted some caution. In this and other sectors, the Fund continued to emphasize bottom-up security selection.
See Endnotes and Additional Disclosures in this report. Past performance is no guarantee of future results. Investment return and principal value will fluctuate so that shares, when sold, may be worth more or less than their original cost. Performance is for the stated time period only; due to market volatility, the Fund’s current performance may be lower or higher than indicated. The Fund’s performance at market price will differ from its results at net asset value (NAV). The market price used to calculate the Market Price return is the midpoint between the highest bid and the lowest offer on the exchange on which the shares of the Fund are listed for trading, as of the time that the Fund’s NAV is calculated. If you trade your shares at another time during the day, your return may differ. Returns are historical and are calculated by determining the percentage change in NAV or market price (as applicable) with all distributions reinvested at NAV or closing market price (as applicable) on the payment date of the distribution, and are net of management fees and other expenses. Returns are before taxes unless otherwise noted. Performance less than or equal to one year is cumulative. For performance as of the most recent month-end, including historical trading premiums/discounts relative to NAV, please refer to www.calvert.com. |
2 www.calvert.com CALVERT ULTRA-SHORT DURATION INCOME NEXTSHARES ANNUAL REPORT (Unaudited)
PERFORMANCE
Performance2,3 | |||||||||||||
Portfolio Managers Vishal Khanduja, CFA and Brian S. Ellis, CFA, each of Calvert Research and Management | |||||||||||||
| % Cumulative Total Returns | Fund Inception Date | Performance Inception Date | One Year | Five Years | Since Fund Inception | ||||||||
| Fund at NAV | 01/10/2018 | 01/10/2018 | — | % | — | % | 1.57 | % | |||||
| Fund at Market Price | 01/10/2018 | 01/10/2018 | — | — | 1.57 | ||||||||
| Bloomberg Barclays 9-12 Months Short Treasury Index | — | — | 1.28 | % | 0.61 | % | 1.15 | % | |||||
% Total Annual Operating Expense Ratios4 | |||||||||||||
| Gross | 0.65 | % | |||||||||||
| Net | 0.38 | ||||||||||||
% Distribution Rates/Yields5 | |||||||||||||
| Distribution Rate at NAV | 2.71 | % | |||||||||||
| SEC 30-day Yield - Subsidized | 4.21 | ||||||||||||
| SEC 30-day Yield - Unsubsidized | 2.60 | ||||||||||||
| Growth of $10,000 |
| This graph shows the change in value of a hypothetical investment of $10,000 in Calvert Ultra-Short Duration Income NextShares for the period indicated. For comparison, the same investment is shown in the indicated index. |
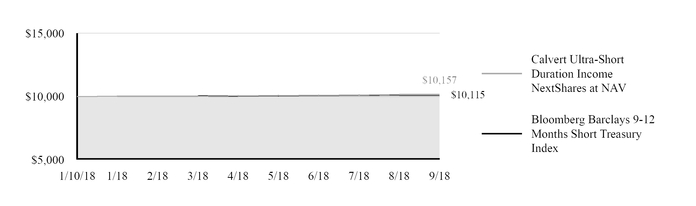
See Endnotes and Additional Disclosures in this report.
Past performance is no guarantee of future results. Investment return and principal value will fluctuate so that shares, when sold, may be worth more or less than their original cost. Performance is for the stated time period only; due to market volatility, the Fund’s current performance may be lower or higher than indicated. The Fund’s performance at market price will differ from its results at net asset value (NAV). The market price used to calculate the Market Price return is the midpoint between the highest bid and the lowest offer on the exchange on which the shares of the Fund are listed for trading, as of the time that the Fund’s NAV is calculated. If you trade your shares at another time during the day, your return may differ. Returns are historical and are calculated by determining the percentage change in NAV or market price (as applicable) with all distributions reinvested at NAV or closing market price (as applicable) on the payment date of the distribution, and are net of management fees and other expenses. Returns are before taxes unless otherwise noted. Performance less than or equal to one year is cumulative. For performance as of the most recent month-end, including historical trading premiums/discounts relative to NAV, please refer to www.calvert.com.
www.calvert.com CALVERT ULTRA-SHORT DURATION INCOME NEXTSHARES ANNUAL REPORT (Unaudited) 3
FUND PROFILE
| PORTFOLIO COMPOSITION (% of total investments) | ||||
| Corporate Bonds | 51.4 | % | ||
| Asset-Backed Securities | 34.3 | % | ||
| Collateralized Mortgage-Backed Obligations | 8.7 | % | ||
| Commercial Mortgage-Backed Securities | 5.6 | % | ||
| Total | 100.0 | % | ||
See Endnotes and Additional Disclosures in this report.
4 www.calvert.com CALVERT ULTRA-SHORT DURATION INCOME NEXTSHARES ANNUAL REPORT (Unaudited)
| Endnotes and Additional Disclosures | ||
1 The views expressed in this report are those of the portfolio manager(s) and are current only through the date stated on the cover. These views are subject to change at any time based upon market or other conditions, and Calvert and the Fund(s) disclaim any responsibility to update such views. These views may not be relied upon as investment advice and, because investment decisions are based on many factors, may not be relied upon as an indication of trading intent on behalf of any Calvert fund. This commentary may contain statements that are not historical facts, referred to as “forward looking statements.” The Fund’s actual future results may differ significantly from those stated in any forward looking statement, depending on factors such as changes in securities or financial markets or general economic conditions, the volume of sales and purchases of Fund shares, the continuation of investment advisory, administrative and service contracts, and other risks discussed from time to time in the Fund’s filings with the Securities and Exchange Commission.
2 | Bloomberg Barclays U.S. Aggregate Bond Index is an unmanaged index of domestic investment-grade bonds, including corporate, government and mortgage-backed securities. Bloomberg Barclays 9-12 Months Short Treasury Index measures the performance of U.S. Treasury bills, notes, and bonds with a maturity between nine and twelve months. ICE BofAML U.S. High Yield Index is an unmanaged index of below-investment grade U.S. corporate bonds. ICE® BofAML® indices are not for redistribution or other uses; provided “as is”, without warranties, and with no liability. Eaton Vance has prepared this report and ICE Data Indices, LLC does not endorse it, or guarantee, review, or endorse Eaton Vance’s products. BofAML® is a licensed registered trademark of Bank of America Corporation in the United States and other countries. Unless otherwise stated, index returns do not reflect the effect of any applicable sales charges, commissions, expenses, taxes or leverage, as applicable. It is not possible to invest directly in an index. Performance since inception for an index, if presented, is the performance since the Fund’s inception. |
3 | Shares of NextShares funds are normally bought and sold in the secondary market through a broker, and may not be individually purchased or redeemed from the fund. In the secondary market, buyers and sellers transact with each other, rather than with the fund. Market trading prices of NextShares are linked to the fund’s next-computed net asset value (NAV) and will vary from NAV by a market-determined premium or discount, which may be zero. Buyers and sellers of NextShares will not know the value of their purchases and sales until after the fund’s NAV is determined at the end of the trading day. Market trading prices may vary significantly from anticipated levels. NextShares do not offer investors the opportunity to buy and sell intraday based on current (versus end-of-day) determinations of fund value. NextShares trade execution prices will fluctuate based on changes in NAV. Although limit orders may be used to control trading costs, they cannot be used to control or limit trade execution prices. As a new type of fund, NextShares have a limited operating history and may initially be available through a limited number of brokers. There can be no guarantee that an active trading market for NextShares will develop or be maintained, or that their listing will continue unchanged. Buying and selling NextShares may require |
payment of brokerage commissions and expose transacting shareholders to other trading costs. Frequent trading may detract from realized investment returns. The return on a shareholder’s NextShares investment will be reduced if the shareholder sells shares at a greater discount or narrower premium to NAV than he or she acquired the shares. NextShares funds issue and redeem shares only in specified creation unit quantities in transactions by or through authorized participants. In such transactions, a fund issues and redeems shares in exchange for the basket of securities, other instruments and/or cash that the fund specifies each business day. A fund’s basket is not intended to be representative of the fund’s current portfolio positions and may vary significantly from current positions.
4 | Source: Fund prospectus. Net expense ratio reflects a contractual expense reimbursement that continues through 1/31/19. Without the reimbursement, performance would have been lower. The expense ratios for the current reporting period can be found in the Financial Highlights section of this report. |
5 | The Distribution Rate is based on the Fund’s last regular distribution per share in the period (annualized) divided by the Fund’s NAV at the end of the period. The Fund’s distributions may be comprised of amounts characterized for federal income tax purposes as tax-exempt income, qualified and non-qualified ordinary dividends, capital gains and nondividend distributions, also known as return of capital. The Fund will determine the federal income tax character of distributions paid to a shareholder after the end of the calendar year. This is reported on the IRS form 1099-DIV and provided to the shareholder shortly after each year-end. The Fund’s distributions are determined by the investment adviser based on its current assessment of the Fund’s long-term return potential. As portfolio and market conditions change, the rate of distributions paid by the Fund could change. The SEC Yield is a standardized measure based on the estimated yield to maturity of a fund’s investments over a 30-day period and is based on the maximum offer price at the date specified. The SEC Yield is not based on the distributions made by the Fund, which may differ. Subsidized yield reflects the effect of fee waivers and expense reimbursements. |
6 | Ratings are based on Moody’s Investors Service, Inc. (“Moody’s”), S&P Global Ratings (“S&P”) or Fitch Ratings (“Fitch”), as applicable. If securities are rated differently by the ratings agencies, the highest rating is applied. Ratings, which are subject to change, apply to the creditworthiness of the issuers of the underlying securities and not to the Fund or its shares. Credit ratings measure the quality of a bond based on the issuer’s creditworthiness, with ratings ranging from AAA, being the highest, to D, being the lowest based on S&P’s measures. Ratings of BBB or higher by S&P or Fitch (Baa or higher by Moody’s) are considered to be investment-grade quality. Credit ratings are based largely on the ratings agency’s analysis at the time of rating. The rating assigned to any particular security is not necessarily a reflection of the issuer’s current financial condition and does not necessarily reflect its assessment of the volatility of a security’s market value or of the liquidity of an investment in the security. |
Fund profile subject to change due to active management.
www.calvert.com CALVERT ULTRA-SHORT DURATION INCOME NEXTSHARES ANNUAL REPORT (Unaudited) 5
FUND EXPENSES
Example
As a Fund shareholder, you incur two types of costs: (1) transaction costs, including brokerage commissions on purchases and sales of Fund shares; and (2) ongoing costs, including management fees and other Fund expenses. This Example is intended to help you understand your ongoing costs (in dollars) of Fund investing and to compare these costs with the ongoing costs of investing in other funds. The Example is based on an investment of $1,000 invested at the beginning of the period and held for the entire period (April 1, 2018 to September 30, 2018).
Actual Expenses
The first section of the table below provides information about actual account values and actual expenses. You may use the information in this section, together with the amount you invested, to estimate the expenses that you paid over the period. Simply divide your account value by $1,000 (for example, an $8,600 account value divided by $1,000 = 8.6), then multiply the result by the number in the first section under the heading entitled “Expenses Paid During Period” to estimate the expenses you paid on your account during this period.
Hypothetical Example for Comparison Purposes
The second section of the table below provides information about hypothetical account values and hypothetical expenses based on the actual Fund expense ratio and an assumed rate of return of 5% per year (before expenses), which is not the actual Fund return. The hypothetical account values and expenses may not be used to estimate the actual ending account balance or expenses you paid for the period. You may use this information to compare the ongoing costs of investing in the Fund and other funds. To do so, compare this 5% hypothetical example with the 5% hypothetical examples that appear in the shareholder reports of the other funds.
Please note that the expenses shown in the table are meant to highlight your ongoing costs only and do not reflect any transactional costs, such as brokerage commissions on purchases and sales of Fund shares. Therefore, the second section of the table is useful in comparing ongoing costs only, and will not help you determine the relative total costs of owning different funds. In addition, if these transactional costs were included, your costs would be higher.
| BEGINNING ACCOUNT VALUE (4/1/18) | ENDING ACCOUNT VALUE (9/30/18) | EXPENSES PAID DURING PERIOD* (4/1/18 - 9/30/18) | ANNUALIZED EXPENSE RATIO | |
| Actual | ||||
| $1,000.00 | $1,013.40 | $1.97** | 0.39% | |
| Hypothetical | ||||
| (5% return per year before expenses) | ||||
| $1,000.00 | $1,023.11 | $1.98** | 0.39% | |
| * Expenses are equal to the Fund’s annualized expense ratio, multiplied by the average account value over the period, multiplied by 183/365 (to reflect the one-half year period). The Example assumes that the $1,000 was invested at the net asset value per share determined at the close of business on March 31, 2018. | ||||
| ** Absent a waiver and/or reimbursement of expenses by an affiliate, expenses would be higher. | ||||
6 www.calvert.com CALVERT ULTRA-SHORT DURATION INCOME NEXTSHARES ANNUAL REPORT (Unaudited)
CALVERT ULTRA-SHORT DURATION INCOME NEXTSHARES
SCHEDULE OF INVESTMENTS
SEPTEMBER 30, 2018
| PRINCIPAL AMOUNT ($) | VALUE ($) | |
| CORPORATE BONDS - 49.6% | ||
| Communications - 3.0% | ||
| AT&T, Inc., 3.289%, (3 mo. USD LIBOR + 0.95%), 7/15/21 (1) | 200,000 | 202,451 |
| Verizon Communications, Inc.: | ||
| 3.334%, (3 mo. USD LIBOR + 1.00%), 3/16/22 (1) | 33,000 | 33,713 |
| 3.414%, (3 mo. USD LIBOR + 1.10%), 5/15/25 (1) | 64,000 | 64,611 |
| 300,775 | ||
| Consumer, Cyclical - 6.7% | ||
| CVS Health Corp.: | ||
| 2.957%, (3 mo. USD LIBOR + 0.63%), 3/9/20 (1) | 94,000 | 94,504 |
| 3.047%, (3 mo. USD LIBOR + 0.72%), 3/9/21 (1) | 44,000 | 44,361 |
| 3.125%, 3/9/20 | 38,000 | 38,016 |
| Ford Motor Credit Co. LLC: | ||
| 3.124%, (3 mo. USD LIBOR + 0.79%), 6/12/20 (1) | 200,000 | 200,011 |
| 3.271%, (3 mo. USD LIBOR + 0.93%), 11/4/19 (1) | 200,000 | 200,539 |
| Hyundai Capital America, 3.261%, (3 mo. USD LIBOR + 0.94%), 7/8/21 (1)(2) | 30,000 | 30,088 |
| Lennar Corp., 4.50%, 11/15/19 | 65,000 | 65,650 |
| 673,169 | ||
| Consumer, Non-cyclical - 6.2% | ||
| Becton Dickinson and Co.: | ||
| 2.133%, 6/6/19 | 100,000 | 99,425 |
| 3.261%, (3 mo. USD LIBOR + 0.875%), 12/29/20 (1) | 306,000 | 306,472 |
| Kraft Heinz Foods Co.: | ||
| 2.761%, (3 mo. USD LIBOR + 0.42%), 8/9/19 (1) | 100,000 | 100,157 |
| 2.911%, (3 mo. USD LIBOR + 0.57%), 2/10/21 (1) | 106,000 | 106,144 |
| Teva Pharmaceutical Finance Netherlands III BV, 1.70%, 7/19/19 | 4,000 | 3,936 |
| 616,134 | ||
| Financial - 28.2% | ||
| AerCap Ireland Capital DAC / AerCap Global Aviation Trust, 3.75%, 5/15/19 | 150,000 | 150,616 |
| Ally Financial, Inc., 3.50%, 1/27/19 | 277,000 | 277,346 |
| Athene Global Funding, 3.566%, (3 mo. USD LIBOR + 1.23%), 7/1/22 (1)(2) | 50,000 | 50,933 |
| Bank of America Corp.: | ||
| 2.727%, (3 mo. USD LIBOR + 0.38%), 1/23/22 (1) | 57,000 | 56,845 |
| 3.007%, (3 mo. USD LIBOR + 0.66%), 7/21/21 (1) | 200,000 | 201,189 |
| 3.106%, (3 mo. USD LIBOR + 0.79%), 3/5/24 (1) | 110,000 | 110,010 |
| 3.527%, (3 mo. USD LIBOR + 1.18%), 10/21/22 (1) | 100,000 | 101,647 |
| Capital One Financial Corp.: | ||
| 3.059%, (3 mo. USD LIBOR + 0.72%), 1/30/23 (1) | 150,000 | 149,426 |
| 3.098%, (3 mo. USD LIBOR + 0.76%), 5/12/20 (1) | 150,000 | 151,044 |
www.calvert.com CALVERT ULTRA-SHORT DURATION INCOME NEXTSHARES ANNUAL REPORT 7
| PRINCIPAL AMOUNT ($) | VALUE ($) | |
| CORPORATE BONDS - CONT’D | ||
| Citigroup, Inc., 3.397%, (3 mo. USD LIBOR + 1.07%), 12/8/21 (1) | 400,000 | 407,174 |
| Goldman Sachs Group, Inc. (The): | ||
| 3.111%, (3 mo. USD LIBOR + 0.73%), 12/27/20 (1) | 200,000 | 201,081 |
| 3.484%, (3 mo. USD LIBOR + 1.17%), 5/15/26 (1) | 38,000 | 38,057 |
| JPMorgan Chase & Co., 3.237%, (3 mo. USD LIBOR + 0.89%), 7/23/24 (1) | 31,000 | 31,127 |
| JPMorgan Chase & Co., Series V, 5.00% to 7/1/19 (3)(4) | 30,000 | 30,262 |
| Morgan Stanley: | ||
| 2.891%, (3 mo. USD LIBOR + 0.55%), 2/10/21 (1) | 150,000 | 150,510 |
| 3.119%, (3 mo. USD LIBOR + 0.80%), 2/14/20 (1) | 250,000 | 250,603 |
| Realogy Group LLC / Realogy Co-Issuer Corp., 4.50%, 4/15/19 (2) | 50,000 | 50,250 |
| Springleaf Finance Corp., 5.25%, 12/15/19 | 65,000 | 66,100 |
| Synchrony Financial: | ||
| 2.60%, 1/15/19 | 175,000 | 174,870 |
| 3.00%, 8/15/19 | 75,000 | 74,865 |
| 3.578%, (3 mo. USD LIBOR + 1.23%), 2/3/20 (1) | 100,000 | 100,669 |
| 2,824,624 | ||
| Industrial - 0.9% | ||
| CNH Industrial Capital LLC, 3.375%, 7/15/19 | 85,000 | 85,144 |
| Technology - 4.6% | ||
| Dell International LLC / EMC Corp.: | ||
| 3.48%, 6/1/19 (2) | 150,000 | 150,406 |
| 4.42%, 6/15/21 (2) | 20,000 | 20,309 |
| DXC Technology Co., 3.271%, (3 mo. USD LIBOR + 0.95%), 3/1/21 (1) | 250,000 | 250,004 |
| Hewlett Packard Enterprise Co., 3.105%, (3 mo. USD LIBOR + 0.72%), 10/5/21 (1) | 18,000 | 18,020 |
| Microchip Technology, Inc., 4.333%, 6/1/23 (2) | 25,000 | 24,865 |
| 463,604 | ||
| Total Corporate Bonds (Cost $4,963,904) | 4,963,450 | |
| ASSET-BACKED SECURITIES - 33.0% | ||
| Automobile - 9.3% | ||
| Avis Budget Rental Car Funding AESOP LLC: | ||
| Series 2013-2A, Class A, 2.97%, 2/20/20 (2) | 250,000 | 250,174 |
| Series 2014-1A, Class A, 2.46%, 7/20/20 (2) | 125,000 | 124,689 |
| Series 2014-2A, Class A, 2.50%, 2/20/21 (2) | 100,000 | 99,245 |
| Enterprise Fleet Financing LLC, Series 2017-3, Class A2, 2.13%, 5/22/23 (2) | 97,342 | 96,504 |
| Hertz Fleet Lease Funding LP, Series 2017-1, Class A2, 2.13%, 4/10/31 (2) | 85,883 | 85,390 |
| OneMain Direct Auto Receivables Trust, Series 2017-2A, Class A, 2.31%, 12/14/21 (2) | 200,000 | 198,965 |
| Tesla Auto Lease Trust, Series 2018-A, Class A, 2.32%, 12/20/19 (2) | 80,009 | 79,801 |
| 934,768 | ||
8 www.calvert.com CALVERT ULTRA-SHORT DURATION INCOME NEXTSHARES ANNUAL REPORT
| PRINCIPAL AMOUNT ($) | VALUE ($) | |
| ASSET-BACKED SECURITIES - CONT’D | ||
| Consumer Loan - 18.3% | ||
| Avant Loans Funding Trust: | ||
| Series 2016-C, Class C, 8.83%, 8/15/22 (2) | 150,000 | 152,755 |
| Series 2017-B, Class B, 3.38%, 4/15/21 (2) | 150,000 | 150,022 |
| Consumer Loan Underlying Bond Credit Trust, Series 2017-P1, Class A, 2.42%, 9/15/23 (2) | 76,937 | 76,744 |
| Marlette Funding Trust, Series 2018-1A, Class A, 2.61%, 3/15/28 (2) | 101,589 | 101,297 |
| OneMain Financial Issuance Trust: | ||
| Series 2015-1A, Class A, 3.19%, 3/18/26 (2) | 68,619 | 68,791 |
| Series 2015-2A, Class B, 3.10%, 7/18/25 (2) | 100,000 | 100,132 |
| Series 2016-2A, Class A, 4.10%, 3/20/28 (2) | 180,706 | 181,886 |
| Prosper Marketplace Issuance Trust: | ||
| Series 2017-1A, Class A, 2.56%, 6/15/23 (2) | 20,717 | 20,714 |
| Series 2017-2A, Class B, 3.48%, 9/15/23 (2) | 315,000 | 314,917 |
| Series 2017-3A, Class A, 2.36%, 11/15/23 (2) | 92,871 | 92,641 |
| Series 2018-2A, Class A, 3.35%, 10/15/24 (2) | 100,000 | 100,007 |
| Springleaf Funding Trust, Series 2016-AA, Class A, 2.90%, 11/15/29 (2) | 175,000 | 174,563 |
| Verizon Owner Trust: | ||
| Series 2016-1A, Class A, 1.42%, 1/20/21 (2) | 196,370 | 195,691 |
| Series 2016-1A, Class B, 1.46%, 1/20/21 (2) | 100,000 | 98,550 |
| 1,828,710 | ||
| Equipment - 0.7% | ||
| Volvo Financial Equipment LLC, Series 2018-1A, Class A2, 2.26%, 9/15/20 (2) | 75,000 | 74,814 |
| Other - 4.0% | ||
| Invitation Homes Trust: | ||
| Series 2017-SFR2, Class A, 3.008%, (1 mo. USD LIBOR + 0.85%), 12/17/36 (1)(2) | 198,886 | 199,720 |
| Series 2018-SFR2, Class D, 3.608%, (1 mo. USD LIBOR + 1.45%), 6/17/37 (1)(2) | 100,000 | 99,721 |
| NextGear Floorplan Master Owner Trust, Series 2015-2A, Class A, 2.38%, 10/15/20 (2) | 100,000 | 99,993 |
| 399,434 | ||
| Student Loan - 0.2% | ||
| Social Professional Loan Program LLC, Series 2016-E, Class A2A, 1.63%, 1/25/36 (2) | 15,265 | 15,223 |
| Whole Business - 0.5% | ||
| Taco Bell Funding LLC, Series 2016-1A, Class A2I, 3.832%, 5/25/46 (2) | 54,175 | 54,270 |
| Total Asset-Backed Securities (Cost $3,309,045) | 3,307,219 | |
| COLLATERALIZED MORTGAGE-BACKED OBLIGATIONS - 8.4% | ||
| Bellemeade Re Ltd., Series 2015-1A, Class M2, 6.516%, (1 mo. USD LIBOR + 4.30%), 7/25/25 (1)(2) | 94,184 | 95,199 |
| Federal Home Loan Mortgage Corp. Structured Agency Credit Risk Debt Notes: | ||
| Series 2018-DNA1, Class M1, 2.666%, (1 mo. USD LIBOR + 0.45%), 7/25/30 (1) | 132,856 | 132,807 |
| Series 2018-SPI2, Class M1, 3.82%, 5/25/48 (2)(5) | 11,258 | 11,276 |
www.calvert.com CALVERT ULTRA-SHORT DURATION INCOME NEXTSHARES ANNUAL REPORT 9
| PRINCIPAL AMOUNT ($) | VALUE ($) | |
| COLLATERALIZED MORTGAGE-BACKED OBLIGATIONS - CONT’D | ||
| Federal National Mortgage Association Connecticut Avenue Securities: | ||
| Series 2014-C01, Class M2, 6.616%, (1 mo. USD LIBOR + 4.40%), 1/25/24 (1) | 22,000 | 25,093 |
| Series 2014-C02, Class 1M2, 4.816%, (1 mo. USD LIBOR + 2.60%), 5/25/24 (1) | 110,000 | 117,555 |
| Series 2014-C03, Class 1M2, 5.216%, (1 mo. USD LIBOR + 3.00%), 7/25/24 (1) | 180,877 | 195,043 |
| Series 2014-C03, Class 2M2, 5.116%, (1 mo. USD LIBOR + 2.90%), 7/25/24 (1) | 246,902 | 264,143 |
| Total Collateralized Mortgage-Backed Obligations (Cost $836,426) | 841,116 | |
| COMMERCIAL MORTGAGE-BACKED SECURITIES - 5.4% | ||
| BBCMS Trust, Series 2018-RRI, Class A, 2.858%, (1 mo. USD LIBOR + 0.70%), 2/15/33 (1)(2) | 101,380 | 101,261 |
| Morgan Stanley Capital I Trust, Series 2017-CLS, Class A, 2.858%, (1 mo. USD LIBOR + 0.70%), 11/15/34 (1)(2) | 250,000 | 249,913 |
| Motel 6 Trust, Series 2017-MTL6, Class A, 3.078%, (1 mo. USD LIBOR + 0.92%), 8/15/34 (1)(2) | 74,567 | 74,706 |
| RETL Trust: | ||
| Series 2018-RVP, Class A, 3.258%, (1 mo. USD LIBOR + 1.10%), 3/15/33 (1)(2) | 59,852 | 60,138 |
| Series 2018-RVP, Class B, 3.908%, (1 mo. USD LIBOR + 1.75%), 3/15/33 (1)(2) | 51,301 | 51,617 |
| Total Commercial Mortgage-Backed Securities (Cost $537,718) | 537,635 | |
| TOTAL INVESTMENTS (Cost $9,647,093) - 96.4% | 9,649,420 | |
| Other assets and liabilities, net - 3.6% | 364,668 | |
NET ASSETS - 100.0% | 10,014,088 | |
| NOTES TO SCHEDULE OF INVESTMENTS | |
| (1) Variable rate security. The stated interest rate represents the rate in effect at September 30, 2018. | |
| (2) Security is exempt from registration under Rule 144A of the Securities Act of 1933. These securities may be resold in transactions exempt from registration, normally to qualified institutional buyers. Total market value of Rule 144A securities amounts to $4,278,180, which represents 42.7% of the net assets of the Fund as of September 30, 2018. | |
| (3) Perpetual security with no stated maturity date but may be subject to calls by the issuer. | |
| (4) Security converts to floating rate after the indicated fixed-rate coupon period. | |
| (5) Weighted average fixed-rate coupon that changes/updates monthly. Rate shown is the rate at September 30, 2018. | |
| Abbreviations: | |
| LIBOR: | London Interbank Offered Rate |
| Currency Abbreviations: | |
| USD: | United States Dollar |
| FUTURES CONTRACTS | NUMBER OF CONTRACTS | EXPIRATION MONTH/YEAR | NOTIONAL AMOUNT | VALUE/NET UNREALIZED APPRECIATION (DEPRECIATION) | ||||
| Long: | ||||||||
| U.S. 2-Year Treasury Note | 2 | Dec-18 | $421,469 | ($1,158 | ) | |||
| See notes to financial statements. | ||||||||
10 www.calvert.com CALVERT ULTRA-SHORT DURATION INCOME NEXTSHARES ANNUAL REPORT
CALVERT ULTRA-SHORT DURATION INCOME NEXTSHARES
STATEMENT OF ASSETS AND LIABILITIES
SEPTEMBER 30, 2018
| ASSETS | |||
| Investments in securities of unaffiliated issuers, at value (identified cost $9,647,093) | $9,649,420 | ||
| Cash | 405,887 | ||
| Receivable for variation margin on open futures contracts | 91 | ||
| Interest receivable | 33,512 | ||
| Deposits at broker for futures contracts | 2,794 | ||
| Trustees’ deferred compensation plan | 5 | ||
| Other assets | 101 | ||
| Total assets | 10,091,810 | ||
| LIABILITIES | |||
| Payable to affiliates: | |||
| Investment advisory fee | 2,138 | ||
| Administrative fee | 987 | ||
| Operations agreement fee | 411 | ||
| Trustees’ deferred compensation plan | 5 | ||
| Other | 3,546 | ||
| Accrued expenses | 70,635 | ||
| Total liabilities | 77,722 | ||
| NET ASSETS | $10,014,088 | ||
| NET ASSETS CONSIST OF: | |||
| Paid-in capital applicable to shares of beneficial interest | |||
| (unlimited number of no par value shares authorized) | $10,004,906 | ||
| Distributable earnings | 9,182 | ||
| Total | $10,014,088 | ||
| NET ASSET VALUE PER SHARE (based on net assets of $10,014,088 and 1,000,000 shares outstanding) | $10.01 | ||
| See notes to financial statements. | |||
www.calvert.com CALVERT ULTRA-SHORT DURATION INCOME NEXTSHARES ANNUAL REPORT 11
CALVERT ULTRA-SHORT DURATION INCOME NEXTSHARES
STATEMENT OF OPERATIONS
PERIOD ENDED SEPTEMBER 30, 2018(1)
| INVESTMENT INCOME | |||
| Interest income | $189,029 | ||
| Total investment income | 189,029 | ||
| EXPENSES | |||
| Investment advisory fee | 18,406 | ||
| Administrative fee | 8,495 | ||
| Operations agreement fee | 3,540 | ||
| Trustees’ fees and expenses | 390 | ||
| Custodian fees | 32,315 | ||
| Transfer agency fees and expenses | 10,348 | ||
| Accounting fees | 514 | ||
| Professional fees | 35,176 | ||
| Reports to shareholders | 4,342 | ||
| Listing fee | 14,600 | ||
| Intraday pricing fee | 8,667 | ||
| Interest expense and fees | 366 | ||
| Miscellaneous | 1,349 | ||
| Total expenses | 138,508 | ||
| Waiver and/or reimbursement of expenses by affiliate | (110,614) | ||
| Reimbursement of expenses-other | (101) | ||
| Net expenses | 27,793 | ||
| Net investment income | 161,236 | ||
| REALIZED AND UNREALIZED GAIN (LOSS) | |||
| Net realized gain (loss) on: | |||
| Investment securities | (5,970) | ||
| Futures contracts | (1,553) | ||
| (7,523) | |||
| Net change in unrealized appreciation (depreciation) on: | |||
| Investment securities | 2,327 | ||
| Futures contracts | (1,158) | ||
| 1,169 | |||
| Net realized and unrealized loss | (6,354) | ||
| Net increase in net assets resulting from operations | $154,882 | ||
(1) For the period from the start of business, January 10, 2018, to September 30, 2018. | |||
| See notes to financial statements. | |||
12 www.calvert.com CALVERT ULTRA-SHORT DURATION INCOME NEXTSHARES ANNUAL REPORT
CALVERT ULTRA-SHORT DURATION INCOME NEXTSHARES
STATEMENT OF CHANGES IN NET ASSETS
| INCREASE (DECREASE) IN NET ASSETS | Period Ended September 30, 2018 (1) | ||
| Operations: | |||
| Net investment income | $161,236 | ||
| Net realized loss | (7,523) | ||
| Net change in unrealized appreciation (depreciation) | 1,169 | ||
| Net increase in net assets resulting from operations | 154,882 | ||
| Distributions to shareholders | (145,700) | ||
| Capital share transactions: | |||
| Proceeds from sale of shares | 9,999,906 | ||
| Transaction fees | 5,000 | ||
| Net increase in net assets from capital share transactions | 10,004,906 | ||
| TOTAL INCREASE IN NET ASSETS | 10,014,088 | ||
| NET ASSETS | |||
| Beginning of period | — | ||
| End of period | $10,014,088 | ||
| Changes in shares outstanding | |||
| Shares outstanding, beginning of period | — | ||
| Shares sold | 1,000,000 | ||
| Shares outstanding, end of period | 1,000,000 | ||
(1) For the period from the start of business, January 10, 2018, to September 30, 2018. | |||
| See notes to financial statements. | |||
www.calvert.com CALVERT ULTRA-SHORT DURATION INCOME NEXTSHARES ANNUAL REPORT 13
CALVERT ULTRA-SHORT DURATION INCOME NEXTSHARES
FINANCIAL HIGHLIGHTS
Period Ended September 30, 2018 (1) | ||||
| Net asset value, beginning | $10.00 | |||
| Income from investment operations: | ||||
Net investment income (2) | 0.16 | |||
| Net realized and unrealized loss | — | (3) | ||
| Total from investment operations | 0.16 | |||
| Distributions from: | ||||
| Net investment income | (0.15) | |||
| Total distributions | (0.15) | |||
| Total increase in net asset value | 0.01 | |||
| Net asset value, ending | $10.01 | |||
Total return (4) | 1.57 | % | (5) | |
Ratios to average net assets: (6) | ||||
| Total expenses | 1.93 | % | (7)(8) | |
| Net expenses | 0.39 | % | (7)(8) | |
| Net investment income | 2.24 | % | (7) | |
| Portfolio turnover | 64 | % | (5) | |
| Net assets, ending (in thousands) | $10,014 | |||
(1) For the period from the start of business, January 10, 2018, to September 30, 2018. | ||||
(2) Computed using average shares outstanding. | ||||
(3) Amount is less than ($0.005). | ||||
(4) Returns are historical and are calculated by determining the percentage change in net asset value with all distributions reinvested and do not reflect the effect of a market-determined premium or discount. Investment returns assume that all distributions have been reinvested at net asset value. | ||||
(5) Not annualized. | ||||
(6) Total expenses do not reflect amounts reimbursed and/or waived by the adviser and certain of its affiliates, if applicable. Net expenses are net of all reductions and represent the net expenses paid by the Fund. | ||||
(7) Annualized. | ||||
(8) Includes interest expense of 0.01% for the period from the start of business, January 10, 2018, to September 30, 2018. | ||||
| See notes to financial statements. | ||||
14 www.calvert.com CALVERT ULTRA-SHORT DURATION INCOME NEXTSHARES ANNUAL REPORT
NOTES TO FINANCIAL STATEMENTS
NOTE 1 — SIGNIFICANT ACCOUNTING POLICIES
Calvert Ultra-Short Duration Income NextShares (the Fund) is a diversified series of Calvert Management Series (the Trust). The Trust is a Massachusetts business trust registered under the Investment Company Act of 1940, as amended (the 1940 Act). The investment objective of the Fund is to seek to maximize income, to the extent consistent with preservation of capital, through investment in short-term bonds and income-producing securities. The Fund is an exchange-traded managed fund operating pursuant to an order issued by the SEC granting an exemption from certain provisions of the 1940 Act. Individual shares of the Fund may be purchased and sold only on a national securities exchange or alternative trading system through a broker-dealer that offers NextShares, and may not be directly purchased or redeemed from the Fund. Market trading prices for the Fund are directly linked to the Fund’s next-computed net asset value per share (NAV) and will vary from NAV by a market-determined premium or discount, which may be zero. The Fund commenced operations on January 10, 2018.
The Fund applies the accounting and reporting guidance in the Financial Accounting Standards Board (FASB) Accounting Standards Codification Topic 946, Financial Services – Investment Companies (ASC 946). Subsequent events, if any, through the date that the financial statements were issued have been evaluated in the preparation of the financial statements.
A. Investment Valuation: Net asset value per share is determined every business day as of the close of the regular session of the New York Stock Exchange (generally 4:00 p.m. Eastern time). The Fund uses independent pricing services approved by the Board of Trustees (the Board) to value its investments wherever possible. Investments for which market quotations are not available or deemed not reliable are fair valued in good faith under the direction of the Board.
U.S. generally accepted accounting principles (U.S. GAAP) establishes a disclosure hierarchy that categorizes the inputs to valuation techniques used to value assets and liabilities at measurement date. These inputs are summarized in the three broad levels listed below:
Level 1 - quoted prices in active markets for identical securities
Level 2 - other significant observable inputs (including quoted prices for similar securities, interest rates, prepayment speeds, credit risk, etc.)
Level 3 - significant unobservable inputs (including the Fund’s own assumptions in determining the fair value of investments)
The inputs or methodologies used for valuing securities are not necessarily an indication of the risk associated with investing in those securities.
Valuation techniques used to value the Fund’s investments by major category are as follows:
Debt Securities. Debt securities are generally valued on the basis of valuations provided by third party pricing services, as derived from such services’ pricing models. Inputs to the models may include, but are not limited to, reported trades, executable bid and asked prices, broker/dealer quotations, prices or yields of securities with similar characteristics, interest rates, anticipated prepayments, benchmark curves or information pertaining to the issuer, as well as industry and economic events. Accordingly, debt securities are generally categorized as Level 2 in the hierarchy. Short-term debt securities of sufficient credit quality purchased with remaining maturities of sixty days or less for which a valuation from a third party pricing service is not readily available may be valued at amortized cost, which approximates fair value, and are categorized as Level 2 in the hierarchy.
Derivatives. Futures contracts are valued at unrealized appreciation (depreciation) based on the settlement price established each day by the board of trade or exchange on which they are traded and are categorized as Level 1 in the hierarchy.
Fair Valuation. If a market value cannot be determined for a security using the methodologies described above, or if, in the good faith opinion of the Fund’s adviser, the market value does not constitute a readily available market quotation, or if a significant event has occurred that would materially affect the value of the security, the security will be fair valued as determined in good faith by or at the direction of the Board in a manner that fairly reflects the security’s value, or the amount that the Fund might reasonably expect to receive for the security upon its current sale in the ordinary course. Each such determination is based on a consideration of relevant factors, which are likely to vary from one pricing context to another. These factors may include, but are not limited to, the type of security, the existence of any contractual restrictions on the security’s disposition, the price and extent of public trading in similar securities of the issuer or of comparable companies or entities, quotations or relevant information obtained from broker/dealers or other market participants, information obtained from the issuer, analysts, and/or the appropriate stock exchange (for exchange-traded securities), an analysis of the company’s or entity’s financial condition, and an evaluation of the forces that influence the issuer and the market(s) in which the security is purchased and sold.
www.calvert.com CALVERT ULTRA-SHORT DURATION INCOME NEXTSHARES ANNUAL REPORT 15
The values assigned to fair value investments are based on available information and do not necessarily represent amounts that might ultimately be realized. Further, due to the inherent uncertainty of valuations of such investments, the fair values may differ significantly from the values that would have been used had an active market existed, and the differences could be material.
The following table summarizes the market value of the Fund’s holdings as of September 30, 2018, based on the inputs used to value them:
| Assets | Level 1 | Level 2 | Level 3 | Total | ||||||||
| Corporate Bonds | $ | — | $ | 4,963,450 | $ | — | $ | 4,963,450 | ||||
| Asset-Backed Securities | — | 3,307,219 | — | 3,307,219 | ||||||||
| Collateralized Mortgage-Backed Obligations | — | 841,116 | — | 841,116 | ||||||||
| Commercial Mortgage-Backed Securities | — | 537,635 | — | 537,635 | ||||||||
| Total Investments | $ | — | $ | 9,649,420 | $ | — | $ | 9,649,420 | ||||
| Liabilities | ||||||||||||
Futures Contracts(1) | $ | (1,158 | ) | $ | — | $ | — | $ | (1,158 | ) | ||
(1) The value listed reflects unrealized appreciation (depreciation) as shown in the Schedule of Investments. | ||||||||||||
B. Investment Transactions and Income: Investment transactions for financial statement purposes are accounted for on trade date. Realized gains and losses are recorded on an identified cost basis and may include proceeds from litigation. Interest income, which includes amortization of premium and accretion of discount on debt securities, is accrued as earned.
C. Futures Contracts: The Fund may enter into futures contracts to buy or sell a financial instrument for a set price at a future date. Initial margin deposits of either cash or securities as required by the broker are made upon entering into the contract. While the contract is open, daily variation margin payments are made to or received from the broker reflecting the daily change in market value of the contract and are recorded for financial reporting purposes as unrealized gains or losses by the Fund. When a futures contract is closed, a realized gain or loss is recorded equal to the difference between the opening and closing value of the contract. The risks associated with entering into futures contracts may include the possible illiquidity of the secondary market which would limit the Fund’s ability to close out a futures contract prior to the settlement date, an imperfect correlation between the value of the contracts and the underlying financial instruments, or that the counterparty will fail to perform its obligations under the contracts’ terms. Futures contracts are designed by boards of trade which are designated “contracts markets” by the Commodities Futures Trading Commission. Futures contracts trade on the contracts markets in a manner that is similar to the way a stock trades on a stock exchange, and the boards of trade, through their clearing corporations, guarantee the futures contracts against default. As a result, there is minimal counterparty credit risk to the Fund.
D. Distributions to Shareholders: Distributions to shareholders are recorded by the Fund on ex-dividend date. Dividends from net investment income are declared and paid monthly. Distributions from net realized capital gains, if any, are paid at least annually. Distributions are paid in cash and cannot be automatically reinvested in additional shares of the Fund. Distributions are determined in accordance with income tax regulations which may differ from U.S. GAAP; accordingly, periodic reclassifications are made within the Fund’s capital accounts to reflect income and gains available for distribution under income tax regulations.
E. Estimates: The preparation of financial statements in conformity with U.S. GAAP requires management to make estimates and assumptions that affect the reported amounts of assets and liabilities and disclosure of contingent assets and liabilities at the date of the financial statements and the reported amounts of increases and decreases in net assets from operations during the reporting period. Actual results could differ from those estimates.
F. Indemnifications: Under the Trust’s organizational document, its officers and Trustees may be indemnified against certain liabilities and expenses arising out of the performance of their duties to the Fund. Under Massachusetts law, if certain conditions prevail, shareholders of a Massachusetts business trust (such as the Trust) could be deemed to have personal liability for the obligations of the Trust. However, the Trust’s Declaration of Trust contains an express disclaimer of liability on the part of Fund shareholders and provides that upon request, the Trust shall assume the defense on behalf of any Fund shareholders or former shareholders. Additionally, in the normal course of business, the Fund enters into agreements with service providers that may contain indemnification clauses. The Fund’s maximum exposure under these arrangements is unknown as this would involve future claims that may be made against the Fund that have not yet occurred.
G. Federal Income Taxes: No provision for federal income or excise tax is required since the Fund intends to qualify as a regulated investment company under the Internal Revenue Code and to distribute substantially all of its taxable earnings.
16 www.calvert.com CALVERT ULTRA-SHORT DURATION INCOME NEXTSHARES ANNUAL REPORT
Management has analyzed the Fund’s tax positions taken for all open federal income tax years and has concluded that no provision for federal income tax is required in the Fund’s financial statements. A Fund’s federal tax return is subject to examination by the Internal Revenue Service for a period of three years from the date of filing.
NOTE 2 — RELATED PARTY TRANSACTIONS
The investment advisory fee is earned by Calvert Research and Management (CRM), a subsidiary of Eaton Vance Management (EVM), as compensation for investment advisory services rendered to the Fund. Pursuant to the investment advisory agreement, CRM receives a fee, payable monthly, at the following annual rates of the Fund’s average daily net assets: 0.26% on the first $1 billion and 0.25% on the excess of $1 billion. For the period ended September 30, 2018, the investment advisory fee amounted to $18,406 or 0.26% (annualized) of the Fund’s average daily net assets.
CRM has agreed to reimburse the Fund’s expenses to the extent that total annual operating expenses (relating to ordinary operating expenses only and excluding expenses such as brokerage commissions, acquired fund fees and expenses of unaffiliated funds, interest expense, taxes or litigation expenses) exceed 0.38% of the Fund’s average daily net assets. The expense reimbursement agreement with CRM may be changed or terminated after January 31, 2019. For the period ended September 30, 2018, CRM waived or reimbursed expenses of $110,614.
The Trust, on behalf of the Fund, has entered into an operations agreement with CRM pursuant to which CRM provides the Fund with services required for it to operate as a NextShares exchange-traded managed fund in accordance with the exemptive order. Pursuant to the agreement, the Fund pays CRM a monthly fee at an annual rate of 0.05% of the Fund’s average daily net assets provided the average net assets of NextShares funds sponsored by CRM (“Covered Assets”) are less than $10 billion. The annual rate is reduced if Covered Assets are $10 billion and above. For the period ended September 30, 2018, the operations agreement fee amounted to $3,540 or 0.05% (annualized) of the Fund’s average daily net assets.
The administrative fee is earned by CRM as compensation for administrative services rendered to the Fund. The fee is computed at an annual rate of 0.12% of the Fund’s average daily net assets and is payable monthly. For the period ended September 30, 2018, CRM was paid administrative fees of $8,495.
Each Trustee of the Fund who is not an employee of CRM or its affiliates receives a fee of $3,000 for each Board meeting attended in person and $2,000 for each Board meeting attended by phone plus an annual fee of $52,000, and $1,500 for each Committee meeting attended in person and $1,000 for each Committee meeting attended by phone plus an annual Committee fee of $2,500. The Board chair receives an additional $10,000 annual retainer and Committee chairs receive an additional $6,000 annual retainer. Eligible Trustees may participate in a Deferred Compensation Plan (the Plan). Amounts deferred under the Plan are treated as though equal dollar amounts had been invested in shares of the Fund or other Calvert funds selected by the Trustees. The Fund purchases shares of the funds selected equal to the dollar amounts deferred under the Plan, resulting in an asset equal to the deferred compensation liability. Obligations of the Plan are paid solely from the Fund’s assets. Trustees’ fees are allocated to each of the Calvert funds served. Salaries and fees of officers and Trustees of the Fund who are employees of CRM or its affiliates are paid by CRM. In addition, an advisory council was established to aid the Board and CRM in advancing the cause of responsible investing through original scholarship and thought leadership. The advisory council consists of CRM’s Chief Executive Officer and four additional members. Each member (other than CRM’s Chief Executive Officer) receives annual compensation of $75,000, which is being reimbursed by Calvert Investment Management, Inc. (CIM), the Calvert funds’ former investment adviser and Ameritas Holding Company, CIM’s parent company, through the end of 2019. For the period ended September 30, 2018, the Fund’s allocated portion of such expense and reimbursement was $101, which are included in miscellaneous expense and reimbursement of expenses-other, respectively, on the Statement of Operations.
NOTE 3 — INVESTMENT ACTIVITY
During the period ended September 30, 2018, the cost of purchases and proceeds from sales of investments, other than U.S. government and agency securities and short-term securities, and including maturities and paydowns, were $12,372,379 and $3,931,840, respectively. Purchases and sales of U.S. government and agency securities, including paydowns, were $2,705,983 and $1,957,314, respectively.
www.calvert.com CALVERT ULTRA-SHORT DURATION INCOME NEXTSHARES ANNUAL REPORT 17
NOTE 4 — DISTRIBUTIONS TO SHAREHOLDERS AND INCOME TAX INFORMATION
The tax character of distributions declared for the period ended September 30, 2018 was as follows:
| Period Ended September 30, | |
2018 (1) | |
| Ordinary income | $145,700 |
(1) For the period from the start of business, January 10, 2018, to September 30, 2018. | |
As of September 30, 2018, the components of distributable earnings (accumulated loss) on a tax basis were as follows:
| Undistributed ordinary income | $22,037 | ||
| Deferred capital losses | ($15,182 | ) | |
| Net unrealized appreciation (depreciation) | $2,327 | ||
At September 30, 2018, the Fund, for federal income tax purposes, had deferred capital losses of $15,182 which would reduce the Fund’s taxable income arising from future net realized gains on investment transactions, if any, to the extent permitted by the Internal Revenue Code, and thus would reduce the amount of distributions to shareholders, which would otherwise be necessary to relieve the Fund of any liability for federal income or excise tax. The deferred capital losses are treated as arising on the first day of the Fund’s next taxable year and retain the same short-term or long-term character as when originally deferred. Of the deferred capital losses at September 30, 2018, $13,555 are short-term and $1,627 are long-term.
The cost and unrealized appreciation (depreciation) of investments, including open derivative contracts, of the Fund at September 30, 2018, as determined on a federal income tax basis, were as follows:
| Aggregate cost | $9,647,093 | ||
| Gross unrealized appreciation | $13,204 | ||
| Gross unrealized depreciation | (10,877) | ||
| Net unrealized appreciation (depreciation) | $2,327 | ||
NOTE 5 — FINANCIAL INSTRUMENTS
A summary of futures contracts outstanding at September 30, 2018 is included in the Schedule of Investments. During the period ended September 30, 2018, the Fund used futures contracts to hedge interest rate risk and to manage duration.
At September 30, 2018, the fair value of open derivative instruments (not considered to be hedging instruments for accounting disclosure purposes) and whose primary underlying risk exposure is interest rate risk was as follows:
| Derivative | Assets | Liabilities | |||||
| Futures contracts | $— | ($1,158 | ) | * | |||
| * Only the current day’s variation margin is reported within the Statement of Assets and Liabilities as Receivable or Payable for variation margin on open futures contracts, as applicable. | |||||||
The effect of derivative instruments (not considered to be hedging instruments for accounting disclosure purposes) on the Statement of Operations and whose primary underlying risk exposure is interest rate risk for the period ended September 30, 2018 was as follows:
| Statement of Operations Caption | ||
| Derivative | Net realized gain (loss) on futures contracts | Net change in unrealized appreciation (depreciation) on futures contracts |
| Futures contracts | ($1,553) | ($1,158) |
The average notional cost of futures contracts (long) outstanding during the period ended September 30, 2018 was approximately $519,000.
18 www.calvert.com CALVERT ULTRA-SHORT DURATION INCOME NEXTSHARES ANNUAL REPORT
NOTE 6 — CAPITAL SHARE TRANSACTIONS
The Trust may issue an unlimited number of shares of capital stock (no par value per share) in one or more series (such as the Fund). The Fund issues and redeems shares only in blocks of 25,000 shares or multiples thereof (“Creation Units”). The Fund issues and redeems Creation Units in return for the securities, other instruments and/or cash (the “Basket”) that the Fund specifies each business day. Creation Units may be purchased or redeemed only by or through Authorized Participants, which are broker-dealers or institutional investors that have entered into agreements with the Fund’s distributor for this purpose. The Fund imposes a transaction fee on Creation Units issued and redeemed to offset the estimated cost to the Fund of processing the transaction, which is paid by the Authorized Participants directly to a third-party administrator. In addition, Authorized Participants pay the Fund a variable charge for converting the Basket to or from the desired portfolio composition. Such variable charges are reflected as Transaction fees on the Statement of Changes in Net Assets.
At September 30, 2018, EVM owned approximately 99.5% of the outstanding shares of the Fund.
www.calvert.com CALVERT ULTRA-SHORT DURATION INCOME NEXTSHARES ANNUAL REPORT 19
REPORT OF INDEPENDENT REGISTERED PUBLIC ACCOUNTING FIRM
To the Shareholders and Board of Trustees
Calvert Management Series:
Opinion on the Financial Statements
We have audited the accompanying statement of assets and liabilities of Calvert Ultra-Short Duration Income NextShares (the Fund), a series of Calvert Management Series, including the schedule of investments, as of September 30, 2018, the related statement of operations and changes in net assets for the period from January 10, 2018 (commencement of operations) to September 30, 2018, and the related notes (collectively, the financial statements) and the financial highlights for the period from January 10, 2018 to September 30, 2018. In our opinion, the financial statements and financial highlights present fairly, in all material respects, the financial position of the Fund as of September 30, 2018, the results of its operations, the changes in its net assets, and the financial highlights for the period from January 10, 2018 to September 30, 2018, in conformity with U.S. generally accepted accounting principles.
Basis for Opinion
These financial statements and financial highlights are the responsibility of the Fund’s management. Our responsibility is to express an opinion on these financial statements and financial highlights based on our audit. We are a public accounting firm registered with the Public Company Accounting Oversight Board (United States) (PCAOB) and are required to be independent with respect to the Fund in accordance with the U.S. federal securities laws and the applicable rules and regulations of the Securities and Exchange Commission and the PCAOB.
We conducted our audit in accordance with the standards of the PCAOB. Those standards require that we plan and perform the audit to obtain reasonable assurance about whether the financial statements and financial highlights are free of material misstatement, whether due to error or fraud. Our audit included performing procedures to assess the risks of material misstatement of the financial statements and financial highlights, whether due to error or fraud, and performing procedures that respond to those risks. Such procedures included examining, on a test basis, evidence regarding the amounts and disclosures in the financial statements and financial highlights. Such procedures also included confirmation of securities owned as of September 30, 2018, by correspondence with custodians and brokers. Our audit also included evaluating the accounting principles used and significant estimates made by management, as well as evaluating the overall presentation of the financial statements and financial highlights. We believe that our audit provides a reasonable basis for our opinion.
We have served as the auditor of one or more of the Calvert Funds since 2002.
Philadelphia, Pennsylvania
November 21, 2018
20 www.calvert.com CALVERT ULTRA-SHORT DURATION INCOME NEXTSHARES ANNUAL REPORT
FEDERAL TAX INFORMATION
The Form 1099-DIV you receive in February 2019 will show the tax status of all distributions paid to your account in calendar year 2018. Shareholders are advised to consult their own tax adviser with respect to the tax consequences of their investment in the Fund.
www.calvert.com CALVERT ULTRA-SHORT DURATION INCOME NEXTSHARES ANNUAL REPORT (Unaudited) 21
MANAGEMENT AND ORGANIZATION
Fund Management. The Trustees of Calvert Management Series (the Trust) are responsible for the overall management and supervision of the Trust’s affairs. The Trustees and officers of the Trust are listed below. Except as indicated, each individual has held the office shown or other offices in the same company for the last five years. Trustees and officers of the Trust hold indefinite terms of office. The “Independent Trustees” consist of those Trustees who are not “interested persons” of the Trust, as that term is defined under the 1940 Act. The business address of each Trustee and officer, with the exception of Ms. Gemma and Mr. Kirchner, is 1825 Connecticut Avenue NW, Suite 400, Washington, DC 20009. As used below, “CRM” refers to Calvert Research and Management. Each Trustee oversees 39 funds in the Calvert fund complex. Each officer serves as an officer of certain other Calvert funds.
| Name and Year of Birth | Position with Trust | Position Start Date | Principal Occupation(s) and Directorships During Past Five Years and Other Relevant Experience |
| Interested Trustee | |||
John H. Streur(1) 1960 | Trustee & President | 2015 | President and Chief Executive Officer of Calvert Research and Management (since December 31, 2016). President and Chief Executive Officer of Calvert Investments, Inc. (January 2015 - December 2016); Chief Executive Officer of Calvert Investment Distributors, Inc. (August 2015 - December 2016); Chief Compliance Officer of Calvert Investment Management, Inc. (August 2015 - April 2016); President and Director, Portfolio 21 Investments, Inc. (through October 2014); President, Chief Executive Officer and Director, Managers Investment Group LLC (through January 2012); President and Director, The Managers Funds and Managers AMG Funds (through January 2012). Directorships in the Last Five Years. Portfolio 21 Investments, Inc. (asset management) (through October 2014); Managers Investment Group LLC (asset management) (through January 2012); The Managers Funds (asset management) (through January 2012); Managers AMG Funds (asset management) (through January 2012); Calvert Impact Capital, Inc. |
| Independent Trustees | |||
| Richard L. Baird, Jr 1948 | Trustee | 1980 | Former President and CEO of Adagio Health Inc. (retired in 2014) in Pittsburgh, PA, a non-profit corporation which provides family planning services, nutrition, maternal/child health care, and various health screening services and community preventive health programs. Directorships in the Last Five Years. None. |
| Alice Gresham Bullock 1950 | Chair & Trustee | 2016 | Professor at Howard University School of Law (retired June 2016). She is former Dean of Howard University School of Law (1996-2002) and Deputy Director of the Association of American Law Schools (1992-1994). Directorships in the Last Five Years. None. |
| Cari M. Dominguez 1949 | Trustee | 2016 | Former Chair of the U.S. Equal Employment Opportunity Commission. Directorships in the Last Five Years. Manpower, Inc. (employment agency); Triple S Management Corporation (managed care); National Association of Corporate Directors. |
| John G. Guffey, Jr. 1948 | Trustee | 1982 | President of Aurora Press Inc., a privately held publisher of trade paperbacks (since January 1997). Directorships in the Last Five Years. Calvert Impact Capital, Inc.; Calvert Ventures, LLC. |
| Miles D. Harper, III 1962 | Trustee | 2016 | Partner, Carr Riggs & Ingram (public accounting firm) since October 2014. Partner, Gainer Donnelly & Desroches (public accounting firm) (now Carr Riggs & Ingram), November 1999 - September 2014). Directorships in the Last Five Years. Bridgeway Funds (10) (asset management). |
22 www.calvert.com CALVERT ULTRA-SHORT DURATION INCOME NEXTSHARES ANNUAL REPORT (Unaudited)
| Name and Year of Birth | Position with Trust | Position Start Date | Principal Occupation(s) and Directorships During Past Five Years and Other Relevant Experience |
| Joy V. Jones 1950 | Trustee | 2016 | Attorney. Directorships in the Last Five Years. Conduit Street Restaurants SUD 2 Limited; Palm Management Restaurant Corporation. |
| Anthony A. Williams 1951 | Trustee | 2010 | CEO and Executive Director of the Federal City Council (July 2012 to present); Senior Adviser and Independent Consultant for McKenna Long & Aldridge LLP (September 2011 to present); Executive Director of Global Government Practice at the Corporate Executive Board (January 2010 to January 2012). Directorships in the Last Five Years. Freddie Mac; Evoq Properties/ Meruelo Maddux Properties, Inc. (real estate management); Weston Solutions, Inc. (environmental services); Bipartisan Policy Center’s Debt Reduction Task Force; Chesapeake Bay Foundation; Catholic University of America; Urban Institute (research organization). |
| Principal Officers who are not Trustees | |||
| Name and Year of Birth | Position with Trust | Position Start Date | Principal Occupation During Past Five Years |
| Hope L. Brown 1973 | Chief Compliance Officer | 2014 | Chief Compliance Officer of 39 registered investment companies advised by CRM (since 2014). Vice President and Chief Compliance Officer, Wilmington Funds (2012-2014). Vice President and Senior Compliance Officer, Wilmington Trust Investment Advisors, Inc. (2010-2012). |
Maureen A. Gemma(2) 1960 | Secretary, Vice President and Chief Legal Officer | 2016 | Vice President of CRM and officer of 39 registered investment companies advised by CRM (since 2016). Also Vice President of Eaton Vance Management (“EVM”) and certain of its affiliates and officer of 174 registered investment companies advised or administered by EVM. |
James F. Kirchner(2) 1967 | Treasurer | 2016 | Vice President of CRM and officer of 39 registered investment companies advised by CRM (since 2016). Also Vice President of EVM and certain of its affiliates and officer of 174 registered investment companies advised or administered by EVM. |
(1) | Mr. Streur is an interested person of the Fund because of his positions with the Fund’s Adviser and certain affiliates. |
(2) | The business address for Ms. Gemma and Mr. Kirchner is Two International Place, Boston, MA 02110. |
The SAI for the Fund includes additional information about the Trustees and officers of the Fund and can be obtained without charge on Calvert’s website at www.calvert.com or by calling 1-800-368-2745.
www.calvert.com CALVERT ULTRA-SHORT DURATION INCOME NEXTSHARES ANNUAL REPORT (Unaudited) 23
IMPORTANT NOTICES
Privacy. The Calvert Funds and Calvert Research and Management are committed to ensuring your financial privacy. Each of the financial institutions identified below has in effect the following policy (“Privacy Policy”) with respect to nonpublic personal information about its customers:
| • | Only such information received from you, through application forms or otherwise, and information about your Calvert fund transactions will be collected. This may include information such as name, address, social security number, tax status, account balances and transactions. |
| • | None of such information about you (or former customers) will be disclosed to anyone, except as permitted by law (which includes disclosure to employees necessary to service your account). In the normal course of servicing a customer’s account, Calvert Research and Management may share information with unaffiliated third parties that perform various required services such as transfer agents, custodians and broker-dealers. |
| • | Policies and procedures (including physical, electronic and procedural safeguards) are in place that are designed to protect the confidentiality of such information. |
| • | The Funds reserve the right to change this Privacy Policy at any time upon proper notification to you. Customers may want to review the Funds’ Privacy Policy periodically for changes by accessing the link on our homepage: www.calvert.com. |
Our pledge of privacy applies to the following entities: the Calvert Family of Funds, Calvert Research and Management and their affiliated service providers, Eaton Vance Management and Eaton Vance Distributors, Inc. In addition, our Privacy Policy applies only to those Calvert customers who are individuals and who have a direct relationship with us. If a customer’s account (i.e., fund shares) is held in the name of a third-party financial advisor/broker-dealer, it is likely that only such advisor’s privacy policies apply to the customer. This notice supersedes all previously issued privacy disclosures. For more information about Calvert’s Privacy Policy, please call 1-800-368-2745.
Delivery of Shareholder Documents. The Securities and Exchange Commission (SEC) permits delivery of only one copy of fund shareholder documents, including prospectuses, proxy statements and shareholder reports, to fund investors with multiple accounts at the same residential or post office box address. This practice is often called “householding” and it helps eliminate duplicate mailings to shareholders. Your broker may household the mailing of your documents indefinitely unless you instruct your broker otherwise. If you would prefer that your Calvert documents not be householded, please contact your broker. Your instructions that householding not apply to delivery of your Calvert documents will typically be effective within 30 days of receipt by your broker.
Portfolio Holdings. Each Calvert fund will file a schedule of portfolio holdings on Form N-Q with the SEC for the first and third quarters of each fiscal year. The Form N-Q will be available on the Calvert funds’ website at www.calvert.com, by calling Calvert funds at 1-800-368-2745 or in the EDGAR database on the SEC’s website at www.sec.gov. Form N-Q may also be reviewed and copied at the SEC’s public reference room in Washington, D.C. (call 1-800-732-0330 for information on the operation of the public reference room).
Proxy Voting. The Proxy Voting Guidelines that each Calvert fund uses to determine how to vote proxies relating to portfolio securities is provided as an Appendix to the fund’s Statement of Additional Information. The Statement of Additional Information can be obtained free of charge by calling the Calvert funds at 1-800-368-2745, by visiting the Calvert funds’ website at www.calvert.com or visiting the SEC’s website at www.sec.gov. Information regarding how a Calvert fund voted proxies relating to portfolio securities during the most recent 12-month period ended June 30 is available by calling Calvert funds, by visiting the Calvert funds’ website at www.calvert.com or by visiting the SEC’s website at www.sec.gov.
24 www.calvert.com CALVERT ULTRA-SHORT DURATION INCOME NEXTSHARES ANNUAL REPORT (Unaudited)
| CALVERT ULTRA-SHORT DURATION INCOME NEXTSHARES | |
Investment Adviser and Administrator Calvert Research and Management 1825 Connecticut Avenue NW, Suite 400 Washington, DC 20009 | Transfer and Dividend Disbursing Agent State Street Bank and Trust Company State Street Financial Center, One Lincoln Street Boston, MA 02111 |
Distributor* Foreside Fund Services, LLC Three Canal Plaza, Suite 100 Portland, ME 04101 | Independent Registered Public Accounting Firm KPMG LLP 1601 Market Street Philadelphia, PA 19103-2499 |
Custodian State Street Bank and Trust Company State Street Financial Center, One Lincoln Street Boston, MA 02111 | Fund Offices 1825 Connecticut Avenue NW, Suite 400 Washington, DC 20009 |
* FINRA BrokerCheck. Investors may check the background of their Investment Professional by contacting the Financial Industry Regulatory Authority (FINRA). FINRA BrokerCheck is a free tool to help investors check the professional background of current and former FINRA-registered securities firms and brokers. FINRA BrokerCheck is available by calling 1-800-289-9999 and at www.FINRA.org. The FINRA BrokerCheck brochure describing this program is available to investors at www.FINRA.org.
Fund shares are not insured by the FDIC and are not deposits or other obligations of, or guaranteed by, any depository institution. Shares are subject to investment risks, including possible loss of principal invested. This report is intended to provide fund information to investors. It is not authorized for distribution to prospective investors unless preceded or accompanied by a prospectus. Note: The information on our website is not incorporated by reference into this report; our website address is included as an inactive textual reference only. Before investing in NextShares, investors should carefully consider the investment objectives, risks, charges and expenses. This and other important information is contained in the fund’s summary prospectus and prospectus, which can be obtained from your financial professional and should be read carefully before investing. For further information, please call 800-368-2745. Printed on recycled paper. | |
| 29939 9.30.18 | |
Item 2. Code of Ethics
The registrant has adopted a code of ethics applicable to its Principal Executive Officer, Principal Financial Officer and Principal Accounting Officer. The registrant undertakes to provide a copy of such code of ethics to any person upon request, without charge, by calling 1-800-368-2745. The registrant has amended the code of ethics as described in Form N-CSR during the period covered by this report to make immaterial changes. The registrant has not granted any waiver, including an implicit waiver, from a provision of the code of ethics as described in Form N-CSR during the period covered by this report.
Item 3. Audit Committee Financial Expert
The registrant's Board of Trustees has determined that Miles D. Harper III, an “independent” Trustee serving on the registrant’s audit committee, is an “audit committee financial expert,” as defined in Item 3 of Form N-CSR. Under applicable securities laws, a person who is determined to be an audit committee financial expert will not be deemed an "expert" for any purpose, including without limitation for the purposes of Section 11 of the Securities Act of 1933, as a result of being designated or identified as an audit committee financial expert. The designation or identification of a person as an audit committee financial expert does not impose on such person any duties, obligations, or liabilities that are greater than the duties, obligations, and liabilities imposed on such person as a member of the audit committee and Board of Trustees in the absence of such designation or identification.
Item 4. Principal Accountant Fees and Services
(a) –(d)
The various Series comprising the Trust have differing fiscal year ends (September 30 and December 31). The following table presents the aggregate audit, audit-related, tax, and other fees billed to all of the Series in the Trust by KPMG for the last two fiscal years of each Series.
| Fiscal Years Ended* | 12/31/16 | %** | 9/30/17* | %** | 12/31/17 | %** | 9/30/18 | %** | |||||||||
| Audit Fees | $47,630 | 0 | % | N/A | N/A | $44,959 | 0 | % | $53,500 | 0 | % | ||||||
Audit-Related Fees(1) | $0 | 0 | % | N/A | N/A | $0 | 0 | % | $0 | 0 | % | ||||||
Tax Fees(2) | $8,600 | 0 | % | N/A | N/A | $11,000 | 0 | % | $11,700 | 0 | % | ||||||
All Other Fees(3) | $0 | 0 | % | N/A | N/A | $0 | 0 | % | $0 | 0 | % | ||||||
| Total | $56,230 | 0 | % | N/A | N/A | $55,959 | 0 | % | $65,200 | 0 | % | ||||||
* No Series of the Registrant with a fiscal year end of September 30 was in operation for the fiscal year ended September 30, 2017. Calvert Floating-Rate Advantage Fund commenced operations on October 10, 2017 and Calvert Ultra-Short Duration Income NextShares commenced operations on January 10, 2018.
**Percentage of fees approved by the Audit Committee pursuant to (c)(7)(i)(C) of Rule 2-01 of Reg. S-X (statutory de minimus waiver of Committee’s requirement to pre-approve)
(1) | Audit-related fees consist of the aggregate fees billed for assurance and related services that are reasonably related to the performance of the audit of the registrant’s financial statements and are not reported under the category of audit fees. |
(2) | Tax fees consist of the aggregate fees billed for professional services rendered by the principal accountant relating to tax compliance, tax advice, and tax planning and specifically include fees for tax return preparation and other related tax compliance/planning matters. |
(3) | All other fees consist of the aggregate fees billed for products and services provided by the principal accountant other than audit, audit-related, and tax services. |
(e) The Audit Committee is required to pre-approve all audit and non-audit services provided to the registrant by the auditors, and to the registrant’s investment adviser, and any entity controlling, controlled by, or under common control with the adviser that provides ongoing services to the registrant. In determining whether to pre-approve non-audit services, the Audit Committee considers whether the services are consistent with maintaining the independence of the auditors. The Committee may delegate its authority to pre-approve certain matters to one or more of its members. In this regard, the Committee has delegated authority jointly to the Audit Committee Chair together with another Committee member with respect to non-audit services not exceeding $25,000 in each instance.
In addition, the Committee has pre-approved the retention of the auditors to provide tax-related services related to the tax treatment and tax accounting of newly acquired securities, upon request by the investment adviser in each instance.
(f) Not applicable.
(g) Aggregate non-audit fees billed by the registrant’s accountant for services rendered to the registrant, and rendered to the registrant’s investment adviser, and any entity controlling, controlled by, or under common control with the adviser that provides ongoing services to the registrant for each of the last two fiscal periods of each Series.
Fiscal Year ended 12/31/16 | Fiscal Year ended 9/30/17* | Fiscal Year ended 12/31/17 | Fiscal Period ended 9/30/18 | ||||
| $ | %** | $ | %** | $ | %** | $ | %** |
| $0 | 0% | N/A | N/A | $0 | 0% | $11,700 | 0% |
* Information is not presented for fiscal period ended 9/30/17, as no Series in the Trust with such fiscal year end was in operation during such period.
**Percentage of fees approved by the Audit Committee pursuant to (c)(7)(i)(C) of Rule 2-01 of Reg. S-X (statutory de minimus waiver of Committee’s requirement to pre-approve)
(h) The registrant’s audit committee has considered whether the provision by the registrant’s principal accountant of non-audit services to the registrant’s investment adviser and any entity controlling, controlled by, or under common control with the adviser that provides ongoing services to the registrant that were not pre-approved pursuant to Rule 2-01(c)(7)(ii) of Regulation S-X is compatible with maintaining the principal accountant’s independence.
Item 5. Audit Committee of Listed Registrants
Not applicable.
Item 6. Schedule of Investments
Please see schedule of investments contained in the Report to Stockholders included under Item 1 of this Form N-CSR.
Item 7. Disclosure of Proxy Voting Policies and Procedures for Closed-End Management Investment Companies
Not applicable.
Item 8. Portfolio Managers of Closed-End Management Investment Companies
Not applicable.
Item 9. Purchases of Equity Securities by Closed-End Management Investment Company and Affiliated Purchasers
Not applicable.
Item 10. Submission of Matters to a Vote of Security Holders
No material changes.
Item 11. Controls and Procedures
(a) The registrant’s principal executive and principal financial officers have concluded that the registrant's disclosure controls and procedures (as defined in Rule 30a-3(c) under the Investment Company Act of 1940 Act, as amended (the “1940 Act”) are effective, based on the evaluation of these controls and procedures required by Rule 30a-3(b) under the 1940 Act and Rules 13a-15(b) or 15d-15(b) under the Securities Exchange Act of 1934 (“Exchange Act”), as of a date within 90 days of the filing date of this report.
(b) There was no change in the registrant's internal control over financial reporting (as defined in Rule 30a-3(d) under the 1940 Act) that occurred during the second fiscal quarter of the period covered by this report that has materially affected, or is reasonably likely to materially affect, the registrant's internal control over financial reporting.
Item 12. Disclosure of Securities Lending Activities for Closed-End Management Investment Companies
Not applicable.
Item 13. Exhibits
(a)(1) Registrant’s Code of Ethics – Not applicable (please see Item 2).
(a)(2)(i) Treasurer’s Section 302 certification.
(a)(2)(ii) President’s Section 302 certification.
(b) Combined Section 906 certification.
Signatures
Pursuant to the requirements of the Securities Exchange Act of 1934 and the Investment Company Act of 1940, the registrant has duly caused this report to be signed on its behalf by the undersigned, thereunto duly authorized.
CALVERT MANAGEMENT SERIES
By: /s/ John H. Streur
John H. Streur
President
Date: November 26, 2018
Pursuant to the requirements of the Securities Exchange Act of 1934 and the Investment Company Act of 1940, this report has been signed below by the following persons on behalf of the registrant and in the capacities and on the dates indicated.
By: /s/ James F. Kirchner
James F. Kirchner
Treasurer
Date: November 26, 2018
By: /s/ John H. Streur
John H. Streur
President
Date: November 26, 2018