UNITED STATES
SECURITIES AND EXCHANGE COMMISSION
Washington, D.C. 20549
FORM 10-K
(Mark one)
[ ☒ ] ANNUAL REPORT PURSUANT TO SECTION 13 OR 15(d) OF THE SECURITIES EXCHANGE ACT OF 1934
For the fiscal year ended December 31, 2024
or
[ ☐ ] TRANSITION REPORT PURSUANT TO SECTION 13 OR 15(d) OF THE SECURITIES EXCHANGE ACT OF 1934
For the transition period from to
Commission file number: 001-08052
GLOBE LIFE INC.
(Exact name of registrant as specified in its charter) | | | | | | | | |
| Delaware | | 63-0780404 |
| (State or other jurisdiction of incorporation or organization) | | (I.R.S. Employer Identification No.) |
| |
| 3700 South Stonebridge Drive, McKinney, TX | | 75070 |
| (Address of principal executive offices) | | (Zip Code) |
972-569-4000
(Registrant’s telephone number, including area code)
Securities registered pursuant to Section 12(b) of the Act:
| | | | | | | | |
| Title of each class | Trading Symbol(s) | Name of each exchange on which registered |
| Common Stock, $1.00 par value per share | GL | New York Stock Exchange |
| 4.250% Junior Subordinated Debentures | GL PRD | New York Stock Exchange |
Securities registered pursuant to Section 12(g) of the Act: None
Indicate by check mark if the registrant is a well-known seasoned issuer, as defined in Rule 405 of the Securities Act.
Yes x No ¨
Indicate by check mark if the registrant is not required to file reports pursuant to Section 13 or Section 15(d) of the Act.
Yes ¨ No x
Indicate by check mark whether the registrant (1) has filed all reports required to be filed by Section 13 or 15(d) of the Securities Exchange Act of 1934 during the preceding 12 months (or for such shorter period that the registrant was required to file such reports), and (2) has been subject to such filing requirements for the past 90 days.
Yes x No ¨
Indicate by check mark whether the registrant has submitted electronically every Interactive Data File required to be submitted pursuant to Rule 405 of Regulation S-T (§ 232.405 of this chapter) during the preceding 12 months (or for such shorter period that the registrant was required to submit such files).
Yes x No ¨
Indicate by check mark whether the registrant is a large accelerated filer, an accelerated filer, a non-accelerated filer, a smaller reporting company, or an emerging growth company. See the definitions of “large accelerated filer,” “accelerated filer,” “smaller reporting company” and "emerging growth company" in Rule 12b-2 of the Exchange Act.
| | | | | | | | | | | | | | | | | | | | |
| Large accelerated filer | | x | | Accelerated filer | | ¨ |
| Non-accelerated filer | | ¨ | | Smaller reporting company | | ¨ |
| | | | Emerging growth company | | ¨ |
| If an emerging growth company, indicate by check mark if the registrant has elected not to use the extended transition period for complying with any new or revised financial accounting standards provided pursuant to Section 13(a) of the Exchange Act. | | ¨ |
Indicate by check mark whether the registrant has filed a report on and attestation to its management's assessment of the effectiveness of its internal control over financial reporting under Section 404(b) of the Sarbanes-Oxley Act (15 U.S.C. 7262(b)) by the registered public accounting firm that prepared or issued its audit report. x
If securities are registered pursuant to Section 12(b) of the Act, indicate by check mark whether the financial statements of the registrant included in the filing reflect the correction of an error to previously issued financial statements. ☐
Indicate by checkmark whether any of those error corrections are restatements that required a recovery analysis of incentive-based compensation received by any of the registrant's executive officers during the relevant recovery period pursuant to §240.10D-1(b). ☐
Indicate by check mark whether the registrant is a shell company (as defined in Rule 12b-2 of the Act).
Yes ☐ No x
As of June 30, 2024, the aggregate market value of the registrant’s common stock held by non-affiliates of the registrant was $7.4 billion based on the closing sale price as reported on the New York Stock Exchange.
Indicate the number of shares outstanding of each of the registrant’s classes of common stock, as of the latest practicable date. | | | | | | | | |
| Class | | Outstanding as of January 31, 2025 |
| Common Stock, $1.00 par value per share | | 83,848,424 shares |
DOCUMENTS INCORPORATED BY REFERENCE | | | | | | | | |
| Document | | Parts Into Which Incorporated |
| Proxy Statement for the Annual Meeting of Stockholders to be held on April 24, 2025 (Proxy Statement) | | Part III |
Globe Life Inc.
Table of Contents | | | | | | | | | | | |
| | | | Page |
| | | |
| Item 1. | | |
| Item 1A. | | |
| Item 1B. | | |
| Item 1C. | | |
| Item 2. | | |
| Item 3. | | |
| Item 4. | | |
| | | |
| Item 5. | | |
| Item 6. | | |
| | | |
| Item 7. | | |
| Item 7A. | | |
| Item 8. | | |
| | | |
| | | |
| | | |
| | | |
| | | |
| | | |
| | | |
| | | |
| | | |
| | | |
| | | |
| | | |
| | | |
| | | |
| | | |
| | | |
| | | |
| | | |
| | | |
| | | |
| | | |
| | | |
| Item 9. | | |
| Item 9A. | | |
| Item 9B. | | |
| Item 9C. | | |
| | | |
| Item 10. | | |
| Item 11. | | |
| Item 12. | | |
| Item 13. | | |
| Item 14. | | |
| | | |
| Item 15. | | |
| | | |
Part I
Item 1. Business
Globe Life and the Company refer to Globe Life Inc., an insurance holding company incorporated in Delaware in 1979, and its subsidiaries and affiliates. Its primary subsidiaries are Globe Life And Accident Insurance Company, American Income Life Insurance Company, Liberty National Life Insurance Company, Family Heritage Life Insurance Company of America, and United American Insurance Company.
Globe Life's website is: www.globelifeinsurance.com. Globe Life makes available free of charge through its website, its annual report on Form 10-K, its quarterly reports on Form 10-Q, current reports on Form 8-K, and amendments to those reports as soon as reasonably practicable after they have been electronically filed with or furnished to the Securities and Exchange Commission. Other information included in Globe Life's website is not incorporated into this filing.
| | | | | | | | | | | | | | | | | | | | | | | | | | |
| | Primary Distribution Method | | Underwriting Company | | Products and Target Markets | | Distribution |
| | | | | | | | |
| | Direct to Consumer Division | | Globe Life And Accident Insurance Company
McKinney, Texas | | Individual life and supplemental health limited-benefit insurance including juvenile and senior life coverage and Medicare Supplement to lower middle-income to middle-income Americans. | | Nationwide distribution through direct to consumer channels: including direct mail, electronic media, and insert media. |
| | | | | | | | |
| | | | | | | | |
| | American Income Life Division | | American Income Life Insurance Company
Waco, Texas | | Individual life and supplemental health limited-benefit insurance marketed to working families. | | 11,741 average producing agents in the U.S., Canada, and New Zealand. |
| | | | | | | | |
| | | | | | | | |
| | Liberty National Division | | Liberty National Life Insurance Company
McKinney, Texas | | Life and supplemental health limited-benefit insurance distributed through in-home and worksite channels. | | 3,664 average producing agents in the U.S. |
| | | | | | | | |
| | | | | | | | |
| | Family Heritage Division | | Family Heritage Life Insurance Company of America
Cleveland, Ohio | | Supplemental limited-benefit health insurance to lower middle-income to middle-income families. | | 1,399 average producing agents in the U.S. |
| | | | | | | | |
| | | | | | | | |
| | United American Division | | United American Insurance Company
McKinney, Texas | | Supplemental health Medicare coverage to beneficiaries and, to a lesser extent, supplemental limited-benefit coverage to people under age 65. | | 3,355 independent producing agents in the U.S. |
Insurance
Life Insurance—The distribution channels for life insurance products include direct to consumer, exclusive agents, and independent agents. These methods are described in greater detail within the primary marketing distribution channel chart as shown above. The following table presents annualized premium in force for the three years ended December 31, 2024 by distribution method:
| | | | | | | | | | | | | | | | | |
| | Annualized Premium in Force(1) (Dollar amounts in thousands) |
| 2024 | | 2023 | | 2022 |
Direct to Consumer | $ | 922,508 | | | $ | 933,057 | | | $ | 936,507 | |
| Exclusive agents: | | | | | |
| American Income | 1,761,713 | | | 1,654,197 | | | 1,553,003 | |
| Liberty National | 410,912 | | | 390,693 | | | 360,963 | |
| Independent agents: | | | | | |
| United American | 6,499 | | | 6,958 | | | 7,609 | |
| Other | 197,629 | | | 200,840 | | | 203,438 | |
| $ | 3,299,261 | | | $ | 3,185,745 | | | $ | 3,061,520 | |
Globe Life's insurance subsidiaries write a variety of nonparticipating ordinary life insurance products. These include traditional whole life, term life, and other life insurance. The Company does not currently sell interest-sensitive whole life products. The following tables present selected information about Globe Life's life insurance products.
| | | | | | | | | | | | | | | | | | | | | | | | | | | | | | | | | | | |
| Annualized Premium in Force (Dollar amounts in thousands) |
| | 2024 | | 2023 | | 2022 |
| Amount | | % of
Total | | Amount | | % of
Total | | Amount | | % of
Total |
| Whole life: | | | | | | | | | | | |
| Traditional | $ | 2,321,947 | | | 70 | | | $ | 2,213,816 | | | 69 | | | $ | 2,106,878 | | | 69 | |
| Interest-sensitive | 28,105 | | | 1 | | | 29,929 | | | 1 | | | 31,838 | | | 1 | |
Term | 745,231 | | | 23 | | | 753,261 | | | 24 | | | 756,471 | | | 25 | |
Other | 203,978 | | | 6 | | | 188,739 | | | 6 | | | 166,333 | | | 5 | |
| $ | 3,299,261 | | | 100 | | | $ | 3,185,745 | | | 100 | | | $ | 3,061,520 | | | 100 | |
| | | | | | | | | | | | | | | | | | | | | | | | | | | | | | | | | | | |
| Policy Count and Average Face Amount Per Policy (Dollar amounts in thousands) |
| 2024 | | 2023 | | 2022 |
| Policy Count | | Average Face Amount per Policy | | Policy Count | | Average Face Amount per Policy | | Policy Count | | Average Face Amount per Policy |
| Whole life: | | | | | | | | | | | |
| Traditional | 9,092,122 | | | $ | 16.2 | | | 9,050,091 | | | $ | 16.0 | | | 9,011,227 | | | $ | 15.7 | |
| Interest-sensitive | 169,054 | | | 20.4 | | | 176,339 | | | 20.4 | | | 183,887 | | | 20.4 | |
Term | 4,600,839 | | | 15.2 | | | 4,680,364 | | | 15.1 | | | 4,720,870 | | | 15.3 | |
Other | 495,894 | | | 18.1 | | | 479,664 | | | 17.3 | | | 453,515 | | | 16.1 | |
| 14,357,909 | | | $ | 16.0 | | | 14,386,458 | | | $ | 15.8 | | | 14,369,499 | | | $ | 15.6 | |
Health Insurance—The following table presents Globe Life's health insurance annualized premium in force for the three years ended December 31, 2024 by distribution channel.
| | | | | | | | | | | | | | | | | |
| | Annualized Premium in Force (Dollar amounts in thousands) |
| 2024 | | 2023 | | 2022 |
Direct to Consumer | $ | 74,815 | | | $ | 70,249 | | | $ | 72,161 | |
| Exclusive agents: | | | | | |
| Liberty National | 201,874 | | | 200,160 | | | 196,336 | |
| American Income | 119,986 | | | 116,962 | | | 113,087 | |
| Family Heritage | 454,725 | | | 418,693 | | | 387,897 | |
| Independent agents: | | | | | |
| United American | 624,446 | | | 579,237 | | | 558,373 | |
| $ | 1,475,846 | | | $ | 1,385,301 | | | $ | 1,327,854 | |
Globe Life offers Medicare Supplement and limited-benefit supplemental health insurance products that include accident, cancer, critical illness, heart, intensive care, and other health products. These products are designed to supplement health coverage that applicants already own. Medicare Supplements are offered to enrollees in the traditional fee-for-service Medicare program. Medicare Supplement plans are standardized by federal regulation and are designed to pay deductibles and co-payments not paid by Medicare.
The following table presents supplemental health annualized premium in force information for the three years ended December 31, 2024 by product category.
| | | | | | | | | | | | | | | | | | | | | | | | | | | | | | | | | | | |
| | Annualized Premium in Force (Dollar amounts in thousands) |
| 2024 | | 2023 | | 2022 |
| Amount | | % of
Total | | Amount | | % of
Total | | Amount | | % of
Total |
| Limited-benefit plans | $ | 824,844 | | | 56 | | | $ | 782,424 | | | 56 | | | $ | 735,858 | | | 55 | |
| Medicare Supplement | 651,002 | | | 44 | | | 602,877 | | | 44 | | | 591,996 | | | 45 | |
| $ | 1,475,846 | | | 100 | | | $ | 1,385,301 | | | 100 | | | $ | 1,327,854 | | | 100 | |
Pricing—Premium rates for life and health insurance products are established using assumptions as to future mortality, morbidity, persistency, investment income, expenses, and target profit margins. These assumptions are based on Company experience and projected investment earnings rates. Revenues for individual life and health insurance products are primarily derived from premium income, and, to a lesser extent, through policy charges to the policyholder account values on annuity products and certain individual life products. Profitability is affected by actual experience deviations from the established assumptions and to the extent investment income varies from that required for policy reserves.
Collections for certain life products are not recognized as revenues, but are added to policyholder account values. Revenues from these products are derived from charges to the account balances for insurance risk and administrative costs. Profits are earned to the extent these revenues exceed actual costs. Profits are also earned from investment income in excess of the amounts required for policy reserves.
Underwriting—The underwriting standards of Globe Life's insurance subsidiaries are established by management. Each subsidiary uses information obtained from the application, and in some cases additional information such as, telephone interviews with applicants, inspection reports, pharmacy data, motor vehicle records, responses to both medical and non-medical questions, doctors’ statements and/or medical records and examinations. This information is used to determine whether a policy should be issued in accordance with the application, with a different rating, with a rider, with reduced coverage, or rejected.
Reserves—The life insurance policy reserves reflected in Globe Life's consolidated financial statements as future policy benefits are calculated based on accounting principles generally accepted in the United States of America (GAAP). These reserves, with future premiums and the associated interest compounded at assumed rates, are expected to be sufficient to cover policy and contract obligations as they mature. Generally, the mortality and lapse
assumptions used in the calculations of reserves are based on Company experience. Similar reserves are held on most of the health insurance policies written by Globe Life's insurance subsidiaries, since these policies generally are issued on a guaranteed-renewable basis. The assumptions used in the calculation of Globe Life's reserves are reported in Note 1—Significant Accounting Policies. Reserves for certain life products consist of the policyholders’ account values and are increased by policyholder deposits and interest credited and are decreased by policy charges and benefit payments.
Investments—The nature, quality, and percentage mix of insurance company investments are regulated by state laws. The investments of Globe Life insurance subsidiaries consist predominantly of high-quality, investment-grade securities. Approximately 88% of our invested assets, at fair value, are fixed maturities at December 31, 2024 (see Note 4—Investments and Management’s Discussion and Analysis).
Competition—Globe Life competes with other life and health insurance carriers through policyholder service, price, product design, and sales efforts. While there are insurance companies competing with Globe Life, no individual company dominates any of Globe Life's life or health insurance markets.
Globe Life's health insurance products compete with, in addition to the products of other health insurance carriers, health maintenance organizations, preferred provider organizations, and other health care-related institutions which provide medical benefits based on contractual agreements.
The Company effectively competes with other carriers, in part, due to its ability to operate at lower policy acquisition and administrative expense levels than peer companies. This allows Globe Life to have competitive rates while maintaining higher underwriting margins.
Regulation
Insurance—Insurance companies are subject to regulation and supervision in the states in which they do business. The laws of the various states establish agencies with broad administrative and supervisory powers which include, among other things, granting and revoking licenses to transact business, regulating trade practices, licensing agents, approving policy forms, approving certain premium rates, setting minimum reserve and loss ratio requirements, determining the form and content of required financial statements, and prescribing the type and amount of investments permitted. Insurance companies are also required to file detailed annual reports with supervisory agencies, and records of their business are subject to examination at any time. Under the rules of the National Association of Insurance Commissioners (NAIC), insurance companies are examined periodically by one or more of the supervisory agencies.
Risk-Based Capital (RBC)—The NAIC requires that a risk-based capital formula be applied to all life and health insurers. The risk-based capital formula is a threshold formula rather than a target capital formula. It is designed only to identify companies that require regulatory attention and is not to be used to rate or rank companies that are adequately capitalized. All Globe Life's insurance subsidiaries are more than adequately capitalized under the risk-based capital formula. See further discussion of RBC in Capital Resources.
Holding Company—States have enacted legislation requiring registration and periodic reporting by insurance companies domiciled within their respective jurisdictions that control or are controlled by other corporations so as to constitute a holding company system. Globe Life Inc. and its subsidiaries have registered as a holding company system pursuant to such legislation in Indiana, Nebraska, Ohio, Texas, and New York.
Insurance holding company system statutes and regulations impose various limitations on investments in subsidiaries, and may require prior regulatory approval for material transactions between insurers and affiliates and for the payment of certain dividends and other distributions.
Sustainable Business Practices
Globe Life’s sustainable business practices are a driver of the success and longevity that our Company has experienced since its origin. We plan to advance our sustainable business practices by further developing the Company's sustainability strategy and have substantially aligned disclosures with the Sustainability Accounting Standards Board (SASB) standards and the Task Force on Climate-related Financial Disclosures (TCFD) recommendations.
Environmental responsibility and sustainability are key components of our overall corporate responsibility efforts. We strive to reduce our impact on the environment by placing a company-wide emphasis on recycling and reducing waste at our corporate facilities, focusing on efforts to reduce the use of paper and water. With respect to social matters, our focus continues to be on supporting a culture that is inclusive and attractive for all of our employees and independent sales agents. We are committed to maintaining a diverse workforce that reflects the communities in which we work. In addition, to enable the Company to appropriately respond to related challenges and opportunities, the Company has in place a Sustainability Committee, and the Board and its committees regularly engage with senior management on relevant and related issues.
Human Capital Management
Globe Life's talent base encompasses a broad range of experience that possesses the depth of critical skills to efficiently and effectively accomplish our business purpose and mission, serve our policyholders, and protect our shareholders' interests. Maintaining superior human capital is a key driver to the success and longevity that our Company has experienced since its origins dating back to the early 1900s. As of December 31, 2024, the Company had 3,732 full-time, part-time, and temporary employees, a 3% increase over the prior year. The increase in headcount in 2024 was primarily to support the increased growth in recent periods, as well as lower attrition levels than normal. The Company engages over 16,400 independently-contracted insurance agents. Refer to Management's Discussion & Analysis for exclusive agent counts.
People, Culture, and Community
At Globe Life, we are united by our mission to—Make Tomorrow Better1 and this starts with our employees and agents. Beyond providing insurance protection for millions of individuals, serving our policyholders and generating financial results for our shareholders, we focus on cultivating a healthy, positive culture and a thriving community within and among our campuses that is inclusive of and attractive for all. Globe Life promotes a diverse and inclusive work force to better enable our employees to consistently achieve outstanding individual and collective results. Our commitment to diversity starts at the top; of the 9 independent Board members, 56% are women and 33% are racial/ethnic minorities as of December 31, 2024.
As of December 31, 2024 and 2023, the Globe Life employees, (excluding independently-contracted agents) identify as follows:
| | | | | | | | | | | | | | | | | | | | | | | |
| 2024 |
| Ethnicity/Race | Gender | | Generations |
| White | 51 | % | | Female | 68 | % | | Baby Boomers (1946-1964) | 14 | % |
| Black or African American | 25 | | | Male | 32 | | | Gen X (1965-1977) | 29 | |
| Hispanic or Latino | 13 | | | | | | Millennials (1978-1995) | 44 | |
| Asian | 9 | | | | | | Gen Z (1996-2012) | 13 | |
| American Indian or Alaskan Native | 1 | | | | | | | |
| Native Hawaiian or Pacific Islander | — | | | | | | | |
| Other or Not Specified | 1 | | | | | | | |
| Total | 100 | % | | | 100 | % | | | 100 | % |
1Per the Globe Life Employee Handbook, the Globe Life mission statement is "We help families Make Tomorrow Better by working to protect their financial future."
| | | | | | | | | | | | | | | | | | | | | | | |
| 2023 |
| Ethnicity/Race | Gender | | Generations |
| White | 52 | % | | Female | 68 | % | | Baby Boomers (1946-1964) | 16 | % |
| Black or African American | 24 | | | Male | 32 | | | Gen X (1965-1977) | 29 | |
| Hispanic or Latino | 13 | | | | | | Millennials (1978-1995) | 45 | |
| Asian | 9 | | | | | | Gen Z (1996-2012) | 10 | |
| American Indian or Alaskan Native | 1 | | | | | | | |
| Native Hawaiian or Pacific Islander | — | | | | | | | |
| Other or Not Specified | 1 | | | | | | | |
| Total | 100 | % | | | 100 | % | | | 100 | % |
We conduct a confidential survey biennially to give our employees the opportunity to provide candid feedback about their experiences at the Company, including but not limited to, confidence in the Company and leadership, competitiveness of our compensation and benefit package, and departmental relationships. The results are shared with our employees, reviewed by senior leadership, and used to identify areas for improvement and create action plans based on the employee feedback received.
We strive to Make Tomorrow Better, in part by giving financial and service contributions to programs that provide hands-on assistance in the communities where we live, work, serve, and visit. We focus our charitable giving on organizations that support children, families, veterans, and seniors, as well as those that work to ensure people are able to live full, healthy lives. These categories align with our mission to help families Make Tomorrow Better by working to protect their financial future. In 2024, we provided financial support of more than $7 million to organizations within that focus, including charities that support underserved communities, provide scholarships to youth, and advance equity and diversity efforts.
Talent Development
At Globe Life, we believe investing in our employees through training and development is paramount to their success. We have developed a learning ecosystem that includes a multitude of professional development opportunities, including online, self-directed, and instructor-led courses on a variety of topics. An education assistance program is also offered to facilitate growth in an area related to one's current position with the Company.
Health, Safety, and Wellness
We strive to provide a safe and healthy work environment for every employee. We furnish employees with numerous tools and trainings throughout the year to help ensure they have, at their fingertips, the best information to safely engage with co-workers, customers, and third parties. In furtherance of our commitment to our employees, we offer a comprehensive employee benefits package that includes competitive monetary benefits, retirement benefits through a Section 401(k) plan and a qualified pension to eligible employees, fitness center reimbursement, paid-time-off (based on years of service), health insurance, dental and vision insurance, employee resource program, health savings and flexible spending accounts, family leave, and tuition assistance.
The Company remains committed to the well-being and safety of its employees, agents, customers, guests, vendors, and shareholders in our resolve to maintain a stable and secure business environment.
Item 1A. Risk Factors
Risks Related to Our Business
The following is a summary of the material risks and uncertainties that could adversely affect our business, financial condition, and results of operations.
Business and Operational Risks
The development and maintenance of our various distribution channels are critical to growth in product sales and profits.
Our future success depends, in substantial part, on our ability to recruit, hire, and motivate highly-skilled insurance personnel. Further, the development and retention of producing agents are critical to supporting sales growth in our agency operations because our insurance sales are primarily made to individuals.
A failure to effectively develop new methods of reaching consumers, realize cost efficiencies or generate an attractive value proposition in our Direct to Consumer Division business could result in reduced sales and profits. In addition, if we do not provide an attractive career opportunity with competitive compensation as well as motivation for producing agents to increase sales of our products, our growth could be impeded. Doing so may be difficult due to many factors, including but not limited to, fluctuations in economic and industry conditions and the effectiveness of our compensation programs and competition among other companies.
Our life insurance products are sold in niche markets. We are at risk should any of these markets diminish.
We have several life distribution channels that focus on distinct market niches, three of which are labor unions, affinity groups, and sales via Direct to Consumer solicitations. Deterioration of our relationships with either organized labor union groups or affinity groups, or adverse changes in the public’s receptivity to Direct to Consumer marketing initiatives could negatively affect our life insurance business.
Actual or alleged misclassification of independent contractors at our insurance subsidiaries could result in adverse legal, tax or financial consequences.
A significant portion of our sales agents are independent contractors. Although we believe we have properly classified such individuals, a risk nevertheless exists that a court, the Internal Revenue Service or other authority will take the position that our sales agents are employees. From time-to-time, we are subject to civil litigation, including class and collective action litigation, alleging that we have improperly classified certain of our sales agents as independent contractors. In September 2024, the Equal Employment Opportunity Commission (EEOC) notified us that it had determined that all sales agents affiliated with State General Agent Simon Arias were employees, not independent contractors, of Globe Life Inc. and/or AIL. Such determination is not binding but we expect any potential civil action brought by the EEOC would include such an allegation. A future adverse judgment in connection with any such civil litigation described above could result in substantial damages. Future changes in rules, regulations or interpretations of existing rules and regulations, or significant adverse judgments in litigation, could require us to reclassify all or a portion of our agents as employees and the impact could significantly increase our operating costs and negatively impact our insurance business.
The use of third-party vendors, including independent sales agents, to support the Company's operations makes the Company susceptible to the operational risk of those third parties, which could lower revenues, increase costs, reduce profits, disrupt business, or damage the Company’s reputation.
The Company utilizes third-party vendors, including independent sales agents, to provide certain business services and functions, which exposes the Company to risks outside the control of the Company. The reliance on these third-party vendors creates a number of business risks, such as the risk that the Company may not maintain service quality, control or effective management of the outsourced business operations and that the Company cannot control the data, information systems, facilities or networks of such third-party vendors. We employ controls and procedures designed to facilitate service quality of our third party vendors; however, such controls and procedures cannot be 100% effective in all cases. The Company may be adversely affected by a third-party vendor who
operates in a poorly controlled manner or fails to deliver contracted services, which could lower revenues, increase costs, reduce profits, disrupt business, or damage the Company’s reputation.
Extensive federal and state laws regulate our business, imposing certain requirements that independent sales agents must follow in dealing with clients. Misconduct of our independent sales agents could result in violations of law by, or claims against, us or our subsidiaries. From time to time, we are subject to private litigation as a result of alleged misconduct by independent agents. We employ controls and procedures designed to prevent and detect agent misconduct; however, such controls and procedures cannot be 100% effective in all cases. Instances of misconduct or non-compliance or violations of laws or regulations by our independent sales agents could result in adverse findings in either examinations or litigation and subject us to sanctions, monetary liabilities, restrictions on or loss of the operation of our business or reputational harm, any of which could have a material adverse effect on our business, financial condition or results of operations.
Additionally, the Company is at risk of being unable to meet legal, regulatory, financial or customer obligations if the data, information systems, facilities or networks of a third-party vendor are disrupted, damaged or fail, whether due to physical disruptions, such as fire, natural disaster, pandemic or power outage, or due to cybersecurity incidents, ransomware or other impacts to vendors, including labor strikes, political unrest and terrorist attacks.
Financial and Strategic Risks
Our investments are subject to market and credit risks. Significant downgrades, delinquencies and defaults in our investment portfolio could potentially result in lower net investment income and increased realized and unrealized investment losses.
Our invested assets are subject to the customary risks of defaults, downgrades, and changes in market values. Our investment portfolio consists predominately of fixed income investments, where we are exposed to the risk that individual issuers will not have the ability to make required interest or principal payments. A concentration of these investments in any particular issuer, industry, group of related industries or geographic areas could increase this risk. Factors that may affect both market and credit risks include interest rate levels (consisting of both treasury rate and credit spread), financial market performance, disruptions in credit markets, general economic conditions, legislative changes, particular circumstances affecting the businesses or industries of each issuer and other factors beyond our control.
Additionally, as the majority of our investments are long-term fixed maturities that we typically hold until maturity, a significant increase in interest rates and/or credit spreads could cause a material temporary decline in the fair value of our fixed investment portfolio, even with regard to performing assets. These declines could cause a material increase in unrealized losses in our investment portfolio. Significant unrealized losses could substantially reduce our capital position and shareholders’ equity. It is possible our investment in certain of these securities with unrealized losses could experience a credit event where an allowance for credit loss is recorded, reducing net income.
We cannot be assured that any particular issuer, regardless of industry, will be able to make required interest and principal payments on a timely basis or at all. Significant downgrades or defaults of issuers could negatively impact our risk-based capital ratios, leading to potential downgrades of the Company by rating agencies, potential reduction in future dividend capacity from our insurance subsidiaries, and/or higher financing costs at Globe Life Inc. (Parent Company) should additional statutory capital be required.
Changes in interest rates could negatively affect income.
Declines in interest rates expose insurance companies to the risk that they will fail to earn the level of interest on investments assumed in pricing products and in setting discount rates used to calculate policy liabilities, which could have a negative impact on income. Significant decreases in interest rates could result in calls by issuers of investments, where such features are available to issuers. Any such calls could result in a decline in our investment income, as reinvestment of the proceeds would likely be at lower interest rates.
An increase in interest rates could result in certain policyholders surrendering their life or annuity policies for cash, thereby potentially requiring our insurance subsidiaries to liquidate invested assets if other sources of liquidity are
not available to meet their obligations. In such a case, realized losses could result from the sale of the invested assets and could adversely affect our statutory income, required capital levels, and results of operations.
Our ability to fund operations is substantially dependent on available funds from our insurance subsidiaries.
As a holding company with no direct operations, our principal asset is the capital stock of our insurance subsidiaries, which periodically declare and distribute dividends on their capital stock. Moreover, our liquidity, including our ability to pay our operating expenses and to make principal and interest payments on debt securities or other indebtedness owed by us, as well as our ability to pay dividends on our common stock or any preferred stock, depends significantly upon the surplus and earnings of our insurance subsidiaries and the ability of these subsidiaries to pay dividends or to advance or repay funds to us.
The principal sources of our insurance subsidiaries’ liquidity are insurance premiums, as well as investment income, maturities, repayments, and other cash flow from our investment portfolio. Our insurance subsidiaries are subject to various state statutory and regulatory restrictions applicable to insurance companies that limit the amount of cash dividends, loans, and advances that those subsidiaries may pay to us, including laws establishing minimum solvency and liquidity thresholds. For example, in the states where our companies are domiciled, an insurance company generally may pay dividends only out of its unassigned surplus as reflected in its statutory financial statements filed in that state. Additionally, dividends paid by insurance subsidiaries are restricted based on regulations by their states of domicile. Accordingly, impairments in assets or disruptions in our insurance subsidiaries’ operations that reduce their capital or cash flow could limit or disallow the payment of dividends, a principal source of our cash flow, to us.
Other sources of liquidity include a variety of short-term and long-term instruments, including our credit facility, commercial paper, long-term debt, Federal Home Loan Bank (FHLB), intercompany financing and reinsurance.
Changes in laws or regulations in the states in which our companies are domiciled could constrain the ability of our insurance subsidiaries to pay dividends or to advance or repay funds to us in sufficient amounts and at times necessary to pay our debt obligations, corporate expenses, or dividends on our capital stock.
We are subject to liquidity risks associated with sourcing a concentration of our funding from the Federal Home Loan Bank (“FHLB”).
We use institutional funding agreements originating from FHLB, which from time to time serve as a significant source of our liquidity. Additionally, we use agreements with the FHLB to meet near-term liquidity needs. If the FHLB were to change its definition of eligible collateral, we could be required to post additional amounts of collateral in the form of cash or other assets. Additionally, if our creditworthiness falls below the FHLB’s requirements or if legislative or other political actions cause changes to the FHLB’s mandate or to the eligibility of life insurance companies to be members of the FHLB system, we could be required to find other sources to replace this funding, which may prove difficult and increase our liquidity risk.
Adverse capital and credit market conditions may significantly affect our ability to meet liquidity needs or access capital, as well as affect our cost of capital.
Should interest rates increase in the future, the higher interest expense on any newly issued debt may reduce net income. In addition, if the credit and capital markets were to experience significant disruption, uncertainty and instability, these conditions could adversely affect our access to capital. Such market conditions could limit our ability to replace maturing debt obligations in a timely manner, or at all, and/or access the capital necessary to grow our business and maintain required capital levels and credit ratings.
In the event that current sources of liquidity do not satisfy our needs, we may have to seek additional financing or raise capital. The availability and cost of additional financing or capital depend on a variety of factors such as market conditions, the general availability of credit or capital, the volume of trading activities, the overall availability of credit to the insurance industry, our credit ratings and credit capacity. Additionally, customers, lenders or investors could develop a negative perception of our financial prospects if we were to incur large investment losses or if the level of our business activity decreased due to a market downturn. Our access to funds may also be impaired if regulatory authorities or rating agencies take negative actions against us. If our internal sources of liquidity prove to
be insufficient, we may not be able to successfully obtain additional financing on favorable terms or at all. As such, we may be forced to delay raising capital, issue shorter term securities than we would prefer or bear an unattractive cost of capital which could decrease our profitability and significantly reduce our financial flexibility. If so, our results of operations, financial condition, consolidated RBC, and cash flows could be materially negatively affected.
We have become subject to, and may in the future be subject to, short selling strategies driving down the market price of our common stock.
Short selling is the practice of selling securities that the seller does not own but may have borrowed with the intention of buying identical securities back at a later date. A short seller hopes to profit from a decline in the value of the securities between the sale of the borrowed securities and the purchase of the replacement shares, as the short seller expects to pay less in that purchase than it received in the sale. Because it is in the short seller’s best interests for the price of the securities to decline, some short sellers publish, or arrange for the publication of, opinions or characterizations regarding the relevant issuer, its business prospects and similar matters calculated to or which may create negative market momentum, which may permit them to obtain profits for themselves as a result of selling the stock short. Companies, like us, that are subject to unfavorable allegations, even if untrue, may have to expend a significant amount of resources to investigate such allegations and/or defend themselves, including in connection with securityholder litigation against Globe Life Inc. or investigations by regulators related to or prompted by such allegations.
Since April 2024, we have been and continue to be the target of several short sellers who have published reports making allegations about the Company, which resulted in a significant decline in the price of our common stock. In addition, these reports resulted in significant negative publicity against us, damaged our reputation, and exposed us to securities class action litigation. We have already expended significant resources to defend and repair our reputation. We will continue to defend against any unfounded and unsubstantiated claims about our business, our disclosures, and the integrity of our financial statements, which may require us to expend significant resources.
We may be subject to additional short seller reports and activity in the future. The publication of any such commentary regarding us may bring about a temporary, or long term, decline in the market price of our common stock. No assurances can be made that similar declines in the market price of our common stock or negative publicity will not occur in the future, in connection with such commentary by short sellers or otherwise.
Industry Risks
Variations in actual-to-expected rates of mortality, morbidity and policyholder behavior could materially negatively affect our results of operations and financial condition.
We establish policy reserves to pay future policyholder benefits. These reserves do not represent an exact calculation of liability, but rather are actuarial estimates based on models and accounting requirements that include many assumptions and projections which are inherently uncertain. The reserve assumptions involve the exercise of significant judgment with respect to levels or trends of mortality, morbidity, lapses, and discount rates. Changes in assumptions could materially impact our financial condition and results of operations. Further, actual results may differ significantly from the levels assumed, which could result in increased policy obligations and expenses and thus negatively affect our profit margins and income.
A ratings downgrade or other negative action by a rating agency could materially affect our business, financial condition, and results of operations.
Various rating agencies review the financial performance and condition of insurers, including our insurance subsidiaries, and publish their financial strength ratings as indicators of an insurer’s ability to fulfill its contractual obligations. These ratings are important to maintaining public confidence in our insurance products. A downgrade or other negative action by a rating agency with respect to the financial strength ratings of our insurance subsidiaries could negatively affect us by limiting or restricting the ability of our insurance subsidiaries to pay dividends to us and reducing our sales by adversely affecting our ability to sell insurance products through independent insurance agencies.
Obtaining timely and appropriate premium rate increases for certain supplemental health insurance policies is critical.
A significant percentage of the supplemental health insurance premiums that our insurance subsidiaries earn is from Medicare Supplement insurance. Medicare Supplement insurance, including conditions under which the premiums for such policies may be increased, is highly regulated at both the state and federal level. As a result, Medicare Supplement business is characterized by lower profit margins than life insurance and requires strict administrative discipline and economies of scale for success. Since Medicare Supplement policies are coordinated with the federal Medicare program, which commonly experiences health care inflation every year, annual premium rate increases for the Medicare Supplement policies are typically necessary. Accordingly, the inability to obtain approval of appropriate premium rate increases for supplemental health insurance plans in a timely manner from state insurance regulatory authorities could adversely impact their profitability and thus our business, financial condition, and results of operations.
Our business is subject to the risk of the occurrence of catastrophic events that could adversely affect our financial condition or operations.
Our insurance policies are issued to and held by a large number of policyholders throughout the United States in relatively low-face amounts. Accordingly, it is unlikely that a large portion of our policyholder base would be affected by a single natural disaster. However, our insurance operations could be exposed to the risk of catastrophic mortality or morbidity caused by events such as a pandemic or other public health issues, hurricane, earthquake, or man-made catastrophes, including acts of terrorism or war, which may produce significant claims in larger areas, especially those that are heavily populated. Claims resulting from natural or man-made catastrophic events could cause substantial volatility in our financial results for any fiscal quarter or year and could materially reduce our profitability or harm our financial condition. In addition, government, business, and consumer reactions to public health events could result in material negative impacts to our business and operations.
Our life and health insurance products are particularly exposed to risks of catastrophic mortality, such as a pandemic or other events that result in a large number of deaths. In addition, the occurrence of such an event in a concentrated geographic area could have a severe disruptive effect on our workforce and business operations. The likelihood and severity of such events cannot be predicted and are difficult to estimate. In such an event, the impact to our operations could have a material adverse impact on our ability to conduct business and on our results of operations and financial condition, particularly if those problems affect our producing agents or our employees performing operational tasks and supporting computer-based data processing, or impair or destroy our capability to transmit, store, and retrieve valuable data. In addition, in the event that a significant number of our management were unavailable following a disaster, the achievement of our strategic objectives could be negatively impacted.
We are exposed to model risk, which is the risk of financial loss or reputational damage or adverse regulatory impacts caused by model errors or limitations, incorrect implementation of models, or misuse of or overreliance upon models.
Models are utilized by our businesses and corporate areas primarily to project future cash flows associated with pricing products, calculating reserves and valuing assets, as well as in evaluating risk and determining capital requirements, among other uses. These models may not operate properly and may rely on assumptions and projections that are inherently uncertain. As our businesses continue to grow and evolve, the number and complexity of models we utilize expands, increasing our exposure to error in the design, implementation or use of models, including the associated input data and assumptions.
Our business is subject to the risk of direct or indirect effects of climate change.
Climate change may increase the frequency and severity of weather-related events and natural disasters, which may adversely impact our mortality and morbidity rates and disrupt our business operations. In addition, climate change and climate change regulation may affect the prospects of companies and other entities whose securities we hold or our willingness to continue to hold their securities. Climate change may also influence investor sentiment with respect to the Company and investments in our portfolio.
Legal, Regulatory, and Compliance Risks
Recent volatility in the trading price of our common stock has and can be expected to result in securities class action litigation.
In April 2024, the trading price of our common stock dropped following the publication of certain short seller reports. As of the date of this Report, one putative securities class action has been filed against Globe Life Inc. and we expect that other putative class action claims may be filed as well. While we intend to defend such actions vigorously, any judgment against us or any future stockholder litigation could have a material adverse effect on our business, financial condition or results of operations.
Our businesses are heavily regulated and changes in regulation or regulatory scrutiny may have a material adverse impact on our business, financial condition or results of operation.
Insurance companies, including our insurance subsidiaries, are subject to extensive supervision and regulation in the states in which they conduct business. The primary purpose of this supervision and regulation is the protection of policyholders, not investors. Regulatory agencies have broad administrative power over numerous aspects of our business, including premium rates for our life, Medicare Supplement and other supplement health products, as well as other terms and conditions included in the insurance policies offered by our insurance subsidiaries, marketing practices, advertising, use of emerging technologies, agent licensing, independent agent practices, policy forms, capital adequacy, solvency, reserves and permitted investments.
Regulatory authorities also have the power to conduct investigations, and to bring administrative or judicial proceedings against us, which could result in suspension or revocation of our licenses, cease and desist orders, fines, civil penalties, disgorgement, criminal penalties or other disciplinary action that could have a material adverse impact on our business, financial condition or results of operation. Press coverage and other public statements that allege wrongdoing, even if untrue, can lead to increased regulatory inquiries or investigations including any that may arise in connection with the subpoenas from U.S. Attorney’s Office for the Western District of Pennsylvania seeking documents related to sales practices by certain of our independent sales agents contracted to sell American Income Life Insurance Company policies.
The insurance laws, regulations and policies currently affecting our companies may change at any time, possibly having an adverse effect on our business. Should regulatory changes occur, we may be unable to maintain all required licenses and approvals, or fully comply with the wide variety of applicable laws and regulations or the relevant authority’s interpretation of such laws and regulations. If we do not have the requisite licenses and approvals or do not comply with applicable regulatory requirements, the insurance regulatory authorities could preclude or temporarily suspend some or all of our business activities and/or impose substantial fines. Additionally, any violation or alleged violation of law or regulations could result in significant legal costs or in legal proceedings that may result in monetary and legal remedies being imposed against the Company, which could have a material adverse effect on our business, financial condition or results of operations.
Changes in accounting standards issued by accounting standard-setting bodies may affect our financial statements, reduce our reported profitability and change the timing of profit recognition.
Our financial statements are subject to the application of GAAP and accounting practices as promulgated by the National Association of Insurance Commissioners’ statutory accounting practices (NAIC SAP), which principles are periodically revised and/or expanded. Accordingly, from time to time we are required to adopt new or revised accounting standards or guidance issued by recognized authoritative bodies. Future accounting standards that we are required to adopt could change the current accounting treatment that we apply to our consolidated financial statements. These changes, including underlying assumptions, projections, estimates or judgments/interpretations by management, could have a material adverse effect on our business, financial condition, and results of operations. (Refer to Note 1—Significant Accounting Policies under the caption Accounting Pronouncements Yet to be Adopted)
Non-compliance with laws or regulations related to customer and consumer privacy and information security, including a failure to ensure that third parties with access to sensitive customer and consumer information maintain its confidentiality, could materially adversely affect our reputation and business operations.
The collection, maintenance, use, disclosure, and disposal of personally identifiable information by our insurance subsidiaries are regulated at the international, federal, and state levels. Applicable laws and rules are subject to change by legislation or administrative or judicial interpretation. We are subject to the privacy and security provisions of federal laws including, but not limited to, the Gramm-Leach-Biley Act of 1999 (GLBA), the Health Information Technology for Economic and Clinical Health Act (HITECH), and the Health Insurance Portability and Accountability Act of 1996 (HIPAA). HIPAA additionally requires that we impose privacy and security requirements on our third-party business associates. Various state laws also address the use and disclosure of personally identifiable information, to the extent they are more restrictive than these and other federal laws. Further, approximately half of the states have adopted a form of the National Association of Insurance Commissioners’ data security model law, which imposes security requirements. Noncompliance with these laws, whether by us or by one of our business associates, could have a material adverse effect on our business, reputation, and results of operations and could result in material fines and penalties, various forms of damages, consent orders regarding our privacy and security practices, adverse actions against our licenses to do business, and injunctive relief.
General Risk Factors
The failure to maintain effective and efficient information systems at the Company could adversely affect our financial condition and results of operations.
Our business is highly dependent upon the internet, third-party service providers, and information systems to operate in an efficient and resilient manner. We gather and maintain data for the purpose of conducting marketing, actuarial analysis, sales, and policy administration functions. Our ability to modernize and maintain our information technology systems and infrastructure requires us to commit significant resources and effective planning and execution. This modernization includes the responsible and secure use of emerging technologies like artificial intelligence.
Malicious third parties, employee or agent errors or disasters affecting our information systems could impair our business operations, regulatory compliance, and financial condition. Employee or agent malfeasance or errors in the handling of our information systems may result in unauthorized access to customer or proprietary information, or an inability to use our information systems to efficiently support business operations. As a result of more frequent and sophisticated cyberattacks and the highly regulated nature of the insurance industry, we must continually implement new, and maintain existing, technology or adapt existing technology to protect against security and privacy incidents and to meet compliance requirements of new and proposed regulations.
Any incident affecting confidential information systems resulting from the above factors could damage our reputation in the marketplace, deter potential customers from purchasing our products, result in the loss of existing customers, subject us to significant civil and criminal liability, constrain cash flows, or require us to incur significant technical, legal, or other expenses. In addition, should we be unable to implement or maintain our technology effectively, efficiently, or in a timely manner, it could result in poor customer experience, poor agent experience, additional expenses, reputational harm, legal and regulatory actions, and other adverse consequences. This could also result in the inability to effectively support business operations.
Changes in U.S. federal income tax law could increase our tax costs or negatively impact our insurance subsidiaries' capital.
Changes to the Internal Revenue Code, administrative rulings, or court decisions affecting the insurance industry, including the products insurers offer, could increase our effective tax rate and lower our net income, adversely impact our insurance subsidiaries' capital, or limit the ability of our insurance subsidiaries to sell certain of their products.
Damage to the brand and reputation of Globe Life or its subsidiaries could affect our ability to conduct business.
Negative publicity through traditional media, internet, social media, and other public forums, including short seller reports and allegations of independent agent misconduct could damage our brand or reputation, which could adversely impact our ability to recruit and retain agents, our ability to market our products, and the persistency of in-force policies. A reduction in the number of agents selling our products, or the rate of growth of the number of agents selling our products may have an adverse impact on product sales and profit, and such impact may be material.
We may fail to meet expectations relating to corporate responsibility and sustainability standards and practices.
Certain existing or potential investors, customers and regulators evaluate our business or other practices according to a variety of corporate responsibility and sustainability standards and expectations. Certain of our regulators have proposed or adopted, or may propose or adopt, certain corporate responsibility and sustainability rules or standards that would apply to our business. Our practices may be judged by these standards that are continually evolving and not always clear. Our decisions or priorities are made with the considerations of all stakeholders. Prevailing corporate responsibility and sustainability standards and expectations may also reflect contrasting or conflicting values or agendas.
We may fail to meet our corporate responsibility and sustainability expectations. Failure to meet, or achieve progress on, our expectations, on a timely basis, or at all, could adversely affect our reputation, business, financial performance, and growth. We may face adverse regulatory, investor, customer, media, or public scrutiny leading to business, reputational, or legal challenges. In addition, our policies, and processes to evaluate and manage these standards in coordination with other business priorities may not prove completely effective or satisfy investors, customers, regulators, or others.
Item 1B. Unresolved Staff Comments
As of December 31, 2024, Globe Life had no unresolved SEC staff comments.
Item 1C. Cybersecurity
Risk Management and Strategy
We have implemented a comprehensive Enterprise Risk Management (“ERM”) process to identify, assess and manage risks related to our overall organization, including material risks from cybersecurity threats. Our ERM process takes a holistic view of our specific risks and our strategy to anticipate and manage possible risks. Our Executive Vice President, General Counsel and Chief Risk Officer (“CRO”) oversees our ERM program and execution of our risk strategy, including as it relates to cyber risk. The Chief Information Security Officer ("CISO"), who reports to the General Counsel and CRO, leads our cyber risk management and strategy and the Information Security Department.
Our cyber risk management and information security strategy includes elements to identify threats, assess risks, implement protective controls, detect attempts from threat actors to compromise the confidentiality, integrity, and availability of information and information systems, respond to those events and ultimately recover from incidents. We use a threat-based approach to identify and assess cyber risks. This approach includes membership in threat intelligence organizations such as the FS-ISAC (Financial Services Information Sharing and Analysis Center) to identify standard and emerging cyber-threats to financial services organizations and specifically to insurance companies. We also monitor for threats through vendor alerts, manufacturer bulletins, and government advisories.
Identified threats are analyzed using a recognized risk assessment model to consistently assess the likelihood and impact of these threats. We then map these threats to a well-established industry model called MITRE ATT&CK to identify areas of vulnerability. This analysis produces a likelihood score that is used in conjunction with an impact analysis to calculate the preliminary level of risk. The impact analysis includes factors such as disruption to business operations, employee and customer data, legal issues, reputational harm, and regulatory compliance. Based on the preliminary level of risk, we also analyze compensating controls and other factors to arrive at a residual risk level. If appropriate, additional mitigations may be planned based on this risk level.
We manage identified cyber risks by designing and implementing information security policies and controls addressing a wide range of current cyber threats. These policies and associated standards are designed to comply with current applicable legal and regulatory requirements and align with recognized frameworks for cybersecurity risk management. We review and update these policies and controls regularly in order to confirm ongoing alignment with the constantly changing threat landscape and evolving compliance requirements.
We assess the effectiveness of our corporate policies and controls internally, as well as through the engagement of external advisors to conduct regular reviews, penetration tests, and vulnerability scans of Company information systems and applications. Results from these assessments help inform updates to risk assessments, changes to security controls and processes, and updates to policies and standards as appropriate. We employ a variety of internal measures to detect, prevent, and reduce the frequency and severity of cybersecurity incidents on the Company’s infrastructure, which may include, but are not limited to, the use of encryption, intrusion prevention, endpoint security, password protection, multi-factor authentication, internal phishing testing, security awareness training, and vulnerability scanning and penetration testing.
In addition, cybersecurity is incorporated into our third-party risk management program. We assess the ability of our vendors as appropriate to adequately protect information, which includes requiring agreements that address cybersecurity. We periodically review and assess vendors’ adherence to these agreements and review for information security (including cybersecurity) incidents experienced by our third-party vendors. With respect to our independent sales agents, we require each agent to execute an agent agreement containing terms governing the ownership, use and confidentiality of policyholder and proprietary information. We also engage with agency offices to support their use of measures and safeguards to protect information.
Due to the type and volume of information that we collect and store to support our business, including to provide insurance coverage to prospective, current and former policyholders, we are an attractive target for cyber threat actors seeking financial gain. Our failure to maintain the safety of our policyholder’s information could have a
material adverse effect on our reputation, financial condition and results of operations. To date, we have not experienced a cybersecurity incident that resulted in a material adverse effect on our business strategy, results of operations, or financial condition; however, we anticipate that our systems and data will continue to face attacks or other cybersecurity risks and there can be no guarantee that we will not experience such an incident in the future. Although we maintain cybersecurity insurance, the costs and expenses related to cybersecurity incidents may not be fully insured. We describe whether and how risks from identified cybersecurity threats, including as a result of previous cybersecurity incidents, have materially affected or are reasonably likely to materially affect us, including our business strategy, results of operations, or financial condition under Item 1A. Risk Factors, General Risk Factors, “The failure to maintain effective and efficient information systems at the Company could adversely affect our financial condition and results of operations.”
Governance
Our Board of Directors considers information security to be an enterprise-wide risk management issue and oversees material cybersecurity risks through the Audit Committee. The Audit Committee is designated with the responsibility to monitor and periodically report to the full Board regarding management’s risk management and information security processes. The ERM Committee and the Operational Risk Committee (“ORC”) are the senior management-level entities designated with the responsibility to oversee the execution of our risk strategy, including as it relates to cyber risk. These Committees are composed of an enterprise-wide representative group of the Company’s Executive and Senior Vice Presidents, as well as other essential directors and personnel. The ERM Committee is chaired by our CRO, and the ORC is chaired by our Chief Security Officer (“CSO”). The Chief Information Officer (“CIO”) and CISO serve on both Committees. Our CRO has over a decade of experience managing risks at the Company, including risks from cybersecurity threats. Our current CIO has over 15 years of experience managing risks, including risks from cybersecurity threats. Our current CSO has a Certified Information Systems Security Professional certification, a Certified Information Systems Auditor certification, a Certified in Risk and Information Systems Control certification, and over 20 years of experience in cybersecurity. The CISO serves on both Committees and leads cyber governance and strategy, as well as cyber risk and incident management. The current CISO holds a master’s degree in cybersecurity, has a Certified Information Systems Security Professional certification, and has over a decade of experience in cybersecurity.
The CISO assesses cyber risk and provides recommendations for management decision(s) by the ORC on a routine basis. The CISO briefs the Audit Committee on a quarterly basis. These updates include compliance measures designed to meet applicable regulations as well as current or planned changes to the regulations, an overview of the current cyber threats, risk management activities, and discussions of cyber incident investigations that warrant the attention of the Board. The CISO also provides an annual update to the entire Board of Directors on topics such as changes in cybersecurity, top threats facing the Company, key risks and mitigation efforts, and any potential material cybersecurity incidents. The Chair of the Audit Committee also provides a quarterly report to the Board on any information security topics presented to the Audit Committee by management.
Incident Management
The Company maintains and tests a cybersecurity incident response plan that outlines steps for the containment, investigation of, response to and recovery from cyber events. The plan also includes information pertaining to roles and responsibilities, escalation, third-party support, documentation, reporting, and law enforcement engagement. Escalation is designed to raise awareness of events that may require disclosure to help ensure assessments are performed without unreasonable delay. In alignment with our plan, we maintain playbooks that outline processes for responding to certain incidents commonly observed in the insurance industry. In addition, we have implemented a formal crisis management process, which outlines an incident response communication plan with executive leadership as well as criteria for communication with the chair of the Audit Committee and the Lead Director of the Board.
Item 2. Properties
Globe Life Inc., through its subsidiaries, owns or leases buildings that are used in the normal course of business. Globe Life Inc. owns and occupies approximately 480,000 combined square feet in McKinney, Texas (headquarters) and at the Waco, Texas and Oklahoma City, Oklahoma campuses. Additionally, the Company leases other buildings across the U.S.
Item 3. Legal Proceedings
Item 4. Mine Safety Disclosures
Not Applicable.
Part II
Item 5. Market for Registrant's Common Equity, Related Stockholder Matters and Issuer Purchases of Equity Securities
Market Price of and Dividends on the Registrant’s Common Equity and Related Stockholder Matters
The principal market in which Globe Life's common stock is traded is the New York Stock Exchange (NYSE: GL). There were 1,859 shareholders of record on December 31, 2024, excluding shareholder accounts held in nominee form.
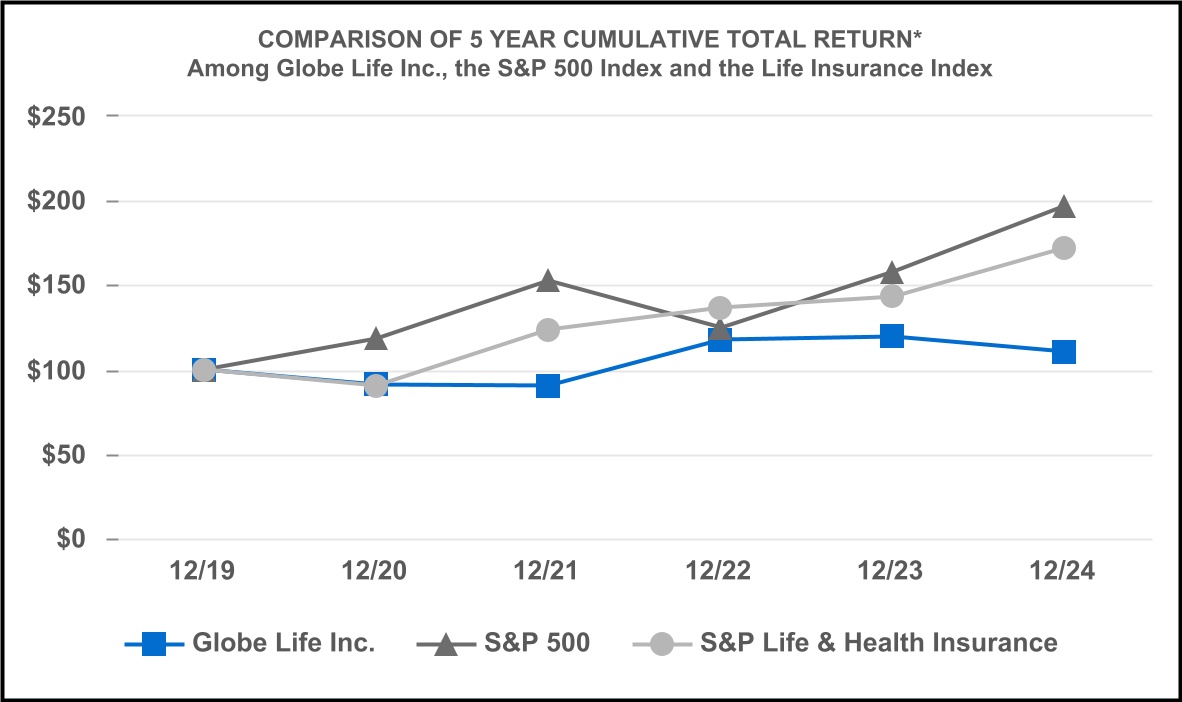
The line graph shown below compares Globe Life's cumulative total return on its common stock with the cumulative total returns of the Standard & Poor’s 500 Stock Index (S&P 500) and a Life Insurance Index. Globe Life's stock is included within the S&P 500 Index.
*$100 invested on 12/31/2019 in stock or index, including reinvestment of dividends. Fiscal year ended December 31.
Copyright© 2025 Standard & Poor's, a division of S&P Global. All rights reserved.
Purchases of Certain Equity Securities by the Issuer and affiliated purchasers for the Fourth Quarter 2024
| | | | | | | | | | | | | | | | | | | | | | | | | | |
| | (a) | | (b) | | (c) | | (d) |
| Period | | Total Number
of Shares
Purchased | | Average
Price Paid
Per Share | | Total Number of
Shares Purchased
as Part of
Publicly Announced
Plans or Programs | | Maximum Number of
Shares (or Approximate Dollar
Amount) that May Yet Be
Purchased Under the
Plans or Programs |
| October 1-31, 2024 | | 374,567 | | | $ | 105.45 | | | 374,567 | | | — |
| November 1-30, 2024 | | — | | | — | | | — | | | — |
| December 1-31, 2024 | | 116,484 | | | 108.77 | | | 116,484 | | | — |
Item 6. [Reserved]
CAUTIONARY STATEMENTS
We caution readers regarding certain forward-looking statements contained in the foregoing discussion and elsewhere in this document, and in any other statements made by, or on behalf of Globe Life whether or not in future filings with the Securities and Exchange Commission. Any statement that is not a historical fact, or that might otherwise be considered an opinion or projection concerning the Company or its business, whether express or implied, is meant as and should be considered a forward-looking statement. Such statements represent management's opinions concerning future operations, strategies, financial results or other developments. We specifically disclaim any obligation to update or revise any forward-looking statement because of new information, future developments, or otherwise.
Forward-looking statements are based upon estimates and assumptions that are subject to significant business, economic and competitive uncertainties, many of which are beyond our control, including uncertainties related to the impact of the recent pandemic and associated direct and indirect effects on our business operations, financial results, and financial condition. If these estimates or assumptions prove to be incorrect, the actual results of Globe Life may differ materially from the forward-looking statements made on the basis of such estimates or assumptions. Whether or not actual results differ materially from forward-looking statements may depend on numerous foreseeable and unforeseeable events or developments, which may be national in scope, related to the insurance industry generally, or applicable to the Company specifically. Such events or developments could include, but are not necessarily limited to:
1.Economic and other conditions, including the continued impact of inflation, geopolitical events, and the recent pandemic on the U.S. economy, leading to unexpected changes in lapse rates and/or sales of our policies, as well as levels of mortality, morbidity, and utilization of health care services that differ from Globe Life's assumptions;
2.Regulatory developments, including changes in accounting standards or governmental regulations (particularly those impacting taxes and changes to the Federal Medicare program that would affect Medicare Supplement);
3.Market trends in the senior-aged health care industry that provide alternatives to traditional Medicare (such as Health Maintenance Organizations and other managed care or private plans) and that could affect the sales of traditional Medicare Supplement insurance;
4.Interest rate changes that affect product sales, financing costs, and/or investment yields;
5.General economic, industry sector or individual debt issuers’ financial conditions (including developments and volatility arising from geopolitical events, particularly in certain industries that may comprise part of our investment portfolio) that may affect the current market value of securities we own, or that may impair an issuer’s ability to make principal and/or interest payments due on those securities;
6.Changes in the competitiveness of the Company's products and pricing;
7.Litigation results or regulatory actions against the Company;
8.Levels of administrative and operational efficiencies that differ from our assumptions (including any reduction in efficiencies resulting from increased costs arising from the impact of higher than anticipated inflation);
9.The ability to obtain timely and appropriate premium rate increases for health insurance policies from our regulators;
10.The customer response to new products and marketing initiatives;
11.Reported amounts in the consolidated financial statements which are based on management estimates and judgments which may differ from the actual amounts ultimately realized;
12.Compromise by a malicious actor or other event that causes a loss of secure data from, or inaccessibility to, our computer and other information technology systems;
13.The impact of reputational damage on the Company including the impact on the Company's ability to attract and retain agents;
14.The severity, magnitude, and impact of natural or man-made catastrophic events, including but not limited to pandemics, tornadoes, hurricanes, earthquakes, war and terrorism, on our operations and personnel, commercial activity, level of claims, and demand for our products; and
15.Globe Life's ability to access the commercial paper and debt markets, particularly if such markets become unpredictable or unstable for a certain period.
Readers are also directed to consider other risks and uncertainties described in other documents on file with the Securities and Exchange Commission.
GLOBE LIFE INC.
Management's Discussion & Analysis
Item 7. Management's Discussion and Analysis of Financial Condition and Results of Operations
The following discussion should be read in conjunction with Globe Life's Consolidated Financial Statements and Notes thereto appearing elsewhere in this report. The following management discussion will only include comparison to prior year. For discussion regarding activity from 2022, please refer to the prior filed Form 10-Ks at www.sec.gov.
"Globe Life" and the "Company" refer to Globe Life Inc. and its subsidiaries and affiliates.
Results of Operations
| | | | | | | | |
| | How Globe Life Views Its Operations. Globe Life Inc. is the holding company for a group of insurance companies that market primarily individual life and supplemental health insurance to lower middle to middle-income households throughout the United States. We view our operations by segments, which are the insurance product lines of life and supplemental health, and the investment segment that supports the product lines. |
| | |
| | Insurance Product Line Segments. The insurance product line segments involve the marketing, underwriting, and administration of policies. Each product line is further subdivided by the various distribution channels that market the insurance policies. Each distribution channel operates in a niche market offering insurance products designed for that particular market. Whether analyzing profitability of a segment as a whole, or the individual distribution channels within the segment, the measure of profitability used by management is the underwriting margin, as seen below:
|
| | Premium revenue (Policy obligations) (Policy acquisition costs and commissions) Underwriting margin
|
| | Investment Segment. The investment segment involves the management of our capital resources, including investments and the management of liquidity. Our measure of profitability for the investment segment is excess investment income, as seen below: |
| | Net investment income (Required interest on policy liabilities) Excess investment income
|
GLOBE LIFE INC.
Management's Discussion & Analysis
Current Highlights.
•Net income as a return on equity (ROE) for the year ended December 31, 2024 was 21.7% and net operating income as an ROE, excluding accumulated other comprehensive income(1) was 15.1%.
•Total premium increased 5% over the same period in the prior year. Life premium increased 4% for the period from $3.14 billion in 2023 to $3.26 billion in 2024.
•Net investment income increased 7% over the same period in the prior year.
•Total net sales increased 9% over the same period in the prior year from $768 million in 2023 to $840 million in 2024. The average producing agent count across all of the exclusive agencies increased 11% over the prior year.
•Book value per share increased 33% over the same period in the prior year from $47.10 to $62.50. Book value per share, excluding accumulated other comprehensive income(1), increased 13% over the prior year from $76.21 in 2023 to $86.40 in 2024.
•For the year ended December 31, 2024, the Company repurchased 10.1 million shares of Globe Life Inc. common stock at a total cost of $946 million for an average share price of $93.76.
The following graphs represent net income and net operating income for the three years ended December 31, 2024.
(1)As shown in the charts above, net operating income is primarily comprised of insurance underwriting margin plus excess investment income and annuity and other income, offset by operating expenses after tax and, as such, is considered a non-GAAP measure. It has been used consistently by Globe Life's management for many years to evaluate the operating performance of the Company. It differs from net income primarily because it excludes certain non-operating items such as realized gains and losses and certain significant and unusual items included in net income. Net income is the most directly comparable GAAP measure.
Net operating income as an ROE, excluding accumulated other comprehensive income (AOCI), is considered a non-GAAP measure. Management utilizes this measure to view the business without the effect of changes in AOCI, which are primarily attributable to fluctuation in interest rates. The impact of the adjustment to exclude AOCI is $(2.03) billion and $(2.77) billion for the year ended December 31, 2024 and 2023, respectively.
Book value per share, excluding AOCI, is also considered a non-GAAP measure. Management utilizes this measure to view the book value of the business without the effect of changes in AOCI, which are primarily attributable to fluctuation in interest rates. The impact of the adjustment to exclude AOCI is $(23.90) and $(29.11) for the year ended December 31, 2024 and 2023, respectively.
GLOBE LIFE INC.
Management's Discussion & Analysis
Summary of Operations. Net income increased 10% to $1.07 billion in 2024, compared with $971 million in 2023. In 2023, net income increased 9% from $894 million in 2022. On a diluted per common share basis, net income per common share for 2024 increased from $10.07 to $11.94. In 2023, net income per common share, on a diluted per common share basis, increased 11% from $9.04 in 2022.
Net operating income increased 8% to $1.11 billion in 2024, compared with $1.03 billion in 2023, due to a 26% increase in excess investment income as well as a 13% increase in life underwriting margin. In 2023, net operating income increased 7% from $961 million in 2022. On a diluted per common share basis, net operating income per common share for 2024 increased from $10.65 to $12.37, an increase of 16%. In 2023, net income per common share, on a diluted per common share basis, increased 10% from $9.71 in 2022. Net operating income is primarily comprised of insurance underwriting margin plus excess investment income and annuity and other income, offset by operating expenses, after tax and, as such, is considered a non-GAAP measure. Net income is the most directly comparable GAAP measure. We do not consider realized gains and losses to be a component of our core insurance operations or operating segments. Additionally, net income in 2024, 2023, and 2022 was affected by certain non-operating items. We do not view these items as components of core operating results because they are not indicative of past performance or future prospects of the insurance operations. We remove items such as these that relate to prior periods or are non-operating items when evaluating the results of current operations, and therefore exclude such items from our segment analysis for current periods.
As previously noted, a component of insurance underwriting margin is policy obligations, which includes for each reporting period the change in the liability for future policy benefits (LFPB). The LFPB is determined each reporting period based on the net level premium method. Net level premiums reflect a recomputed net premium ratio using actual experience since the issue date, and expected future experience based on future cash-flow assumptions. See Note 6—Policy Liabilities for additional information. The policy liability is accrued as premium revenue is recognized and adjusted for differences between actual and expected experience in the form of remeasurement gains and losses during the period. If actual mortality, morbidity, and lapse experience equals our expected assumptions used in the development of our liability for future policy benefits, there would be no impact to our financial results. Actual experience can have a material impact on financial results to the extent it significantly deviates from the expected assumptions which are used to develop our estimates of the liability for future policy benefits and amortization of the deferred acquisition cost asset (DAC). For example, deviations in actual versus expected lapses in the early policy years tend to have a larger impact on DAC amortization than LFPB change in reserves. Conversely, deviations in actual versus expected lapses in the later policy years typically have a larger impact on LFPB change in reserves than DAC amortization. This is due to the release of DAC and LFPB where DAC capitalization in earlier years is amortizing over time and the LFPB is increasing over time as the policy stays inforce. Disaggregated rollforwards of our present value of expected future net premiums and our expected future policy benefits are presented within Note 6—Policy Liabilities, which include disclosure of remeasurement gain (loss) for the effect of actual variances from expected experience and the changes in assumptions (mortality, morbidity, and lapses) on future cash flows. The Company performed an annual review of its assumptions in the third quarter of 2024 that resulted in favorable changes to its mortality and lapse assumptions on life and unfavorable changes to morbidity assumptions on health. In our life segment mortality assumptions generally decreased across most channels in line with recent experience consistent with decreasing levels of excess deaths. Lapse rate assumptions in the life segment were slightly increased across all channels. For the health segment, morbidity assumptions were increased, causing higher future policy benefit reserves. The assumption review process of the life and health segments resulted in a $46.3 million net remeasurement gain for the period ended December 31, 2024 as compared to a $3.2 million net remeasurement gain for the period ended December 31, 2023 and a $36.5 million net remeasurement loss for the period ended December 31, 2022.
Excluding the impact of assumption changes, the Company's results for actual variances from expected experience for both life and health produced a $57.4 million net remeasurement gain for the period ended December 31, 2024, as compared to a $38.0 million net remeasurement gain for the period ended December 31, 2023 and a $4.6 million net remeasurement gain for the period ended December 31, 2022.
Overall, the Company continues to see positive signs in its core operations, including sales and premium growth, and continues to achieve an operating ROE (excluding accumulated other comprehensive income) generally in the mid-teens.
GLOBE LIFE INC.
Management's Discussion & Analysis
Globe Life's operations on a segment-by-segment basis are discussed in depth below. Net operating income has been used consistently by management for many years to evaluate the operating performance of the Company and is a measure commonly used in the life insurance industry. It differs from GAAP net income primarily because it excludes certain non-operating items such as realized gains and losses and other significant and unusual items included in net income. Management believes an analysis of net operating income is important in understanding the profitability and operating trends of the Company’s business. Net income is the most directly comparable GAAP measure.
Analysis of Profitability by Segment
(Dollar amounts in thousands) | | | | | | | | | | | | | | | | | | | | | | | | | | | | | | | | | | | | | | | | | |
| 2024 | | 2023 | | 2022 | | 2024 Change | | % | | 2023 Change | | % |
| Life insurance underwriting margin | $ | 1,352,597 | | | $ | 1,192,972 | | | $ | 1,129,525 | | | $ | 159,625 | | | 13 | | | $ | 63,447 | | | 6 | |
| Health insurance underwriting margin | 372,423 | | | 377,937 | | | 377,137 | | | (5,514) | | | (1) | | | 800 | | | — | |
| | | | | | | | | | | | | |
| Excess investment income | 164,404 | | | 130,382 | | | 104,589 | | | 34,022 | | | 26 | | | 25,793 | | | 25 | |
| Segment profit or (loss) | 1,889,424 | | | 1,701,291 | | | 1,611,251 | | | 188,133 | | | 11 | | | 90,040 | | | 6 | |
| | | | | | | | | | | | | |
| Annuity and other income | 7,636 | | | 8,800 | | | 11,757 | | | (1,164) | | | (13) | | | (2,957) | | | (25) | |
| Administrative expense | (342,430) | | | (301,161) | | | (299,341) | | | (41,269) | | | 14 | | | (1,820) | | | 1 | |
| Other corporate expense | (179,610) | | | (143,918) | | | (137,201) | | | (35,692) | | | 25 | | | (6,717) | | | 5 | |
| Pre-tax total | 1,375,020 | | | 1,265,012 | | | 1,186,466 | | | 110,008 | | | 9 | | | 78,546 | | | 7 | |
| Applicable taxes | (266,036) | | | (238,368) | | | (225,439) | | | (27,668) | | | 12 | | | (12,929) | | | 6 | |
Net operating income | 1,108,984 | | | 1,026,644 | | | 961,027 | | | 82,340 | | | 8 | | | 65,617 | | | 7 | |
| | | | | | | | | | | | | |
| Reconciling items, net of tax: | | | | | | | | | | | | | |
| Realized gains (losses) | (19,108) | | | (51,884) | | | (60,473) | | | 32,776 | | | | | 8,589 | | | |
| | | | | | | | | | | | | |
| | | | | | | | | | | | | |
| | | | | | | | | | | | | |
| Non-operating expenses | (2,070) | | | (3,294) | | | (4,196) | | | 1,224 | | | | | 902 | | | |
| Legal proceedings | (17,044) | | | (711) | | | (1,972) | | | (16,333) | | | | | 1,261 | | | |
| | | | | | | | | | | | | |
| | | | | | | | | | | | | |
Net income | $ | 1,070,762 | | | $ | 970,755 | | | $ | 894,386 | | | $ | 100,007 | | | 10 | | | $ | 76,369 | | | 9 |
The life insurance segment is our primary segment and is the largest contributor to earnings in each year presented. In 2024, the life insurance segment underwriting margin increased $160 million compared with 2023. This was primarily a result of increased premiums and favorable policy obligations as a percent of premium due to a remeasurement gain resulting from the assumption updates in 2024. In 2023, the life insurance segment underwriting margin increased $63 million when compared with 2022. The increase was due to increased premiums, favorable policy obligations as a percent of premium, and a lower remeasurement loss resulting from assumption updates in 2023. Excess investment income increased $34 million in 2024 compared with 2023, resulting from growth in our invested assets and increased yields due to higher interest rates. In 2023, excess investment income increased $26 million compared with 2022. In 2024, underwriting margin in the health segment decreased to $372 million due to higher claim utilization, compared with $378 million in 2023 and $377 million in 2022.
GLOBE LIFE INC.
Management's Discussion & Analysis
In 2024, the largest contributor of total underwriting margin was the life insurance segment and the primary distribution channel was the American Income Life Division (American Income). The following charts represent the breakdown of total underwriting margin by operating segment and distribution channel for the year ended December 31, 2024.
Total premium income rose 5% for the year ended December 31, 2024 to $4.67 billion. Total net sales increased 9% to $840 million, when compared with 2023. Total first-year collected premium (defined in the following section) increased 11% to $674 million for 2024, compared to $605 million in 2023.
Life insurance premium income increased 4% to $3.26 billion over the prior-year total of $3.14 billion. Life net sales rose 9% to $595 million for the year ended 2024. First-year collected life premium increased 8% to $455 million. Life underwriting margin, as a percent of premium, increased to 41% for 2024 from 38% in 2023. Underwriting margin increased to $1.35 billion in 2024, compared to $1.19 billion in 2023.
Health insurance premium income increased 7% to $1.40 billion over the prior-year total of $1.32 billion. Health net sales rose 10% to $245 million for the year ended 2024. First-year collected health premium rose 18% to $219 million. Health underwriting margin, as a percent of premium, was 27% for 2024 and 29% for 2023. Health underwriting margin declined to $372 million for the year ended 2024, compared to $378 million in 2023.
Excess investment income, the measure of profitability of our investment segment, increased 26% during the year ended 2024 to $164.4 million from $130.4 million in 2023. Excess investment income per common share, reflecting the impact of our share repurchase program and increased net investment income, increased 36% to $1.83 from $1.35 when compared with the same period in 2023.
Insurance administrative expenses increased 14% in 2024 when compared with the prior-year period. These expenses were 7.3% as a percent of premium during 2024 compared to 6.8% in 2023.
For the year ended December 31, 2024, the Company repurchased 10.1 million Globe Life Inc. shares at a total cost of $946 million for an average share price of $93.76.
GLOBE LIFE INC.
Management's Discussion & Analysis
The discussions of our segments are presented in the manner we view our operations, as described in Note 15—Business Segments.
We use three measures as indicators of premium growth and sales over the near term: “annualized premium in force,” “net sales,” and “first-year collected premium.”
•Annualized premium in force is defined as the premium income that would be received over the following twelve months at any given date on all active policies if those policies remain in force throughout the twelve-month period.
•Net sales is calculated as annualized premium issued, net of cancellations generally in the first thirty days after issue, except in the case of Direct to Consumer, where net sales is annualized premium issued at the time the first full premium is paid after any introductory offer period (typically 1 month) has expired. Management considers net sales to be a better indicator of the rate of premium growth than annualized premium issued since annualized premium issued excludes cancellations, and cancellations do not contribute to premium income.
•First-year collected premium is defined as the premium collected during the reporting period for all policies in their first policy year. First-year collected premium takes lapses into account in the first year when lapses are more likely to occur, and thus is a useful indicator of how much new premium is expected to be added to premium income in the future. First-year collected premiums are lower than net sales over the prior 12 months because premiums are not collected on lapsed policies after the date of lapse.
Cancellations are not included in lapses.
Approximately 90% of our premiums are collected monthly; however, other premium payment options such as quarterly and annual are offered by the Company and may be elected by the policyholder. The majority of premiums are paid by way of automatic draft or electronic payment from our policyholders and to a lesser extent from other payment methods such as check, credit card, and worksite payroll deduction.
Excluding our Direct to Consumer Division, we sell our policies primarily through independently contracted agents (“agents”) who earn commissions in accordance with contracts they have with the respective insurance subsidiary of the Company. These contract arrangements with agents cover commission structures and rates, contract periods, credit terms for settlement of agent advance accounts, vesting rights in future renewal commissions upon termination of contracts and responsibility for certain premium collections. Contract terms with agents vary, but generally commissions are earned over the life of the policy as premiums are paid. Commissions are calculated on a policy-by-policy basis and vary by product type and policy year. Commission rates are higher for the first-year premium when a policy is issued and are generally reduced for policies that remain in effect for renewal periods (e.g., commission rates may reduce in years 2-10 and again in year 11 and after). After a certain period (typically 10 years), commission rates become constant over the remaining life of the policy and are considered level commissions.
See further discussion of the distribution channels below for Life and Health.
GLOBE LIFE INC.
Management's Discussion & Analysis
LIFE INSURANCE
Life insurance is the Company's predominant segment. During 2024, life premium represented 70% of total premium and life underwriting margin represented 78% of the total underwriting margin. Additionally, investments supporting the reserves for life products produce the majority of excess investment income attributable to the investment segment.
The following table presents the summary of results of life insurance. Further discussion of the results by distribution channel is included below.
Life Insurance
Summary of Results
(Dollar amounts in thousands)
| | | | | | | | | | | | | | | | | | | | | | | | | | | | | | | | | | | |
| | 2024 | | 2023 | | 2022 |
| | Amount | | % of Premium | | Amount | | % of Premium | | Amount | | % of Premium |
| Premium and policy charges | $ | 3,261,347 | | | 100 | | | $ | 3,137,244 | | | 100 | | | $ | 3,027,824 | | | 100 | |
| | | | | | | | | | | |
| Policy obligations | 2,000,977 | | | 62 | | | 2,050,789 | | | 65 | | | 2,035,693 | | | 67 | |
| Required interest on reserves | (811,147) | | | (25) | | | (772,701) | | | (24) | | | (735,688) | | | (24) | |
| Net policy obligations | 1,189,830 | | | 37 | | | 1,278,088 | | | 41 | | | 1,300,005 | | | 43 | |
| | | | | | | | | | | |
| Amortization of acquisition costs | 356,223 | | | 11 | | | 327,426 | | | 10 | | | 298,841 | | | 10 | |
| Commission expense | 159,703 | | | 5 | | | 145,678 | | | 5 | | | 140,283 | | | 5 | |
| Premium taxes | 68,360 | | | 2 | | | 64,571 | | | 2 | | | 61,609 | | | 2 | |
| Non-deferred acquisition costs | 134,634 | | | 4 | | | 128,509 | | | 4 | | | 97,561 | | | 3 | |
| Total expense | 1,908,750 | | | 59 | | | 1,944,272 | | | 62 | | | 1,898,299 | | | 63 | |
Insurance underwriting margin | $ | 1,352,597 | | | 41 | | | $ | 1,192,972 | | | 38 | | | $ | 1,129,525 | | | 37 | |
Net policy obligations amounted to 37% of premiums for the year ended December 31, 2024, compared to 41% in 2023, and 43% in 2022. This improvement was primarily due to the assumptions updated based upon our review of lapses, mortality, and morbidity resulting in a remeasurement gain of $56.8 million compared to a remeasurement loss of $2.0 million in 2023 and a remeasurement loss of $47.2 million in 2022. Refer to Note 6—Policy Liabilities for further discussion of the Company's annual assumptions review.
The table below summarizes life underwriting margin by distribution channel for the last three years.
Life Insurance
Underwriting Margin by Distribution Channel
(Dollar amounts in thousands)
| | | | | | | | | | | | | | | | | | | | | | | | | | | | | | | | | | | |
| 2024 | | 2023 | | 2022 |
| Amount | | % of Premium | | Amount | | % of Premium | | Amount | | % of Premium |
| American Income | $ | 799,946 | | | 47 | | | $ | 719,378 | | | 45 | | | $ | 692,107 | | | 46 | |
| Direct to Consumer | 281,948 | | | 29 | | | 234,893 | | | 24 | | | 213,748 | | | 22 | |
| Liberty National | 140,136 | | | 38 | | | 114,646 | | | 33 | | | 101,202 | | | 31 | |
| Other | 130,567 | | | 64 | | | 124,055 | | | 60 | | | 122,468 | | | 58 | |
Total | $ | 1,352,597 | | | 41 | | | $ | 1,192,972 | | | 38 | | | $ | 1,129,525 | | | 37 | |
GLOBE LIFE INC.
Management's Discussion & Analysis
The following table presents Globe Life's life premium distribution channel for the last three years.
Life Insurance
Premium by Distribution Channel
(Dollar amounts in thousands) | | | | | | | | | | | | | | | | | | | | | | | | | | | | | | | | | | | |
| | 2024 | | 2023 | | 2022 |
| | Amount | | % of
Total | | Amount | | % of
Total | | Amount | | % of
Total |
| American Income | $ | 1,698,209 | | | 52 | | | $ | 1,588,702 | | | 51 | | | $ | 1,505,034 | | | 50 | |
| Direct to Consumer | 988,522 | | | 30 | | | 991,406 | | | 31 | | | 985,488 | | | 32 | |
| Liberty National | 371,061 | | | 12 | | | 349,736 | | | 11 | | | 327,469 | | | 11 | |
| Other | 203,555 | | | 6 | | | 207,400 | | | 7 | | | 209,833 | | | 7 | |
Total | $ | 3,261,347 | | | 100 | | | $ | 3,137,244 | | | 100 | | | $ | 3,027,824 | | | 100 | |
Annualized life premium in force was $3.3 billion at December 31, 2024, an increase of 4% over $3.2 billion a year earlier.
The following table presents life net sales, an indicator of new business production, by distribution channel for each of the last three years.
Life Insurance
Net Sales by Distribution Channel
(Dollar amounts in thousands) | | | | | | | | | | | | | | | | | | | | | | | | | | | | | | | | | | | |
| | 2024 | | 2023 | | 2022 |
| | Amount | | % of
Total | | Amount | | % of
Total | | Amount | | % of
Total |
| American Income | $ | 381,945 | | | 64 | | | $ | 322,658 | | | 59 | | | $ | 316,715 | | | 59 | |
| Direct to Consumer | 106,310 | | | 18 | | | 116,454 | | | 21 | | | 125,979 | | | 24 | |
| Liberty National | 98,162 | | | 16 | | | 95,459 | | | 18 | | | 78,390 | | | 15 | |
| Other | 8,936 | | | 2 | | | 9,701 | | | 2 | | | 9,844 | | | 2 | |
Total | $ | 595,353 | | | 100 | | | $ | 544,272 | | | 100 | | | $ | 530,928 | | | 100 | |
The table below discloses first-year collected life premium by distribution channel for the last three years.
Life Insurance
First-Year Collected Premium by Distribution Channel
(Dollar amounts in thousands) | | | | | | | | | | | | | | | | | | | | | | | | | | | | | | | | | | | |
| | 2024 | | 2023 | | 2022 |
| | Amount | | % of
Total | | Amount | | % of
Total | | Amount | | % of
Total |
| American Income | $ | 305,165 | | | 67 | | | $ | 266,429 | | | 63 | | | $ | 257,584 | | | 63 | |
| Direct to Consumer | 67,452 | | | 15 | | | 77,570 | | | 19 | | | 86,854 | | | 21 | |
| Liberty National | 74,553 | | | 16 | | | 67,618 | | | 16 | | | 56,085 | | | 14 | |
| Other | 7,678 | | | 2 | | | 8,542 | | | 2 | | | 8,988 | | | 2 | |
Total | $ | 454,848 | | | 100 | | | $ | 420,159 | | | 100 | | | $ | 409,511 | | | 100 | |
GLOBE LIFE INC.
Management's Discussion & Analysis
A discussion of life operations by distribution channel follows.
The American Income Life Division markets to members of labor unions and other affinity groups and continues to diversify its lead sources utilizing third-party internet vendor leads and obtaining referrals to facilitate sustainable growth. This division is Globe Life's largest contributor of life premium of any distribution channel at 52% of the Company's 2024 total life premium. In 2024, the average monthly life premium issued per policy was $56 as compared to $54 in 2023. Net sales were $382 million in 2024, up from $323 million in 2023. The underwriting margin, as a percent of premium, was 47% in 2024, up from 45% in 2023.
The average producing agent count increased 11% over the year-ago period. Over 65% of the Division's net sales are driven by agents that have been producing for the Division for six months or more. The increase in average producing agent count was driven by an increase in new agent recruiting along with continued improvement in new agent retention. Sales growth in this Division, as well as within our other exclusive agencies, is generally dependent on growth in the size of the agency force.
Below is the average producing agent count as of the indicated periods for the American Income Division. The average producing agent count is based on the actual count at the beginning and end of each week during the year.
| | | | | | | | | | | | | | | | | | | | | | | | | | | | | | | | | | | | | | | | | |
| 2024 | | 2023 | | 2022 | | 2024 Change | | % | | 2023 Change | | % |
| American Income | 11,741 | | | 10,579 | | | 9,444 | | | 1,162 | | | 11 | | | 1,135 | | | 12 | |
American Income Life continues to focus on growing and strengthening the agency force, specifically through emphasis on agency middle-management growth and additional agency office openings. In addition to offering financial incentives and training opportunities, the Division has made considerable investments in information technology, including a customer relationship management (CRM) tool for the agency force. This tool is designed to drive productivity in lead distribution, conservation of business, manager dashboards, and new agent recruiting. Additionally, this Division has invested in and successfully implemented technology that allows the agency force to engage in virtual recruiting, training, and sales activity. The agents have shifted to primarily a virtual experience with customers and have generated the vast majority of sales through virtual presentations. We find this flexibility to be attractive to new recruits as well as a driver of sustainability for our agency force.
The Direct to Consumer Division (DTC) markets adult and juvenile life insurance through a variety of mediums, including direct mail, insert media, and digital marketing. The different media channels support and complement one another in the Division's efforts to provide consumer outreach. All three channels work in an omnichannel approach. Sales from the internet and inbound phone calls continue to outpace the activity from direct mail. DTC's long-term growth has been fueled by consistent innovation and brand awareness. Additionally, the DTC division provides valuable support to our agency business through brand impressions and inquires that may lead to sales in our exclusive agency channels. New initiatives are continuously introduced to help increase response rates, issue rates, and create a seamless customer experience. The juvenile market is an important source of sales as well as a vehicle to reach the parent and grandparent market of juvenile policyholders, who are more likely to respond favorably to a solicitation for life insurance.
It is also a vehicle to reach the parents and grandparents of juvenile policyholders, who are more likely to respond favorably to a seamless customer experience solicitation for life coverage on themselves in comparison to the general adult population. Also, future offerings to juvenile policyholders and their parents are sources of lower acquisition-cost life insurance sales in the future.
DTC net sales declined 9% to $106 million in 2024 compared with $116 million for the same period a year ago. This decline is due primarily to the management of costs relative to direct mail and mailing insert marketing activity as a result of inflation related to postage, paper, and online advertising costs. While total sales have declined, the focus has been on improving profitability and improving the underwriting margin. In 2024, DTC’s underwriting margin, as a percent of premium, was 29% compared with 24% in 2023.
GLOBE LIFE INC.
Management's Discussion & Analysis
The Liberty National Division markets individual life insurance to middle-income household and worksite customers. Recent investments in new sales technologies as well as recent growth in middle management within the agency are expected to support increased sales. The underwriting margin as a percent of premium was 38% in 2024, compared with 33% in 2023. The increase is primarily attributable to increased premiums and lower policy obligations as a percent of premium during the year compared with the same year ago period. In 2024, the average monthly life premium issued per policy was $43 as compared to $44 in 2023. Net sales rose 3% in 2024 over the same period in 2023 due primarily to increased agent count.
Below is the average producing agent count as of the indicated periods for the Liberty National Division. The average producing agent count is based on the actual count at the beginning and end of each week during the year.
| | | | | | | | | | | | | | | | | | | | | | | | | | | | | | | | | | | | | | | | | |
| 2024 | | 2023 | | 2022 | | 2024 Change | | % | | 2023 Change | | % |
| Liberty National | 3,664 | | | 3,229 | | | 2,775 | | | 435 | | | 13 | | | 454 | | | 16 | |
The Liberty National Division average producing agent count increased significantly compared with the prior-year comparable periods. We continue to execute our long-term plan to grow this agency through expansion from small-town markets in the Southeast to more densely populated areas with larger pools of potential agent recruits and customers as we serve communities, regions, and cities. Continued expansion of this Division’s presence in larger geographic cities, with less penetrated areas will help create long-term sustainable agency growth. Additionally, the Division continues to help improve the ability of agents to develop new worksite marketing business. Systems that have been put in place, including the addition of a CRM platform and enhanced analytical capabilities, have helped the agents develop additional worksite marketing opportunities as well as improve the productivity of agents selling in the individual life market. As the Division continues to gain momentum in its sales and recruiting initiatives, as well as advances in its technology and CRM platform, the Division anticipates continued growth in recruiting activity, average producing agent count and net sales.
The Other agency distribution channels primarily include non-exclusive independent agencies selling primarily life insurance. The other distribution channels contributed $204 million of life premium income, or 6% of Globe Life's total life premium income in 2024, and contributed 2% of net sales for the year.
HEALTH INSURANCE
Health insurance sold by the Company primarily includes Medicare Supplement insurance including retiree health insurance business, accident coverage, and other limited-benefit supplemental health products including cancer, critical illness, heart disease, intensive care, and other health products.
Health premium accounted for 30% of our total premium in 2024, while the health underwriting margin accounted for 22% of total underwriting margin. Health underwriting margin declined to $372 million compared to $378 million in the prior year. While the Company continues to emphasize life insurance sales relative to health due to life’s superior long-term profitability and its greater contribution to excess investment income, the health business provides a significant contribution to return on equity as it does not require a substantial amount of up-front capital.
GLOBE LIFE INC.
Management's Discussion & Analysis
The following table presents the summary of health insurance results. Further discussion of the results by distribution channel is included below.
Health Insurance
Summary of Results
(Dollar amounts in thousands)
| | | | | | | | | | | | | | | | | | | | | | | | | | | | | | | | | | | |
| | 2024 | | 2023 | | 2022 |
| | Amount | | % of Premium | | Amount | | % of Premium | | Amount | | % of Premium |
| Premium | $ | 1,404,925 | | | 100 | | | $ | 1,318,773 | | | 100 | | | $ | 1,282,417 | | | 100 | |
| | | | | | | | | | | |
| Policy obligations | 851,577 | | | 61 | | | 776,362 | | | 59 | | | 752,866 | | | 59 | |
| Required interest on reserves | (110,342) | | | (8) | | | (106,516) | | | (8) | | | (102,315) | | | (8) | |
| Net policy obligations | 741,235 | | | 53 | | | 669,846 | | | 51 | | | 650,551 | | | 51 | |
| | | | | | | | | | | |
| Amortization of acquisition costs | 52,224 | | | 3 | | | 50,598 | | | 4 | | | 48,185 | | | 4 | |
| Commission expense | 158,869 | | | 11 | | | 150,192 | | | 11 | | | 145,185 | | | 11 | |
| Premium taxes | 28,421 | | | 2 | | | 26,440 | | | 2 | | | 24,653 | | | 2 | |
| Non-deferred acquisition costs | 51,753 | | | 4 | | | 43,760 | | | 3 | | | 36,706 | | | 3 | |
| Total expense | 1,032,502 | | | 73 | | | 940,836 | | | 71 | | | 905,280 | | | 71 | |
Insurance underwriting margin | $ | 372,423 | | | 27 | | | $ | 377,937 | | | 29 | | | $ | 377,137 | | | 29 | |
Net policy obligations amounted to 53% of premium in 2024 compared to 51% in both 2023 and 2022. This increase was primarily due to the assumptions review of lapses and morbidity resulting in a remeasurement loss of $10.5 million compared to a remeasurement gain of $5.2 million and $10.7 million in 2023 and 2022, respectively. Refer to Note 6—Policy Liabilities for further discussion of the Company's annual assumptions review.
The table below summarizes health underwriting margin by distribution channel for the last three years.
Health Insurance
Underwriting Margin by Distribution Channel
(Dollar amounts in thousands)
| | | | | | | | | | | | | | | | | | | | | | | | | | | | | | | | | | | |
| 2024 | | 2023 | | 2022 |
| Amount | | % of Premium | | Amount | | % of Premium | | Amount | | % of Premium |
| United American | $ | 47,964 | | | 8 | | | $ | 57,344 | | | 11 | | | $ | 62,695 | | | 12 | |
| Family Heritage | 146,478 | | | 34 | | | 135,691 | | | 34 | | | 124,936 | | | 34 | |
| Liberty National | 106,033 | | | 56 | | | 105,317 | | | 56 | | | 107,662 | | | 57 | |
| American Income | 67,912 | | | 55 | | | 74,668 | | | 62 | | | 74,551 | | | 64 | |
| Direct to Consumer | 4,036 | | | 6 | | | 4,917 | | | 7 | | | 7,293 | | | 10 | |
Total | $ | 372,423 | | | 27 | | | $ | 377,937 | | | 29 | | | $ | 377,137 | | | 29 | |
GLOBE LIFE INC.
Management's Discussion & Analysis
The following table presents Globe Life's health premium by distribution channel for the last three years.
Health Insurance
Premium by Distribution Channel
(Dollar amounts in thousands)
| | | | | | | | | | | | | | | | | | | | | | | | | | | | | | | | | | | |
| | 2024 | | 2023 | | 2022 |
| | Amount | | % of Total | | Amount | | % of Total | | Amount | | % of Total |
| United American | $ | 591,774 | | | 42 | | | $ | 545,723 | | | 42 | | | $ | 539,874 | | | 42 | |
| Family Heritage | 427,654 | | | 30 | | | 396,209 | | | 30 | | | 366,820 | | | 29 | |
| Liberty National | 190,381 | | | 14 | | | 187,934 | | | 14 | | | 187,241 | | | 15 | |
| American Income | 123,123 | | | 9 | | | 120,332 | | | 9 | | | 117,353 | | | 9 | |
| Direct to Consumer | 71,993 | | | 5 | | | 68,575 | | | 5 | | | 71,129 | | | 5 | |
Total | $ | 1,404,925 | | | 100 | | | $ | 1,318,773 | | | 100 | | | $ | 1,282,417 | | | 100 | |
Premium related to limited-benefit supplemental health products comprise $786 million, or 56%, of the total health premiums for 2024 compared with $743 million, or 56%, in 2023. Premium from Medicare Supplement products comprises the remaining $619 million, or 44%, for 2024 compared with $576 million, or 44%, in 2023.
Annualized health premium in force was $1.48 billion at December 31, 2024, an increase of 7% from $1.39 billion a year earlier.
Presented below is a table of health net sales, an indicator of new business production, by distribution channel for each of the last three years.
Health Insurance
Net Sales by Distribution Channel
(Dollar amounts in thousands)
| | | | | | | | | | | | | | | | | | | | | | | | | | | | | | | | | | | |
| | 2024 | | 2023 | | 2022 |
| | Amount | | % of Total | | Amount | | % of Total | | Amount | | % of Total |
| United American | $ | 80,296 | | | 33 | | | $ | 72,208 | | | 32 | | | $ | 58,601 | | | 31 | |
| Family Heritage | 105,623 | | | 43 | | | 96,093 | | | 43 | | | 82,529 | | | 43 | |
| Liberty National | 33,001 | | | 13 | | | 33,155 | | | 15 | | | 28,916 | | | 15 | |
| American Income | 21,103 | | | 9 | | | 18,124 | | | 8 | | | 17,555 | | | 9 | |
| Direct to Consumer | 5,004 | | | 2 | | | 3,993 | | | 2 | | | 3,825 | | | 2 | |
Total | $ | 245,027 | | | 100 | | | $ | 223,573 | | | 100 | | | $ | 191,426 | | | 100 | |
Health net sales related to limited-benefit supplemental health products, comprise $175 million, or 71%, of the total health net sales for 2024 compared with $161 million, or 72%, in 2023. Medicare Supplement sales make up the remaining $70 million, or 29%, for 2024 compared with $63 million, or 28%, in 2023.
GLOBE LIFE INC.
Management's Discussion & Analysis
The following table discloses first-year collected health premium by distribution channel for the last three years.
Health Insurance
First-Year Collected Premium by Distribution Channel
(Dollar amounts in thousands)
| | | | | | | | | | | | | | | | | | | | | | | | | | | | | | | | | | | |
| | 2024 | | 2023 | | 2022 |
| | Amount | | % of Total | | Amount | | % of Total | | Amount | | % of Total |
| United American | $ | 87,190 | | | 40 | | | $ | 66,002 | | | 36 | | | $ | 64,410 | | | 39 | |
| Family Heritage | 79,934 | | | 36 | | | 72,362 | | | 39 | | | 60,699 | | | 36 | |
| Liberty National | 28,114 | | | 13 | | | 25,608 | | | 14 | | | 22,415 | | | 13 | |
| American Income | 19,740 | | | 9 | | | 17,633 | | | 9 | | | 17,294 | | | 10 | |
| Direct to Consumer | 4,064 | | | 2 | | | 3,683 | | | 2 | | | 3,115 | | | 2 | |
Total | $ | 219,042 | | | 100 | | | $ | 185,288 | | | 100 | | | $ | 167,933 | | | 100 | |
First-year collected premium related to limited-benefit supplemental health plans comprise $155 million, or 71% of total first-year collected premium for 2024 compared with $133 million, or 72%, in 2023. First-year collected premium from Medicare Supplement policies make up the remaining $64 million, or 29%, for 2024 compared with $52 million, or 28%, in 2023.
A discussion of health operations by distribution channel follows.
The United American Division consists of non-exclusive independent agencies and brokers who may also sell for other companies. The United American Division was Globe Life's largest health agency in terms of health premium income, with net sales up 11% from the same period in the prior year.
This Division includes three different units:
•UA General Agency, which primarily sells individual Medicare Supplement insurance through independent agents;
•Special Markets, which markets retiree health insurance to employer and union groups through brokers; and
•Globe Life Group Benefits, which offers group worksite supplemental health insurance through brokers.
The majority of the premium revenue comes from Medicare Supplement. Underwriting margin as a percent of premium for the Division was 8% in 2024, declining due to increased claims utilization, 11% in 2023, and 12% in 2022.
The Family Heritage Division primarily markets individual limited-benefit supplemental health insurance in small to medium sized businesses. Most of its policies include a cash-back feature, such as a return of premium, where any excess of premiums over claims paid is returned to the policyholder at the end of a specified period stated within the insurance policy. Underwriting margin as a percent of premium was 34% in 2024, the same as in 2023 and 2022.
The division experienced a 10% rise in health net sales in 2024 as compared with 2023, primarily due to an increase in producing agents and improved agent productivity and training. The Division will continue to implement incentive and retention programs to further increases in the number of producing agents.
The average producing agent count was up 5% compared with the same period a year ago. The Division has recently increased efforts to grow agency middle management, which also positively impacts average producing agent count. While growth in net sales and earned premium is impacted by agent productivity, growth in the number of average producing agents is the primary driver of future growth in sales, similar to other exclusive agencies.
GLOBE LIFE INC.
Management's Discussion & Analysis
Below is the average producing agent count as of the indicated periods for the Family Heritage Division. The average producing agent count is based on the actual count at the beginning and end of each week during the year.
| | | | | | | | | | | | | | | | | | | | | | | | | | | | | | | | | | | | | | | | | |
| 2024 | | 2023 | | 2022 | | 2024 Change | | % | | 2023 Change | | % |
| Family Heritage | 1,399 | | | 1,334 | | | 1,210 | | | 65 | | | 5 | | | 124 | | | 10 | |
The Liberty National Division represented 14% of all Globe Life health premium income in 2024. The Liberty National Division markets limited-benefit supplemental health products, consisting primarily of cancer and critical illness insurance. Much of Liberty National’s health business is generated through worksite marketing targeting small businesses. Health premium at the Liberty National Division was $190 million in 2024 up from $188 million in 2023. Liberty National's first-year collected premium increased 10% to $28 million in 2024 compared with $26 million in 2023. Health net sales is slightly lower in 2024 as compared to 2023. Underwriting margin as a percent of premium was 56% in 2024 and 2023.
While both the American Income Life Division and the Direct to Consumer Division sell life insurance, they also market health products. The American Income Life Division primarily markets accident plans. The Direct to Consumer Division primarily markets Medicare Supplements to employer or union-sponsored groups. On a combined basis, these other channels accounted for 14% of health premium in 2024 and 2023.
INVESTMENTS
We manage our capital resources, including investments and cash flow, through the investment segment. Excess investment income represents the profit margin attributable to investment operations and is the measure that we use to evaluate the performance of the investment segment as described in Note 15—Business Segments. It is defined as net investment income less the required interest attributable to policy liabilities.
Management also views excess investment income per diluted common share as an important and useful measure to evaluate the performance of the investment segment. It is defined as excess investment income divided by the total diluted weighted average shares outstanding, representing the contribution by the investment segment to the consolidated earnings per share of the Company. As excess investment income per diluted common share incorporates all invested assets and insurance liabilities, we view excess investment income per diluted common share as a useful measure to evaluate the investment segment.
GLOBE LIFE INC.
Management's Discussion & Analysis
Excess Investment Income. The following table summarizes Globe Life's investment income, excess investment income, and excess investment income per diluted common share.
Analysis of Excess Investment Income
(Dollar amounts in thousands except per share data)
| | | | | | | | | | | | | | | | | |
| 2024 | | 2023 | | 2022 |
| Net investment income | $ | 1,135,631 | | | $ | 1,056,884 | | | $ | 991,800 | |
Interest on policy liabilities(1) | (971,227) | | | (926,502) | | | (887,211) | |
| | | | | |
Excess investment income | $ | 164,404 | | | $ | 130,382 | | | $ | 104,589 | |
| | | | | |
Excess investment income per diluted common share | $ | 1.83 | | | $ | 1.35 | | | $ | 1.06 | |
| | | | | |
| Mean invested assets (at amortized cost) | $ | 21,337,531 | | | $ | 20,411,093 | | | $ | 19,714,027 | |
| Average insurance policy liabilities | 17,527,857 | | | 16,772,861 | | | 16,060,240 | |
| | | | | |
(1)Interest on policy liabilities, at original rates, is a component of total policyholder benefits, a GAAP measure.
Excess investment income increased $34 million, or 26%, in 2024 when compared with 2023. In 2023, excess investment income increased $26 million, or 25%, when compared with 2022. Excess investment income per diluted common share was $1.83 during 2024, an increase of 36% over the prior-year period ended 2023. Excess investment income per diluted common share was $1.35 during 2023, an increase of 27% over the period ended 2022. Excess investment income per diluted common share generally increases at a faster pace than excess investment income because the number of diluted shares outstanding generally decreases from year to year as a result of our share repurchase program.
Net investment income increased at a compound annual growth rate of 6% over the three years ending 2024. Mean invested assets increased at a compound annual growth rate of 4% during the same period. The effective annual yield rate earned on the fixed maturity portfolio was 5.26% in 2024, compared with 5.20% in 2023. Generally, investment income grows at a slower rate than the assets when the yield on new investments is lower than the yield on dispositions or the average portfolio yield. It also increases at a faster rate than the assets when new investment yields exceed the yield on dispositions or the average portfolio yield. Investment income grew in the current period due to the growth in invested assets and the higher yields on new investments relative to the yield on dispositions and average portfolio yield. In addition to fixed maturities, the Company has also invested in commercial mortgage loans and limited partnerships with debt-like characteristics that diversify risk and enhance risk-adjusted, capital-adjusted returns on the portfolio. The earned yield on the Company's commercial mortgage loans for the year ended December 31, 2024 was 8.04%. The earned yield on limited partnership investments for the year ended December 31, 2024 was 8.42%. See additional information in Note 4—Investments. The following chart presents the growth in net investment income and the growth in mean invested assets. | | | | | | | | | | | | | | | | | |
| 2024 | | 2023 | | 2022 |
| Growth in net investment income | 7.5 | % | | 6.6 | % | | 3.7 | % |
| Growth in mean invested assets (at amortized cost) | 4.5 | % | | 3.5 | % | | 4.1 | % |
Globe Life's net investment income benefits from higher interest rates on new investments. While increasing interest rates have resulted in a net unrealized loss from our available for sale debt securities included in accumulated other comprehensive income (loss) as of December 31, 2024, we are not concerned because we do not generally intend to sell, nor is it likely that we will be required to sell, fixed maturity investments prior to their anticipated recovery.
Required interest on insurance policy liabilities reduces excess investment income, as it is the amount of net investment income considered by management necessary to cover the interest-related growth on insurance policy liabilities. As such, it is reclassified from the insurance segment to the investment segment. As discussed in Note 15—Business Segments, management regards this as a more meaningful analysis of the investment and insurance segments. Required interest is based on the original discount rate assumptions for our insurance policies in force.
GLOBE LIFE INC.
Management's Discussion & Analysis
The vast majority of our life and health insurance policies are fixed interest rate protection policies, not investment products, and are accounted for under current GAAP accounting guidance for long-duration insurance products which mandate that interest rate assumptions for a particular block of business be “locked in” for the life of that block of business. Each calendar year, we set the original discount rate to be used to calculate the benefit reserve liability for all insurance policies issued that year. The liability reported on the balance sheet is updated in subsequent periods using current discount rates as of the end of the relevant reporting period with a corresponding adjustment to Other Comprehensive Income.
The discount rate used for policies issued in the current year has no impact on the in-force policies issued in prior years as the rates of all prior issue years are also locked in for purposes of recognizing income. As such, the overall original discount rate for the entire in-force block of 5.5% is a weighted average of the discount rates being used from all issue years. Changes in the overall weighted-average discount rate over time are caused by changes in the mix of the reserves on the entire block of in force business. Business issued in the current year has little impact on the overall weighted-average original discount rate due to the size of our in-force business.
Information about interest on policy liabilities is shown in the following table.
Required Interest on Insurance Policy Liabilities
(Dollar amounts in thousands) | | | | | | | | | | | | | | | | | |
| Required Interest | | Average Net Insurance Policy Liabilities | | Average Discount Rate(1) |
| 2024: | | | | | |
| Life and Health | $ | 921,489 | | | $ | 16,502,133 | | | 5.6 | % |
| Annuity | 28,769 | | | 640,506 | | | 4.5 | |
| FHLB Funding Agreement | 16,525 | | | 295,089 | | | 5.6 | |
| Deposit Funds | 4,444 | | | 90,129 | | | 4.9 | |
| Total | $ | 971,227 | | | $ | 17,527,857 | | | 5.5 | |
| Increase in 2024 | 4.8 | % | | 4.5 | % | | |
| 2023: | | | | | |
| Life and Health | $ | 879,217 | | | $ | 15,739,423 | | | 5.6 | % |
| Annuity | 38,224 | | | 861,676 | | | 4.4 | |
| FHLB Funding Agreement | 4,536 | | | 79,036 | | | 5.7 | |
| Deposit Funds | 4,525 | | | 92,726 | | | 4.9 | |
| Total | $ | 926,502 | | | $ | 16,772,861 | | | 5.5 | |
| Increase in 2023 | 4.4 | % | | 4.4 | % | | |
| 2022: | | | | | |
| Life and Health | $ | 838,003 | | | $ | 14,957,728 | | | 5.6 | % |
| Annuity | 44,836 | | | 1,007,008 | | | 4.5 | |
| FHLB Funding Agreement | 71 | | | 2,692 | | | 2.6 | |
| Deposit Funds | 4,301 | | | 92,812 | | | 4.6 | |
| Total | $ | 887,211 | | | $ | 16,060,240 | | | 5.5 | |
| | | | | |
(1) Reflects the average discount rate applicable to the current period, which is used to accrue interest on the insurance policy liabilities for each of the years presented.
GLOBE LIFE INC.
Management's Discussion & Analysis
Realized Gains and Losses. Our life and health insurance companies collect premium income from policyholders for the eventual payment of policyholder benefits, sometimes paid many years or even decades in the future. Since benefits are expected to be paid in future periods, premium receipts in excess of current expenses are invested to provide for these obligations. For this reason, we hold a significant investment portfolio as a part of our core insurance operations. This portfolio consists primarily of high-quality fixed maturities containing an adequate yield to provide for the cost of carrying these long-term insurance product obligations. As a result, fixed maturities are generally held for long periods to support these obligations. Expected yields on these investments are taken into account when setting insurance premium rates and product profitability expectations.
Despite our intent to hold fixed maturity investments for a long period of time, investments are occasionally sold, exchanged, called, or experience a credit loss event, resulting in a realized gain or loss. Gains or losses are only secondary to our core insurance operations of providing insurance coverage to policyholders. In a bond exchange offer, bondholders may consent to exchange their existing bonds for another class of debt securities. The Company also has investments in certain limited partnerships, held under the fair value option, with fair value changes recognized in Realized gains (losses) in the Consolidated Statements of Operations.
Realized gains and losses can be significant in relation to the earnings from core insurance operations, and as a result, can have a material positive or negative impact on net income. The significant fluctuations caused by gains and losses can cause period-to-period trends of net income that are not indicative of historical core operating results or predictive of the future trends of core operations. Accordingly, they have no bearing on core insurance operations or segment results as we view operations. For these reasons, and in line with industry practice, we remove the effects of realized gains and losses when evaluating overall insurance operating results.
The following table summarizes our tax-effected realized gains (losses) by component for each of the three years ended December 31, 2024.
Analysis of Realized Gains (Losses), Net of Tax
(Dollar amounts in thousands, except for per share data) | | | | | | | | | | | | | | | | | | | | | | | | | | | | | | | | | | | |
| | Year Ended December 31, |
| | 2024 | | 2023 | | 2022 |
| | Amount | | Per Share | | Amount | | Per
Share | | Amount | | Per
Share |
| Fixed maturities: | | | | | | | | | | | |
Sales(3) | $ | (9,290) | | | $ | (0.10) | | | $ | (59,463) | | | $ | (0.62) | | | $ | (44,792) | | | $ | (0.45) | |
Matured or other redemptions(1) | 155 | | | — | | | (1,604) | | | (0.02) | | | 19,076 | | | 0.19 | |
| Provision for credit losses | (2,590) | | | (0.03) | | | (5,621) | | | (0.06) | | | 306 | | | — | |
| Fair value option—change in fair value | (13,206) | | | (0.15) | | | 11,931 | | | 0.12 | | | (23,189) | | | (0.23) | |
| Mortgages | (3,138) | | | (0.04) | | | (4,427) | | | (0.04) | | | (761) | | | (0.01) | |
| Other investments | 2,319 | | | 0.03 | | | 1,415 | | | 0.02 | | | 3,699 | | | 0.04 | |
Total realized investment gains (losses)—investments | (25,750) | | | (0.29) | | | (57,769) | | | (0.60) | | | (45,661) | | | (0.46) | |
| | | | | | | | | | | |
Other gains (losses)(2) | 6,642 | | | 0.08 | | | 5,885 | | | 0.06 | | | (14,812) | | | (0.15) | |
Total realized gains (losses) | $ | (19,108) | | | $ | (0.21) | | | $ | (51,884) | | | $ | (0.54) | | | $ | (60,473) | | | $ | (0.61) | |
(1)During the three years ended December 31, 2024, 2023, and 2022, the Company recorded $105.6 million, $50.9 million, and $147.6 million, respectively, of exchanges of fixed maturity securities (noncash transactions) that resulted in $0, $(1.5) million, and $1.5 million, respectively, in realized gains (losses), net of tax.
(2)Other realized gains (losses) are primarily a result of changes in the fair value for assets held in rabbi trust.
(3)During the year ended December 31, 2023, the Company incurred a $52 million after-tax realized loss due to the disposal of holdings in Signature Bank New York and First Republic Bank as a result of the banks entering receivership.
GLOBE LIFE INC.
Management's Discussion & Analysis
Investment Acquisitions. Globe Life's investment policy calls for investing primarily in investment grade fixed maturities that meet our quality and yield objectives. We generally invest in securities with longer-term maturities because they more closely match the long-term nature of our life and health policy liabilities. We believe this strategy is appropriate since our expected future cash flows are generally stable and predictable and the likelihood that we will need to sell invested assets to raise cash is low.
The following table summarizes selected information for fixed maturity investments. The effective annual yield shown is based on the acquisition price and call features, if any, of the securities. For non-callable bonds, the yield is calculated to maturity date. For callable bonds acquired at a premium, the yield is calculated to the earliest known call date and call price after acquisition ("first call date"). For all other callable bonds, the yield is calculated to maturity date.
Fixed Maturity Acquisitions Selected Information
(Dollar amounts in thousands) | | | | | | | | | | | | | | | | | |
| | Year Ended December 31, |
| | 2024 | | 2023 | | 2022 |
Cost of acquisitions: | | | | | |
| Investment-grade corporate securities | $ | 1,258,203 | | | $ | 967,588 | | | $ | 812,697 | |
| Investment-grade municipal securities | 94,658 | | | 572,654 | | | 599,946 | |
| Other securities | 29,577 | | | — | | | 7,577 | |
Total fixed maturity acquisitions(1) | $ | 1,382,438 | | | $ | 1,540,242 | | | $ | 1,420,220 | |
| | | | | |
Effective annual yield (one year compounded)(2) | 5.93 | % | | 6.13 | % | | 5.18 | % |
| Average life (in years, to next call) | 29.4 | | | 18.0 | | | 13.5 | |
| Average life (in years, to maturity) | 33.3 | | | 24.8 | | | 22.8 | |
| Average rating | A- | | A | | A |
(1)Fixed maturity acquisitions included unsettled trades of $3.2 million in 2024, $3.8 million in 2023, and $0 in 2022.
(2)Tax-equivalent basis, where the yield on tax-exempt securities is adjusted to produce a yield equivalent to the pretax yield on taxable securities.
For investments in callable bonds, the actual life of the investment will depend on whether the issuer calls the investment prior to the maturity date. Given our investments in callable bonds, the actual average life of our investments cannot be known at the time of the investment. Absent sales and "make-whole calls," however, the average life will not be less than the average life to next call and will not exceed the average life to maturity. Data for both of these average life measures is provided in the above chart.
During 2024 and 2023, acquisitions consisted primarily of corporate and municipal bonds with securities spanning a diversified range of issuers, industry sectors, and geographical regions. For the year ended December 31, 2024, we invested primarily in the industrial, financial, and utility sectors. For the entire portfolio, the taxable equivalent effective yield earned was 5.26%, up approximately 6 basis points from the yield in 2023. The increase in taxable equivalent effective yield was primarily due to new purchase yields exceeding the yield on dispositions and the average portfolio yield.
New cash flow available for investment has been primarily provided through our insurance operations, cash received on existing investments, and proceeds from dispositions. Dispositions of fixed maturities were $1.42 billion in 2024 and $853 million in 2023. Dispositions in 2024 included $462 million related to a coinsurance agreement to cede a majority of annuity business to a third-party insurer. Refer to Note—1 Significant Accounting Policies for further information.
GLOBE LIFE INC.
Management's Discussion & Analysis
In addition to the fixed maturity acquisitions, Globe Life invested in commercial mortgage loans and in other long-term investments. Other long-term investments primarily consist of investment funds. See Note—4 Investments for further discussion.
The following table summarizes Globe Life's other investment acquisitions of the following assets.
Other Investment Acquisitions
(Dollar amounts in thousands)
| | | | | | | | | | | | | |
| Year Ended December 31, |
| 2024 | | 2023 | | |
| Limited partnerships | $ | 238,812 | | | $ | 142,308 | | | |
| Commercial mortgage loans | 174,517 | | | 158,823 | | | |
| Common stock | 19,869 | | | 10,257 | | | |
| Convertible notes | 2,850 | | | 3,950 | | | |
| Company-owned life insurance | 200,000 | | | — | | | |
Total | $ | 636,048 | | | $ | 315,338 | | | |
Since fixed maturities represent such a significant portion of our investment portfolio, 89% of total amortized cost net of allowance for credit losses at December 31, 2024, the remainder of the discussion of portfolio composition will focus on fixed maturities. Selected information concerning the fixed maturity portfolio is as follows:
Fixed Maturity Portfolio Selected Information | | | | | | | | | | | |
| At December 31, |
| 2024 | | 2023 |
Average annual effective yield(1) | 5.25% | | 5.23% |
| Average life, in years, to: | | | |
Next call(2) | 15.1 | | 14.6 |
Maturity(2) | 19.3 | | 18.6 |
| Effective duration to: | | | |
Next call(2,3) | 8.8 | | 9.0 |
Maturity(2,3) | 10.6 | | 10.7 |
(1)Tax-equivalent basis. The yield on tax-exempt securities is adjusted to produce a yield equivalent to the pretax yield on taxable securities.
(2)Globe Life calculates the average life and duration of the fixed maturity portfolio two ways:
(a) based on the next call date which is the next call date for callable bonds and the maturity date for noncallable bonds; and
(b) based on the maturity date of all bonds, whether callable or not.
(3)Effective duration is a measure of the price sensitivity of a fixed-income security to a 1% change in interest rates.
GLOBE LIFE INC.
Management's Discussion & Analysis
Credit Risk Sensitivity. The following tables summarize certain information about the major corporate sectors and security types held in our fixed maturity portfolio at December 31, 2024 and 2023.
Fixed Maturities by Sector
December 31, 2024
(Dollar amounts in thousands) | | | | | | | | | | | | | | | | | | | | | | | | | | | | | | | | | | | | | | |
| Below Investment Grade | | Total Fixed Maturities | | % of Total Fixed Maturities |
| | Amortized
Cost, net | Gross
Unrealized
Gains | Gross
Unrealized
Losses | Fair
Value | | Amortized
Cost, net | Gross
Unrealized
Gains | Gross
Unrealized
Losses | Fair
Value | | At Amortized Cost, net | At Fair Value |
|
| Corporates: | | | | | | | | | | | | |
| Financial | | | | | | | | | | | | |
| Insurance - life, health, P&C | $ | 38,584 | | $ | 32 | | $ | (7,801) | | $ | 30,815 | | | $ | 2,817,161 | | $ | 49,928 | | $ | (206,943) | | $ | 2,660,146 | | | 15 | | 15 | |
| Banks | 65,718 | | 254 | | (3,506) | | 62,466 | | | 1,026,367 | | 17,023 | | (59,795) | | 983,595 | | | 6 | | 6 | |
| Other financial | 74,973 | | — | | (14,917) | | 60,056 | | | 1,162,847 | | 15,647 | | (146,305) | | 1,032,189 | | | 6 | | 6 | |
| Total financial | 179,275 | | 286 | | (26,224) | | 153,337 | | | 5,006,375 | | 82,598 | | (413,043) | | 4,675,930 | | | 27 | | 27 | |
| Industrial | | | | | | | | | | | | |
| Energy | 44,580 | | — | | (5,410) | | 39,170 | | | 1,318,501 | | 33,825 | | (77,700) | | 1,274,626 | | | 7 | | 7 | |
| Basic materials | — | | — | | — | | — | | | 1,147,932 | | 20,121 | | (91,699) | | 1,076,354 | | | 6 | | 6 | |
| Consumer, non-cyclical | 640 | | — | | (3) | | 637 | | | 2,087,181 | | 11,222 | | (255,241) | | 1,843,162 | | | 11 | | 11 | |
| Other industrials | 25,000 | | — | | (4,796) | | 20,204 | | | 1,089,118 | | 14,847 | | (108,283) | | 995,682 | | | 6 | | 6 | |
| Communications | — | | — | | — | | — | | | 832,355 | | 12,085 | | (90,817) | | 753,623 | | | 4 | | 4 | |
| Transportation | — | | — | | — | | — | | | 572,829 | | 9,800 | | (38,953) | | 543,676 | | | 3 | | 3 | |
| Consumer. cyclical | 128,674 | | 331 | | (28,378) | | 100,627 | | | 492,653 | | 3,113 | | (75,592) | | 420,174 | | | 3 | | 3 | |
| Technology | 50,278 | | — | | (2,419) | | 47,859 | | | 341,407 | | 597 | | (67,045) | | 274,959 | | | 2 | | 2 | |
| Total industrial | 249,172 | | 331 | | (41,006) | | 208,497 | | | 7,881,976 | | 105,610 | | (805,330) | | 7,182,256 | | | 42 | | 42 | |
| Utilities | 58,996 | | 22 | | (6,797) | | 52,221 | | | 2,081,366 | | 39,716 | | (118,007) | | 2,003,075 | | | 11 | | 12 | |
Total corporates | 487,443 | | 639 | | (74,027) | | 414,055 | | | 14,969,717 | | 227,924 | | (1,336,380) | | 13,861,261 | | | 80 | | 81 | |
| States, municipalities, and political divisions: | | | | | | | | | | | | |
| General obligations | — | | — | | — | | — | | | 909,765 | | 3,695 | | (177,021) | | 736,439 | | | 5 | | 4 | |
| Revenues | — | | — | | — | | — | | | 2,391,136 | | 16,967 | | (357,738) | | 2,050,365 | | | 13 | | 12 | |
Total states, municipalities, and political divisions | — | | — | | — | | — | | | 3,300,901 | | 20,662 | | (534,759) | | 2,786,804 | | | 18 | | 16 | |
| Other fixed maturities: | | | | | | | | | | | | |
| Government (U.S. and foreign) | — | | — | | — | | — | | | 438,636 | | 19 | | (51,664) | | 386,991 | | | 2 | | 2 | |
| Collateralized debt obligations | 36,923 | | 5,943 | | — | | 42,866 | | | 36,923 | | 5,943 | | — | | 42,866 | | | — | | — | |
| Other asset-backed securities | 4,754 | | 10 | | — | | 4,764 | | | 79,237 | | 39 | | (2,186) | | 77,090 | | | — | | 1 | |
Total fixed maturities | $ | 529,120 | | $ | 6,592 | | $ | (74,027) | | $ | 461,685 | | | $ | 18,825,414 | | $ | 254,587 | | $ | (1,924,989) | | $ | 17,155,012 | | | 100 | 100 |
GLOBE LIFE INC.
Management's Discussion & Analysis
Fixed Maturities by Sector
December 31, 2023
(Dollar amounts in thousands) | | | | | | | | | | | | | | | | | | | | | | | | | | | | | | | | | | | | | | |
| Below Investment Grade | | Total Fixed Maturities | | % of Total Fixed Maturities |
| | Amortized
Cost | Gross
Unrealized
Gains | Gross
Unrealized
Losses | Fair
Value | | Amortized
Cost | Gross
Unrealized
Gains | Gross
Unrealized
Losses | Fair
Value | | At Amortized Cost, net | At Fair Value |
|
| Corporates: | | | | | | | | | | | | |
| Financial | | | | | | | | | | | | |
| Insurance - life, health, P&C | $ | 107,010 | | $ | — | | $ | (12,472) | | $ | 94,538 | | | $ | 2,413,685 | | $ | 61,715 | | $ | (163,455) | | $ | 2,311,945 | | | 13 | | 13 | |
| Banks | 36,906 | | — | | (4,401) | | 32,505 | | | 1,327,272 | | 25,019 | | (71,714) | | 1,280,577 | | | 7 | | 7 | |
| Other financial | 74,965 | | — | | (25,255) | | 49,710 | | | 1,287,194 | | 25,634 | | (153,171) | | 1,159,657 | | | 7 | | 7 | |
| Total financial | 218,881 | | — | | (42,128) | | 176,753 | | | 5,028,151 | | 112,368 | | (388,340) | | 4,752,179 | | | 27 | | 27 | |
| Industrial | | | | | | | | | | | | |
| Energy | 44,652 | | — | | (7,481) | | 37,171 | | | 1,446,480 | | 58,637 | | (62,324) | | 1,442,793 | | | 8 | | 8 | |
| Basic materials | — | | — | | — | | — | | | 1,166,385 | | 39,248 | | (64,501) | | 1,141,132 | | | 6 | | 6 | |
| Consumer, non-cyclical | — | | — | | — | | — | | | 2,096,651 | | 32,071 | | (160,828) | | 1,967,894 | | | 11 | | 11 | |
| Other industrials | 5,185 | | 110 | | — | | 5,295 | | | 1,101,059 | | 32,541 | | (78,817) | | 1,054,783 | | | 6 | | 6 | |
| Communications | — | | — | | — | | — | | | 868,131 | | 21,006 | | (73,323) | | 815,814 | | | 4 | | 5 | |
| Transportation | 8,403 | | — | | (415) | | 7,988 | | | 534,468 | | 21,113 | | (24,649) | | 530,932 | | | 3 | | 3 | |
| Consumer. cyclical | 136,343 | | — | | (25,059) | | 111,284 | | | 515,169 | | 4,941 | | (57,735) | | 462,375 | | | 3 | | 3 | |
| Technology | 32,543 | | 625 | | — | | 33,168 | | | 280,668 | | 3,521 | | (44,670) | | 239,519 | | | 1 | | 1 | |
| Total industrial | 227,126 | | 735 | | (32,955) | | 194,906 | | | 8,009,011 | | 213,078 | | (566,847) | | 7,655,242 | | | 42 | | 43 | |
| Utilities | 34,698 | | 722 | | (1,523) | | 33,897 | | | 2,017,967 | | 73,925 | | (94,130) | | 1,997,762 | | | 11 | | 11 | |
| Total corporates | 480,705 | | 1,457 | | (76,606) | | 405,556 | | | 15,055,129 | | 399,371 | | (1,049,317) | | 14,405,183 | | | 80 | | 81 | |
| States, municipalities, and political divisions: | | | | | | | | | | | | |
| General obligations | — | | — | | — | | — | | | 887,013 | | 8,526 | | (135,003) | | 760,536 | | | 4 | | 4 | |
| Revenues | — | | — | | — | | — | | | 2,409,292 | | 38,820 | | (268,326) | | 2,179,786 | | | 13 | | 12 | |
Total states, municipalities, and political divisions | — | | — | | — | | — | | | 3,296,305 | | 47,346 | | (403,329) | | 2,940,322 | | | 17 | | 16 | |
| Other fixed maturities: | | | | | | | | | | | | |
| Government (U.S., municipal, and foreign) | — | | — | | — | | — | | | 442,903 | | 8 | | (42,654) | | 400,257 | | | 2 | | 2 | |
| Collateralized debt obligations | 37,110 | | 5,036 | | — | | 42,146 | | | 37,110 | | 5,036 | | — | | 42,146 | | | — | | — | |
| Other asset-backed securities | 11,696 | | — | | (409) | | 11,287 | | | 86,352 | | 3 | | (4,057) | | 82,298 | | | 1 | | 1 | |
| Total fixed maturities | $ | 529,511 | | $ | 6,493 | | $ | (77,015) | | $ | 458,989 | | | $ | 18,917,799 | | $ | 451,764 | | $ | (1,499,357) | | $ | 17,870,206 | | | 100 | 100 |
GLOBE LIFE INC.
Management's Discussion & Analysis
Corporate securities, which consist of bonds and redeemable preferred stocks, were the largest component of the fixed maturity portfolio as of December 31, 2024, representing 80% of amortized cost, net, and 81% of fair value. The remainder of the portfolio is invested primarily in securities issued by the U.S. government and U.S. municipalities. The Company holds insignificant amounts in foreign government bonds, collateralized debt obligations, asset-backed securities, and mortgage-backed securities. Corporate securities are diversified over a variety of industry sectors and issuers. At December 31, 2024, the total fixed maturity portfolio consisted of 1,014 issuers.
Fixed maturities had a fair value of $17.2 billion at December 31, 2024, compared with $17.9 billion at December 31, 2023. The net unrealized loss position in the fixed-maturity portfolio increased from $1.0 billion at December 31, 2023 to $1.7 billion at December 31, 2024 due to an increase in market rates during the period.
For more information about our fixed maturity portfolio by component at December 31, 2024 and December 31, 2023, including a discussion of allowance for credit losses, an analysis of unrealized investment losses, and a schedule of maturities, see Note 4—Investments.
An analysis of the fixed maturity portfolio by composite quality rating at December 31, 2024 and December 31, 2023, is shown in the following tables. The company uses the NAIC designation for credit quality ratings. The NAIC designation is generally determined using the second lowest rating available from nationally recognized statistical rating organizations (“NRSRO”) when 3 or more ratings are available and the lowest rating when 2 or fewer rating are available. When NRSRO ratings are unavailable the rating may be assigned by the Securities Valuation Office (“SVO”) of the NAIC.
Fixed Maturities by Rating
At December 31, 2024
(Dollar amounts in thousands) | | | | | | | | | | | | | | | | | | | | | | | | | | | | | |
| Amortized Cost, net | | % of Total | | Fair
Value | | % of Total | | Average Composite Quality Rating on Amortized Cost, net |
| Investment grade: | | | | | | | | | |
| AAA | $ | 968,220 | | | 5 | | | $ | 855,165 | | | 5 | | | |
| AA | 3,225,044 | | | 17 | | | 2,691,908 | | | 15 | | | |
| A | 5,508,446 | | | 29 | | | 5,147,203 | | | 30 | | | |
| BBB+ | 3,267,101 | | | 17 | | | 3,040,313 | | | 18 | | | |
| BBB | 4,087,323 | | | 22 | | | 3,799,696 | | | 22 | | | |
| BBB- | 1,240,160 | | | 7 | | | 1,159,042 | | | 7 | | | |
Total investment grade | 18,296,294 | | | 97 | | | 16,693,327 | | | 97 | | | A- |
| | | | | | | | | |
| Below investment grade: | | | | | | | | | |
| BB | 397,823 | | | 2 | | | 349,028 | | | 2 | | | |
| B | 92,176 | | | 1 | | | 67,593 | | | 1 | | | |
| Below B | 39,121 | | | — | | | 45,064 | | | — | | | |
Total below investment grade | 529,120 | | | 3 | | | 461,685 | | | 3 | | | BB- |
| $ | 18,825,414 | | | 100 | | | $ | 17,155,012 | | | 100 | | | |
| | | | | | | | | |
Weighted average composite quality rating | A- |
GLOBE LIFE INC.
Management's Discussion & Analysis
Fixed Maturities by Rating
At December 31, 2023
(Dollar amounts in thousands) | | | | | | | | | | | | | | | | | | | | | | | | | | | | | |
| Amortized
Cost, net | | % of Total | | Fair Value | | % of Total | | Average Composite Quality Rating on Amortized Cost |
| Investment grade: | | | | | | | | | |
| AAA | $ | 952,822 | | | 5 | | | $ | 880,729 | | | 5 | | | |
| AA | 3,179,618 | | | 17 | | | 2,789,626 | | | 15 | | | |
| A | 5,118,085 | | | 27 | | | 4,976,280 | | | 28 | | | |
| BBB+ | 3,615,102 | | | 19 | | | 3,495,898 | | | 19 | | | |
| BBB | 4,278,786 | | | 23 | | | 4,056,833 | | | 23 | | | |
| BBB- | 1,243,875 | | | 6 | | | 1,211,851 | | | 7 | | | |
Total investment grade | 18,388,288 | | | 97 | | | 17,411,217 | | | 97 | | | A- |
| | | | | | | | | |
| Below investment grade: | | | | | | | | | |
| BB | 450,503 | | | 3 | | | 376,912 | | | 3 | | | |
| B | 37,896 | | | — | | | 35,929 | | | — | | | |
| Below B | 41,112 | | | — | | | 46,148 | | | — | | | |
Total below investment grade | 529,511 | | | 3 | | | 458,989 | | | 3 | | | BB |
| $ | 18,917,799 | | | 100 | | | $ | 17,870,206 | | | 100 | | | |
| | | | | | | | | |
Weighted average composite quality rating | A- |
The overall quality rating of the portfolio is A-, the same as of year end 2023. Fixed maturities rated BBB are 46% of the total portfolio at December 31, 2024, down from 48% at December 31, 2023. While this ratio is high relative to our peers, it is at its lowest level since 2007 and we have limited exposure to higher-risk assets such as derivatives, equities, and asset-backed securities. Additionally, the Company does not participate in securities lending and has no off-balance sheet investments as of December 31, 2024. Of our fixed maturity purchases, BBB securities generally provide the Company with the best risk-adjusted, capital-adjusted returns largely due to our ability to hold securities to maturity regardless of fluctuations in interest rates or equity markets.
An analysis of changes in our portfolio of below-investment grade fixed maturities at amortized cost, net of allowance for credit losses is as follows:
Below-Investment Grade Fixed Maturities
(Dollar amounts in thousands) | | | | | | | | | | | |
| Year Ended
December 31, |
| 2024 | | 2023 |
Balance at beginning of period | $ | 529,511 | | | $ | 542,497 | |
| Downgrades by rating agencies | 101,018 | | | 117,731 | |
| Upgrades by rating agencies | (76,754) | | | (32,540) | |
| Dispositions | (40,907) | | | (95,060) | |
| Acquisitions | 20,292 | | | — | |
| Provision for credit losses | (3,280) | | | (6,811) | |
| Amortization and other | (760) | | | 3,694 | |
Balance at end of period | $ | 529,120 | | | $ | 529,511 | |
Our investment policy calls for investing primarily in fixed maturities that are investment grade and meet our quality and yield objectives. Thus, the balance of below-investment grade issues is primarily the result of ratings
GLOBE LIFE INC.
Management's Discussion & Analysis
downgrades of existing holdings. Below-investment grade bonds at amortized cost, net of allowance for credit losses, were 3% of total fixed maturities at amortized cost as of December 31, 2024. Globe Life invests long term and as such, one of our key criterion in our investment process is to select issuers that are anticipated to weather multiple financial cycles.
OPERATING EXPENSES
Operating expenses are classified into two categories: insurance administrative expenses and expenses of the Parent Company. Insurance administrative expenses generally include expenses incurred after a policy has been issued. As these expenses relate to premium for a given period, management measures the expenses as a percentage of premium income. The Company also views stock-based compensation expense as a Parent Company expense. Expenses associated with the issuance of our insurance policies are reflected as acquisition expenses and included in the determination of underwriting margin.
The following table is an analysis of operating expenses for the three years ended December 31, 2024.
Operating Expenses Selected Information
(Dollar amounts in thousands) | | | | | | | | | | | | | | | | | | | | | | | | | | | | | | | | | | | |
| | 2024 | | 2023 | | 2022 |
| | Amount | | % of
Premium | | Amount | | % of
Premium | | Amount | | % of
Premium |
| Insurance administrative expenses: | | | | | | | | | | | |
| Salaries | $ | 129,369 | | | 2.8 | | | $ | 119,699 | | | 2.7 | | | $ | 129,711 | | | 3.0 | |
| Other employee costs | 36,176 | | | 0.8 | | | 35,905 | | | 0.8 | | | 42,319 | | | 1.0 | |
| Information technology costs | 80,555 | | | 1.7 | | | 64,998 | | | 1.5 | | | 55,526 | | | 1.3 | |
| Legal costs | 30,478 | | | 0.6 | | | 15,335 | | | 0.3 | | | 12,056 | | | 0.2 | |
| Other administrative costs | 65,852 | | | 1.4 | | | 65,224 | | | 1.5 | | | 59,729 | | | 1.4 | |
| Total insurance administrative expenses | 342,430 | | | 7.3 | | | 301,161 | | | 6.8 | | | 299,341 | | | 6.9 | |
| | | | | | | | | | | |
| Parent company expense | 12,400 | | | | | 10,866 | | | | | 11,156 | | | |
| Stock compensation expense | 40,118 | | | | | 30,736 | | | | | 35,650 | | | |
| | | | | | | | | | | |
| Legal proceedings | 21,575 | | | | | 900 | | | | | 2,496 | | | |
| Non-operating expenses | 2,620 | | | | | 4,170 | | | | | 5,311 | | | |
| | | | | | | | | | | |
| $ | 419,143 | | | | | $ | 347,833 | | | | | $ | 353,954 | | | |
| | | | | | | | | | | |
| 2024 | | 2023 | | 2022 |
| Amount | | % | | Amount | | % | | Amount | | % |
| Total insurance administrative expenses increase (decrease) over prior year | $ | 41,269 | | | 13.7 | | | $ | 1,820 | | | 0.6 | | | $ | 27,710 | | | 10.2 | |
| Total operating expenses increase (decrease) over prior year | 71,310 | | | 20.5 | | | (6,121) | | | (1.7) | | | 31,925 | | | 9.9 | |
Total operating expenses for December 31, 2024 increased in comparison with the prior year primarily due to increases in insurance administrative expenses as well as stock compensation and legal proceedings. Insurance administrative expenses increased $41.3 million primarily due to higher information technology costs, legal costs including compliance and security and employee costs, which includes salaries and other. Insurance administrative expenses as a percent of premium were 7.3% for the year ended December 31, 2024 compared to 6.8% for the same period in 2023.
GLOBE LIFE INC.
Management's Discussion & Analysis
SHARE REPURCHASES
Globe Life has an ongoing share repurchase program that began in 1986. The share repurchase program is reviewed with the Board of Directors by management quarterly, and continues indefinitely unless and until the Board of Directors decides to suspend, terminate or modify the program. On November 18, 2024, the Board of Directors authorized the repurchase of up to $1.8 billion under the Company's existing share repurchase program. Management generally determines the amount of repurchases based on the amount of the excess cash flows and other available sources after the payment of dividends to the Parent Company shareholders, general market conditions, and other alternative uses. Since implementing our share repurchase program in 1986, we have used $10.3 billion to repurchase Globe Life Inc. common shares after determining that the repurchases provide a greater risk-adjusted after-tax return than other investment alternatives.
Excess cash flow at the Parent Company is primarily comprised of dividends received from the insurance subsidiaries less interest expense paid on its debt and other limited operating activities. Additionally, when stock options are exercised, proceeds from these exercises and the resulting tax benefit are used to repurchase additional shares on the open market to minimize dilution as a result of the option exercises.
The following table summarizes share repurchases for each of the last three years.
Analysis of Share Purchases
(Amounts in thousands) | | | | | | | | | | | | | | | | | | | | | | | | | | | | | | | | | | | |
| | 2024 | | 2023 | | 2022 |
| Purchases with: | Shares | | Amount | | Shares | | Amount | | Shares | | Amount |
Excess cash flow at the Parent Company(1) | 10,086 | | | $ | 945,637 | | | 3,369 | | | $ | 380,103 | | | 3,322 | | | $ | 335,145 | |
| Option exercise proceeds | 501 | | | 48,026 | | | 1,080 | | | 127,155 | | | 1,103 | | | 119,493 | |
| Total | 10,587 | | | $ | 993,663 | | | 4,449 | | | $ | 507,258 | | | 4,425 | | | $ | 454,638 | |
(1)Excludes excise tax on the repurchase of treasury stock of $8 million in 2024, $4 million in 2023, and $0 in 2022.
During 2024, the amount of share repurchases was higher as we accelerated repurchases given favorable market conditions and the use of additional capital raised during the year. Refer to Note 12—Debt for further details. Throughout the remainder of this discussion, share repurchases will only refer to those made from excess cash flow at the Parent Company and exclude anti-dilutive share repurchases related to stock options exercised.
FINANCIAL CONDITION
Liquidity. Liquidity provides Globe Life with the ability to meet on demand the cash commitments required to support our business operations and meet our financial obligations. Our liquidity is primarily derived from multiple sources: positive cash flow from operations, a portfolio of marketable securities, a revolving credit facility, commercial paper, and advances from the Federal Home Loan Bank.
Insurance Subsidiary Liquidity. The operations of our insurance subsidiaries have historically generated substantial cash inflows in excess of immediate cash needs. Cash inflows for the insurance subsidiaries primarily include premium and investment income. In addition to investment income, maturities and scheduled repayments in the investment portfolio are cash inflows. Cash outflows from operations include policy benefit payments, commissions, administrative expenses, and taxes. A portion of cash inflows in the current year will provide for the payment of future policy benefits and are invested primarily in long-term fixed maturities as they better match the long-term nature of these obligations. Excess cash available from the insurance subsidiaries’ operations is generally distributed as a dividend to the Parent Company, subject to regulatory restrictions. The dividends are generally paid in amounts equal to the subsidiaries’ prior year statutory net income excluding realized capital gains. While the insurance subsidiaries annually generate more operating cash inflows than cash outflows, the companies also have the entire available-for-sale fixed maturity investment portfolio available to create additional cash flows if required.
Four of our insurance subsidiaries are members of the FHLB of Dallas. FHLB membership provides the insurance subsidiaries with access to various low-cost collateralized borrowings and funding agreements. While not the only
GLOBE LIFE INC.
Management's Discussion & Analysis
source of liquidity, the FHLB could provide the insurance subsidiaries with an additional source of liquidity, if needed. Refer to Note 12—Debt for further details.
Parent Company Liquidity. An important source of Parent Company liquidity is the dividends from its insurance subsidiaries. These dividends are received throughout the year and are used by the Parent Company to pay dividends on common and preferred stock, interest and principal repayment requirements on Parent Company debt, and operating expenses of the Parent Company.
| | | | | | | | | | | | | | | | | | | | | | | |
| Year Ended December 31, |
| (Amounts in Thousands) |
| Projected 2025 | | 2024 | | 2023 | | 2022 |
| Liquidity Sources: | | | | | | | |
| Dividends from Subsidiaries | $ | 724,000 | | | $ | 692,690 | | | $ | 459,535 | | | $ | 407,042 | |
Excess Cash Flows(1) | 810,000 | | | 455,013 | | | 416,081 | | | 358,981 | |
(1)Excess cash flows are reported gross of shareholder dividends. For the year ended December 31, 2024, 2023, and 2022, shareholder dividends were $85 million, $84 million, and $81 million, respectively.
For more information on the restrictions on the payment of dividends by subsidiaries, see the Restrictions section of Note 13—Shareholders' Equity. Although these restrictions exist, dividend availability from subsidiaries historically has been more than sufficient for the cash flow needs of the Parent Company.
Dividends from subsidiaries and excess cash flows are projected to be higher in 2025 than in 2024 primarily due to improved earnings from favorable mortality trends and growth in business, as well as positive impacts from lower reserve increases under statutory accounting impacting the 2024 statutory earnings that derive the 2025 dividends. Additional sources of liquidity for the Parent Company are cash, intercompany receivables, intercompany borrowings, public debt markets, term loans, and a revolving credit facility. See Schedule II for more information. The credit facility is discussed below.
Short-Term Borrowings. An additional source of Parent Company liquidity is a credit facility with a group of lenders. The facility was amended on March 29, 2024, resulting in an increased capacity of $250 million. The facility allows for unsecured borrowings and stand-by letters of credit up to $1 billion, which could be increased up to $1.25 billion. While the Parent Company may request the increase, it is not guaranteed. The updated five-year credit agreement will mature on March 29, 2029. Up to $250 million in letters of credit can be issued against the facility. The facility serves as a back-up line of credit for a commercial paper program under which commercial paper may be issued at any time, with total commercial paper outstanding not to exceed the facility maximum less any letters of credit issued. Interest charged on the commercial paper program resembles variable rate debt due to its short term nature. As of December 31, 2024, we had available $466 million of additional borrowing capacity under this facility, compared with $316 million a year earlier. Globe Life has consistently been able to issue commercial paper as needed during the three years ended December 31, 2024. As of December 31, 2024, the Parent Company was in full compliance with all covenants related to the aforementioned debt.
As a part of the credit facility, Globe Life has stand-by letters of credit. These letters are issued among our insurance subsidiaries, one of which is an offshore captive reinsurer, and have no impact on company obligations as a whole. Any future regulatory changes that restrict the use of off-shore captive reinsurers might require Globe Life to obtain third-party financing, which could cause an increase in financing costs. On March 29, 2023, the letters of credit were amended to reduce the amount outstanding from $125 million to $115 million. The outstanding letters of credit remained at $115 million at December 31, 2024.
Through internally generated cash flow and the credit facility the Parent Company expects to have readily available funds for 2025 and the foreseeable future to conduct its operations and to maintain target capital ratios in the insurance subsidiaries. In the unlikely event that more liquidity is needed, the Company could generate additional funds through multiple sources including, but not limited to, the issuance of debt, an additional short-term credit facility, and intercompany borrowings. Refer to Note 5—Commitments and Contingencies and the discussion surrounding the Company's obligations over the next five years. As noted above, the Parent Company had access
GLOBE LIFE INC.
Management's Discussion & Analysis
to $90 million of liquid assets available as of December 31, 2024. This liquidity is available to the Company in the event additional funds are needed to support the targeted capital levels within our insurance subsidiaries.
Consolidated Liquidity. Consolidated net cash inflows provided from operations were $1.40 billion in 2024, compared with $1.48 billion in 2023. The decrease is attributable to routine fluctuations in the settlement of operating activities. In addition to cash inflows from operations, our insurance companies received proceeds from dispositions of fixed maturities, mortgage loans, and other long-term investments in the amount of $1.52 billion in 2024. The Company sold shorter term securities and reinvested in longer term investments, extending duration and taking advantage of higher current interest rates during the year ended December 31, 2024. As noted under the caption Credit Facility in Note 12—Debt, the Parent Company has in place a revolving credit facility. The insurance companies have no additional outstanding credit facilities.
Cash and short-term investments were $250 million at the end of 2024 compared with $185 million at the end of 2023. In addition to these liquid assets, $17.2 billion (fair value at December 31, 2024) of fixed income securities are available for sale in the event of an unexpected need. Approximately $1.3 billion, at fair value, are pledged for outstanding FHLB advances and reinsurance. Further, approximately 98% of our fixed income securities are publicly traded, freely tradable under SEC Rule 144, or qualified for resale under SEC Rule 144A. While our fixed income securities are classified as available for sale, we have the ability and general intent to hold any securities to recovery or maturity. Our strong cash flows from operations, ongoing investment maturities, and available liquidity under our credit facility make any need to sell securities for liquidity highly unlikely.
Capital Resources. The Parent Company's capital structure consists of short-term debt (the commercial paper facility and current maturities of long-term debt), long-term debt, and shareholders’ equity. It does not include short-term FHLB borrowings, which are obligations of the insurance subsidiaries and typically repaid over the course of the year.
Debt: The carrying value of the long-term debt was $2.3 billion at December 31, 2024 and $1.6 billion at December 31, 2023. A complete analysis and description of long-term debt issues outstanding is presented in Note 12—Debt.
Financing costs consist primarily of interest on our various debt instruments. The table below presents the components of financing costs and reconciles interest expense per the Consolidated Statements of Operations.
Analysis of Financing Costs
(Dollar amounts in thousands) | | | | | | | | | | | | | | | | | |
| 2024 | | 2023 | | 2022 |
| Interest on debt | $ | 77,258 | | | $ | 72,641 | | | $ | 80,481 | |
| Interest on term loan | 13,823 | | | 7,684 | | | — | |
| Interest on short-term debt | 35,979 | | | 21,958 | | | 9,875 | |
| Other | 32 | | | 33 | | | 39 | |
Financing costs | $ | 127,092 | | | $ | 102,316 | | | $ | 90,395 | |
In 2024, financing costs increased 24% compared with the prior year. The increase in financing costs is primarily due to higher average balances in the current year compared to the prior year. We increased durations on commercial paper issuances during 2024 due to market considerations. More information on our debt transactions is disclosed in the Financial Condition section of this report and in Note 12—Debt.
Subsidiary Capital: The National Association of Insurance Commissioners (NAIC) has established a risk-based factor approach for determining threshold risk-based capital levels for all insurance companies. This approach was designed to assist the regulatory bodies in identifying companies that may require regulatory attention. A Risk-Based Capital (RBC) ratio is typically determined by dividing adjusted total statutory capital by the amount of risk-based capital determined using the NAIC’s factors. If a company’s RBC ratio approaches two times the RBC amount, the company must file a plan with the NAIC for improving its capital levels (this level is commonly referred to as “Company Action Level” RBC). Companies typically hold a multiple of the Company Action Level RBC depending on their particular business needs and risk profile.
GLOBE LIFE INC.
Management's Discussion & Analysis
Our goal is to maintain statutory capital within our insurance subsidiaries at levels necessary to support our current ratings. For 2025, Globe Life has targeted a consolidated Company Action Level RBC ratio of 300% to 320%. The Company has concluded that this capital level is more than adequate and sufficient to support its current ratings, given the nature of its business and its risk profile. For 2024, our consolidated Company Action Level RBC ratio is expected to be approximately 310%. The Parent Company is committed to maintaining the targeted consolidated RBC ratio at its insurance subsidiaries and has sufficient liquidity available to provide additional capital if necessary.
Shareholder's Equity: As noted under the caption Analysis of Share Purchases within this report, we have an ongoing share repurchase program.
Globe Life has continually increased the quarterly dividend on its common shares over the past three years.
| | | | | | | | | | | | | | | | | | | | | | | |
| Year Ended December 31, |
| Projected 2025 | | 2024 | | 2023 | | 2022 |
| Quarterly dividend by annual year | $ | 0.2700 | | | $ | 0.2400 | | | $ | 0.2250 | | | $ | 0.2075 | |
Shareholders’ equity was $5.3 billion at December 31, 2024. This compares to $4.5 billion at December 31, 2023, an increase of $819 million or 18%. Shareholders' equity increased $537 million, or 14%, during 2023 from $3.9 billion in 2022.
During 2024, shareholders’ equity increased as a result of net income of $1.1 billion, but was offset by share repurchases of $946 million and an additional $48 million in share repurchases to offset the dilution from stock option exercises. Additionally, the balance of AOCI increased $743 million primarily due to increased interest rates and discount rates over the period. During 2023, shareholders' equity increased as a result of net income of $971 million, but was offset by share repurchases of $380 million and an additional $127 million in share repurchases to offset the dilution from stock option exercises. Additionally, the balance of AOCI increased $18 million due to increased interest rates and discount rates over the period.
We plan to use excess cash available at the Parent Company as efficiently as possible in the future. Excess cash flow, as we define it, results primarily from the dividends received by the Parent Company from its insurance subsidiaries less the interest paid on debt. The cash received by the Parent Company from our insurance subsidiaries is after they have made substantial investments during the year to grow the business. Possible uses of excess cash flow include, but are not limited to, share repurchases, acquisitions, shareholder dividend payments, investments in securities, or repayment of short-term debt. We will determine the best use of excess cash after ensuring that targeted capital levels are maintained in our insurance subsidiaries. If market conditions are favorable, we currently expect that share repurchases will continue to be a primary use of those funds.
Future policy benefits are computed using current discount rates with the impact of changes in discount rates included in accumulated other comprehensive income. Additionally, the liability for future policy benefits is calculated using net premiums rather than gross premiums. Given that gross premiums are considerably higher than net premiums for our business, as seen in Note 6—Policy Liabilities, the measurement of the liability is higher than what it would be had it been computed using gross premiums. This is an important consideration when analyzing shareholders' equity.
We maintain a significant available-for-sale fixed maturity portfolio to support our insurance policy liabilities. Current accounting guidance requires that we revalue our portfolio to fair market value at the end of each accounting period. The period-to-period changes in fair value, net of their associated impact on income tax, are reflected directly in shareholders’ equity. Changes in the fair value of the portfolio can result from changes in market rates.
While a majority of invested assets are revalued, accounting rules do not permit interest-bearing insurance policy liabilities to be valued at fair value in a consistent manner as that of assets, with changes in value applied directly to shareholders’ equity. Due to the size of our policy liabilities in relation to our shareholders’ equity, an inconsistency exists in measurement, which may have a material impact on the reported value of shareholders’ equity. Fluctuations in interest rates cause undue volatility in the period-to-period presentation of our shareholders’ equity, capital structure, and financial ratios. Due to the long-term nature of our fixed maturity investments and liabilities
GLOBE LIFE INC.
Management's Discussion & Analysis
and the strong cash flows consistently generated by our insurance subsidiaries, we have the ability to hold our securities to maturity. As such, we do not expect to incur losses due to fluctuations in market value of fixed maturities caused by market rate changes and temporarily illiquid markets. Accordingly, our management, credit rating agencies, lenders, many industry analysts, and certain other financial statement users prefer to remove the effect of this accounting rule when analyzing our balance sheet, capital structure, and financial ratios.
Financial Strength Ratings. The financial strength of our major insurance subsidiaries is rated by Standard & Poor’s and A. M. Best. The following table presents these ratings for our five largest insurance subsidiaries at December 31, 2024.
| | | | | | | | | | | |
| Standard
& Poor’s | | A.M.
Best |
| Liberty National Life Insurance Company | AA- | | A |
| Globe Life And Accident Insurance Company | AA- | | A |
| United American Insurance Company | AA- | | A |
| American Income Life Insurance Company | AA- | | A |
| Family Heritage Life Insurance Company of America | NR | | A |
A.M. Best states that it assigns an A (Excellent) rating to insurance companies that have, in its opinion, an excellent ability to meet their ongoing insurance obligations.
The AA financial strength rating category is assigned by Standard & Poor’s Corporation (S&P) to those insurers which have very strong capacity to meet its financial commitments. The plus sign (+) or minus sign (-) shows the relative standing within the major rating category.
OTHER ITEMS
CRITICAL ACCOUNTING ESTIMATES
Application of Critical Accounting Estimates. Critical accounting estimates are those estimates made in accordance with GAAP that involve a significant level of estimation uncertainty and have had or are reasonably likely to have a material impact on the financial condition or results of operations. The preparation of financial statements in conformity with GAAP requires the application of accounting estimates that often involve a significant degree of judgment. Management reviews these key estimates and assumptions used in the preparation of financial statements on a timely basis. If management determines that modifications are necessary due to current facts and circumstances, the Company’s results of operations and financial position as reported in the consolidated financial statements could possibly change significantly. Information on our accounting policies is disclosed in Note 1—Significant Accounting Policies.
The liability for future policy benefits for traditional and limited-payment long duration life and health products comprises the vast majority of the total liability for future policy benefits for the Company. The liability is determined each reporting period based on the net level premium method. This method requires the liability for future policy benefits to be calculated as the present value of estimated future policyholder benefits and the related termination expenses, less the present value of estimated future net premiums to be collected from policyholders.
The Company reviews, and updates as necessary, its cash flow assumptions (mortality, morbidity, and lapses) used to calculate the change in the liability for future policy benefits at least annually. These cash flow assumptions are reviewed at the same time every year, or more frequently, if suggested by experience. If cash flow assumptions are
GLOBE LIFE INC.
Management's Discussion & Analysis
changed, the net premium ratio is recalculated from the original issue date, or the Transition Date, using actual experience and projected future cash flows. As cash flow assumptions are changed, the liability for future policy benefits is adjusted with changes recognized in policyholder benefits on the Consolidated Statements of Operations.
The following table illustrates the sensitivity of our liability for future policy benefits, including the corresponding pre-tax impact on OCI, and net income, as of December 31, 2024, to changes in cash flow assumptions. This information is useful in understanding the potential financial impact on our financial statements from changes in these items and the expected impact to our liability for future policy benefits. We could experience impacts that are more or less significant than noted in the following analysis; however the sensitivities provide insight regarding the direction and magnitude of those potential impacts.
| | | | | | | | | | | | | | | | | | | | | | | |
| At December 31, 2024 |
| (Dollar amounts in thousands) |
| Assumptions | Sensitivity | | Future policy benefits | | OCI(1) | | Net Income |
| Mortality | 1% increase | | $ | 40,722 | | | $ | (1,805) | | | $ | (38,917) | |
| 1% decrease | | (40,993) | | | 2,431 | | | 38,562 | |
| | | | | | | |
| Morbidity | 5% increase | | 68,461 | | | (895) | | | (67,566) | |
| 5% decrease | | (54,082) | | | 185 | | | 53,897 | |
| | | | | | | |
| Lapses | 10% increase | | (165,378) | | | 82,937 | | | 82,441 | |
| 10% decrease | | 176,216 | | | (90,799) | | | (85,417) | |
(1)Represents the associated impact to OCI from updating the net premium ratio based upon the cash flow assumptions and the remeasurement of the liability for future policy benefits using the current discount rate.
The liability for future policy benefits is discounted using a current upper-medium grade fixed-income instrument yield that reflects the duration characteristics of the liability for future policy benefits. Accordingly, the discount rate assumption is key in determining the change in the value of the liability for future benefits for long duration life and health contracts. Since the liability for future policy benefits for traditional and limited-payment long duration life and health products comprises approximately 93% of the total liability for future policy benefits, it is subject to interest rate risk. A decrease in discount rates will cause an increase in the obligation with a corresponding change in AOCI.
The following table illustrates the interest rate sensitivity of our liability for future policy benefits as of December 31, 2024. This table measures the effect of a parallel shift in discount rates on the liability. The data measures the change in reported value arising from an immediate change in rates in increments of 50 and 100 basis points, which would be recorded as a component of OCI.
Value of Liability for Future Policy Benefits
(Dollar amounts in thousands)
| | | | | | | | | | |
| | At December 31, |
Change in Discount Rates(1) | | 2024 | | |
| (200) | | $ | 27,004,267 | | | |
| (100) | | 22,070,140 | | | |
| (50) | | 20,129,615 | | | |
| 0 | | 18,457,263 | | | |
| 50 | | 17,006,840 | | | |
| 100 | | 15,741,352 | | | |
| 200 | | 13,651,611 | | | |
(1) In basis points.
GLOBE LIFE INC.
Management's Discussion & Analysis
Deferred Acquisition Costs. Certain costs of acquiring new insurance business are deferred and recorded as an asset. These costs are capitalized on a grouped contract basis and amortized over the expected term of the related contracts, and are essential for the acquisition of new insurance business.
Deferred Acquisition Costs (DAC) are amortized on a constant-level basis over the expected term of the grouped contracts, with the related expense included in amortization of deferred acquisition costs on the Consolidated Statements of Operations. The in-force metric used to compute the DAC amortization rate is annualized premium in force. The assumptions used to amortize acquisition costs include mortality, morbidity, and lapses, and are consistent with those used in calculating the liability for future policy benefits.
Value of business acquired (VOBA) is amortized on a basis that is consistent with DAC, as described above, and is subject to periodic recoverability and loss recognition testing to determine if there is a premium deficiency. These tests evaluate whether the present value of future contract-related cash flows will support the capitalized VOBA asset. These cash flows consist primarily of premium income, less benefits and expenses. The present value of these cash flows, less the reserve liability, is then compared with the unamortized balance. In the event the estimated present value of net cash flows is less, the deficiency would be recognized by a charge to earnings and either a reduction of unamortized acquisition costs or an increase in the liability for future benefits.
Policy Claims and Other Benefits Payable. This liability consists of known benefits currently payable and an estimate of claims that have been incurred but not yet reported to us. The estimate of unreported claims is based on prior experience and is made after careful evaluation of all information available to us. However, the factors upon which these estimates are based can be subject to change from historical patterns. Factors involved include the litigation environment, regulatory mandates, and the introduction of policy types for which claim patterns are not well established, and medical trend rates and medical cost inflation as they affect our health claims. Changes in these estimates, if any, are reflected in the earnings of the period in which the adjustment is made. The Company concludes that the estimates used to produce the liability for claims and other benefits, including the estimate of unsubmitted claims, are the most appropriate under the circumstances. However, there is no certainty that the resulting stated liability will be our ultimate obligation. At this time, we do not expect any change in this estimate to have a material impact on earnings or financial position consistent with our historical experience. There were no significant changes in the claims process in the current year.
Valuation of Fixed Maturities. We hold a substantial investment in high-quality fixed maturities to provide for the funding of our future policy contractual obligations over long periods of time. While these securities are generally expected to be held to maturity, they are classified as available for sale and are sold from time to time to maximize risk-adjusted, capital-adjusted returns or for other general purposes. We report this portfolio at fair value. Fair value is the price that we would expect to receive upon sale of the asset in an orderly transaction. The fair value of the fixed maturity portfolio is primarily affected by changes in interest rates in financial markets. Because of the size of our fixed maturity portfolio and the long average life, small changes in rates can have a significant effect on the portfolio and the reported financial position of the Company. This impact is disclosed in 100 basis point increments under the caption Market Risk Sensitivity in this report. However, as discussed under the caption Financial Condition in this report, the Company regards these unrealized fluctuations in value as having no meaningful impact on our actual financial condition and, as such, we remove them from consideration when viewing our financial position and financial ratios.
At times, the values of our fixed maturities can also be affected by illiquidity in the financial markets. Illiquidity may contribute to a spread widening, and accordingly to unrealized losses, on many securities that we would expect to be fully recoverable. Even though our fixed maturity portfolio is available for sale, we have the ability and general intent to hold the securities until maturity as a result of our strong and stable cash flows generated from our insurance products. Considerable information concerning the policies, procedures, classification levels, and other relevant data concerning the valuation of our fixed maturity investments is presented in Note 1—Significant Accounting Policies and in Note 4—Investments under the captions Fair Value Measurements in both notes. There were no significant changes in the valuation process in the current year.
Market Risk Sensitivity. Globe Life's investment securities are exposed to interest rate risk, meaning the effect of changes in financial market interest rates on the current fair value of the Company’s investment portfolio. Since 88% of the carrying value of our investments is attributable to fixed maturity investments and these investments are
GLOBE LIFE INC.
Management's Discussion & Analysis
predominately fixed-rate investments, the portfolio is highly subject to market risk. Declines in market interest rates generally result in the fair value of the investment portfolio rising, and increases in interest rates cause the fair value to decline. Under normal market conditions, we are not concerned about unrealized losses that are interest rate driven since we would not expect to realize them. Globe Life does not generally intend to sell the securities prior to maturity and, likely, will not be required to sell the securities prior to recovery of amortized cost. The long-term nature of our insurance policy liabilities and strong operating cash-flow substantially mitigate any future need to liquidate portions of the portfolio.
The following table illustrates the interest rate sensitivity of our fixed maturity portfolio at December 31, 2024. This table measures the effect of a parallel shift in interest rates (as represented by the U.S. Treasury curve) on the fair value of the fixed maturity portfolio. The data measures the change in fair value arising from an immediate and sustained change in interest rates in increments of 100 basis points.
Market Value of Fixed Maturity Portfolio
(Dollar amounts in thousands)
| | | | | | | | | | |
| | At December 31, |
Change in Interest Rates(1) | | 2024 | | |
| (200) | | $ | 20,877,000 | | | |
| (100) | | 18,909,000 | | | |
| 0 | | 17,155,000 | | | |
| 100 | | 15,588,000 | | | |
| 200 | | 14,186,000 | | | |
(1) In basis points.
Investments: Allowance for Credit Losses. We continually monitor our investment portfolio for investments where fair value has declined below carrying value to determine if a credit loss event has occurred. When a credit event does occur, an allowance for credit loss is recorded and the corresponding provision is recognized in the Consolidated Statements of Operations in Realized Gains or Losses. Non-credit related fluctuations in the fair value are recorded in Other Comprehensive Income. The policies and procedures that we use to evaluate and account for allowance for credit losses are disclosed in Note 1—Significant Accounting Policies and the discussions under the captions Investments and Realized Gains and Losses in this report. While every effort is made to make the best estimate of status and value with the information available regarding an allowance for credit loss, it is difficult to predict the future prospects of a distressed or impaired security.
Defined Benefit Pension Plans. We maintain funded defined benefit plans covering most full-time employees. We also have an unfunded nonqualified defined benefit plan covering a limited number of officers. Our obligations under these plans are determined actuarially based on specified actuarial assumptions. In accordance with GAAP, an expense is recorded each year as these pension obligations grow due to the increase in the service period of employees and the interest cost associated with the passage of time. These obligations are offset, at least in part, by the growth in value of the assets in the funded plans. At December 31, 2024, our gross liability under these plans was $635 million, but was offset by assets of $615 million.
The actuarial assumptions used in determining our obligations/expenses for pensions include: employee mortality and turnover, retirement age, the expected return on plan assets, projected salary increases, and the discount rate at which future obligations could be settled. Additionally, a corridor approach is used to amortize any unrecognized gains or losses outside the corridor (the standard 10% of the greater of plan PBO and fair value assets) and have an amortization service period of approximately nine years. These assumptions have an important effect on the pension obligation. A decrease in the discount rate will cause an increase in the pension obligation. A decrease in projected salary increases will cause a decrease in this obligation. Small changes in assumptions may cause significant differences in reported results for these plans. For example, a sensitivity analysis is presented below for the impact of change in the discount rate and the long-term rate of return on assets assumed on our defined benefit pension plans expense for the year 2024 and projected benefit obligation as of December 31, 2024.
GLOBE LIFE INC.
Management's Discussion & Analysis
Pension Assumptions
(Dollar amounts in thousands) | | | | | | | | | | | | | | | | | | | | |
| Assumption | | Change(1) | | Impact on Expense | | Impact on Projected Benefit Obligation |
| | | | | | |
Discount Rate(2): | | | | | | |
| Increase | | 25 | | | $ | (870) | | | $ | (19,576) | |
| Decrease | | (25) | | | 777 | | | 20,627 | |
Expected Return(3): | | | | | | |
| Increase | | 25 | | | (1,578) | | | — | |
| Decrease | | (25) | | | 1,578 | | | — | |
(1)In basis points.
(2)The discount rate for determining the net periodic benefit cost was 5.40% for 2024. The discount rate used for determining the projected benefit obligation as of December 31, 2024 was 5.81%.
(3)The expected long-term return rate assumed was 7.18% at December 31, 2024, and 6.98% in the prior year. Management considers both historical and future yields to determine the expected return.
The Company determines mortality assumptions through the use of published mortality tables that reflect broad-based studies of mortality and published longevity improvement scales.
The criteria used to determine the primary assumptions are discussed in Note 10—Postretirement Benefits. While we have used our best efforts to determine the most reliable assumptions, given the information available from Company experience, economic data, independent consultants, and other sources, we cannot be certain that actual results will be the same as expected. The assumptions are reviewed annually and revised, if necessary, based on more current information available to us. Note 10—Postretirement Benefits also contains information about pension plan assets, investment policies, and other related data. There were no significant changes in the assumptions in the current year.
Item 7A. Quantitative and Qualitative Disclosures About Market Risk
Information required by this item is found under the heading Market Risk Sensitivity in Item 7 of this report.
ITEM 8. FINANCIAL STATEMENTS AND SUPPLEMENTARY DATA
Consolidated Financial Statements Index
REPORT OF INDEPENDENT REGISTERED PUBLIC ACCOUNTING FIRM
To the Shareholders and the Board of Directors of Globe Life Inc.
Opinion on the Financial Statements
We have audited the accompanying consolidated balance sheets of Globe Life Inc. and subsidiaries (the "Company") as of December 31, 2024 and 2023, the related consolidated statements of operations, comprehensive income (loss), shareholders’ equity, and cash flows, for each of the three years in the period ended December 31, 2024, and the related notes and the schedules listed in the Index at Item 15 (collectively referred to as the "financial statements"). In our opinion, the financial statements present fairly, in all material respects, the financial position of the Company as of December 31, 2024 and 2023, and the results of its operations and its cash flows for each of the three years in the period ended December 31, 2024, in conformity with accounting principles generally accepted in the United States of America.
We have also audited, in accordance with the standards of the Public Company Accounting Oversight Board (United States) (PCAOB), the Company's internal control over financial reporting as of December 31, 2024, based on criteria established in Internal Control — Integrated Framework (2013) issued by the Committee of Sponsoring Organizations of the Treadway Commission and our report dated February 26, 2025, expressed an unqualified opinion on the Company’s internal control over financial reporting.
Basis for Opinion
These financial statements are the responsibility of the Company's management. Our responsibility is to express an opinion on the Company's financial statements based on our audits. We are a public accounting firm registered with the PCAOB and are required to be independent with respect to the Company in accordance with the U.S. federal securities laws and the applicable rules and regulations of the Securities and Exchange Commission and the PCAOB.
We conducted our audits in accordance with the standards of the PCAOB. Those standards require that we plan and perform the audit to obtain reasonable assurance about whether the financial statements are free of material misstatement, whether due to error or fraud. Our audits included performing procedures to assess the risks of material misstatement of the financial statements, whether due to error or fraud, and performing procedures that respond to those risks. Such procedures included examining, on a test basis, evidence regarding the amounts and disclosures in the financial statements. Our audits also included evaluating the accounting principles used and significant estimates made by management, as well as evaluating the overall presentation of the financial statements. We believe that our audits provide a reasonable basis for our opinion.
Critical Audit Matter
The critical audit matter communicated below is a matter arising from the current-period audit of the financial statements that was communicated or required to be communicated to the audit committee and that (1) relates to accounts or disclosures that are material to the financial statements and (2) involved our especially challenging, subjective, or complex judgments. The communication of critical audit matters does not alter in any way our opinion on the financial statements, taken as a whole, and we are not, by communicating the critical audit matter below, providing a separate opinion on the critical audit matter or on the accounts or disclosures to which it relates.
Future Policy Benefits at Current Discount Rates and Amortization of Deferred Acquisition Costs — Certain Underlying Assumptions for Certain Products – Refer to Notes 1, 6 and 7 to the Financial Statements
Critical Audit Matter Description
The Company estimates the liability for future policy benefits based on the net level premium method, which requires a calculation of the present value of estimated future policyholder benefits and the related termination expenses, less the present value of estimated future net premiums to be collected from policyholders. The
Company estimates the amortization of deferred acquisition costs on a constant-level basis over the expected term of the grouped contracts.
The most significant assumptions used to estimate the liability for future policy benefits and amortization of deferred acquisition costs for certain products are mortality, morbidity and lapse. The Company regularly reviews these assumptions, which are updated as necessary in the third quarter of every year, or more frequently if suggested by experience. The mortality, morbidity, and lapse assumptions are determined based upon Company experience and industry data.
Given the inherent uncertainty and extent of specialized skill required in assessing the mortality, morbidity and lapse assumptions, auditing the development of these assumptions for certain products involved especially subjective judgment.
How the Critical Audit Matter Was Addressed in the Audit
Our audit procedures related to management’s judgments regarding the mortality, morbidity, and lapse assumptions used in the development of future policy benefits and the amortization of deferred acquisition costs for certain insurance products, included the following, among others:
•We tested the effectiveness of controls over the development of these assumptions used in the valuation of future policy benefits and the amortization of deferred acquisition costs for certain insurance products, including the effectiveness of the controls over the underlying data.
•We tested the underlying data used in the development of these assumptions as well as in the valuation of future policy benefits and the amortization of deferred acquisition costs for certain insurance products.
•With the assistance of our actuarial specialists, we:
◦evaluated management’s methods, calculations and judgments regarding the development of these assumptions used in the valuation of future policy benefits and the amortization of deferred acquisition costs for certain products.
◦evaluated on a sample basis, through independent calculation of future policy benefits and amortization of deferred acquisition costs, the mathematical accuracy of management’s calculations, the appropriateness of valuation models, and whether these assumptions were properly applied.
/s/ Deloitte & Touche LLP
Dallas, Texas
February 26, 2025
We have served as the Company’s auditor since 1999.
Globe Life Inc.
Consolidated Balance Sheets
(Dollar amounts in thousands, except per share data)
| | | | | | | | | | | |
| December 31, |
| 2024 | | 2023 |
| Assets: | | | |
| Investments: | | | |
Fixed maturities—available for sale, at fair value (amortized cost: 2024—$18,835,809; 2023—$18,924,914, allowance for credit losses: 2024— $10,395; 2023— $7,115) | $ | 17,155,012 | | | $ | 17,870,206 | |
| Mortgage loans | 396,088 | | | 279,199 | |
| Policy loans | 699,669 | | | 657,020 | |
| Other long-term investments (includes: 2024—$986,766; 2023—$795,583 under the fair value option) | 1,235,759 | | | 835,878 | |
| Short-term investments | 85,035 | | | 81,740 | |
| Total investments | 19,571,563 | | | 19,724,043 | |
| Cash | 165,325 | | | 103,156 | |
| Accrued investment income | 269,791 | | | 270,396 | |
| Other receivables | 691,907 | | | 630,223 | |
| Deferred acquisition costs | 6,495,589 | | | 6,009,477 | |
| Goodwill | 490,446 | | | 481,791 | |
| Other assets | 1,391,560 | | | 832,413 | |
| Total assets | $ | 29,076,181 | | | $ | 28,051,499 | |
| Liabilities: | | | |
| Future policy benefits at current discount rates: (at original discount rates: 2024—$17,552,564; 2023—$16,984,615) | $ | 18,457,263 | | | $ | 19,460,353 | |
| Unearned and advance premium | 257,631 | | | 254,567 | |
| Policy claims and other benefits payable | 532,832 | | | 514,875 | |
| Other policyholders' funds | 468,604 | | | 236,958 | |
| Total policy liabilities | 19,716,330 | | | 20,466,753 | |
| Current and deferred income taxes | 731,255 | | | 494,639 | |
| Short-term debt | 415,401 | | | 486,113 | |
| Long-term debt (estimated fair value: 2024—$2,122,772; 2023—$1,491,229) | 2,324,251 | | | 1,629,559 | |
| Other liabilities | 583,424 | | | 487,632 | |
| Total liabilities | 23,770,661 | | | 23,564,696 | |
| Commitments and Contingencies (Note 5) | | | |
| Shareholders' equity: | | | |
| Preferred stock, par value $1 per share—5,000,000 shares authorized; outstanding: 0 in 2024 and 2023 | — | | | — | |
| Common stock, par value $1 per share—320,000,000 shares authorized; outstanding: (2024—97,218,183 issued; 2023—102,218,183 issued) | 97,218 | | | 102,218 | |
| Additional paid-in-capital | 527,795 | | | 532,474 | |
| Accumulated other comprehensive income (loss) | (2,029,720) | | | (2,772,419) | |
| Retained earnings | 8,002,521 | | | 7,478,813 | |
| Treasury stock, at cost: (2024—13,240,616 shares; 2023—8,426,854 shares) | (1,292,294) | | | (854,283) | |
| Total shareholders' equity | 5,305,520 | | | 4,486,803 | |
| Total liabilities and shareholders' equity | $ | 29,076,181 | | | $ | 28,051,499 | |
See accompanying Notes to Consolidated Financial Statements.
Globe Life Inc.
Consolidated Statements of Operations
(Dollar amounts in thousands, except per share data)
| | | | | | | | | | | | | | | | | | | | |
| | Year Ended December 31, |
| | 2024 | | 2023 | | 2022 |
| Revenue: | | | | | | |
| Life premium | | $ | 3,261,347 | | | $ | 3,137,244 | | | $ | 3,027,824 | |
| Health premium | | 1,404,925 | | | 1,318,773 | | | 1,282,417 | |
| Other premium | | — | | | — | | | 1 | |
| Total premium | | 4,666,272 | | | 4,456,017 | | | 4,310,242 | |
| | | | | | |
| Net investment income | | 1,135,631 | | | 1,056,884 | | | 991,800 | |
| Realized gains (losses) | | (24,188) | | | (65,676) | | | (76,548) | |
| | | | | | |
| Other income | | 354 | | | 308 | | | 1,246 | |
| Total revenue | | 5,778,069 | | | 5,447,533 | | | 5,226,740 | |
| | | | | | |
| Benefits and expenses: | | | | | | |
Life policyholder benefits(1) | | 2,000,977 | | | 2,050,789 | | | 2,035,693 | |
Health policyholder benefits(2) | | 851,577 | | | 776,362 | | | 752,866 | |
| Other policyholder benefits | | 41,889 | | | 37,100 | | | 36,875 | |
| Total policyholder benefits | | 2,894,443 | | | 2,864,251 | | | 2,825,434 | |
| | | | | | |
| Amortization of deferred acquisition costs | | 410,001 | | | 379,700 | | | 348,824 | |
| Commissions, premium taxes, and non-deferred acquisition costs | | 600,753 | | | 559,167 | | | 506,022 | |
| Other operating expense | | 419,143 | | | 347,833 | | | 353,954 | |
| Interest expense | | 127,092 | | | 102,316 | | | 90,395 | |
| Total benefits and expenses | | 4,451,432 | | | 4,253,267 | | | 4,124,629 | |
| | | | | | |
| Income before income taxes | | 1,326,637 | | | 1,194,266 | | | 1,102,111 | |
| Income tax benefit (expense) | | (255,875) | | | (223,511) | | | (207,725) | |
| | | | | | |
| | | | | | |
| | | | | | |
Net income | | $ | 1,070,762 | | | $ | 970,755 | | | $ | 894,386 | |
| | | | | | |
Basic net income per common share | | $ | 11.99 | | | $ | 10.21 | | | $ | 9.13 | |
| | | | | | |
Diluted net income per common share | | $ | 11.94 | | | $ | 10.07 | | | $ | 9.04 | |
(1)Net of total remeasurement, including both the impact of assumption changes and the effect of actual to expected experience adjustments, resulting in a gain (loss) of $107.0 million, $29.4 million, and $(47.4) million for the year ended December 31, 2024, 2023, and 2022, respectively.
(2)Net of total remeasurement, including both the impact of assumption changes and the effect of actual to expected experience adjustments, resulting in a gain (loss) of $(3.2) million, $11.8 million, and $15.6 million for the year ended December 31, 2024, 2023, and 2022, respectively.
See accompanying Notes to Consolidated Financial Statements.
Globe Life Inc.
Consolidated Statements of Comprehensive Income (Loss)
(Dollar amounts in thousands)
| | | | | | | | | | | | | | | | | |
| Year Ended December 31, |
| 2024 | | 2023 | | 2022 |
Net income | $ | 1,070,762 | | | $ | 970,755 | | | $ | 894,386 | |
| | | | | |
| Other comprehensive income (loss): | | | | | |
| | | | | |
| Investments: | | | | | |
| Unrealized gains (losses) on fixed maturities: | | | | | |
| Unrealized holding gains (losses) arising during period | (630,042) | | | 671,211 | | | (5,332,818) | |
| | | | | |
| Other reclassification adjustments included in net income | 3,764 | | | 80,238 | | | 32,377 | |
| Foreign exchange adjustment on fixed maturities recorded at fair value | 3,469 | | | (715) | | | 1,749 | |
| | | | | |
| | | | | |
| | | | | |
| Total unrealized investment gains (losses) | (622,809) | | | 750,734 | | | (5,298,692) | |
| Less applicable tax (expense) benefit | 130,787 | | | (157,658) | | | 1,112,730 | |
| Unrealized gains (losses) on investments, net of tax | (492,022) | | | 593,076 | | | (4,185,962) | |
| | | | | |
| Future Policy benefits: | | | | | |
| Change in discount rate on future policy benefits | 1,567,530 | | | (731,883) | | | 7,021,147 | |
| Less applicable tax (expense) benefit | (329,181) | | | 153,696 | | | (1,474,441) | |
| Future policy benefit adjustments, net of tax | 1,238,349 | | | (578,187) | | | 5,546,706 | |
| | | | | |
| | | | | |
| | | | | |
| | | | | |
| | | | | |
| | | | | |
| Foreign exchange translation: | | | | | |
| Foreign exchange translation adjustments, other than securities | (33,516) | | | 8,102 | | | (26,494) | |
| Less applicable tax (expense) benefit | 7,040 | | | (1,702) | | | 5,565 | |
| Foreign exchange translation adjustments, other than securities, net of tax | (26,476) | | | 6,400 | | | (20,929) | |
| | | | | |
| Pension: | | | | | |
| Amortization of pension costs | 474 | | | (390) | | | 13,754 | |
| Plan amendments | (1,212) | | | — | | | — | |
| Experience gain (loss) | 29,659 | | | (3,907) | | | 119,055 | |
| Pension adjustments | 28,921 | | | (4,297) | | | 132,809 | |
| Less applicable tax (expense) benefit | (6,073) | | | 902 | | | (27,889) | |
| Pension adjustments, net of tax | 22,848 | | | (3,395) | | | 104,920 | |
| | | | | |
| Other comprehensive income (loss) | 742,699 | | | 17,894 | | | 1,444,735 | |
Comprehensive income (loss) | $ | 1,813,461 | | | $ | 988,649 | | | $ | 2,339,121 | |
See accompanying Notes to Consolidated Financial Statements.
Globe Life Inc.
Consolidated Statements of Shareholders' Equity
(Dollar amounts in thousands, except per share data)
| | | | | | | | | | | | | | | | | | | | | | | | | | | | | | | | | | | | | | | | | |
| Preferred Stock | | Common Stock | | Additional Paid-In Capital | | Accumulated Other Comprehensive Income (Loss) | | Retained Earnings | | Treasury Stock | | Total Shareholders' Equity |
| Year Ended December 31, 2022 | | | | | | | | | | | | | |
| | | | | | | | | | | | | |
| | | | | | | | | | | | | |
Balance at January 1, 2022 | — | | | 109,218 | | | 520,564 | | | (4,235,048) | | | 6,455,733 | | | (846,659) | | | 2,003,808 | |
| Comprehensive income (loss) | — | | | — | | | — | | | 1,444,735 | | | 894,386 | | | — | | | 2,339,121 | |
Common dividends declared ($0.83 per share) | — | | | — | | | — | | | — | | | (80,956) | | | — | | | (80,956) | |
| Acquisition of treasury stock | — | | | — | | | — | | | — | | | — | | | (454,638) | | | (454,638) | |
| Stock-based compensation | — | | | — | | | 29,119 | | | — | | | (345) | | | 6,876 | | | 35,650 | |
| Exercise of stock options | — | | | — | | | — | | | — | | | (29,838) | | | 136,430 | | | 106,592 | |
| | | | | | | | | | | | | |
| Retirement of treasury stock | — | | | (4,000) | | | (20,022) | | | — | | | (344,445) | | | 368,467 | | | — | |
| Balance at December 31, 2022 | — | | | 105,218 | | | 529,661 | | | (2,790,313) | | | 6,894,535 | | | (789,524) | | | 3,949,577 | |
| | | | | | | | | | | | | |
| Year Ended December 31, 2023 | | | | | | | | | | | | | |
| | | | | | | | | | | | | |
Balance at January 1, 2023 | — | | | 105,218 | | | 529,661 | | | (2,790,313) | | | 6,894,535 | | | (789,524) | | | 3,949,577 | |
| Comprehensive income (loss) | — | | | — | | | — | | | 17,894 | | | 970,755 | | | — | | | 988,649 | |
Common dividends declared ($0.90 per share) | — | | | — | | | — | | | — | | | (85,139) | | | — | | | (85,139) | |
| Acquisition of treasury stock | — | | | — | | | — | | | — | | | — | | | (511,100) | | | (511,100) | |
| Stock-based compensation | — | | | — | | | 18,466 | | | — | | | — | | | 12,270 | | | 30,736 | |
| Exercise of stock options | — | | | — | | | — | | | — | | | (19,395) | | | 133,475 | | | 114,080 | |
| Retirement of treasury stock | — | | | (3,000) | | | (15,653) | | | — | | | (281,943) | | | 300,596 | | | — | |
| Balance at December 31, 2023 | — | | | 102,218 | | | 532,474 | | | (2,772,419) | | | 7,478,813 | | | (854,283) | | | 4,486,803 | |
| | | | | | | | | | | | | |
| Year Ended December 31, 2024 | | | | | | | | | | | | | |
| | | | | | | | | | | | | |
| | | | | | | | | | | | | |
Balance at January 1, 2024 | — | | | 102,218 | | | 532,474 | | | (2,772,419) | | | 7,478,813 | | | (854,283) | | | 4,486,803 | |
| Comprehensive income (loss) | — | | | — | | | — | | | 742,699 | | | 1,070,762 | | | — | | | 1,813,461 | |
Common dividends declared ($0.96 per share) | — | | | — | | | — | | | — | | | (84,539) | | | — | | | (84,539) | |
| Acquisition of treasury stock | — | | | — | | | — | | | — | | | — | | | (1,002,109) | | | (1,002,109) | |
| Stock-based compensation | — | | | — | | | 22,277 | | | — | | | (438) | | | 18,279 | | | 40,118 | |
| Exercise of stock options | — | | | — | | | — | | | — | | | (6,358) | | | 58,144 | | | 51,786 | |
| Retirement of treasury stock | — | | | (5,000) | | | (26,956) | | | — | | | (455,719) | | | 487,675 | | | — | |
| Balance at December 31, 2024 | $ | — | | | $ | 97,218 | | | $ | 527,795 | | | $ | (2,029,720) | | | $ | 8,002,521 | | | $ | (1,292,294) | | | $ | 5,305,520 | |
See accompanying Notes to Consolidated Financial Statements.
Globe Life Inc.
Consolidated Statements of Cash Flows
(Dollar amounts in thousands)
| | | | | | | | | | | | | | | | | |
| Year Ended December 31, |
| 2024 | | 2023 | | 2022 |
Net income | $ | 1,070,762 | | | $ | 970,755 | | | $ | 894,386 | |
| Adjustments to reconcile net income to cash provided from operations: | | | | | |
| | | | | |
| Increase (decrease) in future policy benefits | 731,417 | | | 834,366 | | | 759,426 | |
| | | | | |
| Increase (decrease) in other policy benefits | 19,268 | | | 5,448 | | | 35,638 | |
| Deferral of policy acquisition costs | (913,544) | | | (850,169) | | | (828,943) | |
| Amortization of deferred policy acquisition costs | 410,001 | | | 379,700 | | | 348,824 | |
| Change in current and deferred income taxes | 77,930 | | | 101,448 | | | 91,835 | |
| Realized (gains) losses | 24,188 | | | 65,676 | | | 76,548 | |
| | | | | |
| Other, net | (17,582) | | | (24,799) | | | 44,480 | |
| | | | | |
| | | | | |
Cash provided from (used for) operating activities | 1,402,440 | | | 1,482,425 | | | 1,422,194 | |
| | | | | |
| Cash provided from (used for) investing activities: | | | | | |
| Investments sold or matured: | | | | | |
| Fixed maturities available for sale—sold | 1,207,237 | | | 602,556 | | | 390,392 | |
| Fixed maturities available for sale—matured or other redemptions | 214,442 | | | 250,652 | | | 462,002 | |
| Mortgage loans | 54,157 | | | 44,004 | | | 32,870 | |
| Other long-term investments | 43,362 | | | 151,262 | | | 50,281 | |
| Total investments sold or matured | 1,519,198 | | | 1,048,474 | | | 935,545 | |
| Acquisition of investments: | | | | | |
| Fixed maturities—available for sale | (1,379,238) | | | (1,536,409) | | | (1,420,220) | |
| Mortgage loans | (174,665) | | | (158,823) | | | (77,275) | |
| Other long-term investments | (459,660) | | | (155,700) | | | (213,207) | |
| Total investments acquired | (2,013,563) | | | (1,850,932) | | | (1,710,702) | |
| Net (increase) decrease in policy loans | (42,649) | | | (42,154) | | | (25,232) | |
| Net (increase) decrease in short-term investments | (3,295) | | | 32,381 | | | (44,976) | |
| Additions to property and equipment | (71,045) | | | (49,553) | | | (27,929) | |
| Other investing activities | 96 | | | — | | | — | |
| Investments in low-income housing interests | (30,258) | | | (64,365) | | | (69,721) | |
Cash provided from (used for) investing activities | (641,516) | | | (926,149) | | | (943,015) | |
| | | | | |
| Cash provided from (used for) financing activities: | | | | | |
| Issuance of common stock | 51,786 | | | 114,080 | | | 106,592 | |
| Cash dividends paid to shareholders | (85,485) | | | (84,116) | | | (80,547) | |
| Repayment of debt | — | | | (165,612) | | | (150,000) | |
| Proceeds from issuance of debt | 530,000 | | | 170,000 | | | 250,492 | |
| Payment for debt issuance costs | (7,253) | | | (757) | | | (5,272) | |
| | | | | |
| Net borrowing (repayment) of commercial paper | (13,878) | | | 32,961 | | | (46,289) | |
| Proceeds from commercial paper with original maturities greater than 90 days | 484,726 | | | — | | | — | |
| Repayment of commercial paper with original maturities greater than 90 days | (372,011) | | | — | | | — | |
| Acquisition of treasury stock | (1,002,109) | | | (511,100) | | | (454,638) | |
| Amounts paid to reinsurer | (413,779) | | | — | | | — | |
| Net receipts (payments) from deposit-type products | 112,168 | | | (96,943) | | | (112,791) | |
Cash provided from (used for) financing activities | (715,835) | | | (541,487) | | | (492,453) | |
| | | | | |
| Effect of foreign exchange rate changes on cash | 17,080 | | | (4,192) | | | 13,670 | |
| Net increase (decrease) in cash | 62,169 | | | 10,597 | | | 396 | |
| Cash at beginning of year | 103,156 | | | 92,559 | | | 92,163 | |
| Cash at end of year | $ | 165,325 | | | $ | 103,156 | | | $ | 92,559 | |
See accompanying Notes to Consolidated Financial Statements.
Globe Life Inc.
Notes to Consolidated Financial Statements
(Dollar amounts in thousands, except per share data)
Note 1—Significant Accounting Policies
Business: (Globe Life), (the Company), refers to Globe Life Inc., an insurance holding company incorporated in Delaware in 1979, and Globe Life Inc. subsidiaries and affiliates. Globe Life Inc.'s direct or indirect primary subsidiaries are Globe Life And Accident Insurance Company, American Income Life Insurance Company, Liberty National Life Insurance Company, Family Heritage Life Insurance Company of America, and United American Insurance Company. The underwriting companies are owned by their ultimate corporate parent, Globe Life Inc. (Parent Company).
Globe Life provides a variety of life and supplemental health insurance products and annuities to a broad base of customers. The Company is organized into three reportable segments: life insurance, supplemental health insurance, and investments.
Globe Life markets its insurance products through a number of distribution channels, each of which sells the products of one or more of Globe Life's insurance segments. Our distribution channels consist of the following exclusive agencies: American Income Life Division (American Income), Liberty National Division (Liberty National) and Family Heritage Division (Family Heritage); an independent agency, United American Division (United American); and our Direct to Consumer Division (DTC).
Basis of Presentation: The accompanying consolidated financial statements of Globe Life have been prepared in conformity with accounting principles generally accepted in the United States of America (GAAP), under guidance issued by the Financial Accounting Standards Board (FASB). The preparation of the consolidated financial statements in conformity with GAAP requires management to make estimates and assumptions that affect the reported amounts of assets and liabilities and disclosure of contingent liabilities at the date of the consolidated financial statements and the reported amounts of revenues and expenses during the reporting period.
Use of Estimates: The preparation of the consolidated financial statements in conformity with GAAP requires management to make estimates and assumptions that affect the reported amounts of assets and liabilities and disclosure of contingent liabilities at the date of the consolidated financial statements and the reported amounts of revenues and expenses during the reporting period. Actual results could differ from those estimates. See further documentation in the significant accounting policies or the accompanying notes.
Principles of Consolidation: The consolidated financial statements include the results of Globe Life Inc. and its wholly-owned subsidiaries. All intercompany accounts and transactions have been eliminated in consolidation. When Globe Life acquires a subsidiary or a block of business, the assets acquired and the liabilities assumed are measured at fair value at the acquisition date. Any excess of acquisition cost over the fair value of net assets is recorded as goodwill. Expenses incurred to effect the acquisition are charged to earnings as of the acquisition date. Upon acquisition, the accounts and results of operations are consolidated as of and subsequent to the acquisition date.
Investments: Globe Life classifies all of its fixed maturity investments as available for sale. Investments classified as available for sale are carried at fair value with unrealized gains and losses, net of taxes, reflected directly in accumulated other comprehensive income (AOCI). Income from investments is recorded in "Net investment income" on the Consolidated Statements of Operations. Gains and losses from sales, maturities, or other redemptions of investments are recorded in "Realized gains (losses)". Gains and losses realized on the disposition of investments are determined on a specific identification basis. Interest income and prepayment fees are recognized when earned. Premiums and discounts are amortized using the effective yield method. When amortized cost of a callable debt security exceeds the first call price, the premium is amortized to the earliest call date. Otherwise, the period of amortization or accretion generally extends from the purchase date to the maturity date.
"Policy loans", which represent loans provided to policyholders using cash values as collateral, are carried at unpaid principal balances.
Globe Life Inc.
Notes to Consolidated Financial Statements
(Dollar amounts in thousands, except per share data)
"Mortgage loans" or commercial mortgage loans, are a type of investment where the mortgage loan is shared among investors, are accounted for as financing receivables. The commercial mortgage loans are managed by third parties. The Company purchased the legal rights to interests in commercial mortgage loans which are secured by properties such as hotels, retail, multiple family, or offices. The commercial mortgage loans typically have a term of 3 years with the option to extend up to 2 years. The commercial mortgage loans are recorded at unpaid principal balance, net of unamortized origination fees and net of allowance for loan losses. Interest income, net of the amortization of origination fees, is recorded in "Net investment income" under the effective yield method. Our unfunded commitment balance to the commercial loan borrowers was $22 million as of December 31, 2024.
"Other long-term investments" include investment funds, equity securities, company-owned life insurance (COLI) and real estate. Investments in equity securities are reported at fair value with changes in fair value, net of taxes, reflected directly in "Realized gains (losses)" in the Consolidated Statements of Operations. COLI is reported at the cash surrender value; changes in the cash surrender value are recorded in net investment income. Investments in real estate are reported at cost less accumulated depreciation. Depreciation is recorded on a straight-line basis over the estimated useful life.
The investment funds consist of limited partnerships whereby the Company has a pro-rata share of ownership ranging from less than 1% to 20%. For each investment, the Company has elected the fair value option, but would have been otherwise accounted for as an equity method investment. The fair value option is assessed for each individual investment at the inception of the investment.
Each limited partnership investment is evaluated under applicable GAAP to determine if it is a variable interest entity (VIE) and would qualify for consolidation. Primary beneficiaries are required to consolidate VIEs. The investments are not consolidated because the Company has no power to control the activities that most significantly affect the economic performance of these entities and therefore the Company is not the primary beneficiary of any of these interests. Globe Life's involvement is limited to its limited partnership interest in the entities. The Company has not provided any other financial support to the entities beyond its commitments to fund its limited partnership interests, and there are no arrangements or agreements with any of the interests to provide other financial support. The maximum loss exposure relative to these interests is limited to their carrying value and future commitments. The Company has approximately 2% of total assets in low-income housing tax credits and certain limited partnerships (investment funds) that qualify as unconsolidated VIEs.
The limited partnership investments are reported at the Company's pro-rata share of the investment fund's net asset value or its equivalent (NAV), as a practical expedient for fair value. Changes in the NAV are recorded in net income and increase the carrying value on the balance sheet. The amount of change in NAV attributable to the net operating results of the fund is recorded in "Net investment income" with the remaining balance of the change reflected in "Realized gains (losses)." Distributions received from the funds reduce the carrying value. Our maximum exposure to loss is equal to the outstanding carrying value and future funding commitments. The Company had $239 million of capital called during the year from existing investment funds, reducing our unfunded commitments. Our unfunded commitments were $433 million as of December 31, 2024.
"Short-term investments" include investments in interest-bearing assets with original maturities of twelve months or less.
Globe Life Inc.
Notes to Consolidated Financial Statements
(Dollar amounts in thousands, except per share data)
Fair Value Measurements, Investments in Securities: Globe Life measures the fair value of its "fixed maturities" based on a hierarchy consisting of three levels which indicate the quality of the fair value measurements as described below:
•Level 1—fair values are based on quoted prices in active markets for identical assets or liabilities that the Company has the ability to access as of the measurement date.
•Level 2—fair values are based on inputs other than quoted prices included in Level 1 that are observable for the asset or liability, either directly or indirectly. Level 2 inputs include quoted prices for similar assets or liabilities in active markets, quoted prices for identical or similar assets or liabilities in markets that are not active, inputs other than quoted prices that are observable for the asset or liability, or inputs that can otherwise be corroborated by observable market data.
•Level 3—fair values are based on inputs that are considered unobservable where there is little, if any, market activity for the asset or liability as of the measurement date. In this circumstance, the Company has to rely on values derived by independent brokers or internally-developed assumptions. Unobservable inputs are developed based on the best information available to the Company which may include the Company’s own data or bid and ask prices in the dealer market.
Certain investments, such as investment funds, that are measured at fair value using the net asset value per share or its equivalent, as a practical expedient, have not been classified in the fair value hierarchy. The net asset value is provided by general partners or managers.
The great majority of Globe Life's "fixed maturities" are not actively traded and direct quotes are not generally available. Management therefore determines the fair values of these securities after consideration of data provided by third-party pricing services, independent broker/dealers, and other resources. At December 31, 2024, the Company's investments in fixed maturities were primarily composed of the following significant security types: corporate securities, state and municipal securities, U.S. government direct, guaranteed, and government-sponsored enterprises securities. The remaining security types represented approximately 1% of the total in the aggregate.
Approximately 98% of the fair value of "fixed maturities" reported at December 31, 2024 was determined using data provided by third-party pricing services. Prices provided by these services are not binding offers but are estimated exit values. Third-party pricing services use proprietary pricing models to determine security values by discounting cash flows using a market-adjusted spread to a benchmark yield.
For all asset classes within Globe Life's significant security types, third-party pricing services use a common valuation technique to model the price of the investments using observable market data. The foundation for these models consists of developing yield spreads based on multiple observable market inputs, including but not limited to: benchmark yield curves, actual trading activity, new issue yields, broker-dealer quotes, issuer spreads, two-sided markets, benchmark securities, bids, offers, sector-specific data, economic data, and other inputs that are corroborated in the market. Pricing vendors monitor and review their pricing data continuously with current market and economic data feeds, augmented by ongoing communication within the dealer community.
Using the observable market inputs described above, spreads to an appropriate benchmark yield are further developed by the vendors for each security based on security-specific and/or sector-specific risk factors, such as a security’s terms and conditions (coupon, maturity, and call features), credit rating, sector, liquidity, collateral or other cash flow options, and other factors that could impact the risk of the security. Embedded repayment options, such as call and redemption features, are also taken into account in the pricing models. When the spread is determined, it is added to the security’s benchmark yield. The security's expected cash flows are discounted using this spread-adjusted yield, and the resulting present value of the discounted cash flows is the evaluated price.
When third-party vendor prices are not available, the Company attempts to obtain valuations from other sources, including but not limited to broker/dealers, broker quotes, and prices on comparable securities.
Globe Life Inc.
Notes to Consolidated Financial Statements
(Dollar amounts in thousands, except per share data)
When valuations have been obtained for all securities in the portfolio, management reviews and analyzes the prices to ensure their reasonableness, taking into account available and observable information. The Company utilizes pricing from multiple pricing providers and applies a hierarchy of sources to determine price. When two or more valuations are available for a security and the variance between the prices is 10% or less, the close correlation suggests similar observable inputs were used in deriving the price, and the price is selected based on hierarchy of pricing providers. Securities valued in this manner are classified as Level 2. When the variance between two or more valuations for a security exceeds 10%, additional analysis is performed to evaluate the reasonableness of the fair value using the hierarchy and upon the evaluation company may elect to use the hierarchy of pricing providers or use additional resources such as broker quotes, prices on comparable securities, recent trades, and any other observable market data to corroborate the pricing provider. If fair value differences from pricing providers are determined to be unreasonable and additional pricing resources utilizing observable market data cannot corroborate the price within a reasonable tolerance, then the security will be classified as Level 3.
Globe Life invests in private placement fixed maturities. Private placement fixed maturities are generally not an active market. Private placement valuations are based on observable inputs, such as the benchmark treasury rate, published sector indices, and/or publicly traded comparables and unobservable inputs such as an internally-developed credit ratings, public private spreads and/or private letter ratings assigned by the nationally recognized statistical rating organizations. If observable inputs cannot be corroborated, the fair values are classified as Level 3. Refer to Note 4—Investments under the caption Quantitative Information about Level 3 Fair Value Measurements.
Fair Value Measurements, Other Financial Instruments: Fair values for cash and cash equivalents, short-term investments, short-term debt, receivables, and payables approximate carrying value. Cash and cash equivalents are classified as Level 1. Fair values of commercial mortgage loans are determined based upon expected cash flows discounted at an appropriate risk-adjusted rate and are classified as Level 3. The fair value of investments in limited partnerships that provide low-income housing tax credits is based on discounted projected cash flows and are classified as Level 3. Policy loans are an integral part of Globe Life's subsidiaries’ life insurance policies in force and their fair values cannot be valued separately from the insurance contracts. Investment funds are based on net asset value and are excluded from the fair value hierarchy.
The fair values of Globe Life's long and short-term debt issues are based on the same methodology as investments in fixed maturities. At December 31, 2024, observable inputs were available for these debt securities and as such were classified as Level 2 in the valuation hierarchy. The fair value for each debt instrument as of December 31, 2024 is disclosed in Note 12—Debt.
As described in Note 10—Postretirement Benefits, Globe Life maintains a nonqualified supplemental retirement plan. Accordingly, the assets that support the liability for this plan are considered general assets of the Company. These assets consist of the cash value of company-owned life insurance policies (COLI) and exchange traded funds (ETFs). Fair values for the ETFs are derived from direct quotes and are considered Level 1 in the fair value hierarchy.
Current Expected Credit Loss Reserve (fixed maturities): At the onset of the evaluation, the Company individually assesses each fixed maturity, on a quarterly basis, to determine whether it intends to sell, or it is more likely than not that it will be required to sell the security before recovery of its amortized cost basis. If either of the criteria are met, the Company will write down the fixed maturity's amortized cost basis to fair value through "Realized gains (losses)".
If neither of the aforementioned criteria are met, the Company will evaluate whether the decline in fair value has resulted from a credit event. The Company will evaluate many factors, as further described below, to determine the present value of the expected cash flows. A credit loss occurs when the present value of the expected cash flows is less than the amortized cost basis. This will result in the recording of an allowance for credit losses as a contra
Globe Life Inc.
Notes to Consolidated Financial Statements
(Dollar amounts in thousands, except per share data)
asset account to the amortized cost basis with an offsetting provision for credit losses in "Realized gains (losses)" on the Consolidated Statements of Operations. Additionally, the current expected credit loss (CECL) methodology includes a fair value floor where the allowance for credit loss for a security cannot exceed the difference between fair value and amortized cost. When it is determined that there is not a credit loss, the decline in fair value is recognized in Other Comprehensive Income.
All changes in the allowance for credit losses are recorded as provision for (or reversal of) credit loss expense. Losses recorded to the allowance for credit losses are management's best estimate of the uncollectibility of principal and interest of a fixed maturity.
The evaluation of Globe Life's securities for credit losses is a process that is undertaken at least quarterly and is overseen by a team of investment and accounting professionals. The process for making this determination is highly subjective and involves the careful consideration of many factors. The factors considered include, but are not limited to:
•The Company’s lack of intent to sell the debt security before recovery;
•Whether it is more likely than not the Company will be required to sell prior to maturity;
•The reason(s) for the credit related losses;
•The financial condition of the issuer and the prospects for recovery in fair value of the security;
•Expected future cash flows.
The relative weight given to each of these factors can change over time as facts and circumstances change. In many cases, management believes it is appropriate to give more consideration to prospective factors than to retrospective factors. Prospective factors that are given more weight include prospects for recovery, the Company’s ability and general intent to hold the security until anticipated recovery, and expected future cash flows.
Among the facts and information considered in the process are:
•Financial statements of the issuer;
•Changes in credit ratings of the issuer;
•The value of underlying collateral;
•News and information included in press releases issued by the issuer;
•News and information reported in the media concerning the issuer;
•News and information published by or otherwise provided by securities, economic, or research analysts;
•The nature and amount of recent and expected future sources and uses of cash;
•Default on a required payment;
•Issuer bankruptcy filings.
The expected cash flows are determined using judgment and the best information available to the Company. Inputs used to derive expected cash flows generally include expected default rates, current levels of subordination, and estimated recovery rate. The discount rate utilized in the discounted cash flows is the effective interest rate, which is the rate of return implicit in the asset at acquisition.
Globe Life Inc.
Notes to Consolidated Financial Statements
(Dollar amounts in thousands, except per share data)
Current Expected Credit Loss Reserve (mortgage loans): The Company evaluates the performance and credit quality of the commercial mortgage loan portfolio at least on a quarterly basis, or as needed, by utilizing common metrics such as loan-to-value or debt-service ratios as well as covenants, local market conditions, borrower quality, and underlying collateral. The fair value of the underlying collateral is based on a third-party appraisal of the property at origination of the loan. The fair value is assessed on an annual basis or more frequently when a loan is materially underperforming, 30 days delinquent, or in technical default. The Company determines the probability of estimated losses for the performing commercial mortgage loan portfolio on a pool basis each quarter and records an allowance. The allowance for credit losses is based on estimates, historical experience, probability of loss, value of the underlying collateral, and macro factors that affect the collectability of the loan.
If management determines that foreclosure of a particular property is probable, or determines the loan is collateral dependent, the company may elect the practical expedient. for an individual mortgage loan to estimate the expected credit losses, which are based on the fair value of the property less amortized cost, adjusted for selling and other associated costs. See Note 4—Investments for current activity.
Cash: "Cash" consists of balances on hand and on deposit in banks and financial institutions.
Accrued investment income: "Accrued investment income" consists of interest income or dividends earned on the investment portfolio, but which are yet to be received as of the balance sheet date. The Company will write off accrued investment income that is deemed to be uncollectible related to the fixed maturities.
"Accrued investment income" also consists of interest income earned on the commercial mortgage loan portfolio, but which is yet to be received as of the balance sheet date. Accrued investment income will be placed in non-accrual status at the time the loan is 90 days delinquent or otherwise deemed to be uncollectible by management. Accrued investment income that is deemed to be uncollectible will be written off. As of December 31, 2024, the accrued interest receivable for commercial mortgage loans was $4.2 million. Mortgage loans generally pay interest monthly, therefore accrued interest is typically for a period of less than 30 days.
As a practical expedient, the Company excludes the accrued investment income from the amortized cost basis of the investment and separately reports it in another financial statement line item, "Accrued investment income." Accordingly, the amount will be excluded from disclosures within Note 4—Investments.
Other Receivables: Agent debit balances primarily represent commissions advanced to insurance agents, a common industry practice. Generally, commissions are paid to an agent when due over the life of a policy as premiums are paid. However, some agents may qualify to have their commissions (primarily first-year commissions) paid in advance of when the commissions are earned. To the extent an advance is made, we will generally advance up to 65% of first year commissions. This creates an agent debit balance which is classified within “Other receivables”. These balances are repaid to the Company over time, generally one year, as the premiums associated with the advanced commissions are collected by the Company and a portion of the agents' commissions on such premiums are retained in order to repay the balances. If an agent has an agent debit balance with the Company, commissions earned by that agent are generally first applied to reduce the amounts owed to the Company. Any excess will be paid to the agent in cash. The balances were $542 million at December 31, 2024 and $501 million at December 31, 2023. When an agent sells a policy, commissions are advanced to the agent, and the collection of the advance is made as long as the policy stays in force. While there is a susceptibility to loss should an agent terminate or excessive policy lapses occur, the ability of the Company to continue to collect an agent's commission streams over time from prior sales of policies reduces the Company's exposure to loss.
Commissions are earned by the agent over the contract period as long as premium is paid by the policyholder and the policy stays in force. As the commissions are earned by the agent and commission expense is incurred by the Company the agent debit balance is reduced. The portion of commission expense incurred related to non-level commissions is deferred and recorded as “Deferred acquisition cost.” The portion of level commission is recognized as an expense within “Commissions, premium taxes, and non-deferred acquisition costs.”
Globe Life Inc.
Notes to Consolidated Financial Statements
(Dollar amounts in thousands, except per share data)
The Company has a very low inherent risk with regard to the collection of agent debit balances and views these balances as recoverable since they are, in aggregate, less than the estimated present value of future commissions discounted at a conservative rate which includes assumptions for lapses and mortality. The Company’s security, or collateral, is in the form of future commission streams collected over the life of the policies sold by the respective agents, which ultimately revert to the Company in the event an agent is terminated. The Company evaluated the agent debit balances on a pool basis to determine the allowance for credit losses, as the loans have similar characteristics. A provision for credit losses will be recorded in "Realized gains (losses)" on the Consolidated Statements of Operations and the asset balance will be reflected in agent debit balances, net of allowance for credit losses ("Other receivables"). As of December 31, 2024 and 2023, the allowance for credit losses was $1.4 million and $1.2 million, respectively.
Deferred Acquisition Costs: Certain costs of acquiring new insurance business are deferred and recorded as an asset. These costs are capitalized on a grouped contract basis and amortized over the expected term of the related contracts, and are essential for the acquisition of new insurance business. Deferred acquisition costs (DAC) are directly related to the successful issuance of an insurance contract, and primarily include sales commissions, policy issue costs, direct to consumer advertising costs, and underwriting costs. Additionally, DAC includes the value of business acquired (VOBA), which are the costs of acquiring blocks of insurance from other companies or through the acquisition of other companies. These costs represent the difference between the fair value of the contractual insurance assets acquired and liabilities assumed, compared against the assets and liabilities for insurance contracts that the company issues or holds measured in accordance with GAAP.
DAC is amortized on a constant-level basis over the expected term of the grouped contracts, with the related expense included in amortization of deferred acquisition costs on the Consolidated Statements of Operations. The in-force metric used to compute the DAC amortization rate is annualized premium in force. The assumptions used to amortize acquisition costs include mortality, morbidity, and lapses. These assumptions are reviewed at least annually and revised in conjunction with any change in the future policy benefit assumptions. The effect of changes in the assumptions are recognized over the remaining expected contract term as a revision of future amortization amounts.
VOBA is amortized on a basis that is consistent with DAC, as described above, and is subject to periodic recoverability and loss recognition testing to determine if there is a premium deficiency. These tests evaluate whether the present value of future contract-related cash flows will support the capitalized VOBA asset. These cash flows consist primarily of premium income, less benefits and expenses. The present value of these cash flows, less the liability for future policy benefits, is then compared with the unamortized balance. In the event the estimated present value of net cash flows is less, the deficiency would be recognized by a charge to earnings and either a reduction of unamortized acquisition costs or an increase in the liability for future policy benefits. Refer to Note 7—DAC.
Advertising Costs: Costs related to advertising are generally charged to expense as incurred. However, certain Direct to Consumer advertising costs are capitalized when there is a reliable and demonstrated relationship between total costs and future benefits that is a direct result of incurring these costs. Advertising costs consist primarily of internet advertising costs and the production and distribution costs of direct mail advertising materials, and when capitalized are included as a component of DAC. Additionally, they are amortized in the same manner as other DAC. Advertising costs charged to earnings and included in commissions, premium taxes, and non-deferred acquisition costs were $15.7 million, $19.2 million, and $9.4 million in 2024, 2023, and 2022, respectively. Unamortized capitalized advertising costs included within DAC were $1.6 billion at December 31, 2024 and $1.6 billion at December 31, 2023.
Goodwill: The excess cost of a business acquired over the fair value of net assets acquired is reported as goodwill. In accordance with the guidance, goodwill is subject to impairment testing on an annual basis, or whenever potential impairment triggers occur. Impairment testing involves the performance of a qualitative analysis, which involves assessing current events and circumstances to determine if it is more likely than not that the fair value of a reporting unit is less than its carrying amount. In the event the fair value is less than the carrying value, further testing is required to determine the amount of impairment, if any. If there is an impairment in the goodwill of any reporting unit,
Globe Life Inc.
Notes to Consolidated Financial Statements
(Dollar amounts in thousands, except per share data)
it is written down and charged to earnings in the period of the test. Globe Life tests its goodwill annually as of June 30th for each of the years 2022 through 2024. The Company's goodwill was not impaired in any of those periods. The Company completed the acquisition of Evry Health during 2024 resulting in an increase in goodwill of $8.7 million.
Low-Income Housing Tax Credit Interests: Globe Life invests in limited partnerships that provide low-income housing tax credits and other related federal income tax benefits to the Company. Globe Life holds passive interests in limited partnerships that provide investment returns through the provision of tax benefits (principally from the transfer of federal or state tax credits related to federal low-income housing). These investments are considered to be VIEs and do not qualify for consolidation. The carrying value of the Company's investment in these entities was $270 million and $267 million at December 31, 2024 and 2023, respectively, and was included in "Other assets" on the Consolidated Balance Sheets. As of December 31, 2024, Globe Life was obligated under future commitments of $76 million, which are recorded in "Other liabilities." For guaranteed investments acquired prior to January 1, 2015, the Company utilizes the effective-yield method of amortization, while the proportional method of amortization is utilized for all non-guaranteed and guaranteed investments acquired on or after January 1, 2015. All net amortization expense and income tax benefits are recorded in "Income tax benefit (expense)" on the Consolidated Statements of Operations.
Property and Equipment: Property and equipment, included in “Other assets,” is reported at cost less accumulated depreciation. Depreciation is recorded primarily on the straight line method over the estimated useful lives of these assets which range from three to fifteen years for equipment and software, and fifteen to forty years for buildings and improvements. Ordinary maintenance and repairs are charged to income as incurred. Impairments, if any, are recorded when certain events and circumstances become evident that the fair value of the asset is less than its carrying amount. Original cost of property and equipment was $527 million at December 31, 2024 and $455 million at December 31, 2023. Accumulated depreciation was $242 million at the end of 2024 and $215 million at the end of 2023. Depreciation expense was $27 million in 2024, $21 million in 2023, and $21 million in 2022. Internally generated software costs are expensed as incurred in the preliminary project phase and post-implementation phase, and are capitalized during the application development stage. Additionally, implementation costs incurred in a hosting arrangement that is a service contract are capitalized. See below for a breakout of the net balance by asset class for the year ended December 31, 2024 and 2023:
| | | | | | | | | | | |
| Year Ended December 31, |
| 2024 | | 2023 |
| Property and equipment, net of accumulated depreciation: | | | |
| Company occupied real estate | $ | 36,656 | | | $ | 32,566 | |
| Data processing equipment | 219,614 | | | 198,150 | |
| Transportation equipment | 26,346 | | | 7,405 | |
| Furniture and equipment | 1,656 | | | 1,776 | |
| Total property and equipment, net of depreciation | $ | 284,272 | | | $ | 239,897 | |
| | | |
| | | |
Future Policy Benefits: The liability for future policy benefits for traditional and limited-payment long duration life and health products comprises approximately 93% of the total liability for future policy benefits. The liability is determined each reporting period based on the net level premium method. This method requires the liability for future policy benefits be calculated as the present value of estimated future policyholder benefits and the related termination expenses, less the present value of estimated future net premiums to be collected from policyholders. Net level premiums reflect a recomputed net premium ratio using actual experience since the issue date or January 1, 2021, the Transition Date(1), and expected future experience. The liability is accrued as premium revenue is recognized and adjusted for differences between actual and expected experience. Long-duration insurance contracts issued by the Company are grouped into cohorts based on the contract issue year, distribution channel, legal entity, and product type.
(1) On January 1, 2023, the Company adopted ASU 2018-12, Financial Services - Insurance (Topic 944): Targeted Improvements to the Accounting for Long-Duration Contracts (ASU 2018-12) on a modified retrospective basis as the transition date (Transition Date) of January 1, 2021.
Globe Life Inc.
Notes to Consolidated Financial Statements
(Dollar amounts in thousands, except per share data)
Both the present value of expected future benefit payments and the present value of expected future net premiums are based primarily on assumptions of discount rates, mortality, morbidity, and lapses. Each quarter, the Company remeasures its liability for future policy benefits using current discount rates with the effect of the change recognized in Other Comprehensive Income, a component of shareholders’ equity. In addition, the Company recognizes a liability remeasurement gain or loss within the Consolidated Statements of Operations using original discount rates, and relating to actual experience under the net premium calculation, as compared to the prior reporting period assumptions.
The Company regularly reviews its cash flow assumptions (mortality, morbidity, and lapses) used to calculate the change in the liability for future policy benefits. These cash flow assumptions are updated as necessary in the third quarter of every year, or more frequently if suggested by experience. If cash flow assumptions are changed, the net premium ratio is recalculated from the original issue date, or the Transition Date, using actual experience and projected future cash flows. When the expected future net premiums exceed the expected future gross premiums (capping), or the present value of future policyholder benefits exceeds the present value of expected future gross premiums (flooring), the liability for future policy benefits is adjusted with changes recognized in policyholder benefits on the Consolidated Statements of Operations. The cash flow assumptions do not include an adjustment for adverse deviation. Mortality tables used for individual life insurance include various industry tables and reflect modifications based on Company experience. Morbidity assumptions for individual health are based on Company experience and industry data. Lapse assumptions are based on Company experience.
The liability for future policy benefits is discounted as noted above, using a current upper-medium grade fixed-income instrument yield that reflects the duration characteristics of the liability for future policy benefits. The methodology for determining current discount rates consists of constructing a discount rate curve intended to be reflective of the currency and tenor of the insurance liability cash flows. The methodology is designed to prioritize observable inputs based on market data available in the local debt markets denominated in the same currency as the policies. For the discount rates applicable to tenors for which the single-A debt market is not liquid or there is little or no observable market data, the Company will use estimation techniques consistent with the fair value guidance in ASC 820. We further accrete interest as a component of policyholder benefits using the original discount rate that is locked-in during the year of contract issuance. The original discount rates (or the locked-in discount rates) are used for interest accretion purposes and for the determination of net premiums, whereas the current discount rates are used for purposes of valuing the liability.
The liability for future policy benefits for annuity and interest sensitive life-type products is represented by policy account value. For limited-payment contracts, a deferred profit liability is also recorded, with changes recognized in income over the life of the contract in proportion to the amount of insurance in force. Refer to Note 6—Policy Liabilities.
Reinsurance: In the normal course of business, Globe Life insurance subsidiaries will enter into reinsurance agreements to limit their exposure to the risk of loss as well as enhance their capital position. To qualify for reinsurance accounting in accordance with applicable guidance, the assuming company (reinsurer) must have the “reasonable possibility” that it may realize a “significant loss.” In instances where the ceding company does not transfer significant insurance risk to the reinsurer, deposit accounting is utilized. Any risk charges payable related to reinsurance agreements where deposit accounting is applicable are recorded as an Other Liability. Any balances due to the Company under the terms of the reinsurance agreement are recorded as a reinsurance recoverable within Other Assets on the Consolidated Balance Sheets. Any ceding commission due to the Company under the terms of the reinsurance agreement are recorded in income over the remaining life of the ceding contracts.
In the fourth quarter of 2024, the Company entered into a coinsurance agreement to cede a majority of its annuity business to a third-party insurer. The annuity reserves ceded totaled $462 million. The pre-tax ceding commission under the agreement was approximately $50 million and will be recognized into income over the remaining life of the ceded contracts. Amounts paid to the reinsurer upon entering into the coinsurance agreement were $413 million, which are reflected as a cash outflow within financing activities in the Consolidated Statement of Cash Flows. The underlying policies ceded are deposit-type contracts and the coinsurance agreement transfers only timing risk to the reinsurer. Net amounts paid to the reinsurer and reimbursements for losses after inception of the
Globe Life Inc.
Notes to Consolidated Financial Statements
(Dollar amounts in thousands, except per share data)
coinsurance agreement are reported as financing activities within "Net receipts (payments) from deposit-type products". Under the terms of the agreement, the assuming company will be required to maintain assets in trust at 105% of reserves. The Company's annuity business comprises less than 1% of revenue and is not core to the Company's business, therefore we have adjusted our segment reporting to reflect the annuity business as a reconciling item to income before taxes in the segment reporting in this Form 10-K. Prior periods presented have been recast for comparability.
Unearned and Advanced Premium: Premium collected from both life and health policies that have not been earned and recognized in accordance with applicable GAAP. Refer to Recognition of Premium Revenue below.
Policy Claims and Other Benefits Payable: Globe Life establishes a liability for known policy benefits payable and an estimate of claims that have been incurred but not yet reported to the Company. Globe Life makes an estimate of unreported claims after careful evaluation of all information available to the Company. This estimate is based on prior experience and is reviewed quarterly. However, there is no certainty the stated liability for claims and other benefits, including the estimate of unsubmitted claims, will be Globe Life's ultimate obligation. For more information, see Note 8—Liability for Unpaid Claims.
Current and Deferred Income Taxes: Current and deferred income taxes are accounted for under the asset and liability method. Deferred tax assets and liabilities are recognized for the future tax consequences attributable to differences between the consolidated financial statement book values and tax bases of assets and liabilities. Deferred tax assets and liabilities are measured using enacted tax rates expected to apply to taxable income in the years in which those temporary differences are expected to be recovered or settled. The effect on deferred tax assets and liabilities of a change in tax rates is recognized in income in the period that includes the enactment date.
Postretirement Benefits: Globe Life accounts for its postretirement defined benefit plans by recognizing the funded status of those plans on its Consolidated Balance Sheets in accordance with accounting guidance. Periodic gains and losses attributable to changes in plan assets and liabilities that are not recognized as components of net periodic benefit costs are recognized as components of other comprehensive income, net of tax. The supplemental executive retirement plan is accounted for consistent with the qualified noncontributory pension plan. The assets are included in a Rabbi Trust and recorded in Other Assets on the Consolidated Balance Sheets. More information concerning the accounting and disclosures for postretirement benefits is found in Note 10—Postretirement Benefits.
Treasury Stock: Globe Life accounts for purchases of treasury stock on the cost method. Issuance of treasury stock is accounted for using the weighted-average cost method. More information is found in Note 13—Shareholders' Equity.
Recognition of Premium Revenue: Premium income for traditional long-duration life and health insurance products is recognized evenly over the contract period and when due from the policyholder. Premiums for short-duration health contracts are recognized as revenue over the contract period in proportion to the insurance protection provided. Premiums for universal life-type and annuity contracts are added to the policy account value, and revenues for such products are recognized as charges to the policy account value for mortality, administration, and surrenders (retrospective deposit method). Life premium includes policy charges of $12.3 million, $12.9 million, and $13.5 million for the years ended December 31, 2024, 2023, and 2022, respectively. Other premium consists of annuity policy charges in each year. For limited-payment life insurance products, the profits are recognized over the contract period.
Commission, premium taxes, and non-deferred acquisition costs: Commissions represent commission-related amounts that are not deferred. Premium taxes are taxes incurred on premiums written within a state jurisdiction. Non-deferred acquisition costs relate to expenses incurred in the selling or issuing of business which are non-deferrable.
Globe Life Inc.
Notes to Consolidated Financial Statements
(Dollar amounts in thousands, except per share data)
| | | | | | | | | | | | | | | | | |
| 2024 | | 2023 | | 2022 |
| Commissions | $ | 317,576 | | | $ | 295,877 | | | $ | 285,477 | |
| Premium taxes | 96,790 | | | 91,021 | | | 86,278 | |
| Non-deferred acquisition costs | 186,387 | | | 172,269 | | | 134,267 | |
| Total | $ | 600,753 | | | $ | 559,167 | | | $ | 506,022 | |
Stock-Based Compensation: Globe Life accounts for stock-based compensation by recognizing an expense in the consolidated financial statements based on the “fair value method.” The fair value method requires that a fair value be assigned to a stock option or other stock grant on its grant date and that this value be amortized over the grantees’ service period.
The fair value method requires the use of an option valuation model to value employee stock options. Globe Life has elected to use the Black-Scholes valuation model for option expensing.
A summary of assumptions for options granted in each of the three years 2022 through 2024 is as follows:
| | | | | | | | | | | | | | | | | |
| 2024 | | 2023 | | 2022 |
| Volatility factor | 22.0 | % | | 23.0 | % | | 22.3 | % |
| Dividend yield | 0.7 | % | | 0.7 | % | | 0.8 | % |
| Expected term (in years) | 5.10 | | 5.10 | | 5.12 |
| Risk-free rate | 4.3 | % | | 4.1 | % | | 1.9 | % |
The expected term is generally derived from Company experience. However, expected terms are determined based on the simplified method as permitted under the ASC 718, Stock Compensation, topic when Company experience is insufficient. On April 26, 2018, the shareholders approved the Globe Life Inc. 2018 Incentive Plan, formerly the Torchmark Corporation 2018 Incentive Plan (the "2018 Incentive Plan"). The 2018 Incentive Plan replaced all previous plans. The 2018 Incentive Plan allows for option grants for employees with a seven-year contractual term which vest over three years in addition to ten-year grants which vest over five years as permitted by the previous plans. Director grants vest over six months. Volatility and risk-free interest rates are assumed over a period of time consistent with the expected term of the option. Volatility is measured on a historical basis. Monthly data points are utilized to derive volatility for periods three years and longer. Expected dividend yield is based on current dividend yield held constant over the expected term. Once the fair value of an option has been determined, it is amortized on a straight-line basis over the employee’s service period for that grant (from the grant date to the date the grant is fully vested). Expenses for restricted stock and restricted stock units are based on the grant date fair value allocated on a straight-line basis over the service period. Performance share expense is recognized based on management’s estimate of the probability of meeting the metrics identified in the performance share award agreement, assigned to each service period as these estimates develop.
Stock-based compensation expense is included in “Other operating expense” in the Consolidated Statements of Operations. Globe Life management views all stock-based compensation expense as part of insurance administration expense and, therefore, presents as such in its segment analysis. More information concerning the Company's segments is provided in Note 15—Business Segments.
Earnings per Share: Globe Life presents basic and diluted earnings per common share (EPS) on the face of the Consolidated Statements of Operations for income from operations. Basic EPS is computed by dividing income available to common shareholders by the weighted average common shares outstanding for the period. Diluted EPS is calculated by adding to shares outstanding the additional net effect of potentially dilutive securities or contracts, such as stock options, which could be exercised or converted into common shares. For more information on earnings per share, see Note 13—Shareholders' Equity.
Accounting Pronouncements Adopted in the Current Year: ASU No. 2022-03, Fair Value Measurement (Topic 820): Fair Value Measurement of Equity Securities Subject to Contractual Sale Restrictions, adds disclosure requirements
Globe Life Inc.
Notes to Consolidated Financial Statements
(Dollar amounts in thousands, except per share data)
specific to equity securities subject to contractual sale restrictions. The disclosures clarify the nature of the contractual sale as well as the duration of the restriction and the circumstances that could cause a lapse in the restriction.
This standard is effective for the Company for fiscal years beginning on January 1, 2024 and interim periods within those fiscal years. The adoption of this standard did not have a material impact on the consolidated financial statements.
ASU No. 2023-07, Segment Reporting (Topic 280): Improvements to Reportable Segment Disclosures, adds disclosure requirements to segment expenses, improving the financial reporting of the entity’s overall performance and assessment of future cash flows. The disclosures required more detailed information related to the entity’s reportable segments.
This standard is effective for the Company for annual periods beginning on January 1, 2024 and for interim periods beginning on January 1, 2025, and was implemented on a retrospective basis. Refer to Note 15—Business Segments for further discussion of the Company's segments.
Accounting Pronouncements Yet to be Adopted: ASU No. 2023-09, Income Taxes (Topic 740): Improvements to Income Tax Disclosures, adds disclosure requirements to disaggregate information related to the effective tax rate reconciliation and information on income taxes paid. The disclosures will enhance the assessment of the entity’s operations and related tax risks.
This standard is effective for the Company for annual periods beginning on January 1, 2025, and will be implemented on a prospective basis. The Company does not expect the standard will have a material impact on the consolidated financial statements.
ASU No. 2024-03, Income Statement—Reporting Comprehensive Income—Expense Disaggregation Disclosures (Subtopic 220-40): Disaggregation of Income Statement Expenses, adds disclosure requirements to disaggregate information related to an entity's income statement. The disclosures will allow for enhanced transparency of an entity's expenses.
This standard is effective for the Company for annual periods beginning on January 1, 2027. The Company is evaluating the standard.
Note 2—Statutory Accounting
Our U.S. based life insurance subsidiaries of Globe Life are required to file statutory financial statements with state insurance regulatory authorities. Accounting principles used to prepare these statutory financial statements differ from GAAP. Consolidated net income and shareholders’ equity (capital and surplus) on a statutory basis for the insurance subsidiaries were as follows:
| | | | | | | | | | | | | | | | | | | | | | | | | | | | | |
| Net Income | | Shareholders’ Equity |
| Year Ended December 31, | | At December 31, |
| 2024 | | 2023 | | 2022 | | 2024 | | 2023 |
| Life insurance subsidiaries | $ | 688,665 | | | $ | 434,952 | | | $ | 444,294 | | | $ | 1,690,663 | | | $ | 1,660,104 | |
The excess, if any, of shareholders' equity of the insurance subsidiaries on a GAAP basis over that determined on a statutory basis is not available for distribution by the insurance subsidiaries to the Parent Company without regulatory approval. Insurance subsidiaries’ statutory capital and surplus necessary to satisfy regulatory requirements in the aggregate was $627 million at December 31, 2024. More information on the restrictions on the payment of dividends can be found in Note 13—Shareholders' Equity.
The Company's statutory financial statements are presented on the basis of accounting practices prescribed by the insurance department of the state of domicile of each insurance subsidiary. While all states have adopted the
Globe Life Inc.
Notes to Consolidated Financial Statements
(Dollar amounts in thousands, except per share data)
National Association of Insurance Commissioners’ ("NAIC") statutory accounting practices ("NAIC SAP") as the basis for statutory accounting, certain states have retained prescribed practices of their respective insurance code or administrative code which can differ from NAIC SAP. For Globe Life's life insurance companies, there are no significant differences between NAIC SAP and the accounting practices prescribed by the states of domicile.
Globe Life Inc.
Notes to Consolidated Financial Statements
(Dollar amounts in thousands, except per share data)
Note 3—Supplemental Information about Changes to Accumulated Other Comprehensive Income
Components of Accumulated Other Comprehensive Income: An analysis of the change in balance by component of Accumulated Other Comprehensive Income is as follows for each of the years 2022 through 2024:
| | | | | | | | | | | | | | | | | | | | | | | | | | | | | |
| Available for Sale Assets | | Future Policy Benefits | | Foreign Exchange | | Pension Adjustments | | Total |
| For the year ended December 31, 2022: | | | | | | | | | |
| Balance at January 1, 2022 | $ | 2,765,290 | | | $ | (6,915,910) | | | $ | 19,248 | | | $ | (103,676) | | | $ | (4,235,048) | |
| Other comprehensive income (loss) before reclassifications, net of tax | (4,211,540) | | | 5,546,706 | | | (20,929) | | | 94,055 | | | 1,408,292 | |
| Reclassifications, net of tax | 25,578 | | | — | | | — | | | 10,865 | | | 36,443 | |
| Other comprehensive income (loss) | (4,185,962) | | | 5,546,706 | | | (20,929) | | | 104,920 | | | 1,444,735 | |
Balance at December 31, 2022 | (1,420,672) | | | (1,369,204) | | | (1,681) | | | 1,244 | | | (2,790,313) | |
| | | | | | | | | |
| For the year ended December 31, 2023: | | | | | | | | | |
| Other comprehensive income (loss) before reclassifications, net of tax | 529,688 | | | (578,187) | | | 6,400 | | | (3,087) | | | (45,186) | |
| Reclassifications, net of tax | 63,388 | | | — | | | — | | | (308) | | | 63,080 | |
| Other comprehensive income (loss) | 593,076 | | | (578,187) | | | 6,400 | | | (3,395) | | | 17,894 | |
Balance at December 31, 2023 | (827,596) | | | (1,947,391) | | | 4,719 | | | (2,151) | | | (2,772,419) | |
| | | | | | | | | |
| For the year ended December 31, 2024: | | | | | | | | | |
| Other comprehensive income (loss) before reclassifications, net of tax | (494,996) | | | 1,238,349 | | | (26,476) | | | 22,474 | | | 739,351 | |
| Reclassifications, net of tax | 2,974 | | | — | | | — | | | 374 | | | 3,348 | |
| Other comprehensive income (loss) | (492,022) | | | 1,238,349 | | | (26,476) | | | 22,848 | | | 742,699 | |
Balance at December 31, 2024 | $ | (1,319,618) | | | $ | (709,042) | | | $ | (21,757) | | | $ | 20,697 | | | $ | (2,029,720) | |
Globe Life Inc.
Notes to Consolidated Financial Statements
(Dollar amounts in thousands, except per share data)
Reclassification adjustments: Reclassification adjustments out of Accumulated Other Comprehensive Income are presented below for the three years ended December 31, 2024.
| | | | | | | | | | | | | | | | | | | | | | | | | | |
| | | Year Ended December 31, | | Affected line items in the Statement of Operations |
| Component Line Item | | 2024 | | 2023 | | 2022 | |
| Unrealized investment (gains) losses on available for sale assets: | | | | | | | | |
| Realized (gains) losses | | $ | 14,843 | | | $ | 84,416 | | | $ | 32,165 | | | Realized (gains) losses |
| Amortization of (discount) premium | | (11,079) | | | (4,178) | | | 212 | | | Net investment income |
| Total before tax | | 3,764 | | | 80,238 | | | 32,377 | | | |
| Tax | | (790) | | | (16,850) | | | (6,799) | | | Income taxes |
| Total after-tax | | 2,974 | | | 63,388 | | | 25,578 | | | |
| Pension adjustments: | | | | | | | | |
| Amortization of prior service cost | | 1,071 | | | 1,075 | | | 1,077 | | | Other operating expense |
| Amortization of actuarial (gain) loss | | (597) | | | (1,465) | | | 12,677 | | | Other operating expense |
| Total before tax | | 474 | | | (390) | | | 13,754 | | | |
| Tax | | (100) | | | 82 | | | (2,889) | | | Income taxes |
| Total after-tax | | 374 | | | (308) | | | 10,865 | | | |
Total reclassification (after-tax) | | $ | 3,348 | | | $ | 63,080 | | | $ | 36,443 | | | |
Globe Life Inc.
Notes to Consolidated Financial Statements
(Dollar amounts in thousands, except per share data)
Note 4—Investments
Portfolio Composition: Summaries of fixed maturities available for sale by amortized cost, fair value, and allowance for credit losses at December 31, 2024 and 2023, and the corresponding amounts of gross unrealized gains and losses recognized in accumulated other comprehensive income (loss) are as follows. Redeemable preferred stock is included within "Corporates, by sector."
| | | | | | | | | | | | | | | | | | | | | | | | | | | | | | | | | | | |
| At December 31, 2024 |
|
Amortized
Cost | | Allowance for Credit Losses | | Gross
Unrealized
Gains | | Gross
Unrealized
Losses | | Fair Value(1) | | % of Total Fixed Maturities(2) |
| Fixed maturities available for sale: | | | | | | | | | | | |
| U.S. Government direct, guaranteed, and government-sponsored enterprises | $ | 401,753 | | | $ | — | | | $ | 1 | | | $ | (42,794) | | | $ | 358,960 | | | 2 | |
| States, municipalities, and political subdivisions | 3,300,901 | | | — | | | 20,662 | | | (534,759) | | | 2,786,804 | | | 16 | |
| Foreign governments | 36,883 | | | — | | | 18 | | | (8,870) | | | 28,031 | | | — | |
| Corporates, by sector: | | | | | | | | | | | |
| Industrials | 7,889,074 | | | (7,098) | | | 105,610 | | | (805,330) | | | 7,182,256 | | | 42 | |
| Financial | 5,006,375 | | | — | | | 82,598 | | | (413,043) | | | 4,675,930 | | | 27 | |
| | | | | | | | | | | |
| Utilities | 2,081,366 | | | — | | | 39,716 | | | (118,007) | | | 2,003,075 | | | 12 | |
| Total corporates | 14,976,815 | | | (7,098) | | | 227,924 | | | (1,336,380) | | | 13,861,261 | | | 81 | |
| Collateralized debt obligations | 36,923 | | | — | | | 5,943 | | | — | | | 42,866 | | | — | |
| Other asset-backed securities | 82,534 | | | (3,297) | | | 39 | | | (2,186) | | | 77,090 | | | 1 | |
Total fixed maturities | $ | 18,835,809 | | | $ | (10,395) | | | $ | 254,587 | | | $ | (1,924,989) | | | $ | 17,155,012 | | | 100 | |
(1)Amount reported in the balance sheet.
(2)At fair value.
| | | | | | | | | | | | | | | | | | | | | | | | | | | | | | | | | | | |
| At December 31, 2023 |
| Amortized
Cost | | Allowance for Credit Losses | | Gross
Unrealized
Gains | | Gross
Unrealized
Losses | | Fair Value(1) | | % of Total Fixed Maturities(2) |
| Fixed maturities available for sale: | | | | | | | | | | | |
| U.S. Government direct, guaranteed, and government-sponsored enterprises | $ | 398,450 | | | $ | — | | | $ | 7 | | | $ | (32,306) | | | $ | 366,151 | | | 2 | |
| States, municipalities, and political subdivisions | 3,296,305 | | | — | | | 47,346 | | | (403,329) | | | 2,940,322 | | | 16 | |
| Foreign governments | 44,453 | | | — | | | 1 | | | (10,348) | | | 34,106 | | | — | |
| Corporates, by sector: | | | | | | | | | | | |
| Industrials | 8,016,126 | | | (7,115) | | | 213,078 | | | (566,847) | | | 7,655,242 | | | 43 | |
| Financial | 5,028,151 | | | — | | | 112,368 | | | (388,340) | | | 4,752,179 | | | 27 | |
| | | | | | | | | | | |
| Utilities | 2,017,967 | | | — | | | 73,925 | | | (94,130) | | | 1,997,762 | | | 11 | |
| Total corporates | 15,062,244 | | | (7,115) | | | 399,371 | | | (1,049,317) | | | 14,405,183 | | | 81 | |
| Collateralized debt obligations | 37,110 | | | — | | | 5,036 | | | — | | | 42,146 | | | — | |
| Other asset-backed securities | 86,352 | | | — | | | 3 | | | (4,057) | | | 82,298 | | | 1 | |
Total fixed maturities | $ | 18,924,914 | | | $ | (7,115) | | | $ | 451,764 | | | $ | (1,499,357) | | | $ | 17,870,206 | | | 100 | |
(1)Amount reported in the balance sheet.
(2)At fair value.
At December 31, 2024 and 2023, the Company had unfunded commitments of $167 million and $0, respectively, in fixed maturity investments.
Globe Life Inc.
Notes to Consolidated Financial Statements
(Dollar amounts in thousands, except per share data)
The Company has exposure to real estate investment trusts with an average rating of BBB+, which had a fair value of $405 million (2% of the total fixed maturity portfolio) and $425 million (2% of the total fixed maturity portfolio) at December 31, 2024 and December 31, 2023, respectively.
A schedule of fixed maturities available for sale by contractual maturity date at December 31, 2024, is shown below on an amortized cost basis, net of allowance for credit losses, and on a fair value basis. Actual disposition dates could differ from contractual maturities due to call or prepayment provisions.
| | | | | | | | | | | |
| At December 31, 2024 |
| Amortized
Cost, net | | Fair
Value |
| Fixed maturities available for sale: | | | |
| Due in one year or less | $ | 126,902 | | | $ | 126,643 | |
| Due after one year through five years | 728,959 | | | 741,488 | |
| Due after five years through ten years | 1,869,090 | | | 1,873,345 | |
| Due after ten years through twenty years | 8,729,774 | | | 8,118,486 | |
| Due after twenty years | 7,254,503 | | | 6,175,067 | |
| Mortgage-backed and asset-backed securities | 116,186 | | | 119,983 | |
| $ | 18,825,414 | | | $ | 17,155,012 | |
Analysis of investment operations: "Net investment income" for the three years ended December 31, 2024 is summarized as follows:
| | | | | | | | | | | | | | | | | |
| Year Ended December 31, |
| 2024 | | 2023 | | 2022 |
| Fixed maturities available for sale | $ | 981,439 | | | $ | 944,628 | | | $ | 910,284 | |
| Policy loans | 52,625 | | | 49,011 | | | 46,586 | |
| Mortgage loans | 27,809 | | | 19,541 | | | 9,719 | |
Other long-term investments(1) | 81,834 | | | 54,655 | | | 40,837 | |
| Short-term investments | 11,151 | | | 6,322 | | | 2,156 | |
| 1,154,858 | | | 1,074,157 | | | 1,009,582 | |
| Less investment expense | (19,227) | | | (17,273) | | | (17,782) | |
Net investment income | $ | 1,135,631 | | | $ | 1,056,884 | | | $ | 991,800 | |
(1)For the years ended 2024, 2023, and 2022, the investment funds, accounted for under the fair value option method, recorded $74.8 million, $52.3 million, and $40.3 million, respectively, in net investment income. Refer to Other Long-Term Investments below for further discussion on the investment funds.
Selected information about sales of fixed maturities available for sale is as follows:
| | | | | | | | | | | | | | | | | |
| Year Ended December 31, |
| 2024 | | 2023 | | 2022 |
| Fixed maturities available for sale: | | | | | |
Proceeds from sales(1) | $ | 1,207,237 | | | $ | 602,556 | | | $ | 390,392 | |
| Gross realized gains | 21,196 | | | 5,554 | | | 1,296 | |
| Gross realized losses | (32,956) | | | (80,823) | | | (57,996) | |
(1)Includes unsettled trades of $866 thousand, $0, and $0 as of December 31, 2024, 2023, and 2022, respectively.
Globe Life Inc.
Notes to Consolidated Financial Statements
(Dollar amounts in thousands, except per share data)
An analysis of "realized gains (losses)" is as follows: | | | | | | | | | | | | | | | | | |
| Year Ended December 31, |
| 2024 | | 2023 | | 2022 |
| Realized investment gains (losses): | | | | | |
| Fixed maturities available for sale: | | | | | |
Sales and other(1) | $ | (11,563) | | | $ | (77,301) | | | $ | (32,552) | |
| Provision for credit losses | (3,280) | | | (7,115) | | | 387 | |
| Fair value option—change in fair value | (16,717) | | | 15,102 | | | (29,353) | |
| Mortgage loans | (3,972) | | | (5,603) | | | (963) | |
| Other investments | 2,936 | | | 1,792 | | | 4,681 | |
Realized gains (losses) from investments | (32,596) | | | (73,125) | | | (57,800) | |
| | | | | |
Other gains (losses) | 8,408 | | | 7,449 | | | (18,748) | |
Total realized gains (losses) | (24,188) | | | (65,676) | | | (76,548) | |
| Applicable tax | 5,080 | | | 13,792 | | | 16,075 | |
Realized gains (losses), net of tax | $ | (19,108) | | | $ | (51,884) | | | $ | (60,473) | |
(1)For the years ended 2024, 2023, and 2022, the Company recorded $105.6 million, $50.9 million, and $147.6 million of issuer-initiated exchanges of fixed maturities (noncash transactions) that resulted in $0, $(1.9) million, and $1.9 million, respectively, in realized gains (losses). During the year ended December 31, 2023, the Company sold $66 million in securities relating to holdings in Signature Bank New York and First Republic Bank, which entered receivership during the first half of 2023.
An analysis of the net change in unrealized investment gains (losses) is as follows: | | | | | | | | | | | | | | | | | |
| Year Ended December 31, |
| 2024 | | 2023 | | 2022 |
| Change in unrealized investment gains (losses) on: | | | | | |
| Fixed maturities available for sale | $ | (622,809) | | | $ | 750,734 | | | $ | (5,298,692) | |
Globe Life Inc.
Notes to Consolidated Financial Statements
(Dollar amounts in thousands, except per share data)
Fair value measurements: The following tables represent the fair value of fixed maturities measured on a recurring basis at December 31, 2024 and 2023: | | | | | | | | | | | | | | | | | | | | | | | |
| Fair Value Measurement at December 31, 2024: |
| Quoted Prices in
Active Markets
for Identical
Assets (Level 1) | | Significant Other
Observable
Inputs (Level 2) | | Significant
Unobservable
Inputs (Level 3) | | Total Fair
Value |
| Fixed maturities available for sale | | | | | | | |
| U.S. Government direct, guaranteed, and government-sponsored enterprises | $ | — | | | $ | 358,960 | | | $ | — | | | $ | 358,960 | |
| States, municipalities, and political subdivisions | — | | | 2,786,804 | | | — | | | 2,786,804 | |
| Foreign governments | — | | | 28,031 | | | — | | | 28,031 | |
| Corporates, by sector: | | | | | | | |
| Industrials | — | | | 6,998,900 | | | 183,356 | | | 7,182,256 | |
| Financial | — | | | 4,551,737 | | | 124,193 | | | 4,675,930 | |
| Utilities | — | | | 1,890,559 | | | 112,516 | | | 2,003,075 | |
| | | | | | | |
| Total corporates | — | | | 13,441,196 | | | 420,065 | | | 13,861,261 | |
| Collateralized debt obligations | — | | | — | | | 42,866 | | | 42,866 | |
| Other asset-backed securities | — | | | 65,907 | | | 11,183 | | | 77,090 | |
Total fixed maturities | $ | — | | | $ | 16,680,898 | | | $ | 474,114 | | | $ | 17,155,012 | |
| Percentage of total | — | % | | 97 | % | | 3 | % | | 100 | % |
| | | | | | | | | | | | | | | | | | | | | | | |
| Fair Value Measurement at December 31, 2023: |
| Quoted Prices in
Active Markets
for Identical
Assets (Level 1) | | Significant Other
Observable
Inputs (Level 2) | | Significant
Unobservable
Inputs (Level 3) | | Total Fair
Value |
| Fixed maturities available for sale | | | | | | | |
| U.S. Government direct, guaranteed, and government-sponsored enterprises | $ | — | | | $ | 366,151 | | | $ | — | | | $ | 366,151 | |
| States, municipalities, and political subdivisions | — | | | 2,940,322 | | | — | | | 2,940,322 | |
| Foreign governments | — | | | 34,106 | | | — | | | 34,106 | |
| Corporates, by sector: | | | | | | | |
| Industrials | — | | | 7,440,493 | | | 214,749 | | | 7,655,242 | |
| Financial | — | | | 4,621,160 | | | 131,019 | | | 4,752,179 | |
| Utilities | — | | | 1,888,797 | | | 108,965 | | | 1,997,762 | |
| | | | | | | |
| Total corporates | — | | | 13,950,450 | | | 454,733 | | | 14,405,183 | |
| Collateralized debt obligations | — | | | — | | | 42,146 | | | 42,146 | |
| Other asset-backed securities | — | | | 82,298 | | | — | | | 82,298 | |
Total fixed maturities | $ | — | | | $ | 17,373,327 | | | $ | 496,879 | | | $ | 17,870,206 | |
| Percentage of total | — | % | | 97 | % | | 3 | % | | 100 | % |
The following tables represent changes in fixed maturities measured at fair value on a recurring basis using significant unobservable inputs (Level 3):
Globe Life Inc.
Notes to Consolidated Financial Statements
(Dollar amounts in thousands, except per share data)
| | | | | | | | | | | | | | | | | | | | | | | |
| Analysis of Changes in Fair Value Measurements Using Significant Unobservable Inputs (Level 3) |
| Asset-
backed
Securities | | Collateralized
Debt
Obligations | | Corporates | | Total |
Balance at January 1, 2022 | $ | — | | | $ | 63,505 | | | $ | 641,688 | | | $ | 705,193 | |
| | | | | | | |
Included in realized gains / losses | — | | | — | | | — | | | — | |
| Included in other comprehensive income | — | | | (13,771) | | | (91,385) | | | (105,156) | |
Acquisitions(1) | — | | | — | | | — | | | — | |
| Sales | — | | | — | | | — | | | — | |
| Amortization | — | | | 4,519 | | | 7 | | | 4,526 | |
Other(2) | — | | | (3,889) | | | (72,227) | | | (76,116) | |
Transfers into Level 3(3) | — | | | — | | | — | | | — | |
Transfers out of Level 3(3) | — | | | — | | | — | | | — | |
Balance at December 31, 2022 | — | | | 50,364 | | | 478,083 | | | 528,447 | |
| | | | | | | |
Included in realized gains / losses | — | | | — | | | — | | | — | |
| Included in other comprehensive income | — | | | (8,230) | | | 4,541 | | | (3,689) | |
Acquisitions(1) | — | | | — | | | — | | | — | |
| Sales | — | | | — | | | — | | | — | |
| Amortization | — | | | 4,569 | | | 155 | | | 4,724 | |
Other(2) | — | | | (4,557) | | | (28,046) | | | (32,603) | |
Transfers into Level 3(3) | — | | | — | | | — | | | — | |
Transfers out of Level 3(3) | — | | | — | | | — | | | — | |
Balance at December 31, 2023 | — | | | 42,146 | | | 454,733 | | | 496,879 | |
| | | | | | | |
Included in realized gains / losses | — | | | — | | | 740 | | | 740 | |
| Included in other comprehensive income | 37 | | | 907 | | | (4,607) | | | (3,663) | |
Acquisitions(1) | 8,948 | | | — | | | 14,800 | | | 23,748 | |
| Sales | — | | | — | | | — | | | — | |
| Amortization | — | | | 4,548 | | | 217 | | | 4,765 | |
Other(2) | — | | | (4,735) | | | (45,818) | | | (50,553) | |
Transfers into Level 3(3) | 2,198 | | | — | | | — | | | 2,198 | |
Transfers out of Level 3(3) | — | | | — | | | — | | | — | |
Balance at December 31, 2024 | $ | 11,183 | | | $ | 42,866 | | | $ | 420,065 | | | $ | 474,114 | |
| | | | | | | |
(1)Acquisitions of Level 3 investments in each of the years 2022 through 2024 are comprised of private placement fixed maturities and equities. (2)Includes capitalized interest, foreign exchange adjustments, and principal repayments. (3)Considered to be transferred at the end of the period. Transfers into Level 3 occur when observable inputs are no longer available. Transfers out of Level 3 occur when observable inputs become available. |
| | | | | | | |
| Changes in unrealized gains and losses for Level 3 securities during the period included in accumulated other comprehensive income for assets held at the end of the reporting period: |
| Asset-
backed
Securities | | Collateralized
Debt
Obligations | | Corporates | | Total |
2022 | $ | — | | | $ | (13,771) | | | $ | (91,385) | | | $ | (105,156) | |
2023 | — | | | (8,230) | | | 4,541 | | | (3,689) | |
2024 | 37 | | | 907 | | | (4,607) | | | (3,663) | |
Globe Life Inc.
Notes to Consolidated Financial Statements
(Dollar amounts in thousands, except per share data)
Transfers between levels within the hierarchy occur when there are changes in the observability of the inputs and market data. Transfers into Level 3 occur when there is little unobservable market activity for the asset/liability as of the measurement date and the Company is required to rely upon internally-developed assumptions or third parties. Transfers out of Level 3 occur when quoted prices in active markets becomes available for identical assets/ liabilities or the ability to corroborate by observable market data.
The following table represents quantitative information about Level 3 fair value measurements:
| | | | | | | | | | | | | | | | | | | | | | | | | | | | | |
| Quantitative Information about Level 3 Fair Value Measurements |
| As of December 31, 2024 |
| Fair Value | | Valuation
Techniques | | Significant Unobservable
Input | | Range | | Weighted- Average(1) |
| Private placement fixed maturities | $ | 420,065 | | | Determination of credit spread | | Credit rating | | B to AA | | BBB+ |
| | | | | | | | | |
| | | | | | | | | |
| Collateralized debt obligations | 42,866 | | | Discounted Cash Flows | | Discount rate | | 11.75% | | 11.75% |
| Asset-backed securities | 11,183 | | | Determination of credit spread | | Credit rating | | CC - BBB | | BB |
| | | | | | | | | |
| $ | 474,114 | | | | | | | | | |
(1)Unobservable inputs were weighted by the relative fair value of the instruments.
Private placement fixed maturities and asset-backed securities are valued based on the contractual cash flows discounted by a yield determined as a treasury benchmark rate adjusted for a credit spread. The credit spread is developed from observable indices for similar securities and unobservable indices for private securities or private comparable securities for corresponding credit ratings. The credit ratings for the securities may be considered unobservable inputs, as they are private letter ratings issued by a nationally recognized statistical rating organization or are assigned by the third-party investment manager based on a quantitative and qualitative assessment of the credit underwritten. A higher (lower) credit rating would result in a higher (lower) valuation.
The collateral underlying collateralized debt obligations consists primarily of trust preferred securities issued by banks and insurance companies. Collateralized debt obligations are valued at the present value of expected future cash flows using an unobservable discount rate. Expected cash flows are determined by scheduling the projected repayment of the collateral assuming no future defaults, deferrals, or recoveries. The discount rate is risk-adjusted to take these items into account. A significant increase (decrease) in the discount rate will produce a significant decrease (increase) in fair value. Additionally, a significant increase (decrease) in the cash flow expectations would result in a significant increase (decrease) in fair value. For more information regarding valuation procedures, please refer to Note 1—Significant Accounting Policies under the caption Fair Value Measurements, Investments in Securities.
Unrealized Loss Analysis: The following table discloses information about fixed maturities available for sale in an unrealized loss position.
| | | | | | | | | | | | | | | | | |
| Less than Twelve Months | | Twelve Months or Longer | | Total |
| Number of issues (CUSIPs) held: | | | | | |
| As of December 31, 2024 | 705 | | | 1,498 | | | 2,203 | |
| As of December 31, 2023 | 151 | | | 1,614 | | | 1,765 | |
Globe Life's entire fixed maturity portfolio consisted of 2,552 issues by 1,014 different issuers at December 31, 2024 and 2,473 issues by 980 different issuers at December 31, 2023. The weighted-average quality rating of all unrealized loss positions at amortized cost was A- as of December 31, 2024 and December 31, 2023.
Globe Life Inc.
Notes to Consolidated Financial Statements
(Dollar amounts in thousands, except per share data)
The following tables disclose unrealized investment losses by class and major sector of fixed maturities available for sale at December 31, 2024 and December 31, 2023.
Analysis of Gross Unrealized Investment Losses | | | | | | | | | | | | | | | | | | | | | | | | | | | | | | | | | | | |
| At December 31, 2024 |
| Less than Twelve Months | | Twelve Months or Longer | | Total |
| Fair
Value | | Unrealized
Loss | | Fair
Value | | Unrealized
Loss | | Fair
Value | | Unrealized
Loss |
| Fixed maturities available for sale: | | | | | | | | | | | |
| Investment grade securities: | | | | | | | | | | | |
| U.S. Government direct, guaranteed, and government-sponsored enterprises | $ | 11,268 | | | $ | (290) | | | $ | 347,527 | | | $ | (42,504) | | | $ | 358,795 | | | $ | (42,794) | |
| States, municipalities, and political subdivisions | 778,244 | | | (32,894) | | | 1,532,264 | | | (501,865) | | | 2,310,508 | | | (534,759) | |
| Foreign governments | — | | | — | | | 24,925 | | | (8,870) | | | 24,925 | | | (8,870) | |
| Corporates, by sector: | | | | | | | | | | | |
| Industrials | 1,487,940 | | | (73,404) | | | 3,433,034 | | | (690,920) | | | 4,920,974 | | | (764,324) | |
| Financial | 961,932 | | | (52,946) | | | 1,785,130 | | | (333,873) | | | 2,747,062 | | | (386,819) | |
| | | | | | | | | | | |
| Utilities | 546,965 | | | (20,214) | | | 540,077 | | | (90,996) | | | 1,087,042 | | | (111,210) | |
| Total corporates | 2,996,837 | | | (146,564) | | | 5,758,241 | | | (1,115,789) | | | 8,755,078 | | | (1,262,353) | |
| Collateralized debt obligations | — | | | — | | | — | | | — | | | — | | | — | |
| Other asset-backed securities | 23,231 | | | (95) | | | 42,639 | | | (2,091) | | | 65,870 | | | (2,186) | |
| Total investment grade securities | 3,809,580 | | | (179,843) | | | 7,705,596 | | | (1,671,119) | | | 11,515,176 | | | (1,850,962) | |
| | | | | | | | | | | |
| Below investment grade securities: | | | | | | | | | | | |
| | | | | | | | | | | |
| | | | | | | | | | | |
| Corporates, by sector: | | | | | | | | | | | |
| Industrials | 54,199 | | | (2,656) | | | 142,638 | | | (38,350) | | | 196,837 | | | (41,006) | |
| Financial | 2,990 | | | (53) | | | 126,811 | | | (26,171) | | | 129,801 | | | (26,224) | |
| | | | | | | | | | | |
| Utilities | 19,263 | | | (1,113) | | | 24,003 | | | (5,684) | | | 43,266 | | | (6,797) | |
| Total corporates | 76,452 | | | (3,822) | | | 293,452 | | | (70,205) | | | 369,904 | | | (74,027) | |
| Collateralized debt obligations | — | | | — | | | — | | | — | | | — | | | — | |
| Other asset-backed securities | — | | | — | | | 2,198 | | | — | | | 2,198 | | | — | |
| Total below investment grade securities | 76,452 | | | (3,822) | | | 295,650 | | | (70,205) | | | 372,102 | | | (74,027) | |
Total fixed maturities | $ | 3,886,032 | | | $ | (183,665) | | | $ | 8,001,246 | | | $ | (1,741,324) | | | $ | 11,887,278 | | | $ | (1,924,989) | |
Gross unrealized losses may fluctuate quarter over quarter due to factors in the market that affect our holdings, such as changes in interest rates or credit spreads. The Company considers many factors when determining whether an allowance for a credit loss should be recorded. While the Company holds securities that may be in an unrealized loss position from time to time, Globe Life does not generally intend to sell and it is unlikely that the Company will be required to sell the fixed maturities prior to their anticipated recovery or maturity due to the strong cash flows generated by its insurance operations.
Globe Life Inc.
Notes to Consolidated Financial Statements
(Dollar amounts in thousands, except per share data)
Analysis of Gross Unrealized Investment Losses | | | | | | | | | | | | | | | | | | | | | | | | | | | | | | | | | | | |
| At December 31, 2023 |
| Less than Twelve Months | | Twelve Months or Longer | | Total |
| Fair
Value | | Unrealized
Loss | | Fair
Value | | Unrealized
Loss | | Fair
Value | | Unrealized
Loss |
| Fixed maturities available for sale: | | | | | | | | | | | |
| Investment grade securities: | | | | | | | | | | | |
| U.S. Government direct, guaranteed, and government-sponsored enterprises | $ | — | | | $ | — | | | $ | 364,006 | | | $ | (32,306) | | | $ | 364,006 | | | $ | (32,306) | |
| States, municipalities, and political subdivisions | 252,800 | | | (3,520) | | | 1,610,163 | | | (399,809) | | | 1,862,963 | | | (403,329) | |
| Foreign governments | — | | | — | | | 32,591 | | | (10,348) | | | 32,591 | | | (10,348) | |
| Corporates, by sector: | | | | | | | | | | | |
| Industrials | 191,573 | | | (3,881) | | | 4,317,827 | | | (530,011) | | | 4,509,400 | | | (533,892) | |
| Financial | 242,099 | | | (6,584) | | | 2,341,424 | | | (339,628) | | | 2,583,523 | | | (346,212) | |
| | | | | | | | | | | |
| Utilities | 81,194 | | | (648) | | | 686,043 | | | (91,959) | | | 767,237 | | | (92,607) | |
| Total corporates | 514,866 | | | (11,113) | | | 7,345,294 | | | (961,598) | | | 7,860,160 | | | (972,711) | |
| Collateralized debt obligations | — | | | — | | | — | | | — | | | — | | | — | |
| Other asset-backed securities | — | | | — | | | 70,956 | | | (3,648) | | | 70,956 | | | (3,648) | |
| Total investment grade securities | 767,666 | | | (14,633) | | | 9,423,010 | | | (1,407,709) | | | 10,190,676 | | | (1,422,342) | |
| | | | | | | | | | | |
| Below investment grade securities: | | | | | | | | | | | |
| | | | | | | | | | | |
| | | | | | | | | | | |
| Corporates, by sector: | | | | | | | | | | | |
| Industrials | 10,745 | | | (199) | | | 145,697 | | | (32,756) | | | 156,442 | | | (32,955) | |
| Financial | 25,563 | | | (2,602) | | | 151,190 | | | (39,526) | | | 176,753 | | | (42,128) | |
| | | | | | | | | | | |
| Utilities | — | | | — | | | 19,654 | | | (1,523) | | | 19,654 | | | (1,523) | |
| Total corporates | 36,308 | | | (2,801) | | | 316,541 | | | (73,805) | | | 352,849 | | | (76,606) | |
| Collateralized debt obligations | — | | | — | | | — | | | — | | | — | | | — | |
| Other asset-backed securities | — | | | — | | | 11,288 | | | (409) | | | 11,288 | | | (409) | |
| Total below investment grade securities | 36,308 | | | (2,801) | | | 327,829 | | | (74,214) | | | 364,137 | | | (77,015) | |
Total fixed maturities | $ | 803,974 | | | $ | (17,434) | | | $ | 9,750,839 | | | $ | (1,481,923) | | | $ | 10,554,813 | | | $ | (1,499,357) | |
Gross unrealized losses increased from $1.50 billion at December 31, 2023 to $1.92 billion at December 31, 2024, an increase of $426 million. The increase in the gross unrealized losses from the prior year was primarily attributable to the increase in market interest rates.
Globe Life Inc.
Notes to Consolidated Financial Statements
(Dollar amounts in thousands, except per share data)
Fixed Maturities, Allowance for Credit Losses: A summary of the activity in the allowance for credit losses is as follows. Refer to Note 1—Significant Accounting Policies for factors considered in the recording of the allowance for credit losses. | | | | | | | | | | | | | | |
| | Year Ended December 31, |
| | 2024 | | 2023 |
Allowance for credit losses beginning balance | | $ | 7,115 | | | $ | — | |
| Additions to allowance for which credit losses were not previously recorded | | 3,297 | | | 72,508 | |
| Additions (reductions) to allowance for fixed maturities that previously had an allowance | | (17) | | | (65,393) | |
| Reduction of allowance for which the Company intends to sell or more likely than not will be required to sell or sold during the period | | — | | | — | |
Allowance for credit losses ending balance | | $ | 10,395 | | | $ | 7,115 | |
As of December 31, 2024, the Company had one fixed maturity security in non-accrual status with an amortized cost of $5.5 million and an allowance of $3.3 million. As of December 31, 2023, there were no fixed maturities in non-accrual status. During the year ended December 31, 2023, the Company sold $66 million in securities for which there was a provision for credit losses relating to holdings in Signature Bank New York and First Republic Bank, which entered receivership during the first half of 2023.
Concentrations of Credit Risk: Globe Life maintains a diversified investment portfolio with limited concentration in any given issuer. At December 31, 2024, the investment portfolio, at fair value, consisted of the following:
| | | | | |
| Investment grade fixed maturities: | |
| Corporates | 68 | % |
| States, municipalities, and political subdivisions | 14 | |
| U.S. Government direct, guaranteed, and government-sponsored enterprises | 2 | |
| Other | 1 | |
| |
| Below investment grade fixed maturities: | |
| Corporates | 2 | |
| |
| |
| |
| 87 | |
| |
| Other | |
| Policy loans, which are secured by the underlying insurance policy values | 4 | |
| Other investments | 9 | |
| 100 | % |
As of December 31, 2024, state and municipal governments represented 14% of invested assets at fair value. Such investments are made throughout the U.S. At December 31, 2024, the state and municipal bond portfolio at fair value was invested in securities issued within the following states: Texas (21%), California (10%), New York (7%), Florida (5%), and Pennsylvania (4%). Otherwise, there was no concentration within any given state greater than 4%.
Globe Life Inc.
Notes to Consolidated Financial Statements
(Dollar amounts in thousands, except per share data)
Corporate fixed maturities represent 71% of Globe Life's invested assets. These investments are spread across a wide range of industries. Below are the ten largest industry concentrations held in the portfolio of corporate fixed maturities at December 31, 2024, based on fair value:
| | | | | |
| Insurance | 18 | % |
| Electric utilities | 11 | |
| Banks | 7 | |
| Oil and natural gas pipelines | 6 | |
| Chemicals | 5 | |
| Transportation | 4 | |
| Telecommunications | 3 | |
| Food | 3 | |
| Diversified financial services | 3 | |
| Real estate investment trusts | 3 | |
At December 31, 2024, 2% of invested assets at fair value were represented by fixed maturities rated below investment grade. Par value of these investments was $648 million, amortized cost was $529 million, and fair value was $462 million. While these investments could be subject to additional credit risk, such risk should generally be reflected in their fair value.
Securities, cash, and short-term investments held on deposit with various state and federal regulatory authorities had an amortized cost and fair value, respectively, of $1.0 billion and $955 million at December 31, 2024 and $1.0 billion and $983 million at December 31, 2023.
Mortgage Loans (commercial mortgage loans): Summaries of commercial mortgage loans by property type and geographical location at December 31, 2024 and 2023 are as follows:
| | | | | | | | | | | | | | | | | | | | | | | |
| 2024 | | 2023 |
| Carrying Value | | % of Total | | Carrying Value | | % of Total |
| Property type: | | | | | | | |
| Multi-family | $ | 111,234 | | | 28 | | | $ | 116,299 | | | 42 | |
| Industrial | 110,456 | | | 28 | | | 57,267 | | | 20 | |
| Retail | 65,612 | | | 16 | | | 23,925 | | | 9 | |
| Hospitality | 73,931 | | | 19 | | | 43,897 | | | 16 | |
| Mixed use | 35,960 | | | 9 | | | 34,749 | | | 12 | |
| Office | 6,539 | | | 2 | | | 6,734 | | | 2 | |
| | | | | | | |
| Total recorded investment | 403,732 | | | 102 | | | 282,871 | | | 101 | |
| Less allowance for credit losses | (7,644) | | | (2) | | | (3,672) | | | (1) | |
Carrying value, net of allowance for credit losses | $ | 396,088 | | | 100 | | | $ | 279,199 | | | 100 | |
Globe Life Inc.
Notes to Consolidated Financial Statements
(Dollar amounts in thousands, except per share data)
| | | | | | | | | | | | | | | | | | | | | | | |
| 2024 | | 2023 |
| Carrying Value | | % of Total | | Carrying Value | | % of Total |
| Geographic location: | | | | | | | |
| Texas | $ | 75,131 | | | 19 | | | $ | 45,111 | | | 16 | |
| Florida | 63,308 | | | 16 | | | 48,233 | | | 17 | |
| New Jersey | 51,744 | | | 13 | | | 44,574 | | | 16 | |
| California | 48,371 | | | 12 | | | 54,721 | | | 20 | |
| Alabama | 35,850 | | | 9 | | | 11,003 | | | 4 | |
| New York | 34,975 | | | 9 | | | 20,284 | | | 7 | |
| Other | 94,353 | | | 24 | | | 58,945 | | | 21 | |
| Total recorded investment | 403,732 | | | 102 | | | 282,871 | | | 101 | |
| Less allowance for credit losses | (7,644) | | | (2) | | | (3,672) | | | (1) | |
Carrying value, net of allowance for credit losses | $ | 396,088 | | | 100 | | | $ | 279,199 | | | 100 | |
The following tables are reflective of the key factors, debt service coverage ratios, and loan-to-value ("LTV") ratios that are utilized by management to monitor the performance of the portfolios. The Company only makes new investments in commercial mortgage loans that have a LTV ratio less than 80%. LTV ratios that exceed 80% are generally as a result of decreases in the valuation of the underlying property. Generally, a higher LTV ratio and a lower debt service coverage ratio can potentially equate to higher risk of loss.
| | | | | | | | | | | | | | | | | | | | | | | | | | | | | |
| December 31, 2024 |
| Recorded Investment |
| Debt Service Coverage Ratios(1) | | | | |
| <1.00x | | 1.00x—1.20x | | >1.20x | | Total | | % of Gross Total |
Loan-to-value ratio(2): | | | | | | | | | |
| Less than 70% | $ | 88,507 | | | $ | 64,494 | | | $ | 196,867 | | | $ | 349,868 | | | 87 | |
| 70% to 80% | — | | | — | | | — | | | — | | | — | |
| 81% to 90% | — | | | — | | | — | | | — | | | — | |
| Greater than 90% | 16,136 | | | 37,728 | | | — | | | 53,864 | | | 13 | |
| Total | $ | 104,643 | | | $ | 102,222 | | | $ | 196,867 | | | 403,732 | | | 100 | |
| Less allowance for credit losses | | (7,644) | | | |
Total, net of allowance for credit losses | | $ | 396,088 | | | |
(1)Annual net operating income divided by annual mortgage debt service (principal and interest).
(2)Loan balance divided by stabilized appraised value at origination, including planned renovations and stabilized occupancy. Updated internal valuations are used when a loan is materially underperforming.
Globe Life Inc.
Notes to Consolidated Financial Statements
(Dollar amounts in thousands, except per share data)
| | | | | | | | | | | | | | | | | | | | | | | | | | | | | |
| December 31, 2023 |
| Recorded Investment |
| Debt Service Coverage Ratios(1) | | | | |
| <1.00x | | 1.00x—1.20x | | >1.20x | | Total | | % of Gross Total |
Loan-to-value ratio(2): | | | | | | | | | |
| Less than 70% | $ | 27,091 | | | $ | 180,761 | | | $ | 58,364 | | | $ | 266,216 | | | 94 | |
| 70% to 80% | — | | | — | | | — | | | — | | | — | |
| 81% to 90% | 8,468 | | | — | | | 1,153 | | | 9,621 | | | 3 | |
| Greater than 90% | 7,034 | | | — | | | — | | | 7,034 | | | 3 | |
| Total | $ | 42,593 | | | $ | 180,761 | | | $ | 59,517 | | | 282,871 | | | 100 | |
| Less allowance for credit losses | | (3,672) | | | |
Total, net of allowance for credit losses | | $ | 279,199 | | | |
(1)Annual net operating income divided by annual mortgage debt service (principal and interest).
(2)Loan balance divided by stabilized appraised value at origination, including planned renovations and stabilized occupancy. Updated internal valuations are used when a loan is materially underperforming.
As of December 31, 2024, the Company had 35 loans in the portfolio. During the quarter, the Company evaluated its commercial mortgage loan portfolio on both an individual and pooling basis to determine the allowance for credit losses and determined six loans were collateral dependent or likely to foreclose. The allowance for credit losses on the six loans was determined using the practical expedient which was based on an estimate of fair value of the underlying collateral plus costs to sell the asset. The total principal balance of the six loans was $53.9 million and the allowance for these loans using the practical expedient was $3.9 million as of December 31, 2024. For the year ended December 31, 2024, the allowance for credit losses increased by $4.0 million to $7.6 million.
| | | | | | | | | | | | | | |
| | Year Ended December 31, |
| | 2024 | | 2023 |
Allowance for credit losses beginning balance | | $ | 3,672 | | | $ | 1,789 | |
| | | | |
| Provision (reversal) for credit losses | | 3,972 | | | 1,883 | |
| | | | |
Allowance for credit losses ending balance | | $ | 7,644 | | | $ | 3,672 | |
As of December 31, 2024, there were five commercial mortgage loans in non-accrual status with an outstanding principal balance of $53 million. There was also one delinquent commercial mortgage loan with outstanding interest of $31 thousand. At December 31, 2023 the Company had no commercial mortgage loans in non-accrual status. The Company's unfunded commitment balance to commercial loan borrowers was $22 million as of December 31, 2024.
Other Long-Term Investments: Other long-term investments consist of the following assets:
| | | | | | | | | | | |
| December 31, |
| 2024 | | 2023 |
| Investment funds | $ | 986,766 | | | $ | 795,583 | |
| Company-owned life insurance | 202,734 | | | — | |
| Other | 46,259 | | | 40,295 | |
Total | $ | 1,235,759 | | | $ | 835,878 | |
Globe Life Inc.
Notes to Consolidated Financial Statements
(Dollar amounts in thousands, except per share data)
The following table presents additional information about the Company's investment funds as of December 31, 2024 and December 31, 2023 at fair value:
| | | | | | | | | | | | | | | | | | | | | | | | | | | |
| | Fair Value | | Unfunded Commitments(2) | | | |
| Investment Category | | 2024 | | 2023 | | 2024 | | Redemption Term/Notice(1) | |
| | | | | | | | | |
| | | | | | | | | |
| | | | | | | | | |
| | | | | | | | | |
| | | | | | | | | |
| Commercial mortgage loans | | $ | 566,142 | | | $ | 411,315 | | | $ | 189,725 | | | Fully redeemable and non-redeemable with varying terms. | |
| Opportunistic and private credit | | 202,008 | | | 181,410 | | | 191,192 | | | Fully redeemable and non-redeemable with varying terms. | |
| | | | | | | | | |
| | | | | | | | | |
| Infrastructure | | 179,627 | | | 165,887 | | | — | | | Fully redeemable and non-redeemable with varying terms. | |
| | | | | | | | | |
| | | | | | | | | |
| Other | | 38,989 | | | 36,971 | | | 52,479 | | | Non-redeemable with varying terms | |
| Total investment funds | | $ | 986,766 | | | $ | 795,583 | | | $ | 433,396 | | | | |
(1) Non-redeemable funds generally have an expected life of 7 to 12 years from fund closing with extension options of 1 to 4 years. Redemptions are paid out throughout the life of the funds at the General Partner's discretion. Redeemable funds can generally be redeemed over 6 to 36 months upon request from limited partners.
(2) Unfunded commitments include unfunded balances during the investment period. After an investment period ends, the fund can call capital based on limited and specified reasons. As of December 31, 2024, unfunded commitments totaled $645 million, including funds past the investment period.
The Company had $239 million of capital called during the period from existing investment funds, as compared to $154 million in 2023. The Company's unfunded commitments were $433 million as of December 31, 2024.
Note 5—Commitments and Contingencies
Reinsurance: Insurance affiliates of Globe Life reinsure a portion of insurance risk that is in excess of their retention limits. Current retention limits for new business written on ordinary life insurance range up to $500 thousand per life. Life insurance ceded represented 0.3% of total life insurance in force at December 31, 2024 and 2023. Insurance ceded on life and accident and health products represented 0.2% of premium income for 2024 and 2023. In the fourth quarter of 2024, the Company entered into a coinsurance agreement to cede a majority of its annuity business to a third-party insurer. Annuities ceded represented 68% of our direct annuity balance. The insurance affiliates of Globe Life would be liable for the reinsured risks ceded to other companies to the extent that such reinsuring companies are unable to meet their obligations.
Insurance affiliates also assume insurance risks of other external companies. Life reinsurance assumed represented 0.8% and 0.9% of life insurance in force at December 31, 2024 and 2023, respectively, and reinsurance assumed on life and accident and health products represented 0.9% and 1.3% of premium income for 2024 and 2023, respectively.
Leases: Globe Life primarily leases office space and other equipment under a variety of operating lease arrangements.
Rental expense for the three years ended December 31, 2024 is as follows:
| | | | | | | | | | | | | | | | | |
| Year Ended December 31, |
| 2024 | | 2023 | | 2022 |
| Rental expense | $ | 3,208 | | | $ | 3,519 | | | $ | 4,239 | |
Globe Life Inc.
Notes to Consolidated Financial Statements
(Dollar amounts in thousands, except per share data)
Future minimum rental commitments required under operating leases having remaining noncancelable lease terms in excess of one year at December 31, 2024 were as follows:
| | | | | | | | | | | | | | | | | | | | | | | | | | | | | | | | | | | |
| Year Ended December 31, |
| 2025 | | 2026 | | 2027 | | 2028 | | 2029 | | Thereafter |
| Operating lease commitments | $ | 2,117 | | | $ | 1,883 | | | $ | 1,417 | | | $ | 867 | | | $ | 487 | | | $ | 4,195 | |
Purchase Commitments: Globe Life has various long-term noncancelable purchase commitments as well as commitments to provide capital for low-income housing tax credit interests. See further discussion related to tax credits in Note 1—Significant Accounting Policies.
| | | | | | | | | | | | | | | | | | | | | | | | | | | | | | | | | | | |
| Year Ended December 31, |
| 2025 | | 2026 | | 2027 | | 2028 | | 2029 | | Thereafter |
Purchase commitments(1) | $ | 47,538 | | | $ | 29,742 | | | $ | 34,443 | | | $ | 15,266 | | | $ | 11,440 | | | $ | 203,445 | |
(1) Includes low-income housing tax credits with non-funded commitments of $76 million at December 31, 2024.
Investments: Globe Life is committed to invest under certain contracts related to investments in fixed maturities, limited partnerships and commercial mortgage loans. See Note 4—Investments for unfunded commitment table.
Guarantees: At December 31, 2024, Globe Life had no guarantee agreements which were either Parent Company guarantees of subsidiary obligations to a third party or Parent Company guarantees of obligations between wholly-owned subsidiaries. As of December 31, 2024, Globe Life had no liability with respect to these guarantees.
Letters of credit—Globe Life has guaranteed letters of credit in connection with its credit facility with a group of banks as disclosed in Note 12—Debt. The letters of credit were issued by TMK Re, Ltd., a wholly-owned subsidiary, to secure TMK Re, Ltd.’s obligation for claims on certain policies reinsured by TMK Re, Ltd. that were sold by other Globe Life insurance companies. These letters of credit facilitate TMK Re, Ltd.’s ability to reinsure the business of Globe Life's insurance carriers. The agreement was amended on March 29, 2024 and now expires in 2029. The maximum amount of letters of credit available is $250 million. The Parent Company would be liable to the extent that TMK Re, Ltd. does not pay the reinsured party. The amount of letters of credit outstanding at December 31, 2024 was $115 million.
Unclaimed Property Audits: Globe Life subsidiaries are currently the subject of audits regarding the identification, reporting and escheatment of unclaimed property arising from life insurance policies and a limited number of annuity contracts. These audits are being conducted by private entities that have contracted with forty-seven states through their respective Departments of Revenue, and have not resulted in any financial assessment from any state nor indicated any liability. The audits are wide-ranging and seek large amounts of data regarding claims handling, procedures, and payments of contract benefits arising from unreported death claims. No estimate of range can be made at this time for loss contingencies related to possible administrative penalties or amounts that could be payable to the states for the escheatment of abandoned property.
Litigation: Globe Life Inc. and its subsidiaries, in common with the insurance industry in general, are subject to litigation, including: putative class action litigation; alleged breaches of contract; torts, including bad faith and fraud claims based on alleged wrongful or fraudulent acts of agents of the Parent Company's insurance subsidiaries; alleged employment discrimination; alleged worker misclassification; and miscellaneous other causes of action. Based upon information presently available, and in light of legal and other factual defenses available to the Parent Company and its subsidiaries, management does not believe that it is reasonably possible that such litigation will have a material adverse effect on Globe Life Inc.'s financial condition, future operating results or liquidity; however, assessing the eventual outcome of litigation necessarily involves forward-looking speculation as to judgments to be made by judges, juries and appellate courts in the future. This bespeaks caution, particularly in states with reputations for high punitive damage verdicts.
Globe Life Inc.
Notes to Consolidated Financial Statements
(Dollar amounts in thousands, except per share data)
On July 22, 2022, putative class and collective action litigation was filed against Arias Agencies and American Income (collectively, “Defendants”) in United States District Court for the Western District of Pennsylvania (David Burkes v. Arias Agencies and American Income Life Insurance Company, Case No. 2:22-cv-1054). The complaint alleges that insurance agent trainees should have been classified as employees, and after contracting should have been classified as employees instead of independent contractors. Plaintiff David Burkes is a former Pennsylvania independent sales agent and asserts claims under Pennsylvania law on behalf of a putative class of all individuals who trained to become and/or worked as sales agents for American Income in the three years prior to July 22, 2022 through case conclusion. Burkes makes claims (a) under the Pennsylvania Minimum Wage Act and the Pennsylvania Wage Payment and Collection Law for the alleged failure to pay minimum wage, alleged failure to pay for time spent in training, alleged failure to pay for missed meals and rest breaks, allegedly requiring putative class members to pay for work-related expenses, and allegedly subjecting putative class members to “chargebacks”; (b) for unjust enrichment for allegedly benefiting from the uncompensated labor of putative class members; and (c) for the rescission of putative class members’ agent contracts. Burkes also asserts a collective action on behalf of the same group of individuals for minimum wage, overtime, liquidated damages, and attorney’s fees and costs under the Fair Labor Standards Act for the three years prior to July 22, 2022 through case conclusion, as well as a claim that American Income allegedly did not keep accurate records of hours worked by sales agents. On January 26, 2023, the Court entered an order compelling Burkes to arbitrate his claims on an individual basis and staying the case pending completion of arbitration. Burkes’ individual claims, as well as the individual claims of other former agents who are members of the putative class, are currently pending in arbitration. While no assurances can be made, at present management does not believe that it is reasonably possible or probable that this matter will result in a material loss.
On April 4, 2023, putative class action litigation was filed against National Income Life Insurance Company (“National Income”) in New York Supreme Court by plaintiffs Melissa K. Goppert, Sarah Valente, James O’Neill, Jennifer Abe, and Emily Herendeen (“Plaintiffs”) (Goppert, et al. v. National Income Life Insurance Company, Index No. 153096/2023). Plaintiffs are former National Income independent sales agents who allege they should have been classified as employees and assert claims under New York state law on behalf of a putative class of former independent sales agents and individuals who trained to become independent sale agents since March 2017. Plaintiffs make claims under New York’s Minimum Wage Law (NYLL § 633 and 12 NYCRR § 142-2.1); Overtime Compensation Law (NYLL § 633 and 12 NYCRR § 142-2.2); and “Spread of Hours” Law (12 NYCRR § 142-2.4) for the alleged failure to pay minimum wages and overtime pay, including for time spent in training, and attorney’s fees and costs. National Income filed a motion to compel arbitration of each Plaintiff’s claims on an individual basis, which the Court granted in full on January 11, 2024, and on February 7, 2024, Plaintiffs filed a notice of appeal of the Court’s order. On November 21, 2024, the Court’s order compelling arbitration was affirmed.
On September 1, 2023, plaintiff Miné Caglar Cost (“Plaintiff”) filed a complaint against American Income in the Superior Court of the State of California for the County of Los Angeles, asserting a single claim for violation of the Private Attorneys General Act (“PAGA”) (Cost v. American Income Life Insurance Company, et al., Case No. 23SMCV04113). Plaintiff is a former California independent insurance sales agent who alleges one cause of action for civil penalties under PAGA arising out of alleged violations of the wage-and-hour provisions of the California Labor Code stemming from American Income’s alleged misclassification of Plaintiff and other California-based sales agents as independent contractors. American Income filed a motion to compel arbitration on an individual basis and stay the representative component of Plaintiff’s claims, to which Plaintiff stipulated. On December 12, 2023, the Court approved the parties’ stipulation to compel the matter to individual arbitration and stayed the case pending the completion of the individual arbitration, to commence on October 27, 2025.
On November 30, 2023, Globe Life Inc. and its subsidiary, American Income, received subpoenas from the U.S. Attorney’s Office for the Western District of Pennsylvania, seeking documents relating to sales practices by certain independent sales agents contracted to sell American Income policies. Globe Life Inc. and American Income continue to fully cooperate in responding to the Department of Justice’s requests. The Department of Justice has not asserted any claims or made allegations against Globe Life Inc. and American Income, and Globe Life Inc. currently is not aware that any legal proceedings are contemplated by governmental authorities. While no assurances can be made, at present management does not believe that it is reasonably possible or probable that this matter will result in a material loss.
Globe Life Inc.
Notes to Consolidated Financial Statements
(Dollar amounts in thousands, except per share data)
In April 2024, Globe Life Inc. received an inquiry from the SEC's Fort Worth Regional Office requesting information related to recent short seller reports making allegations about Globe Life Inc. Globe Life Inc. has provided information in response to the SEC’s requests and continues to cooperate fully with the SEC. At this time, the SEC has not asserted any claims against Globe Life Inc. or indicated that it intends to do so. While no assurances can be made, at present management does not believe that it is reasonably possible or probable that this matter will result in a material loss.
On April 30, 2024, a putative securities class action was filed against Globe Life Inc. and six of its current/former executives and directors in the United States District Court for the Eastern District of Texas (City of Miami Gen. Emp. & Sanitation Emp. Ret. Trust, et al. v. Globe Life Inc., et al., Case No. 4:24-cv-00376). On July 24, 2024, the Court appointed Lead Plaintiffs and Lead Counsel for the putative class of shareholders. The Lead Plaintiffs filed a Consolidated Complaint on October 4, 2024 that asserts claims under §§ 10(b), 20(a), and 20(A) of the Securities Exchange Act of 1934 and SEC Rules 10b-5(a), 10b-5(b), and 10b-5(c) promulgated thereunder, on behalf of a putative class of purchasers of Globe Life Inc.'s securities from May 8, 2019 through April 10, 2024. The Consolidated Complaint adds four additional executives as defendants and alleges that certain of Globe Life Inc.'s disclosures about financial performance and certain other public statements during the putative class period were materially false or misleading. Defendants filed a motion to dismiss the litigation on December 3, 2024. Globe Life Inc. plans to vigorously defend against the lawsuit. Pursuant to Globe Life Inc.'s Restated Certificate of Incorporation and indemnification agreements with the named defendants, Globe Life Inc. has agreed to indemnify those defendants for all expenses and losses related to the litigation, subject to the terms of those indemnification agreements. The outcome of litigation of this type is inherently uncertain, and there is always the possibility that a Court rules in a manner that is adverse to the interests of Globe Life Inc. and the individual defendants. However, the amount of any such loss in that outcome cannot be reasonably estimated at this time. Further, management cannot reasonably estimate whether an outcome on the putative class action will be resolved in the near term.
Also pending in the Eastern District of Texas is a consolidated shareholder derivative suit that is closely related to the putative securities class action disclosed above (the “City of Miami Matter”). On November 7, 2024, Globe Life Inc. shareholder Jui Cheng Hsiao filed a shareholder derivative complaint against Globe Life Inc. as a nominal defendant, as well as certain current and former Globe Life Inc. executives and members of Globe Life Inc.’s Board of Directors. On November 14, 2024, Globe Life Inc. shareholder Gautam Jadhav filed a shareholder derivative complaint against the same set of defendants. Each shareholder derivative complaint asserts one claim for breach of fiduciary duty against the individual defendants and alleges that the individual defendants breached their fiduciary duties to Globe Life Inc. by causing or permitting Globe Life Inc. to make misleading statements about Globe Life Inc.’s performance and financial results. The allegations are substantially similar to the allegations made in the City of Miami Matter and derive from the Fuzzy Panda short seller report. On November 25, 2024, the two shareholder plaintiffs moved to consolidate the two actions into one action and the Court granted the motion on January 3, 2025 (In re Globe Life Inc. Stockholder Derivative Litigation, Lead Case No. 4:24-cv-00993-ALM (E.D. Tex.)). The case is before the same Court as the City of Miami Matter. On January 16, 2025, the parties filed a joint motion to stay such proceedings pending the Court’s resolution of the motion to dismiss filed by Globe Life Inc. in the City of Miami Matter. The Court granted such joint motion to stay the proceedings on January 25, 2025.
On September 26, 2024, Globe Life Inc. and its subsidiary, American Income, were notified by the EEOC that the EEOC conducted an investigation of charges filed against Globe Life Inc. and/or American Income by five former sales agents and one then-current sales agent. The EEOC asserts that there is reasonable cause to believe the six complainants were employees, not independent contractors, of Globe Life Inc. and/or American Income and were discriminated against on the basis of sex, and that one complainant was also discriminated against on the basis of race. In addition, the EEOC asserts that there is reasonable cause to believe that a class of female workers were employees, not independent contractors, and were subject to unlawful conduct which also constitutes a pattern-or-practice of discrimination. The EEOC’s investigative findings are not binding on Globe Life Inc. The EEOC’s procedures provide for a conciliation process that has concluded without achieving a resolution. The EEOC may elect to file a lawsuit in federal court on behalf of the workers based on the alleged statutory violations. The EEOC has not filed any legal proceedings at this time. In the event the EEOC elects to pursue any claims in court, Globe Life Inc. intends to defend against any such lawsuit vigorously. The outcome of litigation of this type would be inherently uncertain and cannot be reasonably estimated or determined at this time. There is always the possibility that a Court rules in a manner that is adverse to the interests of Globe Life Inc.
Globe Life Inc.
Notes to Consolidated Financial Statements
(Dollar amounts in thousands, except per share data)
Note 6—Policy Liabilities
The liability for future policy benefits is determined based on the net level premium method, which requires the liability be calculated as the present value of estimated future policyholder benefits and the related termination expenses, less the present value of estimated future net premiums to be collected from policyholders.
The following tables summarize balances and changes in the net liability for future policy benefits, before reinsurance, for traditional life long-duration contracts for the three years ended December 31, 2024:
| | | | | | | | | | | | | | | | | | | | | | | | | | | | | | | | |
| | Life |
| | Present value of expected future net premiums |
| | American Income | | DTC | | Liberty National | | Other | | Total |
Balance at January 1, 2022 | | $ | 4,925,192 | | | $ | 7,264,905 | | | $ | 1,332,469 | | | $ | 559,972 | | | $ | 14,082,538 | |
| Beginning balance at original discount rates | | 3,906,098 | | | 5,533,741 | | | 1,040,242 | | | 416,141 | | | 10,896,222 | |
| Effect of changes in assumptions on future cash flows | | 34,266 | | | 79,571 | | | 17,719 | | | 35,214 | | | 166,770 | |
| Effect of actual variances from expected experience | | (121,230) | | | (264,286) | | | (20,027) | | | (10,929) | | | (416,472) | |
Adjusted balance at January 1, 2022 | | 3,819,134 | | | 5,349,026 | | | 1,037,934 | | | 440,426 | | | 10,646,520 | |
Issuances(1) | | 760,857 | | | 663,790 | | | 104,982 | | | 31,815 | | | 1,561,444 | |
Interest accrual(2) | | 176,102 | | | 273,494 | | | 51,326 | | | 21,150 | | | 522,072 | |
Net premiums collected(3) | | (491,168) | | | (605,446) | | | (128,119) | | | (44,182) | | | (1,268,915) | |
| | | | | | | | | | |
| Effect of changes in the foreign exchange rate | | (18,202) | | | — | | | — | | | — | | | (18,202) | |
| Ending balance at original discount rates | | 4,246,723 | | | 5,680,864 | | | 1,066,123 | | | 449,209 | | | 11,442,919 | |
| | | | | | | | | | |
| Effect of change from original to current discount rates | | 26,433 | | | 229,360 | | | 28,284 | | | 21,532 | | | 305,609 | |
Balance at December 31, 2022 | | $ | 4,273,156 | | | $ | 5,910,224 | | | $ | 1,094,407 | | | $ | 470,741 | | | $ | 11,748,528 | |
| | | | | | | | | | |
Balance at January 1, 2023 | | $ | 4,273,156 | | | $ | 5,910,224 | | | $ | 1,094,407 | | | $ | 470,741 | | | $ | 11,748,528 | |
| Beginning balance at original discount rates | | 4,246,723 | | | 5,680,864 | | | 1,066,123 | | | 449,209 | | | 11,442,919 | |
| Effect of changes in assumptions on future cash flows | | 14,265 | | | 36,170 | | | 5,178 | | | 8,419 | | | 64,032 | |
| Effect of actual variances from expected experience | | (155,293) | | | (306,004) | | | (40,961) | | | (18,441) | | | (520,699) | |
Adjusted balance at January 1, 2023 | | 4,105,695 | | | 5,411,030 | | | 1,030,340 | | | 439,187 | | | 10,986,252 | |
Issuances(1) | | 733,702 | | | 579,363 | | | 127,048 | | | 27,959 | | | 1,468,072 | |
Interest accrual(2) | | 200,363 | | | 287,615 | | | 54,147 | | | 22,804 | | | 564,929 | |
Net premiums collected(3) | | (521,521) | | | (613,749) | | | (133,704) | | | (46,001) | | | (1,314,975) | |
| | | | | | | | | | |
| Effect of changes in the foreign exchange rate | | 5,090 | | | — | | | — | | | — | | | 5,090 | |
| Ending balance at original discount rates | | 4,523,329 | | | 5,664,259 | | | 1,077,831 | | | 443,949 | | | 11,709,368 | |
| | | | | | | | | | |
| Effect of change from original to current discount rates | | 158,559 | | | 388,392 | | | 51,885 | | | 34,103 | | | 632,939 | |
Balance at December 31, 2023 | | $ | 4,681,888 | | | $ | 6,052,651 | | | $ | 1,129,716 | | | $ | 478,052 | | | $ | 12,342,307 | |
| | | | | | | | | | |
| | |
| |
| | | | | | | | | |
Globe Life Inc.
Notes to Consolidated Financial Statements
(Dollar amounts in thousands, except per share data)
| | | | | | | | | | | | | | | | | | | | | | | | | | | | | | | | |
| | Life |
| | Present value of expected future net premiums |
| | American Income | | DTC | | Liberty National | | Other | | Total |
Balance at January 1, 2024 | | $ | 4,681,888 | | | $ | 6,052,651 | | | $ | 1,129,716 | | | $ | 478,052 | | | $ | 12,342,307 | |
| Beginning balance at original discount rates | | 4,523,329 | | | 5,664,259 | | | 1,077,831 | | | 443,949 | | | 11,709,368 | |
| Effect of changes in assumptions on future cash flows | | (82,348) | | | (28,366) | | | (29,292) | | | (982) | | | (140,988) | |
| Effect of actual variances from expected experience | | (229,772) | | | (311,659) | | | (42,620) | | | (14,436) | | | (598,487) | |
Adjusted balance at January 1, 2024 | | 4,211,209 | | | 5,324,234 | | | 1,005,919 | | | 428,531 | | | 10,969,893 | |
Issuances(1) | | 798,952 | | | 491,440 | | | 120,683 | | | 23,911 | | | 1,434,986 | |
Interest accrual(2) | | 220,959 | | | 292,843 | | | 55,198 | | | 22,875 | | | 591,875 | |
Net premiums collected(3) | | (551,066) | | | (603,605) | | | (134,778) | | | (45,041) | | | (1,334,490) | |
| | | | | | | | | | |
| Effect of changes in the foreign exchange rate | | (23,344) | | | — | | | — | | | — | | | (23,344) | |
| Ending balance at original discount rates | | 4,656,710 | | | 5,504,912 | | | 1,047,022 | | | 430,276 | | | 11,638,920 | |
| | | | | | | | | | |
| Effect of change from original to current discount rates | | (10,793) | | | 117,994 | | | 1,425 | | | 9,771 | | | 118,397 | |
Balance at December 31, 2024 | | $ | 4,645,917 | | | $ | 5,622,906 | | | $ | 1,048,447 | | | $ | 440,047 | | | $ | 11,757,317 | |
(1)Issuances represent the present value, using the original discount rate, of the expected net premiums related to new policies issued during each respective period.
(2)The interest accrual is the interest earned on the beginning present value of the expected net premiums, as well as the interest on actual net premiums earned during the period, using the original interest rate.
(3)Net premiums collected represent the product of the current period net premium ratio and the gross premiums collected during the period on the in-force business.
Globe Life Inc.
Notes to Consolidated Financial Statements
(Dollar amounts in thousands, except per share data)
| | | | | | | | | | | | | | | | | | | | | | | | | | | | | | | | |
| | Life |
| Present value of expected future policy benefits |
| American Income | | DTC | | Liberty National | | Other | | Total |
Balance at January 1, 2022 | | $ | 11,773,519 | | | $ | 11,859,408 | | | $ | 4,542,697 | | | $ | 5,488,684 | | | $ | 33,664,308 | |
| Beginning balance at original discount rates | | 7,744,201 | | | 8,157,259 | | | 3,206,164 | | | 3,267,306 | | | 22,374,930 | |
| Effect of changes in assumptions on future cash flows | | 48,534 | | | 104,910 | | | 33,457 | | | 39,725 | | | 226,626 | |
| Effect of actual variances from expected experience | | (127,626) | | | (259,285) | | | (18,535) | | | (12,787) | | | (418,233) | |
Adjusted balance at January 1, 2022 | | 7,665,109 | | | 8,002,884 | | | 3,221,086 | | | 3,294,244 | | | 22,183,323 | |
Issuances(1) | | 760,856 | | | 663,786 | | | 105,006 | | | 31,815 | | | 1,561,463 | |
Interest accrual(2) | | 410,201 | | | 433,611 | | | 169,578 | | | 195,792 | | | 1,209,182 | |
Benefit payments(3) | | (382,142) | | | (622,389) | | | (222,690) | | | (118,147) | | | (1,345,368) | |
| | | | | | | | | | |
| Effect of changes in the foreign exchange rate | | (44,263) | | | — | | | — | | | — | | | (44,263) | |
| Ending balance at original discount rates | | 8,409,761 | | | 8,477,892 | | | 3,272,980 | | | 3,403,704 | | | 23,564,337 | |
| Effect of change from original to current discount rates | | 709,343 | | | 747,559 | | | 156,276 | | | 572,446 | | | 2,185,624 | |
Balance at December 31, 2022 | | $ | 9,119,104 | | | $ | 9,225,451 | | | $ | 3,429,256 | | | $ | 3,976,150 | | | $ | 25,749,961 | |
| | | | | | | | | | |
| | |
| |
| | | | | | | | | |
Balance at January 1, 2023 | | $ | 9,119,104 | | | $ | 9,225,451 | | | $ | 3,429,256 | | | $ | 3,976,150 | | | $ | 25,749,961 | |
| Beginning balance at original discount rates | | 8,409,761 | | | 8,477,892 | | | 3,272,980 | | | 3,403,704 | | | 23,564,337 | |
| Effect of changes in assumptions on future cash flows | | 13,344 | | | 34,407 | | | 6,156 | | | 11,661 | | | 65,568 | |
| Effect of actual variances from expected experience | | (164,900) | | | (318,687) | | | (46,341) | | | (24,195) | | | (554,123) | |
Adjusted balance at January 1, 2023 | | 8,258,205 | | | 8,193,612 | | | 3,232,795 | | | 3,391,170 | | | 23,075,782 | |
Issuances(1) | | 733,700 | | | 579,365 | | | 127,062 | | | 27,959 | | | 1,468,086 | |
Interest accrual(2) | | 452,640 | | | 458,587 | | | 174,995 | | | 204,083 | | | 1,290,305 | |
Benefit payments(3) | | (396,031) | | | (574,812) | | | (196,600) | | | (116,353) | | | (1,283,796) | |
| | | | | | | | | | |
| Effect of changes in the foreign exchange rate | | 13,319 | | | — | | | — | | | — | | | 13,319 | |
| Ending balance at original discount rates | | 9,061,833 | | | 8,656,752 | | | 3,338,252 | | | 3,506,859 | | | 24,563,696 | |
| Effect of change from original to current discount rates | | 1,101,794 | | | 1,057,764 | | | 267,140 | | | 732,764 | | | 3,159,462 | |
Balance at December 31, 2023 | | $ | 10,163,627 | | | $ | 9,714,516 | | | $ | 3,605,392 | | | $ | 4,239,623 | | | $ | 27,723,158 | |
| | | | | | | | | | |
Balance at January 1, 2024 | | $ | 10,163,627 | | | $ | 9,714,516 | | | $ | 3,605,392 | | | $ | 4,239,623 | | | $ | 27,723,158 | |
| Beginning balance at original discount rates | | 9,061,833 | | | 8,656,752 | | | 3,338,252 | | | 3,506,859 | | | 24,563,696 | |
| Effect of changes in assumptions on future cash flows | | (104,498) | | | (50,106) | | | (41,836) | | | (2,027) | | | (198,467) | |
| Effect of actual variances from expected experience | | (251,310) | | | (335,087) | | | (50,759) | | | (20,954) | | | (658,110) | |
Adjusted balance at January 1, 2024 | | 8,706,025 | | | 8,271,559 | | | 3,245,657 | | | 3,483,878 | | | 23,707,119 | |
Issuances(1) | | 794,225 | | | 491,437 | | | 120,702 | | | 23,912 | | | 1,430,276 | |
Interest accrual(2) | | 492,966 | | | 474,451 | | | 178,617 | | | 210,344 | | | 1,356,378 | |
Benefit payments(3) | | (426,723) | | | (576,499) | | | (204,757) | | | (136,066) | | | (1,344,045) | |
| | | | | | | | | | |
| Effect of changes in the foreign exchange rate | | (57,904) | | | — | | | — | | | — | | | (57,904) | |
| Ending balance at original discount rates | | 9,508,589 | | | 8,660,948 | | | 3,340,219 | | | 3,582,068 | | | 25,091,824 | |
| Effect of change from original to current discount rates | | 362,103 | | | 464,164 | | | 37,298 | | | 378,895 | | | 1,242,460 | |
Balance at December 31, 2024 | | $ | 9,870,692 | | | $ | 9,125,112 | | | $ | 3,377,517 | | | $ | 3,960,963 | | | $ | 26,334,284 | |
(1)Issuances represent the present value, using the original discount rate, of the expected future policy benefits related to new policies issued during each respective period.
(2)The interest accrual is the interest earned on the beginning present value of the expected future policy benefits, as well as the interest on actual benefits and expenses paid during the period, using the original interest rate.
(3)Benefit payments represent the release of the present value, using the original discount rate, of the actual future policy benefits incurred during the period due to death, surrender, and maturity benefit payments based on the revised expected assumptions.
Globe Life Inc.
Notes to Consolidated Financial Statements
(Dollar amounts in thousands, except per share data)
| | | | | | | | | | | | | | | | | | | | | | | | | | | | | | | | |
| | Life |
| | Net liability for future policy benefits as of December 31, 2022 |
| | American Income | | DTC | | Liberty National | | Other | | Total |
Net liability for future policy benefits at original discount rates | | $ | 4,163,038 | | | $ | 2,797,028 | | | $ | 2,206,857 | | | $ | 2,954,495 | | | $ | 12,121,418 | |
| Effect of changes in discount rate assumptions | | 682,910 | | | 518,199 | | | 127,992 | | | 550,914 | | | 1,880,015 | |
Other adjustments(1) | | 115 | | | 4,913 | | | 7,638 | | | 48 | | | 12,714 | |
Net liability for future policy benefits, after other adjustments, at current discount rates | | 4,846,063 | | | 3,320,140 | | | 2,342,487 | | | 3,505,457 | | | 14,014,147 | |
| Reinsurance recoverable | | (123) | | | — | | | (7,477) | | | (34,830) | | | (42,430) | |
Net liability for future policy benefits, after reinsurance recoverable, at current discount rates | | $ | 4,845,940 | | | $ | 3,320,140 | | | $ | 2,335,010 | | | $ | 3,470,627 | | | $ | 13,971,717 | |
(1)Other adjustments include the Company's effects of capping and flooring the liability (guidance requires an amount not less than zero at the calculation level of the liability for future policy benefits).
| | | | | | | | | | | | | | | | | | | | | | | | | | | | | | | | |
| | Life |
| | Net liability for future policy benefits as of December 31, 2023 |
| | American Income | | DTC | | Liberty National | | Other | | Total |
Net liability for future policy benefits at original discount rates | | $ | 4,538,504 | | | $ | 2,992,493 | | | $ | 2,260,421 | | | $ | 3,062,910 | | | $ | 12,854,328 | |
| Effect of changes in discount rate assumptions | | 943,235 | | | 669,372 | | | 215,255 | | | 698,661 | | | 2,526,523 | |
Other adjustments(1) | | 297 | | | 3,315 | | | 5,764 | | | 62 | | | 9,438 | |
Net liability for future policy benefits, after other adjustments, at current discount rates | | 5,482,036 | | | 3,665,180 | | | 2,481,440 | | | 3,761,633 | | | 15,390,289 | |
| Reinsurance recoverable | | (141) | | | — | | | (7,719) | | | (37,848) | | | (45,708) | |
Net liability for future policy benefits, after reinsurance recoverable, at current discount rates | | $ | 5,481,895 | | | $ | 3,665,180 | | | $ | 2,473,721 | | | $ | 3,723,785 | | | $ | 15,344,581 | |
(1)Other adjustments include the Company's effects of capping and flooring the liability (guidance requires an amount not less than zero at the calculation level of the liability for future policy benefits).
| | | | | | | | | | | | | | | | | | | | | | | | | | | | | | | | |
| | Life |
| | Net liability for future policy benefits as of December 31, 2024 |
| | American Income | | DTC | | Liberty National | | Other | | Total |
Net liability for future policy benefits at original discount rates | | $ | 4,851,879 | | | $ | 3,156,036 | | | $ | 2,293,197 | | | $ | 3,151,792 | | | $ | 13,452,904 | |
| Effect of changes in discount rate assumptions | | 372,896 | | | 346,170 | | | 35,873 | | | 369,124 | | | 1,124,063 | |
Other adjustments(1) | | 122 | | | 18 | | | — | | | 33 | | | 173 | |
Net liability for future policy benefits, after other adjustments, at current discount rates | | 5,224,897 | | | 3,502,224 | | | 2,329,070 | | | 3,520,949 | | | 14,577,140 | |
| Reinsurance recoverable | | (167) | | | — | | | (7,953) | | | (35,368) | | | (43,488) | |
Net liability for future policy benefits, after reinsurance recoverable, at current discount rates | | $ | 5,224,730 | | | $ | 3,502,224 | | | $ | 2,321,117 | | | $ | 3,485,581 | | | $ | 14,533,652 | |
(1)Other adjustments include the Company's effects of capping and flooring the liability (guidance requires an amount not less than zero at the calculation level of the liability for future policy benefits).
Globe Life Inc.
Notes to Consolidated Financial Statements
(Dollar amounts in thousands, except per share data)
The following tables summarize balances and changes in the net liability for future policy benefits for long-duration health contracts for the three years ended December 31, 2024:
| | | | | | | | | | | | | | | | | | | | | | | | | | | | | | | | | | | | | | |
| | Health |
| | Present value of expected future net premiums |
| | United American | | Family Heritage | | Liberty National | | American Income | | DTC | | Total |
Balance at January 1, 2022 | | $ | 3,611,659 | | | $ | 1,944,714 | | | $ | 517,368 | | | $ | 222,553 | | | $ | 121,724 | | | $ | 6,418,018 | |
| Beginning balance at original discount rates | | 2,949,851 | | | 1,688,590 | | | 414,409 | | | 178,801 | | | 96,776 | | | 5,328,427 | |
| Effect of changes in assumptions on future cash flows | | (195,560) | | | (20,931) | | | 19,846 | | | (17,911) | | | (9,035) | | | (223,591) | |
| Effect of actual variances from expected experience | | (37,437) | | | (67,419) | | | (39,029) | | | 7,911 | | | (2,301) | | | (138,275) | |
Adjusted balance at January 1, 2022 | | 2,716,854 | | | 1,600,240 | | | 395,226 | | | 168,801 | | | 85,440 | | | 4,966,561 | |
Issuances(1) | | 360,942 | | | 241,052 | | | 51,827 | | | 39,003 | | | 8,224 | | | 701,048 | |
Interest accrual(2) | | 122,064 | | | 60,303 | | | 19,141 | | | 7,399 | | | 4,554 | | | 213,461 | |
Net premiums collected(3) | | (258,598) | | | (172,376) | | | (50,752) | | | (21,085) | | | (10,467) | | | (513,278) | |
| | | | | | | | | | | | |
| Effect of changes in the foreign exchange rate | | — | | | — | | | — | | | (1,487) | | | — | | | (1,487) | |
| Ending balance at original discount rates | | 2,941,262 | | | 1,729,219 | | | 415,442 | | | 192,631 | | | 87,751 | | | 5,366,305 | |
| | | | | | | | | | | | |
| Effect of change from original to current discount rates | | (32,761) | | | (134,227) | | | 8,048 | | | (2,335) | | | 2,392 | | | (158,883) | |
Balance at December 31, 2022 | | $ | 2,908,501 | | | $ | 1,594,992 | | | $ | 423,490 | | | $ | 190,296 | | | $ | 90,143 | | | $ | 5,207,422 | |
| | | | | | | | | | | | |
| | |
| | |
| | | | | | | | | | | | |
Balance at January 1, 2023 | | $ | 2,908,501 | | | $ | 1,594,992 | | | $ | 423,490 | | | $ | 190,296 | | | $ | 90,143 | | | $ | 5,207,422 | |
| Beginning balance at original discount rates | | 2,941,262 | | | 1,729,219 | | | 415,442 | | | 192,631 | | | 87,751 | | | 5,366,305 | |
| Effect of changes in assumptions on future cash flows | | 466,883 | | | (30,255) | | | (56,964) | | | (6,061) | | | 16,553 | | | 390,156 | |
| Effect of actual variances from expected experience | | (27,178) | | | (69,878) | | | (36,850) | | | (11,152) | | | (2,850) | | | (147,908) | |
Adjusted balance at January 1, 2023 | | 3,380,967 | | | 1,629,086 | | | 321,628 | | | 175,418 | | | 101,454 | | | 5,608,553 | |
Issuances(1) | | 377,097 | | | 266,375 | | | 59,768 | | | 39,825 | | | 14,467 | | | 757,532 | |
Interest accrual(2) | | 139,824 | | | 67,743 | | | 18,255 | | | 8,528 | | | 4,616 | | | 238,966 | |
Net premiums collected(3) | | (272,085) | | | (180,031) | | | (51,081) | | | (22,325) | | | (10,657) | | | (536,179) | |
| | | | | | | | | | | | |
| Effect of changes in the foreign exchange rate | | — | | | — | | | — | | | 423 | | | — | | | 423 | |
| Ending balance at original discount rates | | 3,625,803 | | | 1,783,173 | | | 348,570 | | | 201,869 | | | 109,880 | | | 6,069,295 | |
| | | | | | | | | | | | |
| Effect of change from original to current discount rates | | 71,968 | | | (71,432) | | | 9,902 | | | 4,512 | | | 5,483 | | | 20,433 | |
Balance at December 31, 2023 | | $ | 3,697,771 | | | $ | 1,711,741 | | | $ | 358,472 | | | $ | 206,381 | | | $ | 115,363 | | | $ | 6,089,728 | |
| | | | | | | | | | | | |
Balance at January 1, 2024 | | $ | 3,697,771 | | | $ | 1,711,741 | | | $ | 358,472 | | | $ | 206,381 | | | $ | 115,363 | | | $ | 6,089,728 | |
| Beginning balance at original discount rates | | 3,625,803 | | | 1,783,173 | | | 348,570 | | | 201,869 | | | 109,880 | | | 6,069,295 | |
| Effect of changes in assumptions on future cash flows | | 9,892 | | | (8,117) | | | (3,463) | | | 12,207 | | | 4,449 | | | 14,968 | |
| Effect of actual variances from expected experience | | (43,846) | | | (56,720) | | | (29,652) | | | (16,088) | | | (2,937) | | | (149,243) | |
Adjusted balance at January 1, 2024 | | 3,591,849 | | | 1,718,336 | | | 315,455 | | | 197,988 | | | 111,392 | | | 5,935,020 | |
Issuances(1) | | 480,412 | | | 265,166 | | | 58,538 | | | 44,350 | | | 26,149 | | | 874,615 | |
Interest accrual(2) | | 174,269 | | | 75,188 | | | 16,566 | | | 9,787 | | | 5,838 | | | 281,648 | |
Net premiums collected(3) | | (297,675) | | | (190,817) | | | (52,284) | | | (24,852) | | | (11,460) | | | (577,088) | |
| | | | | | | | | | | | |
| Effect of changes in the foreign exchange rate | | — | | | — | | | — | | | (2,132) | | | — | | | (2,132) | |
| Ending balance at original discount rates | | 3,948,855 | | | 1,867,873 | | | 338,275 | | | 225,141 | | | 131,919 | | | 6,512,063 | |
| | | | | | | | | | | | |
| Effect of change from original to current discount rates | | (63,325) | | | (132,998) | | | (1,156) | | | (1,894) | | | 1,458 | | | (197,915) | |
Balance at December 31, 2024 | | $ | 3,885,530 | | | $ | 1,734,875 | | | $ | 337,119 | | | $ | 223,247 | | | $ | 133,377 | | | $ | 6,314,148 | |
(1)Issuances represent the present value, using the original discount rate, of the expected net premiums related to new policies issued during each respective period.
(2)The interest accrual is the interest earned on the beginning present value of the expected net premiums, as well as the interest on actual net premiums earned during the period, using the original interest rate.
(3)Net premiums collected represent the product of the current period net premium ratio and the gross premiums collected during the period on the in-force business.
Globe Life Inc.
Notes to Consolidated Financial Statements
(Dollar amounts in thousands, except per share data)
| | | | | | | | | | | | | | | | | | | | | | | | | | | | | | | | | | | | | | |
| | Health |
| Present value of expected future policy benefits |
| United American | | Family Heritage | | Liberty National | | American Income | | DTC | | Total |
Balance at January 1, 2022 | | $ | 3,810,559 | | | $ | 3,840,322 | | | $ | 1,201,317 | | | $ | 380,915 | | | $ | 119,888 | | | $ | 9,353,001 | |
| Beginning balance at original discount rates | | 3,090,901 | | | 3,193,342 | | | 921,608 | | | 285,604 | | | 95,628 | | | 7,587,083 | |
| Effect of changes in assumptions on future cash flows | | (194,936) | | | (27,211) | | | 18,065 | | | (21,559) | | | (8,270) | | | (233,911) | |
| Effect of actual variances from expected experience | | (40,316) | | | (70,690) | | | (40,597) | | | 10,402 | | | (2,621) | | | (143,822) | |
Adjusted balance at January 1, 2022 | | 2,855,649 | | | 3,095,441 | | | 899,076 | | | 274,447 | | | 84,737 | | | 7,209,350 | |
Issuances(1) | | 360,642 | | | 241,052 | | | 52,257 | | | 39,006 | | | 8,202 | | | 701,159 | |
Interest accrual(2) | | 129,842 | | | 120,700 | | | 47,719 | | | 13,806 | | | 4,553 | | | 316,620 | |
Benefit payments(3) | | (265,500) | | | (120,849) | | | (94,187) | | | (20,413) | | | (12,280) | | | (513,229) | |
| | | | | | | | | | | | |
| Effect of changes in the foreign exchange rate | | — | | | — | | | — | | | (3,133) | | | — | | | (3,133) | |
| Ending balance at original discount rates | | 3,080,633 | | | 3,336,344 | | | 904,865 | | | 303,713 | | | 85,212 | | | 7,710,767 | |
| Effect of change from original to current discount rates | | (33,804) | | | (330,680) | | | 36,709 | | | 9,037 | | | 2,320 | | | (316,418) | |
Balance at December 31, 2022 | | $ | 3,046,829 | | | $ | 3,005,664 | | | $ | 941,574 | | | $ | 312,750 | | | $ | 87,532 | | | $ | 7,394,349 | |
| | | | | | | | | | | | |
Balance at January 1, 2023 | | $ | 3,046,829 | | | $ | 3,005,664 | | | $ | 941,574 | | | $ | 312,750 | | | $ | 87,532 | | | $ | 7,394,349 | |
| Beginning balance at original discount rates | | 3,080,633 | | | 3,336,344 | | | 904,865 | | | 303,713 | | | 85,212 | | | 7,710,767 | |
| Effect of changes in assumptions on future cash flows | | 464,652 | | | (32,428) | | | (60,437) | | | (6,407) | | | 15,930 | | | 381,310 | |
| Effect of actual variances from expected experience | | (26,718) | | | (74,797) | | | (36,910) | | | (12,661) | | | (3,325) | | | (154,411) | |
Adjusted balance at January 1, 2023 | | 3,518,567 | | | 3,229,119 | | | 807,518 | | | 284,645 | | | 97,817 | | | 7,937,666 | |
Issuances(1) | | 376,573 | | | 266,375 | | | 59,158 | | | 39,825 | | | 14,446 | | | 756,377 | |
Interest accrual(2) | | 147,082 | | | 134,107 | | | 45,614 | | | 15,070 | | | 4,616 | | | 346,489 | |
Benefit payments(3) | | (300,692) | | | (122,912) | | | (95,471) | | | (24,987) | | | (12,378) | | | (556,440) | |
| | | | | | | | | | | | |
| Effect of changes in the foreign exchange rate | | — | | | — | | | — | | | 878 | | | — | | | 878 | |
| Ending balance at original discount rates | | 3,741,530 | | | 3,506,689 | | | 816,819 | | | 315,431 | | | 104,501 | | | 8,484,970 | |
| Effect of change from original to current discount rates | | 72,798 | | | (190,809) | | | 48,989 | | | 20,073 | | | 4,981 | | | (43,968) | |
Balance at December 31, 2023 | | $ | 3,814,328 | | | $ | 3,315,880 | | | $ | 865,808 | | | $ | 335,504 | | | $ | 109,482 | | | $ | 8,441,002 | |
| | | | | | | | | | | | |
Balance at January 1, 2024 | | $ | 3,814,328 | | | $ | 3,315,880 | | | $ | 865,808 | | | $ | 335,504 | | | $ | 109,482 | | | $ | 8,441,002 | |
| Beginning balance at original discount rates | | 3,741,530 | | | 3,506,689 | | | 816,819 | | | 315,431 | | | 104,501 | | | 8,484,970 | |
| Effect of changes in assumptions on future cash flows | | 10,680 | | | (5,054) | | | (2,775) | | | 20,293 | | | 7,733 | | | 30,877 | |
| Effect of actual variances from expected experience | | (35,532) | | | (63,595) | | | (30,258) | | | (18,601) | | | (2,420) | | | (150,406) | |
Adjusted balance at January 1, 2024 | | 3,716,678 | | | 3,438,040 | | | 783,786 | | | 317,123 | | | 109,814 | | | 8,365,441 | |
Issuances(1) | | 479,653 | | | 265,166 | | | 57,862 | | | 44,353 | | | 26,116 | | | 873,150 | |
Interest accrual(2) | | 180,235 | | | 147,615 | | | 42,809 | | | 16,577 | | | 5,837 | | | 393,073 | |
Benefit payments(3) | | (349,706) | | | (138,777) | | | (93,317) | | | (25,214) | | | (13,792) | | | (620,806) | |
| | | | | | | | | | | | |
| Effect of changes in the foreign exchange rate | | — | | | — | | | — | | | (4,128) | | | — | | | (4,128) | |
| Ending balance at original discount rates | | 4,026,860 | | | 3,712,044 | | | 791,140 | | | 348,711 | | | 127,975 | | | 9,006,730 | |
| Effect of change from original to current discount rates | | (66,428) | | | (375,498) | | | 13,555 | | | 6,592 | | | 1,302 | | | (420,477) | |
Balance at December 31, 2024 | | $ | 3,960,432 | | | $ | 3,336,546 | | | $ | 804,695 | | | $ | 355,303 | | | $ | 129,277 | | | $ | 8,586,253 | |
(1)Issuances represent the present value, using the original discount rate, of the expected future policy benefits related to new policies issued during each respective period.
(2)The interest accrual is the interest earned on the beginning present value of the expected future policy benefits, as well as the interest on actual benefits and expenses paid during the period, using the original interest rate.
(3)Benefit payments represent the release of the present value, using the original discount rate, of the actual future policy benefits incurred during the period based on the revised expected assumptions.
Globe Life Inc.
Notes to Consolidated Financial Statements
(Dollar amounts in thousands, except per share data)
| | | | | | | | | | | | | | | | | | | | | | | | | | | | | | | | | | | | | | |
| | Health |
| | Net liability for future policy benefits as of December 31, 2022 |
| | United American | | Family Heritage | | Liberty National | | American Income | | Direct to Consumer | | Total |
Net liability for future policy benefits at original discount rates | | $ | 139,371 | | | $ | 1,607,125 | | | $ | 489,423 | | | $ | 111,082 | | | $ | (2,539) | | | $ | 2,344,462 | |
| Effect of changes in discount rate assumptions | | (1,043) | | | (196,453) | | | 28,661 | | | 11,372 | | | (72) | | | (157,535) | |
Other adjustments(1) | | 4,055 | | | 3,172 | | | 5,953 | | | 48 | | | 3,634 | | | 16,862 | |
Net liability for future policy benefits, after other adjustments, at current discount rates | | 142,383 | | | 1,413,844 | | | 524,037 | | | 122,502 | | | 1,023 | | | 2,203,789 | |
| Reinsurance recoverable | | (3,820) | | | (9,027) | | | (1,498) | | | — | | | — | | | (14,345) | |
Net liability for future policy benefits, after reinsurance recoverable, at current discount rates | | $ | 138,563 | | | $ | 1,404,817 | | | $ | 522,539 | | | $ | 122,502 | | | $ | 1,023 | | | $ | 2,189,444 | |
(1)Other adjustments include the effects of capping and flooring the liability (guidance requires an amount not less than zero at the calculation level of the liability for future policy benefits).
| | | | | | | | | | | | | | | | | | | | | | | | | | | | | | | | | | | | | | |
| | Health |
| | Net liability for future policy benefits as of December 31, 2023 |
| | United American | | Family Heritage | | Liberty National | | American Income | | Direct to Consumer | | Total |
Net liability for future policy benefits at original discount rates | | $ | 115,727 | | | $ | 1,723,516 | | | $ | 468,249 | | | $ | 113,562 | | | $ | (5,379) | | | $ | 2,415,675 | |
| Effect of changes in discount rate assumptions | | 830 | | | (119,377) | | | 39,087 | | | 15,561 | | | (502) | | | (64,401) | |
Other adjustments(1) | | 10,980 | | | 84 | | | 9,567 | | | 857 | | | 6,653 | | | 28,141 | |
Net liability for future policy benefits, after other adjustments, at current discount rates | | 127,537 | | | 1,604,223 | | | 516,903 | | | 129,980 | | | 772 | | | 2,379,415 | |
| Reinsurance recoverable | | (3,287) | | | (10,718) | | | (1,317) | | | — | | | — | | | (15,322) | |
Net liability for future policy benefits, after reinsurance recoverable, at current discount rates | | $ | 124,250 | | | $ | 1,593,505 | | | $ | 515,586 | | | $ | 129,980 | | | $ | 772 | | | $ | 2,364,093 | |
(1)Other adjustments include the effects of capping and flooring the liability (guidance requires an amount not less than zero at the calculation level of the liability for future policy benefits).
| | | | | | | | | | | | | | | | | | | | | | | | | | | | | | | | | | | | | | |
| | Health |
| | Net liability for future policy benefits as of December 31, 2024 |
| | United American | | Family Heritage | | Liberty National | | American Income | | Direct to Consumer | | Total |
Net liability for future policy benefits at original discount rates | | 78,005 | | | 1,844,171 | | | 452,865 | | | 123,570 | | | (3,944) | | | 2,494,667 | |
| Effect of changes in discount rate assumptions | | (3,103) | | | (242,500) | | | 14,711 | | | 8,486 | | | (156) | | | (222,562) | |
Other adjustments(1) | | 24,920 | | | 22 | | | 10,310 | | | 814 | | | 4,865 | | | 40,931 | |
Net liability for future policy benefits, after other adjustments, at current discount rates | | 99,822 | | | 1,601,693 | | | 477,886 | | | 132,870 | | | 765 | | | 2,313,036 | |
| Reinsurance recoverable | | (2,768) | | | — | | | (986) | | | — | | | — | | | (3,754) | |
Net liability for future policy benefits, after reinsurance recoverable, at current discount rates | | $ | 97,054 | | | $ | 1,601,693 | | | $ | 476,900 | | | $ | 132,870 | | | $ | 765 | | | $ | 2,309,282 | |
(1)Other adjustments include the effects of capping and flooring the liability (guidance requires an amount not less than zero at the calculation level of the liability for future policy benefits).
Remeasurement Gain or Loss—In accordance with the accounting guidance, the Company reviews, and updates as necessary, its assumptions utilized in the calculation of the liability for future benefits annually in the third quarter and recalculates the net premium ratio. The revised net premium ratio is used to update the liability for future policy
Globe Life Inc.
Notes to Consolidated Financial Statements
(Dollar amounts in thousands, except per share data)
benefits as of the beginning of the current reporting period, and is compared to the liability using the prior cash flow assumptions. The difference is recorded as a component of the remeasurement gain or loss for the current period, along with the effect of the difference between actual and expected experience for the period. The total remeasurement gain or loss is included in the Consolidated Statements of Operations.
The following tables include the total remeasurement gain or loss, bifurcated between the gain or loss due to differences between actual and expected experience and the amount due to assumption updates, for the three years ended December 31, 2024:
| | | | | | | | | | | | | | | | | | | | | |
| | | Year Ended December 31, |
| | | | | 2024 | | 2023 | | 2022 |
| Life Remeasurement Gain (Loss)—Experience: | | | | | | | | | |
| American Income | | | | | $ | 19,606 | | | $ | 9,430 | | | 1,965 | |
| Direct to Consumer | | | | | 21,681 | | | 12,201 | | | (2,243) | |
| Liberty National | | | | | 3,966 | | | 5,013 | | | (1,348) | |
| Other | | | | | 4,872 | | | 4,760 | | | 1,354 | |
Total Life Remeasurement Gain (Loss)—Experience | | | | | 50,125 | | | 31,404 | | | (272) | |
| | | | | | | | | |
| Life Remeasurement Gain (Loss)—Assumption Updates: | | | | | | | | | |
| American Income | | | | | 21,974 | | | 308 | | | (8,707) | |
| Direct to Consumer | | | | | 21,744 | | | 1,763 | | | (25,334) | |
| Liberty National | | | | | 12,224 | | | (1,248) | | | (7,872) | |
| Other | | | | | 904 | | | (2,836) | | | (5,241) | |
Total Life Remeasurement Gain (Loss)—Assumption Updates | | | | | 56,846 | | | (2,013) | | | (47,154) | |
| | | | | | | | | |
Total Life Remeasurement Gain (Loss) | | | | | 106,971 | | | 29,391 | | | (47,426) | |
| | | | | | | | | |
| Health Remeasurement Gain (Loss)—Experience: | | | | | | | | | |
| United American | | | | | (4,890) | | | (134) | | | 3,502 | |
| Family Heritage | | | | | 6,756 | | | 4,638 | | | 2,395 | |
| Liberty National | | | | | 2,640 | | | 628 | | | 1,406 | |
| American Income | | | | | 2,742 | | | 1,461 | | | (2,545) | |
| Direct to Consumer | | | | | 22 | | | 23 | | | 148 | |
Total Health Remeasurement Gain (Loss)—Experience | | | | | 7,270 | | | 6,616 | | | 4,906 | |
| | | | | | | | | |
| Health Remeasurement Gain (Loss)—Assumption Updates: | | | | | | | | | |
| United American | | | | | 1,205 | | | 762 | | | (626) | |
| Family Heritage | | | | | (3,063) | | | 2,173 | | | 6,283 | |
| Liberty National | | | | | (234) | | | 2,171 | | | 1,463 | |
| American Income | | | | | (8,036) | | | 119 | | | 3,615 | |
| Direct to Consumer | | | | | (373) | | | 8 | | | (80) | |
Health Remeasurement Gain (Loss)—Assumption Updates | | | | | (10,501) | | | 5,233 | | | 10,655 | |
| | | | | | | | | |
Total Health Remeasurement Gain (Loss) | | | | | $ | (3,231) | | | $ | 11,849 | | | 15,561 | |
The Company performed its annual review of assumptions during the third quarter. This review process resulted in favorable changes to its mortality and lapse assumptions on life and unfavorable changes to morbidity assumptions on health. Generally, in our life segment mortality assumptions were decreased across most channels in line with recent experience consistent with decreasing levels of excess deaths. Also, for the life segment lapse rate assumptions were slightly increased across all channels. For the health segment, morbidity assumptions were increased, causing higher future policy benefit reserves. The assumption review process of the life and health segments resulted in a $46.3 million net remeasurement gain in the year ended December 31, 2024 as compared to a $3.2 million net remeasurement gain and a $36.5 million net remeasurement loss in the year ended December 31, 2023 and 2022, respectively.
Globe Life Inc.
Notes to Consolidated Financial Statements
(Dollar amounts in thousands, except per share data)
Excluding the impact of assumption changes, the Company's results for actual variances from expected experience for both life and health produced a $57.4 million net remeasurement gain, a $38.0 million net remeasurement gain, and a $4.6 million net remeasurement gain for the year ended December 31, 2024, 2023, and 2022, respectively.
The following table reconciles the liability for future policy benefits to the Consolidated Balance Sheets as of December 31, 2024, 2023, and 2022: | | | | | | | | | | | | | | | | | | | | | | | | | | | | | | | | | | | | | | |
| | | | |
| | At Original Discount Rates | | At Current Discount Rates |
| | As of December 31, | | As of December 31, |
| | 2024 | | 2023 | | 2022 | | 2024 | | 2023 | | 2022 |
Life(1): | | | | | | | | | | | | |
| American Income | | $ | 4,851,995 | | | $ | 4,538,775 | | | $ | 4,163,111 | | | $ | 5,224,897 | | | $ | 5,482,036 | | | $ | 4,846,063 | |
| Direct to Consumer | | 3,156,039 | | | 2,992,493 | | | 2,797,031 | | | 3,502,224 | | | 3,665,180 | | | 3,320,140 | |
| Liberty National | | 2,293,197 | | | 2,260,421 | | | 2,206,857 | | | 2,329,070 | | | 2,481,440 | | | 2,342,487 | |
| Other | | 3,151,824 | | | 3,062,966 | | | 2,954,522 | | | 3,520,949 | | | 3,761,633 | | | 3,505,457 | |
| Net liability for future policy benefits—long duration life | | 13,453,055 | | | 12,854,655 | | | 12,121,521 | | | 14,577,140 | | | 15,390,289 | | | 14,014,147 | |
| | | | | | | | | | | | |
Health(1): | | | | | | | | | | | | |
| United American | | 100,480 | | | 124,021 | | | 141,362 | | | 99,822 | | | 127,537 | | | 142,383 | |
| Family Heritage | | 1,844,186 | | | 1,723,581 | | | 1,607,169 | | | 1,601,693 | | | 1,604,223 | | | 1,413,844 | |
| Liberty National | | 462,712 | | | 476,559 | | | 494,155 | | | 477,886 | | | 516,903 | | | 524,037 | |
| American Income | | 124,309 | | | 114,407 | | | 111,128 | | | 132,870 | | | 129,980 | | | 122,502 | |
| Direct to Consumer | | 738 | | | 737 | | | 979 | | | 765 | | | 772 | | | 1,023 | |
| Net liability for future policy benefits—long duration health | | 2,532,425 | | | 2,439,305 | | | 2,354,793 | | | 2,313,036 | | | 2,379,415 | | | 2,203,789 | |
| | | | | | | | | | | | |
| Deferred profit liability | | 178,199 | | | 174,717 | | | 175,883 | | | 178,199 | | | 174,717 | | | 175,883 | |
| Deferred annuity | | 656,573 | | | 773,039 | | | 954,318 | | | 656,573 | | | 773,039 | | | 954,318 | |
| Interest sensitive life | | 723,389 | | | 732,948 | | | 739,105 | | | 723,389 | | | 732,948 | | | 739,105 | |
| Other | | 8,923 | | | 9,951 | | | 10,106 | | | 8,926 | | | 9,945 | | | 10,099 | |
Total future policy benefits | | $ | 17,552,564 | | | $ | 16,984,615 | | | $ | 16,355,726 | | | $ | 18,457,263 | | | $ | 19,460,353 | | | $ | 18,097,341 | |
(1)Balances are presented net of the effects of capping and flooring the liability (guidance requires an amount not less than zero at the calculation level of the liability for future policy benefits).
Globe Life Inc.
Notes to Consolidated Financial Statements
(Dollar amounts in thousands, except per share data)
The following tables provide the weighted-average original and current discount rates for the liability for future policy benefits and the additional insurance liabilities as of December 31, 2024, 2023, and 2022:
| | | | | | | | | | | | | | | | | | | | | | | | | | | | | | | | | | | | | | |
| | As of December 31, |
| | 2024 | | 2023 | | 2022 |
| | Original discount rate | | Current discount rate | | Original discount rate | | Current discount rate | | Original discount rate | | Current discount rate |
| Life | | | | | | | | | | | | |
| American Income | | 5.7 | % | | 5.4 | % | | 5.7 | % | | 4.9 | % | | 5.8 | % | | 5.2 | % |
| Direct to Consumer | | 6.0 | % | | 5.5 | % | | 6.0 | % | | 5.0 | % | | 6.0 | % | | 5.2 | % |
| Liberty National | | 5.6 | % | | 5.5 | % | | 5.6 | % | | 5.0 | % | | 5.6 | % | | 5.2 | % |
| Other | | 6.2 | % | | 5.5 | % | | 6.2 | % | | 5.0 | % | | 6.2 | % | | 5.2 | % |
| | | | | | | | | | | | |
| Health | | | | | | | | | | | | |
| United American | | 5.1 | % | | 5.2 | % | | 5.1 | % | | 4.8 | % | | 5.2 | % | | 5.1 | % |
| Family Heritage | | 4.2 | % | | 5.3 | % | | 4.3 | % | | 4.9 | % | | 4.3 | % | | 5.2 | % |
| Liberty National | | 5.8 | % | | 5.4 | % | | 5.8 | % | | 4.9 | % | | 5.8 | % | | 5.2 | % |
| American Income | | 5.8 | % | | 5.2 | % | | 5.8 | % | | 4.8 | % | | 5.9 | % | | 5.1 | % |
| Direct to Consumer | | 5.1 | % | | 5.2 | % | | 5.1 | % | | 4.8 | % | | 5.2 | % | | 5.1 | % |
The following table provides the weighted-average durations of the liability for future policy benefits and the additional insurance liabilities as of December 31, 2024, 2023, and 2022:
| | | | | | | | | | | | | | | | | | | | | | | | | | | | | | | | | | | | | | |
| | As of December 31, |
| 2024 | | 2023 | | 2022 |
| | At original discount rates | | At current discount rates | | At original discount rates | | At current discount rates | | At original discount rates | | At current discount rates |
| Life | | | | | | | | | | | | |
| American Income | | 22.73 | | 22.76 | | 23.01 | | 23.45 | | 22.86 | | 23.28 |
| Direct to Consumer | | 19.24 | | 20.31 | | 19.58 | | 21.21 | | 20.27 | | 21.80 |
| Liberty National | | 15.30 | | 15.33 | | 15.13 | | 15.81 | | 14.86 | | 15.39 |
| Other | | 15.99 | | 16.92 | | 16.26 | | 17.92 | | 16.59 | | 18.15 |
| | | | | | | | | | | | |
| Health | | | | | | | | | | | | |
| United American | | 11.72 | | 10.65 | | 11.46 | | 10.89 | | 11.37 | | 10.65 |
| Family Heritage | | 15.33 | | 14.23 | | 14.99 | | 14.54 | | 14.87 | | 14.22 |
| Liberty National | | 9.31 | | 9.19 | | 9.17 | | 9.49 | | 9.26 | | 9.47 |
| American Income | | 12.49 | | 12.56 | | 12.21 | | 12.84 | | 12.12 | | 12.56 |
| Direct to Consumer | | 11.72 | | 10.65 | | 11.46 | | 10.89 | | 11.37 | | 10.65 |
Globe Life Inc.
Notes to Consolidated Financial Statements
(Dollar amounts in thousands, except per share data)
The following tables summarize the amount of gross premiums and interest related to long duration life and health contracts that are recognized in the Consolidated Statements of Operations for the three years ended December 31, 2024: | | | | | | | | | | | | | | | | | | | | | | | | | | | | | | | | | | | | | | |
| | Life |
| | Year Ended
December 31, 2024 | | Year Ended
December 31, 2023 | | Year Ended
December 31, 2022 |
| | Gross
Premiums | | Interest
expense | | Gross
Premiums | | Interest
expense | | Gross
Premiums | | Interest
expense |
| American Income | | $ | 1,696,918 | | | $ | 272,007 | | | $ | 1,587,304 | | | $ | 252,277 | | | $ | 1,503,537 | | | $ | 234,098 | |
| Direct to Consumer | | 977,302 | | | 181,470 | | | 979,739 | | | 170,745 | | | 973,429 | | | 159,945 | |
| Liberty National | | 367,278 | | | 122,727 | | | 345,196 | | | 120,083 | | | 322,497 | | | 117,681 | |
| Other | | 202,234 | | | 185,619 | | | 205,998 | | | 179,513 | | | 208,390 | | | 172,967 | |
| Total | | $ | 3,243,732 | | | $ | 761,823 | | | $ | 3,118,237 | | | $ | 722,618 | | | $ | 3,007,853 | | | $ | 684,691 | |
| | | | | | | | | | | | | | | | | | | | | | | | | | | | | | | | | | | | | | |
| | Health |
| | Year Ended
December 31, 2024 | | Year Ended
December 31, 2023 | | Year Ended
December 31, 2022 |
| | Gross
Premiums | | Interest
expense | | Gross
Premiums | | Interest
expense | | Gross
Premiums | | Interest
expense |
| United American | | $ | 439,125 | | | $ | 5,739 | | | $ | 401,834 | | | $ | 7,002 | | | $ | 380,710 | | | $ | 7,532 | |
| Family Heritage | | 427,640 | | | 71,900 | | | 396,211 | | | 65,892 | | | 366,803 | | | 59,983 | |
| Liberty National | | 189,650 | | | 26,144 | | | 187,095 | | | 27,248 | | | 186,268 | | | 28,477 | |
| American Income | | 117,644 | | | 6,790 | | | 113,605 | | | 6,542 | | | 111,623 | | | 6,408 | |
| Direct to Consumer | | 15,033 | | | — | | | 14,283 | | | — | | | 14,290 | | | — | |
| Total | | $ | 1,189,092 | | | $ | 110,573 | | | $ | 1,113,028 | | | $ | 106,684 | | | $ | 1,059,694 | | | $ | 102,400 | |
Gross premiums are included within life and health premium on the Consolidated Statements of Operations, while the related interest expense is included in life and health policyholder benefits.
Globe Life Inc.
Notes to Consolidated Financial Statements
(Dollar amounts in thousands, except per share data)
The following tables provide the undiscounted and discounted expected future net premiums, expected future gross premiums, and expected future policy benefits, at both original and current discount rates, for life and health contracts for the three years ended December 31, 2024:
| | | | | | | | | | | | | | | | | | | | | | | | | | | | | | | | | | | | | | | | | | | | | | | | | | | | | | | | |
| | Life |
| | As of December 31, 2024 | | As of December 31, 2023 | | As of December 31, 2022 |
| | Not discounted | | At original discount rates | | At current discount rates | | Not discounted | | At original discount rates | | At current discount rates | | Not discounted | | At original discount rates | | At current discount rates |
| American Income | | | | | | | | | | | | | | | | | | |
| PV of expected future gross premiums | | $ | 25,492,032 | | | $ | 14,410,088 | | | $ | 14,471,277 | | | $ | 24,265,464 | | | $ | 13,695,495 | | | $ | 14,264,077 | | | $ | 22,662,540 | | | $ | 12,832,811 | | | $ | 13,006,579 | |
| PV of expected future net premiums | | 8,233,110 | | | 4,656,710 | | | 4,645,917 | | | 8,001,107 | | | 4,523,329 | | | 4,681,888 | | | 7,480,182 | | | 4,246,723 | | | 4,273,156 | |
| PV of expected future policy benefits | | 31,831,310 | | | 9,508,589 | | | 9,870,692 | | | 30,623,947 | | | 9,061,833 | | | 10,163,627 | | | 28,318,683 | | | 8,409,761 | | | 9,119,104 | |
| | | | | | | | | | | | | | | | | | |
| DTC | | | | | | | | | | | | | | | | | | |
| PV of expected future gross premiums | | $ | 17,372,446 | | | $ | 9,077,304 | | | $ | 9,258,880 | | | $ | 17,506,091 | | | $ | 9,150,049 | | | $ | 9,761,706 | | | $ | 17,346,469 | | | $ | 9,086,945 | | | $ | 9,432,882 | |
| PV of expected future net premiums | | 10,481,376 | | | 5,504,912 | | | 5,622,906 | | | 10,774,655 | | | 5,664,259 | | | 6,052,651 | | | 10,769,174 | | | 5,680,864 | | | 5,910,224 | |
| PV of expected future policy benefits | | 25,841,419 | | | 8,660,948 | | | 9,125,112 | | | 25,723,752 | | | 8,656,752 | | | 9,714,516 | | | 25,356,573 | | | 8,477,892 | | | 9,225,451 | |
| | | | | | | | | | | | | | | | | | |
| Liberty National | | | | | | | | | | | | | | | | | | |
| PV of expected future gross premiums | | $ | 4,837,598 | | | $ | 2,817,204 | | | $ | 2,775,304 | | | $ | 4,660,783 | | | $ | 2,720,264 | | | $ | 2,784,916 | | | $ | 4,396,685 | | | $ | 2,561,304 | | | $ | 2,562,342 | |
| PV of expected future net premiums | | 1,849,200 | | | 1,047,022 | | | 1,048,447 | | | 1,897,696 | | | 1,077,831 | | | 1,129,716 | | | 1,885,533 | | | 1,066,123 | | | 1,094,407 | |
| PV of expected future policy benefits | | 9,073,624 | | | 3,340,219 | | | 3,377,517 | | | 8,905,815 | | | 3,338,252 | | | 3,605,392 | | | 8,613,975 | | | 3,272,980 | | | 3,429,256 | |
| | | | | | | | | | | | | | | | | | |
| Other | | | | | | | | | | | | | | | | | | |
| PV of expected future gross premiums | | $ | 3,627,855 | | | $ | 1,844,670 | | | $ | 1,942,849 | | | $ | 3,726,111 | | | $ | 1,889,930 | | | $ | 2,088,668 | | | $ | 3,814,915 | | | $ | 1,925,650 | | | $ | 2,075,874 | |
| PV of expected future net premiums | | 885,362 | | | 430,276 | | | 440,047 | | | 910,786 | | | 443,949 | | | 478,052 | | | 922,500 | | | 449,209 | | | 470,741 | |
| PV of expected future policy benefits | | 12,466,943 | | | 3,582,068 | | | 3,960,963 | | | 12,431,963 | | | 3,506,859 | | | 4,239,623 | | | 12,371,696 | | | 3,403,704 | | | 3,976,150 | |
| | | | | | | | | | | | | | | | | | |
| Total | | | | | | | | | | | | | | | | | | |
| PV of expected future gross premiums | | $ | 51,329,931 | | | $ | 28,149,266 | | | $ | 28,448,310 | | | $ | 50,158,449 | | | $ | 27,455,738 | | | $ | 28,899,367 | | | $ | 48,220,609 | | | $ | 26,406,710 | | | $ | 27,077,677 | |
| PV of expected future net premiums | | 21,449,048 | | | 11,638,920 | | | 11,757,317 | | | 21,584,244 | | | 11,709,368 | | | 12,342,307 | | | 21,057,389 | | | 11,442,919 | | | 11,748,528 | |
| PV of expected future policy benefits | | 79,213,296 | | | 25,091,824 | | | 26,334,284 | | | 77,685,477 | | | 24,563,696 | | | 27,723,158 | | | 74,660,927 | | | 23,564,337 | | | 25,749,961 | |
As of December 31, 2024 for the life segment using current discount rates, the Company anticipates $28.4 billion of expected future gross premiums and $11.8 billion of expected future net premiums. As of December 31, 2023 and 2022 using current discount rates, the Company anticipated $28.9 billion and $27.1 billion of expected future gross premiums and $12.3 billion and $11.7 billion in expected future net premiums, respectively. For each respective period, only expected future net premiums are included in the determination of the liability for future policy benefits on the balance sheet, while the difference between the expected future gross premiums and the expected future net premiums is not.
Globe Life Inc.
Notes to Consolidated Financial Statements
(Dollar amounts in thousands, except per share data)
| | | | | | | | | | | | | | | | | | | | | | | | | | | | | | | | | | | | | | | | | | | | | | | | | | | | | | | | |
| | Health |
| | As of December 31, 2024 | | As of December 31, 2023 | | As of December 31, 2022 |
| | Not discounted | | At original discount rates | | At current discount rates | | Not discounted | | At original discount rates | | At current discount rates | | Not discounted | | At original discount rates | | At current discount rates |
| United American | | | | | | | | | | | | | | | | | | |
| PV of expected future gross premiums | | $ | 9,350,851 | | | $ | 5,738,332 | | | $ | 5,643,454 | | | $ | 8,682,707 | | | $ | 5,295,148 | | | $ | 5,396,402 | | | $ | 6,801,987 | | | $ | 4,285,863 | | | $ | 4,233,647 | |
| PV of expected future net premiums | | 6,442,648 | | | 3,948,855 | | | 3,885,530 | | | 5,955,294 | | | 3,625,803 | | | 3,697,771 | | | 4,680,560 | | | 2,941,262 | | | 2,908,501 | |
| PV of expected future policy benefits | | 6,584,800 | | | 4,026,860 | | | 3,960,432 | | | 6,148,565 | | | 3,741,530 | | | 3,814,328 | | | 4,915,174 | | | 3,080,633 | | | 3,046,829 | |
| | | | | | | | | | | | | | | | | | |
| Family Heritage | | | | | | | | | | | | | | | | | | |
| PV of expected future gross premiums | | $ | 7,242,884 | | | $ | 4,220,293 | | | $ | 3,938,234 | | | $ | 6,739,913 | | | $ | 3,982,571 | | | $ | 3,844,287 | | | $ | 6,329,183 | | | $ | 3,787,020 | | | $ | 3,518,288 | |
| PV of expected future net premiums | | 3,188,017 | | | 1,867,873 | | | 1,734,875 | | | 2,997,954 | | | 1,783,173 | | | 1,711,741 | | | 2,865,334 | | | 1,729,219 | | | 1,594,992 | |
| PV of expected future policy benefits | | 7,176,690 | | | 3,712,044 | | | 3,336,546 | | | 6,655,694 | | | 3,506,689 | | | 3,315,880 | | | 6,245,843 | | | 3,336,344 | | | 3,005,664 | |
| | | | | | | | | | | | | | | | | | |
| Liberty National | | | | | | | | | | | | | | | | | | |
| PV of expected future gross premiums | | $ | 2,039,441 | | | $ | 1,299,234 | | | $ | 1,316,967 | | | $ | 2,089,005 | | | $ | 1,325,869 | | | $ | 1,390,066 | | | $ | 2,271,423 | | | $ | 1,418,333 | | | $ | 1,458,880 | |
| PV of expected future net premiums | | 500,297 | | | 338,275 | | | 337,119 | | | 518,008 | | | 348,570 | | | 358,472 | | | 652,858 | | | 415,442 | | | 423,490 | |
| PV of expected future policy benefits | | 1,374,959 | | | 791,140 | | | 804,695 | | | 1,413,211 | | | 816,819 | | | 865,808 | | | 1,600,943 | | | 904,865 | | | 941,574 | |
| | | | | | | | | | | | | | | | | | |
| American Income | | | | | | | | | | | | | | | | | | |
| PV of expected future gross premiums | | $ | 1,770,862 | | | $ | 992,641 | | | $ | 1,012,919 | | | $ | 1,768,231 | | | $ | 991,448 | | | $ | 1,047,348 | | | $ | 1,750,393 | | | $ | 977,846 | | | $ | 1,004,239 | |
| PV of expected future net premiums | | 400,512 | | | 225,141 | | | 223,247 | | | 359,248 | | | 201,869 | | | 206,381 | | | 342,659 | | | 192,631 | | | 190,296 | |
| PV of expected future policy benefits | | 709,637 | | | 348,711 | | | 355,303 | | | 640,326 | | | 315,431 | | | 335,504 | | | 617,973 | | | 303,713 | | | 312,750 | |
| | | | | | | | | | | | | | | | | | |
| Direct to Consumer | | | | | | | | | | | | | | | | | | |
| PV of expected future gross premiums | | $ | 248,646 | | | $ | 157,812 | | | $ | 159,862 | | | $ | 236,776 | | | $ | 149,119 | | | $ | 156,612 | | | $ | 177,131 | | | $ | 116,212 | | | $ | 119,457 | |
| PV of expected future net premiums | | 208,577 | | | 131,919 | | | 133,377 | | | 174,738 | | | 109,880 | | | 115,363 | | | 133,995 | | | 87,751 | | | 90,143 | |
| PV of expected future policy benefits | | 204,099 | | | 127,975 | | | 129,277 | | | 163,087 | | | 104,501 | | | 109,482 | | | 127,911 | | | 85,212 | | | 87,532 | |
| | | | | | | | | | | | | | | | | | |
| Total | | | | | | | | | | | | | | | | | | |
| PV of expected future gross premiums | | $ | 20,652,684 | | | $ | 12,408,312 | | | $ | 12,071,436 | | | $ | 19,516,632 | | | $ | 11,744,155 | | | $ | 11,834,715 | | | $ | 17,330,117 | | | $ | 10,585,274 | | | $ | 10,334,511 | |
| PV of expected future net premiums | | 10,740,051 | | | 6,512,063 | | | 6,314,148 | | | 10,005,242 | | | 6,069,295 | | | 6,089,728 | | | 8,675,406 | | | 5,366,305 | | | 5,207,422 | |
| PV of expected future policy benefits | | 16,050,185 | | | 9,006,730 | | | 8,586,253 | | | 15,020,883 | | | 8,484,970 | | | 8,441,002 | | | 13,507,844 | | | 7,710,767 | | | 7,394,349 | |
As of December 31, 2024 for the health segment using current discount rates, the Company anticipates $12.1 billion of expected future gross premiums and $6.3 billion of expected future net premiums. As of December 31, 2023 and 2022 using current discount rates, the Company anticipated $11.8 billion and $10.3 billion of expected future gross premiums and $6.1 billion and $5.2 billion in expected future net premiums, respectively. For each respective period, only expected future net premiums are included in the determination of the liability for future policy benefits on the balance sheet, while the difference between the expected future gross premiums and the expected future net premiums is not.
Globe Life Inc.
Notes to Consolidated Financial Statements
(Dollar amounts in thousands, except per share data)
The following table summarizes the balances of, and changes in, policyholders’ account balances for the three years ended December 31, 2024:
| | | | | | | | | | | | | | | | | | | | | | | | | | | | | | | | | | | | | | | | | | | | | | | | | | | | | | | | |
| | Policyholders' Account Balances |
| | 2024 | | 2023 | | 2022 |
| | Interest Sensitive Life | | Deferred Annuity | | Other Policy-holders' Funds | | Interest Sensitive Life | | Deferred Annuity | | Other Policy-holders' Funds | | Interest Sensitive Life | | Deferred Annuity | | Other Policy-holders' Funds |
Balance at January 1, | | $ | 732,948 | | | $ | 773,039 | | | $ | 236,958 | | | $739,105 | | $ | 954,318 | | | $ | 123,236 | | | $ | 745,335 | | | $ | 1,033,525 | | | $ | 99,468 | |
| Issuances | | — | | | 875 | | | — | | | — | | | 896 | | | — | | | — | | | 1,528 | | | — | |
| Premiums received | | 20,928 | | | 11,332 | | | 240,802 | | | 22,036 | | | 13,209 | | | 122,136 | | | 23,439 | | | 22,873 | | | 30,591 | |
| Policy charges | | (12,295) | | | — | | | — | | | (12,926) | | | — | | | — | | | (13,573) | | | — | | | — | |
| Surrenders and withdrawals | | (22,479) | | | (107,707) | | | (13,897) | | | (21,215) | | | (165,584) | | | (13,042) | | | (21,994) | | | (92,235) | | | (11,615) | |
| Benefit payments | | (30,512) | | | (43,955) | | | — | | | (29,909) | | | (57,937) | | | — | | | (32,889) | | | (44,456) | | | — | |
| | | | | | | | | | | | | | | | | | |
| Interest credited | | 27,790 | | | 23,634 | | | 21,165 | | | 28,320 | | | 28,150 | | | 9,314 | | | 28,579 | | | 32,779 | | | 4,589 | |
| Other | | 7,009 | | | (645) | | | (16,424) | | | 7,537 | | | (13) | | | (4,686) | | | 10,208 | | | 304 | | | 203 | |
Balance at December 31, | | $ | 723,389 | | | $ | 656,573 | | | $ | 468,604 | | | $ | 732,948 | | | $ | 773,039 | | | $ | 236,958 | | | $ | 739,105 | | | $ | 954,318 | | | $ | 123,236 | |
| | | | | | | | | | | | | | | | | | |
| Weighted-average credit rate | | 3.82 | % | | 3.31 | % | | 6.00 | % | | 3.85 | % | | 3.26 | % | | 5.17 | % | | 3.85 | % | | 3.30 | % | | 4.12 | % |
| Net amount at risk | | $ | 1,663,496 | | | N/A | | N/A | | $ | 1,766,170 | | | N/A | | N/A | | $ | 1,873,315 | | | N/A | | N/A |
| Cash surrender value | | $ | 677,111 | | | $ | 656,573 | | | $ | 468,604 | | | $ | 671,596 | | | $ | 773,039 | | | $ | 236,958 | | | $ | 689,546 | | | $ | 954,309 | | | $ | 123,236 | |
The following tables present the policyholders' account balances by range of guaranteed minimum crediting rates and the related range of difference, if any, in basis points between rates being credited to policy holders and the respective guaranteed minimums as of December 31, 2024, 2023, and 2022:
| | | | | | | | | | | | | | | | | | | | |
| | At December 31, 2024 |
| Range of guaranteed minimum crediting rates | | Interest Sensitive Life | | Deferred Annuity | | Other Policyholders' Funds |
| At guaranteed minimum: | | | | | | |
| Less than 3.00% | | $ | — | | | $ | 1,812 | | | $ | 373,584 | |
| 3.00%-3.99% | | 29,251 | | | 473,191 | | | 3,182 | |
| 4.00%-4.99% | | 604,412 | | | 181,570 | | | 55,876 | |
| Greater than 5.00% | | 89,726 | | | — | | | 35,962 | |
Total | | 723,389 | | | 656,573 | | | 468,604 | |
| | | | | | |
| | | | | | |
| | | | | | |
| | | | | | |
| | | | | | |
| | | | | | |
| 51-150 basis points above: | | | | | | |
| Less than 3.00% | | — | | | — | | | — | |
| 3.00%-3.99% | | — | | | — | | | — | |
| 4.00%-4.99% | | — | | | — | | | — | |
| Greater than 5.00% | | — | | | — | | | — | |
Total | | — | | | — | | | — | |
| | | | | | |
| | | | | | |
| | | | | | |
| | | | | | |
| | | | | | |
| | | | | | |
Grand Total | | $ | 723,389 | | | $ | 656,573 | | | $ | 468,604 | |
Globe Life Inc.
Notes to Consolidated Financial Statements
(Dollar amounts in thousands, except per share data)
| | | | | | | | | | | | | | | | | | | | |
| | At December 31, 2023 |
| Range of guaranteed minimum crediting rates | | Interest Sensitive Life | | Deferred Annuity | | Other Policyholders' Funds |
| At guaranteed minimum: | | | | | | |
| Less than 3.00% | | $ | — | | | $ | 1,945 | | | $ | 138,684 | |
| 3.00%-3.99% | | 29,086 | | | 574,939 | | | 3,790 | |
| 4.00%-4.99% | | 613,704 | | | 195,390 | | | 6,861 | |
| Greater than 5.00% | | 90,158 | | | 765 | | | 37,556 | |
Total | | 732,948 | | | 773,039 | | | 186,891 | |
| | | | | | |
| | | | | | |
| | | | | | |
| | | | | | |
| | | | | | |
| | | | | | |
| 51-150 basis points above: | | | | | | |
| Less than 3.00% | | — | | | — | | | — | |
| 3.00%-3.99% | | — | | | — | | | — | |
| 4.00%-4.99% | | — | | | — | | | 50,067 | |
| Greater than 5.00% | | — | | | — | | | — | |
Total | | — | | | — | | | 50,067 | |
| | | | | | |
| | | | | | |
| | | | | | |
| | | | | | |
| | | | | | |
| | | | | | |
Grand Total | | $ | 732,948 | | | $ | 773,039 | | | $ | 236,958 | |
| | | | | | | | | | | | | | | | | | | | |
| | At December 31, 2022 |
| Range of guaranteed minimum crediting rates | | Interest Sensitive Life | | Deferred Annuity | | Other Policyholders' Funds |
| At guaranteed minimum: | | | | | | |
| Less than 3.00% | | $ | — | | | $ | 2,040 | | | $ | 23,042 | |
| 3.00%-3.99% | | 28,867 | | | 743,299 | | | 4,074 | |
| 4.00%-4.99% | | 620,594 | | | 208,979 | | | 58,251 | |
| Greater than 5.00% | | 89,644 | | | — | | | 37,869 | |
Total | | 739,105 | | | 954,318 | | | 123,236 | |
| | | | | | |
| | | | | | |
| | | | | | |
| | | | | | |
| | | | | | |
| | | | | | |
| 51-150 basis points above: | | | | | | |
| Less than 3.00% | | — | | | — | | | — | |
| 3.00%-3.99% | | — | | | — | | | — | |
| 4.00%-4.99% | | — | | | — | | | — | |
| Greater than 5.00% | | — | | | — | | | — | |
Total | | — | | | — | | | — | |
| | | | | | |
| | | | | | |
| | | | | | |
| | | | | | |
| | | | | | |
| | | | | | |
Grand Total | | $ | 739,105 | | | $ | 954,318 | | | $ | 123,236 | |
Globe Life Inc.
Notes to Consolidated Financial Statements
(Dollar amounts in thousands, except per share data)
Note 7—Deferred Acquisition Costs
The following tables roll forward the deferred policy acquisition costs for the three years ended December 31, 2024:
| | | | | | | | | | | | | | | | | | | | | | | | | | | | | | | | |
| | Life |
| | American Income | | DTC | | Liberty National | | Other | | Total |
Balance at January 1, 2022 | | $ | 1,960,254 | | | $ | 1,583,695 | | | $ | 566,419 | | | $ | 301,647 | | | $ | 4,412,015 | |
| Capitalizations | | 450,600 | | | 188,083 | | | 90,385 | | | 13,504 | | | 742,572 | |
| Amortization expense | | (141,108) | | | (94,847) | | | (46,081) | | | (16,805) | | | (298,841) | |
| Foreign exchange adjustment | | (11,455) | | | — | | | — | | | — | | | (11,455) | |
| | | | | | | | | | |
Balance at December 31, 2022 | | $ | 2,258,291 | | | $ | 1,676,931 | | | $ | 610,723 | | | $ | 298,346 | | | $ | 4,844,291 | |
| | | | | | | | | | |
Balance at January 1, 2023 | | $ | 2,258,291 | | | $ | 1,676,931 | | | $ | 610,723 | | | $ | 298,346 | | | $ | 4,844,291 | |
| Capitalizations | | 471,771 | | | 159,650 | | | 107,230 | | | 13,053 | | | 751,704 | |
| Amortization expense | | (159,898) | | | (99,464) | | | (51,534) | | | (16,530) | | | (327,426) | |
| Foreign exchange adjustment | | 3,206 | | | — | | | — | | | — | | | 3,206 | |
| | | | | | | | | | |
Balance at December 31, 2023 | | $ | 2,573,370 | | | $ | 1,737,117 | | | $ | 666,419 | | | $ | 294,869 | | | $ | 5,271,775 | |
| | | | | | | | | | |
Balance at January 1, 2024 | | $ | 2,573,370 | | | $ | 1,737,117 | | | $ | 666,419 | | | $ | 294,869 | | | $ | 5,271,775 | |
| Capitalizations | | 524,980 | | | 145,538 | | | 119,203 | | | 12,172 | | | 801,893 | |
| Amortization expense | | (181,431) | | | (101,425) | | | (56,832) | | | (16,535) | | | (356,223) | |
| Foreign exchange adjustment | | (16,690) | | | — | | | — | | | — | | | (16,690) | |
| | | | | | | | | | |
Balance at December 31, 2024 | | $ | 2,900,229 | | | $ | 1,781,230 | | | $ | 728,790 | | | $ | 290,506 | | | $ | 5,700,755 | |
| | | | | | | | | | | | | | | | | | | | | | | | | | | | | | | | | | | | | | |
| | Health |
| | United American | | Family Heritage | | Liberty National | | American Income | | DTC | | Total |
Balance at January 1, 2022 | | $ | 81,140 | | | $ | 388,967 | | | $ | 127,537 | | | $ | 49,406 | | | $ | 2,032 | | | $ | 649,082 | |
| Capitalizations | | 2,135 | | | 53,117 | | | 18,737 | | | 12,378 | | | 4 | | | 86,371 | |
| Amortization expense | | (5,881) | | | (25,476) | | | (13,178) | | | (3,467) | | | (182) | | | (48,184) | |
| Foreign exchange adjustment | | — | | | — | | | — | | | (506) | | | — | | | (506) | |
| | | | | | | | | | | | |
Balance at December 31, 2022 | | $ | 77,394 | | | $ | 416,608 | | | $ | 133,096 | | | $ | 57,811 | | | $ | 1,854 | | | $ | 686,763 | |
| | | | | | | | | | | | |
Balance at January 1, 2023 | | $ | 77,394 | | | $ | 416,608 | | | $ | 133,096 | | | $ | 57,811 | | | $ | 1,854 | | | $ | 686,763 | |
| Capitalizations | | 1,941 | | | 63,366 | | | 20,309 | | | 12,849 | | | — | | | 98,465 | |
| Amortization expense | | (5,846) | | | (27,131) | | | (13,464) | | | (3,982) | | | (175) | | | (50,598) | |
| Foreign exchange adjustment | | — | | | — | | | — | | | 105 | | | — | | | 105 | |
| | | | | | | | | | | | |
Balance at December 31, 2023 | | $ | 73,489 | | | $ | 452,843 | | | $ | 139,941 | | | $ | 66,783 | | | $ | 1,679 | | | $ | 734,735 | |
| | | | | | | | | | | | |
Balance at January 1, 2024 | | $ | 73,489 | | | $ | 452,843 | | | $ | 139,941 | | | $ | 66,783 | | | $ | 1,679 | | | $ | 734,735 | |
| Capitalizations | | 2,608 | | | 70,311 | | | 23,775 | | | 14,955 | | | 2 | | | 111,651 | |
| Amortization expense | | (5,567) | | | (27,035) | | | (14,796) | | | (4,678) | | | (148) | | | (52,224) | |
| Foreign exchange adjustment | | — | | | — | | | — | | | (741) | | | — | | | (741) | |
| | | | | | | | | | | | |
Balance at December 31, 2024 | | $ | 70,530 | | | $ | 496,119 | | | $ | 148,920 | | | $ | 76,319 | | | $ | 1,533 | | | $ | 793,421 | |
| | | | | | | | | | | | |
| | | | | | | | | | | | |
| | | | | | | | | | | | |
| | | | | | | | | | | | |
| | | | | | | | | | | | |
| | | | | | | | | | | | |
| | | | | | | | | | | | |
| | | | | | | | | | | | |
| | | | | | | | | | | | |
| | | | | | | | | | | | |
Globe Life Inc.
Notes to Consolidated Financial Statements
(Dollar amounts in thousands, except per share data)
The following table presents a reconciliation of deferred policy acquisition costs to the Consolidated Balance Sheets for the three years ended December 31, 2024: | | | | | | | | | | | | | | | | | | | | |
| | December 31, |
| 2024 | | 2023 | | 2022 |
| Life | | | | | | |
| American Income | | $ | 2,900,229 | | | $ | 2,573,370 | | | $ | 2,258,291 | |
| Direct to Consumer | | 1,781,230 | | | 1,737,117 | | | 1,676,931 | |
| Liberty National | | 728,790 | | | 666,419 | | | 610,723 | |
| Other | | 290,506 | | | 294,869 | | | 298,346 | |
Total DAC—Life | | 5,700,755 | | | 5,271,775 | | | 4,844,291 | |
| | | | | | |
| Health | | | | | | |
| United American | | 70,530 | | | 73,489 | | | 77,394 | |
| Family Heritage | | 496,119 | | | 452,843 | | | 416,608 | |
| Liberty National | | 148,920 | | | 139,941 | | | 133,096 | |
| American Income | | 76,319 | | | 66,783 | | | 57,811 | |
| Direct to Consumer | | 1,533 | | | 1,679 | | | 1,854 | |
Total DAC—Health | | 793,421 | | | 734,735 | | | 686,763 | |
| | | | | | |
Annuity | | 1,413 | | | 2,967 | | | 4,643 | |
Total | | $ | 6,495,589 | | | $ | 6,009,477 | | | $ | 5,535,697 | |
Globe Life Inc.
Notes to Consolidated Financial Statements
(Dollar amounts in thousands, except per share data)
Note 8—Liability for Unpaid Claims
Activity in the liability for unpaid health claims is summarized as follows: | | | | | | | | | | | | | | | | | |
| Year Ended December 31, |
| 2024 | | 2023 | | 2022 |
Balance at January 1, | $ | 194,809 | | | $ | 184,286 | | | $ | 173,737 | |
| Less reinsurance recoverables | (2,157) | | | (2,084) | | | (2,628) | |
Net balance at January 1, | 192,652 | | | 182,202 | | | 171,109 | |
| Incurred related to: | | | | | |
| Current year | 767,076 | | | 697,521 | | | 676,189 | |
| Prior years | (10,460) | | | (4,853) | | | (15,631) | |
| Total incurred | 756,616 | | | 692,668 | | | 660,558 | |
| Paid related to: | | | | | |
| Current year | 587,473 | | | 535,971 | | | 517,855 | |
| Prior years | 152,322 | | | 146,247 | | | 131,610 | |
| Total paid | 739,795 | | | 682,218 | | | 649,465 | |
| | | | | |
| | | | | |
| | | | | |
Net balance at December 31, | 209,473 | | | 192,652 | | | 182,202 | |
| Plus reinsurance recoverables | 1,521 | | | 2,157 | | | 2,084 | |
Balance at December 31, | $ | 210,994 | | | $ | 194,809 | | | $ | 184,286 | |
At the end of each period, the liability for unpaid health claims includes an estimate of claims incurred but not yet reported to the Company. Such estimates are updated regularly based upon the Company’s most recent claims data with recognition of emerging experience trends. Due to the nature of the Company’s health business, the payment lags are relatively short and most claims are fully paid within a year from the time incurred. Fluctuations in claims experience can lead to either over or under estimation of the liability for any given year. The difference between the estimate made at the end of the prior period and the actual experience during the period is reflected above under the caption "Incurred related to: Prior years."
| | | | | | | | | | | |
| December 31, |
| 2024 | | 2023 |
| Policy claims and other benefits payable: | | | |
| Life insurance | $ | 321,838 | | | $ | 320,066 | |
| Health insurance | 210,994 | | | 194,809 | |
| Total | $ | 532,832 | | | $ | 514,875 | |
Globe Life Inc.
Notes to Consolidated Financial Statements
(Dollar amounts in thousands, except per share data)
Note 9—Income Taxes
The following table discloses significant components of income taxes for each year presented:
| | | | | | | | | | | | | | | | | |
| Year Ended December 31, |
| 2024 | | 2023 | | 2022 |
| Income tax expense (benefit) from operations: | | | | | |
| Current income tax expense (benefit) | $ | 218,135 | | | $ | 145,880 | | | $ | 138,968 | |
| Deferred income tax expense (benefit) | 37,740 | | | 77,631 | | | 68,757 | |
| 255,875 | | | 223,511 | | | 207,725 | |
| Shareholders’ equity: | | | | | |
| Other comprehensive income (loss) | 197,427 | | | 4,762 | | | 384,035 | |
| $ | 453,302 | | | $ | 228,273 | | | $ | 591,760 | |
In each of the years 2022 through 2024, deferred income tax expense (benefit) was incurred because of certain differences between net income before income tax expense (benefit) as reported on the Consolidated Statements of Operations and taxable income as reported on Globe Life's income tax returns. As explained in Note 1—Significant Accounting Policies, these differences caused the consolidated financial statement book values of some assets and liabilities to be different from their respective tax bases.
The effective income tax rate differed from the expected U.S. federal statutory rate of 21% as shown below:
| | | | | | | | | | | | | | | | | | | | | | | | | | | | | | | | | | | |
| Year Ended December 31, |
| 2024 | | % | | 2023 | | % | | 2022 | | % |
Expected federal income tax expense (benefit) | $ | 278,594 | | | 21.0 | | | $ | 250,796 | | | 21.0 | | | $ | 231,443 | | | 21.0 | |
| | | | | | | | | | | |
| Increase (reduction) in income taxes resulting from: | | | | | | | | | | | |
| | | | | | | | | | | |
| Low-income housing investments | (9,700) | | | (0.7) | | | (14,291) | | | (1.2) | | | (11,443) | | | (1.1) | |
| Share-based awards | 1,341 | | | 0.1 | | | (4,724) | | | (0.4) | | | (5,251) | | | (0.5) | |
| Tax-exempt investment income | (9,644) | | | (0.7) | | | (9,644) | | | (0.8) | | | (8,961) | | | (0.8) | |
| Other tax credits | (5,000) | | | (0.4) | | | — | | | — | | | — | | | — | |
| Other | 284 | | | — | | | 1,374 | | | 0.1 | | | 1,937 | | | 0.2 | |
Income tax expense (benefit) | $ | 255,875 | | | 19.3 | | | $ | 223,511 | | | 18.7 | | | $ | 207,725 | | | 18.8 | |
Globe Life Inc.
Notes to Consolidated Financial Statements
(Dollar amounts in thousands, except per share data)
The tax effects of temporary differences that gave rise to significant portions of the deferred tax assets and deferred tax liabilities are presented below:
| | | | | | | | | | | |
| December 31, |
| 2024 | | 2023 |
| Deferred tax assets: | | | |
| | | |
| Unrealized losses | $ | 532,756 | | | $ | 732,750 | |
| Carryover of tax losses | 10,342 | | | 4,227 | |
| Total gross deferred tax assets | 543,098 | | | 736,977 | |
| Less valuation allowance | (3,383) | | | — | |
| Net deferred tax assets | 539,715 | | | 736,977 | |
| Deferred tax liabilities: | | | |
| | | |
| Employee and agent compensation | 104,385 | | | 100,689 | |
| Deferred acquisition costs | 961,406 | | | 892,149 | |
| Future policy benefits, unearned and advance premiums, and policy claims | 228,117 | | | 267,564 | |
| Other liabilities | 24,432 | | | 17,466 | |
| Total gross deferred tax liabilities | 1,318,340 | | | 1,277,868 | |
Net deferred tax liability | $ | 778,625 | | | $ | 540,891 | |
Bermuda Corporate Income Tax Act, The Bermuda Corporate Income Tax Act (the Act) was enacted on December 27, 2023, and included a new corporate income tax (CIT). The Act and CIT go into effect for years beginning after January 1, 2025. The Company is in the process of evaluating the impact the Act will have on the consolidated financial statements; however, the Company does not expect the Act to have a material impact.
Inflation Reduction Act, The Inflation Reduction Act (the Act) was enacted on August 16, 2022, and included a new corporate alternative minimum tax (CAMT). The Act and the CAMT go into effect for tax years beginning after 2022.
Globe Life Inc., as parent of a tax-controlled group, has determined that it does not reasonably expect to be an applicable corporation on a group basis for the taxable year ended December 31, 2024. Therefore, the Company did not calculate or recognize a payable for CAMT in its 2024 financial statements.
Income Tax Return: Globe Life Inc. and its subsidiaries file a life-nonlife consolidated federal income tax return. The statutes of limitations for the Internal Revenue Service's examination and assessment of additional tax are closed for all tax years prior to 2017 with respect to Globe Life's consolidated federal income tax returns. Management concludes that adequate provision has been made in the consolidated financial statements for any potential assessments that may result from current or future tax examinations and other tax-related matters for all open years.
Valuations: Globe Life has a $49.2 million net operating loss (NOL) carryforward at December 31, 2024, of which $7.2 million was created prior to 2018 and will begin to expire in 2035 if not otherwise used to offset future taxable income. The remaining NOL carryforward of $42.0 million may be carried forward indefinitely. A valuation allowance is to be recorded when it is more likely than not that deferred tax assets will not be realized by the Company. A valuation allowance has been established in the amount of $3.4 million related to pre-acquisition NOL carryforward deferred tax assets acquired in 2024 as management has determined that the acquired companies will more than likely not have sufficient taxable income in future periods to realize the deferred tax assets.
Globe Life's tax liability is adjusted to include a provision for uncertain tax positions taken or expected to be taken in a tax return. However, during the years 2022 through 2024, Globe Life did not have any uncertain tax positions which resulted in unrecognized tax benefits.
Globe Life Inc.
Notes to Consolidated Financial Statements
(Dollar amounts in thousands, except per share data)
Note 10—Postretirement Benefits
Globe Life has qualified noncontributory defined benefit pension plans (Pension Plans) and contributory savings plans that cover substantially all employees. There is also a nonqualified noncontributory supplemental executive retirement plan (SERP) that covers a limited number of officers. The tables included herein will focus on the Pension Plans and SERP.
The total cost of these retirement plans charged to operations was as follows:
| | | | | | | | | | | | | | | | | |
| Year Ended December 31, |
| 2024 | | 2023 | | 2022 |
| Plan Type: | | | | | |
Defined Contribution Plans(1) | $ | 6,605 | | | $ | 6,390 | | | $ | 5,824 | |
Defined Benefit Pension Plans(2) | 16,458 | | | 15,225 | | | 37,040 | |
(1)401K plans.
(2)Qualified pension plans and SERP.
Globe Life accrues expense for the defined contribution plans based on a percentage of the employees’ contributions. The plans are funded by the employee contributions and a Globe Life contribution equal to the amount of accrued expense. Plan contributions are both mandatory and discretionary, depending on the terms of the plan.
Pension Plans: Cost for the Pension Plans has been calculated on the projected unit credit actuarial cost method. All plan measurements for the pension plans are as of December 31 of the respective year. The pension plans covering the majority of employees are qualified and funded. Contributions are made to funded pension plans subject to minimums required by regulation and maximums allowed for tax purposes.
Globe Life's SERP provides an additional supplemental defined pension benefit to a limited number of officers. The supplemental benefit is based on the participant’s qualified plan benefit without consideration to the regulatory limits on compensation and benefit payments applicable to qualified plans, except that eligible compensation is capped at $1 million. The SERP is nonqualified and unfunded. However, a Rabbi Trust has been established to support the liability for this plan. The Rabbi Trust consists of life insurance policies on the lives of plan participants with an unaffiliated insurance carrier as well as an investment account. Since this plan is nonqualified, the investments and the policyholder value of the insurance policies in the Rabbi Trust are not included as defined benefit plan assets, but rather assets of the Company. They are included in “Other Assets” in the Consolidated Balance Sheets.
Defined benefit and SERP plan contributions were $24.8 million in 2024, $24.4 million in 2023, and $29.8 million in 2022. In 2025, the Company does not expect to increase contributions to the plans from what was contributed in 2024.
Globe Life Inc.
Notes to Consolidated Financial Statements
(Dollar amounts in thousands, except per share data)
Pension Assets: Plan assets in the funded plans consist primarily of investments in marketable fixed maturities and equity securities that are valued at fair value. Globe Life measures the fair value of its financial assets, including the assets in its benefit plans, in accordance with accounting guidance which establishes a hierarchy for asset values and provides a methodology for the measurement of value. Please refer to Note 1—Significant Accounting Policies under the caption Fair Value Measurements, Investments in Securities for a complete discussion of valuation procedures.
The following table presents the assets of the Company's Pension Plans at December 31, 2024 and 2023:
Pension Assets by Component at December 31, 2024
| | | | | | | | | | | | | | | | | | | | | | | | | | | | | |
| | Fair Value Determined by: | | | | |
| | Quoted Prices in Active Markets for Identical Assets (Level 1) | | Significant Observable Inputs (Level 2) | | Significant
Unobservable
Inputs (Level 3) | | Total Amount | | % of
Total |
| | | | | | | | | |
Exchange traded fund(4) | $ | 35,483 | | | $ | — | | | $ | — | | | $ | 35,483 | | | 6 | |
| | | | | | | | | |
| | | | | | | | | |
| | | | | | | | | |
| | | | | | | | | |
| | | | | | | | | |
Equity exchange traded fund(1) | 322,846 | | | — | | | — | | | 322,846 | | | 53 | |
| U.S. Government and Agency | — | | | 179,418 | | | — | | | 179,418 | | | 29 | |
| Other bonds | — | | | 4 | | | — | | | 4 | | | — | |
Guaranteed annuity contract(2) | — | | | 43,893 | | | — | | | 43,893 | | | 7 | |
| Short-term investments | 1,235 | | | — | | | — | | | 1,235 | | | — | |
| Other | 1,420 | | | — | | | — | | | 1,420 | | | — | |
| $ | 360,984 | | | $ | 223,315 | | | $ | — | | | 584,299 | | | 95 | |
Other long-term investments(3) | | 30,546 | | | 5 | |
Total pension assets | | $ | 614,845 | | | 100 | |
(1)A fund including marketable securities that mirror the S&P 500 index.
(2)Representing a guaranteed annuity contract issued by Globe Life Inc.'s subsidiary, American Income Life Insurance Company, to fund the obligations of the American Income Life Insurance Company Collective Bargaining Agreement Employees Pension Plan.
(3)Includes non-redeemable investment funds that report the Globe Life Inc. Pension Plan's pro-rata share of the limited partnership's net asset value (NAV) per share, or its equivalent, as a practical expedient for fair value. As of December 31, 2024, the Globe Life Inc. Pension Plan owned less than 1% of two long-term investment funds.
(4)A fund including U.S. dollar-denominated investment-grade securities issued by industrial, utility, and financial companies with maturities greater than 10 years.
Globe Life Inc.
Notes to Consolidated Financial Statements
(Dollar amounts in thousands, except per share data)
Pension Assets by Component at December 31, 2023
| | | | | | | | | | | | | | | | | | | | | | | | | | | | | |
| | Fair Value Determined by: | | | | |
| Quoted Prices in Active Markets for Identical Assets (Level 1) | | Significant Observable Inputs (Level 2) | | Significant Unobservable Inputs (Level 3) | | Total Amount | | % of
Total |
| | | | | | | | | |
Exchange traded fund(4) | $ | 18,715 | | | $ | — | | | $ | — | | | $ | 18,715 | | | 3 | |
| | | | | | | | | |
| | | | | | | | | |
| | | | | | | | | |
| | | | | | | | | |
| | | | | | | | | |
Equity exchange traded fund(1) | 315,886 | | | — | | | — | | | 315,886 | | | 55 | |
| U.S. Government and Agency | — | | | 167,450 | | | — | | | 167,450 | | | 30 | |
| Other bonds | — | | | 5 | | | — | | | 5 | | | — | |
Guaranteed annuity contract(2) | — | | | 43,428 | | | — | | | 43,428 | | | 8 | |
| Short-term investments | 6,506 | | | — | | | — | | | 6,506 | | | 1 | |
| Other | 463 | | | — | | | — | | | 463 | | | — | |
| $ | 341,570 | | | $ | 210,883 | | | $ | — | | | 552,453 | | | 97 | |
Other long-term investments(3) | | 18,314 | | | 3 | |
Total pension assets | | $ | 570,767 | | | 100 | |
(1)A fund including marketable securities that mirror the S&P 500 index.
(2)Representing a guaranteed annuity contract issued by Globe Life Inc.'s subsidiary, American Income Life Insurance Company, to fund the obligations of the American Income Life Insurance Company Collective Bargaining Agreement Employees Pension Plan.
(3)Includes non-redeemable investment funds that report the Globe Life Inc. Pension Plan's pro-rata share of the limited partnership's net asset value (NAV) per share, or its equivalent, as a practical expedient for fair value. As of December 31, 2023, the Globe Life Inc. Pension Plan owned less than 1% of two long-term investment funds.
(4)A fund including U.S. dollar-denominated investment-grade securities issued by industrial, utility, and financial companies with maturities greater than 10 years.
Globe Life's investment objectives and goals for its plan assets include generating strong risk-adjusted returns, maintaining diversification, investing in accordance with the liabilities of the plan, and satisfying the liquidity needs of the plan. Globe Life seeks to accomplish these objectives by investing in public and private markets and diversifying across asset classes, industries, sectors, and entities. Globe Life intends to maintain an asset mix that when combined with future plan contributions will produce adequate long-term risk adjusted returns relative to expected changes in the liability as a result of changes to interest rates or earned benefits.
The majority of the securities in the portfolio are highly marketable so that there will be adequate liquidity to meet projected payments. There are no specific policies calling for asset durations to match those of benefit obligations.
Allowed investments include equity, fixed income, real assets, and short-term investments. Equity securities include common stocks or equivalents, preferred stocks, and/or funds investing primarily in private or public equity investments. Fixed income securities include loans of corporations or commercial real estate as well as marketable debt securities issued by either the U.S. Government, Agencies of the U.S. Government, state, local and municipal governments, domestic and foreign corporations, Special Purpose Vehicles secured by pools of financial assets, and other U.S. financial institutions. Real Assets include equity interest in core or non-core real estate or infrastructure with U.S. or non-U.S. exposure. Short-term investments consist of fixed income securities maturing in one year or less.
The assets are to be invested in a mix of allowed investments that best serve the objectives of the pension plan. Factors to be considered in determining the asset mix include funded status, annual pension expense, annual pension contributions, and balance sheet liability. The investment portfolio is well diversified to avoid undue exposure to an asset class, sector, industry, business, or security. The Company does not employ any other special risk management techniques, such as derivatives, in managing the pension investment portfolio.
Globe Life's public equity within the pension plan assets consists of an exchange traded fund that mirrors the S&P 500 index which better aligns with a passive approach rather than an actively managed portfolio.
Globe Life Inc.
Notes to Consolidated Financial Statements
(Dollar amounts in thousands, except per share data)
At December 31, 2024, there were no restricted investments contained in the portfolio. Plan contributions have been invested primarily in fixed maturity and equity securities during the three years ended December 31, 2024.
The following table presents additional information about the Company's investment funds included in pension plan assets as of December 31, 2024 and December 31, 2023 at fair value:
| | | | | | | | | | | | | | | | | | | | | | | | | | | |
| | Fair Value | | Unfunded Commitments(2) | | | |
| Investment Category | | 2024 | | 2023 | | 2024 | | Redemption Term/Notice(1) | |
| Multi-asset class | | $ | 12,383 | | | $ | 14,714 | | | $ | — | | | Non-redeemable | |
| Private equity | | 18,163 | | | 3,600 | | | 48,167 | | | Non-redeemable | |
| | | | | | | | | |
| Total | | $ | 30,546 | | | $ | 18,314 | | | $ | 48,167 | | | | |
(1) Non-redeemable funds generally have an expected life of 7 to 10 years from fund closing with extension options of 2 to 4 years. Redemptions are paid out throughout the life of the funds at the General Partner's discretion.
(2) Unfunded commitments include unfunded balances during the investment period. After an investment period ends, the fund can call capital based on limited and specified reasons. As of December 31, 2024, unfunded commitments totaled $57.5 million, including funds past the investment period.
SERP: The following tables include premiums paid for COLI for the three years ended December 31, 2024 and investments of the Rabbi Trust for the two years ended December 31, 2024:
| | | | | | | | | | | | | | | | | |
| Year Ended December 31, |
| 2024 | | 2023 | | 2022 |
| Premiums paid for insurance coverage | $ | 443 | | | $ | 443 | | | $ | 443 | |
| | | | | |
| | | At December 31, |
| | | 2024 | | 2023 |
| Total investments: | | | | | |
| COLI | | $ | 57,210 | | | $ | 55,185 | |
| Exchange traded funds | | 98,314 | | | 86,156 | |
| | | $ | 155,524 | | | $ | 141,341 | |
Pension Plans and SERP Liabilities: The following table presents the projected benefit obligation (PBO) and accumulated benefit obligation (ABO) for the Pension Plans and SERP at December 31, 2024 and 2023:
| | | | | | | | | | | | | | | | | | | | | | | |
| December 31, |
| 2024 | | 2023 |
| PBO | | ABO | | PBO | | ABO |
| Pension plans | $ | 561,615 | | | $ | 500,010 | | | $ | 554,957 | | | $ | 493,040 | |
| SERP | 73,441 | | | 68,428 | | | 72,603 | | | 69,332 | |
Benefit obligation | $ | 635,056 | | | $ | 568,438 | | | $ | 627,560 | | | $ | 562,372 | |
For the year ended December 31, 2024, the Pension Plans have plan assets with fair values in excess of projected benefit obligations. The projected benefit obligations and the fair value of plan assets were as follows:
| | | | | | | | | | | |
| At December 31, |
| 2024 | | 2023 |
| Funded benefit pension plans PBO | $ | 561,615 | | | $ | 554,957 | |
| Funded benefit pension plans fair value of plan assets | 614,845 | | | 570,767 | |
Globe Life Inc.
Notes to Consolidated Financial Statements
(Dollar amounts in thousands, except per share data)
For the year ended December 31, 2024, the funded benefit pension plans have plan assets with fair value in excess of the accumulated benefit obligations. The accumulated benefit obligations and the fair value of plan assets were as follows:
| | | | | | | | | | | |
| At December 31, |
| 2024 | | 2023 |
| Funded benefit pension plans ABO | $ | 500,010 | | | $ | 493,040 | |
| Funded benefit pension plans fair value of plan assets | 614,845 | | | 570,767 | |
The following table discloses the assumptions used to determine Globe Life's pension liabilities and costs for the appropriate periods. The discount and compensation increase rates are used to determine current year projected benefit obligations and subsequent year pension expense. The long-term rate of return is used to determine current year expense. Differences between assumptions and actual experience are included in actuarial gain or loss.
Weighted Average Pension Plan Assumptions
| | | | | | | | | | | | | | | | | |
| For Benefit Obligations at December 31: | | | 2024 | | 2023 |
| Discount rate | | 5.81 | % | | 5.40 | % |
| Rate of compensation increase | | 4.46 | | | 4.40 | |
| | | | | |
| For Periodic Benefit Cost for the Year: | 2024 | | 2023 | | 2022 |
| Discount rate | 5.40 | % | | 5.71 | % | | 3.19 | % |
| Expected long-term returns | 7.18 | | | 6.98 | | | 6.98 | |
| Rate of compensation increase | 4.40 | | | 4.40 | | | 4.43 | |
The discount rate is determined based on the expected duration of plan liabilities. A yield is then derived based on the current market yield of a hypothetical portfolio of high quality corporate bonds that match the liability's average life. The rate of compensation increase is projected based on Company experience, modified as appropriate for future expectations. The expected long-term rate of return on plan assets is management’s best estimate of the average rate of earnings expected to be received on the assets invested in the plan over the benefit period. In determining this assumption, consideration is given to the historical rate of return earned on the assets, the projected returns over future periods, and the discount rate used to compute benefit obligations.
Net Periodic Benefit Cost: The following table presents the net periodic benefit cost for the defined benefit plans by expense component for the three years ended December 31, 2024 as follows:
Components of Net Periodic Benefit Cost
| | | | | | | | | | | | | | | | | |
| | Year Ended December 31, |
| | 2024 | | 2023 | | 2022 |
| Service cost—benefits earned during the period | $ | 24,898 | | | $ | 21,568 | | | $ | 34,624 | |
| Interest cost on projected benefit obligation | 33,123 | | | 31,367 | | | 24,445 | |
| Expected return on assets | (42,580) | | | (38,625) | | | (35,539) | |
| Amortization of prior service cost (credit) | 1,071 | | | 1,075 | | | 1,077 | |
| Recognition of actuarial gain (loss) | (54) | | | (160) | | | 12,433 | |
Net periodic benefit cost | $ | 16,458 | | | $ | 15,225 | | | $ | 37,040 | |
Globe Life Inc.
Notes to Consolidated Financial Statements
(Dollar amounts in thousands, except per share data)
An analysis of the impact on other comprehensive income (loss) concerning pensions and other postretirement benefits is as follows:
| | | | | | | | | | | | | | | | | |
| Year Ended December 31, |
| 2024 | | 2023 | | 2022 |
Balance at January 1 | $ | (2,727) | | | $ | 1,570 | | | $ | (131,239) | |
| Amortization of: | | | | | |
| Prior service cost (credit) | 1,071 | | | 1,075 | | | 1,077 | |
Net actuarial (gain) loss(1) | (597) | | | (1,465) | | | 12,677 | |
| Total amortization | 474 | | | (390) | | | 13,754 | |
| Plan amendments | (1,212) | | | — | | | — | |
Experience gain (loss)(2) | 29,659 | | | (3,907) | | | 119,055 | |
Balance at December 31 | $ | 26,194 | | | $ | (2,727) | | | $ | 1,570 | |
(1)Includes amortization of postretirement benefits other than pensions of $(622) thousand in 2024, $(732) thousand in 2023, and $289 thousand in 2022.
(2)The increase in the experience gain (loss) is related to an increase in discount rate.
The following table presents a reconciliation from the beginning to the end of the year of the PBO for the Pension Plans and SERP, and the plan assets for the Pension Plans. This table also presents the amounts previously recognized as a component of accumulated other comprehensive income.
Pension Benefits | | | | | | | | | | | |
| Year Ended December 31, |
| 2024 | | 2023 |
| Changes in PBO: | | | |
| PBO at beginning of year | $ | 627,560 | | | $ | 562,567 | |
| Service cost | 24,898 | | | 21,568 | |
| Interest cost | 33,123 | | | 31,367 | |
| Plan amendments | 1,212 | | | — | |
| Actuarial loss (gain) | (22,964) | | | 40,569 | |
| Benefits paid | (28,773) | | | (28,511) | |
| PBO at end of year | 635,056 | | | 627,560 | |
| | | |
| Changes in plan assets: | | | |
| Fair value at beginning of year | 570,767 | | | 499,775 | |
| Return on assets | 48,084 | | | 75,062 | |
| Contributions | 24,767 | | | 24,441 | |
| Benefits paid | (28,773) | | | (28,511) | |
| Fair value at end of year | 614,845 | | | 570,767 | |
Funded status at year end | $ | (20,211) | | | $ | (56,793) | |
Changes in the PBO related to actuarial losses (gains) are primarily attributed to changes in the discount rate.
| | | | | | | | | | | |
| Year Ended December 31, |
| Amounts recognized in accumulated other comprehensive income consist of: | 2024 | | 2023 |
| Net loss (gain) | $ | (28,720) | | | $ | (227) | |
| Prior service cost | 6,636 | | | 6,494 | |
| Net amounts recognized at year end | $ | (22,084) | | | $ | 6,267 | |
Globe Life Inc.
Notes to Consolidated Financial Statements
(Dollar amounts in thousands, except per share data)
Globe Life has estimated its expected postretirement benefits to be paid over the next ten years as of December 31, 2024. These estimates use the same assumptions that measure the benefit obligation at December 31, 2024, taking estimated future employee service into account. Those estimated benefits are as follows:
| | | | | |
| For the year(s): | |
| 2025 | $ | 31,035 | |
| 2026 | 33,565 | |
| 2027 | 36,259 | |
| 2028 | 39,032 | |
| 2029 | 41,865 | |
| 2030-2034 | 243,598 | |
Note 11—Supplemental Disclosures of Cash Flow Information
| | | | | | | | | | | | | | | | | |
| Year Ended December 31, |
| 2024 | | 2023 | | 2022 |
| Stock-based compensation not involving cash | $ | 40,118 | | | $ | 30,736 | | | $ | 35,650 | |
| Commitments for low-income housing interests | 35,000 | | | — | | | 136,882 | |
| Exchanges of fixed maturity investments | 105,595 | | | 50,936 | | | 147,612 | |
| Net unsettled security trades | 2,334 | | | 3,833 | | | — | |
| Noncash tax credits | — | | | 1,083 | | | 1,000 | |
| | | | | |
The following table summarizes certain amounts paid during the period:
| | | | | | | | | | | | | | | | | |
| Year Ended December 31, |
| 2024 | | 2023 | | 2022 |
| Interest paid | $ | 116,993 | | | $ | 99,545 | | | $ | 88,814 | |
Income taxes paid(1) | 175,400 | | | 121,034 | | | 114,888 | |
(1)Income taxes paid includes cash paid of $47 million, $0 and $0 for the purchase of transferable tax credits as of December 31, 2024, 2023 and 2022, respectively.
Globe Life Inc.
Notes to Consolidated Financial Statements
(Dollar amounts in thousands, except per share data)
Note 12—Debt
On August 23, 2024, Globe Life completed the issuance of $450 million principal amount of 5.85% Senior notes due September 15, 2034. Total proceeds received by the Parent Company from the issuance, net of the underwriters’ discount, were $445 million. The proceeds were used for general corporate purposes, which included open market purchases of shares of its common stock under its share repurchase program. On August 15, 2024, Globe Life amended its term loan agreement increasing the principal amount from $170 million to $250 million, an increase of $80 million. The amendment extends the maturity date from November 11, 2024 to August 15, 2027.
The following table presents information about the terms and outstanding balances of Globe Life's debt.
Selected Information about Debt Issues | | | | | | | | | | | | | | | | | | | | | | | | | | | | | | | | | | | | | | | | | | | | | | | |
| | | | | | | As of December 31, |
| | | | | | | 2024 | | 2023 |
| Instrument | Issue Date | | Maturity Date | | Coupon Rate | | Par
Value | | Unamortized Discount & Issuance Costs | | Book
Value | | Fair
Value | | Book
Value |
| | | | | | | | | | | | | | | |
| Senior notes | 09/27/2018 | | 09/15/2028 | | 4.550% | | $ | 550,000 | | | $ | (3,001) | | | $ | 546,999 | | | $ | 542,811 | | | $ | 546,283 | |
| Senior notes | 08/21/2020 | | 08/15/2030 | | 2.150% | | 400,000 | | | (2,868) | | | 397,132 | | | 338,524 | | | 396,670 | |
Senior notes(1) | 05/19/2022 | | 06/15/2032 | | 4.800% | | 250,000 | | | (3,728) | | | 246,272 | | | 241,083 | | | 245,873 | |
| Senior notes | 08/23/2024 | | 09/15/2034 | | 5.850% | | 450,000 | | | (5,186) | | | 444,814 | | | 451,665 | | | — | |
| | | | | | | | | | | | | | | |
| Junior subordinated debentures | 11/17/2017 | | 11/17/2057 | | 5.275% | | 125,000 | | | (1,557) | | | 123,443 | | | 95,865 | | | 123,427 | |
| Junior subordinated debentures | 06/14/2021 | | 06/15/2061 | | 4.250% | | 325,000 | | | (7,613) | | | 317,387 | | | 204,620 | | | 317,306 | |
Term loan(2) | 05/11/2023 | | 08/15/2027 | | 5.998% | | 250,000 | | | (1,796) | | | 248,204 | | | 248,204 | | | — | |
| | | | | | | | | | | | | | | |
| | | | | | | | | | |
Total long-term debt | | 2,350,000 | | | (25,749) | | | 2,324,251 | | | 2,122,772 | | | 1,629,559 | |
| | | | | | | | | | | | | | | |
| | | | | | | | | | |
Term loan(2) | | — | | | — | | | — | | | — | | | 169,549 | |
| | | | | | | | | | |
| Commercial paper | | 419,000 | | | (3,599) | | | 415,401 | | | 415,401 | | | 316,564 | |
Total short-term debt | | 419,000 | | | (3,599) | | | 415,401 | | | 415,401 | | | 486,113 | |
| | | | | | | | | | | | | | | |
Total debt | | $ | 2,769,000 | | | $ | (29,348) | | | $ | 2,739,652 | | | $ | 2,538,173 | | | $ | 2,115,672 | |
(1)An additional $150 million par value and book value is held by insurance subsidiaries that eliminates in consolidation.
(2)Interest calculated quarterly using Secured Overnight Financing Rate (SOFR) plus 135 basis points.
The commercial paper has the highest priority of all unsecured debt, followed by senior notes then junior subordinated debentures. The senior notes are callable under a make-whole provision, and the junior subordinated debentures are subject to an optional redemption five years from issuance. Interest on the 4.25% junior subordinated debentures and the term loan are payable quarterly while all other long-term debt is payable semi-annually.
Globe Life Inc.
Notes to Consolidated Financial Statements
(Dollar amounts in thousands, except per share data)
Contractual Debt Obligations: The following table presents expected scheduled principal payments under our contractual debt obligations:
| | | | | | | | | | | | | | | | | | | | | | | | | | | | | | | | | | | |
| Year Ended December 31, |
| 2025 | | 2026 | | 2027 | | 2028 | | 2029 | | Thereafter |
| Debt obligations | $ | 419,000 | | | $ | — | | | $ | 250,000 | | | $ | 550,000 | | | $ | — | | | $ | 1,550,000 | |
Credit Facility: On March 29, 2024, Globe Life amended the credit agreement dated September 30, 2021, which provides for a $1 billion revolving credit facility that may be increased to $1.25 billion upon approval of the participating banks. The amended credit facility matures March 29, 2029 and may be extended up to two one-year periods upon the Company's request. Pursuant to this agreement, the participating lenders have agreed to make revolving loans to Globe Life and to issue secured or unsecured letters of credit. The Company has not drawn on any of the credit to date. The facility is further designated as a back-up credit line for a commercial paper program under which the Company may either borrow from the credit line or issue commercial paper at any time, with total commercial paper outstanding not to exceed the facility maximum of $1 billion, less any letters of credit issued. Interest is charged at variable rates. In accordance with the agreement, Globe Life is subject to certain covenants regarding capitalization. As of December 31, 2024, the Company was in full compliance with these covenants.
Commercial paper outstanding and any long-term debt due within one year are reported as short-term debt on the Consolidated Balance Sheets. The following tables present selected information concerning Globe Life's commercial paper borrowings.
Credit Facility—Commercial Paper
(Dollar amounts in thousands)
| | | | | | | | | | | |
| At December 31, |
| 2024 | | 2023 |
| Balance commercial paper at end of period (at par value) | $ | 419,000 | | | $ | 319,000 | |
| Annualized interest rate | 5.22 | % | | 5.71 | % |
| Letters of credit outstanding | $ | 115,000 | | | $ | 115,000 | |
| Remaining amount available under credit line | 466,000 | | | 316,000 | |
Credit Facility—Commercial Paper Activity
(Dollar amounts in thousands)
| | | | | | | | | | | | | | | | | |
| Year Ended December 31, |
| 2024 | | 2023 | | 2022 |
| | | | | |
| | | | | |
| Average balance of commercial paper outstanding during period (par value) | $ | 405,573 | | | $ | 290,024 | | | $ | 322,531 | |
| Daily-weighted average interest rate (annualized) | 5.65 | % | | 5.40 | % | | 1.89 | % |
| Maximum daily amount outstanding during period (par value) | $ | 633,425 | | | $ | 477,700 | | | $ | 500,529 | |
| Commercial paper issued during period (par value) | 2,052,056 | | | 2,029,000 | | | 2,269,444 | |
| Commercial paper matured during period (par value) | (1,952,056) | | | (1,995,000) | | | (2,314,477) | |
| Net commercial paper issued (matured) during period (par value) | 100,000 | | | 34,000 | | | (45,033) | |
The Company increased the commercial paper borrowings by $100 million from the prior year. The Company was able to issue commercial paper as needed under this facility during the year ended December 31, 2024 and 2023.
Federal Home Loan Bank: FHLB membership provides certain of our insurance subsidiaries with access to various low-cost collateralized borrowings and funding agreements. The membership requires ownership of FHLB common stock, as well as the purchase of activity-based common stock equal to approximately 4.1% of outstanding borrowings.
Globe Life Inc.
Notes to Consolidated Financial Statements
(Dollar amounts in thousands, except per share data)
Globe Life owned $34.5 million in FHLB common stock as of December 31, 2024 and $22.3 million as of December 31, 2023. The FHLB stock is restricted for the duration of the membership and recorded at cost (par) as required by applicable guidance. The FHLB stock is included in "Other long-term investments" in the Consolidated Balance Sheets. Borrowings with the FHLB are subject to the availability of pledged assets at the insurance subsidiaries of Globe Life. As of December 31, 2024, Globe Life's insurance subsidiaries maximum borrowing capacity under the FHLB facility was approximately $730 million, net of outstanding funding agreements and short-term borrowings, on pledged assets with a fair value of $1.3 billion. As of December 31, 2024, $372 million in funding agreements were outstanding with the FHLB, compared to $138 million as of December 31, 2023. This amount is included in "Other policyholders' funds" in the Consolidated Balance Sheets. The Company had no short-term borrowings from the FHLB as of December 31, 2024 and 2023.
Note 13—Shareholders' Equity
Share Data: A summary of common share activity is presented in the following chart.
| | | | | | | | | | | | | | | |
| | | Common Stock |
| | | | | Issued | | Treasury
Stock |
| 2022: | | | | | | | |
| Balance at January 1, 2022 | | | | | 109,218,183 | | | (9,650,845) | |
| Grants of restricted stock | | | | | — | | | 10,746 | |
| | | | | | | |
| Vesting of performance shares | | | | | — | | | 66,751 | |
| Issuance of common stock due to exercise of stock options | | | | | — | | | 1,519,728 | |
| Treasury stock acquired | | | | | — | | | (4,424,668) | |
| Retirement of treasury stock | | | | | (4,000,000) | | | 4,000,000 | |
Balance at December 31, 2022 | | | | | 105,218,183 | | | (8,478,288) | |
| 2023: | | | | | | | |
| Grants of restricted stock | | | | | — | | | 7,110 | |
| | | | | | | |
| Vesting of performance shares | | | | | — | | | 84,298 | |
| Issuance of common stock due to exercise of stock options | | | | | — | | | 1,375,313 | |
| Treasury stock acquired | | | | | — | | | (4,415,287) | |
| Retirement of treasury stock | | | | | (3,000,000) | | | 3,000,000 | |
Balance at December 31, 2023 | | | | | 102,218,183 | | | (8,426,854) | |
| 2024: | | | | | | | |
| Grants of restricted stock | | | | | — | | | 7,375 | |
| | | | | | | |
| Vesting of performance shares | | | | | — | | | 143,211 | |
| Issuance of common stock due to exercise of stock options | | | | | — | | | 584,993 | |
| Treasury stock acquired | | | | | — | | | (10,549,341) | |
| Retirement of treasury stock | | | | | (5,000,000) | | | 5,000,000 | |
Balance at December 31, 2024 | | | | | 97,218,183 | | | (13,240,616) | |
There was no activity related to the preferred stock in years 2022 through 2024.
Globe Life Inc.
Notes to Consolidated Financial Statements
(Dollar amounts in thousands, except per share data)
Acquisition of Common Shares: Globe Life shares are acquired through open market purchases under the Globe Life stock repurchase program when it is determined to be the best use of Globe Life's excess cash flows. This yields a return that is better than available alternatives and exceeds our cost of equity. When stock options are exercised, proceeds from the exercises are generally used to repurchase approximately the number of shares available with those funds in order to reduce dilution. See the following summary below:
| | | | | | | | | | | | | | | | | | | | | | | | | | | | | | | | | | | |
| Globe Life Share Repurchase Program | | Share Repurchase for Dilution Purposes |
| Shares Acquired
(in thousands) | | Total Cost | | Average Price | | Shares Acquired
(in thousands) | | Total Cost | | Average Price |
2024 | 10,086 | | | $ | 945,637 | | | $ | 93.76 | | | 501 | | | $ | 48,026 | | | $ | 95.75 | |
2023 | 3,369 | | | 380,103 | | | 112.84 | | | 1,080 | | | 127,155 | | | 117.72 | |
2022 | 3,322 | | | 335,145 | | | 100.90 | | | 1,103 | | | 119,493 | | | 108.33 | |
Restrictions: Restrictions exist on the flow of funds to Globe Life Inc. from its insurance subsidiaries. Statutory regulations require life insurance subsidiaries to maintain certain minimum amounts of capital and surplus. Dividends from insurance subsidiaries of Globe Life Inc. are restricted based on regulations by their states of domicile. Additionally, insurance company distributions are generally not permitted in excess of statutory surplus. Subsidiaries are also subject to certain minimum capital requirements. Subsidiaries of Globe Life paid cash dividends to the Parent Company in the amount of $693 million in 2024, $460 million in 2023, and $407 million in 2022. As of December 31, 2024, dividends from our U.S. insurance subsidiaries to the Parent Company available to be paid in 2025 are limited to the amount of $664 million without regulatory approval, such that $1.03 billion was considered restricted net assets of the subsidiaries. Dividends exceeding these limitations may be available during the year pending regulatory approval. While there are no legal restrictions on the payment of dividends to shareholders from Globe Life's retained earnings, retained earnings as of December 31, 2024 were restricted by lenders’ covenants which require the Company to maintain and not distribute $5.5 billion from its total consolidated retained earnings of $8.0 billion.
Earnings per Share: A reconciliation of basic and diluted weighted-average shares outstanding used in the computation of basic and diluted earnings per share is as follows:
| | | | | | | | | | | | | | | | | |
| Year Ended December 31, |
| 2024 | | 2023 | | 2022 |
| Basic weighted average shares outstanding | 89,278,574 | | | 95,098,474 | | | 97,927,770 | |
| Weighted average dilutive options outstanding | 382,848 | | | 1,265,367 | | | 1,056,874 | |
| Diluted weighted average shares outstanding | 89,661,422 | | | 96,363,841 | | | 98,984,644 | |
| | | | | |
| Antidilutive shares | 2,140,787 | | | 422,739 | | | 31,269 | |
Antidilutive shares are excluded from the calculation of diluted earnings per share. All antidilutive shares noted above result from outstanding out of the money employee and Director stock options.
Globe Life Inc.
Notes to Consolidated Financial Statements
(Dollar amounts in thousands, except per share data)
Note 14—Stock-Based Compensation
Globe Life's stock-based compensation consists of stock options, restricted stock, restricted stock units, and performance shares. Certain employees and members of the board of directors (directors) have been granted fixed equity options to buy shares of Globe Life stock at the market value of the stock on the date of grant, under the provisions of the Globe Life stock option plans. The options are exercisable during the period commencing from the date they vest until expiring according to the terms of the grant. Options generally expire the earlier of employee termination or option contract term, which are either seven-year or ten-year terms. However, depending on the circumstances of termination, options may be exercised for a period of time following termination of employment or upon death or disability. Options generally vest in accordance with the following schedule:
| | | | | | | | | | | | | | | | | | | | | | | | | | | | | | | | | | | | | | | | | |
| | | Shares vested by period |
| Contract Period | | 6 Months | | Year 1 | | Year 2 | | Year 3 | | Year 4 | | Year 5 |
Directors | 7 years | | 100% | | —% | | —% | | —% | | —% | | —% |
Employees | 7 years | | —% | | —% | | 50% | | 50% | | —% | | —% |
| | | | | | | | | | | | | |
All employee options vest immediately upon retirement on or after the attainment of age 65, upon death, or disability. Globe Life generally issues shares for the exercise of stock options from treasury stock. The Company generally uses the proceeds from option exercises to buy shares of Globe Life common stock in the open market to reduce the dilution from option exercises.
A summary of stock compensation activity for each of the three years ended December 31, 2024 is presented below:
| | | | | | | | | | | | | | | | | |
| 2024 | | 2023 | | 2022 |
Stock-based compensation expense recognized(1) | $ | 40,118 | | | $ | 30,736 | | | $ | 35,650 | |
| Tax benefit recognized | 7,085 | | | 11,178 | | | 12,738 | |
(1)No stock-based compensation expense was capitalized in any period in accordance with applicable GAAP.
Additional stock compensation information is as follows at December 31:
| | | | | | | | | | | |
| 2024 | | 2023 |
Unrecognized compensation(1) | $ | 46,956 | | | $ | 36,599 | |
Weighted average period of expected recognition (in years)(1) | 0.53 | | 0.53 |
(1)Includes stock options, restricted stock units and performance shares.
No equity awards were cash settled during the three years ended December 31, 2024.
Options: The following table summarizes information about stock options outstanding at December 31, 2024.
| | | | | | | | | | | | | | | | | | | | | | | | | | | | | | | | |
| | | Options Outstanding | | Options Exercisable |
Range of
Exercise Prices | | Number
Outstanding | | Weighted-
Average
Remaining
Contractual
Life (Years) | | Weighted-
Average
Exercise
Price | | Number
Exercisable | | Weighted-
Average
Exercise
Price |
| | | | | | | | | | |
| | | | | | | | | | |
| $50.64 - $87.60 | | 1,609,506 | | | 1.48 | | $ | 81.93 | | | 1,609,506 | | | $ | 81.93 | |
| 92.40 - 100.74 | | 1,994,603 | | | 2.66 | | 99.47 | | | 1,994,603 | | | 99.47 | |
| 103.23 | | 1,187,349 | | | 4.15 | | 103.23 | | | 734,148 | | | 103.23 | |
| 105.56 - 128.40 | | 1,034,499 | | | 5.56 | | 123.96 | | | 38,179 | | | 108.55 | |
| $50.64 - $128.40 | | 5,825,957 | | | 3.15 | | $ | 99.74 | | | 4,376,436 | | | $ | 93.73 | |
Globe Life Inc.
Notes to Consolidated Financial Statements
(Dollar amounts in thousands, except per share data)
An analysis of option activity for each of the three years ended December 31, 2024, is as follows:
| | | | | | | | | | | | | | | | | | | | | | | | | | | | | | | | | | | |
| 2024 | | 2023 | | 2022 |
| Options | | Weighted-Average
Exercise Price | | Options | | Weighted-Average
Exercise Price | | Options | | Weighted-Average
Exercise Price |
Outstanding—beginning of year | 5,940,320 | | | $ | 96.19 | | | 6,962,374 | | | $ | 91.73 | | | 7,197,662 | | | $ | 85.11 | |
| Granted: | | | | | | | | | | | |
| 7-year term | 520,810 | | | 128.32 | | | 497,060 | | | 120.49 | | | 1,300,211 | | | 103.20 | |
| | | | | | | | | | | |
| Exercised | (584,993) | | | 88.52 | | | (1,375,313) | | | 82.95 | | | (1,519,728) | | | 70.14 | |
| Expired and forfeited | (50,180) | | | 106.62 | | | (143,801) | | | 90.92 | | | (15,771) | | | 96.54 | |
Outstanding—end of year | 5,825,957 | | | $ | 99.74 | | | 5,940,320 | | | $ | 96.19 | | | 6,962,374 | | | $ | 91.73 | |
| | | | | | | | | | | |
Exercisable at end of year | 4,376,436 | | | $ | 93.73 | | | 4,003,028 | | | $ | 91.23 | | | 3,666,871 | | | $ | 84.00 | |
Additional information about Globe Life's stock option activity as of December 31, 2024 and 2023 is as follows:
| | | | | | | | | | | |
| 2024 | | 2023 |
| Outstanding options: | | | |
| Weighted-average remaining contractual term (in years) | 3.15 | | 3.68 |
| Aggregate intrinsic value | $ | 81,703 | | | $ | 151,685 | |
| Exercisable options: | | | |
| Weighted-average remaining contractual term (in years) | 2.48 | | 3.01 |
| Aggregate intrinsic value | $ | 77,946 | | | $ | 122,052 | |
Selected stock option activity for the three years ended December 31, 2024, is presented below:
| | | | | | | | | | | | | | | | | |
| 2024 | | 2023 | | 2022 |
Weighted-average grant-date fair value of options granted
(per share) | $ | 33.80 | | | $ | 32.25 | | | $ | 22.03 | |
| Intrinsic value of options exercised | 17,127 | | | 49,163 | | | 58,201 | |
| Cash received from options exercised | 51,786 | | | 114,080 | | | 106,592 | |
| Actual tax benefit received | 2,489 | | | 9,379 | | | 11,907 | |
Additional information concerning Globe Life's unvested options is as follows at December 31:
| | | | | | | | | | | |
| 2024 | | 2023 |
| Number of shares outstanding | 1,449,521 | | | 1,937,292 | |
| Weighted-average exercise price (per share) | $ | 117.88 | | | $ | 106.42 | |
| Weighted-average remaining contractual term (in years) | 5.19 | | 5.05 |
| Aggregate intrinsic value | $ | 3,757 | | | $ | 29,634 | |
Globe Life expects that substantially all unvested options will vest.
Restricted Stock: Restricted stock grants consist of time-vested grants, restricted stock units, and performance shares. Time-vested restricted stock is available to directors and vests over six months. The directors' restricted stock units vest over six months and are converted to shares upon their retirement from the Board. Employees' restricted stock units vest and become non-forfeitable on the vesting date (generally three years from the grant date) or upon meeting certain retirement criteria, or in the event of death or disability. Director restricted stock and restricted stock units are generally granted on the first business day of the calendar year. Performance shares are
Globe Life Inc.
Notes to Consolidated Financial Statements
(Dollar amounts in thousands, except per share data)
granted to a limited number of senior executives. Performance shares have a three-year performance period and are not settled in shares until the certification of the three-year performance period. While the grant specifies a stated target number of shares, the determination of the actual settlement in shares will be based on the achievement of certain performance objectives of Globe Life over the three-year performance period. Certain executive restricted stock and performance share grants contain terms related to age that could accelerate vesting.
Following are the restricted stock units outstanding for each of the three years ended December 31, 2024:
| | | | | | | | |
| Year of grants | | Outstanding as of year end |
| 2022 | | 93,381 | |
| 2023 | | 163,108 | |
| 2024 | | 219,864 | |
Below is the final determination of the performance share grants in 2020 to 2022:
| | | | | | | | | | | | | | |
| Year of grants | | Final settlement of shares | | Final settlement date |
| 2020 | | 84,298 | | | February 22, 2023 |
| 2021 | | 143,211 | | | February 28, 2024 |
| 2022 | | 152,680 | | | February 26, 2025 |
For the 2023 and 2024 performance share grants, actual shares that could be distributed range from 0 to 122 thousand for the 2023 grants and 0 to 145 thousand shares for the 2024 grants.
A summary of restricted stock grants for each of the years in the three-year period ended December 31, 2024, is presented in the table below:
| | | | | | | | | | | | | | | | | |
| 2024 | | 2023 | | 2022 |
| Directors restricted stock: | | | | | |
| Shares | 7,375 | | | 7,110 | | | 10,746 | |
| Price per share | $ | 122.06 | | | $ | 119.59 | | | $ | 94.94 | |
| Aggregate value | $ | 900 | | | $ | 850 | | | $ | 1,020 | |
| Percent vested | 100 | % | | 100 | % | | 100 | % |
| Directors restricted stock units (including dividend equivalents): | | | | | |
| Shares | 4,854 | | | 9,479 | | | 8,956 | |
| Price per share | $ | 120.16 | | | $ | 117.73 | | | $ | 95.62 | |
| Aggregate value | $ | 583 | | | $ | 1,116 | | | $ | 856 | |
| Percent vested | 100 | % | | 100 | % | | 100 | % |
| Employees restricted stock units: | | | | | |
| Shares | 101,011 | | | 96,975 | | | — | |
| Price per share | $ | 127.29 | | | $ | 120.18 | | | $ | — | |
| Aggregate value | $ | 12,858 | | | $ | 11,654 | | | $ | — | |
| Percent vested | — | % | | — | % | | — | % |
| Performance shares: | | | | | |
| Target shares | 96,800 | | | 81,300 | | | 146,500 | |
| Target price per share | $ | 128.40 | | | $ | 120.49 | | | $ | 103.23 | |
| Aggregate value | $ | 12,429 | | | $ | 9,796 | | | $ | 15,123 | |
| Percent vested | — | % | | — | % | | — | % |
Globe Life Inc.
Notes to Consolidated Financial Statements
(Dollar amounts in thousands, except per share data)
Time-vested restricted stockholders are entitled to dividend payments on the unvested stock. Director restricted stock unit holders are entitled to dividend equivalents. These equivalents are granted in the form of additional restricted stock units and vest immediately upon grant. Dividend equivalents are applicable only to directors' restricted stock units. Performance shares held by employees are not entitled to dividend equivalents and are not entitled to dividend payments until the shares are vested and settled.
An analysis of nonvested restricted stock is as follows:
| | | | | | | | | | | | | | | | | | | | | | | | | | | | | | | |
| | | Executive
Performance
Shares | | Directors
Restricted
Stock | | Directors
Restricted
Stock
Units | | Employees Restricted Stock Units | | Total |
| 2022: | | | | | | | | | | | |
| Balance at December 31, 2021 | | | 342,388 | | | 289 | | | 289 | | | — | | | 342,966 | |
| Grants | | | 146,500 | | | 10,746 | | | 8,956 | | | — | | | 166,202 | |
Additional performance shares(1) | | | (16,102) | | | — | | | — | | | — | | | (16,102) | |
| Restriction lapses | | | (66,751) | | | (11,035) | | | (9,245) | | | — | | | (87,031) | |
| Forfeitures | | | (7,500) | | | — | | | — | | | — | | | (7,500) | |
| Balance at December 31, 2022 | | | 398,535 | | | — | | | — | | | — | | | 398,535 | |
| 2023: | | | | | | | | | | | |
| Grants | | | 81,300 | | | 7,110 | | | 9,479 | | | 96,975 | | | 194,864 | |
Additional performance shares(1) | | | (28,857) | | | — | | | — | | | — | | | (28,857) | |
| Restriction lapses | | | (84,298) | | | (7,110) | | | (9,479) | | | — | | | (100,887) | |
| Forfeitures | | | (12,600) | | | — | | | — | | | (4,410) | | | (17,010) | |
| Balance at December 31, 2023 | | | 354,080 | | | — | | | — | | | 92,565 | | | 446,645 | |
| 2024: | | | | | | | | | | | |
| Grants | | | 96,800 | | | 7,375 | | | 4,854 | | | 101,011 | | | 210,040 | |
Additional performance shares(1) | | | 84,712 | | | — | | | — | | | — | | | 84,712 | |
| Restriction lapses | | | (143,211) | | | (7,375) | | | (4,854) | | | (437) | | | (155,877) | |
| Forfeitures | | | (6,000) | | | — | | | — | | | (10,008) | | | (16,008) | |
| Balance at December 31, 2024 | | | 386,381 | | | — | | | — | | | 183,131 | | | 569,512 | |
(1)Estimated additional (reduced) share grants expected due to achievement of performance criteria.
An analysis of the weighted-average grant-date fair values per share of nonvested restricted stock is as follows for the year 2024:
| | | | | | | | | | | | | | | | | | | | | | | | | |
| | | Executive Performance Shares | | Directors Restricted Stock | | Directors Restricted Stock Units | | Employees Restricted Stock Units |
Grant-date fair value per share at January 1, 2024 | | | $ | 105.28 | | | $ | — | | | $ | — | | | $ | 120.16 | |
| Grants | | | 128.40 | | | 122.06 | | | 122.06 | | | 127.29 | |
| Estimated additional performance shares | | | 107.56 | | | — | | | — | | | — | |
| Restriction lapses | | | (98.32) | | | (122.06) | | | (122.06) | | | (94.40) | |
| Forfeitures | | | — | | — | | | — | | | (122.74) | |
Grant-date fair value per share at December 31, 2024 | | | 115.78 | | | — | | | — | | | 124.02 | |
Globe Life Inc.
Notes to Consolidated Financial Statements
(Dollar amounts in thousands, except per share data)
Note 15—Business Segments
Globe Life is organized into three operating segments: life, health, and investments.
Globe Life's reportable insurance segments are based on the insurance product lines it markets and administers: life insurance and supplemental health insurance. There is also an investment segment that manages the investment portfolio and cash flow for the insurance segments. The Company's chief operating decision makers ("CODM"), our Co-CEOs, evaluate the overall performance of the operations of the Company in accordance with these segments.
During the fourth quarter of 2024 we entered into a coinsurance agreement to cede a majority of the annuity business to a third-party insurer. This impacted a significant portion of our annuities which had previously been classified as one of our reportable segments. The annuity segment has historically represented less than 1% of revenue and has not been core to the Company's business. We have adjusted our segments from four down to three as described above. All presentations of segment information have been recast for the periods presented to reflect this change in segments.
Life insurance products marketed by Globe Life include traditional whole life and term life insurance. Health insurance products are generally guaranteed renewable and include Medicare Supplement, cancer, critical illness, accident, and other limited-benefit supplemental hospital and surgical products.
The following tables present segment premium revenue by each of Globe Life's distribution channels.
Premium Income by Distribution Channel | | | | | | | | | | | | | | | | | | | | | | | | | | | | | | | | | | | | | | |
| | For the Year 2024 |
| | | Life | | Health | | Total |
| Distribution Channel | | Amount | | % of
Total | | Amount | | % of
Total | | Amount | | % of
Total |
| American Income | | $ | 1,698,209 | | | 52 | | | $ | 123,123 | | | 9 | | | $ | 1,821,332 | | | 39 | |
| Direct to Consumer | | 988,522 | | | 30 | | | 71,993 | | | 5 | | | 1,060,515 | | | 23 | |
| Liberty National | | 371,061 | | | 12 | | | 190,381 | | | 14 | | | 561,442 | | | 12 | |
| United American | | 6,600 | | | — | | | 591,774 | | | 42 | | | 598,374 | | | 13 | |
| Family Heritage | | 6,661 | | | — | | | 427,654 | | | 30 | | | 434,315 | | | 9 | |
| Other | | 190,294 | | | 6 | | | — | | | — | | | 190,294 | | | 4 | |
| Total premium | | $ | 3,261,347 | | | 100 | | | $ | 1,404,925 | | | 100 | | | $ | 4,666,272 | | | 100 | |
| | | | | | | | | | | | | | | | | | | | | | | | | | | | | | | | | | | | | | |
| | | For the Year 2023 |
| | | Life | | Health | | Total |
| Distribution Channel | | Amount | | % of Total | | Amount | | % of Total | | Amount | | % of Total |
| American Income | | $ | 1,588,702 | | | 51 | | | $ | 120,332 | | | 9 | | | $ | 1,709,034 | | | 38 | |
| Direct to Consumer | | 991,406 | | | 32 | | | 68,575 | | | 5 | | | 1,059,981 | | | 24 | |
| Liberty National | | 349,736 | | | 11 | | | 187,934 | | | 14 | | | 537,670 | | | 12 | |
| United American | | 7,311 | | | — | | | 545,723 | | | 42 | | | 553,034 | | | 13 | |
| Family Heritage | | 6,134 | | | — | | | 396,209 | | | 30 | | | 402,343 | | | 9 | |
| Other | | 193,955 | | | 6 | | | — | | | — | | | 193,955 | | | 4 | |
| Total premium | | $ | 3,137,244 | | | 100 | | | $ | 1,318,773 | | | 100 | | | $ | 4,456,017 | | | 100 | |
Globe Life Inc.
Notes to Consolidated Financial Statements
(Dollar amounts in thousands, except per share data)
| | | | | | | | | | | | | | | | | | | | | | | | | | | | | | | | | | | | | | |
| | | For the Year 2022 |
| | | Life | | Health | | Total |
| Distribution Channel | | Amount | | % of Total | | Amount | | % of Total | | Amount | | % of
Total |
| American Income | | $ | 1,505,034 | | | 50 | | | $ | 117,353 | | | 9 | | | $ | 1,622,387 | | | 38 | |
| Direct to Consumer | | 985,488 | | | 33 | | | 71,129 | | | 5 | | | 1,056,617 | | | 24 | |
| Liberty National | | 327,469 | | | 11 | | | 187,241 | | | 15 | | | 514,710 | | | 12 | |
| United American | | 7,966 | | | — | | | 539,874 | | | 42 | | | 547,840 | | | 13 | |
| Family Heritage | | 5,586 | | | — | | | 366,820 | | | 29 | | | 372,406 | | | 9 | |
| Other | | 196,281 | | | 6 | | | — | | | — | | | 196,281 | | | 4 | |
| | $ | 3,027,824 | | | 100 | | | $ | 1,282,417 | | | 100 | | | 4,310,241 | | | 100 | |
| Annuity | | 1 | | | — | |
Total premium | | $ | 4,310,242 | | | 100 | |
Due to the nature of the life and health insurance industry, Globe Life has no individual or group which would be considered a major customer. Substantially all of Globe Life's business is conducted in the United States.
The measure of profitability established by the chief operating decision makers for the insurance segments is underwriting margin in accordance with the manner in which the segments are managed. It essentially represents gross profit margin on insurance products before insurance administrative expenses and consists primarily of premium less net policy benefits, acquisition expenses, and commissions. The CODMs use the Life and Health segment profit or loss in monitoring the insurance specific business and to analyze performance measures that inform decisions around product pricing and appropriate support services such as agency force and training. Required interest on policy liabilities is reflected as a component of the Investment segment (rather than as a component of underwriting margin in the insurance segment) in order to match this cost with the investment income earned on the assets supporting the policy liabilities.
The measure of profitability for the Investment segment is excess investment income, representing the income earned on the investment portfolio in excess of policy requirements. Excess investment income is used to analyze the performance of our investments in relation to our policy required obligations and informs and supports management actions regarding investment related decisions and policy benefits within our product features. Other than the required interest on the insurance segments, no other intersegment revenues or expenses are recognized.
Globe Life holds a sizable investment portfolio to support its insurance liabilities, the yield from which is used to offset policy benefit, acquisition, administrative, and tax expenses. This yield or investment income is taken into account when establishing premium rates and profitability expectations for its insurance products. From time to time, investments are sold or called, or experience a credit loss event, each of which are reflected by the Company as realized gain (loss)—investments. These gains or losses generally occur as a result of disposition due to issuer calls, compliance with Company investment policies, or other reasons often beyond management’s control. Unlike investment income, realized gains and losses are incidental to insurance operations, and only overall yields are considered when setting premium rates or insurance product profitability expectations. While these gains and losses are not relevant to segment profitability or core operating results, they can have a material positive or negative result on net income. For these reasons, management removes realized investment gains and losses when it views its segment operations.
Management also removes non-operating items unrelated to the Company's core insurance activities when evaluating those results. All other unallocated revenues and expenses, including expenses directly attributable to corporate operations, insurance administrative expense and interest on debt, are disclosed after segment profit or loss within the reconciliation to Income before taxes. Stock-based compensation expense is considered a corporate expense by Globe Life management. Therefore, these items are excluded in its presentation of segment results because accounting guidance requires that operating segment results be presented as management views its
Globe Life Inc.
Notes to Consolidated Financial Statements
(Dollar amounts in thousands, except per share data)
The following tables set forth a reconciliation of Globe Life's revenues and operations by segment to its major income statement line items. See Note 1—Significant Accounting Policies for additional information concerning reconciling items of segment profits to pretax income.
| | | | | | | | | | | | | | | | | | | | | | | |
| Year Ended December 31, 2024 |
| Life | | Health | | Investment | | Consolidated |
| Revenue: | | | | | | | |
| Premium | $ | 3,261,347 | | | $ | 1,404,925 | | | $ | — | | | $ | 4,666,272 | |
| Net investment income | — | | | — | | | 1,135,631 | | | 1,135,631 | |
| Segment revenue | 3,261,347 | | | 1,404,925 | | | 1,135,631 | | | 5,801,903 | |
| Other income | | 354 | |
| Realized gains (losses) | | (24,188) | |
| Total consolidated revenue | | $ | 5,778,069 | |
| | | | | | | |
| Expenses: | | | | | | | |
Policy obligations(1) | 2,000,977 | | | 851,577 | | | 20,969 | | | $ | 2,873,523 | |
| Required interest on reserves | (811,147) | | | (110,342) | | | 950,258 | | | 28,769 | |
| Amortization of acquisition costs | 356,223 | | | 52,224 | | | — | | | 408,447 | |
| Commissions | 159,703 | | | 158,869 | | | — | | | 318,572 | |
| Premium taxes | 68,360 | | | 28,421 | | | — | | | 96,781 | |
| Non-deferred acquisition costs | 134,634 | | | 51,753 | | | — | | | 186,387 | |
| | | | | | | |
| Segment profit or (loss) | $ | 1,352,597 | | | $ | 372,423 | | | $ | 164,404 | | | 1,889,424 | |
| | | | | | | |
| Insurance administrative expenses: | | | | | | | |
| Salaries | | 129,369 | |
| Other employee costs | | 36,176 | |
| Information technology costs | | 80,555 | |
| Legal costs | | 30,478 | |
| Other administrative costs | | 65,852 | |
| Parent expense | | 12,400 | |
| Stock-based compensation expense | | 40,118 | |
| Interest expense | | 127,092 | |
| Legal proceedings | | 21,575 | |
| Non-operating expenses | | 2,620 | |
| Annuity | | (7,282) | |
| Total expenses | | 4,451,432 | |
| | . |
| | $ | 1,326,637 | |
(1)Policy obligations are based upon policyholder behavior and impacts related to lapses, mortality, and morbidity. For detailed information, including remeasurement gains and losses, see Note 6—Policy Liabilities.
Globe Life Inc.
Notes to Consolidated Financial Statements
(Dollar amounts in thousands, except per share data)
| | | | | | | | | | | | | | | | | | | | | | | |
| Year Ended December 31, 2023 |
| Life | | Health | | Investment | | Consolidated |
| Revenue: | | | | | | | |
| Premium | $ | 3,137,244 | | | $ | 1,318,773 | | | $ | — | | | $ | 4,456,017 | |
| Net investment income | — | | | — | | | 1,056,884 | | | 1,056,884 | |
| Segment revenue | 3,137,244 | | | 1,318,773 | | | 1,056,884 | | | 5,512,901 | |
| Other income | | 308 | |
| Realized gains (losses) | | (65,676) | |
| Total consolidated revenue | | $ | 5,447,533 | |
| | | | | | | |
| Expenses: | | | | | | | |
Policy obligations(1) | 2,050,789 | | | 776,362 | | | 9,061 | | | $ | 2,836,212 | |
| Required interest on reserves | (772,701) | | | (106,516) | | | 917,441 | | | 38,224 | |
| Amortization of acquisition costs | 327,426 | | | 50,598 | | | — | | | 378,024 | |
| Commissions | 145,678 | | | 150,192 | | | — | | | 295,870 | |
| Premium taxes | 64,571 | | | 26,440 | | | — | | | 91,011 | |
| Non-deferred acquisition costs | 128,509 | | | 43,760 | | | — | | | 172,269 | |
| | | | | | | |
| Segment profit or (loss) | $ | 1,192,972 | | | $ | 377,937 | | | $ | 130,382 | | | 1,701,291 | |
| | | | | | | |
| Insurance administrative expenses: | | | | | | | |
| Salaries | | 119,699 | |
| Other employee costs | | 35,905 | |
| Information technology costs | | 64,998 | |
| Legal costs | | 15,335 | |
| Other administrative costs | | 65,224 | |
| Parent expense | | 10,866 | |
| Stock-based compensation expense | | 30,736 | |
| Interest expense | | 102,316 | |
| Legal proceedings | | 900 | |
| Non-operating expenses | | 4,170 | |
| Annuity | | (8,492) | |
| Total expenses | | 4,253,267 | |
| | |
| | $ | 1,194,266 | |
(1)Policy obligations are based upon policyholder behavior and impacts related to lapses, mortality, and morbidity. For detailed information, including remeasurement gains and losses, see Note 6—Policy Liabilities.
Globe Life Inc.
Notes to Consolidated Financial Statements
(Dollar amounts in thousands, except per share data)
| | | | | | | | | | | | | | | | | | | | | | | |
| Year Ended December 31, 2022 |
| Life | | Health | | Investment | | Consolidated |
| Revenue: | | | | | | | |
| Premium | $ | 3,027,824 | | | $ | 1,282,417 | | | $ | — | | | $ | 4,310,241 | |
| Net investment income | — | | | — | | | 991,800 | | | 991,800 | |
| Segment revenue | 3,027,824 | | | 1,282,417 | | | 991,800 | | | 5,302,041 | |
| Annuity premium income | | 1 | |
| Other income | | 1,246 | |
| Realized gains (losses) | | (76,548) | |
| Total consolidated revenue | | $ | 5,226,740 | |
| | | | | | | |
| Expenses: | | | | | | | |
Policy obligations(1) | 2,035,693 | | | 752,866 | | | 4,372 | | | $ | 2,792,931 | |
| Required interest on reserves | (735,688) | | | (102,315) | | | 882,839 | | | 44,836 | |
| Amortization of acquisition costs | 298,841 | | | 48,185 | | | — | | | 347,026 | |
| Commissions | 140,283 | | | 145,185 | | | — | | | 285,468 | |
| Premium taxes | 61,609 | | | 24,653 | | | — | | | 86,262 | |
| Non-deferred acquisition costs | 97,561 | | | 36,706 | | | — | | | 134,267 | |
| | | | | | | |
| Segment profit or (loss) | $ | 1,129,525 | | | $ | 377,137 | | | $ | 104,589 | | | 1,611,251 | |
| | | | | | | |
| Insurance administrative expenses: | | | | | | | |
| Salaries | | 129,711 | |
| Other employee costs | | 42,319 | |
| Information technology costs | | 55,526 | |
| Legal costs | | 12,056 | |
| Other administrative costs | | 59,729 | |
| Parent expense | | 11,156 | |
| Stock-based compensation expense | | 35,650 | |
| Interest expense | | 90,395 | |
| Legal proceedings | | 2,496 | |
| Non-operating expenses | | 5,311 | |
| Annuity | | (10,510) | |
| Total expenses | | 4,124,629 | |
| | |
| | $ | 1,102,111 | |
(1)Policy obligations are based upon policyholder behavior and impacts related to lapses, mortality, and morbidity. For detailed information, including remeasurement gains and losses, see Note 6—Policy Liabilities.
Globe Life Inc.
Notes to Consolidated Financial Statements
(Dollar amounts in thousands, except per share data)
Assets for each segment are reported based on a specific identification basis. The insurance segments’ assets contain DAC. The investment segment includes the investment portfolio, cash, and accrued investment income. Goodwill is assigned to the insurance segments at the time of purchase. All other assets are included in the annuity and other corporate category. The tables below reconcile segment assets to total assets as reported on the Consolidated Balance Sheets.
Assets by Segment
| | | | | | | | | | | | | | | | | | | | | | | | | | | |
| | At December 31, 2024 |
| | Life | | Health | | | | Investment | | | | Consolidated |
| Cash and invested assets | $ | — | | | $ | — | | | | | $ | 19,736,888 | | | | | $ | 19,736,888 | |
| Accrued investment income | — | | | — | | | | | 269,791 | | | | | 269,791 | |
| Deferred acquisition costs | 5,700,755 | | | 793,421 | | | | | — | | | | | 6,494,176 | |
| Goodwill | 309,609 | | | 180,837 | | | | | — | | | | | 490,446 | |
| | | | | | | | | | | |
| Total segment assets | $ | 6,010,364 | | | $ | 974,258 | | | | | $ | 20,006,679 | | | | | 26,991,301 | |
| | | | | | | | | | | |
| Annuity and other corporate | | | | 2,084,880 | |
Total assets | | | | $ | 29,076,181 | |
| | | | | | | | | | | | | | | | | | | | | | | | | | | |
| | At December 31, 2023 |
| | Life | | Health | | | | Investment | | | | Consolidated |
| Cash and invested assets | $ | — | | | $ | — | | | | | $ | 19,827,199 | | | | | $ | 19,827,199 | |
| Accrued investment income | — | | | — | | | | | 270,396 | | | | | 270,396 | |
| Deferred acquisition costs | 5,271,775 | | | 734,735 | | | | | — | | | | | 6,006,510 | |
| Goodwill | 309,609 | | | 172,182 | | | | | — | | | | | 481,791 | |
| | | | | | | | | | | |
| Total segment assets | $ | 5,581,384 | | | $ | 906,917 | | | | | $ | 20,097,595 | | | | | 26,585,896 | |
| | | | | | | | | | | |
| Annuity and other corporate | | | | 1,465,603 | |
Total assets | | | | $ | 28,051,499 | |
Globe Life Inc.
Notes to Consolidated Financial Statements
(Dollar amounts in thousands, except per share data)
Liabilities for each segment are reported also on a specific identification basis similar to the assets. The insurance segments' liabilities contain future policy benefits, unearned and advance premiums, and policy claims and other benefits payable. Other policyholders' funds and annuities are included in annuity and other corporate as well as current and deferred income taxes payable. Debt represents both short and long-term. The tables below reconcile segment liabilities to total liabilities as reported on the Consolidated Balance Sheets.
Liabilities by Segment | | | | | | | | | | | | | | | | | | | | | | | | | |
| | At December 31, 2024 |
| | Life | | Health | | | | Investment | | Consolidated |
| Future policy benefits | $ | 15,484,596 | | | $ | 2,316,094 | | | | | $ | — | | | $ | 17,800,690 | |
| Unearned and advance premiums | 198,127 | | | 59,504 | | | | | — | | | 257,631 | |
| Policy claims and other benefits payable | 321,838 | | | 210,994 | | | | | — | | | 532,832 | |
| Debt | — | | | — | | | | | 2,739,652 | | | 2,739,652 | |
| Other | 96,604 | | | — | | | | | 372,000 | | | 468,604 | |
Total segment liabilities | $ | 16,101,165 | | | $ | 2,586,592 | | | | | $ | 3,111,652 | | | 21,799,409 | |
| | | | | | | | | |
| Annuity and other corporate | | 1,971,252 | |
Total liabilities | | $ | 23,770,661 | |
| | | | | | | | | | | | | | | | | | | | | | | | | | | |
| At December 31, 2023 |
| Life | | Health | | | | Investment | | | | Consolidated |
| Future policy benefits | $ | 16,304,797 | | | $ | 2,382,517 | | | | | $ | — | | | | | $ | 18,687,314 | |
| Unearned and advance premiums | 196,630 | | | 57,937 | | | | | — | | | | | 254,567 | |
| Policy claims and other benefits payable | 320,066 | | | 194,809 | | | | | — | | | | | 514,875 | |
| Debt | — | | | — | | | | | 2,115,672 | | | | | 2,115,672 | |
| Other | 98,958 | | | — | | | | | 138,000 | | | | | 236,958 | |
Total segment liabilities | $ | 16,920,451 | | | $ | 2,635,263 | | | | | $ | 2,253,672 | | | | | 21,809,386 | |
| | | | | | | | | | | |
| Annuity and other corporate | | | | 1,755,310 | |
Total liabilities | | | | $ | 23,564,696 | |
Note 16—Subsequent Events
On February 3, 2025, Globe Life Inc. announced plans to relocate its corporate headquarters within McKinney, Texas, as part of the Dallas-Fort Worth market. In connection with this relocation, the Company has entered into an agreement to acquire the office building and two adjacent tracts of developable land for $80 million.
The Company has evaluated this subsequent event and determined that it does not require adjustments to the financial statements for the period ended December 31, 2024.
ITEM 9. CHANGES IN AND DISAGREEMENTS WITH ACCOUNTANTS ON ACCOUNTING AND FINANCIAL DISCLOSURES
None.
Item 9A. Controls and Procedures
Evaluation of Disclosure Controls and Procedures: Globe Life Inc., under the direction of the Co-Chairmen and Chief Executive Officers and the Executive Vice President and Chief Financial Officer, has established disclosure controls and procedures that are designed to ensure that information required to be disclosed by Globe Life in the reports that it files or submits under the Securities Exchange Act of 1934 is recorded, processed, summarized and reported within the time periods specified in the SEC’s rules and forms. The disclosure controls and procedures are also intended to ensure that such information is accumulated and communicated to Globe Life's management, including the Co-Chairmen and Chief Executive Officers and the Executive Vice President and Chief Financial Officer, as appropriate to allow timely decisions regarding required disclosures.
As of the end of the fiscal year completed December 31, 2024, an evaluation was performed under the supervision and with the participation of Globe Life management, including the Co-Chairmen and Chief Executive Officers and the Executive Vice President and Chief Financial Officer, of the disclosure controls and procedures (as those terms are defined in Rule 13a-15(e) under the Securities Exchange Act of 1934). Based upon their evaluation, the Co-Chairmen and Chief Executive Officers and the Executive Vice President and Chief Financial Officer have concluded that disclosure controls and procedures are effective as of the date of this Form 10-K. In compliance with Section 302 of the Sarbanes Oxley Act of 2002 (18 U.S.C. § 1350), each of these officers executed a Certification included as an exhibit to this Form 10-K.
Management's Annual Report on Internal Control over Financial Reporting: Management is responsible for establishing and maintaining adequate internal control over financial reporting as defined in Rule 13a-15(f) under the Securities Exchange Act of 1934. Management evaluated the design and operating effectiveness of the Company's internal control over financial reporting based on the criteria established in Internal Control—Integrated Framework (2013) issued by the Committee of Sponsoring Organizations (COSO) of the Treadway Commission. Based upon their evaluation as of December 31, 2024, the Co-Chairmen and Chief Executive Officers and the Executive Vice President and Chief Financial Officer have concluded that Globe Life's internal control over financial reporting is effective as of the date of this Form 10-K. In compliance with Section 302 of the Sarbanes-Oxley Act of 2002 (18 U.S.C. § 1350), each of these officers executed a Certification included as an exhibit to this Form 10-K.
Changes in Internal Control over Financial Reporting: During the period ended December 31, 2024, there were no changes to Globe Life Inc.'s internal control over financial reporting or in other factors that could significantly affect the internal control over financial reporting subsequent to the date of their evaluation which have materially affected, or are reasonably likely to materially affect, internal control over financial reporting.
Refer to Deloitte & Touche LLP's, independent registered public accounting firm, attestation report on the Company's internal controls over financial reporting.
MANAGEMENT'S REPORT ON INTERNAL CONTROL OVER FINANCIAL REPORTING
Management at Globe Life is responsible for establishing and maintaining adequate internal control over financial reporting for the Company and for assessing the effectiveness of internal control on an annual basis. As a framework for assessing internal control over financial reporting, the Company utilizes the criteria for effective internal control over financial reporting described in Internal Control—Integrated Framework (2013) issued by the Committee of Sponsoring Organizations of the Treadway Commission.
There are inherent limitations in the effectiveness of any internal control, including the possibility of human error and the circumvention or overriding of controls. Accordingly, even effective internal controls can provide only reasonable assurance with respect to financial statement preparation. Further, because of changes in conditions, the effectiveness of internal control may vary over time.
Management evaluated the Company’s internal control over financial reporting, and based on its assessment, determined that the Company’s internal control over financial reporting was effective as of December 31, 2024. The Company’s independent registered public accounting firm has issued an attestation report on the Company’s internal control over financial reporting as stated in their report which is included herein.
| | | | | |
| /s/ J. Matthew Darden | |
J. Matthew Darden Co-Chairman and Chief Executive Officer | |
| |
| /s/ Frank M. Svoboda | |
Frank M. Svoboda Co-Chairman and Chief Executive Officer | |
| |
| /s/ Thomas P. Kalmbach | |
Thomas P. Kalmbach
Executive Vice President and Chief Financial Officer | |
February 26, 2025
REPORT OF INDEPENDENT REGISTERED PUBLIC ACCOUNTING FIRM
To the Shareholders and the Board of Directors of Globe Life Inc.
Opinion on Internal Control over Financial Reporting
We have audited the internal control over financial reporting of Globe Life Inc. and subsidiaries (the “Company”) as of December 31, 2024, based on criteria established in Internal Control — Integrated Framework (2013) issued by the Committee of Sponsoring Organizations of the Treadway Commission (COSO). In our opinion, the Company maintained, in all material respects, effective internal control over financial reporting as of December 31, 2024, based on criteria established in Internal Control — Integrated Framework (2013) issued by COSO.
We have also audited, in accordance with the standards of the Public Company Accounting Oversight Board (United States) (PCAOB), the consolidated financial statements and financial statement schedules as of and for the year ended December 31, 2024 of the Company and our report dated February 26, 2025, expressed an unqualified opinion on those financial statements and financial statement schedules.
Basis for Opinion
The Company’s management is responsible for maintaining effective internal control over financial reporting and for its assessment of the effectiveness of internal control over financial reporting, included in the accompanying Management's Report on Internal Control over Financial Reporting. Our responsibility is to express an opinion on the Company’s internal control over financial reporting based on our audit. We are a public accounting firm registered with the PCAOB and are required to be independent with respect to the Company in accordance with the U.S. federal securities laws and the applicable rules and regulations of the Securities and Exchange Commission and the PCAOB.
We conducted our audit in accordance with the standards of the PCAOB. Those standards require that we plan and perform the audit to obtain reasonable assurance about whether effective internal control over financial reporting was maintained in all material respects. Our audit included obtaining an understanding of internal control over financial reporting, assessing the risk that a material weakness exists, testing and evaluating the design and operating effectiveness of internal control based on the assessed risk, and performing such other procedures as we considered necessary in the circumstances. We believe that our audit provides a reasonable basis for our opinion.
Definition and Limitations of Internal Control over Financial Reporting
A company’s internal control over financial reporting is a process designed to provide reasonable assurance regarding the reliability of financial reporting and the preparation of financial statements for external purposes in accordance with generally accepted accounting principles. A company’s internal control over financial reporting includes those policies and procedures that (1) pertain to the maintenance of records that, in reasonable detail, accurately and fairly reflect the transactions and dispositions of the assets of the company; (2) provide reasonable assurance that transactions are recorded as necessary to permit preparation of financial statements in accordance with generally accepted accounting principles, and that receipts and expenditures of the company are being made only in accordance with authorizations of management and directors of the company; and (3) provide reasonable assurance regarding prevention or timely detection of unauthorized acquisition, use, or disposition of the company’s assets that could have a material effect on the financial statements.
Because of its inherent limitations, internal control over financial reporting may not prevent or detect misstatements. Also, projections of any evaluation of effectiveness to future periods are subject to the risk that controls may become inadequate because of changes in conditions, or that the degree of compliance with the policies or procedures may deteriorate.
/s/ Deloitte & Touche LLP
Dallas, Texas
February 26, 2025
Item 9B. Other Information
(b) Trading arrangements
During the three months ended December 31, 2024, none of our directors or officers adopted or terminated a Rule 10b5-1 trading arrangement or a Non-Rule 10b5-1 trading arrangement, as each term is defined under Item 408(a) of Regulation S-K.
Item 9C. Disclosure Regarding Foreign Jurisdictions that Prevent Inspections
Not Applicable.
PART III
ITEM 10. DIRECTORS, EXECUTIVE OFFICERS AND CORPORATE GOVERNANCE
The information required by this Item is incorporated herein by reference to the information that will be contained in our proxy statement related to the 2025 Annual Meeting of Stockholders, which we intend to file with the Securities and Exchange Commission within 120 days of the end of our fiscal year pursuant to General Instruction G(3) of Form 10-K.
ITEM 11. EXECUTIVE COMPENSATION
The information required by this Item is incorporated herein by reference to the information that will be contained in our proxy statement related to the 2025 Annual Meeting of Stockholders, which we intend to file with the Securities and Exchange Commission within 120 days of the end of our fiscal year pursuant to General Instruction G(3) of Form 10-K.
ITEM 12. SECURITY OWNERSHIP OF CERTAIN BENEFICIAL OWNERS AND MANAGEMENT AND RELATED STOCKHOLDER MATTERS
1. Equity Compensation Plan Information as of December 31, 2024
| | | | | | | | | | | | | | | | | | | | |
| | (a) | | (b) | | (c) |
| Plan Category | | Number of securities to be issued upon exercise of outstanding options, warrants, and rights | | Weighted-average exercise price of outstanding options, warrants, and rights | | Number of securities remaining available for future issuance under equity compensation plans (excluding securities in column (a)) |
| Equity compensation plans approved by security holders | | 5,825,957 | | | $ | 99.74 | | | 4,286,654 | |
| Equity compensation plans not approved by security holders | | — | | | — | | | — | |
| Total | | 5,825,957 | | | $ | 99.74 | | | 4,286,654 | |
2. Security ownership of certain beneficial owners:
The information required by this Item is incorporated herein by reference to the information that will be contained in our proxy statement related to the 2025 Annual Meeting of Stockholders, which we intend to file with the Securities and Exchange Commission within 120 days of the end of our fiscal year pursuant to General Instruction G(3) of Form 10-K.
3. Security ownership of management:
The information required by this Item is incorporated herein by reference to the information that will be contained in our proxy statement related to the 2025 Annual Meeting of Stockholders, which we intend to file with the Securities and Exchange Commission within 120 days of the end of our fiscal year pursuant to General Instruction G(3) of Form 10-K.
4. Changes in control:
Globe Life knows of no arrangements, including any pledges by any person of its securities, the operation of which may at a subsequent date result in a change of control.
ITEM 13. CERTAIN RELATIONSHIPS AND RELATED TRANSACTIONS AND DIRECTOR INDEPENDENCE
The information required by this Item is incorporated herein by reference to the information that will be contained in our proxy statement related to the 2025 Annual Meeting of Stockholders, which we intend to file with the Securities and Exchange Commission within 120 days of the end of our fiscal year pursuant to General Instruction G(3) of Form 10-K.
ITEM 14. PRINCIPAL ACCOUNTANT FEES AND SERVICES
The information required by this Item is incorporated herein by reference to the information that will be contained in our proxy statement related to the 2025 Annual Meeting of Stockholders, which we intend to file with the Securities and Exchange Commission within 120 days of the end of our fiscal year pursuant to General Instruction G(3) of Form 10-K.
PART IV
ITEM 15. EXHIBITS AND FINANCIAL STATEMENT SCHEDULES
Index of documents filed as a part of this report: | | | | | |
| | Page of this report |
| Financial Statements: | |
| |
| Globe Life Inc. and Subsidiaries: | |
| |
| |
| |
| |
| |
| |
| |
| Schedules Supporting Financial Statements for each of the three years in the period ended December 31, 2024: | |
| |
| |
| Schedules not referred to have been omitted as inapplicable or not required by Regulation S-X. |
EXHIBITS
| | | | | | | | | | | | | | | | | | | | | | | | |
| Exhibit No. | | Description | | Form | | Filing Date | | | | |
| | | | | | | | | | |
| 3.1 | | | | 8-K | | August 8, 2019 | | | | |
| | | | | | | | | | |
| 3.2 | | | | 8-K | | May 2, 2023 | | | | |
| | | | | | | | | | |
| 3.3 | | | | 8-K | | August 15, 2023 | | | | |
| | | | | | | | | | |
| 4.1 | | | | 8-K | | November 2, 2001 | | | | |
| | | | | | | | | | |
| 4.2 | | | | 8-K | | November 17, 2017 | | | | |
| | | | | | | | | | |
| 4.3 | | | | 8-K | | June 14, 2021 | | | | |
| | | | | | | | | | |
| 4.4 | | | | S-3 | | September 24, 2018 | | | | |
| | | | | | | | | | |
| 4.5 | | | | 8-K | | September 27, 2018 | | | | |
| | | | | | | | | | |
| 4.6 | | | | 8-K | | August 21, 2020 | | | | |
| | | | | | | | | | |
| 4.7 | | | | 8-K | | May 19, 2022 | | | | |
| | | | | | | | | | |
| 4.8 | | | | 8-K | | August 26, 2024 | | | | |
| | | | | | | | | | |
| 10.1 | | | | 10-K | | March 22, 2002 | | | | |
| | | | | | | | | | |
| 10.2 | | | | 10-K | | February 26, 2025 | | | | |
| | | | | | | | | | |
| 10.3 | | | | 8-K | | January 6, 2009 | | | | |
| | | | | | | | | | |
| 10.4 | | | | 10-K | | February 28, 2014 | | | | |
| | | | | | | | | | |
| 10.5 | | | | 10-K | | March 1, 2019 | | | | |
| | | | | | | | | | |
| 10.6 | | | | 8-K | | May 4, 2011 | | | | |
| | | | | | | | | | |
| 10.7 | | | | 8-K | | April 29, 2014 | | | | |
| | | | | | | | | | |
| 10.8 | | | | 10-K | | February 27, 2017 | | | | |
| | | | | | | | | | |
| 10.9 | | | | 10-K | | February 28, 2011 | | | | |
| | | | | | | | | | |
| 10.1 | | | | 8-K | | May 2, 2018 | | | | |
| | | | | | | | | | |
| 10.11 | | | | 10-K | | February 27, 2020 | | | | |
| | | | | | | | | | |
| 10.12 | | | | 10-Q | | May 9, 2023 | | | | |
| | | | | | | | | | |
| | | | | | | | | | | | | | | | | | | | | | | | |
| Exhibit No. | | Description | | Form | | Filing Date | | | | |
| 10.13 | | | | 10-K | | February 28, 2024 | | | | |
| | | | | | | | | | |
| 10.14 | | | | 10-K | | February 27, 2020 | | | | |
| | | | | | | | | | |
| 10.15 | | | | 8-K | | May 2, 2018 | | | | |
| | | | | | | | | | |
| 10.16 | | | | 10-K | | February 27, 2020 | | | | |
| | | | | | | | | | |
| 10.17 | | | | 8-K | | May 2, 2018 | | | | |
| | | | | | | | | | |
| 10.18 | | | | 8-K | | May 2, 2018 | | | | |
| | | | | | | | | | |
| 10.19 | | | | 10-K | | February 27, 2020 | | | | |
| | | | | | | | | | |
| 10.20 | | | | 10-K | | February 27, 2020 | | | | |
| | | | | | | | | | |
| 10.21 | | | | 8-K | | November 9, 2023 | | | | |
| | | | | | | | | | |
| | | | | | | | | | |
| | | | | | | | | | |
| 10.22 | | | | 8-K | | October 1, 2021 | | | | |
| | | | | | | | | | |
| 10.23 | | | | 10-K | | February 23, 2023 | | | | |
| | | | | | | | | | |
| 10.24 | | | | 8-K | | April 2, 2024 | | | | |
| | | | | | | | | | |
| 10.25 | | | | 8-K | | April 18, 2023 | | | | |
| | | | | | | | | | |
| 10.26 | | | | 8-K | | August 15, 2024 | | | | |
| | | | | | | | | | |
| 10.27 | | | | 10-K | | February 23, 2023 | | | | |
| | | | | | | | | | |
| 10.28 | | | | 10-K | | February 23, 2023 | | | | |
| | | | | | | | | | |
| 10.29 | | | | 10-K | | February 23, 2023 | | | | |
| | | | | | | | | | |
| 10.30 | | | | 10-K | | February 23, 2023 | | | | |
| | | | | | | | | | |
| 10.31 | | | | 10-K | | February 23, 2023 | | | | |
| | | | | | | | | | |
| 10.32 | | | | 10-K | | February 28, 2024 | | | | |
| | | | | | | | | | |
| 10.33 | | | | 10-K | | February 28, 2024 | | | | |
| | | | | | | | | | |
| 10.34 | | | | 10-K | | February 28, 2024 | | | | |
| | | | | | | | | | |
| | | | | | | | | | | | | | | | | | | | | | | | |
| Exhibit No. | | Description | | Form | | Filing Date | | | | |
| 10.35 | | | | 10-K | | February 28, 2024 | | | | |
| | | | | | | | | | |
| 10.36 | | | | 10-K | | February 28, 2024 | | | | |
| | | | | | | | | | |
| 10.37 | | | | 8-K | | November 19, 2024 | | | | |
| | | | | | | | | | |
| 10.38 | | | | 8-K | | November 19, 2024 | | | | |
| | | | | | | | | | |
| 10.39 | | | | 8-K | | November 19, 2024 | | | | |
| | | | | | | | | | |
| 10.40 | | | | 8-K | | November 19, 2024 | | | | |
| | | | | | | | | | |
| 10.41 | | | | 8-K | | November 19, 2024 | | | | |
| | | | | | | | | | |
| 10.42 | | | | 10-K | | February 26, 2025 | | | | |
| | | | | | | | | | |
| 10.43 | | | | 8-K | | November 19, 2024 | | | | |
| 19 | | | | 10-K | | February 26, 2025 | | | | |
| | | | | | | | | | |
| 21 | | | | 10-K | | February 26, 2025 | | | | |
| | | | | | | | | | |
| 23 | | | | 10-K | | February 26, 2025 | | | | |
| | | | | | | | | | |
| 24 | | | | 10-K | | February 26, 2025 | | | | |
| | | | | | | | | | |
| | | | | | | | | | |
| | | | | | | | | | |
| 31.1 | | | | 10-K | | February 26, 2025 | | | | |
| | | | | | | | | | |
| 31.2 | | | | 10-K | | February 26, 2025 | | | | |
| | | | | | | | | | |
| 31.3 | | | | 10-K | | February 26, 2025 | | | | |
| | | | | | | | | | |
| 32.1 | | | | 10-K | | February 26, 2025 | | | | |
| | | | | | | | | | |
| 97 | | | | 10-K | | February 26, 2024 | | | | |
| | | | | | | | | | |
| 101.INS | | XBRL Instance Document- the instance document does not appear in the Interactive Data file because the XBRL tags are embedded within the Inline XBRL document. | | 10-K | | February 26, 2025 | | | | |
| | | | | | | | | | |
| 101.SCH | | Inline XBRL Taxonomy Extension Schema Document. | | 10-K | | February 26, 2025 | | | | |
| | | | | | | | | | |
| 101.CAL | | Inline XBRL Taxonomy Extension Calculation Linkbase Document. | | 10-K | | February 26, 2025 | | | | |
| | | | | | | | | | |
| 101.LAB | | Inline XBRL Taxonomy Extension Label Linkbase Document. | | 10-K | | February 26, 2025 | | | | |
| | | | | | | | | | |
| 101.PRE | | Inline XBRL Taxonomy Extension Presentation Linkbase Document. | | 10-K | | February 26, 2025 | | | | |
| | | | | | | | | | |
| 101.DEF | | Inline XBRL Taxonomy Extension Definition Linkbase Document. | | 10-K | | February 26, 2025 | | | | |
| | | | | | | | | | |
| 104 | | Cover Page Interactive Data File (formatted as inline XBRL with applicable taxonomy extension information contained in Exhibits 101). | | 10-K | | February 26, 2025 | | | | |
| | | | | | | | | | |
* Compensatory plan or arrangement.
Globe Life Inc.
(PARENT COMPANY)
SCHEDULE II. CONDENSED FINANCIAL INFORMATION OF REGISTRANT
Condensed Balance Sheets
(Dollar amounts in thousands) | | | | | | | | | | | |
| December 31, |
| 2024 | | 2023 |
| Assets: | | | |
| Investments: | | | |
| Long-term investments | $ | 39,404 | | | $ | 42,360 | |
| Short-term investments | 29,005 | | | 1,005 | |
| Total investments | 68,409 | | | 43,365 | |
| Cash | 66,770 | | | 1,003 | |
| Investment in affiliates | 7,740,073 | | | 6,539,183 | |
| Due from affiliates | 278,301 | | | 105,279 | |
| | | |
| Taxes receivable from affiliates | 15,202 | | | 14,163 | |
| Other assets | 193,363 | | | 181,443 | |
| Total assets | $ | 8,362,118 | | | $ | 6,884,436 | |
| | | |
| | | |
| Liabilities: | | | |
| Short-term debt | $ | 415,401 | | | $ | 486,113 | |
| Long-term debt | 2,473,874 | | | 1,779,137 | |
| Due to affiliates | 52,568 | | | — | |
| Other liabilities | 114,755 | | | 132,383 | |
| Total liabilities | 3,056,598 | | | 2,397,633 | |
| | | |
| Shareholders’ equity: | | | |
| Preferred stock | 351 | | | 351 | |
| Common stock | 97,218 | | | 102,218 | |
| Additional paid-in capital | 878,306 | | | 882,985 | |
| Accumulated other comprehensive income | (2,029,720) | | | (2,772,419) | |
| Retained earnings | 8,002,521 | | | 7,478,813 | |
| Treasury stock | (1,643,156) | | | (1,205,145) | |
| Total shareholders’ equity | 5,305,520 | | | 4,486,803 | |
| Total liabilities and shareholders’ equity | $ | 8,362,118 | | | $ | 6,884,436 | |
See Notes to Consolidated Financial Statements and accompanying Report of Independent Registered
Public Accounting Firm.
Globe Life Inc.
(PARENT COMPANY)
SCHEDULE II. CONDENSED FINANCIAL INFORMATION OF REGISTRANT (continued)
Condensed Statement of Operations
(Dollar amounts in thousands) | | | | | | | | | | | | | | | | | |
| | Year Ended December 31, |
| | 2024 | | 2023 | | 2022 |
| Net investment income | $ | 38,341 | | | $ | 36,237 | | | $ | 33,664 | |
| Realized gains (losses) | 4,158 | | | 5,924 | | | (9,643) | |
Total revenue | 42,499 | | | 42,161 | | | 24,021 | |
| | | | | |
| General operating expenses | 75,387 | | | 59,051 | | | 59,307 | |
| Reimbursements from affiliates | (53,136) | | | (59,796) | | | (51,312) | |
| Interest expense | 125,023 | | | 107,180 | | | 97,051 | |
Total expenses | 147,274 | | | 106,435 | | | 105,046 | |
| | | | | |
| Operating income (loss) before income taxes and equity in earnings of affiliates | (104,775) | | | (64,274) | | | (81,025) | |
| Income tax benefit | 19,832 | | | 10,706 | | | 12,426 | |
| Net operating loss before equity in earnings of affiliates | (84,943) | | | (53,568) | | | (68,599) | |
| Equity in earnings of affiliates, net of tax | 1,155,705 | | | 1,024,323 | | | 962,985 | |
Net income | 1,070,762 | | | 970,755 | | | 894,386 | |
| | | | | |
| Other comprehensive income (loss): | | | | | |
| Attributable to Parent Company | 21,326 | | | 1,113 | | | 75,076 | |
| Attributable to affiliates | 721,373 | | | 16,781 | | | 1,369,659 | |
| Comprehensive income (loss) | $ | 1,813,461 | | | $ | 988,649 | | | $ | 2,339,121 | |
See Notes to Consolidated Financial Statements and accompanying Report of Independent Registered
Public Accounting Firm.
Globe Life Inc.
(PARENT COMPANY)
SCHEDULE II. CONDENSED FINANCIAL INFORMATION OF REGISTRANT (continued)
Condensed Statement of Cash Flows
(Dollar amounts in thousands) | | | | | | | | | | | | | | | | | |
| | Year Ended December 31, |
| | 2024 | | 2023 | | 2022 |
| Net income | $ | 1,070,762 | | | $ | 970,755 | | | $ | 894,386 | |
| Equity in earnings of affiliates | (1,155,705) | | | (1,024,323) | | | (962,985) | |
| Cash dividends from subsidiaries | 692,690 | | | 459,535 | | | 407,042 | |
| Other, net | 55,243 | | | 33,846 | | | 26,444 | |
Cash provided from operations | 662,990 | | | 439,813 | | | 364,887 | |
| | | | | |
| Cash provided from (used for) investing activities: | | | | | |
| Net decrease (increase) in short-term investments | (28,000) | | | 13,996 | | | (15,001) | |
| Investment in subsidiaries | (12) | | | — | | | (10,010) | |
| Acquisition of investments | (2,850) | | | (3,950) | | | (2,000) | |
| Disposition of investments | 1 | | | — | | | — | |
| Loaned money to affiliates | (557,016) | | | (479,629) | | | (846,002) | |
| Repayments from affiliates | 394,925 | | | 505,929 | | | 886,002 | |
| Additions to properties | (19,147) | | | (7,400) | | | — | |
Cash provided from (used for) investing activities | (212,099) | | | 28,946 | | | 12,989 | |
| | | | | |
| Cash provided from (used for) financing activities: | | | | | |
| Repayment of debt | — | | | (165,612) | | | (300,000) | |
| Proceeds from issuance of debt | 530,000 | | | 170,000 | | | 400,000 | |
| Payment for debt issuance costs | (7,253) | | | (757) | | | (5,272) | |
| Net change in commercial paper held less than 90 days | (13,878) | | | 32,961 | | | (46,289) | |
| Proceeds from commercial paper with original maturities greater than 90 days | 484,726 | | | — | | | — | |
| Repayment of commercial paper with original maturities greater than 90 days | (372,011) | | | — | | | — | |
| Issuance of stock | 51,756 | | | 114,080 | | | 111,970 | |
| Acquisitions of treasury stock | (1,002,109) | | | (511,100) | | | (454,638) | |
| Borrowed money from affiliate | 349,000 | | | 290,500 | | | 22,400 | |
| Repayments to affiliates | (296,600) | | | (290,500) | | | (22,400) | |
| Payment of dividends | (108,755) | | | (107,386) | | | (103,817) | |
Cash provided from (used for) financing activities | (385,124) | | | (467,814) | | | (398,046) | |
| | | | | |
| Net increase (decrease) in cash | 65,767 | | | 945 | | | (20,170) | |
| Cash balance at beginning of period | 1,003 | | | 58 | | | 20,228 | |
| Cash balance at end of period | $ | 66,770 | | | $ | 1,003 | | | $ | 58 | |
See Notes to Consolidated Financial Statements and accompanying Report of Independent Registered
Public Accounting Firm.
Globe Life Inc.
(PARENT COMPANY)
SCHEDULE II. CONDENSED FINANCIAL INFORMATION OF REGISTRANT (continued)
Notes to Condensed Financial Statements
(Dollar amounts in thousands)
Note A—Dividends from Subsidiaries
Cash dividends paid to Globe Life from the subsidiaries were as follows:
| | | | | | | | | | | | | | | | | |
| Year Ended December 31, |
| 2024 | | 2023 | | 2022 |
| Dividends from subsidiaries | $ | 692,690 | | | $ | 459,535 | | | $ | 407,042 | |
Note B—Supplemental Disclosures of Cash Flow Information
| | | | | | | | | | | | | | | | | |
| | Year Ended December 31, |
| | 2024 | | 2023 | | 2022 |
| Stock-based compensation not involving cash | $ | 40,118 | | | $ | 30,736 | | | $ | 35,650 | |
| | | | | |
The following table summarizes certain amounts paid (received) during the period: | | | | | | | | | | | | | | | | | |
| | Year Ended December 31, |
| | 2024 | | 2023 | | 2022 |
| Interest paid | $ | 114,459 | | | $ | 104,493 | | | $ | 96,903 | |
| Income taxes paid (received) | (13,126) | | | (10,408) | | | (11,537) | |
Note C—Preferred Stock
As of December 31, 2024, Globe Life had 351 thousand shares of Cumulative Preferred Stock, Series A, issued and outstanding, of which 280 thousand shares were 6.50% Cumulative Preferred Stock, Series A, and 71 thousand shares were 7.15% Cumulative Preferred Stock, Series A (collectively, the “Series A Preferred Stock”). All issued and outstanding shares of Series A Preferred Stock were held by wholly-owned insurance subsidiaries. In the event of liquidation, the holders of the Series A Preferred Stock at the time outstanding would be entitled to receive a liquidating distribution out of the assets legally available to stockholders in the amount of $1 thousand per share or $351 million in the aggregate, plus any accrued and unpaid dividends, before any distribution is made to holders of Globe Life common stock. Holders of Series A Preferred Stock do not have any voting rights nor have rights to convert such shares into shares of any other class of Globe Life capital stock.
See accompanying Report of Independent Registered Public Accounting Firm.
Globe Life Inc.
SCHEDULE IV. REINSURANCE (CONSOLIDATED)
(Dollar Amounts in thousands)
| | | | | | | | | | | | | | | | | | | | | | | | | | | | | |
| Gross
Amount | | Ceded to Other Companies(1) | | Assumed
from Other
Companies | | Net
Amount | | Percentage
of Amount
Assumed
to Net |
| For the Year Ended December 31, 2024 | | | | | | | | | |
| Life insurance in force | $ | 227,975,584 | | | $ | 671,056 | | | $ | 1,823,957 | | | $ | 229,128,485 | | | 0.8 | |
Premiums(2): | | | | | | | | | |
| Life insurance | $ | 3,235,744 | | | $ | 4,649 | | | $ | 17,994 | | | $ | 3,249,089 | | | 0.6 | |
| Health insurance | 1,384,080 | | | 2,449 | | | 23,294 | | | 1,404,925 | | | 1.7 | |
| Total premium | $ | 4,619,824 | | | $ | 7,098 | | | $ | 41,288 | | | $ | 4,654,014 | | | 0.9 | |
| For the Year Ended December 31, 2023 | | | | | | | | | |
| Life insurance in force | $ | 225,286,002 | | | $ | 685,289 | | | $ | 1,996,223 | | | $ | 226,596,936 | | | 0.9 | |
Premiums(2): | | | | | | | | | |
| Life insurance | $ | 3,109,838 | | | $ | 4,597 | | | $ | 19,104 | | | $ | 3,124,345 | | | 0.6 | |
| Health insurance | 1,281,720 | | | 2,720 | | | 39,773 | | | 1,318,773 | | | 3.0 | |
| Total premium | $ | 4,391,558 | | | $ | 7,317 | | | $ | 58,877 | | | $ | 4,443,118 | | | 1.3 | |
| For the Year Ended December 31, 2022 | | | | | | | | | |
| Life insurance in force | $ | 222,098,389 | | | $ | 662,569 | | | $ | 2,172,728 | | | $ | 223,608,548 | | | 1.0 | |
Premiums(2): | | | | | | | | | |
| Life insurance | $ | 2,999,637 | | | $ | 4,361 | | | $ | 19,009 | | | $ | 3,014,285 | | | 0.6 | |
| Health insurance | 1,238,498 | | | 3,091 | | | 47,010 | | | 1,282,417 | | | 3.7 | |
| Total premium | $ | 4,238,135 | | | $ | 7,452 | | | $ | 66,019 | | | $ | 4,296,702 | | | 1.5 | |
(1)No amounts have been netted against ceded premium.
(2)Excludes policy charges of $12.3 million, $12.9 million, and $13.5 million in each of the years 2024, 2023, and 2022, respectively.
See accompanying Report of Independent Registered Public Accounting Firm.
SIGNATURES
Pursuant to the requirements of Section 13 or 15(d) of the Securities Act of 1934, the registrant has duly caused this report to be signed on its behalf by the undersigned, thereunto duly authorized.
| | | | | | | | | | | |
| Globe Life Inc. | |
| | | |
| By: | /s/ J. MATTHEW DARDEN | |
| | J. Matthew Darden | |
| | Co-Chairman and Chief Executive Officer and Director | |
| | | |
| By: | /s/ FRANK M. SVOBODA | |
| | Frank M. Svoboda | |
| | Co-Chairman and Chief Executive Officer and Director | |
| | | |
| By: | /s/ THOMAS P. KALMBACH | |
| | Thomas P. Kalmbach | |
| | Executive Vice President and Chief Financial Officer | |
| | | |
| By: | /s/ M. SHANE HENRIE | |
| | M. Shane Henrie | |
| | Corporate Senior Vice President and Chief Accounting Officer | |
Date: February 26, 2025
Pursuant to the requirements of the Securities Exchange Act of 1934, this report has been signed below by the following persons on behalf of the registrant and in the capacities and on the dates indicated.
| | | | | | | | | | | | | | |
| By: | | | By: | /s/ LINDA L. ADDISON * |
| Matthew J. Adams | | | Linda L. Addison |
| Director | | | Director |
| | | | |
| By: | /s/ MARILYN A. ALEXANDER * | | By: | /s/ CHERYL D. ALSTON * |
| Marilyn A. Alexander | | | Cheryl D. Alston |
| Director | | | Director |
| | | | |
| By: | /s/ MARK A. BLINN * | | By: | /s/ JAMES P. BRANNEN * |
| Mark A. Blinn | | | James P. Brannen |
| Director | | | Director |
| | | | |
| By: | /s/ ALICE S. CHO * | | By: | |
| Alice S. Cho | | | Philip M. Jacobs |
| Director | | | Director |
| | | | |
| By: | /s/ STEVEN P. JOHNSON * | | By: | /s/ DAVID A. RODRIGUEZ * |
| Steven P. Johnson | | | David A. Rodriguez |
| Director | | | Director |
| | | | |
| By: | /s/ MARY E. THIGPEN * | | | |
| Mary E. Thigpen | | | |
| Director | | | |
| | | | |
| Date: February 26, 2025 | | *By: | /s/ THOMAS P. KALMBACH |
| | | | Thomas P. Kalmbach |
| | | | Attorney-in-fact |