UNITED STATES
SECURITIES AND EXCHANGE COMMISSION
Washington, D.C. 20549
FORM N-CSR
CERTIFIED SHAREHOLDER REPORT OF REGISTERED
MANAGEMENT INVESTMENT COMPANIES
Investment Company Act file number 811-3114
Fidelity Select Portfolios
(Exact name of registrant as specified in charter)
82 Devonshire St., Boston, Massachusetts 02109
(Address of principal executive offices) (Zip code)
Eric D. Roiter, Secretary
82 Devonshire St.
Boston, Massachusetts 02109
(Name and address of agent for service)
Registrant's telephone number, including area code: 617-563-7000
Date of fiscal year end: | February 29 |
| |
Date of reporting period: | February 29, 2004 |
Item 1. Reports to Stockholders
Fidelity®
Select
Portfolios®
Air Transportation
Automotive
Banking
Biotechnology
Brokerage and Investment Management
Business Services and Outsourcing
Chemicals
Computers
Construction and Housing
Consumer Industries
Cyclical Industries
Defense and Aerospace
Developing Communications
Electronics
Energy
Energy Service
Environmental
Financial Services
Food and Agriculture
Gold
Health Care
Home Finance
Industrial Equipment
Industrial Materials
Insurance
Leisure
Medical Delivery
Medical Equipment and Systems
Money Market
Multimedia
Natural Gas
Natural Resources
Networking and Infrastructure
Paper and Forest Products
Pharmaceuticals
Retailing
Software and Computer Services
Technology
Telecommunications
Transportation
Utilities Growth
Wireless
Annual Report
February 29, 2004
(2_fidelity_logos) (Registered_Trademark)
Contents
* Fund updates for each Select Portfolio include: Performance, Management's Discussion, Investment Summary, Investments, and Financial Statements.
Annual Report
For a free copy of the funds' proxy voting guidelines visit www.fidelity.com/goto/proxyguidelines, call 1-800-544-8544, or visit the Securities and Exchange Commission (SEC)'s website at www.sec.gov.
Standard & Poor's, S&P and S&P 500 are registered service marks of The McGraw-Hill Companies, Inc. and have been licensed for use by
Fidelity Distributors Corporation.
Other third party marks appearing herein are the property of their respective owners.
All other marks appearing herein are registered or unregistered trademarks or service marks of FMR Corp. or an affiliated company.
(Recycle graphic) This report is printed on recycled paper using soy-based inks.
This report and the financial statements contained herein are submitted for the general information of the shareholders of the funds. This report is not authorized for distribution to prospective investors in the funds unless preceded or accompanied by an effective prospectus.
Mutual fund shares are not deposits or obligations of, or guaranteed by, any depository institution. Shares are not insured by the FDIC, Federal Reserve Board or any other agency, and are subject to investment risks, including possible loss of principal amount invested.
Neither the funds nor Fidelity Distributors Corporation is a bank.
Annual Report
Consumer Industries Portfolio
Performance
Average annual total return reflects the change in the value of an investment, assuming reinvestment of the fund's dividend income and capital gains (the profits earned upon the sale of securities that have grown in value) and assuming a constant rate of performance each year. The $10,000 table and the fund's returns do not reflect the deduction of taxes that a shareholder would pay on fund distributions or the redemption of fund shares. During periods of reimbursement by Fidelity a fund's total returns will be greater than it would be had the reimbursement not occurred. How a fund did yesterday is no guarantee of how it will do tomorrow.
Average Annual Total Returns
Periods ended February 29, 2004 | Past 1
year | Past 5
years | Past 10
years |
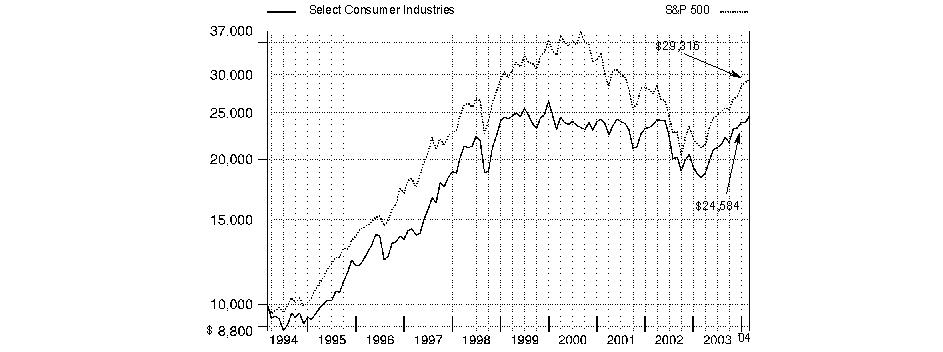
Select Consumer Industries | 33.82% | 0.29% | 9.41% |
$10,000 Over 10 Years
Let's say hypothetically that $10,000 was invested in Fidelity® Select Consumer Industries Portfolio on February 28, 1994. The chart shows how the value of your investment would have grown, and also shows how the S&P 500® Index did over the same period.
Annual Report
Consumer Industries Portfolio
Management's Discussion of Fund Performance
Comments from Joshua Spencer, who became Portfolio Manager of Fidelity® Select Consumer Industries Portfolio on January 12, 2004
From March 2003 through the end of February 2004, domestic stocks recovered dramatically from their prior three-year swoon, driven largely by a broad-based economic and corporate profit recovery. Most major equity benchmarks gained 35% or more during the 12-month period, led by the Russell 2000® Index - a measure of the overall small-cap universe - which advanced 64.41%. As investors grew more confident about the economy's vitality, small-cap stocks were bid up, particularly those with no current earnings. In comparison, the Wilshire 5000® Total Market Index, commonly used as a proxy for the entire U.S. stock market's performance, rose 42.47%. Every sector of the market posted a double-digit advance, with economically sensitive issues - especially technology stocks - leading the way. The tech-heavy NASDAQ Composite® Index returned 52.47% during the past year, despite a negative return in February as investors turned to the more value-oriented segments of the market. The broader Standard & Poor's 500SM Index climbed 38.52% during the year, slightly outperforming the 37.07% increase for the blue-chip Dow Jones Industrial AverageSM.
For the 12-month period that ended on February 29, 2004, Fidelity Select Consumer Industries Portfolio returned 33.82%, lagging the 37.04% return of the Goldman Sachs® Consumer Industries Index as well as that of the S&P 500®. The fund's underperformance versus these indexes was mostly attributable to two factors: first, not owning a large enough position in Altria Group, the parent company of consumer products giant Philip Morris, which performed much better than expected as a result of the favorable resolution of pending tobacco-related lawsuits; and second, holding too large an average cash position, thus missing out on some of the upside of the market's overall rebound during the period. The fund's large positions in such strong-performing stocks as Coca-Cola, Procter & Gamble and Yahoo! all helped absolute performance. Conversely, large positions in media companies Viacom and Fox Entertainment, whose advertising revenues did not meet expectations, held back the fund's overall return, as did our holdings in AutoZone and Wilson's Leather.
The views expressed in this statement reflect those of the portfolio manager only through the end of the period of the report as stated on the cover and do not necessarily represent the views of Fidelity or any other person in the Fidelity organization. Any such views are subject to change at any time based upon market or other conditions and Fidelity disclaims any responsibility to update such views. These views may not be relied on as investment advice and, because investment decisions for a Fidelity fund are based on numerous factors, may not be relied on as an indication of trading intent on behalf of any Fidelity fund.
Annual Report
Consumer Industries Portfolio
Investment Summary
Top Ten Stocks as of February 29, 2004 |
| % of fund's
net assets |
Procter & Gamble Co. | 5.3 |
Clear Channel Communications, Inc. | 5.3 |
Univision Communications, Inc. Class A | 3.6 |
Home Depot, Inc. | 3.6 |
McDonald's Corp. | 3.3 |
PepsiCo, Inc. | 3.3 |
Viacom, Inc. Class B (non-vtg.) | 2.8 |
Citadel Broadcasting Corp. | 2.7 |
Yahoo!, Inc. | 2.5 |
Colgate-Palmolive Co. | 2.2 |
| 34.6 |
Top Industries as of February 29, 2004 |
% of fund's net assets |
 | Media | 31.9% | |
 | Hotels, Restaurants & Leisure | 12.0% | |
 | Specialty Retail | 8.8% | |
 | Household Products | 7.9% | |
 | Food Products | 6.1% | |
 | All Others* | 33.3% | |

* Includes short-term investments and net other assets. |
Annual Report
Consumer Industries Portfolio
Investments February 29, 2004
Showing Percentage of Net Assets
Common Stocks - 97.0% |
| Shares | | Value (Note 1) |
AUTOMOBILES - 2.7% |
Harley-Davidson, Inc. | 8,300 | | $ 440,896 |
Monaco Coach Corp. (a) | 9,200 | | 262,200 |
Thor Industries, Inc. | 8,300 | | 246,427 |
TOTAL AUTOMOBILES | | 949,523 |
BEVERAGES - 5.7% |
Anheuser-Busch Companies, Inc. | 3,700 | | 196,914 |
PepsiCo, Inc. | 22,600 | | 1,172,940 |
The Coca-Cola Co. | 13,500 | | 674,460 |
TOTAL BEVERAGES | | 2,044,314 |
COMMERCIAL SERVICES & SUPPLIES - 1.9% |
Cendant Corp. | 22,300 | | 506,210 |
Cintas Corp. | 100 | | 4,271 |
Manpower, Inc. | 3,300 | | 147,675 |
TOTAL COMMERCIAL SERVICES & SUPPLIES | | 658,156 |
FOOD & STAPLES RETAILING - 1.2% |
CVS Corp. | 10,400 | | 390,000 |
Sysco Corp. | 100 | | 3,965 |
Whole Foods Market, Inc. | 600 | | 46,410 |
TOTAL FOOD & STAPLES RETAILING | | 440,375 |
FOOD PRODUCTS - 6.1% |
Bunge Ltd. | 4,400 | | 171,820 |
Dean Foods Co. (a) | 9,040 | | 328,242 |
Fresh Del Monte Produce, Inc. | 6,400 | | 162,944 |
Hershey Foods Corp. | 1,900 | | 157,510 |
Kellogg Co. | 8,000 | | 315,920 |
McCormick & Co., Inc. (non-vtg.) | 2,300 | | 71,921 |
Smithfield Foods, Inc. (a) | 14,500 | | 370,910 |
SunOpta, Inc. (a) | 5,200 | | 53,112 |
The J.M. Smucker Co. | 1,400 | | 70,812 |
Unilever NV (NY Shares) | 6,500 | | 472,550 |
TOTAL FOOD PRODUCTS | | 2,175,741 |
HOTELS, RESTAURANTS & LEISURE - 12.0% |
Boyd Gaming Corp. | 100 | | 2,038 |
Brinker International, Inc. (a) | 6,270 | | 235,940 |
Carnival Corp. unit | 11,500 | | 510,255 |
CBRL Group, Inc. | 2,300 | | 87,354 |
McDonald's Corp. | 41,700 | | 1,180,110 |
MGM MIRAGE (a) | 8,200 | | 357,110 |
Outback Steakhouse, Inc. | 8,800 | | 425,832 |
Royal Caribbean Cruises Ltd. | 13,400 | | 592,950 |
Starwood Hotels & Resorts Worldwide, Inc. unit (a) | 8,400 | | 327,684 |
Wendy's International, Inc. | 2,270 | | 92,321 |
|
| Shares | | Value (Note 1) |
Wyndham International, Inc. Class A (a) | 163,900 | | $ 183,568 |
Yum! Brands, Inc. (a) | 7,300 | | 270,319 |
TOTAL HOTELS, RESTAURANTS & LEISURE | | 4,265,481 |
HOUSEHOLD DURABLES - 2.1% |
American Greetings Corp. Class A (a) | 3,700 | | 83,879 |
Newell Rubbermaid, Inc. | 13,200 | | 337,788 |
Pulte Homes, Inc. | 1,200 | | 63,312 |
Toll Brothers, Inc. (a) | 6,300 | | 276,570 |
TOTAL HOUSEHOLD DURABLES | | 761,549 |
HOUSEHOLD PRODUCTS - 7.9% |
Colgate-Palmolive Co. | 14,000 | | 776,300 |
Kimberly-Clark Corp. | 2,300 | | 148,764 |
Procter & Gamble Co. | 18,460 | | 1,892,333 |
TOTAL HOUSEHOLD PRODUCTS | | 2,817,397 |
INTERNET SOFTWARE & SERVICES - 4.3% |
Sina Corp. (a) | 6,700 | | 296,013 |
Sohu.com, Inc. (a) | 13,000 | | 365,300 |
Yahoo!, Inc. (a) | 19,948 | | 885,691 |
TOTAL INTERNET SOFTWARE & SERVICES | | 1,547,004 |
LEISURE EQUIPMENT & PRODUCTS - 2.0% |
Brunswick Corp. | 6,800 | | 267,648 |
MarineMax, Inc. (a) | 4,400 | | 116,908 |
Polaris Industries, Inc. | 3,800 | | 321,822 |
TOTAL LEISURE EQUIPMENT & PRODUCTS | | 706,378 |
MEDIA - 31.9% |
Belo Corp. Series A | 3,100 | | 86,490 |
Cablevision Systems Corp. - NY Group Class A (a) | 4,900 | | 124,852 |
Citadel Broadcasting Corp. | 52,000 | | 972,400 |
Clear Channel Communications, Inc. | 43,338 | | 1,865,268 |
Comcast Corp. Class A (special) (a) | 6,100 | | 178,242 |
Cumulus Media, Inc. Class A (a) | 18,300 | | 364,170 |
Dow Jones & Co., Inc. | 2,900 | | 141,230 |
E.W. Scripps Co. Class A | 1,950 | | 189,852 |
EchoStar Communications Corp.
Class A (a) | 9,800 | | 353,976 |
Emmis Communications Corp.
Class A (a) | 100 | | 2,530 |
Entercom Communications Corp.
Class A (a) | 100 | | 4,616 |
Fox Entertainment Group, Inc. Class A (a) | 12,500 | | 362,750 |
Gannett Co., Inc. | 5,900 | | 508,993 |
JC Decaux SA (a) | 9,900 | | 199,397 |
Journal Communications, Inc. Class A | 200 | | 3,666 |
Lamar Advertising Co. Class A (a) | 5,570 | | 221,129 |
Liberty Media Corp. Class A (a) | 25,600 | | 291,840 |
Common Stocks - continued |
| Shares | | Value (Note 1) |
MEDIA - CONTINUED |
Meredith Corp. | 1,800 | | $ 90,540 |
News Corp. Ltd. sponsored ADR | 7,700 | | 252,021 |
Omnicom Group, Inc. | 4,300 | | 351,740 |
R.H. Donnelley Corp. (a) | 7,100 | | 307,785 |
Radio One, Inc. Class D (non-vtg.) (a) | 16,300 | | 296,986 |
Spanish Broadcasting System, Inc.
Class A (a) | 8,840 | | 99,008 |
Time Warner, Inc. (a) | 18,400 | | 317,400 |
Tribune Co. | 5,100 | | 254,694 |
Univision Communications, Inc.
Class A (a) | 35,900 | | 1,279,117 |
Viacom, Inc.: | | | |
Class A | 12,100 | | 468,996 |
Class B (non-vtg.) | 25,428 | | 977,961 |
Walt Disney Co. | 28,900 | | 766,717 |
TOTAL MEDIA | | 11,334,366 |
MULTILINE RETAIL - 2.7% |
Big Lots, Inc. (a) | 6,400 | | 92,160 |
Dollar General Corp. | 4,600 | | 100,694 |
Family Dollar Stores, Inc. | 5,600 | | 213,024 |
Federated Department Stores, Inc. | 3,400 | | 178,058 |
Nordstrom, Inc. | 6,900 | | 270,066 |
Saks, Inc. (a) | 2,100 | | 36,582 |
Tuesday Morning Corp. (a) | 1,800 | | 59,400 |
TOTAL MULTILINE RETAIL | | 949,984 |
PERSONAL PRODUCTS - 2.5% |
Avon Products, Inc. | 2,700 | | 190,620 |
Estee Lauder Companies, Inc. Class A | 3,300 | | 140,580 |
Gillette Co. | 14,300 | | 550,407 |
TOTAL PERSONAL PRODUCTS | | 881,607 |
SPECIALTY RETAIL - 8.8% |
American Eagle Outfitters, Inc. (a) | 8,000 | | 195,120 |
AnnTaylor Stores Corp. (a) | 2,000 | | 91,600 |
Foot Locker, Inc. | 5,500 | | 144,100 |
Gap, Inc. | 12,800 | | 266,240 |
Home Depot, Inc. | 35,060 | | 1,273,029 |
Hot Topic, Inc. (a) | 150 | | 4,355 |
Limited Brands, Inc. | 5,000 | | 98,750 |
Lowe's Companies, Inc. | 8,800 | | 492,800 |
Office Depot, Inc. (a) | 9,900 | | 172,557 |
PETsMART, Inc. | 3,300 | | 89,562 |
Select Comfort Corp. (a) | 5,900 | | 159,713 |
Staples, Inc. (a) | 1,200 | | 31,464 |
West Marine, Inc. (a) | 4,300 | | 127,925 |
TOTAL SPECIALTY RETAIL | | 3,147,215 |
|
| Shares | | Value (Note 1) |
TEXTILES APPAREL & LUXURY GOODS - 2.5% |
Coach, Inc. (a) | 2,800 | | $ 110,964 |
Kenneth Cole Productions, Inc. Class A | 2,000 | | 67,520 |
Liz Claiborne, Inc. | 5,700 | | 210,330 |
NIKE, Inc. Class B | 3,000 | | 219,750 |
Polo Ralph Lauren Corp. Class A | 2,200 | | 73,854 |
Reebok International Ltd. | 5,100 | | 203,031 |
TOTAL TEXTILES APPAREL & LUXURY GOODS | | 885,449 |
TOBACCO - 2.7% |
Altria Group, Inc. | 8,640 | | 497,232 |
UST, Inc. | 11,800 | | 449,344 |
TOTAL TOBACCO | | 946,576 |
TOTAL COMMON STOCKS (Cost $30,713,085) | 34,511,115 |
Money Market Funds - 2.7% |
| | | |
Fidelity Cash Central Fund, 1.08% (b) | 521,494 | | 521,494 |
Fidelity Securities Lending Cash Central Fund, 1.08% (b) | 436,000 | | 436,000 |
TOTAL MONEY MARKET FUNDS (Cost $957,494) | 957,494 |
TOTAL INVESTMENT PORTFOLIO - 99.7% (Cost $31,670,579) | | 35,468,609 |
NET OTHER ASSETS - 0.3% | | 104,840 |
NET ASSETS - 100% | $ 35,573,449 |
Legend |
(a) Non-income producing |
(b) Affiliated fund that is available only to investment companies and other accounts managed by Fidelity Investments. The rate quoted is the annualized seven-day yield of the fund at period end. A complete listing of the fund's holdings as of its most recent fiscal year end is available upon request. |
Other Information |
Purchases and sales of securities, other than short-term securities, aggregated $46,594,878 and $40,584,208, respectively. |
The fund placed a portion of its portfolio transactions with brokerage firms which are affiliates of the investment adviser. The commissions paid to these affiliated firms were $3,600 for the period. |
Income Tax Information |
The fund hereby designates approximately $590,000 as a capital gain dividend for the purpose of the dividend paid deduction. |
See accompanying notes which are an integral part of the financial statements.
Consumer Sector
Consumer Industries Portfolio
Financial Statements
Statement of Assets and Liabilities
| February 29, 2004 |
| | |
Assets | | |
Investment in securities, at value (including securities loaned of $424,960) (cost $31,670,579) - See accompanying schedule | | $ 35,468,609 |
Receivable for investments sold | | 2,318,283 |
Receivable for fund shares sold | | 154,478 |
Dividends receivable | | 28,226 |
Interest receivable | | 544 |
Prepaid expenses | | 152 |
Other affiliated receivables | | 49 |
Other receivables | | 8,109 |
Total assets | | 37,978,450 |
| | |
Liabilities | | |
Payable to custodian bank | $ 17,302 | |
Payable for investments purchased | 1,837,359 | |
Payable for fund shares redeemed | 57,812 | |
Accrued management fee | 16,486 | |
Other affiliated payables | 13,021 | |
Other payables and accrued expenses | 27,021 | |
Collateral on securities loaned, at value | 436,000 | |
Total liabilities | | 2,405,001 |
| | |
Net Assets | | $ 35,573,449 |
Net Assets consist of: | | |
Paid in capital | | $ 30,471,079 |
Accumulated undistributed net realized gain (loss) on investments and foreign currency transactions | | 1,304,340 |
Net unrealized appreciation (depreciation) on investments | | 3,798,030 |
Net Assets, for 1,469,315 shares outstanding | | $ 35,573,449 |
Net Asset Value, offering price and redemption price per share ($35,573,449 ÷ 1,469,315 shares) | | $ 24.21 |
Statement of Operations
| Year ended February 29, 2004 |
| | |
Investment Income | | |
Dividends | | $ 333,136 |
Interest | | 15,561 |
Security lending | | 1,215 |
Total income | | 349,912 |
| | |
Expenses | | |
Management fee | $ 177,247 | |
Transfer agent fees | 181,187 | |
Accounting and security lending fees | 55,512 | |
Non-interested trustees' compensation | 158 | |
Custodian fees and expenses | 11,779 | |
Registration fees | 14,065 | |
Audit | 43,848 | |
Legal | 337 | |
Miscellaneous | 482 | |
Total expenses before reductions | 484,615 | |
Expense reductions | (15,148) | 469,467 |
Net investment income (loss) | | (119,555) |
Realized and Unrealized Gain (Loss) Net realized gain (loss) on: | | |
Investment securities | 4,330,503 | |
Foreign currency transactions | (106) | |
Total net realized gain (loss) | | 4,330,397 |
Change in net unrealized appreciation (depreciation) on investment securities | | 4,329,229 |
Net gain (loss) | | 8,659,626 |
Net increase (decrease) in net assets resulting from operations | | $ 8,540,071 |
Other Information | | |
Sales charges paid to FDC | | $ 16,685 |
Deferred sales charges withheld by FDC | | $ 119 |
Exchange fees withheld by
FSC | | $ 810 |
Annual Report
See accompanying notes which are an integral part of the financial statements.
Consumer Industries Portfolio
Financial Statements - continued
Statement of Changes in Net Assets
| Year ended
February 29,
2004 | Year ended
February 28,
2003 |
Increase (Decrease) in Net Assets | | |
Operations | | |
Net investment income (loss) | $ (119,555) | $ (190,179) |
Net realized gain (loss) | 4,330,397 | (1,560,593) |
Change in net unrealized appreciation (depreciation) | 4,329,229 | (3,859,117) |
Net increase (decrease) in net assets resulting from operations | 8,540,071 | (5,609,889) |
Distributions to shareholders from net realized gain | (589,523) | - |
Share transactions
Net proceeds from sales of shares | 20,824,895 | 16,098,427 |
Reinvestment of distributions | 577,945 | - |
Cost of shares redeemed | (14,480,206) | (13,278,482) |
Net increase (decrease) in net assets resulting from share transactions | 6,922,634 | 2,819,945 |
Redemption fees | 7,160 | 12,450 |
Total increase (decrease) in net assets | 14,880,342 | (2,777,494) |
| | |
Net Assets | | |
Beginning of period | 20,693,107 | 23,470,601 |
End of period | $ 35,573,449 | $ 20,693,107 |
Other Information Shares | | |
Sold | 964,806 | 752,061 |
Issued in reinvestment of distributions | 25,128 | - |
Redeemed | (645,822) | (622,216) |
Net increase (decrease) | 344,112 | 129,845 |
Financial Highlights
Years ended February 28, | 2004 F | 2003 | 2002 | 2001 | 2000 F |
Selected Per-Share Data | | | | | |
Net asset value, beginning of period | $ 18.39 | $ 23.58 | $ 25.31 | $ 28.46 | $ 31.81 |
Income from Investment Operations | | | | | |
Net investment income (loss) C | (.09) | (.18) | (.07) | (.11) | .02 D |
Net realized and unrealized gain (loss) | 6.28 | (5.02) | (.25) | .68 | (1.29) |
Total from investment operations | 6.19 | (5.20) | (.32) | .57 | (1.27) |
Distributions from net investment income | - | - | - | - | (.02) |
Distributions from net realized gain | (.38) | - | (1.42) | (3.80) | (2.08) |
Total distributions | (.38) | - | (1.42) | (3.80) | (2.10) |
Redemption fees added to paid in capital C | .01 | .01 | .01 | .08 | .02 |
Net asset value, end of period | $ 24.21 | $ 18.39 | $ 23.58 | $ 25.31 | $ 28.46 |
Total Return A,B | 33.82% | (22.01)% | (.87)% | 2.74% | (4.55)% |
Ratios to Average Net Assets E | | | | | |
Expenses before expense reductions | 1.59% | 1.86% | 1.71% | 1.80% | 1.27% |
Expenses net of voluntary waivers, if any | 1.59% | 1.86% | 1.71% | 1.80% | 1.27% |
Expenses net of all reductions | 1.54% | 1.83% | 1.69% | 1.78% | 1.25% |
Net investment income (loss) | (.39)% | (.84)% | (.30)% | (.37)% | .06% |
Supplemental Data | | | | | |
Net assets, end of period (000 omitted) | $ 35,573 | $ 20,693 | $ 23,471 | $ 20,483 | $ 63,331 |
Portfolio turnover rate | 138% | 116% | 110% | 92% | 96% |
A Total returns would have been lower had certain expenses not been reduced during the periods shown. B Total returns do not include the effect of the former sales charges. C Calculated based on average shares outstanding during the period. D Investment income per share reflects a special dividend which amounted to $.04 per share. E Expense ratios reflect operating expenses of the fund. Expenses before reductions do not reflect amounts reimbursed by the investment adviser or reductions from brokerage service arrangements or other expense offset arrangements and do not represent the amount paid by the fund during periods when reimbursements or reductions occur. Expenses net of any voluntary waivers reflect expenses after reimbursement by the investment adviser but prior to reductions from brokerage service arrangements or other expense offset arrangements. Expenses net of all reductions represent the net expenses paid by the fund. F For the year ended February 29. |
See accompanying notes which are an integral part of the financial statements.
Consumer Sector
Food and Agriculture Portfolio
Performance
Average annual total return reflects the change in the value of an investment, assuming reinvestment of the fund's dividend income and capital gains (the profits earned upon the sale of securities that have grown in value) and assuming a constant rate of performance each year. The $10,000 table and the fund's returns do not reflect the deduction of taxes that a shareholder would pay on fund distributions or the redemption of fund shares. During periods of reimbursement by Fidelity a fund's total returns will be greater than it would be had the reimbursement not occurred. How a fund did yesterday is no guarantee of how it will do tomorrow.
Average Annual Total Returns
Periods ended February 29, 2004 | Past 1
year | Past 5
years | Past 10
years |
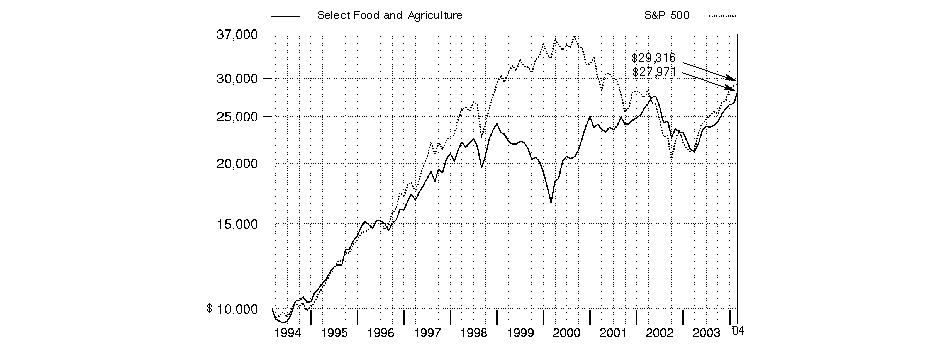
Select Food and Agriculture | 30.94% | 4.00% | 10.83% |
$10,000 Over 10 Years
Let's say hypothetically that $10,000 was invested in Fidelity Select Food and Agriculture Portfolio on February 28, 1994. The chart shows how the value of your investment would have grown, and also shows how the S&P 500 Index did over the same period.
Annual Report
Food and Agriculture Portfolio
Management's Discussion of Fund Performance
Comments from Valerie Friedholm, Portfolio Manager of Fidelity® Select Food and Agriculture Portfolio
From March 2003 through the end of February 2004, domestic stocks recovered dramatically from their prior three-year swoon, driven largely by a broad-based economic and corporate profit recovery. Most major equity benchmarks gained 35% or more during the 12-month period, led by the Russell 2000® Index - a measure of the overall small-cap universe - which advanced 64.41%. As investors grew more confident about the economy's vitality, small-cap stocks were bid up, particularly those with no current earnings. In comparison, the Wilshire 5000® Total Market Index, commonly used as a proxy for the entire U.S. stock market's performance, rose 42.47%. Every sector of the market posted a double-digit advance, with economically sensitive issues - especially technology stocks - leading the way. The tech-heavy NASDAQ Composite® Index returned 52.47% during the past year, despite a negative return in February as investors turned to the more value-oriented segments of the market. The broader Standard & Poor's 500SM Index climbed 38.52% during the year, slightly outperforming the 37.07% increase for the blue-chip Dow Jones Industrial AverageSM.
For the year ending February 29, 2004, the fund rose 30.94%, lagging the Goldman Sachs® Consumer Industries Index, which returned 37.04%, and the S&P 500®. While food stocks moved higher during the period, they failed to keep pace with the broader market and other consumer industries that tend to benefit more from cyclical upturns in the economy. I continued to favor leading companies with strong brands focused on fast-growing niche areas rather than the more diversified players, which I felt had less potential in an expanding economy. While this strategy worked reasonably well, our holdings still struggled relative to the sector benchmark. We lost the most ground in packaged foods, where several names, such as Wrigley and dairy giant Dean Foods, underperformed despite their strong and improving fundamentals. We also owned some companies whose businesses struggled, specifically General Mills, Kraft and Sara Lee. Elsewhere, the Atkins diet craze hurt same-store sales trends at Weight Watchers, which was the fund's biggest detractor. On the plus side, the fund was rewarded for heavily overweighting some of the more cyclical groups in its universe - namely restaurants and food distributors - that soundly outpaced the index. Within restaurants, performance was helped by a focus on casual-dining stocks - including McDonald's and Yum! Brands - that thrived amid a more favorable competitive environment. Coffee retailer Starbucks also boosted returns in this space, while Sysco led the way among food distributors.
The views expressed in this statement reflect those of the portfolio manager only through the end of the period of the report as stated on the cover and do not necessarily represent the views of Fidelity or any other person in the Fidelity organization. Any such views are subject to change at any time based upon market or other conditions and Fidelity disclaims any responsibility to update such views. These views may not be relied on as investment advice and, because investment decisions for a Fidelity fund are based on numerous factors, may not be relied on as an indication of trading intent on behalf of any Fidelity fund.
Annual Report
Food and Agriculture Portfolio
Investment Summary
Top Ten Stocks as of February 29, 2004 |
| % of fund's
net assets |
McDonald's Corp. | 6.2 |
Anheuser-Busch Companies, Inc. | 5.1 |
Sysco Corp. | 4.8 |
Kraft Foods, Inc. Class A | 4.2 |
Procter & Gamble Co. | 4.1 |
PepsiCo, Inc. | 3.9 |
Kellogg Co. | 3.6 |
McCormick & Co., Inc. (non-vtg.) | 3.0 |
Hershey Foods Corp. | 3.0 |
Starbucks Corp. | 2.6 |
| 40.5 |
Top Industries as of February 29, 2004 |
% of fund's net assets |
| Food Products | 29.4% | |
| Hotels, Restaurants & Leisure | 22.2% | |
| Beverages | 13.2% | |
| Food & Staples Retailing | 9.3% | |
| Household Products | 6.7% | |
| All Others* | 19.2% | |

* Includes short-term investments and net other assets. |
Annual Report
Food and Agriculture Portfolio
Investments February 29, 2004
Showing Percentage of Net Assets
Common Stocks - 90.9% |
| Shares | | Value (Note 1) |
BEVERAGES - 13.2% |
Adolph Coors Co. Class B | 5,000 | | $ 338,900 |
Anheuser-Busch Companies, Inc. | 99,000 | | 5,268,780 |
Coca-Cola Enterprises, Inc. | 32,000 | | 745,920 |
Constellation Brands, Inc. Class A (a) | 7,600 | | 240,920 |
Pepsi Bottling Group, Inc. | 29,500 | | 853,435 |
PepsiAmericas, Inc. | 18,900 | | 362,502 |
PepsiCo, Inc. | 78,100 | | 4,053,390 |
The Coca-Cola Co. | 37,600 | | 1,878,496 |
TOTAL BEVERAGES | | 13,742,343 |
CHEMICALS - 0.8% |
Monsanto Co. | 5,600 | | 185,024 |
Sensient Technologies Corp. | 3,900 | | 77,025 |
The Scotts Co. Class A (a) | 9,500 | | 598,975 |
TOTAL CHEMICALS | | 861,024 |
COMMERCIAL SERVICES & SUPPLIES - 1.3% |
Aramark Corp. Class B | 36,000 | | 988,200 |
Cintas Corp. | 9,300 | | 397,203 |
TOTAL COMMERCIAL SERVICES & SUPPLIES | | 1,385,403 |
FOOD & STAPLES RETAILING - 9.3% |
Kroger Co. (a) | 35,700 | | 686,154 |
Performance Food Group Co. (a) | 6,300 | | 220,500 |
Safeway, Inc. (a) | 84,000 | | 1,921,080 |
Sysco Corp. | 127,600 | | 5,059,340 |
United Natural Foods, Inc. (a) | 12,600 | | 581,490 |
Whole Foods Market, Inc. | 15,800 | | 1,222,130 |
Winn-Dixie Stores, Inc. | 5,000 | | 30,600 |
TOTAL FOOD & STAPLES RETAILING | | 9,721,294 |
FOOD PRODUCTS - 29.4% |
American Italian Pasta Co. Class A | 500 | | 20,350 |
Archer-Daniels-Midland Co. | 34,000 | | 584,800 |
Bunge Ltd. | 12,500 | | 488,125 |
Campbell Soup Co. | 7,200 | | 201,312 |
ConAgra Foods, Inc. | 35,400 | | 962,526 |
Corn Products International, Inc. | 2,600 | | 98,540 |
Dean Foods Co. (a) | 71,250 | | 2,587,088 |
Delta & Pine Land Co. | 400 | | 10,200 |
Dreyer's Grand Ice Cream Holdings, Inc. | 7,500 | | 588,225 |
Fresh Del Monte Produce, Inc. | 34,200 | | 870,732 |
H.J. Heinz Co. | 32,400 | | 1,238,004 |
Hershey Foods Corp. | 37,300 | | 3,092,170 |
Hormel Foods Corp. | 26,600 | | 737,352 |
Interstate Bakeries Corp. | 600 | | 9,000 |
Kellogg Co. | 95,000 | | 3,751,550 |
Kraft Foods, Inc. Class A | 129,700 | | 4,382,563 |
|
| Shares | | Value (Note 1) |
McCormick & Co., Inc. (non-vtg.) | 101,400 | | $ 3,170,778 |
Nestle SA ADR | 23,300 | | 1,549,450 |
Sanderson Farms, Inc. | 2,400 | | 85,080 |
Sara Lee Corp. | 500 | | 10,910 |
Smithfield Foods, Inc. (a) | 23,800 | | 608,804 |
SunOpta, Inc. (a) | 3,900 | | 39,834 |
The J.M. Smucker Co. | 19,200 | | 971,136 |
Tootsie Roll Industries, Inc. | 5,092 | | 189,677 |
Unilever NV (NY Shares) | 31,000 | | 2,253,700 |
Wm. Wrigley Jr. Co. | 38,400 | | 2,159,616 |
TOTAL FOOD PRODUCTS | | 30,661,522 |
HOTELS, RESTAURANTS & LEISURE - 22.2% |
Applebee's International, Inc. | 15,950 | | 652,515 |
Bob Evans Farms, Inc. | 3,300 | | 111,639 |
Brinker International, Inc. (a) | 29,600 | | 1,113,848 |
Buffalo Wild Wings, Inc. | 37,400 | | 935,000 |
California Pizza Kitchen, Inc. (a) | 18,500 | | 339,475 |
CBRL Group, Inc. | 8,800 | | 334,224 |
Darden Restaurants, Inc. | 46,800 | | 1,141,920 |
Jack in the Box, Inc. (a) | 2,663 | | 66,229 |
Krispy Kreme Doughnuts, Inc. (a) | 5,386 | | 207,146 |
McDonald's Corp. | 230,000 | | 6,508,998 |
Outback Steakhouse, Inc. | 36,700 | | 1,775,913 |
P.F. Chang's China Bistro, Inc. (a) | 68 | | 3,310 |
Red Robin Gourmet Burgers, Inc. (a) | 55,700 | | 1,723,915 |
Ruby Tuesday, Inc. | 14,800 | | 468,864 |
Sonic Corp. (a) | 12,400 | | 420,484 |
Starbucks Corp. (a) | 72,900 | | 2,727,189 |
The Cheesecake Factory, Inc. (a) | 13,500 | | 637,605 |
Volume Services America Holdings, Inc. Income Deposit Security | 12,930 | | 223,689 |
Wendy's International, Inc. | 32,400 | | 1,317,708 |
Yum! Brands, Inc. (a) | 67,000 | | 2,481,010 |
TOTAL HOTELS, RESTAURANTS & LEISURE | | 23,190,681 |
HOUSEHOLD DURABLES - 0.3% |
Jarden Corp. (a) | 9,000 | | 319,500 |
HOUSEHOLD PRODUCTS - 6.7% |
Colgate-Palmolive Co. | 48,600 | | 2,694,870 |
Procter & Gamble Co. | 41,900 | | 4,295,169 |
TOTAL HOUSEHOLD PRODUCTS | | 6,990,039 |
PERSONAL PRODUCTS - 1.8% |
Alberto-Culver Co. | 45,450 | | 1,867,086 |
SPECIALTY RETAIL - 1.6% |
Select Comfort Corp. (a) | 24,100 | | 652,387 |
Weight Watchers International, Inc. (a) | 27,100 | | 1,016,792 |
TOTAL SPECIALTY RETAIL | | 1,669,179 |
Common Stocks - continued |
| Shares | | Value (Note 1) |
TOBACCO - 4.3% |
Altria Group, Inc. | 43,700 | | $ 2,514,935 |
RJ Reynolds Tobacco Holdings, Inc. | 13,200 | | 814,836 |
Universal Corp. | 6,500 | | 327,730 |
UST, Inc. | 22,700 | | 864,416 |
TOTAL TOBACCO | | 4,521,917 |
TOTAL COMMON STOCKS (Cost $74,114,918) | 94,929,988 |
Money Market Funds - 17.9% |
Fidelity Cash Central Fund, 1.08% (b) | 8,991,461 | | 8,991,461 |
Fidelity Securities Lending Cash Central Fund, 1.08% (b) | 9,752,625 | | 9,752,625 |
TOTAL MONEY MARKET FUNDS (Cost $18,744,086) | 18,744,086 |
TOTAL INVESTMENT PORTFOLIO - 108.8% (Cost $92,859,004) | 113,674,074 |
NET OTHER ASSETS - (8.8)% | (9,237,720) |
NET ASSETS - 100% | $ 104,436,354 |
Legend |
(a) Non-income producing |
(b) Affiliated fund that is available only to investment companies and other accounts managed by Fidelity Investments. The rate quoted is the annualized seven-day yield of the fund at period end. A complete listing of the fund's holdings as of its most recent fiscal year end is available upon request. |
Other Information |
Purchases and sales of securities, other than short-term securities, aggregated $54,455,428 and $66,542,854, respectively. |
The fund placed a portion of its portfolio transactions with brokerage firms which are affiliates of the investment adviser. The commissions paid to these affiliated firms were $4,465 for the period. |
Income Tax Information |
At February 29, 2004, the fund had a capital loss carryforward of approximately $7,186,000 of which $4,117,000 and $3,069,000 will expire on February 28, 2011 and February 29, 2012, respectively. |
See accompanying notes which are an integral part of the financial statements.
Consumer Sector
Food and Agriculture Portfolio
Financial Statements
Statement of Assets and Liabilities
| February 29, 2004 |
| | |
Assets | | |
Investment in securities, at value (including securities loaned of $9,607,772) (cost $92,859,004) - See accompanying schedule | | $ 113,674,074 |
Receivable for investments sold | | 7,227 |
Receivable for fund shares sold | | 738,951 |
Dividends receivable | | 79,425 |
Interest receivable | | 4,440 |
Prepaid expenses | | 441 |
Other affiliated receivables | | 76 |
Other receivables | | 5,758 |
Total assets | | 114,510,392 |
| | |
Liabilities | | |
Payable for investments purchased | $ 146,906 | |
Payable for fund shares redeemed | 67,656 | |
Accrued management fee | 46,759 | |
Other affiliated payables | 33,621 | |
Other payables and accrued expenses | 26,471 | |
Collateral on securities loaned, at value | 9,752,625 | |
Total liabilities | | 10,074,038 |
| | |
Net Assets | | $ 104,436,354 |
Net Assets consist of: | | |
Paid in capital | | $ 91,640,805 |
Accumulated undistributed net realized gain (loss) on investments | | (8,019,913) |
Net unrealized appreciation (depreciation) on investments and assets and liabilities in foreign currencies | | 20,815,462 |
Net Assets, for 2,245,982 shares outstanding | | $ 104,436,354 |
Net Asset Value, offering price and redemption price per share ($104,436,354 ÷ 2,245,982 shares) | | $ 46.50 |
Statement of Operations
| Year ended February 29, 2004 |
| | |
Investment Income | | |
Dividends | | $ 1,594,365 |
Interest | | 34,932 |
Security lending | | 10,212 |
Total income | | 1,639,509 |
| | |
Expenses | | |
Management fee | $ 528,881 | |
Transfer agent fees | 491,546 | |
Accounting and security lending fees | 59,048 | |
Non-interested trustees' compensation | 480 | |
Custodian fees and expenses | 8,583 | |
Registration fees | 19,825 | |
Audit | 44,126 | |
Legal | 442 | |
Miscellaneous | 2,941 | |
Total expenses before reductions | 1,155,872 | |
Expense reductions | (20,419) | 1,135,453 |
Net investment income (loss) | | 504,056 |
Realized and Unrealized Gain (Loss) Net realized gain (loss) on investment securities | | 1,532,340 |
Change in net unrealized appreciation (depreciation) on: Investment securities | 22,626,863 | |
Assets and liabilities in foreign currencies | 178 | |
Total change in net unrealized appreciation (depreciation) | | 22,627,041 |
Net gain (loss) | | 24,159,381 |
Net increase (decrease) in net assets resulting from operations | | $ 24,663,437 |
Other Information | | |
Sales charges paid to FDC | | $ 21,209 |
Deferred sales charges withheld by FDC | | $ 2,871 |
Exchange fees withheld by
FSC | | $ 2,100 |
See accompanying notes which are an integral part of the financial statements.
Annual Report
Food and Agriculture Portfolio
Financial Statements - continued
Statement of Changes in Net Assets
| Year ended
February 29, 2004 | Year ended
February 28, 2003 |
Increase (Decrease) in Net Assets | | |
Operations | | |
Net investment income (loss) | $ 504,056 | $ 676,621 |
Net realized gain (loss) | 1,532,340 | (7,877,487) |
Change in net unrealized appreciation (depreciation) | 22,627,041 | (16,044,426) |
Net increase (decrease) in net assets resulting from operations | 24,663,437 | (23,245,292) |
Distributions to shareholders from net investment income | (521,536) | (816,384) |
Distributions to shareholders from net realized gain | - | (2,364,916) |
Total distributions | (521,536) | (3,181,300) |
Share transactions
Net proceeds from sales of shares | 24,022,618 | 74,577,088 |
Reinvestment of distributions | 489,419 | 3,008,704 |
Cost of shares redeemed | (32,354,647) | (83,113,282) |
Net increase (decrease) in net assets resulting from share transactions | (7,842,610) | (5,527,490) |
Redemption fees | 13,977 | 97,097 |
Total increase (decrease) in net assets | 16,313,268 | (31,856,985) |
Net Assets | | |
Beginning of period | 88,123,086 | 119,980,071 |
End of period (including undistributed net investment income of $0 and $44,341, respectively) | $ 104,436,354 | $ 88,123,086 |
Other Information Shares | | |
Sold | 567,727 | 1,721,821 |
Issued in reinvestment of distributions | 11,371 | 69,302 |
Redeemed | (800,611) | (2,009,194) |
Net increase (decrease) | (221,513) | (218,071) |
Financial Highlights
Years ended February 28, | 2004 F | 2003 | 2002 | 2001 | 2000 F |
Selected Per-Share Data | | | | | |
Net asset value, beginning of period | $ 35.71 | $ 44.68 | $ 46.01 | $ 31.88 | $ 46.92 |
Income from Investment Operations | | | | | |
Net investment income (loss) C | .22 | .25 | .34 | .44 | .42D |
Net realized and unrealized gain (loss) | 10.80 | (8.06) | 2.79 | 13.96 | (13.07) |
Total from investment operations | 11.02 | (7.81) | 3.13 | 14.40 | (12.65) |
Distributions from net investment income | (.24) | (.32) | (.21) | (.36) | (.42) |
Distributions from net realized gain | - | (.88) | (4.28) | - | (1.79) |
Distributions in excess of net realized gain | - | - | - | - | (.21) |
Total distributions | (.24) | (1.20) | (4.49) | (.36) | (2.42) |
Redemption fees added to paid in capitalC | .01 | .04 | .03 | .09 | .03 |
Net asset value, end of period | $ 46.50 | $ 35.71 | $ 44.68 | $ 46.01 | $ 31.88 |
Total ReturnA,B | 30.94% | (17.85)% | 7.76% | 45.47% | (27.86)% |
Ratios to Average Net AssetsE | | | | | |
Expenses before expense reductions | 1.27% | 1.25% | 1.24% | 1.28% | 1.31% |
Expenses net of voluntary waivers, if any | 1.27% | 1.25% | 1.24% | 1.28% | 1.31% |
Expenses net of all reductions | 1.25% | 1.17% | 1.14% | 1.24% | 1.29% |
Net investment income (loss) | .55% | .59% | .79% | 1.07% | 1.00% |
Supplemental Data | | | | | |
Net assets, end of period (000 omitted) | $ 104,436 | $ 88,123 | $ 119,980 | $ 119,769 | $ 78,288 |
Portfolio turnover rate | 62% | 225% | 315% | 151% | 38% |
ATotal returns would have been lower had certain expenses not been reduced during the periods shown. BTotal returns do not include the effect of the former sales charges. CCalculated based on average shares outstanding during the period. DInvestment income per share reflects a special dividend which amounted to $.28 per share. EExpense ratios reflect operating expenses of the fund. Expenses before reductions do not reflect amounts reimbursed by the investment adviser or reductions from brokerage service arrangements or other expense offset arrangements and do not represent the amount paid by the fund during periods when reimbursements or reductions occur. Expenses net of any voluntary waivers reflect expenses after reimbursement by the investment adviser but prior to reductions from brokerage service arrangements or other expense offset arrangements. Expenses net of all reductions represent the net expenses paid by the fund FFor the year ended February 29.
See accompanying notes which are an integral part of the financial statements.
Consumer Sector
Leisure Portfolio
Performance
Average annual total return reflects the change in the value of an investment, assuming reinvestment of the fund's dividend income and capital gains (the profits earned upon the sale of securities that have grown in value) and assuming a constant rate of performance each year. The $10,000 table and the fund's returns do not reflect the deduction of taxes that a shareholder would pay on fund distributions or the redemption of fund shares. During periods of reimbursement by Fidelity a fund's total returns will be greater than it would be had the reimbursement not occurred. How a fund did yesterday is no guarantee of how it will do tomorrow.
Average Annual Total Returns
Periods ended February 29, 2004 | Past 1
year | Past 5
years | Past 10
years |
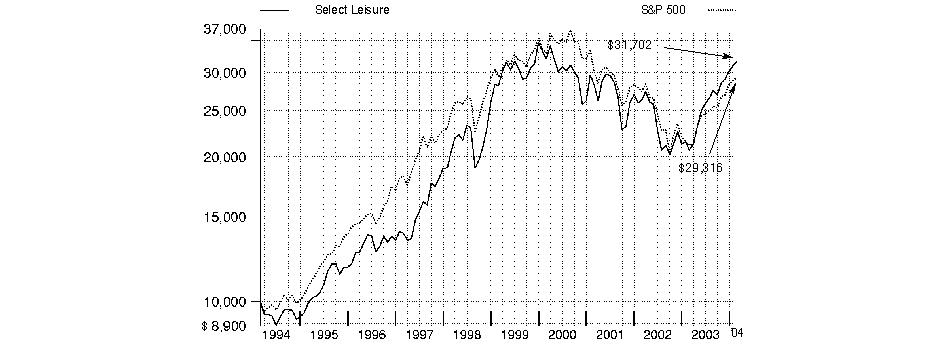
Select Leisure | 53.09% | 2.39% | 12.23% |
$10,000 Over 10 Years
Let's say hypothetically that $10,000 was invested in Fidelity Select Leisure Portfolio on February 28, 1994. The chart shows how the value of your investment would have grown, and also shows how the S&P 500 Index did over the same period.
Annual Report
Leisure Portfolio
Management's Discussion of Fund Performance
Comments from Joshua Spencer, Portfolio Manager of Fidelity® Select Leisure Portfolio
From March 2003 through the end of February 2004, domestic stocks recovered dramatically from their prior three-year swoon, driven largely by a broad-based economic and corporate profit recovery. Most major equity benchmarks gained 35% or more during the 12-month period, led by the Russell 2000® Index - a measure of the overall small-cap universe - which advanced 64.41%. As investors grew more confident about the economy's vitality, small-cap stocks were bid up, particularly those with no current earnings. In comparison, the Wilshire 5000® Total Market Index, commonly used as a proxy for the entire U.S. stock market's performance, rose 42.47%. Every sector of the market posted a double-digit advance, with economically sensitive issues - especially technology stocks - leading the way. The tech-heavy NASDAQ Composite® Index returned 52.47% during the past year, despite a negative return in February as investors turned to the more value-oriented segments of the market. The broader Standard & Poor's 500SM Index climbed 38.52% during the year, slightly outperforming the 37.07% increase for the blue-chip Dow Jones Industrial AverageSM.
For the 12-month period that ended on February 29, 2004, the fund posted a total return of 53.09%, outperforming both the Goldman Sachs® Consumer Industries Index, which returned 37.04%, and the S&P 500®. This strong performance - both in absolute terms and relative to the indexes - came as a result of a secular rebound from the chilling effects of the September 11 terrorist attacks. As leisure activities began to pick up pace, several companies in the casino and gaming, resort, air and cruise lines, and hotel and restaurant industries saw their earnings and profits begin to soar. Favorable stock picking - particularly in such names as JetBlue, McDonald's and video game maker Electronic Arts - also helped the fund outperform. Stocks that detracted from overall performance included InterActiveCorp, the Internet travel company, whose generally high stock valuation suffered as a result of competition from other online travel concerns. Media companies Viacom and Fox Entertainment also saw their stock prices fall, due to weaker-than-expected growth in corporate advertising revenues. I sold JetBlue and Electronic Arts prior to the end of the period.
The views expressed in this statement reflect those of the portfolio manager only through the end of the period of the report as stated on the cover and do not necessarily represent the views of Fidelity or any other person in the Fidelity organization. Any such views are subject to change at any time based upon market or other conditions and Fidelity disclaims any responsibility to update such views. These views may not be relied on as investment advice and, because investment decisions for a Fidelity fund are based on numerous factors, may not be relied on as an indication of trading intent on behalf of any Fidelity fund.
Annual Report
Leisure Portfolio
Investment Summary
Top Ten Stocks as of February 29, 2004 |
| % of fund's
net assets |
McDonald's Corp. | 5.9 |
Yahoo!, Inc. | 5.6 |
Viacom, Inc. Class B (non-vtg.) | 5.0 |
Liberty Media Corp. Class A | 4.1 |
Clear Channel Communications, Inc. | 3.7 |
Carnival Corp. unit | 3.6 |
News Corp. Ltd. ADR | 3.5 |
Harley-Davidson, Inc. | 3.5 |
Cendant Corp. | 3.3 |
EchoStar Communications Corp. Class A | 3.2 |
| 41.4 |
Top Industries as of February 29, 2004 |
% of fund's net assets |
| Media | 39.7% | |
| Hotels, Restaurants & Leisure | 34.3% | |
| Internet Software & Services | 7.9% | |
| Automobiles | 5.4% | |
| Leisure Equipment & Products | 4.6% | |
| All Others* | 8.1% | |

* Includes short-term investments and net other assets. |
Annual Report
Leisure Portfolio
Investments February 29, 2004
Showing Percentage of Net Assets
Common Stocks - 99.2% |
| Shares | | Value (Note 1) |
AUTOMOBILES - 5.4% |
Harley-Davidson, Inc. | 134,600 | | $ 7,149,952 |
Monaco Coach Corp. (a) | 71,500 | | 2,037,750 |
Thor Industries, Inc. | 65,000 | | 1,929,850 |
TOTAL AUTOMOBILES | | 11,117,552 |
COMMERCIAL SERVICES & SUPPLIES - 3.3% |
Cendant Corp. | 296,600 | | 6,732,820 |
COMMUNICATIONS EQUIPMENT - 0.5% |
Scientific-Atlanta, Inc. | 27,400 | | 906,940 |
HOTELS, RESTAURANTS & LEISURE - 34.3% |
Brinker International, Inc. (a) | 137,400 | | 5,170,362 |
Buffalo Wild Wings, Inc. | 6,100 | | 152,500 |
Carnival Corp. unit | 165,400 | | 7,338,798 |
GTECH Holdings Corp. | 24,500 | | 1,438,885 |
Harrah's Entertainment, Inc. | 12,400 | | 644,180 |
Hilton Hotels Corp. | 180,900 | | 2,899,827 |
International Game Technology | 51,100 | | 2,005,164 |
Kerzner International Ltd. (a) | 54,200 | | 2,086,700 |
Krispy Kreme Doughnuts, Inc. (a) | 43,200 | | 1,661,472 |
Mandalay Resort Group | 71,700 | | 3,685,380 |
Marriott International, Inc. Class A | 45,300 | | 2,021,739 |
McDonald's Corp. | 425,900 | | 12,052,971 |
MGM MIRAGE (a) | 50,000 | | 2,177,500 |
Outback Steakhouse, Inc. | 70,800 | | 3,426,012 |
Penn National Gaming, Inc. (a) | 33,600 | | 882,336 |
Royal Caribbean Cruises Ltd. | 137,500 | | 6,084,375 |
Six Flags, Inc. (a) | 213,500 | | 1,582,035 |
Sonic Corp. (a) | 37,500 | | 1,271,625 |
Starwood Hotels & Resorts Worldwide, Inc. unit (a) | 79,100 | | 3,085,691 |
Station Casinos, Inc. | 28,300 | | 1,064,080 |
Wendy's International, Inc. | 130,300 | | 5,299,301 |
Wyndham International, Inc. Class A (a) | 846,500 | | 948,080 |
Yum! Brands, Inc. (a) | 86,300 | | 3,195,689 |
TOTAL HOTELS, RESTAURANTS & LEISURE | | 70,174,702 |
HOUSEHOLD DURABLES - 0.9% |
Toll Brothers, Inc. (a) | 43,000 | | 1,887,700 |
INTERNET & CATALOG RETAIL - 0.7% |
Amazon.com, Inc. (a) | 17,400 | | 750,810 |
Overstock.com, Inc. (a) | 22,500 | | 659,250 |
TOTAL INTERNET & CATALOG RETAIL | | 1,410,060 |
|
| Shares | | Value (Note 1) |
INTERNET SOFTWARE & SERVICES - 7.9% |
Netease.com, Inc. sponsored ADR (a) | 12,500 | | $ 662,875 |
Sina Corp. (a) | 41,400 | | 1,829,093 |
Sohu.com, Inc. (a) | 76,300 | | 2,144,030 |
Yahoo!, Inc. (a) | 258,252 | | 11,466,389 |
TOTAL INTERNET SOFTWARE & SERVICES | | 16,102,387 |
LEISURE EQUIPMENT & PRODUCTS - 4.6% |
Brunswick Corp. | 138,600 | | 5,455,296 |
MarineMax, Inc. (a) | 22,300 | | 592,511 |
Polaris Industries, Inc. | 38,500 | | 3,260,565 |
TOTAL LEISURE EQUIPMENT & PRODUCTS | | 9,308,372 |
MEDIA - 39.7% |
Belo Corp. Series A | 16,000 | | 446,400 |
Cablevision Systems Corp. - NY Group Class A (a) | 114,100 | | 2,907,268 |
Citadel Broadcasting Corp. | 107,000 | | 2,000,900 |
Clear Channel Communications, Inc. | 177,241 | | 7,628,453 |
Cumulus Media, Inc. Class A (a) | 98,700 | | 1,964,130 |
E.W. Scripps Co. Class A | 12,500 | | 1,217,000 |
EchoStar Communications Corp. Class A (a) | 182,100 | | 6,577,452 |
Fox Entertainment Group, Inc. Class A (a) | 187,800 | | 5,449,956 |
Gannett Co., Inc. | 70,700 | | 6,099,289 |
Hughes Electronics Corp. (a) | 1,201 | | 20,825 |
Lamar Advertising Co. Class A (a) | 2,500 | | 99,250 |
Liberty Media Corp. Class A (a) | 734,068 | | 8,368,375 |
News Corp. Ltd.: | | | |
ADR | 191,400 | | 7,167,930 |
sponsored ADR | 27,448 | | 898,373 |
Omnicom Group, Inc. | 66,100 | | 5,406,980 |
Radio One, Inc. Class D (non-vtg.) (a) | 109,900 | | 2,002,378 |
Tribune Co. | 104,800 | | 5,233,712 |
Univision Communications, Inc. Class A (a) | 141,300 | | 5,034,519 |
Viacom, Inc. Class B (non-vtg.) | 268,196 | | 10,314,818 |
Washington Post Co. Class B | 1,500 | | 1,343,550 |
Westwood One, Inc. (a) | 32,900 | | 1,016,610 |
TOTAL MEDIA | | 81,198,168 |
SPECIALTY RETAIL - 1.9% |
Foot Locker, Inc. | 145,200 | | 3,804,240 |
Steiner Leisure Ltd. (a) | 100 | | 1,810 |
TOTAL SPECIALTY RETAIL | | 3,806,050 |
TOTAL COMMON STOCKS (Cost $175,753,748) | 202,644,751 |
Money Market Funds - 9.3% |
| Shares | | Value (Note 1) |
Fidelity Cash Central Fund,
1.08% (b) | 3,271,966 | | $ 3,271,966 |
Fidelity Securities Lending Cash
Central Fund, 1.08% (b) | 15,834,175 | | 15,834,175 |
TOTAL MONEY MARKET FUNDS (Cost $19,106,141) | 19,106,141 |
TOTAL INVESTMENT PORTFOLIO - 108.5% (Cost $194,859,889) | 221,750,892 |
NET OTHER ASSETS - (8.5)% | (17,397,372) |
NET ASSETS - 100% | $ 204,353,520 |
Legend |
(a) Non-income producing |
(b) Affiliated fund that is available only to investment companies and other accounts managed by Fidelity Investments. The rate quoted is the annualized seven-day yield of the fund at period end. A complete listing of the fund's holdings as of its most recent fiscal year end is available upon request. |
Other Information |
Purchases and sales of securities, other than short-term securities, aggregated $272,008,858 and $246,984,452, respectively. |
The fund placed a portion of its portfolio transactions with brokerage firms which are affiliates of the investment adviser. The commissions paid to these affiliated firms were $18,043 for the period. |
Distribution of investments by country of issue, as a percentage of total net assets, is as follows: |
United States of America | 87.3% |
Australia | 3.9% |
Panama | 3.6% |
Liberia | 3.0% |
Bahamas (Nassau) | 1.0% |
Others (individually less than 1%) | 1.2% |
| 100.0% |
See accompanying notes which are an integral part of the financial statements.
Consumer Sector
Leisure Portfolio
Financial Statements
Statement of Assets and Liabilities
| February 29, 2004 |
| | |
Assets | | |
Investment in securities, at value (including securities loaned of $15,526,049) (cost $194,859,889) - See accompanying schedule | | $ 221,750,892 |
Receivable for investments sold | | 3,818,905 |
Receivable for fund shares sold | | 277,200 |
Dividends receivable | | 107,874 |
Interest receivable | | 2,845 |
Prepaid expenses | | 801 |
Other affiliated receivables | | 534 |
Other receivables | | 52,236 |
Total assets | | 226,011,287 |
| | |
Liabilities | | |
Payable for investments purchased | $ 5,342,949 | |
Payable for fund shares redeemed | 293,189 | |
Accrued management fee | 96,795 | |
Other affiliated payables | 63,643 | |
Other payables and accrued expenses | 27,016 | |
Collateral on securities loaned, at value | 15,834,175 | |
Total liabilities | | 21,657,767 |
| | |
Net Assets | | $ 204,353,520 |
Net Assets consist of: | | |
Paid in capital | | $ 168,930,801 |
Accumulated undistributed net realized gain (loss) on investments and foreign currency transactions | | 8,531,716 |
Net unrealized appreciation (depreciation) on investments | | 26,891,003 |
Net Assets, for 2,746,551 shares outstanding | | $ 204,353,520 |
Net Asset Value, offering price and redemption price per share ($204,353,520 ÷ 2,746,551 shares) | | $ 74.40 |
Statement of Operations
| Year ended February 29, 2004 |
| | |
Investment Income | | |
Dividends | | $ 966,374 |
Interest | | 140,996 |
Security lending | | 57,356 |
Total income | | 1,164,726 |
| | |
Expenses | | |
Management fee | $ 946,814 | |
Transfer agent fees | 749,615 | |
Accounting and security lending fees | 104,599 | |
Non-interested trustees' compensation | 828 | |
Custodian fees and expenses | 11,565 | |
Registration fees | 18,068 | |
Audit | 44,411 | |
Legal | 762 | |
Miscellaneous | 3,404 | |
Total expenses before reductions | 1,880,066 | |
Expense reductions | (100,824) | 1,779,242 |
Net investment income (loss) | | (614,516) |
Realized and Unrealized Gain (Loss) Net realized gain (loss) on: | | |
Investment securities | 41,415,857 | |
Foreign currency transactions | 1,666 | |
Total net realized gain (loss) | | 41,417,523 |
Change in net unrealized appreciation (depreciation) on investment securities | | 24,508,475 |
Net gain (loss) | | 65,925,998 |
Net increase (decrease) in net assets resulting from operations | | $ 65,311,482 |
Other Information | | |
Sales charges paid to FDC | | $ 94,557 |
Deferred sales charges withheld by FDC | | $ 9,187 |
Exchange fees withheld by
FSC | | $ 3,015 |
See accompanying notes which are an integral part of the financial statements.
Annual Report
Leisure Portfolio
Financial Statements - continued
Statement of Changes in Net Assets
| Year ended
February 29, 2004 | Year ended
February 28, 2003 |
Increase (Decrease) in Net Assets | | |
Operations | | |
Net investment income (loss) | $ (614,516) | $ (876,053) |
Net realized gain (loss) | 41,417,523 | (8,789,717) |
Change in net unrealized appreciation (depreciation) | 24,508,475 | (24,755,586) |
Net increase (decrease) in net assets resulting from operations | 65,311,482 | (34,421,356) |
Share transactions
Net proceeds from sales of shares | 79,019,245 | 35,521,313 |
Cost of shares redeemed | (52,161,777) | (100,057,850) |
Net increase (decrease) in net assets resulting from share transactions | 26,857,468 | (64,536,537) |
Redemption fees | 37,107 | 50,793 |
Total increase (decrease) in net assets | 92,206,057 | (98,907,100) |
| | |
Net Assets | | |
Beginning of period | 112,147,463 | 211,054,563 |
End of period | $ 204,353,520 | $ 112,147,463 |
Other Information Shares | | |
Sold | 1,278,672 | 646,188 |
Redeemed | (839,593) | (1,766,686) |
Net increase (decrease) | 439,079 | (1,120,498) |
Financial Highlights
Years ended February 28, | 2004 F | 2003 | 2002 | 2001 | 2000 F |
Selected Per-Share Data | | | | | |
Net asset value, beginning of period | $ 48.60 | $ 61.57 | $ 66.22 | $ 84.73 | $ 81.44 |
Income from Investment Operations | | | | | |
Net investment income (loss) C | (.24) | (.33) | (.29) | (.11) | (.28) D |
Net realized and unrealized gain (loss) | 26.03 | (12.66) | (4.37) | (8.52) | 11.58 |
Total from investment operations | 25.79 | (12.99) | (4.66) | (8.63) | 11.30 |
Distributions from net realized gain | - | - | - | (9.92) | (8.15) |
Redemption fees added to paid in capital C | .01 | .02 | .01 | .04 | .14 |
Net asset value, end of period | $ 74.40 | $ 48.60 | $ 61.57 | $ 66.22 | $ 84.73 |
Total Return A,B | 53.09% | (21.07)% | (7.02)% | (12.04)% | 13.89% |
Ratios to Average Net Assets E | | | | | |
Expenses before expense reductions | 1.15% | 1.27% | 1.12% | 1.12% | 1.15% |
Expenses net of voluntary waivers, if any | 1.15% | 1.27% | 1.12% | 1.12% | 1.15% |
Expenses net of all reductions | 1.09% | 1.19% | 1.09% | 1.12% | 1.12% |
Net investment income (loss) | (.38)% | (.62)% | (.46)% | (.15)% | (.32)% |
Supplemental Data | | | | | |
Net assets, end of period (000 omitted) | $ 204,354 | $ 112,147 | $ 211,055 | $ 269,848 | $ 314,348 |
Portfolio turnover rate | 156% | 124% | 60% | 71% | 120% |
ATotal returns would have been lower had certain expenses not been reduced during the periods shown. BTotal returns do not include the effect of the former sales charges. CCalculated based on average shares outstanding during the period. DInvestment income per share reflects a special dividend which amounted to $.04 per share. EExpense ratios reflect operating expenses of the fund. Expenses before reductions do not reflect amounts reimbursed by the investment adviser or reductions from brokerage service arrangements or other expense offset arrangements and do not represent the amount paid by the fund during periods when reimbursements or reductions occur. Expenses net of any voluntary waivers reflect expenses after reimbursement by the investment adviser but prior to reductions from brokerage service arrangements or other expense offset arrangements. Expenses net of all reductions represent the net expenses paid by the fund. FFor the year ended February 29.
See accompanying notes which are an integral part of the financial statements.
Consumer Sector
Multimedia Portfolio
Performance
Average annual total return reflects the change in the value of an investment, assuming reinvestment of the fund's dividend income and capital gains (the profits earned upon the sale of securities that have grown in value) and assuming a constant rate of performance each year. The $10,000 table and the fund's returns do not reflect the deduction of taxes that a shareholder would pay on fund distributions or the redemption of fund shares. During periods of reimbursement by Fidelity a fund's total returns will be greater than it would be had the reimbursement not occurred. How a fund did yesterday is no guarantee of how it will do tomorrow.
Average Annual Total Returns
Periods ended February 29, 2004 | Past 1
year | Past 5
years | Past 10
years |
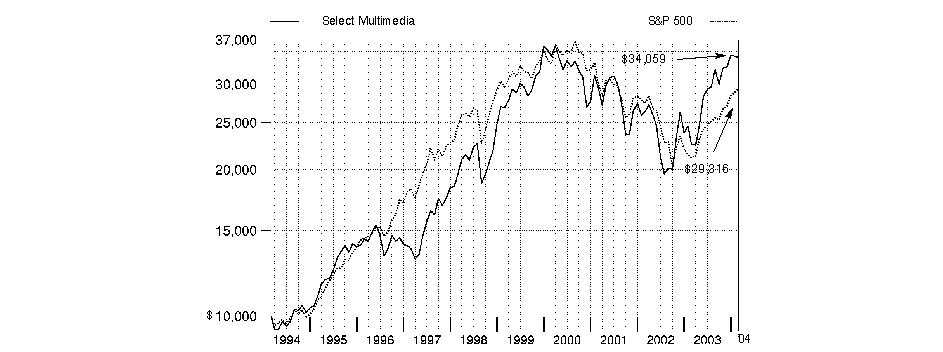
Select Multimedia | 50.99% | 4.89% | 13.04% |
$10,000 Over 10 Years
Let's say hypothetically that $10,000 was invested in Fidelity Select Multimedia Portfolio on February 28, 1994. The chart shows how the value of your investment would have grown, and also shows how the S&P 500 Index did over the same period.
Annual Report
Multimedia Portfolio
Management's Discussion of Fund Performance
Comments from Matt Friedman, Portfolio Manager of Fidelity® Select Multimedia Portfolio
From March 2003 through the end of February 2004, domestic stocks recovered dramatically from their prior three-year swoon, driven largely by a broad-based economic and corporate profit recovery. Most major equity benchmarks gained 35% or more during the 12-month period, led by the Russell 2000® Index - a measure of the overall small-cap universe - which advanced 64.41%. As investors grew more confident about the economy's vitality, small-cap stocks were bid up, particularly those with no current earnings. In comparison, the Wilshire 5000® Total Market Index, commonly used as a proxy for the entire U.S. stock market's performance, rose 42.47%. Every sector of the market posted a double-digit advance, with economically sensitive issues - especially technology stocks - leading the way. The tech-heavy NASDAQ Composite® Index returned 52.47% during the past year, despite a negative return in February as investors turned to the more value-oriented segments of the market. The broader Standard & Poor's 500SM Index climbed 38.52% during the year, slightly outperforming the 37.07% increase for the blue-chip Dow Jones Industrial AverageSM.
For the 12 months that ended February 29, 2004, the fund returned 50.99%, outperforming the S&P 500® as well as the Goldman Sachs® Consumer Industries Index, which gained 37.04%. The fund was aided by investments in several strong performing media-related segments not represented in its sector benchmark, including Internet portals, alternative carriers and international media companies. For example, overweighted positions in two Internet-related advertising vehicles, Yahoo! and Overture, generated strong gains. Yahoo! continued to dominate online advertising, through traditional banner and pop-up ads, as well as paid search advertising via its acquisition of Overture Services during the period. AOL Time Warner benefited from resolving its balance sheet issues and stabilizing its dial-up business. Broadband provider Covad helped returns in response to positive regulatory rulings during the year. On the other hand, investments in Viacom and Clear Channel Communications were disappointing, as both companies suffered from weaker-than-expected radio advertising revenue. Fox Entertainment fell short when investors became concerned about lackluster ratings for several new shows.
The views expressed in this statement reflect those of the portfolio manager only through the end of the period of the report as stated on the cover and do not necessarily represent the views of Fidelity or any other person in the Fidelity organization. Any such views are subject to change at any time based upon market or other conditions and Fidelity disclaims any responsibility to update such views. These views may not be relied on as investment advice and, because investment decisions for a Fidelity fund are based on numerous factors, may not be relied on as an indication of trading intent on behalf of any Fidelity fund.
Annual Report
Multimedia Portfolio
Investment Summary
Top Ten Stocks as of February 29, 2004 |
| % of fund's
net assets |
Viacom, Inc. Class B (non-vtg.) | 8.7 |
Yahoo!, Inc. | 7.8 |
Fox Entertainment Group, Inc. Class A | 6.5 |
EchoStar Communications Corp. Class A | 5.4 |
Liberty Media Corp. Class A | 5.2 |
Walt Disney Co. | 5.1 |
InterActiveCorp | 5.0 |
Omnicom Group, Inc. | 5.0 |
Cablevision Systems Corp. - NY Group Class A | 5.0 |
Clear Channel Communications, Inc. | 4.9 |
| 58.6 |
Top Industries as of February 29, 2004 |
% of fund's net assets |
| Media | 79.2% | |
| Internet Software & Services | 9.5% | |
| Internet & Catalog Retail | 5.0% | |
| Wireless Telecommunication Services | 1.9% | |
| Communications Equipment | 1.0% | |
| All Others * | 3.4% | |

* Includes short-term investments and net other assets. |
Annual Report
Multimedia Portfolio
Investments February 29, 2004
Showing Percentage of Net Assets
Common Stocks - 98.8% |
| Shares | | Value (Note 1) |
COMMERCIAL SERVICES & SUPPLIES - 0.8% |
Monster Worldwide, Inc. (a) | 28,900 | | $ 635,800 |
R.R. Donnelley & Sons Co. | 23,200 | | 736,832 |
TOTAL COMMERCIAL SERVICES & SUPPLIES | | 1,372,632 |
COMMUNICATIONS EQUIPMENT - 1.0% |
Scientific-Atlanta, Inc. | 48,300 | | 1,598,730 |
COMPUTERS & PERIPHERALS - 0.5% |
Concurrent Computer Corp. (a) | 190,000 | | 773,300 |
CONSTRUCTION & ENGINEERING - 0.8% |
Dycom Industries, Inc. (a) | 49,300 | | 1,277,856 |
INTERNET & CATALOG RETAIL - 5.0% |
InterActiveCorp (a) | 253,000 | | 8,240,210 |
Netflix, Inc. | 600 | | 20,640 |
TOTAL INTERNET & CATALOG RETAIL | | 8,260,850 |
INTERNET SOFTWARE & SERVICES - 9.5% |
United Online, Inc. (a) | 91,050 | | 1,567,881 |
Yahoo Japan Corp. (a) | 66 | | 1,217,455 |
Yahoo!, Inc. (a) | 287,600 | | 12,769,440 |
TOTAL INTERNET SOFTWARE & SERVICES | | 15,554,776 |
IT SERVICES - 0.0% |
infoUSA, Inc. (a) | 5,500 | | 56,100 |
MEDIA - 79.2% |
Belo Corp. Series A | 44,300 | | 1,235,970 |
British Sky Broadcasting Group PLC (BSkyB) sponsored ADR | 43,200 | | 2,340,144 |
Cablevision Systems Corp. - NY Group Class A (a) | 322,755 | | 8,223,797 |
Catalina Marketing Corp. (a) | 23,700 | | 414,039 |
Central European Media Enterprises Ltd. Class A (a) | 21,000 | | 410,970 |
Cheil Communications, Inc. | 3,000 | | 458,209 |
Cinram International, Inc. | 37,800 | | 765,652 |
Clear Channel Communications, Inc. | 188,026 | | 8,092,639 |
Dow Jones & Co., Inc. | 26,000 | | 1,266,200 |
E.W. Scripps Co. Class A | 21,100 | | 2,054,296 |
EchoStar Communications Corp. Class A (a) | 243,400 | | 8,791,608 |
EMI Group PLC | 4,200 | | 19,842 |
Emmis Communications Corp. Class A (a) | 600 | | 15,180 |
Entravision Communications Corp. Class A (a) | 200 | | 1,920 |
|
| Shares | | Value (Note 1) |
Fox Entertainment Group, Inc. Class A (a) | 369,300 | | $ 10,717,086 |
Gannett Co., Inc. | 39,200 | | 3,381,784 |
Gemstar-TV Guide International, Inc. (a) | 56,900 | | 411,956 |
Hughes Electronics Corp. (a) | 189,934 | | 3,293,456 |
ITV PLC (a) | 178,600 | | 461,910 |
JC Decaux SA (a) | 41,800 | | 841,899 |
Lamar Advertising Co. Class A (a) | 189,500 | | 7,523,150 |
Liberty Media Corp. Class A (a) | 742,704 | | 8,466,826 |
Lions Gate Entertainment Corp. (a) | 3,400 | | 21,462 |
McGraw-Hill Companies, Inc. | 23,500 | | 1,836,995 |
Meredith Corp. | 200 | | 10,060 |
News Corp. Ltd.: | | | |
ADR | 69,800 | | 2,614,010 |
sponsored ADR | 124,711 | | 4,081,791 |
NTL, Inc. (a) | 510 | | 34,966 |
Omnicom Group, Inc. | 100,600 | | 8,229,080 |
Pixar (a) | 20,900 | | 1,373,966 |
Playboy Enterprises, Inc. Class B (non-vtg.) (a) | 280,660 | | 4,296,905 |
Point.360 (a) | 19,400 | | 84,390 |
R.H. Donnelley Corp. (a) | 15,800 | | 684,930 |
Radio One, Inc. Class D (non-vtg.) (a) | 26,400 | | 481,008 |
SBS Broadcasting SA (a) | 32,900 | | 1,087,345 |
Sirius Satellite Radio, Inc. (a) | 39,600 | | 116,424 |
Sogecable SA (a) | 38,600 | | 1,796,039 |
Spanish Broadcasting System, Inc. Class A (a) | 7,400 | | 82,880 |
Time Warner, Inc. (a) | 293,725 | | 5,066,756 |
TiVo, Inc. (a) | 35,900 | | 383,771 |
Tribune Co. | 24,200 | | 1,208,548 |
Univision Communications, Inc. Class A (a) | 111,100 | | 3,958,493 |
Viacom, Inc. Class B (non-vtg.) | 372,096 | | 14,310,813 |
Walt Disney Co. | 313,300 | | 8,311,849 |
Washington Post Co. Class B | 300 | | 268,710 |
World Wrestling Entertainment, Inc. Class A | 6,400 | | 86,720 |
WPP Group PLC sponsored ADR | 1,200 | | 67,548 |
TOTAL MEDIA | | 129,683,992 |
SOFTWARE - 0.1% |
Electronic Arts, Inc. (a) | 400 | | 18,864 |
Macrovision Corp. (a) | 700 | | 13,664 |
NDS Group PLC sponsored ADR (a) | 5,300 | | 155,343 |
OpenTV Corp. Class A (a) | 5,200 | | 15,028 |
TOTAL SOFTWARE | | 202,899 |
WIRELESS TELECOMMUNICATION SERVICES - 1.9% |
SpectraSite, Inc. (a) | 84,800 | | 3,103,680 |
TOTAL COMMON STOCKS (Cost $139,823,843) | 161,884,815 |
Money Market Funds - 11.0% |
| Shares | | Value (Note 1) |
Fidelity Securities Lending Cash Central Fund, 1.08% (b)
(Cost $18,008,875) | 18,008,875 | | $ 18,008,875 |
TOTAL INVESTMENT PORTFOLIO - 109.8% (Cost $157,832,718) | | 179,893,690 |
NET OTHER ASSETS - (9.8)% | | (16,068,053) |
NET ASSETS - 100% | $ 163,825,637 |
Legend |
(a) Non-income producing |
(b) Affiliated fund that is available only to investment companies and other accounts managed by Fidelity Investments. The rate quoted is the annualized seven-day yield of the fund at period end. A complete listing of the fund's holdings as of its most recent fiscal year end is available upon request. |
Other Information |
Purchases and sales of securities, other than short-term securities, aggregated $312,552,652 and $308,319,849, respectively. |
The fund placed a portion of its portfolio transactions with brokerage firms which are affiliates of the investment adviser. The commissions paid to these affiliated firms were $64,459 for the period. |
Income Tax Information |
The fund hereby designates approximately $1,425,000 as a capital gain dividend for the purpose of the dividend paid deduction. |
See accompanying notes which are an integral part of the financial statements.
Consumer Sector
Multimedia Portfolio
Financial Statements
Statement of Assets and Liabilities
| February 29, 2004 |
| | |
Assets | | |
Investment in securities, at value (including securities loaned of $17,954,178) (cost $157,832,718) - See accompanying schedule | | $ 179,893,690 |
Receivable for investments sold | | 4,955,372 |
Receivable for fund shares sold | | 67,510 |
Dividends receivable | | 60,079 |
Interest receivable | | 447 |
Prepaid expenses | | 796 |
Other affiliated receivables | | 383 |
Other receivables | | 32,797 |
Total assets | | 185,011,074 |
| | |
Liabilities | | |
Payable to custodian bank | $ 298,614 | |
Payable for investments purchased | 1,010,958 | |
Payable for fund shares redeemed | 1,702,707 | |
Accrued management fee | 81,605 | |
Other affiliated payables | 55,041 | |
Other payables and accrued expenses | 27,637 | |
Collateral on securities loaned, at value | 18,008,875 | |
Total liabilities | | 21,185,437 |
| | |
Net Assets | | $ 163,825,637 |
Net Assets consist of: | | |
Paid in capital | | $ 135,384,643 |
Accumulated undistributed net realized gain (loss) on investments and foreign currency transactions | | 6,379,865 |
Net unrealized appreciation (depreciation) on investments and assets and liabilities in foreign currencies | | 22,061,129 |
Net Assets, for 3,654,126 shares outstanding | | $ 163,825,637 |
Net Asset Value, offering price and redemption price per share ($163,825,637 ÷ 3,654,126 shares) | | $ 44.83 |
Statement of Operations
| Year ended February 29, 2004 |
| | |
Investment Income | | |
Dividends | | $ 386,978 |
Interest | | 108,947 |
Security lending | | 37,705 |
Total income | | 533,630 |
| | |
Expenses | | |
Management fee | $ 897,880 | |
Transfer agent fees | 697,559 | |
Accounting and security lending fees | 99,129 | |
Non-interested trustees' compensation | 809 | |
Custodian fees and expenses | 30,423 | |
Registration fees | 31,289 | |
Audit | 44,388 | |
Legal | 919 | |
Miscellaneous | 2,468 | |
Total expenses before reductions | 1,804,864 | |
Expense reductions | (116,793) | 1,688,071 |
Net investment income (loss) | | (1,154,441) |
Realized and Unrealized Gain (Loss) Net realized gain (loss) on: | | |
Investment securities | 35,916,718 | |
Foreign currency transactions | 9,721 | |
Total net realized gain (loss) | | 35,926,439 |
Change in net unrealized appreciation (depreciation) on: Investment securities | 21,257,647 | |
Assets and liabilities in foreign currencies | 157 | |
Total change in net unrealized appreciation (depreciation) | | 21,257,804 |
Net gain (loss) | | 57,184,243 |
Net increase (decrease) in net assets resulting from operations | | $ 56,029,802 |
Other Information | | |
Sales charges paid to FDC | | $ 222,797 |
Deferred sales charges withheld by FDC | | $ 1,694 |
Exchange fees withheld by
FSC | | $ 3,675 |
See accompanying notes which are an integral part of the financial statements.
Annual Report
Multimedia Portfolio
Financial Statements - continued
Statement of Changes in Net Assets
| Year ended
February 29,
2004 | Year ended
February 28,
2003 |
Increase (Decrease) in Net Assets | | |
Operations | | |
Net investment income (loss) | $ (1,154,441) | $ (651,154) |
Net realized gain (loss) | 35,926,439 | 3,092,917 |
Change in net unrealized appreciation (depreciation) | 21,257,804 | (17,822,917) |
Net increase (decrease) in net assets resulting from operations | 56,029,802 | (15,381,154) |
Distributions to shareholders from net realized gain | (12,358,836) | - |
Share transactions
Net proceeds from sales of shares | 137,479,179 | 138,813,149 |
Reinvestment of distributions | 11,930,736 | - |
Cost of shares redeemed | (129,433,118) | (163,593,387) |
Net increase (decrease) in net assets resulting from share transactions | 19,976,797 | (24,780,238) |
Redemption fees | 66,876 | 202,024 |
Total increase (decrease) in net assets | 63,714,639 | (39,959,368) |
| | |
Net Assets | | |
Beginning of period | 100,110,998 | 140,070,366 |
End of period (including undistributed net investment income of $0 and undistributed net investment
income of $23,586, respectively) | $ 163,825,637 | $ 100,110,998 |
Other Information Shares | | |
Sold | 3,290,473 | 4,158,091 |
Issued in reinvestment of distributions | 279,016 | - |
Redeemed | (3,033,755) | (4,786,847) |
Net increase (decrease) | 535,734 | (628,756) |
Financial Highlights
Years ended February 28, | 2004 E | 2003 | 2002 | 2001 | 2000 E |
Selected Per-Share Data | | | | | |
Net asset value, beginning of period | $ 32.10 | $ 37.38 | $ 41.91 | $ 53.39 | $ 43.13 |
Income from Investment Operations | | | | | |
Net investment income (loss) C | (.31) | (.20) | (.18) | (.06) | (.16) |
Net realized and unrealized gain (loss) | 16.49 | (5.14) | (4.36) | (7.29) | 11.90 |
Total from investment operations | 16.18 | (5.34) | (4.54) | (7.35) | 11.74 |
Distributions from net realized gain | (3.47) | - | - | (4.16) | (1.57) |
Redemption fees added to paid in capital C | .02 | .06 | .01 | .03 | .09 |
Net asset value, end of period | $ 44.83 | $ 32.10 | $ 37.38 | $ 41.91 | $ 53.39 |
Total Return A, B | 50.99% | (14.13)% | (10.81)% | (13.97)% | 27.62% |
Ratios to Average Net Assets D | | | | | |
Expenses before expense reductions | 1.17% | 1.29% | 1.13% | 1.13% | 1.17% |
Expenses net of voluntary waivers, if any | 1.17% | 1.29% | 1.13% | 1.13% | 1.17% |
Expenses net of all reductions | 1.09% | 1.13% | 1.10% | 1.12% | 1.15% |
Net investment income (loss) | (.75)% | (.59)% | (.46)% | (.14)% | (.32)% |
Supplemental Data | | | | | |
Net assets, end of period (000 omitted) | $ 163,826 | $ 100,111 | $ 140,070 | $ 235,761 | $ 238,612 |
Portfolio turnover rate | 208% | 272% | 74% | 73% | 76% |
A Total returns would have been lower had certain expenses not been reduced during the periods shown. B Total returns do not include the effect of the former sales charges. C Calculated based on average shares outstanding during the period. D Expense ratios reflect operating expenses of the fund. Expenses before reductions do not reflect amounts reimbursed by the investment adviser or reductions from brokerage service arrangements or other expense offset arrangements and do not represent the amount paid by the fund during periods when reimbursements or reductions occur. Expenses net of any voluntary waivers reflect expenses after reimbursement by the investment adviser but prior to reductions from brokerage service arrangements or other expense offset arrangements. Expenses net of all reductions represent the net expenses paid by the fund. E For the year ended February 29. |
See accompanying notes which are an integral part of the financial statements.
Consumer Sector
Retailing Portfolio
Performance
Average annual total return reflects the change in the value of an investment, assuming reinvestment of the fund's dividend income and capital gains (the profits earned upon the sale of securities that have grown in value) and assuming a constant rate of performance each year. The $10,000 table and the fund's returns do not reflect the deduction of taxes that a shareholder would pay on fund distributions or the redemption of fund shares. During periods of reimbursement by Fidelity a fund's total returns will be greater than it would be had the reimbursement not occurred. How a fund did yesterday is no guarantee of how it will do tomorrow.
Average Annual Total Returns
Periods ended February 29, 2004 | Past 1
year | Past 5
years | Past 10
years |
Select Retailing | 54.26% | -0.31% | 10.63% |
$10,000 Over 10 Years
Let's say hypothetically that $10,000 was invested in Fidelity Select Retailing Portfolio on February 28, 1994. The chart shows how the value of your investment would have grown, and also shows how the S&P 500 Index did over the same period.
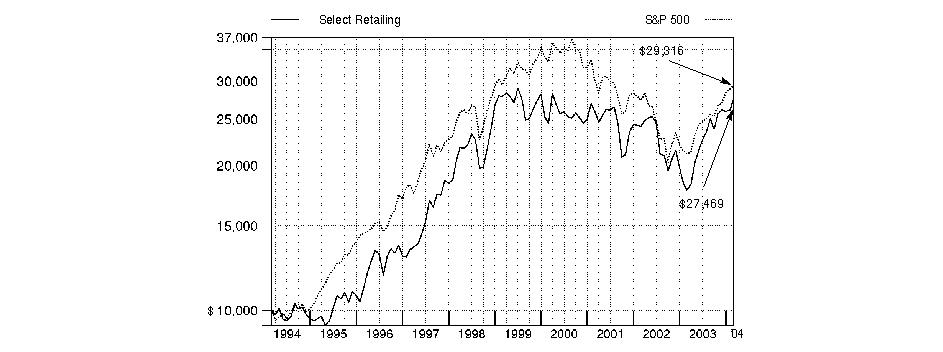
Annual Report
Retailing Portfolio
Management's Discussion of Fund Performance
Comments from Adam Segel, Portfolio Manager of Fidelity® Select Retailing Portfolio
From March 2003 through the end of February 2004, domestic stocks recovered dramatically from their prior three-year swoon, driven largely by a broad-based economic and corporate profit recovery. Most major equity benchmarks gained 35% or more during the 12-month period, led by the Russell 2000® Index - a measure of the overall small-cap universe - which advanced 64.41%. As investors grew more confident about the economy's vitality, small-cap stocks were bid up, particularly those with no current earnings. In comparison, the Wilshire 5000® Total Market Index, commonly used as a proxy for the entire U.S. stock market's performance, rose 42.47%. Every sector of the market posted a double-digit advance, with economically sensitive issues - especially technology stocks - leading the way. The tech-heavy NASDAQ Composite® Index returned 52.47% during the past year, despite a negative return in February as investors turned to the more value-oriented segments of the market. The broader Standard & Poor's 500SM Index climbed 38.52% during the year, slightly outperforming the 37.07% increase for the blue-chip Dow Jones Industrial AverageSM.
For the 12 months ending February 29, 2004, the fund posted a return of 54.26%, beating the Goldman Sachs® Consumer Industries Index, which returned 37.04%, and the S&P 500® index. As the period began, retailers, an early cyclical group, benefited from investor optimism regarding an improving economy, favorable sales comparisons, continued low interest rates and a federal tax stimulus package. However, during the past six months, after retail stocks had rallied, the group sold off as actual results lagged increasingly bullish expectations, most notably during the important holiday season. The consumer was pressured by continued sluggish employment data and high energy prices. The fund benefited from its concentration in companies with compelling valuations that stood to improve from internal operational changes and were not solely dependent on a broad economic recovery. Examples included McDonald's, Home Depot and CVS, all of which were top contributors to fund performance. On the other hand, Safeway, one of the largest food and drug retailers in the United States, detracted from performance. The company's earnings were lower than expected as a result of a grocery workers strike at some of its stores in Southern California. Krispy Kreme Doughnuts declined on weaker-than-expected earnings.
The views expressed in this statement reflect those of the portfolio manager only through the end of the period of the report as stated on the cover and do not necessarily represent the views of Fidelity or any other person in the Fidelity organization. Any such views are subject to change at any time based upon market or other conditions and Fidelity disclaims any responsibility to update such views. These views may not be relied on as investment advice and, because investment decisions for a Fidelity fund are based on numerous factors, may not be relied on as an indication of trading intent on behalf of any Fidelity fund.
Annual Report
Retailing Portfolio
Investment Summary
Top Ten Stocks as of February 29, 2004 |
| % of fund's
net assets |
McDonald's Corp. | 14.2 |
Home Depot, Inc. | 13.0 |
CVS Corp. | 10.5 |
Safeway, Inc. | 10.5 |
Wal-Mart Stores, Inc. | 4.4 |
American Eagle Outfitters, Inc. | 3.3 |
Duane Reade, Inc. | 3.0 |
Albertsons, Inc. | 2.7 |
Limited Brands, Inc. | 2.0 |
Krispy Kreme Doughnuts, Inc. | 1.6 |
| 65.2 |
Top Industries as of February 29, 2004 |
% of fund's net assets |
| Food & Staples Retailing | 34.9% | |
| Specialty Retail | 27.7% | |
| Hotels, Restaurants & Leisure | 18.3% | |
| Multiline Retail | 6.2% | |
| Textiles Apparel & Luxury Goods | 1.1% | |
| All Others* | 11.8% | |

* Includes short-term investments and net other assets. |
Annual Report
Annual Report
Retailing Portfolio
Investments February 29, 2004
Showing Percentage of Net Assets
Common Stocks - 90.5% |
| Shares | | Value (Note 1) |
BEVERAGES - 0.3% |
Pyramid Breweries, Inc. | 83,900 | | $ 264,285 |
COMMERCIAL SERVICES & SUPPLIES - 0.3% |
Copart, Inc. (a) | 10,600 | | 208,184 |
Sothebys Holdings, Inc.
Class A (ltd. vtg.) (a) | 5,300 | | 76,426 |
TOTAL COMMERCIAL SERVICES & SUPPLIES | | 284,610 |
DISTRIBUTORS - 1.0% |
Advanced Marketing Services, Inc. | 82,800 | | 895,896 |
FOOD & STAPLES RETAILING - 34.9% |
Albertsons, Inc. | 95,100 | | 2,352,774 |
BJ's Wholesale Club, Inc. (a) | 9,600 | | 228,000 |
Costco Wholesale Corp. (a) | 500 | | 19,465 |
CVS Corp. | 244,100 | | 9,153,750 |
Duane Reade, Inc. (a) | 154,500 | | 2,634,225 |
Kroger Co. (a) | 68,900 | | 1,324,258 |
Longs Drug Stores Corp. | 5,900 | | 123,251 |
Pricesmart, Inc. (a) | 78,222 | | 551,465 |
Rite Aid Corp. (a) | 21,800 | | 121,644 |
Safeway, Inc. (a) | 399,700 | | 9,141,139 |
Wal-Mart Stores, Inc. | 64,600 | | 3,847,576 |
Walgreen Co. | 23,400 | | 834,444 |
Weis Markets, Inc. | 1,900 | | 61,674 |
Wild Oats Markets, Inc. (a) | 3,700 | | 46,990 |
TOTAL FOOD & STAPLES RETAILING | | 30,440,655 |
HOTELS, RESTAURANTS & LEISURE - 18.3% |
Buca, Inc. (a) | 4,400 | | 29,084 |
Darden Restaurants, Inc. | 36,500 | | 890,600 |
Jack in the Box, Inc. (a) | 5,000 | | 124,350 |
Krispy Kreme Doughnuts, Inc. (a) | 36,100 | | 1,388,406 |
McDonald's Corp. | 436,200 | | 12,344,460 |
Outback Steakhouse, Inc. | 5,800 | | 280,662 |
Starbucks Corp. (a) | 17,000 | | 635,970 |
Yum! Brands, Inc. (a) | 6,500 | | 240,695 |
TOTAL HOTELS, RESTAURANTS & LEISURE | | 15,934,227 |
HOUSEHOLD DURABLES - 0.1% |
Yankee Candle Co., Inc. (a) | 2,300 | | 64,492 |
INTERNET & CATALOG RETAIL - 0.6% |
Drugstore.com, Inc. (a) | 19,400 | | 113,684 |
J. Jill Group, Inc. (a) | 26,700 | | 412,248 |
TOTAL INTERNET & CATALOG RETAIL | | 525,932 |
MULTILINE RETAIL - 6.2% |
99 Cents Only Stores (a) | 1,600 | | 41,360 |
Big Lots, Inc. (a) | 88,700 | | 1,277,280 |
|
| Shares | | Value (Note 1) |
Dillard's, Inc. Class A | 28,600 | | $ 503,360 |
Dollar Tree Stores, Inc. (a) | 15,100 | | 466,590 |
Federated Department Stores, Inc. | 4,700 | | 246,139 |
JCPenney Co., Inc. | 1,900 | | 58,653 |
Kohl's Corp. (a) | 8,300 | | 427,450 |
Nordstrom, Inc. | 12,500 | | 489,250 |
Saks, Inc. (a) | 32,100 | | 559,182 |
Sears, Roebuck & Co. | 2,100 | | 98,721 |
ShopKo Stores, Inc. (a) | 51,100 | | 780,297 |
Target Corp. | 500 | | 21,980 |
The May Department Stores Co. | 11,700 | | 412,074 |
TOTAL MULTILINE RETAIL | | 5,382,336 |
SPECIALTY RETAIL - 27.7% |
American Eagle Outfitters, Inc. (a) | 118,400 | | 2,887,776 |
Barnes & Noble, Inc. (a) | 2,400 | | 83,760 |
Best Buy Co., Inc. | 3,050 | | 162,413 |
Blockbuster, Inc. Class A | 11,300 | | 194,134 |
Charlotte Russe Holding, Inc. (a) | 3,300 | | 50,094 |
Charming Shoppes, Inc. (a) | 7,800 | | 51,090 |
Christopher & Banks Corp. | 12,300 | | 229,149 |
Circuit City Stores, Inc. | 6,000 | | 67,080 |
Gap, Inc. | 46,900 | | 975,520 |
Home Depot, Inc. | 313,000 | | 11,365,030 |
Kirkland's, Inc. (a) | 30,900 | | 454,230 |
Limited Brands, Inc. | 88,760 | | 1,753,010 |
Linens 'N Things, Inc. (a) | 12,700 | | 430,530 |
Lithia Motors, Inc. Class A | 1,700 | | 46,886 |
Lowe's Companies, Inc. | 11,100 | | 621,600 |
Office Depot, Inc. (a) | 47,600 | | 829,668 |
Payless ShoeSource, Inc. (a) | 7,500 | | 100,125 |
PETCO Animal Supplies, Inc. (a) | 20,800 | | 675,584 |
PETsMART, Inc. | 21,600 | | 586,224 |
RadioShack Corp. | 2,400 | | 82,944 |
Shoe Carnival, Inc. (a) | 9,700 | | 148,313 |
Staples, Inc. (a) | 14,000 | | 367,080 |
Stein Mart, Inc. (a) | 25,400 | | 280,162 |
Talbots, Inc. | 4,300 | | 145,770 |
Too, Inc. (a) | 15,000 | | 287,700 |
Toys 'R' Us, Inc. (a) | 75,600 | | 1,186,920 |
Whitehall Jewellers, Inc. (a) | 5,700 | | 53,523 |
Wilsons Leather Experts, Inc. (a) | 14,100 | | 41,595 |
TOTAL SPECIALTY RETAIL | | 24,157,910 |
TEXTILES APPAREL & LUXURY GOODS - 1.1% |
Jones Apparel Group, Inc. | 7,800 | | 290,940 |
Oshkosh B'Gosh, Inc. Class A | 11,000 | | 242,110 |
Common Stocks - continued |
| Shares | | Value (Note 1) |
TEXTILES APPAREL & LUXURY GOODS - CONTINUED |
Tommy Hilfiger Corp. (a) | 16,900 | | $ 273,273 |
VF Corp. | 2,600 | | 116,818 |
TOTAL TEXTILES APPAREL & LUXURY GOODS | | 923,141 |
TOTAL COMMON STOCKS (Cost $65,625,495) | 78,873,484 |
Money Market Funds - 15.2% |
| | | |
Fidelity Cash Central Fund, 1.08% (b) | 4,388,568 | | 4,388,568 |
Fidelity Securities Lending Cash Central Fund, 1.08% (b) | 8,823,675 | | 8,823,675 |
TOTAL MONEY MARKET FUNDS (Cost $13,212,243) | 13,212,243 |
TOTAL INVESTMENT PORTFOLIO - 105.7% (Cost $78,837,738) | 92,085,727 |
NET OTHER ASSETS - (5.7)% | (5,000,001) |
NET ASSETS - 100% | $ 87,085,726 |
Legend |
(a) Non-income producing |
(b) Affiliated fund that is available only to investment companies and other accounts managed by Fidelity Investments. The rate quoted is the annualized seven-day yield of the fund at period end. A complete listing of the fund's holdings as of its most recent fiscal year end is available upon request. |
Other Information |
Purchases and sales of securities, other than short-term securities, aggregated $62,726,563 and $77,852,639, respectively. |
The fund placed a portion of its portfolio transactions with brokerage firms which are affiliates of the investment adviser. The commissions paid to these affiliated firms were $13,020 for the period. |
Income Tax Information |
At February 29, 2004, the fund had a capital loss carryforward of approximately $403,000 all of which will expire on February 28, 2011. |
See accompanying notes which are an integral part of the financial statements.
Consumer Sector
Retailing Portfolio
Financial Statements
Statement of Assets and Liabilities
| February 29, 2004 |
Assets | | |
Investment in securities, at value (including securities loaned of $8,419,181) (cost $78,837,738) - See accompanying schedule | | $ 92,085,727 |
Receivable for investments sold | | 1,021,169 |
Receivable for fund shares sold | | 3,392,038 |
Dividends receivable | | 11,882 |
Interest receivable | | 3,790 |
Prepaid expenses | | 380 |
Other affiliated receivables | | 76 |
Other receivables | | 12,104 |
Total assets | | 96,527,166 |
| | |
Liabilities | | |
Payable for investments purchased | $ 351,828 | |
Payable for fund shares redeemed | 171,347 | |
Accrued management fee | 38,435 | |
Other affiliated payables | 29,231 | |
Other payables and accrued expenses | 26,924 | |
Collateral on securities loaned, at value | 8,823,675 | |
Total liabilities | | 9,441,440 |
| | |
Net Assets | | $ 87,085,726 |
Net Assets consist of: | | |
Paid in capital | | $ 74,469,129 |
Accumulated undistributed net realized gain (loss) on investments and foreign currency transactions | | (631,392) |
Net unrealized appreciation (depreciation) on investments | | 13,247,989 |
Net Assets, for 1,837,583 shares outstanding | | $ 87,085,726 |
Net Asset Value, offering price and redemption price per share ($87,085,726 ÷ 1,837,583 shares) | | $ 47.39 |
Statement of Operations
| Year ended February 29, 2004 |
Investment Income | | |
Dividends | | $ 574,264 |
Interest | | 90,769 |
Security lending | | 5,949 |
Total income | | 670,982 |
Expenses | | |
Management fee | $ 474,775 | |
Transfer agent fees | 457,955 | |
Accounting and security lending fees | 58,080 | |
Non-interested trustees' compensation | 405 | |
Custodian fees and expenses | 13,498 | |
Registration fees | 25,281 | |
Audit | 44,073 | |
Legal | 424 | |
Miscellaneous | 1,747 | |
Total expenses before reductions | 1,076,238 | |
Expense reductions | (29,167) | 1,047,071 |
Net investment income (loss) | | (376,089) |
Realized and Unrealized Gain (Loss) Net realized gain (loss) on: | | |
Investment securities | 10,890,236 | |
Foreign currency transactions | (78) | |
Total net realized gain (loss) | | 10,890,158 |
Change in net unrealized appreciation (depreciation) on investment securities | | 22,296,787 |
Net gain (loss) | | 33,186,945 |
Net increase (decrease) in net assets resulting from operations | | $ 32,810,856 |
Other Information | | |
Sales charges paid to FDC | | $ 97,830 |
Deferred sales charges withheld by FDC | | $ 745 |
Exchange fees withheld by
FSC | | $ 4,583 |
See accompanying notes which are an integral part of the financial statements.
Annual Report
Retailing Portfolio
Financial Statements - continued
Statement of Changes in Net Assets
| Year ended
February 29,
2004 | Year ended
February 28,
2003 |
Increase (Decrease) in Net Assets | | |
Operations | | |
Net investment income (loss) | $ (376,089) | $ (650,580) |
Net realized gain (loss) | 10,890,158 | (5,619,312) |
Change in net unrealized appreciation (depreciation) | 22,296,787 | (20,126,539) |
Net increase (decrease) in net assets resulting from operations | 32,810,856 | (26,396,431) |
Share transactions
Net proceeds from sales of shares | 96,912,516 | 102,704,962 |
Cost of shares redeemed | (106,328,320) | (139,947,963) |
Net increase (decrease) in net assets resulting from share transactions | (9,415,804) | (37,243,001) |
Redemption fees | 63,615 | 72,373 |
Total increase (decrease) in net assets | 23,458,667 | (63,567,059) |
| | |
Net Assets | | |
Beginning of period | 63,627,059 | 127,194,118 |
End of period | $ 87,085,726 | $ 63,627,059 |
Other Information Shares | | |
Sold | 2,393,633 | 2,655,580 |
Redeemed | (2,627,252) | (3,636,899) |
Net increase (decrease) | (233,619) | (981,319) |
Financial Highlights
Years ended February 28, | 2004 E | 2003 | 2002 | 2001 | 2000 E |
Selected Per-Share Data | | | | | |
Net asset value, beginning of period | $ 30.72 | $ 41.67 | $ 46.34 | $ 50.42 | $ 67.50 |
Income from Investment Operations | | | | | |
Net investment income (loss) C | (.19) | (.28) | (.23) | (.25) | (.39) |
Net realized and unrealized gain (loss) | 16.83 | (10.70) | (3.05) | 3.15 | (6.72) |
Total from investment operations | 16.64 | (10.98) | (3.28) | 2.90 | (7.11) |
Distributions from net realized gain | - | - | (1.47) | (7.18) | (10.13) |
Redemption fees added to paid in capital C | .03 | .03 | .08 | .20 | .16 |
Net asset value, end of period | $ 47.39 | $ 30.72 | $ 41.67 | $ 46.34 | $ 50.42 |
Total Return A,B | 54.26% | (26.28)% | (6.85)% | 5.77% | (12.15)% |
Ratios to Average Net Assets D | | | | | |
Expenses before expense reductions | 1.31% | 1.32% | 1.29% | 1.36% | 1.25% |
Expenses net of voluntary waivers, if any | 1.31% | 1.32% | 1.29% | 1.36% | 1.25% |
Expenses net of all reductions | 1.28% | 1.25% | 1.16% | 1.29% | 1.20% |
Net investment income (loss) | (.46)% | (.74)% | (.54)% | (.51)% | (.60)% |
Supplemental Data | | | | | |
Net assets, end of period (000 omitted) | $ 87,086 | $ 63,627 | $ 127,194 | $ 96,888 | $ 75,822 |
Portfolio turnover rate | 85% | 149% | 280% | 278% | 88% |
A Total returns would have been lower had certain expenses not been reduced during the periods shown. B Total returns do not include the effect of the former sales charges. C Calculated based on average shares outstanding during the period. D Expense ratios reflect operating expenses of the fund. Expenses before reductions do not reflect amounts reimbursed by the investment adviser or reductions from brokerage service arrangements or other expense offset arrangements and do not represent the amount paid by the fund during periods when reimbursements or reductions occur. Expenses net of any voluntary waivers reflect expenses after reimbursement by the investment adviser but prior to reductions from brokerage service arrangements or other expense offset arrangements. Expenses net of all reductions represent the net expenses paid by the fund. E For the year ended February 29. |
See accompanying notes which are an integral part of the financial statements.
Consumer Sector
Air Transportation Portfolio
Performance
Average annual total return reflects the change in the value of an investment, assuming reinvestment of the fund's dividend income and capital gains (the profits earned upon the sale of securities that have grown in value) and assuming a constant rate of performance each year. The $10,000 table and the fund's returns do not reflect the deduction of taxes that a shareholder would pay on fund distributions or the redemption of fund shares. During periods of reimbursement by Fidelity a fund's total returns will be greater than it would be had the reimbursement not occurred. How a fund did yesterday is no guarantee of how it will do tomorrow.
Average Annual Total Returns
Periods ended February 29, 2004 | Past 1
year | Past 5
years | Past 10
years |
Select Air Transportation | 53.42% | 7.90% | 10.94% |
$10,000 Over 10 Years
Let's say hypothetically that $10,000 was invested in Fidelity Select Air Transportation Portfolio on February 28, 1994. The chart shows how the value of your investment would have grown, and also shows how the S&P 500 Index did over the same period.
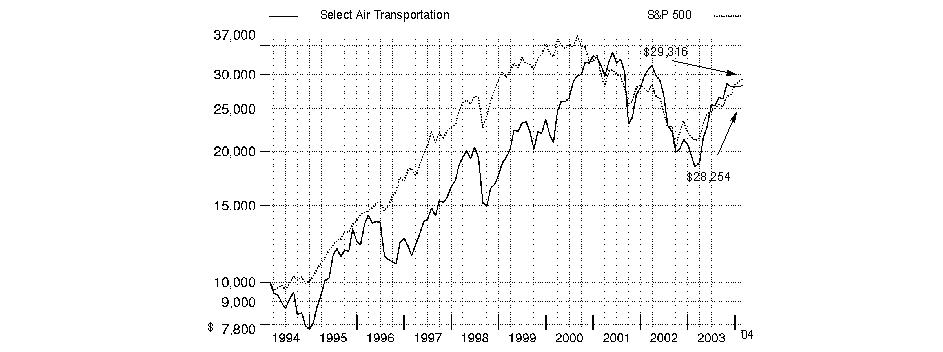
Annual Report
Air Transportation Portfolio
Management's Discussion of Fund Performance
Comments from Harlan Carere, who became Portfolio Manager of Fidelity® Select Air Transportation Portfolio on January 1, 2004
From March 2003 through the end of February 2004, domestic stocks recovered dramatically from their prior three-year swoon, driven largely by a broad-based economic and corporate profit recovery. Most major equity benchmarks gained 35% or more during the 12-month period, led by the Russell 2000® Index - a measure of the overall small-cap universe - which advanced 64.41%. As investors grew more confident about the economy's vitality, small-cap stocks were bid up, particularly those with no current earnings. In comparison, the Wilshire 5000® Total Market Index, commonly used as a proxy for the entire U.S. stock market's performance, rose 42.47%. Every sector of the market posted a double-digit advance, with economically sensitive issues - especially technology stocks - leading the way. The tech-heavy NASDAQ Composite® Index returned 52.47% during the past year, despite a negative return in February as investors turned to the more value-oriented segments of the market. The broader Standard & Poor's 500SM Index climbed 38.52% during the year, slightly outperforming the 37.07% increase for the blue-chip Dow Jones Industrial AverageSM.
For the 12 months ending February 29, 2004, the fund returned 53.42%, topping both the 45.70% return for the Goldman Sachs® Cyclical Industries Index and the S&P 500®'s gain. Good stock picking within the airline and the aerospace and defense industries was an important factor in the fund's solid relative results, as these three industries represented approximately two-thirds of its net assets on average throughout the period. It was particularly helpful for the fund to have a large exposure to many of the so-called "legacy" airline carriers, meaning the large, established airlines that operate hub-and-spoke networks, as these stocks generally rebounded the most when the industry's business climate improved. Notable contributors included Continental Airlines and AMR, the parent of American Airlines. On the downside, holdings in low-cost carriers that had higher valuations going into the period, such as Southwest Airlines and JetBlue Airways, significantly underperformed the overall airline group and detracted from the fund's performance relative to its benchmarks. Among other holdings, regional jet manufacturer Bombardier and aircraft equipment maker Goodrich outperformed the Goldman Sachs index, while defense contractor Lockheed Martin had only a modestly positive absolute gain, hurting the fund's return relative to the sector benchmark.
The views expressed in this statement reflect those of the portfolio manager only through the end of the period of the report as stated on the cover and do not necessarily represent the views of Fidelity or any other person in the Fidelity organization. Any such views are subject to change at any time based upon market or other conditions and Fidelity disclaims any responsibility to update such views. These views may not be relied on as investment advice and, because investment decisions for a Fidelity fund are based on numerous factors, may not be relied on as an indication of trading intent on behalf of any Fidelity fund.
Annual Report
Air Transportation Portfolio
Investment Summary
Top Ten Stocks as of February 29, 2004 |
| % of fund's
net assets |
Goodrich Corp. | 5.7 |
Bombardier, Inc. Class B (sub. vtg.) | 5.6 |
Boeing Co. | 5.5 |
United Parcel Service, Inc. Class B | 5.1 |
Rockwell Collins, Inc. | 5.0 |
Honeywell International, Inc. | 5.0 |
Expeditors International of Washington, Inc. | 4.9 |
JetBlue Airways Corp. | 4.8 |
C.H. Robinson Worldwide, Inc. | 4.2 |
Sabre Holdings Corp. Class A | 4.0 |
| 49.8 |
Top Industries as of February 29, 2004 |
% of fund's net assets |
| Aerospace & Defense | 39.8% | |
| Airlines | 28.1% | |
| Air Freight & Logistics | 21.8% | |
| IT Services | 4.0% | |
| Commercial Services & Supplies | 2.0% | |
| All Others* | 4.3% | |

* Includes short-term investments and net other assets. |
Annual Report
Air Transportation Portfolio
Investments February 29, 2004
Showing Percentage of Net Assets
Common Stocks - 97.8% |
| Shares | | Value (Note 1) |
AEROSPACE & DEFENSE - 39.8% |
Boeing Co. | 43,700 | | $ 1,895,269 |
Bombardier, Inc. Class B (sub. vtg.) | 399,000 | | 1,939,054 |
Embraer - Empresa Brasileira de Aeronautica SA sponsored ADR | 14,200 | | 428,698 |
General Dynamics Corp. | 9,600 | | 884,352 |
Goodrich Corp. | 67,600 | | 1,993,524 |
Honeywell International, Inc. | 49,200 | | 1,724,460 |
Lockheed Martin Corp. | 29,500 | | 1,365,260 |
Precision Castparts Corp. | 25,100 | | 1,133,265 |
Rockwell Collins, Inc. | 53,300 | | 1,734,382 |
United Technologies Corp. | 7,900 | | 727,669 |
TOTAL AEROSPACE & DEFENSE | | 13,825,933 |
AIR FREIGHT & LOGISTICS - 21.8% |
C.H. Robinson Worldwide, Inc. | 36,500 | | 1,445,765 |
Dynamex, Inc. (a) | 500 | | 5,950 |
EGL, Inc. (a) | 1,200 | | 19,188 |
Expeditors International of Washington, Inc. | 44,400 | | 1,711,176 |
FedEx Corp. | 20,000 | | 1,373,600 |
Forward Air Corp. (a) | 10,500 | | 332,010 |
United Parcel Service, Inc. Class B | 25,100 | | 1,772,813 |
UTI Worldwide, Inc. | 20,500 | | 925,985 |
TOTAL AIR FREIGHT & LOGISTICS | | 7,586,487 |
AIRLINES - 28.1% |
AirTran Holdings, Inc. (a) | 53,300 | | 659,854 |
Alaska Air Group, Inc. (a) | 14,100 | | 362,934 |
America West Holding Corp. Class B (a) | 17,500 | | 191,275 |
AMR Corp. (a) | 75,100 | | 1,141,520 |
Atlantic Coast Airlines Holdings, Inc. (a) | 12,200 | | 88,938 |
British Airways PLC ADR (a) | 10,300 | | 608,730 |
Continental Airlines, Inc. Class B (a) | 46,100 | | 675,365 |
ExpressJet Holdings, Inc. Class A (a) | 23,800 | | 326,774 |
Frontier Airlines, Inc. (a) | 55,800 | | 566,370 |
JetBlue Airways Corp. (a) | 69,775 | | 1,660,645 |
Mesa Air Group, Inc. (a) | 7,600 | | 68,324 |
Northwest Airlines Corp. (a) | 88,900 | | 963,676 |
SkyWest, Inc. | 21,100 | | 408,285 |
Southwest Airlines Co. | 71,125 | | 982,236 |
WestJet Airlines Ltd. (a) | 54,900 | | 1,038,021 |
TOTAL AIRLINES | | 9,742,947 |
COMMERCIAL SERVICES & SUPPLIES - 2.0% |
The Brink's Co. | 26,400 | | 699,072 |
IT SERVICES - 4.0% |
Sabre Holdings Corp. Class A | 61,400 | | 1,393,166 |
|
| Shares | | Value (Note 1) |
OIL & GAS - 1.9% |
Frontline Ltd. | 6,400 | | $ 205,559 |
Tsakos Energy Navigation Ltd. | 14,100 | | 438,510 |
TOTAL OIL & GAS | | 644,069 |
ROAD & RAIL - 0.2% |
USF Corp. | 1,600 | | 56,560 |
TOTAL COMMON STOCKS (Cost $29,218,794) | 33,948,234 |
Money Market Funds - 10.9% |
| | | |
Fidelity Cash Central Fund, 1.08% (b) | 264,040 | | 264,040 |
Fidelity Securities Lending Cash Central Fund, 1.08% (b) | 3,528,750 | | 3,528,750 |
TOTAL MONEY MARKET FUNDS (Cost $3,792,790) | 3,792,790 |
TOTAL INVESTMENT PORTFOLIO - 108.7% (Cost $33,011,584) | | 37,741,024 |
NET OTHER ASSETS - (8.7)% | | (3,017,220) |
NET ASSETS - 100% | $ 34,723,804 |
Legend |
(a) Non-income producing |
(b) Affiliated fund that is available only to investment companies and other accounts managed by Fidelity Investments. The rate quoted is the annualized seven-day yield of the fund at period end. A complete listing of the fund's holdings as of its most recent fiscal year end is available upon request. |
Other Information |
Purchases and sales of securities, other than short-term securities, aggregated $52,493,624 and $55,877,351, respectively. |
The fund placed a portion of its portfolio transactions with brokerage firms which are affiliates of the investment adviser. The commissions paid to these affiliated firms were $15,678 for the period. |
Distribution of investments by country of issue, as a percentage of total net assets, is as follows: |
United States of America | 83.8% |
Canada | 8.6% |
British Virgin Islands | 2.7% |
United Kingdom | 1.8% |
Bermuda | 1.3% |
Brazil | 1.2% |
Others (individually less than 1%) | 0.6% |
| 100.0% |
Income Tax Information |
The fund intends to elect to defer to its fiscal year ending February 28, 2005 approximately $1,550,000 of losses recognized during the period November 1, 2003 to February 29, 2004. |
See accompanying notes which are an integral part of the financial statements.
Annual Report
Air Transportation Portfolio
Financial Statements
Statement of Assets and Liabilities
| February 29, 2004 |
| | |
Assets | | |
Investment in securities, at value (including securities loaned of $3,365,776) (cost $33,011,584) - See accompanying schedule | | $ 37,741,024 |
Receivable for investments sold | | 2,053,581 |
Receivable for fund shares sold | | 50,294 |
Dividends receivable | | 42,956 |
Interest receivable | | 173 |
Prepaid expenses | | 263 |
Other affiliated receivables | | 85 |
Other receivables | | 6,626 |
Total assets | | 39,895,002 |
| | |
Liabilities | | |
Payable for investments purchased | $ 4,450 | |
Payable for fund shares redeemed | 1,578,341 | |
Accrued management fee | 17,770 | |
Other affiliated payables | 15,300 | |
Other payables and accrued expenses | 26,587 | |
Collateral on securities loaned, at value | 3,528,750 | |
Total liabilities | | 5,171,198 |
| | |
Net Assets | | $ 34,723,804 |
Net Assets consist of: | | |
Paid in capital | | $ 31,347,736 |
Accumulated undistributed net realized gain (loss) on investments and foreign currency transactions | | (1,353,729) |
Net unrealized appreciation (depreciation) on investments and assets and liabilities in foreign currencies | | 4,729,797 |
Net Assets, for 1,155,898 shares outstanding | | $ 34,723,804 |
Net Asset Value, offering price and redemption price per share ($34,723,804 ÷ 1,155,898 shares) | | $ 30.04 |
Statement of Operations
| Year ended February 29, 2004 |
| | |
Investment Income | | |
Dividends | | $ 337,910 |
Interest | | 29,641 |
Security lending | | 25,146 |
Total income | | 392,697 |
| | |
Expenses | | |
Management fee | $ 239,068 | |
Transfer agent fees | 250,323 | |
Accounting and security lending fees | 56,428 | |
Non-interested trustees' compensation | 219 | |
Custodian fees and expenses | 11,223 | |
Registration fees | 16,141 | |
Audit | 43,894 | |
Legal | 136 | |
Miscellaneous | 1,080 | |
Total expenses before reductions | 618,512 | |
Expense reductions | (31,534) | 586,978 |
Net investment income (loss) | | (194,281) |
Realized and Unrealized Gain (Loss) Net realized gain (loss) on: | | |
Investment securities | 8,548,599 | |
Foreign currency transactions | 7,117 | |
Total net realized gain (loss) | | 8,555,716 |
Change in net unrealized appreciation (depreciation) on: Investment securities | 6,849,264 | |
Assets and liabilities in foreign currencies | 164 | |
Total change in net unrealized appreciation (depreciation) | | 6,849,428 |
Net gain (loss) | | 15,405,144 |
Net increase (decrease) in net assets resulting from operations | | $ 15,210,863 |
Other Information | | |
Sales charges paid to FDC | | $ 57,439 |
Deferred sales charges withheld by FDC | | $ 374 |
Exchange fees withheld by
FSC | | $ 2,610 |
See accompanying notes which are an integral part of the financial statements.
Annual Report
Air Transportation Portfolio
Financial Statements - continued
Statement of Changes in Net Assets
| Year ended
February 29,
2004 | Year ended
February 28,
2003 |
Increase (Decrease) in Net Assets | | |
Operations | | |
Net investment income (loss) | $ (194,281) | $ (284,844) |
Net realized gain (loss) | 8,555,716 | (8,773,528) |
Change in net unrealized appreciation (depreciation) | 6,849,428 | (10,774,506) |
Net increase (decrease) in net assets resulting from operations | 15,210,863 | (19,832,878) |
Distributions to shareholders from net realized gain | - | (483,018) |
Share transactions
Net proceeds from sales of shares | 63,501,703 | 28,138,992 |
Reinvestment of distributions | - | 469,085 |
Cost of shares redeemed | (67,485,307) | (51,993,684) |
Net increase (decrease) in net assets resulting from share transactions | (3,983,604) | (23,385,607) |
Redemption fees | 56,837 | 54,521 |
Total increase (decrease) in net assets | 11,284,096 | (43,646,982) |
| | |
Net Assets | | |
Beginning of period | 23,439,708 | 67,086,690 |
End of period (including undistributed net investment income of $0 and $1,626, respectively) | $ 34,723,804 | $ 23,439,708 |
Other Information Shares | | |
Sold | 2,419,487 | 994,634 |
Issued in reinvestment of distributions | - | 14,193 |
Redeemed | (2,460,622) | (1,847,123) |
Net increase (decrease) | (41,135) | (838,296) |
Financial Highlights
Years ended February 28, | 2004 E | 2003 | 2002 | 2001 | 2000 E |
Selected Per-Share Data | | | | | |
Net asset value, beginning of period | $ 19.58 | $ 32.96 | $ 35.48 | $ 26.45 | $ 27.76 |
Income from Investment Operations | | | | | |
Net investment income (loss) C | (.13) | (.19) | (.08) | (.04) | (.15) |
Net realized and unrealized gain (loss) | 10.55 | (12.99) | (.88) | 12.62 | 2.59 |
Total from investment operations | 10.42 | (13.18) | (.96) | 12.58 | 2.44 |
Distributions from net realized gain | - | (.24) | (1.61) | (3.68) | (3.88) |
Redemption fees added to paid in capital C | .04 | .04 | .05 | .13 | .13 |
Net asset value, end of period | $ 30.04 | $ 19.58 | $ 32.96 | $ 35.48 | $ 26.45 |
Total Return A,B | 53.42% | (40.16)% | (2.38)% | 50.37% | 8.50% |
Ratios to Average Net Assets D | | | | | |
Expenses before expense reductions | 1.49% | 1.63% | 1.43% | 1.34% | 1.40% |
Expenses net of voluntary waivers, if any | 1.49% | 1.63% | 1.43% | 1.34% | 1.40% |
Expenses net of all reductions | 1.42% | 1.58% | 1.38% | 1.30% | 1.35% |
Net investment income (loss) | (.47)% | (.73)% | (.24)% | (.11)% | (.48)% |
Supplemental Data | | | | | |
Net assets, end of period (000 omitted) | $ 34,724 | $ 23,440 | $ 67,087 | $ 47,952 | $ 24,463 |
Portfolio turnover rate | 140% | 56% | 117% | 198% | 252% |
A Total returns would have been lower had certain expenses not been reduced during the periods shown. B Total returns do not include the effect of the former sales charges. C Calculated based on average shares outstanding during the period. D Expense ratios reflect operating expenses of the fund. Expenses before reductions do not reflect amounts reimbursed by the investment adviser or reductions from brokerage service arrangements or other expense offset arrangements and do not represent the amount paid by the fund during periods when reimbursements or reductions occur. Expenses net of any voluntary waivers reflect expenses after reimbursement by the investment adviser but prior to reductions from brokerage service arrangements or other expense offset arrangements. Expenses net of all reductions represent the net expenses paid by the fund. E For the year ended February 29. |
See accompanying notes which are an integral part of the financial statements.
Cyclicals Sector
Automotive Portfolio
Performance
Average annual total return reflects the change in the value of an investment, assuming reinvestment of the fund's dividend income and capital gains (the profits earned upon the sale of securities that have grown in value) and assuming a constant rate of performance each year. The $10,000 table and the fund's returns do not reflect the deduction of taxes that a shareholder would pay on fund distributions or the redemption of fund shares. During periods of reimbursement by Fidelity a fund's total returns will be greater than it would be had the reimbursement not occurred. How a fund did yesterday is no guarantee of how it will do tomorrow.
Average Annual Total Returns
Periods ended February 29, 2004 | Past 1
year | Past 5
years | Past 10
years |
Select Automotive | 52.14% | 6.81% | 6.13% |
$10,000 Over 10 Years
Let's say hypothetically that $10,000 was invested in Fidelity Select Automotive Portfolio on February 28, 1994. The chart shows how the value of your investment would have grown, and also shows how the S&P 500 Index did over the same period.
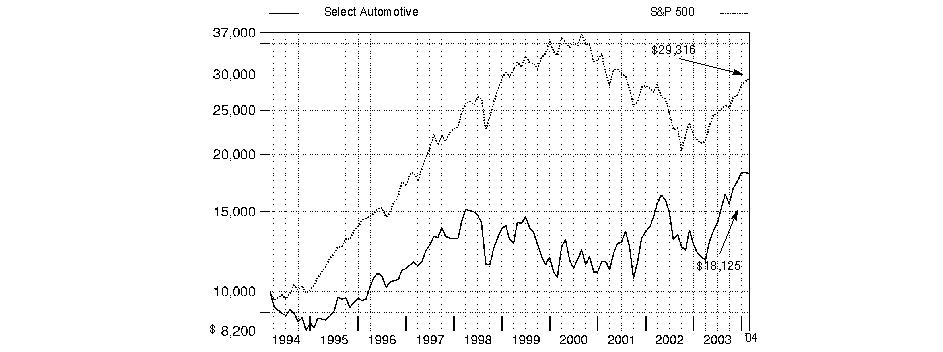
Annual Report
Automotive Portfolio
Management's Discussion of Fund Performance
Comments from Robert Bao, Portfolio Manager of Fidelity® Select Automotive Portfolio
From March 2003 through the end of February 2004, domestic stocks recovered dramatically from their prior three-year swoon, driven largely by a broad-based economic and corporate profit recovery. Most major equity benchmarks gained 35% or more during the 12-month period, led by the Russell 2000® Index - a measure of the overall small-cap universe - which advanced 64.41%. As investors grew more confident about the economy's vitality, small-cap stocks were bid up, particularly those with no current earnings. In comparison, the Wilshire 5000® Total Market Index, commonly used as a proxy for the entire U.S. stock market's performance, rose 42.47%. Every sector of the market posted a double-digit advance, with economically sensitive issues - especially technology stocks - leading the way. The tech-heavy NASDAQ Composite® Index returned 52.47% during the past year, despite a negative return in February as investors turned to the more value-oriented segments of the market. The broader Standard & Poor's 500SM Index climbed 38.52% during the year, slightly outperforming the 37.07% increase for the blue-chip Dow Jones Industrial AverageSM.
For the 12-month period that ended February 29, 2004, Fidelity Select Automotive Portfolio posted a return of 52.14%, outpacing both the Goldman Sachs® Cyclical Industries Index, which returned 45.70%, and the S&P 500®. Fund performance benefited from a large overweighting in heavy truck manufacturers, a segment in which many stocks moved higher on expectations that trucking companies would begin upgrading their fleets. Navistar, a maker of heavy trucks and the fund's largest holding at period end, was its top relative contributor to performance, followed by PACCAR, another heavy truck manufacturer. Within the automaking segment, Toyota turned in strong performance, as did Korean automaker Hyundai. Parts suppliers, such as American Axle and Lear, and aftermarket retailers, such as Monro Muffler, also performed well. Taking what may have been an overly cautious stance, the fund held a large average cash position - at about 6% of net assets - which was the biggest detractor to overall fund performance during the period. Underweighting Ford, which outpaced the benchmark index, also tempered relative returns.
Note to shareholders: Anmol Mehra became Portfolio Manager of Fidelity Select Automotive Portfolio on March 1, 2004.
The views expressed in this statement reflect those of the portfolio manager only through the end of the period of the report as stated on the cover and do not necessarily represent the views of Fidelity or any other person in the Fidelity organization. Any such views are subject to change at any time based upon market or other conditions and Fidelity disclaims any responsibility to update such views. These views may not be relied on as investment advice and, because investment decisions for a Fidelity fund are based on numerous factors, may not be relied on as an indication of trading intent on behalf of any Fidelity fund.
Annual Report
Automotive Portfolio
Investment Summary
Top Ten Stocks as of February 29, 2004 |
| % of fund's
net assets |
Navistar International Corp. | 8.0 |
Toyota Motor Corp. | 5.1 |
AutoNation, Inc. | 4.0 |
Nissan Motor Co. Ltd. sponsored ADR | 3.9 |
Sonic Automotive, Inc. Class A | 3.8 |
Cummins, Inc. | 3.4 |
Johnson Controls, Inc. | 3.4 |
Monro Muffler Brake, Inc. | 3.4 |
Eaton Corp. | 3.4 |
Gentex Corp. | 3.3 |
| 41.7 |
Top Industries as of February 29, 2004 |
% of fund's net assets |
| Machinery | 27.7% | |
| Specialty Retail | 23.7% | |
| Auto Components | 22.5% | |
| Automobiles | 19.4% | |
| Aerospace & Defense | 1.4% | |
| All Others* | 5.3% | |

* Includes short-term investments and net other assets. |
Annual Report
Automotive Portfolio
Investments February 29, 2004
Showing Percentage of Net Assets
Common Stocks - 98.2% |
| Shares | | Value (Note 1) |
AEROSPACE & DEFENSE - 1.4% |
Honeywell International, Inc. | 8,800 | | $ 308,440 |
AUTO COMPONENTS - 22.5% |
American Axle & Manufacturing Holdings, Inc. (a) | 10,200 | | 387,702 |
Autoliv, Inc. | 7,700 | | 341,726 |
BorgWarner, Inc. | 5,600 | | 505,120 |
Gentex Corp. | 17,300 | | 705,148 |
Goodyear Tire & Rubber Co. (a) | 26,700 | | 224,814 |
Johnson Controls, Inc. | 12,600 | | 734,832 |
Keystone Automotive Industries, Inc. (a) | 18,700 | | 500,412 |
Lear Corp. | 10,900 | | 671,767 |
Magna International, Inc. Class A | 6,200 | | 491,469 |
Modine Manufacturing Co. | 2,000 | | 56,900 |
Superior Industries International, Inc. | 5,800 | | 198,360 |
TOTAL AUTO COMPONENTS | | 4,818,250 |
AUTOMOBILES - 19.4% |
Bayerische Motoren Werke AG (BMW) | 13,900 | | 597,090 |
Coachmen Industries, Inc. | 19,900 | | 328,549 |
Denway Motors Ltd. | 288,000 | | 332,982 |
Hyundai Motor Co. Ltd. | 14,620 | | 620,280 |
Monaco Coach Corp. (a) | 5,000 | | 142,500 |
Nissan Motor Co. Ltd. sponsored ADR | 37,400 | | 828,410 |
Toyota Motor Corp. | 31,800 | | 1,099,167 |
Winnebago Industries, Inc. | 3,300 | | 220,407 |
TOTAL AUTOMOBILES | | 4,169,385 |
BUILDING PRODUCTS - 1.4% |
Trex Co., Inc. (a) | 8,600 | | 302,118 |
COMMERCIAL SERVICES & SUPPLIES - 0.4% |
Copart, Inc. (a) | 4,800 | | 94,272 |
INDUSTRIAL CONGLOMERATES - 0.8% |
Tyco International Ltd. | 5,800 | | 165,706 |
MACHINERY - 27.7% |
Caterpillar, Inc. | 1,900 | | 143,925 |
Cummins, Inc. | 14,900 | | 736,060 |
Danaher Corp. | 2,900 | | 259,927 |
Donaldson Co., Inc. | 4,600 | | 262,338 |
Eaton Corp. | 12,300 | | 720,042 |
Kennametal, Inc. | 7,876 | | 341,897 |
Navistar International Corp. (a) | 36,694 | | 1,709,941 |
Oshkosh Truck Co. | 3,100 | | 182,435 |
PACCAR, Inc. | 5,325 | | 295,058 |
Parker Hannifin Corp. | 10,000 | | 561,700 |
SPX Corp. (a) | 12,600 | | 529,200 |
Volvo AB ADR | 6,200 | | 196,788 |
TOTAL MACHINERY | | 5,939,311 |
|
| Shares | | Value (Note 1) |
ROAD & RAIL - 0.9% |
P.A.M. Transportation Services, Inc. (a) | 300 | | $ 5,277 |
USF Corp. | 5,000 | | 176,750 |
TOTAL ROAD & RAIL | | 182,027 |
SPECIALTY RETAIL - 23.7% |
AutoNation, Inc. (a) | 50,900 | | 849,012 |
AutoZone, Inc. (a) | 6,900 | | 618,930 |
CarMax, Inc. (a) | 14,500 | | 493,000 |
Lithia Motors, Inc. Class A | 8,600 | | 237,188 |
Monro Muffler Brake, Inc. (a) | 30,579 | | 733,284 |
O'Reilly Automotive, Inc. (a) | 7,600 | | 308,788 |
Sonic Automotive, Inc. Class A | 33,145 | | 815,367 |
TBC Corp. (a) | 11,900 | | 327,964 |
The Pep Boys - Manny, Moe & Jack | 15,500 | | 365,645 |
United Auto Group, Inc. | 11,600 | | 329,208 |
TOTAL SPECIALTY RETAIL | | 5,078,386 |
TOTAL COMMON STOCKS (Cost $18,100,346) | 21,057,895 |
Money Market Funds - 1.0% |
| | | |
Fidelity Securities Lending Cash Central Fund, 1.08% (b)
(Cost $214,500) | 214,500 | | 214,500 |
TOTAL INVESTMENT PORTFOLIO - 99.2% (Cost $18,314,846) | | 21,272,395 |
NET OTHER ASSETS - 0.8% | | 165,820 |
NET ASSETS - 100% | $ 21,438,215 |
Legend |
(a) Non-income producing |
(b) Affiliated fund that is available only to investment companies and other accounts managed by Fidelity Investments. The rate quoted is the annualized seven-day yield of the fund at period end. A complete listing of the fund's holdings as of its most recent fiscal year end is available upon request. |
Other Information |
Purchases and sales of securities, other than short-term securities, aggregated $28,967,325 and $32,153,355, respectively. |
The fund placed a portion of its portfolio transactions with brokerage firms which are affiliates of the investment adviser. The commissions paid to these affiliated firms were $6,221 for the period. |
Distribution of investments by country of issue, as a percentage of total net assets, is as follows: |
United States of America | 80.6% |
Japan | 9.0% |
Korea (South) | 2.9% |
Germany | 2.8% |
Canada | 2.3% |
Hong Kong | 1.5% |
Others (individually less than 1%) | 0.9% |
| 100.0% |
Income Tax Information |
At February 29, 2004, the fund had a capital loss carryforward of approximately $7,439,000 of which $3,649,000, $947,000, $1,664,000 and $1,179,000 will expire on February 29, 2008, February 28, 2009, 2010 and 2011, respectively. |
See accompanying notes which are an integral part of the financial statements.
Cyclicals Sector
Automotive Portfolio
Financial Statements
Statement of Assets and Liabilities
| February 29, 2004 |
| | |
Assets | | |
Investment in securities, at value (including securities loaned of $218,920) (cost $18,314,846) - See accompanying schedule | | $ 21,272,395 |
Receivable for investments sold | | 509,953 |
Receivable for fund shares sold | | 50,720 |
Dividends receivable | | 25,208 |
Interest receivable | | 266 |
Prepaid expenses | | 110 |
Other affiliated receivables | | 5 |
Other receivables | | 861 |
Total assets | | 21,859,518 |
| | |
Liabilities | | |
Payable to custodian bank | $ 47,815 | |
Payable for fund shares redeemed | 107,535 | |
Accrued management fee | 11,713 | |
Other affiliated payables | 13,264 | |
Other payables and accrued expenses | 26,476 | |
Collateral on securities loaned, at value | 214,500 | |
Total liabilities | | 421,303 |
| | |
Net Assets | | $ 21,438,215 |
Net Assets consist of: | | |
Paid in capital | | $ 25,983,418 |
Accumulated undistributed net realized gain (loss) on investments and foreign currency transactions | | (7,503,346) |
Net unrealized appreciation (depreciation) on investments and assets and liabilities in foreign currencies | | 2,958,143 |
Net Assets, for 662,543 shares outstanding | | $ 21,438,215 |
Net Asset Value, offering price and redemption price per share ($21,438,215 ÷ 662,543 shares) | | $ 32.36 |
Statement of Operations
| Year ended February 29, 2004 |
| | |
Investment Income | | |
Dividends | | $ 221,513 |
Interest | | 15,152 |
Security lending | | 10,754 |
Total income | | 247,419 |
| | |
Expenses | | |
Management fee | $ 143,724 | |
Transfer agent fees | 164,690 | |
Accounting and security lending fees | 55,949 | |
Non-interested trustees' compensation | 220 | |
Custodian fees and expenses | 10,629 | |
Registration fees | 20,610 | |
Audit | 43,826 | |
Legal | 89 | |
Miscellaneous | 474 | |
Total expenses before reductions | 440,211 | |
Expense reductions | (1,646) | 438,565 |
Net investment income (loss) | | (191,146) |
Realized and Unrealized Gain (Loss) Net realized gain (loss) on: | | |
Investment securities | 5,664,095 | |
Foreign currency transactions | (11,279) | |
Total net realized gain (loss) | | 5,652,816 |
Change in net unrealized appreciation (depreciation) on: Investment securities | 3,865,599 | |
Assets and liabilities in foreign currencies | 586 | |
Total change in net unrealized appreciation (depreciation) | | 3,866,185 |
Net gain (loss) | | 9,519,001 |
Net increase (decrease) in net assets resulting from operations | | $ 9,327,855 |
Other Information | | |
Sales charges paid to FDC | | $ 28,783 |
Deferred sales charges withheld by FDC | | $ 195 |
Exchange fees withheld by
FSC | | $ 818 |
See accompanying notes which are an integral part of the financial statements.
Annual Report
Automotive Portfolio
Financial Statements - continued
Statement of Changes in Net Assets
| Year ended
February 29,
2004 | Year ended
February 28,
2003 |
Increase (Decrease) in Net Assets | | |
Operations | | |
Net investment income (loss) | $ (191,146) | $ (175,451) |
Net realized gain (loss) | 5,652,816 | (2,887,660) |
Change in net unrealized appreciation (depreciation) | 3,866,185 | (4,714,469) |
Net increase (decrease) in net assets resulting from operations | 9,327,855 | (7,777,580) |
Share transactions
Net proceeds from sales of shares | 37,276,160 | 75,730,395 |
Cost of shares redeemed | (40,423,660) | (80,473,103) |
Net increase (decrease) in net assets resulting from share transactions | (3,147,500) | (4,742,708) |
Redemption fees | 16,499 | 73,960 |
Total increase (decrease) in net assets | 6,196,854 | (12,446,328) |
| | |
Net Assets | | |
Beginning of period | 15,241,361 | 27,687,689 |
End of period | $ 21,438,215 | $ 15,241,361 |
Other Information Shares | | |
Sold | 1,322,632 | 2,822,555 |
Redeemed | (1,376,802) | (3,173,424) |
Net increase (decrease) | (54,170) | (350,869) |
Financial Highlights
Years ended February 28, | 2004 E | 2003 | 2002 | 2001 | 2000 E |
Selected Per-Share Data | | | | | |
Net asset value, beginning of period | $ 21.27 | $ 25.93 | $ 20.80 | $ 19.23 | $ 23.28 |
Income from Investment Operations | | | | | |
Net investment income (loss) C | (.22) | (.13) | (.05) | (.14) | (.12) |
Net realized and unrealized gain (loss) | 11.29 | (4.59) | 5.10 | 1.65 | (4.01) |
Total from investment operations | 11.07 | (4.72) | 5.05 | 1.51 | (4.13) |
Redemption fees added to paid in capital C | .02 | .06 | .08 | .06 | .08 |
Net asset value, end of period | $ 32.36 | $ 21.27 | $ 25.93 | $ 20.80 | $ 19.23 |
Total Return A,B | 52.14% | (17.97)% | 24.66% | 8.16% | (17.40)% |
Ratios to Average Net Assets D | | | | | |
Expenses before expense reductions | 1.78% | 1.71% | 1.90% | 2.44% | 1.94% |
Expenses net of voluntary waivers, if any | 1.78% | 1.71% | 1.90% | 2.44% | 1.94% |
Expenses net of all reductions | 1.77% | 1.68% | 1.87% | 2.43% | 1.91% |
Net investment income (loss) | (.77)% | (.52)% | (.20)% | (.65)% | (.49)% |
Supplemental Data | | | | | |
Net assets, end of period (000 omitted) | $ 21,438 | $ 15,241 | $ 27,688 | $ 11,080 | $ 10,561 |
Portfolio turnover rate | 125% | 217% | 180% | 166% | 29% |
A Total returns would have been lower had certain expenses not been reduced during the periods shown. B Total returns do not include the effect of the former sales charges. C Calculated based on average shares outstanding during the period. D Expense ratios reflect operating expenses of the fund. Expenses before reductions do not reflect amounts reimbursed by the investment adviser or reductions from brokerage service arrangements or other expense offset arrangements and do not represent the amount paid by the fund during periods when reimbursements or reductions occur. Expenses net of any voluntary waivers reflect expenses after reimbursement by the investment adviser but prior to reductions from brokerage service arrangements or other expense offset arrangements. Expenses net of all reductions represent the net expenses paid by the fund. E For the year ended February 29. |
See accompanying notes which are an integral part of the financial statements.
Cyclicals Sector
Chemicals Portfolio
Performance
Average annual total return reflects the change in the value of an investment, assuming reinvestment of the fund's dividend income and capital gains (the profits earned upon the sale of securities that have grown in value) and assuming a constant rate of performance each year. The $10,000 table and the fund's returns do not reflect the deduction of taxes that a shareholder would pay on fund distributions or the redemption of fund shares. During periods of reimbursement by Fidelity a fund's total returns will be greater than it would be had the reimbursement not occurred. How a fund did yesterday is no guarantee of how it will do tomorrow.
Average Annual Total Returns
Periods ended February 29, 2004 | Past 1
year | Past 5
years | Past 10
years |
Select Chemicals | 41.73% | 12.01% | 9.99% |
$10,000 Over 10 Years
Let's say hypothetically that $10,000 was invested in Fidelity Select Chemicals Portfolio on February 28, 1994. The chart shows how the value of your investment would have grown, and also shows how the S&P 500 Index did over the same period.
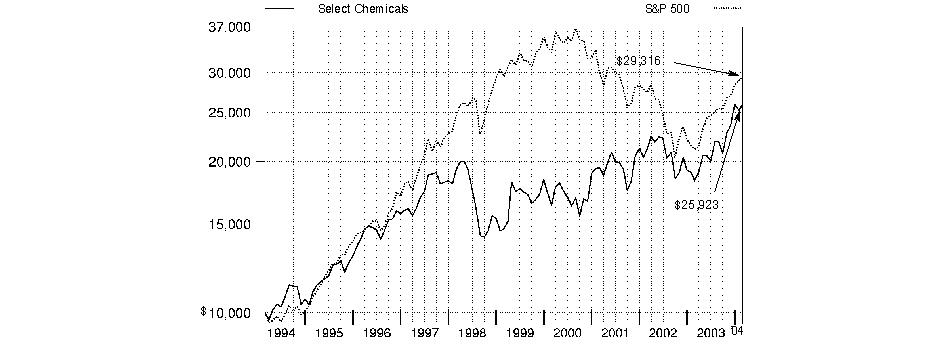
Annual Report
Chemicals Portfolio
Management's Discussion of Fund Performance
Comments from John Roth, Portfolio Manager of Fidelity® Select Chemicals Portfolio
From March 2003 through the end of February 2004, domestic stocks recovered dramatically from their prior three-year swoon, driven largely by a broad-based economic and corporate profit recovery. Most major equity benchmarks gained 35% or more during the 12-month period, led by the Russell 2000® Index - a measure of the overall small-cap universe - which advanced 64.41%. As investors grew more confident about the economy's vitality, small-cap stocks were bid up, particularly those with no current earnings. In comparison, the Wilshire 5000® Total Market Index, commonly used as a proxy for the entire U.S. stock market's performance, rose 42.47%. Every sector of the market posted a double-digit advance, with economically sensitive issues - especially technology stocks - leading the way. The tech-heavy NASDAQ Composite® Index returned 52.47% during the past year, despite a negative return in February as investors turned to the more value-oriented segments of the market. The broader Standard & Poor's 500SM Index climbed 38.52% during the year, slightly outperforming the 37.07% increase for the blue-chip Dow Jones Industrial AverageSM.
For the 12-month period that ended February 29, 2004, the fund returned 41.73%, underperforming the Goldman Sachs® Cyclical Industries Index, which rose 45.70%, but topping the S&P 500®. In addition to chemicals, the Goldman Sachs index held other types of cyclical stocks with better fundamentals and valuations, and they recovered more than the fund's holdings. The fund focused on commodity chemical producers and specialty chemical and industrial gas companies that were able to raise their prices. Dow Chemical, the fund's second-largest holding as of period end, was the top absolute contributor to performance, as it improved its competitive position by diversifying into low-cost regions and rapidly expanding markets. Industrial gas producer Praxair delivered strong earnings growth, reduced its costs and increased returns on invested capital, which resulted in a higher stock price. Turning to detractors, Solutia struggled with litigation over PCB contamination, and a combination of pension, environmental and other liabilities resulting from its split from Monsanto ultimately forced the company to seek protection under Chapter 11. Cabot Microelectronics, a maker of chemicals and materials used in the manufacturing of semiconductors, came under competitive pressure, which threatened its market-leadership position and hurt its stock price.
The views expressed in this statement reflect those of the portfolio manager only through the end of the period of the report as stated on the cover and do not necessarily represent the views of Fidelity or any other person in the Fidelity organization. Any such views are subject to change at any time based upon market or other conditions and Fidelity disclaims any responsibility to update such views. These views may not be relied on as investment advice and, because investment decisions for a Fidelity fund are based on numerous factors, may not be relied on as an indication of trading intent on behalf of any Fidelity fund.
Annual Report
Chemicals Portfolio
Investment Summary
Top Ten Stocks as of February 29, 2004 |
| % of fund's
net assets |
Lyondell Chemical Co. | 9.1 |
Dow Chemical Co. | 8.2 |
Millennium Chemicals, Inc. | 7.7 |
3M Co. | 6.5 |
Praxair, Inc. | 6.4 |
Eastman Chemical Co. | 5.9 |
Olin Corp. | 4.6 |
Cytec Industries, Inc. | 4.2 |
FMC Corp. | 3.7 |
Airgas, Inc. | 3.3 |
| 59.6 |
Top Industries as of February 29, 2004 |
% of fund's net assets |
| Chemicals | 82.6% | |
| Industrial Conglomerates | 6.5% | |
| Oil & Gas | 2.7% | |
| Leisure Equipment & Products | 2.5% | |
| Semiconductors & Semiconductor Equipment | 1.3% | |
| All Others* | 4.4% | |

* Includes short-term investments and net other assets. |
Annual Report
Chemicals Portfolio
Investments February 29, 2004
Showing Percentage of Net Assets
Common Stocks - 98.7% |
| Shares | | Value (Note 1) |
AEROSPACE & DEFENSE - 0.3% |
Hexcel Corp. (a) | 21,300 | | $ 160,815 |
CHEMICALS - 82.6% |
Airgas, Inc. | 79,200 | | 1,643,400 |
Albemarle Corp. | 17,000 | | 480,250 |
Arch Chemicals, Inc. | 26,250 | | 719,513 |
BASF AG sponsored ADR | 19,700 | | 1,053,162 |
Celanese AG | 17,200 | | 691,440 |
Crompton Corp. | 26,500 | | 197,690 |
Cytec Industries, Inc. | 60,300 | | 2,097,837 |
Dow Chemical Co. | 94,800 | | 4,120,956 |
Eastman Chemical Co. | 70,300 | | 2,977,205 |
Ferro Corp. | 47,400 | | 1,232,400 |
FMC Corp. (a) | 49,300 | | 1,848,750 |
Georgia Gulf Corp. | 37,612 | | 1,023,423 |
Hercules, Inc. (a) | 98,500 | | 1,172,150 |
IMC Global, Inc. | 130,400 | | 1,473,520 |
LG Petrochemical Co. Ltd. | 22,670 | | 561,700 |
Lyondell Chemical Co. | 259,400 | | 4,619,913 |
Millennium Chemicals, Inc. | 289,114 | | 3,865,454 |
Monsanto Co. | 32,000 | | 1,057,280 |
NOVA Chemicals Corp. | 21,100 | | 580,173 |
Olin Corp. | 128,052 | | 2,325,424 |
PolyOne Corp. (a) | 114,600 | | 658,950 |
PPG Industries, Inc. | 6,100 | | 358,009 |
Praxair, Inc. | 88,660 | | 3,220,131 |
Sinopec Beijing Yanhua Petrochemical Co. Ltd. (H Shares) (a) | 1,206,000 | | 503,520 |
Sinopec Shanghai Petrochemical Co. Ltd. sponsored ADR | 26,300 | | 1,196,650 |
Solutia, Inc. (a) | 103,600 | | 57,498 |
Spartech Corp. | 22,200 | | 524,586 |
Syngenta AG sponsored ADR | 89,500 | | 1,253,000 |
Valspar Corp. | 3,600 | | 179,532 |
TOTAL CHEMICALS | | 41,693,516 |
COMPUTERS & PERIPHERALS - 0.4% |
Applied Films Corp. (a) | 5,400 | | 188,028 |
CONTAINERS & PACKAGING - 0.5% |
Applied Extrusion Technologies, Inc. (a) | 85,946 | | 274,168 |
FOOD PRODUCTS - 1.0% |
Delta & Pine Land Co. | 19,500 | | 497,250 |
INDUSTRIAL CONGLOMERATES - 6.5% |
3M Co. | 42,100 | | 3,284,642 |
LEISURE EQUIPMENT & PRODUCTS - 2.5% |
SCP Pool Corp. (a) | 34,500 | | 1,250,625 |
METALS & MINING - 0.9% |
Nucor Corp. | 7,400 | | 465,460 |
|
| Shares | | Value (Note 1) |
OIL & GAS - 2.7% |
China Petroleum & Chemical Corp. sponsored ADR | 26,000 | | $ 1,080,820 |
EnCana Corp. | 6,300 | | 272,861 |
TOTAL OIL & GAS | | 1,353,681 |
SEMICONDUCTORS & SEMICONDUCTOR EQUIPMENT - 1.3% |
Cabot Microelectronics Corp. (a) | 15,000 | | 668,250 |
TOTAL COMMON STOCKS (Cost $40,788,980) | 49,836,435 |
Money Market Funds - 16.8% |
| | | |
Fidelity Cash Central Fund, 1.08% (b) | 1,095,528 | | 1,095,528 |
Fidelity Securities Lending Cash Central Fund, 1.08% (b) | 7,418,400 | | 7,418,400 |
TOTAL MONEY MARKET FUNDS (Cost $8,513,928) | 8,513,928 |
TOTAL INVESTMENT PORTFOLIO - 115.5% (Cost $49,302,908) | 58,350,363 |
NET OTHER ASSETS - (15.5)% | (7,848,211) |
NET ASSETS - 100% | $ 50,502,152 |
Legend |
(a) Non-income producing |
(b) Affiliated fund that is available only to investment companies and other accounts managed by Fidelity Investments. The rate quoted is the annualized seven-day yield of the fund at period end. A complete listing of the fund's holdings as of its most recent fiscal year end is available upon request. |
Other Information |
Purchases and sales of securities, other than short-term securities, aggregated $52,242,806 and $42,158,893, respectively. |
The fund placed a portion of its portfolio transactions with brokerage firms which are affiliates of the investment adviser. The commissions paid to these affiliated firms were $6,377 for the period. |
Distribution of investments by country of issue, as a percentage of total net assets, is as follows: |
United States of America | 85.7% |
China | 5.5% |
Germany | 3.5% |
Switzerland | 2.5% |
Canada | 1.7% |
Korea (South) | 1.1% |
| 100.0% |
Income Tax Information |
At February 29, 2004, the fund had a capital loss carryforward of approximately $889,000 all of which will expire on February 28, 2011. |
See accompanying notes which are an integral part of the financial statements.
Annual Report
Chemicals Portfolio
Financial Statements
Statement of Assets and Liabilities
| February 29, 2004 |
| | |
Assets | | |
Investment in securities, at value (including securities loaned of $7,314,068) (cost $49,302,908) - See accompanying schedule | | $ 58,350,363 |
Receivable for fund shares sold | | 179,596 |
Dividends receivable | | 132,906 |
Interest receivable | | 624 |
Prepaid expenses | | 168 |
Other affiliated receivables | | 2 |
Other receivables | | 14,921 |
Total assets | | 58,678,580 |
| | |
Liabilities | | |
Payable for investments purchased | $ 260,598 | |
Payable for fund shares redeemed | 426,673 | |
Accrued management fee | 24,218 | |
Other affiliated payables | 18,548 | |
Other payables and accrued expenses | 27,991 | |
Collateral on securities loaned, at value | 7,418,400 | |
Total liabilities | | 8,176,428 |
| | |
Net Assets | | $ 50,502,152 |
Net Assets consist of: | | |
Paid in capital | | $ 42,726,157 |
Undistributed net investment income | | 22,461 |
Accumulated undistributed net realized gain (loss) on investments and foreign currency transactions | | (1,294,203) |
Net unrealized appreciation (depreciation) on investments and assets and liabilities in foreign currencies | | 9,047,737 |
Net Assets, for 975,896 shares outstanding | | $ 50,502,152 |
Net Asset Value, offering price and redemption price per share ($50,502,152 ÷ 975,896 shares) | | $ 51.75 |
Statement of Operations
| Year ended February 29, 2004 |
| | |
Investment Income | | |
Dividends | | $ 972,602 |
Interest | | 14,969 |
Security lending | | 7,351 |
Total income | | 994,922 |
| | |
Expenses | | |
Management fee | $ 235,571 | |
Transfer agent fees | 228,656 | |
Accounting and security lending fees | 55,752 | |
Non-interested trustees' compensation | 247 | |
Custodian fees and expenses | 13,298 | |
Registration fees | 20,715 | |
Audit | 43,894 | |
Legal | 151 | |
Miscellaneous | 740 | |
Total expenses before reductions | 599,024 | |
Expense reductions | (19,508) | 579,516 |
Net investment income (loss) | | 415,406 |
Realized and Unrealized Gain (Loss) Net realized gain (loss) on: | | |
Investment securities | 2,847,043 | |
Foreign currency transactions | (3,899) | |
Total net realized gain (loss) | | 2,843,144 |
Change in net unrealized appreciation (depreciation) on: Investment securities | 10,067,222 | |
Assets and liabilities in foreign currencies | 282 | |
Total change in net unrealized appreciation (depreciation) | | 10,067,504 |
Net gain (loss) | | 12,910,648 |
Net increase (decrease) in net assets resulting from operations | | $ 13,326,054 |
Other Information | | |
Sales charges paid to FDC | | $ 15,045 |
Deferred sales charges withheld by FDC | | $ 2,221 |
Exchange fees withheld by
FSC | | $ 2,385 |
See accompanying notes which are an integral part of the financial statements.
Annual Report
Chemicals Portfolio
Financial Statements - continued
Statement of Changes in Net Assets
| Year ended
February 29, 2004 | Year ended
February 28, 2003 |
Increase (Decrease) in Net Assets | | |
Operations | | |
Net investment income (loss) | $ 415,406 | $ 371,037 |
Net realized gain (loss) | 2,843,144 | (3,970,601) |
Change in net unrealized appreciation (depreciation) | 10,067,504 | (3,855,915) |
Net increase (decrease) in net assets resulting from operations | 13,326,054 | (7,455,479) |
Distributions to shareholders from net investment income | (419,485) | (333,224) |
Distributions to shareholders from net realized gain | - | (142,642) |
Total distributions | (419,485) | (475,866) |
Share transactions
Net proceeds from sales of shares | 65,448,375 | 50,357,991 |
Reinvestment of distributions | 370,076 | 449,013 |
Cost of shares redeemed | (56,611,222) | (56,356,209) |
Net increase (decrease) in net assets resulting from share transactions | 9,207,229 | (5,549,205) |
Redemption fees | 49,422 | 58,409 |
Total increase (decrease) in net assets | 22,163,220 | (13,422,141) |
Net Assets | | |
Beginning of period | 28,338,932 | 41,761,073 |
End of period (including undistributed net investment income of $22,461 and undistributed net investment income of $30,439, respectively) | $ 50,502,152 | $ 28,338,932 |
Other Information Shares | | |
Sold | 1,429,710 | 1,153,025 |
Issued in reinvestment of distributions | 7,579 | 11,149 |
Redeemed | (1,231,678) | (1,363,120) |
Net increase (decrease) | 205,611 | (198,946) |
Financial Highlights
Years ended February 28, | 2004 E | 2003 | 2002 | 2001 | 2000E |
Selected Per-Share Data | | | | | |
Net asset value, beginning of period | $ 36.79 | $ 43.09 | $ 39.95 | $ 33.79 | $ 31.10 |
Income from Investment Operations | | | | | |
Net investment income (loss)C | .46 | .38 | .32 | .33 | .15 |
Net realized and unrealized gain (loss) | 14.82 | (6.21) | 2.98 | 5.95 | 3.22 |
Total from investment operations | 15.28 | (5.83) | 3.30 | 6.28 | 3.37 |
Distributions from net investment income | (.37) | (.39) | (.32) | (.26) | (.09) |
Distributions from net realized gain | - | (.14) | - | - | (.73) |
Total distributions | (.37) | (.53) | (.32) | (.26) | (.82) |
Redemption fees added to paid in capitalC | .05 | .06 | .16 | .14 | .14 |
Net asset value, end of period | $ 51.75 | $ 36.79 | $ 43.09 | $ 39.95 | $ 33.79 |
Total ReturnA,B | 41.73% | (13.49)% | 8.68% | 19.09% | 11.10% |
Ratios to Average Net AssetsD | | | | | |
Expenses before expense reductions | 1.48% | 1.54% | 1.34% | 1.61% | 1.64% |
Expenses net of voluntary waivers, if any | 1.48% | 1.54% | 1.34% | 1.61% | 1.64% |
Expenses net of all reductions | 1.43% | 1.50% | 1.23% | 1.55% | 1.63% |
Net investment income (loss) | 1.03% | .91% | .79% | .91% | .40% |
Supplemental Data | | | | | |
Net assets, end of period (000 omitted) | $ 50,502 | $ 28,339 | $ 41,761 | $ 54,421 | $ 26,307 |
Portfolio turnover rate | 107% | 114% | 221% | 187% | 132% |
ATotal returns would have been lower had certain expenses not been reduced during the periods shown. BTotal returns do not include the effect of the former sales charges. CCalculated based on average shares outstanding during the period. DExpense ratios reflect operating expenses of the fund. Expenses before reductions do not reflect amounts reimbursed by the investment adviser or reductions from brokerage service arrangements or other expense offset arrangements and do not represent the amount paid by the fund during periods when reimbursements or reductions occur. Expenses net of any voluntary waivers reflect expenses after reimbursement by the investment adviser but prior to reductions from brokerage service arrangements or other expense offset arrangements. Expenses net of all reductions represent the net expenses paid by the fund. EFor the year ended February 29.
See accompanying notes which are an integral part of the financial statements.
Cyclicals Sector
Construction and Housing Portfolio
Performance
Average annual total return reflects the change in the value of an investment, assuming reinvestment of the fund's dividend income and capital gains (the profits earned upon the sale of securities that have grown in value) and assuming a constant rate of performance each year. The $10,000 table and the fund's returns do not reflect the deduction of taxes that a shareholder would pay on fund distributions or the redemption of fund shares. During periods of reimbursement by Fidelity a fund's total returns will be greater than it would be had the reimbursement not occurred. How a fund did yesterday is no guarantee of how it will do tomorrow.
Average Annual Total Returns
Periods ended February 29, 2004 | Past 1
year | Past 5
years | Past 10
years |
Select Construction and Housing | 59.82% | 11.79% | 11.69% |
$10,000 Over 10 Years
Let's say hypothetically that $10,000 was invested in Fidelity Select Construction and Housing Portfolio on February 28, 1994. The chart shows how the value of your investment would have grown, and also shows how the S&P 500 Index did over the same period.
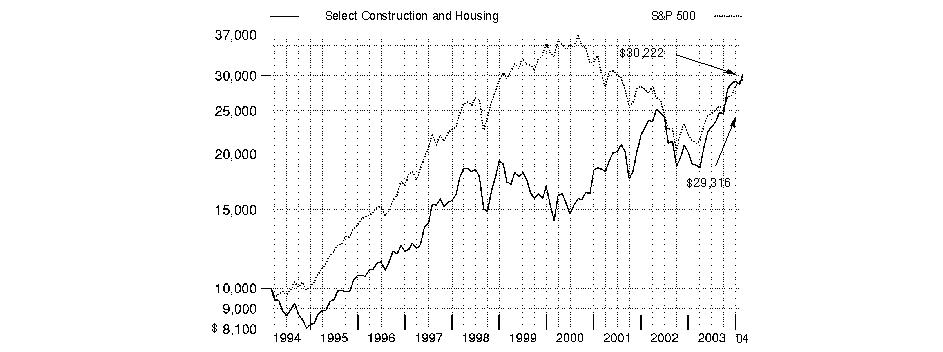
Annual Report
Construction and Housing Portfolio
Management's Discussion of Fund Performance
Comments from Robert Bao, Portfolio Manager of Fidelity® Select Construction and Housing Portfolio
From March 2003 through the end of February 2004, domestic stocks recovered dramatically from their prior three-year swoon, driven largely by a broad-based economic and corporate profit recovery. Most major equity benchmarks gained 35% or more during the 12-month period, led by the Russell 2000® Index - a measure of the overall small-cap universe - which advanced 64.41%. As investors grew more confident about the economy's vitality, small-cap stocks were bid up, particularly those with no current earnings. In comparison, the Wilshire 5000® Total Market Index, commonly used as a proxy for the entire U.S. stock market's performance, rose 42.47%. Every sector of the market posted a double-digit advance, with economically sensitive issues - especially technology stocks - leading the way. The tech-heavy NASDAQ Composite® Index returned 52.47% during the past year, despite a negative return in February as investors turned to the more value-oriented segments of the market. The broader Standard & Poor's 500SM Index climbed 38.52% during the year, slightly outperforming the 37.07% increase for the blue-chip Dow Jones Industrial AverageSM.
For the 12 months that ended on February 29, 2004, Fidelity Select Construction and Housing Portfolio posted a healthy 59.82% return, topping the 45.70% gain of the Goldman Sachs® Cyclical Industries Index and outperforming the S&P 500®. Most of the fund's robust performance came from its overweighting in the homebuilders segment, which benefited from continuing strong demand for housing. In fact, five of the top eight contributors to absolute performance were stocks from the large homebuilders group, including D.R. Horton, Toll Brothers, Lennar, Centex and Pulte Homes. Techtronic Industries, a Hong Kong-based maker of power tools, was the fund's top performer versus the Goldman Sachs benchmark, surging forward on its inherent labor cost advantages and its exclusive marketing arrangements with a large U.S. do-it-yourself chain. The biggest detractor from overall fund performance was Maytag, the major appliance maker, whose Hoover brand vacuum cleaners came under heavy pressure from lower-cost Asian imports, slowing revenues from this important part of Maytag's business. AK Steel performed poorly because of operational missteps as well as a loss of investor confidence over an ill-conceived acquisition attempt.
Note to shareholders: Ramona Persaud became Portfolio Manager of Fidelity Select Construction and Housing Portfolio on April 1, 2004.
The views expressed in this statement reflect those of the portfolio manager only through the end of the period of the report as stated on the cover and do not necessarily represent the views of Fidelity or any other person in the Fidelity organization. Any such views are subject to change at any time based upon market or other conditions and Fidelity disclaims any responsibility to update such views. These views may not be relied on as investment advice and, because investment decisions for a Fidelity fund are based on numerous factors, may not be relied on as an indication of trading intent on behalf of any Fidelity fund.
Annual Report
Construction and Housing Portfolio
Investment Summary
Top Ten Stocks as of February 29, 2004 |
| % of fund's
net assets |
Pulte Homes, Inc. | 4.2 |
D.R. Horton, Inc. | 4.0 |
Techtronic Industries Co. | 4.0 |
Toll Brothers, Inc. | 3.9 |
Home Depot, Inc. | 3.9 |
Masco Corp. | 3.9 |
Lennar Corp. Class A | 3.8 |
Countrywide Financial Corp. | 3.7 |
Lowe's Companies, Inc. | 3.6 |
Danaher Corp. | 3.5 |
| 38.5 |
Top Industries as of February 29, 2004 |
% of fund's net assets |
| Household Durables | 44.8% | |
| Machinery | 14.7% | |
| Specialty Retail | 9.9% | |
| Building Products | 8.0% | |
| Construction & Engineering | 4.9% | |
| All Others* | 17.7% | |

* Includes short-term investments and net other assets. |
Annual Report
Construction and Housing Portfolio
Investments February 29, 2004
Showing Percentage of Net Assets
Common Stocks - 99.1% |
| Shares | | Value (Note 1) |
BUILDING PRODUCTS - 8.0% |
Griffon Corp. (a) | 20,000 | | $ 449,600 |
Lennox International, Inc. | 17,000 | | 316,370 |
Masco Corp. | 134,300 | | 3,765,772 |
NCI Building Systems, Inc. (a) | 9,200 | | 223,192 |
Simpson Manufacturing Co. Ltd. | 14,400 | | 679,824 |
Trex Co., Inc. (a) | 40,800 | | 1,433,304 |
York International Corp. | 25,400 | | 948,182 |
TOTAL BUILDING PRODUCTS | | 7,816,244 |
CHEMICALS - 2.6% |
PPG Industries, Inc. | 42,900 | | 2,517,801 |
COMMERCIAL SERVICES & SUPPLIES - 2.2% |
Herman Miller, Inc. | 34,500 | | 967,380 |
HON Industries, Inc. | 30,000 | | 1,133,100 |
TOTAL COMMERCIAL SERVICES & SUPPLIES | | 2,100,480 |
CONSTRUCTION & ENGINEERING - 4.9% |
Dycom Industries, Inc. (a) | 24,200 | | 627,264 |
EMCOR Group, Inc. (a) | 36,900 | | 1,381,905 |
Fluor Corp. | 27,200 | | 1,121,456 |
Granite Construction, Inc. | 19,100 | | 463,175 |
Jacobs Engineering Group, Inc. (a) | 18,800 | | 829,644 |
MasTec, Inc. (a) | 16,200 | | 196,344 |
URS Corp. (a) | 5,900 | | 180,540 |
TOTAL CONSTRUCTION & ENGINEERING | | 4,800,328 |
CONSTRUCTION MATERIALS - 4.0% |
Eagle Materials, Inc. | 21,877 | | 1,276,523 |
Eagle Materials, Inc. Class B | 5,305 | | 298,406 |
Florida Rock Industries, Inc. | 6,450 | | 283,155 |
Martin Marietta Materials, Inc. | 12,800 | | 628,352 |
Vulcan Materials Co. | 28,600 | | 1,352,780 |
TOTAL CONSTRUCTION MATERIALS | | 3,839,216 |
ELECTRICAL EQUIPMENT - 1.1% |
A.O. Smith Corp. | 34,900 | | 1,085,390 |
HOUSEHOLD DURABLES - 44.8% |
Applica, Inc. | 90,400 | | 899,480 |
Beazer Homes USA, Inc. | 5,792 | | 619,165 |
Black & Decker Corp. | 20,850 | | 1,074,609 |
Cavco Industries, Inc. (a) | 1,320 | | 50,160 |
Centex Corp. | 31,000 | | 3,310,800 |
D.R. Horton, Inc. | 122,874 | | 3,906,164 |
|
| Shares | | Value (Note 1) |
Electrolux AB sponsored ADR | 35,100 | | $ 1,484,028 |
Fortune Brands, Inc. | 37,500 | | 2,680,500 |
Hovnanian Enterprises, Inc. Class A (a) | 9,900 | | 798,831 |
KB Home | 38,200 | | 2,763,770 |
Leggett & Platt, Inc. | 111,600 | | 2,730,852 |
Lennar Corp.: | | | |
Class A | 75,400 | | 3,728,530 |
Class B | 6,000 | | 282,180 |
Mohawk Industries, Inc. (a) | 35,571 | | 2,963,064 |
NVR, Inc. (a) | 2,000 | | 925,000 |
Pulte Homes, Inc. | 76,700 | | 4,046,692 |
Ryland Group, Inc. | 17,100 | | 1,465,812 |
Southern Energy Homes, Inc. (a) | 100,000 | | 310,000 |
Standard Pacific Corp. | 15,000 | | 784,650 |
Techtronic Industries Co. | 1,164,000 | | 3,857,969 |
The Stanley Works | 27,900 | | 1,080,567 |
Toll Brothers, Inc. (a) | 87,200 | | 3,828,080 |
TOTAL HOUSEHOLD DURABLES | | 43,590,903 |
MACHINERY - 14.7% |
Astec Industries, Inc. (a) | 23,200 | | 308,096 |
Caterpillar, Inc. | 43,400 | | 3,287,550 |
Crane Co. | 25,000 | | 803,500 |
Cummins, Inc. | 62,300 | | 3,077,620 |
Danaher Corp. | 37,900 | | 3,396,977 |
Mueller Industries, Inc. (a) | 11,900 | | 383,656 |
Navistar International Corp. (a) | 64,800 | | 3,019,680 |
TOTAL MACHINERY | | 14,277,079 |
PAPER & FOREST PRODUCTS - 1.3% |
Louisiana-Pacific Corp. | 51,000 | | 1,261,230 |
REAL ESTATE - 1.6% |
LNR Property Corp. | 6,000 | | 316,200 |
The St. Joe Co. | 29,800 | | 1,221,204 |
TOTAL REAL ESTATE | | 1,537,404 |
SPECIALTY RETAIL - 9.9% |
Home Depot, Inc. | 103,850 | | 3,770,794 |
Lowe's Companies, Inc. | 63,800 | | 3,572,800 |
Sherwin-Williams Co. | 66,400 | | 2,324,000 |
TOTAL SPECIALTY RETAIL | | 9,667,594 |
THRIFTS & MORTGAGE FINANCE - 4.0% |
Countrywide Financial Corp. | 39,086 | | 3,581,450 |
Doral Financial Corp. | 10,350 | | 353,142 |
TOTAL THRIFTS & MORTGAGE FINANCE | | 3,934,592 |
TOTAL COMMON STOCKS (Cost $76,868,837) | 96,428,261 |
Money Market Funds - 4.5% |
| Shares | | Value (Note 1) |
Fidelity Cash Central Fund, 1.08% (b) | 491,395 | | $ 491,395 |
Fidelity Securities Lending Cash Central Fund, 1.08% (b) | 3,889,813 | | 3,889,813 |
TOTAL MONEY MARKET FUNDS (Cost $4,381,208) | 4,381,208 |
TOTAL INVESTMENT PORTFOLIO - 103.6% (Cost $81,250,045) | 100,809,469 |
NET OTHER ASSETS - (3.6)% | (3,471,832) |
NET ASSETS - 100% | $ 97,337,637 |
Legend |
(a) Non-income producing |
(b) Affiliated fund that is available only to investment companies and other accounts managed by Fidelity Investments. The rate quoted is the annualized seven-day yield of the fund at period end. A complete listing of the fund's holdings as of its most recent fiscal year end is available upon request. |
Other Information |
Purchases and sales of securities, other than short-term securities, aggregated $70,230,910 and $50,877,553, respectively. |
The fund placed a portion of its portfolio transactions with brokerage firms which are affiliates of the investment adviser. The commissions paid to these affiliated firms were $2,037 for the period. |
The fund participated in the interfund lending program as a borrower. The average daily loan balance during the period for which loans were outstanding amounted to $3,117,000. The weighted average interest rate was 1.11%. Interest expense includes $192 paid under the interfund lending program. At period end there were no interfund loans outstanding. |
Income Tax Information |
At February 29, 2004, the fund had a capital loss carryforward of approximately $2,710,000 all of which will expire on February 28, 2011. |
See accompanying notes which are an integral part of the financial statements.
Cyclicals Sector
Construction and Housing Portfolio
Financial Statements
Statement of Assets and Liabilities
| February 29, 2004 |
| | |
Assets | | |
Investment in securities, at value (including securities loaned of $3,770,605) (cost $81,250,045) - See accompanying schedule | | $ 100,809,469 |
Receivable for fund shares sold | | 791,843 |
Dividends receivable | | 90,618 |
Interest receivable | | 557 |
Prepaid expenses | | 365 |
Other receivables | | 11,772 |
Total assets | | 101,704,624 |
| | |
Liabilities | | |
Payable for fund shares redeemed | $ 368,548 | |
Accrued management fee | 46,280 | |
Other affiliated payables | 35,717 | |
Other payables and accrued expenses | 26,629 | |
Collateral on securities loaned, at value | 3,889,813 | |
Total liabilities | | 4,366,987 |
| | |
Net Assets | | $ 97,337,637 |
Net Assets consist of: | | |
Paid in capital | | $ 80,553,106 |
Accumulated undistributed net realized gain (loss) on investments and foreign currency transactions | | (2,774,893) |
Net unrealized appreciation (depreciation) on investments | | 19,559,424 |
Net Assets, for 2,701,060 shares outstanding | | $ 97,337,637 |
Net Asset Value, offering price and redemption price per share ($97,337,637 ÷ 2,701,060 shares) | | $ 36.04 |
Statement of Operations
| Year ended February 29, 2004 |
| | |
Investment Income | | |
Dividends | | $ 716,881 |
Special Dividends | | 121,800 |
Interest | | 56,795 |
Security lending | | 5,430 |
Total income | | 900,906 |
| | |
Expenses | | |
Management fee | $ 439,089 | |
Transfer agent fees | 448,713 | |
Accounting and security lending fees | 62,117 | |
Non-interested trustees' compensation | 387 | |
Custodian fees and expenses | 9,525 | |
Registration fees | 25,273 | |
Audit | 44,035 | |
Legal | 292 | |
Interest | 192 | |
Miscellaneous | 1,110 | |
Total expenses before reductions | 1,030,733 | |
Expense reductions | (15,800) | 1,014,933 |
Net investment income (loss) | | (114,027) |
Realized and Unrealized Gain (Loss) Net realized gain (loss) on: | | |
Investment securities | 9,524,932 | |
Foreign currency transactions | 2,445 | |
Total net realized gain (loss) | | 9,527,377 |
Change in net unrealized appreciation (depreciation) on investment securities | | 21,450,127 |
Net gain (loss) | | 30,977,504 |
Net increase (decrease) in net assets resulting from operations | | $ 30,863,477 |
Other Information | | |
Sales charges paid to FDC | | $ 67,175 |
Deferred sales charges withheld by FDC | | $ 684 |
Exchange fees withheld by
FSC | | $ 3,135 |
See accompanying notes which are an integral part of the financial statements.
Annual Report
Construction and Housing Portfolio
Financial Statements - continued
Statement of Changes in Net Assets
| Year ended
February 29, 2004 | Year ended
February 28, 2003 |
Increase (Decrease) in Net Assets | | |
Operations | | |
Net investment income (loss) | $ (114,027) | $ (292,229) |
Net realized gain (loss) | 9,527,377 | (7,946,294) |
Change in net unrealized appreciation (depreciation) | 21,450,127 | (14,375,423) |
Net increase (decrease) in net assets resulting from operations | 30,863,477 | (22,613,946) |
Share transactions
Net proceeds from sales of shares | 119,952,507 | 123,203,252 |
Cost of shares redeemed | (100,609,332) | (137,181,423) |
Net increase (decrease) in net assets resulting from share transactions | 19,343,175 | (13,978,171) |
Redemption fees | 47,699 | 139,555 |
Total increase (decrease) in net assets | 50,254,351 | (36,452,562) |
| | |
Net Assets | | |
Beginning of period | 47,083,286 | 83,535,848 |
End of period | $ 97,337,637 | $ 47,083,286 |
Other Information Shares | | |
Sold | 3,784,882 | 4,339,869 |
Redeemed | (3,171,598) | (5,192,395) |
Net increase (decrease) | 613,284 | (852,526) |
Financial Highlights
Years ended February 28, | 2004F | 2003 | 2002 | 2001 | 2000F |
Selected Per-Share Data | | | | | |
Net asset value, beginning of period | $ 22.55 | $ 28.41 | $ 22.22 | $ 17.44 | $ 25.02 |
Income from Investment Operations | | | | | |
Net investment income (loss)C | (.05)D | (.10) | (.04) | (.01) | (.13) |
Net realized and unrealized gain (loss) | 13.52 | (5.81) | 6.34 | 5.20 | (4.11) |
Total from investment operations | 13.47 | (5.91) | 6.30 | 5.19 | (4.24) |
Distributions from net realized gain | - | - | (.17) | (.41) | (3.42) |
Distributions in excess of net realized gain | - | - | - | (.10) | - |
Total distributions | - | - | (.17) | (.51) | (3.42) |
Redemption fees added to paid in capitalC | .02 | .05 | .06 | .10 | .08 |
Net asset value, end of period | $ 36.04 | $ 22.55 | $ 28.41 | $ 22.22 | $ 17.44 |
Total ReturnA,B | 59.82% | (20.63)% | 28.87% | 30.67% | (18.28)% |
Ratios to Average Net AssetsE | | | | | |
Expenses before expense reductions | 1.37% | 1.44% | 1.45% | 2.33% | 2.42% |
Expenses net of voluntary waivers, if any | 1.37% | 1.44% | 1.45% | 2.33% | 2.42% |
Expenses net of all reductions | 1.35% | 1.41% | 1.44% | 2.32% | 2.34% |
Net investment income (loss) | (.15)% | (.37)% | (.15)% | (.06)% | (.53)% |
Supplemental Data | | | | | |
Net assets, end of period (000 omitted) | $ 97,338 | $ 47,083 | $ 83,536 | $ 20,390 | $ 7,925 |
Portfolio turnover rate | 71% | 133% | 111% | 135% | 34% |
A Total returns would have been lower had certain expenses not been reduced during the periods shown. B Total returns do not include the effect of the former sales charges. C Calculated based on average shares outstanding during the period. D Investment income per share reflects a special dividend which amounted to $.05 per share. E Expense ratios reflect operating expenses of the fund. Expenses before reductions do not reflect amounts reimbursed by the investment adviser or reductions from brokerage service arrangements or other expense offset arrangements and do not represent the amount paid by the fund during periods when reimbursements or reductions occur. Expenses net of any voluntary waivers reflect expenses after reimbursement by the investment adviser but prior to reductions from brokerage service arrangements or other expense offset arrangements. Expenses net of all reductions represent the net expenses paid by the fund. F For the year ended February 29. |
See accompanying notes which are an integral part of the financial statements.
Cyclicals Sector
Cyclical Industries Portfolio
Performance
Average annual total return reflects the change in the value of an investment, assuming reinvestment of the fund's dividend income and capital gains (the profits earned upon the sale of securities that have grown in value) and assuming a constant rate of performance each year. The $10,000 table and the fund's returns do not reflect the deduction of taxes that a shareholder would pay on fund distributions or the redemption of fund shares. During periods of reimbursement by Fidelity a fund's total returns will be greater than it would be had the reimbursement not occurred. How a fund did yesterday is no guarantee of how it will do tomorrow.
Average Annual Total Returns
Periods ended February 29, 2004 | Past 1
year | Past 5
years | Life of
fundA |
Select Cyclical Industries | 49.87% | 8.04% | 8.41% |
A From March 3, 1997
$10,000 Over Life of Fund
Let's say hypothetically that $10,000 was invested in Fidelity Select Cyclical Industries Portfolio on March 3, 1997, when the fund started. The chart shows how the value of your investment would have grown, and also shows how the S&P 500 Index did over the same period.
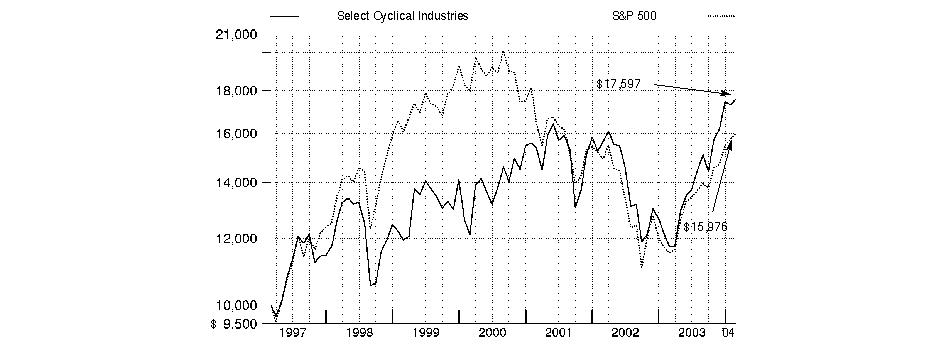
Annual Report
Cyclical Industries Portfolio
Management's Discussion of Fund Performance
Comments from Matthew Fruhan, Portfolio Manager of Fidelity® Select Cyclical Industries Portfolio
From March 2003 through the end of February 2004, domestic stocks recovered dramatically from their prior three-year swoon, driven largely by a broad-based economic and corporate profit recovery. Most major equity benchmarks gained 35% or more during the 12-month period, led by the Russell 2000® Index - a measure of the overall small-cap universe - which advanced 64.41%. As investors grew more confident about the economy's vitality, small-cap stocks were bid up, particularly those with no current earnings. In comparison, the Wilshire 5000® Total Market Index, commonly used as a proxy for the entire U.S. stock market's performance, rose 42.47%. Every sector of the market posted a double-digit advance, with economically sensitive issues - especially technology stocks - leading the way. The tech-heavy NASDAQ Composite® Index returned 52.47% during the past year, despite a negative return in February as investors turned to the more value-oriented segments of the market. The broader Standard & Poor's 500SM Index climbed 38.52% during the year, slightly outperforming the 37.07% increase for the blue-chip Dow Jones Industrial AverageSM.
For the 12 months that ended February 29, 2004, Fidelity Select Cyclical Industries Portfolio had a total return of 49.87%, beating both the Goldman Sachs® Cyclical Industries Index, which returned 45.70%, and the S&P 500®. The fund was positioned aggressively throughout the period, as I believed that cyclical stocks had a good opportunity to outperform the overall market early in the economic recovery, just as they had in the rebounds of the 1980s and 1990s. I emphasized companies with the highest operating and financial leverage in industries that typically demonstrate the first signs of a recovery in earnings. I also looked for companies where customer demand was closer to a trough than a peak, such as the machinery and commodity industries. Stocks that contributed to performance included Tyco International, a conglomerate whose stock had fallen to depressed levels amid controversies surrounding its former management; Lennar, a major home builder that continued to gain market share; and heavy construction equipment manufacturers Terex and Manitowoc. Disappointments included Solutia, a chemical company that filed for bankruptcy because of legal problems associated with environmental issues, and regional discount airline JetBlue, which fell after a period of rapid growth because of concerns about increased competition from major airlines.
The views expressed in this statement reflect those of the portfolio manager only through the end of the period of the report as stated on the cover and do not necessarily represent the views of Fidelity or any other person in the Fidelity organization. Any such views are subject to change at any time based upon market or other conditions and Fidelity disclaims any responsibility to update such views. These views may not be relied on as investment advice and, because investment decisions for a Fidelity fund are based on numerous factors, may not be relied on as an indication of trading intent on behalf of any Fidelity fund.
Annual Report
Cyclical Industries Portfolio
Investment Summary
Top Ten Stocks as of February 29, 2004 |
| % of fund's
net assets |
General Electric Co. | 9.1 |
Tyco International Ltd. | 6.7 |
Honeywell International, Inc. | 5.0 |
Boeing Co. | 3.8 |
Dow Chemical Co. | 3.5 |
3M Co. | 3.5 |
United Technologies Corp. | 2.1 |
Lockheed Martin Corp. | 2.0 |
Manitowoc Co., Inc. | 2.0 |
Millennium Chemicals, Inc. | 1.9 |
| 39.6 |
Top Industries as of February 29, 2004 |
% of fund's net assets |
| Aerospace & Defense | 20.9% | |
| Industrial Conglomerates | 19.7% | |
| Machinery | 13.7% | |
| Chemicals | 12.8% | |
| Road & Rail | 3.6% | |
| All Others* | 29.3% | |

* Includes short-term investments and net other assets. |
Annual Report
Cyclical Industries Portfolio
Investments February 29, 2004
Showing Percentage of Net Assets
Common Stocks - 95.3% |
| Shares | | Value (Note 1) |
AEROSPACE & DEFENSE - 20.9% |
BE Aerospace, Inc. (a) | 16,500 | | $ 107,910 |
Boeing Co. | 32,640 | | 1,415,597 |
Bombardier, Inc. Class B (sub. vtg.) | 75,100 | | 364,970 |
EADS NV | 8,500 | | 197,644 |
Embraer - Empresa Brasileira de Aeronautica SA sponsored ADR | 14,300 | | 431,717 |
Goodrich Corp. | 9,700 | | 286,053 |
Honeywell International, Inc. | 52,400 | | 1,836,620 |
Lockheed Martin Corp. | 15,890 | | 735,389 |
Northrop Grumman Corp. | 6,054 | | 612,120 |
Precision Castparts Corp. | 6,200 | | 279,930 |
Raytheon Co. | 2,300 | | 69,920 |
United Defense Industries, Inc. (a) | 18,600 | | 570,090 |
United Technologies Corp. | 8,621 | | 794,080 |
TOTAL AEROSPACE & DEFENSE | | 7,702,040 |
AIR FREIGHT & LOGISTICS - 2.3% |
C.H. Robinson Worldwide, Inc. | 1,550 | | 61,396 |
CNF, Inc. | 7,800 | | 259,350 |
FedEx Corp. | 5,000 | | 343,400 |
Ryder System, Inc. | 1,200 | | 44,208 |
UTI Worldwide, Inc. | 2,580 | | 116,539 |
TOTAL AIR FREIGHT & LOGISTICS | | 824,893 |
AIRLINES - 1.3% |
Alaska Air Group, Inc. (a) | 2,800 | | 72,072 |
AMR Corp. (a) | 1,000 | | 15,200 |
Continental Airlines, Inc. Class B (a) | 25,700 | | 376,505 |
Frontier Airlines, Inc. (a) | 80 | | 812 |
TOTAL AIRLINES | | 464,589 |
AUTO COMPONENTS - 2.3% |
American Axle & Manufacturing Holdings, Inc. (a) | 3,680 | | 139,877 |
BorgWarner, Inc. | 800 | | 72,160 |
Delphi Corp. | 10,000 | | 102,000 |
Dura Automotive Systems, Inc.
Class A (a) | 2,900 | | 37,120 |
Gentex Corp. | 2,800 | | 114,128 |
Goodyear Tire & Rubber Co. (a) | 11,400 | | 95,988 |
Johnson Controls, Inc. | 1,300 | | 75,816 |
Lear Corp. | 2,000 | | 123,260 |
TRW Automotive Holdings Corp. (a) | 1,100 | | 27,500 |
Visteon Corp. | 4,700 | | 47,470 |
TOTAL AUTO COMPONENTS | | 835,319 |
AUTOMOBILES - 1.1% |
Ford Motor Co. | 30,000 | | 412,500 |
|
| Shares | | Value (Note 1) |
BUILDING PRODUCTS - 1.7% |
American Standard Companies, Inc. (a) | 2,570 | | $ 280,027 |
Masco Corp. | 8,510 | | 238,620 |
Trex Co., Inc. (a) | 3,200 | | 112,416 |
TOTAL BUILDING PRODUCTS | | 631,063 |
CHEMICALS - 12.8% |
Airgas, Inc. | 6,500 | | 134,875 |
Arch Chemicals, Inc. | 1,070 | | 29,329 |
Dow Chemical Co. | 29,800 | | 1,295,406 |
E.I. du Pont de Nemours & Co. | 13,600 | | 613,224 |
Eastman Chemical Co. | 2,960 | | 125,356 |
Ferro Corp. | 3,890 | | 101,140 |
Georgia Gulf Corp. | 3,470 | | 94,419 |
Hercules, Inc. (a) | 5,000 | | 59,500 |
Lyondell Chemical Co. | 38,460 | | 684,973 |
Millennium Chemicals, Inc. | 51,590 | | 689,758 |
Minerals Technologies, Inc. | 400 | | 21,772 |
Olin Corp. | 23,000 | | 417,680 |
PolyOne Corp. (a) | 30,310 | | 174,283 |
PPG Industries, Inc. | 4,700 | | 275,843 |
TOTAL CHEMICALS | | 4,717,558 |
COMMERCIAL SERVICES & SUPPLIES - 2.9% |
Allied Waste Industries, Inc. (a) | 4,600 | | 58,098 |
Herman Miller, Inc. | 16,100 | | 451,444 |
HON Industries, Inc. | 1,400 | | 52,878 |
IKON Office Solutions, Inc. | 6,800 | | 79,900 |
Republic Services, Inc. | 9,570 | | 251,117 |
Waste Connections, Inc. (a) | 3,000 | | 113,040 |
Waste Management, Inc. | 2,500 | | 71,250 |
TOTAL COMMERCIAL SERVICES & SUPPLIES | | 1,077,727 |
CONSTRUCTION & ENGINEERING - 3.1% |
Dycom Industries, Inc. (a) | 11,500 | | 298,080 |
EMCOR Group, Inc. (a) | 8,000 | | 299,600 |
Granite Construction, Inc. | 8,200 | | 198,850 |
Jacobs Engineering Group, Inc. (a) | 1,210 | | 53,397 |
URS Corp. (a) | 8,900 | | 272,340 |
TOTAL CONSTRUCTION & ENGINEERING | | 1,122,267 |
CONSTRUCTION MATERIALS - 0.9% |
Martin Marietta Materials, Inc. | 1,070 | | 52,526 |
Texas Industries, Inc. | 6,400 | | 227,968 |
Vulcan Materials Co. | 900 | | 42,570 |
TOTAL CONSTRUCTION MATERIALS | | 323,064 |
Common Stocks - continued |
| Shares | | Value (Note 1) |
CONTAINERS & PACKAGING - 0.7% |
Owens-Illinois, Inc. (a) | 820 | | $ 10,972 |
Pactiv Corp. (a) | 11,890 | | 255,516 |
TOTAL CONTAINERS & PACKAGING | | 266,488 |
DIVERSIFIED FINANCIAL SERVICES - 0.1% |
GATX Corp. | 2,200 | | 51,744 |
DIVERSIFIED TELECOMMUNICATION SERVICES - 0.3% |
SBC Communications, Inc. | 3,900 | | 93,639 |
ELECTRICAL EQUIPMENT - 1.0% |
A.O. Smith Corp. | 7,200 | | 223,920 |
Baldor Electric Co. | 900 | | 20,925 |
Cooper Industries Ltd. Class A | 1,100 | | 58,201 |
Roper Industries, Inc. | 1,280 | | 62,144 |
TOTAL ELECTRICAL EQUIPMENT | | 365,190 |
ELECTRONIC EQUIPMENT & INSTRUMENTS - 0.9% |
Cognex Corp. | 2,400 | | 79,824 |
Mettler-Toledo International, Inc. (a) | 1,100 | | 48,400 |
Molex, Inc. | 1,900 | | 60,192 |
Tech Data Corp. (a) | 1,200 | | 48,564 |
Thermo Electron Corp. (a) | 2,830 | | 79,438 |
TOTAL ELECTRONIC EQUIPMENT & INSTRUMENTS | | 316,418 |
ENERGY EQUIPMENT & SERVICES - 0.2% |
Cooper Cameron Corp. (a) | 1,800 | | 79,596 |
HEALTH CARE EQUIPMENT & SUPPLIES - 0.2% |
Millipore Corp. (a) | 1,260 | | 65,961 |
HOUSEHOLD DURABLES - 2.0% |
Beazer Homes USA, Inc. | 200 | | 21,380 |
Black & Decker Corp. | 1,200 | | 61,848 |
D.R. Horton, Inc. | 7,200 | | 228,888 |
KB Home | 800 | | 57,880 |
Leggett & Platt, Inc. | 4,300 | | 105,221 |
Lennar Corp.: | | | |
Class A | 2,800 | | 138,460 |
Class B | 600 | | 28,218 |
Ryland Group, Inc. | 1,160 | | 99,435 |
TOTAL HOUSEHOLD DURABLES | | 741,330 |
INDUSTRIAL CONGLOMERATES - 19.7% |
3M Co. | 16,460 | | 1,284,209 |
Carlisle Companies, Inc. | 600 | | 34,170 |
General Electric Co. | 103,060 | | 3,351,509 |
Teleflex, Inc. | 800 | | 41,256 |
Textron, Inc. | 1,300 | | 71,942 |
Tyco International Ltd. | 86,830 | | 2,480,733 |
TOTAL INDUSTRIAL CONGLOMERATES | | 7,263,819 |
|
| Shares | | Value (Note 1) |
MACHINERY - 13.7% |
AGCO Corp. (a) | 28,710 | | $ 535,442 |
Astec Industries, Inc. (a) | 18,400 | | 244,352 |
Caterpillar, Inc. | 6,500 | | 492,375 |
Cummins, Inc. | 2,500 | | 123,500 |
Dover Corp. | 4,200 | | 164,598 |
IDEX Corp. | 860 | | 36,636 |
Ingersoll-Rand Co. Ltd. Class A | 7,270 | | 483,310 |
ITT Industries, Inc. | 9,000 | | 679,500 |
Kennametal, Inc. | 833 | | 36,161 |
Manitowoc Co., Inc. | 23,600 | | 731,600 |
Navistar International Corp. (a) | 2,570 | | 119,762 |
Oshkosh Truck Co. | 460 | | 27,071 |
PACCAR, Inc. | 1,342 | | 74,360 |
Parker Hannifin Corp. | 2,100 | | 117,957 |
Pentair, Inc. | 8,280 | | 447,203 |
Terex Corp. (a) | 5,400 | | 189,162 |
Timken Co. | 18,600 | | 408,828 |
Toro Co. | 1,000 | | 55,050 |
Wabash National Corp. (a) | 800 | | 22,760 |
Watts Water Technologies, Inc. Class A | 2,400 | | 55,536 |
TOTAL MACHINERY | | 5,045,163 |
METALS & MINING - 0.9% |
AK Steel Holding Corp. (a) | 5,000 | | 24,300 |
Companhia Vale do Rio Doce sponsored ADR | 1,400 | | 81,060 |
Nucor Corp. | 3,650 | | 229,585 |
TOTAL METALS & MINING | | 334,945 |
OFFICE ELECTRONICS - 0.2% |
Xerox Corp. (a) | 6,100 | | 86,254 |
OIL & GAS - 0.1% |
Overseas Shipholding Group, Inc. | 900 | | 32,310 |
PAPER & FOREST PRODUCTS - 0.3% |
Bowater, Inc. | 2,300 | | 105,570 |
ROAD & RAIL - 3.6% |
Boyd Brothers Transportation, Inc. (a) | 13,400 | | 91,388 |
Canadian National Railway Co. | 8,010 | | 315,914 |
CSX Corp. | 9,970 | | 314,354 |
Marten Transport Ltd. (a) | 600 | | 10,620 |
Norfolk Southern Corp. | 5,020 | | 111,243 |
P.A.M. Transportation Services, Inc. (a) | 1,610 | | 28,320 |
Quality Distribution, Inc. | 3,400 | | 47,464 |
Union Pacific Corp. | 5,610 | | 357,020 |
USF Corp. | 1,700 | | 60,095 |
TOTAL ROAD & RAIL | | 1,336,418 |
SEMICONDUCTORS & SEMICONDUCTOR EQUIPMENT - 0.2% |
Cabot Microelectronics Corp. (a) | 1,600 | | 71,280 |
Common Stocks - continued |
| Shares | | Value (Note 1) |
SPECIALTY RETAIL - 1.6% |
AutoNation, Inc. (a) | 5,800 | | $ 96,744 |
AutoZone, Inc. (a) | 700 | | 62,790 |
Sonic Automotive, Inc. Class A | 9,200 | | 226,320 |
Toys 'R' Us, Inc. (a) | 11,900 | | 186,830 |
TOTAL SPECIALTY RETAIL | | 572,684 |
TRADING COMPANIES & DISTRIBUTORS - 0.3% |
W.W. Grainger, Inc. | 2,440 | | 115,290 |
TOTAL COMMON STOCKS (Cost $29,566,310) | 35,055,119 |
Money Market Funds - 3.5% |
Fidelity Cash Central Fund, 1.08% (b)
(Cost $1,303,018) | 1,303,018 | | 1,303,018 |
TOTAL INVESTMENT PORTFOLIO - 98.8% (Cost $30,869,328) | 36,358,137 |
NET OTHER ASSETS - 1.2% | 439,005 |
NET ASSETS - 100% | $ 36,797,142 |
Legend |
(a) Non-income producing |
(b) Affiliated fund that is available only to investment companies and other accounts managed by Fidelity Investments. The rate quoted is the annualized seven-day yield of the fund at period end. A complete listing of the fund's holdings as of its most recent fiscal year end is available upon request. |
Other Information |
Purchases and sales of securities, other than short-term securities, aggregated $53,588,802 and $43,541,600, respectively. |
The fund placed a portion of its portfolio transactions with brokerage firms which are affiliates of the investment adviser. The commissions paid to these affiliated firms were $6,751 for the period. |
Income Tax Information |
The fund hereby designates approximately $509,000 as a capital gain dividend for the purpose of the dividend paid deduction. |
See accompanying notes which are an integral part of the financial statements.
Annual Report
Cyclical Industries Portfolio
Financial Statements
Statement of Assets and Liabilities
| February 29, 2004 |
| | |
Assets | | |
Investment in securities, at value (cost $30,869,328) - See accompanying schedule | | $ 36,358,137 |
Receivable for investments sold | | 784,918 |
Receivable for fund shares sold | | 90,550 |
Dividends receivable | | 90,606 |
Interest receivable | | 877 |
Prepaid expenses | | 111 |
Other affiliated receivables | | 4 |
Other receivables | | 5,316 |
Total assets | | 37,330,519 |
| | |
Liabilities | | |
Payable for investments purchased | $ 277,144 | |
Payable for fund shares redeemed | 193,390 | |
Accrued management fee | 18,120 | |
Other affiliated payables | 14,135 | |
Other payables and accrued expenses | 30,588 | |
Total liabilities | | 533,377 |
| | |
Net Assets | | $ 36,797,142 |
Net Assets consist of: | | |
Paid in capital | | $ 31,318,407 |
Undistributed net investment income | | 1,686 |
Accumulated undistributed net realized gain (loss) on investments and foreign currency transactions | | (12,144) |
Net unrealized appreciation (depreciation) on investments and assets and liabilities in foreign currencies | | 5,489,193 |
Net Assets, for 2,268,138 shares outstanding | | $ 36,797,142 |
Net Asset Value, offering price and redemption price per share ($36,797,142 ÷ 2,268,138 shares) | | $ 16.22 |
Statement of Operations
| Year ended February 29, 2004 |
| | |
Investment Income | | |
Dividends | | $ 456,675 |
Interest | | 9,740 |
Security lending | | 1,034 |
Total income | | 467,449 |
| | |
Expenses | | |
Management fee | $ 159,325 | |
Transfer agent fees | 138,685 | |
Accounting and security lending fees | 55,457 | |
Non-interested trustees' compensation | 113 | |
Custodian fees and expenses | 23,199 | |
Registration fees | 16,297 | |
Audit | 43,835 | |
Legal | 85 | |
Miscellaneous | 251 | |
Total expenses before reductions | 437,247 | |
Expense reductions | (9,227) | 428,020 |
Net investment income (loss) | | 39,429 |
Realized and Unrealized Gain (Loss) Net realized gain (loss) on: | | |
Investment securities | 3,585,864 | |
Foreign currency transactions | (964) | |
Total net realized gain (loss) | | 3,584,900 |
Change in net unrealized appreciation (depreciation) on: Investment securities | 6,617,432 | |
Assets and liabilities in foreign currencies | 403 | |
Total change in net unrealized appreciation (depreciation) | | 6,617,835 |
Net gain (loss) | | 10,202,735 |
Net increase (decrease) in net assets resulting from operations | | $ 10,242,164 |
Other Information | | |
Sales charges paid to FDC | | $ 15,842 |
Deferred sales charges withheld by FDC | | $ 75 |
Exchange fees withheld by
FSC | | $ 428 |
See accompanying notes which are an integral part of the financial statements.
Annual Report
Cyclical Industries Portfolio
Financial Statements - continued
Statement of Changes in Net Assets
| Year ended
February 29, 2004 | Year ended
February 28, 2003 |
Increase (Decrease) in Net Assets | | |
Operations | | |
Net investment income (loss) | $ 39,429 | $ (70,880) |
Net realized gain (loss) | 3,584,900 | (2,397,944) |
Change in net unrealized appreciation (depreciation) | 6,617,835 | (2,661,999) |
Net increase (decrease) in net assets resulting from operations | 10,242,164 | (5,130,823) |
Distributions to shareholders from net investment income | (21,204) | - |
Distributions to shareholders from net realized gain | (636,112) | - |
Total distributions | (657,316) | - |
Share transactions
Net proceeds from sales of shares | 39,201,154 | 15,318,690 |
Reinvestment of distributions | 616,179 | - |
Cost of shares redeemed | (27,756,739) | (17,769,957) |
Net increase (decrease) in net assets resulting from share transactions | 12,060,594 | (2,451,267) |
Redemption fees | 19,959 | 20,066 |
Total increase (decrease) in net assets | 21,665,401 | (7,562,024) |
Net Assets | | |
Beginning of period | 15,131,741 | 22,693,765 |
End of period (including undistributed net investment income of $1,686 and undistributed net investment income of $6,396, respectively) | $ 36,797,142 | $ 15,131,741 |
Other Information Shares | | |
Sold | 2,718,412 | 1,155,389 |
Issued in reinvestment of distributions | 39,934 | - |
Redeemed | (1,860,598) | (1,329,979) |
Net increase (decrease) | 897,748 | (174,590) |
Financial Highlights
Years ended February 28, | 2004 E | 2003 | 2002 | 2001 | 2000 E |
Selected Per-Share Data | | | | | |
Net asset value, beginning of period | $ 11.04 | $ 14.69 | $ 14.47 | $ 11.55 | $ 11.39 |
Income from Investment Operations | | | | | |
Net investment income (loss) C | .02 | (.05) | (.04) | (.07) | (.13) |
Net realized and unrealized gain (loss) | 5.46 | (3.61) | .26 | 3.11 | .21 |
Total from investment operations | 5.48 | (3.66) | .22 | 3.04 | .08 |
Distributions from net investment income | (.01) | - | - | - | - |
Distributions from net realized gain | (.30) | - | (.01) | (.06) | - |
Distributions in excess of net realized gain | - | - | - | (.11) | - |
Total distributions | (.31) | - | (.01) | (.17) | - |
Redemption fees added to paid in capital C | .01 | .01 | .01 | .05 | .08 |
Net asset value, end of period | $ 16.22 | $ 11.04 | $ 14.69 | $ 14.47 | $ 11.55 |
Total Return A,B | 49.87% | (24.85)% | 1.59% | 26.88% | 1.40% |
Ratios to Average Net Assets D | | | | | |
Expenses before expense reductions | 1.60% | 1.94% | 1.79% | 3.14% | 2.93% |
Expenses net of voluntary waivers, if any | 1.60% | 1.94% | 1.79% | 2.50% | 2.50% |
Expenses net of all reductions | 1.57% | 1.91% | 1.78% | 2.49% | 2.49% |
Net investment income (loss) | .14% | (.40)% | (.32)% | (.48)% | (1.00)% |
Supplemental Data | | | | | |
Net assets, end of period (000 omitted) | $ 36,797 | $ 15,132 | $ 22,694 | $ 8,157 | $ 4,112 |
Portfolio turnover rate | 166% | 162% | 67% | 150% | 211% |
ATotal returns would have been lower had certain expenses not been reduced during the periods shown. BTotal returns do not include the effect of the former sales charges. CCalculated based on average shares outstanding during the period. DExpense ratios reflect operating expenses of the fund. Expenses before reductions do not reflect amounts reimbursed by the investment adviser or reductions from brokerage service arrangements or other expense offset arrangements and do not represent the amount paid by the fund during periods when reimbursements or reductions occur. Expenses net of any voluntary waivers reflect expenses after reimbursement by the investment adviser but prior to reductions from brokerage service arrangements or other expense offset arrangements. Expenses net of all reductions represent the net expenses paid by the fund. EFor the year ended February 29.
See accompanying notes which are an integral part of the financial statements.
Cyclicals Sector
Defense and Aerospace Portfolio
Performance
Average annual total return reflects the change in the value of an investment, assuming reinvestment of the fund's dividend income and capital gains (the profits earned upon the sale of securities that have grown in value) and assuming a constant rate of performance each year. The $10,000 table and the fund's returns do not reflect the deduction of taxes that a shareholder would pay on fund distributions or the redemption of fund shares. During periods of reimbursement by Fidelity a fund's total returns will be greater than it would be had the reimbursement not occurred. How a fund did yesterday is no guarantee of how it will do tomorrow.
Average Annual Total Returns
Periods ended February 29, 2004 | Past 1
year | Past 5
years | Past 10
years |
Select Defense and Aerospace | 51.71% | 11.93% | 14.92% |
$10,000 Over 10 Years
Let's say hypothetically that $10,000 was invested in Fidelity Select Defense and Aerospace Portfolio on February 28, 1994. The chart shows how the value of your investment would have grown, and also shows how the S&P 500 Index did over the same period.
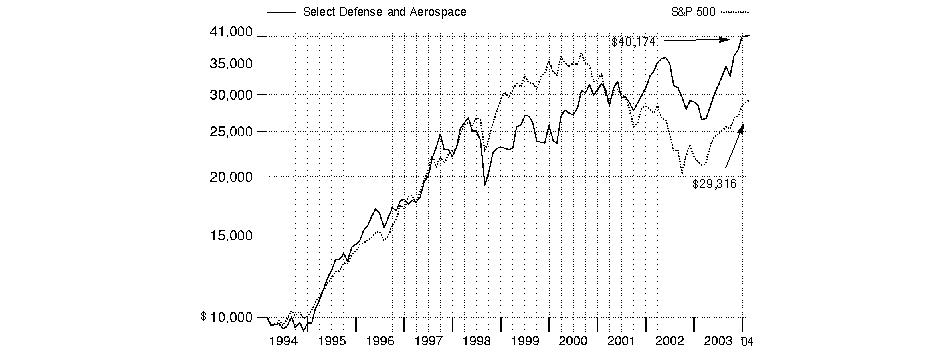
Annual Report
Defense and Aerospace Portfolio
Management's Discussion of Fund Performance
Comments from Alex Sacerdote, who managed the Fidelity® Select Defense and Aerospace Portfolio from October 1, 2003, through the end of the period
From March 2003 through the end of February 2004, domestic stocks recovered dramatically from their prior three-year swoon, driven largely by a broad-based economic and corporate profit recovery. Most major equity benchmarks gained 35% or more during the 12-month period, led by the Russell 2000® Index - a measure of the overall small-cap universe - which advanced 64.41%. As investors grew more confident about the economy's vitality, small-cap stocks were bid up, particularly those with no current earnings. In comparison, the Wilshire 5000® Total Market Index, commonly used as a proxy for the entire U.S. stock market's performance, rose 42.47%. Every sector of the market posted a double-digit advance, with economically sensitive issues - especially technology stocks - leading the way. The tech-heavy NASDAQ Composite® Index returned 52.47% during the past year, despite a negative return in February as investors turned to the more value-oriented segments of the market. The broader Standard & Poor's 500SM Index climbed 38.52% during the year, slightly outperforming the 37.07% increase for the blue-chip Dow Jones Industrial AverageSM.
For the year ending February 29, 2004, the fund gained 51.71%, outpacing the S&P 500® index and the Goldman Sachs® Cyclical Industries Index, which rose 45.70%. While aerospace and defense stocks as a group slightly lagged the cyclical index overall despite gaining nearly 44%, owning more of the right names in each subsector made the difference versus the sector benchmark. The fund's heavy weighting in commercial aerospace helped a lot, as these stocks were highly leveraged to a firming economy, including many that supply and service the aviation industry. Leading the way were companies specializing in aftermarket - or replacement - products, most notably Goodrich and Precision Castparts, both of which benefited strongly from a pickup in order activity. Good stock picking among commercial aircraft makers, including EADS - majority owner of France's Airbus - Brazil's Embraer and U.S.-based Boeing, also boosted returns as investors grew more optimistic about the companies' longer-term earnings prospects. The fund also benefited from having exposure to faster-growing areas within the defense industry, specifically the electronics/communications group - where ViaSat was a standout - and technology consulting, where Veridian - which was acquired by General Dynamics - soared. Conversely, the fund was hurt by overweighting military contractors Lockheed Martin and Northrop Grumman, industry leaders that struggled amid concerns about slower growth in defense spending. Other notable detractors within the industry were Raytheon and Alliant Techsystems.
Note to shareholders: Chris Bartel became Portfolio Manager of Fidelity Select Defense and Aerospace Portfolio on March 1, 2004.
The views expressed in this statement reflect those of the portfolio manager only through the end of the period of the report as stated on the cover and do not necessarily represent the views of Fidelity or any other person in the Fidelity organization. Any such views are subject to change at any time based upon market or other conditions and Fidelity disclaims any responsibility to update such views. These views may not be relied on as investment advice and, because investment decisions for a Fidelity fund are based on numerous factors, may not be relied on as an indication of trading intent on behalf of any Fidelity fund.
Annual Report
Defense and Aerospace Portfolio
Investment Summary
Top Ten Stocks as of February 29, 2004 |
| % of fund's
net assets |
EADS NV | 7.9 |
Goodrich Corp. | 7.8 |
Northrop Grumman Corp. | 6.5 |
Embraer - Empresa Brasileira de Aeronautica SA sponsored ADR | 6.2 |
Boeing Co. | 5.8 |
Harris Corp. | 5.6 |
Hughes Electronics Corp. | 5.0 |
Honeywell International, Inc. | 4.7 |
Precision Castparts Corp. | 4.5 |
Rockwell Collins, Inc. | 4.2 |
| 58.2 |
Top Industries as of February 29, 2004 |
% of fund's net assets |
| Aerospace & Defense | 75.9% | |
| Media | 9.3% | |
| Communications Equipment | 9.1% | |
| Electronic Equipment & Instruments | 3.0% | |
| IT Services | 2.5% | |
| All Others* | 0.2% | |

* Includes short-term investments and net other assets. |
Annual Report
Defense and Aerospace Portfolio
Investments February 29, 2004
Showing Percentage of Net Assets
Common Stocks - 99.8% |
| Shares | | Value (Note 1) |
AEROSPACE & DEFENSE - 75.9% |
AAR Corp. (a) | 430,900 | | $ 5,567,228 |
Alliant Techsystems, Inc. (a) | 117,955 | | 6,735,231 |
BE Aerospace, Inc. (a) | 424,000 | | 2,772,960 |
Boeing Co. | 433,300 | | 18,792,221 |
DRS Technologies, Inc. (a) | 129,800 | | 3,914,768 |
EADS NV | 1,095,191 | | 25,465,669 |
EDO Corp. | 32,200 | | 815,304 |
Embraer - Empresa Brasileira de Aeronautica SA sponsored ADR | 663,700 | | 20,037,103 |
Engineered Support Systems, Inc. | 90,375 | | 4,717,575 |
GenCorp, Inc. | 99,900 | | 1,126,872 |
General Dynamics Corp. | 107,600 | | 9,912,112 |
Goodrich Corp. | 846,750 | | 24,970,658 |
Honeywell International, Inc. | 428,900 | | 15,032,945 |
L-3 Communications Holdings, Inc. | 225,100 | | 12,047,352 |
Lockheed Martin Corp. | 261,000 | | 12,079,080 |
Mercury Computer Systems, Inc. (a) | 86,400 | | 2,529,792 |
Northrop Grumman Corp. | 207,224 | | 20,952,419 |
Precision Castparts Corp. | 318,400 | | 14,375,760 |
Raytheon Co. | 212,652 | | 6,464,621 |
Rockwell Collins, Inc. | 411,700 | | 13,396,718 |
Triumph Group, Inc. (a) | 146,900 | | 4,913,805 |
United Defense Industries, Inc. (a) | 309,700 | | 9,492,305 |
United Technologies Corp. | 90,300 | | 8,317,533 |
TOTAL AEROSPACE & DEFENSE | | 244,430,031 |
COMMUNICATIONS EQUIPMENT - 9.1% |
Anaren, Inc. (a) | 110,700 | | 1,900,719 |
Harris Corp. | 384,800 | | 18,181,800 |
REMEC, Inc. (a) | 531,650 | | 3,721,550 |
ViaSat, Inc. (a) | 206,600 | | 5,526,550 |
TOTAL COMMUNICATIONS EQUIPMENT | | 29,330,619 |
ELECTRONIC EQUIPMENT & INSTRUMENTS - 3.0% |
Aeroflex, Inc. (a) | 332,900 | | 4,667,258 |
Trimble Navigation Ltd. (a) | 152,300 | | 5,047,222 |
TOTAL ELECTRONIC EQUIPMENT & INSTRUMENTS | | 9,714,480 |
IT SERVICES - 2.5% |
ManTech International Corp. Class A (a) | 143,600 | | 2,998,368 |
SRA International, Inc. Class A (a) | 127,000 | | 4,889,500 |
TOTAL IT SERVICES | | 7,887,868 |
MEDIA - 9.3% |
EchoStar Communications Corp.
Class A (a) | 96,700 | | 3,492,804 |
|
| Shares | | Value (Note 1) |
Hughes Electronics Corp. (a) | 928,011 | | $ 16,091,711 |
PanAmSat Corp. (a) | 457,500 | | 10,453,875 |
TOTAL MEDIA | | 30,038,390 |
TOTAL COMMON STOCKS (Cost $268,623,979) | 321,401,388 |
Money Market Funds - 3.2% |
| | | |
Fidelity Securities Lending Cash Central Fund, 1.08% (b)
(Cost $10,204,803) | 10,204,803 | | 10,204,803 |
TOTAL INVESTMENT PORTFOLIO - 103.0% (Cost $278,828,782) | | 331,606,191 |
NET OTHER ASSETS - (3.0)% | | (9,691,037) |
NET ASSETS - 100% | $ 321,915,154 |
Legend |
(a) Non-income producing |
(b) Affiliated fund that is available only to investment companies and other accounts managed by Fidelity Investments. The rate quoted is the annualized seven-day yield of the fund at period end. A complete listing of the fund's holdings as of its most recent fiscal year end is available upon request. |
Other Information |
Purchases and sales of securities, other than short-term securities, aggregated $127,567,108 and $175,710,094, respectively. |
The fund placed a portion of its portfolio transactions with brokerage firms which are affiliates of the investment adviser. The commissions paid to these affiliated firms were $11,915 for the period. |
Distribution of investments by country of issue, as a percentage of total net assets, is as follows: |
United States of America | 85.9% |
Netherlands | 7.9% |
Brazil | 6.2% |
| 100.0% |
Income Tax Information |
At February 29, 2004, the fund had a capital loss carryforward of approximately $515,000 all of which will expire on February 28, 2011. |
The fund intends to elect to defer to its fiscal year ending February 28, 2005 approximately $3,919,000 of losses recognized during the period November 1, 2003 to February 29, 2004. |
See accompanying notes which are an integral part of the financial statements.
Annual Report
Defense and Aerospace Portfolio
Financial Statements
Statement of Assets and Liabilities
| February 29, 2004 |
| | |
Assets | | |
Investment in securities, at value (including securities loaned of $9,941,523) (cost $278,828,782) - See accompanying schedule | | $ 331,606,191 |
Receivable for investments sold | | 4,537,363 |
Receivable for fund shares sold | | 320,263 |
Dividends receivable | | 388,990 |
Interest receivable | | 2,491 |
Prepaid expenses | | 1,280 |
Other affiliated receivables | | 112 |
Other receivables | | 64,076 |
Total assets | | 336,920,766 |
| | |
Liabilities | | |
Payable to custodian bank | $ 2,836,681 | |
Payable for fund shares redeemed | 1,661,940 | |
Accrued management fee | 159,471 | |
Other affiliated payables | 114,140 | |
Other payables and accrued expenses | 28,577 | |
Collateral on securities loaned, at value | 10,204,803 | |
Total liabilities | | 15,005,612 |
| | |
Net Assets | | $ 321,915,154 |
Net Assets consist of: | | |
Paid in capital | | $ 274,969,758 |
Accumulated undistributed net realized gain (loss) on investments and foreign currency transactions | | (5,832,013) |
Net unrealized appreciation (depreciation) on investments | | 52,777,409 |
Net Assets, for 5,845,667 shares outstanding | | $ 321,915,154 |
Net Asset Value, offering price and redemption price per share ($321,915,154 ÷ 5,845,667 shares) | | $ 55.07 |
Statement of Operations
| Year ended February 29, 2004 |
| | |
Investment Income | | |
Dividends | | $ 2,805,791 |
Interest | | 53,185 |
Security lending | | 56,682 |
Total income | | 2,915,658 |
| | |
Expenses | | |
Management fee | $ 1,603,226 | |
Transfer agent fees | 1,638,100 | |
Accounting and security lending fees | 175,751 | |
Non-interested trustees' compensation | 1,406 | |
Custodian fees and expenses | 17,317 | |
Registration fees | 28,766 | |
Audit | 44,955 | |
Legal | 1,346 | |
Miscellaneous | 10,600 | |
Total expenses before reductions | 3,521,467 | |
Expense reductions | (92,033) | 3,429,434 |
Net investment income (loss) | | (513,776) |
Realized and Unrealized Gain (Loss) Net realized gain (loss) on: | | |
Investment securities | 28,394,768 | |
Foreign currency transactions | (17,013) | |
Total net realized gain (loss) | | 28,377,755 |
Change in net unrealized appreciation (depreciation) on investment securities | | 82,494,151 |
Net gain (loss) | | 110,871,906 |
Net increase (decrease) in net assets resulting from operations | | $ 110,358,130 |
Other Information | | |
Sales charges paid to FDC | | $ 179,190 |
Deferred sales charges withheld by FDC | | $ 1,493 |
Exchange fees withheld by
FSC | | $ 11,603 |
See accompanying notes which are an integral part of the financial statements.
Annual Report
Defense and Aerospace Portfolio
Financial Statements - continued
Statement of Changes in Net Assets
| Year ended
February 29,
2004 | Year ended
February 28,
2003 |
Increase (Decrease) in Net Assets | | |
Operations | | |
Net investment income (loss) | $ (513,776) | $ 9,481 |
Net realized gain (loss) | 28,377,755 | (30,046,047) |
Change in net unrealized appreciation (depreciation) | 82,494,151 | (66,655,713) |
Net increase (decrease) in net assets resulting from operations | 110,358,130 | (96,692,279) |
Distributions to shareholders from net investment income | - | (310,532) |
Share transactions
Net proceeds from sales of shares | 129,945,447 | 419,033,641 |
Reinvestment of distributions | - | 300,378 |
Cost of shares redeemed | (182,745,505) | (345,149,163) |
Net increase (decrease) in net assets resulting from share transactions | (52,800,058) | 74,184,856 |
Redemption fees | 55,969 | 287,781 |
Total increase (decrease) in net assets | 57,614,041 | (22,530,174) |
| | |
Net Assets | | |
Beginning of period | 264,301,113 | 286,831,287 |
End of period | $ 321,915,154 | $ 264,301,113 |
Other Information Shares | | |
Sold | 2,674,669 | 9,168,302 |
Issued in reinvestment of distributions | - | 6,191 |
Redeemed | (4,109,112) | (8,119,537) |
Net increase (decrease) | (1,434,443) | 1,054,956 |
Financial Highlights
Years ended February 28, | 2004 E | 2003 | 2002 | 2001 | 2000 E |
Selected Per-Share Data | | | | | |
Net asset value, beginning of period | $ 36.30 | $ 46.08 | $ 42.83 | $ 34.36 | $ 33.85 |
Income from Investment Operations | | | | | |
Net investment income (loss) C | (.09) | - F | .15 | .03 | (.15) |
Net realized and unrealized gain (loss) | 18.85 | (9.77) | 3.59 | 10.19 | 1.14 |
Total from investment operations | 18.76 | (9.77) | 3.74 | 10.22 | .99 |
Distributions from net investment income | - | (.04) | (.05) | (.02) | - |
Distributions from net realized gain | - | - | (.49) | (1.81) | (.59) |
Total distributions | - | (.04) | (.54) | (1.83) | (.59) |
Redemption fees added to paid in capital C | .01 | .03 | .05 | .08 | .11 |
Net asset value, end of period | $ 55.07 | $ 36.30 | $ 46.08 | $ 42.83 | $ 34.36 |
Total Return A,B | 51.71% | (21.16)% | 9.09% | 30.45% | 3.24% |
Ratios to Average Net Assets D | | | | | |
Expenses before expense reductions | 1.28% | 1.25% | 1.23% | 1.52% | 1.61% |
Expenses net of voluntary waivers, if any | 1.28% | 1.25% | 1.23% | 1.52% | 1.61% |
Expenses net of all reductions | 1.24% | 1.21% | 1.19% | 1.49% | 1.59% |
Net investment income (loss) | (.19)% | -% | .37% | .08% | (.42)% |
Supplemental Data | | | | | |
Net assets, end of period (000 omitted) | $ 321,915 | $ 264,301 | $ 286,831 | $ 78,270 | $ 21,406 |
Portfolio turnover rate | 47% | 79% | 76% | 119% | 146% |
A Total returns would have been lower had certain expenses not been reduced during the periods shown. B Total returns do not include the effect of the former sales charges. C Calculated based on average shares outstanding during the period. D Expense ratios reflect operating expenses of the fund. Expenses before reductions do not reflect amounts reimbursed by the investment adviser or reductions from brokerage service arrangements or other expense offset arrangements and do not represent the amount paid by the fund during periods when reimbursements or reductions occur. Expenses net of any voluntary waivers reflect expenses after reimbursement by the investment adviser but prior to reductions from brokerage service arrangements or other expense offset arrangements. Expenses net of all reductions represent the net expenses paid by the fund. E For the year ended February 29. F Amount represents less than $.01 per share. |
Cyclicals Sector
See accompanying notes which are an integral part of the financial statements.
Environmental Portfolio
Performance
Average annual total return reflects the change in the value of an investment, assuming reinvestment of the fund's dividend income and capital gains (the profits earned upon the sale of securities that have grown in value) and assuming a constant rate of performance each year. The $10,000 table and the fund's returns do not reflect the deduction of taxes that a shareholder would pay on fund distributions or the redemption of fund shares. During periods of reimbursement by Fidelity a fund's total returns will be greater than it would be had the reimbursement not occurred. How a fund did yesterday is no guarantee of how it will do tomorrow.
Average Annual Total Returns
Periods ended February 29, 2004 | Past 1
year | Past 5
years | Past 10
years |
Select Environmental | 36.87% | 0.82% | 1.67% |
$10,000 Over 10 Years
Let's say hypothetically that $10,000 was invested in Fidelity Select Environmental Portfolio on February 28, 1994. The chart shows what the value of your investment would have been, and also shows how the S&P 500 Index did over the same period.
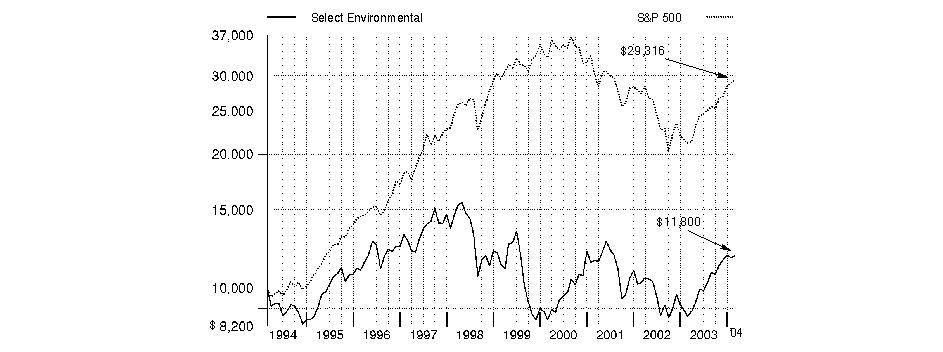
Annual Report
Environmental Portfolio
Management's Discussion of Fund Performance
Comments from Douglas Simmons, who became Portfolio Manager of Fidelity® Select Environmental Portfolio on February 1, 2004
From March 2003 through the end of February 2004, domestic stocks recovered dramatically from their prior three-year swoon, driven largely by a broad-based economic and corporate profit recovery. Most major equity benchmarks gained 35% or more during the 12-month period, led by the Russell 2000® Index - a measure of the overall small-cap universe - which advanced 64.41%. As investors grew more confident about the economy's vitality, small-cap stocks were bid up, particularly those with no current earnings. In comparison, the Wilshire 5000® Total Market Index, commonly used as a proxy for the entire U.S. stock market's performance, rose 42.47%. Every sector of the market posted a double-digit advance, with economically sensitive issues - especially technology stocks - leading the way. The tech-heavy NASDAQ Composite® Index returned 52.47% during the past year, despite a negative return in February as investors turned to the more value-oriented segments of the market. The broader Standard & Poor's 500SM Index climbed 38.52% during the year, slightly outperforming the 37.07% increase for the blue-chip Dow Jones Industrial AverageSM.
For the 12 months ending February 29, 2004, the fund returned 36.87%, trailing the 45.70% gain for the Goldman Sachs® Cyclical Industries Index and the S&P 500® index. Although the fund had a strong absolute return, it underperformed its benchmarks primarily because environmental stocks tend to exhibit more defensive characteristics than stocks in many other cyclical industries. Put another way, the earnings of many environmental businesses tend to be less economically sensitive than other businesses whose profits are more closely tied to the strength of the economy. More specifically, maintaining a higher exposure to strong-performing filtration stocks, such as Donaldson and Millipore, helped boost the fund's performance relative to its sector benchmark. Overweighting several organic food stocks that outperformed the Goldman Sachs index, including Whole Foods Market and United Natural Foods, also made a significant contribution to the fund's relative performance. In terms of disappointments, several environmental holdings had positive returns but failed to keep up with the cyclical index. These included oil disposal services company Newpark Resources, and waste removal companies Republic Services and Waste Connections.
The views expressed in this statement reflect those of the portfolio manager only through the end of the period of the report as stated on the cover and do not necessarily represent the views of Fidelity or any other person in the Fidelity organization. Any such views are subject to change at any time based upon market or other conditions and Fidelity disclaims any responsibility to update such views. These views may not be relied on as investment advice and, because investment decisions for a Fidelity fund are based on numerous factors, may not be relied on as an indication of trading intent on behalf of any Fidelity fund.
Annual Report
Environmental Portfolio
Investment Summary
Top Ten Stocks as of February 29, 2004 |
| % of fund's
net assets |
Whole Foods Market, Inc. | 8.2 |
Tetra Tech, Inc. | 6.1 |
Donaldson Co., Inc. | 6.0 |
Republic Services, Inc. | 5.8 |
Millipore Corp. | 5.6 |
Pall Corp. | 5.6 |
Waste Management, Inc. | 5.1 |
Calpine Corp. | 5.0 |
Allied Waste Industries, Inc. | 4.8 |
Newpark Resources, Inc. | 4.2 |
| 56.4 |
Top Industries as of February 29, 2004 |
% of fund's net assets |
| Commercial Services & Supplies | 29.0% | |
| Machinery | 22.9% | |
| Food & Staples Retailing | 12.6% | |
| Multi-Utilities & Unregulated Power | 8.8% | |
| Health Care Equipment & Supplies | 5.6% | |
| All Others* | 21.1% | |

* Includes short-term investments and net other assets. |
Annual Report
Environmental Portfolio
Investments February 29, 2004
Showing Percentage of Net Assets
Common Stocks - 97.2% |
| Shares | | Value (Note 1) |
BUILDING PRODUCTS - 1.7% |
Trex Co., Inc. (a) | 6,000 | | $ 210,780 |
CHEMICALS - 0.8% |
Calgon Carbon Corp. | 13,600 | | 96,288 |
COMMERCIAL SERVICES & SUPPLIES - 29.0% |
Allied Waste Industries, Inc. (a) | 46,460 | | 586,790 |
Casella Waste Systems, Inc. Class A (a) | 19,200 | | 250,176 |
Herman Miller, Inc. | 1,500 | | 42,060 |
Ionics, Inc. (a) | 6,600 | | 183,480 |
Republic Services, Inc. | 27,000 | | 708,480 |
Tetra Tech, Inc. (a) | 35,200 | | 749,760 |
Waste Connections, Inc. (a) | 10,900 | | 410,712 |
Waste Management, Inc. | 22,093 | | 629,651 |
TOTAL COMMERCIAL SERVICES & SUPPLIES | | 3,561,109 |
ELECTRICAL EQUIPMENT - 0.2% |
FuelCell Energy, Inc. (a) | 2,000 | | 26,280 |
ENERGY EQUIPMENT & SERVICES - 4.2% |
Newpark Resources, Inc. (a) | 101,100 | | 510,555 |
FOOD & STAPLES RETAILING - 12.6% |
United Natural Foods, Inc. (a) | 6,800 | | 313,820 |
Whole Foods Market, Inc. | 13,000 | | 1,005,550 |
Wild Oats Markets, Inc. (a) | 18,300 | | 232,410 |
TOTAL FOOD & STAPLES RETAILING | | 1,551,780 |
FOOD PRODUCTS - 1.5% |
SunOpta, Inc. (a) | 18,600 | | 189,976 |
HEALTH CARE EQUIPMENT & SUPPLIES - 5.6% |
Millipore Corp. (a) | 13,100 | | 685,785 |
HOUSEHOLD DURABLES - 0.3% |
Leggett & Platt, Inc. | 1,600 | | 39,152 |
MACHINERY - 22.9% |
CLARCOR, Inc. | 7,900 | | 340,885 |
CUNO, Inc. (a) | 10,100 | | 432,886 |
Donaldson Co., Inc. | 12,900 | | 735,687 |
ESCO Technologies, Inc. (a) | 7,900 | | 357,080 |
Kadant, Inc. (a) | 2,706 | | 56,150 |
Pall Corp. | 26,200 | | 685,654 |
Zenon Environmental, Inc. (a) | 13,000 | | 195,664 |
TOTAL MACHINERY | | 2,804,006 |
MULTI-UTILITIES & UNREGULATED POWER - 8.8% |
Calpine Corp. (a) | 112,000 | | 617,120 |
Veolia Environnement sponsored ADR | 15,500 | | 461,900 |
TOTAL MULTI-UTILITIES & UNREGULATED POWER | | 1,079,020 |
|
| Shares | | Value (Note 1) |
PAPER & FOREST PRODUCTS - 0.4% |
International Paper Co. | 1,100 | | $ 48,686 |
PERSONAL PRODUCTS - 1.9% |
NBTY, Inc. (a) | 7,000 | | 232,820 |
SEMICONDUCTORS & SEMICONDUCTOR EQUIPMENT - 3.5% |
Asyst Technologies, Inc. (a) | 20,400 | | 202,572 |
Mykrolis Corp. (a) | 15,000 | | 226,200 |
TOTAL SEMICONDUCTORS & SEMICONDUCTOR EQUIPMENT | | 428,772 |
SPECIALTY RETAIL - 3.8% |
Select Comfort Corp. (a) | 17,000 | | 460,190 |
TOTAL COMMON STOCKS (Cost $11,154,460) | 11,925,199 |
Money Market Funds - 18.6% |
| | | |
Fidelity Cash Central Fund, 1.08% (b) | 440,979 | | 440,979 |
Fidelity Securities Lending Cash Central Fund, 1.08% (b) | 1,841,250 | | 1,841,250 |
TOTAL MONEY MARKET FUNDS (Cost $2,282,229) | 2,282,229 |
TOTAL INVESTMENT PORTFOLIO - 115.8% (Cost $13,436,689) | 14,207,428 |
NET OTHER ASSETS - (15.8)% | (1,938,278) |
NET ASSETS - 100% | $ 12,269,150 |
Legend |
(a) Non-income producing |
(b) Affiliated fund that is available only to investment companies and other accounts managed by Fidelity Investments. The rate quoted is the annualized seven-day yield of the fund at period end. A complete listing of the fund's holdings as of its most recent fiscal year end is available upon request. |
Other Information |
Purchases and sales of securities, other than short-term securities, aggregated $10,569,918 and $12,092,554, respectively. |
The fund placed a portion of its portfolio transactions with brokerage firms which are affiliates of the investment adviser. The commissions paid to these affiliated firms were $5,241 for the period. |
Income Tax Information |
At February 29, 2004, the fund had a capital loss carryforward of approximately $2,923,000 of which $253,000, $1,937,000 and $733,000 will expire on February 28, 2010, 2011 and February 29, 2012, respectively. |
See accompanying notes which are an integral part of the financial statements.
Annual Report
Environmental Portfolio
Financial Statements
Statement of Assets and Liabilities
| February 29, 2004 |
Assets | | |
Investment in securities, at value (including securities loaned of $1,792,290) (cost $13,436,689) - See accompanying schedule | | $ 14,207,428 |
Receivable for investments sold | | 412,047 |
Receivable for fund shares sold | | 8,866 |
Dividends receivable | | 5,891 |
Interest receivable | | 304 |
Prepaid expenses | | 59 |
Other receivables | | 2,671 |
Total assets | | 14,637,266 |
Liabilities | | |
Payable for investments purchased | $ 454,164 | |
Payable for fund shares redeemed | 24,276 | |
Accrued management fee | 13,114 | |
Other affiliated payables | 8,886 | |
Other payables and accrued expenses | 26,426 | |
Collateral on securities loaned, at value | 1,841,250 | |
Total liabilities | | 2,368,116 |
| | |
Net Assets | | $ 12,269,150 |
Net Assets consist of: | | |
Paid in capital | | $ 14,670,013 |
Accumulated undistributed net realized gain (loss) on investments and foreign currency transactions | | (3,171,602) |
Net unrealized appreciation (depreciation) on investments | | 770,739 |
Net Assets, for 923,470 shares outstanding | | $ 12,269,150 |
Net Asset Value, offering price and redemption price per share ($12,269,150 ÷ 923,470 shares) | | $ 13.29 |
Statement of Operations
| Year ended February 29, 2004 |
Investment Income | | |
Dividends | | $ 38,905 |
Interest | | 3,154 |
Security lending | | 3,293 |
Total income | | 45,352 |
Expenses | | |
Management fee | $ 69,626 | |
Transfer agent fees | 112,989 | |
Accounting and security lending fees | 55,608 | |
Non-interested trustees' compensation | 60 | |
Custodian fees and expenses | 10,668 | |
Registration fees | 14,358 | |
Audit | 43,773 | |
Legal | 216 | |
Miscellaneous | 522 | |
Total expenses before reductions | 307,820 | |
Expense reductions | (8,051) | 299,769 |
Net investment income (loss) | | (254,417) |
Realized and Unrealized Gain (Loss) Net realized gain (loss) on: | | |
Investment securities | 544,635 | |
Foreign currency transactions | (1,302) | |
Total net realized gain (loss) | | 543,333 |
Change in net unrealized appreciation (depreciation) on: Investment securities | 3,356,141 | |
Assets and liabilities in foreign currencies | (72) | |
Total change in net unrealized appreciation (depreciation) | | 3,356,069 |
Net gain (loss) | | 3,899,402 |
Net increase (decrease) in net assets resulting from operations | | $ 3,644,985 |
Other Information | | |
Sales charges paid to FDC | | $ 6,981 |
Deferred sales charges withheld by FDC | | $ 1,119 |
Exchange fees withheld by
FSC | | $ 428 |
See accompanying notes which are an integral part of the financial statements.
Annual Report
Environmental Portfolio
Financial Statements - continued
Statement of Changes in Net Assets
| Year ended
February 29,
2004 | Year ended
February 28,
2003 |
Increase (Decrease) in Net Assets | | |
Operations | | |
Net investment income (loss) | $ (254,417) | $ (233,259) |
Net realized gain (loss) | 543,333 | (1,517,230) |
Change in net unrealized appreciation (depreciation) | 3,356,069 | (162,529) |
Net increase (decrease) in net assets resulting from operations | 3,644,985 | (1,913,018) |
Share transactions
Net proceeds from sales of shares | 5,478,846 | 11,704,469 |
Cost of shares redeemed | (6,846,116) | (12,288,494) |
Net increase (decrease) in net assets resulting from share transactions | (1,367,270) | (584,025) |
Redemption fees | 4,492 | 13,282 |
Total increase (decrease) in net assets | 2,282,207 | (2,483,761) |
| | |
Net Assets | | |
Beginning of period | 9,986,943 | 12,470,704 |
End of period | $ 12,269,150 | $ 9,986,943 |
Other Information Shares | | |
Sold | 471,001 | 1,123,278 |
Redeemed | (576,560) | (1,170,975) |
Net increase (decrease) | (105,559) | (47,697) |
Financial Highlights
Years ended February 28, | 2004 E | 2003 | 2002 | 2001 | 2000 E |
Selected Per-Share Data | | | | | |
Net asset value, beginning of period | $ 9.71 | $ 11.58 | $ 12.98 | $ 9.57 | $ 12.77 |
Income from Investment Operations | | | | | |
Net investment income (loss) C | (.25) | (.20) | (.17) | (.13) | (.21) |
Net realized and unrealized gain (loss) | 3.83 | (1.68) | (1.25) | 3.51 | (3.03) |
Total from investment operations | 3.58 | (1.88) | (1.42) | 3.38 | (3.24) |
Distributions in excess of net realized gain | - | - | - | - | (.01) |
Redemption fees added to paid in capital C | - F | .01 | .02 | .03 | .05 |
Net asset value, end of period | $ 13.29 | $ 9.71 | $ 11.58 | $ 12.98 | $ 9.57 |
Total ReturnA,B | 36.87% | (16.15)% | (10.79)% | 35.63% | (25.00)% |
Ratios to Average Net Assets D | | | | | |
Expenses before expense reductions | 2.57% | 2.64% | 2.00% | 1.92% | 2.47% |
Expenses net of voluntary waivers, if any | 2.50% | 2.50% | 2.00% | 1.92% | 2.47% |
Expenses net of all reductions | 2.50% | 2.45% | 1.98% | 1.88% | 2.39% |
Net investment income (loss) | (2.12)% | (1.92)% | (1.32)% | (1.17)% | (1.76)% |
Supplemental Data | | | | | |
Net assets, end of period (000 omitted) | $ 12,269 | $ 9,987 | $ 12,471 | $ 24,668 | $ 17,553 |
Portfolio turnover rate | 90% | 67% | 109% | 168% | 206% |
A Total returns would have been lower had certain expenses not been reduced during the periods shown. B Total returns do not include the effect of the former sales charges. C Calculated based on average shares outstanding during the period. D Expense ratios reflect operating expenses of the fund. Expenses before reductions do not reflect amounts reimbursed by the investment adviser or reductions from brokerage service arrangements or other expense offset arrangements and do not represent the amount paid by the fund during periods when reimbursements or reductions occur. Expenses net of any voluntary waivers reflect expenses after reimbursement by the investment adviser but prior to reductions from brokerage service arrangements or other expense offset arrangements. Expenses net of all reductions represent the net expenses paid by the fund. E For the year ended February 29. F Amount represents less than $.01 per share. |
See accompanying notes which are an integral part of the financial statements.
Cyclicals Sector
Industrial Equipment Portfolio
Performance
Average annual total return reflects the change in the value of an investment, assuming reinvestment of the fund's dividend income and capital gains (the profits earned upon the sale of securities that have grown in value) and assuming a constant rate of performance each year. The $10,000 table and the fund's returns do not reflect the deduction of taxes that a shareholder would pay on fund distributions or the redemption of fund shares. During periods of reimbursement by Fidelity a fund's total returns will be greater than it would be had the reimbursement not occurred. How a fund did yesterday is no guarantee of how it will do tomorrow.
Average Annual Total Returns
Periods ended February 29, 2004 | Past 1
year | Past 5
years | Past 10
years |
Select Industrial Equipment | 53.75% | 4.52% | 9.66% |
$10,000 Over 10 Years
Let's say hypothetically that $10,000 was invested in Fidelity Select Industrial Equipment Portfolio on February 28, 1994. The chart shows how the value of your investment would have grown, and also shows how the S&P 500 Index did over the same period.
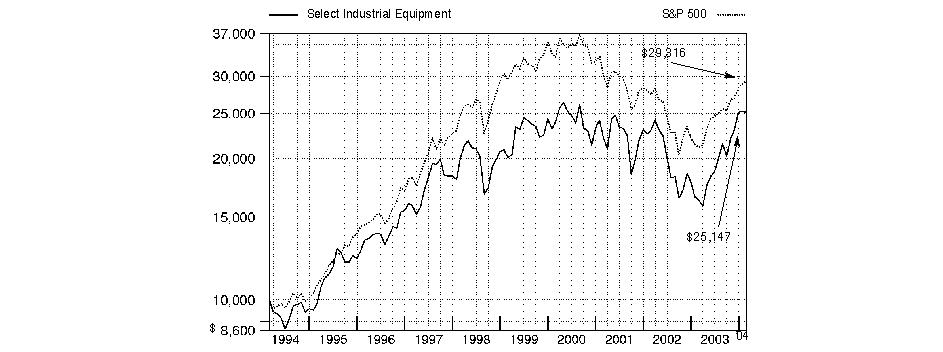
Annual Report
Industrial Equipment Portfolio
Management's Discussion of Fund Performance
Comments from Chris Bartel, Portfolio Manager of Fidelity® Select Industrial Equipment Portfolio
From March 2003 through the end of February 2004, domestic stocks recovered dramatically from their prior three-year swoon, driven largely by a broad-based economic and corporate profit recovery. Most major equity benchmarks gained 35% or more during the 12-month period, led by the Russell 2000® Index - a measure of the overall small-cap universe - which advanced 64.41%. As investors grew more confident about the economy's vitality, small-cap stocks were bid up, particularly those with no current earnings. In comparison, the Wilshire 5000® Total Market Index, commonly used as a proxy for the entire U.S. stock market's performance, rose 42.47%. Every sector of the market posted a double-digit advance, with economically sensitive issues - especially technology stocks - leading the way. The tech-heavy NASDAQ Composite® Index returned 52.47% during the past year, despite a negative return in February as investors turned to the more value-oriented segments of the market. The broader Standard & Poor's 500SM Index climbed 38.52% during the year, slightly outperforming the 37.07% increase for the blue-chip Dow Jones Industrial AverageSM.
For the year ending February 29, 2004, the fund rose 53.75%, topping the Goldman Sachs® Cyclical Industries Index, which rose 45.70%, and the S&P 500®. Cyclical stocks enjoyed a sustained rally during the past year as the economy shifted into high gear. Industrial equipment issues showed particularly strong gains, outpacing the Goldman Sachs index and the broader market, as investors grew more optimistic about a rebound in the industrial economy. Most of our advantage versus the sector benchmark came from the machinery space, where I focused on cheap mobile equipment stocks likely to benefit from a strong replacement cycle. That strategy paid off, with big moves from holdings such as Terex, Caterpillar, Ingersoll-Rand and Eaton. The fund also enjoyed strong stock selection in industrial conglomerates, where Tyco International was a successful turnaround. Other major contributors for the year were Honeywell, defense contractor Titan and building products maker American Standard. On the downside, the fund was hurt by one poor pick in energy services, Weatherford International, which struggled due to a delayed pickup in oil and gas exploration and development in the United States. Also hurting performance was untimely trading in semiconductor equipment stocks such as Applied Materials. Other notable laggards included tractor maker AGCO, toolmaker Illinois Tool Works and industrial supply distributor Grainger. Some stocks mentioned in this review were no longer held at period end.
The views expressed in this statement reflect those of the portfolio manager only through the end of the period of the report as stated on the cover and do not necessarily represent the views of Fidelity or any other person in the Fidelity organization. Any such views are subject to change at any time based upon market or other conditions and Fidelity disclaims any responsibility to update such views. These views may not be relied on as investment advice and, because investment decisions for a Fidelity fund are based on numerous factors, may not be relied on as an indication of trading intent on behalf of any Fidelity fund.
Annual Report
Industrial Equipment Portfolio
Investment Summary
Top Ten Stocks as of February 29, 2004 |
| % of fund's
net assets |
Tyco International Ltd. | 8.0 |
Honeywell International, Inc. | 6.8 |
Applied Materials, Inc. | 6.7 |
AGCO Corp. | 4.5 |
Caterpillar, Inc. | 4.3 |
General Electric Co. | 4.3 |
Ingersoll-Rand Co. Ltd. Class A | 4.1 |
ASML Holding NV (NY Shares) | 4.0 |
ITT Industries, Inc. | 3.6 |
American Standard Companies, Inc. | 3.3 |
| 49.6 |
Top Industries as of February 29, 2004 |
% of fund's net assets |
| Machinery | 37.7% | |
| Industrial Conglomerates | 13.9% | |
| Semiconductors & Semiconductor Equipment | 13.2% | |
| Aerospace & Defense | 12.1% | |
| Building Products | 4.8% | |
| All Others* | 18.3% | |

* Includes short-term investments and net other assets. |
Annual Report
Industrial Equipment Portfolio
Investments February 29, 2004
Showing Percentage of Net Assets
Common Stocks - 99.5% |
| Shares | | Value (Note 1) |
AEROSPACE & DEFENSE - 12.1% |
Bombardier, Inc. Class B (sub. vtg.) | 62,700 | | $ 304,709 |
General Dynamics Corp. | 9,500 | | 875,140 |
Honeywell International, Inc. | 129,400 | | 4,535,470 |
Lockheed Martin Corp. | 21,900 | | 1,013,532 |
Precision Castparts Corp. | 4,700 | | 212,205 |
United Defense Industries, Inc. (a) | 13,200 | | 404,580 |
United Technologies Corp. | 7,500 | | 690,825 |
TOTAL AEROSPACE & DEFENSE | | 8,036,461 |
AUTO COMPONENTS - 0.6% |
American Axle & Manufacturing Holdings, Inc. (a) | 6,200 | | 235,662 |
ArvinMeritor, Inc. | 4,700 | | 106,032 |
TRW Automotive Holdings Corp. (a) | 1,700 | | 42,500 |
TOTAL AUTO COMPONENTS | | 384,194 |
BUILDING PRODUCTS - 4.8% |
American Standard Companies, Inc. (a) | 19,900 | | 2,168,304 |
Trex Co., Inc. (a) | 11,300 | | 396,969 |
York International Corp. | 16,300 | | 608,479 |
TOTAL BUILDING PRODUCTS | | 3,173,752 |
COMMERCIAL SERVICES & SUPPLIES - 2.0% |
IKON Office Solutions, Inc. | 111,200 | | 1,306,600 |
COMMUNICATIONS EQUIPMENT - 0.3% |
Avaya, Inc. (a) | 13,000 | | 222,950 |
CONSTRUCTION & ENGINEERING - 1.3% |
EMCOR Group, Inc. (a) | 8,600 | | 322,070 |
Granite Construction, Inc. | 9,400 | | 227,950 |
URS Corp. (a) | 9,700 | | 296,820 |
TOTAL CONSTRUCTION & ENGINEERING | | 846,840 |
CONSTRUCTION MATERIALS - 0.1% |
Martin Marietta Materials, Inc. | 1,700 | | 83,453 |
ELECTRICAL EQUIPMENT - 2.7% |
A.O. Smith Corp. | 5,500 | | 171,050 |
Cooper Industries Ltd. Class A | 4,500 | | 238,095 |
Emerson Electric Co. | 18,000 | | 1,124,640 |
Hubbell, Inc. Class B | 2,700 | | 107,190 |
Rockwell Automation, Inc. | 900 | | 27,414 |
Thomas & Betts Corp. | 4,200 | | 90,678 |
TOTAL ELECTRICAL EQUIPMENT | | 1,759,067 |
ELECTRONIC EQUIPMENT & INSTRUMENTS - 3.0% |
Cognex Corp. | 2,500 | | 83,150 |
Electro Scientific Industries, Inc. (a) | 14,000 | | 334,180 |
Molex, Inc. | 11,500 | | 364,320 |
|
| Shares | | Value (Note 1) |
Newport Corp. (a) | 20,000 | | $ 350,600 |
Symbol Technologies, Inc. | 52,100 | | 886,742 |
TOTAL ELECTRONIC EQUIPMENT & INSTRUMENTS | | 2,018,992 |
HOUSEHOLD DURABLES - 0.1% |
Whirlpool Corp. | 1,200 | | 87,528 |
INDUSTRIAL CONGLOMERATES - 13.9% |
Carlisle Companies, Inc. | 3,000 | | 170,850 |
General Electric Co. | 86,950 | | 2,827,614 |
Textron, Inc. | 16,000 | | 885,440 |
Tyco International Ltd. | 187,200 | | 5,348,303 |
TOTAL INDUSTRIAL CONGLOMERATES | | 9,232,207 |
MACHINERY - 37.7% |
AGCO Corp. (a) | 160,100 | | 2,985,865 |
Albany International Corp. Class A | 2,400 | | 76,608 |
Astec Industries, Inc. (a) | 71,300 | | 946,864 |
Caterpillar, Inc. | 37,800 | | 2,863,350 |
Crane Co. | 900 | | 28,926 |
Cummins, Inc. | 29,200 | | 1,442,480 |
Danaher Corp. | 12,000 | | 1,075,560 |
Deere & Co. | 7,600 | | 488,148 |
Donaldson Co., Inc. | 10,800 | | 615,924 |
Dover Corp. | 34,400 | | 1,348,136 |
Eaton Corp. | 11,600 | | 679,064 |
Harsco Corp. | 1,700 | | 77,231 |
IDEX Corp. | 4,900 | | 208,740 |
Illinois Tool Works, Inc. | 4,800 | | 381,696 |
Ingersoll-Rand Co. Ltd. Class A | 40,800 | | 2,712,384 |
ITT Industries, Inc. | 31,200 | | 2,355,600 |
Kennametal, Inc. | 38 | | 1,614 |
Manitowoc Co., Inc. | 11,600 | | 359,600 |
Navistar International Corp. (a) | 22,700 | | 1,057,820 |
Oshkosh Truck Co. | 11,600 | | 682,660 |
PACCAR, Inc. | 22,350 | | 1,238,414 |
Parker Hannifin Corp. | 17,700 | | 994,209 |
Pentair, Inc. | 10,100 | | 545,501 |
SPX Corp. (a) | 30,000 | | 1,260,000 |
Timken Co. | 17,800 | | 391,244 |
Wabash National Corp. (a) | 3,700 | | 105,265 |
Watts Water Technologies, Inc. Class A | 3,900 | | 90,246 |
TOTAL MACHINERY | | 25,013,149 |
OFFICE ELECTRONICS - 3.2% |
Xerox Corp. (a) | 148,500 | | 2,099,790 |
ROAD & RAIL - 0.8% |
Laidlaw International, Inc. (a) | 36,200 | | 539,971 |
Marten Transport Ltd. (a) | 750 | | 13,275 |
TOTAL ROAD & RAIL | | 553,246 |
Common Stocks - continued |
| Shares | | Value (Note 1) |
SEMICONDUCTORS & SEMICONDUCTOR EQUIPMENT - 13.2% |
Applied Materials, Inc. (a) | 210,500 | | $ 4,471,020 |
ASML Holding NV (NY Shares) (a) | 145,500 | | 2,656,830 |
FormFactor, Inc. | 4,700 | | 95,598 |
Kulicke & Soffa Industries, Inc. (a) | 48,500 | | 603,825 |
Teradyne, Inc. (a) | 37,600 | | 926,840 |
TOTAL SEMICONDUCTORS & SEMICONDUCTOR
EQUIPMENT | | 8,754,113 |
TRADING COMPANIES & DISTRIBUTORS - 3.7% |
Fastenal Co. | 7,600 | | 368,220 |
Finning International, Inc. | 1,200 | | 27,505 |
W.W. Grainger, Inc. | 43,400 | | 2,050,650 |
TOTAL TRADING COMPANIES & DISTRIBUTORS | | 2,446,375 |
TOTAL INVESTMENT PORTFOLIO - 99.5% (Cost $58,375,455) | | 66,018,717 |
NET OTHER ASSETS - 0.5% | | 364,474 |
NET ASSETS - 100% | $ 66,383,191 |
Legend |
(a) Non-income producing |
Other Information |
Purchases and sales of securities, other than short-term securities, aggregated $69,342,649 and $34,281,708, respectively. |
The fund placed a portion of its portfolio transactions with brokerage firms which are affiliates of the investment adviser. The commissions paid to these affiliated firms were $4,875 for the period. |
Income Tax Information |
The fund hereby designates approximately $11,000 as a capital gain dividend for the purpose of the dividend paid deduction. |
See accompanying notes which are an integral part of the financial statements.
Cyclicals Sector
Industrial Equipment Portfolio
Financial Statements
Statement of Assets and Liabilities
| February 29, 2004 |
| | |
Assets | | |
Investment in securities, at value (cost $58,375,455) - See accompanying schedule | | $ 66,018,717 |
Receivable for investments sold | | 2,563,310 |
Receivable for fund shares sold | | 66,526 |
Dividends receivable | | 116,393 |
Interest receivable | | 505 |
Prepaid expenses | | 141 |
Other affiliated receivables | | 72 |
Other receivables | | 10,869 |
Total assets | | 68,776,533 |
| | |
Liabilities | | |
Payable to custodian bank | $ 76,909 | |
Payable for investments purchased | 1,286,364 | |
Payable for fund shares redeemed | 947,125 | |
Accrued management fee | 34,297 | |
Other affiliated payables | 21,424 | |
Other payables and accrued expenses | 27,223 | |
Total liabilities | | 2,393,342 |
| | |
Net Assets | | $ 66,383,191 |
Net Assets consist of: | | |
Paid in capital | | $ 58,525,507 |
Accumulated undistributed net realized gain (loss) on investments and foreign currency transactions | | 214,422 |
Net unrealized appreciation (depreciation) on investments | | 7,643,262 |
Net Assets, for 2,698,118 shares outstanding | | $ 66,383,191 |
Net Asset Value, offering price and redemption price per share ($66,383,191 ÷ 2,698,118 shares) | | $ 24.60 |
Statement of Operations
| Year ended February 29, 2004 |
| | |
Investment Income | | |
Dividends | | $ 446,255 |
Interest | | 19,780 |
Security lending | | 2,764 |
Total income | | 468,799 |
| | |
Expenses | | |
Management fee | $ 219,502 | |
Transfer agent fees | 155,009 | |
Accounting and security lending fees | 56,842 | |
Non-interested trustees' compensation | 182 | |
Custodian fees and expenses | 11,288 | |
Registration fees | 26,007 | |
Audit | 43,870 | |
Legal | 220 | |
Miscellaneous | 579 | |
Total expenses before reductions | 513,499 | |
Expense reductions | (14,508) | 498,991 |
Net investment income (loss) | | (30,192) |
Realized and Unrealized Gain (Loss) Net realized gain (loss) on: | | |
Investment securities | 4,818,303 | |
Foreign currency transactions | 3,785 | |
Total net realized gain (loss) | | 4,822,088 |
Change in net unrealized appreciation (depreciation) on investment securities | | 8,887,338 |
Net gain (loss) | | 13,709,426 |
Net increase (decrease) in net assets resulting from operations | | $ 13,679,234 |
Other Information | | |
Sales charges paid to FDC | | $ 21,353 |
Deferred sales charges withheld by FDC | | $ 199 |
Exchange fees withheld by
FSC | | $ 510 |
See accompanying notes which are an integral part of the financial statements.
Annual Report
Industrial Equipment Portfolio
Financial Statements - continued
Statement of Changes in Net Assets
| Year ended
February 29,
2004 | Year ended
February 28,
2003 |
Increase (Decrease) in Net Assets | | |
Operations | | |
Net investment income (loss) | $ (30,192) | $ (129,905) |
Net realized gain (loss) | 4,822,088 | (2,106,031) |
Change in net unrealized appreciation (depreciation) | 8,887,338 | (5,125,556) |
Net increase (decrease) in net assets resulting from operations | 13,679,234 | (7,361,492) |
Share transactions
Net proceeds from sales of shares | 77,496,492 | 11,370,302 |
Cost of shares redeemed | (42,305,092) | (11,339,800) |
Net increase (decrease) in net assets resulting from share transactions | 35,191,400 | 30,502 |
Redemption fees | 53,771 | 15,115 |
Total increase (decrease) in net assets | 48,924,405 | (7,315,875) |
| | |
Net Assets | | |
Beginning of period | 17,458,786 | 24,774,661 |
End of period | $ 66,383,191 | $ 17,458,786 |
Other Information Shares | | |
Sold | 3,441,291 | 561,801 |
Redeemed | (1,834,470) | (569,419) |
Net increase (decrease) | 1,606,821 | (7,618) |
Financial Highlights
Years ended February 28, | 2004 E | 2003 | 2002 | 2001 | 2000 E |
Selected Per-Share Data | | | | | |
Net asset value, beginning of period | $ 16.00 | $ 22.54 | $ 21.69 | $ 26.38 | $ 25.23 |
Income from Investment Operations | | | | | |
Net investment income (loss) C | (.02) | (.12) | (.03) | (.02) | .02 |
Net realized and unrealized gain (loss) | 8.59 | (6.43) | .88 | (2.03) | 4.44 |
Total from investment operations | 8.57 | (6.55) | .85 | (2.05) | 4.46 |
Distributions from net investment income | - | - | - | - | (.01) |
Distributions from net realized gain | - | - | (.03) | (2.67) | (3.34) |
Total distributions | - | - | (.03) | (2.67) | (3.35) |
Redemption fees added to paid in capital C | .03 | .01 | .03 | .03 | .04 |
Net asset value, end of period | $ 24.60 | $ 16.00 | $ 22.54 | $ 21.69 | $ 26.38 |
Total Return A,B | 53.75% | (29.02)% | 4.07% | (7.69)% | 18.98% |
Ratios to Average Net Assets D | | | | | |
Expenses before expense reductions | 1.37% | 1.77% | 1.46% | 1.48% | 1.43% |
Expenses net of voluntary waivers, if any | 1.37% | 1.77% | 1.46% | 1.48% | 1.43% |
Expenses net of all reductions | 1.33% | 1.76% | 1.45% | 1.48% | 1.41% |
Net investment income (loss) | (.08)% | (.62)% | (.16)% | (.06)% | .06% |
Supplemental Data | | | | | |
Net assets, end of period (000 omitted) | $ 66,383 | $ 17,459 | $ 24,775 | $ 21,392 | $ 26,117 |
Portfolio turnover rate | 95% | 123% | 131% | 48% | 119% |
A Total returns would have been lower had certain expenses not been reduced during the periods shown. B Total returns do not include the effect of the former sales charges. C Calculated based on average shares outstanding during the period. D Expense ratios reflect operating expenses of the fund. Expenses before reductions do not reflect amounts reimbursed by the investment adviser or reductions from brokerage service arrangements or other expense offset arrangements and do not represent the amount paid by the fund during periods when reimbursements or reductions occur. Expenses net of any voluntary waivers reflect expenses after reimbursement by the investment adviser but prior to reductions from brokerage service arrangements or other expense offset arrangements. Expenses net of all reductions represent the net expenses paid by the fund. E For the year ended February 29. |
See accompanying notes which are an integral part of the financial statements.
Cyclicals Sector
Industrial Materials Portfolio
Performance
Average annual total return reflects the change in the value of an investment, assuming reinvestment of the fund's dividend income and capital gains (the profits earned upon the sale of securities that have grown in value) and assuming a constant rate of performance each year. The $10,000 table and the fund's returns do not reflect the deduction of taxes that a shareholder would pay on fund distributions or the redemption of fund shares. During periods of reimbursement by Fidelity a fund's total returns will be greater than it would be had the reimbursement not occurred. How a fund did yesterday is no guarantee of how it will do tomorrow.
Average Annual Total Returns
Periods ended February 29, 2004 | Past 1
year | Past 5
years | Past 10
years |
Select Industrial Materials | 51.73% | 12.99% | 8.18% |
$10,000 Over 10 Years
Let's say hypothetically that $10,000 was invested in Fidelity Select Industrial Materials Portfolio on February 28, 1994. The chart shows how the value of your investment would have grown, and also shows how the S&P 500 Index did over the same period.
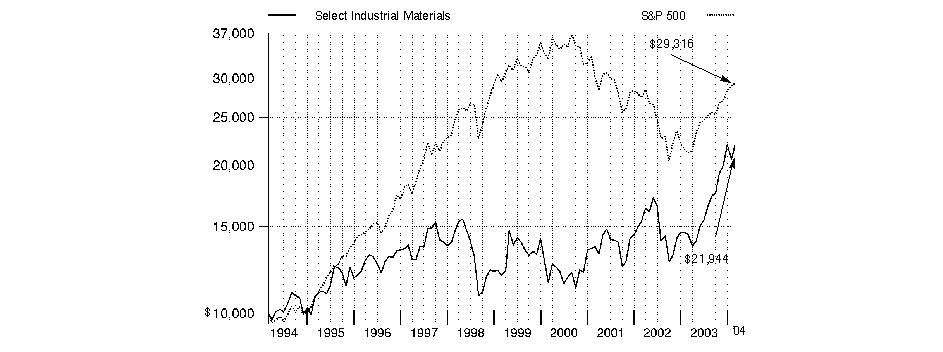
Annual Report
Industrial Materials Portfolio
Management's Discussion of Fund Performance
Comments from Jody Simes, who managed Fidelity® Select Industrial Materials Portfolio from August 1, 2003, through the end of the period
From March 2003 through the end of February 2004, domestic stocks recovered dramatically from their prior three-year swoon, driven largely by a broad-based economic and corporate profit recovery. Most major equity benchmarks gained 35% or more during the 12-month period, led by the Russell 2000® Index - a measure of the overall small-cap universe - which advanced 64.41%. As investors grew more confident about the economy's vitality, small-cap stocks were bid up, particularly those with no current earnings. In comparison, the Wilshire 5000® Total Market Index, commonly used as a proxy for the entire U.S. stock market's performance, rose 42.47%. Every sector of the market posted a double-digit advance, with economically sensitive issues - especially technology stocks - leading the way. The tech-heavy NASDAQ Composite® Index returned 52.47% during the past year, despite a negative return in February as investors turned to the more value-oriented segments of the market. The broader Standard & Poor's 500SM Index climbed 38.52% during the year, slightly outperforming the 37.07% increase for the blue-chip Dow Jones Industrial AverageSM.
The fund gained 51.73% for the year ending February 29, 2004, topping both the Goldman Sachs® Cyclical Industries Index, which rose 45.70%, and the S&P 500®. Industrial materials stocks waged a strong cyclical recovery during the period, helped by an improving global economy and sharply higher commodity prices. The fund beat its benchmarks, thanks to a heavy emphasis on metals and mining stocks, which far outpaced most areas of the market and had very little representation in the Goldman Sachs index. With nearly all cyclical stocks moving higher, the key to outperforming was figuring out which stocks had the most leverage to the improving U.S. and European economies and to the long-term economic growth story in China. Within basic materials, we favored cheap base metal and steel stocks rather than the chemical and paper companies because we felt they had a much better supply/demand profile. That strategy worked well, especially the fund's focus on surging copper and nickel stocks, such as Freeport-McMoRan Copper & Gold and Russian-based MMC Norlisk Nickel. Copper producers Phelps Dodge and Inmet Mining also were big contributors, as were nickel miner Inco, steel producer IPSCO and aluminum giant Alcan. Conversely, we owned a couple of gold-mining issues - Kinross Gold and Agnico-Eagle Mines - that struggled due to company-specific issues. Stock selection in the lagging chemical and paper/forest groups also hurt, most notably pulp manufacturer Tembec and specialty chemicals maker Solutia.
The views expressed in this statement reflect those of the portfolio manager only through the end of the period of the report as stated on the cover and do not necessarily represent the views of Fidelity or any other person in the Fidelity organization. Any such views are subject to change at any time based upon market or other conditions and Fidelity disclaims any responsibility to update such views. These views may not be relied on as investment advice and, because investment decisions for a Fidelity fund are based on numerous factors, may not be relied on as an indication of trading intent on behalf of any Fidelity fund.
Annual Report
Industrial Materials Portfolio
Investment Summary
Top Ten Stocks as of February 29, 2004 |
| % of fund's
net assets |
Inmet Mining Corp. | 7.6 |
Phelps Dodge Corp. | 5.4 |
3M Co. | 4.7 |
Dow Chemical Co. | 4.4 |
Inco Ltd. | 3.9 |
Alcan, Inc. | 3.8 |
Alcoa, Inc. | 3.8 |
E.I. du Pont de Nemours & Co. | 3.8 |
International Paper Co. | 3.6 |
BHP Billiton Ltd. sponsored ADR | 3.5 |
| 44.5 |
Top Industries as of February 29, 2004 |
% of fund's net assets |
| Metals & Mining | 58.3% | |
| Chemicals | 15.7% | |
| Paper & Forest Products | 6.3% | |
| Road & Rail | 5.1% | |
| Industrial Conglomerates | 4.7% | |
| All Others* | 9.9% | |

* Includes short-term investments and net other assets. |
Annual Report
Industrial Materials Portfolio
Investments February 29, 2004
Showing Percentage of Net Assets
Common Stocks - 95.8% |
| Shares | | Value (Note 1) |
BUILDING PRODUCTS - 1.1% |
American Standard Companies, Inc. (a) | 13,700 | | $ 1,492,752 |
CHEMICALS - 15.7% |
Air Products & Chemicals, Inc. | 30,300 | | 1,461,672 |
Airgas, Inc. | 58,600 | | 1,215,950 |
Albemarle Corp. | 4,500 | | 127,125 |
Dow Chemical Co. | 136,900 | | 5,951,043 |
E.I. du Pont de Nemours & Co. | 113,500 | | 5,117,715 |
Ferro Corp. | 5,200 | | 135,200 |
Georgia Gulf Corp. | 35,500 | | 965,955 |
Methanex Corp. | 53,900 | | 615,504 |
NOVA Chemicals Corp. | 20,500 | | 563,675 |
PPG Industries, Inc. | 31,100 | | 1,825,259 |
Praxair, Inc. | 65,200 | | 2,368,064 |
Sigma Aldrich Corp. | 14,700 | | 840,399 |
TOTAL CHEMICALS | | 21,187,561 |
CONSTRUCTION MATERIALS - 2.4% |
Eagle Materials, Inc. | 15,900 | | 927,765 |
Florida Rock Industries, Inc. | 3,300 | | 144,870 |
Lafarge North America, Inc. | 3,442 | | 141,742 |
Martin Marietta Materials, Inc. | 17,500 | | 859,075 |
Texas Industries, Inc. | 32,100 | | 1,143,402 |
Vulcan Materials Co. | 1,500 | | 70,950 |
TOTAL CONSTRUCTION MATERIALS | | 3,287,804 |
CONTAINERS & PACKAGING - 2.0% |
Ball Corp. | 25 | | 1,614 |
Owens-Illinois, Inc. (a) | 28,500 | | 381,330 |
Packaging Corp. of America | 31,500 | | 742,140 |
Pactiv Corp. (a) | 26,000 | | 558,740 |
Smurfit-Stone Container Corp. (a) | 51,300 | | 952,128 |
TOTAL CONTAINERS & PACKAGING | | 2,635,952 |
INDUSTRIAL CONGLOMERATES - 4.7% |
3M Co. | 82,100 | | 6,405,442 |
METALS & MINING - 58.3% |
Aber Diamond Corp. (a) | 8,500 | | 287,948 |
Agnico-Eagle Mines Ltd. | 25,330 | | 345,965 |
AK Steel Holding Corp. (a) | 41,400 | | 201,204 |
Alcan, Inc. | 109,300 | | 5,170,153 |
Alcoa, Inc. | 136,898 | | 5,129,568 |
|
| Shares | | Value (Note 1) |
Alumina Ltd. sponsored ADR | 209,100 | | $ 3,588,156 |
AUR Resources, Inc. (a) | 274,500 | | 1,549,837 |
BHP Billiton Ltd. sponsored ADR | 247,900 | | 4,737,369 |
Cameco Corp. | 42,700 | | 2,036,759 |
Century Aluminum Co. (a) | 22,400 | | 609,280 |
Falconbridge Ltd. | 175,200 | | 4,722,902 |
First Quantum Minerals Ltd. (a) | 63,300 | | 765,506 |
Freeport-McMoRan Copper & Gold, Inc. Class B | 83,000 | | 3,539,950 |
Inco Ltd. (a) | 141,901 | | 5,261,850 |
Inmet Mining Corp. (a) | 679,700 | | 10,306,582 |
International Steel Group, Inc. | 100 | | 3,921 |
IPSCO, Inc. | 78,600 | | 1,447,283 |
JSC MMC 'Norilsk Nickel' sponsored ADR | 36,900 | | 2,619,900 |
Kinross Gold Corp. (a) | 92,300 | | 615,817 |
Lionore Mining International Ltd. (a) | 522,400 | | 2,894,725 |
Newmont Mining Corp. | 94,300 | | 4,097,335 |
Nucor Corp. | 17,700 | | 1,113,330 |
Phelps Dodge Corp. (a) | 84,900 | | 7,323,474 |
Rio Tinto PLC sponsored ADR | 18,000 | | 1,978,200 |
SouthernEra Resources Ltd. (a) | 243,700 | | 930,675 |
Steel Dynamics, Inc. (a) | 10,100 | | 244,925 |
Teck Cominco Ltd. Class B (sub. vtg.) | 132,500 | | 2,500,281 |
United States Steel Corp. | 22,000 | | 808,500 |
Wheaton River Minerals Ltd. (a) | 921,900 | | 2,485,185 |
Xstrata PLC | 114,700 | | 1,531,423 |
TOTAL METALS & MINING | | 78,848,003 |
PAPER & FOREST PRODUCTS - 6.3% |
Abitibi-Consolidated, Inc. | 46,200 | | 366,708 |
Bowater, Inc. | 34,200 | | 1,569,780 |
International Paper Co. | 110,200 | | 4,877,452 |
Pope & Talbot, Inc. | 100,800 | | 1,733,760 |
TOTAL PAPER & FOREST PRODUCTS | | 8,547,700 |
ROAD & RAIL - 5.1% |
Canadian National Railway Co. | 47,850 | | 1,887,199 |
CSX Corp. | 88,000 | | 2,774,640 |
Union Pacific Corp. | 34,500 | | 2,195,580 |
TOTAL ROAD & RAIL | | 6,857,419 |
SPECIALTY RETAIL - 0.2% |
Boise Cascade Corp. | 7,200 | | 242,640 |
TOTAL COMMON STOCKS (Cost $119,412,264) | 129,505,273 |
Money Market Funds - 7.6% |
| Shares | | Value (Note 1) |
Fidelity Cash Central Fund, 1.08% (b) | 5,279,789 | | $ 5,279,789 |
Fidelity Securities Lending Cash Central Fund, 1.08% (b) | 4,980,250 | | 4,980,250 |
TOTAL MONEY MARKET FUNDS (Cost $10,260,039) | 10,260,039 |
TOTAL INVESTMENT PORTFOLIO - 103.4% (Cost $129,672,303) | 139,765,312 |
NET OTHER ASSETS - (3.4)% | (4,634,533) |
NET ASSETS - 100% | $ 135,130,779 |
Legend |
(a) Non-income producing |
(b) Affiliated fund that is available only to investment companies and other accounts managed by Fidelity Investments. The rate quoted is the annualized seven-day yield of the fund at period end. A complete listing of the fund's holdings as of its most recent fiscal year end is available upon request. |
Other Information |
Purchases and sales of securities, other than short-term securities, aggregated $178,665,038 and $113,125,191, respectively. |
The fund placed a portion of its portfolio transactions with brokerage firms which are affiliates of the investment adviser. The commissions paid to these affiliated firms were $10,410 for the period. |
The fund participated in the interfund lending program as a borrower. The average daily loan balance during the period for which loans were outstanding amounted to $5,407,143. The weighted average interest rate was 1.12%. Interest expense includes $1,174 paid under the interfund lending program. At period end there were no interfund loans outstanding. |
Distribution of investments by country of issue, as a percentage of total net assets, is as follows: |
United States of America | 58.8% |
Canada | 33.2% |
Australia | 3.5% |
United Kingdom | 2.6% |
Russia | 1.9% |
| 100.0% |
Income Tax Information |
The fund hereby designates approximately $611,000 as a capital gain dividend for the purpose of the dividend paid deduction. |
See accompanying notes which are an integral part of the financial statements.
Cyclicals Sector
Industrial Materials Portfolio
Financial Statements
Statement of Assets and Liabilities
| February 29, 2004 |
| | |
Assets | | |
Investment in securities, at value (including securities loaned of $4,849,510) (cost $129,672,303) - See accompanying schedule | | $ 139,765,312 |
Receivable for fund shares sold | | 943,388 |
Dividends receivable | | 250,312 |
Interest receivable | | 5,105 |
Prepaid expenses | | 199 |
Other affiliated receivables | | 1,065 |
Other receivables | | 70,559 |
Total assets | | 141,035,940 |
| | |
Liabilities | | |
Payable for fund shares redeemed | $ 793,842 | |
Accrued management fee | 59,860 | |
Other affiliated payables | 38,493 | |
Other payables and accrued expenses | 32,716 | |
Collateral on securities loaned, at value | 4,980,250 | |
Total liabilities | | 5,905,161 |
| | |
Net Assets | | $ 135,130,779 |
Net Assets consist of: | | |
Paid in capital | | $ 122,249,120 |
Undistributed net investment income | | 94,751 |
Accumulated undistributed net realized gain (loss) on investments and foreign currency transactions | | 2,694,198 |
Net unrealized appreciation (depreciation) on investments and assets and liabilities in foreign currencies | | 10,092,710 |
Net Assets, for 3,755,075 shares outstanding | | $ 135,130,779 |
Net Asset Value, offering price and redemption price per share ($135,130,779 ÷ 3,755,075 shares) | | $ 35.99 |
Statement of Operations
| Year ended February 29, 2004 |
| | |
Investment Income | | |
Dividends | | $ 832,884 |
Special dividends | | 138,600 |
Interest | | 51,136 |
Security lending | | 26,572 |
Total income | | 1,049,192 |
Expenses | | |
Management fee | $ 385,135 | |
Transfer agent fees | 296,906 | |
Accounting and security lending fees | 65,813 | |
Non-interested trustees' compensation | 329 | |
Custodian fees and expenses | 24,820 | |
Registration fees | 44,702 | |
Audit | 43,988 | |
Legal | 196 | |
Interest | 1,174 | |
Miscellaneous | 688 | |
Total expenses before reductions | 863,751 | |
Expense reductions | (95,452) | 768,299 |
Net investment income (loss) | | 280,893 |
Realized and Unrealized Gain (Loss) Net realized gain (loss) on: | | |
Investment securities | 13,328,871 | |
Foreign currency transactions | (13,918) | |
Total net realized gain (loss) | | 13,314,953 |
Change in net unrealized appreciation (depreciation) on: Investment securities | 9,560,451 | |
Assets and liabilities in foreign currencies | (532) | |
Total change in net unrealized appreciation (depreciation) | | 9,559,919 |
Net gain (loss) | | 22,874,872 |
Net increase (decrease) in net assets resulting from operations | | $ 23,155,765 |
Other Information | | |
Sales charges paid to FDC | | $ 62,697 |
Deferred sales charges withheld by FDC | | $ 256 |
Exchange fees withheld by
FSC | | $ 6,248 |
See accompanying notes which are an integral part of the financial statements.
Annual Report
Industrial Materials Portfolio
Financial Statements - continued
Statement of Changes in Net Assets
| Year ended
February 29,
2004 | Year ended
February 28,
2003 |
Increase (Decrease) in Net Assets | | |
Operations | | |
Net investment income (loss) | $ 280,893 | $ 56,362 |
Net realized gain (loss) | 13,314,953 | (4,102,167) |
Change in net unrealized appreciation (depreciation) | 9,559,919 | (3,660,437) |
Net increase (decrease) in net assets resulting from operations | 23,155,765 | (7,706,242) |
Distributions to shareholders from net investment income | (240,088) | (445,684) |
Share transactions | | |
Net proceeds from sales of shares | 238,570,426 | 92,824,975 |
Reinvestment of distributions | 229,805 | 429,170 |
Cost of shares redeemed | (168,039,932) | (71,365,294) |
Net increase (decrease) in net assets resulting from share transactions | 70,760,299 | 21,888,851 |
Redemption fees | 179,535 | 77,036 |
Total increase (decrease) in net assets | 93,855,511 | 13,813,961 |
| | |
Net Assets | | |
Beginning of period | 41,275,268 | 27,461,307 |
End of period (including undistributed net investment income of $94,751 and undistributed net investment income of $14,521, respectively) | $ 135,130,779 | $ 41,275,268 |
Other Information Shares | | |
Sold | 7,280,383 | 3,545,040 |
Issued in reinvestment of distributions | 8,045 | 18,263 |
Redeemed | (5,265,275) | (2,892,013) |
Net increase (decrease) | 2,023,153 | 671,290 |
Financial Highlights
Years ended February 28, | 2004 F | 2003 | 2002 | 2001 | 2000 F |
Selected Per-Share Data | | | | | |
Net asset value, beginning of period | $ 23.83 | $ 25.89 | $ 23.11 | $ 19.64 | $ 20.32 |
Income from Investment Operations | | | | | |
Net investment income (loss) C | .13 D | .04 D | .10 | .16 | .05 |
Net realized and unrealized gain (loss) | 12.07 | (1.69) | 2.81 | 3.33 | (.89) |
Total from investment operations | 12.20 | (1.65) | 2.91 | 3.49 | (.84) |
Distributions from net investment income | (.12) | (.46) | (.20) | (.11) | (.03) |
Redemption fees added to paid in capital C | .08 | .05 | .07 | .09 | .19 |
Net asset value, end of period | $ 35.99 | $ 23.83 | $ 25.89 | $ 23.11 | $ 19.64 |
Total ReturnA,B | 51.73% | (6.16)% | 12.98% | 18.28% | (3.22)% |
Ratios to Average Net Assets E | | | | | |
Expenses before expense reductions | 1.31% | 1.57% | 1.57% | 1.80% | 1.92% |
Expenses net of voluntary waivers, if any | 1.31% | 1.57% | 1.57% | 1.80% | 1.92% |
Expenses net of all reductions | 1.17% | 1.42% | 1.49% | 1.78% | 1.89% |
Net investment income (loss) | .43% | .16% | .42% | .75% | .21% |
Supplemental Data | | | | | |
Net assets, end of period (000 omitted) | $ 135,131 | $ 41,275 | $ 27,461 | $ 31,721 | $ 20,627 |
Portfolio turnover rate | 175% | 226% | 230% | 141% | 257% |
A Total returns would have been lower had certain expenses not been reduced during the periods shown. B Total returns do not include the effect of the former sales charges. C Calculated based on average shares outstanding during the period. D Investment income per share reflects a special dividend which amounted to $.07 per share. E Expense ratios reflect operating expenses of the fund. Expenses before reductions do not reflect amounts reimbursed by the investment adviser or reductions from brokerage service arrangements or other expense offset arrangements and do not represent the amount paid by the fund during periods when reimbursements or reductions occur. Expenses net of any voluntary waivers reflect expenses after reimbursement by the investment adviser but prior to reductions from brokerage service arrangements or other expense offset arrangements. Expenses net of all reductions represent the net expenses paid by the fund. F For the year ended February 29. |
See accompanying notes which are an integral part of the financial statements.
Cyclicals Sector
Transportation Portfolio
Performance
Average annual total return reflects the change in the value of an investment, assuming reinvestment of the fund's dividend income and capital gains (the profits earned upon the sale of securities that have grown in value) and assuming a constant rate of performance each year. The $10,000 table and the fund's returns do not reflect the deduction of taxes that a shareholder would pay on fund distributions or the redemption of fund shares. During periods of reimbursement by Fidelity a fund's total returns will be greater than it would be had the reimbursement not occurred. How a fund did yesterday is no guarantee of how it will do tomorrow.
Average Annual Total Returns
Periods ended February 29, 2004 | Past 1
year | Past 5
years | Past 10
years |
Select Transportation | 44.04% | 10.32% | 10.99% |
$10,000 Over 10 Years
Let's say hypothetically that $10,000 was invested in Fidelity Select Transportation Portfolio on February 28, 1994. The chart shows how the value of your investment would have grown, and also shows how the S&P 500 Index did over the same period.
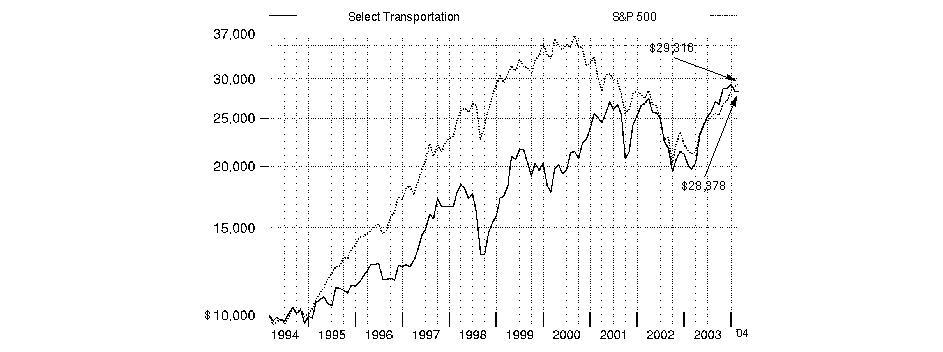
Annual Report
Transportation Portfolio
Management's Discussion of Fund Performance
Comments from Harlan Carere, who became Portfolio Manager of Fidelity® Select Transportation Portfolio on January 1, 2004
From March 2003 through the end of February 2004, domestic stocks recovered dramatically from their prior three-year swoon, driven largely by a broad-based economic and corporate profit recovery. Most major equity benchmarks gained 35% or more during the 12-month period, led by the Russell 2000® Index - a measure of the overall small-cap universe - which advanced 64.41%. As investors grew more confident about the economy's vitality, small-cap stocks were bid up, particularly those with no current earnings. In comparison, the Wilshire 5000® Total Market Index, commonly used as a proxy for the entire U.S. stock market's performance, rose 42.47%. Every sector of the market posted a double-digit advance, with economi-cally sensitive issues - especially technology stocks - leading the way. The tech-heavy NASDAQ Composite® Index returned 52.47% during the past year, despite a negative return in February as investors turned to the more value-oriented segments of the market. The broader Standard & Poor's 500SM Index climbed 38.52% during the year, slightly outperforming the 37.07% increase for the blue-chip Dow Jones Industrial AverageSM.
For the 12 months ending February 29, 2004, the fund returned 44.04%, performing nearly in line with the 45.70% gain by the Goldman Sachs® Cyclical Industries Index, and outdistancing the S&P 500® index. Most of the transportation industries performed well during the period, though some that were heavily represented in the portfolio - such as railroads, air freight/logistics and trucking - didn't appreciate as much as other cyclical industries included in the broader Goldman Sachs benchmark. Offsetting a good portion of the fund's weakness in these underperforming industries was good stock picking in the airline, aerospace and industrial machinery industries. Holdings in legacy airlines - meaning large, established carriers that operate hub-and-spoke networks - drove much of the fund's strong absolute return. Top performers were Continental Airlines and AMR, the parent of American Airlines. Other stocks that benefited from an upturn in the economy included truck manufacturer Oshkosh Truck and oil tanker company Teekay Shipping. The portfolio's biggest detractors relative to the Goldman Sachs index primarily were railroad companies, including CSX, Union Pacific and Norfolk Southern, as well as transportation services companies Expeditors International of Washington and C.H. Robinson Worldwide.
The views expressed in this statement reflect those of the portfolio manager only through the end of the period of the report as stated on the cover and do not necessarily represent the views of Fidelity or any other person in the Fidelity organization. Any such views are subject to change at any time based upon market or other conditions and Fidelity disclaims any responsibility to update such views. These views may not be relied on as investment advice and, because investment decisions for a Fidelity fund are based on numerous factors, may not be relied on as an indication of trading intent on behalf of any Fidelity fund.
Annual Report
Transportation Portfolio
Investment Summary
Top Ten Stocks as of February 29, 2004 |
| % of fund's
net assets |
United Parcel Service, Inc. Class B | 5.0 |
Burlington Northern Santa Fe Corp. | 4.9 |
CSX Corp. | 4.7 |
Canadian National Railway Co. | 4.5 |
FedEx Corp. | 4.4 |
Norfolk Southern Corp. | 4.4 |
Bombardier, Inc. Class B (sub. vtg.) | 4.1 |
Union Pacific Corp. | 3.7 |
Eaton Corp. | 3.6 |
Northwest Airlines Corp. | 3.0 |
| 42.3 |
Top Industries as of February 29, 2004 |
% of fund's net assets |
| Road & Rail | 32.5% | |
| Air Freight & Logistics | 21.4% | |
| Airlines | 18.8% | |
| Machinery | 11.4% | |
| Oil & Gas | 6.8% | |
| All Others* | 9.1% | |

* Includes short-term investments and net other assets. |
Annual Report
Transportation Portfolio
Investments February 29, 2004
Showing Percentage of Net Assets
Common Stocks - 98.9% |
| Shares | | Value (Note 1) |
AEROSPACE & DEFENSE - 5.1% |
Bombardier, Inc. Class B (sub. vtg.) | 318,500 | | $ 1,547,842 |
Embraer - Empresa Brasileira de Aeronautica SA sponsored ADR | 12,200 | | 368,318 |
TOTAL AEROSPACE & DEFENSE | | 1,916,160 |
AIR FREIGHT & LOGISTICS - 21.4% |
C.H. Robinson Worldwide, Inc. | 21,900 | | 867,459 |
CNF, Inc. | 14,800 | | 492,100 |
Dynamex, Inc. (a) | 500 | | 5,950 |
EGL, Inc. (a) | 11,500 | | 183,885 |
Expeditors International of Washington, Inc. | 23,160 | | 892,586 |
FedEx Corp. | 24,200 | | 1,662,056 |
Forward Air Corp. (a) | 2,500 | | 79,050 |
J.B. Hunt Transport Services, Inc. (a) | 26,200 | | 717,880 |
Pacer International, Inc. (a) | 9,700 | | 208,356 |
Ryder System, Inc. | 9,800 | | 361,032 |
United Parcel Service, Inc. Class B | 26,800 | | 1,892,884 |
UTI Worldwide, Inc. | 15,000 | | 677,550 |
TOTAL AIR FREIGHT & LOGISTICS | | 8,040,788 |
AIRLINES - 18.8% |
AirTran Holdings, Inc. (a) | 34,200 | | 423,396 |
Alaska Air Group, Inc. (a) | 7,600 | | 195,624 |
AMR Corp. (a) | 34,300 | | 521,360 |
Atlantic Coast Airlines Holdings, Inc. (a) | 8,100 | | 59,049 |
British Airways PLC ADR (a) | 8,600 | | 508,260 |
Continental Airlines, Inc. Class B (a) | 24,100 | | 353,065 |
ExpressJet Holdings, Inc. Class A (a) | 18,500 | | 254,005 |
Frontier Airlines, Inc. (a) | 95,500 | | 969,325 |
JetBlue Airways Corp. (a) | 33,425 | | 795,515 |
Mesa Air Group, Inc. (a) | 9,900 | | 89,001 |
Northwest Airlines Corp. (a) | 104,500 | | 1,132,780 |
Pinnacle Airlines Corp. | 800 | | 11,664 |
SkyWest, Inc. | 5,500 | | 106,425 |
Southwest Airlines Co. | 69,887 | | 965,139 |
WestJet Airlines Ltd. (a) | 36,100 | | 682,560 |
TOTAL AIRLINES | | 7,067,168 |
DIVERSIFIED FINANCIAL SERVICES - 0.7% |
GATX Corp. | 11,700 | | 275,184 |
IT SERVICES - 0.0% |
Sabre Holdings Corp. Class A | 380 | | 8,622 |
|
| Shares | | Value (Note 1) |
MACHINERY - 11.4% |
Cummins, Inc. | 8,400 | | $ 414,960 |
Eaton Corp. | 23,400 | | 1,369,836 |
Navistar International Corp. (a) | 12,700 | | 591,820 |
Oshkosh Truck Co. | 9,300 | | 547,305 |
PACCAR, Inc. | 17,175 | | 951,667 |
Trinity Industries, Inc. | 13,500 | | 392,850 |
TOTAL MACHINERY | | 4,268,438 |
MARINE - 2.2% |
Alexander & Baldwin, Inc. | 13,500 | | 458,325 |
Kirby Corp. (a) | 11,900 | | 378,420 |
TOTAL MARINE | | 836,745 |
OIL & GAS - 6.8% |
Frontline Ltd. | 12,300 | | 399,135 |
General Maritime Corp. (a) | 12,700 | | 270,510 |
Knightsbridge Tankers Ltd. | 8,600 | | 153,166 |
OMI Corp. (a) | 26,000 | | 281,060 |
Overseas Shipholding Group, Inc. | 15,800 | | 567,220 |
Teekay Shipping Corp. | 13,000 | | 866,710 |
TOTAL OIL & GAS | | 2,537,801 |
ROAD & RAIL - 32.5% |
Burlington Northern Santa Fe Corp. | 57,800 | | 1,860,004 |
Canadian National Railway Co. | 42,750 | | 1,686,055 |
Canadian Pacific Railway Ltd. | 41,500 | | 978,884 |
Central Freight Lines, Inc. | 5,300 | | 99,375 |
CSX Corp. | 55,700 | | 1,756,221 |
Florida East Coast Industries, Inc. Class A | 3,300 | | 115,698 |
Heartland Express, Inc. | 16,162 | | 361,059 |
Kansas City Southern (a) | 5,650 | | 79,383 |
Knight Transportation, Inc. (a) | 13,025 | | 316,377 |
Landstar System, Inc. (a) | 6,800 | | 242,692 |
Norfolk Southern Corp. | 74,300 | | 1,646,488 |
Old Dominion Freight Lines, Inc. (a) | 6,300 | | 210,483 |
Overnite Corp. | 100 | | 2,190 |
Quality Distribution, Inc. | 5,100 | | 71,196 |
Swift Transportation Co., Inc. (a) | 10,141 | | 218,032 |
Union Pacific Corp. | 21,700 | | 1,380,988 |
USA Truck, Inc. (a) | 44,300 | | 495,717 |
USF Corp. | 8,500 | | 300,475 |
Werner Enterprises, Inc. | 20,707 | | 394,882 |
TOTAL ROAD & RAIL | | 12,216,199 |
TOTAL COMMON STOCKS (Cost $30,667,290) | 37,167,105 |
Money Market Funds - 6.6% |
| Shares | | Value (Note 1) |
Fidelity Cash Central Fund, 1.08% (b) | 852,803 | | $ 852,803 |
Fidelity Securities Lending Cash Central Fund, 1.08% (b) | 1,621,800 | | 1,621,800 |
TOTAL MONEY MARKET FUNDS (Cost $2,474,603) | 2,474,603 |
TOTAL INVESTMENT PORTFOLIO - 105.5% (Cost $33,141,893) | 39,641,708 |
NET OTHER ASSETS - (5.5)% | (2,058,295) |
NET ASSETS - 100% | $ 37,583,413 |
Legend |
(a) Non-income producing |
(b) Affiliated fund that is available only to investment companies and other accounts managed by Fidelity Investments. The rate quoted is the annualized seven-day yield of the fund at period end. A complete listing of the fund's holdings as of its most recent fiscal year end is available upon request. |
Other Information |
Purchases and sales of securities, other than short-term securities, aggregated $33,843,608 and $27,873,230, respectively. |
The fund placed a portion of its portfolio transactions with brokerage firms which are affiliates of the investment adviser. The commissions paid to these affiliated firms were $9,617 for the period. |
Distribution of investments by country of issue, as a percentage of total net assets, is as follows: |
United States of America | 78.3% |
Canada | 13.0% |
Marshall Islands | 3.0% |
British Virgin Islands | 1.8% |
United Kingdom | 1.4% |
Norway | 1.1% |
Brazil | 1.0% |
Others (individually less than 1%) | 0.4% |
| 100.0% |
Income Tax Information |
At February 29, 2004, the fund had a capital loss carryforward of approximately $1,143,000 all of which will expire on February 28, 2011. |
Cyclicals Sector
See accompanying notes which are an integral part of the financial statements.
Annual Report
Transportation Portfolio
Financial Statements
Statement of Assets and Liabilities
| February 29, 2004 |
Assets | | |
Investment in securities, at value (including securities loaned of $1,534,553) (cost $33,141,893) - See accompanying schedule | | $ 39,641,708 |
Receivable for fund shares sold | | 58,498 |
Dividends receivable | | 34,281 |
Interest receivable | | 285 |
Prepaid expenses | | 172 |
Other receivables | | 2,872 |
Total assets | | 39,737,816 |
| | |
Liabilities | | |
Payable for investments purchased | $ 386,047 | |
Payable for fund shares redeemed | 86,001 | |
Accrued management fee | 18,282 | |
Other affiliated payables | 15,467 | |
Other payables and accrued expenses | 26,806 | |
Collateral on securities loaned, at value | 1,621,800 | |
Total liabilities | | 2,154,403 |
| | |
Net Assets | | $ 37,583,413 |
Net Assets consist of: | | |
Paid in capital | | $ 32,338,024 |
Accumulated undistributed net realized gain (loss) on investments and foreign currency transactions | | (1,254,738) |
Net unrealized appreciation (depreciation) on investments and assets and liabilities in foreign currencies | | 6,500,127 |
Net Assets, for 1,144,318 shares outstanding | | $ 37,583,413 |
Net Asset Value, offering price and redemption price per share ($37,583,413 ÷ 1,144,318 shares) | | $ 32.84 |
Statement of Operations
| Year ended February 29, 2004 |
Investment Income | | |
Dividends | | $ 359,250 |
Interest | | 18,053 |
Security lending | | 15,035 |
Total income | | 392,338 |
Expenses | | |
Management fee | $ 200,660 | |
Transfer agent fees | 216,436 | |
Accounting and security lending fees | 55,839 | |
Non-interested trustees' compensation | 176 | |
Custodian fees and expenses | 11,549 | |
Registration fees | 14,172 | |
Audit | 43,868 | |
Legal | 116 | |
Miscellaneous | 769 | |
Total expenses before reductions | 543,585 | |
Expense reductions | (13,769) | 529,816 |
Net investment income (loss) | | (137,478) |
Realized and Unrealized Gain (Loss) Net realized gain (loss) on: | | |
Investment securities | 5,297,945 | |
Foreign currency transactions | (4,160) | |
Total net realized gain (loss) | | 5,293,785 |
Change in net unrealized appreciation (depreciation) on: Investment securities | 5,590,985 | |
Assets and liabilities in foreign currencies | 114 | |
Total change in net unrealized appreciation (depreciation) | | 5,591,099 |
Net gain (loss) | | 10,884,884 |
Net increase (decrease) in net assets resulting from operations | | $ 10,747,406 |
Other Information | | |
Sales charges paid to FDC | | $ 37,680 |
Deferred sales charges withheld by FDC | | $ 288 |
Exchange fees withheld by
FSC | | $ 990 |
See accompanying notes which are an integral part of the financial statements.
Cyclicals Sector
Transportation Portfolio
Financial Statements - continued
Statement of Changes in Net Assets
| Year ended
February 29,
2004 | Year ended
February 28,
2003 |
Increase (Decrease) in Net Assets | | |
Operations | | |
Net investment income (loss) | $ (137,478) | $ (232,447) |
Net realized gain (loss) | 5,293,785 | (3,370,556) |
Change in net unrealized appreciation (depreciation) | 5,591,099 | (6,618,510) |
Net increase (decrease) in net assets resulting from operations | 10,747,406 | (10,221,513) |
Share transactions
Net proceeds from sales of shares | 44,087,588 | 17,653,308 |
Cost of shares redeemed | (39,108,260) | (57,204,689) |
Net increase (decrease) in net assets resulting from share transactions | 4,979,328 | (39,551,381) |
Redemption fees | 36,421 | 66,892 |
Total increase (decrease) in net assets | 15,763,155 | (49,706,002) |
| | |
Net Assets | | |
Beginning of period | 21,820,258 | 71,526,260 |
End of period | $ 37,583,413 | $ 21,820,258 |
Other Information Shares | | |
Sold | 1,504,874 | 611,130 |
Redeemed | (1,317,429) | (1,964,961) |
Net increase (decrease) | 187,445 | (1,353,831) |
Financial Highlights
Years ended February 28, | 2004 E | 2003 | 2002 | 2001 | 2000 E |
Selected Per-Share Data | | | | | |
Net asset value, beginning of period | $ 22.80 | $ 30.95 | $ 29.20 | $ 20.96 | $ 25.04 |
Income from Investment Operations | | | | | |
Net investment income (loss) C | (.12) | (.18) | (.06) | (.06) | (.14) |
Net realized and unrealized gain (loss) | 10.13 | (8.02) | 1.99 | 8.50 | .93 |
Total from investment operations | 10.01 | (8.20) | 1.93 | 8.44 | .79 |
Distributions from net realized gain | - | - | (.23) | (.31) | (4.97) |
Redemption fees added to paid in capital C | .03 | .05 | .05 | .11 | .10 |
Net asset value, end of period | $ 32.84 | $ 22.80 | $ 30.95 | $ 29.20 | $ 20.96 |
Total Return A,B | 44.04% | (26.33)% | 6.85% | 41.09% | 2.15% |
Ratios to Average Net Assets D | | | | | |
Expenses before expense reductions | 1.57% | 1.77% | 1.44% | 1.87% | 1.77% |
Expenses net of voluntary waivers, if any | 1.57% | 1.77% | 1.44% | 1.87% | 1.77% |
Expenses net of all reductions | 1.53% | 1.75% | 1.40% | 1.84% | 1.71% |
Net investment income (loss) | (.40)% | (.67)% | (.21)% | (.25)% | (.54)% |
Supplemental Data | | | | | |
Net assets, end of period (000 omitted) | $ 37,583 | $ 21,820 | $ 71,526 | $ 57,572 | $ 10,202 |
Portfolio turnover rate | 86% | 47% | 155% | 137% | 318% |
A Total returns would have been lower had certain expenses not been reduced during the periods shown. B Total returns do not include the effect of the former sales charges. C Calculated based on average shares outstanding during the period. D Expense ratios reflect operating expenses of the fund. Expenses before reductions do not reflect amounts reimbursed by the investment adviser or reductions from brokerage service arrangements or other expense offset arrangements and do not represent the amount paid by the fund during periods when reimbursements or reductions occur. Expenses net of any voluntary waivers reflect expenses after reimbursement by the investment adviser but prior to reductions from brokerage service arrangements or other expense offset arrangements. Expenses net of all reductions represent the net expenses paid by the fund. E For the year ended February 29. |
See accompanying notes which are an integral part of the financial statements.
Cyclicals Sector
Banking Portfolio
Performance
Average annual total return reflects the change in the value of an investment, assuming reinvestment of the fund's dividend income and capital gains (the profits earned upon the sale of securities that have grown in value) and assuming a constant rate of performance each year. The $10,000 table and the fund's returns do not reflect the deduction of taxes that a shareholder would pay on fund distributions or the redemption of fund shares. During periods of reimbursement by Fidelity a fund's total returns will be greater than it would be had the reimbursement not occurred. How a fund did yesterday is no guarantee of how it will do tomorrow.
Average Annual Total Returns
Periods ended February 29, 2004 | Past 1
year | Past 5
years | Past 10
years |
Select Banking | 40.08% | 7.00% | 15.71% |
$10,000 Over 10 Years
Let's say hypothetically that $10,000 was invested in Fidelity Select Banking Portfolio on February 28, 1994. The chart shows how the value of your investment would have grown, and also shows how the S&P 500 Index did over the same period.
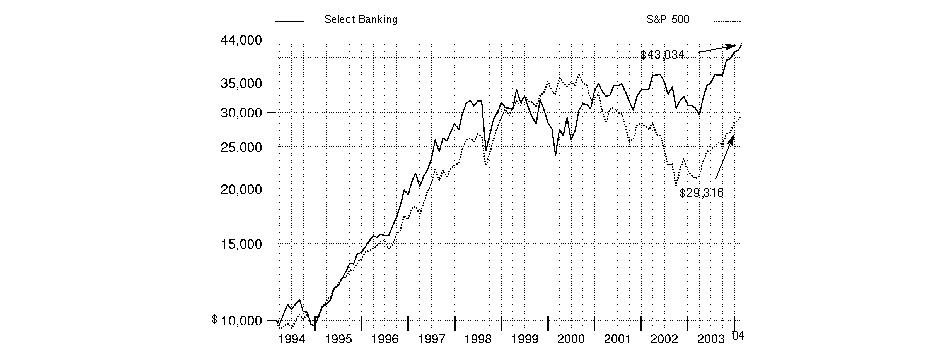
Annual Report
Banking Portfolio
Management's Discussion of Fund Performance
Comments from Peter Hirsch, Portfolio Manager of Fidelity Select Banking Portfolio
From March 2003 through the end of February 2004, domestic stocks recovered dramatically from their prior three-year swoon, driven largely by a broad-based economic and corporate profit recovery. Most major equity benchmarks gained 35% or more during the 12-month period, led by the Russell 2000® Index - a measure of the overall small-cap universe - which advanced 64.41%. As investors grew more confident about the economy's vitality, small-cap stocks were bid up, particularly those with no current earnings. In comparison, the Wilshire 5000® Total Market Index, commonly used as a proxy for the entire U.S. stock market's performance, rose 42.47%. Every sector of the market posted a double-digit advance, with economically sensitive issues - especially technology stocks - leading the way. The tech-heavy NASDAQ Composite® Index returned 52.47% during the past year, despite a negative return in February as investors turned to the more value-oriented segments of the market. The broader Standard & Poor's 500SM Index climbed 38.52% during the year, slightly outperforming the 37.07% increase for the blue-chip Dow Jones Industrial AverageSM.
Fidelity Select Banking Portfolio was up 40.08% during the 12-month period ending February 29, 2004, trailing the 46.45% return for the Goldman Sachs® Financial Services Index but outperforming the S&P 500® index. As a group, bank stocks performed well, but they couldn't keep up with the stronger gains achieved by other financial services industries that made up a larger portion of the Goldman Sachs index, such as security brokerages and investment management companies, whose profits generally increased at a higher rate due to their businesses being more economically sensitive. For example, several bank holdings that were significant positions in the fund and appreciated more than 20%, such as Bank of America, M&T Bank and SouthTrust, proved to be detractors from the fund's relative return. On the positive side of the ledger, good stock picking within the banking group made a notable contribution to the fund's performance relative to its sector benchmark. In particular, overweighting selected bank stocks that had significant capital markets exposure, such as J.P. Morgan Chase, Northern Trust and Bank of New York, worked out well, as all of these stocks outperformed the Goldman Sachs index.
Note to shareholders: Heather Lawrence became Portfolio Manager of Fidelity Select Banking Portfolio on March 1, 2004.
The views expressed in this statement reflect those of the portfolio manager only through the end of the period of the report as stated on the cover and do not necessarily represent the views of Fidelity or any other person in the Fidelity organization. Any such views are subject to change at any time based upon market or other conditions and Fidelity disclaims any responsibility to update such views. These views may not be relied on as investment advice and, because investment decisions for a Fidelity fund are based on numerous factors, may not be relied on as an indication of trading intent on behalf of any Fidelity fund.
Annual Report
Banking Portfolio
Investment Summary
Top Ten Stocks as of February 29, 2004 |
| % of fund's
net assets |
Bank One Corp. | 10.3 |
Bank of America Corp. | 6.5 |
Fifth Third Bancorp | 6.3 |
J.P. Morgan Chase & Co. | 6.2 |
Golden West Financial Corp., Delaware | 5.2 |
Bank of New York Co., Inc. | 5.0 |
Citigroup, Inc. | 4.8 |
Northern Trust Corp. | 4.6 |
Wachovia Corp. | 4.5 |
Wells Fargo & Co. | 4.4 |
| 57.8 |
Top Industries as of February 29, 2004 |
% of fund's net assets |
| Commercial Banks | 61.7% | |
| Capital Markets | 17.6% | |
| Thrifts & Mortgage Finance | 12.8% | |
| Diversified Financial Services | 4.8% | |
| IT Services | 0.0% | |
| All Others * | 3.1% | |

* Includes short-term investments and net other assets. |
Annual Report
Banking Portfolio
Investments February 29, 2004
Showing Percentage of Net Assets
Common Stocks - 96.9% |
| Shares | | Value (Note 1) |
CAPITAL MARKETS - 17.6% |
Bank of New York Co., Inc. | 737,396 | | $ 24,334,068 |
Investors Financial Services Corp. | 16,700 | | 735,301 |
J.P. Morgan Chase & Co. | 739,300 | | 30,326,086 |
Mellon Financial Corp. | 236,000 | | 7,641,680 |
Northern Trust Corp. | 449,900 | | 22,337,535 |
Piper Jaffray Companies (a) | 2,695 | | 138,846 |
SEI Investments Co. | 11,300 | | 403,523 |
State Street Corp. | 3,000 | | 161,190 |
TOTAL CAPITAL MARKETS | | 86,078,229 |
COMMERCIAL BANKS - 61.7% |
AmSouth Bancorp. | 37,200 | | 941,160 |
Associated Banc-Corp. | 45,080 | | 2,001,101 |
Bank of America Corp. | 389,406 | | 31,900,140 |
Bank One Corp. | 935,626 | | 50,505,091 |
Banknorth Group, Inc. | 274,400 | | 9,145,752 |
BB&T Corp. | 15,642 | | 581,100 |
City National Corp. | 113,300 | | 7,042,728 |
Comerica, Inc. | 2,800 | | 161,112 |
Commerce Bancorp, Inc., New Jersey | 49,911 | | 3,028,100 |
Commerce Bancshares, Inc. | 31,527 | | 1,557,749 |
Compass Bancshares, Inc. | 72,400 | | 3,010,392 |
East West Bancorp, Inc. | 65,000 | | 3,454,750 |
Fifth Third Bancorp | 552,380 | | 30,944,328 |
First Bancorp, Puerto Rico | 25,700 | | 1,090,965 |
First Commonwealth Financial Corp. | 60,000 | | 882,000 |
FirstMerit Corp. | 900 | | 23,868 |
FleetBoston Financial Corp. | 282,454 | | 12,718,904 |
Fulton Financial Corp. | 47,840 | | 1,052,958 |
Humboldt Bancorp | 57,120 | | 1,005,312 |
Huntington Bancshares, Inc. | 129,070 | | 2,985,389 |
IBERIABANK Corp. | 39,300 | | 2,444,460 |
KeyCorp | 30,900 | | 1,001,778 |
M&T Bank Corp. | 181,400 | | 17,423,470 |
Marshall & Ilsley Corp. | 38,200 | | 1,513,484 |
Nara Bancorp, Inc. | 37,400 | | 1,251,404 |
National City Corp. | 25,289 | | 902,817 |
National Commerce Financial Corp. | 201,900 | | 5,905,575 |
North Fork Bancorp, Inc., New York | 34,500 | | 1,456,935 |
Pacific Capital Bancorp | 66 | | 2,602 |
Pacific Union Bank | 40,908 | | 1,227,240 |
PNC Financial Services Group, Inc. | 59,600 | | 3,493,752 |
Popular, Inc. | 149,200 | | 6,684,160 |
PrivateBancorp, Inc. | 41,650 | | 2,078,335 |
|
| Shares | | Value (Note 1) |
Santander Bancorp | 53,100 | | $ 1,403,964 |
Silicon Valley Bancshares (a) | 101,600 | | 3,479,800 |
SouthTrust Corp. | 289,790 | | 9,736,944 |
SunTrust Banks, Inc. | 10,047 | | 726,499 |
Synovus Financial Corp. | 243,500 | | 6,099,675 |
TCF Financial Corp. | 800 | | 41,584 |
U.S. Bancorp, Delaware | 269,500 | | 7,688,835 |
UnionBanCal Corp. | 157,134 | | 8,471,094 |
Valley National Bancorp | 123,800 | | 3,489,922 |
Wachovia Corp. | 453,953 | | 21,776,125 |
Wells Fargo & Co. | 372,500 | | 21,362,875 |
Wintrust Financial Corp. | 55,100 | | 2,650,310 |
Zions Bancorp | 93,400 | | 5,442,418 |
TOTAL COMMERCIAL BANKS | | 301,788,956 |
DIVERSIFIED FINANCIAL SERVICES - 4.8% |
Citigroup, Inc. | 469,200 | | 23,581,992 |
INSURANCE - 0.0% |
Travelers Property Casualty Corp.: | | | |
Class A | 99 | | 1,798 |
Class B | 61 | | 1,113 |
TOTAL INSURANCE | | 2,911 |
IT SERVICES - 0.0% |
InterCept, Inc. (a) | 3,300 | | 39,402 |
REAL ESTATE - 0.0% |
Levitt Corp. Class A (a) | 725 | | 15,943 |
THRIFTS & MORTGAGE FINANCE - 12.8% |
Astoria Financial Corp. | 1,200 | | 48,408 |
BankAtlantic Bancorp, Inc. Class A (non-vtg.) | 2,900 | | 51,968 |
Countrywide Financial Corp. | 33,709 | | 3,088,756 |
Doral Financial Corp. | 24,900 | | 849,588 |
Golden West Financial Corp., Delaware | 218,500 | | 25,219,270 |
Greenpoint Financial Corp. | 31,500 | | 1,374,030 |
Hawthorne Financial Corp. (a) | 68,100 | | 2,661,348 |
Hudson City Bancorp, Inc. | 37,900 | | 1,472,794 |
IndyMac Bancorp, Inc. | 53,000 | | 1,865,600 |
NetBank, Inc. | 227,700 | | 2,823,480 |
New York Community Bancorp, Inc. | 238,800 | | 8,386,656 |
Sovereign Bancorp, Inc. | 422,300 | | 9,353,945 |
W Holding Co., Inc. | 269,284 | | 5,396,451 |
TOTAL THRIFTS & MORTGAGE FINANCE | | 62,592,294 |
TOTAL COMMON STOCKS (Cost $293,740,651) | 474,099,727 |
Money Market Funds - 9.5% |
| Shares | | Value (Note 1) |
Fidelity Cash Central Fund, 1.08% (b) | 15,598,442 | | $ 15,598,442 |
Fidelity Securities Lending Cash Central Fund, 1.08% (b) | 30,761,375 | | 30,761,375 |
TOTAL MONEY MARKET FUNDS (Cost $46,359,817) | 46,359,817 |
TOTAL INVESTMENT PORTFOLIO - 106.4% (Cost $340,100,468) | 520,459,544 |
NET OTHER ASSETS - (6.4)% | (31,084,001) |
NET ASSETS - 100% | $ 489,375,543 |
Legend |
(a) Non-income producing |
(b) Affiliated fund that is available only to investment companies and other accounts managed by Fidelity Investments. The rate quoted is the annualized seven-day yield of the fund at period end. A complete listing of the fund's holdings as of its most recent fiscal year end is available upon request. |
Other Information |
Purchases and sales of securities, other than short-term securities, aggregated $112,257,946 and $142,204,579, respectively. |
The fund placed a portion of its portfolio transactions with brokerage firms which are affiliates of the investment adviser. The commissions paid to these affiliated firms were $31,844 for the period. |
Income Tax Information |
The fund hereby designates approximately $6,142,000 as a capital gain dividend for the purpose of the dividend paid deduction. |
See accompanying notes which are an integral part of the financial statements.
Financial Services Sector
Banking Portfolio
Financial Statements
Statement of Assets and Liabilities
| February 29, 2004 |
| | |
Assets | | |
Investment in securities, at value (including securities loaned of $30,089,216) (cost $340,100,468) - See accompanying schedule | | $ 520,459,544 |
Receivable for fund shares sold | | 292,901 |
Dividends receivable | | 583,836 |
Interest receivable | | 13,672 |
Prepaid expenses | | 1,962 |
Other affiliated receivables | | 4 |
Other receivables | | 21,326 |
Total assets | | 521,373,245 |
| | |
Liabilities | | |
Payable for fund shares redeemed | $ 834,571 | |
Accrued management fee | 231,164 | |
Other affiliated payables | 143,022 | |
Other payables and accrued expenses | 27,570 | |
Collateral on securities loaned, at value | 30,761,375 | |
Total liabilities | | 31,997,702 |
| | |
Net Assets | | $ 489,375,543 |
Net Assets consist of: | | |
Paid in capital | | $ 306,174,167 |
Undistributed net investment income | | 1,479,567 |
Accumulated undistributed net realized gain (loss) on investments | | 1,362,733 |
Net unrealized appreciation (depreciation) on investments | | 180,359,076 |
Net Assets, for 11,994,198 shares outstanding | | $ 489,375,543 |
Net Asset Value, offering price and redemption price per share ($489,375,543 ÷ 11,994,198 shares) | | $ 40.80 |
Statement of Operations
| Year ended February 29, 2004 |
| | |
Investment Income | | |
Dividends | | $ 10,350,312 |
Interest | | 133,225 |
Security lending | | 32,500 |
Total income | | 10,516,037 |
| | |
Expenses | | |
Management fee | $ 2,414,114 | |
Transfer agent fees | 1,710,248 | |
Accounting and security lending fees | 261,074 | |
Non-interested trustees' compensation | 2,274 | |
Custodian fees and expenses | 11,924 | |
Registration fees | 26,104 | |
Audit | 45,552 | |
Legal | 1,872 | |
Miscellaneous | 12,061 | |
Total expenses before reductions | 4,485,223 | |
Expense reductions | (43,402) | 4,441,821 |
Net investment income (loss) | | 6,074,216 |
Realized and Unrealized Gain (Loss) Net realized gain (loss) on investment securities | | 14,665,358 |
Change in net unrealized appreciation (depreciation) on investment securities | | 120,008,339 |
Net gain (loss) | | 134,673,697 |
Net increase (decrease) in net assets resulting from operations | | $ 140,747,913 |
Other Information | | |
Sales charges paid to FDC | | $ 161,605 |
Deferred sales charges withheld by FDC | | $ 3,596 |
Exchange fees withheld by
FSC | | $ 6,045 |
See accompanying notes which are an integral part of the financial statements.
Annual Report
Banking Portfolio
Financial Statements - continued
Statement of Changes in Net Assets
| Year ended
February 29,
2004 | Year ended
February 28,
2003 |
Increase (Decrease) in Net Assets | | |
Operations | | |
Net investment income (loss) | $ 6,074,216 | $ 6,939,879 |
Net realized gain (loss) | 14,665,358 | (3,198,488) |
Change in net unrealized appreciation (depreciation) | 120,008,339 | (50,119,300) |
Net increase (decrease) in net assets resulting from operations | 140,747,913 | (46,377,909) |
Distributions to shareholders from net investment income | (5,352,517) | (4,545,468) |
Distributions to shareholders from net realized gain | (5,029,258) | - |
Total distributions | (10,381,775) | (4,545,468) |
Share transactions
Net proceeds from sales of shares | 112,909,846 | 132,661,819 |
Reinvestment of distributions | 9,782,551 | 4,301,230 |
Cost of shares redeemed | (146,856,256) | (176,600,882) |
Net increase (decrease) in net assets resulting from share transactions | (24,163,859) | (39,637,833) |
Redemption fees | 35,597 | 109,932 |
Total increase (decrease) in net assets | 106,237,876 | (90,451,278) |
| | |
Net Assets | | |
Beginning of period | 383,137,667 | 473,588,945 |
End of period (including undistributed net investment income of $1,479,567 and undistributed net investment income of $2,952,742, respectively) | $ 489,375,543 | $ 383,137,667 |
Other Information Shares | | |
Sold | 3,064,608 | 3,971,002 |
Issued in reinvestment of distributions | 262,490 | 137,755 |
Redeemed | (4,164,077) | (5,516,224) |
Net increase (decrease) | (836,979) | (1,407,467) |
Financial Highlights
Years ended February 28, | 2004 E | 2003 | 2002 | 2001 | 2000 E |
Selected Per-Share Data | | | | | |
Net asset value, beginning of period | $ 29.86 | $ 33.26 | $ 33.40 | $ 26.47 | $ 41.57 |
Income from Investment Operations | | | | | |
Net investment income (loss) C | .52 | .50 | .51 | .56 | .39 |
Net realized and unrealized gain (loss) | 11.36 | (3.57) | (.17) | 9.36 | (7.74) |
Total from investment operations | 11.88 | (3.07) | .34 | 9.92 | (7.35) |
Distributions from net investment income | (.48) | (.34) | (.47) | (.60) | (.36) |
Distributions from net realized gain | (.46) | - | (.02) | (2.10) | (7.44) |
Distributions in excess of net realized gain | - | - | - | (.37) | - |
Total distributions | (.94) | (.34) | (.49) | (3.07) | (7.80) |
Redemption fees added to paid in capital C | - F | .01 | .01 | .08 | .05 |
Net asset value, end of period | $ 40.80 | $ 29.86 | $ 33.26 | $ 33.40 | $ 26.47 |
Total Return A, B | 40.08% | (9.24)% | 1.07% | 40.08% | (22.07)% |
Ratios to Average Net Assets D | | | | | |
Expenses before expense reductions | 1.08% | 1.11% | 1.11% | 1.20% | 1.23% |
Expenses net of voluntary waivers, if any | 1.08% | 1.11% | 1.11% | 1.20% | 1.23% |
Expenses net of all reductions | 1.07% | 1.10% | 1.09% | 1.18% | 1.19% |
Net investment income (loss) | 1.46% | 1.54% | 1.55% | 1.86% | 1.00% |
Supplemental Data | | | | | |
Net assets, end of period (000 omitted) | $ 489,376 | $ 383,138 | $ 473,589 | $ 513,838 | $ 363,537 |
Portfolio turnover rate | 28% | 33% | 41% | 63% | 94% |
A Total returns would have been lower had certain expenses not been reduced during the periods shown. B Total returns do not include the effect of the former sales charges. C Calculated based on average shares outstanding during the period. D Expense ratios reflect operating expenses of the fund. Expenses before reductions do not reflect amounts reimbursed by the investment adviser or reductions from brokerage service arrangements or other expense offset arrangements and do not represent the amount paid by the fund during periods when reimbursements or reductions occur. Expenses net of any voluntary waivers reflect expenses after reimbursement by the investment adviser but prior to reductions from brokerage service arrangements or other expense offset arrangements. Expenses net of all reductions represent the net expenses paid by the fund. E For the year ended February 29. F Amount represents less than $.01 per share. |
See accompanying notes which are an integral part of the financial statements.
Financial Services Sector
Brokerage and Investment Management Portfolio
Performance
Average annual total return reflects the change in the value of an investment, assuming reinvestment of the fund's dividend income and capital gains (the profits earned upon the sale of securities that have grown in value) and assuming a constant rate of performance each year. The $10,000 table and the fund's returns do not reflect the deduction of taxes that a shareholder would pay on fund distributions or the redemption of fund shares. During periods of reimbursement by Fidelity a fund's total returns will be greater than it would be had the reimbursement not occurred. How a fund did yesterday is no guarantee of how it will do tomorrow.
Average Annual Total Returns
Periods ended February 29, 2004 | Past 1
year | Past 5
years | Past 10
years |
Select Brokerage and Investment Management | 63.56% | 11.84% | 16.81% |
$10,000 Over 10 Years
Let's say hypothetically that $10,000 was invested in Fidelity Select Brokerage and Investment Management Portfolio on February 28, 1994. The chart shows how the value of your investment would have grown, and also shows how the S&P 500 Index did over the same period.
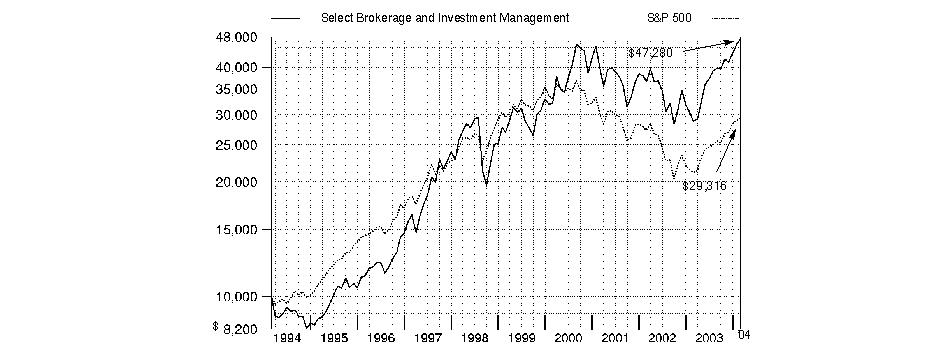
Annual Report
Brokerage and Investment Management Portfolio
Management's Discussion of Fund Performance
Comments from Brian Kennedy, Portfolio Manager of Fidelity® Select Brokerage and Investment Management Portfolio
From March 2003 through the end of February 2004, domestic stocks recovered dramatically from their prior three-year swoon, driven largely by a broad-based economic and corporate profit recovery. Most major equity benchmarks gained 35% or more during the 12-month period, led by the Russell 2000® Index - a measure of the overall small-cap universe - which advanced 64.41%. As investors grew more confident about the economy's vitality, small-cap stocks were bid up, particularly those with no current earnings. In comparison, the Wilshire 5000® Total Market Index, commonly used as a proxy for the entire U.S. stock market's performance, rose 42.47%. Every sector of the market posted a double-digit advance, with economically sensitive issues - especially technology stocks - leading the way. The tech-heavy NASDAQ Composite® Index returned 52.47% during the past year, despite a negative return in February as investors turned to the more value-oriented segments of the market. The broader Standard & Poor's 500SM Index climbed 38.52% during the year, slightly outperforming the 37.07% increase for the blue-chip Dow Jones Industrial AverageSM.
Brokerage and investment management stocks were among the biggest beneficiaries of the broad market rally, which helped to propel the Fidelity Select Brokerage and Investment Management Portfolio to a 63.56% gain during the past year, outperforming the Goldman Sachs® Financial Services Index, which gained 46.45%, and the S&P 500®. Two traditional trading specialists, LaBranche & Company and Van der Moolen, underperformed as electronic trading became more prevalent. Conversely, investors returned to the stock market with increased confidence, resulting in higher stock prices and increased trading activity. A spate of new financing initiatives contributed to brokerage and investment management firms' bottom lines, including restructured corporate debt, new issues of convertible securities and asset-backed securities, and initial public offerings. Mergers and acquisitions also restarted with renewed vigor. As a result, brokers' and investment managers' commissions and fees rose during the period, with online brokers Ameritrade and E*TRADE among the portfolio's top performers. Lehman Brothers, which is attempting to balance its historically strong fixed-income business with a stronger focus on equities, was also a top performer.
The views expressed in this statement reflect those of the portfolio manager only through the end of the period of the report as stated on the cover and do not necessarily represent the views of Fidelity or any other person in the Fidelity organization. Any such views are subject to change at any time based upon market or other conditions and Fidelity disclaims any responsibility to update such views. These views may not be relied on as investment advice and, because investment decisions for a Fidelity fund are based on numerous factors, may not be relied on as an indication of trading intent on behalf of any Fidelity fund.
Annual Report
Brokerage and Investment Management Portfolio
Investment Summary
Top Ten Stocks as of February 29, 2004 |
| % of fund's
net assets |
Lehman Brothers Holdings, Inc. | 9.0 |
E*TRADE Group, Inc. | 5.9 |
Merrill Lynch & Co., Inc. | 5.5 |
Morgan Stanley | 5.3 |
Citigroup, Inc. | 5.0 |
Goldman Sachs Group, Inc. | 4.5 |
Bear Stearns Companies, Inc. | 4.5 |
Ameritrade Holding Corp. | 4.5 |
Franklin Resources, Inc. | 4.2 |
T. Rowe Price Group, Inc. | 4.0 |
| 52.4 |
Top Industries as of February 29, 2004 |
% of fund's net assets |
| Capital Markets | 79.7% | |
| Diversified
Financial Services | 8.1% | |
| Consumer Finance | 4.0% | |
| Thrifts & Mortgage Finance | 1.7% | |
| Insurance | 1.7% | |
| All Others* | 4.8% | |

* Includes short-term investments and net other assets. |
Annual Report
Brokerage and Investment Management Portfolio
Investments February 29, 2004
Showing Percentage of Net Assets
Common Stocks - 98.0% |
| Shares | | Value (Note 1) |
CAPITAL MARKETS - 79.7% |
3i Group PLC | 75,000 | | $ 909,633 |
Allied Capital Corp. | 50,000 | | 1,536,500 |
American Capital Strategies Ltd. | 310,000 | | 10,301,300 |
Ameritrade Holding Corp. (a) | 1,279,700 | | 20,833,516 |
Bear Stearns Companies, Inc. | 237,486 | | 20,860,770 |
BlackRock, Inc. Class A | 47,900 | | 2,850,050 |
Charles Schwab Corp. | 1,377,100 | | 16,855,704 |
D. Carnegie & Co. AB | 70,000 | | 894,463 |
DAB Bank AG (a) | 90,000 | | 955,829 |
E*TRADE Group, Inc. (a) | 1,900,000 | | 27,189,000 |
Eaton Vance Corp. (non-vtg.) | 260,700 | | 10,036,950 |
Federated Investors, Inc. Class B (non-vtg.) | 368,850 | | 11,902,790 |
Franklin Resources, Inc. | 338,500 | | 19,125,250 |
Goldman Sachs Group, Inc. | 197,200 | | 20,877,564 |
Intermediate Capital Group PLC | 40,000 | | 888,859 |
Investment Technology Group, Inc. (a) | 208,350 | | 3,016,908 |
J.P. Morgan Chase & Co. | 443,220 | | 18,180,884 |
Janus Capital Group, Inc. | 512,300 | | 8,770,576 |
Knight Trading Group, Inc. (a) | 1,000,000 | | 13,860,000 |
Legg Mason, Inc. | 193,432 | | 18,248,375 |
Lehman Brothers Holdings, Inc. | 476,450 | | 41,312,980 |
Merrill Lynch & Co., Inc. | 414,300 | | 25,359,303 |
Morgan Stanley | 408,130 | | 24,389,849 |
Northern Trust Corp. | 23,100 | | 1,146,915 |
Piper Jaffray Companies (a) | 50,000 | | 2,576,000 |
Raymond James Financial, Inc. | 175,325 | | 6,700,922 |
SEI Investments Co. | 1,000 | | 35,710 |
T. Rowe Price Group, Inc. | 353,200 | | 18,574,788 |
UBS AG (NY Shares) | 145,400 | | 10,761,054 |
Waddell & Reed Financial, Inc. Class A | 316,995 | | 8,222,850 |
TOTAL CAPITAL MARKETS | | 367,175,292 |
COMMERCIAL BANKS - 1.6% |
Bank of America Corp. | 12,900 | | 1,056,768 |
Bank One Corp. | 66,100 | | 3,568,078 |
Wells Fargo & Co. New | 48,600 | | 2,787,210 |
TOTAL COMMERCIAL BANKS | | 7,412,056 |
COMMERCIAL SERVICES & SUPPLIES - 0.8% |
Bowne & Co., Inc. | 150,300 | | 2,434,860 |
Dun & Bradstreet Corp. (a) | 1,000 | | 53,220 |
Equifax, Inc. | 1,000 | | 26,210 |
H&R Block, Inc. | 20,700 | | 1,118,835 |
TOTAL COMMERCIAL SERVICES & SUPPLIES | | 3,633,125 |
CONSUMER FINANCE - 4.0% |
American Express Co. | 341,300 | | 18,232,246 |
|
| Shares | | Value (Note 1) |
DIVERSIFIED FINANCIAL SERVICES - 8.1% |
Alliance Capital Management Holding LP | 50,500 | | $ 1,868,500 |
Citigroup, Inc. | 452,866 | | 22,761,045 |
Deutsche Boerse AG | 5,007 | | 289,590 |
eSpeed, Inc. Class A (a) | 465,000 | | 9,388,350 |
Instinet Group, Inc. (a) | 271,800 | | 1,921,626 |
OMHEX AB | 60,000 | | 945,169 |
TOTAL DIVERSIFIED FINANCIAL SERVICES | | 37,174,280 |
INSURANCE - 1.7% |
American International Group, Inc. | 34,800 | | 2,575,200 |
Hartford Financial Services Group, Inc. | 78,300 | | 5,128,650 |
Scottish Annuity & Life Holdings Ltd. | 10,100 | | 238,158 |
TOTAL INSURANCE | | 7,942,008 |
IT SERVICES - 0.4% |
First Data Corp. | 41,600 | | 1,704,768 |
SOFTWARE - 0.0% |
FactSet Research Systems, Inc. | 1,000 | | 36,830 |
Fair, Isaac & Co., Inc. | 1,000 | | 59,640 |
TOTAL SOFTWARE | | 96,470 |
THRIFTS & MORTGAGE FINANCE - 1.7% |
Golden West Financial Corp., Delaware | 70,000 | | 8,079,400 |
TOTAL COMMON STOCKS (Cost $317,320,236) | 451,449,645 |
Money Market Funds - 4.0% |
| | | |
Fidelity Cash Central Fund, 1.08% (b) | 12,637,978 | | 12,637,978 |
Fidelity Securities Lending Cash Central Fund, 1.08% (b) | 5,886,250 | | 5,886,250 |
TOTAL MONEY MARKET FUNDS (Cost $18,524,228) | 18,524,228 |
TOTAL INVESTMENT PORTFOLIO - 102.0% (Cost $335,844,464) | 469,973,873 |
NET OTHER ASSETS - (2.0)% | (9,399,952) |
NET ASSETS - 100% | $ 460,573,921 |
Legend |
(a) Non-income producing |
(b) Affiliated fund that is available only to investment companies and other accounts managed by Fidelity Investments. The rate quoted is the annualized seven-day yield of the fund at period end. A complete listing of the fund's holdings as of its most recent fiscal year end is available upon request. |
Other Information |
Purchases and sales of securities, other than short-term securities, aggregated $237,330,298 and $236,701,772, respectively. |
The fund placed a portion of its portfolio transactions with brokerage firms which are affiliates of the investment adviser. The commissions paid to these affiliated firms were $23,385 for the period. |
Income Tax Information |
At February 29, 2004, the fund had a capital loss carryforward of approximately $36,859,000 of which $27,486,000 and $9,373,000 will expire on February 28, 2010 and 2011, respectively. |
See accompanying notes which are an integral part of the financial statements.
Financial Services Sector
Brokerage and Investment Management Portfolio
Financial Statements
Statement of Assets and Liabilities
| February 29, 2004 |
| | |
Assets | | |
Investment in securities, at value (including securities loaned of $5,732,550) (cost $335,844,464) - See accompanying schedule | | $ 469,973,873 |
Receivable for investments sold | | 5,437,459 |
Receivable for fund shares sold | | 1,086,096 |
Dividends receivable | | 129,899 |
Interest receivable | | 13,027 |
Prepaid expenses | | 1,940 |
Other affiliated receivables | | 213 |
Other receivables | | 70,089 |
Total assets | | 476,712,596 |
| | |
Liabilities | | |
Payable for investments purchased | $ 9,345,076 | |
Payable for fund shares redeemed | 531,244 | |
Accrued management fee | 215,848 | |
Other affiliated payables | 132,714 | |
Other payables and accrued expenses | 27,543 | |
Collateral on securities loaned, at value | 5,886,250 | |
Total liabilities | | 16,138,675 |
| | |
Net Assets | | $ 460,573,921 |
Net Assets consist of: | | |
Paid in capital | | $ 364,726,812 |
Undistributed net investment income | | 294,117 |
Accumulated undistributed net realized gain (loss) on investments and foreign currency transactions | | (38,576,417) |
Net unrealized appreciation (depreciation) on investments | | 134,129,409 |
Net Assets, for 8,508,990 shares outstanding | | $ 460,573,921 |
Net Asset Value, offering price and redemption price per share ($460,573,921 ÷ 8,508,990 shares) | | $ 54.13 |
Statement of Operations
| Year ended February 29, 2004 |
| | |
Investment Income | | |
Dividends | | $ 5,447,618 |
Interest | | 99,574 |
Security lending | | 67,150 |
Total income | | 5,614,342 |
| | |
Expenses | | |
Management fee | $ 2,197,733 | |
Transfer agent fees | 1,697,453 | |
Accounting and security lending fees | 237,888 | |
Non-interested trustees' compensation | 1,599 | |
Custodian fees and expenses | 12,177 | |
Registration fees | 24,560 | |
Audit | 45,354 | |
Legal | 1,372 | |
Miscellaneous | 12,385 | |
Total expenses before reductions | 4,230,521 | |
Expense reductions | (84,318) | 4,146,203 |
Net investment income (loss) | | 1,468,139 |
Realized and Unrealized Gain (Loss) Net realized gain (loss) on: | | |
Investment securities | 34,903,285 | |
Foreign currency transactions | (2,664) | |
Total net realized gain (loss) | | 34,900,621 |
Change in net unrealized appreciation (depreciation) on investment securities | | 138,792,823 |
Net gain (loss) | | 173,693,444 |
Net increase (decrease) in net assets resulting from operations | | $ 175,161,583 |
Other Information | | |
Sales charges paid to FDC | | $ 208,354 |
Deferred sales charges withheld by FDC | | $ 1,590 |
Exchange fees withheld by
FSC | | $ 6,083 |
See accompanying notes which are an integral part of the financial statements.
Annual Report
Brokerage and Investment Management Portfolio
Financial Statements - continued
Statement of Changes in Net Assets
| Year ended
February 29, 2004 | Year ended
February 28, 2003 |
Increase (Decrease) in Net Assets | | |
Operations | | |
Net investment income (loss) | $ 1,468,139 | $ 2,840,074 |
Net realized gain (loss) | 34,900,621 | (11,860,158) |
Change in net unrealized appreciation (depreciation) | 138,792,823 | (77,570,278) |
Net increase (decrease) in net assets resulting from operations | 175,161,583 | (86,590,362) |
Distributions to shareholders from net investment income | (1,323,045) | (2,209,018) |
Share transactions
Net proceeds from sales of shares | 170,230,959 | 146,572,532 |
Reinvestment of distributions | 1,257,074 | 2,105,423 |
Cost of shares redeemed | (166,766,767) | (203,906,836) |
Net increase (decrease) in net assets resulting from share transactions | 4,721,266 | (55,228,881) |
Redemption fees | 129,000 | 167,665 |
Total increase (decrease) in net assets | 178,688,804 | (143,860,596) |
| | |
Net Assets | | |
Beginning of period | 281,885,117 | 425,745,713 |
End of period (including undistributed net investment income of $294,117 and undistributed net investment
income of $584,819, respectively) | $ 460,573,921 | $ 281,885,117 |
Other Information Shares | | |
Sold | 3,775,985 | 3,783,390 |
Issued in reinvestment of distributions | 29,732 | 56,007 |
Redeemed | (3,782,350) | (5,413,616) |
Net increase (decrease) | 23,367 | (1,574,219) |
Financial Highlights
Years ended February 28, | 2004E | 2003 | 2002 | 2001 | 2000E |
Selected Per-Share Data | | | | | |
Net asset value, beginning of period | $ 33.22 | $ 42.32 | $ 50.10 | $ 45.69 | $ 41.16 |
Income from Investment Operations | | | | | |
Net investment income (loss)C | .17 | .30 | .04 | .13 | (.04) |
Net realized and unrealized gain (loss) | 20.88 | (9.19) | (4.31) | 10.68 | 7.64 |
Total from investment operations | 21.05 | (8.89) | (4.27) | 10.81 | 7.60 |
Distributions from net investment income | (.16) | (.23) | (.12) | - | (.05) |
Distributions from net realized gain | - | - | (3.41) | (6.49) | (3.13) |
Total distributions | (.16) | (.23) | (3.53) | (6.49) | (3.18) |
Redemption fees added to paid in capitalC | .02 | .02 | .02 | .09 | .11 |
Net asset value, end of period | $ 54.13 | $ 33.22 | $ 42.32 | $ 50.10 | $ 45.69 |
Total ReturnA,B | 63.56% | (21.02)% | (8.13)% | 23.77% | 19.14% |
Ratios to Average Net AssetsD | | | | | |
Expenses before expense reductions | 1.12% | 1.20% | 1.15% | 1.11% | 1.29% |
Expenses net of voluntary waivers, if any | 1.12% | 1.20% | 1.15% | 1.11% | 1.29% |
Expenses net of all reductions | 1.10% | 1.16% | 1.11% | 1.08% | 1.28% |
Net investment income (loss) | .39% | .78% | .10% | .24% | (.09)% |
Supplemental Data | | | | | |
Net assets, end of period (000 omitted) | $ 460,574 | $ 281,885 | $ 425,746 | $ 632,543 | $ 423,572 |
Portfolio turnover rate | 64% | 64% | 74% | 105% | 47% |
A Total returns would have been lower had certain expenses not been reduced during the periods shown. B Total returns do not include the effect of the former sales charges. C Calculated based on average shares outstanding during the period. D Expense ratios reflect operating expenses of the fund. Expenses before reductions do not reflect amounts reimbursed by the investment adviser or reductions from brokerage service arrangements or other expense offset arrangements and do not represent the amount paid by the fund during periods when reimbursements or reductions occur. Expenses net of any voluntary waivers reflect expenses after reimbursement by the investment adviser but prior to reductions from brokerage service arrangements or other expense offset arrangements. Expenses net of all reductions represent the net expenses paid by the fund. E For the year ended February 29. |
See accompanying notes which are an integral part of the financial statements.
Financial Services Sector
Financial Services Portfolio
Performance
Average annual total return reflects the change in the value of an investment, assuming reinvestment of the fund's dividend income and capital gains (the profits earned upon the sale of securities that have grown in value) and assuming a constant rate of performance each year. The $10,000 table and the fund's returns do not reflect the deduction of taxes that a shareholder would pay on fund distributions or the redemption of fund shares. During periods of reimbursement by Fidelity a fund's total returns will be greater than it would be had the reimbursement not occurred. How a fund did yesterday is no guarantee of how it will do tomorrow.
Average Annual Total Returns
Periods ended February 29, 2004 | Past 1
year | Past 5
years | Past 10
years |
Select Financial Services | 45.17% | 7.18% | 15.62% |
$10,000 Over 10 Years
Let's say hypothetically that $10,000 was invested in Fidelity Select Financial Services Portfolio on February 28, 1994. The chart shows how the value of your investment would have grown, and also shows how the S&P 500 Index did over the same period.
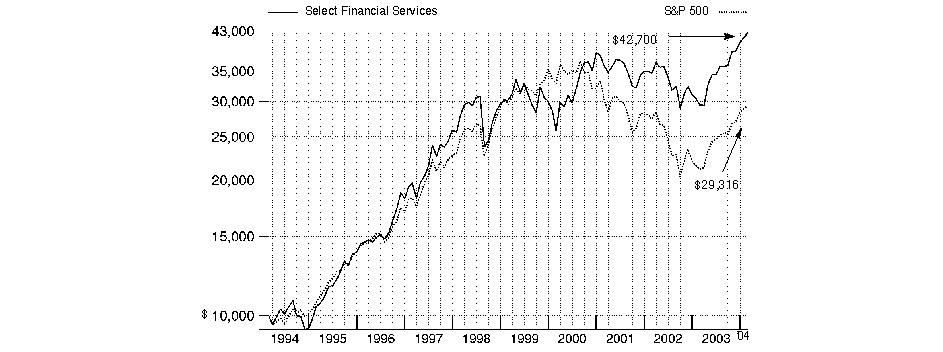
Annual Report
Financial Services Portfolio
Management's Discussion of Fund Performance
Comments from Jeffrey Feingold, Portfolio Manager of Fidelity® Select Financial Services Portfolio
From March 2003 through the end of February 2004, domestic stocks recovered dramatically from their prior three-year swoon, driven largely by a broad-based economic and corporate profit recovery. Most major equity benchmarks gained 35% or more during the 12-month period, led by the Russell 2000® Index - a measure of the overall small-cap universe - which advanced 64.41%. As investors grew more confident about the economy's vitality, small-cap stocks were bid up, particularly those with no current earnings. In comparison, the Wilshire 5000® Total Market Index, commonly used as a proxy for the entire U.S. stock market's performance, rose 42.47%. Every sector of the market posted a double-digit advance, with economically sensitive issues - especially technology stocks - leading the way. The tech-heavy NASDAQ Composite® Index returned 52.47% during the past year, despite a negative return in February as investors turned to the more value-oriented segments of the market. The broader Standard & Poor's 500SM Index climbed 38.52% during the year, slightly outperforming the 37.07% increase for the blue-chip Dow Jones Industrial AverageSM.
For the 12 months ending February 29, 2004, Fidelity Select Financial Services Portfolio returned 45.17%, slightly underperforming the Goldman Sachs® Financial Services Index, which had a total return of 46.45%, but topping the S&P 500®. Banks continued to outperform the broader market during the period, as they grew their earnings at healthy rates because of stable-to-improving credit quality trends and continued low funding costs for loans. However, economically sensitive specialty finance corporations and investment banks, which had lagged in previous years, produced some of the best performance because of their potential to benefit from a strengthened economy and improved equity markets. Performance leaders included MBNA, a major credit card issuer that benefited from better credit trends; online broker Ameritrade, which was helped by rising trading volumes as the stock market recovered; and Bank of New York, a banking and securities processor. Detractors included Apartment Investment & Management, which was hurt by a weak apartment rental climate, and Fannie Mae, the government-sponsored mortgage company, whose stock declined both because of accounting problems at Freddie Mac and because of increased demand for mortgages from investors such as banks. The investment in Fifth Third Bancorp also held back performance.
Note to shareholders: Matthew Fruhan became Portfolio Manager of Fidelity Select Financial Services Portfolio on April 1, 2004.
The views expressed in this statement reflect those of the portfolio manager only through the end of the period of the report as stated on the cover and do not necessarily represent the views of Fidelity or any other person in the Fidelity organization. Any such views are subject to change at any time based upon market or other conditions and Fidelity disclaims any responsibility to update such views. These views may not be relied on as investment advice and, because investment decisions for a Fidelity fund are based on numerous factors, may not be relied on as an indication of trading intent on behalf of any Fidelity fund.
Annual Report
Financial Services Portfolio
Investment Summary
Top Ten Stocks as of February 29, 2004 |
| % of fund's
net assets |
American International Group, Inc. | 5.3 |
Fannie Mae | 4.4 |
Citigroup, Inc. | 4.1 |
Sovereign Bancorp, Inc. | 3.7 |
Bank of America Corp. | 3.3 |
MBNA Corp. | 3.2 |
American Express Co. | 3.1 |
Berkshire Hathaway, Inc. Class B | 3.0 |
Wells Fargo & Co. | 3.0 |
J.P. Morgan Chase & Co. | 2.9 |
| 36.0 |
Top Industries as of February 29, 2004 |
% of fund's net assets |
| Commercial Banks | 24.0% | |
| Insurance | 23.5% | |
| Capital Markets | 17.0% | |
| Thrifts & Mortgage Finance | 15.3% | |
| Consumer Finance | 8.4% | |
| All Others* | 11.8% | |

* Includes short-term investments and net other assets. |
Annual Report
Financial Services Portfolio
Investments February 29, 2004
Showing Percentage of Net Assets
Common Stocks - 97.6% |
| Shares | | Value (Note 1) |
CAPITAL MARKETS - 17.0% |
A.G. Edwards, Inc. | 20,000 | | $ 765,000 |
Ameritrade Holding Corp. (a) | 245,600 | | 3,998,368 |
Bank of New York Co., Inc. | 200,636 | | 6,620,988 |
Bear Stearns Companies, Inc. | 34,900 | | 3,065,616 |
Charles Schwab Corp. | 94,286 | | 1,154,061 |
E*TRADE Group, Inc. (a) | 106,400 | | 1,522,584 |
Federated Investors, Inc. Class B (non-vtg.) | 79,150 | | 2,554,171 |
Franklin Resources, Inc. | 55,700 | | 3,147,050 |
Goldman Sachs Group, Inc. | 90,900 | | 9,623,583 |
Investors Financial Services Corp. | 48,900 | | 2,153,067 |
J.P. Morgan Chase & Co. | 394,260 | | 16,172,545 |
LaBranche & Co., Inc. | 29,200 | | 300,468 |
Lehman Brothers Holdings, Inc. | 66,800 | | 5,792,228 |
Mellon Financial Corp. | 148,000 | | 4,792,240 |
Merrill Lynch & Co., Inc. | 194,900 | | 11,929,829 |
Morgan Stanley | 225,900 | | 13,499,784 |
Northern Trust Corp. | 122,500 | | 6,082,125 |
Piper Jaffray Companies (a) | 2,352 | | 121,175 |
Waddell & Reed Financial, Inc. Class A | 42,602 | | 1,105,096 |
TOTAL CAPITAL MARKETS | | 94,399,978 |
COMMERCIAL BANKS - 24.0% |
Banco Popolare di Verona e Novara | 93,800 | | 1,629,292 |
Bank of America Corp. | 222,779 | | 18,250,056 |
Bank of Hawaii Corp. | 44,100 | | 2,012,724 |
Bank of the Ozarks, Inc. | 19,800 | | 482,724 |
Bank One Corp. | 226,919 | | 12,249,088 |
Banknorth Group, Inc. | 82,000 | | 2,733,060 |
BB&T Corp. | 109,000 | | 4,049,350 |
Comerica, Inc. | 31,800 | | 1,829,772 |
Commerce Bancorp, Inc., New Jersey | 9,998 | | 606,579 |
East West Bancorp, Inc. | 33,400 | | 1,775,210 |
Fifth Third Bancorp | 24,955 | | 1,397,979 |
FleetBoston Financial Corp. | 154,934 | | 6,976,678 |
KeyCorp | 92,500 | | 2,998,850 |
Mitsubishi Tokyo Financial Group, Inc. (MTFG) sponsored ADR | 187,700 | | 1,464,060 |
National Bank of Canada | 207,300 | | 7,086,184 |
North Fork Bancorp, Inc., New York | 64,100 | | 2,706,943 |
Royal Bank of Canada | 164,100 | | 7,796,731 |
SouthTrust Corp. | 75,900 | | 2,550,240 |
SunTrust Banks, Inc. | 94,500 | | 6,833,295 |
Synovus Financial Corp. | 56,800 | | 1,422,840 |
U.S. Bancorp, Delaware | 436,300 | | 12,447,639 |
UCBH Holdings, Inc. | 86,600 | | 3,377,400 |
UnionBanCal Corp. | 48,400 | | 2,609,244 |
Valley National Bancorp | 17,220 | | 485,432 |
Wachovia Corp. | 226,902 | | 10,884,489 |
Wells Fargo & Co. | 291,050 | | 16,691,718 |
TOTAL COMMERCIAL BANKS | | 133,347,577 |
|
| Shares | | Value (Note 1) |
CONSUMER FINANCE - 8.4% |
American Express Co. | 321,500 | | $ 17,174,530 |
Asta Funding, Inc. | 39,600 | | 1,577,268 |
Capital One Financial Corp. | 58,800 | | 4,158,336 |
MBNA Corp. | 659,200 | | 18,015,936 |
Metris Companies, Inc. | 178,000 | | 1,003,920 |
SLM Corp. | 115,500 | | 4,838,295 |
TOTAL CONSUMER FINANCE | | 46,768,285 |
DIVERSIFIED FINANCIAL SERVICES - 5.2% |
Chicago Mercantile Exchange Holdings, Inc. Class A | 300 | | 27,975 |
CIT Group, Inc. | 63,600 | | 2,510,292 |
Citigroup, Inc. | 458,602 | | 23,049,337 |
Encore Capital Group, Inc. (a) | 62,600 | | 893,928 |
Euronext NV | 43,500 | | 1,191,919 |
Principal Financial Group, Inc. | 30,000 | | 1,086,000 |
TOTAL DIVERSIFIED FINANCIAL SERVICES | | 28,759,451 |
INSURANCE - 23.5% |
ACE Ltd. | 170,600 | | 7,670,176 |
AFLAC, Inc. | 128,700 | | 5,226,507 |
Allstate Corp. | 196,500 | | 8,966,295 |
AMBAC Financial Group, Inc. | 57,500 | | 4,496,500 |
American Equity Investment Life
Holding Co. | 57,100 | | 693,194 |
American International Group, Inc. | 397,051 | | 29,381,773 |
Aon Corp. | 54,900 | | 1,440,027 |
Arch Capital Group Ltd. (a) | 26,600 | | 1,128,106 |
Berkshire Hathaway, Inc. Class B (a) | 5,330 | | 16,698,890 |
Cincinnati Financial Corp. | 31,100 | | 1,400,744 |
Everest Re Group Ltd. | 37,100 | | 3,242,169 |
Fidelity National Financial, Inc. | 75,075 | | 2,936,183 |
Hartford Financial Services Group, Inc. | 112,000 | | 7,336,000 |
HCC Insurance Holdings, Inc. | 24,700 | | 800,033 |
Lincoln National Corp. | 35,400 | | 1,643,622 |
Marsh & McLennan Companies, Inc. | 72,200 | | 3,464,878 |
MBIA, Inc. | 48,400 | | 3,184,236 |
MetLife, Inc. | 257,000 | | 9,033,550 |
Montpelier Re Holdings Ltd. | 22,400 | | 797,216 |
Old Republic International Corp. | 75,150 | | 1,773,540 |
PartnerRe Ltd. | 28,700 | | 1,585,388 |
Protective Life Corp. | 15,800 | | 601,032 |
RenaissanceRe Holdings Ltd. | 58,100 | | 3,076,395 |
Scottish Annuity & Life Holdings Ltd. | 21,100 | | 497,538 |
St. Paul Companies, Inc. | 37,100 | | 1,585,654 |
StanCorp Financial Group, Inc. | 20,300 | | 1,338,785 |
Sun Life Financial, Inc. | 146,000 | | 3,976,203 |
Torchmark Corp. | 17,600 | | 917,312 |
Travelers Property Casualty Corp.: | | | |
Class A | 244,269 | | 4,435,925 |
Common Stocks - continued |
| Shares | | Value (Note 1) |
INSURANCE - CONTINUED |
Travelers Property Casualty Corp.: - continued | | | |
Class B | 52,327 | | $ 954,444 |
UICI (a) | 43,700 | | 596,068 |
TOTAL INSURANCE | | 130,878,383 |
REAL ESTATE - 4.2% |
Apartment Investment & Management Co. Class A | 136,700 | | 4,429,080 |
AvalonBay Communities, Inc. | 18,700 | | 942,106 |
CBL & Associates Properties, Inc. | 11,480 | | 660,674 |
Duke Realty Corp. | 62,700 | | 2,031,480 |
Equity Residential (SBI) | 178,000 | | 5,295,500 |
Federal Realty Investment Trust (SBI) | 40,900 | | 1,732,115 |
Highwoods Properties, Inc. (SBI) | 40,400 | | 1,041,108 |
Manufactured Home Communities, Inc. | 13,100 | | 438,195 |
Reckson Associates Realty Corp. | 23,500 | | 629,330 |
Shurgard Storage Centers, Inc. | 14,500 | | 540,125 |
Simon Property Group, Inc. | 53,700 | | 2,926,113 |
The Mills Corp. | 13,700 | | 683,082 |
Vornado Realty Trust | 32,200 | | 1,832,180 |
TOTAL REAL ESTATE | | 23,181,088 |
THRIFTS & MORTGAGE FINANCE - 15.3% |
Astoria Financial Corp. | 30,700 | | 1,238,438 |
Countrywide Financial Corp. | 54,134 | | 4,960,298 |
Doral Financial Corp. | 150,450 | | 5,133,354 |
Fannie Mae | 326,200 | | 24,432,380 |
FirstFed Financial Corp., Delaware (a) | 44,500 | | 1,931,300 |
Golden West Financial Corp., Delaware | 108,200 | | 12,488,444 |
Hudson City Bancorp, Inc. | 57,200 | | 2,222,792 |
MGIC Investment Corp. | 39,000 | | 2,581,020 |
NetBank, Inc. | 197,000 | | 2,442,800 |
New York Community Bancorp, Inc. | 92,000 | | 3,231,040 |
Northwest Bancorp, Inc. | 39,100 | | 990,794 |
Radian Group, Inc. | 10,000 | | 437,000 |
Sovereign Bancorp, Inc. | 937,600 | | 20,767,840 |
Washington Federal, Inc. | 77,000 | | 1,998,920 |
TOTAL THRIFTS & MORTGAGE FINANCE | | 84,856,420 |
TOTAL COMMON STOCKS (Cost $367,545,497) | 542,191,182 |
Money Market Funds - 2.4% |
| Shares | | Value (Note 1) |
Fidelity Cash Central Fund, 1.08% (b) | 13,121,160 | | $ 13,121,160 |
Fidelity Securities Lending Cash Central Fund, 1.08% (b) | 54,825 | | 54,825 |
TOTAL MONEY MARKET FUNDS (Cost $13,175,985) | 13,175,985 |
TOTAL INVESTMENT PORTFOLIO - 100.0% (Cost $380,721,482) | | 555,367,167 |
NET OTHER ASSETS - 0.0% | | 209,992 |
NET ASSETS - 100% | $ 555,577,159 |
Legend |
(a) Non-income producing |
(b) Affiliated fund that is available only to investment companies and other accounts managed by Fidelity Investments. The rate quoted is the annualized seven-day yield of the fund at period end. A complete listing of the fund's holdings as of its most recent fiscal year end is available upon request. |
Other Information |
Purchases and sales of securities, other than short-term securities, aggregated $243,693,605 and $258,988,025, respectively. |
The fund placed a portion of its portfolio transactions with brokerage firms which are affiliates of the investment adviser. The commissions paid to these affiliated firms were $18,801 for the period. |
Income Tax Information |
The fund hereby designates approximately $142,000 as a capital gain dividend for the purpose of the dividend paid deduction. |
See accompanying notes which are an integral part of the financial statements.
Financial Services Sector
Financial Services Portfolio
Financial Statements
Statement of Assets and Liabilities
| February 29, 2004 |
| | |
Assets | | |
Investment in securities, at value (including securities loaned of $52,479) (cost $380,721,482) - See accompanying schedule | | $ 555,367,167 |
Receivable for fund shares sold | | 508,693 |
Dividends receivable | | 553,336 |
Interest receivable | | 11,055 |
Prepaid expenses | | 2,351 |
Other affiliated receivables | | 96 |
Other receivables | | 48,196 |
Total assets | | 556,490,894 |
| | |
Liabilities | | |
Payable for investments purchased | $ 9,500 | |
Payable for fund shares redeemed | 394,954 | |
Accrued management fee | 263,505 | |
Transfer agent fee payable | 138,203 | |
Other affiliated payables | 23,603 | |
Other payables and accrued expenses | 29,145 | |
Collateral on securities loaned, at value | 54,825 | |
Total liabilities | | 913,735 |
| | |
Net Assets | | $ 555,577,159 |
Net Assets consist of: | | |
Paid in capital | | $ 374,086,231 |
Undistributed net investment income | | 474,004 |
Accumulated undistributed net realized gain (loss) on investments and foreign currency transactions | | 6,369,824 |
Net unrealized appreciation (depreciation) on investments and assets and liabilities in foreign currencies | | 174,647,100 |
Net Assets, for 4,588,070 shares outstanding | | $ 555,577,159 |
Net Asset Value, offering price and redemption price per share ($555,577,159 ÷ 4,588,070 shares) | | $ 121.09 |
Statement of Operations
| Year ended February 29, 2004 |
| | |
Investment Income | | |
Dividends | | $ 9,504,252 |
Interest | | 38,663 |
Security lending | | 67,633 |
Total income | | 9,610,548 |
| | |
Expenses | | |
Management fee | $ 2,794,467 | |
Transfer agent fees | 2,038,852 | |
Accounting and security lending fees | 300,517 | |
Non-interested trustees' compensation | 2,522 | |
Custodian fees and expenses | 21,453 | |
Registration fees | 24,418 | |
Audit | 45,814 | |
Legal | 2,164 | |
Miscellaneous | 10,631 | |
Total expenses before reductions | 5,240,838 | |
Expense reductions | (75,637) | 5,165,201 |
Net investment income (loss) | | 4,445,347 |
Realized and Unrealized Gain (Loss) Net realized gain (loss) on: | | |
Investment securities | 29,055,607 | |
Investments not meeting investment restrictions | 9,882 | |
Foreign currency transactions | 7,213 | |
Total net realized gain (loss) | | 29,072,702 |
Change in net unrealized appreciation (depreciation) on: Investment securities | 141,893,015 | |
Assets and liabilities in foreign currencies | 1,224 | |
Total change in net unrealized appreciation (depreciation) | | 141,894,239 |
Net gain (loss) | | 170,966,941 |
Net increase (decrease) in net assets resulting from operations | | $ 175,412,288 |
Other Information | | |
Sales charges paid to FDC | | $ 167,026 |
Deferred sales charges withheld by FDC | | $ 8,315 |
Exchange fees withheld by
FSC | | $ 6,653 |
See accompanying notes which are an integral part of the financial statements.
Annual Report
Financial Services Portfolio
Financial Statements - continued
Statement of Changes in Net Assets
| Year ended
February 29,
2004 | Year ended
February 28,
2003 |
Increase (Decrease) in Net Assets | | |
Operations | | |
Net investment income (loss) | $ 4,445,347 | $ 3,820,995 |
Net realized gain (loss) | 29,072,702 | (11,159,502) |
Change in net unrealized appreciation (depreciation) | 141,894,239 | (71,647,374) |
Net increase (decrease) in net assets resulting from operations | 175,412,288 | (78,985,881) |
Distributions to shareholders from net investment income | (4,309,494) | (4,054,325) |
Share transactions
Net proceeds from sales of shares | 128,825,421 | 131,229,136 |
Reinvestment of distributions | 4,092,801 | 3,832,576 |
Cost of shares redeemed | (137,894,192) | (222,748,911) |
Net increase (decrease) in net assets resulting from share transactions | (4,975,970) | (87,687,199) |
Redemption fees | 57,915 | 117,538 |
Total increase (decrease) in net assets | 166,184,739 | (170,609,867) |
| | |
Net Assets | | |
Beginning of period | 389,392,420 | 560,002,287 |
End of period (including undistributed net investment income of $474,004 and undistributed net investment income of $406,952, respectively) | $ 555,577,159 | $ 389,392,420 |
Other Information Shares | | |
Sold | 1,257,161 | 1,385,333 |
Issued in reinvestment of distributions | 37,945 | 41,751 |
Redeemed | (1,334,891) | (2,401,917) |
Net increase (decrease) | (39,785) | (974,833) |
Financial Highlights
Years ended February 28, | 2004 E | 2003 | 2002 | 2001 | 2000 E |
Selected Per-Share Data | | | | | |
Net asset value, beginning of period | $ 84.14 | $ 99.95 | $ 108.59 | $ 81.31 | $ 100.82 |
Income from Investment Operations | | | | | |
Net investment income (loss) C | .96 | .74 | .96 | 1.10 | .67 |
Net realized and unrealized gain (loss) | 36.92 | (15.75) | (4.95) | 30.26 | (14.61) |
Total from investment operations | 37.88 | (15.01) | (3.99) | 31.36 | (13.94) |
Distributions from net investment income | (.94) | (.82) | (1.03) | (.80) | (.64) |
Distributions from net realized gain | - | - | (3.64) | (3.45) | (5.09) |
Total distributions | (.94) | (.82) | (4.67) | (4.25) | (5.73) |
Redemption fees added to paid in capital C | .01 | .02 | .02 | .17 | .16 |
Net asset value, end of period | $ 121.09 | $ 84.14 | $ 99.95 | $ 108.59 | $ 81.31 |
Total Return A,B | 45.17% | (15.06)% | (3.58)% | 39.19% | (14.53)% |
Ratios to Average Net Assets D | | | | | |
Expenses before expense reductions | 1.09% | 1.12% | 1.07% | 1.09% | 1.19% |
Expenses net of voluntary waivers, if any | 1.09% | 1.12% | 1.07% | 1.09% | 1.19% |
Expenses net of all reductions | 1.07% | 1.09% | 1.03% | 1.06% | 1.17% |
Net investment income (loss) | .92% | .79% | .93% | 1.07% | .66% |
Supplemental Data | | | | | |
Net assets, end of period (000 omitted) | $ 555,577 | $ 389,392 | $ 560,002 | $ 657,533 | $ 344,152 |
Portfolio turnover rate | 51% | 76% | 127% | 107% | 57% |
A Total returns would have been lower had certain expenses not been reduced during the periods shown. B Total returns do not include the effect of the former sales charges. C Calculated based on average shares outstanding during the period. D Expense ratios reflect operating expenses of the fund. Expenses before reductions do not reflect amounts reimbursed by the investment adviser or reductions from brokerage service arrangements or other expense offset arrangements and do not represent the amount paid by the fund during periods when reimbursements or reductions occur. Expenses net of any voluntary waivers reflect expenses after reimbursement by the investment adviser but prior to reductions from brokerage service arrangements or other expense offset arrangements. Expenses net of all reductions represent the net expenses paid by the fund. E For the year ended February 29. |
See accompanying notes which are an integral part of the financial statements.
Financial Services Sector
Home Finance Portfolio
Performance
Average annual total return reflects the change in the value of an investment, assuming reinvestment of the fund's dividend income and capital gains (the profits earned upon the sale of securities that have grown in value) and assuming a constant rate of performance each year. The $10,000 table and the fund's returns do not reflect the deduction of taxes that a shareholder would pay on fund distributions or the redemption of fund shares. During periods of reimbursement by Fidelity a fund's total returns will be greater than it would be had the reimbursement not occurred. How a fund did yesterday is no guarantee of how it will do tomorrow.
Average Annual Total Returns
Periods ended February 29, 2004 | Past 1
year | Past 5
years | Past 10
years |
Select Home Finance | 49.39% | 13.70% | 17.06% |
$10,000 Over 10 Years
Let's say hypothetically that $10,000 was invested in Fidelity Select Home Finance Portfolio on February 28, 1994. The chart shows how the value of your investment would have grown, and also shows how the S&P 500 Index did over the same period.
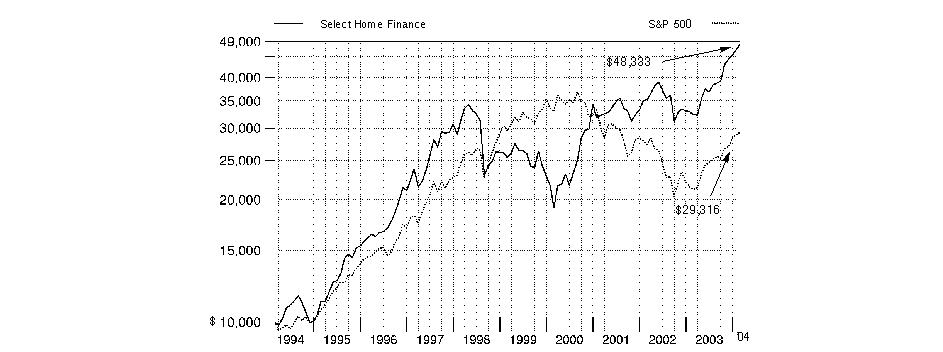
Annual Report
Home Finance Portfolio
Management's Discussion of Fund Performance
Comments from Jeffrey Feingold, Portfolio Manager of Fidelity® Select Home Finance Portfolio
From March 2003 through the end of February 2004, domestic stocks recovered dramatically from their prior three-year swoon, driven largely by a broad-based economic and corporate profit recovery. Most major equity benchmarks gained 35% or more during the 12-month period, led by the Russell 2000® Index - a measure of the overall small-cap universe - which advanced 64.41%. As investors grew more confident about the economy's vitality, small-cap stocks were bid up, particularly those with no current earnings. In comparison, the Wilshire 5000® Total Market Index, commonly used as a proxy for the entire U.S. stock market's performance, rose 42.47%. Every sector of the market posted a double-digit advance, with economically sensitive issues - especially technology stocks - leading the way. The tech-heavy NASDAQ Composite® Index returned 52.47% during the past year, despite a negative return in February as investors turned to the more value-oriented segments of the market. The broader Standard & Poor's 500SM Index climbed 38.52% during the year, slightly outperforming the 37.07% increase for the blue-chip Dow Jones Industrial AverageSM.
For the 12 months ending February 29, 2004, Fidelity Select Home Finance Portfolio returned 49.39%, topping both the Goldman Sachs® Financial Services Index, which had a total return of 46.45%, and the S&P 500®. The earnings growth rates of the home finance industry greatly exceeded Wall Street expectations during the period, propelled by heavy mortgage issuance and continued low interest rates that led to wide profit margins for mortgage providers. Performance leaders included New York Community Bancorp, which specializes in loans for multi-family real estate developments in New York and New Jersey, and Golden West Financial, a California-based thrift and a dominant player in the adjustable-rate market. Both stocks were rewarded for exceeding the market's expectations during the period. Sovereign Bancorp, a fast-growing bank in the Northeast, also added to returns, helped by continued improvement in fundamentals as well as by speculation it might be a takeover candidate. Detractors included Freddie Mac and Fannie Mae, two leading government-sponsored mortgage companies. Both stocks underperformed after Freddie Mac announced it had accounting problems that led to the restatement of earnings for the years 2000 through 2002. In addition, the two companies faced increased competition for mortgages from other investors, such as banks.
The views expressed in this statement reflect those of the portfolio manager only through the end of the period of the report as stated on the cover and do not necessarily represent the views of Fidelity or any other person in the Fidelity organization. Any such views are subject to change at any time based upon market or other conditions and Fidelity disclaims any responsibility to update such views. These views may not be relied on as investment advice and, because investment decisions for a Fidelity fund are based on numerous factors, may not be relied on as an indication of trading intent on behalf of any Fidelity fund.
Annual Report
Home Finance Portfolio
Investment Summary
Top Ten Stocks as of February 29, 2004 |
| % of fund's
net assets |
Golden West Financial Corp., Delaware | 10.4 |
Fannie Mae | 7.8 |
Sovereign Bancorp, Inc. | 5.8 |
Old Republic International Corp. | 5.3 |
New York Community Bancorp, Inc. | 5.2 |
Fidelity National Financial, Inc. | 5.1 |
Countrywide Financial Corp. | 5.1 |
Banknorth Group, Inc. | 4.4 |
MGIC Investment Corp. | 4.4 |
North Fork Bancorp, Inc., New York | 4.2 |
| 57.7 |
Top Industries as of February 29, 2004 |
% of fund's net assets |
| Thrifts & Mortgage Finance | 65.1% | |
| Commercial Banks | 18.4% | |
| Insurance | 10.4% | |
| Capital Markets | 4.3% | |
| Diversified Financial Services | 0.5% | |
| All Others * | 1.3% | |

* Includes short-term investments and net other assets. |
Annual Report
Home Finance Portfolio
Investments February 29, 2004
Showing Percentage of Net Assets
Common Stocks - 98.7% |
| Shares | | Value (Note 1) |
CAPITAL MARKETS - 4.3% |
Bank of New York Co., Inc. | 104,500 | | $ 3,448,500 |
J.P. Morgan Chase & Co. | 387,700 | | 15,903,454 |
TOTAL CAPITAL MARKETS | | 19,351,954 |
COMMERCIAL BANKS - 18.4% |
Banknorth Group, Inc. | 591,275 | | 19,707,196 |
Charter One Financial, Inc. | 333,470 | | 12,078,283 |
Dime Bancorp, Inc. warrants 12/31/49 (a) | 425,000 | | 85,000 |
IBERIABANK Corp. | 75,200 | | 4,677,440 |
North Fork Bancorp, Inc., New York | 449,100 | | 18,965,493 |
TCF Financial Corp. | 165,300 | | 8,592,294 |
UCBH Holdings, Inc. | 132,400 | | 5,163,600 |
Wells Fargo & Co. New | 233,000 | | 13,362,550 |
TOTAL COMMERCIAL BANKS | | 82,631,856 |
DIVERSIFIED FINANCIAL SERVICES - 0.5% |
Citigroup, Inc. | 41,000 | | 2,060,660 |
Imperial Credit Industries, Inc. warrants 1/31/08 (a) | 31,281 | | 0 |
TOTAL DIVERSIFIED FINANCIAL SERVICES | | 2,060,660 |
INSURANCE - 10.4% |
Fidelity National Financial, Inc. | 587,666 | | 22,983,617 |
Old Republic International Corp. | 1,002,400 | | 23,656,640 |
TOTAL INSURANCE | | 46,640,257 |
THRIFTS & MORTGAGE FINANCE - 65.1% |
Astoria Financial Corp. | 356,800 | | 14,393,312 |
Bank United Corp. Litigation Contingent Payment Rights Trust rights 12/31/04 (a) | 126,300 | | 20,208 |
Countrywide Financial Corp. | 247,940 | | 22,718,742 |
Doral Financial Corp. | 434,025 | | 14,808,933 |
Downey Financial Corp. | 36,500 | | 1,964,795 |
Fannie Mae | 466,700 | | 34,955,830 |
First Niagara Financial Group, Inc. | 297,661 | | 4,339,897 |
FirstFed Financial Corp., Delaware (a) | 170,100 | | 7,382,340 |
Golden West Financial Corp., Delaware | 406,500 | | 46,918,231 |
Greenpoint Financial Corp. | 394,300 | | 17,199,366 |
Hudson City Bancorp, Inc. | 306,500 | | 11,910,590 |
IndyMac Bancorp, Inc. | 30,800 | | 1,084,160 |
MGIC Investment Corp. | 296,600 | | 19,628,988 |
New York Community Bancorp, Inc. | 667,937 | | 23,457,947 |
Northwest Bancorp, Inc. | 186,400 | | 4,723,376 |
People's Bank, Connecticut | 158,000 | | 7,102,100 |
Radian Group, Inc. | 194,400 | | 8,495,280 |
Rainier Pacific Financial Group, Inc. | 195,573 | | 3,138,947 |
Seacoast Financial Services Corp. | 74,900 | | 2,575,811 |
Sovereign Bancorp, Inc. | 1,183,200 | | 26,207,880 |
Staten Island Bancorp, Inc. | 106,100 | | 2,580,352 |
|
| Shares | | Value (Note 1) |
W Holding Co., Inc. | 128,621 | | $ 2,577,565 |
Washington Federal, Inc. | 293,920 | | 7,630,163 |
Webster Financial Corp. | 132,800 | | 6,686,480 |
TOTAL THRIFTS & MORTGAGE FINANCE | | 292,501,293 |
TOTAL COMMON STOCKS (Cost $265,115,034) | 443,186,020 |
Money Market Funds - 1.1% |
| | | |
Fidelity Cash Central Fund, 1.08% (b)
(Cost $4,843,160) | 4,843,160 | | 4,843,160 |
TOTAL INVESTMENT PORTFOLIO - 99.8% (Cost $269,958,194) | | 448,029,180 |
NET OTHER ASSETS - 0.2% | | 1,030,559 |
NET ASSETS - 100% | $ 449,059,739 |
Legend |
(a) Non-income producing |
(b) Affiliated fund that is available only to investment companies and other accounts managed by Fidelity Investments. The rate quoted is the annualized seven-day yield of the fund at period end. A complete listing of the fund's holdings as of its most recent fiscal year end is available upon request. |
Other Information |
Purchases and sales of securities, other than short-term securities, aggregated $143,557,129 and $173,438,758, respectively. |
The fund placed a portion of its portfolio transactions with brokerage firms which are affiliates of the investment adviser. The commissions paid to these affiliated firms were $9,254 for the period. |
Income Tax Information |
The fund hereby designates approximately $11,824,000 as a capital gain dividend for the purpose of the dividend paid deduction. |
See accompanying notes which are an integral part of the financial statements.
Annual Report
Home Finance Portfolio
Financial Statements
Statement of Assets and Liabilities
| February 29, 2004 |
| | |
Assets | | |
Investment in securities, at value (cost $269,958,194) - See accompanying schedule | | $ 448,029,180 |
Receivable for investments sold | | 733,296 |
Receivable for fund shares sold | | 812,542 |
Dividends receivable | | 543,507 |
Interest receivable | | 5,492 |
Prepaid expenses | | 1,848 |
Other receivables | | 12,897 |
Total assets | | 450,138,762 |
| | |
Liabilities | | |
Payable for investments purchased | $ 303,366 | |
Payable for fund shares redeemed | 405,064 | |
Accrued management fee | 210,846 | |
Transfer agent fee payable | 112,354 | |
Other affiliated payables | 19,770 | |
Other payables and accrued expenses | 27,623 | |
Total liabilities | | 1,079,023 |
| | |
Net Assets | | $ 449,059,739 |
Net Assets consist of: | | |
Paid in capital | | $ 259,068,358 |
Undistributed net investment income | | 1,274,249 |
Accumulated undistributed net realized gain (loss) on investments and foreign currency transactions | | 10,646,146 |
Net unrealized appreciation (depreciation) on investments | | 178,070,986 |
Net Assets, for 6,530,436 shares outstanding | | $ 449,059,739 |
Net Asset Value, offering price and redemption price per share ($449,059,739 ÷ 6,530,436 shares) | | $ 68.76 |
Statement of Operations
| Year ended February 29, 2004 |
| | |
Investment Income | | |
Dividends | | $ 8,096,039 |
Interest | | 51,804 |
Security lending | | 7,601 |
Total income | | 8,155,444 |
| | |
Expenses | | |
Management fee | $ 2,204,266 | |
Transfer agent fees | 1,674,059 | |
Accounting and security lending fees | 237,789 | |
Non-interested trustees' compensation | 2,102 | |
Custodian fees and expenses | 13,044 | |
Registration fees | 29,674 | |
Audit | 45,382 | |
Legal | 1,976 | |
Miscellaneous | 10,279 | |
Total expenses before reductions | 4,218,571 | |
Expense reductions | (38,187) | 4,180,384 |
Net investment income (loss) | | 3,975,060 |
Realized and Unrealized Gain (Loss) Net realized gain (loss) on: | | |
Investment securities | 27,601,361 | |
Foreign currency transactions | 1,800 | |
Total net realized gain (loss) | | 27,603,161 |
Change in net unrealized appreciation (depreciation) on: Investment securities | 119,416,875 | |
Assets and liabilities in foreign currencies | (2,409) | |
Total change in net unrealized appreciation (depreciation) | | 119,414,466 |
Net gain (loss) | | 147,017,627 |
Net increase (decrease) in net assets resulting from operations | | $ 150,992,687 |
Other Information | | |
Sales charges paid to FDC | | $ 91,742 |
Deferred sales charges withheld by FDC | | $ 2,192 |
Exchange fees withheld by
FSC | | $ 8,303 |
See accompanying notes which are an integral part of the financial statements.
Annual Report
Home Finance Portfolio
Financial Statements - continued
Statement of Changes in Net Assets
| Year ended
February 29,
2004 | Year ended
February 28,
2003 |
Increase (Decrease) in Net Assets | | |
Operations | | |
Net investment income (loss) | $ 3,975,060 | $ 3,168,804 |
Net realized gain (loss) | 27,603,161 | 2,330,427 |
Change in net unrealized appreciation (depreciation) | 119,414,466 | (54,338,743) |
Net increase (decrease) in net assets resulting from operations | 150,992,687 | (48,839,512) |
Distributions to shareholders from net investment income | (2,656,954) | (2,208,881) |
Distributions to shareholders from net realized gain | (11,172,622) | (5,002,985) |
Total distributions | (13,829,576) | (7,211,866) |
Share transactions
Net proceeds from sales of shares | 112,685,283 | 281,309,467 |
Reinvestment of distributions | 13,255,067 | 6,880,481 |
Cost of shares redeemed | (141,481,607) | (313,781,669) |
Net increase (decrease) in net assets resulting from share transactions | (15,541,257) | (25,591,721) |
Redemption fees | 43,765 | 258,135 |
Total increase (decrease) in net assets | 121,665,619 | (81,384,964) |
| | |
Net Assets | | |
Beginning of period | 327,394,120 | 408,779,084 |
End of period (including undistributed net investment income of $1,274,249 and undistributed net investment income of $1,688,459, respectively) | $ 449,059,739 | $ 327,394,120 |
Other Information Shares | | |
Sold | 1,876,424 | 5,150,509 |
Issued in reinvestment of distributions | 212,334 | 137,922 |
Redeemed | (2,436,304) | (6,129,829) |
Net increase (decrease) | (347,546) | (841,398) |
Financial Highlights
Years ended February 28, | 2004 E | 2003 | 2002 | 2001 | 2000 E |
Selected Per-Share Data | | | | | |
Net asset value, beginning of period | $ 47.60 | $ 52.95 | $ 51.82 | $ 30.92 | $ 42.09 |
Income from Investment Operations | | | | | |
Net investment income (loss) C | .61 | .39 | .41 | .37 | .30 |
Net realized and unrealized gain (loss) | 22.67 | (4.77) | 4.07 | 20.73 | (10.64) |
Total from investment operations | 23.28 | (4.38) | 4.48 | 21.10 | (10.34) |
Distributions from net investment income | (.41) | (.30) | (.17) | (.26) | (.19) |
Distributions from net realized gain | (1.72) | (.70) | (3.23) | (.07) | (.69) |
Total distributions | (2.13) | (1.00) | (3.40) | (.33) | (.88) |
Redemption fees added to paid in capital C | .01 | .03 | .05 | .13 | .05 |
Net asset value, end of period | $ 68.76 | $ 47.60 | $ 52.95 | $ 51.82 | $ 30.92 |
Total Return A, B | 49.39% | (8.30)% | 9.40% | 68.78% | (24.88)% |
Ratios to Average Net Assets D | | | | | |
Expenses before expense reductions | 1.11% | 1.14% | 1.15% | 1.30% | 1.39% |
Expenses net of voluntary waivers, if any | 1.11% | 1.14% | 1.15% | 1.30% | 1.39% |
Expenses net of all reductions | 1.10% | 1.11% | 1.12% | 1.27% | 1.37% |
Net investment income (loss) | 1.05% | .75% | .82% | .87% | .72% |
Supplemental Data | | | | | |
Net assets, end of period (000 omitted) | $ 449,060 | $ 327,394 | $ 408,779 | $ 417,589 | $ 213,058 |
Portfolio turnover rate | 38% | 78% | 72% | 115% | 91% |
A Total returns would have been lower had certain expenses not been reduced during the periods shown. B Total returns do not include the effect of the former sales charges. C Calculated based on average shares outstanding during the period. D Expense ratios reflect operating expenses of the fund. Expenses before reductions do not reflect amounts reimbursed by the investment adviser or reductions from brokerage service arrangements or other expense offset arrangements and do not represent the amount paid by the fund during periods when reimbursements or reductions occur. Expenses net of any voluntary waivers reflect expenses after reimbursement by the investment adviser but prior to reductions from brokerage service arrangements or other expense offset arrangements. Expenses net of all reductions represent the net expenses paid by the fund. E For the year ended February 29. |
See accompanying notes which are an integral part of the financial statements.
Financial Services Sector
Insurance Portfolio
Performance
Average annual total return reflects the change in the value of an investment, assuming reinvestment of the fund's dividend income and capital gains (the profits earned upon the sale of securities that have grown in value) and assuming a constant rate of performance each year. The $10,000 table and the fund's returns do not reflect the deduction of taxes that a shareholder would pay on fund distributions or the redemption of fund shares. During periods of reimbursement by Fidelity a fund's total returns will be greater than it would be had the reimbursement not occurred. How a fund did yesterday is no guarantee of how it will do tomorrow.
Average Annual Total Returns
Periods ended February 29, 2004 | Past 1
year | Past 5
years | Past 10
years |
Select Insurance | 49.04% | 12.77% | 17.96% |
$10,000 Over 10 Years
Let's say hypothetically that $10,000 was invested in Fidelity Select Insurance Portfolio on February 28, 1994. The chart shows how the value of your investment would have grown, and also shows how the S&P 500 Index did over the same period.
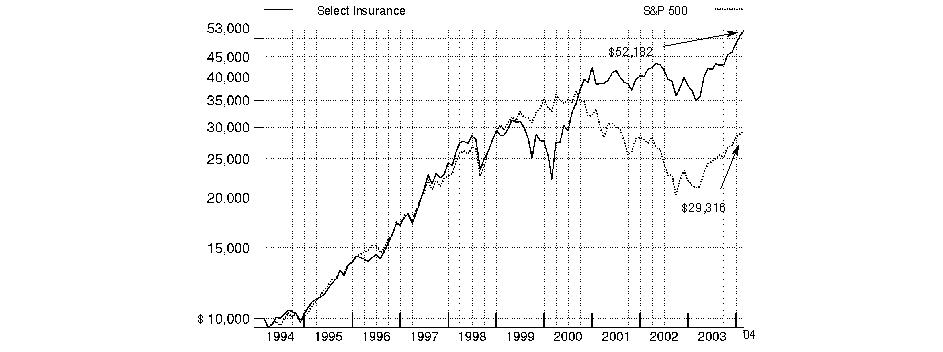
Annual Report
Insurance Portfolio
Management's Discussion of Fund Performance
Comments from Ian Gutterman, Portfolio Manager of Fidelity® Select Insurance Portfolio
From March 2003 through the end of February 2004, domestic stocks recovered dramatically from their prior three-year swoon, driven largely by a broad-based economic and corporate profit recovery. Most major equity benchmarks gained 35% or more during the 12-month period, led by the Russell 2000® Index - a measure of the overall small-cap universe - which advanced 64.41%. As investors grew more confident about the economy's vitality, small-cap stocks were bid up, particularly those with no current earnings. In comparison, the Wilshire 5000® Total Market Index, commonly used as a proxy for the entire U.S. stock market's performance, rose 42.47%. Every sector of the market posted a double-digit advance, with economically sensitive issues - especially technology stocks - leading the way. The tech-heavy NASDAQ Composite® Index returned 52.47% during the past year, despite a negative return in February as investors turned to the more value-oriented segments of the market. The broader Standard & Poor's 500SM Index climbed 38.52% during the year, slightly outperforming the 37.07% increase for the blue-chip Dow Jones Industrial AverageSM.
Fidelity Select Insurance Portfolio was up 49.04% during the 12-month period ending February 29, 2004, outperforming the 46.45% return for the Goldman Sachs® Financial Services Index as well as the increase in the S&P 500®. Insurance stocks were among the better-performing groups in the financial services sector, so the fund's concentration in this area helped produce a gain that compared favorably to the sector benchmark. Good security selection also made a contribution to the fund's performance. Life insurance stocks benefited significantly from the rising equity market. Holdings in companies with large life insurance businesses, such as Hartford Financial Services, Lincoln National and Nationwide Financial, all handily outperformed the Goldman Sachs index. Strong pricing power - meaning the ability to raise prices on insurance policies - generally helped property and casualty (P&C) insurance companies produce strong earnings growth. Among the fund's top-performing P&C holdings were ACE Ltd. and Everest Re Group. The portfolio's biggest disappointments were positions that had positive returns but failed to keep up with the average returns of the overall industry. Among these detractors were P&C company XL Capital Ltd., Travelers Property Casualty and PartnerRe.
The views expressed in this statement reflect those of the portfolio manager only through the end of the period of the report as stated on the cover and do not necessarily represent the views of Fidelity or any other person in the Fidelity organization. Any such views are subject to change at any time based upon market or other conditions and Fidelity disclaims any responsibility to update such views. These views may not be relied on as investment advice and, because investment decisions for a Fidelity fund are based on numerous factors, may not be relied on as an indication of trading intent on behalf of any Fidelity fund.
Annual Report
Insurance Portfolio
Investment Summary
Top Ten Stocks as of February 29, 2004 |
| % of fund's
net assets |
American International Group, Inc. | 6.3 |
ACE Ltd. | 6.1 |
Everest Re Group Ltd. | 5.1 |
Hartford Financial Services Group, Inc. | 4.7 |
Allstate Corp. | 4.4 |
The Chubb Corp. | 4.0 |
AFLAC, Inc. | 3.7 |
MetLife, Inc. | 3.6 |
AMBAC Financial Group, Inc. | 3.5 |
Berkshire Hathaway, Inc. | 3.2 |
| 44.6 |
Top Industries as of February 29, 2004 |
% of fund's net assets |
| Insurance | 83.6% | |
| Health Care Providers & Services | 2.5% | |
| Thrifts & Mortgage Finance | 1.8% | |
| Diversified Financial Services | 1.8% | |
| Capital Markets | 0.2% | |
| All Others* | 10.1% | |

* Includes short-term investments and net other assets. |
Annual Report
Annual Report
Insurance Portfolio
Investments February 29, 2004
Showing Percentage of Net Assets
Common Stocks - 90.1% |
| Shares | | Value (Note 1) |
CAPITAL MARKETS - 0.2% |
National Financial Partners Corp. | 10,000 | | $ 321,800 |
DIVERSIFIED FINANCIAL SERVICES - 1.8% |
Leucadia National Corp. | 1,100 | | 57,200 |
Principal Financial Group, Inc. | 73,200 | | 2,649,840 |
TOTAL DIVERSIFIED FINANCIAL SERVICES | | 2,707,040 |
HEALTH CARE PROVIDERS & SERVICES - 2.5% |
Anthem, Inc. (a) | 44,400 | | 3,816,180 |
INDUSTRIAL CONGLOMERATES - 0.2% |
Alleghany Corp. | 1,189 | | 279,522 |
INSURANCE - 83.6% |
ACE Ltd. | 207,100 | | 9,311,216 |
AFLAC, Inc. | 136,600 | | 5,547,326 |
Allmerica Financial Corp. (a) | 96,573 | | 3,561,612 |
Allstate Corp. | 147,000 | | 6,707,610 |
AMBAC Financial Group, Inc. | 67,150 | | 5,251,130 |
American Financial Group, Inc., Ohio | 2,000 | | 60,160 |
American International Group, Inc. | 129,100 | | 9,553,400 |
Aon Corp. | 26,800 | | 702,964 |
Arch Capital Group Ltd. (a) | 13,300 | | 564,053 |
Arthur J. Gallagher & Co. | 9,200 | | 309,580 |
Aspen Insurance Holdings Ltd. | 15,000 | | 391,500 |
Axis Capital Holdings Ltd. | 50,000 | | 1,525,500 |
Berkshire Hathaway, Inc.: | | | |
Class A (a) | 50 | | 4,725,000 |
Class B (a) | 48 | | 150,384 |
Brown & Brown, Inc. | 14,100 | | 520,290 |
Cincinnati Financial Corp. | 32,700 | | 1,472,808 |
CNA Financial Corp. (a) | 2,200 | | 60,500 |
Endurance Specialty Holdings Ltd. | 55,000 | | 1,825,450 |
Erie Indemnity Co. Class A | 400 | | 18,896 |
Everest Re Group Ltd. | 88,700 | | 7,751,493 |
Fidelity National Financial, Inc. | 38,384 | | 1,501,198 |
Hartford Financial Services Group, Inc. | 108,500 | | 7,106,750 |
HCC Insurance Holdings, Inc. | 23,000 | | 744,970 |
Hilb, Rogal & Hamilton Co. | 1,000 | | 36,800 |
Infinity Property & Casualty Corp. | 1,000 | | 32,600 |
IPC Holdings Ltd. | 15,500 | | 603,725 |
Jefferson-Pilot Corp. | 5,650 | | 301,936 |
John Hancock Financial Services, Inc. | 31,900 | | 1,344,266 |
Lincoln National Corp. | 26,500 | | 1,230,395 |
Markel Corp. (a) | 1,100 | | 299,376 |
Marsh & McLennan Companies, Inc. | 80,200 | | 3,848,798 |
MBIA, Inc. | 66,800 | | 4,394,772 |
Mercury General Corp. | 800 | | 40,880 |
MetLife, Inc. | 154,000 | | 5,413,100 |
Montpelier Re Holdings Ltd. | 74,500 | | 2,651,455 |
Nationwide Financial Services, Inc. Class A | 300 | | 11,412 |
Odyssey Re Holdings Corp. | 10,000 | | 266,500 |
|
| Shares | | Value (Note 1) |
Ohio Casualty Corp. (a) | 1,800 | | $ 34,596 |
Old Republic International Corp. | 31,600 | | 745,760 |
PartnerRe Ltd. | 29,400 | | 1,624,056 |
Philadelphia Consolidated Holding Corp. (a) | 4,500 | | 268,110 |
Phoenix Companies, Inc. | 25,000 | | 357,250 |
Platinum Underwriters Holdings Ltd. | 5,200 | | 169,572 |
Progressive Corp. | 900 | | 74,394 |
Protective Life Corp. | 20,600 | | 783,624 |
Prudential Financial, Inc. | 68,200 | | 3,163,798 |
Reinsurance Group of America, Inc. | 5,600 | | 226,520 |
RenaissanceRe Holdings Ltd. | 59,400 | | 3,145,230 |
RLI Corp. | 1,000 | | 40,000 |
SAFECO Corp. | 30,300 | | 1,363,500 |
Scottish Annuity & Life Holdings Ltd. | 32,000 | | 754,560 |
St. Paul Companies, Inc. | 17,100 | | 730,854 |
StanCorp Financial Group, Inc. | 8,600 | | 567,170 |
The Chubb Corp. | 85,029 | | 6,035,358 |
The MONY Group, Inc. (a) | 25,000 | | 787,500 |
Torchmark Corp. | 14,400 | | 750,528 |
Transatlantic Holdings, Inc. | 2,850 | | 245,300 |
Travelers Property Casualty Corp.: | | | |
Class A | 149,000 | | 2,705,840 |
Class B | 101,800 | | 1,856,832 |
UICI (a) | 21,800 | | 297,352 |
UnumProvident Corp. | 90,235 | | 1,337,283 |
USI Holdings Corp. (a) | 10,000 | | 135,600 |
W.R. Berkley Corp. | 53,775 | | 2,239,729 |
Willis Group Holdings Ltd. | 88,600 | | 3,397,810 |
XL Capital Ltd. Class A | 41,500 | | 3,181,390 |
Zenith National Insurance Corp. | 500 | | 20,030 |
TOTAL INSURANCE | | 126,879,351 |
THRIFTS & MORTGAGE FINANCE - 1.8% |
MGIC Investment Corp. | 16,100 | | 1,065,498 |
Radian Group, Inc. | 18,400 | | 804,080 |
The PMI Group, Inc. | 23,400 | | 926,640 |
TOTAL THRIFTS & MORTGAGE FINANCE | | 2,796,218 |
TOTAL COMMON STOCKS (Cost $100,346,784) | 136,800,111 |
Money Market Funds - 9.4% |
| Shares | | Value (Note 1) |
Fidelity Cash Central Fund, 1.08% (b)
(Cost $14,343,956) | 14,343,956 | | $ 14,343,956 |
TOTAL INVESTMENT PORTFOLIO - 99.5% (Cost $114,690,740) | | 151,144,067 |
NET OTHER ASSETS - 0.5% | 731,239 |
NET ASSETS - 100% | $ 151,875,306 |
Legend |
(a) Non-income producing |
(b) Affiliated fund that is available only to investment companies and other accounts managed by Fidelity Investments. The rate quoted is the annualized seven-day yield of the fund at period end. A complete listing of the fund's holdings as of its most recent fiscal year end is available upon request. |
Other Information |
Purchases and sales of securities, other than short-term securities, aggregated $69,591,732 and $59,470,665, respectively. |
The fund placed a portion of its portfolio transactions with brokerage firms which are affiliates of the investment adviser. The commissions paid to these affiliated firms were $5,835 for the period. |
Distribution of investments by country of issue, as a percentage of total net assets, is as follows: |
United States of America | 77.8% |
Bermuda | 21.7% |
Others (individually less than 1%) | 0.5% |
| 100.0% |
Income Tax Information |
The fund hereby designates approximately $2,707,000 as a capital gain dividend for the purpose of the dividend paid deduction. |
See accompanying notes which are an integral part of the financial statements.
Financial Services Sector
Insurance Portfolio
Financial Statements
Statement of Assets and Liabilities
| February 29, 2004 |
| | |
Assets | | |
Investment in securities, at value (cost $114,690,740) - See accompanying schedule | | $ 151,144,067 |
Receivable for fund shares sold | | 1,212,944 |
Dividends receivable | | 117,047 |
Interest receivable | | 11,898 |
Prepaid expenses | | 498 |
Other affiliated receivables | | 371 |
Other receivables | | 4,738 |
Total assets | | 152,491,563 |
| | |
Liabilities | | |
Payable for investments purchased | $ 68,139 | |
Payable for fund shares redeemed | 414,267 | |
Accrued management fee | 66,531 | |
Transfer agent fee payable | 35,106 | |
Other affiliated payables | 5,856 | |
Other payables and accrued expenses | 26,358 | |
Total liabilities | | 616,257 |
| | |
Net Assets | | $ 151,875,306 |
Net Assets consist of: | | |
Paid in capital | | $ 114,125,987 |
Undistributed net investment income | | 20,216 |
Accumulated undistributed net realized gain (loss) on investments and foreign currency transactions | | 1,275,776 |
Net unrealized appreciation (depreciation) on investments | | 36,453,327 |
Net Assets, for 2,545,297 shares outstanding | | $ 151,875,306 |
Net Asset Value, offering price and redemption price per share ($151,875,306 ÷ 2,545,297 shares) | | $ 59.67 |
Statement of Operations
| Year ended February 29, 2004 |
| | |
Investment Income | | |
Dividends | | $ 1,407,241 |
Interest | | 64,795 |
Security lending | | 3,791 |
Total income | | 1,475,827 |
| | |
Expenses | | |
Management fee | $ 614,719 | |
Transfer agent fees | 556,996 | |
Accounting and security lending fees | 66,875 | |
Non-interested trustees' compensation | 531 | |
Custodian fees and expenses | 8,425 | |
Registration fees | 20,244 | |
Audit | 44,176 | |
Legal | 499 | |
Miscellaneous | 2,086 | |
Total expenses before reductions | 1,314,551 | |
Expense reductions | (11,133) | 1,303,418 |
Net investment income (loss) | | 172,409 |
Realized and Unrealized Gain (Loss) Net realized gain (loss) on: | | |
Investment securities | 5,957,647 | |
Foreign currency transactions | (46) | |
Total net realized gain (loss) | | 5,957,601 |
Change in net unrealized appreciation (depreciation) on investment securities | | 35,139,034 |
Net gain (loss) | | 41,096,635 |
Net increase (decrease) in net assets resulting from operations | | $ 41,269,044 |
Other Information | | |
Sales charges paid to FDC | | $ 75,440 |
Deferred sales charges withheld by FDC | | $ 764 |
Exchange fees withheld by
FSC | | $ 2,618 |
See accompanying notes which are an integral part of the financial statements.
Annual Report
Insurance Portfolio
Financial Statements - continued
Statement of Changes in Net Assets
| Year ended
February 29,
2004 | Year ended
February 28,
2003 |
Increase (Decrease) in Net Assets | | |
Operations | | |
Net investment income (loss) | $ 172,409 | $ 59,045 |
Net realized gain (loss) | 5,957,601 | 714,099 |
Change in net unrealized appreciation (depreciation) | 35,139,034 | (23,736,041) |
Net increase (decrease) in net assets resulting from operations | 41,269,044 | (22,962,897) |
Distributions to shareholders from net investment income | (152,145) | (248,409) |
Distributions to shareholders from net realized gain | (2,453,342) | (3,934,303) |
Total distributions | (2,605,487) | (4,182,712) |
Share transactions
Net proceeds from sales of shares | 88,536,944 | 95,872,748 |
Reinvestment of distributions | 2,513,948 | 4,033,379 |
Cost of shares redeemed | (66,028,898) | (127,910,409) |
Net increase (decrease) in net assets resulting from share transactions | 25,021,994 | (28,004,282) |
Redemption fees | 39,257 | 87,865 |
Total increase (decrease) in net assets | 63,724,808 | (55,062,026) |
Net Assets | | |
Beginning of period | 88,150,498 | 143,212,524 |
End of period (including undistributed net investment income of $20,216 and undistributed net investment income of $49,282, respectively) | $ 151,875,306 | $ 88,150,498 |
Other Information Shares | | |
Sold | 1,674,481 | 1,983,851 |
Issued in reinvestment of distributions | 46,920 | 82,208 |
Redeemed | (1,322,766) | (2,738,825) |
Net increase (decrease) | 398,635 | (672,766) |
Financial Highlights
Years ended February 28, | 2004E | 2003 | 2002 | 2001 | 2000E |
Selected Per-Share Data | | | | | |
Net asset value, beginning of period | $ 41.06 | $ 50.79 | $ 47.12 | $ 27.64 | $ 42.14 |
Income from Investment Operations | | | | | |
Net investment income (loss) C | .08 | .02 | .13 | .28 | (.05) |
Net realized and unrealized gain (loss) | 19.88 | (8.14) | 3.83 | 19.76 | (7.92) |
Total from investment operations | 19.96 | (8.12) | 3.96 | 20.04 | (7.97) |
Distributions from net investment income | (.08) | (.09) | (.03) | (.12) | - |
Distributions from net realized gain | (1.29) | (1.55) | (.30) | (.65) | (6.60) |
Total distributions | (1.37) | (1.64) | (.33) | (.77) | (6.60) |
Redemption fees added to paid in capitalC | .02 | .03 | .04 | .21 | .07 |
Net asset value, end of period | $ 59.67 | $ 41.06 | $ 50.79 | $ 47.12 | $ 27.64 |
Total ReturnA,B | 49.04% | (16.41)% | 8.56% | 73.17% | (22.12)% |
Ratios to Average Net AssetsD | | | | | |
Expenses before expense reductions | 1.24% | 1.26% | 1.20% | 1.20% | 1.39% |
Expenses net of voluntary waivers, if any | 1.24% | 1.26% | 1.20% | 1.20% | 1.39% |
Expenses net of all reductions | 1.23% | 1.24% | 1.17% | 1.16% | 1.36% |
Net investment income (loss) | .16% | .05% | .28% | .66% | (.12)% |
Supplemental Data | | | | | |
Net assets, end of period (000 omitted) | $ 151,875 | $ 88,150 | $ 143,213 | $ 142,149 | $ 29,521 |
Portfolio turnover rate | 59% | 95% | 104% | 175% | 107% |
ATotal returns would have been lower had certain expenses not been reduced during the periods shown. BTotal returns do not include the effect of the former sales charges. CCalculated based on average shares outstanding during the period. DExpense ratios reflect operating expenses of the fund. Expenses before reductions do not reflect amounts reimbursed by the investment adviser or reductions from brokerage service arrangements or other expense offset arrangements and do not represent the amount paid by the fund during periods when reimbursements or reductions occur. Expenses net of any voluntary waivers reflect expenses after reimbursement by the investment adviser but prior to reductions from brokerage service arrangements or other expense offset arrangements. Expenses net of all reductions represent the net expenses paid by the fund. EFor the year ended February 29.
See accompanying notes which are an integral part of the financial statements.
Financial Services Sector
Biotechnology Portfolio
Performance
Average annual total return reflects the change in the value of an investment, assuming reinvestment of the fund's dividend income and capital gains (the profits earned upon the sale of securities that have grown in value) and assuming a constant rate of performance each year. The $10,000 table and the fund's returns do not reflect the deduction of taxes that a shareholder would pay on fund distributions or the redemption of fund shares. During periods of reimbursement by Fidelity a fund's total returns will be greater than it would be had the reimbursement not occurred. How a fund did yesterday is no guarantee of how it will do tomorrow.
Average Annual Total Returns
Periods ended February 29, 2004 | Past 1
year | Past 5
years | Past 10
years |
Select Biotechnology | 44.17% | 7.69% | 11.64% |
$10,000 Over 10 Years
Let's say hypothetically that $10,000 was invested in Fidelity Select Biotechnology Portfolio on February 28, 1994. The chart shows how the value of your investment would have grown, and also shows how the S&P 500 Index did over the same period.
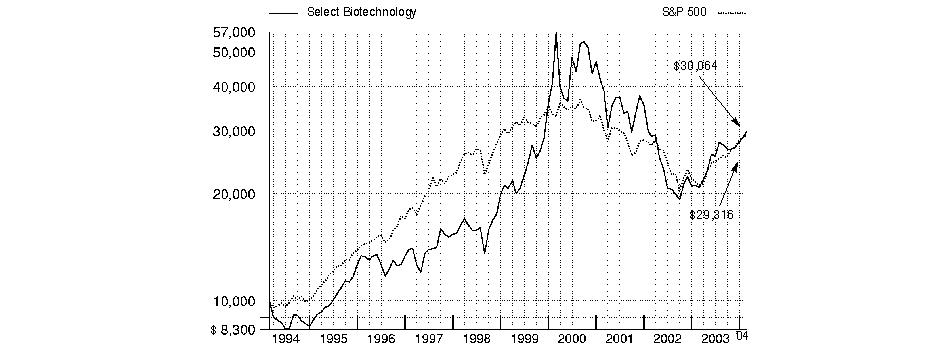
Annual Report
Biotechnology Portfolio
Management's Discussion of Fund Performance
Comments from Andraz Razen, Portfolio Manager of Fidelity® Select Biotechnology Portfolio
From March 2003 through the end of February 2004, domestic stocks recovered dramatically from their prior three-year swoon, driven largely by a broad-based economic and corporate profit recovery. Most major equity benchmarks gained 35% or more during the 12-month period, led by the Russell 2000® Index - a measure of the overall small-cap universe - which advanced 64.41%. As investors grew more confident about the economy's vitality, small-cap stocks were bid up, particularly those with no current earnings. In comparison, the Wilshire 5000® Total Market Index, commonly used as a proxy for the entire U.S. stock market's performance, rose 42.47%. Every sector of the market posted a double-digit advance, with economically sensitive issues - especially technology stocks - leading the way. The tech-heavy NASDAQ Composite® Index returned 52.47% during the past year, despite a negative return in February as investors turned to the more value-oriented segments of the market. The broader Standard & Poor's 500SM Index climbed 38.52% during the year, slightly outperforming the 37.07% increase for the blue-chip Dow Jones Industrial AverageSM.
Fidelity Select Biotechnology Portfolio benefited not only from the rally in the U.S. stock market, but also from a number of positive developments for several leading companies within the industry that drove strong returns during the first half of the period and led to its solid overall return. The fund gained 44.17% for the 12-month period ending February 29, 2004, outperforming its benchmark, the Goldman Sachs® Health Care Index, which returned 30.76%, as well as the Standard & Poor's 500 Index, which returned 38.52%. The fund's performance was driven by the strong gains of several top holdings. Genentech had successful clinical trial data on its cancer drug, Avastin, while Gilead Sciences had an increase in sales of its HIV drug, Viread, and received FDA approval in July to market another HIV drug, Emtriva. Genzyme saw increased profits from Cerezyme, a treatment for Gaucher disease, and Renegal, a kidney dialysis treatment. MedImmune detracted from performance due to disappointing financial results, while Amgen underperformed because investors were concerned about the company's future prospects for growth.
The views expressed in this statement reflect those of the portfolio manager only through the end of the period of the report as stated on the cover and do not necessarily represent the views of Fidelity or any other person in the Fidelity organization. Any such views are subject to change at any time based upon market or other conditions and Fidelity disclaims any responsibility to update such views. These views may not be relied on as investment advice and, because investment decisions for a Fidelity fund are based on numerous factors, may not be relied on as an indication of trading intent on behalf of any Fidelity fund.
Annual Report
Biotechnology Portfolio
Investment Summary
Top Ten Stocks as of February 29, 2004 |
| % of fund's
net assets |
Genentech, Inc. | 14.5 |
Biogen Idec, Inc. | 8.0 |
Gilead Sciences, Inc. | 7.6 |
Genzyme Corp. - General Division | 7.0 |
Cephalon, Inc. | 6.0 |
Millennium Pharmaceuticals, Inc. | 5.9 |
Celgene Corp. | 4.9 |
MedImmune, Inc. | 4.4 |
Amgen, Inc. | 4.0 |
Invitrogen Corp. | 3.8 |
| 66.1 |
Top Industries as of February 29, 2004 |
% of fund's net assets |
| Biotechnology | 92.5% | |
 | Pharmaceuticals | 6.8% | |
 | Health Care Equipment & Supplies | 0.4% | |
| Health Care Providers & Services | 0.1% | |
| All Others* | 0.2% | |

* Includes short-term investments and net other assets. |
Annual Report
Biotechnology Portfolio
Investments February 29, 2004
Showing Percentage of Net Assets
Common Stocks - 99.1% |
| Shares | | Value (Note 1) |
BIOTECHNOLOGY - 91.8% |
Abgenix, Inc. (a) | 899,300 | | $ 13,255,682 |
Actelion Ltd. (Reg.) (a) | 553,574 | | 64,909,643 |
Affymetrix, Inc. (a) | 1,319,500 | | 44,849,805 |
Alkermes, Inc. (a) | 2,234,057 | | 31,835,312 |
Amgen, Inc. (a) | 1,233,400 | | 78,357,902 |
Amylin Pharmaceuticals, Inc. (a) | 238,100 | | 5,457,252 |
Biogen Idec, Inc. (a) | 2,799,742 | | 155,245,694 |
BioMarin Pharmaceutical, Inc. (a) | 1,925,800 | | 14,732,370 |
Celgene Corp. (a) | 2,322,915 | | 95,216,286 |
Cell Genesys, Inc. (a) | 800 | | 11,296 |
Celltech Group PLC (a) | 258,300 | | 1,953,463 |
Cephalon, Inc. (a) | 1,969,340 | | 116,840,942 |
Chiron Corp. (a) | 555,000 | | 27,145,050 |
Dendreon Corp. (a) | 987,500 | | 13,588,000 |
Enzon Pharmaceuticals, Inc. (a) | 614,300 | | 10,492,244 |
Genentech, Inc. (a) | 2,610,000 | | 281,592,901 |
Genzyme Corp. - General Division (a) | 2,692,300 | | 136,714,994 |
Gilead Sciences, Inc. (a) | 2,715,100 | | 147,185,571 |
Harvard Bioscience, Inc. (a) | 11,600 | | 99,876 |
Human Genome Sciences, Inc. (a) | 366,500 | | 4,672,875 |
ICOS Corp. (a) | 733,600 | | 28,082,208 |
ImClone Systems, Inc. (a) | 663,400 | | 27,849,532 |
ImmunoGen, Inc. (a) | 846,300 | | 5,873,322 |
Immunomedics, Inc. (a) | 782,200 | | 3,316,528 |
Invitrogen Corp. (a) | 1,011,354 | | 74,536,790 |
Ligand Pharmaceuticals, Inc. Class B (a) | 1,533,400 | | 23,599,026 |
Medarex, Inc. (a) | 771,000 | | 6,900,450 |
MedImmune, Inc. (a) | 3,350,120 | | 86,064,583 |
Millennium Pharmaceuticals, Inc. (a) | 6,489,362 | | 115,575,537 |
Myogen, Inc. | 187,000 | | 2,900,744 |
Neurocrine Biosciences, Inc. (a) | 688,200 | | 38,263,920 |
NPS Pharmaceuticals, Inc. (a) | 391,300 | | 11,727,261 |
Pharmion Corp. | 213,796 | | 4,833,928 |
Protein Design Labs, Inc. (a) | 1,447,030 | | 34,728,720 |
Regeneron Pharmaceuticals, Inc. (a) | 432,200 | | 6,145,884 |
Rigel Pharmaceuticals, Inc. (a) | 48,705 | | 948,773 |
Seattle Genetics, Inc. (a) | 792,800 | | 7,809,080 |
Serologicals Corp. (a) | 885,400 | | 16,503,856 |
Tanox, Inc. (a) | 334,600 | | 5,527,592 |
Techne Corp. (a) | 600,100 | | 24,298,049 |
Telik, Inc. (a) | 277,200 | | 6,519,744 |
Transkaryotic Therapies, Inc. (a) | 145,300 | | 1,753,771 |
Vicuron Pharmaceuticals, Inc. (a) | 48,700 | | 1,143,476 |
XOMA Ltd. (a) | 1,542,100 | | 9,252,600 |
TOTAL BIOTECHNOLOGY | | 1,788,312,532 |
|
| Shares | | Value (Note 1) |
HEALTH CARE EQUIPMENT & SUPPLIES - 0.4% |
Epix Medical, Inc. (a) | 114,400 | | $ 2,410,408 |
Fisher Scientific International, Inc. (a) | 100,400 | | 5,346,300 |
TOTAL HEALTH CARE EQUIPMENT & SUPPLIES | | 7,756,708 |
HEALTH CARE PROVIDERS & SERVICES - 0.1% |
U.S. Oncology, Inc. (a) | 163,300 | | 2,033,085 |
PHARMACEUTICALS - 6.8% |
Elan Corp. PLC sponsored ADR (a) | 3,198,500 | | 46,122,370 |
Guilford Pharmaceuticals, Inc. (a) | 918,200 | | 7,051,776 |
Medicines Co. (a) | 611,000 | | 16,594,760 |
MGI Pharma, Inc. (a) | 272,500 | | 13,385,200 |
Sepracor, Inc. (a) | 1,283,200 | | 36,468,544 |
Shire Pharmaceuticals Group PLC sponsored ADR (a) | 422,600 | | 13,066,792 |
SkyePharma PLC (a) | 304,800 | | 361,422 |
TOTAL PHARMACEUTICALS | | 133,050,864 |
TOTAL COMMON STOCKS (Cost $1,454,059,890) | 1,931,153,189 |
Preferred Stocks - 0.4% |
| | | |
Convertible Preferred Stocks - 0.3% |
BIOTECHNOLOGY - 0.3% |
Xenon Genetics, Inc. Series E (d) | 981,626 | | 6,056,632 |
Nonconvertible Preferred Stocks - 0.1% |
BIOTECHNOLOGY - 0.1% |
Geneprot, Inc. Series A (d) | 180,000 | | 630,000 |
TOTAL PREFERRED STOCKS (Cost $7,714,138) | 6,686,632 |
Convertible Bonds - 0.3% |
| Principal Amount | | |
BIOTECHNOLOGY - 0.3% |
Cell Therapeutics, Inc. 5.75% 6/15/08 (c)
(Cost $7,500,000) | | $ 7,500,000 | | 5,625,000 |
Money Market Funds - 8.6% |
| Shares | | Value (Note 1) |
Fidelity Cash Central Fund, 1.08% (b) | 5,988,679 | | $ 5,988,679 |
Fidelity Securities Lending Cash Central Fund, 1.08% (b) | 162,052,575 | | 162,052,575 |
TOTAL MONEY MARKET FUNDS (Cost $168,041,254) | 168,041,254 |
TOTAL INVESTMENT PORTFOLIO - 108.4% (Cost $1,637,315,282) | | 2,111,506,075 |
NET OTHER ASSETS - (8.4)% | | (162,931,939) |
NET ASSETS - 100% | $ 1,948,574,136 |
Legend |
(a) Non-income producing |
(b) Affiliated fund that is available only to investment companies and other accounts managed by Fidelity Investments. The rate quoted is the annualized seven-day yield of the fund at period end. A complete listing of the fund's holdings as of its most recent fiscal year end is available upon request. |
(c) Security exempt from registration under Rule 144A of the Securities Act of 1933. These securities may be resold in transactions exempt from registration, normally to qualified institutional buyers. At the period end, the value of these securities amounted to $5,625,000 or 0.3% of net assets. |
(d) Restricted securities - Investment in securities not registered under the Securities Act of 1933 (excluding 144A issues). At the end of the period, the value of restricted securities (excluding 144A issues) amounted to $6,686,632 or 0.4% of net assets. |
Additional information on each holding is as follows: |
Security | Acquisition Date | Acquisition Cost |
Geneprot, Inc. Series A | 7/7/00 | $ 990,000 |
Xenon Genetics, Inc. Series E | 3/23/01 | $ 6,724,138 |
Other Information |
Purchases and sales of securities, other than short-term securities, aggregated $879,762,794 and $830,639,338, respectively. |
The fund placed a portion of its portfolio transactions with brokerage firms which are affiliates of the investment adviser. The commissions paid to these affiliated firms were $14,084 for the period. |
The fund participated in the interfund lending program as a borrower. The average daily loan balance during the period for which loans were outstanding amounted to $13,836,500. The weighted average interest rate was 1.14%. At period end there were no interfund loans outstanding. |
Income Tax Information |
At February 29, 2004, the fund had a capital loss carryforward of approximately $1,049,360,000 of which $266,016,000 and $783,344,000 will expire on February 28, 2010 and 2011, respectively. |
See accompanying notes which are an integral part of the financial statements.
Health Care Sector
Biotechnology Portfolio
Financial Statements
Statement of Assets and Liabilities
| February 29, 2004 |
| | |
Assets | | |
Investment in securities, at value (including securities loaned of $158,880,772) (cost $1,637,315,282) - See accompanying schedule | | $ 2,111,506,075 |
Receivable for investments sold | | 3,012,292 |
Receivable for fund shares sold | | 2,108,548 |
Dividends receivable | | 48,834 |
Interest receivable | | 106,466 |
Prepaid expenses | | 9,437 |
Other affiliated receivables | | 136 |
Other receivables | | 239,775 |
Total assets | | 2,117,031,563 |
| | |
Liabilities | | |
Payable for investments purchased | $ 2,783,672 | |
Payable for fund shares redeemed | 1,997,979 | |
Accrued management fee | 920,117 | |
Other affiliated payables | 665,484 | |
Other payables and accrued expenses | 37,600 | |
Collateral on securities loaned,
at value | 162,052,575 | |
Total liabilities | | 168,457,427 |
| | |
Net Assets | | $ 1,948,574,136 |
Net Assets consist of: | | |
Paid in capital | | $ 2,536,274,982 |
Accumulated undistributed net realized gain (loss) on investments and foreign currency transactions | | (1,061,891,639) |
Net unrealized appreciation (depreciation) on investments | | 474,190,793 |
Net Assets, for 35,180,402 shares outstanding | | $ 1,948,574,136 |
Net Asset Value, offering price and redemption price per share ($1,948,574,136 ÷ 35,180,402 shares) | | $ 55.39 |
Statement of Operations
| Year ended February 29, 2004 |
| | |
Investment Income | | |
Dividends | | $ 971,749 |
Interest | | 3,117,428 |
Security lending | | 831,089 |
Total income | | 4,920,266 |
| | |
Expenses | | |
Management fee | $ 10,729,447 | |
Transfer agent fees | 9,792,093 | |
Accounting and security lending fees | 871,642 | |
Non-interested trustees' compensation | 7,393 | |
Custodian fees and expenses | 58,498 | |
Registration fees | 37,164 | |
Audit | 53,035 | |
Legal | 7,818 | |
Interest | 877 | |
Miscellaneous | 71,184 | |
Total expenses before reductions | 21,629,151 | |
Expense reductions | (391,277) | 21,237,874 |
Net investment income (loss) | | (16,317,608) |
Realized and Unrealized Gain (Loss) Net realized gain (loss) on: | | |
Investment securities | 210,616,415 | |
Foreign currency transactions | (8,816) | |
Total net realized gain (loss) | | 210,607,599 |
Change in net unrealized appreciation (depreciation) on: Investment securities | 445,811,527 | |
Assets and liabilities in foreign currencies | 1,699 | |
Total change in net unrealized appreciation (depreciation) | | 445,813,226 |
Net gain (loss) | | 656,420,825 |
Net increase (decrease) in net assets resulting from operations | | $ 640,103,217 |
Other Information | | |
Sales charges paid to FDC | | $ 962,665 |
Deferred sales charges withheld by FDC | | $ 19,652 |
Exchange fees withheld by
FSC | | $ 36,233 |
See accompanying notes which are an integral part of the financial statements.
Annual Report
Biotechnology Portfolio
Financial Statements - continued
Statement of Changes in Net Assets
| Year ended
February 29,
2004 | Year ended
February 28,
2003 |
Increase (Decrease) in Net Assets | | |
Operations | | |
Net investment income (loss) | $ (16,317,608) | $ (14,873,907) |
Net realized gain (loss) | 210,607,599 | (730,143,036) |
Change in net unrealized appreciation (depreciation) | 445,813,226 | 75,786,232 |
Net increase (decrease) in net assets resulting from operations | 640,103,217 | (669,230,711) |
Share transactions
Net proceeds from sales of shares | 407,057,700 | 346,674,008 |
Cost of shares redeemed | (583,228,963) | (627,547,544) |
Net increase (decrease) in net assets resulting from share transactions | (176,171,263) | (280,873,536) |
Redemption fees | 339,354 | 572,165 |
Total increase (decrease) in net assets | 464,271,308 | (949,532,082) |
| | |
Net Assets | | |
Beginning of period | 1,484,302,828 | 2,433,834,910 |
End of period (including undistributed net investment income of $0 and $104,900, respectively) | $ 1,948,574,136 | $ 1,484,302,828 |
Other Information Shares | | |
Sold | 8,488,917 | 8,420,251 |
Redeemed | (11,938,480) | (15,303,113) |
Net increase (decrease) | (3,449,563) | (6,882,862) |
Financial Highlights
Years ended February 28, | 2004 E | 2003 | 2002 | 2001 | 2000 E |
Selected Per-Share Data | | | | | |
Net asset value, beginning of period | $ 38.42 | $ 53.48 | $ 71.46 | $ 107.27 | $ 41.35 |
Income from Investment Operations | | | | | |
Net investment income (loss) C | (.43) | (.36) | (.42) | (.32) | (.30) |
Net realized and unrealized gain (loss) | 17.39 | (14.71) | (17.59) | (33.51) | 68.93 |
Total from investment operations | 16.96 | (15.07) | (18.01) | (33.83) | 68.63 |
Distributions from net realized gain | - | - | - | (1.70) | (2.82) |
Distributions in excess of net realized gain | - | - | - | (.41) | - |
Total distributions | - | - | - | (2.11) | (2.82) |
Redemption fees added to paid in capital C | .01 | .01 | .03 | .13 | .11 |
Net asset value, end of period | $ 55.39 | $ 38.42 | $ 53.48 | $ 71.46 | $ 107.27 |
Total Return A,B | 44.17% | (28.16)% | (25.16)% | (31.61)% | 173.22% |
Ratios to Average Net Assets D | | | | | |
Expenses before expense reductions | 1.17% | 1.29% | 1.11% | 1.01% | 1.16% |
Expenses net of voluntary waivers, if any | 1.17% | 1.29% | 1.11% | 1.01% | 1.16% |
Expenses net of all reductions | 1.15% | 1.24% | 1.09% | 1.00% | 1.15% |
Net investment income (loss) | (.88)% | (.87)% | (.67)% | (.37)% | (.51)% |
Supplemental Data | | | | | |
Net assets, end of period (000 omitted) | $ 1,948,574 | $ 1,484,303 | $ 2,433,835 | $ 3,516,830 | $ 5,292,350 |
Portfolio turnover rate | 50% | 73% | 96% | 74% | 72% |
A Total returns would have been lower had certain expenses not been reduced during the periods shown. B Total returns do not include the effect of the former sales charges. C Calculated based on average shares outstanding during the period. D Expense ratios reflect operating expenses of the fund. Expenses before reductions do not reflect amounts reimbursed by the investment adviser or reductions from brokerage service arrangements or other expense offset arrangements and do not represent the amount paid by the fund during periods when reimbursements or reductions occur. Expenses net of any voluntary waivers reflect expenses after reimbursement by the investment adviser but prior to reductions from brokerage service arrangements or other expense offset arrangements. Expenses net of all reductions represent the net expenses paid by the fund. E For the year ended February 29. |
See accompanying notes which are an integral part of the financial statements.
Health Care Sector
Health Care Portfolio
Performance
Average annual total return reflects the change in the value of an investment, assuming reinvestment of the fund's dividend income and capital gains (the profits earned upon the sale of securities that have grown in value) and assuming a constant rate of performance each year. The $10,000 table and the fund's returns do not reflect the deduction of taxes that a shareholder would pay on fund distributions or the redemption of fund shares. During periods of reimbursement by Fidelity a fund's total returns will be greater than it would be had the reimbursement not occurred. How a fund did yesterday is no guarantee of how it will do tomorrow.
Average Annual Total Returns
Periods ended February 29, 2004 | Past 1
year | Past 5
years | Past 10
years |
Select Health Care | 24.11% | 2.17% | 15.61% |
$10,000 Over 10 Years
Let's say hypothetically that $10,000 was invested in Fidelity Select Health Care Portfolio on February 28, 1994. The chart shows how the value of your investment would have grown, and also shows how the S&P 500 Index did over the same period.
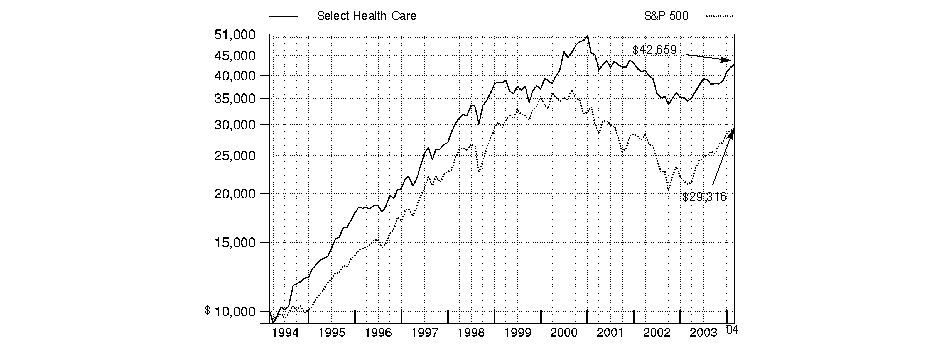
Annual Report
Health Care Portfolio
Management's Discussion of Fund Performance
Comments from Sam Peters, who became Portfolio Manager of Fidelity® Select Health Care Portfolio on February 1, 2004
From March 2003 through the end of February 2004, domestic stocks recovered dramatically from their prior three-year swoon, driven largely by a broad-based economic and corporate profit recovery. Most major equity benchmarks gained 35% or more during the 12-month period, led by the Russell 2000® Index - a measure of the overall small-cap universe - which advanced 64.41%. As investors grew more confident about the economy's vitality, small-cap stocks were bid up, particularly those with no current earnings. In comparison, the Wilshire 5000® Total Market Index, commonly used as a proxy for the entire U.S. stock market's performance, rose 42.47%. Every sector of the market posted a double-digit advance, with economically sensitive issues - especially technology stocks - leading the way. The tech-heavy NASDAQ Composite® Index returned 52.47% during the past year, despite a negative return in February as investors turned to the more value-oriented segments of the market. The broader Standard & Poor's 500SM Index climbed 38.52% during the year, slightly outperforming the 37.07% increase for the blue-chip Dow Jones Industrial AverageSM.
For the 12-month period that ended February 29, 2004, the fund posted a gain of 24.11%, underperforming the Goldman Sachs® Health Care Index, which returned 30.76%, and the S&P 500®. Although health care stocks posted solid absolute performance, they did not fare as well as the overall stock market, which regained some of the ground it lost during the downturn of the past three years. The fund's overweighted position in pharmaceutical stocks and underweighting in biotech stocks led it to underperform the Goldman Sachs index. Looking at detractors from performance, Johnson & Johnson's stock was hurt by the troubled launch of its Cypher drug-coated coronary stent as well as by concerns about competition in its pharmaceutical business. Baxter International, a leading maker of intravenous supplies, hurt performance because of increased sales pressure on its top-selling clotting agent, Recombinate, which is used to treat hemophilia patients. Medtronic's stock declined as a result of the market's concerns about the sustainability of the company's ICD - Implantable Cardioverter Defibrillator - business as more competitors enter the marketplace. On the positive side, St. Jude Medical added to fund performance, benefiting from its ICD product launch anticipated to take place in mid-2004. Boston Scientific also helped performance as it continued to prosper from its expected drug-coated stent product launch. Angiotech Pharmaceuticals also contributed to fund performance. The company produces surgical products coated with Paclitaxel, a drug with anti-inflammatory properties, and has partnered with Boston Scientific on its drug-coated stent products.
The views expressed in this statement reflect those of the portfolio manager only through the end of the period of the report as stated on the cover and do not necessarily represent the views of Fidelity or any other person in the Fidelity organization. Any such views are subject to change at any time based upon market or other conditions and Fidelity disclaims any responsibility to update such views. These views may not be relied on as investment advice and, because investment decisions for a Fidelity fund are based on numerous factors, may not be relied on as an indication of trading intent on behalf of any Fidelity fund.
Annual Report
Health Care Portfolio
Investment Summary
Top Ten Stocks as of February 29, 2004 |
| % of fund's
net assets |
Johnson & Johnson | 9.9 |
Pfizer, Inc. | 7.9 |
Medtronic, Inc. | 6.4 |
Eli Lilly & Co. | 5.4 |
Genentech, Inc. | 5.3 |
Merck & Co., Inc. | 5.0 |
Abbott Laboratories | 4.5 |
Amgen, Inc. | 4.4 |
Baxter International, Inc. | 4.3 |
Boston Scientific Corp. | 4.1 |
| 57.2 |
Top Industries as of February 29, 2004 |
% of fund's net assets |
| Pharmaceuticals | 44.3% | |
| Health Care Equipment & Supplies | 22.4% | |
| Biotechnology | 16.4% | |
| Health Care Providers & Services | 15.5% | |
| Personal Products | 0.2% | |
| All Others* | 1.2% | |

* Includes short-term investments and net other assets. |
Annual Report
Health Care Portfolio
Investments February 29, 2004
Showing Percentage of Net Assets
Common Stocks - 98.8% |
| Shares | | Value (Note 1) |
BIOTECHNOLOGY - 16.4% |
Alkermes, Inc. (a) | 1,073,700 | | $ 15,300,225 |
Amgen, Inc. (a) | 1,424,900 | | 90,523,897 |
Angiotech Pharmaceuticals, Inc. (a) | 100,000 | | 2,572,167 |
Biogen Idec, Inc. (a) | 411,700 | | 22,828,765 |
Celgene Corp. (a) | 236,500 | | 9,694,135 |
Genentech, Inc. (a) | 996,200 | | 107,480,018 |
Genzyme Corp. - General Division (a) | 400,600 | | 20,342,468 |
Gilead Sciences, Inc. (a) | 272,800 | | 14,788,488 |
ImClone Systems, Inc. (a) | 112,900 | | 4,739,542 |
MedImmune, Inc. (a) | 420,370 | | 10,799,305 |
Millennium Pharmaceuticals, Inc. (a) | 1,169,600 | | 20,830,576 |
Neurocrine Biosciences, Inc. (a) | 200,600 | | 11,153,360 |
Protein Design Labs, Inc. (a) | 136,500 | | 3,276,000 |
TOTAL BIOTECHNOLOGY | | 334,328,946 |
HEALTH CARE EQUIPMENT & SUPPLIES - 22.4% |
Alcon, Inc. | 364,200 | | 22,893,612 |
Baxter International, Inc. | 3,022,800 | | 88,023,936 |
Biomet, Inc. | 1,082,100 | | 42,180,258 |
Boston Scientific Corp. (a) | 2,068,000 | | 84,477,800 |
Edwards Lifesciences Corp. (a) | 712,800 | | 22,952,160 |
Epix Medical, Inc. (a) | 91,900 | | 1,936,333 |
Kinetic Concepts, Inc. | 2,300 | | 92,805 |
Medtronic, Inc. | 2,765,704 | | 129,711,518 |
ResMed, Inc. (a) | 153,700 | | 7,233,122 |
Respironics, Inc. (a) | 137,300 | | 7,182,163 |
St. Jude Medical, Inc. (a) | 674,400 | | 48,995,160 |
TOTAL HEALTH CARE EQUIPMENT & SUPPLIES | | 455,678,867 |
HEALTH CARE PROVIDERS & SERVICES - 15.5% |
Aetna, Inc. | 165,300 | | 13,354,587 |
Caremark Rx, Inc. (a) | 1,210,930 | | 39,064,602 |
Coventry Health Care, Inc. (a) | 256,500 | | 11,175,705 |
DaVita, Inc. (a) | 112,600 | | 5,124,426 |
HCA, Inc. | 510,100 | | 21,689,452 |
Health Management Associates, Inc. Class A | 501,100 | | 11,169,519 |
Henry Schein, Inc. (a) | 274,200 | | 19,605,300 |
Humana, Inc. (a) | 292,700 | | 6,415,984 |
IMS Health, Inc. | 444,200 | | 11,007,276 |
Laboratory Corp. of America Holdings (a) | 237,800 | | 9,319,382 |
Omnicare, Inc. | 393,900 | | 18,143,034 |
PacifiCare Health Systems, Inc. (a) | 779,400 | | 27,824,580 |
Patterson Dental Co. (a) | 58,900 | | 3,991,653 |
Quest Diagnostics, Inc. | 138,600 | | 11,485,782 |
Tenet Healthcare Corp. (a) | 823,000 | | 9,892,460 |
|
| Shares | | Value (Note 1) |
UnitedHealth Group, Inc. | 1,302,400 | | $ 80,748,800 |
WebMD Corp. (a) | 1,946,400 | | 16,661,184 |
TOTAL HEALTH CARE PROVIDERS & SERVICES | | 316,673,726 |
PERSONAL PRODUCTS - 0.2% |
NBTY, Inc. (a) | 100,600 | | 3,345,956 |
PHARMACEUTICALS - 44.3% |
Abbott Laboratories | 2,145,800 | | 91,840,240 |
Allergan, Inc. | 248,200 | | 21,727,428 |
Barr Pharmaceuticals, Inc. (a) | 140,000 | | 10,837,400 |
Eli Lilly & Co. | 1,490,400 | | 110,200,176 |
Endo Pharmaceuticals Holdings, Inc. (a) | 205,500 | | 4,987,485 |
Forest Laboratories, Inc. (a) | 656,800 | | 49,575,264 |
Hollis-Eden Pharmaceutcals, Inc. (a) | 660,000 | | 8,646,000 |
IVAX Corp. (a) | 540,300 | | 12,027,078 |
Johnson & Johnson | 3,741,964 | | 201,729,278 |
King Pharmaceuticals, Inc. (a) | 388,800 | | 7,492,176 |
Merck & Co., Inc. | 2,110,000 | | 101,448,800 |
Novartis AG sponsored ADR | 236,400 | | 10,437,060 |
Perrigo Co. | 342,600 | | 6,694,404 |
Pfizer, Inc. | 4,371,810 | | 160,226,837 |
Schering-Plough Corp. | 2,616,900 | | 46,999,524 |
Sepracor, Inc. (a) | 136,000 | | 3,865,120 |
Watson Pharmaceuticals, Inc. (a) | 239,200 | | 10,984,064 |
Wyeth | 1,061,070 | | 41,912,265 |
TOTAL PHARMACEUTICALS | | 901,630,599 |
TOTAL COMMON STOCKS (Cost $1,461,090,351) | 2,011,658,094 |
Nonconvertible Preferred Stocks - 0.0% |
| | | |
BIOTECHNOLOGY - 0.0% |
Geneprot, Inc. Series A (c)
(Cost $610,500) | 111,000 | | 388,500 |
Money Market Funds - 0.9% |
| Shares | | Value (Note 1) |
Fidelity Cash Central Fund, 1.08% (b) | 16,713,190 | | $ 16,713,190 |
Fidelity Securities Lending Cash Central Fund, 1.08% (b) | 94,500 | | 94,500 |
TOTAL MONEY MARKET FUNDS (Cost $16,807,690) | 16,807,690 |
TOTAL INVESTMENT PORTFOLIO - 99.7% (Cost $1,478,508,541) | 2,028,854,284 |
NET OTHER ASSETS - 0.3% | 6,928,102 |
NET ASSETS - 100% | $ 2,035,782,386 |
Legend |
(a) Non-income producing |
(b) Affiliated fund that is available only to investment companies and other accounts managed by Fidelity Investments. The rate quoted is the annualized seven-day yield of the fund at period end. A complete listing of the fund's holdings as of its most recent fiscal year end is available upon request. |
(c) Restricted securities - Investment in securities not registered under the Securities Act of 1933 (excluding 144A issues). At the end of the period, the value of restricted securities (excluding 144A issues) amounted to $388,500 or 0.0% of net assets. |
Additional information on each holding is as follows: |
Security | Acquisition Date | Acquisition Cost |
Geneprot, Inc. Series A | 7/7/00 | $ 610,500 |
Other Information |
Purchases and sales of securities, other than short-term securities, aggregated $1,933,806,578 and $2,058,944,972, respectively. |
The fund placed a portion of its portfolio transactions with brokerage firms which are affiliates of the investment adviser. The commissions paid to these affiliated firms were $57,009 for the period. |
The fund participated in the interfund lending program as a borrower. The average daily loan balance during the period for which the loan was outstanding amounted to $6,407,000. The weighted average interest rate was 1.18%. At period end, there were no interfund loans outstanding. |
Income Tax Information |
At February 29, 2004, the fund had a capital loss carryforward of approximately $70,936,000 of which $67,712,000 and $3,224,000 will expire on February 28, 2011 and February 29, 2012, respectively. |
See accompanying notes which are an integral part of the financial statements.
Health Care Sector
Health Care Portfolio
Financial Statements
Statement of Assets and Liabilities
| February 29, 2004 |
| | |
Assets | | |
Investment in securities, at value (including securities loaned of $91,700) (cost $1,478,508,541) - See accompanying schedule | | $ 2,028,854,284 |
Receivable for investments sold | | 7,085,667 |
Receivable for fund shares sold | | 1,581,606 |
Dividends receivable | | 2,668,111 |
Interest receivable | | 22,775 |
Prepaid expenses | | 9,434 |
Other affiliated receivables | | 8,777 |
Other receivables | | 337,134 |
Total assets | | 2,040,567,788 |
| | |
Liabilities | | |
Payable for investments purchased | $ 337,709 | |
Payable for fund shares redeemed | 2,715,643 | |
Accrued management fee | 985,182 | |
Transfer agent fee payable | 507,389 | |
Other affiliated payables | 110,684 | |
Other payables and accrued expenses | 34,295 | |
Collateral on securities loaned,
at value | 94,500 | |
Total liabilities | | 4,785,402 |
| | |
Net Assets | | $ 2,035,782,386 |
Net Assets consist of: | | |
Paid in capital | | $ 1,562,524,261 |
Undistributed net investment income | | 250,710 |
Accumulated undistributed net realized gain (loss) on investments and foreign currency transactions | | (77,347,160) |
Net unrealized appreciation (depreciation) on investments and assets and liabilities in foreign currencies | | 550,354,575 |
Net Assets, for 16,503,419 shares outstanding | | $ 2,035,782,386 |
Net Asset Value, offering price and redemption price per share ($2,035,782,386 ÷ 16,503,419 shares) | | $ 123.36 |
Statement of Operations
| Year ended February 29, 2004 |
| | |
Investment Income | | |
Dividends | | $ 20,795,734 |
Interest | | 395,765 |
Security lending | | 57,047 |
Total income | | 21,248,546 |
| | |
Expenses | | |
Management fee | $ 11,099,447 | |
Transfer agent fees | 7,415,343 | |
Accounting and security lending
fees | 870,931 | |
Non-interested trustees' compensation | 9,799 | |
Appreciation in deferred trustee compensation account | 780 | |
Custodian fees and expenses | 50,287 | |
Registration fees | 45,378 | |
Audit | 52,216 | |
Legal | 10,875 | |
Interest | 210 | |
Miscellaneous | 44,230 | |
Total expenses before reductions | 19,599,496 | |
Expense reductions | (604,727) | 18,994,769 |
Net investment income (loss) | | 2,253,777 |
Realized and Unrealized Gain (Loss) Net realized gain (loss) on: | | |
Investment securities | 110,984,828 | |
Foreign currency transactions | 18,868 | |
Total net realized gain (loss) | | 111,003,696 |
Change in net unrealized appreciation (depreciation) on: Investment securities | 294,478,321 | |
Assets and liabilities in foreign currencies | 3,851 | |
Total change in net unrealized appreciation (depreciation) | | 294,482,172 |
Net gain (loss) | | 405,485,868 |
Net increase (decrease) in net assets resulting from operations | | $ 407,739,645 |
Other Information | | |
Sales charges paid to FDC | | $ 522,632 |
Deferred sales charges withheld by FDC | | $ 64,322 |
Exchange fees withheld by
FSC | | $ 21,465 |
See accompanying notes which are an integral part of the financial statements.
Annual Report
Health Care Portfolio
Financial Statements - continued
Statement of Changes in Net Assets
| Year ended
February 29,
2004 | Year ended
February 28,
2003 |
Increase (Decrease) in Net Assets | | |
Operations | | |
Net investment income (loss) | $ 2,253,777 | $ 4,399,316 |
Net realized gain (loss) | 111,003,696 | (174,907,602) |
Change in net unrealized appreciation (depreciation) | 294,482,172 | (203,717,278) |
Net increase (decrease) in net assets resulting from operations | 407,739,645 | (374,225,564) |
Distributions to shareholders from net investment income | (3,051,688) | (3,690,576) |
Distributions to shareholders from net realized gain | - | (46,584,247) |
Total distributions | (3,051,688) | (50,274,823) |
Share transactions
Net proceeds from sales of shares | 256,547,117 | 298,590,394 |
Reinvestment of distributions | 2,870,563 | 47,403,253 |
Cost of shares redeemed | (376,879,228) | (540,624,899) |
Net increase (decrease) in net assets resulting from share transactions | (117,461,548) | (194,631,252) |
Redemption fees | 97,353 | 178,410 |
Total increase (decrease) in net assets | 287,323,762 | (618,953,229) |
Net Assets | | |
Beginning of period | 1,748,458,624 | 2,367,411,853 |
End of period (including undistributed net investment income of $250,710 and undistributed net investment income of $1,531,012, respectively) | $ 2,035,782,386 | $ 1,748,458,624 |
Other Information Shares | | |
Sold | 2,262,268 | 2,824,688 |
Issued in reinvestment of distributions | 25,993 | 409,763 |
Redeemed | (3,347,387) | (5,169,082) |
Net increase (decrease) | (1,059,126) | (1,934,631) |
Financial Highlights
Years ended February 28, | 2004 E | 2003 | 2002 | 2001 | 2000 E |
Selected Per-Share Data | | | | | |
Net asset value, beginning of period | $ 99.56 | $ 121.42 | $ 134.00 | $ 130.79 | $ 137.60 |
Income from Investment Operations | | | | | |
Net investment income (loss) C | .13 | .23 | .17 | .30 | .15 |
Net realized and unrealized gain (loss) | 23.84 | (19.48) | (12.45) | 21.72 | .90 |
Total from investment operations | 23.97 | (19.25) | (12.28) | 22.02 | 1.05 |
Distributions from net investment income | (.18) | (.20) | (.13) | (.24) | (.08) |
Distributions from net realized gain | - | (2.42) | (.19) | (18.63) | (7.85) |
Total distributions | (.18) | (2.62) | (.32) | (18.87) | (7.93) |
Redemption fees added to paid in capital C | .01 | .01 | .02 | .06 | .07 |
Net asset value, end of period | $ 123.36 | $ 99.56 | $ 121.42 | $ 134.00 | $ 130.79 |
Total Return A,B | 24.11% | (16.14)% | (9.15)% | 16.40% | 1.15% |
Ratios to Average Net Assets D | | | | | |
Expenses before expense reductions | 1.02% | 1.05% | .99% | .98% | 1.07% |
Expenses net of voluntary waivers, if any | 1.02% | 1.05% | .99% | .98% | 1.07% |
Expenses net of all reductions | .99% | .99% | .96% | .97% | 1.05% |
Net investment income (loss) | .12% | .22% | .13% | .21% | .12% |
Supplemental Data | | | | | |
Net assets, end of period (000 omitted) | $ 2,035,782 | $ 1,748,459 | $ 2,367,412 | $ 2,755,457 | $ 2,365,063 |
Portfolio turnover rate | 104% | 139% | 135% | 78% | 70% |
ATotal returns would have been lower had certain expenses not been reduced during the periods shown. BTotal returns do not include the effect of the former sales charges. CCalculated based on average shares outstanding during the period. DExpense ratios reflect operating expenses of the fund. Expenses before reductions do not reflect amounts reimbursed by the investment adviser or reductions from brokerage service arrangements or other expense offset arrangements and do not represent the amount paid by the fund during periods when reimbursements or reductions occur. Expenses net of any voluntary waivers reflect expenses after reimbursement by the investment adviser but prior to reductions from brokerage service arrangements or other expense offset arrangements. Expenses net of all reductions represent the net expenses paid by the fund. EFor the year ended February 29. |
Health Care Sector
See accompanying notes which are an integral part of the financial statements.
Medical Delivery Portfolio
Performance
Average annual total return reflects the change in the value of an investment, assuming reinvestment of the fund's dividend income and capital gains (the profits earned upon the sale of securities that have grown in value) and assuming a constant rate of performance each year. The $10,000 table and the fund's returns do not reflect the deduction of taxes that a shareholder would pay on fund distributions or the redemption of fund shares. During periods of reimbursement by Fidelity a fund's total returns will be greater than it would be had the reimbursement not occurred. How a fund did yesterday is no guarantee of how it will do tomorrow.
Average Annual Total Returns
Periods ended February 29, 2004 | Past 1
year | Past 5
years | Past 10
years |
Select Medical Delivery | 43.43% | 11.42% | 10.11% |
$10,000 Over 10 Years
Let's say hypothetically that $10,000 was invested in Fidelity Select Medical Delivery Portfolio on February 28, 1994. The chart shows how the value of your investment would have grown, and also shows how the S&P 500 Index did over the same period.
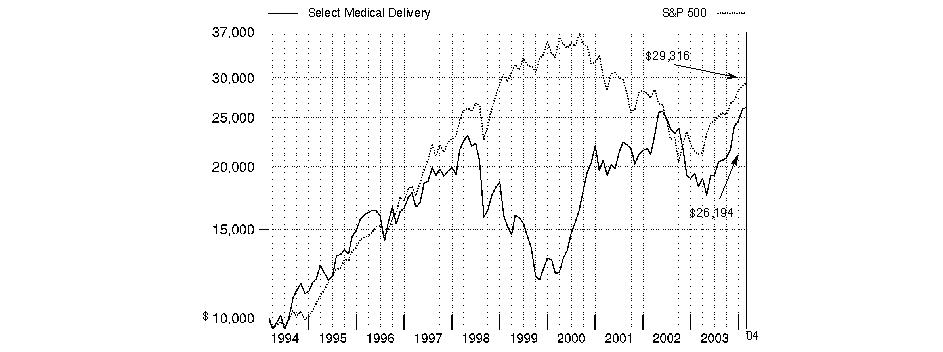
Annual Report
Medical Delivery Portfolio
Management's Discussion of Fund Performance
Comments from Jonathan Zang, Portfolio Manager of Fidelity® Select Medical Delivery Portfolio
From March 2003 through the end of February 2004, domestic stocks recovered dramatically from their prior three-year swoon, driven largely by a broad-based economic and corporate profit recovery. Most major equity benchmarks gained 35% or more during the 12-month period, led by the Russell 2000® Index - a measure of the overall small-cap universe - which advanced 64.41%. As investors grew more confident about the economy's vitality, small-cap stocks were bid up, particularly those with no current earnings. In comparison, the Wilshire 5000® Total Market Index, commonly used as a proxy for the entire U.S. stock market's performance, rose 42.47%. Every sector of the market posted a double-digit advance, with economically sensitive issues - especially technology stocks - leading the way. The tech-heavy NASDAQ Composite® Index returned 52.47% during the past year, despite a negative return in February as investors turned to the more value-oriented segments of the market. The broader Standard & Poor's 500SM Index climbed 38.52% during the year, slightly outperforming the 37.07% increase for the blue-chip Dow Jones Industrial AverageSM.
For the 12-month period ending February 29, 2004, the fund returned 43.43%, outperforming the Goldman Sachs® Health Care Index, which was up 30.76%, and the S&P 500®. The fund's managed care stocks helped its performance relative to its sector benchmark considerably, while its hospital issues generally performed poorly. HealthSouth was the top absolute contributor for the year and grew into one of the fund's largest holdings by period end. PacifiCare and Humana, two managed care companies with substantial exposure to Medicare HMOs, also rose sharply in the second half of the year in anticipation of passage of the Medicare bill. Turning to detractors, hospital stocks were hurt by weakening admissions growth during the period. Fund holdings HCA and Triad Hospitals lost ground along with the rest of their industry due to this slowing growth, and they revised their earnings outlooks downward. Problems at Tenet Healthcare continued to surface following an FBI raid at one of its hospitals and the company's admission last year that it was taking advantage of a loophole in the Medicare reimbursement system.
The views expressed in this statement reflect those of the portfolio manager only through the end of the period of the report as stated on the cover and do not necessarily represent the views of Fidelity or any other person in the Fidelity organization. Any such views are subject to change at any time based upon market or other conditions and Fidelity disclaims any responsibility to update such views. These views may not be relied on as investment advice and, because investment decisions for a Fidelity fund are based on numerous factors, may not be relied on as an indication of trading intent on behalf of any Fidelity fund.
Annual Report
Medical Delivery Portfolio
Investment Summary
Top Ten Stocks as of February 29, 2004 |
| % of fund's
net assets |
UnitedHealth Group, Inc. | 13.1 |
PacifiCare Health Systems, Inc. | 11.8 |
Lincare Holdings, Inc. | 11.4 |
HealthSouth Corp. | 9.5 |
Coventry Health Care, Inc. | 4.7 |
Humana, Inc. | 4.7 |
Caremark Rx, Inc. | 4.7 |
AdvancePCS Class A | 4.6 |
Apria Healthcare Group, Inc. | 4.2 |
Health Management Associates, Inc. Class A | 3.8 |
| 72.5 |
Top Industries as of February 29, 2004 |
% of fund's net assets |
| Health Care Providers & Services | 97.4% | |
| All Others* | 2.6% | |

* Includes short-term investments and net other assets. |
Annual Report
Medical Delivery Portfolio
Investments February 29, 2004
Showing Percentage of Net Assets
Common Stocks - 97.4% |
| Shares | | Value (Note 1) |
HEALTH CARE PROVIDERS & SERVICES - 97.4% |
Accredo Health, Inc. (a) | 76,900 | | $ 2,744,561 |
AdvancePCS Class A (a) | 140,000 | | 9,660,000 |
Aetna, Inc. | 34,800 | | 2,811,492 |
American Healthways, Inc. (a) | 262,248 | | 7,400,639 |
AMERIGROUP Corp. (a) | 90,400 | | 3,834,768 |
Apria Healthcare Group, Inc. (a) | 285,800 | | 8,934,108 |
Caremark Rx, Inc. (a) | 305,000 | | 9,839,300 |
Centene Corp. (a) | 141,000 | | 4,266,660 |
Community Health Systems, Inc. (a) | 214,700 | | 6,022,335 |
Coventry Health Care, Inc. (a) | 229,100 | | 9,981,887 |
Health Management Associates, Inc. Class A | 356,017 | | 7,935,619 |
HealthSouth Corp. (a) | 4,330,380 | | 19,919,748 |
Humana, Inc. (a) | 453,900 | | 9,949,488 |
Lincare Holdings, Inc. (a) | 738,300 | | 23,876,622 |
Mariner Health Care, Inc. (a) | 25,800 | | 561,150 |
Matria Healthcare, Inc. (a) | 266,900 | | 7,886,895 |
Molina Healthcare, Inc. | 75,500 | | 2,393,350 |
Omnicare, Inc. | 85,000 | | 3,915,100 |
PacifiCare Health Systems, Inc. (a) | 694,186 | | 24,782,440 |
Priority Healthcare Corp. Class B (a) | 97,900 | | 2,163,590 |
Sierra Health Services, Inc. (a) | 90,100 | | 3,012,043 |
Tenet Healthcare Corp. (a) | 230,000 | | 2,764,600 |
U.S. Oncology, Inc. (a) | 63,600 | | 791,820 |
UnitedHealth Group, Inc. | 442,814 | | 27,454,467 |
Universal Health Services, Inc. Class B | 36,500 | | 1,968,445 |
TOTAL COMMON STOCKS (Cost $176,695,370) | 204,871,127 |
Money Market Funds - 1.5% |
| | | |
Fidelity Cash Central Fund, 1.08% (b) | 2,848,958 | | 2,848,958 |
Fidelity Securities Lending Cash Central Fund, 1.08% (b) | 196,000 | | 196,000 |
TOTAL MONEY MARKET FUNDS (Cost $3,044,958) | 3,044,958 |
Cash Equivalents - 0.0% |
| Maturity Amount | | |
Investments in repurchase agreements (Collateralized by U.S. Treasury Obligations, in a joint trading account at 1%, dated 2/27/04 due 3/1/04)
(Cost $31,000) | $ 31,003 | | 31,000 |
TOTAL INVESTMENT PORTFOLIO - 98.9% (Cost $179,771,328) | | 207,947,085 |
NET OTHER ASSETS - 1.1% | | 2,308,235 |
NET ASSETS - 100% | $ 210,255,320 |
Legend |
(a) Non-income producing |
(b) Affiliated fund that is available only to investment companies and other accounts managed by Fidelity Investments. The rate quoted is the annualized seven-day yield of the fund at period end. A complete listing of the fund's holdings as of its most recent fiscal year end is available upon request. |
Other Information |
Purchases and sales of securities, other than short-term securities, aggregated $303,207,900 and $250,030,210, respectively. |
The fund placed a portion of its portfolio transactions with brokerage firms which are affiliates of the investment adviser. The commissions paid to these affiliated firms were $20,632 for the period. |
Income Tax Information |
At February 29, 2004, the fund had a capital loss carryforward of approximately $30,293,000 of which $18,216,000, $3,617,000, $29,000 and $8,431,000 will expire on February 29, 2008, February 28, 2009, February 28, 2010 and February 29, 2012, respectively. |
See accompanying notes which are an integral part of the financial statements.
Annual Report
Medical Delivery Portfolio
Financial Statements
Statement of Assets and Liabilities
| February 29, 2004 |
| | |
Assets | | |
Investment in securities, at value (including securities loaned of $196,630 and repurchase agreements of $31,000)(cost $179,771,328) - See accompanying schedule | | $ 207,947,085 |
Cash | | 572 |
Receivable for investments sold | | 459,877 |
Receivable for fund shares sold | | 2,465,572 |
Dividends receivable | | 15,333 |
Interest receivable | | 4,153 |
Prepaid expenses | | 499 |
Other affiliated receivables | | 9 |
Other receivables | | 123,970 |
Total assets | | 211,017,070 |
| | |
Liabilities | | |
Payable for fund shares redeemed | $ 376,437 | |
Accrued management fee | 98,256 | |
Transfer agent fee payable | 54,004 | |
Other affiliated payables | 9,457 | |
Other payables and accrued expenses | 27,596 | |
Collateral on securities loaned, at value | 196,000 | |
Total liabilities | | 761,750 |
| | |
Net Assets | | $ 210,255,320 |
Net Assets consist of: | | |
Paid in capital | | $ 212,499,117 |
Accumulated undistributed net realized gain (loss) on investments | | (30,419,554) |
Net unrealized appreciation (depreciation) on investments | | 28,175,757 |
Net Assets, for 6,417,483 shares outstanding | | $ 210,255,320 |
Net Asset Value, offering price and redemption price per share ($210,255,320 ÷ 6,417,483 shares) | | $ 32.76 |
Statement of Operations
| Year ended February 29, 2004 |
| | |
Investment Income | | |
Dividends | | $ 62,107 |
Interest | | 79,382 |
Security lending | | 20,254 |
Total income | | 161,743 |
| | |
Expenses | | |
Management fee | $ 747,049 | |
Transfer agent fees | 744,540 | |
Accounting and security lending fees | 79,918 | |
Non-interested trustees' compensation | 682 | |
Custodian fees and expenses | 11,184 | |
Registration fees | 39,248 | |
Audit | 44,844 | |
Legal | 1,048 | |
Miscellaneous | 2,826 | |
Total expenses before reductions | 1,671,339 | |
Expense reductions | (84,182) | 1,587,157 |
Net investment income (loss) | | (1,425,414) |
Realized and Unrealized Gain (Loss) Net realized gain (loss) on investment securities | | 19,504,194 |
Change in net unrealized appreciation (depreciation) on investment securities | | 28,933,358 |
Net gain (loss) | | 48,437,552 |
Net increase (decrease) in net assets resulting from operations | | $ 47,012,138 |
Other Information | | |
Sales charges paid to FDC | | $ 55,381 |
Deferred sales charges withheld by FDC | | $ 1,863 |
Exchange fees withheld by
FSC | | $ 7,860 |
See accompanying notes which are an integral part of the financial statements.
Annual Report
Medical Delivery Portfolio
Financial Statements - continued
Statement of Changes in Net Assets
| Year ended
February 29,
2004 | Year ended
February 28,
2003 |
Increase (Decrease) in Net Assets | | |
Operations | | |
Net investment income (loss) | $ (1,425,414) | $ (1,900,412) |
Net realized gain (loss) | 19,504,194 | (6,812,671) |
Change in net unrealized appreciation (depreciation) | 28,933,358 | (38,929,539) |
Net increase (decrease) in net assets resulting from operations | 47,012,138 | (47,642,622) |
Share transactions
Net proceeds from sales of shares | 178,798,464 | 372,528,556 |
Cost of shares redeemed | (133,289,649) | (347,092,411) |
Net increase (decrease) in net assets resulting from share transactions | 45,508,815 | 25,436,145 |
Redemption fees | 99,420 | 589,558 |
Total increase (decrease) in net assets | 92,620,373 | (21,616,919) |
| | |
Net Assets | | |
Beginning of period | 117,634,947 | 139,251,866 |
End of period | $ 210,255,320 | $ 117,634,947 |
Other Information Shares | | |
Sold | 6,230,519 | 12,376,967 |
Redeemed | (4,963,649) | (12,483,749) |
Net increase (decrease) | 1,266,870 | (106,782) |
Financial Highlights
Years ended February 28, | 2004 E | 2003 | 2002 | 2001 | 2000 E |
Selected Per-Share Data | | | | | |
Net asset value, beginning of period | $ 22.84 | $ 26.49 | $ 25.74 | $ 15.34 | $ 19.08 |
Income from Investment Operations | | | | | |
Net investment income (loss) C | (.30) | (.28) | (.20) | (.10) | (.18) |
Net realized and unrealized gain (loss) | 10.20 | (3.46) | .91 | 10.39 | (3.61) |
Total from investment operations | 9.90 | (3.74) | .71 | 10.29 | (3.79) |
Redemption fees added to paid in capital C | .02 | .09 | .04 | .11 | .05 |
Net asset value, end of period | $ 32.76 | $ 22.84 | $ 26.49 | $ 25.74 | $ 15.34 |
Total Return A,B | 43.43% | (13.78)% | 2.91% | 67.80% | (19.60)% |
Ratios to Average Net Assets D | | | | | |
Expenses before expense reductions | 1.30% | 1.25% | 1.22% | 1.25% | 1.73% |
Expenses net of voluntary waivers, if any | 1.30% | 1.25% | 1.22% | 1.25% | 1.73% |
Expenses net of all reductions | 1.24% | 1.13% | 1.19% | 1.22% | 1.67% |
Net investment income (loss) | (1.11)% | (.99)% | (.77)% | (.46)% | (1.02)% |
Supplemental Data | | | | | |
Net assets, end of period (000 omitted) | $ 210,255 | $ 117,635 | $ 139,252 | $ 173,999 | $ 45,106 |
Portfolio turnover rate | 196% | 269% | 106% | 113% | 154% |
A Total returns would have been lower had certain expenses not been reduced during the periods shown. B Total returns do not include the effect of the former sales charges. C Calculated based on average shares outstanding during the period. D Expense ratios reflect operating expenses of the fund. Expenses before reductions do not reflect amounts reimbursed by the investment adviser or reductions from brokerage service arrangements or other expense offset arrangements and do not represent the amount paid by the fund during periods when reimbursements or reductions occur. Expenses net of any voluntary waivers reflect expenses after reimbursement by the investment adviser but prior to reductions from brokerage service arrangements or other expense offset arrangements. Expenses net of all reductions represent the net expenses paid by the fund. E For the year ended February 29. |
See accompanying notes which are an integral part of the financial statements.
Health Care Sector
Medical Equipment and Systems Portfolio
Performance
Average annual total return reflects the change in the value of an investment, assuming reinvestment of the fund's dividend income and capital gains (the profits earned upon the sale of securities that have grown in value) and assuming a constant rate of performance each year. The $10,000 table and the fund's returns do not reflect the deduction of taxes that a shareholder would pay on fund distributions or the redemption of fund shares. During periods of reimbursement by Fidelity a fund's total returns will be greater than it would be had the reimbursement not occurred. How a fund did yesterday is no guarantee of how it will do tomorrow.
Average Annual Total Returns
Periods ended February 29, 2004 | Past 1
year | Past 5
years | Life of
fund A |
Select Medical Equipment and Systems | 37.94% | 17.26% | 18.39% |
A From April 28, 1998.
$10,000 Over Life of Fund
Let's say hypothetically that $10,000 was invested in Fidelity Select Medical Equipment and Systems Portfolio on April 28, 1998, when the fund started. The chart shows how the value of your investment would have grown, and also shows how the S&P 500 Index did over the same period.
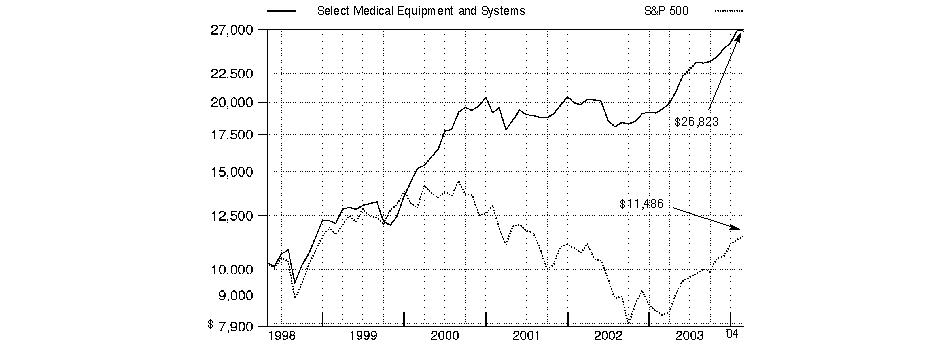
Annual Report
Medical Equipment and Systems Portfolio
Management's Discussion of Fund Performance
Comments from Sam Peters, who became Portfolio Manager of Fidelity® Select Medical Equipment and Systems Portfolio on
February 1, 2004
From March 2003 through the end of February 2004, domestic stocks recovered dramatically from their prior three-year swoon, driven largely by a broad-based economic and corporate profit recovery. Most major equity benchmarks gained 35% or more during the 12-month period, led by the Russell 2000® Index - a measure of the overall small-cap universe - which advanced 64.41%. As investors grew more confident about the economy's vitality, small-cap stocks were bid up, particularly those with no current earnings. In comparison, the Wilshire 5000® Total Market Index, commonly used as a proxy for the entire U.S. stock market's performance, rose 42.47%. Every sector of the market posted a double-digit advance, with economically sensitive issues - especially technology stocks - leading the way. The tech-heavy NASDAQ Composite® Index returned 52.47% during the past year, despite a negative return in February as investors turned to the more value-oriented segments of the market. The broader Standard & Poor's 500SM Index climbed 38.52% during the year, slightly outperforming the 37.07% increase for the blue-chip Dow Jones Industrial AverageSM.
During the 12-month period, the fund gained 37.94%, outperforming the 30.76% return of the Goldman Sachs® Health Care Index and nearly in line with the S&P 500®. Medical device stocks continued to drive performance for the health care group, led by the companies associated with drug-coated stents. The fund's focus on those types of stocks led to its outperformance of the Goldman Sachs index. Based on the success of it surgical products coated with Paclitaxel, a drug with anti-inflammatory properties, Angiotech Pharmaceuticals was the top contributor during the one-year period. In addition, the company - whose revenue comes from license, option and research fees - has partnered with Boston Scientific on its drug-coated stent product. I sold off the position, prior to period-end, to take advantage of gains. Boston Scientific also added to the fund's gains as it continued to prosper from its highly anticipated drug-coated stent product launch. The stents are expected to get Food and Drug Administration (FDA) approval during the first part of 2004. On the down side, St. Jude Medical did well during the period due to its ICD, product line. ICDs or Implantable Cardioverter Defibrillators, are designed to control abnormal heart rhythms. Liquidmetal Technologies, the developer of new technology for cardio-rhythm monitoring devices, and Baxter International, a leading maker of intravenous supplies, also detracted from performance as their stocks were troubled by sales and earnings pressures. ICD maker Medtronic's stock declined due to concerns about the sustainability of product sales as more competitors enter the ICD market.
The views expressed in this statement reflect those of the portfolio manager only through the end of the period of the report as stated on the cover and do not necessarily represent the views of Fidelity or any other person in the Fidelity organization. Any such views are subject to change at any time based upon market or other conditions and Fidelity disclaims any responsibility to update such views. These views may not be relied on as investment advice and, because investment decisions for a Fidelity fund are based on numerous factors, may not be relied on as an indication of trading intent on behalf of any Fidelity fund.
Annual Report
Medical Equipment and Systems Portfolio
Investment Summary
Top Ten Stocks as of February 29, 2004 |
| % of fund's
net assets |
Medtronic, Inc. | 8.5 |
Baxter International, Inc. | 6.4 |
Johnson & Johnson | 5.5 |
Allergan, Inc. | 5.1 |
Boston Scientific Corp. | 5.0 |
St. Jude Medical, Inc. | 4.9 |
Alcon, Inc. | 4.8 |
Biomet, Inc. | 4.7 |
Abbott Laboratories | 3.7 |
Synthes-Stratec, Inc. | 2.8 |
| 51.4 |
Top Industries as of February 29, 2004 |
% of fund's net assets |
| Health Care Equipment & Supplies | 63.0% | |
| Pharmaceuticals | 15.9% | |
| Health Care Providers & Services | 10.9% | |
| Electronic Equipment & Instruments | 2.4% | |
| Biotechnology | 1.5% | |
| All Others* | 6.3% | |

* Includes short-term investments and net other assets. |
Annual Report
Medical Equipment and Systems Portfolio
Investments February 29, 2004
Showing Percentage of Net Assets
Common Stocks - 94.8% |
| Shares | | Value (Note 1) |
BIOTECHNOLOGY - 1.5% |
Digene Corp. (a) | 176,000 | | $ 6,688,000 |
Gen-Probe, Inc. (a) | 58,600 | | 2,003,534 |
TOTAL BIOTECHNOLOGY | | 8,691,534 |
ELECTRONIC EQUIPMENT & INSTRUMENTS - 2.4% |
Waters Corp. (a) | 377,000 | | 13,926,380 |
HEALTH CARE EQUIPMENT & SUPPLIES - 63.0% |
Advanced Neuromodulation Systems, Inc. (a) | 33,111 | | 1,420,462 |
Alcon, Inc. | 436,400 | | 27,432,104 |
American Medical Systems Holdings, Inc. (a) | 76,800 | | 2,161,920 |
Applera Corp. - Applied Biosystems Group | 409,200 | | 9,329,760 |
Bausch & Lomb, Inc. | 78,800 | | 4,679,932 |
Baxter International, Inc. | 1,259,920 | | 36,688,870 |
Beckman Coulter, Inc. | 125,000 | | 6,572,500 |
Biomet, Inc. | 682,947 | | 26,621,274 |
Boston Scientific Corp. (a) | 702,400 | | 28,693,040 |
C.R. Bard, Inc. | 42,000 | | 3,964,380 |
Cooper Companies, Inc. | 56,000 | | 2,649,360 |
Cyberonics, Inc. (a) | 240,000 | | 5,860,800 |
Dade Behring Holdings, Inc. (a) | 235,000 | | 9,599,750 |
DENTSPLY International, Inc. | 184,800 | | 8,096,088 |
Edwards Lifesciences Corp. (a) | 352,100 | | 11,337,620 |
Epix Medical, Inc. (a) | 85,000 | | 1,790,950 |
Given Imaging Ltd. (a) | 125,000 | | 3,723,750 |
Guidant Corp. | 192,500 | | 13,116,950 |
Hologic, Inc. (a) | 380,000 | | 7,600,000 |
Integra LifeSciences Holdings Corp. (a) | 150,000 | | 4,756,500 |
Invacare Corp. | 75,000 | | 3,351,000 |
Inverness Medical Innovations, Inc. (a) | 120,000 | | 2,640,000 |
Kensey Nash Corp. (a) | 128,100 | | 3,352,377 |
Medtronic, Inc. | 1,041,116 | | 48,828,342 |
Memry Corp. (a) | 350,000 | | 549,500 |
PolyMedica Corp. | 75,000 | | 1,905,750 |
Regeneration Technologies, Inc. (a) | 250,000 | | 2,755,000 |
ResMed, Inc. (a) | 183,900 | | 8,654,334 |
Respironics, Inc. (a) | 126,200 | | 6,601,522 |
Smith & Nephew PLC sponsored ADR | 82,200 | | 4,130,550 |
Sonic Innovations, Inc. (a) | 150,000 | | 1,531,500 |
St. Jude Medical, Inc. (a) | 388,600 | | 28,231,790 |
Steris Corp. (a) | 164,200 | | 4,136,198 |
SurModics, Inc. (a) | 164,900 | | 3,464,549 |
Synthes-Stratec, Inc. | 15,709 | | 15,955,425 |
Thoratec Corp. (a) | 89,300 | | 1,160,900 |
Wilson Greatbatch Technologies, Inc. (a) | 181,800 | | 6,586,614 |
TOTAL HEALTH CARE EQUIPMENT & SUPPLIES | | 359,931,361 |
|
| Shares | | Value (Note 1) |
HEALTH CARE PROVIDERS & SERVICES - 10.9% |
Hanger Orthopedic Group, Inc. (a) | 240,000 | | $ 3,888,000 |
Henry Schein, Inc. (a) | 207,600 | | 14,843,400 |
IMPAC Medical Systems, Inc. (a) | 126,100 | | 3,141,151 |
Laboratory Corp. of America Holdings (a) | 267,000 | | 10,463,730 |
Patterson Dental Co. (a) | 120,900 | | 8,193,393 |
ProxyMed, Inc. (a) | 150,000 | | 2,817,000 |
Quest Diagnostics, Inc. | 130,500 | | 10,814,535 |
WebMD Corp. (a) | 935,900 | | 8,011,304 |
TOTAL HEALTH CARE PROVIDERS & SERVICES | | 62,172,513 |
PHARMACEUTICALS - 15.9% |
Abbott Laboratories | 486,720 | | 20,831,616 |
Allergan, Inc. | 333,000 | | 29,150,820 |
Endo Pharmaceuticals Holdings, Inc. (a) | 242,200 | | 5,878,194 |
Johnson & Johnson | 581,700 | | 31,359,447 |
Medicines Co. (a) | 130,000 | | 3,530,800 |
TOTAL PHARMACEUTICALS | | 90,750,877 |
SOFTWARE - 1.1% |
Merge Technologies, Inc. (a) | 447,000 | | 6,405,510 |
TOTAL COMMON STOCKS (Cost $460,800,598) | 541,878,175 |
Money Market Funds - 7.3% |
| | | |
Fidelity Cash Central Fund, 1.08% (b) | 35,316,217 | | 35,316,217 |
Fidelity Securities Lending Cash Central Fund, 1.08% (b) | 6,266,450 | | 6,266,450 |
TOTAL MONEY MARKET FUNDS (Cost $41,582,667) | 41,582,667 |
TOTAL INVESTMENT PORTFOLIO - 102.1% (Cost $502,383,265) | 583,460,842 |
NET OTHER ASSETS - (2.1)% | (11,865,089) |
NET ASSETS - 100% | $ 571,595,753 |
Legend |
(a) Non-income producing |
(b) Affiliated fund that is available only to investment companies and other accounts managed by Fidelity Investments. The rate quoted is the annualized seven-day yield of the fund at period end. A complete listing of the fund's holdings as of its most recent fiscal year end is available upon request. |
Other Information |
Purchases and sales of securities, other than short-term securities, aggregated $395,989,275 and $100,689,423, respectively. |
The fund placed a portion of its portfolio transactions with brokerage firms which are affiliates of the investment adviser. The commissions paid to these affiliated firms were $13,098 for the period. |
Income Tax Information |
The fund hereby designates approximately $3,870,000 as a capital gain dividend for the purpose of the dividend paid deduction. |
See accompanying notes which are an integral part of the financial statements.
Health Care Sector
Medical Equipment and Systems Portfolio
Financial Statements
Statement of Assets and Liabilities
| February 29, 2004 |
| | |
Assets | | |
Investment in securities, at value (including securities loaned of $6,143,198) (cost $502,383,265) - See accompanying schedule | | $ 583,460,842 |
Foreign currency held at value
(cost $2,523,190) | | 2,523,190 |
Receivable for investments sold | | 2,839,295 |
Receivable for fund shares sold | | 3,511,848 |
Dividends receivable | | 230,213 |
Interest receivable | | 27,898 |
Prepaid expenses | | 1,352 |
Other affiliated receivables | | 736 |
Other receivables | | 55,132 |
Total assets | | 592,650,506 |
| | |
Liabilities | | |
Payable for investments purchased | $ 13,602,076 | |
Payable for fund shares redeemed | 723,928 | |
Accrued management fee | 265,200 | |
Other affiliated payables | 169,127 | |
Other payables and accrued expenses | 27,972 | |
Collateral on securities loaned, at value | 6,266,450 | |
Total liabilities | | 21,054,753 |
| | |
Net Assets | | $ 571,595,753 |
Net Assets consist of: | | |
Paid in capital | | $ 485,781,422 |
Accumulated undistributed net realized gain (loss) on investments and foreign currency transactions | | 4,691,116 |
Net unrealized appreciation (depreciation) on investments and assets and liabilities in foreign currencies | | 81,123,215 |
Net Assets, for 27,233,846 shares outstanding | | $ 571,595,753 |
Net Asset Value, offering price and redemption price per share ($571,595,753 ÷ 27,233,846 shares) | | $ 20.99 |
Statement of Operations
| Year ended February 29, 2004 |
| | |
Investment Income | | |
Dividends | | $ 1,872,513 |
Interest | | 141,395 |
Security lending | | 109,025 |
Total income | | 2,122,933 |
| | |
Expenses | | |
Management fee | $ 1,799,402 | |
Transfer agent fees | 1,514,609 | |
Accounting and security lending fees | 191,061 | |
Non-interested trustees' compensation | 1,221 | |
Custodian fees and expenses | 12,353 | |
Registration fees | 59,048 | |
Audit | 44,943 | |
Legal | 839 | |
Miscellaneous | 3,892 | |
Total expenses before reductions | 3,627,368 | |
Expense reductions | (83,009) | 3,544,359 |
Net investment income (loss) | | (1,421,426) |
Realized and Unrealized Gain (Loss) Net realized gain (loss) on: | | |
Investment securities | 16,640,665 | |
Foreign currency transactions | (48,552) | |
Total net realized gain (loss) | | 16,592,113 |
Change in net unrealized appreciation (depreciation) on: Investment securities | 74,777,986 | |
Assets and liabilities in foreign currencies | 45,638 | |
Total change in net unrealized appreciation (depreciation) | | 74,823,624 |
Net gain (loss) | | 91,415,737 |
Net increase (decrease) in net assets resulting from operations | | $ 89,994,311 |
Other Information | | |
Sales charges paid to FDC | | $ 1,148,354 |
Deferred sales charges withheld by FDC | | $ 622 |
Exchange fees withheld by
FSC | | $ 6,548 |
See accompanying notes which are an integral part of the financial statements.
Annual Report
Medical Equipment and Systems Portfolio
Financial Statements - continued
Statement of Changes in Net Assets
| Year ended
February 29, 2004 | Year ended
February 28, 2003 |
Increase (Decrease) in Net Assets | | |
Operations | | |
Net investment income (loss) | $ (1,421,426) | $ (766,612) |
Net realized gain (loss) | 16,592,113 | 75,914 |
Change in net unrealized appreciation (depreciation) | 74,823,624 | (2,391,283) |
Net increase (decrease) in net assets resulting from operations | 89,994,311 | (3,081,981) |
Distributions to shareholders from net realized gain | (9,765,977) | (995,401) |
Share transactions
Net proceeds from sales of shares | 461,715,369 | 105,482,111 |
Reinvestment of distributions | 9,398,735 | 964,137 |
Cost of shares redeemed | (135,814,709) | (93,135,243) |
Net increase (decrease) in net assets resulting from share transactions | 335,299,395 | 13,311,005 |
Redemption fees | 98,213 | 71,442 |
Total increase (decrease) in net assets | 415,625,942 | 9,305,065 |
| | |
Net Assets | | |
Beginning of period | 155,969,811 | 146,664,746 |
End of period | $ 571,595,753 | $ 155,969,811 |
Other Information Shares | | |
Sold | 24,011,828 | 6,936,439 |
Issued in reinvestment of distributions | 481,986 | 60,372 |
Redeemed | (7,238,591) | (6,174,558) |
Net increase (decrease) | 17,255,223 | 822,253 |
Financial Highlights
Years ended February 28, | 2004 E | 2003 | 2002 | 2001 | 2000 E |
Selected Per-Share Data | | | | | |
Net asset value, beginning of period | $ 15.63 | $ 16.02 | $ 16.19 | $ 14.71 | $ 12.10 |
Income from Investment Operations | | | | | |
Net investment income (loss) C | (.09) | (.08) | (.07) | (.02) | (.08) |
Net realized and unrealized gain (loss) | 5.97 | (.21) | .23 | 3.78 | 3.09 |
Total from investment operations | 5.88 | (.29) | .16 | 3.76 | 3.01 |
Distributions from net realized gain | (.53) | (.11) | (.34) | (2.31) | (.42) |
Redemption fees added to paid in capital C | .01 | .01 | .01 | .03 | .02 |
Net asset value, end of period | $ 20.99 | $ 15.63 | $ 16.02 | $ 16.19 | $ 14.71 |
Total Return A,B | 37.94% | (1.76)% | 1.37% | 28.41% | 25.68% |
Ratios to Average Net Assets D | | | | | |
Expenses before expense reductions | 1.18% | 1.33% | 1.26% | 1.24% | 1.66% |
Expenses net of voluntary waivers, if any | 1.18% | 1.33% | 1.26% | 1.24% | 1.66% |
Expenses net of all reductions | 1.15% | 1.29% | 1.23% | 1.23% | 1.65% |
Net investment income (loss) | (.46)% | (.55)% | (.49)% | (.12)% | (.61)% |
Supplemental Data | | | | | |
Net assets, end of period (000 omitted) | $ 571,596 | $ 155,970 | $ 146,665 | $ 133,661 | $ 52,030 |
Portfolio turnover rate | 33% | 82% | 87% | 64% | 101% |
ATotal returns would have been lower had certain expenses not been reduced during the periods shown. BTotal returns do not include the effect of the former sales charges. CCalculated based on average shares outstanding during the period. DExpense ratios reflect operating expenses of the fund. Expenses before reductions do not reflect amounts reimbursed by the investment adviser or reductions from brokerage service arrangements or other expense offset arrangements and do not represent the amount paid by the fund during periods when reimbursements or reductions occur. Expenses net of any voluntary waivers reflect expenses after reimbursement by the investment adviser but prior to reductions from brokerage service arrangements or other expense offset arrangements. Expenses net of all reductions represent the net expenses paid by the fund. EFor the year ended February 29.
See accompanying notes which are an integral part of the financial statements.
Health Care Sector
Pharmaceuticals Portfolio
Performance
Average annual total return reflects the change in the value of an investment, assuming reinvestment of the fund's dividend income and capital gains (the profits earned upon the sale of securities that have grown in value) and assuming a constant rate of performance each year. The $10,000 table and the fund's returns do not reflect the deduction of taxes that a shareholder would pay on fund distributions or the redemption of fund shares. During periods of reimbursement by Fidelity a fund's total returns will be greater than it would be had the reimbursement not occurred. How a fund did yesterday is no guarantee of how it will do tomorrow.
Average Annual Total Returns
Periods ended February 29, 2004 | Past 1
year | Past 5
years | Life of
fundA |
Select Pharmaceuticals | 27.86% | n/a* | -4.02% |
A From June 18, 2001.
* Not available
$10,000 Over Life of Fund
Let's say hypothetically that $10,000 was invested in Fidelity Select Pharmaceuticals Portfolio on June 18, 2001, when the fund started. The chart shows what the value of your investment would have been, and also shows how the S&P 500 Index did over the same period.
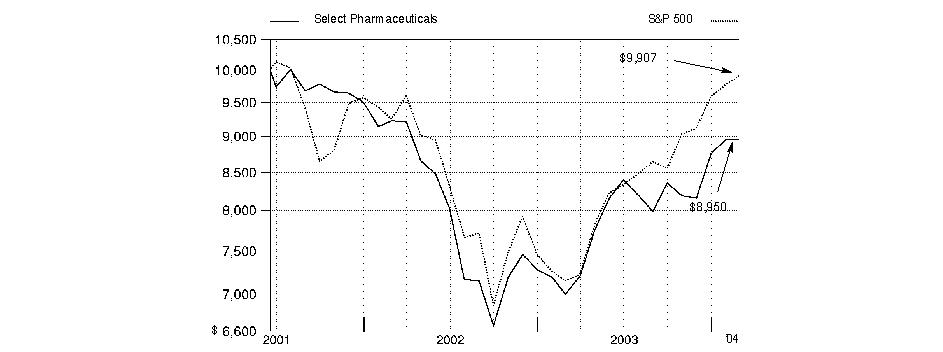
Annual Report
Pharmaceuticals Portfolio
Management's Discussion of Fund Performance
Comments from Gavin Baker, Portfolio Manager of Fidelity® Select Pharmaceuticals Portfolio
From March 2003 through the end of February 2004, domestic stocks recovered dramatically from their prior three-year swoon, driven largely by a broad-based economic and corporate profit recovery. Most major equity benchmarks gained 35% or more during the 12-month period, led by the Russell 2000® Index - a measure of the overall small-cap universe - which advanced 64.41%. As investors grew more confident about the economy's vitality, small-cap stocks were bid up, particularly those with no current earnings. In comparison, the Wilshire 5000® Total Market Index, commonly used as a proxy for the entire U.S. stock market's performance, rose 42.47%. Every sector of the market posted a double-digit advance, with economically sensitive issues - especially technology stocks - leading the way. The tech-heavy NASDAQ Composite® Index returned 52.47% during the past year, despite a negative return in February as investors turned to the more value-oriented segments of the market. The broader Standard & Poor's 500SM Index climbed 38.52% during the year, slightly outperforming the 37.07% increase for the blue-chip Dow Jones Industrial AverageSM.
Fidelity Select Pharmaceuticals Portfolio was up 27.86% during the 12-month period ending February 29, 2004, trailing the 30.76% return for the Goldman Sachs® Health Care Index and the S&P 500® index. The fund trailed its sector benchmark primarily because stocks of pharmaceutical companies didn't generate earnings growth as fast as other industries included in the index, such as medical equipment manufacturers and managed care providers. Similarly drug company stocks trailed the S&P 500 index because the group's earnings didn't increase as significantly as other, more-cyclical industries in the broader market amid the sharply improving economy. The portfolio's biggest detractors were Merck and Schering-Plough, two large holdings that were hurt by disappointing 2003 earnings results. Positions in other large pharmaceutical stocks, including Wyeth and Pfizer, had double-digit gains but didn't keep up with the return of the Goldman Sachs index. On the positive side of the ledger, strong stock selection in the biotechnology sector provided a boost to the fund's absolute and relative results. Specifically, large gains in Sepracor and Esperion Therapeutics helped the fund's biotech holdings collectively outperform those in the sector benchmark. Elsewhere, Swiss pharmaceutical firm Roche - the majority shareholder of Genentech - appreciated sharply, in part due to unexpectedly positive clinical data for Genentech's colorectal cancer treatment, Avastin.
The views expressed in this statement reflect those of the portfolio manager only through the end of the period of the report as stated on the cover and do not necessarily represent the views of Fidelity or any other person in the Fidelity organization. Any such views are subject to change at any time based upon market or other conditions and Fidelity disclaims any responsibility to update such views. These views may not be relied on as investment advice and, because investment decisions for a Fidelity fund are based on numerous factors, may not be relied on as an indication of trading intent on behalf of any Fidelity fund.
Annual Report
Pharmaceuticals Portfolio
Investment Summary
Top Ten Stocks as of February 29, 2004 |
| % of fund's
net assets |
Merck & Co., Inc. | 8.9 |
Schering-Plough Corp. | 7.6 |
Wyeth | 6.8 |
Pfizer, Inc. | 6.8 |
AstraZeneca PLC sponsored ADR | 5.6 |
Roche Holding AG (participation certificate) | 4.1 |
Biovail Corp. | 3.9 |
Altana AG | 3.4 |
Sanofi-Synthelabo SA | 3.3 |
Cardinal Health, Inc. | 3.3 |
| 53.7 |
Top Industries as of February 29, 2004 |
% of fund's net assets |
| Pharmaceuticals | 75.3% | |
| Biotechnology | 12.6% | |
| Health Care Providers & Services | 7.0% | |
| Health Care Equipment & Supplies | 1.9% | |
| Chemicals | 0.0% | |
| All Others * | 3.2% | |

* Includes short-term investments and net other assets. |
Annual Report
Pharmaceuticals Portfolio
Investments February 29, 2004
Showing Percentage of Net Assets
Common Stocks - 96.8% |
| Shares | | Value (Note 1) |
BIOTECHNOLOGY - 12.6% |
Alkermes, Inc. (a) | 104,100 | | $ 1,483,425 |
Cephalon, Inc. (a) | 8,600 | | 510,238 |
CSL Ltd. | 20,562 | | 318,115 |
CV Therapeutics, Inc. (a) | 16,100 | | 253,092 |
Genelabs Technologies, Inc. (a) | 250,800 | | 616,968 |
Genentech, Inc. (a) | 5,800 | | 625,762 |
ImmunoGen, Inc. (a) | 63,100 | | 437,914 |
Introgen Therapeutics, Inc. (a) | 101,000 | | 860,520 |
MedImmune, Inc. (a) | 13,100 | | 336,539 |
Millennium Pharmaceuticals, Inc. (a) | 20,700 | | 368,667 |
Myogen, Inc. | 97,000 | | 1,504,664 |
Neurocrine Biosciences, Inc. (a) | 31,300 | | 1,740,280 |
Protein Design Labs, Inc. (a) | 18,100 | | 434,400 |
QLT, Inc. (a) | 2,690 | | 63,853 |
Seattle Genetics, Inc. (a) | 48,500 | | 477,725 |
Telik, Inc. (a) | 20,700 | | 486,864 |
Vertex Pharmaceuticals, Inc. (a) | 37,700 | | 425,256 |
TOTAL BIOTECHNOLOGY | | 10,944,282 |
CHEMICALS - 0.0% |
Monsanto Co. | 71 | | 2,346 |
HEALTH CARE EQUIPMENT & SUPPLIES - 1.9% |
Advanced Medical Optics, Inc. (a) | 3 | | 69 |
Baxter International, Inc. | 14,800 | | 430,976 |
Illumina, Inc. (a) | 180,600 | | 1,226,274 |
TOTAL HEALTH CARE EQUIPMENT & SUPPLIES | | 1,657,319 |
HEALTH CARE PROVIDERS & SERVICES - 7.0% |
AmerisourceBergen Corp. | 23,900 | | 1,386,917 |
Cardinal Health, Inc. | 43,562 | | 2,841,549 |
HCA, Inc. | 6,500 | | 276,380 |
McKesson Corp. | 25,630 | | 699,955 |
Medco Health Solutions, Inc. (a) | 87 | | 2,841 |
Omnicell, Inc. (a) | 23,400 | | 476,892 |
Priority Healthcare Corp. Class B (a) | 13,600 | | 300,560 |
Tenet Healthcare Corp. (a) | 10,900 | | 131,018 |
TOTAL HEALTH CARE PROVIDERS & SERVICES | | 6,116,112 |
PHARMACEUTICALS - 75.3% |
Allergan, Inc. | 3,450 | | 302,013 |
Alpharma, Inc. Class A | 7,300 | | 156,658 |
Altana AG | 6,370 | | 392,299 |
|
| Shares | | Value (Note 1) |
Altana AG sponsored ADR | 41,800 | | $ 2,583,240 |
AstraZeneca PLC sponsored ADR | 100,330 | | 4,878,045 |
Aventis SA sponsored ADR | 5,540 | | 427,965 |
Barr Pharmaceuticals, Inc. (a) | 5,100 | | 394,791 |
Biovail Corp. (a) | 166,810 | | 3,418,765 |
Bristol-Myers Squibb Co. | 10,240 | | 284,877 |
Chugai Pharmaceutical Co. Ltd. | 17,400 | | 257,251 |
Daiichi Pharmaceutical Co. Ltd. | 11,100 | | 198,846 |
Eisai Co. Ltd. | 9,400 | | 255,779 |
Elan Corp. PLC sponsored ADR (a) | 100,500 | | 1,449,210 |
Forest Laboratories, Inc. (a) | 25,420 | | 1,918,702 |
Fujisawa Pharmaceutical Co. Ltd. | 9,700 | | 233,676 |
GlaxoSmithKline PLC sponsored ADR | 61,100 | | 2,604,082 |
H. Lundbeck AS | 8,880 | | 179,398 |
IVAX Corp. (a) | 3,690 | | 82,139 |
Johnson & Johnson | 40,603 | | 2,188,908 |
King Pharmaceuticals, Inc. (a) | 300 | | 5,781 |
Kyorin Pharmaceutical Co. Ltd. | 9,000 | | 118,607 |
Merck & Co., Inc. | 160,720 | | 7,727,418 |
Merck KGaA | 4,720 | | 209,358 |
Mylan Laboratories, Inc. | 11,547 | | 271,355 |
Novartis AG sponsored ADR | 57,240 | | 2,527,146 |
Novo Nordisk AS: | | | |
ADR | 16,800 | | 786,408 |
Series B | 5,650 | | 263,337 |
Perrigo Co. | 170 | | 3,322 |
Pfizer, Inc. | 161,740 | | 5,927,771 |
Recordati Spa | 6,700 | | 120,698 |
Roche Holding AG (participation certificate) | 34,220 | | 3,551,592 |
Sankyo Co. Ltd. | 15,300 | | 332,075 |
Sanofi-Synthelabo SA | 19,050 | | 1,306,830 |
Sanofi-Synthelabo SA sponsored ADR | 45,800 | | 1,570,940 |
Schering AG | 6,870 | | 344,393 |
Schering-Plough Corp. | 369,590 | | 6,637,836 |
Sepracor, Inc. (a) | 94,100 | | 2,674,322 |
Shionogi & Co. Ltd. | 15,000 | | 264,030 |
Shire Pharmaceuticals Group PLC sponsored ADR (a) | 12,900 | | 398,868 |
Takeda Chemical Industries Ltd. | 32,800 | | 1,354,563 |
Tanabe Seiyaku Co. Ltd. | 17,000 | | 142,908 |
Teva Pharmaceutical Industries Ltd. sponsored ADR | 1,220 | | 79,300 |
Watson Pharmaceuticals, Inc. (a) | 7,600 | | 348,992 |
Wyeth | 150,120 | | 5,929,740 |
Yamanouchi Pharmaceutical Co. Ltd. | 16,300 | | 547,497 |
TOTAL PHARMACEUTICALS | | 65,651,731 |
TOTAL COMMON STOCKS (Cost $82,108,525) | 84,371,790 |
Money Market Funds - 14.6% |
| Shares | | Value (Note 1) |
Fidelity Cash Central Fund, 1.08% (b) | 2,757,643 | | $ 2,757,643 |
Fidelity Securities Lending Cash Central Fund, 1.08% (b) | 9,954,375 | | 9,954,375 |
TOTAL MONEY MARKET FUNDS (Cost $12,712,018) | 12,712,018 |
TOTAL INVESTMENT PORTFOLIO - 111.4% (Cost $94,820,543) | | 97,083,808 |
NET OTHER ASSETS - (11.4)% | | (9,925,537) |
NET ASSETS - 100% | $ 87,158,271 |
Legend |
(a) Non-income producing |
(b) Affiliated fund that is available only to investment companies and other accounts managed by Fidelity Investments. The rate quoted is the annualized seven-day yield of the fund at period end. A complete listing of the fund's holdings as of its most recent fiscal year end is available upon request. |
Other Information |
Purchases and sales of securities, other than short-term securities, aggregated $70,891,836 and $50,021,162, respectively. |
The fund placed a portion of its portfolio transactions with brokerage firms which are affiliates of the investment adviser. The commissions paid to these affiliated firms were $7,571 for the period. |
Distribution of investments by country of issue, as a percentage of total net assets, is as follows: |
United States of America | 64.1% |
United Kingdom | 9.1% |
Switzerland | 7.0% |
Japan | 4.3% |
Germany | 4.0% |
Canada | 4.0% |
France | 3.8% |
Ireland | 1.7% |
Denmark | 1.4% |
Others (individually less than 1%) | 0.6% |
| 100.0% |
Income Tax Information |
At February 29, 2004, the fund had a capital loss carryforward of approximately $5,458,000 all of which will expire on February 28, 2011. |
See accompanying notes which are an integral part of the financial statements.
Health Care Sector
Pharmaceuticals Portfolio
Financial Statements
Statement of Assets and Liabilities
| February 29, 2004 |
| | |
Assets | | |
Investment in securities, at value (including securities loaned of $9,666,586) (cost $94,820,543) - See accompanying schedule | | $ 97,083,808 |
Receivable for fund shares sold | | 249,550 |
Dividends receivable | | 217,800 |
Interest receivable | | 2,463 |
Prepaid expenses | | 312 |
Other affiliated receivables | | 60 |
Other receivables | | 12,458 |
Total assets | | 97,566,451 |
| | |
Liabilities | | |
Payable for fund shares redeemed | $ 348,697 | |
Accrued management fee | 41,945 | |
Other affiliated payables | 36,359 | |
Other payables and accrued expenses | 26,804 | |
Collateral on securities loaned, at value | 9,954,375 | |
Total liabilities | | 10,408,180 |
| | |
Net Assets | | $ 87,158,271 |
Net Assets consist of: | | |
Paid in capital | | $ 91,328,055 |
Accumulated undistributed net realized gain (loss) on investments and foreign currency transactions | | (6,435,803) |
Net unrealized appreciation (depreciation) on investments and assets and liabilities in foreign currencies | | 2,266,019 |
Net Assets, for 9,741,454 shares outstanding | | $ 87,158,271 |
Net Asset Value, offering price and redemption price per share ($87,158,271 ÷ 9,741,454 shares) | | $ 8.95 |
Statement of Operations
| Year ended February 29, 2004 |
| | |
Investment Income | | |
Dividends | | $ 960,894 |
Interest | | 24,679 |
Security lending | | 11,242 |
| | 996,815 |
Less foreign taxes withheld | | (51,981) |
Total income | | 944,834 |
| | |
Expenses | | |
Management fee | $ 374,656 | |
Transfer agent fees | 503,790 | |
Accounting and security lending fees | 57,972 | |
Non-interested trustees' compensation | 269 | |
Custodian fees and expenses | 18,998 | |
Registration fees | 24,926 | |
Audit | 43,996 | |
Legal | 225 | |
Miscellaneous | 741 | |
Total expenses before reductions | 1,025,573 | |
Expense reductions | (13,948) | 1,011,625 |
Net investment income (loss) | | (66,791) |
Realized and Unrealized Gain (Loss) Net realized gain (loss) on: | | |
Investment securities | 6,322,670 | |
Foreign currency transactions | (9,603) | |
Total net realized gain (loss) | | 6,313,067 |
Change in net unrealized appreciation (depreciation) on: Investment securities | 7,644,502 | |
Assets and liabilities in foreign currencies | 1,372 | |
Total change in net unrealized appreciation (depreciation) | | 7,645,874 |
Net gain (loss) | | 13,958,941 |
Net increase (decrease) in net assets resulting from operations | | $ 13,892,150 |
Other Information | | |
Sales charges paid to FDC | | $ 91,693 |
Deferred sales charges withheld by FDC | | $ 199 |
Exchange fees withheld by
FSC | | $ 2,723 |
See accompanying notes which are an integral part of the financial statements.
Annual Report
Pharmaceuticals Portfolio
Financial Statements - continued
Statement of Changes in Net Assets
| Year ended
February 29,
2004 | Year ended
February 28,
2003 |
Increase (Decrease) in Net Assets | | |
Operations | | |
Net investment income (loss) | $ (66,791) | $ (134,947) |
Net realized gain (loss) | 6,313,067 | (12,283,911) |
Change in net unrealized appreciation (depreciation) | 7,645,874 | (2,033,770) |
Net increase (decrease) in net assets resulting from operations | 13,892,150 | (14,452,628) |
Share transactions
Net proceeds from sales of shares | 86,788,515 | 46,046,373 |
Cost of shares redeemed | (64,038,094) | (41,890,825) |
Net increase (decrease) in net assets resulting from share transactions | 22,750,421 | 4,155,548 |
Redemption fees | 59,673 | 46,648 |
Total increase (decrease) in net assets | 36,702,244 | (10,250,432) |
| | |
Net Assets | | |
Beginning of period | 50,456,027 | 60,706,459 |
End of period | $ 87,158,271 | $ 50,456,027 |
Other Information Shares | | |
Sold | 10,314,614 | 6,148,907 |
Redeemed | (7,778,977) | (5,518,360) |
Net increase (decrease) | 2,535,637 | 630,547 |
Financial Highlights
Years ended February 28, | 2004 H | 2003 | 2002 F |
Selected Per-Share Data | | | |
Net asset value, beginning of period | $ 7.00 | $ 9.23 | $ 10.00 |
Income from Investment Operations | | | |
Net investment income (loss) E | (.01) | (.02) | (.03) |
Net realized and unrealized gain (loss) | 1.95 | (2.22) | (.75) |
Total from investment operations | 1.94 | (2.24) | (.78) |
Redemption fees added to paid in capital E | .01 | .01 | .01 |
Net asset value, end of period | $ 8.95 | $ 7.00 | $ 9.23 |
Total Return B, C, D | 27.86% | (24.16)% | (7.70)% |
Ratios to Average Net Assets G | | | |
Expenses before expense reductions | 1.59% | 1.80% | 1.69% A |
Expenses net of voluntary waivers, if any | 1.59% | 1.80% | 1.69% A |
Expenses net of all reductions | 1.57% | 1.74% | 1.68% A |
Net investment income (loss) | (.10)% | (.26)% | (.40)% A |
Supplemental Data | | | |
Net assets, end of period (000 omitted) | $ 87,158 | $ 50,456 | $ 60,706 |
Portfolio turnover rate | 80% | 140% | 26% A |
A Annualized B Total returns for periods of less than one year are not annualized. C Total returns would have been lower had certain expenses not been reduced during the periods shown. D Total returns do not include the effect of the former sales charges. E Calculated based on average shares outstanding during the period. F For the period June 18, 2001 (commencement of operations) to February 28, 2002. G Expense ratios reflect operating expenses of the fund. Expenses before reductions do not reflect amounts reimbursed by the investment adviser or reductions from brokerage service arrangements or other expense offset arrangements and do not represent the amount paid by the fund during periods when reimbursements or reductions occur. Expense ratios before reductions for start-up periods may not be representative of longer-term operating periods. Expenses net of any voluntary waivers reflect expenses after reimbursement by the investment adviser but prior to reductions from brokerage service arrangements or other expense offset arrangements. Expenses net of all reductions represent the net expenses paid by the fund. H For the year ended February 29. |
See accompanying notes which are an integral part of the financial statements.
Health Care Sector
Energy Portfolio
Performance
Average annual total return reflects the change in the value of an investment, assuming reinvestment of the fund's dividend income and capital gains (the profits earned upon the sale of securities that have grown in value) and assuming a constant rate of performance each year. The $10,000 table and the fund's returns do not reflect the deduction of taxes that a shareholder would pay on fund distributions or the redemption of fund shares. During periods of reimbursement by Fidelity a fund's total returns will be greater than it would be had the reimbursement not occurred. How a fund did yesterday is no guarantee of how it will do tomorrow.
Average Annual Total Returns
Periods ended February 29, 2004 | Past 1
year | Past 5
years | Past 10
years |
Select Energy | 29.34% | 14.34% | 10.33% |
$10,000 Over 10 Years
Let's say hypothetically that $10,000 was invested in Fidelity Select Energy Portfolio on February 28, 1994. The chart shows how the value of your investment would have grown, and also shows how the S&P 500 Index did over the same period.
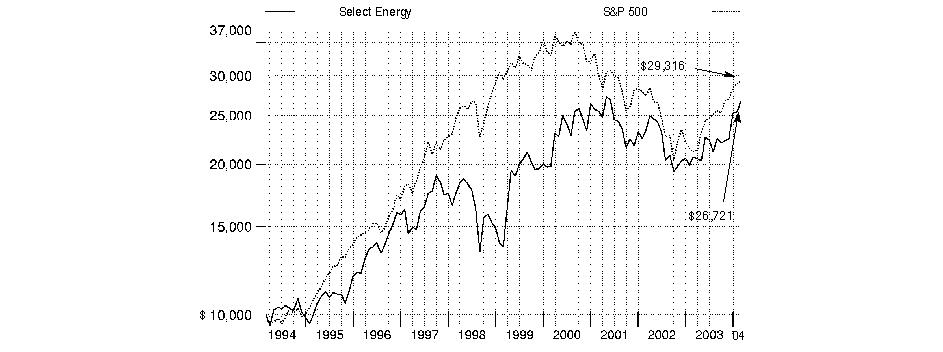
Annual Report
Energy Portfolio
Management's Discussion of Fund Performance
Comments from Pratima Abichandani, Portfolio Manager of Fidelity® Select Energy Portfolio
From March 2003 through the end of February 2004, domestic stocks recovered dramatically from their prior three-year swoon, driven largely by a broad-based economic and corporate profit recovery. Most major equity benchmarks gained 35% or more during the 12-month period, led by the Russell 2000® Index - a measure of the overall small-cap universe - which advanced 64.41%. As investors grew more confident about the economy's vitality, small-cap stocks were bid up, particularly those with no current earnings. In comparison, the Wilshire 5000® Total Market Index, commonly used as a proxy for the entire U.S. stock market's performance, rose 42.47%. Every sector of the market posted a double-digit advance, with economically sensitive issues - especially technology stocks - leading the way. The tech-heavy NASDAQ Composite® Index returned 52.47% during the past year, despite a negative return in February as investors turned to the more value-oriented segments of the market. The broader Standard & Poor's 500SM Index climbed 38.52% during the year, slightly outperforming the 37.07% increase for the blue-chip Dow Jones Industrial AverageSM.
For the 12 months ending February 29, 2004, the fund returned 29.34%, trailing the 40.34% gain for the Goldman Sachs® Natural Resources Index and the S&P 500®. Versus the Goldman Sachs index, the fund was hurt by a minimal exposure to the surging industrial metals group. Given the fund's focus on the energy sector it was precluded from owning metal stocks to any significant degree. Strong performers the fund missed out on or underweighted included aluminum producers Alcoa and Alcan, along with copper stocks Phelps Dodge and Freeport-McMoRan Copper & Gold. Conversely, the fund's performance was helped marginally by overweighting the energy refining and marketing group and by a lack of exposure to the lagging paper industry. Oil services giant Schlumberger topped the list of contributors to absolute performance and also ranked high in relative terms. The company reported fourth-quarter earnings-per-share of 30 cents, compared with a huge loss a year earlier. Shares of the large integrated companies - including ChevronTexaco, BP and ConocoPhillips - were among the fund's largest contributors in absolute terms. Underweighting Royal Dutch Petroleum also was helpful versus the sector benchmark.
The views expressed in this statement reflect those of the portfolio manager only through the end of the period of the report as stated on the cover and do not necessarily represent the views of Fidelity or any other person in the Fidelity organization. Any such views are subject to change at any time based upon market or other conditions and Fidelity disclaims any responsibility to update such views. These views may not be relied on as investment advice and, because investment decisions for a Fidelity fund are based on numerous factors, may not be relied on as an indication of trading intent on behalf of any Fidelity fund.
Annual Report
Energy Portfolio
Investment Summary
Top Ten Stocks as of February 29, 2004 |
| % of fund's
net assets |
BP PLC sponsored ADR | 7.3 |
ChevronTexaco Corp. | 6.6 |
Exxon Mobil Corp. | 6.5 |
Schlumberger Ltd. (NY Shares) | 6.4 |
ConocoPhillips | 6.0 |
Total SA sponsored ADR | 4.7 |
Occidental Petroleum Corp. | 4.6 |
EnCana Corp. | 3.4 |
Apache Corp. | 3.2 |
Burlington Resources, Inc. | 2.9 |
| 51.6 |
Top Industries as of February 29, 2004 |
% of fund's net assets |
| Oil & Gas | 67.1% | |
| Energy Equipment & Services | 26.3% | |
| Multi-Utilities & Unregulated Power | 1.1% | |
| Gas Utilities | 0.7% | |
| Metals & Mining | 0.7% | |
| All Others* | 4.1% | |

* Includes short-term investments and net other assets. |
Annual Report
Energy Portfolio
Investments February 29, 2004
Showing Percentage of Net Assets
Common Stocks - 96.5% |
| Shares | | Value (Note 1) |
ELECTRIC UTILITIES - 0.6% |
Dominion Resources, Inc. | 27,900 | | $ 1,752,957 |
ENERGY EQUIPMENT & SERVICES - 26.3% |
Baker Hughes, Inc. | 177,250 | | 6,668,145 |
BJ Services Co. (a) | 106,500 | | 4,610,385 |
Cal Dive International, Inc. (a) | 12,400 | | 300,700 |
Cooper Cameron Corp. (a) | 11,400 | | 504,108 |
Diamond Offshore Drilling, Inc. | 60,200 | | 1,505,602 |
ENSCO International, Inc. | 153,500 | | 4,508,295 |
GlobalSantaFe Corp. | 135,319 | | 3,991,911 |
Grant Prideco, Inc. (a) | 133,500 | | 2,025,195 |
Grey Wolf, Inc. (a) | 66,900 | | 282,987 |
Halliburton Co. | 60,400 | | 1,930,384 |
Helmerich & Payne, Inc. | 200 | | 5,944 |
Maverick Tube Corp. (a) | 12,100 | | 248,655 |
Nabors Industries Ltd. (a) | 90,700 | | 4,294,645 |
National-Oilwell, Inc. (a) | 75,900 | | 2,254,989 |
Noble Corp. (a) | 44,900 | | 1,822,940 |
Precision Drilling Corp. (a) | 31,300 | | 1,502,363 |
Pride International, Inc. (a) | 86,600 | | 1,484,324 |
Rowan Companies, Inc. (a) | 92,700 | | 2,178,450 |
Schlumberger Ltd. (NY Shares) | 284,780 | | 18,365,462 |
Smith International, Inc. (a) | 134,900 | | 6,835,383 |
Tidewater, Inc. | 16,600 | | 551,618 |
Transocean, Inc. (a) | 38,600 | | 1,137,928 |
Varco International, Inc. (a) | 83,500 | | 1,663,320 |
Weatherford International Ltd. (a) | 140,025 | | 6,273,120 |
Willbros Group, Inc. (a) | 38,600 | | 598,300 |
TOTAL ENERGY EQUIPMENT & SERVICES | | 75,545,153 |
GAS UTILITIES - 0.7% |
Kinder Morgan, Inc. | 33,600 | | 2,073,456 |
METALS & MINING - 0.7% |
Alcan, Inc. | 4,600 | | 217,591 |
Anglo American PLC ADR | 9,000 | | 227,430 |
Apex Silver Mines Ltd. (a) | 13,700 | | 299,071 |
Inco Ltd. (a) | 6,100 | | 226,195 |
Inmet Mining Corp. (a) | 23,400 | | 354,824 |
Kinross Gold Corp. (a) | 23,800 | | 158,791 |
Meridian Gold, Inc. (a) | 15,700 | | 198,800 |
Nucor Corp. | 3,300 | | 207,570 |
TOTAL METALS & MINING | | 1,890,272 |
MULTI-UTILITIES & UNREGULATED POWER - 1.1% |
AES Corp. (a) | 353,600 | | 3,203,616 |
OIL & GAS - 67.1% |
Anadarko Petroleum Corp. | 69,700 | | 3,572,125 |
Apache Corp. | 222,850 | | 9,174,735 |
BP PLC sponsored ADR | 423,700 | | 20,846,039 |
Burlington Resources, Inc. | 143,600 | | 8,406,344 |
Chesapeake Energy Corp. | 179,600 | | 2,302,472 |
|
| Shares | | Value (Note 1) |
ChevronTexaco Corp. | 212,616 | | $ 18,784,624 |
ConocoPhillips | 249,686 | | 17,195,875 |
Cross Timbers Royalty Trust | 479 | | 12,837 |
Devon Energy Corp. | 147,487 | | 8,374,312 |
EnCana Corp. | 223,988 | | 9,701,199 |
EOG Resources, Inc. | 96,900 | | 4,311,081 |
Exxon Mobil Corp. | 442,410 | | 18,656,430 |
Murphy Oil Corp. | 17,300 | | 1,085,229 |
Noble Energy, Inc. | 13,200 | | 617,496 |
Occidental Petroleum Corp. | 300,300 | | 13,333,320 |
Petro-Canada | 142,600 | | 6,440,999 |
Pioneer Natural Resources Co. (a) | 109,000 | | 3,501,080 |
Pogo Producing Co. | 29,600 | | 1,342,952 |
Premcor, Inc. (a) | 44,700 | | 1,405,815 |
Repsol YPF SA sponsored ADR | 41,300 | | 850,367 |
Royal Dutch Petroleum Co. (NY Shares) | 114,700 | | 5,687,973 |
Sibneft sponsored ADR | 63,600 | | 2,181,480 |
Southwestern Energy Co. (a) | 20,500 | | 460,430 |
Sunoco, Inc. | 85,500 | | 5,258,250 |
Talisman Energy, Inc. | 118,300 | | 6,914,010 |
Tom Brown, Inc. (a) | 14,800 | | 520,516 |
Total SA sponsored ADR | 146,300 | | 13,458,137 |
Valero Energy Corp. | 79,600 | | 4,776,000 |
XTO Energy, Inc. | 68,866 | | 2,054,961 |
YUKOS Corp. sponsored ADR | 21,556 | | 1,092,889 |
TOTAL OIL & GAS | | 192,319,977 |
TOTAL COMMON STOCKS (Cost $225,630,083) | 276,785,431 |
Money Market Funds - 6.3% |
| | | |
Fidelity Cash Central Fund, 1.08% (b) | 7,970,705 | | 7,970,705 |
Fidelity Securities Lending Cash Central Fund, 1.08% (b) | 10,122,675 | | 10,122,675 |
TOTAL MONEY MARKET FUNDS (Cost $18,093,380) | 18,093,380 |
TOTAL INVESTMENT PORTFOLIO - 102.8% (Cost $243,723,463) | 294,878,811 |
NET OTHER ASSETS - (2.8)% | (8,031,860) |
NET ASSETS - 100% | $ 286,846,951 |
Legend |
(a) Non-income producing |
(b) Affiliated fund that is available only to investment companies and other accounts managed by Fidelity Investments. The rate quoted is the annualized seven-day yield of the fund at period end. A complete listing of the fund's holdings as of its most recent fiscal year end is available upon request. |
Other Information |
Purchases and sales of securities, other than short-term securities, aggregated $101,874,743 and $66,056,834, respectively. |
The fund placed a portion of its portfolio transactions with brokerage firms which are affiliates of the investment adviser. The commissions paid to these affiliated firms were $1,087 for the period. |
Distribution of investments by country of issue, as a percentage of total net assets, is as follows: |
United States of America | 66.8% |
Canada | 8.9% |
United Kingdom | 7.4% |
Netherlands Antilles | 6.4% |
France | 4.7% |
Cayman Islands | 2.1% |
Netherlands | 2.0% |
Russia | 1.2% |
Others (individually less than 1%) | 0.5% |
| 100.0% |
Income Tax Information |
At February 29, 2004, the fund had a capital loss carryforward of approximately $16,411,000 of which $9,287,000, $6,764,000 and $360,000 will expire on February 28, 2010, 2011 and February 29, 2012, respectively. |
See accompanying notes which are an integral part of the financial statements.
Natural Resources Sector
Energy Portfolio
Financial Statements
Statement of Assets and Liabilities
| February 29, 2004 |
| | |
Assets | | |
Investment in securities, at value (including securities loaned of $9,899,040) (cost $243,723,463) - See accompanying schedule | | $ 294,878,811 |
Receivable for fund shares sold | | 2,010,654 |
Dividends receivable | | 723,654 |
Interest receivable | | 6,801 |
Prepaid expenses | | 900 |
Other receivables | | 14,988 |
Total assets | | 297,635,808 |
| | |
Liabilities | | |
Payable for fund shares redeemed | $ 417,021 | |
Accrued management fee | 133,084 | |
Other affiliated payables | 86,947 | |
Other payables and accrued expenses | 29,130 | |
Collateral on securities loaned, at value | 10,122,675 | |
Total liabilities | | 10,788,857 |
| | |
Net Assets | | $ 286,846,951 |
Net Assets consist of: | | |
Paid in capital | | $ 254,600,841 |
Undistributed net investment income | | 205,583 |
Accumulated undistributed net realized gain (loss) on investments and foreign currency transactions | | (19,114,816) |
Net unrealized appreciation (depreciation) on investments and assets and liabilities in foreign currencies | | 51,155,343 |
Net Assets, for 10,816,545 shares outstanding | | $ 286,846,951 |
Net Asset Value, offering price and redemption price per share ($286,846,951 ÷ 10,816,545 shares) | | $ 26.52 |
Statement of Operations
| Year ended February 29, 2004 |
| | |
Investment Income | | |
Dividends | | $ 3,535,605 |
Interest | | 63,798 |
Security lending | | 16,953 |
Total income | | 3,616,356 |
| | |
Expenses | | |
Management fee | $ 1,194,847 | |
Transfer agent fees | 1,007,403 | |
Accounting and security lending fees | 128,398 | |
Non-interested trustees' compensation | 1,042 | |
Custodian fees and expenses | 16,314 | |
Registration fees | 29,440 | |
Audit | 44,622 | |
Legal | 764 | |
Miscellaneous | 5,341 | |
Total expenses before reductions | 2,428,171 | |
Expense reductions | (31,161) | 2,397,010 |
Net investment income (loss) | | 1,219,346 |
Realized and Unrealized Gain (Loss) Net realized gain (loss) on: | | |
Investment securities | 6,312,719 | |
Foreign currency transactions | (2,329) | |
Total net realized gain (loss) | | 6,310,390 |
Change in net unrealized appreciation (depreciation) on: Investment securities | 47,950,532 | |
Assets and liabilities in foreign currencies | (48) | |
Total change in net unrealized appreciation (depreciation) | | 47,950,484 |
Net gain (loss) | | 54,260,874 |
Net increase (decrease) in net assets resulting from operations | | $ 55,480,220 |
Other Information | | |
Sales charges paid to FDC | | $ 91,621 |
Deferred sales charges withheld by FDC | | $ 7,725 |
Exchange fees withheld by
FSC | | $ 4,958 |
See accompanying notes which are an integral part of the financial statements.
Annual Report
Energy Portfolio
Financial Statements - continued
Statement of Changes in Net Assets
| Year ended
February 29, 2004 | Year ended
February 28, 2003 |
Increase (Decrease) in Net Assets | | |
Operations | | |
Net investment income (loss) | $ 1,219,346 | $ 1,115,572 |
Net realized gain (loss) | 6,310,390 | (7,649,511) |
Change in net unrealized appreciation (depreciation) | 47,950,484 | (20,417,132) |
Net increase (decrease) in net assets resulting from operations | 55,480,220 | (26,951,071) |
Distributions to shareholders from net investment income | (1,208,061) | (1,333,657) |
Share transactions
Net proceeds from sales of shares | 134,875,792 | 100,907,114 |
Reinvestment of distributions | 1,108,208 | 1,229,797 |
Cost of shares redeemed | (97,775,670) | (104,199,460) |
Net increase (decrease) in net assets resulting from share transactions | 38,208,330 | (2,062,549) |
Redemption fees | 72,637 | 70,928 |
Total increase (decrease) in net assets | 92,553,126 | (30,276,349) |
| | |
Net Assets | | |
Beginning of period | 194,293,825 | 224,570,174 |
End of period (including undistributed net investment income of $205,583 and undistributed net investment income of $196,626, respectively) | $ 286,846,951 | $ 194,293,825 |
Other Information Shares | | |
Sold | 5,652,220 | 4,609,528 |
Issued in reinvestment of distributions | 48,440 | 55,847 |
Redeemed | (4,301,278) | (4,824,282) |
Net increase (decrease) | 1,399,382 | (158,907) |
Financial Highlights
Years ended February 28, | 2004 E | 2003 | 2002 | 2001 | 2000 E |
Selected Per-Share Data | | | | | |
Net asset value, beginning of period | $ 20.63 | $ 23.45 | $ 26.41 | $ 23.11 | $ 16.23 |
Income from Investment Operations | | | | | |
Net investment income (loss) C | .13 | .12 | .19 | .19 | .10 |
Net realized and unrealized gain (loss) | 5.89 | (2.81) | (2.44) | 6.17 | 7.11 |
Total from investment operations | 6.02 | (2.69) | (2.25) | 6.36 | 7.21 |
Distributions from net investment income | (.14) | (.14) | (.04) | (.14) | (.09) |
Distributions from net realized gain | - | - | (.69) | (2.97) | (.29) |
Total distributions | (.14) | (.14) | (.73) | (3.11) | (.38) |
Redemption fees added to paid in capital C | .01 | .01 | .02 | .05 | .05 |
Net asset value, end of period | $ 26.52 | $ 20.63 | $ 23.45 | $ 26.41 | $ 23.11 |
Total Return A,B | 29.34% | (11.46)% | (8.57)% | 28.84% | 44.89% |
Ratios to Average Net Assets D | | | | | |
Expenses before expense reductions | 1.18% | 1.22% | 1.16% | 1.16% | 1.29% |
Expenses net of voluntary waivers, if any | 1.18% | 1.22% | 1.16% | 1.16% | 1.29% |
Expenses net of all reductions | 1.17% | 1.21% | 1.12% | 1.12% | 1.25% |
Net investment income (loss) | .59% | .54% | .77% | .69% | .45% |
Supplemental Data | | | | | |
Net assets, end of period (000 omitted) | $ 286,847 | $ 194,294 | $ 224,570 | $ 262,013 | $ 175,672 |
Portfolio turnover rate | 33% | 73% | 119% | 117% | 124% |
ATotal returns would have been lower had certain expenses not been reduced during the periods shown. BTotal returns do not include the effect of the former sales charges. CCalculated based on average shares outstanding during the period. DExpense ratios reflect operating expenses of the fund. Expenses before reductions do not reflect amounts reimbursed by the investment adviser or reductions from brokerage service arrangements or other expense offset arrangements and do not represent the amount paid by the fund during periods when reimbursements or reductions occur. Expenses net of any voluntary waivers reflect expenses after reimbursement by the investment adviser but prior to reductions from brokerage service arrangements or other expense offset arrangements. Expenses net of all reductions represent the net expenses paid by the fund. EFor the year ended February 29.
See accompanying notes which are an integral part of the financial statements.
Natural Resources Sector
Energy Service Portfolio
Performance
Average annual total return reflects the change in the value of an investment, assuming reinvestment of the fund's dividend income and capital gains (the profits earned upon the sale of securities that have grown in value) and assuming a constant rate of performance each year. The $10,000 table and the fund's returns do not reflect the deduction of taxes that a shareholder would pay on fund distributions or the redemption of fund shares. During periods of reimbursement by Fidelity a fund's total returns will be greater than it would be had the reimbursement not occurred. How a fund did yesterday is no guarantee of how it will do tomorrow.
Average Annual Total Returns
Periods ended February 29, 2004 | Past 1
year | Past 5
years | Past 10
years |
Select Energy Service | 19.91% | 22.19% | 14.74% |
$10,000 Over 10 Years
Let's say hypothetically that $10,000 was invested in Fidelity Select Energy Service Portfolio on February 28, 1994. The chart shows how the value of your investment would have grown, and also shows how the S&P 500 Index did over the same period.
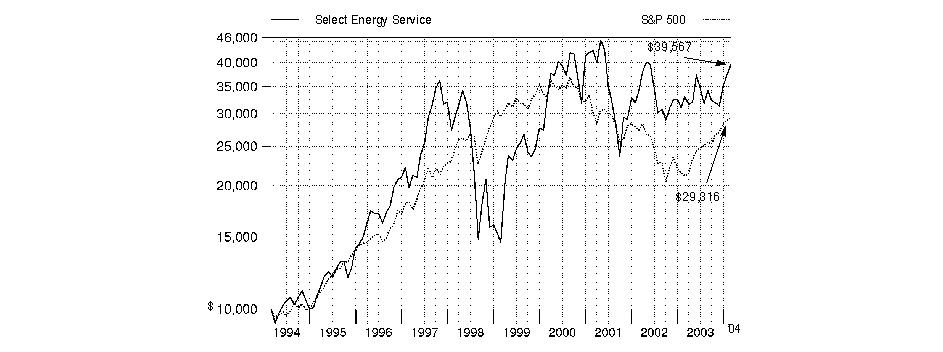
Annual Report
Energy Service Portfolio
Management's Discussion of Fund Performance
Comments from Charles Hebard, Portfolio Manager of Fidelity® Select Energy Service Portfolio
From March 2003 through the end of February 2004, domestic stocks recovered dramatically from their prior three-year swoon, driven largely by a broad-based economic and corporate profit recovery. Most major equity benchmarks gained 35% or more during the 12-month period, led by the Russell 2000® Index - a measure of the overall small-cap universe - which advanced 64.41%. As investors grew more confident about the economy's vitality, small-cap stocks were bid up, particularly those with no current earnings. In comparison, the Wilshire 5000® Total Market Index, commonly used as a proxy for the entire U.S. stock market's performance, rose 42.47%. Every sector of the market posted a double-digit advance, with economically sensitive issues - especially technology stocks - leading the way. The tech-heavy NASDAQ Composite® Index returned 52.47% during the past year, despite a negative return in February as investors turned to the more value-oriented segments of the market. The broader Standard & Poor's 500SM Index climbed 38.52% during the year, slightly outperforming the 37.07% increase for the blue-chip Dow Jones Industrial AverageSM.
For the 12-month period ending February 29, 2004, the fund returned 19.91%, underperforming both the Goldman Sachs® Natural Resources Index, which climbed 40.34%, and the S&P 500®. The fund's underperformance relative to the Goldman Sachs index was primarily due to not investing in stronger-performing groups within the index, such as precious metals and minerals and mining stocks. The fund continued to focus on select mid-cap energy services companies. It also maintained a significant weighting in drilling contractors with exposure to the shallow-water Gulf of Mexico drilling market. Both strategies generally helped performance. Smith International, a well-managed, high-quality producer of drill bits, benefited from increased demand for its products and modest pricing gains, helping its stock price. BJ Services, an oilfield services provider, benefited from growth in U.S. drilling activity and modest pricing improvement. On the downside, drilling systems manufacturer Cooper Cameron was hurt by an earnings shortfall in late 2003, while land driller Grey Wolf trailed its competitors due to its concentration in the Gulf Coast region, where the rig count increased at a slower pace than in other areas of the United States.
The views expressed in this statement reflect those of the portfolio manager only through the end of the period of the report as stated on the cover and do not necessarily represent the views of Fidelity or any other person in the Fidelity organization. Any such views are subject to change at any time based upon market or other conditions and Fidelity disclaims any responsibility to update such views. These views may not be relied on as investment advice and, because investment decisions for a Fidelity fund are based on numerous factors, may not be relied on as an indication of trading intent on behalf of any Fidelity fund.
Annual Report
Energy Service Portfolio
Investment Summary
Top Ten Stocks as of February 29, 2004 |
| % of fund's
net assets |
Smith International, Inc. | 7.5 |
Weatherford International Ltd. | 7.3 |
BJ Services Co. | 6.0 |
Nabors Industries Ltd. | 5.8 |
Pride International, Inc. | 5.5 |
Transocean, Inc. | 5.1 |
Noble Corp. | 4.9 |
Halliburton Co. | 4.9 |
GlobalSantaFe Corp. | 4.8 |
Rowan Companies, Inc. | 4.7 |
| 56.5 |
Top Industries as of February 29, 2004 |
% of fund's net assets |
| Energy Equipment & Services | 97.2% | |
| All Others* | 2.8% | |

* Includes short-term investments and net other assets. |
Annual Report
Energy Service Portfolio
Investments February 29, 2004
Showing Percentage of Net Assets
Common Stocks - 97.2% |
| Shares | | Value (Note 1) |
ENERGY EQUIPMENT & SERVICES - 97.2% |
Baker Hughes, Inc. | 470,436 | | $ 17,697,802 |
BJ Services Co. (a) | 637,858 | | 27,612,873 |
Cal Dive International, Inc. (a) | 74,700 | | 1,811,475 |
Carbo Ceramics, Inc. | 27,700 | | 1,691,639 |
Cooper Cameron Corp. (a) | 274,276 | | 12,128,485 |
Diamond Offshore Drilling, Inc. | 555,200 | | 13,885,552 |
Dril-Quip, Inc. (a) | 91,000 | | 1,638,000 |
ENSCO International, Inc. | 712,000 | | 20,911,440 |
FMC Technologies, Inc. (a) | 173,800 | | 4,570,940 |
Global Industries Ltd. (a) | 341,500 | | 1,727,990 |
GlobalSantaFe Corp. | 756,510 | | 22,317,045 |
Grant Prideco, Inc. (a) | 1,196,105 | | 18,144,913 |
Grey Wolf, Inc. (a) | 634,300 | | 2,683,089 |
Halliburton Co. | 709,667 | | 22,680,957 |
Helmerich & Payne, Inc. | 274,500 | | 8,158,140 |
Hydril Co. (a) | 89,100 | | 2,361,150 |
Key Energy Services, Inc. (a) | 175,300 | | 2,370,056 |
Maverick Tube Corp. (a) | 180,500 | | 3,709,275 |
Nabors Industries Ltd. (a) | 566,677 | | 26,832,156 |
National-Oilwell, Inc. (a) | 524,000 | | 15,568,040 |
Newpark Resources, Inc. (a) | 326,000 | | 1,646,300 |
Noble Corp. (a) | 558,950 | | 22,693,370 |
Oceaneering International, Inc. (a) | 158,900 | | 5,431,202 |
Offshore Logistics, Inc. (a) | 97,600 | | 2,243,824 |
Patterson-UTI Energy, Inc. (a) | 221,200 | | 8,025,136 |
Precision Drilling Corp. (a) | 18,900 | | 907,177 |
Pride International, Inc. (a) | 1,487,086 | | 25,488,654 |
Rowan Companies, Inc. (a) | 937,200 | | 22,024,200 |
Schlumberger Ltd. (NY Shares) | 262,145 | | 16,905,731 |
Smith International, Inc. (a) | 684,028 | | 34,659,699 |
Superior Energy Services, Inc. (a) | 319,700 | | 3,046,741 |
Tidewater, Inc. | 61,400 | | 2,040,322 |
Transocean, Inc. (a) | 802,927 | | 23,670,288 |
Unit Corp. (a) | 114,600 | | 3,046,068 |
Universal Compression Holdings, Inc. (a) | 65,900 | | 2,051,467 |
Varco International, Inc. (a) | 588,098 | | 11,714,912 |
W-H Energy Services, Inc. (a) | 142,400 | | 2,370,960 |
Weatherford International Ltd. (a) | 759,905 | | 34,043,744 |
TOTAL COMMON STOCKS (Cost $362,582,228) | 450,510,812 |
Money Market Funds - 15.3% |
| Shares | | Value (Note 1) |
Fidelity Cash Central Fund, 1.08% (b) | 23,981,189 | | $ 23,981,189 |
Fidelity Securities Lending Cash Central Fund, 1.08% (b) | 46,959,625 | | 46,959,625 |
TOTAL MONEY MARKET FUNDS (Cost $70,940,814) | 70,940,814 |
TOTAL INVESTMENT PORTFOLIO - 112.5% (Cost $433,523,042) | 521,451,626 |
NET OTHER ASSETS - (12.5)% | (58,068,121) |
NET ASSETS - 100% | $ 463,383,505 |
Legend |
(a) Non-income producing |
(b) Affiliated fund that is available only to investment companies and other accounts managed by Fidelity Investments. The rate quoted is the annualized seven-day yield of the fund at period end. A complete listing of the fund's holdings as of its most recent fiscal year end is available upon request. |
Other Information |
Purchases and sales of securities, other than short-term securities, aggregated $94,037,641 and $156,495,568, respectively. |
The fund placed a portion of its portfolio transactions with brokerage firms which are affiliates of the investment adviser. The commissions paid to these affiliated firms were $2,752 for the period. |
Distribution of investments by country of issue, as a percentage of total net assets, is as follows: |
United States of America | 86.5% |
Cayman Islands | 9.7% |
Netherlands Antilles | 3.6% |
Others (individually less than 1%) | 0.2% |
| 100.0% |
Income Tax Information |
At February 29, 2004, the fund had a capital loss carryforward of approximately $53,712,000 of which $30,612,000 and $23,100,000 will expire on February 29, 2008 and February 28, 2010, respectively. |
See accompanying notes which are an integral part of the financial statements.
Annual Report
Energy Service Portfolio
Financial Statements
Statement of Assets and Liabilities
| February 29, 2004 |
| | |
Assets | | |
Investment in securities, at value (including securities loaned of $45,882,696) (cost $433,523,042) - See accompanying schedule | | $ 521,451,626 |
Receivable for fund shares sold | | 4,987,027 |
Dividends receivable | | 122,048 |
Interest receivable | | 19,661 |
Prepaid expenses | | 1,894 |
Other affiliated receivables | | 860 |
Other receivables | | 27,262 |
Total assets | | 526,610,378 |
| | |
Liabilities | | |
Payable for investments purchased | $ 14,950,146 | |
Payable for fund shares redeemed | 957,346 | |
Accrued management fee | 206,245 | |
Other affiliated payables | 125,544 | |
Other payables and accrued expenses | 27,967 | |
Collateral on securities loaned, at value | 46,959,625 | |
Total liabilities | | 63,226,873 |
| | |
Net Assets | | $ 463,383,505 |
Net Assets consist of: | | |
Paid in capital | | $ 431,684,519 |
Accumulated undistributed net realized gain (loss) on investments and foreign currency transactions | | (56,229,598) |
Net unrealized appreciation (depreciation) on investments | | 87,928,584 |
Net Assets, for 12,997,072 shares outstanding | | $ 463,383,505 |
Net Asset Value, offering price and redemption price per share ($463,383,505 ÷ 12,997,072 shares) | | $ 35.65 |
Statement of Operations
| Year ended February 29, 2004 |
| | |
Investment Income | | |
Dividends | | $ 1,222,825 |
Interest | | 54,602 |
Security lending | | 110,203 |
Total income | | 1,387,630 |
| | |
Expenses | | |
Management fee | $ 2,344,888 | |
Transfer agent fees | 1,902,407 | |
Accounting and security lending fees | 260,492 | |
Non-interested trustees' compensation | 2,102 | |
Custodian fees and expenses | 20,842 | |
Registration fees | 29,578 | |
Audit | 45,572 | |
Legal | 1,683 | |
Miscellaneous | 11,968 | |
Total expenses before reductions | 4,619,532 | |
Expense reductions | (36,760) | 4,582,772 |
Net investment income (loss) | | (3,195,142) |
Realized and Unrealized Gain (Loss) Net realized gain (loss) on: | | |
Investment securities | 44,401,754 | |
Foreign currency transactions | 815 | |
Total net realized gain (loss) | | 44,402,569 |
Change in net unrealized appreciation (depreciation) on: Investment securities | 23,402,132 | |
Assets and liabilities in foreign currencies | (332) | |
Total change in net unrealized appreciation (depreciation) | | 23,401,800 |
Net gain (loss) | | 67,804,369 |
Net increase (decrease) in net assets resulting from operations | | $ 64,609,227 |
Other Information | | |
Sales charges paid to FDC | | $ 171,026 |
Deferred sales charges withheld by FDC | | $ 7,169 |
Exchange fees withheld by
FSC | | $ 19,050 |
See accompanying notes which are an integral part of the financial statements.
Annual Report
Energy Service Portfolio
Financial Statements - continued
Statement of Changes in Net Assets
| Year ended
February 29,
2004 | Year ended
February 28,
2003 |
Increase (Decrease) in Net Assets | | |
Operations | | |
Net investment income (loss) | $ (3,195,142) | $ (3,498,908) |
Net realized gain (loss) | 44,402,569 | 30,955,133 |
Change in net unrealized appreciation (depreciation) | 23,401,800 | (49,478,650) |
Net increase (decrease) in net assets resulting from operations | 64,609,227 | (22,022,425) |
Share transactions
Net proceeds from sales of shares | 265,018,395 | 431,544,308 |
Cost of shares redeemed | (321,678,674) | (481,148,597) |
Net increase (decrease) in net assets resulting from share transactions | (56,660,279) | (49,604,289) |
Redemption fees | 312,779 | 610,073 |
Total increase (decrease) in net assets | 8,261,727 | (71,016,641) |
| | |
Net Assets | | |
Beginning of period | 455,121,778 | 526,138,419 |
End of period | $ 463,383,505 | $ 455,121,778 |
Other Information Shares | | |
Sold | 8,283,079 | 13,612,910 |
Redeemed | (10,594,661) | (15,414,158) |
Net increase (decrease) | (2,311,582) | (1,801,248) |
Financial Highlights
Years ended February 28, | 2004 F | 2003 | 2002 | 2001 | 2000 F |
Selected Per-Share Data | | | | | |
Net asset value, beginning of period | $ 29.73 | $ 30.75 | $ 38.51 | $ 28.96 | $ 13.09 |
Income from Investment Operations | | | | | |
Net investment income (loss) C | (.24) | (.21) D | (.14) | (.14) | (.09) |
Net realized and unrealized gain (loss) | 6.14 | (.85) | (7.71) | 9.57 | 15.86 |
Total from investment operations | 5.90 | (1.06) | (7.85) | 9.43 | 15.77 |
Redemption fees added to paid in capital C | .02 | .04 | .09 | .12 | .10 |
Net asset value, end of period | $ 35.65 | $ 29.73 | $ 30.75 | $ 38.51 | $ 28.96 |
Total ReturnA,B | 19.91% | (3.32)% | (20.15)% | 32.98% | 121.24% |
Ratios to Average Net Assets E | | | | | |
Expenses before expense reductions | 1.14% | 1.15% | 1.13% | 1.07% | 1.23% |
Expenses net of voluntary waivers, if any | 1.14% | 1.15% | 1.13% | 1.07% | 1.23% |
Expenses net of all reductions | 1.13% | 1.12% | 1.07% | 1.04% | 1.20% |
Net investment income (loss) | (.79)% | (.68)% | (.46)% | (.40)% | (.40)% |
Supplemental Data | | | | | |
Net assets, end of period (000 omitted) | $ 463,384 | $ 455,122 | $ 526,138 | $ 899,651 | $ 631,886 |
Portfolio turnover rate | 23% | 64% | 90% | 78% | 69% |
A Total returns would have been lower had certain expenses not been reduced during the periods shown. B Total returns do not include the effect of the former sales charges. C Calculated based on average shares outstanding during the period. D Investment income per share reflects a special dividend which amounted to $.01 per share. E Expense ratios reflect operating expenses of the fund. Expenses before reductions do not reflect amounts reimbursed by the investment adviser or reductions from brokerage service arrangements or other expense offset arrangements and do not represent the amount paid by the fund during periods when reimbursements or reductions occur. Expenses net of any voluntary waivers reflect expenses after reimbursement by the investment adviser but prior to reductions from brokerage service arrangements or other expense offset arrangements. Expenses net of all reductions represent the net expenses paid by the fund. F For the year ended February 29. |
See accompanying notes which are an integral part of the financial statements.
Natural Resources Sector
Gold Portfolio
Performance
Average annual total return reflects the change in the value of an investment, assuming reinvestment of the fund's dividend income and capital gains (the profits earned upon the sale of securities that have grown in value) and assuming a constant rate of performance each year. The $10,000 table and the fund's returns do not reflect the deduction of taxes that a shareholder would pay on fund distributions or the redemption of fund shares. During periods of reimbursement by Fidelity a fund's total returns will be greater than it would be had the reimbursement not occurred. How a fund did yesterday is no guarantee of how it will do tomorrow.
Average Annual Total Returns
Periods ended February 29, 2004 | Past 1
year | Past 5
years | Past 10
years |
Select Gold | 26.79% | 18.56% | 3.61% |
$10,000 Over 10 Years
Let's say hypothetically that $10,000 was invested in Fidelity Select Gold Portfolio on February 28, 1994. The chart shows how the value of your investment would have grown, and also shows how the S&P 500 Index did over the same period.
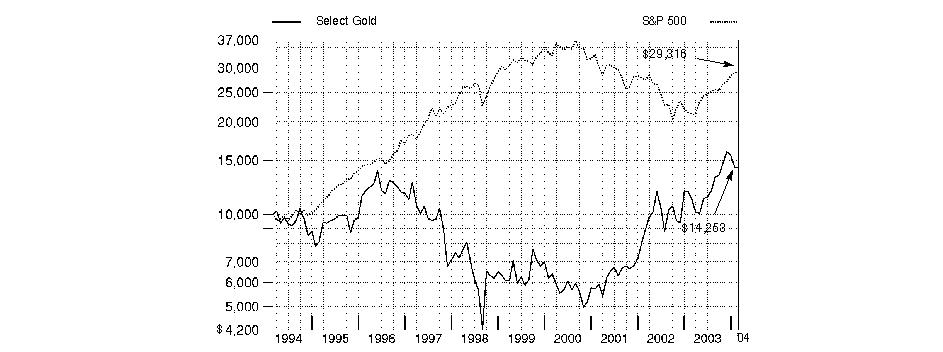
Annual Report
Gold Portfolio
Management's Discussion of Fund Performance
Comments from Dan Dupont, Portfolio Manager of Fidelity® Select Gold Portfolio
From March 2003 through the end of February 2004, domestic stocks recovered dramatically from their prior three-year swoon, driven largely by a broad-based economic and corporate profit recovery. Most major equity benchmarks gained 35% or more during the 12-month period, led by the Russell 2000® Index - a measure of the overall small-cap universe - which advanced 64.41%. As investors grew more confident about the economy's vitality, small-cap stocks were bid up, particularly those with no current earnings. In comparison, the Wilshire 5000® Total Market Index, commonly used as a proxy for the entire U.S. stock market's performance, rose 42.47%. Every sector of the market posted a double-digit advance, with economically sensitive issues - especially technology stocks - leading the way. The tech-heavy NASDAQ Composite® Index returned 52.47% during the past year, despite a negative return in February as investors turned to the more value-oriented segments of the market. The broader Standard & Poor's 500SM Index climbed 38.52% during the year, slightly outperforming the 37.07% increase for the blue-chip Dow Jones Industrial AverageSM.
For the 12 months ending February 29, 2004, the fund returned 26.79%, underperforming the 40.34% return for the Goldman Sachs® Natural Resources Index and the S&P 500®. The Goldman Sachs index benefited much more than the fund did from extraordinary strength in industrial metals. In comparison, gold's advance from approximately $350 per ounce to roughly $380 an ounce was less exciting. In large part, gold's strength was a reflection of the U.S. dollar's weakness. Freeport-McMoRan Copper & Gold was the fund's biggest contributor. Surging copper prices and better-than-expected performance at its Indonesia-based Grasburg mine aided the company's shares. Also performing well was Buenaventura, which owns almost half of the Yanacocha mine in Peru - one of the largest gold mines in the world. Australia-based Newcrest Mining was another contributor. The company started a new mine that performed impressively. Conversely, the fund's returns were hurt by Kinross Gold, which was sidetracked in part by disappointing results at a mine that was subsequently shut down. Meridian Gold also hurt performance. One of the company's developing projects in Argentina was strongly opposed by the local community. I trimmed both positions during the period. On the other hand, I held on to Agnico-Eagle, which struggled because of a collapse at the company's LaRonde mine.
The views expressed in this statement reflect those of the portfolio manager only through the end of the period of the report as stated on the cover and do not necessarily represent the views of Fidelity or any other person in the Fidelity organization. Any such views are subject to change at any time based upon market or other conditions and Fidelity disclaims any responsibility to update such views. These views may not be relied on as investment advice and, because investment decisions for a Fidelity fund are based on numerous factors, may not be relied on as an indication of trading intent on behalf of any Fidelity fund.
Annual Report
Gold Portfolio
Investment Summary
Top Ten Stocks as of February 29, 2004 |
| % of fund's
net assets |
Meridian Gold, Inc. | 7.7 |
Goldcorp, Inc. | 7.2 |
Kinross Gold Corp. | 7.1 |
Agnico-Eagle Mines Ltd. | 6.9 |
Wheaton River Minerals Ltd. | 6.8 |
Compania de Minas Buenaventura SA sponsored ADR | 4.6 |
Newmont Mining Corp. | 4.6 |
Gold Fields Ltd. | 4.3 |
Newcrest Mining Ltd. | 4.2 |
Lonmin PLC | 4.0 |
| 57.4 |
Top Industries as of February 29, 2004 |
% of fund's net assets |
| Gold | 71.6% | |
| Precious Metals & Minerals | 22.7% | |
 | Diversified Metals & Mining | 3.5% | |
| All Others * | 2.2% | |

* Includes short-term investments and net other assets. |
Annual Report
Gold Portfolio
Investments February 29, 2004
Showing Percentage of Net Assets
Common Stocks - 97.8% |
| Shares | | Value (Note 1) |
Australia - 4.2% |
METALS & MINING - 4.2% |
Gold - 4.2% |
Newcrest Mining Ltd. | 3,500,000 | | $ 31,135,387 |
Bermuda - 1.9% |
METALS & MINING - 1.9% |
Precious Metals & Minerals - 1.9% |
Aquarius Platinum Ltd. (Australia) | 2,021,244 | | 13,915,446 |
Canada - 56.8% |
METALS & MINING - 56.8% |
Gold - 50.4% |
Agnico-Eagle Mines Ltd. | 3,700,000 | | 50,535,774 |
Apollo Gold Corp. (a) | 790,100 | | 1,609,249 |
Apollo Gold Corp. (a)(d) | 209,900 | | 427,517 |
Arizona Star Resource Corp. (a) | 300,000 | | 1,617,432 |
Aurizon Mines Ltd. (a) | 1,500,000 | | 1,909,469 |
Chesapeake Gold Corp. (a) | 221,400 | | 729,462 |
Chesapeake Gold Corp. (a)(d) | 199,000 | | 655,659 |
Eldorado Gold Corp. (a) | 2,000,000 | | 5,780,823 |
Gabriel Resources Ltd. (a)(c) | 9,870,000 | | 25,128,608 |
Gabriel Resources Ltd. (a)(c)(d) | 1,130,000 | | 2,876,933 |
Glamis Gold Ltd. (a) | 500,000 | | 7,753,941 |
Goldcorp, Inc. | 4,000,000 | | 52,896,028 |
High River Gold Mines Ltd. (a) | 2,000,000 | | 3,100,079 |
IAMGOLD Corp. | 2,500,000 | | 16,904,414 |
Kinross Gold Corp. (a)(d) | 866,666 | | 5,782,316 |
Kinross Gold Corp. (a) | 7,833,334 | | 52,263,286 |
Kinross Gold Corp. warrants 12/5/07 (a) | 1,300,000 | | 963,720 |
Meridian Gold, Inc. (a) | 4,500,000 | | 56,980,794 |
Metallic Ventures Gold, Inc. unit (d)(e) | 405,500 | | 2,131,574 |
Midway Gold Corp. (a) | 485,800 | | 727,545 |
Northgate Exploration Ltd. (a) | 1,000,000 | | 2,208,993 |
Novagold Resources, Inc. (a)(c) | 3,450,000 | | 16,223,745 |
Novagold Resources, Inc. (a)(c)(d) | 700,000 | | 3,291,774 |
Novagold Resources, Inc. warrants 10/1/08 (a)(d) | 350,000 | | 676,177 |
Orezone Resources, Inc. Class A (a) | 4,000,000 | | 3,294,770 |
Richmont Mines, Inc. (a)(c) | 1,000,000 | | 4,462,915 |
Wheaton River Minerals Ltd. (a) | 18,500,000 | | 49,870,830 |
Wheaton River Minerals Ltd. warrants 8/25/08 (a) | 206,450 | | 262,807 |
| | 371,066,634 |
Precious Metals & Minerals - 6.4% |
Aber Diamond Corp. (a) | 200,000 | | 6,775,244 |
Minefinders Corp. Ltd. (a)(c) | 2,000,000 | | 18,720,282 |
|
| Shares | | Value (Note 1) |
SouthernEra Resources Ltd. (a)(c) | 5,546,000 | | $ 21,179,827 |
SouthernEra Resources Ltd. warrants 11/17/08 (a) | 125,000 | | 87,985 |
| | 46,763,338 |
TOTAL METALS & MINING | | 417,829,972 |
Cayman Islands - 1.5% |
METALS & MINING - 1.5% |
Precious Metals & Minerals - 1.5% |
Apex Silver Mines Ltd. (a) | 500,000 | | 10,915,000 |
Papua New Guinea - 1.3% |
METALS & MINING - 1.3% |
Gold - 1.3% |
Lihir Gold Ltd. | 11,000,020 | | 9,445,063 |
Peru - 7.9% |
METALS & MINING - 7.9% |
Precious Metals & Minerals - 7.9% |
Compania de Minas Buenaventura SA | 1,000,000 | | 24,187,975 |
Compania de Minas Buenaventura SA sponsored ADR | 1,400,000 | | 33,894,000 |
| | 58,081,975 |
South Africa - 10.6% |
METALS & MINING - 10.6% |
Gold - 9.6% |
Avgold Ltd. (a) | 5,050,000 | | 7,683,835 |
Gold Fields Ltd. | 2,527,600 | | 31,218,544 |
Harmony Gold Mining Co. Ltd. | 1,500,000 | | 23,004,951 |
Harmony Gold Mining Co. Ltd. sponsored ADR | 500,000 | | 7,525,000 |
Western Areas Ltd. (a) | 190,715 | | 919,345 |
| | 70,351,675 |
Precious Metals & Minerals - 1.0% |
Impala Platinum Holdings Ltd. | 92,900 | | 7,763,819 |
TOTAL METALS & MINING | | 78,115,494 |
United Kingdom - 4.0% |
METALS & MINING - 4.0% |
Precious Metals & Minerals - 4.0% |
Lonmin PLC | 1,292,784 | | 29,137,948 |
United States of America - 9.6% |
METALS & MINING - 9.6% |
Diversified Metals & Mining - 3.5% |
Freeport-McMoRan Copper & Gold, Inc. Class B | 600,000 | | 25,590,000 |
Common Stocks - continued |
| Shares | | Value (Note 1) |
United States of America - continued |
METALS & MINING - CONTINUED |
Gold - 6.1% |
Newmont Mining Corp. | 777,224 | | $ 33,770,383 |
Newmont Mining Corp. CHESS Depository Interests | 672,776 | | 2,914,385 |
Royal Gold, Inc. | 500,000 | | 8,519,500 |
| | 45,204,268 |
TOTAL METALS & MINING | | 70,794,268 |
TOTAL COMMON STOCKS (Cost $530,970,126) | 719,370,553 |
Money Market Funds - 5.5% |
| | | |
Fidelity Cash Central Fund, 1.08% (b) | 18,149,078 | | 18,149,078 |
Fidelity Securities Lending Cash Central Fund, 1.08% (b) | 22,199,134 | | 22,199,134 |
TOTAL MONEY MARKET FUNDS (Cost $40,348,212) | 40,348,212 |
TOTAL INVESTMENT PORTFOLIO - 103.3% (Cost $571,318,338) | | 759,718,765 |
NET OTHER ASSETS - (3.3)% | | (23,974,975) |
NET ASSETS - 100% | $ 735,743,790 |
Legend |
(a) Non-income producing |
(b) Affiliated fund that is available only to investment companies and other accounts managed by Fidelity Investments. The rate quoted is the annualized seven-day yield of the fund at period end. A complete listing of the fund's holdings as of its most recent fiscal year end is available upon request. |
(c) Affiliated company |
(d) Security exempt from registration under Rule 144A of the Securities Act of 1933. These securities may be resold in transactions exempt from registration, normally to qualified institutional buyers. At the period end, the value of these securities amounted to $15,841,950 or 2.2% of net assets. |
(e) Security or a portion of the security purchased on a delayed delivery or when-issued basis. |
Other Information |
Purchases and sales of securities, other than short-term securities, aggregated $267,351,502 and $339,526,986, respectively. |
The fund placed a portion of its portfolio transactions with brokerage firms which are affiliates of the investment adviser. The commissions paid to these affiliated firms were $48 for the period. |
Transactions during the period with companies which are or were affiliates are as follows: |
Affiliate | Value, beginning of period | Purchases | Sales
Proceeds | Dividend
Income | Value,
end of period |
Gabriel Resources Ltd. | $ - | $ 26,485,094 | $ 224,186 | $ - | $ 25,128,608 |
Gabriel Resources Ltd. | - | 2,522,691 | - | - | 2,876,933 |
Kinross Gold Corp. | 112,468,722 | 1,145,964 | 52,021,498 | - | 52,263,286 |
Minefinders Corp. Ltd. | 12,795,324 | 8,467,951 | 7,049,242 | - | 18,720,282 |
Novagold Resources, Inc. | - | 11,761,295 | 537,439 | - | 16,223,745 |
Novagold Resources, Inc. | - | - | - | - | 3,291,774 |
Richmont Mines, Inc. | 746,416 | 3,464,082 | - | - | 4,462,915 |
SouthernEra Resources Ltd. | 23,631,856 | 614,140 | - | - | 21,179,827 |
TOTALS | $ 149,642,318 | $ 54,461,217 | $ 59,832,365 | $ - | $ 144,147,370 |
Income Tax Information |
At February 29, 2004, the fund had a capital loss carryforward of approximately $73,760,000 of which $9,053,000, $24,782,000, $5,311,000 and $34,614,000 will expire on February 28, 2007, February 29, 2008, February 28, 2009, and February 28, 2010, respectively. Of the capital loss carryforward expiring on February 28, 2007, and February 29, 2008, $9,053,000 and $14,795,000, respectively, was acquired in the merger with Select Precious Metals and Minerals and is available to offset future capital gains of the fund to the extent provided by regulations. |
The fund elects to defer to its fiscal year ending February 28, 2005 approximately $4,263,000 of passive foreign investment company losses realized for federal tax purposes during the period November 1, 2003 to February 29, 2004. |
See accompanying notes which are an integral part of the financial statements.
Annual Report
Gold Portfolio
Financial Statements
Statement of Assets and Liabilities
| February 29, 2004 |
| | |
Assets | | |
Investment in securities, at value (including securities loaned of $21,686,443) (cost $571,318,338) - See accompanying schedule | | $ 759,718,765 |
Receivable for investments sold | | 273,094 |
Receivable for fund shares sold | | 2,476,591 |
Dividends receivable | | 65,675 |
Interest receivable | | 11,403 |
Prepaid expenses | | 3,018 |
Other affiliated receivables | | 3,072 |
Other receivables | | 279,344 |
Total assets | | 762,830,962 |
| | |
Liabilities | | |
Payable for investments purchased
Regular delivery | $ 7,963 | |
Delayed delivery | 1,943,315 | |
Payable for fund shares redeemed | 2,281,202 | |
Accrued management fee | 360,938 | |
Other affiliated payables | 216,991 | |
Other payables and accrued expenses | 77,629 | |
Collateral on securities loaned, at value | 22,199,134 | |
Total liabilities | | 27,087,172 |
| | |
Net Assets | | $ 735,743,790 |
Net Assets consist of: | | |
Paid in capital | | $ 647,943,973 |
Distributions in excess of net investment income | | (26,696,951) |
Accumulated undistributed net realized gain (loss) on investments and foreign currency transactions | | (73,892,340) |
Net unrealized appreciation (depreciation) on investments and assets and liabilities in foreign currencies | | 188,389,108 |
Net Assets, for 27,035,590 shares outstanding | | $ 735,743,790 |
Net Asset Value, offering price and redemption price per share ($735,743,790 ÷ 27,035,590 shares) | | $ 27.21 |
Statement of Operations
| Year ended February 29, 2004 |
| | |
Investment Income | | |
Dividends | | $ 6,176,612 |
Interest | | 390,489 |
Security lending | | 272,130 |
Total income | | 6,839,231 |
| | |
Expenses | | |
Management fee | $ 3,922,956 | |
Transfer agent fees | 2,780,887 | |
Accounting and security lending fees | 390,206 | |
Non-interested trustees' compensation | 4,590 | |
Custodian fees and expenses | 291,001 | |
Registration fees | 86,603 | |
Audit | 47,894 | |
Legal | 2,571 | |
Miscellaneous | 10,131 | |
Total expenses before reductions | 7,536,839 | |
Expense reductions | (494,132) | 7,042,707 |
Net investment income (loss) | | (203,476) |
Realized and Unrealized Gain (Loss) Net realized gain (loss) on: | | |
Investment securities (including realized gain (loss) of $5,541,753 on sales of investments in affiliated issuers) | 99,241,431 | |
Foreign currency transactions | (87,631) | |
Total net realized gain (loss) | | 99,153,800 |
Change in net unrealized appreciation (depreciation) on: Investment securities | 37,904,420 | |
Assets and liabilities in foreign currencies | (5,447) | |
Total change in net unrealized appreciation (depreciation) | | 37,898,973 |
Net gain (loss) | | 137,052,773 |
Net increase (decrease) in net assets resulting from operations | | $ 136,849,297 |
Other Information | | |
Sales charges paid to FDC | | $ 630,419 |
Deferred sales charges withheld by FDC | | $ 30,622 |
Exchange fees withheld by
FSC | | $ 29,580 |
See accompanying notes which are an integral part of the financial statements.
Annual Report
Gold Portfolio
Financial Statements - continued
Statement of Changes in Net Assets
| Year ended
February 29,
2004 | Year ended
February 28,
2003 |
Increase (Decrease) in Net Assets | | |
Operations | | |
Net investment income (loss) | $ (203,476) | $ 1,280,578 |
Net realized gain (loss) | 99,153,800 | 10,346,641 |
Change in net unrealized appreciation (depreciation) | 37,898,973 | 63,682,207 |
Net increase (decrease) in net assets resulting from operations | 136,849,297 | 75,309,426 |
Distributions to shareholders from net investment income | (39,692,454) | (9,260,070) |
Share transactions
Net proceeds from sales of shares | 744,412,449 | 1,188,797,905 |
Reinvestment of distributions | 38,172,690 | 8,907,366 |
Cost of shares redeemed | (831,737,192) | (1,024,844,325) |
Net increase (decrease) in net assets resulting from share transactions | (49,152,053) | 172,860,946 |
Redemption fees | 1,710,255 | 3,269,476 |
Total increase (decrease) in net assets | 49,715,045 | 242,179,778 |
| | |
Net Assets | | |
Beginning of period | 686,028,745 | 443,848,967 |
End of period (including distributions in excess of net investment income of $26,696,951 and distributions in excess of net investment income of $5,092,142, respectively) | $ 735,743,790 | $ 686,028,745 |
Other Information Shares | | |
Sold | 28,812,773 | 54,106,714 |
Issued in reinvestment of distributions | 1,565,759 | 419,738 |
Redeemed | (33,521,798) | (48,662,682) |
Net increase (decrease) | (3,143,266) | 5,863,770 |
Financial Highlights
Years ended February 28, | 2004 H | 2003 | 2002 | 2001 | 2000 H |
Selected Per-Share Data | | | | | |
Net asset value, beginning of period | $ 22.73 | $ 18.25 | $ 12.38 | $ 13.45 | $ 12.79 |
Income from Investment Operations | | | | | |
Net investment income (loss) C | (.01) | .05 | .25 E | .07 | .09 D |
Net realized and unrealized gain (loss) | 5.85 | 4.67 | 5.78 | (1.12) | .46 |
Total from investment operations | 5.84 | 4.72 | 6.03 | (1.05) | .55 |
Distributions from net investment income | (1.42) | (.36) | (.22) | (.07) | - |
Redemption fees added to paid in capital C | .06 | .12 | .06 | .05 | .11 |
Net asset value, end of period | $ 27.21 | $ 22.73 | $ 18.25 | $ 12.38 | $ 13.45 |
Total Return A, B | 26.79% | 26.68% | 49.79% | (7.41)% | 5.16% |
Ratios to Average Net Assets F | | | | | |
Expenses before expense reductions | 1.12% | 1.18% | 1.29% | 1.47% | 1.49% |
Expenses net of voluntary waivers, if any | 1.12% | 1.18% | 1.29% | 1.47% | 1.49% |
Expenses net of all reductions | 1.04% | 1.11% | 1.24% | 1.43% | 1.41% |
Net investment income (loss) | (.03)% | .22% | 1.76% | .60% | .68% |
Supplemental Data | | | | | |
Net assets, end of period (000 omitted) | $ 735,744 | $ 686,029 | $ 443,849 | $ 235,921 | $ 283,966 |
Portfolio turnover rate | 41% | 44% | 49% | 23% | 71% G |
A Total returns would have been lower had certain expenses not been reduced during the periods shown. B Total returns do not include the effect of the former sales charges. C Calculated based on average shares outstanding during the period. D Investment income per share reflects a special dividend which amounted to $.06 per share. E Investment income per share reflects a special dividend which amounted to $.04 per share. F Expense ratios reflect operating expenses of the fund. Expenses before reductions do not reflect amounts reimbursed by the investment adviser or reductions from brokerage service arrangements or other expense offset arrangements and do not represent the amount paid by the fund during periods when reimbursements or reductions occur. Expenses net of any voluntary waivers reflect expenses after reimbursement by the investment adviser but prior to reductions from brokerage service arrangements or other expense offset arrangements. Expenses net of all reductions represent the net expenses paid by the fund. G The portfolio turnover rate does not include the assets acquired in the merger with Select Precious Metals and Minerals. H For the year ended February 29. |
See accompanying notes which are an integral part of the financial statements.
Natural Resources Sector
Natural Gas Portfolio
Performance
Average annual total return reflects the change in the value of an investment, assuming reinvestment of the fund's dividend income and capital gains (the profits earned upon the sale of securities that have grown in value) and assuming a constant rate of performance each year. The $10,000 table and the fund's returns do not reflect the deduction of taxes that a shareholder would pay on fund distributions or the redemption of fund shares. During periods of reimbursement by Fidelity a fund's total returns will be greater than it would be had the reimbursement not occurred. How a fund did yesterday is no guarantee of how it will do tomorrow.
Average Annual Total Returns
Periods ended February 29, 2004 | Past 1
year | Past 5
years | Past 10
years |
Select Natural Gas | 32.03% | 17.64% | 10.39% |
$10,000 Over 10 Years
Let's say hypothetically that $10,000 was invested in Fidelity Select Natural Gas Portfolio on February 28, 1994. The chart shows how the value of your investment would have grown, and also shows how the S&P 500 Index did over the same period.
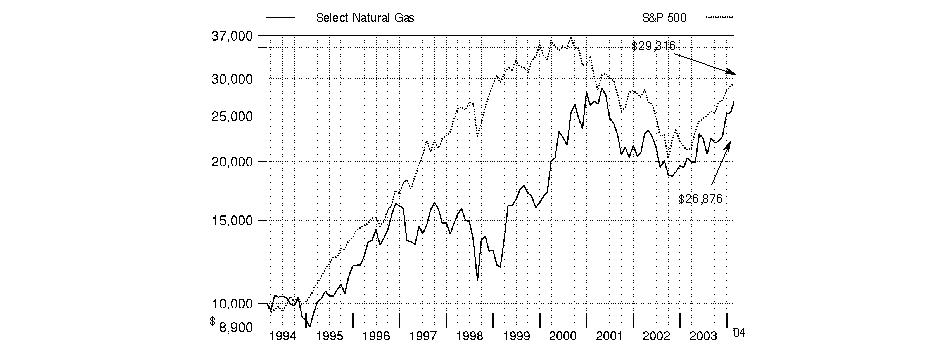
Annual Report
Natural Gas Portfolio
Management's Discussion of Fund Performance
Comments from Naved Khan, Portfolio Manager of Fidelity® Select Natural Gas Portfolio
From March 2003 through the end of February 2004, domestic stocks recovered dramatically from their prior three-year swoon, driven largely by a broad-based economic and corporate profit recovery. Most major equity benchmarks gained 35% or more during the 12-month period, led by the Russell 2000® Index - a measure of the overall small-cap universe - which advanced 64.41%. As investors grew more confident about the economy's vitality, small-cap stocks were bid up, particularly those with no current earnings. In comparison, the Wilshire 5000® Total Market Index, commonly used as a proxy for the entire U.S. stock market's performance, rose 42.47%. Every sector of the market posted a double-digit advance, with economically sensitive issues - especially technology stocks - leading the way. The tech-heavy NASDAQ Composite® Index returned 52.47% during the past year, despite a negative return in February as investors turned to the more value-oriented segments of the market. The broader Standard & Poor's 500SM Index climbed 38.52% during the year, slightly outperforming the 37.07% increase for the blue-chip Dow Jones Industrial AverageSM.
For the 12 months ending February 29, 2004, the fund returned 32.03%, underperforming the S&P 500® and the 40.34% gain for the Goldman Sachs® Natural Resources Index. Strong stock selection within the energy sector helped absolute performance. However, the fund lagged the broad market, as technology and other sectors that tend to do well early in the economic cycle led the rally. The fund's lack of exposure to strong-performing aluminum, metals and mining, and forest products stocks, which are included in the sector benchmark, also hampered relative returns. Top performers included BJ Services, a services company that raised its earnings forecast in early '04; Chesapeake Energy, an exploration and production (E&P) company that posted strong production growth numbers; and Valero Energy, a refiner benefiting from high oil prices. I took profits and sold the fund's stake in Chesapeake. On the negative side, Cooper Cameron, which makes sub-sea drilling systems, declined after missing Wall Street's earnings expectations in the fourth quarter of 2003. Elsewhere, contract delays hampered Pioneer Natural Resources, an E&P company, while deteriorating pricing for North Sea rigs held back ENSCO International, a driller.
The views expressed in this statement reflect those of the portfolio manager only through the end of the period of the report as stated on the cover and do not necessarily represent the views of Fidelity or any other person in the Fidelity organization. Any such views are subject to change at any time based upon market or other conditions and Fidelity disclaims any responsibility to update such views. These views may not be relied on as investment advice and, because investment decisions for a Fidelity fund are based on numerous factors, may not be relied on as an indication of trading intent on behalf of any Fidelity fund.
Annual Report
Natural Gas Portfolio
Investment Summary
Top Ten Stocks as of February 29, 2004 |
| % of fund's
net assets |
BJ Services Co. | 7.7 |
Apache Corp. | 7.0 |
Burlington Resources, Inc. | 6.7 |
Pioneer Natural Resources Co. | 6.6 |
Cooper Cameron Corp. | 6.1 |
Rowan Companies, Inc. | 5.4 |
Valero Energy Corp. | 5.3 |
ENSCO International, Inc. | 4.9 |
Nabors Industries Ltd. | 4.2 |
Occidental Petroleum Corp. | 4.1 |
| 58.0 |
Top Industries as of February 29, 2004 |
% of fund's net assets |
| Oil & Gas | 48.1% | |
| Energy Equipment & Services | 46.9% | |
| Gas Utilities | 0.4% | |
| Multi-Utilities & Unregulated Power | 0.1% | |
| All Others* | 4.5% | |

* Includes short-term investments and net other assets. |
See accompanying notes which are an integral part of the financial statements.
Annual Report
Natural Gas Portfolio
Investments February 29, 2004
Showing Percentage of Net Assets
Common Stocks - 95.5% |
| Shares | | Value (Note 1) |
ENERGY EQUIPMENT & SERVICES - 46.9% |
Baker Hughes, Inc. | 6,200 | | $ 233,244 |
BJ Services Co. (a) | 400,000 | | 17,316,000 |
Cooper Cameron Corp. (a) | 310,000 | | 13,708,200 |
Diamond Offshore Drilling, Inc. | 149,200 | | 3,731,492 |
ENSCO International, Inc. | 375,000 | | 11,013,750 |
GlobalSantaFe Corp. | 11,553 | | 340,814 |
Grant Prideco, Inc. (a) | 458,696 | | 6,958,418 |
Grey Wolf, Inc. (a) | 161,800 | | 684,414 |
Halliburton Co. | 75,000 | | 2,397,000 |
Nabors Industries Ltd. (a) | 199,800 | | 9,460,530 |
Noble Corp. (a) | 37,300 | | 1,514,380 |
Patterson-UTI Energy, Inc. (a) | 15,000 | | 544,200 |
Precision Drilling Corp. (a) | 50,000 | | 2,396,500 |
Pride International, Inc. (a) | 363,700 | | 6,233,818 |
Rowan Companies, Inc. (a) | 518,000 | | 12,173,000 |
Schlumberger Ltd. (NY Shares) | 62,000 | | 3,998,380 |
Smith International, Inc. (a) | 19,360 | | 980,971 |
Transocean, Inc. (a) | 280,000 | | 8,254,400 |
W-H Energy Services, Inc. (a) | 101,115 | | 1,683,565 |
Weatherford International Ltd. (a) | 35,502 | | 1,590,490 |
TOTAL ENERGY EQUIPMENT & SERVICES | | 105,213,566 |
GAS UTILITIES - 0.4% |
KeySpan Corp. | 15,900 | | 604,200 |
Sempra Energy | 12,100 | | 383,570 |
TOTAL GAS UTILITIES | | 987,770 |
MULTI-UTILITIES & UNREGULATED POWER - 0.1% |
Equitable Resources, Inc. | 7,900 | | 340,411 |
OIL & GAS - 48.1% |
Apache Corp. | 382,136 | | 15,732,539 |
Bonavista Energy Trust | 59,000 | | 923,359 |
BP PLC sponsored ADR | 50,000 | | 2,460,000 |
Burlington Resources, Inc. | 255,800 | | 14,974,532 |
Cross Timbers Royalty Trust | 1,506 | | 40,361 |
Denbury Resources, Inc. (a) | 144,900 | | 2,189,439 |
EnCana Corp. | 79,408 | | 3,439,259 |
Encore Acquisition Co. (a) | 93,200 | | 2,428,792 |
Evergreen Resources, Inc. (a) | 111,500 | | 3,668,350 |
Harvest Natural Resources, Inc. (a) | 25,000 | | 292,000 |
NuVista Energy Ltd. (a) | 29,500 | | 181,137 |
Occidental Petroleum Corp. | 205,000 | | 9,102,000 |
Pioneer Natural Resources Co. (a) | 462,800 | | 14,865,136 |
Pogo Producing Co. | 75,000 | | 3,402,750 |
Premcor, Inc. (a) | 200,500 | | 6,305,725 |
Progress Energy Ltd. (a) | 100,000 | | 1,025,871 |
Remington Oil & Gas Corp. (a) | 57,000 | | 1,137,150 |
Suncor Energy, Inc. | 8,000 | | 208,289 |
Talisman Energy, Inc. | 36,400 | | 2,127,388 |
Tom Brown, Inc. (a) | 151,800 | | 5,338,806 |
|
| Shares | | Value (Note 1) |
Valero Energy Corp. | 200,000 | | $ 12,000,000 |
XTO Energy, Inc. | 203,600 | | 6,075,424 |
TOTAL OIL & GAS | | 107,918,307 |
TOTAL COMMON STOCKS (Cost $179,772,013) | 214,460,054 |
Money Market Funds - 1.7% |
| | | |
Fidelity Cash Central Fund, 1.08% (b) | 1,700,070 | | 1,700,070 |
Fidelity Securities Lending Cash Central Fund, 1.08% (b) | 2,008,500 | | 2,008,500 |
TOTAL MONEY MARKET FUNDS (Cost $3,708,570) | 3,708,570 |
TOTAL INVESTMENT PORTFOLIO - 97.2% (Cost $183,480,583) | 218,168,624 |
NET OTHER ASSETS - 2.8% | | 6,305,904 |
NET ASSETS - 100% | $ 224,474,528 |
Legend |
(a) Non-income producing |
(b) Affiliated fund that is available only to investment companies and other accounts managed by Fidelity Investments. The rate quoted is the annualized seven-day yield of the fund at period end. A complete listing of the fund's holdings as of its most recent fiscal year end is available upon request. |
Other Information |
Purchases and sales of securities, other than short-term securities, aggregated $308,799,595 and $303,590,107, respectively. |
Income Tax Information |
At February 29, 2004, the fund had a capital loss carryforward of approximately $23,667,000 all of which will expire on February 28, 2011. |
Annual Report
See accompanying notes which are an integral part of the financial statements.
Natural Gas Portfolio
Financial Statements
Statement of Assets and Liabilities
| February 29, 2004 |
| | |
Assets | | |
Investment in securities, at value (including securities loaned of $1,950,780) (cost $183,480,583) - See accompanying schedule | | $ 218,168,624 |
Receivable for investments sold | | 19,923,008 |
Receivable for fund shares sold | | 1,349,846 |
Dividends receivable | | 55,420 |
Interest receivable | | 3,836 |
Prepaid expenses | | 843 |
Other affiliated receivables | | 27 |
Other receivables | | 65,506 |
Total assets | | 239,567,110 |
| | |
Liabilities | | |
Payable for investments purchased | $ 12,229,493 | |
Payable for fund shares redeemed | 649,777 | |
Accrued management fee | 106,079 | |
Other affiliated payables | 71,877 | |
Other payables and accrued expenses | 26,856 | |
Collateral on securities loaned, at value | 2,008,500 | |
Total liabilities | | 15,092,582 |
| | |
Net Assets | | $ 224,474,528 |
Net Assets consist of: | | |
Paid in capital | | $ 213,826,313 |
Undistributed net investment income | | 1,632 |
Accumulated undistributed net realized gain (loss) on investments and foreign currency transactions | | (24,042,006) |
Net unrealized appreciation (depreciation) on investments and assets and liabilities in foreign currencies | | 34,688,589 |
Net Assets, for 9,761,183 shares outstanding | | $ 224,474,528 |
Net Asset Value, offering price and redemption price per share ($224,474,528 ÷ 9,761,183 shares) | | $ 23.00 |
Statement of Operations
| Year ended February 29, 2004 |
| | |
Investment Income | | |
Dividends | | $ 1,169,851 |
Interest | | 63,455 |
Security lending | | 17,224 |
Total income | | 1,250,530 |
| | |
Expenses | | |
Management fee | $ 1,068,158 | |
Transfer agent fees | 935,288 | |
Accounting and security lending fees | 115,675 | |
Non-interested trustees' compensation | 933 | |
Custodian fees and expenses | 10,055 | |
Registration fees | 45,297 | |
Audit | 44,529 | |
Legal | 664 | |
Miscellaneous | 4,049 | |
Total expenses before reductions | 2,224,648 | |
Expense reductions | (123,020) | 2,101,628 |
Net investment income (loss) | | (851,098) |
Realized and Unrealized Gain (Loss) Net realized gain (loss) on: | | |
Investment securities | 30,065,315 | |
Foreign currency transactions | (36,244) | |
Total net realized gain (loss) | | 30,029,071 |
Change in net unrealized appreciation (depreciation) on: Investment securities | 20,772,437 | |
Assets and liabilities in foreign currencies | 209 | |
Total change in net unrealized appreciation (depreciation) | | 20,772,646 |
Net gain (loss) | | 50,801,717 |
Net increase (decrease) in net assets resulting from operations | | $ 49,950,619 |
Other Information | | |
Sales charges paid to FDC | | $ 324,628 |
Deferred sales charges withheld by FDC | | $ 1,242 |
Exchange fees withheld by
FSC | | $ 7,373 |
See accompanying notes which are an integral part of the financial statements.
Annual Report
Natural Gas Portfolio
Financial Statements - continued
Statement of Changes in Net Assets
| Year ended
February 29,
2004 | Year ended
February 28,
2003 |
Increase (Decrease) in Net Assets | | |
Operations | | |
Net investment income (loss) | $ (851,098) | $ 434,413 |
Net realized gain (loss) | 30,029,071 | (11,530,770) |
Change in net unrealized appreciation (depreciation) | 20,772,646 | 6,463,114 |
Net increase (decrease) in net assets resulting from operations | 49,950,619 | (4,633,243) |
Distributions to shareholders from net investment income | - | (875,067) |
Share transactions
Net proceeds from sales of shares | 201,189,693 | 108,934,224 |
Reinvestment of distributions | - | 782,096 |
Cost of shares redeemed | (189,830,118) | (127,016,898) |
Net increase (decrease) in net assets resulting from share transactions | 11,359,575 | (17,300,578) |
Redemption fees | 159,700 | 128,572 |
Total increase (decrease) in net assets | 61,469,894 | (22,680,316) |
| | |
Net Assets | | |
Beginning of period | 163,004,634 | 185,684,950 |
End of period (including undistributed net investment income of $1,632 and $0, respectively) | $ 224,474,528 | $ 163,004,634 |
Other Information Shares | | |
Sold | 10,255,398 | 6,131,084 |
Issued in reinvestment of distributions | - | 45,436 |
Redeemed | (9,850,376) | (7,186,594) |
Net increase (decrease) | 405,022 | (1,010,074) |
Financial Highlights
Years ended February 28, | 2004 E | 2003 | 2002 | 2001 | 2000 E |
Selected Per-Share Data | | | | | |
Net asset value, beginning of period | $ 17.42 | $ 17.91 | $ 23.26 | $ 15.21 | $ 10.59 |
Income from Investment Operations | | | | | |
Net investment income (loss) C | (.09) | .05 | .14 | .10 | -F |
Net realized and unrealized gain (loss) | 5.65 | (.45) | (5.35) | 8.22 | 4.68 |
Total from investment operations | 5.56 | (.40) | (5.21) | 8.32 | 4.68 |
Distributions from net investment income | - | (.10) | (.03) | (.04) | (.09) |
Distributions from net realized gain | - | - | (.13) | (.30) | - |
Total distributions | - | (.10) | (.16) | (.34) | (.09) |
Redemption fees added to paid in capital C | .02 | .01 | .02 | .07 | .03 |
Net asset value, end of period | $ 23.00 | $ 17.42 | $ 17.91 | $ 23.26 | $ 15.21 |
Total Return A,B | 32.03% | (2.17)% | (22.47)% | 55.49% | 44.70% |
Ratios to Average Net Assets D | | | | | |
Expenses before expense reductions | 1.21% | 1.30% | 1.17% | 1.15% | 1.42% |
Expenses net of voluntary waivers, if any | 1.21% | 1.30% | 1.17% | 1.15% | 1.42% |
Expenses net of all reductions | 1.14% | 1.24% | 1.13% | 1.10% | 1.39% |
Net investment income (loss) | (.46)% | .27% | .67% | .47% | .03% |
Supplemental Data | | | | | |
Net assets, end of period (000 omitted) | $ 224,475 | $ 163,005 | $ 185,685 | $ 421,167 | $ 53,976 |
Portfolio turnover rate | 171% | 108% | 68% | 94% | 85% |
A Total returns would have been lower had certain expenses not been reduced during the periods shown. B Total returns do not include the effect of the former sales charges. C Calculated based on average shares outstanding during the period. D Expense ratios reflect operating expenses of the fund. Expenses before reductions do not reflect amounts reimbursed by the investment adviser or reductions from brokerage service arrangements or other expense offset arrangements and do not represent the amount paid by the fund during periods when reimbursements or reductions occur. Expenses net of any voluntary waivers reflect expenses after reimbursement by the investment adviser but prior to reductions from brokerage service arrangements or other expense offset arrangements. Expenses net of all reductions represent the net expenses paid by the fund. E For the year ended February 29. F Amount represents less than $.01 per share. |
See accompanying notes which are an integral part of the financial statements.
Natural Resources Sector
Natural Resources Portfolio
Performance
Average annual total return reflects the change in the value of an investment, assuming reinvestment of the fund's dividend income and capital gains (the profits earned upon the sale of securities that have grown in value) and assuming a constant rate of performance each year. The $10,000 table and the fund's returns do not reflect the deduction of taxes that a shareholder would pay on fund distributions or the redemption of fund shares. During periods of reimbursement by Fidelity a fund's total returns will be greater than it would be had the reimbursement not occurred. How a fund did yesterday is no guarantee of how it will do tomorrow.
Average Annual Total Returns
Periods ended February 29, 2004 | Past 1
year | Past 5
years | Life of
FundA |
Select Natural Resources | 34.96% | 15.93% | 7.83% |
A From March 3, 1997
$10,000 Over Life of Fund
Let's say hypothetically that $10,000 was invested in Fidelity Select Natural Resources Portfolio on March 3, 1997, when the fund started. The chart shows how the value of your investment would have grown, and also shows how the S&P 500 Index did over the same period.
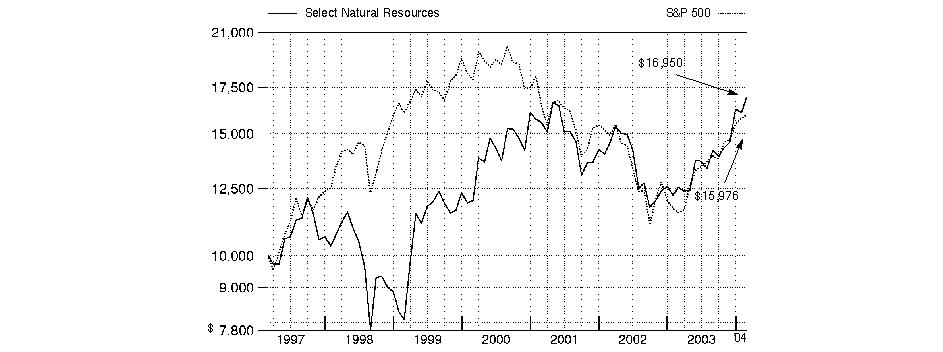
Annual Report
Natural Resources Portfolio
Management's Discussion of Fund Performance
Comments from Pratima Abichandani, Portfolio Manager of Fidelity® Select Natural Resources Portfolio
From March 2003 through the end of February 2004, domestic stocks recovered dramatically from their prior three-year swoon, driven largely by a broad-based economic and corporate profit recovery. Most major equity benchmarks gained 35% or more during the 12-month period, led by the Russell 2000® Index - a measure of the overall small-cap universe - which advanced 64.41%. As investors grew more confident about the economy's vitality, small-cap stocks were bid up, particularly those with no current earnings. In comparison, the Wilshire 5000® Total Market Index, commonly used as a proxy for the entire U.S. stock market's performance, rose 42.47%. Every sector of the market posted a double-digit advance, with economically sensitive issues - especially technology stocks - leading the way. The tech-heavy NASDAQ Composite® Index returned 52.47% during the past year, despite a negative return in February as investors turned to the more value-oriented segments of the market. The broader Standard & Poor's 500SM Index climbed 38.52% during the year, slightly outperforming the 37.07% increase for the blue-chip Dow Jones Industrial AverageSM.
For the 12 months ending February 29, 2004, the fund returned 34.96%, lagging the 40.34% return of the Goldman Sachs® Natural Resources Index and the S&P 500®. Unfavorable stock selection in the energy services and exploration and production (E&P) segments was the most detrimental factor compared with the Goldman Sachs index, along with an overweighting in drillers, a group that struggled during the period. Weatherford International, a large energy services provider, was hampered by the delayed recovery in spending on North American exploration projects. My decision to carry a large overweighting in the stock made the situation worse. A similar story explained the performance of driller ENSCO International, which finished with a single-digit gain due to sluggish offshore exploration activity in the Gulf of Mexico. On the positive side, performance was aided by good stock picking in industrial metals, integrated energy and gold. Copper-producer Freeport-McMoRan Copper & Gold topped the list of contributors, boosted by surging copper prices. Gold mining stock Newmont Mining had a less spectacular but still solid return, benefiting from rising gold prices, low interest rates and a weak U.S. dollar.
The views expressed in this statement reflect those of the portfolio manager only through the end of the period of the report as stated on the cover and do not necessarily represent the views of Fidelity or any other person in the Fidelity organization. Any such views are subject to change at any time based upon market or other conditions and Fidelity disclaims any responsibility to update such views. These views may not be relied on as investment advice and, because investment decisions for a Fidelity fund are based on numerous factors, may not be relied on as an indication of trading intent on behalf of any Fidelity fund.
Annual Report
Natural Resources Portfolio
Investment Summary
Top Ten Stocks as of February 29, 2004 |
| % of fund's
net assets |
BP PLC sponsored ADR | 8.5 |
ChevronTexaco Corp. | 6.0 |
Exxon Mobil Corp. | 5.5 |
ConocoPhillips | 5.2 |
Schlumberger Ltd. (NY Shares) | 4.6 |
Alcoa, Inc. | 3.7 |
Occidental Petroleum Corp. | 3.3 |
Newmont Mining Corp. | 2.7 |
EnCana Corp. | 2.6 |
International Paper Co. | 2.6 |
| 44.7 |
Top Industries as of February 29, 2004 |
% of fund's net assets |
| Oil & Gas | 53.8% | |
| Energy Equipment & Services | 19.6% | |
| Metals & Mining | 13.4% | |
| Paper & Forest Products | 6.1% | |
| Containers & Packaging | 1.7% | |
| All Others* | 5.4% | |

* Includes short-term investments and net other assets. |
Annual Report
Natural Resources Portfolio
Investments February 29, 2004
Showing Percentage of Net Assets
Common Stocks - 95.7% |
| Shares | | Value (Note 1) |
CHEMICALS - 0.1% |
Olin Corp. | 4,000 | | $ 72,640 |
CONTAINERS & PACKAGING - 1.7% |
Packaging Corp. of America | 16,400 | | 386,384 |
Pactiv Corp. (a) | 4,500 | | 96,705 |
Smurfit-Stone Container Corp. (a) | 43,800 | | 812,928 |
TOTAL CONTAINERS & PACKAGING | | 1,296,017 |
ENERGY EQUIPMENT & SERVICES - 19.6% |
Baker Hughes, Inc. | 34,190 | | 1,286,228 |
BJ Services Co. (a) | 20,900 | | 904,761 |
Cal Dive International, Inc. (a) | 2,800 | | 67,900 |
Cooper Cameron Corp. (a) | 3,000 | | 132,660 |
Diamond Offshore Drilling, Inc. | 13,600 | | 340,136 |
ENSCO International, Inc. | 38,500 | | 1,130,745 |
GlobalSantaFe Corp. | 27,483 | | 810,749 |
Grant Prideco, Inc. (a) | 23,700 | | 359,529 |
Grey Wolf, Inc. (a) | 24,000 | | 101,520 |
Halliburton Co. | 20,300 | | 648,788 |
Maverick Tube Corp. (a) | 3,000 | | 61,650 |
Nabors Industries Ltd. (a) | 16,300 | | 771,805 |
National-Oilwell, Inc. (a) | 10,900 | | 323,839 |
Noble Corp. (a) | 10,100 | | 410,060 |
Pason Systems, Inc. | 4,300 | | 88,225 |
Patterson-UTI Energy, Inc. (a) | 3,900 | | 141,492 |
Precision Drilling Corp. (a) | 7,000 | | 335,992 |
Pride International, Inc. (a) | 27,100 | | 464,494 |
Rowan Companies, Inc. (a) | 24,600 | | 578,100 |
Schlumberger Ltd. (NY Shares) | 54,426 | | 3,509,933 |
Smith International, Inc. (a) | 17,600 | | 891,792 |
Tidewater, Inc. | 3,200 | | 106,336 |
Transocean, Inc. (a) | 9,000 | | 265,320 |
Varco International, Inc. (a) | 17,900 | | 356,568 |
Weatherford International Ltd. (a) | 18,795 | | 842,016 |
Willbros Group, Inc. (a) | 9,700 | | 150,350 |
TOTAL ENERGY EQUIPMENT & SERVICES | | 15,080,988 |
GAS UTILITIES - 0.4% |
Kinder Morgan, Inc. | 4,400 | | 271,524 |
METALS & MINING - 13.4% |
Aber Diamond Corp. (a) | 2,200 | | 74,528 |
Alcan, Inc. | 29,200 | | 1,381,230 |
Alcoa, Inc. | 76,200 | | 2,855,214 |
Anglo American PLC ADR | 3,000 | | 75,810 |
Apex Silver Mines Ltd. (a) | 4,400 | | 96,052 |
Freeport-McMoRan Copper & Gold, Inc. Class B | 36,463 | | 1,555,147 |
Goldcorp, Inc. | 32,000 | | 423,168 |
Inco Ltd. (a) | 12,900 | | 478,347 |
|
| Shares | | Value (Note 1) |
Inmet Mining Corp. (a) | 7,200 | | $ 109,177 |
Kinross Gold Corp. (a) | 15,200 | | 101,413 |
Meridian Gold, Inc. (a) | 7,500 | | 94,968 |
Newmont Mining Corp. | 47,100 | | 2,046,495 |
Nucor Corp. | 2,300 | | 144,670 |
Phelps Dodge Corp. (a) | 8,400 | | 724,584 |
Rio Tinto PLC sponsored ADR | 1,500 | | 164,850 |
TOTAL METALS & MINING | | 10,325,653 |
MULTI-UTILITIES & UNREGULATED POWER - 0.5% |
AES Corp. (a) | 44,200 | | 400,452 |
OIL & GAS - 53.8% |
Anadarko Petroleum Corp. | 14,600 | | 748,250 |
Apache Corp. | 43,870 | | 1,806,128 |
BP PLC sponsored ADR | 132,964 | | 6,541,826 |
Burlington Resources, Inc. | 29,900 | | 1,750,346 |
Chesapeake Energy Corp. | 44,300 | | 567,926 |
ChevronTexaco Corp. | 51,716 | | 4,569,109 |
ConocoPhillips | 57,482 | | 3,958,785 |
Cross Timbers Royalty Trust | 60 | | 1,608 |
Devon Energy Corp. | 28,985 | | 1,645,768 |
EnCana Corp. | 46,442 | | 2,011,461 |
EOG Resources, Inc. | 19,800 | | 880,902 |
Exxon Mobil Corp. | 99,896 | | 4,212,614 |
Murphy Oil Corp. | 5,300 | | 332,469 |
Noble Energy, Inc. | 3,200 | | 149,696 |
Occidental Petroleum Corp. | 57,500 | | 2,553,000 |
Petro-Canada | 27,800 | | 1,255,679 |
Pioneer Natural Resources Co. (a) | 24,600 | | 790,152 |
Pogo Producing Co. | 7,900 | | 358,423 |
Premcor, Inc. (a) | 10,400 | | 327,080 |
Repsol YPF SA sponsored ADR | 17,900 | | 368,561 |
Royal Dutch Petroleum Co. (NY Shares) | 25,900 | | 1,284,381 |
Sibneft sponsored ADR | 17,200 | | 589,960 |
Southwestern Energy Co. (a) | 5,200 | | 116,792 |
Sunoco, Inc. | 14,900 | | 916,350 |
Talisman Energy, Inc. | 23,500 | | 1,373,451 |
Tom Brown, Inc. (a) | 3,500 | | 123,095 |
Total SA sponsored ADR | 6,000 | | 551,940 |
Valero Energy Corp. | 13,900 | | 834,000 |
XTO Energy, Inc. | 14,033 | | 418,745 |
YUKOS Corp. sponsored ADR | 4,587 | | 232,561 |
TOTAL OIL & GAS | | 41,271,058 |
PAPER & FOREST PRODUCTS - 6.1% |
Bowater, Inc. | 6,900 | | 316,710 |
Domtar, Inc. | 13,700 | | 158,497 |
Georgia-Pacific Corp. | 23,000 | | 737,150 |
International Paper Co. | 44,800 | | 1,982,848 |
MeadWestvaco Corp. | 17,789 | | 521,218 |
Common Stocks - continued |
| Shares | | Value (Note 1) |
PAPER & FOREST PRODUCTS - CONTINUED |
Slocan Forest Products Ltd. (a) | 260 | | $ 3,390 |
Weyerhaeuser Co. | 14,500 | | 946,125 |
TOTAL PAPER & FOREST PRODUCTS | | 4,665,938 |
SPECIALTY RETAIL - 0.1% |
Boise Cascade Corp. | 2,700 | | 90,990 |
TOTAL COMMON STOCKS (Cost $64,066,985) | 73,475,260 |
Money Market Funds - 7.5% |
| | | |
Fidelity Cash Central Fund, 1.08% (b) | 4,800,252 | | 4,800,252 |
Fidelity Securities Lending Cash Central Fund, 1.08% (b) | 959,775 | | 959,775 |
TOTAL MONEY MARKET FUNDS (Cost $5,760,027) | 5,760,027 |
TOTAL INVESTMENT PORTFOLIO - 103.2% (Cost $69,827,012) | | 79,235,287 |
NET OTHER ASSETS - (3.2)% | | (2,457,621) |
NET ASSETS - 100% | $ 76,777,666 |
Legend |
(a) Non-income producing |
(b) Affiliated fund that is available only to investment companies and other accounts managed by Fidelity Investments. The rate quoted is the annualized seven-day yield of the fund at period end. A complete listing of the fund's holdings as of its most recent fiscal year end is available upon request. |
Other Information |
Purchases and sales of securities, other than short-term securities, aggregated $47,399,401 and $12,213,235, respectively. |
The fund placed a portion of its portfolio transactions with brokerage firms which are affiliates of the investment adviser. The commissions paid to these affiliated firms were $453 for the period. |
Distribution of investments by country of issue, as a percentage of total net assets, is as follows: |
United States of America | 70.6% |
Canada | 10.1% |
United Kingdom | 8.8% |
Netherlands Antilles | 4.6% |
Cayman Islands | 1.7% |
Netherlands | 1.7% |
Russia | 1.1% |
Others (individually less than 1%) | 1.4% |
| 100.0% |
Income Tax Information |
At February 29, 2004, the fund had a capital loss carryforward of approximately $1,584,000 all of which will expire on February 28, 2011. |
See accompanying notes which are an integral part of the financial statements.
Natural Resources Sector
Natural Resources Portfolio
Financial Statements
Statement of Assets and Liabilities
| February 29, 2004 |
| | |
Assets | | |
Investment in securities, at value (including securities loaned of $939,720) (cost $69,827,012) - See accompanying schedule | | $ 79,235,287 |
Receivable for fund shares sold | | 594,354 |
Dividends receivable | | 183,911 |
Interest receivable | | 2,675 |
Prepaid expenses | | 147 |
Other affiliated receivables | | 31 |
Other receivables | | 2,955 |
Total assets | | 80,019,360 |
| | |
Liabilities | | |
Payable for investments purchased | $ 2,106,222 | |
Payable for fund shares redeemed | 89,145 | |
Accrued management fee | 33,499 | |
Other affiliated payables | 22,982 | |
Other payables and accrued expenses | 30,071 | |
Collateral on securities loaned, at value | 959,775 | |
Total liabilities | | 3,241,694 |
| | |
Net Assets | | $ 76,777,666 |
Net Assets consist of: | | |
Paid in capital | | $ 69,101,966 |
Undistributed net investment income | | 99,061 |
Accumulated undistributed net realized gain (loss) on investments and foreign currency transactions | | (1,830,867) |
Net unrealized appreciation (depreciation) on investments and assets and liabilities in foreign currencies | | 9,407,506 |
Net Assets, for 5,151,211 shares outstanding | | $ 76,777,666 |
Net Asset Value, offering price and redemption price per share ($76,777,666 ÷ 5,151,211 shares) | | $ 14.90 |
Statement of Operations
| Year ended February 29, 2004 |
| | |
Investment Income | | |
Dividends | | $ 671,890 |
Interest | | 14,163 |
Security lending | | 4,208 |
Total income | | 690,261 |
| | |
Expenses | | |
Management fee | $ 220,571 | |
Transfer agent fees | 236,538 | |
Accounting and security lending fees | 56,192 | |
Non-interested trustees' compensation | 151 | |
Custodian fees and expenses | 20,410 | |
Registration fees | 21,337 | |
Audit | 44,374 | |
Legal | 124 | |
Miscellaneous | 430 | |
Total expenses before reductions | 600,127 | |
Expense reductions | (2,167) | 597,960 |
Net investment income (loss) | | 92,301 |
Realized and Unrealized Gain (Loss) Net realized gain (loss) on: | | |
Investment securities | 1,607,160 | |
Foreign currency transactions | 6,761 | |
Total net realized gain (loss) | | 1,613,921 |
Change in net unrealized appreciation (depreciation) on: Investment securities | 10,257,240 | |
Assets and liabilities in foreign currencies | (798) | |
Total change in net unrealized appreciation (depreciation) | | 10,256,442 |
Net gain (loss) | | 11,870,363 |
Net increase (decrease) in net assets resulting from operations | | $ 11,962,664 |
Other Information | | |
Sales charges paid to FDC | | $ 19,804 |
Deferred sales charges withheld by FDC | | $ 172 |
Exchange fees withheld by
FSC | | $ 720 |
See accompanying notes which are an integral part of the financial statements.
Annual Report
Natural Resources Portfolio
Financial Statements - continued
Statement of Changes in Net Assets
| Year ended
February 29,
2004 | Year ended
February 28,
2003 |
Increase (Decrease) in Net Assets | | |
Operations | | |
Net investment income (loss) | $ 92,301 | $ 3,817 |
Net realized gain (loss) | 1,613,921 | (1,453,298) |
Change in net unrealized appreciation (depreciation) | 10,256,442 | (3,206,856) |
Net increase (decrease) in net assets resulting from operations | 11,962,664 | (4,656,337) |
Distributions to shareholders from net investment income | - | (49,916) |
Share transactions
Net proceeds from sales of shares | 63,168,537 | 23,260,495 |
Reinvestment of distributions | - | 48,426 |
Cost of shares redeemed | (25,574,269) | (19,392,640) |
Net increase (decrease) in net assets resulting from share transactions | 37,594,268 | 3,916,281 |
Redemption fees | 23,182 | 25,488 |
Total increase (decrease) in net assets | 49,580,114 | (764,484) |
| | |
Net Assets | | |
Beginning of period | 27,197,552 | 27,962,036 |
End of period (including undistributed net investment income of $99,061 and $0, respectively) | $ 76,777,666 | $ 27,197,552 |
Other Information Shares | | |
Sold | 4,674,705 | 1,924,734 |
Issued in reinvestment of distributions | - | 3,769 |
Redeemed | (1,987,519) | (1,651,607) |
Net increase (decrease) | 2,687,186 | 276,896 |
Financial Highlights
Years ended February 28, | 2004 E | 2003 | 2002 | 2001 | 2000 E |
Selected Per-Share Data | | | | | |
Net asset value, beginning of period | $ 11.04 | $ 12.78 | $ 14.11 | $ 11.71 | $ 7.89 |
Income from Investment Operations | | | | | |
Net investment income (loss) C | .03 | - F | .05 | .04 | (.02) |
Net realized and unrealized gain (loss) | 3.82 | (1.73) | (.98) | 3.33 | 3.80 |
Total from investment operations | 3.85 | (1.73) | (.93) | 3.37 | 3.78 |
Distributions from net investment income | - | (.02) | (.01) | (.01) | - |
Distributions from net realized gain | - | - | (.40) | (.99) | - |
Total distributions | - | (.02) | (.41) | (1.00) | - |
Redemption fees added to paid in capital C | .01 | .01 | .01 | .03 | .04 |
Net asset value, end of period | $ 14.90 | $ 11.04 | $ 12.78 | $ 14.11 | $ 11.71 |
Total Return A,B | 34.96% | (13.48)% | (6.73)% | 29.57% | 48.42% |
Ratios to Average Net Assets D | | | | | |
Expenses before expense reductions | 1.59% | 1.75% | 1.61% | 1.70% | 1.89% |
Expenses net of voluntary waivers, if any | 1.59% | 1.75% | 1.61% | 1.70% | 1.89% |
Expenses net of all reductions | 1.59% | 1.72% | 1.56% | 1.67% | 1.85% |
Net investment income (loss) | .24% | .01% | .36% | .29% | (.17)% |
Supplemental Data | | | | | |
Net assets, end of period (000 omitted) | $ 76,778 | $ 27,198 | $ 27,962 | $ 23,006 | $ 14,057 |
Portfolio turnover rate | 32% | 70% | 115% | 138% | 164% |
A Total returns would have been lower had certain expenses not been reduced during the periods shown. B Total returns do not include the effect of the former sales charges. C Calculated based on average shares outstanding during the period. D Expense ratios reflect operating expenses of the fund. Expenses before reductions do not reflect amounts reimbursed by the investment adviser or reductions from brokerage service arrangements or other expense offset arrangements and do not represent the amount paid by the fund during periods when reimbursements or reductions occur. Expenses net of any voluntary waivers reflect expenses after reimbursement by the investment adviser but prior to reductions from brokerage service arrangements or other expense offset arrangements. Expenses net of all reductions represent the net expenses paid by the fund. E For the year ended February 29. F Amount represents less than $.01 per share. |
See accompanying notes which are an integral part of the financial statements.
Natural Resources Sector
Paper and Forest Products Portfolio
Performance
Average annual total return reflects the change in the value of an investment, assuming reinvestment of the fund's dividend income and capital gains (the profits earned upon the sale of securities that have grown in value) and assuming a constant rate of performance each year. The $10,000 table and the fund's returns do not reflect the deduction of taxes that a shareholder would pay on fund distributions or the redemption of fund shares. During periods of reimbursement by Fidelity a fund's total returns will be greater than it would be had the reimbursement not occurred. How a fund did yesterday is no guarantee of how it will do tomorrow.
Average Annual Total Returns
Periods ended February 29, 2004 | Past 1
year | Past 5
years | Past 10
years |
Select Paper and Forest Products | 31.45% | 11.67% | 8.76% |
$10,000 Over 10 Years
Let's say hypothetically that $10,000 was invested in Fidelity Select Paper and Forest Products Portfolio on February 28, 1994. The chart shows how the value of your investment would have grown, and also shows how the S&P 500 Index did over the same period.
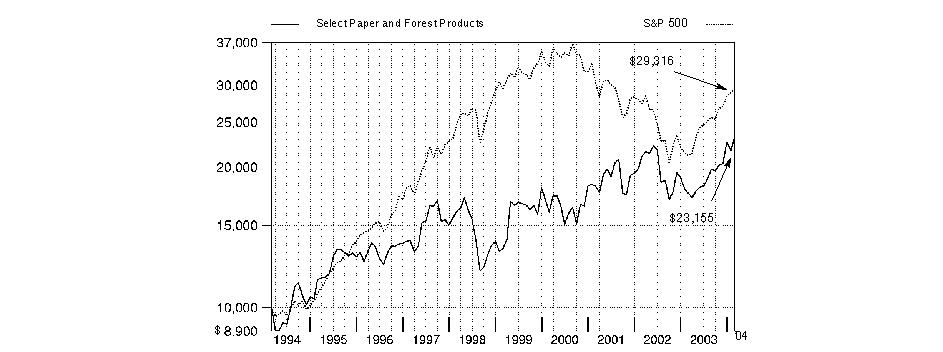
Annual Report
Paper and Forest Products Portfolio
Management's Discussion of Fund Performance
Comments from Anmol Mehra, who became Portfolio Manager of Fidelity® Select Paper and Forest Products Portfolio on February 1, 2004
From March 2003 through the end of February 2004, domestic stocks recovered dramatically from their prior three-year swoon, driven largely by a broad-based economic and corporate profit recovery. Most major equity benchmarks gained 35% or more during the 12-month period, led by the Russell 2000® Index - a measure of the overall small-cap universe - which advanced 64.41%. As investors grew more confident about the economy's vitality, small-cap stocks were bid up, particularly those with no current earnings. In comparison, the Wilshire 5000® Total Market Index, commonly used as a proxy for the entire U.S. stock market's performance, rose 42.47%. Every sector of the market posted a double-digit advance, with economically sensitive issues - especially technology stocks - leading the way. The tech-heavy NASDAQ Composite® Index returned 52.47% during the past year, despite a negative return in February as investors turned to the more value-oriented segments of the market. The broader Standard & Poor's 500SM Index climbed 38.52% during the year, slightly outperforming the 37.07% increase for the blue-chip Dow Jones Industrial AverageSM.
For the 12 months that ended February 29, 2004, the fund returned 31.45%, lagging the S&P 500® and Goldman Sachs® Natural Resources Index, which gained 40.34%. The fund underperformed the sector index in part because it lacked the benchmark's exposure to many natural resources segments - such as gold - that outperformed paper and forest product stocks during the period. Also, within paper and forest products, a number of investments were hurt by rising energy prices, sluggish commodity demand and high raw material prices. Holdings in packaging companies Pactiv and Constar were disappointing. Pactiv suffered from investors' negative perception of its consumer-oriented business lines, while Constar declined on weak volume and difficult pricing. On the paper side, Tembec, Sappi and Bowater were hurt by the declining value of the U.S. dollar because much of their production takes place outside of the U.S., which resulted in falling local currency prices in those markets. However, several investments gained against the benchmark. Georgia-Pacific and Louisiana-Pacific benefited from strong pricing in wood products, while Buckeye Technologies enjoyed attractive dollar-denominated commodity pricing overseas. Packaging manufacturer Silgan Holdings enjoyed a rebound in food production that increased demand for its containers. The stock is no longer held in the fund.
The views expressed in this statement reflect those of the portfolio manager only through the end of the period of the report as stated on the cover and do not necessarily represent the views of Fidelity or any other person in the Fidelity organization. Any such views are subject to change at any time based upon market or other conditions and Fidelity disclaims any responsibility to update such views. These views may not be relied on as investment advice and, because investment decisions for a Fidelity fund are based on numerous factors, may not be relied on as an indication of trading intent on behalf of any Fidelity fund.
Annual Report
Paper and Forest Products Portfolio
Investment Summary
Top Ten Stocks as of February 29, 2004 |
| % of fund's
net assets |
Smurfit-Stone Container Corp. | 7.7 |
Bowater, Inc. | 7.3 |
International Paper Co. | 6.1 |
Georgia-Pacific Corp. | 5.9 |
Temple-Inland, Inc. | 5.5 |
Weyerhaeuser Co. | 4.9 |
Sealed Air Corp. | 4.7 |
Packaging Corp. of America | 4.5 |
Boise Cascade Corp. | 4.2 |
Kimberly-Clark Corp. | 3.9 |
| 54.7 |
Top Industries as of February 29, 2004 |
% of fund's net assets |
| Paper & Forest Products | 49.5% | |
| Containers & Packaging | 29.4% | |
| Real Estate | 5.2% | |
| Specialty Retail | 4.2% | |
| Household Products | 3.9% | |
| All Others * | 7.8% | |

* Includes short-term investments and net other assets. |
Annual Report
Paper and Forest Products Portfolio
Investments February 29, 2004
Showing Percentage of Net Assets
Common Stocks - 92.2% |
| Shares | | Value (Note 1) |
CONTAINERS & PACKAGING - 29.4% |
Bemis Co., Inc. | 15,900 | | $ 812,172 |
Longview Fibre Co. | 19,400 | | 251,812 |
Packaging Corp. of America | 54,900 | | 1,293,444 |
Pactiv Corp. (a) | 6,300 | | 135,387 |
Sealed Air Corp. (a) | 27,100 | | 1,350,935 |
Smurfit-Stone Container Corp. (a) | 119,870 | | 2,224,786 |
Sonoco Products Co. | 32,300 | | 805,885 |
Temple-Inland, Inc. | 24,400 | | 1,589,660 |
TOTAL CONTAINERS & PACKAGING | | 8,464,081 |
HOUSEHOLD PRODUCTS - 3.9% |
Kimberly-Clark Corp. | 17,400 | | 1,125,432 |
PAPER & FOREST PRODUCTS - 49.5% |
Abitibi-Consolidated, Inc. | 123,500 | | 980,269 |
Aracruz Celulose SA sponsored ADR | 15,500 | | 560,325 |
Bowater, Inc. | 45,600 | | 2,093,040 |
Buckeye Technologies, Inc. (a) | 31,400 | | 295,474 |
Canfor Corp. | 13,100 | | 132,329 |
Cascades, Inc. | 37,000 | | 343,555 |
Domtar, Inc. | 56,700 | | 655,970 |
Georgia-Pacific Corp. | 53,200 | | 1,705,060 |
International Forest Products (Interfor) Class A (a) | 53,600 | | 270,519 |
International Paper Co. | 39,700 | | 1,757,122 |
Louisiana-Pacific Corp. | 44,000 | | 1,088,120 |
MeadWestvaco Corp. | 37,900 | | 1,110,470 |
P.H. Glatfelter Co. | 10,200 | | 118,830 |
Pope & Talbot, Inc. | 19,800 | | 340,560 |
Potlatch Corp. | 9,900 | | 419,760 |
Sappi Ltd. sponsored ADR | 9,400 | | 128,780 |
Sino-Forest Corp. Class A (sub. vtg.) (a) | 53,200 | | 274,475 |
Tembec, Inc. (a) | 67,900 | | 495,732 |
Wausau-Mosinee Paper Corp. | 6,700 | | 90,852 |
Weyerhaeuser Co. | 21,700 | | 1,415,925 |
TOTAL PAPER & FOREST PRODUCTS | | 14,277,167 |
REAL ESTATE - 5.2% |
Plum Creek Timber Co., Inc. | 25,700 | | 802,097 |
Rayonier, Inc. | 16,125 | | 694,343 |
TOTAL REAL ESTATE | | 1,496,440 |
SPECIALTY RETAIL - 4.2% |
Boise Cascade Corp. | 36,300 | | 1,223,310 |
TOTAL COMMON STOCKS (Cost $24,562,197) | 26,586,430 |
Money Market Funds - 21.6% |
| Shares | | Value (Note 1) |
Fidelity Cash Central Fund, 1.08% (b) | 4,830,416 | | $ 4,830,416 |
Fidelity Securities Lending Cash Central Fund, 1.08% (b) | 1,387,500 | | 1,387,500 |
TOTAL MONEY MARKET FUNDS (Cost $6,217,916) | 6,217,916 |
TOTAL INVESTMENT PORTFOLIO - 113.8% (Cost $30,780,113) | | 32,804,346 |
NET OTHER ASSETS - (13.8)% | | (3,986,009) |
NET ASSETS - 100% | $ 28,818,337 |
Legend |
(a) Non-income producing |
(b) Affiliated fund that is available only to investment companies and other accounts managed by Fidelity Investments. The rate quoted is the annualized seven-day yield of the fund at period end. A complete listing of the fund's holdings as of its most recent fiscal year end is available upon request. |
Other Information |
Purchases and sales of securities, other than short-term securities, aggregated $36,582,011 and $35,107,568, respectively. |
The fund placed a portion of its portfolio transactions with brokerage firms which are affiliates of the investment adviser. The commissions paid to these affiliated firms were $8,770 for the period. |
Distribution of investments by country of issue, as a percentage of total net assets, is as follows: |
United States of America | 86.8% |
Canada | 10.9% |
Brazil | 1.9% |
Others (individually less than 1%) | 0.4% |
| 100.0% |
Income Tax Information |
At February 29, 2004, the fund had a capital loss carryforward of approximately $7,785,000 of which $1,371,000, $3,556,000 and $2,858,000 will expire on February 28, 2009, 2010 and 2011, respectively. |
See accompanying notes which are an integral part of the financial statements.
Annual Report
Paper and Forest Products Portfolio
Financial Statements
Statement of Assets and Liabilities
| February 29, 2004 |
| | |
Assets | | |
Investment in securities, at value (including securities loaned of $1,377,000) (cost $30,780,113) - See accompanying schedule | | $ 32,804,346 |
Receivable for investments sold | | 190,248 |
Receivable for fund shares sold | | 2,075,398 |
Dividends receivable | | 42,442 |
Interest receivable | | 678 |
Prepaid expenses | | 78 |
Other affiliated receivables | | 31 |
Other receivables | | 7,267 |
Total assets | | 35,120,488 |
| | |
Liabilities | | |
Payable for investments purchased | $ 4,822,929 | |
Payable for fund shares redeemed | 43,371 | |
Accrued management fee | 10,522 | |
Other affiliated payables | 10,429 | |
Other payables and accrued expenses | 27,400 | |
Collateral on securities loaned, at value | 1,387,500 | |
Total liabilities | | 6,302,151 |
| | |
Net Assets | | $ 28,818,337 |
Net Assets consist of: | | |
Paid in capital | | $ 34,742,411 |
Accumulated undistributed net realized gain (loss) on investments and foreign currency transactions | | (7,951,120) |
Net unrealized appreciation (depreciation) on investments and assets and liabilities in foreign currencies | | 2,027,046 |
Net Assets, for 910,739 shares outstanding | | $ 28,818,337 |
Net Asset Value, offering price and redemption price per share ($28,818,337 ÷ 910,739 shares) | | $ 31.64 |
Statement of Operations
| Year ended February 29, 2004 |
| | |
Investment Income | | |
Dividends | | $ 316,266 |
Interest | | 7,258 |
Security lending | | 4,175 |
Total income | | 327,699 |
| | |
Expenses | | |
Management fee | $ 109,487 | |
Transfer agent fees | 139,825 | |
Accounting and security lending fees | 55,653 | |
Non-interested trustees' compensation | 103 | |
Custodian fees and expenses | 12,985 | |
Registration fees | 17,134 | |
Audit | 43,805 | |
Legal | 79 | |
Miscellaneous | 483 | |
Total expenses before reductions | 379,554 | |
Expense reductions | (13,422) | 366,132 |
Net investment income (loss) | | (38,433) |
Realized and Unrealized Gain (Loss) Net realized gain (loss) on: | | |
Investment securities | 2,466,570 | |
Foreign currency transactions | (3,762) | |
Total net realized gain (loss) | | 2,462,808 |
Change in net unrealized appreciation (depreciation) on: Investment securities | 2,491,424 | |
Assets and liabilities in foreign currencies | 2,793 | |
Total change in net unrealized appreciation (depreciation) | | 2,494,217 |
Net gain (loss) | | 4,957,025 |
Net increase (decrease) in net assets resulting from operations | | $ 4,918,592 |
Other Information | | |
Sales charges paid to FDC | | $ 9,451 |
Deferred sales charges withheld by FDC | | $ 661 |
Exchange fees withheld by
FSC | | $ 1,118 |
See accompanying notes which are an integral part of the financial statements.
Annual Report
Paper and Forest Products Portfolio
Financial Statements - continued
Statement of Changes in Net Assets
| Year ended
February 29,
2004 | Year ended
February 28,
2003 |
Increase (Decrease) in Net Assets | | |
Operations | | |
Net investment income (loss) | $ (38,433) | $ (17,701) |
Net realized gain (loss) | 2,462,808 | (2,910,573) |
Change in net unrealized appreciation (depreciation) | 2,494,217 | (3,595,280) |
Net increase (decrease) in net assets resulting from operations | 4,918,592 | (6,523,554) |
Share transactions
Net proceeds from sales of shares | 26,995,138 | 42,413,424 |
Cost of shares redeemed | (24,424,891) | (40,708,473) |
Net increase (decrease) in net assets resulting from share transactions | 2,570,247 | 1,704,951 |
Redemption fees | 21,236 | 50,656 |
Total increase (decrease) in net assets | 7,510,075 | (4,767,947) |
| | |
Net Assets | | |
Beginning of period | 21,308,262 | 26,076,209 |
End of period | $ 28,818,337 | $ 21,308,262 |
Other Information Shares | | |
Sold | 930,389 | 1,486,372 |
Redeemed | (904,918) | (1,507,023) |
Net increase (decrease) | 25,471 | (20,651) |
Financial Highlights
Years ended February 28, | 2004 E | 2003 | 2002 | 2001 | 2000 E |
Selected Per-Share Data | | | | | |
Net asset value, beginning of period | $ 24.07 | $ 28.78 | $ 25.00 | $ 22.17 | $ 18.45 |
Income from Investment Operations | | | | | |
Net investment income (loss) C | (.05) | (.02) | .11 | .20 | .20 |
Net realized and unrealized gain (loss) | 7.59 | (4.74) | 3.71 | 2.64 | 3.26 |
Total from investment operations | 7.54 | (4.76) | 3.82 | 2.84 | 3.46 |
Distributions from net investment income | - | - | (.16) | (.15) | - |
Redemption fees added to paid in capital C | .03 | .05 | .12 | .14 | .26 |
Net asset value, end of period | $ 31.64 | $ 24.07 | $ 28.78 | $ 25.00 | $ 22.17 |
Total Return A, B | 31.45% | (16.37)% | 15.82% | 13.48% | 20.16% |
Ratios to Average Net Assets D | | | | | |
Expenses before expense reductions | 2.01% | 1.81% | 1.82% | 2.10% | 1.89% |
Expenses net of voluntary waivers, if any | 2.01% | 1.81% | 1.82% | 2.10% | 1.89% |
Expenses net of all reductions | 1.94% | 1.73% | 1.69% | 2.03% | 1.74% |
Net investment income (loss) | (.20)% | (.07)% | .42% | .86% | .85% |
Supplemental Data | | | | | |
Net assets, end of period (000 omitted) | $ 28,818 | $ 21,308 | $ 26,076 | $ 15,252 | $ 12,412 |
Portfolio turnover rate | 188% | 201% | 247% | 318% | 383% |
A Total returns would have been lower had certain expenses not been reduced during the periods shown. B Total returns do not include the effect of the former sales charges. C Calculated based on average shares outstanding during the period. D Expense ratios reflect operating expenses of the fund. Expenses before reductions do not reflect amounts reimbursed by the investment adviser or reductions from brokerage service arrangements or other expense offset arrangements and do not represent the amount paid by the fund during periods when reimbursements or reductions occur. Expenses net of any voluntary waivers reflect expenses after reimbursement by the investment adviser but prior to reductions from brokerage service arrangements or other expense offset arrangements. Expenses net of all reductions represent the net expenses paid by the fund. E For the year ended February 29. |
See accompanying notes which are an integral part of the financial statements.
Natural Resources Sector
Business Services and Outsourcing Portfolio
Performance
Average annual total return reflects the change in the value of an investment, assuming reinvestment of the fund's dividend income and capital gains (the profits earned upon the sale of securities that have grown in value) and assuming a constant rate of performance each year. The $10,000 table and the fund's returns do not reflect the deduction of taxes that a shareholder would pay on fund distributions or the redemption of fund shares. During periods of reimbursement by Fidelity a fund's total returns will be greater than it would be had the reimbursement not occurred. How a fund did yesterday is no guarantee of how it will do tomorrow.
Average Annual Total Returns
Periods ended February 29, 2004 | Past 1
year | Past 5
years | Life of
fundA |
Select Business Services and Outsourcing | 38.63% | 4.80% | 9.53% |
A From February 4, 1998
$10,000 Over Life of Fund
Let's say hypothetically that $10,000 was invested in Fidelity Select Business Services and Outsourcing Portfolio on February 4, 1998, when the fund started. The chart shows how the value of your investment would have grown, and also shows how the S&P 500 Index did over the same period.
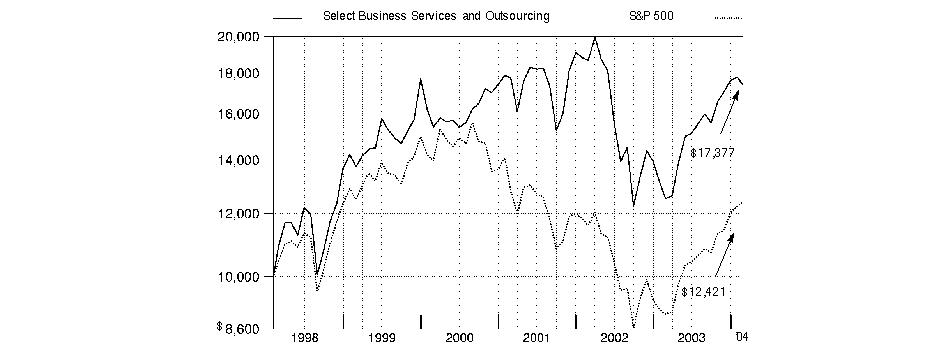
Annual Report
Business Services and Outsourcing Portfolio
Management's Discussion of Fund Performance
Comments from Dion Hershan, who managed Fidelity® Select Business Services and Outsourcing Portfolio from October 1, 2003 through the end of the period
From March 2003 through the end of February 2004, domestic stocks recovered dramatically from their prior three-year swoon, driven largely by a broad-based economic and corporate profit recovery. Most major equity benchmarks gained 35% or more during the 12-month period, led by the Russell 2000® Index - a measure of the overall small-cap universe - which advanced 64.41%. As investors grew more confident about the economy's vitality, small-cap stocks were bid up, particularly those with no current earnings. In comparison, the Wilshire 5000® Total Market Index, commonly used as a proxy for the entire U.S. stock market's performance, rose 42.47%. Every sector of the market posted a double-digit advance, with economically sensitive issues - especially technology stocks - leading the way. The tech-heavy NASDAQ Composite® Index returned 52.47% during the past year, despite a negative return in February as investors turned to the more value-oriented segments of the market. The broader Standard & Poor's 500SM Index climbed 38.52% during the year, slightly outperforming the 37.07% increase for the blue-chip Dow Jones Industrial AverageSM.
The fund gained 38.63% during the 12 months ending February 29, 2004, modestly outpacing the S&P 500 index but trailing the 55.88% return of the Goldman Sachs® Technology Index. The underperformance relative to the Goldman Sachs index stemmed primarily from the fund's more defensive orientation. First Data had the largest negative impact on results. The stock lagged the Goldman Sachs index because of concerns that U.S. regulators would derail a pending merger with Concord EFS, a processor of debit card transactions and a second disappointment during the period. Another laggard was Intuit, a maker of personal finance, tax and small-business software. Intuit's business execution was subpar during the past year. Turning to contributors, Amdocs, which provides software to telecommunications companies, did very well. Amdocs benefited from increased spending on software by its customers, missteps by the company's chief competitors, and success in entering new markets. Another positive relative performer was Satyam Computer Services, an Indian IT services company. Satyam benefited from the increased willingness of U.S. companies to take advantage of cheaper overseas technology labor.
The views expressed in this statement reflect those of the portfolio manager only through the end of the period of the report as stated on the cover and do not necessarily represent the views of Fidelity or any other person in the Fidelity organization. Any such views are subject to change at any time based upon market or other conditions and Fidelity disclaims any responsibility to update such views. These views may not be relied on as investment advice and, because investment decisions for a Fidelity fund are based on numerous factors, may not be relied on as an indication of trading intent on behalf of any Fidelity fund.
Annual Report
Business Services and Outsourcing Portfolio
Investment Summary
Top Ten Stocks as of February 29, 2004 |
| % of fund's
net assets |
First Data Corp. | 11.0 |
Ceridian Corp. | 8.1 |
Affiliated Computer Services, Inc. Class A | 7.8 |
Computer Sciences Corp. | 5.7 |
Omnicom Group, Inc. | 4.2 |
DST Systems, Inc. | 4.0 |
Amdocs Ltd. | 4.0 |
Paychex, Inc. | 3.5 |
Quest Diagnostics, Inc. | 3.4 |
The BISYS Group, Inc. | 3.1 |
| 54.8 |
Top Industries as of February 29, 2004 |
% of fund's net assets |
| IT Services | 61.2% | |
| Commercial
Services & Supplies | 11.3% | |
| Health Care
Providers & Services | 9.0% | |
| Software | 7.0% | |
| Media | 5.9% | |
| All Others* | 5.6% | |

* Includes short-term investments and net other assets. |
Annual Report
Business Services and Outsourcing Portfolio
Investments February 29, 2004
Showing Percentage of Net Assets
Common Stocks - 99.5% |
| Shares | | Value (Note 1) |
CAPITAL MARKETS - 2.5% |
Investors Financial Services Corp. | 7,000 | | $ 308,210 |
Lehman Brothers Holdings, Inc. | 1,200 | | 104,052 |
State Street Corp. | 8,800 | | 472,824 |
TOTAL CAPITAL MARKETS | | 885,086 |
COMMERCIAL SERVICES & SUPPLIES - 11.3% |
Adecco SA sponsored ADR | 7,600 | | 95,304 |
Apollo Group, Inc. Class A (a) | 5,000 | | 380,750 |
Aramark Corp. Class B | 11,300 | | 310,185 |
Banta Corp. | 200 | | 8,872 |
Capita Group PLC | 31,300 | | 159,855 |
ChoicePoint, Inc. (a) | 19,200 | | 723,072 |
Cintas Corp. | 15,700 | | 670,547 |
Corinthian Colleges, Inc. (a) | 4,900 | | 294,735 |
Corrections Corp. of America (a) | 96 | | 3,223 |
Equifax, Inc. | 24,400 | | 639,524 |
Exponent, Inc. (a) | 1,700 | | 37,704 |
H&R Block, Inc. | 300 | | 16,215 |
Hudson Highland Group, Inc. (a) | 2,900 | | 65,598 |
Korn/Ferry International (a) | 4,300 | | 53,363 |
Manpower, Inc. | 4,400 | | 196,900 |
MemberWorks, Inc. (a) | 1,600 | | 54,512 |
Robert Half International, Inc. (a) | 10,600 | | 238,182 |
TOTAL COMMERCIAL SERVICES & SUPPLIES | | 3,948,541 |
COMPUTERS & PERIPHERALS - 1.1% |
Diebold, Inc. | 1,400 | | 73,766 |
Maxtor Corp. (a) | 7,800 | | 79,950 |
Moser-Baer India Ltd. | 15,200 | | 108,725 |
Seagate Technology | 4,300 | | 74,390 |
Western Digital Corp. (a) | 3,200 | | 36,448 |
TOTAL COMPUTERS & PERIPHERALS | | 373,279 |
ELECTRONIC EQUIPMENT & INSTRUMENTS - 0.2% |
Flextronics International Ltd. (a) | 2,400 | | 43,440 |
Solectron Corp. (a) | 3,900 | | 24,921 |
TOTAL ELECTRONIC EQUIPMENT & INSTRUMENTS | | 68,361 |
HEALTH CARE PROVIDERS & SERVICES - 9.0% |
AMN Healthcare Services, Inc. (a) | 6,075 | | 110,687 |
DaVita, Inc. (a) | 18,100 | | 823,731 |
IMS Health, Inc. | 27,278 | | 675,949 |
Laboratory Corp. of America Holdings (a) | 2,300 | | 90,137 |
Quest Diagnostics, Inc. | 14,600 | | 1,209,902 |
U.S. Oncology, Inc. (a) | 13,400 | | 166,830 |
WebMD Corp. (a) | 10,300 | | 88,168 |
TOTAL HEALTH CARE PROVIDERS & SERVICES | | 3,165,404 |
|
| Shares | | Value (Note 1) |
HOUSEHOLD DURABLES - 0.2% |
Garmin Ltd. | 1,100 | | $ 50,424 |
INSURANCE - 0.5% |
Hilb, Rogal & Hamilton Co. | 2,700 | | 99,360 |
USI Holdings Corp. (a) | 5,700 | | 77,292 |
TOTAL INSURANCE | | 176,652 |
INTERNET SOFTWARE & SERVICES - 0.3% |
Ariba, Inc. (a) | 9,800 | | 30,478 |
Websense, Inc. (a) | 2,900 | | 79,170 |
TOTAL INTERNET SOFTWARE & SERVICES | | 109,648 |
IT SERVICES - 61.2% |
Accenture Ltd. Class A (a) | 5,500 | | 127,050 |
Affiliated Computer Services, Inc.
Class A (a) | 56,400 | | 2,721,864 |
Alliance Data Systems Corp. (a) | 12,400 | | 371,380 |
Anteon International Corp. (a) | 8,400 | | 245,700 |
BearingPoint, Inc. (a) | 61,000 | | 649,650 |
Ceridian Corp. (a) | 149,300 | | 2,826,249 |
Certegy, Inc. | 6,200 | | 211,854 |
Ciber, Inc. (a) | 17,300 | | 164,350 |
Cognizant Technology Solutions Corp. Class A (a) | 8,454 | | 401,058 |
Computer Sciences Corp. (a) | 47,700 | | 1,993,383 |
DST Systems, Inc. (a) | 31,100 | | 1,392,036 |
First Data Corp. | 94,000 | | 3,852,120 |
Hewitt Associates, Inc. Class A (a) | 10,000 | | 325,500 |
Infosys Technologies Ltd. | 4,939 | | 554,145 |
InterCept, Inc. (a) | 12,300 | | 146,862 |
Iron Mountain, Inc. (a) | 3,100 | | 139,035 |
ManTech International Corp. Class A (a) | 21,900 | | 457,272 |
Mastek Ltd. | 5,251 | | 27,263 |
MPS Group, Inc. (a) | 100 | | 975 |
National Processing, Inc. (a) | 31,400 | | 621,720 |
Paychex, Inc. | 38,087 | | 1,225,259 |
Sabre Holdings Corp. Class A | 16,200 | | 367,578 |
Satyam Computer Services Ltd. | 70,500 | | 482,840 |
Satyam Computer Services Ltd. ADR | 100 | | 2,052 |
SM&A (a) | 4,900 | | 51,009 |
SunGard Data Systems, Inc. (a) | 34,900 | | 1,014,543 |
The BISYS Group, Inc. (a) | 61,900 | | 1,092,535 |
TOTAL IT SERVICES | | 21,465,282 |
MEDIA - 5.9% |
Interpublic Group of Companies, Inc. (a) | 34,303 | | 581,436 |
Lamar Advertising Co. Class A (a) | 100 | | 3,970 |
Common Stocks - continued |
| Shares | | Value (Note 1) |
MEDIA - CONTINUED |
Omnicom Group, Inc. | 17,839 | | $ 1,459,230 |
Univision Communications, Inc. Class A (a) | 900 | | 32,067 |
TOTAL MEDIA | | 2,076,703 |
SOFTWARE - 7.0% |
Amdocs Ltd. (a) | 49,600 | | 1,382,848 |
Barra, Inc. | 12,300 | | 389,172 |
I-Flex Solutions Ltd. | 5,680 | | 84,920 |
Intuit, Inc. (a) | 3,300 | | 146,388 |
Jack Henry & Associates, Inc. | 200 | | 3,710 |
Microsoft Corp. | 3,500 | | 92,750 |
Reynolds & Reynolds Co. Class A | 12,300 | | 343,416 |
TOTAL SOFTWARE | | 2,443,204 |
SPECIALTY RETAIL - 0.3% |
Abercrombie & Fitch Co. Class A | 800 | | 25,224 |
Finlay Enterprises, Inc. (a) | 5,100 | | 94,554 |
TOTAL SPECIALTY RETAIL | | 119,778 |
TOTAL COMMON STOCKS (Cost $29,253,357) | 34,882,362 |
Money Market Funds - 9.7% |
| | | |
Fidelity Cash Central Fund, 1.08% (b) | 185,741 | | 185,741 |
Fidelity Securities Lending Cash Central Fund, 1.08% (b) | 3,220,850 | | 3,220,850 |
TOTAL MONEY MARKET FUNDS (Cost $3,406,591) | 3,406,591 |
TOTAL INVESTMENT PORTFOLIO - 109.2% (Cost $32,659,948) | 38,288,953 |
NET OTHER ASSETS - (9.2)% | (3,221,212) |
NET ASSETS - 100% | $ 35,067,741 |
Legend |
(a) Non-income producing |
(b) Affiliated fund that is available only to investment companies and other accounts managed by Fidelity Investments. The rate quoted is the annualized seven-day yield of the fund at period end. A complete listing of the fund's holdings as of its most recent fiscal year end is available upon request. |
Other Information |
Purchases and sales of securities, other than short-term securities, aggregated $17,703,901 and $21,409,314, respectively. |
The fund placed a portion of its portfolio transactions with brokerage firms which are affiliates of the investment adviser. The commissions paid to these affiliated firms were $4,717 for the period. |
Income Tax Information |
At February 29, 2004, the fund had a capital loss carryforward of approximately $2,298,000 all of which will expire on February 28, 2011. |
See accompanying notes which are an integral part of the financial statements.
Technology Sector
Business Services and Outsourcing Portfolio
Financial Statements
Statement of Assets and Liabilities
| February 29, 2004 |
| | |
Assets | | |
Investment in securities, at value (including securities loaned of $3,173,781) (cost $32,659,948) - See accompanying schedule | | $ 38,288,953 |
Receivable for investments sold | | 91,520 |
Receivable for fund shares sold | | 30,522 |
Dividends receivable | | 7,982 |
Interest receivable | | 235 |
Prepaid expenses | | 164 |
Other affiliated receivables | | 36 |
Other receivables | | 3,218 |
Total assets | | 38,422,630 |
| | |
Liabilities | | |
Payable for fund shares redeemed | $ 71,981 | |
Accrued management fee | 17,178 | |
Other affiliated payables | 15,599 | |
Other payables and accrued expenses | 29,281 | |
Collateral on securities loaned, at value | 3,220,850 | |
Total liabilities | | 3,354,889 |
| | |
Net Assets | | $ 35,067,741 |
Net Assets consist of: | | |
Paid in capital | | $ 32,143,065 |
Accumulated undistributed net realized gain (loss) on investments and foreign currency transactions | | (2,704,329) |
Net unrealized appreciation (depreciation) on investments | | 5,629,005 |
Net Assets, for 2,479,848 shares outstanding | | $ 35,067,741 |
Net Asset Value, offering price and redemption price per share ($35,067,741 ÷ 2,479,848 shares) | | $ 14.14 |
Statement of Operations
| Year ended February 29, 2004 |
| | |
Investment Income | | |
Dividends | | $ 132,347 |
Interest | | 10,561 |
Security lending | | 12,683 |
Total income | | 155,591 |
| | |
Expenses | | |
Management fee | $ 194,978 | |
Transfer agent fees | 225,712 | |
Accounting and security lending fees | 56,145 | |
Non-interested trustees' compensation | 145 | |
Custodian fees and expenses | 14,105 | |
Registration fees | 16,187 | |
Audit | 43,867 | |
Legal | 155 | |
Miscellaneous | 711 | |
Total expenses before reductions | 552,005 | |
Expense reductions | (4,879) | 547,126 |
Net investment income (loss) | | (391,535) |
Realized and Unrealized Gain (Loss) Net realized gain (loss) on: | | |
Investment securities | 1,669,301 | |
Foreign currency transactions | 712 | |
Total net realized gain (loss) | | 1,670,013 |
Change in net unrealized appreciation (depreciation) on investment securities | | 9,233,366 |
Net gain (loss) | | 10,903,379 |
Net increase (decrease) in net assets resulting from operations | | $ 10,511,844 |
Other Information | | |
Sales charges paid to FDC | | $ 18,330 |
Deferred sales charges withheld by FDC | | $ 315 |
Exchange fees withheld by
FSC | | $ 1,215 |
See accompanying notes which are an integral part of the financial statements.
Annual Report
Business Services and Outsourcing Portfolio
Financial Statements - continued
Statement of Changes in Net Assets
| Year ended
February 29, 2004 | Year ended
February 28, 2003 |
Increase (Decrease) in Net Assets | | |
Operations | | |
Net investment income (loss) | $ (391,535) | $ (401,224) |
Net realized gain (loss) | 1,670,013 | (3,497,634) |
Change in net unrealized appreciation (depreciation) | 9,233,366 | (13,228,095) |
Net increase (decrease) in net assets resulting from operations | 10,511,844 | (17,126,953) |
Share transactions
Net proceeds from sales of shares | 12,647,841 | 23,784,015 |
Cost of shares redeemed | (15,988,062) | (42,142,348) |
Net increase (decrease) in net assets resulting from share transactions | (3,340,221) | (18,358,333) |
Redemption fees | 8,594 | 46,665 |
Total increase (decrease) in net assets | 7,180,217 | (35,438,621) |
| | |
Net Assets | | |
Beginning of period | 27,887,524 | 63,326,145 |
End of period | $ 35,067,741 | $ 27,887,524 |
Other Information Shares | | |
Sold | 989,188 | 1,746,855 |
Redeemed | (1,244,696) | (3,175,220) |
Net increase (decrease) | (255,508) | (1,428,365) |
Financial Highlights
Years ended February 28, | 2004F | 2003 | 2002 | 2001 | 2000F |
Selected Per-Share Data | | | | | |
Net asset value, beginning of period | $ 10.20 | $ 15.21 | $ 14.66 | $ 14.00 | $ 13.57 |
Income from Investment Operations | | | | | |
Net investment income (loss)C | (.15) | (.12) | (.11) | (.09) | (.05)D |
Net realized and unrealized gain (loss) | 4.09 | (4.90) | .81 | 2.00 | 1.69 |
Total from investment operations | 3.94 | (5.02) | .70 | 1.91 | 1.64 |
Distributions from net realized gain | - | - | (.19) | (1.28) | (1.23) |
Redemption fees added to paid in capitalC | -G | .01 | .04 | .03 | .02 |
Net asset value, end of period | $ 14.14 | $ 10.20 | $ 15.21 | $ 14.66 | $ 14.00 |
Total ReturnA,B | 38.63% | (32.94)% | 5.23% | 15.21% | 12.15% |
Ratios to Average Net AssetsE | | | | | |
Expenses before expense reductions | 1.64% | 1.61% | 1.42% | 1.54% | 1.50% |
Expenses net of voluntary waivers, if any | 1.64% | 1.61% | 1.42% | 1.54% | 1.50% |
Expenses net of all reductions | 1.63% | 1.57% | 1.39% | 1.51% | 1.48% |
Net investment income (loss) | (1.17)% | (.97)% | (.74)% | (.67)% | (.37)% |
Supplemental Data | | | | | |
Net assets, end of period (000 omitted) | $ 35,068 | $ 27,888 | $ 63,326 | $ 55,166 | $ 52,278 |
Portfolio turnover rate | 54% | 129% | 159% | 123% | 54% |
A Total returns would have been lower had certain expenses not been reduced during the periods shown. B Total returns do not include the effect of the former sales charges. C Calculated based on average shares outstanding during the period. D Investment income per share reflects a special dividend which amounted to $0.05 per share. E Expense ratios reflect operating expenses of the fund. Expenses before reductions do not reflect amounts reimbursed by the investment adviser or reductions from brokerage service arrangements or other expense offset arrangements and do not represent the amount paid by the fund during periods when reimbursements or reductions occur. Expenses net of any voluntary waivers reflect expenses after reimbursement by the investment adviser but prior to reductions from brokerage service arrangements or other expense offset arrangements. Expenses net of all reductions represent the net expenses paid by the fund. F For the year ended February 29. G Amount represents less than $.01 per share. |
See accompanying notes which are an integral part of the financial statements.
Technology Sector
Computers Portfolio
Performance
Average annual total return reflects the change in the value of an investment, assuming reinvestment of the fund's dividend income and capital gains (the profits earned upon the sale of securities that have grown in value) and assuming a constant rate of performance each year. The $10,000 table and the fund's returns do not reflect the deduction of taxes that a shareholder would pay on fund distributions or the redemption of fund shares. During periods of reimbursement by Fidelity a fund's total returns will be greater than it would be had the reimbursement not occurred. How a fund did yesterday is no guarantee of how it will do tomorrow.
Average Annual Total Returns
Periods ended February 29, 2004 | Past 1
year | Past 5
years | Past 10
years |
Select Computers | 67.71% | -2.20% | 14.44% |
$10,000 Over 10 Years
Let's say hypothetically that $10,000 was invested in Fidelity Select Computers Portfolio on February 28, 1994. The chart shows how the value of your investment would have grown, and also shows how the S&P 500 Index did over the same period.
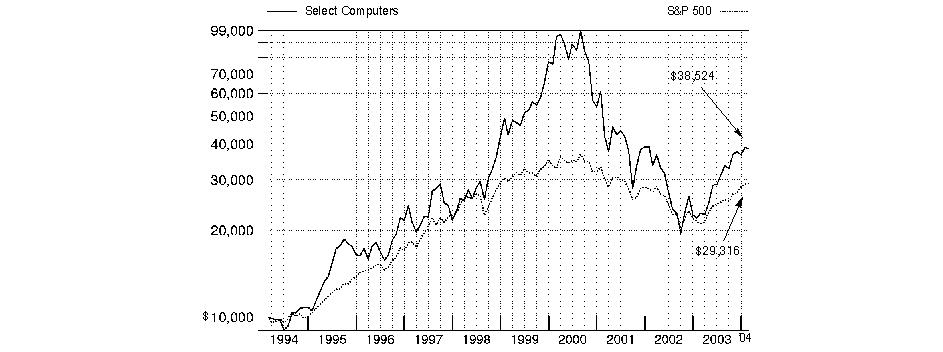
Annual Report
Computers Portfolio
Management's Discussion of Fund Performance
Comments from Sonu Kalra, Portfolio Manager of Fidelity® Select Computers Portfolio
From March 2003 through the end of February 2004, domestic stocks recovered dramatically from their prior three-year swoon, driven largely by a broad-based economic and corporate profit recovery. Most major equity benchmarks gained 35% or more during the 12-month period, led by the Russell 2000® Index - a measure of the overall small-cap universe - which advanced 64.41%. As investors grew more confident about the economy's vitality, small-cap stocks were bid up, particularly those with no current earnings. In comparison, the Wilshire 5000® Total Market Index, commonly used as a proxy for the entire U.S. stock market's performance, rose 42.47%. Every sector of the market posted a double-digit advance, with economically sensitive issues - especially technology stocks - leading the way. The tech-heavy NASDAQ Composite® Index returned 52.47% during the past year, despite a negative return in February as investors turned to the more value-oriented segments of the market. The broader Standard & Poor's 500SM Index climbed 38.52% during the year, slightly outperforming the 37.07% increase for the blue-chip Dow Jones Industrial AverageSM.
For the 12 months ending February 29, 2004, the fund returned 67.71%, beating the 55.88% return of the Goldman Sachs® Technology Index and easily outdistancing the S&P 500®. Stock picking in the semiconductor and software segments was especially strong compared with the Goldman Sachs index. Chip maker Intel was the fund's largest contributor in absolute terms, while wireless infrastructure stock LM Ericsson aided performance in absolute terms and versus the sector benchmark. Aggressive cost cutting and the prospect of higher capital expenditures in the wireless industry boosted Ericsson's stock. Semiconductor maker Analog Devices also contributed both in absolute terms and relative to the sector benchmark, its stock surging on news that the company had blown past estimates for its fiscal first-quarter earnings. On the negative side, PalmOne was the fund's largest detractor on an absolute basis. The stock struggled due to the announcement of an approximately 10% cutback in the company's workforce, along with the news of planned phase-outs of some PalmOne products by a key retailer. Compared with the Goldman Sachs index, telecommunications network provider Nortel Networks was the largest detractor, as I underweighted the stock and it gained more than 270%.
The views expressed in this statement reflect those of the portfolio manager only through the end of the period of the report as stated on the cover and do not necessarily represent the views of Fidelity or any other person in the Fidelity organization. Any such views are subject to change at any time based upon market or other conditions and Fidelity disclaims any responsibility to update such views. These views may not be relied on as investment advice and, because investment decisions for a Fidelity fund are based on numerous factors, may not be relied on as an indication of trading intent on behalf of any Fidelity fund.
Annual Report
Computers Portfolio
Investment Summary
Top Ten Stocks as of February 29, 2004 |
| % of fund's
net assets |
Dell, Inc. | 5.4 |
Intel Corp. | 5.4 |
Cisco Systems, Inc. | 4.6 |
Analog Devices, Inc. | 3.9 |
EMC Corp. | 3.0 |
Hewlett-Packard Co. | 2.9 |
Lexmark International, Inc. Class A | 2.7 |
National Semiconductor Corp. | 2.5 |
Texas Instruments, Inc. | 2.4 |
Xilinx, Inc. | 2.0 |
| 34.8 |
Top Industries as of February 29, 2004 |
% of fund's net assets |
| Semiconductors & Semiconductor Equipment | 36.8% | |
| Computers & Peripherals | 21.9% | |
| Communications Equipment | 20.2% | |
| Electronic Equipment & Instruments | 6.6% | |
| Software | 6.6% | |
| All Others* | 7.9% | |

* Includes short-term investments and net other assets. |
Annual Report
Computers Portfolio
Investments February 29, 2004
Showing Percentage of Net Assets
Common Stocks - 98.7% |
| Shares | | Value (Note 1) |
COMMUNICATIONS EQUIPMENT - 20.2% |
3Com Corp. (a) | 268,400 | | $ 1,878,800 |
ADC Telecommunications, Inc. (a) | 1,330,000 | | 3,990,000 |
Airspan Networks, Inc. (a) | 235,400 | | 1,122,858 |
Alcatel SA sponsored ADR (a) | 653,400 | | 10,578,546 |
Alvarion Ltd. (a) | 341,200 | | 4,930,340 |
Andrew Corp. (a) | 94,000 | | 1,675,080 |
Arris Group, Inc. (a) | 182,800 | | 1,895,636 |
AudioCodes Ltd. (a) | 77,500 | | 1,067,175 |
Avaya, Inc. (a) | 790,400 | | 13,555,360 |
Avici Systems, Inc. (a) | 80,000 | | 1,640,800 |
Brocade Communications Systems, Inc. (a) | 759,000 | | 5,290,230 |
CIENA Corp. (a) | 587,800 | | 3,368,094 |
Cisco Systems, Inc. (a) | 2,008,800 | | 46,403,280 |
Comverse Technology, Inc. (a) | 317,400 | | 6,259,128 |
Corning, Inc. (a) | 292,600 | | 3,672,130 |
ECI Telecom Ltd. (a) | 19,900 | | 137,091 |
Emulex Corp. (a) | 157,400 | | 3,648,532 |
Enterasys Networks, Inc. (a) | 928,300 | | 4,223,765 |
Extreme Networks, Inc. (a) | 175,900 | | 1,415,995 |
F5 Networks, Inc. (a) | 42,200 | | 1,396,398 |
FalconStor Software, Inc. (a) | 197,500 | | 1,477,300 |
Finisar Corp. (a) | 574,200 | | 1,647,954 |
Foundry Networks, Inc. (a) | 16,400 | | 387,040 |
ITF Optical Technologies, Inc. Series A (c) | 31,365 | | 39,206 |
Juniper Networks, Inc. (a) | 43,500 | | 1,125,345 |
Lucent Technologies, Inc. (a) | 1,825,800 | | 7,650,102 |
Marconi Corp. PLC (a) | 307,903 | | 4,102,359 |
McDATA Corp. Class A (a) | 426,900 | | 3,440,814 |
Motorola, Inc. | 475,200 | | 8,767,440 |
MRV Communications, Inc. (a) | 292,800 | | 1,206,336 |
NetScreen Technologies, Inc. (a) | 48,100 | | 1,705,145 |
NMS Communications Corp. (a) | 210,000 | | 1,621,200 |
Nortel Networks Corp. (a) | 579,900 | | 4,610,380 |
Oplink Communications, Inc. (a) | 375,000 | | 993,750 |
Powerwave Technologies, Inc. (a) | 512,799 | | 5,061,326 |
QLogic Corp. (a) | 44,700 | | 1,868,460 |
QUALCOMM, Inc. | 123,800 | | 7,855,110 |
Research in Motion Ltd. (a) | 13,000 | | 1,285,544 |
Riverstone Networks, Inc. (a) | 537,100 | | 902,328 |
Scientific-Atlanta, Inc. | 100,000 | | 3,310,000 |
SeaChange International, Inc. (a) | 62,600 | | 1,079,224 |
Sierra Wireless, Inc. (a) | 90,800 | | 2,491,229 |
Sonus Networks, Inc. (a) | 34,800 | | 206,364 |
Telefonaktiebolaget LM Ericsson ADR (a) | 651,400 | | 18,903,628 |
WJ Communications, Inc. (a) | 309,900 | | 1,558,797 |
Zhone Technologies, Inc. (a) | 53,000 | | 259,170 |
TOTAL COMMUNICATIONS EQUIPMENT | | 201,704,789 |
COMPUTERS & PERIPHERALS - 21.9% |
Acer, Inc. | 1,177,000 | | 1,858,421 |
|
| Shares | | Value (Note 1) |
Ambit Microsystems Corp. | 526,900 | | $ 1,537,122 |
Apple Computer, Inc. (a) | 340,600 | | 8,150,558 |
ASUSTeK Computer, Inc. | 711,000 | | 1,871,053 |
Concurrent Computer Corp. (a) | 650,900 | | 2,649,163 |
Dell, Inc. (a) | 1,651,100 | | 53,908,413 |
Diebold, Inc. | 20,300 | | 1,069,607 |
Dot Hill Systems Corp. (a) | 375,900 | | 5,273,877 |
EMC Corp. (a) | 2,085,900 | | 29,870,088 |
Hewlett-Packard Co. | 1,267,400 | | 28,782,654 |
Hutchinson Technology, Inc. (a) | 277,900 | | 7,911,813 |
Komag, Inc. (a) | 281,400 | | 6,427,176 |
Lexmark International, Inc. Class A (a) | 325,200 | | 26,760,708 |
Maxtor Corp. (a) | 334,300 | | 3,426,575 |
Moser-Baer India Ltd. | 174,400 | | 1,247,478 |
Network Appliance, Inc. (a) | 218,700 | | 4,737,042 |
PalmOne, Inc. (a) | 400,120 | | 4,013,204 |
Quanta Computer, Inc. | 1,146,200 | | 2,912,899 |
Quantum Corp. (a) | 524,800 | | 2,020,480 |
Silicon Graphics, Inc. (a) | 117,100 | | 377,062 |
Storage Technology Corp. (a) | 204,200 | | 5,997,354 |
Sun Microsystems, Inc. (a) | 1,629,000 | | 8,698,860 |
Synaptics, Inc. (a) | 182,300 | | 3,332,444 |
Western Digital Corp. (a) | 551,400 | | 6,280,446 |
TOTAL COMPUTERS & PERIPHERALS | | 219,114,497 |
DIVERSIFIED TELECOMMUNICATION SERVICES - 0.1% |
Global Crossing Ltd. (a) | 36,900 | | 996,300 |
ELECTRICAL EQUIPMENT - 0.4% |
Byd Co. Ltd. (H Shares) | 482,000 | | 1,597,544 |
Kumho Electric Co. Ltd. | 24,786 | | 945,380 |
Power-One, Inc. (a) | 160,900 | | 1,972,634 |
TOTAL ELECTRICAL EQUIPMENT | | 4,515,558 |
ELECTRONIC EQUIPMENT & INSTRUMENTS - 6.6% |
Ace Digitech Co. Ltd. (a) | 239,000 | | 1,218,829 |
Agilent Technologies, Inc. (a) | 182,100 | | 6,225,999 |
Agilysys, Inc. | 142,900 | | 1,901,285 |
Amphenol Corp. Class A (a) | 23,100 | | 1,428,735 |
Arrow Electronics, Inc. (a) | 459,100 | | 11,293,860 |
Avnet, Inc. (a) | 97,200 | | 2,289,060 |
Bell Microproducts, Inc. (a) | 571,000 | | 5,264,620 |
DDi Corp. (a) | 86,500 | | 1,267,225 |
Hon Hai Precision Industries Co. Ltd. | 714,200 | | 3,178,995 |
Ingram Micro, Inc. Class A (a) | 173,600 | | 3,294,928 |
Merix Corp. (a) | 2,800 | | 68,880 |
Nano-Proprietary, Inc. (a) | 337,700 | | 753,071 |
National Instruments Corp. | 112,425 | | 3,885,408 |
Photon Dynamics, Inc. (a) | 71,000 | | 2,535,410 |
Solectron Corp. (a) | 469,500 | | 3,000,105 |
Somera Communications, Inc. (a) | 131,300 | | 354,510 |
Symbol Technologies, Inc. | 154,800 | | 2,634,696 |
Tech Data Corp. (a) | 150,900 | | 6,106,923 |
Common Stocks - continued |
| Shares | | Value (Note 1) |
ELECTRONIC EQUIPMENT & INSTRUMENTS - CONTINUED |
TTM Technologies, Inc. (a) | 90,100 | | $ 1,456,016 |
Veeco Instruments, Inc. (a) | 73,500 | | 2,143,995 |
Vishay Intertechnology, Inc. (a) | 137,200 | | 3,088,372 |
World Peace Industrial Co. Ltd. | 2,789,000 | | 2,927,402 |
TOTAL ELECTRONIC EQUIPMENT & INSTRUMENTS | | 66,318,324 |
HOUSEHOLD DURABLES - 0.6% |
Koninklijke Philips Electronics NV
(NY Shares) | 106,100 | | 3,227,562 |
Sony Corp. sponsored ADR | 57,000 | | 2,333,580 |
TOTAL HOUSEHOLD DURABLES | | 5,561,142 |
INDUSTRIAL CONGLOMERATES - 0.2% |
Siemens AG sponsored ADR | 24,600 | | 1,913,880 |
INTERNET SOFTWARE & SERVICES - 3.0% |
Akamai Technologies, Inc. (a) | 146,600 | | 2,199,000 |
Blue Coat Systems, Inc. (a) | 51,000 | | 2,092,071 |
EarthLink, Inc. (a) | 323,900 | | 2,957,207 |
Internap Network Services Corp. (a) | 1,000,500 | | 1,880,940 |
Internet Security Systems, Inc. (a) | 31,700 | | 561,407 |
Netegrity, Inc. (a) | 263,500 | | 2,411,025 |
Openwave Systems, Inc. (a) | 153,933 | | 2,333,624 |
Opsware, Inc. (a) | 292,700 | | 2,546,490 |
RADWARE Ltd. (a) | 151,700 | | 4,232,430 |
TheStreet.com, Inc. (a) | 379,900 | | 1,857,711 |
United Online, Inc. (a) | 238,500 | | 4,106,970 |
Yahoo!, Inc. (a) | 69,000 | | 3,063,600 |
TOTAL INTERNET SOFTWARE & SERVICES | | 30,242,475 |
IT SERVICES - 0.2% |
CompuCom Systems, Inc. (a) | 214,300 | | 1,176,507 |
CSG Systems International, Inc. (a) | 60,400 | | 845,600 |
TOTAL IT SERVICES | | 2,022,107 |
MACHINERY - 0.1% |
Magnecomp International Ltd. (a) | 378,000 | | 200,389 |
TK Corp. | 120,392 | | 934,736 |
TOTAL MACHINERY | | 1,135,125 |
MEDIA - 0.4% |
Cinram International, Inc. | 100,000 | | 2,025,534 |
XM Satellite Radio Holdings, Inc.
Class A (a) | 65,000 | | 1,591,200 |
TOTAL MEDIA | | 3,616,734 |
SEMICONDUCTORS & SEMICONDUCTOR EQUIPMENT - 36.8% |
Advanced Energy Industries, Inc. (a) | 82,500 | | 1,801,800 |
Agere Systems, Inc.: | | | |
Class A (a) | 2,149,111 | | 8,338,551 |
|
| Shares | | Value (Note 1) |
Class B (a) | 2,105,689 | | $ 7,812,106 |
Altera Corp. (a) | 636,200 | | 14,047,296 |
Analog Devices, Inc. | 792,170 | | 39,529,283 |
Applied Micro Circuits Corp. (a) | 230,900 | | 1,491,614 |
ATMI, Inc. (a) | 129,500 | | 3,515,925 |
Broadcom Corp. Class A (a) | 111,900 | | 4,540,902 |
Conexant Systems, Inc. (a) | 1,594,400 | | 11,718,840 |
Cree, Inc. (a) | 26,700 | | 639,465 |
Cypress Semiconductor Corp. (a) | 227,600 | | 4,911,608 |
FEI Co. (a) | 41,000 | | 932,750 |
FormFactor, Inc. | 86,100 | | 1,751,274 |
GlobespanVirata, Inc. (a) | 285,700 | | 2,534,159 |
Integrated Circuit Systems, Inc. (a) | 497,400 | | 13,698,396 |
Integrated Device Technology, Inc. (a) | 657,900 | | 10,848,771 |
Intel Corp. | 1,835,000 | | 53,637,050 |
International Rectifier Corp. (a) | 34,100 | | 1,574,056 |
Intersil Corp. Class A | 352,900 | | 8,324,911 |
Lattice Semiconductor Corp. (a) | 252,450 | | 2,607,809 |
Linear Technology Corp. | 221,800 | | 8,869,782 |
LSI Logic Corp. (a) | 192,500 | | 1,944,250 |
Marvell Technology Group Ltd. (a) | 115,900 | | 5,276,927 |
Maxim Integrated Products, Inc. | 134,200 | | 6,697,922 |
MEMC Electronic Materials, Inc. (a) | 246,600 | | 2,340,234 |
Microchip Technology, Inc. | 131,300 | | 3,742,050 |
Micron Technology, Inc. (a) | 271,200 | | 4,078,848 |
Mindspeed Technologies, Inc. (a) | 335,299 | | 2,977,455 |
National Semiconductor Corp. (a) | 647,700 | | 25,493,472 |
NVIDIA Corp. (a) | 524,100 | | 11,661,225 |
ON Semiconductor Corp. (a) | 575,300 | | 4,867,038 |
Pericom Semiconductor Corp. (a) | 85,700 | | 985,550 |
PMC-Sierra, Inc. (a) | 245,000 | | 4,875,500 |
Power Integrations, Inc. (a) | 98,300 | | 2,897,884 |
Samsung Electronics Co. Ltd. | 14,400 | | 6,659,311 |
Silicon Image, Inc. (a) | 633,400 | | 7,062,410 |
STMicroelectronics NV (NY Shares) | 185,900 | | 4,805,515 |
Taiwan Semiconductor Manufacturing Co. Ltd. (a) | 519,000 | | 991,173 |
Taiwan Semiconductor Manufacturing Co. Ltd. sponsored ADR (a) | 405,244 | | 4,210,485 |
Teradyne, Inc. (a) | 286,600 | | 7,064,690 |
Texas Instruments, Inc. | 798,000 | | 24,458,700 |
Tokyo Electron Ltd. | 44,100 | | 2,667,086 |
Tower Semicondutor Ltd. (a) | 240,000 | | 1,680,000 |
Trident Microsystems, Inc. (a) | 228,753 | | 3,737,824 |
United Microelectronics Corp.
sponsored ADR (a) | 639,885 | | 3,333,801 |
Xilinx, Inc. (a) | 486,400 | | 20,448,256 |
TOTAL SEMICONDUCTORS & SEMICONDUCTOR
EQUIPMENT | | 368,083,954 |
SOFTWARE - 6.6% |
Actuate Corp. (a) | 338,300 | | 964,155 |
Amdocs Ltd. (a) | 202,300 | | 5,640,124 |
BakBone Software, Inc. (a) | 680,600 | | 2,140,492 |
Common Stocks - continued |
| Shares | | Value (Note 1) |
SOFTWARE - CONTINUED |
BEA Systems, Inc. (a) | 389,000 | | $ 5,368,200 |
Cadence Design Systems, Inc. (a) | 228,700 | | 3,528,841 |
Concord Communications, Inc. (a) | 185,300 | | 3,428,050 |
FileNET Corp. (a) | 92,400 | | 2,614,920 |
Lawson Software, Inc. (a) | 115,692 | | 1,014,619 |
Micromuse, Inc. (a) | 184,800 | | 1,655,808 |
Microsoft Corp. | 372,700 | | 9,876,550 |
Mobius Management Systems, Inc. (a) | 99,253 | | 970,694 |
Nintendo Co. Ltd. | 37,800 | | 3,642,454 |
Peregrine Systems, Inc. (a) | 120,000 | | 2,820,000 |
Quest Software, Inc. (a) | 137,500 | | 2,168,375 |
Red Hat, Inc. (a) | 163,867 | | 2,962,715 |
Siebel Systems, Inc. (a) | 238,478 | | 3,114,523 |
Sonic Solutions, Inc. (a) | 119,500 | | 2,366,100 |
Symantec Corp. (a) | 73,900 | | 3,040,246 |
Synopsys, Inc. (a) | 163,200 | | 4,811,136 |
VERITAS Software Corp. (a) | 101,700 | | 3,093,714 |
Visual Networks, Inc. (a) | 100,000 | | 400,000 |
TOTAL SOFTWARE | | 65,621,716 |
SPECIALTY RETAIL - 1.4% |
Best Buy Co., Inc. | 261,500 | | 13,924,875 |
WIRELESS TELECOMMUNICATION SERVICES - 0.2% |
At Road, Inc. (a) | 5,100 | | 60,945 |
LCC International, Inc. (a) | 360,100 | | 2,358,655 |
TOTAL WIRELESS TELECOMMUNICATION
SERVICES | | 2,419,600 |
TOTAL COMMON STOCKS (Cost $823,136,907) | 987,191,076 |
Convertible Preferred Stocks - 0.0% |
| | | |
COMMUNICATIONS EQUIPMENT - 0.0% |
Procket Networks, Inc. Series C (c) | 233,000 | | 58,250 |
SOFTWARE - 0.0% |
Monterey Design Systems Series E (c) | 298,000 | | 149,000 |
TOTAL CONVERTIBLE PREFERRED STOCKS (Cost $3,865,608) | 207,250 |
Money Market Funds - 3.1% |
| Shares | | Value (Note 1) |
Fidelity Cash Central Fund, 1.08% (b) | 3,676,191 | | $ 3,676,191 |
Fidelity Securities Lending Cash Central Fund, 1.08% (b) | 27,045,900 | | 27,045,900 |
TOTAL MONEY MARKET FUNDS (Cost $30,722,091) | 30,722,091 |
TOTAL INVESTMENT PORTFOLIO - 101.8% (Cost $857,724,606) | | 1,018,120,417 |
NET OTHER ASSETS - (1.8)% | | (18,412,677) |
NET ASSETS - 100% | $ 999,707,740 |
Legend |
(a) Non-income producing |
(b) Affiliated fund that is available only to investment companies and other accounts managed by Fidelity Investments. The rate quoted is the annualized seven-day yield of the fund at period end. A complete listing of the fund's holdings as of its most recent fiscal year end is available upon request. |
(c) Restricted securities - Investment in securities not registered under the Securities Act of 1933 (excluding 144A issues). At the end of the period, the value of restricted securities (excluding 144A issues) amounted to $246,456 or 0.0% of net assets. |
Additional information on each holding is as follows: |
Security | Acquisition Date | Acquisition Cost |
ITF Optical Technologies, Inc.
Series A | 10/11/00 | $ 1,575,000 |
Monterey Design Systems Series E | 11/1/00 | $ 1,564,500 |
Procket Networks, Inc. Series C | 11/15/00 - 12/26/00 | $ 2,301,108 |
Other Information |
Purchases and sales of securities, other than short-term securities, aggregated $1,167,192,726 and $1,108,806,331, respectively. |
The fund placed a portion of its portfolio transactions with brokerage firms which are affiliates of the investment adviser. The commissions paid to these affiliated firms were $435,101 for the period. |
The fund participated in the interfund lending program as a borrower. The average daily loan balance during the period for which loans were outstanding amounted to $5,090,500. The weighted average interest rate was 1.14%. At period end there were no interfund loans outstanding. |
Distribution of investments by country of issue, as a percentage of total net assets, is as follows: |
United States of America | 87.4% |
Taiwan | 2.3% |
Sweden | 1.9% |
Canada | 1.3% |
Israel | 1.2% |
France | 1.1% |
Korea (South) | 1.0% |
United Kingdom | 1.0% |
Japan | 1.0% |
Others (individually less than 1%) | 1.8% |
| 100.0% |
Income Tax Information |
At February 29, 2004, the fund had a capital loss carryforward of approximately $901,379,000 of which $649,599,000 and $251,780,000 will expire on February 28, 2010 and 2011, respectively. |
See accompanying notes which are an integral part of the financial statements.
Technology Sector
Computers Portfolio
Financial Statements
Statement of Assets and Liabilities
| February 29, 2004 |
| | |
Assets | | |
Investment in securities, at value (including securities loaned of $25,942,898) (cost $857,724,606) - See accompanying schedule | | $ 1,018,120,417 |
Foreign currency held at value
(cost $8,391,003) | | 8,432,271 |
Receivable for investments sold | | 38,637,757 |
Receivable for fund shares sold | | 390,521 |
Dividends receivable | | 184,622 |
Interest receivable | | 4,119 |
Prepaid expenses | | 4,094 |
Other affiliated receivables | | 315 |
Other receivables | | 343,124 |
Total assets | | 1,066,117,240 |
| | |
Liabilities | | |
Payable for investments purchased | $ 35,015,335 | |
Payable for fund shares redeemed | 3,405,275 | |
Accrued management fee | 488,511 | |
Other affiliated payables | 352,453 | |
Other payables and accrued expenses | 102,026 | |
Collateral on securities loaned, at value | 27,045,900 | |
Total liabilities | | 66,409,500 |
| | |
Net Assets | | $ 999,707,740 |
Net Assets consist of: | | |
Paid in capital | | $ 1,749,510,574 |
Accumulated undistributed net realized gain (loss) on investments and foreign currency transactions | | (910,183,273) |
Net unrealized appreciation (depreciation) on investments and assets and liabilities in foreign currencies | | 160,380,439 |
Net Assets, for 26,657,310 shares outstanding | | $ 999,707,740 |
Net Asset Value, offering price and redemption price per share ($999,707,740 ÷ 26,657,310 shares) | | $ 37.50 |
Statement of Operations
| Year ended February 29, 2004 |
| | |
Investment Income | | |
Dividends | | $ 2,007,936 |
Interest | | 335,141 |
Security lending | | 285,288 |
Total income | | 2,628,365 |
| | |
Expenses | | |
Management fee | $ 4,883,292 | |
Transfer agent fees | 4,791,705 | |
Accounting and security lending fees | 451,085 | |
Non-interested trustees' compensation | 4,064 | |
Custodian fees and expenses | 85,934 | |
Registration fees | 25,743 | |
Audit | 47,268 | |
Legal | 5,508 | |
Interest | 322 | |
Miscellaneous | 31,063 | |
Total expenses before reductions | 10,325,984 | |
Expense reductions | (580,887) | 9,745,097 |
Net investment income (loss) | | (7,116,732) |
Realized and Unrealized Gain (Loss) Net realized gain (loss) on: | | |
Investment securities | 183,178,006 | |
Foreign currency transactions | 57,849 | |
Total net realized gain (loss) | | 183,235,855 |
Change in net unrealized appreciation (depreciation) on: Investment securities (net of deferred foreign taxes of $(58,626)) | 219,339,624 | |
Assets and liabilities in foreign currencies | 43,200 | |
Total change in net unrealized appreciation (depreciation) | | 219,382,824 |
Net gain (loss) | | 402,618,679 |
Net increase (decrease) in net assets resulting from operations | | $ 395,501,947 |
Other Information | | |
Sales charges paid to FDC | | $ 380,503 |
Deferred sales charges withheld by FDC | | $ 3,001 |
Exchange fees withheld by
FSC | | $ 12,285 |
See accompanying notes which are an integral part of the financial statements.
Annual Report
Computers Portfolio
Financial Statements - continued
Statement of Changes in Net Assets
| Year ended
February 29,
2004 | Year ended
February 28,
2003 |
Increase (Decrease) in Net Assets | | |
Operations | | |
Net investment income (loss) | $ (7,116,732) | $ (6,779,371) |
Net realized gain (loss) | 183,235,855 | (227,126,964) |
Change in net unrealized appreciation (depreciation) | 219,382,824 | (55,546,425) |
Net increase (decrease) in net assets resulting from operations | 395,501,947 | (289,452,760) |
Share transactions
Net proceeds from sales of shares | 281,411,926 | 96,965,989 |
Cost of shares redeemed | (249,855,642) | (201,392,121) |
Net increase (decrease) in net assets resulting from share transactions | 31,556,284 | (104,426,132) |
Redemption fees | 161,436 | 131,659 |
Total increase (decrease) in net assets | 427,219,667 | (393,747,233) |
| | |
Net Assets | | |
Beginning of period | 572,488,073 | 966,235,306 |
End of period | $ 999,707,740 | $ 572,488,073 |
Other Information Shares | | |
Sold | 8,778,752 | 3,812,824 |
Redeemed | (7,724,813) | (7,735,021) |
Net increase (decrease) | 1,053,939 | (3,922,197) |
Financial Highlights
Years ended February 28, | 2004 E | 2003 | 2002 | 2001 | 2000 E |
Selected Per-Share Data | | | | | |
Net asset value, beginning of period | $ 22.36 | $ 32.73 | $ 41.31 | $ 127.95 | $ 68.37 |
Income from Investment Operations | | | | | |
Net investment income (loss) C | (.27) | (.25) | (.30) | (.51) | (.41) |
Net realized and unrealized gain (loss) | 15.40 | (10.12) | (8.29) | (64.38) | 74.86 |
Total from investment operations | 15.13 | (10.37) | (8.59) | (64.89) | 74.45 |
Distributions from net investment income | - | - | - | (11.85) | (14.92) |
Distributions in excess of net realized gain | - | - | - | (9.94) | - |
Total distributions | - | - | - | (21.79) | (14.92) |
Redemption fees added to paid in capital C | .01 | - F | .01 | .04 | .05 |
Net asset value, end of period | $ 37.50 | $ 22.36 | $ 32.73 | $ 41.31 | $ 127.95 |
Total Return A,B | 67.71% | (31.68)% | (20.77)% | (55.11)% | 119.58% |
Ratios to Average Net Assets D | | | | | |
Expenses before expense reductions | 1.23% | 1.40% | 1.19% | .96% | 1.07% |
Expenses net of voluntary waivers, if any | 1.23% | 1.40% | 1.19% | .96% | 1.07% |
Expenses net of all reductions | 1.16% | 1.31% | 1.13% | .95% | 1.05% |
Net investment income (loss) | (.85)% | (.96)% | (.77)% | (.52)% | (.47)% |
Supplemental Data | | | | | |
Net assets, end of period (000 omitted) | $ 999,708 | $ 572,488 | $ 966,235 | $ 1,472,080 | $ 3,824,215 |
Portfolio turnover rate | 138% | 106% | 206% | 100% | 129% |
A Total returns would have been lower had certain expenses not been reduced during the periods shown. B Total returns do not include the effect of the former sales charges. C Calculated based on average shares outstanding during the period. D Expense ratios reflect operating expenses of the fund. Expenses before reductions do not reflect amounts reimbursed by the investment adviser or reductions from brokerage service arrangements or other expense offset arrangements and do not represent the amount paid by the fund during periods when reimbursements or reductions occur. Expenses net of any voluntary waivers reflect expenses after reimbursement by the investment adviser but prior to reductions from brokerage service arrangements or other expense offset arrangements. Expenses net of all reductions represent the net expenses paid by the fund. E For the year ended February 29. F Amount represents less than $.01 per share. |
See accompanying notes which are an integral part of the financial statements.
Technology Sector
Developing Communications Portfolio
Performance
Average annual total return reflects the change in the value of an investment, assuming reinvestment of the fund's dividend income and capital gains (the profits earned upon the sale of securities that have grown in value) and assuming a constant rate of performance each year. The $10,000 table and the fund's returns do not reflect the deduction of taxes that a shareholder would pay on fund distributions or the redemption of fund shares. During periods of reimbursement by Fidelity a fund's total returns will be greater than it would be had the reimbursement not occurred. How a fund did yesterday is no guarantee of how it will do tomorrow.
Average Annual Total Returns
Periods ended February 29, 2004 | Past 1
year | Past 5
years | Past 10
years |
Select Developing Communications | 101.89% | -0.06% | 11.32% |
$10,000 Over 10 Years
Let's say hypothetically that $10,000 was invested in Fidelity Select Developing Communications Portfolio on February 28, 1994. The chart shows how the value of your investment would have grown, and also shows how the S&P 500 Index did over the same period.
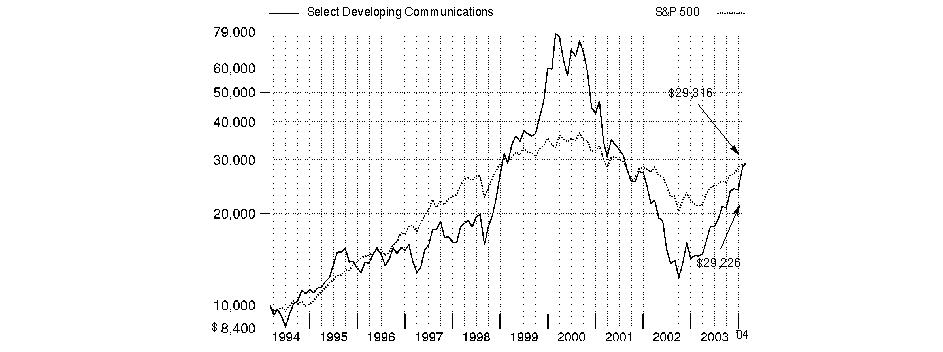
Annual Report
Developing Communications Portfolio
Management's Discussion of Fund Performance
Comments from Charlie Chai, Portfolio Manager of Fidelity® Select Developing Communications Portfolio
From March 2003 through the end of February 2004, domestic stocks recovered dramatically from their prior three-year swoon, driven largely by a broad-based economic and corporate profit recovery. Most major equity benchmarks gained 35% or more during the 12-month period, led by the Russell 2000® Index - a measure of the overall small-cap universe - which advanced 64.41%. As investors grew more confident about the economy's vitality, small-cap stocks were bid up, particularly those with no current earnings. In comparison, the Wilshire 5000® Total Market Index, commonly used as a proxy for the entire U.S. stock market's performance, rose 42.47%. Every sector of the market posted a double-digit advance, with economically sensitive issues - especially technology stocks - leading the way. The tech-heavy NASDAQ Composite® Index returned 52.47% during the past year, despite a negative return in February as investors turned to the more value-oriented segments of the market. The broader Standard & Poor's 500SM Index climbed 38.52% during the year, slightly outperforming the 37.07% increase for the blue-chip Dow Jones Industrial AverageSM.
For the 12 months ending February 29, 2004, the fund returned 101.89%, far outdistancing the 55.88% return of the Goldman Sachs® Technology Index. Moreover, the fund beat the Standard & Poor's 500 Index by an even wider margin. Large overweightings in wireless and wireline telecommunications equipment played a significant role in the fund's outperformance versus the Goldman Sachs index. Favorable stock selection in the wireless equipment space also drove performance. The fund's largest holding at period end - LM Ericsson - also was its strongest contributor both in absolute terms and compared with its sector benchmark. Ericsson was an indirect beneficiary of Nortel Networks' favorable earnings report, but the stock was helped as well by the improving prospects for stepped-up capital expenditures in the wireless industry and by effective cost-containment measures. Wireline equipment provider Marconi was another of the fund's success stories - its share price almost tripled during the period. Another outstanding performer in the wireline equipment space was Avaya. On the other hand, the fund was hurt by my picks in the computer storage and peripherals area, two of which - Maxtor and Seagate Technology - weighed down its returns on both an absolute basis and relative to the sector benchmark.
The views expressed in this statement reflect those of the portfolio manager only through the end of the period of the report as stated on the cover and do not necessarily represent the views of Fidelity or any other person in the Fidelity organization. Any such views are subject to change at any time based upon market or other conditions and Fidelity disclaims any responsibility to update such views. These views may not be relied on as investment advice and, because investment decisions for a Fidelity fund are based on numerous factors, may not be relied on as an indication of trading intent on behalf of any Fidelity fund.
Annual Report
Developing Communications Portfolio
Investment Summary
Top Ten Stocks as of February 29, 2004 |
| % of fund's
net assets |
Telefonaktiebolaget LM Ericsson ADR | 12.4 |
Alcatel SA sponsored ADR | 8.4 |
Motorola, Inc. | 6.4 |
Marconi Corp. PLC | 5.5 |
Comverse Technology, Inc. | 4.1 |
RADWARE Ltd. | 2.5 |
Enterasys Networks, Inc. | 2.1 |
American Tower Corp. Class A | 2.0 |
Sogecable SA | 1.9 |
Juniper Networks, Inc. | 1.8 |
| 47.1 |
Top Industries as of February 29, 2004 |
% of fund's net assets |
| Communications Equipment | 65.8% | |
| Wireless Telecommunication Services | 9.5% | |
| Semiconductors & Semiconductor Equipment | 7.7% | |
| Media | 3.8% | |
| Internet Software & Services | 3.7% | |
| All Others* | 9.5% | |

* Includes short-term investments and net other assets. |
Annual Report
Developing Communications Portfolio
Investments February 29, 2004
Showing Percentage of Net Assets
Common Stocks - 95.2% |
| Shares | | Value (Note 1) |
COMMUNICATIONS EQUIPMENT - 65.8% |
Aastra Technologies Ltd. (a) | 141,600 | | $ 2,115,332 |
ADC Telecommunications, Inc. (a) | 2,854,395 | | 8,563,185 |
Adtran, Inc. | 52,800 | | 1,719,168 |
Adva AG Optical Networking (a) | 247,600 | | 2,165,547 |
Advanced Fibre Communications, Inc. (a) | 189,100 | | 4,636,732 |
Airspan Networks, Inc. (a) | 200,700 | | 957,339 |
Alcatel SA sponsored ADR (a) | 4,883,400 | | 79,062,246 |
Alvarion Ltd. (a) | 596,900 | | 8,625,205 |
Andrew Corp. (a) | 321,100 | | 5,722,002 |
Arris Group, Inc. (a) | 100,000 | | 1,037,000 |
AudioCodes Ltd. (a) | 159,400 | | 2,194,938 |
Avaya, Inc. (a) | 531,300 | | 9,111,795 |
Bookham Technology PLC sponsored ADR (a) | 294,300 | | 735,750 |
C-COR.net Corp. (a) | 339,876 | | 5,587,561 |
Carrier Access Corp. (a) | 882,300 | | 10,146,450 |
CIENA Corp. (a) | 1,823,500 | | 10,448,655 |
Comverse Technology, Inc. (a) | 1,966,240 | | 38,774,253 |
Ditech Communications Corp. (a) | 120,100 | | 2,244,669 |
Emulex Corp. (a) | 35,900 | | 832,162 |
Endwave Corp. (a) | 27,400 | | 300,852 |
Enterasys Networks, Inc. (a) | 4,263,200 | | 19,397,560 |
Ericsson Spa | 45,709 | | 1,490,600 |
Extreme Networks, Inc. (a) | 249,600 | | 2,009,280 |
F5 Networks, Inc. (a) | 297,700 | | 9,850,893 |
Foundry Networks, Inc. (a) | 255,200 | | 6,022,720 |
Harmonic, Inc. (a) | 362,100 | | 4,432,104 |
Inter-Tel, Inc. | 70,700 | | 2,138,675 |
JDS Uniphase Corp. (a) | 406,400 | | 1,991,360 |
Juniper Networks, Inc. (a) | 646,000 | | 16,712,020 |
Lucent Technologies, Inc. (a) | 2,971,600 | | 12,451,004 |
Marconi Corp. PLC (a) | 3,899,730 | | 51,958,217 |
Motorola, Inc. | 3,239,200 | | 59,763,240 |
MRV Communications, Inc. (a) | 491,300 | | 2,024,156 |
Nokia Corp. sponsored ADR | 87,500 | | 1,904,875 |
Nortel Networks Corp. (a) | 2,075,300 | | 16,499,260 |
Oplink Communications, Inc. (a) | 156,600 | | 414,990 |
Packeteer, Inc. (a) | 54,700 | | 790,962 |
Powerwave Technologies, Inc. (a) | 893,400 | | 8,817,858 |
QUALCOMM, Inc. | 204,700 | | 12,988,215 |
Redback Networks, Inc. (a) | 1,709,800 | | 13,524,518 |
REMEC, Inc. (a) | 1,039,300 | | 7,275,100 |
Research in Motion Ltd. (a) | 53,200 | | 5,260,842 |
Riverstone Networks, Inc. (a) | 4,052,300 | | 6,807,864 |
Scientific-Atlanta, Inc. | 365,400 | | 12,094,740 |
Spirent PLC (a) | 1,875,400 | | 3,099,295 |
Stratex Networks, Inc. (a) | 133,200 | | 696,636 |
Sycamore Networks, Inc. (a) | 1,194,500 | | 5,626,095 |
Symmetricom, Inc. (a) | 159,100 | | 1,460,538 |
Tekelec (a) | 89,100 | | 1,725,867 |
Telefonaktiebolaget LM Ericsson ADR (a) | 4,026,248 | | 116,841,716 |
Telson Electronics Co. Ltd. (a) | 569,972 | | 1,126,885 |
|
| Shares | | Value (Note 1) |
UTStarcom, Inc. (a) | 287,100 | | $ 9,511,910 |
ViaSat, Inc. (a) | 19,100 | | 510,925 |
Vyyo, Inc. (a) | 181,800 | | 1,436,220 |
WJ Communications, Inc. (a) | 1,041,900 | | 5,240,757 |
TOTAL COMMUNICATIONS EQUIPMENT | | 618,878,738 |
COMPUTERS & PERIPHERALS - 0.4% |
Concurrent Computer Corp. (a) | 905,200 | | 3,684,164 |
NEC Corp. ADR | 700 | | 5,159 |
Novatel Wireless, Inc. (a) | 32 | | 616 |
Seagate Technology | 400 | | 6,920 |
Synaptics, Inc. (a) | 34,500 | | 630,660 |
TOTAL COMPUTERS & PERIPHERALS | | 4,327,519 |
DIVERSIFIED TELECOMMUNICATION SERVICES - 0.2% |
SBC Communications, Inc. | 63,500 | | 1,524,635 |
ELECTRONIC EQUIPMENT & INSTRUMENTS - 2.6% |
Amphenol Corp. Class A (a) | 83,500 | | 5,164,475 |
Anritsu Corp. (a) | 313,000 | | 2,536,402 |
Brightpoint, Inc. (a) | 397,400 | | 6,767,722 |
Celestica, Inc. (sub. vtg.) (a) | 82,500 | | 1,420,869 |
Ingram Micro, Inc. Class A (a) | 134,500 | | 2,552,810 |
Merix Corp. (a) | 12,800 | | 314,880 |
Richardson Electronics Ltd. | 143,900 | | 1,978,625 |
Sirenza Microdevices, Inc. (a) | 543,000 | | 2,829,030 |
Superconductor Technologies, Inc. (a) | 253,200 | | 1,045,716 |
TOTAL ELECTRONIC EQUIPMENT & INSTRUMENTS | | 24,610,529 |
HOUSEHOLD DURABLES - 0.5% |
LG Electronics, Inc. | 78,280 | | 4,397,229 |
INDUSTRIAL CONGLOMERATES - 0.4% |
Siemens AG sponsored ADR | 49,100 | | 3,819,980 |
INTERNET SOFTWARE & SERVICES - 3.7% |
Openwave Systems, Inc. (a) | 431,566 | | 6,542,541 |
RADWARE Ltd. (a) | 847,100 | | 23,634,090 |
Yahoo!, Inc. (a) | 105,700 | | 4,693,080 |
TOTAL INTERNET SOFTWARE & SERVICES | | 34,869,711 |
MEDIA - 3.8% |
EchoStar Communications Corp.
Class A (a) | 461,300 | | 16,662,156 |
Hughes Electronics Corp. (a) | 84,132 | | 1,458,849 |
News Corp. Ltd. sponsored ADR | 9,410 | | 307,989 |
Sogecable SA (a) | 378,100 | | 17,592,811 |
TOTAL MEDIA | | 36,021,805 |
METALS & MINING - 0.1% |
Liquidmetal Technologies (a) | 162,500 | | 599,625 |
Common Stocks - continued |
| Shares | | Value (Note 1) |
SEMICONDUCTORS & SEMICONDUCTOR EQUIPMENT - 7.7% |
Agere Systems, Inc. Class B (a) | 4,178,200 | | $ 15,501,122 |
Conexant Systems, Inc. (a) | 955,300 | | 7,021,455 |
DSP Group, Inc. (a) | 68,300 | | 1,739,601 |
GlobespanVirata, Inc. (a) | 455,500 | | 4,040,285 |
Lattice Semiconductor Corp. (a) | 154,300 | | 1,593,919 |
Marvell Technology Group Ltd. (a) | 45,300 | | 2,062,509 |
Mindspeed Technologies, Inc. (a) | 1,643,800 | | 14,596,944 |
PMC-Sierra, Inc. (a) | 691,200 | | 13,754,880 |
Rohm Co. Ltd. | 37,800 | | 4,284,220 |
Silicon Laboratories, Inc. (a) | 86,200 | | 4,859,094 |
Texas Instruments, Inc. | 24,400 | | 747,860 |
Vitesse Semiconductor Corp. (a) | 255,800 | | 2,043,842 |
TOTAL SEMICONDUCTORS & SEMICONDUCTOR
EQUIPMENT | | 72,245,731 |
SOFTWARE - 0.5% |
Ulticom, Inc. (a) | 432,778 | | 4,362,835 |
WIRELESS TELECOMMUNICATION SERVICES - 9.5% |
American Tower Corp. Class A (a) | 1,680,610 | | 18,570,741 |
Boston Communications Group, Inc. (a) | 182,000 | | 1,958,320 |
Centennial Communications Corp.
Class A (a) | 57,200 | | 386,100 |
Crown Castle International Corp. (a) | 1,186,600 | | 14,298,530 |
KDDI Corp. | 55 | | 286,193 |
Nextel Communications, Inc. Class A (a) | 266,600 | | 7,062,234 |
NII Holdings, Inc. Class B (a) | 32,500 | | 3,521,375 |
SpectraSite, Inc. (a) | 331,000 | | 12,114,600 |
Sprint Corp. - PCS Group Series 1 (a) | 743,700 | | 6,693,300 |
Telesystem International Wireless, Inc. (a) | 644,080 | | 8,199,004 |
Western Wireless Corp. Class A (a) | 356,700 | | 8,592,903 |
Wireless Facilities, Inc. (a) | 582,400 | | 7,611,968 |
TOTAL WIRELESS TELECOMMUNICATION
SERVICES | | 89,295,268 |
TOTAL COMMON STOCKS (Cost $724,133,422) | 894,953,605 |
Convertible Preferred Stocks - 0.0% |
| | | |
COMMUNICATIONS EQUIPMENT - 0.0% |
Procket Networks, Inc. Series C (d)
(Cost $1,293,756) | 131,000 | | 32,750 |
Nonconvertible Bonds - 1.0% |
| Principal
Amount | | |
DIVERSIFIED TELECOMMUNICATION SERVICES - 1.0% |
WorldCom, Inc.: | | | | |
6.4% 8/15/05 (c) | | $ 5,915,000 | | 1,922,375 |
6.5% 5/15/04 (c) | | 7,885,000 | | 2,562,625 |
|
| Principal
Amount | | Value
(Note 1) |
7.5% 5/15/11 (c) | | $ 4,930,000 | | $ 1,602,250 |
8.25% 5/15/31 (c) | | 9,970,000 | | 3,240,250 |
TOTAL NONCONVERTIBLE BONDS (Cost $9,127,044) | 9,327,500 |
Money Market Funds - 15.3% |
| Shares | | |
Fidelity Cash Central Fund, 1.08% (b) | 17,248,460 | | 17,248,460 |
Fidelity Securities Lending Cash Central Fund, 1.08% (b) | 127,027,697 | | 127,027,697 |
TOTAL MONEY MARKET FUNDS (Cost $144,276,157) | 144,276,157 |
TOTAL INVESTMENT PORTFOLIO - 111.5% (Cost $878,830,379) | | 1,048,590,012 |
NET OTHER ASSETS - (11.5)% | | (108,529,017) |
NET ASSETS - 100% | $ 940,060,995 |
Legend |
(a) Non-income producing |
(b) Affiliated fund that is available only to investment companies and other accounts managed by Fidelity Investments. The rate quoted is the annualized seven-day yield of the fund at period end. A complete listing of the fund's holdings as of its most recent fiscal year end is available upon request. |
(c) Non-income producing - issuer filed for bankruptcy or is in default of interest payments. |
(d) Restricted securities - Investment in securities not registered under the Securities Act of 1933 (excluding 144A issues). At the end of the period, the value of restricted securities (excluding 144A issues) amounted to $32,750 or 0.0% of net assets. |
Additional information on each holding is as follows: |
Security | Acquisition Date | Acquisition Cost |
Procket Networks, Inc. Series C | 12/26/00 | $ 1,293,756 |
Other Information |
Purchases and sales of securities, other than short-term securities, aggregated $1,298,354,763 and $1,079,817,239, respectively. |
The fund placed a portion of its portfolio transactions with brokerage firms which are affiliates of the investment adviser. The commissions paid to these affiliated firms were $324,286 for the period. |
Distribution of investments by country of issue, as a percentage of total net assets, is as follows: |
United States of America | 61.5% |
Sweden | 12.4% |
France | 8.4% |
United Kingdom | 5.9% |
Canada | 3.7% |
Israel | 3.6% |
Spain | 1.9% |
Others (individually less than 1%) | 2.6% |
| 100.0% |
Income Tax Information |
At February 29, 2004, the fund had a capital loss carryforward of approximately $1,372,594,000 of which $1,017,146,000 and $355,448,000 will expire on February 28, 2010 and 2011, respectively. |
See accompanying notes which are an integral part of the financial statements.
Annual Report
Developing Communications Portfolio
Financial Statements
Statement of Assets and Liabilities
| February 29, 2004 |
| | |
Assets | | |
Investment in securities, at value (including securities loaned of $123,594,387) (cost $878,830,379) - See accompanying schedule | | $ 1,048,590,012 |
Foreign currency held at value
(cost $8,894,472) | | 9,072,381 |
Receivable for investments sold | | 15,010,527 |
Receivable for fund shares sold | | 6,369,861 |
Dividends receivable | | 24,897 |
Interest receivable | | 42,850 |
Prepaid expenses | | 2,573 |
Other affiliated receivables | | 3,348 |
Other receivables | | 539,765 |
Total assets | | 1,079,656,214 |
| | |
Liabilities | | |
Payable for investments purchased | $ 8,413,844 | |
Payable for fund shares redeemed | 3,376,702 | |
Accrued management fee | 437,305 | |
Other affiliated payables | 304,972 | |
Other payables and accrued expenses | 34,699 | |
Collateral on securities loaned,
at value | 127,027,697 | |
Total liabilities | | 139,595,219 |
| | |
Net Assets | | $ 940,060,995 |
Net Assets consist of: | | |
Paid in capital | | $ 2,143,303,436 |
Accumulated undistributed net realized gain (loss) on investments and foreign currency transactions | | (1,373,181,401) |
Net unrealized appreciation (depreciation) on investments and assets and liabilities in foreign currencies | | 169,938,960 |
Net Assets, for 46,415,007 shares outstanding | | $ 940,060,995 |
Net Asset Value, offering price and redemption price per share ($940,060,995 ÷ 46,415,007 shares) | | $ 20.25 |
Statement of Operations
| Year ended February 29, 2004 |
| | |
Investment Income | | |
Dividends | | $ 1,143,823 |
Interest | | 391,228 |
Security lending | | 463,906 |
Total income | | 1,998,957 |
| | |
Expenses | | |
Management fee | $ 3,247,823 | |
Transfer agent fees | 3,904,613 | |
Accounting and security lending fees | 335,966 | |
Non-interested trustees' compensation | 2,269 | |
Custodian fees and expenses | 54,199 | |
Registration fees | 22,629 | |
Audit | 45,962 | |
Legal | 3,329 | |
Miscellaneous | 18,221 | |
Total expenses before reductions | 7,635,011 | |
Expense reductions | (798,289) | 6,836,722 |
Net investment income (loss) | | (4,837,765) |
Realized and Unrealized Gain (Loss) Net realized gain (loss) on: | | |
Investment securities | 165,836,604 | |
Investments not meeting investment restrictions | 5,583 | |
Foreign currency transactions | 54,399 | |
Total net realized gain (loss) | | 165,896,586 |
Change in net unrealized appreciation (depreciation) on: Investment securities | 207,817,995 | |
Assets and liabilities in foreign currencies | 179,327 | |
Total change in net unrealized appreciation (depreciation) | | 207,997,322 |
Net gain (loss) | | 373,893,908 |
Net increase (decrease) in net assets resulting from operations | | $ 369,056,143 |
Other Information | | |
Sales charges paid to FDC | | $ 294,067 |
Deferred sales charges withheld by FDC | | $ 1,239 |
Exchange fees withheld by
FSC | | $ 13,553 |
See accompanying notes which are an integral part of the financial statements.
Annual Report
Developing Communications Portfolio
Financial Statements - continued
Statement of Changes in Net Assets
| Year ended
February 29,
2004 | Year ended
February 28,
2003 |
Increase (Decrease) in Net Assets | | |
Operations | | |
Net investment income (loss) | $ (4,837,765) | $ (3,657,254) |
Net realized gain (loss) | 165,896,586 | (325,840,794) |
Change in net unrealized appreciation (depreciation) | 207,997,322 | 144,032,174 |
Net increase (decrease) in net assets resulting from operations | 369,056,143 | (185,465,874) |
Share transactions
Net proceeds from sales of shares | 533,497,327 | 51,261,295 |
Cost of shares redeemed | (282,265,665) | (139,059,680) |
Net increase (decrease) in net assets resulting from share transactions | 251,231,662 | (87,798,385) |
Redemption fees | 252,561 | 81,487 |
Total increase (decrease) in net assets | 620,540,366 | (273,182,772) |
| | |
Net Assets | | |
Beginning of period | 319,520,629 | 592,703,401 |
End of period | $ 940,060,995 | $ 319,520,629 |
Other Information Shares | | |
Sold | 32,423,726 | 4,554,507 |
Redeemed | (17,863,752) | (12,255,987) |
Net increase (decrease) | 14,559,974 | (7,701,480) |
Financial Highlights
Years ended February 28, | 2004 E | 2003 | 2002 | 2001 | 2000 E |
Selected Per-Share Data | | | | | |
Net asset value, beginning of period | $ 10.03 | $ 14.98 | $ 23.94 | $ 81.81 | $ 32.72 |
Income from Investment Operations | | | | | |
Net investment income (loss) C | (.13) | (.10) | (.11) | (.31) | (.22) |
Net realized and unrealized gain (loss) | 10.34 | (4.85) | (8.85) | (42.16) | 52.31 |
Total from investment operations | 10.21 | (4.95) | (8.96) | (42.47) | 52.09 |
Distributions from net realized gain | - | - | - | (4.18) | (3.07) |
Distributions in excess of net realized gain | - | - | - | (11.27) | - |
Total distributions | - | - | - | (15.45) | (3.07) |
Redemption fees added to paid in capital C | .01 | - F | - F | .05 | .07 |
Net asset value, end of period | $ 20.25 | $ 10.03 | $ 14.98 | $ 23.94 | $ 81.81 |
Total Return A,B | 101.89% | (33.04)% | (37.43)% | (55.71)% | 166.12% |
Ratios to Average Net Assets D | | | | | |
Expenses before expense reductions | 1.37% | 1.76% | 1.31% | 1.00% | 1.11% |
Expenses net of voluntary waivers, if any | 1.37% | 1.76% | 1.31% | 1.00% | 1.11% |
Expenses net of all reductions | 1.23% | 1.58% | 1.22% | .98% | 1.11% |
Net investment income (loss) | (.87)% | (.93)% | (.55)% | (.53)% | (.47)% |
Supplemental Data | | | | | |
Net assets, end of period (000 omitted) | $ 940,061 | $ 319,521 | $ 592,703 | $ 1,286,990 | $ 3,452,727 |
Portfolio turnover rate | 205% | 111% | 198% | 368% | 112% |
A Total returns would have been lower had certain expenses not been reduced during the periods shown. B Total returns do not include the effect of the former sales charges. C Calculated based on average shares outstanding during the period. D Expense ratios reflect operating expenses of the fund. Expenses before reductions do not reflect amounts reimbursed by the investment adviser or reductions from brokerage service arrangements or other expense offset arrangements and do not represent the amount paid by the fund during periods when reimbursements or reductions occur. Expenses net of any voluntary waivers reflect expenses after reimbursement by the investment adviser but prior to reductions from brokerage service arrangements or other expense offset arrangements. Expenses net of all reductions represent the net expenses paid by the fund. E For the year ended February 29. F Amount represents less than $.01 per share. |
See accompanying notes which are an integral part of the financial statements.
Technology Sector
Electronics Portfolio
Performance
Average annual total return reflects the change in the value of an investment, assuming reinvestment of the fund's dividend income and capital gains (the profits earned upon the sale of securities that have grown in value) and assuming a constant rate of performance each year. The $10,000 table and the fund's returns do not reflect the deduction of taxes that a shareholder would pay on fund distributions or the redemption of fund shares. During periods of reimbursement by Fidelity a fund's total returns will be greater than it would be had the reimbursement not occurred. How a fund did yesterday is no guarantee of how it will do tomorrow.
Average Annual Total Returns
Periods ended February 29, 2004 | Past 1
year | Past 5
years | Past 10
years |
Select Electronics | 75.38% | 4.84% | 18.69% |
$10,000 Over 10 Years
Let's say hypothetically that $10,000 was invested in Fidelity Select Electronics Portfolio on February 28, 1994. The chart shows how the value of your investment would have grown, and also shows how the S&P 500 Index did over the same period.
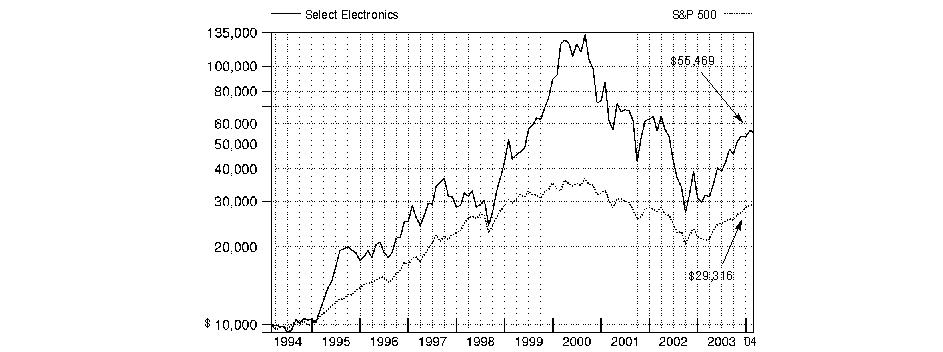
Annual Report
Electronics Portfolio
Management's Discussion of Fund Performance
Comments from Jim Morrow, who became Portfolio Manager of Fidelity® Select Electronics Portfolio on February 1, 2004
From March 2003 through the end of February 2004, domestic stocks recovered dramatically from their prior three-year swoon, driven largely by a broad-based economic and corporate profit recovery. Most major equity benchmarks gained 35% or more during the 12-month period, led by the Russell 2000® Index - a measure of the overall small-cap universe - which advanced 64.41%. As investors grew more confident about the economy's vitality, small-cap stocks were bid up, particularly those with no current earnings. In comparison, the Wilshire 5000® Total Market Index, commonly used as a proxy for the entire U.S. stock market's performance, rose 42.47%. Every sector of the market posted a double-digit advance, with economically sensitive issues - especially technology stocks - leading the way. The tech-heavy NASDAQ Composite® Index returned 52.47% during the past year, despite a negative return in February as investors turned to the more value-oriented segments of the market. The broader Standard & Poor's 500SM Index climbed 38.52% during the year, slightly outperforming the 37.07% increase for the blue-chip Dow Jones Industrial AverageSM.
Fidelity Select Electronics Portfolio was up 75.38% during the 12-month period ending February 29, 2004, outperforming the 55.88% return for the Goldman Sachs® Technology Index and the S&P 500® index. An improving economic climate and better-than-expected earnings within the semiconductor industry helped boost demand for electronics stocks, propelling the fund to a strong absolute and relative return. Maintaining a higher exposure to analog semiconductor stocks relative to the sector benchmark, including strong performers Analog Devices and Texas Instruments, was instrumental to the fund's solid performance. Additionally, having a large weighting in international semiconductor stocks, such as ASML Holding of the Netherlands, also helped boost the fund's return, as many of these stocks were among the electronics industry's top performers. Turning to relative detractors, the fund was hurt by either not owning or underweighting a handful of communications equipment companies in the sector index, including Nortel Networks and Cisco Systems, both of which rallied due to rebounding sales of wireless and networking equipment. Elsewhere, the share price of disk-drive component maker Hutchinson Technology fell when the business prospects for that industry turned out to be weaker than the market expected.
The views expressed in this statement reflect those of the portfolio manager only through the end of the period of the report as stated on the cover and do not necessarily represent the views of Fidelity or any other person in the Fidelity organization. Any such views are subject to change at any time based upon market or other conditions and Fidelity disclaims any responsibility to update such views. These views may not be relied on as investment advice and, because investment decisions for a Fidelity fund are based on numerous factors, may not be relied on as an indication of trading intent on behalf of any Fidelity fund.
Annual Report
Electronics Portfolio
Investment Summary
Top Ten Stocks as of February 29, 2004 |
| % of fund's
net assets |
Analog Devices, Inc. | 8.1 |
Motorola, Inc. | 6.2 |
Intel Corp. | 5.5 |
Texas Instruments, Inc. | 5.3 |
National Semiconductor Corp. | 5.0 |
Samsung Electronics Co. Ltd. | 3.6 |
Agilent Technologies, Inc. | 2.7 |
NVIDIA Corp. | 2.5 |
ASML Holding NV (NY Shares) | 2.5 |
Synopsys, Inc. | 2.4 |
| 43.8 |
Top Industries as of February 29, 2004 |
% of fund's net assets |
| Semiconductors & Semiconductor Equipment | 62.9% | |
| Electronic Equipment & Instruments | 13.0% | |
| Communications Equipment | 9.9% | |
| Software | 5.7% | |
| Computers & Peripherals | 3.1% | |
| All Others* | 5.4% | |

* Includes short-term investments and net other assets. |
Annual Report
Electronics Portfolio
Investments February 29, 2004
Showing Percentage of Net Assets
Common Stocks - 96.9% |
| Shares | | Value (Note 1) |
BIOTECHNOLOGY - 0.5% |
Affymetrix, Inc. (a) | 300,000 | | $ 10,197,000 |
Caliper Life Sciences, Inc. (a) | 1,340,500 | | 9,973,320 |
TOTAL BIOTECHNOLOGY | | 20,170,320 |
COMMUNICATIONS EQUIPMENT - 9.9% |
Alcatel SA sponsored ADR (a) | 1,000,000 | | 16,190,000 |
Harris Corp. | 600,000 | | 28,350,000 |
InterDigital Communication Corp. (a) | 200,000 | | 5,312,000 |
Motorola, Inc. | 13,743,360 | | 253,564,992 |
Nortel Networks Corp. (a) | 600,000 | | 4,770,181 |
QLogic Corp. (a) | 435,400 | | 18,199,720 |
QUALCOMM, Inc. | 318,700 | | 20,221,515 |
Telefonaktiebolaget LM Ericsson ADR (a) | 2,100,000 | | 60,942,000 |
TOTAL COMMUNICATIONS EQUIPMENT | | 407,550,408 |
COMPUTERS & PERIPHERALS - 3.1% |
Ambit Microsystems Corp. | 5,113,900 | | 14,918,746 |
Dell, Inc. (a) | 800,000 | | 26,120,000 |
Hutchinson Technology, Inc. (a) | 605,600 | | 17,241,432 |
Maxtor Corp. (a) | 1,600,000 | | 16,400,000 |
Quanta Computer, Inc. | 8,556,460 | | 21,744,989 |
Storage Technology Corp. (a) | 427,400 | | 12,552,738 |
Western Digital Corp. (a) | 1,700,000 | | 19,363,000 |
TOTAL COMPUTERS & PERIPHERALS | | 128,340,905 |
ELECTRONIC EQUIPMENT & INSTRUMENTS - 13.0% |
Agilent Technologies, Inc. (a) | 3,255,200 | | 111,295,288 |
Amphenol Corp. Class A (a) | 200,000 | | 12,370,000 |
Arrow Electronics, Inc. (a) | 1,516,400 | | 37,303,440 |
AU Optronics Corp. sponsored ADR | 142,500 | | 2,451,000 |
Avnet, Inc. (a) | 832,014 | | 19,593,930 |
AVX Corp. | 1,582,500 | | 26,649,300 |
Electro Scientific Industries, Inc. (a) | 42,900 | | 1,024,023 |
Flextronics International Ltd. (a) | 4,600,000 | | 83,260,000 |
Jabil Circuit, Inc. (a) | 2,100,000 | | 58,758,000 |
National Instruments Corp. | 45,000 | | 1,555,200 |
Nidec Corp. | 220,000 | | 21,805,167 |
Sanmina-SCI Corp. (a) | 3,500,000 | | 44,415,000 |
Solectron Corp. (a) | 4,200,000 | | 26,838,000 |
Tektronix, Inc. | 789,400 | | 25,300,270 |
Vishay Intertechnology, Inc. (a) | 2,707,500 | | 60,945,825 |
TOTAL ELECTRONIC EQUIPMENT & INSTRUMENTS | | 533,564,443 |
HOUSEHOLD DURABLES - 0.5% |
Garmin Ltd. | 200,000 | | 9,168,000 |
Koninklijke Philips Electronics NV
(NY Shares) | 397,200 | | 12,082,824 |
TOTAL HOUSEHOLD DURABLES | | 21,250,824 |
|
| Shares | | Value (Note 1) |
IT SERVICES - 0.3% |
The BISYS Group, Inc. (a) | 702,300 | | $ 12,395,595 |
OFFICE ELECTRONICS - 1.0% |
Canon, Inc. ADR | 800,000 | | 39,320,000 |
SEMICONDUCTORS & SEMICONDUCTOR EQUIPMENT - 62.9% |
Advanced Micro Devices, Inc. (a) | 1,331,000 | | 19,965,000 |
Agere Systems, Inc.: | | | |
Class A (a) | 2,451,300 | | 9,511,044 |
Class B (a) | 11,044,200 | | 40,973,982 |
Altera Corp. (a) | 3,622,600 | | 79,987,008 |
Analog Devices, Inc. | 6,687,100 | | 333,686,289 |
Applied Materials, Inc. (a) | 1,902,658 | | 40,412,456 |
ARM Holdings PLC sponsored ADR | 2,156,200 | | 14,554,350 |
ASM Pacific Technology Ltd. | 3,287,800 | | 14,994,078 |
ASML Holding NV (NY Shares) (a) | 5,631,200 | | 102,825,712 |
Asyst Technologies, Inc. (a) | 1,100,000 | | 10,923,000 |
ATMI, Inc. (a) | 700,000 | | 19,005,000 |
Axcelis Technologies, Inc. (a) | 2,445,800 | | 27,979,952 |
Broadcom Corp. Class A (a) | 1,016,300 | | 41,241,454 |
Cabot Microelectronics Corp. (a) | 364,500 | | 16,238,475 |
Conexant Systems, Inc. (a) | 3,799,300 | | 27,924,855 |
Credence Systems Corp. (a) | 2,447,500 | | 27,779,125 |
Cree, Inc. (a) | 512,000 | | 12,262,400 |
Cymer, Inc. (a) | 100,000 | | 3,854,000 |
Cypress Semiconductor Corp. (a) | 16,500 | | 356,070 |
DuPont Photomasks, Inc. (a) | 319,500 | | 7,099,290 |
Entegris, Inc. (a) | 700,000 | | 8,505,000 |
Fairchild Semiconductor International, Inc. (a) | 1,056,000 | | 27,244,800 |
FEI Co. (a) | 87,000 | | 1,979,250 |
FormFactor, Inc. (c) | 1,813,100 | | 36,878,454 |
Infineon Technologies AG sponsored ADR (a) | 900,000 | | 12,690,000 |
Integrated Circuit Systems, Inc. (a) | 1,355,350 | | 37,326,339 |
Integrated Device Technology, Inc. (a) | 1,180,400 | | 19,464,796 |
Intel Corp. | 7,750,000 | | 226,532,500 |
International Rectifier Corp. (a) | 100,000 | | 4,616,000 |
Intersil Corp. Class A | 1,485,000 | | 35,031,150 |
KLA-Tencor Corp. (a) | 1,397,760 | | 73,801,728 |
Lam Research Corp. (a) | 1,188,681 | | 30,394,573 |
Lattice Semiconductor Corp. (a) | 3,000,000 | | 30,990,000 |
Linear Technology Corp. | 2,290,240 | | 91,586,698 |
LSI Logic Corp. (a) | 1,700,000 | | 17,170,000 |
Marvell Technology Group Ltd. (a) | 150,000 | | 6,829,500 |
Maxim Integrated Products, Inc. | 895,500 | | 44,694,405 |
MEMC Electronic Materials, Inc. (a) | 805,500 | | 7,644,195 |
Micrel, Inc. (a) | 600,000 | | 9,012,000 |
Micron Technology, Inc. (a) | 2,800,000 | | 42,112,000 |
Mindspeed Technologies, Inc. (a) | 3,085,133 | | 27,395,981 |
National Semiconductor Corp. (a) | 5,194,900 | | 204,471,264 |
NPTest Holding Corp. | 242,000 | | 3,516,260 |
NVIDIA Corp. (a) | 4,638,300 | | 103,202,175 |
ON Semiconductor Corp. (a) | 1,000,000 | | 8,460,000 |
Common Stocks - continued |
| Shares | | Value (Note 1) |
SEMICONDUCTORS & SEMICONDUCTOR EQUIPMENT - CONTINUED |
Photronics, Inc. (a) | 900,000 | | $ 15,633,000 |
RF Micro Devices, Inc. (a) | 44,800 | | 416,192 |
Samsung Electronics Co. Ltd. | 322,650 | | 149,210,177 |
Samsung Electronics Co. Ltd. GDR | 90,000 | | 21,015,000 |
Semtech Corp. (a) | 5,800 | | 139,896 |
Sigmatel, Inc. | 64,300 | | 1,601,713 |
Skyworks Solutions, Inc. (a) | 2,660,054 | | 30,005,409 |
Taiwan Semiconductor Manufacturing Co. Ltd. sponsored ADR (a) | 1,416,000 | | 14,712,240 |
Teradyne, Inc. (a) | 2,100,162 | | 51,768,993 |
Texas Instruments, Inc. | 7,100,000 | | 217,615,000 |
Tokyo Electron Ltd. | 313,300 | | 18,947,800 |
United Microelectronics Corp.
sponsored ADR (a) | 3,126,400 | | 16,288,544 |
Varian Semiconductor Equipment Associates, Inc. (a) | 550,800 | | 22,467,132 |
Xilinx, Inc. (a) | 1,509,800 | | 63,471,992 |
TOTAL SEMICONDUCTORS & SEMICONDUCTOR
EQUIPMENT | | 2,586,415,696 |
SOFTWARE - 5.7% |
Cadence Design Systems, Inc. (a) | 4,052,700 | | 62,533,161 |
Microsoft Corp. | 2,500,000 | | 66,250,000 |
Red Hat, Inc. (a) | 321,648 | | 5,815,396 |
Synopsys, Inc. (a) | 3,320,900 | | 97,900,132 |
TOTAL SOFTWARE | | 232,498,689 |
TOTAL COMMON STOCKS (Cost $3,347,368,570) | 3,981,506,880 |
Convertible Preferred Stocks - 0.0% |
| | | |
COMMUNICATIONS EQUIPMENT - 0.0% |
Procket Networks, Inc. Series C (d)
(Cost $2,469,000) | 250,000 | | 62,500 |
Money Market Funds - 1.2% |
| | | |
Fidelity Cash Central Fund, 1.08% (b) | 20,920,849 | | 20,920,849 |
Fidelity Securities Lending Cash Central Fund, 1.08% (b) | 29,756,275 | | 29,756,275 |
TOTAL MONEY MARKET FUNDS (Cost $50,677,124) | 50,677,124 |
TOTAL INVESTMENT PORTFOLIO - 98.1% (Cost $3,400,514,694) | | 4,032,246,504 |
NET OTHER ASSETS - 1.9% | | 77,826,498 |
NET ASSETS - 100% | $ 4,110,073,002 |
Legend |
(a) Non-income producing |
(b) Affiliated fund that is available only to investment companies and other accounts managed by Fidelity Investments. The rate quoted is the annualized seven-day yield of the fund at period end. A complete listing of the fund's holdings as of its most recent fiscal year end is available upon request. |
(c) Affiliated company |
(d) Restricted securities - Investment in securities not registered under the Securities Act of 1933 (excluding 144A issues). At the end of the period, the value of restricted securities (excluding 144A issues) amounted to $62,500 or 0.0% of net assets. |
Additional information on each holding is as follows: |
Security | Acquisition Date | Acquisition Cost |
Procket Networks, Inc. Series C | 11/15/00 | $ 2,469,000 |
Other Information |
Purchases and sales of securities, other than short-term securities, aggregated $1,667,827,939 and $1,564,401,305, respectively. |
The fund placed a portion of its portfolio transactions with brokerage firms which are affiliates of the investment adviser. The commissions paid to these affiliated firms were $76,514 for the period. |
Transactions during the period with companies which are or were affiliates are as follows: |
Affiliate | Value,
beginning of period | Purchases | Sales
proceeds | Dividend
income | Value, end of period |
Caliper Life Sciences, Inc.. | $ 5,103,225 | $ - | $ 1,194,401 | $ - | $ 9,973,320 |
FormFactor, Inc. | - | 43,796,303 | 78,110 | - | 36,878,454 |
TOTALS | $ 5,103,225 | $ 43,796,303 | $ 1,272,511 | $ - | $ 46,851,774 |
Distribution of investments by country of issue, as a percentage of total net assets, is as follows: |
United States of America | 83.8% |
Korea (South) | 4.1% |
Netherlands | 2.8% |
Singapore | 2.0% |
Japan | 2.0% |
Taiwan | 1.8% |
Sweden | 1.5% |
Others (individually less than 1%) | 2.0% |
| 100.0% |
Income Tax Information |
At February 29, 2004, the fund had a capital loss carryforward of approximately $3,065,758,000 of which $1,483,259,000, $1,514,780,000 and $67,719,000 will expire on February 28, 2010, 2011 and February 29, 2012, respectively. |
See accompanying notes which are an integral part of the financial statements.
Technology Sector
Electronics Portfolio
Financial Statements
Statement of Assets and Liabilities
| February 29, 2004 |
| | |
Assets | | |
Investment in securities, at value (including securities loaned of $28,819,566) (cost $3,400,514,694) - See accompanying schedule | | $ 4,032,246,504 |
Foreign currency held at value
(cost $759,495) | | 781,650 |
Receivable for investments sold | | 123,694,013 |
Receivable for fund shares sold | | 4,474,343 |
Dividends receivable | | 2,204,095 |
Interest receivable | | 41,036 |
Prepaid expenses | | 15,788 |
Other affiliated receivables | | 7,052 |
Other receivables | | 344,274 |
Total assets | | 4,163,808,755 |
| | |
Liabilities | | |
Payable for investments purchased | $ 12,199,010 | |
Payable for fund shares redeemed | 8,492,357 | |
Accrued management fee | 2,005,010 | |
Other affiliated payables | 1,202,295 | |
Other payables and accrued expenses | 80,806 | |
Collateral on securities loaned, at value | 29,756,275 | |
Total liabilities | | 53,735,753 |
| | |
Net Assets | | $ 4,110,073,002 |
Net Assets consist of: | | |
Paid in capital | | $ 6,614,327,882 |
Accumulated undistributed net realized gain (loss) on investments and foreign currency transactions | | (3,135,893,457) |
Net unrealized appreciation (depreciation) on investments and assets and liabilities in foreign currencies | | 631,638,577 |
Net Assets, for 94,115,428 shares outstanding | | $ 4,110,073,002 |
Net Asset Value, offering price and redemption price per share ($4,110,073,002 ÷ 94,115,428 shares) | | $ 43.67 |
Statement of Operations
| Year ended February 29, 2004 |
| | |
Investment Income | | |
Dividends | | $ 11,013,728 |
Interest | | 1,810,198 |
Security lending | | 107,833 |
| | 12,931,759 |
Less foreign taxes withheld | | (850,438) |
Total income | | 12,081,321 |
| | |
Expenses | | |
Management fee | $ 19,228,214 | |
Transfer agent fees | 14,619,838 | |
Accounting and security lending fees | 1,284,058 | |
Non-interested trustees' compensation | 16,756 | |
Appreciation in deferred trustee compensation account | 2,488 | |
Custodian fees and expenses | 255,581 | |
Registration fees | 122,967 | |
Audit | 61,675 | |
Legal | 14,081 | |
Miscellaneous | 103,499 | |
Total expenses before reductions | 35,709,157 | |
Expense reductions | (600,468) | 35,108,689 |
Net investment income (loss) | | (23,027,368) |
Realized and Unrealized Gain (Loss) Net realized gain (loss) on: | | |
Investment securities (including realized gain (loss) of $648,244 on sales of investments in affiliated issuers) | 211,629,865 | |
Foreign currency transactions | (145,544) | |
Total net realized gain (loss) | | 211,484,321 |
Change in net unrealized appreciation (depreciation) on: Investment securities | 1,520,899,968 | |
Assets and liabilities in foreign currencies | (113,433) | |
Total change in net unrealized appreciation (depreciation) | | 1,520,786,535 |
Net gain (loss) | | 1,732,270,856 |
Net increase (decrease) in net assets resulting from operations | | $ 1,709,243,488 |
Other Information | | |
Sales charges paid to FDC | | $ 1,953,675 |
Deferred sales charges withheld by FDC | | $ 5,497 |
Exchange fees withheld by
FSC | | $ 37,658 |
See accompanying notes which are an integral part of the financial statements.
Annual Report
Electronics Portfolio
Financial Statements - continued
Statement of Changes in Net Assets
| Year ended
February 29,
2004 | Year ended
February 28,
2003 |
Increase (Decrease) in Net Assets | | |
Operations | | |
Net investment income (loss) | $ (23,027,368) | $ (24,331,083) |
Net realized gain (loss) | 211,484,321 | (1,480,058,739) |
Change in net unrealized appreciation (depreciation) | 1,520,786,535 | (417,760,508) |
Net increase (decrease) in net assets resulting from operations | 1,709,243,488 | (1,922,150,330) |
Share transactions
Net proceeds from sales of shares | 1,241,499,853 | 838,839,233 |
Cost of shares redeemed | (1,046,012,527) | (1,254,435,950) |
Net increase (decrease) in net assets resulting from share transactions | 195,487,326 | (415,596,717) |
Redemption fees | 1,306,474 | 1,991,862 |
Total increase (decrease) in net assets | 1,906,037,288 | (2,335,755,185) |
| | |
Net Assets | | |
Beginning of period | 2,204,035,714 | 4,539,790,899 |
End of period | $ 4,110,073,002 | $ 2,204,035,714 |
Other Information Shares | | |
Sold | 34,702,413 | 24,989,478 |
Redeemed | (29,086,386) | (39,057,366) |
Net increase (decrease) | 5,616,027 | (14,067,888) |
Financial Highlights
Years ended February 28, | 2004 E | 2003 | 2002 | 2001 | 2000 E |
Selected Per-Share Data | | | | | |
Net asset value, beginning of period | $ 24.90 | $ 44.26 | $ 48.25 | $ 121.58 | $ 47.34 |
Income from Investment Operations | | | | | |
Net investment income (loss) C | (.25) | (.26) | (.29) | (.30) | (.33) |
Net realized and unrealized gain (loss) | 19.01 | (19.12) | (3.73) | (54.44) | 81.13 |
Total from investment operations | 18.76 | (19.38) | (4.02) | (54.74) | 80.80 |
Distributions from net realized gain | - | - | - | (15.17) | (6.62) |
Distributions in excess of net realized gain | - | - | - | (3.51) | - |
Total distributions | - | - | - | (18.68) | (6.62) |
Redemption fees added to paid in capital C | .01 | .02 | .03 | .09 | .06 |
Net asset value, end of period | $ 43.67 | $ 24.90 | $ 44.26 | $ 48.25 | $ 121.58 |
Total Return A,B | 75.38% | (43.74)% | (8.27)% | (49.66)% | 178.06% |
Ratios to Average Net Assets D | | | | | |
Expenses before expense reductions | 1.08% | 1.14% | .99% | .88% | .99% |
Expenses net of voluntary waivers, if any | 1.08% | 1.14% | .99% | .88% | .99% |
Expenses net of all reductions | 1.06% | 1.06% | .97% | .87% | .98% |
Net investment income (loss) | (.70)% | (.78)% | (.59)% | (.31)% | (.46)% |
Supplemental Data | | | | | |
Net assets, end of period (000 omitted) | $ 4,110,073 | $ 2,204,036 | $ 4,539,791 | $ 5,230,452 | $ 9,960,884 |
Portfolio turnover rate | 50% | 70% | 57% | 100% | 125% |
A Total returns would have been lower had certain expenses not been reduced during the periods shown. B Total returns do not include the effect of the former sales charges. C Calculated based on average shares outstanding during the period. D Expense ratios reflect operating expenses of the fund. Expenses before reductions do not reflect amounts reimbursed by the investment adviser or reductions from brokerage service arrangements or other expense offset arrangements and do not represent the amount paid by the fund during periods when reimbursements or reductions occur. Expenses net of any voluntary waivers reflect expenses after reimbursement by the investment adviser but prior to reductions from brokerage service arrangements or other expense offset arrangements. Expenses net of all reductions represent the net expenses paid by the fund. E For the year ended February 29. |
See accompanying notes which are an integral part of the financial statements.
Technology Sector
Networking and Infrastructure Portfolio
Performance
Average annual total return reflects the change in the value of an investment, assuming reinvestment of the fund's dividend income and capital gains (the profits earned upon the sale of securities that have grown in value) and assuming a constant rate of performance each year. The $10,000 table and the fund's returns do not reflect the deduction of taxes that a shareholder would pay on fund distributions or the redemption of fund shares. During periods of reimbursement by Fidelity a fund's total returns will be greater than it would be had the reimbursement not occurred. How a fund did yesterday is no guarantee of how it will do tomorrow.
Average Annual Total Returns
Periods ended February 29, 2004 | Past 1
year | Past 5
years | Life of
fundA |
Select Networking and Infrastructure | 75.00% | n/a* | -31.94% |
A From September 21, 2000
* Not available
$10,000 Over Life of Fund
Let's say hypothetically that $10,000 was invested in Fidelity Select Networking and Infrastructure Portfolio on September 21, 2000, when the fund started. The chart shows what the value of your investment would have been, and also shows how the S&P 500 Index did over the same period.
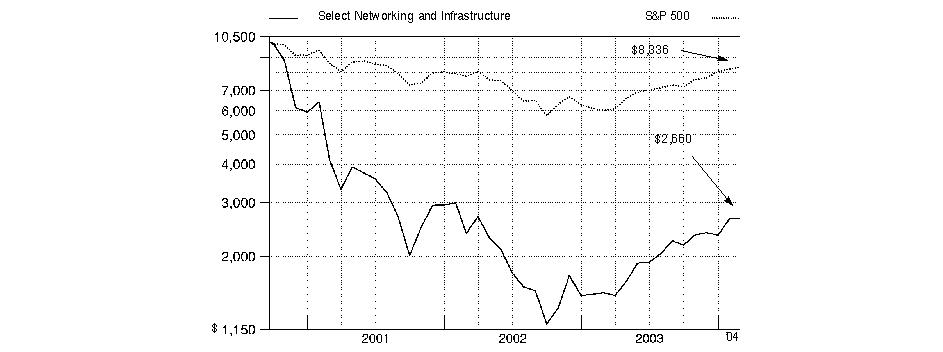
Annual Report
Networking and Infrastructure Portfolio
Management's Discussion of Fund Performance
Comments from Matthew Cheyney, Portfolio Manager of Fidelity® Select Networking and Infrastructure Portfolio
From March 2003 through the end of February 2004, domestic stocks recovered dramatically from their prior three-year swoon, driven largely by a broad-based economic and corporate profit recovery. Most major equity benchmarks gained 35% or more during the 12-month period, led by the Russell 2000® Index - a measure of the overall small-cap universe - which advanced 64.41%. As investors grew more confident about the economy's vitality, small-cap stocks were bid up, particularly those with no current earnings. In comparison, the Wilshire 5000® Total Market Index, commonly used as a proxy for the entire U.S. stock market's performance, rose 42.47%. Every sector of the market posted a double-digit advance, with economically sensitive issues - especially technology stocks - leading the way. The tech-heavy NASDAQ Composite® Index returned 52.47% during the past year, despite a negative return in February as investors turned to the more value-oriented segments of the market. The broader Standard & Poor's 500SM Index climbed 38.52% during the year, slightly outperforming the 37.07% increase for the blue-chip Dow Jones Industrial AverageSM.
The fund gained 75.00% for the year ending February 29, 2004, topping the Goldman Sachs® Technology Index, which returned 55.88%, as well as the S&P 500®. In a strong environment for technology stocks in general, changing expectations about future revenue and earnings growth rates fueled a dramatic resurgence in communications and networking-related shares, led by more-speculative, higher-volatility names. Given the fund's narrow focus, it had a much larger exposure to areas in the sweet spot of technology - and of the broader market, for that matter. Strong industry and security selection also boosted relative returns. My decision to move away from the fund's defensive positioning early in the period and gradually become more aggressive paid off as the market exploded upwards. Most of our top performers were in the semiconductor space, where the fund's holdings outpaced those in the index by more than 35 percentage points. Leading the way were several beaten-down, highly volatile communications-related chip stocks that rebounded strongly - including Broadcom, Agere Systems and Conexant Systems. The fund also benefited from stock selection outside of semis, namely Avaya, Adtran and Ericsson within communications equipment and Agilent Technologies from the electronic equipment and instruments subsector. On the downside, the fund was hurt by a higher-than-normal weighting in cash, as well as by one poor pick in computer peripherals, Seagate Technology. Other notable detractors included chipmaker PMC-Sierra and telecom equipment stocks Advanced Fibre Communications and UTStarcom.
The views expressed in this statement reflect those of the portfolio manager only through the end of the period of the report as stated on the cover and do not necessarily represent the views of Fidelity or any other person in the Fidelity organization. Any such views are subject to change at any time based upon market or other conditions and Fidelity disclaims any responsibility to update such views. These views may not be relied on as investment advice and, because investment decisions for a Fidelity fund are based on numerous factors, may not be relied on as an indication of trading intent on behalf of any Fidelity fund.
Annual Report
Networking and Infrastructure Portfolio
Investment Summary
Top Ten Stocks as of February 29, 2004 |
| % of fund's
net assets |
Agilent Technologies, Inc. | 7.2 |
Telefonaktiebolaget LM Ericsson ADR | 7.1 |
Avaya, Inc. | 6.8 |
PMC-Sierra, Inc. | 6.5 |
Cisco Systems, Inc. | 5.8 |
Agere Systems, Inc. Class A | 5.3 |
Marvell Technology Group Ltd. | 5.1 |
Microsoft Corp. | 3.5 |
Adtran, Inc. | 3.2 |
Nortel Networks Corp. | 2.7 |
| 53.2 |
Top Industries as of February 29, 2004 |
% of fund's net assets |
| Communications Equipment | 36.0% | |
| Semiconductors & Semiconductor Equipment | 33.3% | |
| Software | 11.0% | |
| Electronic Equipment & Instruments | 9.1% | |
| Computers & Peripherals | 5.5% | |
| All Others* | 5.1% | |

* Includes short-term investments and net other assets. |
Annual Report
Networking and Infrastructure Portfolio
Investments February 29, 2004
Showing Percentage of Net Assets
Common Stocks - 95.7% |
| Shares | | Value (Note 1) |
COMMUNICATIONS EQUIPMENT - 35.8% |
3Com Corp. (a) | 35,900 | | $ 251,300 |
Adtran, Inc. | 207,600 | | 6,759,456 |
Advanced Fibre Communications, Inc. (a) | 14,600 | | 357,992 |
Avaya, Inc. (a) | 838,900 | | 14,387,135 |
Black Box Corp. | 7,100 | | 365,721 |
Brocade Communications Systems, Inc. (a) | 104,600 | | 729,062 |
CIENA Corp. (a) | 105,900 | | 606,807 |
Cisco Systems, Inc. (a) | 532,940 | | 12,310,914 |
Comverse Technology, Inc. (a) | 26,900 | | 530,468 |
Emulex Corp. (a) | 22,900 | | 530,822 |
Enterasys Networks, Inc. (a) | 422,600 | | 1,922,830 |
Harris Corp. | 26,900 | | 1,271,025 |
JDS Uniphase Corp. (a) | 137,700 | | 674,730 |
Lucent Technologies, Inc. (a) | 300 | | 1,257 |
Motorola, Inc. | 219,600 | | 4,051,620 |
NetScreen Technologies, Inc. (a) | 37,400 | | 1,325,830 |
Nortel Networks Corp. (a) | 708,300 | | 5,631,198 |
QLogic Corp. (a) | 21,380 | | 893,684 |
Scientific-Atlanta, Inc. | 144,300 | | 4,776,330 |
Sycamore Networks, Inc. (a) | 69,000 | | 324,990 |
Telefonaktiebolaget LM Ericsson ADR (a) | 516,600 | | 14,991,732 |
UTStarcom, Inc. (a) | 90,100 | | 2,985,103 |
TOTAL COMMUNICATIONS EQUIPMENT | | 75,680,006 |
COMPUTERS & PERIPHERALS - 5.5% |
ASUSTeK Computer, Inc. | 3,600 | | 9,474 |
Crossroads Systems, Inc. (a) | 50,000 | | 131,500 |
Dell, Inc. (a) | 23,800 | | 777,070 |
Drexler Technology Corp. (a) | 29,100 | | 411,765 |
EMC Corp. (a) | 101,373 | | 1,451,661 |
Read-Rite Corp. (a) | 44,000 | | 880 |
Seagate Technology | 301,000 | | 5,207,300 |
Sun Microsystems, Inc. (a) | 693,500 | | 3,703,290 |
TOTAL COMPUTERS & PERIPHERALS | | 11,692,940 |
DIVERSIFIED TELECOMMUNICATION SERVICES - 0.6% |
AT&T Corp. | 4,480 | | 89,734 |
Covad Communications Group, Inc. (a) | 1,800 | | 5,958 |
Qwest Communications International, Inc. (a) | 114,900 | | 526,242 |
Verizon Communications, Inc. | 16,500 | | 632,445 |
TOTAL DIVERSIFIED TELECOMMUNICATION
SERVICES | | 1,254,379 |
ELECTRONIC EQUIPMENT & INSTRUMENTS - 9.1% |
Agilent Technologies, Inc. (a) | 446,600 | | 15,269,255 |
Amphenol Corp. Class A (a) | 6,100 | | 377,285 |
Avnet, Inc. (a) | 46,609 | | 1,097,642 |
Bell Microproducts, Inc. (a) | 22,700 | | 209,294 |
|
| Shares | | Value (Note 1) |
Flextronics International Ltd. (a) | 55,300 | | $ 1,000,930 |
Jabil Circuit, Inc. (a) | 11,400 | | 318,972 |
Sanmina-SCI Corp. (a) | 48,500 | | 615,465 |
Tektronix, Inc. | 12,700 | | 407,035 |
TOTAL ELECTRONIC EQUIPMENT & INSTRUMENTS | | 19,295,878 |
INTERNET SOFTWARE & SERVICES - 0.3% |
EarthLink, Inc. (a) | 39,200 | | 357,896 |
Vignette Corp. (a) | 80,500 | | 181,930 |
TOTAL INTERNET SOFTWARE & SERVICES | | 539,826 |
MEDIA - 0.1% |
Comcast Corp. Class A (a) | 7,246 | | 217,670 |
SEMICONDUCTORS & SEMICONDUCTOR EQUIPMENT - 33.3% |
Agere Systems, Inc.: | | | |
Class A (a) | 2,900,500 | | 11,253,940 |
Class B (a) | 1,400,440 | | 5,195,632 |
Altera Corp. (a) | 24,900 | | 549,792 |
Analog Devices, Inc. | 99,900 | | 4,985,010 |
Broadcom Corp. Class A (a) | 16,380 | | 664,700 |
Chartered Semiconductor Manufacturing Ltd. ADR (a) | 32,600 | | 325,348 |
Conexant Systems, Inc. (a) | 320,300 | | 2,354,205 |
Fairchild Semiconductor International, Inc. (a) | 45,300 | | 1,168,740 |
GlobespanVirata, Inc. (a) | 544,500 | | 4,829,715 |
Integrated Silicon Solution, Inc. (a) | 46,800 | | 752,544 |
Intersil Corp. Class A | 24,600 | | 580,314 |
Lattice Semiconductor Corp. (a) | 98,200 | | 1,014,406 |
LSI Logic Corp. (a) | 233,310 | | 2,356,431 |
Marvell Technology Group Ltd. (a) | 235,270 | | 10,711,843 |
Micron Technology, Inc. (a) | 23,700 | | 356,448 |
Mindspeed Technologies, Inc. (a) | 111,433 | | 989,525 |
National Semiconductor Corp. (a) | 41,500 | | 1,633,440 |
PMC-Sierra, Inc. (a) | 692,400 | | 13,778,760 |
STMicroelectronics NV (NY Shares) | 60,090 | | 1,553,327 |
Texas Instruments, Inc. | 165,800 | | 5,081,770 |
Virage Logic Corp. (a) | 21,700 | | 226,765 |
TOTAL SEMICONDUCTORS & SEMICONDUCTOR
EQUIPMENT | | 70,362,655 |
SOFTWARE - 11.0% |
Adobe Systems, Inc. | 3,900 | | 145,236 |
BEA Systems, Inc. (a) | 189,210 | | 2,611,098 |
Check Point Software Technologies Ltd. (a) | 122,600 | | 2,822,252 |
Microsoft Corp. | 277,700 | | 7,359,050 |
Network Associates, Inc. (a) | 314,650 | | 5,518,961 |
Symantec Corp. (a) | 31,100 | | 1,279,454 |
Common Stocks - continued |
| Shares | | Value (Note 1) |
SOFTWARE - CONTINUED |
Vastera, Inc. (a) | 68,600 | | $ 251,762 |
VERITAS Software Corp. (a) | 111,100 | | 3,379,662 |
TOTAL SOFTWARE | | 23,367,475 |
TOTAL COMMON STOCKS (Cost $168,472,642) | 202,410,829 |
Convertible Preferred Stocks - 0.2% |
| | | |
COMMUNICATIONS EQUIPMENT - 0.2% |
Lucent Technologies Capital Trust I 7.75% (c)
(Cost $300,000) | 300 | | 379,782 |
Money Market Funds - 10.1% |
| | | |
Fidelity Cash Central Fund, 1.08% (b) | 9,957,397 | | 9,957,397 |
Fidelity Securities Lending Cash Central Fund, 1.08% (b) | 11,416,450 | | 11,416,450 |
TOTAL MONEY MARKET FUNDS (Cost $21,373,847) | 21,373,847 |
TOTAL INVESTMENT PORTFOLIO - 106.0% (Cost $190,146,489) | 224,164,458 |
NET OTHER ASSETS - (6.0)% | (12,696,409) |
NET ASSETS - 100% | $ 211,468,049 |
Legend |
(a) Non-income producing |
(b) Affiliated fund that is available only to investment companies and other accounts managed by Fidelity Investments. The rate quoted is the annualized seven-day yield of the fund at period end. A complete listing of the fund's holdings as of its most recent fiscal year end is available upon request. |
(c) Security exempt from registration under Rule 144A of the Securities Act of 1933. These securities may be resold in transactions exempt from registration, normally to qualified institutional buyers. At the period end, the value of these securities amounted to $379,782 or 0.2% of net assets. |
Other Information |
Purchases and sales of securities, other than short-term securities, aggregated $143,492,626 and $74,310,915, respectively. |
The fund placed a portion of its portfolio transactions with brokerage firms which are affiliates of the investment adviser. The commissions paid to these affiliated firms were $21,044 for the period. |
Distribution of investments by country of issue, as a percentage of total net assets, is as follows: |
United States of America | 80.0% |
Sweden | 7.1% |
Bermuda | 5.1% |
Canada | 2.7% |
Cayman Islands | 2.5% |
Israel | 1.3% |
Others (individually less than 1%) | 1.3% |
| 100.0% |
Income Tax Information |
At February 29, 2004, the fund had a capital loss carryforward of approximately $200,773,000 of which $117,214,000 and $83,559,000 will expire on February 28, 2010 and 2011, respectively. |
See accompanying notes which are an integral part of the financial statements.
Technology Sector
Networking and Infrastructure Portfolio
Financial Statements
Statement of Assets and Liabilities
| February 29, 2004 |
| | |
Assets | | |
Investment in securities, at value (including securities loaned of $11,071,794) (cost $190,146,489) - See accompanying schedule | | $ 224,164,458 |
Foreign currency held at value
(cost $83,792) | | 87,020 |
Receivable for fund shares sold | | 549,832 |
Dividends receivable | | 5,439 |
Interest receivable | | 12,401 |
Prepaid expenses | | 679 |
Other affiliated receivables | | 350 |
Other receivables | | 48,150 |
Total assets | | 224,868,329 |
| | |
Liabilities | | |
Payable for fund shares redeemed | $ 1,776,397 | |
Accrued management fee | 102,520 | |
Other affiliated payables | 77,394 | |
Other payables and accrued expenses | 27,519 | |
Collateral on securities loaned, at value | 11,416,450 | |
Total liabilities | | 13,400,280 |
| | |
Net Assets | | $ 211,468,049 |
Net Assets consist of: | | |
Paid in capital | | $ 380,581,620 |
Accumulated undistributed net realized gain (loss) on investments and foreign currency transactions | | (203,134,768) |
Net unrealized appreciation (depreciation) on investments and assets and liabilities in foreign currencies | | 34,021,197 |
Net Assets, for 79,415,993 shares outstanding | | $ 211,468,049 |
Net Asset Value, offering price and redemption price per share ($211,468,049 ÷ 79,415,993 shares) | | $ 2.66 |
Statement of Operations
| Year ended February 29, 2004 |
| | |
Investment Income | | |
Dividends | | $ 235,882 |
Special Dividends | | 184,000 |
Interest | | 114,659 |
Security lending | | 24,637 |
Total income | | 559,178 |
| | |
Expenses | | |
Management fee | $ 822,893 | |
Transfer agent fees | 1,011,864 | |
Accounting and security lending fees | 90,593 | |
Non-interested trustees' compensation | 573 | |
Custodian fees and expenses | 10,686 | |
Registration fees | 37,894 | |
Audit | 45,588 | |
Legal | 404 | |
Miscellaneous | 1,613 | |
Total expenses before reductions | 2,022,108 | |
Expense reductions | (50,893) | 1,971,215 |
Net investment income (loss) | | (1,412,037) |
Realized and Unrealized Gain (Loss) Net realized gain (loss) on: | | |
Investment securities | 7,468,860 | |
Foreign currency transactions | 2 | |
Total net realized gain (loss) | | 7,468,862 |
Change in net unrealized appreciation (depreciation) on: Investment securities | 59,768,034 | |
Assets and liabilities in foreign currencies | 3,752 | |
Total change in net unrealized appreciation (depreciation) | | 59,771,786 |
Net gain (loss) | | 67,240,648 |
Net increase (decrease) in net assets resulting from operations | | $ 65,828,611 |
Other Information | | |
Sales charges paid to FDC | | $ 254,182 |
Deferred sales charges withheld by FDC | | $ 876 |
Exchange fees withheld by
FSC | | $ 6,533 |
See accompanying notes which are an integral part of the financial statements.
Annual Report
Networking and Infrastructure Portfolio
Financial Statements - continued
Statement of Changes in Net Assets
| Year ended
February 29, 2004 | Year ended
February 28, 2003 |
Increase (Decrease) in Net Assets | | |
Operations | | |
Net investment income (loss) | $ (1,412,037) | $ (1,199,723) |
Net realized gain (loss) | 7,468,862 | (43,367,097) |
Change in net unrealized appreciation (depreciation) | 59,771,786 | 4,112,042 |
Net increase (decrease) in net assets resulting from operations | 65,828,611 | (40,454,778) |
Share transactions
Net proceeds from sales of shares | 248,584,834 | 101,212,417 |
Cost of shares redeemed | (181,244,333) | (93,620,403) |
Net increase (decrease) in net assets resulting from share transactions | 67,340,501 | 7,592,014 |
Redemption fees | 318,064 | 296,871 |
Total increase (decrease) in net assets | 133,487,176 | (32,565,893) |
| | |
Net Assets | | |
Beginning of period | 77,980,873 | 110,546,766 |
End of period | $ 211,468,049 | $ 77,980,873 |
Other Information Shares | | |
Sold | 110,117,410 | 58,157,174 |
Redeemed | (82,030,918) | (53,233,832) |
Net increase (decrease) | 28,086,492 | 4,923,342 |
Financial Highlights
Years ended February 28, | 2004H | 2003 | 2002 | 2001F |
Selected Per-Share Data | | | | |
Net asset value, beginning of period | $ 1.52 | $ 2.38 | $ 4.14 | $ 10.00 |
Income from Investment Operations | | | | |
Net investment income (loss)E | (.02) | (.03) | (.03) | (.02) |
Net realized and unrealized gain (loss) | 1.16 | (.84) | (1.74) | (5.86) |
Total from investment operations | 1.14 | (.87) | (1.77) | (5.88) |
Redemption fees added to paid in capitalE | -I | .01 | .01 | .02 |
Net asset value, end of period | $ 2.66 | $ 1.52 | $ 2.38 | $ 4.14 |
Total ReturnB,C,D | 75.00% | (36.13)% | (42.51)% | (58.60)% |
Ratios to Average Net AssetsG | | | | |
Expenses before expense reductions | 1.43% | 1.93% | 1.58% | 1.60%A |
Expenses net of voluntary waivers, if any | 1.43% | 1.93% | 1.58% | 1.60%A |
Expenses net of all reductions | 1.39% | 1.78% | 1.52% | 1.59%A |
Net investment income (loss) | (1.00)% | (1.45)% | (1.03)% | (.89)%A |
Supplemental Data | | | | |
Net assets, end of period (000 omitted) | $ 211,468 | $ 77,981 | $ 110,547 | $ 130,351 |
Portfolio turnover rate | 57% | 120% | 177% | 126%A |
A Annualized. B Total returns for periods of less than one year are not annualized. C Total returns would have been lower had certain expenses not been reduced during the periods shown. D Total returns do not include the effect of the former sales charges. E Calculated based on average shares outstanding during the period. F For the period September 21, 2000 (commencement of operations) to February 28, 2001. G Expense ratios reflect operating expenses of the fund. Expenses before reductions do not reflect amounts reimbursed by the investment adviser or reductions from brokerage service arrangements or other expense offset arrangements and do not represent the amount paid by the fund during periods when reimbursements or reductions occur. Expense ratios before reductions for start-up periods may not be representative of longer-term operating periods. Expenses net of any voluntary waivers reflect expenses after reimbursement by the investment adviser but prior to reductions from brokerage service arrangements or other expense offset arrangements. Expenses net of all reductions represent the net expenses paid by the fund. H For the year ended February 29. I Amount represents less than $.01 per share. |
See accompanying notes which are an integral part of the financial statements.
Technology Sector
Software and Computer Services Portfolio
Performance
Average annual total return reflects the change in the value of an investment, assuming reinvestment of the fund's dividend income and capital gains (the profits earned upon the sale of securities that have grown in value) and assuming a constant rate of performance each year. The $10,000 table and the fund's returns do not reflect the deduction of taxes that a shareholder would pay on fund distributions or the redemption of fund shares. During periods of reimbursement by Fidelity a fund's total returns will be greater than it would be had the reimbursement not occurred. How a fund did yesterday is no guarantee of how it will do tomorrow.
Average Annual Total Returns
Periods ended February 29, 2004 | Past 1
year | Past 5
years | Past 10
years |
Select Software and Computer Services | 44.79% | 8.20% | 16.03% |
$10,000 Over 10 Years
Let's say hypothetically that $10,000 was invested in Fidelity Select Software and Computer Services Portfolio on February 28, 1994. The chart shows how the value of your investment would have grown, and also shows how the S&P 500 Index did over the same period.
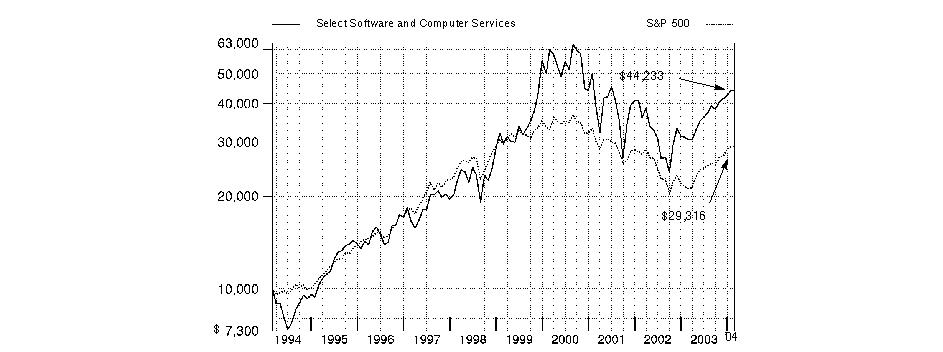
Annual Report
Software and Computer Services Portfolio
Management's Discussion of Fund Performance
Comments from Kelly Cardwell, Portfolio Manager of Fidelity® Select Software and Computer Services Portfolio
From March 2003 through the end of February 2004, domestic stocks recovered dramatically from their prior three-year swoon, driven largely by a broad-based economic and corporate profit recovery. Most major equity benchmarks gained 35% or more during the 12-month period, led by the Russell 2000® Index - a measure of the overall small-cap universe - which advanced 64.41%. As investors grew more confident about the economy's vitality, small-cap stocks were bid up, particularly those with no current earnings. In comparison, the Wilshire 5000® Total Market Index, commonly used as a proxy for the entire U.S. stock market's performance, rose 42.47%. Every sector of the market posted a double-digit advance, with economically sensitive issues - especially technology stocks - leading the way. The tech-heavy NASDAQ Composite® Index returned 52.47% during the past year, despite a negative return in February as investors turned to the more value-oriented segments of the market. The broader Standard & Poor's 500SM Index climbed 38.52% during the year, slightly outperforming the 37.07% increase for the blue-chip Dow Jones Industrial AverageSM.
For the 12 months that ended February 29, 2004, the fund returned 44.79%, beating the S&P 500® but lagging the Goldman Sachs® Technology Index, which gained 55.88%. The fund underperformed in part because the Goldman Sachs index is more broadly based, with exposure to a wide range of technology stocks - including semiconductor, electronics and telecommunications equipment stocks - that outperformed the fund's narrower range of software and computer services holdings. The fund's weakest investments were large, stable-growing defensive companies - such as Microsoft, First Data and Barra - that were out of favor with the market during the period. BEA Systems also underperformed as early gains gave way to a stagnant trading range. On the other hand, several holdings not found in the sector benchmark performed very well, with Amdocs - a market leader in telecommunications billing software - delivering the largest gains relative to the Goldman Sachs index. Autodesk moved up strongly as earnings accelerated at a faster-than-expected rate. Consumer electronics retailer Best Buy continued to perform well in response to strong demand for digital products. Underweighting IBM and Oracle also benefited the fund's relative performance, as both stocks underperformed.
The views expressed in this statement reflect those of the portfolio manager only through the end of the period of the report as stated on the cover and do not necessarily represent the views of Fidelity or any other person in the Fidelity organization. Any such views are subject to change at any time based upon market or other conditions and Fidelity disclaims any responsibility to update such views. These views may not be relied on as investment advice and, because investment decisions for a Fidelity fund are based on numerous factors, may not be relied on as an indication of trading intent on behalf of any Fidelity fund.
Annual Report
Software and Computer Services Portfolio
Investment Summary
Top Ten Stocks as of February 29, 2004 |
| % of fund's
net assets |
Microsoft Corp. | 14.7 |
BEA Systems, Inc. | 11.0 |
Amdocs Ltd. | 8.0 |
Nintendo Co. Ltd. | 5.0 |
First Data Corp. | 5.0 |
Best Buy Co., Inc. | 3.4 |
United Online, Inc. | 3.2 |
The BISYS Group, Inc. | 2.8 |
VERITAS Software Corp. | 2.6 |
Blue Coat Systems, Inc. | 2.1 |
| 57.8 |
Top Industries as of February 29, 2004 |
% of fund's net assets |
| Software | 58.6% | |
| IT Services | 16.5% | |
| Internet Software & Services | 8.0% | |
| Specialty Retail | 3.4% | |
| Computers & Peripherals | 2.5% | |
| All Others * | 11.0% | |

* Includes short-term investments and net other assets. |
Annual Report
Software and Computer Services Portfolio
Investments February 29, 2004
Showing Percentage of Net Assets
Common Stocks - 97.5% |
| Shares | | Value (Note 1) |
AEROSPACE & DEFENSE - 0.5% |
Orbital Sciences Corp. (a) | 245,400 | | $ 3,096,948 |
SI International, Inc. (a) | 44,011 | | 992,008 |
TOTAL AEROSPACE & DEFENSE | | 4,088,956 |
CAPITAL MARKETS - 0.5% |
Investment Technology Group, Inc. (a) | 288,800 | | 4,181,824 |
COMMERCIAL SERVICES & SUPPLIES - 0.8% |
Equifax, Inc. | 257,400 | | 6,746,454 |
COMMUNICATIONS EQUIPMENT - 2.3% |
Adtran, Inc. | 60,600 | | 1,973,136 |
Comverse Technology, Inc. (a) | 341,700 | | 6,738,324 |
Redback Networks, Inc. (a) | 981,836 | | 7,766,323 |
Telefonaktiebolaget LM Ericsson ADR (a) | 100,000 | | 2,902,000 |
TOTAL COMMUNICATIONS EQUIPMENT | | 19,379,783 |
COMPUTERS & PERIPHERALS - 2.5% |
ActivCard Corp. (a) | 400,000 | | 2,692,000 |
Advanced Digital Information Corp. (a) | 111,600 | | 1,403,928 |
Apple Computer, Inc. (a) | 384,900 | | 9,210,657 |
Avid Technology, Inc. (a) | 8,000 | | 339,760 |
Cray, Inc. (a) | 164,100 | | 1,215,981 |
International Business Machines Corp. | 1,400 | | 135,100 |
Network Appliance, Inc. (a) | 81,200 | | 1,758,792 |
Pinnacle Systems, Inc. (a) | 300,700 | | 2,267,278 |
Synaptics, Inc. (a) | 132,900 | | 2,429,412 |
TOTAL COMPUTERS & PERIPHERALS | | 21,452,908 |
ELECTRONIC EQUIPMENT & INSTRUMENTS - 1.9% |
AU Optronics Corp. sponsored ADR | 369,400 | | 6,353,680 |
CDW Corp. | 105,400 | | 7,291,572 |
Tech Data Corp. (a) | 61,700 | | 2,496,999 |
TOTAL ELECTRONIC EQUIPMENT & INSTRUMENTS | | 16,142,251 |
HEALTH CARE PROVIDERS & SERVICES - 1.7% |
Cerner Corp. (a) | 118,000 | | 5,288,760 |
IMS Health, Inc. | 290,496 | | 7,198,491 |
iSoft Group PLC | 294,800 | | 1,844,158 |
TOTAL HEALTH CARE PROVIDERS & SERVICES | | 14,331,409 |
HOUSEHOLD DURABLES - 0.8% |
Matsushita Electric Industrial Co. Ltd. ADR | 141,800 | | 2,056,100 |
Ngai Lik Industrial Holdings Ltd. | 10,180,000 | | 4,707,998 |
TOTAL HOUSEHOLD DURABLES | | 6,764,098 |
INTERNET SOFTWARE & SERVICES - 8.0% |
Ariba, Inc. (a) | 610,900 | | 1,899,899 |
Blue Coat Systems, Inc. (a) | 436,300 | | 17,897,462 |
|
| Shares | | Value (Note 1) |
EarthLink, Inc. (a) | 462,575 | | $ 4,223,310 |
Marimba, Inc. (a) | 20,270 | | 129,728 |
RealNetworks, Inc. (a) | 325,900 | | 1,854,371 |
S1 Corp. (a) | 213,300 | | 1,557,090 |
United Online, Inc. (a) | 1,585,750 | | 27,306,615 |
Websense, Inc. (a) | 407,900 | | 11,135,670 |
Yahoo!, Inc. (a) | 38,500 | | 1,709,400 |
TOTAL INTERNET SOFTWARE & SERVICES | | 67,713,545 |
IT SERVICES - 16.5% |
Affiliated Computer Services, Inc. Class A (a) | 212,200 | | 10,240,772 |
Ceridian Corp. (a) | 458,900 | | 8,686,977 |
CSG Systems International, Inc. (a) | 135,800 | | 1,901,200 |
First Data Corp. | 1,031,059 | | 42,252,798 |
Infosys Technologies Ltd. | 61,057 | | 6,850,459 |
National Processing, Inc. (a) | 90,000 | | 1,782,000 |
Paychex, Inc. | 508,380 | | 16,354,585 |
Sabre Holdings Corp. Class A | 231,500 | | 5,252,735 |
Satyam Computer Services Ltd. | 2,155,800 | | 14,764,643 |
SM&A (a) | 518,200 | | 5,394,462 |
The BISYS Group, Inc. (a) | 1,334,900 | | 23,560,985 |
Titan Corp. (a) | 137,100 | | 2,885,955 |
TOTAL IT SERVICES | | 139,927,571 |
SOFTWARE - 58.6% |
Activision, Inc. (a) | 122,900 | | 2,582,129 |
Adobe Systems, Inc. | 197,206 | | 7,343,951 |
Altiris, Inc. (a) | 3,900 | | 106,275 |
Amdocs Ltd. (a) | 2,416,600 | | 67,374,808 |
Autodesk, Inc. | 491,800 | | 14,090,070 |
Barra, Inc. | 494,989 | | 15,661,452 |
BEA Systems, Inc. (a) | 6,772,700 | | 93,463,260 |
Bottomline Technologies, Inc. (a) | 190,200 | | 1,850,646 |
Cadence Design Systems, Inc. (a) | 485,500 | | 7,491,265 |
Check Point Software Technologies Ltd. (a) | 455,100 | | 10,476,402 |
Compuware Corp. (a) | 333,600 | | 2,615,424 |
Concord Communications, Inc. (a) | 341,900 | | 6,325,150 |
Concur Technologies, Inc. (a) | 8,483 | | 103,493 |
E.piphany, Inc. (a) | 315,600 | | 2,193,420 |
FactSet Research Systems, Inc. | 119,900 | | 4,415,917 |
FileNET Corp. (a) | 333,200 | | 9,429,560 |
I-Flex Solutions Ltd. | 250,000 | | 3,737,695 |
Manhattan Associates, Inc. (a) | 43,300 | | 1,240,978 |
Microsoft Corp. | 4,710,300 | | 124,822,949 |
Network Associates, Inc. (a) | 270,600 | | 4,746,324 |
Nintendo Co. Ltd. | 440,200 | | 42,418,209 |
Oracle Corp. (a) | 4,500 | | 57,960 |
Patni Computer Systems Ltd. (a) | 280,400 | | 1,552,884 |
PeopleSoft, Inc. (a) | 604,500 | | 13,045,110 |
Quest Software, Inc. (a) | 240,100 | | 3,786,377 |
Red Hat, Inc. (a) | 467,070 | | 8,444,626 |
Common Stocks - continued |
| Shares | | Value (Note 1) |
SOFTWARE - CONTINUED |
RM PLC | 1,401,900 | | $ 3,612,616 |
SAP AG sponsored ADR | 4,200 | | 166,320 |
Secure Computing Corp. (a) | 414,300 | | 5,990,778 |
Siebel Systems, Inc. (a) | 902,200 | | 11,782,732 |
SurfControl PLC (a) | 14,400 | | 155,423 |
Verint Systems, Inc. (a) | 19,010 | | 497,302 |
VERITAS Software Corp. (a) | 722,000 | | 21,963,240 |
Wind River Systems, Inc. (a) | 268,700 | | 2,630,573 |
TOTAL SOFTWARE | | 496,175,318 |
SPECIALTY RETAIL - 3.4% |
Best Buy Co., Inc. | 540,800 | | 28,797,600 |
TOTAL COMMON STOCKS (Cost $715,198,299) | 825,701,717 |
Money Market Funds - 3.2% |
| | | |
Fidelity Cash Central Fund, 1.08% (b) | 7,505,098 | | 7,505,098 |
Fidelity Securities Lending Cash Central Fund, 1.08% (b) | 19,739,300 | | 19,739,300 |
TOTAL MONEY MARKET FUNDS (Cost $27,244,398) | 27,244,398 |
TOTAL INVESTMENT PORTFOLIO - 100.7% (Cost $742,442,697) | | 852,946,115 |
NET OTHER ASSETS - (0.7)% | | (5,999,722) |
NET ASSETS - 100% | $ 846,946,393 |
Legend |
(a) Non-income producing |
(b) Affiliated fund that is available only to investment companies and other accounts managed by Fidelity Investments. The rate quoted is the annualized seven-day yield of the fund at period end. A complete listing of the fund's holdings as of its most recent fiscal year end is available upon request. |
Other Information |
Purchases and sales of securities, other than short-term securities, aggregated $602,375,160 and $567,654,926, respectively. |
The fund placed a portion of its portfolio transactions with brokerage firms which are affiliates of the investment adviser. The commissions paid to these affiliated firms were $125,608 for the period. |
Distribution of investments by country of issue, as a percentage of total net assets, is as follows: |
United States of America | 80.1% |
United Kingdom | 8.6% |
Japan | 5.2% |
India | 3.2% |
Israel | 1.2% |
Others (individually less than 1%) | 1.7% |
| 100.0% |
Income Tax Information |
At February 29, 2004, the fund had a capital loss carryforward of approximately $256,344,000 of which $128,686,000 and $127,658,000 will expire on February 28, 2010 and 2011, respectively. |
See accompanying notes which are an integral part of the financial statements.
Technology Sector
Software and Computer Services Portfolio
Financial Statements
Statement of Assets and Liabilities
| February 29, 2004 |
| | |
Assets | | |
Investment in securities, at value (including securities loaned of $19,320,836) (cost $742,442,697) - See accompanying schedule | | $ 852,946,115 |
Receivable for investments sold | | 21,641,901 |
Receivable for fund shares sold | | 767,755 |
Dividends receivable | | 80,249 |
Interest receivable | | 8,616 |
Prepaid expenses | | 3,683 |
Other affiliated receivables | | 85 |
Other receivables | | 89,830 |
Total assets | | 875,538,234 |
| | |
Liabilities | | |
Payable for investments purchased | $ 6,241,328 | |
Payable for fund shares redeemed | 1,703,496 | |
Accrued management fee | 406,161 | |
Other affiliated payables | 255,884 | |
Other payables and accrued expenses | 245,672 | |
Collateral on securities loaned, at value | 19,739,300 | |
Total liabilities | | 28,591,841 |
| | |
Net Assets | | $ 846,946,393 |
Net Assets consist of: | | |
Paid in capital | | $ 998,640,644 |
Accumulated undistributed net realized gain (loss) on investments and foreign currency transactions | | (261,992,869) |
Net unrealized appreciation (depreciation) on investments and assets and liabilities in foreign currencies | | 110,298,618 |
Net Assets, for 16,486,408 shares outstanding | | $ 846,946,393 |
Net Asset Value, offering price and redemption price per share ($846,946,393 ÷ 16,486,408 shares) | | $ 51.37 |
Statement of Operations
| Year ended February 29, 2004 |
| | |
Investment Income | | |
Dividends | | $ 2,646,667 |
Special Dividends | | 534,989 |
Interest | | 652,441 |
Security lending | | 136,801 |
Total income | | 3,970,898 |
| | |
Expenses | | |
Management fee | $ 4,379,941 | |
Transfer agent fees | 3,211,965 | |
Accounting and security lending fees | 417,689 | |
Non-interested trustees' compensation | 3,745 | |
Custodian fees and expenses | 77,576 | |
Registration fees | 29,036 | |
Audit | 48,089 | |
Legal | 7,999 | |
Miscellaneous | 16,239 | |
Total expenses before reductions | 8,192,279 | |
Expense reductions | (202,578) | 7,989,701 |
Net investment income (loss) | | (4,018,803) |
Realized and Unrealized Gain (Loss) Net realized gain (loss) on: | | |
Investment securities (net of foreign taxes of ($480)) | 150,623,955 | |
Foreign currency transactions | (44,092) | |
Total net realized gain (loss) | | 150,579,863 |
Change in net unrealized appreciation (depreciation) on: Investment securities (net of deferred foreign taxes of ($205,167)) | 122,938,641 | |
Assets and liabilities in foreign currencies | 367 | |
Total change in net unrealized appreciation (depreciation) | | 122,939,008 |
Net gain (loss) | | 273,518,871 |
Net increase (decrease) in net assets resulting from operations | | $ 269,500,068 |
Other Information | | |
Sales charges paid to FDC | | $ 322,678 |
Deferred sales charges withheld by FDC | | $ 4,525 |
Exchange fees withheld by
FSC | | $ 9,803 |
See accompanying notes which are an integral part of the financial statements.
Annual Report
Software and Computer Services Portfolio
Financial Statements - continued
Statement of Changes in Net Assets
| Year ended
February 29,
2004 | Year ended
February 28,
2003 |
Increase (Decrease) in Net Assets | | |
Operations | | |
Net investment income (loss) | $ (4,018,803) | $ (4,140,907) |
Net realized gain (loss) | 150,579,863 | (92,535,367) |
Change in net unrealized appreciation (depreciation) | 122,939,008 | (26,122,628) |
Net increase (decrease) in net assets resulting from operations | 269,500,068 | (122,798,902) |
Share transactions
Net proceeds from sales of shares | 166,207,624 | 232,814,124 |
Cost of shares redeemed | (206,781,615) | (274,881,051) |
Net increase (decrease) in net assets resulting from share transactions | (40,573,991) | (42,066,927) |
Redemption fees | 116,029 | 250,645 |
Total increase (decrease) in net assets | 229,042,106 | (164,615,184) |
| | |
Net Assets | | |
Beginning of period | 617,904,287 | 782,519,471 |
End of period | $ 846,946,393 | $ 617,904,287 |
Other Information Shares | | |
Sold | 3,730,779 | 6,309,339 |
Redeemed | (4,658,389) | (7,597,020) |
Net increase (decrease) | (927,610) | (1,287,681) |
Financial Highlights
Years ended February 28, | 2004 F | 2003 | 2002 | 2001 | 2000 F |
Selected Per-Share Data | | | | | |
Net asset value, beginning of period | $ 35.48 | $ 41.84 | $ 45.33 | $ 105.09 | $ 57.09 |
Income from Investment Operations | | | | | |
Net investment income (loss) C | (.24)G | (.24) | (.26) | (.29) | (.36) D |
Net realized and unrealized gain (loss) | 16.12 | (6.13) | (3.02) | (28.23) | 54.60 |
Total from investment operations | 15.88 | (6.37) | (3.28) | (28.52) | 54.24 |
Distributions from net realized gain | - | - | (.24) | (31.32) | (6.33) |
Redemption fees added to paid in capital C | .01 | .01 | .03 | .08 | .09 |
Net asset value, end of period | $ 51.37 | $ 35.48 | $ 41.84 | $ 45.33 | $ 105.09 |
Total Return A, B | 44.79% | (15.20)% | (7.08)% | (35.27)% | 100.83% |
Ratios to Average Net Assets E | | | | | |
Expenses before expense reductions | 1.09% | 1.18% | 1.09% | 1.00% | 1.11% |
Expenses net of voluntary waivers, if any | 1.09% | 1.18% | 1.09% | 1.00% | 1.11% |
Expenses net of all reductions | 1.06% | 1.05% | 1.05% | .99% | 1.11% |
Net investment income (loss) | (.53)% | (.65)% | (.57)% | (.36)% | (.51)% |
Supplemental Data | | | | | |
Net assets, end of period (000 omitted) | $ 846,946 | $ 617,904 | $ 782,519 | $ 921,678 | $ 1,447,686 |
Portfolio turnover rate | 81% | 198% | 325% | 272% | 59% |
A Total returns would have been lower had certain expenses not been reduced during the periods shown. B Total returns do not include the effect of the former sales charges. C Calculated based on average shares outstanding during the period. D Investment income per share reflects a special dividend which amounted to $.01 per share. E Expense ratios reflect operating expenses of the fund. Expenses before reductions do not reflect amounts reimbursed by the investment adviser or reductions from brokerage service arrangements or other expense offset arrangements and do not represent the amount paid by the fund during periods when reimbursements or reductions occur. Expenses net of any voluntary waivers reflect expenses after reimbursement by the investment adviser but prior to reductions from brokerage service arrangements or other expense offset arrangements. Expenses net of all reductions represent the net expenses paid by the fund. F For the year ended February 29. G Investment income per share reflects a special dividend which amounted to $.03 per share. |
See accompanying notes which are an integral part of the financial statements.
Technology Sector
Technology Portfolio
Performance
Average annual total return reflects the change in the value of an investment, assuming reinvestment of the fund's dividend income and capital gains (the profits earned upon the sale of securities that have grown in value) and assuming a constant rate of performance each year. The $10,000 table and the fund's returns do not reflect the deduction of taxes that a shareholder would pay on fund distributions or the redemption of fund shares. During periods of reimbursement by Fidelity a fund's total returns will be greater than it would be had the reimbursement not occurred. How a fund did yesterday is no guarantee of how it will do tomorrow.
Average Annual Total Returns
Periods ended February 29, 2004 | Past 1
year | Past 5
years | Past 10
years |
Select Technology | 61.13% | 0.87% | 13.69% |
$10,000 Over 10 Years
Let's say hypothetically that $10,000 was invested in Fidelity Select Technology Portfolio on February 28, 1994. The chart shows how the value of your investment would have grown, and also shows how the S&P 500 Index did over the same period.
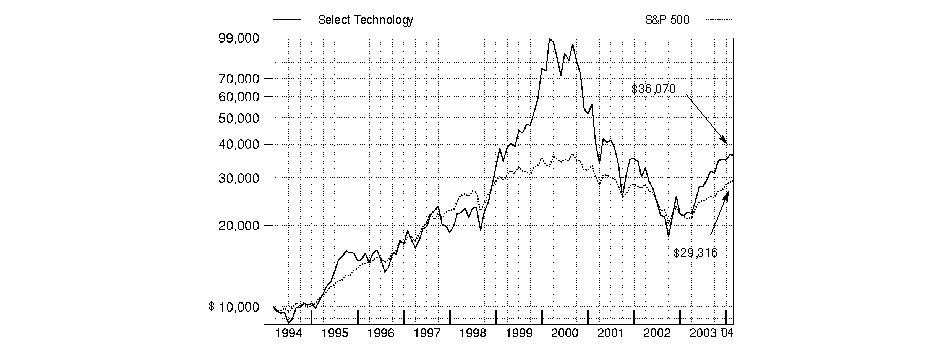
Annual Report
Technology Portfolio
Management's Discussion of Fund Performance
Comments from Sonu Kalra, Portfolio Manager of Fidelity® Select Technology Portfolio
From March 2003 through the end of February 2004, domestic stocks recovered dramatically from their prior three-year swoon, driven largely by a broad-based economic and corporate profit recovery. Most major equity benchmarks gained 35% or more during the 12-month period, led by the Russell 2000® Index - a measure of the overall small-cap universe - which advanced 64.41%. As investors grew more confident about the economy's vitality, small-cap stocks were bid up, particularly those with no current earnings. In comparison, the Wilshire 5000® Total Market Index, commonly used as a proxy for the entire U.S. stock market's performance, rose 42.47%. Every sector of the market posted a double-digit advance, with economically sensitive issues - especially technology stocks - leading the way. The tech-heavy NASDAQ Composite® Index returned 52.47% during the past year, despite a negative return in February as investors turned to the more value-oriented segments of the market. The broader Standard & Poor's 500SM Index climbed 38.52% during the year, slightly outperforming the 37.07% increase for the blue-chip Dow Jones Industrial AverageSM.
For the 12 months ending February 29, 2004, the fund's return was 61.13%, topping the 55.88% return for the Goldman Sachs® Technology Index and the S&P 500®. Stock selection in semiconductors and software provided a major boost to performance versus the sector benchmark. IBM was the top contributor compared with the Goldman Sachs index, as the fund was rewarded for significantly underweighting the stock. Wireless handset maker Motorola topped the fund's contributors in absolute terms and also had a positive impact on relative performance. In the wireless infrastructure space, LM Ericsson performed well, aided by its attention to cost cutting and by the improving prospects for stepped-up capital expenditures in the wireless industry. On the negative side, stock picking in the media and disk-drive industries hurt a bit. For example, media conglomerate Time Warner posted a solid return but still lagged the Goldman Sachs index. The stock's disappointing performance was due primarily to poor results at the company's AOL subsidiary. Shares of PalmOne struggled under the weight of announced plans to reduce the company's workforce by almost 10% and the news that an influential retailer planned to reduce the number of models of PalmOne's personal digital assistants (PDAs) carried in its stores.
The views expressed in this statement reflect those of the portfolio manager only through the end of the period of the report as stated on the cover and do not necessarily represent the views of Fidelity or any other person in the Fidelity organization. Any such views are subject to change at any time based upon market or other conditions and Fidelity disclaims any responsibility to update such views. These views may not be relied on as investment advice and, because investment decisions for a Fidelity fund are based on numerous factors, may not be relied on as an indication of trading intent on behalf of any Fidelity fund.
Annual Report
Technology Portfolio
Investment Summary
Top Ten Stocks as of February 29, 2004 |
| % of fund's
net assets |
Microsoft Corp. | 6.3 |
Intel Corp. | 5.7 |
Cisco Systems, Inc. | 4.8 |
Dell, Inc. | 4.8 |
Hewlett-Packard Co. | 2.8 |
Motorola, Inc. | 2.7 |
National Semiconductor Corp. | 2.6 |
Texas Instruments, Inc. | 2.5 |
EMC Corp. | 2.2 |
Lexmark International, Inc. Class A | 2.0 |
| 36.4 |
Top Industries as of February 29, 2004 |
% of fund's net assets |
| Semiconductors &
Semiconductor
Equipment | 31.9% | |
| Communications
Equipment | 22.4% | |
| Computers &
Peripherals | 17.5% | |
| Software | 14.6% | |
| Electronic Equipment &
Instruments | 3.5% | |
| All Others* | 10.1% | |

* Includes short-term investments and net other assets. |
Annual Report
Technology Portfolio
Investments February 29, 2004
Showing Percentage of Net Assets
Common Stocks - 99.3% |
| Shares | | Value (Note 1) |
COMMERCIAL SERVICES & SUPPLIES - 0.3% |
Monster Worldwide, Inc. (a) | 337,800 | | $ 7,431,600 |
COMMUNICATIONS EQUIPMENT - 22.4% |
3Com Corp. (a) | 744,800 | | 5,213,600 |
ADC Telecommunications, Inc. (a) | 3,509,000 | | 10,527,000 |
Alcatel SA sponsored ADR (a) | 1,706,500 | | 27,628,235 |
Alvarion Ltd. (a) | 152,500 | | 2,203,625 |
Andrew Corp. (a) | 144,200 | | 2,569,644 |
Arris Group, Inc. (a) | 465,000 | | 4,822,050 |
AudioCodes Ltd. (a) | 203,700 | | 2,804,949 |
Avaya, Inc. (a) | 1,923,400 | | 32,986,310 |
Brocade Communications Systems, Inc. (a) | 1,561,200 | | 10,881,564 |
CIENA Corp. (a) | 1,464,000 | | 8,388,720 |
Cisco Systems, Inc. (a) | 5,454,900 | | 126,008,190 |
Comverse Technology, Inc. (a) | 1,095,130 | | 21,595,964 |
Corning, Inc. (a) | 544,000 | | 6,827,200 |
ECI Telecom Ltd. (a) | 51,900 | | 357,539 |
Emulex Corp. (a) | 406,400 | | 9,420,352 |
Enterasys Networks, Inc. (a) | 2,441,300 | | 11,107,915 |
Extreme Networks, Inc. (a) | 451,200 | | 3,632,160 |
F5 Networks, Inc. (a) | 107,800 | | 3,567,102 |
Finisar Corp. (a) | 2,858,700 | | 8,204,469 |
Foundry Networks, Inc. (a) | 42,700 | | 1,007,720 |
ITF Optical Technologies, Inc. Series A (c) | 65,118 | | 81,398 |
Juniper Networks, Inc. (a) | 214,300 | | 5,543,941 |
Lucent Technologies, Inc. (a) | 5,542,500 | | 23,223,075 |
Marconi Corp. PLC (a) | 796,266 | | 10,609,084 |
McDATA Corp. Class A (a) | 1,815,400 | | 14,632,124 |
Motorola, Inc. | 3,802,700 | | 70,159,815 |
NetScreen Technologies, Inc. (a) | 223,700 | | 7,930,165 |
Nortel Networks Corp. (a) | 2,543,100 | | 20,218,411 |
Oplink Communications, Inc. (a) | 953,300 | | 2,526,245 |
Powerwave Technologies, Inc. (a) | 1,490,800 | | 14,714,196 |
QLogic Corp. (a) | 115,400 | | 4,823,720 |
QUALCOMM, Inc. | 525,700 | | 33,355,665 |
Research in Motion Ltd. (a) | 87,900 | | 8,692,257 |
Scientific-Atlanta, Inc. | 444,900 | | 14,726,190 |
Sierra Wireless, Inc. (a) | 237,400 | | 6,513,412 |
Sonus Networks, Inc. (a) | 88,500 | | 524,805 |
Telefonaktiebolaget LM Ericsson ADR (a) | 1,386,100 | | 40,224,622 |
WJ Communications, Inc. (a) | 811,800 | | 4,083,354 |
TOTAL COMMUNICATIONS EQUIPMENT | | 582,336,787 |
COMPUTERS & PERIPHERALS - 17.5% |
Ambit Microsystems Corp. | 1,499,300 | | 4,373,898 |
Apple Computer, Inc. (a) | 696,700 | | 16,672,031 |
Concurrent Computer Corp. (a) | 550,860 | | 2,242,000 |
Dell, Inc. (a) | 3,783,900 | | 123,544,335 |
Dot Hill Systems Corp. (a) | 973,800 | | 13,662,414 |
EMC Corp. (a) | 4,012,545 | | 57,459,644 |
Hewlett-Packard Co. | 3,206,489 | | 72,819,365 |
|
| Shares | | Value (Note 1) |
Hutchinson Technology, Inc. (a) | 348,400 | | $ 9,918,948 |
International Business Machines Corp. | 312,750 | | 30,180,375 |
Komag, Inc. (a) | 276,385 | | 6,312,633 |
Lexmark International, Inc. Class A (a) | 637,600 | | 52,468,104 |
Maxtor Corp. (a) | 796,200 | | 8,161,050 |
Network Appliance, Inc. (a) | 567,200 | | 12,285,552 |
PalmOne, Inc. (a) | 730,144 | | 7,323,344 |
Quanta Computer, Inc. | 2,986,500 | | 7,589,752 |
Silicon Graphics, Inc. (a) | 329,639 | | 1,061,438 |
Storage Technology Corp. (a) | 310,000 | | 9,104,700 |
Sun Microsystems, Inc. (a) | 839,200 | | 4,481,328 |
Western Digital Corp. (a) | 1,235,290 | | 14,069,953 |
TOTAL COMPUTERS & PERIPHERALS | | 453,730,864 |
DIVERSIFIED TELECOMMUNICATION SERVICES - 0.1% |
Global Crossing Ltd. (a) | 95,700 | | 2,583,900 |
ELECTRICAL EQUIPMENT - 0.2% |
Byd Co. Ltd. (H Shares) | 1,246,000 | | 4,129,750 |
Power-One, Inc. (a) | 70,100 | | 859,426 |
TOTAL ELECTRICAL EQUIPMENT | | 4,989,176 |
ELECTRONIC EQUIPMENT & INSTRUMENTS - 3.5% |
Agilent Technologies, Inc. (a) | 280,500 | | 9,590,295 |
Amphenol Corp. Class A (a) | 41,500 | | 2,566,775 |
Arrow Electronics, Inc. (a) | 570,300 | | 14,029,380 |
Avnet, Inc. (a) | 248,500 | | 5,852,175 |
Hon Hai Precision Industries Co. Ltd. | 1,339,000 | | 5,960,060 |
Ingram Micro, Inc. Class A (a) | 317,500 | | 6,026,150 |
Merix Corp. (a) | 7,300 | | 179,580 |
National Instruments Corp. | 83,250 | | 2,877,120 |
Photon Dynamics, Inc. (a) | 187,099 | | 6,681,305 |
Solectron Corp. (a) | 1,257,100 | | 8,032,869 |
Symbol Technologies, Inc. | 503,700 | | 8,572,974 |
Veeco Instruments, Inc. (a) | 169,400 | | 4,941,398 |
Vishay Intertechnology, Inc. (a) | 706,200 | | 15,896,562 |
TOTAL ELECTRONIC EQUIPMENT & INSTRUMENTS | | 91,206,643 |
HOUSEHOLD DURABLES - 1.0% |
Harman International Industries, Inc. | 219,800 | | 17,142,202 |
Koninklijke Philips Electronics NV
(NY Shares) | 122,300 | | 3,720,366 |
Sony Corp. sponsored ADR | 145,000 | | 5,936,300 |
TOTAL HOUSEHOLD DURABLES | | 26,798,868 |
INDUSTRIAL CONGLOMERATES - 0.2% |
Siemens AG sponsored ADR | 64,200 | | 4,994,760 |
INTERNET & CATALOG RETAIL - 1.5% |
Amazon.com, Inc. (a) | 325,900 | | 14,062,585 |
Common Stocks - continued |
| Shares | | Value (Note 1) |
INTERNET & CATALOG RETAIL - CONTINUED |
eBay, Inc. (a) | 211,200 | | $ 14,543,232 |
InterActiveCorp (a) | 360,800 | | 11,751,256 |
TOTAL INTERNET & CATALOG RETAIL | | 40,357,073 |
INTERNET SOFTWARE & SERVICES - 3.4% |
Akamai Technologies, Inc. (a) | 374,600 | | 5,619,000 |
Blue Coat Systems, Inc. (a) | 900 | | 36,919 |
EarthLink, Inc. (a) | 803,700 | | 7,337,781 |
Internap Network Services Corp. (a) | 2,592,100 | | 4,873,148 |
Interwoven, Inc. (a) | 151,725 | | 1,843,459 |
iPass, Inc. | 139,400 | | 1,716,014 |
Openwave Systems, Inc. (a) | 420,133 | | 6,369,216 |
RADWARE Ltd. (a) | 187,000 | | 5,217,300 |
SonicWALL, Inc. (a) | 332,477 | | 3,191,779 |
Supportsoft, Inc. (a) | 29,700 | | 361,746 |
United Online, Inc. (a) | 927,053 | | 15,963,853 |
VeriSign, Inc. (a) | 584,700 | | 10,179,627 |
Yahoo!, Inc. (a) | 595,550 | | 26,442,420 |
TOTAL INTERNET SOFTWARE & SERVICES | | 89,152,262 |
IT SERVICES - 1.0% |
Cognizant Technology Solutions Corp. Class A (a) | 156,700 | | 7,433,848 |
CompuCom Systems, Inc. (a) | 36,900 | | 202,581 |
CSG Systems International, Inc. (a) | 155,600 | | 2,178,400 |
First Data Corp. | 287,500 | | 11,781,750 |
Infosys Technologies Ltd. sponsored ADR | 43,700 | | 3,672,111 |
TOTAL IT SERVICES | | 25,268,690 |
LEISURE EQUIPMENT & PRODUCTS - 0.1% |
Premier Image Technology Corp. | 1,821,000 | | 3,066,947 |
MEDIA - 0.2% |
Pixar (a) | 62,500 | | 4,108,750 |
OFFICE ELECTRONICS - 0.2% |
Canon, Inc. | 91,000 | | 4,472,650 |
SEMICONDUCTORS & SEMICONDUCTOR EQUIPMENT - 31.9% |
Agere Systems, Inc.: | | | |
Class A (a) | 6,575,390 | | 25,512,513 |
Class B (a) | 5,724,206 | | 21,236,804 |
Altera Corp. (a) | 574,000 | | 12,673,920 |
Analog Devices, Inc. | 836,200 | | 41,726,380 |
Applied Materials, Inc. (a) | 792,800 | | 16,839,072 |
ARM Holdings PLC sponsored ADR | 684,700 | | 4,621,725 |
ASML Holding NV (NY Shares) (a) | 414,800 | | 7,574,248 |
ATMI, Inc. (a) | 335,500 | | 9,108,825 |
Axcelis Technologies, Inc. (a) | 412,400 | | 4,717,856 |
Broadcom Corp. Class A (a) | 292,400 | | 11,865,592 |
Cabot Microelectronics Corp. (a) | 101,200 | | 4,508,460 |
Conexant Systems, Inc. (a) | 3,556,700 | | 26,141,745 |
|
| Shares | | Value (Note 1) |
Cree, Inc. (a) | 139,060 | | $ 3,330,487 |
Cymer, Inc. (a) | 119,900 | | 4,620,946 |
Cypress Semiconductor Corp. (a) | 199,600 | | 4,307,368 |
FormFactor, Inc. | 223,600 | | 4,548,024 |
GlobespanVirata, Inc. (a) | 737,300 | | 6,539,851 |
Integrated Circuit Systems, Inc. (a) | 1,375,300 | | 37,875,762 |
Integrated Device Technology, Inc. (a) | 762,000 | | 12,565,380 |
Intel Corp. | 5,051,860 | | 147,665,868 |
International Rectifier Corp. (a) | 133,700 | | 6,171,592 |
Intersil Corp. Class A | 720,900 | | 17,006,031 |
KLA-Tencor Corp. (a) | 228,100 | | 12,043,680 |
Lam Research Corp. (a) | 44,400 | | 1,135,308 |
Lattice Semiconductor Corp. (a) | 611,700 | | 6,318,861 |
Linear Technology Corp. | 284,700 | | 11,385,153 |
LSI Logic Corp. (a) | 501,300 | | 5,063,130 |
Marvell Technology Group Ltd. (a) | 340,700 | | 15,512,071 |
Maxim Integrated Products, Inc. | 68,000 | | 3,393,880 |
MEMC Electronic Materials, Inc. (a) | 333,500 | | 3,164,915 |
Microchip Technology, Inc. | 342,300 | | 9,755,550 |
Micron Technology, Inc. (a) | 367,240 | | 5,523,290 |
Mindspeed Technologies, Inc. (a) | 213,400 | | 1,894,992 |
National Semiconductor Corp. (a) | 1,698,900 | | 66,868,704 |
NVIDIA Corp. (a) | 1,166,200 | | 25,947,950 |
ON Semiconductor Corp. (a) | 1,105,500 | | 9,352,530 |
PMC-Sierra, Inc. (a) | 151,400 | | 3,012,860 |
Power Integrations, Inc. (a) | 165,100 | | 4,867,148 |
Samsung Electronics Co. Ltd. | 44,000 | | 20,347,893 |
Silicon Image, Inc. (a) | 1,713,851 | | 19,109,439 |
STMicroelectronics NV (NY Shares) | 435,200 | | 11,249,920 |
Taiwan Semiconductor Manufacturing Co. Ltd. (a) | 1,320,000 | | 2,520,902 |
Taiwan Semiconductor Manufacturing Co. Ltd. sponsored ADR (a) | 1,055,480 | | 10,966,437 |
Teradyne, Inc. (a) | 1,057,900 | | 26,077,235 |
Texas Instruments, Inc. | 2,157,200 | | 66,118,180 |
Tokyo Electron Ltd. | 125,100 | | 7,565,815 |
Tower Semicondutor Ltd. (a) | 621,800 | | 4,352,600 |
United Microelectronics Corp. sponsored ADR (a) | 2,441,068 | | 12,717,964 |
Varian Semiconductor Equipment Associates, Inc. (a) | 126,300 | | 5,151,777 |
Xilinx, Inc. (a) | 641,000 | | 26,947,640 |
TOTAL SEMICONDUCTORS & SEMICONDUCTOR EQUIPMENT | | 829,524,273 |
SOFTWARE - 14.6% |
Amdocs Ltd. (a) | 577,200 | | 16,092,336 |
Autodesk, Inc. | 198,504 | | 5,687,140 |
BEA Systems, Inc. (a) | 927,933 | | 12,805,475 |
Cadence Design Systems, Inc. (a) | 820,040 | | 12,653,217 |
Check Point Software Technologies Ltd. (a) | 220,100 | | 5,066,702 |
Computer Associates International, Inc. | 160,200 | | 4,254,912 |
Concord Communications, Inc. (a) | 13,000 | | 240,500 |
Common Stocks - continued |
| Shares | | Value (Note 1) |
SOFTWARE - CONTINUED |
FileNET Corp. (a) | 238,697 | | $ 6,755,125 |
Intuit, Inc. (a) | 86,800 | | 3,850,448 |
Lawson Software, Inc. (a) | 310,604 | | 2,723,997 |
Micromuse, Inc. (a) | 370,800 | | 3,322,368 |
Microsoft Corp. | 6,205,060 | | 164,434,090 |
Nintendo Co. Ltd. | 86,500 | | 8,335,246 |
Oracle Corp. (a) | 2,001,700 | | 25,781,896 |
Quest Software, Inc. (a) | 1,084,929 | | 17,109,330 |
Red Hat, Inc. (a) | 1,374,700 | | 24,854,576 |
SAP AG sponsored ADR | 134,800 | | 5,338,080 |
Secure Computing Corp. (a) | 103,200 | | 1,492,272 |
Siebel Systems, Inc. (a) | 807,028 | | 10,539,786 |
Symantec Corp. (a) | 255,000 | | 10,490,700 |
Synopsys, Inc. (a) | 630,895 | | 18,598,785 |
VERITAS Software Corp. (a) | 625,900 | | 19,039,878 |
Visual Networks, Inc. (a) | 263,300 | | 1,053,200 |
TOTAL SOFTWARE | | 380,520,059 |
SPECIALTY RETAIL - 0.5% |
Best Buy Co., Inc. | 235,100 | | 12,519,075 |
WIRELESS TELECOMMUNICATION SERVICES - 0.7% |
American Tower Corp. Class A (a) | 901,000 | | 9,956,050 |
Nextel Communications, Inc. Class A (a) | 281,900 | | 7,467,531 |
Sprint Corp. - PCS Group Series 1 (a) | 14,400 | | 129,600 |
TOTAL WIRELESS TELECOMMUNICATION SERVICES | | 17,553,181 |
TOTAL COMMON STOCKS (Cost $2,199,324,607) | 2,580,615,558 |
Convertible Preferred Stocks - 0.0% |
| | | |
COMMUNICATIONS EQUIPMENT - 0.0% |
Chorum Technologies, Inc. Series E (a)(c) | 33,100 | | 0 |
Procket Networks, Inc. Series C (c) | 504,045 | | 126,011 |
SOFTWARE - 0.0% |
Monterey Design Systems Series E (c) | 627,333 | | 313,667 |
TOTAL CONVERTIBLE PREFERRED STOCKS (Cost $8,842,090) | 439,678 |
Money Market Funds - 2.3% |
| | |
Fidelity Cash Central Fund, 1.08% (b) | 12,827,067 | 12,827,067 |
Fidelity Securities Lending Cash Central Fund, 1.08% (b) | 45,875,578 | 45,875,578 |
TOTAL MONEY MARKET FUNDS (Cost $58,702,645) | 58,702,645 |
|
| | Value (Note 1) |
TOTAL INVESTMENT PORTFOLIO - 101.6% (Cost $2,266,869,342) | $ 2,639,757,881 |
NET OTHER ASSETS - (1.6)% | (40,585,744) |
NET ASSETS - 100% | $ 2,599,172,137 |
Legend |
(a) Non-income producing |
(b) Affiliated fund that is available only to investment companies and other accounts managed by Fidelity Investments. The rate quoted is the annualized seven-day yield of the fund at period end. A complete listing of the fund's holdings as of its most recent fiscal year end is available upon request. |
(c) Restricted securities - Investment in securities not registered under the Securities Act of 1933. At the end of the period, the value of restricted securities amounted to $521,076 or 0.0% of net assets. |
Additional information on each holding is as follows: |
Security | Acquisition Date | Acquisition Cost |
Chorum Technologies, Inc. Series E | 9/19/00 | $ 570,644 |
ITF Optical Technologies, Inc.
Series A | 10/11/00 | $ 3,269,910 |
Monterey Design Systems Series E | 11/1/00 | $ 3,293,498 |
Procket Networks, Inc. Series C | 11/15/00 - 12/26/00 | $ 4,977,948 |
Other Information |
Purchases and sales of securities, other than short-term securities, aggregated $2,854,737,629 and $2,631,956,291, respectively. |
The fund placed a portion of its portfolio transactions with brokerage firms which are affiliates of the investment adviser. The commissions paid to these affiliated firms were $1,075,395 for the period. |
Distribution of investments by country of issue, as a percentage of total net assets, is as follows: |
United States of America | 88.2% |
Taiwan | 1.8% |
Sweden | 1.5% |
Canada | 1.4% |
United Kingdom | 1.2% |
France | 1.1% |
Japan | 1.0% |
Others (individually less than 1%) | 3.8% |
| 100.0% |
Income Tax Information |
At February 29, 2004, the fund had a capital loss carryforward of approximately $2,944,572,000 of which $2,166,121,000 and $778,451,000 will expire on February 28, 2010 and 2011, respectively. |
See accompanying notes which are an integral part of the financial statements.
Annual Report
Technology Portfolio
Financial Statements
Statement of Assets and Liabilities
| February 29, 2004 |
| | |
Assets | | |
Investment in securities, at value (including securities loaned of $43,213,446) (cost $2,266,869,342) - See accompanying schedule | | $ 2,639,757,881 |
Foreign currency held at value (cost $11,268,766) | | 11,318,406 |
Receivable for investments sold | | 65,669,881 |
Receivable for fund shares sold | | 1,947,315 |
Dividends receivable | | 476,573 |
Interest receivable | | 14,937 |
Prepaid expenses | | 10,541 |
Other affiliated receivables | | 548 |
Other receivables | | 819,973 |
Total assets | | 2,720,016,055 |
| | |
Liabilities | | |
Payable for investments purchased | $ 68,214,304 | |
Payable for fund shares redeemed | 4,550,800 | |
Accrued management fee | 1,266,637 | |
Other affiliated payables | 881,104 | |
Other payables and accrued expenses | 55,495 | |
Collateral on securities loaned, at value | 45,875,578 | |
Total liabilities | | 120,843,918 |
| | |
Net Assets | | $ 2,599,172,137 |
Net Assets consist of: | | |
Paid in capital | | $ 5,213,123,875 |
Accumulated undistributed net realized gain (loss) on investments and foreign currency transactions | | (2,986,884,887) |
Net unrealized appreciation (depreciation) on investments and assets and liabilities in foreign currencies | | 372,933,149 |
Net Assets, for 41,959,761 shares outstanding | | $ 2,599,172,137 |
Net Asset Value, offering price and redemption price per share ($2,599,172,137 ÷ 41,959,761 shares) | | $ 61.94 |
Statement of Operations
| Year ended February 29, 2004 |
| | |
Investment Income | | |
Dividends | | $ 6,016,747 |
Interest | | 999,885 |
Security lending | | 364,058 |
Total income | | 7,380,690 |
| | |
Expenses | | |
Management fee | $ 12,611,274 | |
Transfer agent fees | 11,989,687 | |
Accounting and security lending fees | 973,087 | |
Non-interested trustees' compensation | 10,759 | |
Custodian fees and expenses | 137,083 | |
Registration fees | 60,763 | |
Audit | 57,514 | |
Legal | 9,865 | |
Miscellaneous | 65,453 | |
Total expenses before reductions | 25,915,485 | |
Expense reductions | (1,269,162) | 24,646,323 |
Net investment income (loss) | | (17,265,633) |
Realized and Unrealized Gain (Loss) Net realized gain (loss) on: | | |
Investment securities | 454,371,524 | |
Foreign currency transactions | (46,264) | |
Total net realized gain (loss) | | 454,325,260 |
Change in net unrealized appreciation (depreciation) on: Investment securities | 507,120,188 | |
Assets and liabilities in foreign currencies | 173,748 | |
Total change in net unrealized appreciation (depreciation) | | 507,293,936 |
Net gain (loss) | | 961,619,196 |
Net increase (decrease) in net assets resulting from operations | | $ 944,353,563 |
Other Information | | |
Sales charges paid to FDC | | $ 1,307,558 |
Deferred sales charges withheld by FDC | | $ 19,918 |
Exchange fees withheld by
FSC | | $ 31,477 |
See accompanying notes which are an integral part of the financial statements.
Annual Report
Technology Portfolio
Financial Statements - continued
Statement of Changes in Net Assets
| Year ended
February 29,
2004 | Year ended
February 28,
2003 |
Increase (Decrease) in Net Assets | | |
Operations | | |
Net investment income (loss) | $ (17,265,633) | $ (14,618,151) |
Net realized gain (loss) | 454,325,260 | (478,162,403) |
Change in net unrealized appreciation (depreciation) | 507,293,936 | (76,582,605) |
Net increase (decrease) in net assets resulting from operations | 944,353,563 | (569,363,159) |
Share transactions
Net proceeds from sales of shares | 774,205,314 | 398,042,492 |
Cost of shares redeemed | (604,001,588) | (590,458,371) |
Net increase (decrease) in net assets resulting from share transactions | 170,203,726 | (192,415,879) |
Redemption fees | 464,868 | 616,899 |
Total increase (decrease) in net assets | 1,115,022,157 | (761,162,139) |
| | |
Net Assets | | |
Beginning of period | 1,484,149,980 | 2,245,312,119 |
End of period | $ 2,599,172,137 | $ 1,484,149,980 |
Other Information Shares | | |
Sold | 14,602,938 | 9,553,378 |
Redeemed | (11,247,811) | (14,069,006) |
Net increase (decrease) | 3,355,127 | (4,515,628) |
Financial Highlights
| | | | | |
Years ended February 28, | 2004 F | 2003 | 2002 | 2001 | 2000 F |
Selected Per-Share Data | | | | | |
Net asset value, beginning of period | $ 38.44 | $ 52.07 | $ 69.00 | $ 195.92 | $ 82.70 |
Income from Investment Operations | | | | | |
Net investment income (loss) C | (.42) | (.37) | (.45) | (.65) | (.40) D |
Net realized and unrealized gain (loss) | 23.91 | (13.28) | (16.50) | (105.68) | 133.30 |
Total from investment operations | 23.49 | (13.65) | (16.95) | (106.33) | 132.90 |
Distributions from net realized gain | - | - | - | (8.60) | (19.80) |
Distributions in excess of net realized gain | - | - | - | (12.13) | - |
Total distributions | - | - | - | (20.73) | (19.80) |
Redemption fees added to paid in capital C | .01 | .02 | .02 | .14 | .12 |
Net asset value, end of period | $ 61.94 | $ 38.44 | $ 52.07 | $ 69.00 | $ 195.92 |
Total Return A, B | 61.13% | (26.18)% | (24.54)% | (59.05)% | 184.11% |
Ratios to Average Net Assets E | | | | | |
Expenses before expense reductions | 1.19% | 1.39% | 1.19% | .95% | 1.05% |
Expenses net of voluntary waivers, if any | 1.19% | 1.39% | 1.19% | .95% | 1.05% |
Expenses net of all reductions | 1.14% | 1.22% | 1.13% | .94% | 1.04% |
Net investment income (loss) | (.80)% | (.86)% | (.73)% | (.46)% | (.34)% |
Supplemental Data | | | | | |
Net assets, end of period (000 omitted) | $ 2,599,172 | $ 1,484,150 | $ 2,245,312 | $ 3,245,537 | $ 7,919,951 |
Portfolio turnover rate | 127% | 153% | 184% | 114% | 210% |
A Total returns would have been lower had certain expenses not been reduced during the periods shown. B Total returns do not include the effect of the former sales charges. C Calculated based on average shares outstanding during the period. D Investment income per share reflects a special dividend which amounted to $.07 per share. E Expense ratios reflect operating expenses of the fund. Expenses before reductions do not reflect amounts reimbursed by the investment adviser or reductions from brokerage service arrangements or other expense offset arrangements and do not represent the amount paid by the fund during periods when reimbursements or reductions occur. Expenses net of any voluntary waivers reflect expenses after reimbursement by the investment adviser but prior to reductions from brokerage service arrangements or other expense offset arrangements. Expenses net of all reductions represent the net expenses paid by the fund. F For the year ended February 29. |
See accompanying notes which are an integral part of the financial statements.
Technology Sector
Telecommunications Portfolio
Performance
Average annual total return reflects the change in the value of an investment, assuming reinvestment of the fund's dividend income and capital gains (the profits earned upon the sale of securities that have grown in value) and assuming a constant rate of performance each year. The $10,000 table and the fund's returns do not reflect the deduction of taxes that a shareholder would pay on fund distributions or the redemption of fund shares. During periods of reimbursement by Fidelity a fund's total returns will be greater than it would be had the reimbursement not occurred. How a fund did yesterday is no guarantee of how it will do tomorrow.
Average Annual Total Returns
Periods ended February 29, 2004 | Past 1
year | Past 5
years | Past 10
years |
Select Telecommunications | 51.78% | -6.20% | 6.66% |
$10,000 Over 10 Years
Let's say hypothetically that $10,000 was invested in Fidelity Select Telecommunications Portfolio on February 28, 1994. The chart shows how the value of your investment would have grown, and also shows how the S&P 500 Index did over the same period.
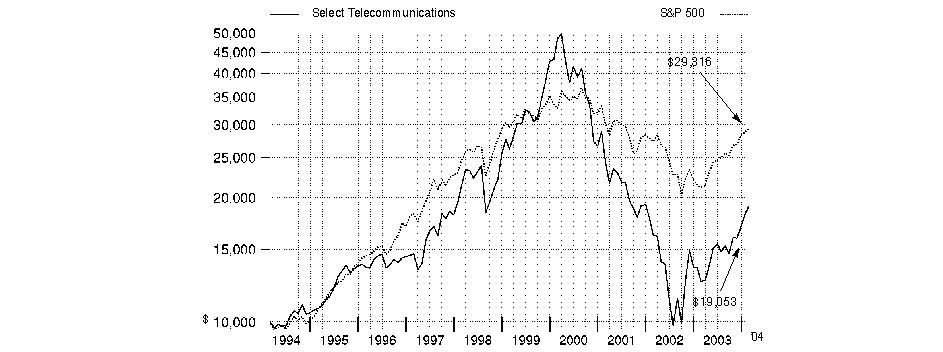
Annual Report
Telecommunications Portfolio
Management's Discussion of Fund Performance
Comments from Brian Younger, Portfolio Manager of Fidelity® Select Telecommunications Portfolio
From March 2003 through the end of February 2004, domestic stocks recovered dramatically from their prior three-year swoon, driven largely by a broad-based economic and corporate profit recovery. Most major equity benchmarks gained 35% or more during the 12-month period, led by the Russell 2000® Index - a measure of the overall small-cap universe - which advanced 64.41%. As investors grew more confident about the economy's vitality, small-cap stocks were bid up, particularly those with no current earnings. In comparison, the Wilshire 5000® Total Market Index, commonly used as a proxy for the entire U.S. stock market's performance, rose 42.47%. Every sector of the market posted a double-digit advance, with economically sensitive issues - especially technology stocks - leading the way. The tech-heavy NASDAQ Composite® Index returned 52.47% during the past year, despite a negative return in February as investors turned to the more value-oriented segments of the market. The broader Standard & Poor's 500SM Index climbed 38.52% during the year, slightly outperforming the 37.07% increase for the blue-chip Dow Jones Industrial AverageSM.
Fidelity Select Telecommunications Portfolio returned 51.78% for the year ended February 29, 2004. The fund beat both its sector benchmark, the Goldman Sachs® Utilities Index, which returned 41.17%, and the S&P 500® index. Telecommunications equipment stocks, which are not included in the Goldman Sachs benchmark, were the biggest drivers of performance. Equipment stocks, which represented roughly 25% of the fund's net assets on average, were fueled by a combination of recent cost cutting and an improved sales environment. As wireless and wireline carriers increased spending to upgrade their networks, stocks such as Ericsson, Nortel Networks, Motorola and Corning soared. Wireless services companies such as Nextel Communications were also strong performers, benefiting from accelerating subscriber growth, improving demand, stabilizing pricing and industry consolidation. The fund's overweighting in Regional Bell Operating Companies (RBOCs), including Verizon Communications, Qwest Communications and SBC Communications, hampered relative returns. The stocks appreciated, but lagged the broader market as unfavorable regulatory rules and weak job growth pressured performance.
The views expressed in this statement reflect those of the portfolio manager only through the end of the period of the report as stated on the cover and do not necessarily represent the views of Fidelity or any other person in the Fidelity organization. Any such views are subject to change at any time based upon market or other conditions and Fidelity disclaims any responsibility to update such views. These views may not be relied on as investment advice and, because investment decisions for a Fidelity fund are based on numerous factors, may not be relied on as an indication of trading intent on behalf of any Fidelity fund.
Annual Report
Telecommunications Portfolio
Investment Summary
Top Ten Stocks as of February 29, 2004 |
| % of fund's
net assets |
Qwest Communications International, Inc. | 12.4 |
Verizon Communications, Inc. | 8.5 |
SBC Communications, Inc. | 8.5 |
Nextel Communications, Inc. Class A | 5.8 |
AT&T Wireless Services, Inc. | 5.5 |
Nortel Networks Corp. | 5.1 |
Motorola, Inc. | 5.0 |
QUALCOMM, Inc. | 4.8 |
BellSouth Corp. | 4.5 |
Citizens Communications Co. | 4.3 |
| 64.4 |
Top Industries as of February 29, 2004 |
% of fund's net assets |
| Diversified Telecommunication Services | 41.9% | |
| Communications Equipment | 36.3% | |
| Wireless Telecommunication Services | 18.8% | |
| Media | 2.7% | |
| All Others* | 0.3% | |

* Includes short-term investments and net other assets. |
Annual Report
Telecommunications Portfolio
Investments February 29, 2004
Showing Percentage of Net Assets
Common Stocks - 99.7% |
| Shares | | Value (Note 1) |
COMMUNICATIONS EQUIPMENT - 36.3% |
Alcatel SA sponsored ADR (a) | 368,700 | | $ 5,969,253 |
Avaya, Inc. (a) | 310,400 | | 5,323,360 |
CIENA Corp. (a) | 190,000 | | 1,088,700 |
Cisco Systems, Inc. (a) | 671,300 | | 15,507,030 |
Comverse Technology, Inc. (a) | 281,600 | | 5,553,152 |
Corning, Inc. (a) | 570,300 | | 7,157,265 |
Juniper Networks, Inc. (a) | 467,000 | | 12,081,290 |
Lucent Technologies, Inc. (a) | 2,725,600 | | 11,420,264 |
Motorola, Inc. | 1,200,300 | | 22,145,535 |
Nokia Corp. sponsored ADR | 416,200 | | 9,060,674 |
Nortel Networks Corp. (a) | 2,811,600 | | 22,353,067 |
Polycom, Inc. (a) | 60,600 | | 1,337,442 |
QUALCOMM, Inc. | 330,600 | | 20,976,570 |
Scientific-Atlanta, Inc. | 69,600 | | 2,303,760 |
Sonus Networks, Inc. (a) | 18,900 | | 112,077 |
Telefonaktiebolaget LM Ericsson ADR (a) | 585,600 | | 16,994,112 |
UTStarcom, Inc. (a) | 9,200 | | 304,805 |
TOTAL COMMUNICATIONS EQUIPMENT | | 159,688,356 |
DIVERSIFIED TELECOMMUNICATION SERVICES - 41.9% |
ALLTEL Corp. | 311,300 | | 16,125,340 |
BellSouth Corp. | 718,000 | | 19,788,080 |
Citizens Communications Co. (a) | 1,441,400 | | 18,997,652 |
Qwest Communications International, Inc. (a) | 11,889,044 | | 54,451,822 |
SBC Communications, Inc. | 1,548,500 | | 37,179,485 |
Verizon Communications, Inc. | 979,000 | | 37,525,070 |
TOTAL DIVERSIFIED TELECOMMUNICATION
SERVICES | | 184,067,449 |
MEDIA - 2.7% |
Cablevision Systems Corp. - NY Group Class A (a) | 181,800 | | 4,632,264 |
EchoStar Communications Corp.
Class A (a) | 199,600 | | 7,209,552 |
Hughes Electronics Corp. (a) | 2,600 | | 45,084 |
TOTAL MEDIA | | 11,886,900 |
WIRELESS TELECOMMUNICATION SERVICES - 18.8% |
At Road, Inc. (a) | 4,100 | | 48,995 |
AT&T Wireless Services, Inc. (a) | 1,765,700 | | 23,978,206 |
Nextel Communications, Inc. Class A (a) | 955,900 | | 25,321,791 |
Nextel Partners, Inc. Class A (a) | 166,600 | | 2,135,812 |
NII Holdings, Inc. Class B (a) | 46,900 | | 5,081,615 |
Sprint Corp. - PCS Group Series 1 (a) | 1,302,000 | | 11,718,000 |
|
| Shares | | Value (Note 1) |
Vodafone Group PLC sponsored ADR | 442,800 | | $ 11,056,716 |
Western Wireless Corp. Class A (a) | 134,600 | | 3,242,514 |
TOTAL WIRELESS TELECOMMUNICATION
SERVICES | | 82,583,649 |
TOTAL COMMON STOCKS (Cost $353,708,425) | 438,226,354 |
Money Market Funds - 2.0% |
| | | |
Fidelity Cash Central Fund, 1.08% (b) | 170,410 | | 170,410 |
Fidelity Securities Lending Cash Central Fund, 1.08% (b) | 8,448,375 | | 8,448,375 |
TOTAL MONEY MARKET FUNDS (Cost $8,618,785) | 8,618,785 |
TOTAL INVESTMENT PORTFOLIO - 101.7% (Cost $362,327,210) | | 446,845,139 |
NET OTHER ASSETS - (1.7)% | | (7,494,901) |
NET ASSETS - 100% | $ 439,350,238 |
Legend |
(a) Non-income producing |
(b) Affiliated fund that is available only to investment companies and other accounts managed by Fidelity Investments. The rate quoted is the annualized seven-day yield of the fund at period end. A complete listing of the fund's holdings as of its most recent fiscal year end is available upon request. |
Other Information |
Purchases and sales of securities, other than short-term securities, aggregated $342,176,685 and $356,147,487, respectively. |
The fund placed a portion of its portfolio transactions with brokerage firms which are affiliates of the investment adviser. The commissions paid to these affiliated firms were $199,464 for the period. |
Distribution of investments by country of issue, as a percentage of total net assets, is as follows: |
United States of America | 85.0% |
Canada | 5.1% |
Sweden | 3.9% |
United Kingdom | 2.5% |
Finland | 2.1% |
France | 1.4% |
| 100.0% |
Income Tax Information |
At February 29, 2004, the fund had a capital loss carryforward of approximately $622,862,000 of which $449,206,000, $161,867,000 and $11,789,000 will expire on February 28, 2010, 2011 and February 29, 2012, respectively. |
See accompanying notes which are an integral part of the financial statements.
Annual Report
Telecommunications Portfolio
Financial Statements
Statement of Assets and Liabilities
| February 29, 2004 |
| | |
Assets | | |
Investment in securities, at value (including securities loaned of $8,183,355) (cost $362,327,210) - See accompanying schedule | | $ 446,845,139 |
Receivable for investments sold | | 7,660,664 |
Receivable for fund shares sold | | 490,829 |
Dividends receivable | | 139,019 |
Interest receivable | | 2,368 |
Prepaid expenses | | 1,725 |
Other affiliated receivables | | 174 |
Other receivables | | 122,923 |
Total assets | | 455,262,841 |
| | |
Liabilities | | |
Payable for investments purchased | $ 5,228,273 | |
Payable for fund shares redeemed | 1,828,813 | |
Accrued management fee | 209,905 | |
Other affiliated payables | 169,115 | |
Other payables and accrued expenses | 28,122 | |
Collateral on securities loaned, at value | 8,448,375 | |
Total liabilities | | 15,912,603 |
| | |
Net Assets | | $ 439,350,238 |
Net Assets consist of: | | |
Paid in capital | | $ 982,710,908 |
Undistributed net investment income | | 434,006 |
Accumulated undistributed net realized gain (loss) on investments and foreign currency transactions | | (628,312,605) |
Net unrealized appreciation (depreciation) on investments | | 84,517,929 |
Net Assets, for 12,276,429 shares outstanding | | $ 439,350,238 |
Net Asset Value, offering price and redemption price per share ($439,350,238 ÷ 12,276,429 shares) | | $ 35.79 |
Statement of Operations
| Year ended February 29, 2004 |
| | |
Investment Income | | |
Dividends | | $ 5,633,989 |
Interest | | 73,889 |
Security lending | | 37,309 |
Total income | | 5,745,187 |
| | |
Expenses | | |
Management fee | $ 2,067,406 | |
Transfer agent fees | 2,574,453 | |
Accounting and security lending fees | 224,198 | |
Non-interested trustees' compensation | 1,458 | |
Custodian fees and expenses | 15,433 | |
Registration fees | 28,085 | |
Audit | 45,301 | |
Legal | 5,715 | |
Miscellaneous | 15,489 | |
Total expenses before reductions | 4,977,538 | |
Expense reductions | (206,879) | 4,770,659 |
Net investment income (loss) | | 974,528 |
Realized and Unrealized Gain (Loss) Net realized gain (loss) on: | | |
Investment securities | 47,022,243 | |
Foreign currency transactions | 24,807 | |
Total net realized gain (loss) | | 47,047,050 |
Change in net unrealized appreciation (depreciation) on investment securities | | 97,912,183 |
Net gain (loss) | | 144,959,233 |
Net increase (decrease) in net assets resulting from operations | | $ 145,933,761 |
Other Information | | |
Sales charges paid to FDC | | $ 123,829 |
Deferred sales charges withheld by FDC | | $ 8,929 |
Exchange fees withheld
by FSC | | $ 11,003 |
See accompanying notes which are an integral part of the financial statements.
Annual Report
Telecommunications Portfolio
Financial Statements - continued
Statement of Changes in Net Assets
| Year ended
February 29,
2004 | Year ended
February 28,
2003 |
Increase (Decrease) in Net Assets | | |
Operations | | |
Net investment income (loss) | $ 974,528 | $ 458,299 |
Net realized gain (loss) | 47,047,050 | (175,055,799) |
Change in net unrealized appreciation (depreciation) | 97,912,183 | 69,172,977 |
Net increase (decrease) in net assets resulting from operations | 145,933,761 | (105,424,523) |
Distributions to shareholders from net investment income | (565,329) | (484,984) |
Share transactions
Net proceeds from sales of shares | 126,418,282 | 210,541,381 |
Reinvestment of distributions | 535,974 | 463,098 |
Cost of shares redeemed | (145,888,463) | (248,634,059) |
Net increase (decrease) in net assets resulting from share transactions | (18,934,207) | (37,629,580) |
Redemption fees | 77,030 | 261,644 |
Total increase (decrease) in net assets | 126,511,255 | (143,277,443) |
| | |
Net Assets | | |
Beginning of period | 312,838,983 | 456,116,426 |
End of period (including undistributed net investment income of $434,006 and $0, respectively) | $ 439,350,238 | $ 312,838,983 |
Other Information Shares | | |
Sold | 4,049,684 | 8,350,188 |
Issued in reinvestment of distributions | 17,866 | 17,622 |
Redeemed | (5,034,709) | (10,055,300) |
Net increase (decrease) | (967,159) | (1,687,490) |
Financial Highlights
Years ended February 28, | 2004 E | 2003 | 2002 | 2001 | 2000 E |
Selected Per-Share Data | | | | | |
Net asset value, beginning of period | $ 23.62 | $ 30.55 | $ 45.89 | $ 100.87 | $ 61.85 |
Income from Investment Operations | | | | | |
Net investment income (loss) C | .08 | .03 | .01 | (.12) | (.12) |
Net realized and unrealized gain (loss) | 12.13 | (6.95) | (15.33) | (45.86) | 49.58 |
Total from investment operations | 12.21 | (6.92) | (15.32) | (45.98) | 49.46 |
Distributions from net investment income | (.05) | (.03) | (.02) | - | - |
Distributions from net realized gain | - | - | - | (9.04) | (10.48) |
Total distributions | (.05) | (.03) | (.02) | (9.04) | (10.48) |
Redemption fees added to paid in capital C | .01 | .02 | - F | .04 | .04 |
Net asset value, end of period | $ 35.79 | $ 23.62 | $ 30.55 | $ 45.89 | $ 100.87 |
Total Return A,B | 51.78% | (22.60)% | (33.39)% | (49.80)% | 84.89% |
Ratios to Average Net Assets D | | | | | |
Expenses before expense reductions | 1.40% | 1.56% | 1.29% | 1.07% | 1.12% |
Expenses net of voluntary waivers, if any | 1.40% | 1.56% | 1.29% | 1.07% | 1.12% |
Expenses net of all reductions | 1.34% | 1.34% | 1.20% | 1.02% | 1.09% |
Net investment income (loss) | .27% | .13% | .02% | (.17)% | (.15)% |
Supplemental Data | | | | | |
Net assets, end of period (000 omitted) | $ 439,350 | $ 312,839 | $ 456,116 | $ 791,196 | $ 1,888,217 |
Portfolio turnover rate | 98% | 163% | 169% | 322% | 173% |
A Total returns would have been lower had certain expenses not been reduced during the periods shown. B Total returns do not include the effect of the former sales charges. C Calculated based on average shares outstanding during the period. D Expense ratios reflect operating expenses of the fund. Expenses before reductions do not reflect amounts reimbursed by the investment adviser or reductions from brokerage service arrangements or other expense offset arrangements and do not represent the amount paid by the fund during periods when reimbursements or reductions occur. Expenses net of any voluntary waivers reflect expenses after reimbursement by the investment adviser but prior to reductions from brokerage service arrangements or other expense offset arrangements. Expenses net of all reductions represent the net expenses paid by the fund. E For the year ended February 29. F Amount represents less than $.01 per share. |
See accompanying notes which are an integral part of the financial statements.
Utilities Sector
Utilities Growth Portfolio
Performance
Average annual total return reflects the change in the value of an investment, assuming reinvestment of the fund's dividend income and capital gains (the profits earned upon the sale of securities that have grown in value) and assuming a constant rate of performance each year. The $10,000 table and the fund's returns do not reflect the deduction of taxes that a shareholder would pay on fund distributions or the redemption of fund shares. During periods of reimbursement by Fidelity a fund's total returns will be greater than it would be had the reimbursement not occurred. How a fund did yesterday is no guarantee of how it will do tomorrow.
Average Annual Total Returns
Periods ended February 29, 2004 | Past 1
year | Past 5
years | Past 10
years |
Select Utilities Growth | 40.71% | -5.26% | 7.42% |
$10,000 Over 10 Years
Let's say hypothetically that $10,000 was invested in Fidelity Select Utilities Growth Portfolio on February 28, 1994. The chart shows how the value of your investment would have grown, and also shows how the S&P 500 Index did over the same period.
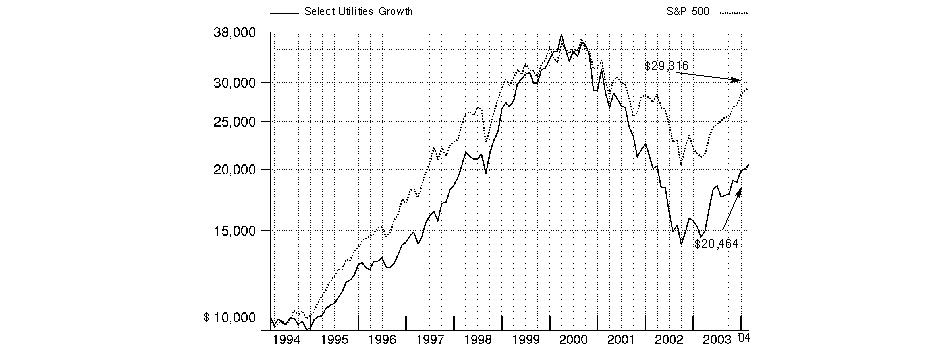
Annual Report
Utilities Growth Portfolio
Management's Discussion of Fund Performance
Comments from Brian Younger, Portfolio Manager of Fidelity® Select Utilities Growth Portfolio
From March 2003 through the end of February 2004, domestic stocks recovered dramatically from their prior three-year swoon, driven largely by a broad-based economic and corporate profit recovery. Most major equity benchmarks gained 35% or more during the 12-month period, led by the Russell 2000® Index - a measure of the overall small-cap universe - which advanced 64.41%. As investors grew more confident about the economy's vitality, small-cap stocks were bid up, particularly those with no current earnings. In comparison, the Wilshire 5000® Total Market Index, commonly used as a proxy for the entire U.S. stock market's performance, rose 42.47%. Every sector of the market posted a double-digit advance, with economically sensitive issues - especially technology stocks - leading the way. The tech-heavy NASDAQ Composite® Index returned 52.47% during the past year, despite a negative return in February as investors turned to the more value-oriented segments of the market. The broader Standard & Poor's 500SM Index climbed 38.52% during the year, slightly outperforming the 37.07% increase for the blue-chip Dow Jones Industrial AverageSM.
Fidelity Select Utilities Growth Portfolio returned 40.71% for the year ended February 29, 2004. This compared to the 41.17% gain in the Goldman Sachs® Utilities Index, and was ahead of the S&P 500®. Electric utilities stocks were strong contributors to performance, benefiting from a more stable operating environment and, in some states, better regulatory conditions. Companies such as AES that had improved their balance sheets posted especially strong gains. In addition, the fund benefited from owning a number of turnaround opportunities in the telecommunications sector, including Nextel Communications, a wireless company with a highly regarded walkie-talkie feature. The fund had an overweighting in the Regional Bell Operating Companies (RBOCs), with large stakes in Verizon Communications, BellSouth and SBC Communications. All of these names appreciated during the period as revenue and earnings growth improved in each quarter of 2003. However, they lagged the sector benchmark amid an unfavorable regulatory environment with little or no job growth to spur demand. Verizon Communications was the weakest of the RBOCs, further weighed down by investor concerns following recent union contract negotiations.
The views expressed in this statement reflect those of the portfolio manager only through the end of the period of the report as stated on the cover and do not necessarily represent the views of Fidelity or any other person in the Fidelity organization. Any such views are subject to change at any time based upon market or other conditions and Fidelity disclaims any responsibility to update such views. These views may not be relied on as investment advice and, because investment decisions for a Fidelity fund are based on numerous factors, may not be relied on as an indication of trading intent on behalf of any Fidelity fund.
Annual Report
Utilities Growth Portfolio
Investment Summary
Top Ten Stocks as of February 29, 2004 |
| % of fund's
net assets |
Verizon Communications, Inc. | 10.5 |
SBC Communications, Inc. | 9.3 |
BellSouth Corp. | 9.3 |
Nextel Communications, Inc. Class A | 6.5 |
TXU Corp. | 5.8 |
FirstEnergy Corp. | 5.2 |
Citizens Communications Co. | 4.5 |
AT&T Wireless Services, Inc. | 4.1 |
Dominion Resources, Inc. | 3.9 |
PG&E Corp. | 3.6 |
| 62.7 |
Top Industries as of February 29, 2004 |
% of fund's net assets |
| Diversified Telecommunication Services | 37.0% | |
| Electric Utilities | 28.1% | |
| Wireless Telecommunication Services | 18.0% | |
| Multi-Utilities & Unregulated Power | 5.9% | |
| Media | 4.8% | |
| All Others* | 6.2% | |

* Includes short-term investments and net other assets. |
Annual Report
Utilities Growth Portfolio
Investments February 29, 2004
Showing Percentage of Net Assets
Common Stocks - 97.6% |
| Shares | | Value (Note 1) |
CONSTRUCTION & ENGINEERING - 0.9% |
Dycom Industries, Inc. (a) | 70,900 | | $ 1,837,728 |
DIVERSIFIED TELECOMMUNICATION SERVICES - 37.0% |
ALLTEL Corp. | 21,100 | | 1,092,980 |
BellSouth Corp. | 698,400 | | 19,247,904 |
CenturyTel, Inc. | 26,900 | | 768,533 |
Citizens Communications Co. (a) | 712,100 | | 9,385,478 |
Qwest Communications International, Inc. (a) | 1,119,100 | | 5,125,478 |
SBC Communications, Inc. | 802,000 | | 19,256,020 |
Verizon Communications, Inc. | 565,366 | | 21,670,479 |
TOTAL DIVERSIFIED TELECOMMUNICATION
SERVICES | | 76,546,872 |
ELECTRIC UTILITIES - 28.1% |
Allegheny Energy, Inc. (a) | 149,400 | | 1,970,586 |
Dominion Resources, Inc. | 127,500 | | 8,010,825 |
Edison International | 147,700 | | 3,410,393 |
Entergy Corp. | 70,800 | | 4,197,732 |
Exelon Corp. | 800 | | 53,712 |
FirstEnergy Corp. | 280,600 | | 10,839,578 |
FPL Group, Inc. | 9,500 | | 623,675 |
PG&E Corp. (a) | 267,600 | | 7,538,292 |
PPL Corp. | 76,300 | | 3,550,239 |
TXU Corp. | 428,000 | | 12,039,640 |
Wisconsin Energy Corp. | 184,000 | | 5,946,880 |
TOTAL ELECTRIC UTILITIES | | 58,181,552 |
GAS UTILITIES - 2.4% |
KeySpan Corp. | 102,000 | | 3,876,000 |
NiSource, Inc. | 30,100 | | 653,471 |
Sempra Energy | 1,500 | | 47,550 |
Southern Union Co. | 26,500 | | 514,630 |
TOTAL GAS UTILITIES | | 5,091,651 |
MEDIA - 4.8% |
EchoStar Communications Corp.
Class A (a) | 160,800 | | 5,808,096 |
Hughes Electronics Corp. (a) | 244,411 | | 4,238,087 |
TOTAL MEDIA | | 10,046,183 |
MULTI-UTILITIES & UNREGULATED POWER - 5.9% |
AES Corp. (a) | 154,500 | | 1,399,770 |
Calpine Corp. (a) | 318,800 | | 1,756,588 |
Constellation Energy Group, Inc. | 76,100 | | 3,024,975 |
Energen Corp. | 13,300 | | 552,216 |
Equitable Resources, Inc. | 19,800 | | 853,182 |
MDU Resources Group, Inc. | 29,200 | | 676,564 |
|
| Shares | | Value (Note 1) |
SCANA Corp. | 48,200 | | $ 1,686,518 |
Sierra Pacific Resources (a) | 276,900 | | 2,231,814 |
TOTAL MULTI-UTILITIES & UNREGULATED POWER | | 12,181,627 |
WATER UTILITIES - 0.5% |
Aqua America, Inc. | 45,256 | | 977,982 |
WIRELESS TELECOMMUNICATION SERVICES - 18.0% |
American Tower Corp. Class A (a) | 482,420 | | 5,330,741 |
AT&T Wireless Services, Inc. (a) | 627,500 | | 8,521,450 |
Crown Castle International Corp. (a) | 177,500 | | 2,138,875 |
Nextel Communications, Inc. Class A (a) | 505,500 | | 13,390,695 |
NII Holdings, Inc. Class B (a) | 22,300 | | 2,416,205 |
SpectraSite, Inc. (a) | 37,400 | | 1,368,840 |
Sprint Corp. - PCS Group Series 1 (a) | 379,700 | | 3,417,300 |
Western Wireless Corp. Class A (a) | 25,000 | | 602,250 |
TOTAL WIRELESS TELECOMMUNICATION
SERVICES | | 37,186,356 |
TOTAL COMMON STOCKS (Cost $183,034,991) | 202,049,951 |
Money Market Funds - 4.4% |
| | | |
Fidelity Cash Central Fund, 1.08% (b) | 4,971,693 | | 4,971,693 |
Fidelity Securities Lending Cash Central Fund, 1.08% (b) | 4,105,500 | | 4,105,500 |
TOTAL MONEY MARKET FUNDS (Cost $9,077,193) | 9,077,193 |
TOTAL INVESTMENT PORTFOLIO - 102.0% (Cost $192,112,184) | | 211,127,144 |
NET OTHER ASSETS - (2.0)% | | (4,083,561) |
NET ASSETS - 100% | $ 207,043,583 |
Legend |
(a) Non-income producing |
(b) Affiliated fund that is available only to investment companies and other accounts managed by Fidelity Investments. The rate quoted is the annualized seven-day yield of the fund at period end. A complete listing of the fund's holdings as of its most recent fiscal year end is available upon request. |
Other Information |
Purchases and sales of securities, other than short-term securities, aggregated $145,729,855 and $162,091,565, respectively. |
The fund placed a portion of its portfolio transactions with brokerage firms which are affiliates of the investment adviser. The commissions paid to these affiliated firms were $7,949 for the period. |
Income Tax Information |
At February 29, 2004, the fund had a capital loss carryforward of approximately $185,879,000 of which $44,352,000 and $141,527,000 will expire on February 28, 2010 and 2011, respectively. |
See accompanying notes which are an integral part of the financial statements.
Annual Report
Utilities Growth Portfolio
Financial Statements
Statement of Assets and Liabilities
| February 29, 2004 |
| | |
Assets | | |
Investment in securities, at value (including securities loaned of $3,976,740) (cost $192,112,184) - See accompanying schedule | | $ 211,127,144 |
Receivable for investments sold | | 1,021,634 |
Receivable for fund shares sold | | 71,760 |
Dividends receivable | | 294,081 |
Interest receivable | | 2,960 |
Prepaid expenses | | 996 |
Other affiliated receivables | | 38 |
Other receivables | | 58,206 |
Total assets | | 212,576,819 |
| | |
Liabilities | | |
Payable for investments purchased | $ 972,757 | |
Payable for fund shares redeemed | 254,986 | |
Accrued management fee | 99,543 | |
Other affiliated payables | 73,392 | |
Other payables and accrued expenses | 27,058 | |
Collateral on securities loaned,
at value | 4,105,500 | |
Total liabilities | | 5,533,236 |
| | |
Net Assets | | $ 207,043,583 |
Net Assets consist of: | | |
Paid in capital | | $ 381,211,738 |
Undistributed net investment income | | 746,905 |
Accumulated undistributed net realized gain (loss) on investments and foreign currency transactions | | (193,930,020) |
Net unrealized appreciation (depreciation) on investments | | 19,014,960 |
Net Assets, for 6,100,214 shares outstanding | | $ 207,043,583 |
Net Asset Value, offering price and redemption price per share ($207,043,583 ÷ 6,100,214 shares) | | $ 33.94 |
Statement of Operations
| Year ended February 29, 2004 |
| | |
Investment Income | | |
Dividends | | $ 5,114,453 |
Interest | | 52,166 |
Security lending | | 20,083 |
Total income | | 5,186,702 |
| | |
Expenses | | |
Management fee | $ 1,143,837 | |
Transfer agent fees | 1,076,383 | |
Accounting and security lending fees | 124,824 | |
Non-interested trustees' compensation | 499 | |
Custodian fees and expenses | 11,708 | |
Registration fees | 19,688 | |
Audit | 44,591 | |
Legal | 1,854 | |
Miscellaneous | 7,557 | |
Total expenses before reductions | 2,430,941 | |
Expense reductions | (83,072) | 2,347,869 |
Net investment income (loss) | | 2,838,833 |
Realized and Unrealized Gain (Loss) Net realized gain (loss) on: | | |
Investment securities | 20,356,020 | |
Foreign currency transactions | (9,567) | |
Total net realized gain (loss) | | 20,346,453 |
Change in net unrealized appreciation (depreciation) on investment securities | | 41,257,509 |
Net gain (loss) | | 61,603,962 |
Net increase (decrease) in net assets resulting from operations | | $ 64,442,795 |
Other Information | | |
Sales charges paid to FDC | | $ 74,191 |
Deferred sales charges withheld by FDC | | $ 14,145 |
Exchange fees withheld by
FSC | | $ 3,825 |
See accompanying notes which are an integral part of the financial statements.
Annual Report
Utilities Growth Portfolio
Financial Statements - continued
Statement of Changes in Net Assets
| Year ended
February 29,
2004 | Year ended
February 28,
2003 |
Increase (Decrease) in Net Assets | | |
Operations | | |
Net investment income (loss) | $ 2,838,833 | $ 3,134,893 |
Net realized gain (loss) | 20,346,453 | (121,989,072) |
Change in net unrealized appreciation (depreciation) | 41,257,509 | 47,550,917 |
Net increase (decrease) in net assets resulting from operations | 64,442,795 | (71,303,262) |
Distributions to shareholders from net investment income | (2,532,917) | (3,390,133) |
Share transactions
Net proceeds from sales of shares | 61,766,265 | 36,907,796 |
Reinvestment of distributions | 2,381,378 | 3,131,542 |
Cost of shares redeemed | (80,413,110) | (78,927,254) |
Net increase (decrease) in net assets resulting from share transactions | (16,265,467) | (38,887,916) |
Redemption fees | 40,620 | 45,904 |
Total increase (decrease) in net assets | 45,685,031 | (113,535,407) |
| | |
Net Assets | | |
Beginning of period | 161,358,552 | 274,893,959 |
End of period (including undistributed net investment income of $746,905 and undistributed net investment income of $450,556, respectively) | $ 207,043,583 | $ 161,358,552 |
Other Information Shares | | |
Sold | 2,055,456 | 1,334,005 |
Issued in reinvestment of distributions | 78,707 | 112,821 |
Redeemed | (2,635,809) | (2,855,573) |
Net increase (decrease) | (501,646) | (1,408,747) |
Financial Highlights
Years ended February 28, | 2004 F | 2003 | 2002 | 2001 | 2000 F |
Selected Per-Share Data | | | | | |
Net asset value, beginning of period | $ 24.44 | $ 34.32 | $ 50.37 | $ 68.83 | $ 61.58 |
Income from Investment Operations | | | | | |
Net investment income (loss) C | .43 | .44 | .33 | 2.48 D | .48 |
Net realized and unrealized gain (loss) | 9.46 | (9.85) | (15.20) | (14.15) | 16.46 |
Total from investment operations | 9.89 | (9.41) | (14.87) | (11.67) | 16.94 |
Distributions from net investment income | (.40) | (.48) | (.26) | (1.97) | (.42) |
Distributions from net realized gain | - | - | (.93) | (4.85) | (9.30) |
Total distributions | (.40) | (.48) | (1.19) | (6.82) | (9.72) |
Redemption fees added to paid in capital C | .01 | .01 | .01 | .03 | .03 |
Net asset value, end of period | $ 33.94 | $ 24.44 | $ 34.32 | $ 50.37 | $ 68.83 |
Total Return A,B | 40.71% | (27.55)% | (29.94)% | (17.65)% | 29.76% |
Ratios to Average Net Assets E | | | | | |
Expenses before expense reductions | 1.23% | 1.30% | 1.11% | 1.01% | 1.07% |
Expenses net of voluntary waivers, if any | 1.23% | 1.30% | 1.11% | 1.01% | 1.07% |
Expenses net of all reductions | 1.19% | 1.17% | 1.09% | .99% | 1.04% |
Net investment income (loss) | 1.44% | 1.56% | .77% | 3.85% | .72% |
Supplemental Data | | | | | |
Net assets, end of period (000 omitted) | $ 207,044 | $ 161,359 | $ 274,894 | $ 532,367 | $ 645,105 |
Portfolio turnover rate | 76% | 139% | 54% | 80% | 93% |
A Total returns would have been lower had certain expenses not been reduced during the periods shown. B Total returns do not include the effect of the former sales charges. C Calculated based on average shares outstanding during the period. D Investment income per share reflects a special dividend which amounted to $2.26 per share. E Expense ratios reflect operating expenses of the fund. Expenses before reductions do not reflect amounts reimbursed by the investment adviser or reductions from brokerage service arrangements or other expense offset arrangements and do not represent the amount paid by the fund during periods when reimbursements or reductions occur. Expenses net of any voluntary waivers reflect expenses after reimbursement by the investment adviser but prior to reductions from brokerage service arrangements or other expense offset arrangements. Expenses net of all reductions represent the net expenses paid by the fund. F For the year ended February 29. |
See accompanying notes which are an integral part of the financial statements.
Utilities Sector
Wireless Portfolio
Performance
Average annual total return reflects the change in the value of an investment, assuming reinvestment of the fund's dividend income and capital gains (the profits earned upon the sale of securities that have grown in value) and assuming a constant rate of performance each year. The $10,000 table and the fund's returns do not reflect the deduction of taxes that a shareholder would pay on fund distributions or the redemption of fund shares. During periods of reimbursement by Fidelity a fund's total returns will be greater than it would be had the reimbursement not occurred. How a fund did yesterday is no guarantee of how it will do tomorrow.
Average Annual Total Returns
Periods ended February 29, 2004 | Past 1
year | Past 5
years | Life of
fund A |
Select Wireless | 100.41% | n/a* | -18.94% |
A From September 21, 2000.
* Not available
$10,000 Over Life of Fund
Let's say hypothetically that $10,000 was invested in Fidelity Select Wireless Portfolio on September 21, 2000, when the fund started. The chart shows what the value of your investment would have been, and also shows how the S&P 500 Index did over the same period.

Annual Report
Wireless Portfolio
Management's Discussion of Fund Performance
Comments from Brian Younger, Portfolio Manager of Fidelity® Select Wireless Portfolio
From March 2003 through the end of February 2004, domestic stocks recovered dramatically from their prior three-year swoon, driven largely by a broad-based economic and corporate profit recovery. Most major equity benchmarks gained 35% or more during the 12-month period, led by the Russell 2000® Index - a measure of the overall small-cap universe - which advanced 64.41%. As investors grew more confident about the economy's vitality, small-cap stocks were bid up, particularly those with no current earnings. In comparison, the Wilshire 5000® Total Market Index, commonly used as a proxy for the entire U.S. stock market's performance, rose 42.47%. Every sector of the market posted a double-digit advance, with economically sensitive issues - especially technology stocks - leading the way. The tech-heavy NASDAQ Composite® Index returned 52.47% during the past year, despite a negative return in February as investors turned to the more value-oriented segments of the market. The broader Standard & Poor's 500SM Index climbed 38.52% during the year, slightly outperforming the 37.07% increase for the blue-chip Dow Jones Industrial AverageSM.
Fidelity Select Wireless Portfolio returned 100.41% during the 12-month period ending February 29, 2004, beating the S&P 500® and the Goldman Sachs® Utilities Index, which returned 41.17%. The fund benefited from its overweighting in wireless equipment and services, both of which were exceptionally strong performers. Wireless equipment companies that had cut costs in recent years rallied sharply as the carriers spent more on upgrading their networks. Top performers included Sweden's Ericsson, which makes handsets as well as network equipment; American Tower, which sells tower services to wireless providers; and QUALCOMM, which licenses CDMA (code division multiple access) technology for better, more reliable wireless services. On the wireless carrier side, accelerating subscriber growth, more stable pricing and industry consolidation drove stock prices higher. Nextel Communications, which has a highly-regarded walkie-talkie feature, and AT&T Wireless, which received a buy-out offer from Cingular, did especially well. Disappointments included PalmOne (formerly known as Palm, Inc.), which faltered amid concerns over manufacturing capacity and competition. In addition, ALLTEL, a company that provides wireless and wireline services to rural markets, did not do as well as the pure wireless companies.
The views expressed in this statement reflect those of the portfolio manager only through the end of the period of the report as stated on the cover and do not necessarily represent the views of Fidelity or any other person in the Fidelity organization. Any such views are subject to change at any time based upon market or other conditions and Fidelity disclaims any responsibility to update such views. These views may not be relied on as investment advice and, because investment decisions for a Fidelity fund are based on numerous factors, may not be relied on as an indication of trading intent on behalf of any Fidelity fund.
Annual Report
Wireless Portfolio
Investment Summary
Top Ten Stocks as of February 29, 2004 |
| % of fund's
net assets |
QUALCOMM, Inc. | 7.9 |
Motorola, Inc. | 7.3 |
Telefonaktiebolaget LM Ericsson ADR | 7.1 |
AT&T Wireless Services, Inc. | 6.7 |
Sprint Corp. - PCS Group Series 1 | 5.5 |
Nextel Communications, Inc. Class A | 5.3 |
Research in Motion Ltd. | 4.7 |
Nokia Corp. sponsored ADR | 4.5 |
Vodafone Group PLC sponsored ADR | 3.9 |
Western Wireless Corp. Class A | 3.5 |
| 56.4 |
Top Industries as of February 29, 2004 |
% of fund's net assets |
| Communications Equipment | 45.2% | |
| Wireless Telecommunication Services | 40.4% | |
| Semiconductors & Semiconductor Equipment | 4.8% | |
| Diversified Telecommunication Services | 4.6% | |
| Electronic Equipment & Instruments | 0.8% | |
| All Others* | 4.2% | |

* Includes short-term investments and net other assets. |
Annual Report
Wireless Portfolio
Investments February 29, 2004
Showing Percentage of Net Assets
Common Stocks - 98.5% |
| Shares | | Value (Note 1) |
COMMUNICATIONS EQUIPMENT - 45.2% |
Andrew Corp. (a) | 319,200 | | $ 5,688,144 |
Arris Group, Inc. (a) | 104,100 | | 1,079,517 |
Cisco Systems, Inc. (a) | 28,800 | | 665,280 |
Comverse Technology, Inc. (a) | 385,520 | | 7,602,454 |
Harris Corp. | 130,200 | | 6,151,950 |
Juniper Networks, Inc. (a) | 53,800 | | 1,391,806 |
Lucent Technologies, Inc. (a) | 859,100 | | 3,599,629 |
Motorola, Inc. | 1,120,880 | | 20,680,236 |
Nokia Corp. sponsored ADR | 588,130 | | 12,803,590 |
Nortel Networks Corp. (a) | 341,500 | | 2,715,028 |
Powerwave Technologies, Inc. (a) | 151,700 | | 1,497,279 |
QUALCOMM, Inc. | 350,250 | | 22,223,362 |
REMEC, Inc. (a) | 58,400 | | 408,800 |
Research in Motion Ltd. (a) | 134,000 | | 13,250,994 |
Sierra Wireless, Inc. (a) | 184,900 | | 5,072,999 |
Tekelec (a) | 147,500 | | 2,857,075 |
Telefonaktiebolaget LM Ericsson ADR (a) | 691,700 | | 20,073,134 |
TOTAL COMMUNICATIONS EQUIPMENT | | 127,761,277 |
COMPUTERS & PERIPHERALS - 0.2% |
PalmOne, Inc. (a) | 58,000 | | 581,740 |
CONSTRUCTION & ENGINEERING - 0.6% |
Dycom Industries, Inc. (a) | 59,600 | | 1,544,832 |
DIVERSIFIED TELECOMMUNICATION SERVICES - 4.6% |
ALLTEL Corp. | 89,990 | | 4,661,482 |
BellSouth Corp. | 66,700 | | 1,838,252 |
SBC Communications, Inc. | 187,200 | | 4,494,672 |
Verizon Communications, Inc. | 53,700 | | 2,058,321 |
TOTAL DIVERSIFIED TELECOMMUNICATION
SERVICES | | 13,052,727 |
ELECTRONIC EQUIPMENT & INSTRUMENTS - 0.8% |
Symbol Technologies, Inc. | 136,800 | | 2,328,336 |
HOUSEHOLD DURABLES - 0.4% |
Garmin Ltd. | 25,999 | | 1,191,794 |
INTERNET SOFTWARE & SERVICES - 0.7% |
iPass, Inc. | 68,300 | | 840,773 |
Openwave Systems, Inc. (a) | 81,866 | | 1,241,089 |
TOTAL INTERNET SOFTWARE & SERVICES | | 2,081,862 |
MEDIA - 0.7% |
EchoStar Communications Corp.
Class A (a) | 22,800 | | 823,536 |
Hughes Electronics Corp. (a) | 71,100 | | 1,232,874 |
TOTAL MEDIA | | 2,056,410 |
|
| Shares | | Value (Note 1) |
SEMICONDUCTORS & SEMICONDUCTOR EQUIPMENT - 4.8% |
Atmel Corp. (a) | 1,069,600 | | $ 7,401,632 |
DSP Group, Inc. (a) | 20,400 | | 519,588 |
RF Micro Devices, Inc. (a) | 279,300 | | 2,594,697 |
Samsung Electronics Co. Ltd. | 1,100 | | 508,697 |
Skyworks Solutions, Inc. (a) | 99,500 | | 1,122,360 |
TriQuint Semiconductor, Inc. (a) | 158,400 | | 1,267,200 |
TOTAL SEMICONDUCTORS & SEMICONDUCTOR
EQUIPMENT | | 13,414,174 |
SOFTWARE - 0.1% |
PalmSource, Inc. (a) | 17,968 | | 347,681 |
WIRELESS TELECOMMUNICATION SERVICES - 40.4% |
American Tower Corp. Class A (a) | 721,650 | | 7,974,233 |
At Road, Inc. (a) | 1,800 | | 21,510 |
AT&T Wireless Services, Inc. (a) | 1,400,260 | | 19,015,531 |
Crown Castle International Corp. (a) | 454,800 | | 5,480,340 |
Dobson Communications Corp.
Class A (a) | 70,900 | | 286,436 |
KDDI Corp. | 351 | | 1,826,431 |
Nextel Communications, Inc. Class A (a) | 560,650 | | 14,851,619 |
Nextel Partners, Inc. Class A (a) | 492,900 | | 6,318,978 |
NII Holdings, Inc. Class B (a) | 86,300 | | 9,350,605 |
SBA Communications Corp. Class A (a) | 917,900 | | 4,057,118 |
SpectraSite, Inc. (a) | 119,100 | | 4,359,060 |
Sprint Corp. - PCS Group Series 1 (a) | 1,732,050 | | 15,588,450 |
Telephone & Data Systems, Inc. | 46,684 | | 3,363,582 |
U.S. Cellular Corp. (a) | 7,300 | | 301,855 |
Vodafone Group PLC sponsored ADR | 445,290 | | 11,118,891 |
Western Wireless Corp. Class A (a) | 415,100 | | 9,999,759 |
Wireless Facilities, Inc. (a) | 34,900 | | 456,143 |
TOTAL WIRELESS TELECOMMUNICATION
SERVICES | | 114,370,541 |
TOTAL COMMON STOCKS (Cost $220,913,207) | 278,731,374 |
Money Market Funds - 13.2% |
Fidelity Cash Central Fund, 1.08% (b) | 15,309,427 | | 15,309,427 |
Fidelity Securities Lending Cash Central Fund, 1.08% (b) | 21,983,775 | | 21,983,775 |
TOTAL MONEY MARKET FUNDS (Cost $37,293,202) | 37,293,202 |
TOTAL INVESTMENT PORTFOLIO - 111.7% (Cost $258,206,409) | 316,024,576 |
NET OTHER ASSETS - (11.7)% | (32,984,597) |
NET ASSETS - 100% | $ 283,039,979 |
Legend |
(a) Non-income producing |
(b) Affiliated fund that is available only to investment companies and other accounts managed by Fidelity Investments. The rate quoted is the annualized seven-day yield of the fund at period end. A complete listing of the fund's holdings as of its most recent fiscal year end is available upon request. |
Other Information |
Purchases and sales of securities, other than short-term securities, aggregated $245,912,912 and $92,853,270, respectively. |
The fund placed a portion of its portfolio transactions with brokerage firms which are affiliates of the investment adviser. The commissions paid to these affiliated firms were $18,129 for the period. |
Distribution of investments by country of issue, as a percentage of total net assets, is as follows: |
United States of America | 75.7% |
Canada | 7.5% |
Sweden | 7.1% |
Finland | 4.5% |
United Kingdom | 3.9% |
Others (individually less than 1%) | 1.3% |
| 100.0% |
Income Tax Information |
At February 29, 2004, the fund had a capital loss carryforward of approximately $136,666,000 of which $66,186,000, $68,901,000 and $1,579,000 will expire on February 28, 2010, February 28, 2011 and February 29, 2012, respectively. |
See accompanying notes which are an integral part of the financial statements.
Utilities Sector
Wireless Portfolio
Financial Statements
Statement of Assets and Liabilities
| February 29, 2004 |
| | |
Assets | | |
Investment in securities, at value (including securities loaned of $21,424,697) (cost $258,206,409) - See accompanying schedule | | $ 316,024,576 |
Receivable for investments sold | | 33,490 |
Receivable for fund shares sold | | 2,484,540 |
Dividends receivable | | 65,962 |
Interest receivable | | 18,912 |
Prepaid expenses | | 507 |
Other affiliated receivables | | 386 |
Other receivables | | 108,156 |
Total assets | | 318,736,529 |
| | |
Liabilities | | |
Payable for investments purchased | $ 11,784,165 | |
Payable for fund shares redeemed | 1,687,429 | |
Accrued management fee | 124,459 | |
Other affiliated payables | 89,144 | |
Other payables and accrued expenses | 27,578 | |
Collateral on securities loaned, at value | 21,983,775 | |
Total liabilities | | 35,696,550 |
| | |
Net Assets | | $ 283,039,979 |
Net Assets consist of: | | |
Paid in capital | | $ 363,382,339 |
Accumulated undistributed net realized gain (loss) on investments and foreign currency transactions | | (138,160,672) |
Net unrealized appreciation (depreciation) on investments and assets and liabilities in foreign currencies | | 57,818,312 |
Net Assets, for 58,337,506 shares outstanding | | $ 283,039,979 |
Net Asset Value, offering price and redemption price per share ($283,039,979 ÷ 58,337,506 shares) | | $ 4.85 |
Statement of Operations
| Year ended February 29, 2004 |
| | |
Investment Income | | |
Dividends | | $ 659,171 |
Interest | | 78,004 |
Security lending | | 49,901 |
Total income | | 787,076 |
| | |
Expenses | | |
Management fee | $ 693,067 | |
Transfer agent fees | 965,408 | |
Accounting and security lending fees | 80,596 | |
Non-interested trustees' compensation | 451 | |
Custodian fees and expenses | 12,287 | |
Registration fees | 34,012 | |
Audit | 44,171 | |
Legal | 310 | |
Miscellaneous | 1,374 | |
Total expenses before reductions | 1,831,676 | |
Expense reductions | (139,351) | 1,692,325 |
Net investment income (loss) | | (905,249) |
Realized and Unrealized Gain (Loss) Net realized gain (loss) on: | | |
Investment securities | 9,842,397 | |
Foreign currency transactions | (9,428) | |
Total net realized gain (loss) | | 9,832,969 |
Change in net unrealized appreciation (depreciation) on: Investment securities | 69,150,582 | |
Assets and liabilities in foreign currencies | 145 | |
Total change in net unrealized appreciation (depreciation) | | 69,150,727 |
Net gain (loss) | | 78,983,696 |
Net increase (decrease) in net assets resulting from operations | | $ 78,078,447 |
Other Information | | |
Sales charges paid to FDC | | $ 217,933 |
Deferred sales charges withheld by FDC | | $ 72 |
Exchange fees withheld by
FSC | | $ 3,075 |
See accompanying notes which are an integral part of the financial statements.
Annual Report
Wireless Portfolio
Financial Statements - continued
Statement of Changes in Net Assets
| Year ended
February 29, 2004 | Year ended
February 28, 2003 |
Increase (Decrease) in Net Assets | | |
Operations | | |
Net investment income (loss) | $ (905,249) | $ (763,087) |
Net realized gain (loss) | 9,832,969 | (62,446,953) |
Change in net unrealized appreciation (depreciation) | 69,150,727 | 33,389,361 |
Net increase (decrease) in net assets resulting from operations | 78,078,447 | (29,820,679) |
Share transactions
Net proceeds from sales of shares | 236,301,292 | 48,893,521 |
Cost of shares redeemed | (83,183,442) | (44,706,915) |
Net increase (decrease) in net assets resulting from share transactions | 153,117,850 | 4,186,606 |
Redemption fees | 124,160 | 88,092 |
Total increase (decrease) in net assets | 231,320,457 | (25,545,981) |
| | |
Net Assets | | |
Beginning of period | 51,719,522 | 77,265,503 |
End of period | $ 283,039,979 | $ 51,719,522 |
Other Information Shares | | |
Sold | 58,994,612 | 15,775,129 |
Redeemed | (22,003,130) | (15,442,073) |
Net increase (decrease) | 36,991,482 | 333,056 |
Financial Highlights
Years ended February 28, | 2004 H | 2003 | 2002 | 2001 F |
Selected Per-Share Data | | | | |
Net asset value, beginning of period | $ 2.42 | $ 3.68 | $ 7.22 | $ 10.00 |
Income from Investment Operations | | | | |
Net investment income (loss) E | (.03) | (.03) | (.04) | (.02) |
Net realized and unrealized gain (loss) | 2.46 | (1.23) | (3.50) | (2.76) |
Total from investment operations | 2.43 | (1.26) | (3.54) | (2.78) |
Distributions in excess of net realized gain | - | - | - | (.01) |
Redemption fees added to paid in capital E | - I | - I | - I | .01 |
Net asset value, end of period | $ 4.85 | $ 2.42 | $ 3.68 | $ 7.22 |
Total Return B,C,D | 100.41% | (34.24)% | (49.03)% | (27.71)% |
Ratios to Average Net Assets G | | | | |
Expenses before expense reductions | 1.55% | 2.17% | 1.59% | 1.51% A |
Expenses net of voluntary waivers, if any | 1.55% | 2.17% | 1.59% | 1.51% A |
Expenses net of all reductions | 1.43% | 2.01% | 1.54% | 1.48% A |
Net investment income (loss) | (.77)% | (1.16)% | (.72)% | (.43)% A |
Supplemental Data | | | | |
Net assets, end of period (000 omitted) | $ 283,040 | $ 51,720 | $ 77,266 | $ 157,516 |
Portfolio turnover rate | 79% | 110% | 148% | 155% A |
AAnnualized BTotal returns for periods of less than one year are not annualized. CTotal returns would have been lower had certain expenses not been reduced during the periods shown. DTotal returns do not include the effect of the former sales charges. ECalculated based on average shares outstanding during the period. FFor the period September 21, 2000 (commencement of operations) to February 28, 2001. GExpense ratios reflect operating expenses of the fund. Expenses before reductions do not reflect amounts reimbursed by the investment adviser or reductions from brokerage service arrangements or other expense offset arrangements and do not represent the amount paid by the fund during periods when reimbursements or reductions occur. Expense ratios before reductions for start-up periods may not be representative of longer-term operating periods. Expenses net of any voluntary waivers reflect expenses after reimbursement by the investment adviser but prior to reductions from brokerage service arrangements or other expense offset arrangements. Expenses net of all reductions represent the net expenses paid by the fund. HFor the year ended February 29. IAmount represents less than $.01 per share.
See accompanying notes which are an integral part of the financial statements.
Utilities Sector
Money Market Portfolio
Investments February 29, 2004
Showing Percentage of Net Assets
Certificates of Deposit - 19.8% |
Due Date | Annualized Yield at
Time of Purchase | Principal
Amount | | Value
(Note 1) |
London Branch, Eurodollar, Foreign Banks - 9.9% |
Barclays Bank PLC |
3/8/04 | 1.16% | $ 10,000,000 | | $ 10,000,000 |
4/13/04 | 1.12 | 5,000,000 | | 5,000,000 |
Credit Agricole Indosuez |
8/5/04 | 1.39 | 5,000,000 | | 5,000,000 |
8/5/04 | 1.40 | 5,000,000 | | 5,000,000 |
Credit Lyonnais SA |
3/9/04 | 1.16 | 5,000,000 | | 5,000,006 |
Dresdner Bank AG |
4/19/04 | 1.15 | 5,000,000 | | 5,000,000 |
HBOS Treasury Services PLC |
3/1/04 | 1.15 | 5,000,000 | | 5,000,000 |
8/11/04 | 1.13 | 5,000,000 | | 5,000,000 |
Landesbank Hessen-Thuringen |
5/12/04 | 1.21 | 5,000,000 | | 5,000,000 |
Norddeutsche Landesbank Girozentrale |
3/5/04 | 1.16 | 5,000,000 | | 5,000,003 |
Unicredito Italiano Spa |
3/9/04 | 1.10 | 5,000,000 | | 5,000,000 |
| 60,000,009 |
New York Branch, Yankee Dollar, Foreign Banks - 9.9% |
BNP Paribas SA |
3/1/04 | 1.04 (b) | 10,000,000 | | 9,997,720 |
8/5/04 | 1.41 | 5,000,000 | | 5,000,000 |
Canadian Imperial Bank of Commerce |
3/15/04 | 1.11 (b) | 10,000,000 | | 10,000,000 |
Credit Agricole Indosuez |
3/1/04 | 1.04 (b) | 5,000,000 | | 4,999,872 |
3/1/04 | 1.07 (b) | 5,000,000 | | 4,999,949 |
Deutsche Bank AG |
7/26/04 | 1.26 | 5,000,000 | | 5,000,000 |
11/26/04 | 1.23 | 5,000,000 | | 5,000,000 |
Societe Generale |
3/1/04 | 1.04 (b) | 10,000,000 | | 9,998,441 |
3/1/04 | 1.05 (b) | 5,000,000 | | 4,999,996 |
| 59,995,978 |
TOTAL CERTIFICATES OF DEPOSIT | 119,995,987 |
Commercial Paper - 7.9% |
|
Citibank Credit Card Master Trust I (Dakota Certificate Program) |
3/24/04 | 1.04 | 5,000,000 | | 4,996,678 |
DaimlerChrysler NA Holding Corp. |
3/2/04 | 1.26 | 3,000,000 | | 2,999,895 |
|
Due Date | Annualized Yield at
Time of Purchase | Principal
Amount | | Value
(Note 1) |
Dresdner U.S. Finance, Inc. |
4/19/04 | 1.15% | $ 5,000,000 | | $ 4,992,208 |
Ford Motor Credit Co. |
3/17/04 | 1.40 | 5,000,000 | | 4,996,889 |
General Electric Capital Corp. |
5/4/04 | 1.19 | 5,000,000 | | 4,989,511 |
Grampian Funding Ltd. |
3/22/04 | 1.13 | 15,000,000 | | 14,990,113 |
Household Finance Corp. |
3/9/04 | 1.13 | 10,000,000 | | 9,997,511 |
TOTAL COMMERCIAL PAPER | 47,962,805 |
Federal Agencies - 25.2% |
|
Fannie Mae - 13.0% |
Agency Coupons - 8.2% |
3/2/04 | 1.48 | 5,000,000 | | 5,000,000 |
3/10/04 | 1.11 (b) | 10,000,000 | | 10,000,000 |
10/1/04 | 1.53 | 10,000,000 | | 10,000,000 |
10/25/04 | 1.35 | 5,000,000 | | 5,000,000 |
11/2/04 | 1.35 | 5,000,000 | | 5,000,000 |
11/15/04 | 1.43 | 5,000,000 | | 5,000,000 |
3/29/05 | 1.40 | 10,000,000 | | 10,000,000 |
| 50,000,000 |
Discount Notes - 4.8% |
5/19/04 | 1.15 | 10,000,000 | | 9,974,983 |
5/28/04 | 1.16 | 4,000,000 | | 3,988,756 |
6/10/04 | 1.21 | 10,000,000 | | 9,966,333 |
6/14/04 | 1.21 | 5,000,000 | | 4,982,500 |
| 28,912,572 |
| 78,912,572 |
Federal Home Loan Bank - 9.7% |
Agency Coupons - 9.7% |
3/21/04 | 1.10 (b) | 10,000,000 | | 9,996,976 |
3/25/04 | 1.01 (b) | 9,000,000 | | 8,993,167 |
7/6/04 | 1.23 | 15,000,000 | | 15,000,000 |
8/4/04 | 1.25 | 5,000,000 | | 5,000,000 |
2/25/05 | 1.40 | 20,000,000 | | 20,000,000 |
| 58,990,143 |
Freddie Mac - 2.5% |
Agency Coupons - 1.7% |
7/27/04 | 1.20 | 10,000,000 | | 10,000,000 |
Discount Notes - 0.8% |
2/8/05 | 1.33 | 5,000,000 | | 4,937,411 |
| 14,937,411 |
TOTAL FEDERAL AGENCIES | 152,840,126 |
Bank Notes - 2.5% |
Due Date | Annualized Yield at
Time of Purchase | Principal
Amount | | Value
(Note 1) |
Wells Fargo Bank NA, San Francisco |
3/1/04 | 1.04% (b) | $ 15,000,000 | | $ 14,998,500 |
Master Notes - 4.1% |
|
General Motors Acceptance Corp. Mortgage Credit |
3/1/04 | 1.60(b)(c) | 5,000,000 | | 5,000,000 |
Goldman Sachs Group, Inc. |
3/2/04 | 1.19 (c) | 5,000,000 | | 5,000,000 |
9/14/04 | 1.21 | 15,000,000 | | 15,000,000 |
TOTAL MASTER NOTES | 25,000,000 |
Medium-Term Notes - 18.2% |
|
Bank of New York Co., Inc. |
3/29/04 | 1.08 (a)(b) | 5,000,000 | | 5,000,000 |
Chase Manhattan Auto Owner Trust |
8/16/04 | 1.04 | 734,614 | | 734,614 |
Citigroup, Inc. |
3/9/04 | 1.33 (b) | 5,000,000 | | 5,000,305 |
GE Life & Annuity Assurance Co. |
3/1/04 | 1.21 (b)(c) | 15,000,000 | | 15,000,000 |
General Electric Capital Corp. |
3/9/04 | 1.18 (b) | 5,000,000 | | 5,000,000 |
3/17/04 | 1.17 (b) | 8,000,000 | | 8,003,281 |
3/25/04 | 1.24 (a)(b) | 20,000,000 | | 20,001,175 |
HBOS Treasury Services PLC |
3/24/04 | 1.16 (b) | 10,000,000 | | 10,000,000 |
Morgan Stanley |
3/4/04 | 1.10 (b) | 5,000,000 | | 5,000,000 |
SLM Corp. |
4/26/04 | 1.27 (b) | 7,000,000 | | 7,004,815 |
U.S. Bank NA, Minnesota |
4/13/04 | 1.29 (b) | 10,000,000 | | 10,002,144 |
Verizon Global Funding Corp. |
3/15/04 | 1.26 (b) | 5,000,000 | | 5,000,132 |
3/15/04 | 1.62 (b) | 10,000,000 | | 10,000,000 |
Wells Fargo & Co. |
3/2/04 | 1.12 (b) | 5,000,000 | | 5,000,000 |
TOTAL MEDIUM-TERM NOTES | 110,746,466 |
Short-Term Notes - 1.6% |
|
Metropolitan Life Insurance Co. |
4/1/04 | 1.35 (b)(c) | 5,000,000 | | 5,000,000 |
New York Life Insurance Co. |
4/1/04 | 1.29 (b)(c) | 5,000,000 | | 5,000,000 |
TOTAL SHORT-TERM NOTES | 10,000,000 |
Municipal Securities - 0.8% |
Due Date | Annualized Yield at
Time of Purchase | Principal
Amount | | Value
(Note 1) |
West Baton Rouge Parish Indl. District #3 Rev. Bonds (Dow Chemical Co. Proj.) Series 1995, 1.21% tender 3/22/04, CP mode |
3/22/04 | 1.21 | $ 5,000,000 | | $ 5,000,000 |
Repurchase Agreements - 21.2% |
| Maturity Amount | | |
In a joint trading account
(Collateralized by U.S. Government Obligations dated 2/27/04 due 3/1/04 At 1.07%) | $ 17,077,518 | | 17,076,000 |
With: | | | |
Banc of America Securities LLC At
1.15%, dated 2/27/04 due 3/1/04 (Collateralized by Corporate Obligations with principal amounts of $25,500,000, 3.65% - 4.3%, 7/15/10 - 3/25/34) | 25,002,396 | | 25,000,000 |
Countrywide Securities Corp. At 1.13%, dated 1/30/04 due 4/29/04 (Collateralized by Corporate Obligations with principal amounts of $5,100,000, 1.311%, 4/15/30) | 5,014,125 | | 5,000,000 |
Goldman Sachs & Co. At 1.12%, dated 2/27/04 due 4/8/04 (Collateralized by Mortgage Loan Obligations with principal amounts of $7,350,000, 6.5%, 1/25/34) | 7,008,929 | | 7,000,000 |
J.P. Morgan Securities, Inc. At: | | | |
1.13%, dated 2/23/04 due 4/26/04 (Collateralized by Corporate Obligations with principal amounts of $11,103,512, 0% - 7.5%, 3/1/04 - 1/15/16) | 10,019,775 | | 10,000,000 |
1.18%, dated 2/27/04 due 3/1/04 (Collateralized by Corporate Obligations with principal amounts of $18,902,790, 7.875%, 2/15/05) | 18,001,770 | | 18,000,000 |
Repurchase Agreements - continued |
| Maturity Amount | | Value
(Note 1) |
Merrill Lynch, Pierce, Fenner & Smith At 1.14%, dated 2/27/04 due 3/1/04 (Collateralized by Corporate Obligations with principal amounts of $27,541,030, 4.77% - 7.26%, 3/15/10 - 6/15/11) | $ 27,002,571 | | $ 27,000,000 |
Morgan Stanley & Co. At 1.13%, dated 1/29/04 due 3/17/04 (Collateralized by Mortgage Loan Obligations with principal amounts of $21,000,000, 0.788% - 2.025%, 2/11/11 - 11/11/30) | 20,030,133 | | 20,000,000 |
TOTAL REPURCHASE AGREEMENTS | 129,076,000 |
TOTAL INVESTMENT PORTFOLIO - 101.3% | | 615,619,884 |
NET OTHER ASSETS - (1.3)% | | (7,999,974) |
NET ASSETS - 100% | $ 607,619,910 |
Total Cost for Income Tax Purposes | $ 615,619,884 |
Legend |
(a) Security exempt from registration under Rule 144A of the Securities Act of 1933. These securities may be resold in transactions exempt from registration, normally to qualified institutional buyers. At the period end, the value of these securities amounted to $25,001,175 or 4.1% of net assets. |
(b) The coupon rate shown on floating or adjustable rate securities represents the rate at period end. The due dates on these types of securities reflect the next interest rate reset date or, when applicable, the final maturity date. |
(c) Restricted securities - Investment in securities not registered under the Securities Act of 1933 (excluding 144A issues). At the end of the period, the value of restricted securities (excluding 144A issues) amounted to $35,000,000 or 5.8% of net assets. |
Additional information on each holding is as follows: |
Security | Acquisition Date | Cost |
GE Life & Annuity Assurance Co. 1.21%, 3/1/04 | 3/31/03 | $ 15,000,000 |
General Motors Acceptance Corp. Mortgage Credit 1.60%, 3/1/04 | 2/2/04 | $ 5,000,000 |
Goldman Sachs Group, Inc.
1.19%, 3/2/04 | 10/27/03 | $ 5,000,000 |
Metropolitan Life Insurance Co. 1.35%, 4/1/04 | 3/26/02 | $ 5,000,000 |
New York Life Insurance Co.
1.29%, 4/1/04 | 2/28/02 | $ 5,000,000 |
Other Information |
The fund participated in the interfund lending program as a lender. The average daily loan balance during the period for which the loans were outstanding amounted to $20,592,200. The weighted average interest rate was 1.13%. Interest earned from the interfund lending program amounted to $3,226 and is included in interest income on the Statement of Operations. At period end, there were no interfund loans outstanding. |
Income Tax Information |
At February 29, 2004, the fund had a capital loss carryforward of approximately $20,000 all of which will expire on February 29, 2012. |
See accompanying notes which are an integral part of the financial statements.
Annual Report
Money Market Portfolio
Financial Statements
Statement of Assets and Liabilities
| February 29, 2004 |
| | |
Assets | | |
Investment in securities, at value (including repurchase agreements of $129,076,000) - See accompanying schedule | | $ 615,619,884 |
Cash | | 4,966 |
Receivable for fund shares sold | | 8,589,728 |
Interest receivable | | 1,047,266 |
Prepaid expenses | | 3,911 |
Total assets | | 625,265,755 |
| | |
Liabilities | | |
Payable for investments purchased | $ 10,000,000 | |
Payable for fund shares redeemed | 7,406,676 | |
Distributions payable | 16,130 | |
Accrued management fee | 98,545 | |
Other affiliated payables | 94,783 | |
Other payables and accrued expenses | 29,711 | |
Total liabilities | | 17,645,845 |
| | |
Net Assets | | $ 607,619,910 |
Net Assets consist of: | | |
Paid in capital | | $ 607,641,843 |
Accumulated net realized gain (loss) on investments | | (21,933) |
Net Assets, for 607,524,938 shares outstanding | | $ 607,619,910 |
Net Asset Value, offering price and redemption price per share ($607,619,910 ÷ 607,524,938 shares) | | $ 1.00 |
Statement of Operations
| Year ended February 29, 2004 |
| | |
Investment Income | | |
Interest | | $ 10,282,404 |
| | |
Expenses | | |
Management fee | $ 1,621,010 | |
Transfer agent fees | 1,342,593 | |
Accounting fees and expenses | 103,279 | |
Non-interested trustees' compensation | 4,457 | |
Custodian fees and expenses | 29,056 | |
Registration fees | 111,625 | |
Audit | 48,267 | |
Legal | 3,517 | |
Miscellaneous | 7,308 | |
Total expenses before reductions | 3,271,112 | |
Expense reductions | (511) | 3,270,601 |
Net investment income | | 7,011,803 |
Net realized gain (loss) on investment securities | | (21,933) |
Net increase in net assets resulting from operations | | $ 6,989,870 |
Other Information | | |
Sales charges paid to FDC | | $ 229,282 |
Deferred sales charges withheld by FDC | | $ 52,724 |
See accompanying notes which are an integral part of the financial statements.
Annual Report
Money Market Portfolio
Financial Statements - continued
Statement of Changes in Net Assets
| Year ended
February 29,
2004 | Year ended
February 28,
2003 |
Increase (Decrease) in Net Assets | | |
Operations | | |
Net investment income | $ 7,011,803 | $ 14,738,757 |
Net realized gain (loss) | (21,933) | 68,356 |
Net increase (decrease) in net assets resulting from operations | 6,989,870 | 14,807,113 |
Distributions to shareholders from net investment income | (7,011,803) | (14,738,757) |
Share transactions at net asset value of $1.00 per share
Proceeds from sales of shares | 1,221,793,960 | 1,928,640,505 |
Reinvestment of distributions | 6,806,831 | 14,606,333 |
Cost of shares redeemed | (1,700,536,459) | (1,901,606,880) |
Net increase (decrease) in net assets and shares resulting from share transactions | (471,935,668) | 41,639,958 |
Total increase (decrease) in net assets | (471,957,601) | 41,708,314 |
| | |
Net Assets | | |
Beginning of period | 1,079,577,511 | 1,037,869,197 |
End of period | $ 607,619,910 | $ 1,079,577,511 |
Financial Highlights
Years ended February 28, | 2004 D | 2003 | 2002 | 2001 | 2000 D |
Selected Per-Share Data | | | | | |
Net asset value, beginning of period | $ 1.00 | $ 1.00 | $ 1.00 | $ 1.00 | $ 1.00 |
Income from Investment Operations | | | | | |
Net investment income | .009 | .015 | .033 | .060 | .050 |
Distributions from net investment income | (.009) | (.015) | (.033) | (.060) | (.050) |
Net asset value, end of period | $ 1.00 | $ 1.00 | $ 1.00 | $ 1.00 | $ 1.00 |
Total Return A,B | .86% | 1.50% | 3.30% | 6.19% | 5.08% |
Ratios to Average Net Assets C | | | | | |
Expenses before expense reductions | .40% | .38% | .37% | .50% | .48% |
Expenses net of voluntary waivers, if any | .40% | .38% | .37% | .50% | .48% |
Expenses net of all reductions | .40% | .38% | .37% | .50% | .48% |
Net investment income | .86% | 1.45% | 3.38% | 6.02% | 4.95% |
Supplemental Data | | | | | |
Net assets, end of period (000 omitted) | $ 607,620 | $ 1,079,578 | $ 1,037,869 | $ 1,173,360 | $ 888,869 |
A Total returns would have been lower had certain expenses not been reduced during the periods shown. B Total returns do not include the effect of the former sales charges. C Expense ratios reflect operating expenses of the fund. Expenses before reductions do not reflect amounts reimbursed by the investment adviser or reductions from brokerage service arrangements or other expense offset arrangements and do not represent the amount paid by the fund during periods when reimbursements or reductions occur. Expenses net of any voluntary waivers reflect expenses after reimbursement by the investment adviser but prior to reductions from brokerage service arrangements or other expense offset arrangements. Expenses net of all reductions represent the net expenses paid by the fund. D For the year ended February 29. |
See accompanying notes which are an integral part of the financial statements.
Money Market
Notes to Financial Statements
For the period ended February 29, 2004
1. Significant Accounting Policies.
Fidelity Select Portfolios (the trust) is registered under the Investment Company Act of 1940, as amended (the 1940 Act), as an open-end management investment company organized as a Massachusetts business trust. The trust is comprised of equity funds (the fund or the funds), which invest primarily in securities of companies whose principal business activities fall within specific industries, and a money market fund, which invests in high quality money market instruments. Each fund is authorized to issue an unlimited number of shares. The Gold Portfolio and Natural Resources Portfolio may also invest in certain precious metals. The financial statements have been prepared in conformity with accounting principles generally accepted in the United States of America, which require management to make certain estimates and assumptions at the date of the financial statements. The following summarizes the significant accounting policies of the funds:
Security Valuation. Net asset value per share (NAV calculation) is calculated as of the close of business of the New York Stock Exchange, normally 4:00 p.m. Eastern time. Equity securities for which market quotations are available are valued at the last sale price or official closing price (closing bid price or last evaluated quote if no sale has occurred) on the primary market or exchange on which they trade. Debt securities for which quotations are readily available are valued at their most recent bid prices (sales prices if the principal market is an exchange) in the principal market in which such securities are normally traded, as determined by recognized dealers in such securities, or securities are valued on the basis of information provided by a pricing service. Pricing services use valuation matrices that incorporate both dealer-supplied valuations and valuation models. If prices are not readily available or do not accurately reflect fair value for a security, or if a security's value has been materially affected by events occurring after the close of the exchange or market on which the security is principally traded, that security may be valued by another method that the Board of Trustees believes accurately reflects fair value. A security's valuation may differ depending on the method used for determining value. Price movements in futures contracts and ADRs, market and trading trends, the bid/ask quotes of brokers and off-exchange institutional trading may be reviewed in the course of making a good faith determination of a security's fair value. Short-term securities with remaining maturities of sixty days or less for which quotations are not readily available are valued on the basis of amortized cost. Investments in open-end investment companies are valued at their net asset value each business day.
As permitted under Rule 2a-7 of the 1940 Act, and certain conditions therein, securities owned by the money market fund are valued initially at cost and thereafter assume a constant amortization to maturity of any discount or premium.
Foreign Currency. Certain funds may use foreign currency contracts to facilitate transactions in foreign-denominated securities. Losses from these transactions may arise from changes in the value of the foreign currency or if the counterparties do not perform under the contracts' terms.
Foreign-denominated assets, including investment securities, and liabilities are translated into U.S. dollars at the exchange rate at period end. Purchases and sales of investment securities, income and dividends received and expenses denominated in foreign currencies are translated into U.S. dollars at the exchange rate in effect on the transaction date.
The effects of exchange rate fluctuations on investments are included with the net realized and unrealized gain (loss) on investment securities. Other foreign currency transactions resulting in realized and unrealized gain (loss) are disclosed separately.
Investment Transactions and Income. Security transactions are accounted for as of trade date. Gains and losses on securities sold are determined on the basis of identified cost. Dividend income is recorded on the ex-dividend date, except for certain dividends from foreign securities where the ex-dividend date may have passed, which are recorded as soon as the funds are informed of the ex-dividend date. Non-cash dividends included in dividend income, if any, are recorded at the fair market value of the securities received. The funds estimate the components of distributions received from Real Estate Investment Trusts (REITs). Distributions received in excess of income are recorded as a reduction of cost of investments and/or realized gain. Interest income is accrued as earned. Interest income includes coupon interest and amortization of premium and accretion of discount on debt securities. Investment income is recorded net of foreign taxes withheld where recovery of such taxes is uncertain.
Expenses. Most expenses of the trust can be directly attributed to a fund. Expenses which cannot be directly attributed are apportioned among the funds in the trust.
Deferred Trustee Compensation. Under a Deferred Compensation Plan (the Plan), non-interested Trustees must defer receipt of a portion of, and may elect to defer receipt of an additional portion of, their annual compensation. Deferred amounts are treated as though equivalent dollar amounts had been invested in shares of each applicable fund or are invested in a cross-section of other Fidelity funds, and are marked-to-market. Deferred amounts remain in the fund until distributed in accordance with the Plan.
Income Tax Information and Distributions to Shareholders. Each year, the funds intend to qualify as regulated investment companies by distributing all of their taxable income and realized gains under Subchapter M of the Internal Revenue Code. As a result, no provision for income taxes is required in the accompanying financial statements. Foreign taxes are provided for based on each fund's understanding of the tax rules and rates that exist in the foreign markets in which it invests. For the Money Market Portfolio, dividends are declared daily and paid monthly from net investment income and distributions from realized gains, if any, are recorded on the ex-dividend date. Distributions from net investment income and realized gains are recorded on the ex-dividend date for all other funds.
Annual Report
Notes to Financial Statements - continued
1. Significant Accounting Policies - continued
Income Tax Information and Distributions to Shareholders - continued
Income and capital gain distributions are determined in accordance with income tax regulations, which may differ from generally accepted accounting principles. In addition, certain funds will treat a portion of the proceeds from shares redeemed as a distribution from net investment income and realized gain for income tax purposes. There were no significant book-to-tax differences during the period for the money market fund. Capital accounts within the financial statements are adjusted for permanent and temporary book and tax differences. These adjustments have no impact on net assets or the results of operations. Temporary differences will reverse in a subsequent period. These differences are primarily due to foreign currency transactions, certain foreign taxes, passive foreign investment companies (PFIC), market discount, partnerships, non-taxable dividends, net operating losses, capital loss carryforwards and losses deferred due to wash sales and excise tax regulations.
The tax-basis components of distributable earnings and the federal tax cost as of period end were as follows for each fund:
| Cost for
Federal Income
Tax Purposes | Unrealized
Appreciation | Unrealized
Depreciation | Net Unrealized
Appreciation/
(Depreciation) |
Air Transportation Portfolio | $ 33,225,809 | $ 6,036,359 | $ (1,521,144) | $ 4,515,215 |
Automotive Portfolio | 18,378,319 | 3,219,091 | (325,015) | 2,894,076 |
Banking Portfolio | 340,908,956 | 180,114,452 | (563,864) | 179,550,588 |
Biotechnology Portfolio | 1,649,846,774 | 518,652,533 | (56,993,232) | 461,659,301 |
Brokerage and Investment Management Portfolio | 337,698,664 | 135,966,704 | (3,691,495) | 132,275,209 |
Business Services and Outsourcing Portfolio | 33,065,819 | 6,705,286 | (1,482,152) | 5,223,134 |
Chemicals Portfolio | 49,636,130 | 9,868,413 | (1,154,180) | 8,714,233 |
Computers Portfolio | 866,544,503 | 201,020,431 | (49,444,517) | 151,575,914 |
Construction and Housing Portfolio | 81,315,272 | 20,299,092 | (804,895) | 19,494,197 |
Consumer Industries Portfolio | 31,893,322 | 3,881,776 | (306,489) | 3,575,287 |
Cyclical Industries Portfolio | 31,411,399 | 5,646,233 | (699,495) | 4,946,738 |
Defense and Aerospace Portfolio | 280,226,246 | 59,113,431 | (7,733,486) | 51,379,945 |
Developing Communications Portfolio | 879,237,964 | 192,278,687 | (22,926,639) | 169,352,048 |
Electronics Portfolio | 3,470,742,893 | 898,455,547 | (336,951,936) | 561,503,611 |
Energy Portfolio | 246,538,290 | 50,824,781 | (2,484,260) | 48,340,521 |
Energy Service Portfolio | 436,040,265 | 100,057,519 | (14,646,158) | 85,411,361 |
Environmental Portfolio | 13,684,990 | 1,803,255 | (1,280,817) | 522,438 |
Financial Services Portfolio | 381,518,676 | 175,669,462 | (1,820,971) | 173,848,491 |
Food and Agriculture Portfolio | 93,692,115 | 20,452,633 | (470,674) | 19,981,959 |
Gold Portfolio | 593,896,729 | 194,442,138 | (28,620,102) | 165,822,036 |
Health Care Portfolio | 1,484,910,710 | 561,538,972 | (17,595,398) | 543,943,574 |
Home Finance Portfolio | 270,066,077 | 178,433,363 | (470,260) | 177,963,103 |
Industrial Equipment Portfolio | 59,163,668 | 8,903,802 | (2,048,753) | 6,855,049 |
Industrial Materials Portfolio | 130,236,665 | 13,256,922 | (3,728,275) | 9,528,647 |
Insurance Portfolio | 115,344,489 | 36,168,025 | (368,447) | 35,799,578 |
Leisure Portfolio | 195,680,815 | 28,064,749 | (1,994,672) | 26,070,077 |
Medical Delivery Portfolio | 179,897,403 | 30,048,543 | (1,998,861) | 28,049,682 |
Medical Equipment and Systems Portfolio | 502,583,416 | 94,949,263 | (14,071,837) | 80,877,426 |
Multimedia Portfolio | 158,562,745 | 25,588,517 | (4,257,572) | 21,330,945 |
Natural Gas Portfolio | 183,852,927 | 35,848,339 | (1,532,642) | 34,315,697 |
Natural Resources Portfolio | 70,096,788 | 9,739,225 | (600,726) | 9,138,499 |
Networking and Infrastructure Portfolio | 192,505,197 | 47,415,585 | (15,756,324) | 31,659,261 |
Paper and Forest Products Portfolio | 30,942,922 | 2,037,991 | (176,567) | 1,861,424 |
Pharmaceuticals Portfolio | 95,795,734 | 8,396,138 | (7,108,064) | 1,288,074 |
Retailing Portfolio | 79,066,509 | 14,041,705 | (1,022,487) | 13,019,218 |
Software and Computer Services Portfolio | 748,296,759 | 143,598,043 | (38,948,687) | 104,649,356 |
Technology Portfolio | 2,309,137,678 | 432,952,163 | (102,331,960) | 330,620,203 |
Telecommunications Portfolio | 367,777,926 | 100,243,882 | (21,176,669) | 79,067,213 |
Transportation Portfolio | 33,229,811 | 7,666,476 | (1,254,579) | 6,411,897 |
Utilities Growth Portfolio | 200,163,221 | 28,244,364 | (17,280,441) | 10,963,923 |
Wireless Portfolio | 259,700,949 | 62,566,464 | (6,242,837) | 56,323,627 |
Annual Report
1. Significant Accounting Policies - continued
Income Tax Information and Distributions to Shareholders - continued
| Undistributed
Ordinary Income | Undistributed
Long-term Capital
Gain | Capital Loss
Carryforward |
Air Transportation Portfolio | $ - | $ 410,611 | $ - |
Automotive Portfolio | - | - | (7,439,277) |
Banking Portfolio | 707,593 | 1,038,372 | - |
Biotechnology Portfolio | - | - | (1,049,360,149) |
Brokerage and Investment Management Portfolio | 430,813 | - | (36,858,919) |
Business Services and Outsourcing Portfolio | - | - | (2,298,451) |
Chemicals Portfolio | 22,461 | - | (889,021) |
Computers Portfolio | - | - | (901,378,746) |
Construction and Housing Portfolio | - | - | (2,709,654) |
Consumer Industries Portfolio | 845,751 | 657,560 | - |
Cyclical Industries Portfolio | 448,055 | 45,776 | - |
Defense and Aerospace Portfolio | - | - | (515,088) |
Developing Communications Portfolio | - | - | (1,372,594,494) |
Electronics Portfolio | - | - | (3,065,758,489) |
Energy Portfolio | 316,781 | - | (16,411,194) |
Energy Service Portfolio | - | - | (53,712,370) |
Environmental Portfolio | - | - | (2,923,295) |
Financial Services Portfolio | 464,672 | 7,027,303 | - |
Food and Agriculture Portfolio | - | - | (7,186,408) |
Gold Portfolio | - | - | (73,759,570) |
Health Care Portfolio | 250,710 | - | (70,936,153) |
Home Finance Portfolio | 1,014,730 | 8,588,746 | - |
Industrial Equipment Portfolio | - | 991,770 | - |
Industrial Materials Portfolio | 77,011 | 2,648,230 | - |
Insurance Portfolio | - | 1,496,019 | - |
Leisure Portfolio | 3,041,303 | 6,279,836 | - |
Medical Delivery Portfolio | - | - | (30,293,479) |
Medical Equipment and Systems Portfolio | 3,058,226 | 19,949 | - |
Multimedia Portfolio | 1,670,244 | 1,412,243 | - |
Natural Gas Portfolio | - | - | (23,667,482) |
Natural Resources Portfolio | 121,683 | - | (1,584,480) |
Networking and Infrastructure Portfolio | - | - | (200,772,831) |
Paper and Forest Products Portfolio | - | - | (7,785,495) |
Pharmaceuticals Portfolio | - | - | (5,457,857) |
Retailing Portfolio | - | - | (402,624) |
Software and Computer Services Portfolio | - | - | (256,343,603) |
Technology Portfolio | - | - | (2,944,571,943) |
Telecommunications Portfolio | 434,006 | - | (622,861,890) |
Transportation Portfolio | - | - | (1,143,008) |
Utilities Growth Portfolio | 746,905 | - | (185,878,983) |
Wireless Portfolio | - | - | (136,665,986) |
Annual Report
Notes to Financial Statements - continued
1. Significant Accounting Policies - continued
Income Tax Information and Distributions to Shareholders - continued
The tax character of distributions paid during the year 2004 was as follows:
| Ordinary
Income | Long-term
Capital Gains | Total |
Banking Portfolio | $ 5,352,517 | $ 5,029,258 | $ 10,381,775 |
Brokerage and Investment Management Portfolio | 1,323,045 | - | 1,323,045 |
Chemicals Portfolio | 419,485 | - | 419,485 |
Consumer Industries Portfolio | - | 589,523 | 589,523 |
Cyclical Industries Portfolio | 148,427 | 508,889 | 657,316 |
Energy Portfolio | 1,208,061 | - | 1,208,061 |
Financial Services Portfolio | 4,309,494 | - | 4,309,494 |
Food and Agriculture Portfolio | 521,536 | - | 521,536 |
Gold Portfolio | 39,692,454 | - | 39,692,454 |
Health Care Portfolio | 3,051,688 | - | 3,051,688 |
Home Finance Portfolio | 2,656,954 | 11,172,622 | 13,829,576 |
Industrial Materials Portfolio | 240,088 | - | 240,088 |
Insurance Portfolio | 152,145 | 2,453,342 | 2,605,487 |
Medical Equipment and Systems Portfolio | 5,896,352 | 3,869,625 | 9,765,977 |
Multimedia Portfolio | 10,934,186 | 1,424,650 | 12,358,836 |
Telecommunications Portfolio | 565,329 | - | 565,329 |
Utilities Growth Portfolio | 2,532,917 | - | 2,532,917 |
The tax character of distributions paid during the year 2003 was as follows:
| Ordinary
Income | Long-term
Capital Gains | Total |
Air Transportation Portfolio | $ - | $ 483,018 | $ 483,018 |
Banking Portfolio | 4,545,468 | - | 4,545,468 |
Brokerage and Investment Management Portfolio | 2,209,018 | - | 2,209,018 |
Chemicals Portfolio | 341,100 | 134,766 | 475,866 |
Defense and Aerospace Portfolio | 310,532 | - | 310,532 |
Energy Portfolio | 1,333,657 | - | 1,333,657 |
Financial Services Portfolio | 4,054,325 | - | 4,054,325 |
Food and Agriculture Portfolio | 823,441 | 2,357,859 | 3,181,300 |
Gold Portfolio | 9,260,070 | - | 9,260,070 |
Health Care Portfolio | 3,769,448 | 46,505,375 | 50,274,823 |
Home Finance Portfolio | 2,208,881 | 5,002,985 | 7,211,866 |
Industrial Materials Portfolio | 445,684 | - | 445,684 |
Insurance Portfolio | 248,409 | 3,934,303 | 4,182,712 |
Medical Equipment and Systems Portfolio | - | 995,401 | 995,401 |
Natural Gas Portfolio | 875,067 | - | 875,067 |
Natural Resources Portfolio | 49,916 | - | 49,916 |
Telecommunications Portfolio | 484,984 | - | 484,984 |
Utilities Growth Portfolio | 3,390,133 | - | 3,390,133 |
Trading (Redemption) Fees. Shares redeemed (including exchanges) from an equity fund are subject to trading fees. Shares held less than 30 days are subject to a trading fee equal to .75% of the net asset value of shares redeemed. The fees, which are retained by the fund, are accounted for as an addition to paid in capital. Shareholders are also subject to an additional $7.50 fee for shares exchanged into another Fidelity fund (see Note 4).
2. Operating Policies.
Repurchase Agreements. Fidelity Management & Research Company (FMR) has received an Exemptive Order from the Securities and Exchange Commission (the SEC) which permits the funds and other affiliated entities of FMR to transfer uninvested cash balances into joint trading accounts. These accounts are then invested in repurchase agreements that are collateralized by U.S. Treasury or Government obligations. Certain funds may also invest directly with institutions, in repurchase agreements that are collateralized by commercial paper obligations, corporate obligations and mortgage loan obligations which may be below investment grade quality and equity securities. Collateral is held in segregated accounts with custodian banks and may be obtained in the event of a default of the counterparty. Collateral is marked-to-market daily and maintained at a value at least equal to the principal amount of the repurchase agreement (including accrued interest).
Annual Report
2. Operating Policies - continued
Delayed Delivery Transactions and When-Issued Securities. Each fund may purchase or sell securities on a delayed delivery or when-issued basis. Payment and delivery may take place after the customary settlement period for that security. The price of the underlying securities and the date when the securities will be delivered and paid for are fixed at the time the transaction is negotiated. During the time a delayed delivery sell is outstanding, the contract is marked-to-market daily and equivalent deliverable securities are held for the transaction. The value of the securities purchased on a delayed delivery or when-issued basis are identified as such in each applicable fund's Schedule of Investments. Each fund may receive compensation for interest forgone in the purchase of a delayed delivery or when-issued security. With respect to purchase commitments, each fund identifies securities as segregated in its records with a value at least equal to the amount of the commitment. Losses may arise due to changes in the value of the underlying securities or if the counterparty does not perform under the contract's terms, or if the issuer does not issue the securities due to political, economic, or other factors.
Restricted Securities. Certain funds may invest in securities that are subject to legal or contractual restrictions on resale. These securities generally may be resold in transactions exempt from registration or to the public if the securities are registered. Disposal of these securities may involve time-consuming negotiations and expense, and prompt sale at an acceptable price may be difficult. Information regarding restricted securities is included at the end of each applicable fund's Schedule of Investments.
3. Purchases and Sales of Investments.
Information regarding purchases and sales of securities is included under the caption "Other Information" at the end of each applicable fund's Schedule of Investments. Developing Communications Portfolio and Financial Services Portfolio each realized a gain on the sale of an investment not meeting the investment restrictions of the respective fund.
4. Fees and Other Transactions with Affiliates.
Management Fee. FMR and its affiliates provide the funds with investment management related services for which the funds pay a monthly management fee.
For the equity funds the management fee is the sum of an individual fund fee rate that is based on an annual rate of .30% of each fund's average net assets and a group fee rate that averaged .28% during the period. The group fee rates differ for equity and fixed-income funds and are based upon the average net assets of all the mutual funds advised by FMR. The group fee rate decreases as assets under management increase and increases as assets under management decrease. For the period the equity funds' total annual management fee rates ranged from .58% to .59% of the funds' average net assets.
For the money market fund the management fee is calculated on the basis of a group fee rate plus a total income-based component. The group fee rate averaged .13% during the period. The total income-based component is calculated according to a graduated schedule providing for different rates based on the fund's gross annualized yield. The rate increases as the fund's gross yield increases.
During the period the income-based portion of the management fee was $569,689 or an annual rate of .07% of the fund's average net assets. For the period the money market fund's total annual management fee rate was .20% of average net assets.
Sales Load. Fidelity Distributors Corporation (FDC), an affiliate of FMR, is the general distributor of the funds. Effective September 22, 2003, after 4:00 P.M. Eastern Standard Time, all of the Fidelity Select Portfolios eliminated their 3% sales charge. Shares purchased prior to October 12, 1990, are subject to a 1% deferred sales charge upon redemption or exchange to any other Fidelity fund (other than Select funds). The amounts received and retained by FDC are shown under the caption "Other Information" on each fund's Statement of Operations.
Transfer Agent Fees. Fidelity Service Company, Inc. (FSC), an affiliate of FMR, is the funds' transfer, dividend disbursing and shareholder servicing agent. FSC receives account fees and asset-based fees that vary according to account size and type of account. FSC pays for typesetting, printing and mailing of shareholder reports, except proxy statements.
Accounting and Security Lending Fees. FSC maintains each fund's accounting records. The accounting fee is based on the level of average net assets for the month. Under a separate contract, FSC administers the security lending program. The security lending fee is based on the number and duration of lending transactions.
Annual Report
Notes to Financial Statements - continued
4. Fees and Other Transactions with Affiliates - continued
Central Funds. The funds may invest in affiliated Central Funds managed by Fidelity Investments Money Management, Inc. (FIMM), an affiliate of FMR. The Central Funds are open-end investment companies available only to investment companies and other accounts managed by FMR and its affiliates. The Central Funds seek preservation of capital and current income and do not pay a management fee. Income distributions earned by the funds are recorded as income in the accompanying financial statements. Distributions from the Central Funds are noted in the table below:
| Income
Distributions | |
Air Transportation Portfolio | $ 29,504 | |
Automotive Portfolio | 14,813 | |
Banking Portfolio | 81,562 | |
Biotechnology Portfolio | 2,108,768 | |
Brokerage and Investment Management Portfolio | 98,500 | |
Business Services and Outsourcing Portfolio | 10,528 | |
Chemicals Portfolio | 14,957 | |
Computers Portfolio | 331,948 | |
Construction and Housing Portfolio | 52,681 | |
Consumer Industries Portfolio | 15,533 | |
Cyclical Industries Portfolio | 9,710 | |
Defense and Aerospace Portfolio | 52,741 | |
Developing Communications Portfolio | 317,091 | |
Electronics Portfolio | 1,803,406 | |
Energy Portfolio | 63,782 | |
Energy Service Portfolio | 54,529 | |
Environmental Portfolio | 3,128 | |
Financial Services Portfolio | 38,655 | |
Food and Agriculture Portfolio | 26,170 | |
Gold Portfolio | 389,896 | |
Health Care Portfolio | 392,671 | |
Home Finance Portfolio | 51,799 | |
Industrial Equipment Portfolio | 17,550 | |
Industrial Materials Portfolio | 51,133 | |
Insurance Portfolio | 64,777 | |
Leisure Portfolio | 61,379 | |
Medical Delivery Portfolio | 79,295 | |
Medical Equipment and Systems Portfolio | 140,871 | |
Multimedia Portfolio | 69,189 | |
Natural Gas Portfolio | 63,265 | |
Natural Resources Portfolio | 14,124 | |
Networking and Infrastructure Portfolio | 102,897 | |
Paper and Forest Products Portfolio | 7,226 | |
Pharmaceuticals Portfolio | 22,907 | |
Retailing Portfolio | 90,729 | |
Software and Computer Services Portfolio | 651,765 | |
Technology Portfolio | 989,386 | |
Telecommunications Portfolio | 73,446 | |
Transportation Portfolio | 18,033 | |
Utilities Growth Portfolio | 52,125 | |
Wireless Portfolio | 77,952 | |
Exchange Fees. FSC receives the proceeds of $7.50 to cover administrative costs associated with exchanges out of an equity fund to any other Fidelity Select fund or to any other Fidelity fund. The exchange fees retained by FSC are shown under the caption "Other Information" on each fund's Statement of Operations.
Brokerage Commissions. Certain funds placed a portion of their portfolio transactions with brokerage firms which are affiliates of the investment adviser. The commissions paid to these affiliated firms are shown under the caption "Other Information" at the end of each applicable fund's Schedule of Investments.
Interfund Lending Program. Pursuant to an Exemptive Order issued by the SEC, the funds, along with other registered investment companies having management contracts with FMR, may participate in an interfund lending program. This program provides an alternative credit facility allowing the funds to borrow from, or lend money to, other participating funds. Information regarding each applicable fund's participation in the program is included under the caption "Other Information" at the end of each applicable fund's Schedule of Investments.
Annual Report
5. Committed Line of Credit.
Certain funds participate with other funds managed by FMR in a $3.5 billion credit facility (the "line of credit") to be utilized for temporary or emergency purposes to fund shareholder redemptions or for other short-term liquidity purposes. The funds have agreed to pay commitment fees on their pro rata portion of the line of credit. During the period, there were no borrowings on this line of credit.
6. Security Lending.
Certain funds lend portfolio securities from time to time in order to earn additional income. Each applicable fund receives collateral (in the form of U.S. Treasury obligations, letters of credit and/or cash) against the loaned securities and maintains collateral in an amount not less than 100% of the market value of the loaned securities during the period of the loan. The market value of the loaned securities is determined at the close of business of the funds and any additional required collateral is delivered to the funds on the next business day. If the borrower defaults on its obligation to return the securities loaned because of insolvency or other reasons, a fund could experience delays and costs in recovering the securities loaned or in gaining access to the collateral. Cash collateral is invested in cash equivalents. The value of loaned securities and cash collateral at period end are disclosed on each applicable fund's Statement of Assets and Liabilities.
7. Expense Reductions.
FMR agreed to reimburse certain funds to the extent operating expenses exceeded certain levels of average net assets as noted in the table below. Some expenses, for example interest expense, are excluded from this reimbursement.
| Expense
Limitations | Reimbursement
from adviser |
Environmental Portfolio | 2.50% | $ 7,837 |
Annual Report
Notes to Financial Statements - continued
7. Expense Reductions - continued
Many of the brokers with whom FMR places trades on behalf of certain funds provided services to these funds in addition to trade execution. These services included payments of expenses on behalf of each applicable fund. In addition, through arrangements with each applicable fund's custodian and transfer agent, credits realized as a result of uninvested cash balances were used to reduce each applicable fund's expenses. All of the applicable expense reductions are noted in the table below.
| Brokerage Service Arrangements | Custody
expense
reduction | Transfer
Agent
expense
reduction |
Air Transportation Portfolio | $ 31,534 | $ - | $ - |
Automotive Portfolio | 1,646 | - | - |
Banking Portfolio | 43,402 | - | - |
Biotechnology Portfolio | 391,075 | 202 | - |
Brokerage and Investment Management Portfolio | 84,318 | - | - |
Business Services and Outsourcing Portfolio | 4,879 | - | - |
Chemicals Portfolio | 19,508 | - | - |
Computers Portfolio | 578,455 | 2,432 | - |
Construction and Housing Portfolio | 15,780 | 20 | - |
Consumer Industries Portfolio | 15,148 | - | - |
Cyclical Industries Portfolio | 9,227 | - | - |
Defense and Aerospace Portfolio | 92,033 | - | - |
Developing Communications Portfolio | 797,813 | 476 | - |
Electronics Portfolio | 600,237 | 231 | - |
Energy Portfolio | 31,161 | - | - |
Energy Service Portfolio | 36,760 | - | - |
Environmental Portfolio | 214 | - | - |
Financial Services Portfolio | 75,576 | - | 61 |
Food and Agriculture Portfolio | 20,419 | - | - |
Gold Portfolio | 468,896 | 25,236 | - |
Health Care Portfolio | 604,727 | - | - |
Home Finance Portfolio | 38,187 | - | - |
Industrial Equipment Portfolio | 14,508 | - | - |
Industrial Materials Portfolio | 95,452 | - | - |
Insurance Portfolio | 11,133 | - | - |
Leisure Portfolio | 100,824 | - | - |
Medical Delivery Portfolio | 83,990 | 192 | - |
Medical Equipment and Systems Portfolio | 82,310 | 699 | - |
Money Market Portfolio | - | 129 | 382 |
Multimedia Portfolio | 116,793 | - | - |
Natural Gas Portfolio | 123,020 | - | - |
Natural Resources Portfolio | 2,167 | - | - |
Networking and Infrastructure Portfolio | 50,893 | - | - |
Paper and Forest Products Portfolio | 13,422 | - | - |
Pharmaceuticals Portfolio | 13,948 | - | - |
Retailing Portfolio | 29,167 | - | - |
Software and Computer Services Portfolio | 201,725 | 853 | - |
Technology Portfolio | 1,267,566 | 1,596 | - |
Telecommunications Portfolio | 206,786 | 93 | - |
Transportation Portfolio | 13,769 | - | - |
Utilities Growth Portfolio | 83,072 | - | - |
Wireless Portfolio | 139,300 | 51 | - |
Annual Report
8. Other Information.
At the end of the period, FMR or its affiliates and certain unaffiliated shareholders were owners of record of more than 10% of the outstanding shares of the following funds:
| Affiliated % | Number of
Unaffiliated
Shareholders | Unaffiliated
Shareholders % |
Air Transportation Portfolio | - | 1 | 11 |
Consumer Industries Portfolio | - | 1 | 34 |
Cyclical Industries Portfolio | - | 1 | 33 |
Industrial Equipment Portfolio | - | 1 | 18 |
Multimedia Portfolio | - | 1 | 18 |
Natural Gas Portfolio | 10 | - | - |
Paper and Forest Products Portfolio | - | 1 | 13 |
9. Transactions with Affiliated Companies.
An affiliated company is a company in which the fund has ownership of at least 5% of the voting securities. Information regarding transactions with affiliated companies is included in "Other Information" at the end of each applicable fund's Schedule of Investments.
10. Litigation.
In October 2002, a lawsuit was commenced against Construction and Housing Portfolio and numerous other defendants as a defendants' class action suit by the Chapter 11 estate of Owens Corning. The Owens Corning estate alleges that 16 dividend payments made by Owens Corning between 1996 and the filing of Owens Corning's petition for Chapter 11 relief in October 2000 were fraudulent conveyances and, thus, the Owens Corning estate seeks to recover those dividends. During this period Construction and Housing Portfolio received dividends in the amount of $42,780. The lawsuit has been stayed by order of the Bankruptcy Court for the District of Delaware until February 23, 2005 or until the debtor's plan of reorganization has been approved, whichever comes first. The fund intends to defend the proceedings vigorously.
Annual Report
Report of Independent Auditors
To the Trustees and the Shareholders of Fidelity Select Portfolios:
In our opinion, the accompanying statements of assets and liabilities, including the schedules of investments, and the related statements of operations and of changes in net assets and the financial highlights present fairly, in all material respects, the financial position of the funds constituting Fidelity Select Portfolios at February 29, 2004, and the results of their operations, the changes in their net assets and the financial highlights for the periods indicated, in conformity with accounting principles generally accepted in the United States of America. These financial statements and financial highlights (hereafter referred to as "financial statements") are the responsibility of the Fidelity Select Portfolios' management; our responsibility is to express an opinion on these financial statements based on our audits. We conducted our audits of these financial statements in accordance with auditing standards generally accepted in the United States of America which require that we plan and perform the audit to obtain reasonable assurance about whether the financial statements are free of material misstatement. An audit includes examining, on a test basis, evidence supporting the amounts and disclosures in the financial statements, assessing the accounting principles used and significant estimates made by management, and evaluating the overall financial statement presentation. We believe that our audits, which included confirmation of securities at February 29, 2004 by correspondence with the custodian and brokers, provide a reasonable basis for our opinion.
/s/PricewaterhouseCoopers LLP
PricewaterhouseCoopers LLP
Boston, Massachusetts
April 20, 2004
Annual Report
Trustees and Officers
The Trustees, Members of the Advisory Board, and executive officers of the trust and funds, as applicable, are listed below. The Board of Trustees governs each fund and is responsible for protecting the interests of shareholders. The Trustees are experienced executives who meet periodically throughout the year to oversee each fund's activities, review contractual arrangements with companies that provide services to each fund, and review each fund's performance. Except for William O. McCoy, each of the Trustees oversees 292 funds advised by FMR or an affiliate. Mr. McCoy oversees 294 funds advised by FMR or an affiliate.
The Trustees hold office without limit in time except that (a) any Trustee may resign; (b) any Trustee may be removed by written instrument, signed by at least two-thirds of the number of Trustees prior to such removal; (c) any Trustee who requests to be retired or who has become incapacitated by illness or injury may be retired by written instrument signed by a majority of the other Trustees; and (d) any Trustee may be removed at any special meeting of shareholders by a two-thirds vote of the outstanding voting securities of the trust. In any event, each non-interested Trustee shall retire not later than the last day of the calendar year in which his or her 72nd birthday occurs. The executive officers and Advisory Board Members hold office without limit in time, except that any officer and Advisory Board Member may resign or may be removed by a vote of a majority of the Trustees at any regular meeting or any special meeting of the Trustees. Except as indicated, each individual has held the office shown or other offices in the same company for the past five years.
The funds' Statement of Additional Information (SAI) includes more information about the Trustees. To request a free copy, call Fidelity at 1-800-544-8544.
Interested Trustees*:
Correspondence intended for each Trustee who is an "interested person" (as defined in the 1940 Act) may be sent to Fidelity Investments, 82 Devonshire Street, Boston, Massachusetts 02109.
Name, Age; Principal Occupation |
Edward C. Johnson 3d (73)** |
| Year of Election or Appointment: 1980 Mr. Johnson is Chairman of the Board of Trustees. Mr. Johnson serves as Chief Executive Officer, Chairman, and a Director of FMR Corp.; a Director and Chairman of the Board and of the Executive Committee of FMR; Chairman and a Director of Fidelity Management & Research (Far East) Inc.; Chairman (1998) and a Director of Fidelity Investments Money Management, Inc.; and Chairman (2001) and a Director (2000) of FMR Co., Inc. |
Abigail P. Johnson (42)** |
| Year of Election or Appointment: 2001 Senior Vice President of each of the Select funds (2001). Ms. Johnson also serves as Senior Vice President of other Fidelity funds (2001). She is President and a Director of FMR (2001), Fidelity Investments Money Management, Inc. (2001), FMR Co., Inc. (2001), and a Director of FMR Corp. Previously, Ms. Johnson managed a number of Fidelity funds. |
Laura B. Cronin (49) |
| Year of Election or Appointment: 2003 Ms. Cronin is an Executive Vice President (2002) and Chief Financial Officer (2002) of FMR Corp. and is a member of the Fidelity Management Committee (2003). Previously, Ms. Cronin served as Vice President of Finance of FMR (1997-1999), and Chief Financial Officer of FMR (1999-2001), Fidelity Personal Investments (2001), and Fidelity Brokerage Company (2001-2002). |
Robert L. Reynolds (51) |
| Year of Election or Appointment: 2003 Mr. Reynolds is a Director (2003) and Chief Operating Officer (2002) of FMR Corp. and is the head of the Fidelity Management Committee (2003). He also serves on the Board at Fidelity Investments Canada, Ltd. (2000). Previously, Mr. Reynolds served as President of Fidelity Investments Institutional Retirement Group (1996-2000). |
* Trustees have been determined to be "Interested Trustees" by virtue of, among other things, their affiliation with the trust or various entities under common control with FMR.
** Edward C. Johnson 3d, Trustee, is Abigail P. Johnson's father.
Annual Report
Trustees and Officers - continued
Non-Interested Trustees:
Correspondence intended for each non-interested Trustee (that is, the Trustees other than the Interested Trustees) may be sent to Fidelity Investments, P.O. Box 55235, Boston, Massachusetts 02205-5235.
Name, Age; Principal Occupation |
J. Michael Cook (61) |
| Year of Election or Appointment: 2001 Prior to Mr. Cook's retirement in May 1999, he served as Chairman and Chief Executive Officer of Deloitte & Touche LLP (accounting/consulting), Chairman of the Deloitte & Touche Foundation, and a member of the Board of Deloitte Touche Tohmatsu. He currently serves as a Director of Comcast (telecommunications, 2002), International Flavors & Fragrances, Inc. (2000), The Dow Chemical Company (2000), and Northrop Grumman Corporation (global defense technology, 2003). He is a Member of the Diversity Advisory Council of Marakon (2003) and the Advisory Board of the Directorship Search Group, Chairman Emeritus of the Board of Catalyst (a leading organization for the advancement of women in business), and is Chairman of the Accountability Advisory Council to the Comptroller General of the United States. He also serves as a Member of the Advisory Board of the Graduate School of Business of the University of Florida, his alma mater. |
Ralph F. Cox (71) |
| Year of Election or Appointment: 1991 Mr. Cox is President of RABAR Enterprises (management consulting for the petroleum industry). Prior to February 1994, he was President of Greenhill Petroleum Corporation (petroleum exploration and production). Until March 1990, Mr. Cox was President and Chief Operating Officer of Union Pacific Resources Company (exploration and production). He is a Director of CH2M Hill Companies (engineering), and Abraxas Petroleum (petroleum exploration and production, 1999). In addition, he is a member of advisory boards of Texas A&M University and the University of Texas at Austin. |
Robert M. Gates (60) |
| Year of Election or Appointment: 1997 Dr. Gates is President of Texas A&M University (2002). He was Director of the Central Intelligence Agency (CIA) from 1991 to 1993. From 1989 to 1991, Dr. Gates served as Assistant to the President of the United States and Deputy National Security Advisor. Dr. Gates is a Director of NACCO Industries, Inc. (mining and manufacturing), Parker Drilling Co., Inc. (drilling and rental tools for the energy industry, 2001), and Brinker International (restaurant management, 2003). He also serves as a member of the Advisory Board of VoteHere.net (secure internet voting, 2001). Previously, Dr. Gates served as a Director of LucasVarity PLC (automotive components and diesel engines), a Director of TRW Inc. (automotive, space, defense, and information technology), and Dean of the George Bush School of Government and Public Service at Texas A&M University (1999-2001). Dr. Gates also is a Trustee of the Forum for International Policy. |
George H. Heilmeier (67) |
| Year of Election or Appointment: 2004 Dr. Heilmeier is Chairman Emeritus of Telcordia Technologies (communication software and systems), where prior to his retirement, he served as company Chairman and Chief Executive Officer. He currently serves on the Boards of Directors of The Mitre Corporation (systems engineering and information technology support for the government), INET Technologies Inc. (telecommunications network surveillance, 2001) and Teletech Holdings (customer management services, 1998). He is Chairman of the General Motors Technology Advisory Committee and a Life Fellow of the IEEE (2000). Dr. Heilmeier is a member of the Defense Science Board and the National Security Agency Advisory Board. He is also a member of the National Academy of Engineering, the American Academy of Arts and Sciences and The Board of Overseers of the School of Engineering and Applied Science of the University of Pennsylvania. Previously, Dr. Heilmeier served as a Director of TRW Inc. (automotive, space, defense, and information technology, 1992-2002) and Compaq (1994-2002). |
Donald J. Kirk (71) |
| Year of Election or Appointment: 1987 Mr. Kirk is a Governor of the American Stock Exchange (2001), a Trustee and former Chairman of the Board of Trustees of the Greenwich Hospital Association, a Director of the Yale-New Haven Health Services Corp. (1998), and a Director Emeritus and former Chairman of the Board of Directors of National Arts Strategies Inc. Mr. Kirk was an Executive-in-Residence (1995-2000) and a Professor (1987-1995) at Columbia University Graduate School of Business. Prior to 1987, he was Chairman of the Financial Accounting Standards Board. Previously, Mr. Kirk served as a Governor of the National Association of Securities Dealers, Inc. (1996-2002), a member and Vice Chairman of the Public Oversight Board of the American Institute of Certified Public Accountants' SEC Practice Section (1995-2002), a Director of General Re Corporation (reinsurance, 1987-1998) and as a Director of Valuation Research Corp. (appraisals and valuations). |
Name, Age; Principal Occupation |
Marie L. Knowles (57) |
| Year of Election or Appointment: 2001 Prior to Ms. Knowles' retirement in June 2000, she served as Executive Vice President and Chief Financial Officer of Atlantic Richfield Company (ARCO) (diversified energy, 1996-2000). From 1993 to 1996, she was a Senior Vice President of ARCO and President of ARCO Transportation Company. She served as a Director of ARCO from 1996 to 1998. She currently serves as a Director of Phelps Dodge Corporation (copper mining and manufacturing), URS Corporation (multidisciplinary engineering, 1999), and McKesson Corporation (healthcare service, 2002). Ms. Knowles is a Trustee of the Brookings Institution and the Catalina Island Conservancy and also serves as a member of the Advisory Board for the School of Engineering of the University of Southern California. |
Ned C. Lautenbach (60) |
| Year of Election or Appointment: 2000 Mr. Lautenbach has been a partner of Clayton, Dubilier & Rice, Inc. (private equity investment firm) since September 1998. Previously, Mr. Lautenbach was with the International Business Machines Corporation (IBM) from 1968 until his retirement in 1998. He was most recently Senior Vice President and Group Executive of Worldwide Sales and Services. From 1993 to 1995, he was Chairman of IBM World Trade Corporation, and from 1994 to 1998 was a member of IBM's Corporate Executive Committee. Mr. Lautenbach serves as Co-Chairman and a Director of Covansys, Inc. (global provider of business and technology solutions, 2000). In addition, he is a Director of Eaton Corporation (diversified industrial) and the Philharmonic Center for the Arts in Naples, Florida (1999). He also is a member of the Council on Foreign Relations. |
Marvin L. Mann (70) |
| Year of Election or Appointment: 1993 Mr. Mann is Chairman of the non-interested Trustees (2001). He is Chairman Emeritus of Lexmark International, Inc. (computer peripherals) where he served as CEO until April 1998 and retired as Chairman May 1999, and remains a member of the Board. Prior to 1991, he held the positions of Vice President of International Business Machines Corporation (IBM) and President and General Manager of various IBM divisions and subsidiaries. Mr. Mann is a Board member of Imation Corp. (imaging and information storage). He is also a member of the Director Services Committee of the Investment Company Institute. In addition, Mr. Mann is a member of the President's Cabinet at the University of Alabama and the Board of Visitors of the Culverhouse College of Commerce and Business Administration at the University of Alabama. |
William O. McCoy (70) |
| Year of Election or Appointment: 1997 Prior to his retirement in December 1994, Mr. McCoy was Vice Chairman of the Board of BellSouth Corporation (telecommunications) and President of BellSouth Enterprises. He is currently a Director of Liberty Corporation (holding company), Duke Realty Corporation (real estate), and Progress Energy, Inc. (electric utility). He is also a partner of Franklin Street Partners (private investment management firm) and a member of the Research Triangle Foundation Board. In addition, Mr. McCoy served as the Interim Chancellor (1999-2000) and a member of the Board of Visitors (1994-1998) for the University of North Carolina at Chapel Hill and currently serves on the Board of Directors of the University of North Carolina Health Care System and the Board of Visitors of the Kenan-Flagler Business School (University of North Carolina at Chapel Hill). He also served as Vice President of Finance for the University of North Carolina (16-school system, 1995-1998). |
William S. Stavropoulos (64) |
| Year of Election or Appointment: 2001 Mr. Stavropoulos is Chairman of the Board (2000), CEO (2002), a position he previously held from 1995-2000, Chairman of the Executive Committee (2000), and a Member of the Board of Directors of The Dow Chemical Company. Since joining The Dow Chemical Company in 1967, Mr. Stavropoulos served in numerous senior management positions, including President (1993-2000; 2002-2003). Currently, he is a Director of NCR Corporation (data warehousing and technology solutions), BellSouth Corporation (telecommunications), Chemical Financial Corporation, and Maersk Inc. (industrial conglomerate, 2002). He also serves as a member of the Board of Trustees of the American Enterprise Institute for Public Policy Research. In addition, Mr. Stavropoulos is a member of The Business Council, J.P. Morgan International Council and the University of Notre Dame Advisory Council for the College of Science. |
Annual Report
Trustees and Officers - continued
Advisory Board Members and Executive Officers:
Correspondence intended for Ms. Small may be sent to Fidelity Investments, P.O. Box 55235, Boston, Massachusetts 02205-5235. Correspondence intended for each executive officer and Mr. Lynch may be sent to Fidelity Investments, 82 Devonshire Street, Boston, Massachusetts 02109.
Name, Age; Principal Occupation |
Peter S. Lynch (61) |
| Year of Election or Appointment: 2003 Member of the Advisory Board of Fidelity Select Portfolios. Vice Chairman and a Director of FMR, and Vice Chairman (2001) and a Director (2000) of FMR Co., Inc. Previously, Mr. Lynch served as a Trustee of the Fidelity funds (1990-2003). Prior to May 31, 1990, he was a Director of FMR and Executive Vice President of FMR (a position he held until March 31, 1991), Vice President of Fidelity® Magellan® Fund and FMR Growth Group Leader, and Managing Director of FMR Corp. Mr. Lynch was also Vice President of Fidelity Investments Corporate Services. In addition, he serves as a Trustee of Boston College, Massachusetts Eye & Ear Infirmary, Historic Deerfield, John F. Kennedy Library, and the Museum of Fine Arts of Boston. |
Cornelia M. Small (59) |
| Year of Election or Appointment: 2004 Member of the Advisory Board of Fidelity Select Portfolios. Ms. Small is a member (2000) and Chairperson (2002) of the Investment Committee, and a member (2002) of the Board of Trustees of Smith College. Previously, she served as Chief Investment Officer (1999-2000), Director of Global Equity Investments (1996-1999), and a member of the Board of Directors of Scudder, Stevens & Clark (1990-1997) and Scudder Kemper Investments (1997-1998). In addition, Ms. Small served as Co-Chair (2000-2003) of the Annual Fund for the Fletcher School of Law and Diplomacy. |
Dwight D. Churchill (50) |
| Year of Election or Appointment: 2000 Vice President of Money Market. He serves as Head of Fidelity's Fixed-Income Division (2000), Vice President of Fidelity's Money Market Funds (2000), Vice President of Fidelity's Bond Funds (1997), and Senior Vice President of FIMM (2000) and FMR (1997). Mr. Churchill joined Fidelity in 1993 as Vice President and Group Leader of Taxable Fixed-Income Investments. |
David L. Murphy (56) |
| Year of Election or Appointment: 2002 Vice President of Money Market. Mr. Murphy also serves as Vice President of Fidelity's Money Market Funds (2002) and Vice President of certain Asset Allocation Funds (2003). He serves as Senior Vice President (2000) and Money Market Group Leader (2002) of the Fidelity Investments Fixed Income Division. Mr. Murphy is also a Senior Vice President of FIMM (2003) and a Vice President of FMR (2000). Previously, Mr. Murphy served as Bond Group Leader (2000-2002) and Vice President of Fidelity's Taxable Bond Funds (2000-2002) and Fidelity's Municipal Bond Funds (2001-2002). Mr. Murphy joined Fidelity in 1989 as a portfolio manager in the Bond Group. |
Robert A. Litterst (44) |
| Year of Election or Appointment: 2004 Vice President of Money Market. Mr. Litterst also serves as Vice President of other funds advised by FMR. Prior to assuming his current responsibilities, Mr. Litterst managed a variety of Fidelity funds. |
Eric D. Roiter (55) |
| Year of Election or Appointment: 1998, 2000, or 2001 Secretary of Air Transportation (1998), Automotive (1998), Banking (1998), Biotechnology (1998), Brokerage and Investment Management (1998), Business Services and Outsourcing (1998), Chemicals (1998), Computers (1998), Construction and Housing (1998), Consumer Industries (1998), Cyclical Industries (1998), Defense and Aerospace (1998), Developing Communications (1998), Electronics (1998), Energy (1998), Energy Service (1998), Environmental (1998), Financial Services (1998), Food and Agriculture (1998), Gold (1998), Health Care (1998), Home Finance (1998), Industrial Equipment (1998), Industrial Materials (1998), Insurance (1998), Leisure (1998), Medical Delivery (1998), Medical Equipment and Systems (1998), Multimedia (1998), Natural Gas (1998), Natural Resources (1998), Networking and Infrastructure (2000), Paper and Forest Products (1998), Pharmaceuticals (2001), Retailing (1998), Software and Computer Services (1998), Technology (1998), Telecommunications (1998), Transportation (1998), Utilities Growth (1998), Wireless (2000), and Money Market (1998). He also serves as Secretary of other Fidelity funds (1998); Vice President, General Counsel, and Clerk of FMR Co., Inc. (2001) and FMR (1998); Vice President and Clerk of FDC (1998); Assistant Clerk of Fidelity Management & Research (U.K.) Inc. (2001) and Fidelity Management & Research (Far East) Inc. (2001); and Assistant Secretary of Fidelity Investments Money Management, Inc. (2001). Prior to joining Fidelity, Mr. Roiter was with the law firm of Debevoise & Plimpton, as an associate (1981-1984) and as a partner (1985-1997), and served as an Assistant General Counsel of the U.S. Securities and Exchange Commission (1979-1981). Mr. Roiter is an Adjunct Member, Faculty of Law, at Boston College Law School (2003). |
Stuart Fross (44) |
| Year of Election or Appointment: 2003 Assistant Secretary of each of the Select funds. Mr. Fross also serves as Assistant Secretary of other Fidelity funds (2003) and is an employee of FMR. |
Christine Reynolds (45) |
| Year of Election or Appointment: 2004 President, Treasurer, and Anti-Money Laundering (AML) officer of each of the Select funds. Ms. Reynolds also serves as President, Treasurer, and AML officer of other Fidelity funds (2004) and is a Vice President (2003) and an employee (2002) of FMR. Before joining Fidelity Investments, Ms. Reynolds worked at PricewaterhouseCoopers LLP (PwC) (1980-2002), where she was most recently an audit partner with PwC's investment management practice. |
Timothy F. Hayes (53) |
| Year of Election or Appointment: 2002 Chief Financial Officer of each of the Select funds. Mr. Hayes also serves as Chief Financial Officer of other Fidelity funds (2002). Recently he was appointed President of Fidelity Service Company (2003) where he also serves as a Director. Mr. Hayes also serves as President of Fidelity Investments Operations Group (FIOG, 2002), which includes Fidelity Pricing and Cash Management Services Group (FPCMS), where he was appointed President in 1998. Previously, Mr. Hayes served as Chief Financial Officer of Fidelity Investments Corporate Systems and Service Group (1998) and Fidelity Systems Company (1997-1998). |
John R. Hebble (45) |
| Year of Election or Appointment: 2003 Deputy Treasurer of each of the Select funds. Mr. Hebble also serves as Deputy Treasurer of other Fidelity funds (2003), and is an employee of FMR. Before joining Fidelity Investments, Mr. Hebble worked at Deutsche Asset Management where he served as Director of Fund Accounting (2002-2003) and Assistant Treasurer of the Scudder Funds (1998-2003). |
Kimberley H. Monasterio (40) |
| Year of Election or Appointment: 2004 Deputy Treasurer of each of the Select funds. Ms. Monasterio also serves as Deputy Treasurer of other Fidelity funds (2004) and is an employee of FMR (2004). Before joining Fidelity Investments, Ms. Monasterio served as Treasurer (2000-2004) and Chief Financial Officer (2002-2004) of the Franklin Templeton Funds and Senior Vice President of Franklin Templeton Services, LLC (2000-2004). |
John H. Costello (57) |
| Year of Election or Appointment: 1986, 1989, 1990, 1993, 1997, 1998, 2000, or 2001 Assistant Treasurer of Air Transportation (1986), Automotive (1986), Banking (1986), Biotechnology (1986), Brokerage and Investment Management (1986), Business Services and Outsourcing (1998), Chemicals (1986), Computers (1986), Construction and Housing (1986), Consumer Industries (1990), Cyclical Industries (1997), Defense and Aerospace (1986), Developing Communications (1990), Electronics (1986), Energy (1986), Energy Service (1986), Environmental (1989), Financial Services (1986), Food and Agriculture (1986), Gold (1986), Health Care (1986), Home Finance (1986), Industrial Equipment (1986), Industrial Materials (1986), Insurance (1986), Leisure (1986), Medical Delivery (1986), Medical Equipment and Systems (1998), Multimedia (1986), Natural Gas (1993), Natural Resources (1997), Networking and Infrastructure (2000), Paper and Forest Products (1986), Pharmaceuticals (2001), Retailing (1986), Software and Computer Services (1986), Technology (1986), Telecommunications (1986), Transportation (1986), Utilities Growth (1986), Wireless (2000), and Money Market (1986). Mr. Costello also serves as Assistant Treasurer of other Fidelity funds and is an employee of FMR. |
Francis V. Knox, Jr. (56) |
| Year of Election or Appointment: 2002 Assistant Treasurer of each of the Select funds. Mr. Knox also serves as Assistant Treasurer of other Fidelity funds (2002), and is a Vice President and an employee of FMR. Previously, Mr. Knox served as Vice President of Investment & Advisor Compliance (1990-2001), and Compliance Officer of Fidelity Management & Research (U.K.) Inc. (1992-2002), Fidelity Management & Research (Far East) Inc. (1991-2002), and FMR Corp. (1995-2002). |
Mark Osterheld (48) |
| Year of Election or Appointment: 2002 Assistant Treasurer of each of the Select funds. Mr. Osterheld also serves as Assistant Treasurer of other Fidelity funds (2002) and is an employee of FMR. |
Thomas J. Simpson (45) |
| Year of Election or Appointment: 1996, 2000, or 2001 Assistant Treasurer of Air Transportation (2000), Automotive (2000), Banking (2000), Biotechnology (2000), Brokerage and Investment Management (2000), Business Services and Outsourcing (2000), Chemicals (2000), Computers (2000), Construction and Housing (2000), Consumer Industries (2000), Cyclical Industries (2000), Defense and Aerospace (2000), Developing Communications (2000), Electronics (2000), Energy (2000), Energy Service (2000), Environmental (2000), Financial Services (2000), Food and Agriculture (2000), Gold (2000), Health Care (2000), Home Finance (2000), Industrial Equipment (2000), Industrial Materials (2000), Insurance (2000), Leisure (2000), Medical Delivery (2000), Medical Equipment and Systems (2000), Multimedia (2000), Natural Gas (2000), Natural Resources (2000), Networking and Infrastructure (2000), Paper and Forest Products (2000), Pharmaceuticals (2001), Retailing (2000), Software and Computer Services (2000), Technology (2000), Telecommunications (2000), Transportation (2000), Utilities Growth (2000), Wireless (2000), and Money Market (1996). Mr. Simpson is Assistant Treasurer of other Fidelity funds (2000) and an employee of FMR (1996). Prior to joining FMR, Mr. Simpson was Vice President and Fund Controller of Liberty Investment Services (1987-1995). |
Annual Report
Distributions
The Board of Trustees of each fund voted to pay to shareholders of record at the opening of business on record date, the following distributions per share derived from capital gains realized from sales of portfolio securities, and dividends derived from net investment income:
Fund | Pay Date | Record Date | Dividends | Capital Gains |
Air Transportation | 04/05/04 | 04/02/04 | - | $0.36 |
Banking | 04/12/04 | 04/08/04 | $0.06 | $0.09 |
Brokerage and Investment Management | 04/05/04 | 04/02/04 | $0.06 | - |
Chemicals | 04/05/04 | 04/02/04 | $0.03 | - |
Consumer Industries | 04/12/04 | 04/08/04 | - | $0.97 |
Cyclical Industries | 04/12/04 | 04/08/04 | - | $0.26 |
Energy | 04/05/04 | 04/02/04 | $0.03 | - |
Financial Services | 04/12/04 | 04/08/04 | $0.11 | $1.55 |
Health Care | 04/12/04 | 04/08/04 | $0.02 | - |
Home Finance | 04/12/04 | 04/08/04 | $0.16 | $1.36 |
Industrial Equipment | 04/12/04 | 04/08/04 | - | $0.44 |
Industrial Materials | 04/12/04 | 04/08/04 | $0.03 | $0.74 |
Insurance | 04/12/04 | 04/08/04 | - | $0.59 |
Leisure | 04/05/04 | 04/02/04 | - | $3.40 |
Medical Equipment and Systems | 04/12/04 | 04/08/04 | - | $0.11 |
Multimedia | 04/12/04 | 04/08/04 | - | $1.08 |
Natural Resources | 04/12/04 | 04/08/04 | $0.02 | - |
Telecommunications | 04/05/04 | 04/02/04 | $0.04 | - |
Utilities Growth | 04/05/04 | 04/02/04 | $0.13 | - |
A percentage of the dividends distributed during the fiscal year for the following funds was derived from interest on U.S. Government securities which is generally exempt from state income tax:
A percentage of the dividends distributed during the fiscal year for the following funds qualifies for the dividends-received deduction for corporate shareholders:
Banking | 100% | |
Brokerage and Investment Management | 100% | |
Chemicals | 100% | |
Cyclical Industries | 100% | |
Energy | 100% | |
Financial Services | 100% | |
Food and Agriculture | 100% | |
Health Care | 100% | |
Home Finance | 100% | |
Industrial Materials | 63%-4/11/03
100%-12/12/03 |
Insurance | 100% | |
Medical Equipment and Systems | 23% | |
Telecommunications | 100% | |
Utilities Growth | 100% | |
Annual Report
Distributions - continued
A percentage of the dividends distributed during the fiscal year for the following funds may be taken into account as a dividend for purposes of the maximum rate under section 1(h)(11) of the Internal Revenue Code.
Banking | 100% | |
Brokerage and Investment Management | 100% | |
Chemicals | 100% | |
Cyclical Industries | 100% | |
Energy | 100% | |
Financial Services | 100% | |
Food and Agriculture | 100% | |
Gold | 11%-04/04/03
18%-12/12/03 |
Health Care | 100% | |
Home Finance | 100% | |
Industrial Materials | 100% | |
Insurance | 100% | |
Medical Equipment and Systems | 25% | |
Multimedia | 3% | |
Telecommunications | 100% | |
Utilities Growth | 100% | |
The amounts per share which represent income derived from sources within, and taxes paid to, foreign countries or possessions of the United States are as follows:
Fund | Pay Date | Income | Taxes |
Gold | 04/07/03
12/15/03 | $0.033
$0.058 | $0.005
$0.005 |
The funds will notify shareholders in January 2005 of amounts for use in preparing 2004 income tax returns.
Annual Report
Proxy Voting Results
A special meeting of the funds' shareholders was held on March 24, 2004. The results of votes taken among shareholders on proposals before them are reported below. Each vote reported represents one dollar of net asset value held on the record date for the meeting.
PROPOSAL 1 |
To amend the Declaration of Trust to allow the Board of Trustees, if permitted by applicable law, to authorize fund mergers without shareholder approval.* |
| # of
Votes | % of
Votes |
Affirmative | 9,314,364,721.61 | 70.523 |
Against | 2,486,143,584.96 | 18.823 |
Abstain | 489,189,430.66 | 3.704 |
Broker Non-Votes | 917,940,491.14 | 6.950 |
TOTAL | 13,207,638,228.37 | 100.000 |
PROPOSAL 2 |
To elect a Board of Trustees.* |
| # of
Votes | % of
Votes |
J. Michael Cook |
Affirmative | 12,369,521,674.13 | 93.654 |
Withheld | 838,116,554.24 | 6.346 |
TOTAL | 13,207,638,228.37 | 100.000 |
Ralph F. Cox |
Affirmative | 12,353,429,984.36 | 93.532 |
Withheld | 854,208,244.01 | 6.468 |
TOTAL | 13,207,638,228.37 | 100.000 |
Laura B. Cronin |
Affirmative | 12,360,172,516.31 | 93.584 |
Withheld | 847,465,712.06 | 6.416 |
TOTAL | 13,207,638,228.37 | 100.000 |
Robert M. Gates |
Affirmative | 12,356,402,798.10 | 93.555 |
Withheld | 851,235,430.27 | 6.445 |
TOTAL | 13,207,638,228.37 | 100.000 |
George H. Heilmeier |
Affirmative | 12,365,687,775.19 | 93.625 |
Withheld | 841,950,453.18 | 6.375 |
TOTAL | 13,207,638,228.37 | 100.000 |
Abigail P. Johnson |
Affirmative | 12,335,958,829.63 | 93.400 |
Withheld | 871,679,398.74 | 6.600 |
TOTAL | 13,207,638,228.37 | 100.000 |
Edward C. Johnson 3d |
Affirmative | 12,337,734,780.99 | 93.414 |
Withheld | 869,903,447.38 | 6.586 |
TOTAL | 13,207,638,228.37 | 100.000 |
* Denotes trust-wide proposals and voting results. |
| # of
Votes | % of
Votes |
Donald J. Kirk |
Affirmative | 12,360,750,886.49 | 93.588 |
Withheld | 846,887,341.88 | 6.412 |
TOTAL | 13,207,638,228.37 | 100.000 |
Marie L. Knowles |
Affirmative | 12,367,215,661.94 | 93.637 |
Withheld | 840,422,566.43 | 6.363 |
TOTAL | 13,207,638,228.37 | 100.000 |
Ned C. Lautenbach |
Affirmative | 12,369,405,974.85 | 93.653 |
Withheld | 838,232,253.52 | 6.347 |
TOTAL | 13,207,638,228.37 | 100.000 |
Marvin L. Mann |
Affirmative | 12,358,339,601.76 | 93.570 |
Withheld | 849,298,626.61 | 6.430 |
TOTAL | 13,207,638,228.37 | 100.000 |
William O. McCoy |
Affirmative | 12,358,409,929.20 | 93.570 |
Withheld | 849,228,299.17 | 6.430 |
TOTAL | 13,207,638,228.37 | 100.000 |
Robert L. Reynolds |
Affirmative | 12,369,327,462.49 | 93.653 |
Withheld | 838,310,765.88 | 6.347 |
TOTAL | 13,207,638,228.37 | 100.000 |
William S. Stavropoulos |
Affirmative | 12,365,850,786.06 | 93.627 |
Withheld | 841,787,442.31 | 6.373 |
TOTAL | 13,207,638,228.37 | 100.000 |
PROPOSAL 3 |
To amend the fundamental investment limitation concerning lending for each fund (except Pharmaceuticals Portfolio). |
Air Transportation | # of
Votes | % of
Votes |
Affirmative | 19,708,013.12 | 77.627 |
Against | 2,900,970.34 | 11.426 |
Abstain | 1,288,675.40 | 5.076 |
Broker Non-Votes | 1,490,578.96 | 5.871 |
TOTAL | 25,388,237.82 | 100.000 |
Automotive |
Affirmative | 15,686,920.42 | 76.976 |
Against | 2,472,016.56 | 12.130 |
Abstain | 1,368,912.95 | 6.718 |
Broker Non-Votes | 851,112.36 | 4.176 |
TOTAL | 20,378,962.29 | 100.000 |
Banking | # of
Votes | % of
Votes |
Affirmative | 209,284,471.48 | 75.170 |
Against | 41,800,244.73 | 15.014 |
Abstain | 17,553,946.27 | 6.305 |
Broker Non-Votes | 9,775,543.68 | 3.511 |
TOTAL | 278,414,206.16 | 100.000 |
Biotechnology |
Affirmative | 855,740,471.61 | 72.355 |
Against | 152,812,875.19 | 12.921 |
Abstain | 63,548,527.05 | 5.373 |
Broker Non-Votes | 110,593,782.00 | 9.351 |
TOTAL | 1,182,695,655.85 | 100.000 |
Brokerage and Investment Management |
Affirmative | 209,987,919.16 | 74.751 |
Against | 31,182,257.83 | 11.100 |
Abstain | 11,205,001.40 | 3.989 |
Broker Non-Votes | 28,542,461.38 | 10.160 |
TOTAL | 280,917,639.77 | 100.000 |
Business Services and Outsourcing |
Affirmative | 18,336,427.91 | 76.070 |
Against | 3,501,674.82 | 14.527 |
Abstain | 1,350,563.63 | 5.603 |
Broker Non-Votes | 916,076.04 | 3.800 |
TOTAL | 24,104,742.40 | 100.000 |
Chemicals |
Affirmative | 21,017,424.99 | 72.932 |
Against | 5,059,271.78 | 17.556 |
Abstain | 2,473,779.36 | 8.584 |
Broker Non-Votes | 267,440.44 | .928 |
TOTAL | 28,817,916.57 | 100.000 |
Computers |
Affirmative | 486,378,459.49 | 74.894 |
Against | 79,989,926.42 | 12.317 |
Abstain | 31,550,603.98 | 4.858 |
Broker Non-Votes | 51,506,182.65 | 7.931 |
TOTAL | 649,425,172.54 | 100.000 |
Construction and Housing |
Affirmative | 50,709,620.36 | 77.908 |
Against | 7,420,073.85 | 11.400 |
Abstain | 5,203,809.16 | 7.995 |
Broker Non-Votes | 1,755,771.70 | 2.697 |
TOTAL | 65,089,275.07 | 100.000 |
Consumer Industries |
Affirmative | 20,916,168.80 | 87.398 |
Against | 1,478,679.97 | 6.179 |
Abstain | 966,900.28 | 4.040 |
Broker Non-Votes | 570,230.43 | 2.383 |
TOTAL | 23,931,979.48 | 100.000 |
Cyclical Industries | # of
Votes | % of
Votes |
Affirmative | 31,399,163.09 | 87.042 |
Against | 2,346,055.36 | 6.503 |
Abstain | 1,937,132.45 | 5.371 |
Broker Non-Votes | 390,934.50 | 1.084 |
TOTAL | 36,073,285.40 | 100.000 |
Defense and Aerospace |
Affirmative | 158,422,752.61 | 72.254 |
Against | 26,168,885.75 | 11.935 |
Abstain | 12,622,989.01 | 5.758 |
Broker Non-Votes | 22,041,106.56 | 10.053 |
TOTAL | 219,255,733.93 | 100.000 |
Developing Communications |
Affirmative | 388,195,518.32 | 77.407 |
Against | 60,836,034.91 | 12.130 |
Abstain | 26,953,971.67 | 5.376 |
Broker Non-Votes | 25,510,135.28 | 5.087 |
TOTAL | 501,495,660.18 | 100.000 |
Electronics |
Affirmative | 1,868,956,174.24 | 72.134 |
Against | 365,481,621.61 | 14.106 |
Abstain | 131,637,452.35 | 5.081 |
Broker Non-Votes | 224,868,750.15 | 8.679 |
TOTAL | 2,590,943,998.35 | 100.000 |
Energy |
Affirmative | 147,523,451.47 | 78.716 |
Against | 21,108,673.80 | 11.263 |
Abstain | 8,920,239.88 | 4.760 |
Broker Non-Votes | 9,859,649.80 | 5.261 |
TOTAL | 187,412,014.95 | 100.000 |
Energy Service |
Affirmative | 185,592,573.43 | 73.670 |
Against | 35,539,717.99 | 14.108 |
Abstain | 11,568,998.39 | 4.592 |
Broker Non-Votes | 19,222,172.48 | 7.630 |
TOTAL | 251,923,462.29 | 100.000 |
Environmental |
Affirmative | 6,086,908.09 | 75.484 |
Against | 928,011.39 | 11.509 |
Abstain | 556,358.55 | 6.899 |
Broker Non-Votes | 492,540.84 | 6.108 |
TOTAL | 8,063,818.87 | 100.000 |
Financial Services |
Affirmative | 255,827,765.78 | 75.573 |
Against | 40,545,451.70 | 11.977 |
Abstain | 18,478,953.55 | 5.459 |
Broker Non-Votes | 23,665,282.20 | 6.991 |
TOTAL | 338,517,453.23 | 100.000 |
Food and Agriculture | # of
Votes | # of
Votes |
Affirmative | 41,919,685.18 | 72.038 |
Against | 10,963,706.14 | 18.841 |
Abstain | 3,941,521.76 | 6.773 |
Broker Non-Votes | 1,366,235.42 | 2.348 |
TOTAL | 58,191,148.50 | 100.000 |
Gold |
Affirmative | 338,920,550.36 | 72.263 |
Against | 85,458,440.11 | 18.221 |
Abstain | 25,525,254.84 | 5.442 |
Broker Non-Votes | 19,109,003.76 | 4.074 |
TOTAL | 469,013,249.07 | 100.000 |
Health Care |
Affirmative | 925,921,265.06 | 72.636 |
Against | 183,028,030.41 | 14.358 |
Abstain | 77,950,468.05 | 6.115 |
Broker Non-Votes | 87,844,041.45 | 6.891 |
TOTAL | 1,274,743,804.97 | 100.000 |
Home Finance |
Affirmative | 187,381,016.17 | 71.523 |
Against | 32,705,041.39 | 12.484 |
Abstain | 16,353,713.20 | 6.242 |
Broker Non-Votes | 25,546,597.12 | 9.751 |
TOTAL | 261,986,367.88 | 100.000 |
Industrial Equipment |
Affirmative | 48,711,461.34 | 82.316 |
Against | 3,789,033.62 | 6.403 |
Abstain | 1,969,719.22 | 3.328 |
Broker Non-Votes | 4,706,466.15 | 7.953 |
TOTAL | 59,176,680.33 | 100.000 |
Industrial Materials |
Affirmative | 69,257,710.70 | 77.073 |
Against | 10,150,217.14 | 11.295 |
Abstain | 4,668,249.54 | 5.196 |
Broker Non-Votes | 5,783,823.24 | 6.436 |
TOTAL | 89,860,000.62 | 100.000 |
Insurance |
Affirmative | 54,747,826.65 | 74.243 |
Against | 10,556,273.51 | 14.316 |
Abstain | 3,293,888.56 | 4.466 |
Broker Non-Votes | 5,143,097.44 | 6.975 |
TOTAL | 73,741,086.16 | 100.000 |
Leisure |
Affirmative | 101,800,501.74 | 76.343 |
Against | 16,953,647.40 | 12.714 |
Abstain | 6,278,646.51 | 4.709 |
Broker Non-Votes | 8,312,947.50 | 6.234 |
TOTAL | 133,345,743.15 | 100.000 |
Medical Delivery | # of
Votes | # of
Votes |
Affirmative | 95,555,202.19 | 75.768 |
Against | 14,180,288.50 | 11.244 |
Abstain | 10,578,527.15 | 8.388 |
Broker Non-Votes | 5,801,883.70 | 4.600 |
TOTAL | 126,115,901.54 | 100.000 |
Medical Equipment and Systems |
Affirmative | 256,072,823.88 | 77.792 |
Against | 41,941,104.04 | 12.741 |
Abstain | 15,777,636.73 | 4.793 |
Broker Non-Votes | 15,386,712.40 | 4.674 |
TOTAL | 329,178,277.05 | 100.000 |
Money Market |
Affirmative | 267,580,859.15 | 73.581 |
Against | 53,632,078.60 | 14.748 |
Abstain | 28,358,239.45 | 7.798 |
Broker Non-Votes | 14,085,151.00 | 3.873 |
TOTAL | 363,656,328.20 | 100.000 |
Multimedia |
Affirmative | 72,155,190.15 | 79.485 |
Against | 10,618,345.74 | 11.697 |
Abstain | 3,987,976.76 | 4.393 |
Broker Non-Votes | 4,017,326.28 | 4.425 |
TOTAL | 90,778,838.93 | 100.000 |
Natural Gas |
Affirmative | 126,439,451.65 | 76.684 |
Against | 21,826,432.45 | 13.237 |
Abstain | 8,545,764.22 | 5.183 |
Broker Non-Votes | 8,072,812.69 | 4.896 |
TOTAL | 164,884,461.01 | 100.000 |
Natural Resources |
Affirmative | 36,547,387.42 | 82.674 |
Against | 4,797,828.25 | 10.853 |
Abstain | 1,726,684.84 | 3.906 |
Broker Non-Votes | 1,134,744.09 | 2.567 |
TOTAL | 44,206,644.60 | 100.000 |
Networking and Infrastructure |
Affirmative | 92,649,107.17 | 80.805 |
Against | 14,991,657.91 | 13.076 |
Abstain | 5,389,047.29 | 4.699 |
Broker Non-Votes | 1,628,609.20 | 1.420 |
TOTAL | 114,658,421.57 | 100.000 |
Paper and Forest Products |
Affirmative | 10,260,098.79 | 72.683 |
Against | 1,773,109.28 | 12.561 |
Abstain | 1,302,282.46 | 9.225 |
Broker Non-Votes | 780,718.08 | 5.531 |
TOTAL | 14,116,208.61 | 100.000 |
Retailing | # of
Votes | # of
Votes |
Affirmative | 36,900,174.48 | 75.114 |
Against | 6,826,106.97 | 13.895 |
Abstain | 2,661,068.48 | 5.417 |
Broker Non-Votes | 2,738,156.01 | 5.574 |
TOTAL | 49,125,505.94 | 100.000 |
Software and Computer Services |
Affirmative | 404,486,758.02 | 75.583 |
Against | 68,697,820.64 | 12.838 |
Abstain | 26,043,018.55 | 4.866 |
Broker Non-Votes | 35,924,835.02 | 6.713 |
TOTAL | 535,152,432.23 | 100.000 |
Technology |
Affirmative | 1,237,184,775.28 | 75.642 |
Against | 198,562,889.66 | 12.140 |
Abstain | 89,812,897.48 | 5.491 |
Broker Non-Votes | 110,026,497.64 | 6.727 |
TOTAL | 1,635,587,060.06 | 100.000 |
Telecommunications |
Affirmative | 190,962,265.27 | 74.865 |
Against | 31,920,906.72 | 12.514 |
Abstain | 13,009,657.67 | 5.101 |
Broker Non-Votes | 19,180,466.80 | 7.520 |
TOTAL | 255,073,296.46 | 100.000 |
Transportation |
Affirmative | 21,315,523.93 | 78.221 |
Against | 3,396,984.98 | 12.466 |
Abstain | 1,482,863.36 | 5.442 |
Broker Non-Votes | 1,054,743.20 | 3.871 |
TOTAL | 27,250,115.47 | 100.000 |
Utilities Growth |
Affirmative | 100,643,727.75 | 75.325 |
Against | 20,967,400.69 | 15.693 |
Abstain | 8,575,208.07 | 6.418 |
Broker Non-Votes | 3,425,691.26 | 2.564 |
TOTAL | 133,612,027.77 | 100.000 |
Wireless |
Affirmative | 116,061,414.45 | 83.066 |
Against | 14,474,794.26 | 10.360 |
Abstain | 6,007,757.29 | 4.299 |
Broker Non-Votes | 3,179,261.89 | 2.275 |
TOTAL | 139,723,227.89 | 100.000 |
Annual Report
Managing Your Investments
Fidelity offers several ways to conveniently manage your personal investments via your telephone or PC. You can access your account information, conduct trades and research your investments 24 hours a day.
By Phone
Fidelity Automated Service Telephone provides a single toll-free number to access account balances, positions, quotes and trading. It's easy to navigate the service, and on your first call, the system will help you create a personal identification number (PIN) for security.

Fidelity Automated Service Telephone (FAST®)
1-800-544-5555
Press
1 For mutual fund and brokerage trading.
2 For quotes.*
3 For account balances and holdings.
4 To review orders and mutual fund activity.
5 To change your PIN.
*0 To speak to a Fidelity representative.
By PC
Fidelity's web site on the Internet provides a wide range of information, including daily financial news, fund performance, interactive planning tools and news about Fidelity products and services.
(computer_graphic)Fidelity's Web Site
www.fidelity.com
* When you call the quotes line, please remember that a fund's yield and return will vary and, except for money market funds, share price will also vary. This means that you may have a gain or loss when you sell your shares. There is no assurance that money market funds will be able to maintain a stable $1 share price; an investment in a money market fund is not insured or guaranteed by the U.S. government. Total returns are historical and include changes in share price, reinvestment of dividends and capital gains, and the effects of any sales charges.
Annual Report
To Write Fidelity
We'll give your correspondence immediate attention and send you written confirmation upon completion of your request.
(letter_graphic)Making Changes
To Your Account
(such as changing name, address, bank, etc.)
Fidelity Investments
P.O. Box 770001
Cincinnati, OH 45277-0002
(letter_graphic)For Non-Retirement
Accounts
Buying shares
Fidelity Investments
P.O. Box 770001
Cincinnati, OH 45277-0003
Overnight Express
Fidelity Investments
Attn: Distribution Services
100 Crosby Parkway - KC1H
Covington, KY 41015
Selling shares
Fidelity Investments
P.O. Box 770001
Cincinnati, OH 45277-0035
Overnight Express
Fidelity Investments
Attn: Distribution Services
100 Crosby Parkway - KC1H
Covington, KY 41015
General Correspondence
Fidelity Investments
P.O. Box 500
Merrimack, NH 03054-0500
(letter_graphic)For Retirement
Accounts
Buying shares
Fidelity Investments
P.O. Box 770001
Cincinnati, OH 45277-0003
Selling shares
Fidelity Investments
P.O. Box 770001
Cincinnati, OH 45277-0035
Overnight Express
Fidelity Investments
Attn: Distribution Services
100 Crosby Parkway - KC1H
Covington, KY 41015
General Correspondence
Fidelity Investments
P.O. Box 500
Merrimack, NH 03054-0500
Annual Report
Investment Adviser
Fidelity Management & Research Company
Boston, MA
Investment Sub-Advisers
FMR Co., Inc.
Fidelity Investments Money Management, Inc.,
Money Market Fund
Fidelity Management & Research
(U.K.) Inc.
Fidelity Management & Research
(Far East) Inc.
Fidelity Investments Japan Limited
Fidelity International Investment Advisors
Fidelity International Investment Advisors
(U.K. Limited)
General Distributor
Fidelity Distributors Corporation
Boston, MA
Transfer and Shareholder
Servicing Agent
Fidelity Service Company, Inc.
Boston, MA
Custodians
Brown Brothers Harriman & Co.
Boston, MA
and
The Bank of New York
New York, NY
Corporate Headquarters
82 Devonshire Street
Boston, MA 02109
1-800-544-8888
Fidelity Select Portfolios
Consumer Sector
Consumer Industries
Food and Agriculture
Leisure
Multimedia
Retailing
Cyclicals Sector
Air Transportation
Automotive
Chemicals
Construction and Housing
Cyclical Industries
Defense and Aerospace
Environmental
Industrial Equipment
Industrial Materials
Transportation
Financial Services Sector
Banking
Brokerage and Investment Management
Financial Services
Home Finance
Insurance
Health Care Sector
Biotechnology
Health Care
Medical Delivery
Medical Equipment and Systems
Pharmaceuticals
Natural Resources Sector
Energy
Energy Service
Gold
Natural Gas
Natural Resources
Paper and Forest Products
Technology Sector
Business Services and Outsourcing
Computers
Developing Communications
Electronics
Networking and Infrastructure
Software and Computer Services
Technology
Utilities Sector
Telecommunications
Utilities Growth
Wireless
Money Market
The Fidelity Telephone Connection
Mutual Fund 24-Hour Service
Exchanges/Redemptions
and Account Assistance 1-800-544-6666
Product Information 1-800-544-6666
Retirement Accounts 1-800-544-4774
(8 a.m. - 9 p.m.)
TDD Service 1-800-544-0111
for the deaf and hearing impaired
(9 a.m. - 9 p.m. Eastern time)
Fidelity Automated Service
Telephone (FAST®) (automated graphic) 1-800-544-5555
(automated graphic) Automated line for quickest service
Fidelity (registered Trademark) INVESTMENTS (logo graphic) P.O. Box 193 Boston, MA 02101 | PRSRT STD U.S. Postage PAID Fidelity Investments |
|
|
|
|
SEL-UANN-0404
1.799912.100
(Recycle graphic) Printed on Recycled Paper
Item 2. Code of Ethics
As of the end of the period, February 29, 2004, Fidelity Select Portfolios (the trust) has adopted a code of ethics, as defined in Item 2 of Form N-CSR, that applies to its President and Treasurer and its Chief Financial Officer. A copy of the code of ethics is filed as an exhibit to this Form N-CSR.
Item 3. Audit Committee Financial Expert
The Board of Trustees of the trust has determined that Marie L. Knowles and Donald J. Kirk are each audit committee financial experts, as defined in Item 3 of Form N-CSR. Ms. Knowles and Mr. Kirk are each independent for purposes of Item 3 of Form N-CSR.
Item 4. Principal Accountant Fees and Services
(a) Audit Fees.
For the fiscal years ended February 29, 2004 and February 28, 2003, the aggregate Audit Fees billed by PricewaterhouseCoopers LLP (PwC) for professional services rendered for the audits of the financial statements, or services that are normally provided in connection with statutory and regulatory filings or engagements for those fiscal years, for Air Transportation Portfolio, Automotive Portfolio, Banking Portfolio, Biotechnology Portfolio, Brokerage Services and Investment Management Portfolio, Business Services and Outsourcing Portfolio, Chemicals Portfolio, Computers Portfolio, Construction and Housing Portfolio, Consumer Industries Portfolio, Cyclical Industries Portfolio, Defense and Aerospace Portfolio, Developing Communications Portfolio, Electronics Portfolio, Energy Portfolio, Energy Services Portfolio, Environmental Portfolio, Financial Services Portfolio, Food and Agriculture Portfolio, Gold Portfolio, Health Care Portfolio, Home Finance Portfolio, Industrial Equipment Portfolio, Industrial Materials Portfolio, Insurance Portfolio, Leisure Portfolio, Medical Delivery Portfolio, Medical Equipment and Systems Portfolio, Money Market Portfolio, Multimedia Portfolio, Natural Gas Portfolio, Natural Resources Portfolio, Networking and Infrastructure Portfolio, Paper and Forest Products Portfolio, Pharmaceuticals Portfolio, Retailing Portfolio, Software and Computer Services Portfolio, Technology Portfolio, Telecommunications Portfolio, Transportation Portfolio, Utilities Growth Portfolio and Wireless Portfolio (the funds) and for all funds in the Fidelity Group of Funds are shown in the table below.
Fund | 2004A | 2003A |
Air Transportation Portfolio | $36,000 | $16,000 |
Automotive Portfolio | $36,000 | $15,000 |
Banking Portfolio | $37,000 | $26,000 |
Biotechnology Portfolio | $40,000 | $87,000 |
Brokerage Services and Investment Management Portfolio | $37,000 | $25,000 |
Business Services and Outsourcing Portfolio | $36,000 | $16,000 |
Chemicals Portfolio | $36,000 | $16,000 |
Computers Portfolio | $38,000 | $42,000 |
Construction and Housing Portfolio | $36,000 | $16,000 |
Consumer Industries Portfolio | $36,000 | $15,000 |
Cyclical Industries Portfolio | $36,000 | $15,000 |
Defense and Aerospace Portfolio | $36,000 | $19,000 |
Developing Communications Portfolio | $37,000 | $33,000 |
Electronics Portfolio | $44,000 | $134,000 |
Energy Portfolio | $36,000 | $20,000 |
Energy Services Portfolio | $37,000 | $26,000 |
Environmental Portfolio | $36,000 | $15,000 |
Financial Services Portfolio | $37,000 | $28,000 |
Food and Agriculture Portfolio | $36,000 | $17,000 |
Gold Portfolio | $38,000 | $22,000 |
Health Care Portfolio | $41,000 | $73,000 |
Home Finance Portfolio | $37,000 | $23,000 |
Industrial Equipment Portfolio | $36,000 | $15,000 |
Industrial Materials Portfolio | $36,000 | $15,000 |
Insurance Portfolio | $36,000 | $17,000 |
Leisure Portfolio | $36,000 | $20,000 |
Medical Delivery Portfolio | $36,000 | $18,000 |
Medical Equipment and Systems Portfolio | $36,000 | $18,000 |
Money Market Portfolio | $38,000 | $37,000 |
Multimedia Portfolio | $36,000 | $18,000 |
Natural Gas Portfolio | $36,000 | $19,000 |
Natural Resources Portfolio | $36,000 | $15,000 |
Networking and Infrastructure Portfolio | $36,000 | $18,000 |
Paper and Forest Products Portfolio | $36,000 | $15,000 |
Pharmaceuticals Portfolio | $36,000 | $16,000 |
Retailing Portfolio | $36,000 | $17,000 |
Software and Computer Services Portfolio | $38,000 | $37,000 |
Technology Portfolio | $41,000 | $78,000 |
Telecommunications Portfolio | $37,000 | $27,000 |
Transportation Portfolio | $36,000 | $16,000 |
Utilities Growth Portfolio | $36,000 | $22,000 |
Wireless Portfolio | $36,000 | $17,000 |
All funds in the Fidelity Group of Funds audited by PwC | $10,700,000 | $8,500,000 |
A | Aggregate amounts may reflect rounding. |
(b) Audit-Related Fees.
In each of the fiscal years ended February 29, 2004 and February 28, 2003, the aggregate Audit-Related Fees billed by PwC for services rendered for assurance and related services to each fund that are reasonably related to the performance of the audit or review of the fund's financial statements, but not reported as Audit Fees, are shown in the table below.
Fund | 2004A, B | 2003 A, B |
Air Transportation Portfolio | $0 | $0 |
Automotive Portfolio | $0 | $0 |
Banking Portfolio | $0 | $0 |
Biotechnology Portfolio | $0 | $0 |
Brokerage Services and Investment Management Portfolio | $0 | $0 |
Business Services and Outsourcing Portfolio | $0 | $0 |
Chemicals Portfolio | $0 | $0 |
Computers Portfolio | $0 | $0 |
Construction and Housing Portfolio | $0 | $0 |
Consumer Industries Portfolio | $0 | $0 |
Cyclical Industries Portfolio | $0 | $0 |
Defense and Aerospace Portfolio | $0 | $0 |
Developing Communications Portfolio | $0 | $0 |
Electronics Portfolio | $0 | $0 |
Energy Portfolio | $0 | $0 |
Energy Services Portfolio | $0 | $0 |
Environmental Portfolio | $0 | $0 |
Financial Services Portfolio | $0 | $0 |
Food and Agriculture Portfolio | $0 | $0 |
Gold Portfolio | $0 | $0 |
Health Care Portfolio | $0 | $0 |
Home Finance Portfolio | $0 | $0 |
Industrial Equipment Portfolio | $0 | $0 |
Industrial Materials Portfolio | $0 | $0 |
Insurance Portfolio | $0 | $0 |
Leisure Portfolio | $0 | $0 |
Medical Delivery Portfolio | $0 | $0 |
Medical Equipment and Systems Portfolio | $0 | $0 |
Money Market Portfolio | $0 | $0 |
Multimedia Portfolio | $0 | $0 |
Natural Gas Portfolio | $0 | $0 |
Natural Resources Portfolio | $0 | $0 |
Networking and Infrastructure Portfolio | $0 | $0 |
Paper and Forest Products Portfolio | $0 | $0 |
Pharmaceuticals Portfolio | $0 | $0 |
Retailing Portfolio | $0 | $0 |
Software and Computer Services Portfolio | $0 | $0 |
Technology Portfolio | $0 | $0 |
Telecommunications Portfolio | $0 | $0 |
Transportation Portfolio | $0 | $0 |
Utilities Growth Portfolio | $0 | $0 |
Wireless Portfolio | $0 | $0 |
A | Aggregate amounts may reflect rounding. |
B | Includes amounts related to non-audit services prior to May 6, 2003 that would have been subject to pre-approval if the SEC rules relating to the pre-approval of non-audit services had been in effect at that time. |
In each of the fiscal years ended February 29, 2004 and February 28, 2003, the aggregate Audit-Related Fees that were billed by PwC that were required to be approved by the Audit Committee for services rendered on behalf of Fidelity Management & Research Company (FMR) and entities controlling, controlled by, or under common control with FMR (not including any sub-adviser whose role is primarily portfolio management and is subcontracted with or overseen by another investment adviser) that provide ongoing services to the funds ("Fund Service Providers") for assurance and related services that relate directly to the operations and financial reporting of each fund that are reasonably related to the performance of the audit or review of the fund's financial statements, but not reported as Audit Fees, are shown in the table below.
Billed By | 2004 A, B | 2003A, B |
PwC | $50,000 | $0 |
A | Aggregate amounts may reflect rounding. |
B | Includes amounts related to non-audit services prior to May 6, 2003 that would have been subject to pre-approval if the SEC rules relating to the pre-approval of non-audit services had been in effect at that time. |
Fees included in the audit-related category comprise assurance and related services (e.g., due diligence services) that are traditionally performed by the independent accountant. These audit-related services include due diligence related to mergers and acquisitions, accounting consultations and audits in connection with acquisitions, internal control reviews, attest services that are not required by statute or regulation and consultation concerning financial accounting and reporting standards.
(c) Tax Fees.
In each of the fiscal years ended February 29, 2004 and February 28, 2003, the aggregate Tax Fees billed by PwC for professional services rendered for tax compliance, tax advice, and tax planning for each fund is shown in the table below.
Fund | 2004A, B | 2003A, B |
Air Transportation Portfolio | $1,700 | $700 |
Automotive Portfolio | $1,700 | $700 |
Banking Portfolio | $1,700 | $1,400 |
Biotechnology Portfolio | $1,700 | $5,300 |
Brokerage Services and Investment Management Portfolio | $1,700 | $1,300 |
Business Services and Outsourcing Portfolio | $1,700 | $800 |
Chemicals Portfolio | $1,700 | $800 |
Computers Portfolio | $1,700 | $2,400 |
Construction and Housing Portfolio | $1,700 | $700 |
Consumer Industries Portfolio | $1,700 | $700 |
Cyclical Industries Portfolio | $1,700 | $700 |
Defense and Aerospace Portfolio | $1,700 | $1,000 |
Developing Communications Portfolio | $1,700 | $1,900 |
Electronics Portfolio | $1,700 | $8,400 |
Energy Portfolio | $1,700 | $1,000 |
Energy Services Portfolio | $1,700 | $1,400 |
Environmental Portfolio | $1,700 | $700 |
Financial Services Portfolio | $1,700 | $1,500 |
Food and Agriculture Portfolio | $1,700 | $800 |
Gold Portfolio | $1,700 | $1,100 |
Health Care Portfolio | $1,700 | $4,400 |
Home Finance Portfolio | $1,700 | $1,200 |
Industrial Equipment Portfolio | $1,700 | $700 |
Industrial Materials Portfolio | $1,700 | $700 |
Insurance Portfolio | $1,700 | $800 |
Leisure Portfolio | $1,700 | $1,000 |
Medical Delivery Portfolio | $1,700 | $900 |
Medical Equipment and Systems Portfolio | $1,700 | $900 |
Money Market Portfolio | $1,700 | $2,100 |
Multimedia Portfolio | $1,700 | $900 |
Natural Gas Portfolio | $1,700 | $1,000 |
Natural Resources Portfolio | $1,700 | $700 |
Networking and Infrastructure Portfolio | $1,700 | $900 |
Paper and Forest Products Portfolio | $1,700 | $700 |
Pharmaceuticals Portfolio | $1,700 | $800 |
Retailing Portfolio | $1,700 | $800 |
Software and Computer Services Portfolio | $1,700 | $2,100 |
Technology Portfolio | $1,700 | $4,700 |
Telecommunications Portfolio | $1,700 | $1,500 |
Transportation Portfolio | $1,700 | $700 |
Utilities Growth Portfolio | $1,700 | $1,100 |
Wireless Portfolio | $1,700 | $800 |
A | Aggregate amounts may reflect rounding. |
B | Includes amounts related to non-audit services prior to May 6, 2003 that would have been subject to pre-approval if the SEC rules relating to the pre-approval of non-audit services had been in effect at that time. |
In each of the fiscal years ended February 29, 2004 and February 28, 2003, the aggregate Tax Fees billed by PwC that were required to be approved by the Audit Committee for professional services rendered on behalf of the Fund Service Providers for tax compliance, tax advice, and tax planning that relate directly to the operations and financial reporting of each fund is shown in the table below.
Billed By | 2004A, B | 2003A, B |
PwC | $0 | $0 |
A | Aggregate amounts may reflect rounding. |
B | Includes amounts related to non-audit services prior to May 6, 2003 that would have been subject to pre-approval if the SEC rules relating to the pre-approval of non-audit services had been in effect at that time. |
Fees included in the Tax Fees category comprise all services performed by professional staff in the independent accountant's tax division except those services related to the audit. Typically, this category would include fees for tax compliance, tax planning, and tax advice. Tax compliance, tax advice, and tax planning services include preparation of original and amended tax returns, claims for refund and tax payment-planning services, assistance with tax audits and appeals, tax advice related to mergers and acquisitions and requests for rulings or technical advice from taxing authorities.
(d) All Other Fees.
In each of the fiscal years ended February 29, 2004 and February 28, 2003, the aggregate Other Fees billed by PwC for all other non-audit services rendered to the funds is shown in the table below.
Fund | 2004A, B | 2003A, B |
Air Transportation Portfolio | $1,200 | $1,400 |
Automotive Portfolio | $1,100 | $1,300 |
Banking Portfolio | $1,500 | $1,800 |
Biotechnology Portfolio | $2,700 | $3,800 |
Brokerage Services and Investment Management Portfolio | $1,400 | $1,700 |
Business Services and Outsourcing Portfolio | $1,200 | $1,400 |
Chemicals Portfolio | $1,200 | $1,400 |
Computers Portfolio | $1,800 | $2,200 |
Construction and Housing Portfolio | $1,200 | $1,400 |
Consumer Industries Portfolio | $1,100 | $1,300 |
Cyclical Industries Portfolio | $1,100 | $1,300 |
Defense and Aerospace Portfolio | $1,400 | $1,500 |
Developing Communications Portfolio | $1,600 | $1,900 |
Electronics Portfolio | $3,800 | $5,300 |
Energy Portfolio | $1,300 | $1,500 |
Energy Services Portfolio | $1,500 | $1,800 |
Environmental Portfolio | $1,100 | $1,300 |
Financial Services Portfolio | $1,500 | $1,800 |
Food and Agriculture Portfolio | $1,200 | $1,400 |
Gold Portfolio | $1,700 | $1,700 |
Health Care Portfolio | $2,700 | $3,500 |
Home Finance Portfolio | $1,400 | $1,700 |
Industrial Equipment Portfolio | $1,200 | $1,300 |
Industrial Materials Portfolio | $1,200 | $1,300 |
Insurance Portfolio | $1,200 | $1,400 |
Leisure Portfolio | $1,300 | $1,500 |
Medical Delivery Portfolio | $1,200 | $1,400 |
Medical Equipment and Systems Portfolio | $1,400 | $1,500 |
Money Market Portfolio | $1,600 | $2,000 |
Multimedia Portfolio | $1,300 | $1,500 |
Natural Gas Portfolio | $1,300 | $1,500 |
Natural Resources Portfolio | $1,200 | $1,300 |
Networking and Infrastructure Portfolio | $1,200 | $1,400 |
Paper and Forest Products Portfolio | $1,100 | $1,300 |
Pharmaceuticals Portfolio | $1,200 | $1,400 |
Retailing Portfolio | $1,200 | $1,400 |
Software and Computer Services Portfolio | $1,800 | $2,100 |
Technology Portfolio | $2,900 | $3,500 |
Telecommunications Portfolio | $1,400 | $1,800 |
Transportation Portfolio | $1,200 | $1,400 |
Utilities Growth Portfolio | $1,300 | $1,600 |
Wireless Portfolio | $1,200 | $1,400 |
A | Aggregate amounts may reflect rounding. |
B | Includes amounts related to non-audit services prior to May 6, 2003 that would have been subject to pre-approval if the SEC rules relating to the pre-approval of non-audit services had been in effect at that time. |
In each of the fiscal years ended February 29, 2004 and February 28, 2003, the aggregate Other Fees billed by PwC that were required to be approved by the Audit Committee for all other non-audit services rendered on behalf of the Fund Service Providers that relate directly to the operations and financial reporting of each fund is shown in the table below.
Billed By | 2004A, B | 2003A, B |
PwC | $140,000 | $210,000 |
A | Aggregate amounts may reflect rounding. |
B | Includes amounts related to non-audit services prior to May 6, 2003 that would have been subject to pre-approval if the SEC rules relating to the pre-approval of non-audit services had been in effect at that time. |
Fees included in the All Other Fees category include services related to internal control reviews, strategy and other consulting, financial information systems design and implementation, consulting on other information systems, and other tax services unrelated to the fund.
(e) (1) | Audit Committee Pre-Approval Policies and Procedures: |
The trust's Audit Committee must pre-approve all audit and non-audit services provided by the independent accountant relating to the operations or financial reporting of the funds. Prior to the commencement of any audit or non-audit services to a fund, the Audit Committee reviews the services to determine whether they are appropriate and permissible under applicable law.
The trust's Audit Committee has adopted policies and procedures to, among other purposes, provide a framework for the Committee's consideration of non-audit services by the audit firms that audit the Fidelity funds. The policies and procedures require that any non-audit service provided by a fund audit firm to a Fidelity Fund and any non-audit service provided by a fund auditor to a Fund Service Provider that relates directly to the operations and financial reporting of a Fidelity fund (Covered Service) are subject to approval by the Audit Committee before such service is provided. Non-audit services provided by a fund audit firm for a Fund Service Provider that do not relate directly to the operations and financial reporting of a Fidelity fund (Non-Covered Service) but that are expected to exceed $50,000 are also subject to pre-approval by the Audit Committee.
All Covered Services, as well as Non-Covered Services that are expected to exceed $50,000, must be approved in advance of provision of the service either: (i) by formal resolution of the Audit Committee, or (ii) by oral or written approval of the service by the Chair of the Audit Committee (or if the Chair is unavailable, such other member of the Audit Committee as may be designated by the Audit Committee to act in the Chair's absence). The approval contemplated by (ii) above is permitted where the Treasurer determines that action on such an engagement is necessary before the next meeting of the Audit Committee. Neither pre-approval nor advance notice of Non-Covered Service engagements for which fees are not expected to exceed $50,000 is required; such engagements are to be reported to the Audit Committee monthly.
(e) (2) | Services approved pursuant to paragraph (c)(7)(i)(C) of Rule 2-01 of Regulation S-X: |
Audit-Related Fees:
There were no amounts, including amounts related to non-audit services prior to May 6, 2003 that would have been subject to pre-approval if the SEC rules relating to the pre-approval of non-audit services had been in effect at that time, that were approved by the Audit Committee pursuant to the de minimis exception for the fiscal years ended February 29, 2004 and February 28, 2003 on behalf of each fund.
There were no amounts, including amounts related to non-audit services prior to May 6, 2003 that would have been subject to pre-approval if the SEC rules relating to the pre-approval of non-audit services had been in effect at that time, that were required to be approved by the Audit Committee pursuant to the de minimis exception for the fiscal years ended February 29, 2004 and February 28, 2003 on behalf of the Fund Service Providers that relate directly to the operations and financial reporting of each fund.
Tax Fees:
There were no amounts, including amounts related to non-audit services prior to May 6, 2003 that would have been subject to pre-approval if the SEC rules relating to the pre-approval of non-audit services had been in effect at that time, that were approved by the Audit Committee pursuant to the de minimis exception for the fiscal years ended February 29, 2004 and February 28, 2003 on behalf of each fund.
There were no amounts, including amounts related to non-audit services prior to May 6, 2003 that would have been subject to pre-approval if the SEC rules relating to the pre-approval of non-audit services had been in effect at that time, that were required to be approved by the Audit Committee pursuant to the de minimis exception for the fiscal years ended February 29, 2004 and February 28, 2003 on behalf of the Fund Service Providers that relate directly to the operations and financial reporting of each fund.
All Other Fees:
There were no amounts, including amounts related to non-audit services prior to May 6, 2003 that would have been subject to pre-approval if the SEC rules relating to the pre-approval of non-audit services had been in effect at that time, that were approved by the Audit Committee pursuant to the de minimis exception for the fiscal years ended February 29, 2004 and February 28, 2003 on behalf of each fund.
There were no amounts, including amounts related to non-audit services prior to May 6, 2003 that would have been subject to pre-approval if the SEC rules relating to the pre-approval of non-audit services had been in effect at that time, that were required to be approved by the Audit Committee pursuant to the de minimis exception for the fiscal years ended February 29, 2004 and February 28, 2003 on behalf of the Fund Service Providers that relate directly to the operations and financial reporting of each fund.
(f) According to PwC for the fiscal year ended February 29, 2004, the percentage of hours spent on the audit of each fund's financial statements for the most recent fiscal year that were attributed to work performed by persons who are not full-time, permanent employees of PwC is as follows:
Fund | 2004 |
Air Transportation Portfolio | 0% |
Automotive Portfolio | 0% |
Banking Portfolio | 0% |
Biotechnology Portfolio | 0% |
Brokerage Services and Investment Management Portfolio | 0% |
Business Services and Outsourcing Portfolio | 0% |
Chemicals Portfolio | 0% |
Computers Portfolio | 0% |
Construction and Housing Portfolio | 0% |
Consumer Industries Portfolio | 0% |
Cyclical Industries Portfolio | 0% |
Defense and Aerospace Portfolio | 0% |
Developing Communications Portfolio | 0% |
Electronics Portfolio | 0% |
Energy Portfolio | 0% |
Energy Services Portfolio | 0% |
Environmental Portfolio | 0% |
Financial Services Portfolio | 0% |
Food and Agriculture Portfolio | 0% |
Gold Portfolio | 0% |
Health Care Portfolio | 0% |
Industrial Equipment Portfolio | 0% |
Industrial Materials Portfolio | 0% |
Insurance Portfolio | 0% |
Leisure Portfolio | 0% |
Medical Delivery Portfolio | 0% |
Medical Equipment and Systems Portfolio | 0% |
Money Market Portfolio | 0% |
Multimedia Portfolio | 0% |
Natural Gas Portfolio | 0% |
Natural Resources Portfolio | 0% |
Networking and Infrastructure Portfolio | 0% |
Paper and Forest Products Portfolio | 0% |
Pharmaceuticals Portfolio | 0% |
Retailing Portfolio | 0% |
Software and Computer Services Portfolio | 0% |
Technology Portfolio | 0% |
Telecommunications Portfolio | 0% |
Transportation Portfolio | 0% |
Utilities Growth Portfolio | 0% |
Wireless Portfolio | 0% |
(g) For the fiscal years ended February 29, 2004 and February 28, 2003, the aggregate fees billed by PwC of $1,800,000A,B and $1,800,000A,B for non-audit services rendered on behalf of the funds, FMR (not including any sub-adviser whose role is primarily portfolio management and is subcontracted with or overseen by another investment adviser) and Fund Service Providers relating to Covered Services and Non-Covered Services are shown in the table below.
| 2004A,B | 2003A,B |
Covered Services | $300,000 | $350,000 |
Non-Covered Services | $1,500,000 | $1,450,000 |
A | Aggregate amounts may reflect rounding. |
B | Includes amounts related to non-audit services prior to May 6, 2003 that would have been subject to pre-approval if the SEC rules relating to the pre-approval of non-audit services had been in effect at that time. |
(h) The trust's Audit Committee has considered Non-Covered Services that were not pre-approved that were provided by PwC to Fund Service Providers to be compatible with maintaining the independence of PwC in its audit of the funds, taking into account representations from PwC, in accordance with Independence Standards Board Standard No.1, regarding its independence from the funds and their related entities.
Item 5. Audit Committee of Listed Registrants
Not applicable.
Item 6. Schedule of Investments
Not applicable.
Item 7. Disclosure of Proxy Voting Policies and Procedures for Closed-End Management Investment Companies
Not applicable.
Item 8. Purchases of Equity Securities by Closed-End Management Investment Company and Affiliated Purchasers
Not applicable.
Item 9. Submission of Matters to a Vote of Security Holders
There were no material changes to the procedures by which shareholders may recommend nominees to the trust's Board of Trustees.
Item 10. Controls and Procedures
(a)(i) The President and Treasurer and the Chief Financial Officer have concluded that the trust's disclosure controls and procedures (as defined in Rule 30a-3(c) under the Investment Company Act) provide reasonable assurances that material information relating to the trust is made known to them by the appropriate persons, based on their evaluation of these controls and procedures as of a date within 90 days of the filing date of this report.
(a)(ii) There was no change in the trust's internal control over financial reporting (as defined in Rule 30a-3(d) under the Investment Company Act) that occurred during the trust's second fiscal half-year that has materially affected, or is reasonably likely to materially affect, the trust's internal control over financial reporting.
Item 11. Exhibits
(a) | (1) | Code of Ethics pursuant to Item 2 of Form N-CSR is filed and attached hereto as EX-99.CODE ETH. |
(a) | (2) | Certification pursuant to Rule 30a-2(a) under the Investment Company Act of 1940 (17 CFR 270.30a-2(a)) is filed and attached hereto as Exhibit 99.CERT. |
(a) | (3) | Not applicable. |
(b) | | Certification pursuant to Rule 30a-2(b) under the Investment Company Act of 1940 (17 CFR 270.30a-2(b)) is furnished and attached hereto as Exhibit 99.906CERT. |
SIGNATURES
Pursuant to the requirements of the Securities Exchange Act of 1934 and the Investment Company Act of 1940, the registrant has duly caused this report to be signed on its behalf by the undersigned, thereunto duly authorized.
Fidelity Select Portfolios
By: | /s/Christine Reynolds |
| Christine Reynolds |
| President and Treasurer |
| |
Date: | April 27, 2004 |
Pursuant to the requirements of the Securities Exchange Act of 1934 and the Investment Company Act of 1940, this report has been signed below by the following persons on behalf of the registrant and in the capacities and on the dates indicated.
By: | /s/Christine Reynolds |
| Christine Reynolds |
| President and Treasurer |
| |
Date: | April 27, 2004 |
By: | /s/Timothy F. Hayes |
| Timothy F. Hayes |
| Chief Financial Officer |
| |
Date: | April 27, 2004 |