UNITED STATES
SECURITIES AND EXCHANGE COMMISSION
Washington, D.C. 20549
FORM N-CSR
CERTIFIED SHAREHOLDER REPORT OF REGISTERED
MANAGEMENT INVESTMENT COMPANIES
Investment Company Act file number 811-3114
Fidelity Select Portfolios
(Exact name of registrant as specified in charter)
82 Devonshire St., Boston, Massachusetts 02109
(Address of principal executive offices) (Zip code)
Eric D. Roiter, Secretary
82 Devonshire St.
Boston, Massachusetts 02109
(Name and address of agent for service)
Registrant's telephone number, including area code: 617-563-7000
Date of fiscal year end: | February 28 |
| |
Date of reporting period: | February 28, 2006 |
Item 1. Reports to Stockholders
Fidelity®
Select Portfolios®
Consumer Sector
Consumer Industries
Food and Agriculture
Leisure
Multimedia
Retailing
Annual Report
February 28, 2006


| Contents | | |
| |
| Chairman’s Message | | 3 |
| Shareholder Expense Example | | 4 |
| Fund Updates* | | |
| Consumer Sector | | |
| Consumer Industries | | 5 |
| Food and Agriculture | | 17 |
| Leisure | | 27 |
| Multimedia | | 38 |
| Retailing | | 48 |
| Notes to Financial Statements | | 58 |
| Report of Independent Registered | | 63 |
| Public Accounting Firm | | |
| Trustees and Officers | | 64 |
| Distributions | | 69 |
| Board Approval of Investment | | 70 |
| Advisory Contracts and | | |
| Management Fees | | |
* Fund updates for each Select Portfolio include: Performance, Management’s Discussion of Fund Performance, Investment Changes, Investments, and Financial Statements.
To view a fund’s proxy voting guidelines and proxy voting record for the 12-month period ended June 30, visit www.fidelity.com/proxyvotingresults or visit the Securities and Exchange Commission’s (SEC) website at www.sec.gov. You may also call 1-800-544-8544 to request a free copy of the proxy voting guidelines.
Standard & Poor’s, S&P and S&P 500 are registered service marks of The McGraw-Hill Companies, Inc. and have been licensed for use by Fidelity Distributors Corporation.
Other third party marks appearing herein are the property of their respective owners.
All other marks appearing herein are registered or unregistered trademarks or service marks of FMR Corp. or an affiliated company.
This report and the financial statements contained herein are submitted for the general information of the shareholders of the funds. This report is not authorized for distribution to prospective investors in the funds unless preceded or accompanied by an effective prospectus.
A fund files its complete schedule of portfolio holdings with the SEC for the first and third quarters of each fiscal year on Form N-Q. Forms N-Q are available on the SEC’s web site at http://www.sec.gov. A fund’s Forms N-Q may be reviewed and copied at the SEC’s Public Reference Room in Washing-ton, DC. Information regarding the operation of the SEC’s Public Reference Room may be obtained by calling 1-800-SEC-0330. For a complete list of a fund’s portfolio holdings, view the most recent quarterly holdings report, semiannual report, or annual report on Fidelity’s web site at http://www.fidelity.com/holdings.
NOT FDIC INSURED · MAY LOSE VALUE · NO BANK GUARANTEE
Neither the funds nor Fidelity Distributors Corporation is a bank.
|
(Photograph of Edward C. Johnson 3d.)
Although many securities markets made gains in early 2006, there is only one certainty when it comes to investing: There is no sure thing. There are, however, a number of time-tested, fundamental investment principles that can put the historical odds in your favor.
One of the basic tenets is to invest for the long term. Over time, riding out the markets’ inevitable ups and downs has proven much more effective than selling into panic or chasing the hottest trend. Even missing only a few of the markets’ best days can significantly diminish investor returns. Patience also affords the benefits of compounding — of earning interest on additional income or reinvested dividends and capital gains. There are tax advantages and cost benefits to consider as well. The more you sell, the more taxes you pay, and the more you trade, the higher the costs. While staying the course doesn’t eliminate risk, it can considerably lessen the effect of short-term declines.
You can further manage your investing risk through diversification. And today, more than ever, geographic diversification should be taken into account. Studies indicate that asset allocation is the single most important determinant of a portfolio’s long-term success. The right mix of stocks, bonds and cash — aligned to your particular risk tolerance and investment objective — is very important. Age-appropriate rebalancing is also an essential aspect of asset allocation. For younger investors, an emphasis on equities — which historically have been the best performing asset class over time — is encouraged. As investors near their specific goal, such as retirement or sending a child to college, consideration may be given to replacing volatile assets (e.g. common stocks) with more-stable fixed investments (bonds or savings plans).
A third investment principle — investing regularly — can help lower the average cost of your purchases. Investing a certain amount of money each month or quarter helps ensure you won’t pay for all your shares at market highs. This strategy — known as dollar cost averaging — also reduces unconstructive “emotion” from investing, helping shareholders avoid selling weak performers just prior to an upswing, or chasing a hot performer just before a correction.
We invite you to contact us via the Internet, through our Investor Centers or over the phone. It is our privilege to provide you the information you need to make the investments that are right for you.

3 Annual Report
Shareholder Expense Example
|
As a shareholder of a Fund, you incur two types of costs: (1) transaction costs, including redemption fees and exchange fees, and (2) ongoing costs, including management fees and other Fund expenses. This Example is intended to help you understand your ongoing costs (in dollars) of investing in the Funds and to compare these costs with the ongoing costs of investing in other mutual funds.
The Example is based on an investment of $1,000 invested at the beginning of the period and held for the entire period (September 1, 2005 to Febru-ary 28, 2006).
The first line of the table below for each fund provides information about actual account values and actual expenses. You may use the information in this line, together with the amount you invested, to estimate the expenses that you paid over the period. Simply divide your account value by $1,000.00 (for example, an $8,600 account value divided by $1,000.00 = 8.6), then multiply the result by the number in the first line for a fund under the heading entitled “Expenses Paid During Period” to estimate the expenses you paid on your account during this period. A small balance maintenance fee of $12.00 that is charged once a year may apply for certain accounts with a value of less than $2,000. This fee is not included in the table below. If it was, the estimate of expenses you paid during the period would be higher, and your ending account value lower, by this amount.
Hypothetical Example for Comparison Purposes
|
The second line of the table below for each fund provides information about hypothetical account values and hypothetical expenses based on a fund’s actual expense ratio and an assumed rate of return of 5% per year before expenses, which is not the Fund’s actual return. The hypothetical account values and expenses may not be used to estimate the actual ending account balance or expenses you paid for the period. You may use this information to compare the ongoing costs of investing in the Fund and other funds. To do so, compare this 5% hypothetical example with the 5% hypothetical examples that appear in the shareholder reports of the other funds. A small balance maintenance fee of $12.00 that is charged once a year may apply for certain accounts with a value of less than $2,000. This fee is not included in the table below. If it was, the estimate of expenses you paid during the period would be higher, and your ending account value lower, by this amount.
Please note that the expenses shown in the table are meant to highlight your ongoing costs only and do not reflect any transaction costs. Therefore, the second line of the table is useful in comparing ongoing costs only, and will not help you determine the relative total costs of owning different funds. In addition, if these transactional costs were included, your costs would have been higher.
| | | | | | | | | | |
Expenses Paid |
| | | Beginning | | Ending | | During Period* |
| | | Account Value | | Account Value | | September 1, 2005 to |
| | | September 1, 2005 | | February 28, 2006 | | February 28, 2006 |
| Consumer Industries Portfolio | | | | | | | | | | | | |
| Actual | | $ | | 1,000.00 | | $ | | 1,060.00 | | $ | | 5.77 |
| HypotheticalA | | $ | | 1,000.00 | | $ | | 1,019.19 | | $ | | 5.66 |
| Food and Agriculture Portfolio | | | | | | | | | | | | |
| Actual | | $ | | 1,000.00 | | $ | | 1,056.80 | | $ | | 5.15 |
| HypotheticalA | | $ | | 1,000.00 | | $ | | 1,019.79 | | $ | | 5.06 |
| Leisure Portfolio | | | | | | | | | | | | |
| Actual | | $ | | 1,000.00 | | $ | | 1,104.00 | | $ | | 5.06 |
| HypotheticalA | | $ | | 1,000.00 | | $ | | 1,019.98 | | $ | | 4.86 |
| Multimedia Portfolio | | | | | | | | | | | | |
| Actual | | $ | | 1,000.00 | | $ | | 1,060.30 | | $ | | 5.36 |
| HypotheticalA | | $ | | 1,000.00 | | $ | | 1,019.59 | | $ | | 5.26 |
| Retailing Portfolio | | | | | | | | | | | | |
| Actual | | $ | | 1,000.00 | | $ | | 1,061.60 | | $ | | 5.37 |
| HypotheticalA | | $ | | 1,000.00 | | $ | | 1,019.59 | | $ | | 5.26 |
A 5% return per year before expenses
* Expenses are equal to each Fund’s annualized expense ratio (shown in the table below); multiplied by the average account value over the period, multiplied by 181/365 (to reflect the one-half year period).
| | | Annualized |
| | | Expense Ratio |
| Consumer Industries Portfolio | | 1.13% |
| Food and Agriculture Portfolio | | 1.01% |
| Leisure Portfolio | | 97% |
| Multimedia Portfolio | | 1.05% |
| Retailing Portfolio | | 1.05% |
Consumer Industries Portfolio
Performance
|
Average annual total return reflects the change in the value of an investment, assuming reinvestment of the fund’s dividend income and capital gains (the profits earned upon the sale of securities that have grown in value) and assuming a constant rate of performance each year. The $10,000 table and the fund’s returns do not reflect the deduction of taxes that a shareholder would pay on fund distributions or the redemption of fund shares. During periods of reimbursement by Fidelity a fund’s total returns will be greater than it would be had the reimbursement not occurred. How a fund did yesterday is no guarantee of how it will do tomorrow.
| Average Annual Total Returns | | | | | | |
| Periods ended February 28, 2006 | | Past 1 | | Past 5 | | Past 10 |
| | | year | | years | | years |
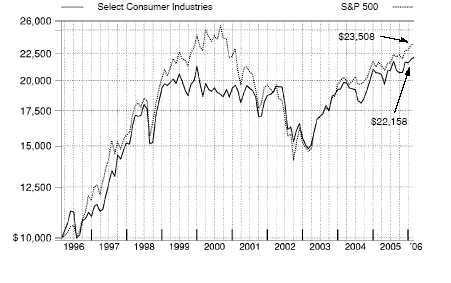
| Select Consumer Industries | | 7.31% | | 2.95% | | 8.28% |
| |
| $10,000 Over 10 Years | | | | | | |
Let’s say hypothetically that $10,000 was invested in Fidelity® Select Consumer Industries Portfolio on February 29, 1996. The chart shows how the value of your investment would have changed, and also shows how the S&P 500® Index performed over the same period.
5 Annual Report
Consumer Industries Portfolio
|
Management’s Discussion of Fund Performance
Comments from John Roth, Portfolio Manager of Fidelity® Select Consumer Industries Portfolio
With the exception of several popular large-cap stock performance measures, most major U.S. equity benchmarks had double-digit returns for the year ending February 28, 2006. For much of the period, market gains were driven largely by the energy sector, although utilities ultimately sneaked into the top spot for the year overall. Financials and telecommunication services also reached double figures, outperforming the 8.40% return of the broader market as measured by the large-cap-oriented Standard & Poor’s 500SM Index. The consumer discretionary segment — home to the weak performing automobile and media industries — was the biggest disappointment. Although the overall return for the S&P 500® beat the small-cap Russell 2000® Index in calendar year 2005 — the first time that’s happened in six years — small-caps stormed back in early 2006, leading to a 16.59% advance during the past 12 months, nearly twice the broader market’s gain. Mid-caps soared even higher, returning 17.67% according to the Russell Midcap® Index. The technology-heavy NASDAQ Composite® Index also fared well, climbing 12.13%, but the Dow Jones Industrial AverageSM, an index of 30 large-cap, blue-chip stocks, managed to rise only 4.52% .
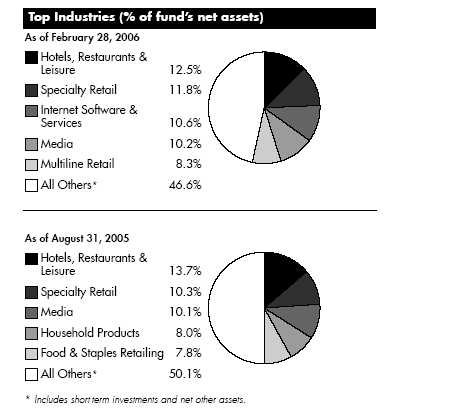
For the 12-month period ending February 28, 2006, the fund returned 7.31%, outperforming the 3.31% return of the Goldman Sachs® Consumer Industries Index but lagging the S&P 500. Advertisers continued to shift spending out of traditional media such as radio, television and print, and into online media such as paid search and branded advertising. The fund benefited from that trend relative to the sector index by avoiding several traditional media firms, including Comcast and Liberty Media, while holding a sizable out-of-benchmark position in Internet firm Google, whose stock soared. Performance also was helped by positions in Evergreen Solar, maker of a key component of solar cells, and Chinese online travel firm Ctrip.com International. Conversely, I avoided tobacco and food conglomerate Altria, a large component of the Goldman Sachs index, because of the firm’s tobacco-related legal problems and concerns about its growth. That decision hurt relative results, as favorable court decisions gave Altria’s stock a strong boost. The fund’s positions in adult education firm Apollo Group, cosmetics retailer Avon Products and Brunswick, a maker of powerboats, hurt relative performance as well.
The views expressed above reflect those of the portfolio manager(s) only through the end of the period as stated on the cover of this report and do not necessarily represent the views of Fidelity or any other person in the Fidelity organization. Any such views are subject to change at any time based upon market or other conditions and Fidelity disclaims any responsibility to update such views. These views may not be relied on as investment advice and, because investment decisions for a Fidelity fund are based on numerous factors, may not be relied on as an indication of trading intent on behalf of any Fidelity fund.
Consumer Industries Portfolio
Investment Changes
| Top Ten Stocks as of February 28, 2006 |
| | | % of fund’s | | % of fund’s net assets |
| | | net assets | | 6 months ago |
| Procter & Gamble Co. | | 6.7 | | 6.1 |
| Google, Inc. Class A (sub. vtg.) | | 5.0 | | 4.3 |
| PepsiCo, Inc. | | 3.7 | | 1.5 |
| Target Corp. | | 3.1 | | 3.0 |
| Wal-Mart Stores, Inc. | | 2.7 | | 3.3 |
| The Coca-Cola Co. | | 2.3 | | 3.3 |
| Walt Disney Co. | | 2.3 | | 1.9 |
| eBay, Inc. | | 2.1 | | 2.9 |
| Lowe’s Companies, Inc. | | 2.1 | | 1.9 |
| Nestle SA sponsored ADR | | 2.1 | | 1.0 |
| | | 32.1 | | |
7 Annual Report
| Consumer Industries Portfolio | | | | | | | | |
| Investments February 28, 2006 | | | | |
| Showing Percentage of Net Assets | | | | | | | | |
| |
| Common Stocks — 97.9% | | | | | | | | |
| | | | | | | Shares | | Value (Note 1) |
| |
| AUTOMOBILES – 0.8% | | | | | | | | |
| Motorcycle Manufacturers – 0.8% | | | | | | | | |
| Harley-Davidson, Inc. | | | | | | 7,600 | | $ 399,076 |
| BEVERAGES – 7.7% | | | | | | | | |
| Brewers – 0.5% | | | | | | | | |
| SABMiller PLC | | | | | | 12,400 | | 246,662 |
| Distillers & Vintners – 0.5% | | | | | | | | |
| Diageo PLC sponsored ADR | | | | | | 4,100 | | 252,970 |
| Soft Drinks – 6.7% | | | | | | | | |
| Coca-Cola Enterprises, Inc. | | | | | | 17,600 | | 345,840 |
| PepsiCo, Inc. | | | | | | 31,200 | | 1,844,232 |
| The Coca-Cola Co. | | | | | | 27,700 | | 1,162,569 |
| | | | | | | | | 3,352,641 |
| |
| TOTAL BEVERAGES | | | | | | | | 3,852,273 |
| |
| COMMERCIAL SERVICES & SUPPLIES – 1.3% | | | | | | | | |
| Human Resource & Employment Services – 1.3% | | | | | | | | |
| Monster Worldwide, Inc. (a) | | | | | | 8,100 | | 396,576 |
| Robert Half International, Inc. | | | | | | 6,700 | | 240,664 |
| | | | | | | | | 637,240 |
| |
| DISTRIBUTORS – 0.5% | | | | | | | | |
| Distributors – 0.5% | | | | | | | | |
| Li & Fung Ltd. | | | | | | 122,000 | | 247,683 |
| DIVERSIFIED CONSUMER SERVICES – 1.8% | | | | | | | | |
| Education Services – 1.1% | | | | | | | | |
| Apollo Group, Inc. Class A (a) | | | | | | 10,700 | | 528,366 |
| Specialized Consumer Services – 0.7% | | | | | | | | |
| Steiner Leisure Ltd. (a) | | | | | | 3,500 | | 149,205 |
| Weight Watchers International, Inc. (a) | | | | | | 4,300 | | 225,621 |
| | | | | | | | | 374,826 |
| |
| TOTAL DIVERSIFIED CONSUMER SERVICES | | | | | | | | 903,192 |
| |
| ELECTRICAL EQUIPMENT – 0.7% | | | | | | | | |
| Electrical Components & Equipment – 0.7% | | | | | | | | |
| Evergreen Solar, Inc. (a) | | | | | | 21,400 | | 333,626 |
| FOOD & STAPLES RETAILING – 7.6% | | | | | | | | |
| Drug Retail – 3.0% | | | | | | | | |
| CVS Corp. | | | | | | 20,000 | | 566,600 |
| Walgreen Co. | | | | | | 20,500 | | 919,630 |
| | | | | | | | | 1,486,230 |
| Food Retail – 0.7% | | | | | | | | |
| Whole Foods Market, Inc. | | | | | | 5,000 | | 319,400 |
See accompanying notes which are an integral part of the financial statements.
Annual Report 8
| | | Shares | | Value (Note 1) |
| Hypermarkets & Super Centers – 3.9% | | | | |
| Costco Wholesale Corp. | | 11,700 | | $ 599,976 |
| Wal-Mart Stores, Inc. | | 29,900 | | 1,356,264 |
| | | | | 1,956,240 |
| |
| TOTAL FOOD & STAPLES RETAILING | | | | 3,761,870 |
| |
| FOOD PRODUCTS – 3.9% | | | | |
| Packaged Foods & Meats – 3.9% | | | | |
| Diamond Foods, Inc. | | 6,900 | | 142,140 |
| Flowers Foods, Inc. | | 3,600 | | 99,000 |
| Green Mountain Coffee Roasters, Inc. (a) | | 2,600 | | 106,626 |
| Lindt & Spruengli AG (participation certificate) | | 290 | | 552,834 |
| Nestle SA sponsored ADR | | 13,800 | | 1,017,060 |
| | | | | 1,917,660 |
| |
| HOTELS, RESTAURANTS & LEISURE – 12.5% | | | | |
| Casinos & Gaming – 2.0% | | | | |
| Aristocrat Leisure Ltd. | | 21,800 | | 195,034 |
| International Game Technology | | 7,000 | | 250,390 |
| MGM MIRAGE (a) | | 9,800 | | 362,306 |
| Station Casinos, Inc. | | 1,600 | | 109,520 |
| WMS Industries, Inc. (a) | | 2,800 | | 81,340 |
| | | | | 998,590 |
| Hotels, Resorts & Cruise Lines – 5.5% | | | | |
| Carnival Corp. unit | | 15,200 | | 785,080 |
| Ctrip.com International Ltd. sponsored ADR | | 4,000 | | 310,200 |
| eLong, Inc. sponsored ADR (a) | | 24,800 | | 315,704 |
| Kerzner International Ltd. (a) | | 4,600 | | 309,534 |
| Royal Caribbean Cruises Ltd. | | 10,100 | | 445,006 |
| Starwood Hotels & Resorts Worldwide, Inc. unit | | 9,000 | | 571,500 |
| | | | | 2,737,024 |
| Leisure Facilities – 0.1% | | | | |
| International Speedway Corp. Class A | | 1,400 | | 66,304 |
| Restaurants – 4.9% | | | | |
| Buffalo Wild Wings, Inc. (a) | | 20,654 | | 783,406 |
| CBRL Group, Inc. | | 3,200 | | 142,176 |
| Domino’s Pizza, Inc. | | 7,250 | | 184,875 |
| McDonald’s Corp. | | 10,200 | | 356,082 |
| Outback Steakhouse, Inc. | | 13,100 | | 547,711 |
| Starbucks Corp. (a) | | 11,100 | | 403,152 |
| | | | | 2,417,402 |
| |
| TOTAL HOTELS, RESTAURANTS & LEISURE | | | | 6,219,320 |
| |
| HOUSEHOLD PRODUCTS – 7.7% | | | | |
| Household Products – 7.7% | | | | |
| Colgate-Palmolive Co. | | 9,400 | | 512,112 |
| Procter & Gamble Co. | | 55,300 | | 3,314,128 |
| | | | | 3,826,240 |
See accompanying notes which are an integral part of the financial statements.
|
9
| Consumer Industries Portfolio | | | | |
| Investments - continued | | | | |
| |
| |
| Common Stocks – continued | | | | |
| | | Shares | | Value (Note 1) |
| |
| INTERNET & CATALOG RETAIL – 1.2% | | | | |
| Catalog Retail – 0.6% | | | | |
| Coldwater Creek, Inc. (a) | | 13,500 | | $ 303,345 |
| Internet Retail – 0.6% | | | | |
| Priceline.com, Inc. (a) | | 12,200 | | 299,510 |
| |
| TOTAL INTERNET & CATALOG RETAIL | | | | 602,855 |
| |
| INTERNET SOFTWARE & SERVICES – 10.6% | | | | |
| Internet Software & Services – 10.6% | | | | |
| Digitas, Inc. (a) | | 10,900 | | 154,017 |
| eBay, Inc. (a) | | 26,200 | | 1,049,572 |
| Google, Inc. Class A (sub. vtg.) (a) | | 6,854 | | 2,485,397 |
| Homestore, Inc. (a) | | 32,162 | | 200,048 |
| iVillage, Inc. (a) | | 19,300 | | 157,295 |
| Sina Corp. (a) | | 5,300 | | 118,561 |
| Sohu.com, Inc. (a) | | 5,600 | | 117,768 |
| Yahoo!, Inc. (a) | | 30,296 | | 971,290 |
| | | | | 5,253,948 |
| |
| LEISURE EQUIPMENT & PRODUCTS – 3.3% | | | | |
| Leisure Products – 3.3% | | | | |
| Brunswick Corp. | | 10,700 | | 419,761 |
| K2, Inc. (a) | | 8,500 | | 96,900 |
| MarineMax, Inc. (a) | | 16,400 | | 506,104 |
| RC2 Corp. (a) | | 2,400 | | 86,472 |
| SCP Pool Corp. | | 11,700 | | 508,599 |
| | | | | 1,617,836 |
| |
| MEDIA – 10.2% | | | | |
| Advertising – 1.8% | | | | |
| Harte-Hanks, Inc. | | 6,000 | | 168,060 |
| Interpublic Group of Companies, Inc. (a) | | 24,956 | | 258,544 |
| Omnicom Group, Inc. | | 6,100 | | 486,902 |
| | | | | 913,506 |
| Broadcasting & Cable TV – 0.5% | | | | |
| Liberty Global, Inc. Class A | | 12,200 | | 247,782 |
| Movies & Entertainment – 5.2% | | | | |
| Carmike Cinemas, Inc. | | 5,200 | | 123,864 |
| News Corp. Class A | | 43,600 | | 709,808 |
| Viacom, Inc. Class B (non-vtg.) (a) | | 14,200 | | 567,432 |
| The Walt Disney Co. | | 41,300 | | 1,155,987 |
| | | | | 2,557,091 |
| Publishing – 2.7% | | | | |
| Dow Jones & Co., Inc. | | 3,300 | | 134,145 |
| Gannett Co., Inc. | | 6,000 | | 372,960 |
| McGraw-Hill Companies, Inc. | | 10,600 | | 562,754 |
| Media General, Inc. Class A | | 2,900 | | 145,290 |
| Reuters Group PLC sponsored ADR | | 3,300 | | 131,769 |
| | | | | 1,346,918 |
| |
| TOTAL MEDIA | | | | 5,065,297 |
See accompanying notes which are an integral part of the financial statements.
Annual Report 10
| | | Shares | | Value (Note |
| |
| MULTILINE RETAIL – 8.3% | | | | |
| Department Stores – 4.8% | | | | |
| Federated Department Stores, Inc. | | 8,300 | | $ 589,632 |
| JCPenney Co., Inc. | | 6,400 | | 375,296 |
| KarstadtQuelle AG (a)(d) | | 14,000 | | 342,800 |
| Nordstrom, Inc. | | 7,800 | | 296,400 |
| Saks, Inc. | | 8,400 | | 158,760 |
| Sears Holdings Corp. (a) | | 5,000 | | 602,250 |
| | | | | 2,365,138 |
| General Merchandise Stores – 3.5% | | | | |
| Family Dollar Stores, Inc. | | 7,500 | | 192,900 |
| Target Corp. | | 28,500 | | 1,550,400 |
| | | | | 1,743,300 |
| |
| TOTAL MULTILINE RETAIL | | | | 4,108,438 |
| |
| PERSONAL PRODUCTS – 1.3% | | | | |
| Personal Products – 1.3% | | | | |
| Avon Products, Inc. | | 19,200 | | 553,920 |
| Herbalife Ltd. (a) | | 2,800 | | 86,772 |
| | | | | 640,692 |
| |
| REAL ESTATE – 0.4% | | | | |
| Real Estate Investment Trusts – 0.4% | | | | |
| MeriStar Hospitality Corp. (a) | | 21,400 | | 220,634 |
| SOFTWARE – 0.6% | | | | |
| Home Entertainment Software – 0.6% | | | | |
| Activision, Inc. (a) | | 11,433 | | 142,913 |
| Electronic Arts, Inc. (a) | | 3,400 | | 176,698 |
| | | | | 319,611 |
| |
| SPECIALTY RETAIL – 11.8% | | | | |
| Apparel Retail – 3.7% | | | | |
| Aeropostale, Inc. (a) | | 7,000 | | 200,830 |
| American Eagle Outfitters, Inc. | | 5,600 | | 142,464 |
| Charlotte Russe Holding, Inc. (a) | | 5,700 | | 103,740 |
| Chico’s FAS, Inc. (a) | | 10,100 | | 475,205 |
| Esprit Holdings Ltd. | | 18,100 | | 139,170 |
| Foot Locker, Inc. | | 9,600 | | 221,856 |
| Gymboree Corp. (a) | | 7,100 | | 162,306 |
| Hot Topic, Inc. (a) | | 5,150 | | 67,877 |
| Urban Outfitters, Inc. (a) | | 12,300 | | 345,630 |
| | | | | 1,859,078 |
| Automotive Retail – 0.5% | | | | |
| AutoZone, Inc. (a) | | 2,500 | | 241,700 |
| Computer & Electronics Retail – 2.1% | | | | |
| Best Buy Co., Inc. | | 16,050 | | 864,453 |
| Gamestop Corp. Class B (a) | | 5,400 | | 197,154 |
| | | | | 1,061,607 |
| Home Improvement Retail – 2.1% | | | | |
| Lowe’s Companies, Inc. (d) | | 15,000 | | 1,022,700 |
| |
| |
| See accompanying notes which are an integral part of the financial statements. | | | | |
11 Annual Report
| Consumer Industries Portfolio | | | | |
| Investments - continued | | | | |
| |
| |
| Common Stocks – continued | | | | |
| | | Shares | | Value (Note 1) |
| |
| SPECIALTY RETAIL – CONTINUED | | | | |
| Specialty Stores – 3.4% | | | | |
| Guitar Center, Inc. (a) | | 4,400 | | $ 227,744 |
| Office Depot, Inc. (a) | | 13,500 | | 481,680 |
| OfficeMax, Inc. | | 3,400 | | 99,722 |
| PETsMART, Inc. | | 3,900 | | 101,244 |
| Sports Authority, Inc. (a) | | 962 | | 35,200 |
| Staples, Inc. | | 23,450 | | 575,463 |
| Tractor Supply Co. (a) | | 2,300 | | 145,314 |
| | | | | 1,666,367 |
| |
| TOTAL SPECIALTY RETAIL | | | | 5,851,452 |
| |
| TEXTILES, APPAREL & LUXURY GOODS – 5.7% | | | | |
| Apparel, Accessories & Luxury Goods – 4.0% | | | | |
| Carter’s, Inc. (a) | | 9,500 | | 607,905 |
| Coach, Inc. (a) | | 9,300 | | 332,196 |
| Kenneth Cole Productions, Inc. Class A (sub. vtg.) | | 2,800 | | 77,028 |
| Liz Claiborne, Inc. | | 9,200 | | 331,476 |
| Polo Ralph Lauren Corp. Class A | | 6,600 | | 382,536 |
| Ports Design Ltd. | | 109,000 | | 140,502 |
| Quiksilver, Inc. (a) | | 8,500 | | 123,250 |
| | | | | 1,994,893 |
| Footwear – 1.7% | | | | |
| Deckers Outdoor Corp. (a)(d) | | 4,300 | | 145,770 |
| NIKE, Inc. Class B | | 8,100 | | 702,918 |
| | | | | 848,688 |
| |
| TOTAL TEXTILES, APPAREL & LUXURY GOODS | | | | 2,843,581 |
| |
| TOTAL COMMON STOCKS | | | | |
| (Cost $42,185,808) | | | | 48,622,524 |
| |
| Money Market Funds — 5.0% | | | | |
| | | Shares | | Value (Note 1) |
| Fidelity Cash Central Fund, 4.57% (b) | | 1,140,985 $ | | 1,140,985 |
| Fidelity Securities Lending Cash Central Fund, 4.58% (b)(c) | | 1,346,000 | | 1,346,000 |
| TOTAL MONEY MARKET FUNDS | | | | |
| (Cost $2,486,985) | | | | 2,486,985 |
| |
| TOTAL INVESTMENT PORTFOLIO - 102.9% | | | | |
| (Cost $44,672,793) | | | | 51,109,509 |
| |
| NET OTHER ASSETS – (2.9)% | | | | (1,427,482) |
| NET ASSETS – 100% | | $ | | 49,682,027 |
(a) Non-income producing
(b) Affiliated fund that is available only to investment companies and other accounts managed by Fidelity Investments. The rate quoted is the annualized seven-day yield of the fund at period end. A complete unaudited listing of the fund’s holdings as of its most recent quarter end is available upon request.
(c) Investment made with cash collateral received from securities on loan. (d) Security or a portion of the security is on loan at period end.
See accompanying notes which are an integral part of the financial statements.
Annual Report 12
| Affiliated Central Funds | | | | |
| Information regarding fiscal year to date income earned by the fund from the affiliated Central funds is as follows: | | | | |
| |
| Fund | | Income earned |
| Fidelity Cash Central Fund | | $ | | 37,484 |
| Fidelity Securities Lending Cash Central Fund | | | | 7,629 |
| Total | | $ | | 45,113 |
Distribution of investments by country of issue, as a percentage of total net assets, is as follows:
| United States of America | | 88.2% |
| Switzerland | | 3.2% |
| Panama | | 1.6% |
| Cayman Islands | | 1.4% |
| United Kingdom | | 1.3% |
| Others (individually less than 1%) | | 4.3% |
| | | 100.0% |
See accompanying notes which are an integral part of the financial statements.
|
13 Annual Report
13
| Consumer Industries Portfolio | | | | | | |
| |
| Financial Statements | | | | | | |
| |
| |
| Statement of Assets and Liabilities | | | | | | |
| | | | | | | February 28, 2006 |
| |
| Assets | | | | | | |
| Investment in securities, at value (including securities loaned of $1,267,310) — See accompanying schedule: | | | | | | |
| Unaffiliated issuers (cost $42,185,808) | | $ | | 48,622,524 | | |
| Affiliated Central Funds (cost $2,486,985) | | | | 2,486,985 | | |
| Total Investments (cost $44,672,793) | | | | $ | | 51,109,509 |
| Receivable for investments sold | | | | | | 7,912 |
| Receivable for fund shares sold | | | | | | 93,832 |
| Dividends receivable | | | | | | 24,983 |
| Interest receivable | | | | | | 2,968 |
| Prepaid expenses | | | | | | 168 |
| Other affiliated receivables | | | | | | 4 |
| Other receivables | | | | | | 2,864 |
| Total assets | | | | | | 51,242,240 |
| |
| Liabilities | | | | | | |
| Payable for fund shares redeemed | | $ | | 147,720 | | |
| Accrued management fee | | | | 23,306 | | |
| Other affiliated payables | | | | 15,446 | | |
| Other payables and accrued expenses | | | | 27,741 | | |
| Collateral on securities loaned, at value | | | | 1,346,000 | | |
| Total liabilities | | | | | | 1,560,213 |
| |
| Net Assets | | | | $ | | 49,682,027 |
| Net Assets consist of: | | | | | | |
| Paid in capital | | | | $ | | 41,989,850 |
| Accumulated net investment loss | | | | | | (14) |
| Accumulated undistributed net realized gain (loss) on investments and foreign currency transactions | | | | | | 1,255,475 |
| Net unrealized appreciation (depreciation) on investments | | | | | | 6,436,716 |
| Net Assets, for 1,930,124 shares outstanding | | | | $ | | 49,682,027 |
| Net Asset Value, offering price and redemption price per share ($49,682,027 ÷ 1,930,124 shares) | | | | $ | | 25.74 |
| |
| Statement of Operations | | | | | | |
| | | | | | | Year ended February 28, 2006 |
| |
| Investment Income | | | | | | |
| Dividends | | | | $ | | 392,834 |
| Interest | | | | | | 51 |
| Income from affiliated Central Funds (including $7,629 from security lending) | | | | | | 45,113 |
| Total income | | | | | | 437,998 |
| |
| Expenses | | | | | | |
| Management fee | | $ | | 244,492 | | |
| Transfer agent fees | | | | 158,780 | | |
| Accounting and security lending fees | | | | | | |
| | | | | 21,549 | | |
| Independent trustees’ compensation | | | | 182 | | |
| Custodian fees and expenses | | | | 15,775 | | |
| Registration fees | | | | 15,898 | | |
| Audit | | | | 33,517 | | |
| Legal | | | | 340 | | |
| Miscellaneous | | | | 1,446 | | |
| Total expenses before reductions | | | | 491,979 | | |
| Expense reductions | | | | (8,784) | | 483,195 |
| |
| Net investment income (loss) | | | | | | (45,197) |
| Realized and Unrealized Gain (Loss) | | | | | | |
| Net realized gain (loss) on: | | | | | | |
| Investment securities: | | | | | | |
See accompanying notes which are an integral part of the financial statements.
Annual Report 14
| Unaffiliated issuers | | 1,978,609 | | | | |
| Foreign currency transactions | | 1,499 | | | | |
| Total net realized gain (loss) | | | | | | 1,980,108 |
| Change in net unrealized appreciation (depreciation) on investment securities | | | | | | 1,133,559 |
| Net gain (loss) | | | | | | 3,113,667 |
| Net increase (decrease) in net assets resulting from operations | | | | $ | | 3,068,470 |
See accompanying notes which are an integral part of the financial statements.
|
15 Annual Report
| Consumer Industries Portfolio | | | | | | | | | | | | | | | | | | |
| Financial Statements - continued | | | | | | | | | | | | | | | | | | |
| |
| |
| Statement of Changes in Net Assets | | | | | | | | | | | | | | | | | | |
| | | | | | | | | | | Year ended | | Year ended |
| | | | | | | | | | | February 28, | | February 28, |
| | | | | | | | | | | 2006 | | 2005 |
| Increase (Decrease) in Net Assets | | | | | | | | | | | | | | | | | | |
| Operations | | | | | | | | | | | | | | | | | | |
| Net investment income (loss) | | | | | | | | | | $ | | (45,197) | $ | | | (114,300) |
| Net realized gain (loss) | | | | | | | | | | | | 1,980,108 | | | | 28,900 |
| Change in net unrealized appreciation (depreciation) | | | | | | | | | | | | 1,133,559 | | | | 1,505,127 |
| Net increase (decrease) in net assets resulting from operations | | | | | | | | | | | | 3,068,470 | | | | 1,419,727 |
| Distributions to shareholders from net realized gain | | | | | | | | | | | | (484,881) | | (1,510,535) |
| Share transactions | | | | | | | | | | | | | | | | | | |
| Proceeds from sales of shares | | | | | | | | | | | | 26,870,735 | | 23,571,117 |
| Reinvestment of distributions | | | | | | | | | | | | 473,921 | | | | 1,475,744 |
| Cost of shares redeemed | | | | | | | | | | | | (20,002,209) | | (20,792,957) |
| Net increase (decrease) in net assets resulting from share transactions | | | | | | | | | | 7,342,447 | | | | 4,253,904 |
| Redemption fees | | | | | | | | | | | | | | 8,138 | | | | 11,308 |
| Total increase (decrease) in net assets | | | | | | | | | | | | 9,934,174 | | | | 4,174,404 |
| |
| Net Assets | | | | | | | | | | | | | | | | | | |
| Beginning of period | | | | | | | | | | | | 39,747,853 | | 35,573,449 |
| End of period (including accumulated net investment loss of $14 and accumulated net investment loss of $21, | | | | | | | | | | |
| respectively) | | | | | | | | | | $ | | 49,682,027 | $ | 39,747,853 |
| |
| Other Information | | | | | | | | | | | | | | | | | | |
| Shares | | | | | | | | | | | | | | | | | | |
| Sold | | | | | | | | | | | | 1,077,885 | | | | 1,007,148 |
| Issued in reinvestment of distributions | | | | | | | | | | | | | | 18,542 | | | | 62,267 |
| Redeemed | | | | | | | | | | | | (806,579) | | | | (898,454) |
| Net increase (decrease) | | | | | | | | | | | | 289,848 | | | | 170,961 |
| |
| Financial Highlights | | | | | | | | | | | | | | | | | | |
| Years ended February 28, | | | | 2006 | | | | 2005 | | 2004E | | | | 2003 | | | | 2002 |
| Selected Per-Share Data | | | | | | | | | | | | | | | | | | |
| Net asset value, beginning of period | | $ | | 24.23 | | $ | | 24.21 | | $ 18.39 | | $ | | 23.58 | | $ | | 25.31 |
| Income from Investment Operations | | | | | | | | | | | | | | | | | | |
| Net investment income (loss)C | | | | (.03) | | | | (.07) | | (.09) | | | | (.18) | | | | (.07) |
| Net realized and unrealized gain (loss) | | | | 1.80 | | | | 1.05 | | 6.28 | | | | (5.02) | | | | (.25) |
| Total from investment operations | | | | 1.77 | | | | .98 | | 6.19 | | | | (5.20) | | | | (.32) |
| Distributions from net realized gain | | | | (.26) | | | | (.97) | | (.38) | | | | — | | | | (1.42) |
| Redemption fees added to paid in capitalC | | | | —F | | | | .01 | | .01 | | | | .01 | | | | .01 |
| Net asset value, end of period | | $ | | 25.74 | | $ | | 24.23 | | $ 24.21 | | $ | | 18.39 | | $ | | 23.58 |
| Total ReturnA,B | | | | 7.31% | | | | 4.18% | | 33.82% | | | | (22.01)% | | | | (.87)% |
| Ratios to Average Net AssetsD | | | | | | | | | | | | | | | | | | |
| Expenses before reductions | | | | 1.15% | | | | 1.23% | | 1.59% | | | | 1.86% | | | | 1.71% |
| Expenses net of fee waivers, if any | | | | 1.15% | | | | 1.22% | | 1.59% | | | | 1.86% | | | | 1.71% |
| Expenses net of all reductions | | | | 1.13% | | | | 1.19% | | 1.54% | | | | 1.83% | | | | 1.69% |
| Net investment income (loss) | | | | (.11)% | | | | (.31)% | | (.39)% | | | | (.84)% | | | | (.30)% |
| Supplemental Data | | | | | | | | | | | | | | | | | | |
| Net assets, end of period (000 omitted) | | $ | | 49,682 | | $ | | 39,748 | | $ 35,573 | | $ | | 20,693 | | $ | | 23,471 |
| Portfolio turnover rate | | | | 71% | | | | 112% | | 138% | | | | 116% | | | | 110% |
| |
| | | | | |
A Total returns would have been lower had certain expenses not been reduced during the periods shown. B Total returns do not include the effect of the former sales charges. C Calculated based on average shares outstanding during the period. DExpense ratios reflect operating expenses of the fund. Expenses before reductions do not reflect amounts reimbursed by the investment adviser or reductions from brokerage service arrangements or other expense offset arrangements and do not represent the amount paid by the fund during periods when reimbursements or reductions occur. Expenses net of fee waivers reflect expenses after reimbursement by the investment adviser but prior to reductions from brokerage service arrangements or other expense offset arrangements. Expenses net of all reductions represent the net expenses paid by the fund. EFor the year ended February 29. FAmount represents less than $.01 per share.
See accompanying notes which are an integral part of the financial statements.
Annual Report 16
Food and Agriculture Portfolio
Performance
|
Average annual total return reflects the change in the value of an investment, assuming reinvestment of the fund’s dividend income and capital gains (the profits earned upon the sale of securities that have grown in value) and assuming a constant rate of performance each year. The $10,000 table and the fund’s returns do not reflect the deduction of taxes that a shareholder would pay on fund distributions or the redemption of fund shares. During periods of reimbursement by Fidelity a fund’s total returns will be greater than it would be had the reimbursement not occurred. How a fund did yesterday is no guarantee of how it will do tomorrow.
| Average Annual Total Returns | | | | | | |
| Periods ended February 28, 2006 | | Past 1 | | Past 5 | | Past 10 |
| | | year | | years | | years |
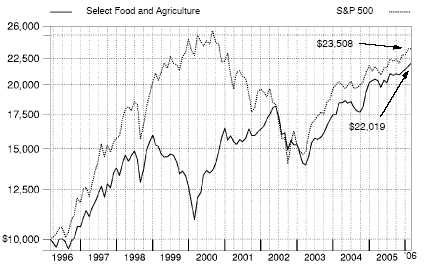
| Select Food and Agriculture | | 7.50% | | 6.75% | | 8.21% |
10,000 Over 10 Years
Let’s say hypothetically that $10,000 was invested in Fidelity Select Food and Agriculture Portfolio on February 29, 1996. The chart shows the value of your investment would have changed, and also shows how the S&P 500 Index performed over the same period.
17 Annual Report
Food and Agriculture Portfolio
|
Management’s Discussion of Fund Performance
Comments from Robert Lee, Portfolio Manager of Fidelity® Select Food and Agriculture Portfolio
With the exception of several popular large-cap stock performance measures, most major U.S. equity benchmarks had double-digit returns for the year ending February 28, 2006. For much of the period, market gains were driven largely by the energy sector, although utilities ultimately sneaked into the top spot for the year overall. Financials and telecommunication services also reached double figures, outperforming the 8.40% return of the broader market as measured by the large-cap-oriented Standard & Poor’s 500SM Index. The consumer discretionary segment — home to the weak performing automobile and media industries — was the biggest disappointment. Although the overall return for the S&P 500® beat the small-cap Russell 2000® Index in calendar year 2005 — the first time that’s happened in six years — small-caps stormed back in early 2006, leading to a 16.59% advance during the past 12 months, nearly twice the broader market’s gain. Mid-caps soared even higher, returning 17.67% according to the Russell Midcap® Index. The technology-heavy NASDAQ Composite® Index also fared well, climbing 12.13%, but the Dow Jones Industrial AverageSM, an index of 30 large-cap, blue-chip stocks, managed to rise only 4.52% .
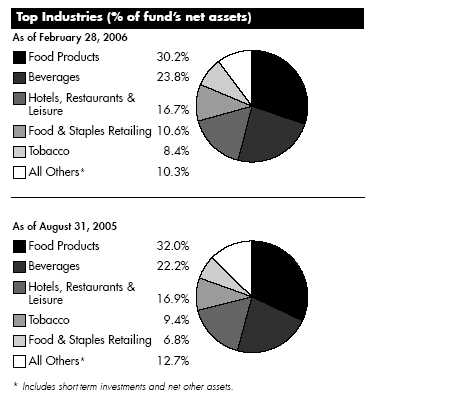
The fund returned 7.50% during the past year, solidly ahead of the Goldman Sachs® Consumer Industries Index, which gained 3.31%, and slightly behind the S&P 500. Some of the fund’s outperformance of the Goldman Sachs index resulted from the strong showing of stocks in the food and agriculture space relative to other consumer industries represented in the index. For example, the fund benefited from not investing in media stocks —which were among the weakest performers within the benchmark — and having very little invested in hypermarkets and super centers — specifically Wal-Mart, a major index component that declined. Partially offsetting this, packaged foods stocks lagged the Goldman Sachs index, so our natural inclusion of some of these stocks — such as Wrigley — held back our relative return. Security selection was strong overall. Although packaged food stocks lagged as a group, we benefited from some good picks there. Overweightings in Swiss-based Nestle and Anglo-Dutch Unilever were notable contributors here. Additionally, we saw solid gains from restaurant holdings Wendy’s International and Domino’s Pizza, although Outback Steakhouse modestly detracted. Strong results from tobacco stocks — driven mostly by Altria Group — further aided performance, as did our showing in the fertilizers and agricultural chemicals area, where Monsanto was a standout. Among beverage companies, PepsiCo helped but bottler Coca-Cola Enterprises detracted. Meat processor Smithfield Foods was the biggest detractor versus the index, and underweighting strong performing food retailer Albertson’s also hurt. Some stocks I’ve mentioned were no longer held at period end.
The views expressed above reflect those of the portfolio manager(s) only through the end of the period as stated on the cover of this report and do not necessarily represent the views of Fidelity or any other person in the Fidelity organization. Any such views are subject to change at any time based upon market or other conditions and Fidelity disclaims any responsibility to update such views. These views may not be relied on as investment advice and, because investment decisions for a Fidelity fund are based on numerous factors, may not be relied on as an indication of trading intent on behalf of any Fidelity fund.
Food and Agriculture Portfolio
Investment Changes
| Top Ten Stocks as of February 28, 2006 |
| | | % of fund’s | | % of fund’s net assets |
| | | net assets | | 6 months ago |
| Nestle SA sponsored ADR | | 8.4 | | 8.0 |
| Unilever NV (NY Shares) | | 6.5 | | 5.8 |
| PepsiCo, Inc. | | 6.5 | | 5.9 |
| Altria Group, Inc. | | 6.4 | | 7.5 |
| The Coca-Cola Co. | | 6.1 | | 5.9 |
| McDonald’s Corp. | | 5.8 | | 6.9 |
| Kellogg Co. | | 4.4 | | 4.2 |
| Coca-Cola Enterprises, Inc. | | 3.5 | | 3.7 |
| Kroger Co. | | 3.5 | | 1.6 |
| Starbucks Corp. | | 3.4 | | 1.1 |
| | | 54.5 | | |
19 Annual Report
| Food and Agriculture Portfolio | | | | | | |
| Investments February 28, 2006 | | | | |
| Showing Percentage of Net Assets | | | | | | |
| |
| Common Stocks — 99.6% | | | | | | |
| | | | | Shares | | Value (Note 1) |
| |
| BEVERAGES – 23.8% | | | | | | |
| Brewers – 2.8% | | | | | | |
| Anheuser-Busch Companies, Inc. | | | | 100 | | $ 4,154 |
| Efes Breweries International NV unit (a)(e) | | | | 8,000 | | 299,040 |
| InBev SA | | | | 33,800 | | 1,562,965 |
| SABMiller PLC | | | | 78,900 | | 1,569,484 |
| | | | | | | 3,435,643 |
| Distillers & Vintners – 3.6% | | | | | | |
| Constellation Brands, Inc. Class A (sub. vtg.) (a) | | | | 39,400 | | 1,037,796 |
| Diageo PLC sponsored ADR | | | | 30,500 | | 1,881,850 |
| Pernod Ricard SA | | | | 9,100 | | 1,557,789 |
| | | | | | | 4,477,435 |
| Soft Drinks – 17.4% | | | | | | |
| Coca-Cola Enterprises, Inc. | | | | 224,900 | | 4,419,285 |
| Coca-Cola Femsa SA de CV sponsored ADR | | | | 11,800 | | 360,844 |
| Coca-Cola Hellenic Bottling Co. SA sponsored ADR | | | | 20,300 | | 613,060 |
| Fomento Economico Mexicano SA de CV sponsored ADR | | | | 7,600 | | 661,124 |
| PepsiCo, Inc. | | | | 137,300 | | 8,115,803 |
| The Coca-Cola Co. | | | | 181,500 | | 7,617,555 |
| | | | | | | 21,787,671 |
| |
| TOTAL BEVERAGES | | | | | | 29,700,749 |
| |
| CHEMICALS – 4.8% | | | | | | |
| Fertilizers & Agricultural Chemicals – 4.5% | | | | | | |
| Agrium, Inc. | | | | 18,400 | | 458,320 |
| Bodisen Biotech, Inc. (a) | | | | 21,000 | | 325,500 |
| CF Industries Holdings, Inc. | | | | 100 | | 1,762 |
| Monsanto Co. | | | | 45,000 | | 3,774,600 |
| Mosaic Co. (a) | | | | 16,800 | | 267,120 |
| Potash Corp. of Saskatchewan | | | | 3,300 | | 316,566 |
| Syngenta AG sponsored ADR | | | | 19,000 | | 539,980 |
| | | | | | | 5,683,848 |
| Specialty Chemicals – 0.3% | | | | | | |
| Senomyx, Inc. (a) | | | | 21,800 | | 354,468 |
| |
| TOTAL CHEMICALS | | | | | | 6,038,316 |
| |
| COMMERCIAL SERVICES & SUPPLIES – 0.0% | | | | | | |
| Diversified Commercial & Professional Services – 0.0% | | | | | | |
| Aramark Corp. Class B | | | | 100 | | 2,846 |
| FOOD & STAPLES RETAILING – 10.6% | | | | | | |
| Food Distributors – 3.3% | | | | | | |
| Central European Distribution Corp. (a)(d) | | | | 8,000 | | 335,280 |
| Sysco Corp. | | | | 127,100 | | 3,824,439 |
| | | | | | | 4,159,719 |
| |
| |
| | | | | Shares | | Value (Note 1) |
| Food Retail – 6.4% | | | | | | |
| Kroger Co. (a) | | | | 217,400 | | $ 4,356,696 |
See accompanying notes which are an integral part of the financial statements.
Annual Report 20
| Safeway, Inc. | | 131,000 | | 3,184,610 |
| Whole Foods Market, Inc. | | 7,400 | | 472,712 |
| | | | | 8,014,018 |
| Hypermarkets & Super Centers – 0.9% | | | | |
| Wal-Mart Stores, Inc. | | 23,200 | | 1,052,352 |
| |
| TOTAL FOOD & STAPLES RETAILING | | | | 13,226,089 |
| |
| FOOD PRODUCTS – 30.2% | | | | |
| Agricultural Products – 4.1% | | | | |
| Archer-Daniels-Midland Co. | | 101,300 | | 3,213,236 |
| Bunge Ltd. | | 10,500 | | 595,245 |
| Corn Products International, Inc. | | 50,600 | | 1,364,176 |
| | | | | 5,172,657 |
| Packaged Foods & Meats – 26.1% | | | | |
| Cadbury Schweppes PLC sponsored ADR (d) | | 8,200 | | 335,544 |
| General Mills, Inc. | | 85,900 | | 4,230,575 |
| Groupe Danone | | 2,700 | | 312,211 |
| Hershey Co. | | 7,000 | | 358,050 |
| Kellogg Co. | | 124,700 | | 5,525,457 |
| Koninklijke Numico NV (a) | | 6,600 | �� | 285,839 |
| Kraft Foods, Inc. Class A | | 100 | | 3,009 |
| Lindt & Spruengli AG | | 30 | | 593,277 |
| Nestle SA sponsored ADR | | 143,000 | | 10,539,100 |
| People’s Food Holdings Ltd. | | 100 | | 71 |
| Tyson Foods, Inc. Class A | | 100 | | 1,353 |
| Unilever NV (NY Shares) | | 117,100 | | 8,148,989 |
| Wm. Wrigley Jr. Co. | | 36,200 | | 2,300,148 |
| | | | | 32,633,623 |
| |
| TOTAL FOOD PRODUCTS | | | | 37,806,280 |
| |
| HOTELS, RESTAURANTS & LEISURE – 16.7% | | | | |
| Restaurants – 16.7% | | | | |
| Applebee’s International, Inc. | | 9,300 | | 215,202 |
| Buffalo Wild Wings, Inc. (a) | | 88,314 | | 3,349,750 |
| California Pizza Kitchen, Inc. (a) | | 9,700 | | 291,582 |
| Chipotle Mexican Grill, Inc. Class A | | 100 | | 4,560 |
| Domino’s Pizza, Inc. | | 44,500 | | 1,134,750 |
| McCormick & Schmick’s Seafood Restaurants (a) | | 13,100 | | 306,933 |
| McDonald’s Corp. | | 207,700 | | 7,250,807 |
| Outback Steakhouse, Inc. | | 21,900 | | 915,639 |
| Red Robin Gourmet Burgers, Inc. (a) | | 45,500 | | 1,819,545 |
| Starbucks Corp. (a)(d) | | 117,600 | | 4,271,232 |
| Texas Roadhouse, Inc. Class A (a) | | 20,000 | | 307,200 |
| Yum! Brands, Inc. | | 21,600 | | 1,030,320 |
| | | | | 20,897,520 |
See accompanying notes which are an integral part of the financial statements.
|
21 Annual Report
21
| Food and Agriculture Portfolio | | | | |
| Investments - continued | | | | |
| |
| |
| Common Stocks – continued | | | | |
| | | Shares | | Value (Note 1) |
| |
| HOUSEHOLD PRODUCTS – 3.7% | | | | |
| Household Products – 3.7% | | | | |
| Colgate-Palmolive Co. | | 60,650 | | $ 3,304,212 |
| Procter & Gamble Co. | | 20,997 | | 1,258,350 |
| | | | | 4,562,562 |
| |
| MACHINERY – 1.1% | | | | |
| Construction & Farm Machinery & Heavy Trucks – 1.1% | | | | |
| AGCO Corp. (a) | | 19,500 | | 381,225 |
| Caterpillar, Inc. | | 4,500 | | 328,860 |
| CNH Global NV | | 10,100 | | 255,227 |
| Deere & Co. | | 5,300 | | 404,231 |
| | | | | 1,369,543 |
| |
| PERSONAL PRODUCTS – 0.3% | | | | |
| Personal Products – 0.3% | | | | |
| Avon Products, Inc. | | 11,200 | | 323,120 |
| TOBACCO – 8.4% | | | | |
| Tobacco – 8.4% | | | | |
| Altria Group, Inc. | | 110,600 | | 7,952,140 |
| British American Tobacco PLC sponsored ADR | | 13,500 | | 646,380 |
| Imperial Tobacco Group PLC | | 10,400 | | 312,870 |
| Loews Corp. – Carolina Group | | 8,100 | | 384,669 |
| Reynolds American, Inc. (d) | | 11,900 | | 1,263,185 |
| | | | | 10,559,244 |
| |
| TOTAL COMMON STOCKS | | | | |
| (Cost $101,462,391) | | | | 124,486,269 |
| |
| Money Market Funds — 1.4% | | | | |
| | | Shares | | Value (Note 1) |
| Fidelity Cash Central Fund, 4.57% (b) | | 1,173,874 $ | | 1,173,874 |
| Fidelity Securities Lending Cash Central Fund, 4.58% (b)(c) | | 600,975 | | 600,975 |
| TOTAL MONEY MARKET FUNDS | | | | |
| (Cost $1,774,849) | | | | 1,774,849 |
| |
| TOTAL INVESTMENT PORTFOLIO - 101.0% | | | | |
| (Cost $103,237,240) | | | | 126,261,118 |
| |
| NET OTHER ASSETS – (1.0)% | | | | (1,254,603) |
| NET ASSETS – 100% | | $ | | 125,006,515 |
(a) Non-income producing
(b) Affiliated fund that is available only to investment companies and other accounts managed by Fidelity Investments. The rate quoted is the annualized seven-day yield of the fund at period end. A complete unaudited listing of the fund’s holdings as of its most recent quarter end is available upon request.
(c) Investment made with cash collateral received from securities on loan. (d) Security or a portion of the security is on loan at period end.
(e) Security exempt from registration under Rule 144A of the Securities Act of 1933. These securities may be resold in transactions exempt from registration, normally to qualified institutional buyers. At the period end, the value of these securities amounted to $299,040 or 0.2% of net assets.
See accompanying notes which are an integral part of the financial statements.
Annual Report 22
| Affiliated Central Funds | | | | |
| Information regarding fiscal year to date income earned by the fund from the affiliated Central funds is as follows: | | | | |
| |
| Fund | | Income earned |
| Fidelity Cash Central Fund | | $ | | 55,900 |
| Fidelity Securities Lending Cash Central Fund | | | | 42,021 |
| Total | | $ | | 97,921 |
Distribution of investments by country of issue, as a percentage of total net assets, is as follows:
| United States of America | | 74.5% |
| Switzerland | | 9.3% |
| Netherlands | | 7.1% |
| United Kingdom | | 3.8% |
| France | | 1.6% |
| Belgium | | 1.3% |
| Others (individually less than 1%) | | 2.4% |
| | | 100.0% |
See accompanying notes which are an integral part of the financial statements.
|
23 Annual Report
23
| Food and Agriculture Portfolio | | | | | | | | |
| |
| Financial Statements | | | | | | | | |
| |
| |
| Statement of Assets and Liabilities | | | | | | | | |
| | | | | | | | | February 28, 2006 |
| |
| Assets | | | | | | | | |
| Investment in securities, at value (including securities loaned of $582,538) — See accompanying schedule: | | | | | | | | |
| Unaffiliated issuers (cost $101,462,391) | | $ | | 124,486,269 | | | | |
| Affiliated Central Funds (cost $1,774,849) | | | | 1,774,849 | | | | |
| Total Investments (cost $103,237,240) | | | | | | $ | | 126,261,118 |
| Receivable for investments sold | | | | | | | | 754,283 |
| Receivable for fund shares sold | | | | | | | | 99,680 |
| Dividends receivable | | | | | | | | 54,584 |
| Interest receivable | | | | | | | | 3,807 |
| Prepaid expenses | | | | | | | | 509 |
| Other receivables | | | | | | | | 3,127 |
| Total assets | | | | | | | | 127,177,108 |
| |
| Liabilities | | | | | | | | |
| Payable for investments purchased | | $ | | 918,448 | | | | |
| Payable for fund shares redeemed | | | | 523,892 | | | | |
| Accrued management fee | | | | 58,955 | | | | |
| Other affiliated payables | | | | 39,018 | | | | |
| Other payables and accrued expenses | | | | 29,305 | | | | |
| Collateral on securities loaned, at value | | | | 600,975 | | | | |
| Total liabilities | | | | | | | | 2,170,593 |
| |
| Net Assets | | | | | | $ | | 125,006,515 |
| Net Assets consist of: | | | | | | | | |
| Paid in capital | | | | | | $ | | 99,432,292 |
| Undistributed net investment income | | | | | | | | 237,173 |
| Accumulated undistributed net realized gain (loss) on investments and foreign currency transactions | | | | | | | | 2,313,431 |
| Net unrealized appreciation (depreciation) on investments and assets and liabilities in foreign currencies | | | | | | | | 23,023,619 |
| Net Assets, for 2,395,866 shares outstanding | | | | | | $ | | 125,006,515 |
| Net Asset Value, offering price and redemption price per share ($125,006,515 ÷ 2,395,866 shares) | | | | | | $ | | 52.18 |
| |
| Statement of Operations | | | | | | | | |
| | | | | | | | | Year ended February 28, 2006 |
| |
| Investment Income | | | | | | | | |
| Dividends | | | | | | $ | | 2,498,933 |
| Interest | | | | | | | | 96 |
| Income from affiliated Central Funds (including $42,021 from security lending) | | | | | | | | 97,921 |
| Total income | | | | | | | | 2,596,950 |
| |
| Expenses | | | | | | | | |
| Management fee | | $ | | 739,001 | | | | |
| Transfer agent fees | | | | 453,016 | | | | |
| Accounting and security lending fees | | | | | | | | |
| | | | | 66,312 | | | | |
| Independent trustees’ compensation | | | | 593 | | | | |
| Custodian fees and expenses | | | | 28,886 | | | | |
| Registration fees | | | | 26,177 | | | | |
| Audit | | | | 34,242 | | | | |
| Legal | | | | 777 | | | | |
| Miscellaneous | | | | 3,290 | | | | |
| Total expenses before reductions | | | | 1,352,294 | | | | |
| Expense reductions | | | | (18,675) | | | | 1,333,619 |
| |
| Net investment income (loss) | | | | | | | | 1,263,331 |
| | Realized and Unrealized Gain (Loss)
Net realized gain (loss) on:
Investment securities:
|
See accompanying notes which are an integral part of the financial statements.
Annual Report 24
| Unaffiliated issuers | | 8,287,528 | | |
| Foreign currency transactions | | 315 | | |
| Total net realized gain (loss) | | | | 8,287,843 |
| Change in net unrealized appreciation (depreciation) on: | | | | |
| Investment securities | | (384,822) | | |
| Assets and liabilities in foreign currencies | | (307) | | |
| Total change in net unrealized appreciation (depreciation) | | | | (385,129) |
| Net gain (loss) | | | | 7,902,714 |
| Net increase (decrease) in net assets resulting from operations | | | $ | 9,166,045 |
See accompanying notes which are an integral part of the financial statements.
|
25 Annual Report
| Food and Agriculture Portfolio | | | | | | | | | | | | | | | | | | | | |
| Financial Statements - continued | | | | | | | | | | | | | | | | | | | | |
| |
| |
| Statement of Changes in Net Assets | | | | | | | | | | | | | | | | | | | | |
| | | | | | | | | | | Year ended | | Year ended |
| | | | | | | | | | | February 28, | | February 28, |
| | | | | | | | | | | 2006 | | 2005 |
| Increase (Decrease) in Net Assets | | | | | | | | | | | | | | | | | | | | |
| Operations | | | | | | | | | | | | | | | | | | | | |
| Net investment income (loss) | | | | | | | | | | $ | | 1,263,331 | | $ | | | | 712,640 |
| Net realized gain (loss) | | | | | | | | | | | | 8,287,843 | | | | | | 8,330,360 |
| Change in net unrealized appreciation (depreciation) | | | | | | | | | | | | (385,129) | | | | | | 2,593,286 |
| Net increase (decrease) in net assets resulting from operations | | | | | | | | | | | | 9,166,045 | | | | 11,636,286 |
| Distributions to shareholders from net investment income | | | | | | | | | | | | (1,049,605) | | | | | | (683,408) |
| Distributions to shareholders from net realized gain | | | | | | | | | | | | (6,158,772) | | | | | | — |
| Total distributions | | | | | | | | | | | | (7,208,377) | | | | | | (683,408) |
| Share transactions | | | | | | | | | | | | | | | | | | | | |
| Proceeds from sales of shares | | | | | | | | | | | | 47,926,666 | | | | 105,702,482 |
| Reinvestment of distributions | | | | | | | | | | | | 6,802,073 | | | | | | 642,326 |
| Cost of shares redeemed | | | | | | | | | | | | (71,028,865) | | | | (82,447,637) |
| Net increase (decrease) in net assets resulting from share transactions | | | | | | | | | | (16,300,126) | | | | 23,897,171 |
| Redemption fees | | | | | | | | | | | | | | 20,664 | | | | | | 41,906 |
| Total increase (decrease) in net assets | | | | | | | | | | | | (14,321,794) | | | | 34,891,955 |
| |
| Net Assets | | | | | | | | | | | | | | | | | | | | |
| Beginning of period | | | | | | | | | | | | 139,328,309 | | | | 104,436,354 |
| End of period (including undistributed net investment income of $237,173 and undistributed net investment income | | | | | | | | | | |
| of $28,038, respectively) | | | | | | | | | | $ | | 125,006,515 | | $ | | 139,328,309 |
| |
| Other Information | | | | | | | | | | | | | | | | | | | | |
| Shares | | | | | | | | | | | | | | | | | | | | |
| Sold | | | | | | | | | | | | 932,427 | | | | | | 2,217,961 |
| Issued in reinvestment of distributions | | | | | | | | | | | | 133,891 | | | | | | 13,111 |
| Redeemed | | | | | | | | | | | | (1,380,263) | | | | (1,767,243) |
| Net increase (decrease) | | | | | | | | | | | | (313,945) | | | | | | 463,829 |
| |
| Financial Highlights | | | | | | | | | | | | | | | | | | | | |
| Years ended February 28, | | | | 2006 | | | | 2005 | | 2004E | | | | 2003 | | | | 2002 |
| Selected Per-Share Data | | | | | | | | | | | | | | | | | | |
| Net asset value, beginning of period | | $ | | 51.42 | | $ | | 46.50 | | $ 35.71 | | $ | | 44.68 | | $ | | 46.01 |
| Income from Investment Operations | | | | | | | | | | | | | | | | | | | | |
| Net investment income (loss)C | | | | 50 | | | | .29 | | .22 | | | | .25 | | | | .34 |
| Net realized and unrealized gain (loss) | | | | 3.25 | | | | 4.90 | | 10.80 | | | | (8.06) | | | | 2.79 |
| Total from investment operations | | | | 3.75 | | | | 5.19 | | 11.02 | | | | (7.81) | | | | 3.13 |
| Distributions from net investment income | | | | (.44) | | | | (.29) | | (.24) | | | | (.32) | | | | (.21) |
| Distributions from net realized gain | | | | (2.56) | | | | — | | — | | | | (.88) | | | | (4.28) |
| Total distributions | | | | (3.00) | | | | (.29) | | (.24) | | | | (1.20) | | | | (4.49) |
| Redemption fees added to paid in capitalC | | | | 01 | | | | .02 | | .01 | | | | .04 | | | | .03 |
| Net asset value, end of period | | $ | | 52.18 | | $ | | 51.42 | | $ 46.50 | | $ | | 35.71 | | $ | | 44.68 |
| Total ReturnA,B | | | | 7.50% | | | | 11.24% | | 30.94% | | | | (17.85)% | | | | 7.76% |
| Ratios to Average Net AssetsD | | | | | | | | | | | | | | | | | | | | |
| Expenses before reductions | | | | 1.04% | | | | 1.06% | | 1.27% | | | | 1.25% | | | | 1.24% |
| Expenses net of fee waivers, if any | | | | 1.04% | | | | 1.06% | | 1.27% | | | | 1.25% | | | | 1.24% |
| Expenses net of all reductions | | | | 1.03% | | | | 1.05% | | 1.25% | | | | 1.17% | | | | 1.14% |
| Net investment income (loss) | | | | 97% | | | | .61% | | .55% | | | | .59% | | | | .79% |
| Supplemental Data | | | | | | | | | | | | | | | | | | | | |
| Net assets, end of period (000 omitted) | | $ | | 125,007 | | $ 139,328 | | $ 104,436 | | $ | | 88,123 | | $ | | 119,980 |
| Portfolio turnover rate | | | | 75% | | | | 86% | | 62% | | | | 225% | | | | 315% |
| |
| | | | | |
A Total returns would have been lower had certain expenses not been reduced during the periods shown. B Total returns do not include the effect of the former sales charges. C Calculated based on average shares outstanding during the period. DExpense ratios reflect operating expenses of the fund. Expenses before reductions do not reflect amounts reimbursed by the investment adviser or reductions from brokerage service arrangements or other expense offset arrangements and do not represent the amount paid by the fund during periods when reimbursements or reductions occur. Expenses net of fee waivers reflect expenses after reimbursement by the investment adviser but prior to reductions from brokerage service arrangements or other expense offset arrangements. Expenses net of all reductions represent the net expenses paid by the fund. EFor the year ended February 29.
See accompanying notes which are an integral part of the financial statements.
Annual Report 26
Leisure Portfolio
Performance
|
Average annual total return reflects the change in the value of an investment, assuming reinvestment of the fund’s dividend income and capital gains (the profits earned upon the sale of securities that have grown in value) and assuming a constant rate of performance each year. The $10,000 table and the fund’s returns do not reflect the deduction of taxes that a shareholder would pay on fund distributions or the redemption of fund shares. During periods of reimbursement by Fidelity a fund’s total returns will be greater than it would be had the reimbursement not occurred. How a fund did yesterday is no guarantee of how it will do tomorrow.
| Average Annual Total Returns | | | | | | |
| Periods ended February 28, 2006 | | Past 1 | | Past 5 | | Past |
| | | year | | years | | years |
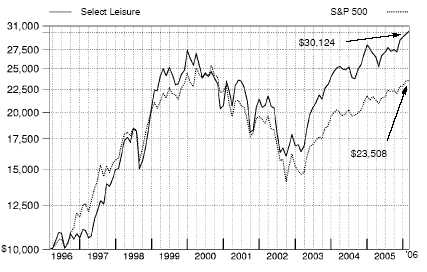
| Select Leisure | | 11.67% | | 6.15% | | 11.66% |
$10,000 Over 10 Years
Let’s say hypothetically that $10,000 was invested in Fidelity Select Leisure Portfolio on February 29, 1996. The chart shows how the value of your investment would have changed, and also shows how the S&P 500 Index performed over the same period.
27 Annual Report
Management’s Discussion of Fund Performance
Comments from Gopal Reddy, who became Portfolio Manager of Fidelity® Select Leisure Portfolio on November 1, 2005
With the exception of several popular large-cap stock performance measures, most major U.S. equity benchmarks had double-digit returns for the year ending February 28, 2006. For much of the period, market gains were driven largely by the energy sector, although utilities ultimately sneaked into the top spot for the year overall. Financials and telecommunication services also reached double figures, outperforming the 8.40% return of the broader market as measured by the large-cap-oriented Standard & Poor’s 500SM Index. The consumer discretionary segment — home to the weak performing automobile and media industries — was the biggest disappointment. Although the overall return for the S&P 500® beat the small-cap Russell 2000® Index in calendar year 2005 — the first time that’s happened in six years — small-caps stormed back in early 2006, leading to a 16.59% advance during the past 12 months, nearly twice the broader market’s gain. Mid-caps soared even higher, returning 17.67% according to the Russell Midcap® Index. The technology-heavy NASDAQ Composite® Index also fared well, climbing 12.13%, but the Dow Jones Industrial AverageSM, an index of 30 large-cap, blue-chip stocks, managed to rise only 4.52% .
For the 12-month period ending February 28, 2006, Select Leisure Portfolio returned 11.67%, easily surpassing both the Goldman Sachs® Consumer Industries Index, which gained 3.31%, and the S&P 500. Good security selection, including large exposure to a handful of top-performing stocks, aided the fund’s performance relative to its sector index. Most of the fund’s success was in the Internet, casinos/gaming and restaurant segments. Weak results in the home entertainment software and consumer electronics areas curbed our gains a bit. Our strongest performer by far was Google, the Internet search engine whose soaring stock price continued to reflect its strong earnings as it reshapes the world of advertising. Other key contributors included American Tower, which builds and operates cellular transmitter towers, and Lamar Advertising, which owns and operates billboards, including popular and profitable new digital billboards. Both these stocks benefited from strong pricing power. Equinix, an Internet hosting company, and Melco, a Hong Kong restaurant and gaming firm, also contributed to performance. Omnicom, a diversified advertising company that provides one-stop media buying, was a disappointment, as was Internet portal Yahoo!, which fell short of expectations despite posting strong cash flow growth. Not owning consumer products giant Procter & Gamble, a benchmark component that did well, also hurt performance.
The views expressed above reflect those of the portfolio manager(s) only through the end of the period as stated on the cover of this report and do not necessarily represent the views of Fidelity or any other person in the Fidelity organization. Any such views are subject to change at any time based upon market or other conditions and Fidelity disclaims any responsibility to update such views. These views may not be relied on as investment advice and, because investment decisions for a Fidelity fund are based on numerous factors, may not be relied on as an indication of trading intent on behalf of any Fidelity fund.
Leisure Portfolio
Investment Changes
| Top Ten Stocks as of February 28, 2006 |
| | | % of fund’s | | % of fund’s net assets |
| | | net assets | | 6 months ago |
| Google, Inc. Class A (sub. vtg.) | | 7.5 | | 7.5 |
| Yahoo!, Inc. | | 7.3 | | 5.8 |
| Carnival Corp. unit | | 4.7 | | 3.7 |
| Equinix, Inc. | | 3.9 | | 0.0 |
| Walt Disney Co. | | 3.9 | | 4.6 |
| News Corp. Class A | | 3.8 | | 4.4 |
| Starwood Hotels & Resorts | | | | |
| Worldwide, Inc. unit | | 3.5 | | 1.0 |
| Kerzner International Ltd. | | 3.3 | | 1.4 |
| Penn National Gaming, Inc. | | 3.0 | | 1.4 |
| Lamar Advertising Co. Class A | | 2.5 | | 6.3 |
| | | 43.4 | | |
29 Annual Report
| Leisure Portfolio | | | | | | |
| Investments February 28, 2006 | | | | |
| Showing Percentage of Net Assets | | | | | | |
| |
| Common Stocks — 96.0% | | | | | | |
| | | | | Shares | | Value (Note 1) |
| |
| AUTOMOBILES – 0.3% | | | | | | |
| Motorcycle Manufacturers – 0.3% | | | | | | |
| Harley-Davidson, Inc. | | | | 14,000 | | $ 735,140 |
| BUILDING PRODUCTS – 0.7% | | | | | | |
| Building Products – 0.7% | | | | | | |
| Simpson Manufacturing Co. Ltd. | | | | 35,200 | | 1,375,968 |
| COMPUTERS & PERIPHERALS – 0.6% | | | | | | |
| Computer Hardware – 0.6% | | | | | | |
| Hewlett-Packard Co. | | | | 35,000 | | 1,148,350 |
| CONSTRUCTION & ENGINEERING – 0.3% | | | | | | |
| Construction & Engineering – 0.3% | | | | | | |
| Perini Corp. (a) | | | | 21,700 | | 659,463 |
| DIVERSIFIED CONSUMER SERVICES – 0.6% | | | | | | |
| Education Services – 0.6% | | | | | | |
| Corinthian Colleges, Inc. (a) | | | | 99,700 | | 1,292,112 |
| DIVERSIFIED FINANCIAL SERVICES – 0.4% | | | | | | |
| Specialized Finance – 0.4% | | | | | | |
| NETeller PLC (a) | | | | 56,200 | | 741,346 |
| DIVERSIFIED TELECOMMUNICATION SERVICES – 0.0% | | | | | | |
| Integrated Telecommunication Services – 0.0% | | | | | | |
| AT&T, Inc. | | | | 100 | | 2,759 |
| BellSouth Corp. | | | | 100 | | 3,158 |
| Verizon Communications, Inc. | | | | 100 | | 3,370 |
| | | | | | | 9,287 |
| |
| ELECTRONIC EQUIPMENT & INSTRUMENTS – 0.7% | | | | | | |
| Electronic Manufacturing Services – 0.5% | | | | | | |
| Merix Corp. (a) | | | | 100,500 | | 972,840 |
| Technology Distributors – 0.2% | | | | | | |
| PFSweb, Inc. (a) | | | | 244,800 | | 396,600 |
| TOTAL ELECTRONIC EQUIPMENT & INSTRUMENTS | | | | | | 1,369,440 |
| |
| FOOD PRODUCTS – 0.4% | | | | | | |
| Packaged Foods & Meats – 0.4% | | | | | | |
| Nestle SA sponsored ADR | | | | 11,000 | | 810,700 |
| HEALTH CARE EQUIPMENT & SUPPLIES – 0.3% | | | | | | |
| Health Care Supplies – 0.3% | | | | | | |
| Align Technology, Inc. (a)(d) | | | | 68,900 | | 562,224 |
| HEALTH CARE PROVIDERS & SERVICES – 0.1% | | | | | | |
| Health Care Services – 0.1% | | | | | | |
| Emdeon Corp. (a) | | | | 14,400 | | 151,776 |
| HOTELS, RESTAURANTS & LEISURE – 40.4% | | | | | | |
| Casinos & Gaming – 15.8% | | | | | | |
| Aristocrat Leisure Ltd. (d) | | | | 109,500 | | 979,644 |
| Boyd Gaming Corp. | | | | 98,300 | | 4,298,659 |
| FortuNet, Inc. | | | | 44,000 | | 418,000 |
| Harrah’s Entertainment, Inc. | | | | 23,900 | | 1,718,888 |
| Isle of Capri Casinos, Inc. (a) | | | | 78,900 | | 2,391,459 |
See accompanying notes which are an integral part of the financial statements.
Annual Report 30
| | | Shares | | Value (Note 1) |
| Las Vegas Sands Corp. (a) | | 44,600 | | $ 2,379,410 |
| MGM MIRAGE (a) | | 57,000 | | 2,107,290 |
| Penn National Gaming, Inc. (a) | | 180,700 | | 6,266,676 |
| Pinnacle Entertainment, Inc. (a) | | 50,200 | | 1,408,110 |
| Shuffle Master, Inc. (a)(d) | | 59,200 | | 1,546,896 |
| Station Casinos, Inc. | | 37,300 | | 2,553,185 |
| WMS Industries, Inc. (a) | | 74,400 | | 2,161,320 |
| Wynn Resorts Ltd. (a)(d) | | 64,800 | | 4,305,960 |
| | | | | 32,535,497 |
| Hotels, Resorts & Cruise Lines – 15.5% | | | | |
| Carnival Corp. unit | | 186,600 | | 9,637,890 |
| eLong, Inc. sponsored ADR (a) | | 1,100 | | 14,003 |
| Gaylord Entertainment Co. (a) | | 36,900 | | 1,647,585 |
| Kerzner International Ltd. (a) | | 99,300 | | 6,681,897 |
| Marriott International, Inc. Class A | | 27,900 | | 1,908,360 |
| Morgans Hotel Group Co. | | 7,400 | | 144,300 |
| Royal Caribbean Cruises Ltd. | | 103,900 | | 4,577,834 |
| Starwood Hotels & Resorts Worldwide, Inc. unit | | 113,100 | | 7,181,850 |
| | | | | 31,793,719 |
| Leisure Facilities – 2.5% | | | | |
| International Speedway Corp. Class A | | 17,300 | | 819,328 |
| Vail Resorts, Inc. (a) | | 127,500 | | 4,212,600 |
| | | | | 5,031,928 |
| Restaurants – 6.6% | | | | |
| Buffalo Wild Wings, Inc. (a) | | 63,015 | | 2,390,159 |
| McDonald’s Corp. | | 122,800 | | 4,286,948 |
| Melco International Development Ltd. | | 2,492,000 | | 3,774,346 |
| Outback Steakhouse, Inc. | | 14,800 | | 618,788 |
| Starbucks Corp. (a)(d) | | 67,100 | | 2,437,072 |
| | | | | 13,507,313 |
| |
| TOTAL HOTELS, RESTAURANTS & LEISURE | | | | 82,868,457 |
| |
| HOUSEHOLD DURABLES – 1.5% | | | | |
| Consumer Electronics – 1.1% | | | | |
| Harman International Industries, Inc. | | 21,200 | | 2,339,420 |
| Homebuilding – 0.4% | | | | |
| D.R. Horton, Inc. | | 25,200 | | 859,572 |
| |
| TOTAL HOUSEHOLD DURABLES | | | | 3,198,992 |
| |
| INTERNET & CATALOG RETAIL – 0.9% | | | | |
| Catalog Retail – 0.0% | | | | |
| dELiA*s, Inc. (a) | | 143 | | 1,274 |
| Internet Retail – 0.9% | | | | |
| Expedia, Inc. (a) | | 99,300 | | 1,883,721 |
| |
| TOTAL INTERNET & CATALOG RETAIL | | | | 1,884,995 |
| |
| INTERNET SOFTWARE & SERVICES – 19.3% | | | | |
| Internet Software & Services – 19.3% | | | | |
| China Lotsynergy Holding Ltd. (a) | | 354,000 | | 96,966 |
| |
| |
| See accompanying notes which are an integral part of the financial statements. | | | | |
31
31 Annual Report
| Leisure Portfolio | | | | |
| Investments - continued | | | | |
| |
| |
| Common Stocks – continued | | | | |
| | | Shares | | Value (Note 1) |
| |
| INTERNET SOFTWARE & SERVICES – CONTINUED | | | | |
| Internet Software & Services – continued | | | | |
| eBay, Inc. (a) | | 23,300 | | $ 933,398 |
| Equinix, Inc. (a) | | 154,200 | | 8,086,248 |
| Google, Inc. Class A (sub. vtg.) (a) | | 42,300 | | 15,338,826 |
| iVillage, Inc. (a) | | 10,100 | | 82,315 |
| Yahoo!, Inc. (a)(d) | | 470,304 | | 15,077,946 |
| | | | | 39,615,699 |
| |
| LEISURE EQUIPMENT & PRODUCTS – 2.0% | | | | |
| Leisure Products – 2.0% | | | | |
| Brunswick Corp. | | 26,700 | | 1,047,441 |
| MarineMax, Inc. (a) | | 36,000 | | 1,110,960 |
| Mattel, Inc. | | 103,400 | | 1,742,290 |
| Polaris Industries, Inc. | | 5,500 | | 275,275 |
| | | | | 4,175,966 |
| |
| MEDIA – 19.7% | | | | |
| Advertising – 3.1% | | | | |
| Interpublic Group of Companies, Inc. (a) | | 384 | | 3,978 |
| Lamar Advertising Co. Class A (a)(d) | | 102,500 | | 5,229,550 |
| Omnicom Group, Inc. | | 14,400 | | 1,149,408 |
| | | | | 6,382,936 |
| Broadcasting & Cable TV – 5.9% | | | | |
| Comcast Corp. Class A (a) | | 177,100 | | 4,751,593 |
| EchoStar Communications Corp. Class A (a) | | 127,800 | | 3,753,486 |
| Grupo Televisa SA de CV (CPO) sponsored ADR | | 13,500 | | 1,059,210 |
| Television Broadcasts Ltd. | | 112,000 | | 630,171 |
| The DIRECTV Group, Inc. (a) | | 87,401 | | 1,377,440 |
| Univision Communications, Inc. Class A (a) | | 500 | | 16,725 |
| XM Satellite Radio Holdings, Inc. Class A (a) | | 23,535 | | 519,888 |
| | | | | 12,108,513 |
| Movies & Entertainment – 7.7% | | | | |
| News Corp. Class A | | 480,996 | | 7,830,615 |
| The Walt Disney Co. (d) | | 281,800 | | 7,887,582 |
| | | | | 15,718,197 |
| Publishing – 3.0% | | | | |
| Gannett Co., Inc. | | 33,900 | | 2,107,224 |
| Getty Images, Inc. (a) | | 37,900 | | 3,071,037 |
| McGraw-Hill Companies, Inc. | | 19,500 | | 1,035,255 |
| | | | | 6,213,516 |
| |
| TOTAL MEDIA | | | | 40,423,162 |
| |
| MULTILINE RETAIL – 2.1% | | | | |
| General Merchandise Stores – 2.1% | | | | |
| 99 Cents Only Stores (a) | | 387,300 | | 4,407,474 |
See accompanying notes which are an integral part of the financial statements.
Annual Report 32
| | | Shares | | Value (Note |
| |
| PERSONAL PRODUCTS – 0.0% | | | | |
| Personal Products – 0.0% | | | | |
| Avon Products, Inc. | | 3,800 | | $ 109,630 |
| REAL ESTATE – 1.1% | | | | |
| Real Estate Investment Trusts – 0.3% | | | | |
| Host Marriott Corp. | | 33,000 | | 641,190 |
| Real Estate Management & Development – 0.8% | | | | |
| Emperor Entertainment Hotel Ltd. | | 2,125,000 | | 753,264 |
| Far East Consortium International Ltd. | | 1,925,000 | | 818,843 |
| | | | | 1,572,107 |
| |
| TOTAL REAL ESTATE | | | | 2,213,297 |
| |
| SEMICONDUCTORS & SEMICONDUCTOR EQUIPMENT – 0.5% | | | | |
| Semiconductor Equipment – 0.5% | | | | |
| MEMC Electronic Materials, Inc. (a) | | 29,800 | | 998,002 |
| SOFTWARE – 1.5% | | | | |
| Application Software – 1.5% | | | | |
| NAVTEQ Corp. (a) | | 33,400 | | 1,546,754 |
| Plato Learning, Inc. (a) | | 188,000 | | 1,488,960 |
| | | | | 3,035,714 |
| |
| SPECIALTY RETAIL – 0.2% | | | | |
| Apparel Retail – 0.2% | | | | |
| Urban Outfitters, Inc. (a) | | 16,700 | | 469,270 |
| TEXTILES, APPAREL & LUXURY GOODS – 0.5% | | | | |
| Apparel, Accessories & Luxury Goods – 0.5% | | | | |
| Carter’s, Inc. (a) | | 15,500 | | 991,845 |
| WIRELESS TELECOMMUNICATION SERVICES – 1.9% | | | | |
| Wireless Telecommunication Services – 1.9% | | | | |
| American Tower Corp. Class A (a) | | 123,900 | | 3,943,737 |
| TOTAL COMMON STOCKS | | | | |
| (Cost $158,464,404) | | | | 197,192,046 |
| |
| Money Market Funds — 14.4% | | | | |
| |
| Fidelity Cash Central Fund, 4.57% (b) | | 2,141,121 | | 2,141,121 |
| Fidelity Securities Lending Cash Central Fund, 4.58% (b)(c) | | 27,387,610 | | 27,387,610 |
| TOTAL MONEY MARKET FUNDS | | | | |
| (Cost $29,528,731) | | | | 29,528,731 |
| |
| TOTAL INVESTMENT PORTFOLIO - 110.4% | | | | |
| (Cost $187,993,135) | | | | 226,720,777 |
| |
| NET OTHER ASSETS – (10.4)% | | | | (21,430,578) |
| NET ASSETS – 100% | | $ | | 205,290,199 |
| |
| Legend | | | | |
| (a) Non-income producing | | | | |
| |
| |
| See accompanying notes which are an integral part of the financial statements. | | | | |
33
33 Annual Report
Leisure Portfolio
Investments - continued
|
(b) Affiliated fund that is available only to investment companies and other accounts managed by Fidelity Investments. The rate quoted is the annualized seven-day yield of the fund at period end. A complete unaudited listing of the fund’s holdings as of its most recent quarter end is available upon request.
(c) Investment made with cash collateral received from securities on loan. (d) Security or a portion of the security is on loan at period end.
Information regarding fiscal year to date income earned by the fund from the affiliated Central funds is as follows:
| Fund | | Income earned |
| Fidelity Cash Central Fund | | $ 88,417 |
| Fidelity Securities Lending Cash Central Fund | | 120,322 |
| Total | | $ 208,739 |
Distribution of investments by country of issue, as a percentage of total net assets, is as follows:
| United States of America | | 85.0% |
| Panama | | 4.7% |
| Bahamas (Nassau) | | 3.3% |
| Hong Kong | | 2.5% |
| Liberia | | 2.2% |
| Others (individually less than 1%) | | 2.3% |
| | | 100.0% |
See accompanying notes which are an integral part of the financial statements.
Annual Report 34
| Leisure Portfolio | | | | | | | | |
| |
| Financial Statements | | | | | | | | |
| |
| |
| Statement of Assets and Liabilities | | | | | | | | |
| | | | | | | | | February 28, 2006 |
| |
| Assets | | | | | | | | |
| Investment in securities, at value (including securities loaned of $26,451,480) — See accompanying schedule: | | | | | | | | |
| Unaffiliated issuers (cost $158,464,404) | | $ | | 197,192,046 | | | | |
| Affiliated Central Funds (cost $29,528,731) | | | | 29,528,731 | | | | |
| Total Investments (cost $187,993,135) | | | | | | $ | | 226,720,777 |
| Receivable for investments sold | | | | | | | | 6,478,519 |
| Receivable for fund shares sold | | | | | | | | 1,966,357 |
| Dividends receivable | | | | | | | | 115,961 |
| Interest receivable | | | | | | | | 9,176 |
| Prepaid expenses | | | | | | | | 835 |
| Other affiliated receivables | | | | | | | | 26 |
| Other receivables | | | | | | | | 22,981 |
| Total assets | | | | | | | | 235,314,632 |
| |
| Liabilities | | | | | | | | |
| Payable to custodian bank | | $ | | 44,853 | | | | |
| Payable for investments purchased | | | | 2,183,284 | | | | |
| Payable for fund shares redeemed | | | | 226,616 | | | | |
| Accrued management fee | | | | 95,633 | | | | |
| Other affiliated payables | | | | 59,730 | | | | |
| Other payables and accrued expenses | | | | 26,707 | | | | |
| Collateral on securities loaned, at value | | | | 27,387,610 | | | | |
| Total liabilities | | | | | | | | 30,024,433 |
| |
| Net Assets | | | | | | $ | | 205,290,199 |
| Net Assets consist of: | | | | | | | | |
| Paid in capital | | | | | | $ | | 157,747,867 |
| Accumulated net investment loss | | | | | | | | (521) |
| Accumulated undistributed net realized gain (loss) on investments and foreign currency transactions | | | | | | | | 8,815,205 |
| Net unrealized appreciation (depreciation) on investments and assets and liabilities in foreign currencies | | | | | | | | 38,727,648 |
| Net Assets, for 2,545,878 shares outstanding | | | | | | $ | | 205,290,199 |
| Net Asset Value, offering price and redemption price per share ($205,290,199 ÷ 2,545,878 shares) | | | | | | $ | | 80.64 |
| |
| Statement of Operations | | | | | | | | |
| | | | | | | | | Year ended February 28, 2006 |
| |
| Investment Income | | | | | | | | |
| Dividends | | | | | | $ | | 944,072 |
| Interest | | | | | | | | 320 |
| Income from affiliated Central Funds (including $120,322 from security lending) | | | | | | | | 208,739 |
| Total income | | | | | | | | 1,153,131 |
| |
| Expenses | | | | | | | | |
| Management fee | | $ | | 1,149,768 | | | | |
| Transfer agent fees | | | | 659,083 | | | | |
| Accounting and security lending fees | | | | | | | | |
| | | | | 104,638 | | | | |
| Independent trustees’ compensation | | | | 881 | | | | |
| Custodian fees and expenses | | | | 15,245 | | | | |
| Registration fees | | | | 22,973 | | | | |
| Audit | | | | 34,614 | | | | |
| Legal | | | | 1,691 | | | | |
| Miscellaneous | | | | 1,995 | | | | |
| Total expenses before reductions | | | | 1,990,888 | | | | |
| Expense reductions | | | | (101,255) | | | | 1,889,633 |
| |
| Net investment income (loss) | | | | | | | | (736,502) |
| |
| |
| See accompanying notes which are an integral part of the financial statements. | | | | | | | | |
35 Annual Report
| Leisure Portfolio | | | | |
| Financial Statements - continued | | | | |
| |
| |
| Realized and Unrealized Gain (Loss) | | | | |
| Net realized gain (loss) on: | | | | |
| Investment securities: | | | | |
| Unaffiliated issuers | | 14,578,084 | | |
| Foreign currency transactions | | 10,484 | | |
| Total net realized gain (loss) | | | | 14,588,568 |
| Change in net unrealized appreciation (depreciation) on: | | | | |
| Investment securities | | 8,408,674 | | |
| Assets and liabilities in foreign currencies | | (31) | | |
| Total change in net unrealized appreciation (depreciation) | | | | 8,408,643 |
| Net gain (loss) | | | | 22,997,211 |
| Net increase (decrease) in net assets resulting from operations | | | $ | 22,260,709 |
See accompanying notes which are an integral part of the financial statements.
Annual Report 36
| Statement of Changes in Net Assets | | | | | | | | | | | | | | | | |
| | | | | | | | | Year ended | | Year ended |
| | | | | | | | | February 28, | | February 28, |
| | | | | | | | | 2006 | | 2005 |
| Increase (Decrease) in Net Assets | | | | | | | | | | | | | | | | |
| Operations | | | | | | | | | | | | | | | | |
| Net investment income (loss) | | | | | | | | $ | | (736,502) | | $ | | (565,025) |
| Net realized gain (loss) | | | | | | | | | | 14,588,568 | | | | 9,229,476 |
| Change in net unrealized appreciation (depreciation) | | | | | | | | | | 8,408,643 | | | | 3,428,002 |
| Net increase (decrease) in net assets resulting from operations | | | | | | | | | | 22,260,709 | | 12,092,453 |
| Distributions to shareholders from net realized gain | | | | | | | | | | (7,936,173) | | (12,897,221) |
| Share transactions | | | | | | | | | | | | | | | | |
| Proceeds from sales of shares | | | | | | | | | | 52,967,028 | | 89,140,152 |
| Reinvestment of distributions | | | | | | | | | | 7,524,369 | | 12,212,709 |
| Cost of shares redeemed | | | | | | | | (75,943,707) | | (98,538,099) |
| Net increase (decrease) in net assets resulting from share transactions | | | | | | | | (15,452,310) | | | | 2,814,762 |
| Redemption fees | | | | | | | | | | | | 12,071 | | | | 42,388 |
| Total increase (decrease) in net assets | | | | | | | | | | (1,115,703) | | | | 2,052,382 |
| |
| Net Assets | | | | | | | | | | | | | | | | |
| Beginning of period | | | | | | | | 206,405,902 | | 204,353,520 |
| End of period (including accumulated net investment loss of $521 and accumulated net investment loss of $739, | | | | | | | | | | |
| respectively) | | | | | | | | $ 205,290,199 $ | | 206,405,902 |
| |
| Other Information | | | | | | | | | | | | | | | | |
| Shares | | | | | | | | | | | | | | | | |
| Sold | | | | | | | | | | 699,664 | | | | 1,203,993 |
| Issued in reinvestment of distributions | | | | | | | | | | | | 98,957 | | | | 165,996 |
| Redeemed | | | | | | | | | | (1,002,364) | | (1,366,919) |
| Net increase (decrease) | | | | | | | | | | (203,743) | | | | 3,070 |
| |
| Financial Highlights | | | | | | | | | | | | | | | | |
| Years ended February 28, | | | | 2006 | | 2005 | | 2004E | | | | 2003 | | | | 2002 |
| Selected Per-Share Data | | | | | | | | | | | | | | | | |
| Net asset value, beginning of period | | $ | | 75.07 | | $ 74.40 | | $ 48.60 | | $ | | 61.57 | | $ | | 66.22 |
| Income from Investment Operations | | | | | | | | | | | | | | | | |
| Net investment income (loss)C | | | | (.28) | | (.20) | | (.24) | | | | (.33) | | | | (.29) |
| Net realized and unrealized gain (loss) | | | | 8.83 | | 5.55 | | 26.03 | | | | (12.66) | | | | (4.37) |
| Total from investment operations | | | | 8.55 | | 5.35 | | 25.79 | | | | (12.99) | | | | (4.66) |
| Distributions from net realized gain | | | | (2.98) | | (4.70) | | — | | | | — | | | | — |
| Redemption fees added to paid in capitalC | | | | —F | | .02 | | .01 | | | | .02 | | | | .01 |
| Net asset value, end of period | | $ | | 80.64 | | $ 75.07 | | $ 74.40 | | $ | | 48.60 | | $ | | 61.57 |
| Total ReturnA,B | | | | 11.67% | | 7.43% | | 53.09% | | | | (21.07)% | | | | (7.02)% |
| Ratios to Average Net AssetsD | | | | | | | | | | | | | | | | |
| Expenses before reductions | | | | 99% | | 1.01% | | 1.15% | | | | 1.27% | | | | 1.12% |
| Expenses net of fee waivers, if any | | | | 99% | | 1.01% | | 1.15% | | | | 1.27% | | | | 1.12% |
| Expenses net of all reductions | | | | 94% | | .96% | | 1.09% | | | | 1.19% | | | | 1.09% |
| Net investment income (loss) | | | | (.37)% | | (.28)% | | (.38)% | | | | (.62)% | | | | (.46)% |
| Supplemental Data | | | | | | | | | | | | | | | | |
| Net assets, end of period (000 omitted) | | $ 205,290 | | $ 206,406 | | $ 204,354 | | $ | | 112,147 | | $ | | 211,055 |
| Portfolio turnover rate | | | | 107% | | 117% | | 156% | | | | 124% | | | | 60% |
ATotal returns would have been lower had certain expenses not been reduced during the periods shown. BTotal returns do not include the effect of the former sales charges. CCalculated based on average shares outstanding during the period. DExpense ratios reflect operating expenses of the fund. Expenses before reductions do not reflect amounts reimbursed by the investment adviser or reductions from brokerage service arrangements or other expense offset arrangements and do not represent the amount paid by the fund during periods when reimbursements or reductions occur. Expenses net of fee waivers reflect expenses after reimbursement by the investment adviser but prior to reductions from brokerage service arrangements or other expense offset arrangements. Expenses net of all reductions represent the net expenses paid by the fund. EFor the year ended February 29. FAmount represents less than $.01 per share.
See accompanying notes which are an integral part of the financial statements.
|
Multimedia Portfolio
Performance
|
Average annual total return reflects the change in the value of an investment, assuming reinvestment of the fund’s dividend income and capital gains (the profits earned upon the sale of securities that have grown in value) and assuming a constant rate of performance each year. The $10,000 table and the fund’s returns do not reflect the deduction of taxes that a shareholder would pay on fund distributions or the redemption of fund shares. During periods of reimbursement by Fidelity a fund’s total returns will be greater than it would be had the reimbursement not occurred. How a fund did yesterday is no guarantee of how it will do tomorrow.
| Average Annual Total Returns | | | | | | |
| Periods ended February 28, 2006 | | Past 1 | | Past 5 | | Past 10 |
| | | year | | years | | years |
| Select Multimedia | | 10.48% | | 5.02% | | 10.06% |
$10,000 Over 10 Years
Let’s say hypothetically that $10,000 was invested in Fidelity Select Multimedia Portfolio on February 29, 1996. The chart shows how the value of your investment would have changed, and also shows how the S&P 500 Index performed over the same period.
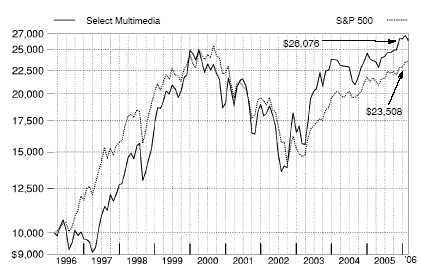
Management’s Discussion of Fund Performance
Comments from John Roth, Portfolio Manager of Fidelity® Select Multimedia Portfolio
With the exception of several popular large-cap stock performance measures, most major U.S. equity benchmarks had double-digit returns for the year ending February 28, 2006. For much of the period, market gains were driven largely by the energy sector, although utilities ultimately sneaked into the top spot for the year overall. Financials and telecommunication services also reached double figures, outperforming the 8.40% return of the broader market as measured by the large-cap-oriented Standard & Poor’s 500SM Index. The consumer discretionary segment — home to the weak performing automobile and media industries — was the biggest disappointment. Although the overall return for the S&P 500® beat the small-cap Russell 2000® Index in calendar year 2005 — the first time that’s happened in six years — small-caps stormed back in early 2006, leading to a 16.59% advance during the past 12 months, nearly twice the broader market’s gain. Mid-caps soared even higher, returning 17.67% according to the Russell Midcap® Index. The technology-heavy NASDAQ Composite® Index also fared well, climbing 12.13%, but the Dow Jones Industrial AverageSM, an index of 30 large-cap, blue-chip stocks, managed to rise only 4.52% .
For the 12-month period ending February 28, 2006, the fund returned 10.48%, outperforming the 3.31% return of the Goldman Sachs® Consumer Industries Index as well as the S&P 500. Advertisers continued to shift spending out of traditional media such as radio, television and print, and into online media such as paid search and branded advertising. The fund benefited from that trend relative to the sector index by holding sizable out-of-benchmark positions in Internet search engine Google and Internet ad agency aQuantive, whose stocks soared. The fund also avoided several traditional media firms in the index whose stocks declined, including Comcast and Liberty Media. Performance was further helped by positions in publisher McGraw-Hill, whose Standard & Poor’s division delivered strong earnings results, and cellular tower operator American Tower, another out-of-index holding. On the negative side, stock selection in the home entertainment software (video game) industry and an overweighting in the weak performing publishing segment dragged on results. Disappointing earnings growth at radio broadcaster XM Satellite Radio — not a component of the benchmark — and at advertising agency Omnicom caused the fund’s holdings in both firms to decline. A pair of newspaper stocks also hurt results, as subscriptions and advertising slipped at The Washington Post and at Gannett. By period end the fund no longer held stock in The Washington Post.
The views expressed above reflect those of the portfolio manager(s) only through the end of the period as stated on the cover of this report and do not necessarily represent the views of Fidelity or any other person in the Fidelity organization. Any such views are subject to change at any time based upon market or other conditions and Fidelity disclaims any responsibility to update such views. These views may not be relied on as investment advice and, because investment decisions for a Fidelity fund are based on numerous factors, may not be relied on as an indication of trading intent on behalf of any Fidelity fund.
39 39 Annual Report
Multimedia Portfolio
Investment Changes
| Top Ten Stocks as of February 28, 2006 |
| | | % of fund’s | | % of fund’s net assets |
| | | net assets | | 6 months ago |
| Google, Inc. Class A (sub. vtg.) | | 10.0 | | 10.7 |
| Yahoo!, Inc. | | 7.0 | | 8.0 |
| Walt Disney Co. | | 6.7 | | 7.1 |
| McGraw-Hill Companies, Inc. | | 6.6 | | 6.1 |
| Omnicom Group, Inc. | | 5.3 | | 5.0 |
| Viacom, Inc. Class B (non-vtg.) | | 5.2 | | 0.0 |
| News Corp. Class A | | 5.1 | | 6.0 |
| Gannett Co., Inc. | | 3.7 | | 4.4 |
| Expedia, Inc. | | 2.4 | | 0.0 |
| Monster Worldwide, Inc. | | 2.2 | | 1.0 |
| | | 54.2 | | |
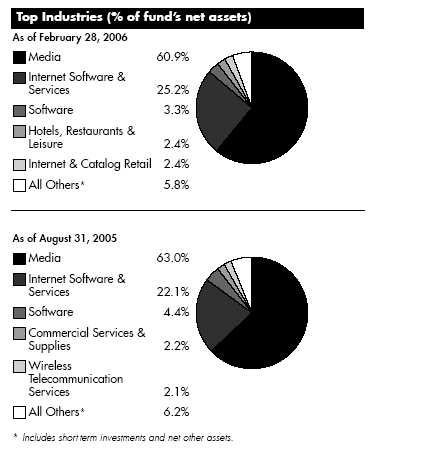
Annual Report 40
| Multimedia Portfolio | | | | | | |
| Investments February 28, 2006 | | | | |
| Showing Percentage of Net Assets | | | | | | |
| |
| Common Stocks — 99.5% | | | | | | |
| | | | | Shares | | Value (Note 1) |
| |
| COMMERCIAL SERVICES & SUPPLIES – 2.2% | | | | | | |
| Human Resource & Employment Services – 2.2% | | | | | | |
| Monster Worldwide, Inc. (a) | | | | 35,800 | | $ 1,752,768 |
| ELECTRONIC EQUIPMENT & INSTRUMENTS – 0.4% | | | | | | |
| Electronic Equipment & Instruments – 0.4% | | | | | | |
| Dolby Laboratories, Inc. Class A | | | | 14,000 | | 285,180 |
| HOTELS, RESTAURANTS & LEISURE – 2.4% | | | | | | |
| Hotels, Resorts & Cruise Lines – 2.4% | | | | | | |
| Ctrip.com International Ltd. sponsored ADR | | | | 13,500 | | 1,046,925 |
| eLong, Inc. sponsored ADR (a) | | | | 70,900 | | 902,557 |
| | | | | | | 1,949,482 |
| |
| HOUSEHOLD DURABLES – 0.6% | | | | | | |
| Consumer Electronics – 0.6% | | | | | | |
| Sony Corp. sponsored ADR | | | | 11,100 | | 520,368 |
| INTERNET & CATALOG RETAIL – 2.4% | | | | | | |
| Internet Retail – 2.4% | | | | | | |
| Expedia, Inc. (a) | | | | 101,500 | | 1,925,455 |
| INTERNET SOFTWARE & SERVICES – 25.2% | | | | | | |
| Internet Software & Services – 25.2% | | | | | | |
| AD Pepper Media International NV (a) | | | | 33,300 | | 406,497 |
| aQuantive, Inc. (a) | | | | 58,800 | | 1,563,492 |
| CNET Networks, Inc. (a) | | | | 30,700 | | 424,888 |
| Digitas, Inc. (a) | | | | 29,500 | | 416,835 |
| eBay, Inc. (a) | | | | 10,300 | | 412,618 |
| Google, Inc. Class A (sub. vtg.) (a) | | | | 22,300 | | 8,086,425 |
| Homestore, Inc. (a) | | | | 106,000 | | 659,320 |
| iVillage, Inc. (a) | | | | 111,300 | | 907,095 |
| NHN Corp. (a) | | | | 1,600 | | 452,655 |
| Sina Corp. (a) | | | | 13,400 | | 299,758 |
| Sohu.com, Inc. (a) | | | | 14,500 | | 304,935 |
| ValueClick, Inc. (a) | | | | 25,000 | | 437,750 |
| WebSideStory, Inc. (a) | | | | 19,300 | | 302,431 |
| Yahoo!, Inc. (a) | | | | 176,450 | | 5,656,987 |
| | | | | | | 20,331,686 |
| |
| MEDIA – 60.9% | | | | | | |
| Advertising – 9.6% | | | | | | |
| Focus Media Holding Ltd. ADR | | | | 3,200 | | 167,200 |
| Harte-Hanks, Inc. | | | | 14,100 | | 394,941 |
| Interpublic Group of Companies, Inc. (a) | | | | 137,047 | | 1,419,807 |
| JC Decaux SA (a) | | | | 8,300 | | 208,278 |
| Lamar Advertising Co. Class A (a) | | | | 24,200 | | 1,234,684 |
| Omnicom Group, Inc. | | | | 53,800 | | 4,294,316 |
| | | | | | | 7,719,226 |
| Broadcasting & Cable TV – 15.1% | | | | | | |
| Central European Media Enterprises Ltd. Class A (a) | | | | 21,200 | | 1,221,756 |
| Clear Channel Communications, Inc. | | | | 43,300 | | 1,225,390 |
| E.W. Scripps Co. Class A | | | | 30,200 | | 1,452,016 |
| |
| |
| |
| See accompanying notes which are an integral part of the financial statements. | | | | |
41
41 Annual Report
| Multimedia Portfolio | | | | |
| Investments - continued | | | | |
| |
| |
| |
| | | Shares | | Value (Note 1) |
| EchoStar Communications Corp. Class A (a) | | 49,900 | | $ 1,465,563 |
| Gestevision Telecinco SA | | 8,100 | | 197,948 |
| Grupo Televisa SA de CV (CPO) sponsored ADR | | 15,100 | | 1,184,746 |
| Impresa SGPS (a) | | 32,900 | | 200,022 |
| Liberty Global, Inc.: | | | | |
| Class A | | 36,744 | | 746,271 |
| Class C (a) | | 36,744 | | 712,834 |
| Mediaset Spa | | 35,100 | | 413,406 |
| NTL, Inc. (a) | | 6,400 | | 421,440 |
| Radio One, Inc. Class D (non-vtg.) (a) | | 58,900 | | 491,226 |
| TiVo, Inc. (a)(d) | | 54,300 | | 301,365 |
| TVN SA (a) | | 17,480 | | 514,344 |
| Univision Communications, Inc. Class A (a) | | 24,300 | | 812,835 |
| XM Satellite Radio Holdings, Inc. Class A (a) | | 36,200 | | 799,658 |
| | | | | 12,160,820 |
| Movies & Entertainment – 20.5% | | | | |
| Carmike Cinemas, Inc. | | 28,700 | | 683,634 |
| News Corp.: | | | | |
| Class A | | 252,682 | | 4,113,663 |
| Class B | | 34,300 | | 588,245 |
| Playboy Enterprises, Inc. Class B (non-vtg.) (a) | | 56,760 | | 786,694 |
| Regal Entertainment Group Class A | | 24,200 | | 460,284 |
| Viacom, Inc. Class B (non-vtg.) | | 104,200 | | 4,163,832 |
| The Walt Disney Co. (d) | | 194,800 | | 5,452,452 |
| World Wrestling Entertainment, Inc. Class A | | 22,300 | | 333,385 |
| | | | | 16,582,189 |
| Publishing – 15.7% | | | | |
| ADVO, Inc. | | 13,800 | | 443,670 |
| Dow Jones & Co., Inc. | | 17,200 | | 699,180 |
| Gannett Co., Inc. | | 48,500 | | 3,014,760 |
| Getty Images, Inc. (a) | | 20,500 | | 1,661,115 |
| McGraw-Hill Companies, Inc. | | 101,000 | | 5,362,090 |
| Media General, Inc. Class A | | 16,400 | | 821,640 |
| Reuters Group PLC sponsored ADR | | 17,800 | | 710,754 |
| | | | | 12,713,209 |
| |
| TOTAL MEDIA | | | | 49,175,444 |
| |
| SOFTWARE – 3.3% | | | | |
| Application Software – 1.6% | | | | |
| NDS Group PLC sponsored ADR (a) | | 27,000 | | 1,300,050 |
| Home Entertainment Software – 1.7% | | | | |
| Activision, Inc. (a) | | 30,266 | | 378,325 |
See accompanying notes which are an integral part of the financial statements.
Annual Report 42
Common Stocks – continued
|
SOFTWARE – CONTINUED
Home Entertainment Software – continued
|
| Electronic Arts, Inc. (a) | | 7,600 | | $ 394,972 |
| Shanda Interactive Entertainment Ltd. sponsored ADR (a)(d) | | 42,300 | | 573,165 |
| | | | | 1,346,462 |
| TOTAL SOFTWARE | | | | 2,646,512 |
| |
| WIRELESS TELECOMMUNICATION SERVICES – 2.1% | | | | |
| Wireless Telecommunication Services – 2.1% | | | | |
| American Tower Corp. Class A (a) | | 52,330 | | 1,665,664 |
| TOTAL COMMON STOCKS | | | | |
| (Cost $60,302,473) | | | | 80,252,559 |
| Money Market Funds — 8.7% | | | | |
| | | Shares | | Value (Note 1) |
| Fidelity Cash Central Fund, 4.57% (b) | | 562,373 | | $ 562,373 |
| Fidelity Securities Lending Cash Central Fund, 4.58% (b)(c) | | 6,479,000 | | 6,479,000 |
| TOTAL MONEY MARKET FUNDS | | | | |
| (Cost $7,041,373) | | | | 7,041,373 |
| TOTAL INVESTMENT PORTFOLIO - 108.2% | | | | |
| (Cost $67,343,846) | | | | 87,293,932 |
| |
| NET OTHER ASSETS – (8.2)% | | | | (6,578,629) |
| NET ASSETS – 100% | | | | $ 80,715,303 |
(a) Non-income producing
(b) Affiliated fund that is available only to investment companies and other accounts managed by Fidelity Investments. The rate quoted is the annualized seven-day yield of the fund at period end. A complete unaudited listing of the fund’s holdings as of its most recent quarter end is available upon request.
(c) Investment made with cash collateral received from securities on loan. (d) Security or a portion of the security is on loan at period end.
Information regarding fiscal year to date income earned by the fund from the affiliated Central funds is as follows:
| Fund | | Income earned |
| Fidelity Cash Central Fund | | $ | | 64,801 |
| Fidelity Securities Lending Cash Central Fund | | | | 32,268 |
| Total | | $ | | 97,069 |
Distribution of investments by country of issue, as a percentage of total net assets, is as follows:
| United States of America | | 87.1% |
| United Kingdom | | 2.5% |
| Cayman Islands | | 2.4% |
| Bermuda | | 1.5% |
| Mexico | | 1.5% |
| |
| |
| See accompanying notes which are an integral part of the financial statements. | | |
43
43 Annual Report
| Multimedia Portfolio | | |
| Investments - continued | | |
| |
| |
| China | | 1.3% |
| Others (individually less than 1%) | | 3.7% |
| | | 100.0% |
See accompanying notes which are an integral part of the financial statements.
Annual Report 44
| Multimedia Portfolio | | | | | | |
| |
| Financial Statements | | | | | | |
| |
| |
| Statement of Assets and Liabilities | | | | | | |
| | | | | | | February 28, 2006 |
| |
| Assets | | | | | | |
| Investment in securities, at value (including securities loaned of $6,149,810) — See accompanying schedule: | | | | | | |
| Unaffiliated issuers (cost $60,302,473) | | $ | | 80,252,559 | | |
| Affiliated Central Funds (cost $7,041,373) | | | | 7,041,373 | | |
| Total Investments (cost $67,343,846) | | | | $ | | 87,293,932 |
| Foreign currency held at value (cost $11,843) | | | | | | 12,019 |
| Receivable for fund shares sold | | | | | | 121,984 |
| Dividends receivable | | | | | | 35,745 |
| Interest receivable | | | | | | 1,646 |
| Prepaid expenses | | | | | | 343 |
| Other receivables | | | | | | 6,038 |
| Total assets | | | | | | 87,471,707 |
| |
| Liabilities | | | | | | |
| Payable to custodian bank | | $ | | 9,596 | | |
| Payable for fund shares redeemed | | | | 173,233 | | |
| Accrued management fee | | | | 39,332 | | |
| Other affiliated payables | | | | 28,121 | | |
| Other payables and accrued expenses | | | | 27,122 | | |
| Collateral on securities loaned, at value | | | | 6,479,000 | | |
| Total liabilities | | | | | | 6,756,404 |
| |
| Net Assets | | | | $ | | 80,715,303 |
| Net Assets consist of: | | | | | | |
| Paid in capital | | | | $ | | 54,535,189 |
| Accumulated net investment loss | | | | | | (79) |
| Accumulated undistributed net realized gain (loss) on investments and foreign currency transactions | | | | | | 6,229,931 |
| Net unrealized appreciation (depreciation) on investments and assets and liabilities in foreign currencies | | | | | | 19,950,262 |
| Net Assets, for 1,705,332 shares outstanding | | | | $ | | 80,715,303 |
| Net Asset Value, offering price and redemption price per share ($80,715,303 ÷ 1,705,332 shares) | | | | $ | | 47.33 |
| |
| Statement of Operations | | | | | | Year ended February 28, 2006 |
| | | | | | | |
| |
| Investment Income | | | | | | |
| Dividends | | | | $ | | 611,763 |
| Interest | | | | | | 73 |
| Income from affiliated Central Funds (including $32,268 from security lending) | | | | | | 97,069 |
| Total income | | | | | | 708,905 |
| |
| Expenses | | | | | | |
| Management fee | | $ | | 521,414 | | |
| Transfer agent fees | | | | 334,638 | | |
| Accounting and security lending fees | | | | | | |
| | | | | 46,397 | | |
| Independent trustees’ compensation | | | | 413 | | |
| Custodian fees and expenses | | | | 18,828 | | |
| Registration fees | | | | 19,344 | | |
| Audit | | | | 34,073 | | |
| Legal | | | | 1,199 | | |
| Miscellaneous | | | | 2,127 | | |
| Total expenses before reductions | | | | 978,433 | | |
| Expense reductions | | | | (26,337) | | 952,096 |
| |
| Net investment income (loss) | | | | | | (243,191) |
| Realized and Unrealized Gain (Loss) | | | | | | |
| Net realized gain (loss) on: | | | | | | |
| Investment securities: | | | | | | |
| |
| See accompanying notes which are an integral part of the financial statements. | | | | | | |
Year ended February 28, 200645 Annual Report
| Multimedia Portfolio | | | | |
| Financial Statements - continued | | | | |
| |
| |
| Unaffiliated issuers | | 8,624,319 | | |
| Foreign currency transactions | | (889) | | |
| Total net realized gain (loss) | | | | 8,623,430 |
| Change in net unrealized appreciation (depreciation) on: | | | | |
| Investment securities | | (81,904) | | |
| Assets and liabilities in foreign currencies | | 173 | | |
| Total change in net unrealized appreciation (depreciation) | | | | (81,731) |
| Net gain (loss) | | | | 8,541,699 |
| Net increase (decrease) in net assets resulting from operations | | | | $ 8,298,508 |
See accompanying notes which are an integral part of the financial statements.
Annual Report 46
| Statement of Changes in Net Assets | | | | |
| | | Year ended | | Year ended |
| | | February 28, | | February 28, |
| | | 2006 | | 2005 |
| Increase (Decrease) in Net Assets | | | | |
| Operations | | | | |
| Net investment income (loss) | | $ (243,191) | | $ (518,933) |
| Net realized gain (loss) | | 8,623,430 | | 1,620,980 |
| Change in net unrealized appreciation (depreciation) | | (81,731) | | (2,029,136) |
| Net increase (decrease) in net assets resulting from operations | | 8,298,508 | | (927,089) |
| Distributions to shareholders from net realized gain | | (1,681,202) | | (3,811,959) |
| Share transactions | | | | |
| Proceeds from sales of shares | | 36,474,405 | | 69,736,354 |
| Reinvestment of distributions | | 1,612,799 | | 3,646,253 |
| Cost of shares redeemed | | (89,613,233) | | (106,871,734) |
| Net increase (decrease) in net assets resulting from share transactions | | (51,526,029) | | (33,489,127) |
| Redemption fees | | 8,889 | | 17,675 |
| Total increase (decrease) in net assets | | (44,899,834) | | (38,210,500) |
| |
| Net Assets | | | | |
| Beginning of period | | 125,615,137 | | 163,825,637 |
| End of period (including accumulated net investment loss of $79 and accumulated net investment loss of $110, | | $ 80,715,303 | | $ 125,615,137 |
| respectively) | | | | |
| |
| Other Information | | | | |
| Shares | | | | |
| Sold | | 781,583 | | 1,629,867 |
| Issued in reinvestment of distributions | | 33,434 | | 82,334 |
| Redeemed | | (1,993,938) | | (2,482,074) |
| Net increase (decrease) | | (1,178,921) | | (769,873) |
| Financial Highlights | | | | | | | | | | |
| Years ended February 28, | | 2006 | | 2005 | | 2004F | | 2003 | | 2002 |
| Selected Per-Share Data | | | | | | | | | | |
| Net asset value, beginning of period | | $ 43.55 | | $ 44.83 | | $ 32.10 | | $ 37.38 | | $ 41.91 |
| Income from Investment Operations | | | | | | | | | | |
| Net investment income (loss)C | | (.12) | | (.18) | | (.31) | | (.20) | | (.18) |
| Net realized and unrealized gain (loss) | | 4.70 | | .19D | | 16.49 | | (5.14) | | (4.36) |
| Total from investment operations | | 4.58 | | .01 | | 16.18 | | (5.34) | | (4.54) |
| Distributions from net realized gain | | (.80) | | (1.30) | | (3.47) | | — | | — |
| Redemption fees added to paid in capitalC | | —G | | .01 | | .02 | | .06 | | .01 |
| Net asset value, end of period | | $ 47.33 | | $ 43.55 | | $ 44.83 | | $ 32.10 | | $ 37.38 |
| Total ReturnA,B | | 10.48% | | .01% | | 50.99% | | (14.13)% | | (10.81)% |
| Ratios to Average Net AssetsE | | | | | | | | | | |
| Expenses before reductions | | 1.07% | | 1.07% | | 1.17% | | 1.29% | | 1.13% |
| Expenses net of fee waivers, if any | | 1.07% | | 1.07% | | 1.17% | | 1.29% | | 1.13% |
| Expenses net of all reductions | | 1.04% | | 1.03% | | 1.09% | | 1.13% | | 1.10% |
| Net investment income (loss) | | (.27)% | | (.42)% | | (.75)% | | (.59)% | | (.46)% |
| Supplemental Data | | | | | | | | | | |
| Net assets, end of period (000 omitted) | | $ 80,715 | | $ 125,615 | | $ 163,826 | | $ 100,111 | | $ 140,070 |
| Portfolio turnover rate | | 48% | | 88% | | 208% | | 272% | | 74% |
ATotal returns would have been lower had certain expenses not been reduced during the periods shown. BTotal returns do not include the effect of the former sales charges. CCalculated based on average shares outstanding during the period. DThe amount shown for a share outstanding does not correspond with the aggregate net gain (loss) on investments for the period due to the timing of sales and repurchases of shares in relation to fluctuating market values of the investments of the fund. EExpense ratios reflect operating expenses of the fund. Expenses before reductions do not reflect amounts reimbursed by the investment adviser or reductions from brokerage service arrangements or other expense offset arrangements and do not represent the amount paid by the fund during periods when reimbursements or reductions occur. Expenses net of fee waivers reflect expenses after reimbursement by the investment adviser but prior to reductions from brokerage service arrange ments or other expense offset arrangements. Expenses net of all reductions represent the net expenses paid by the fund. FFor the year ended February 29. GAmount represents less than $.01 per share.
See accompanying notes which are an integral part of the financial statements.
|
Retailing Portfolio
Performance
|
Average annual total return reflects the change in the value of an investment, assuming reinvestment of the fund’s dividend income and capital gains (the profits earned upon the sale of securities that have grown in value) and assuming a constant rate of performance each year. The $10,000 table and the fund’s returns do not reflect the deduction of taxes that a shareholder would pay on fund distributions or the redemption of fund shares. During periods of reimbursement by Fidelity a fund’s total returns will be greater than it would be had the reimbursement not occurred. How a fund did yesterday is no guarantee of how it will do tomorrow.
| Average Annual Total Returns | | | | | | |
| Periods ended February 28, 2006 | | Past 1 | | Past 5 | | Past 10 |
| | | year | | years | | years |
| Select Retailing | | 12.77% | | 5.32% | | 11.62% |
| |
| $10,000 Over 10 Years | | | | | | |
Let’s say hypothetically that $10,000 was invested in Fidelity Select Retailing Portfolio on February 29, 1996. The chart shows how the value of your investment would have changed, and also shows how the S&P 500 Index performed over the same period.
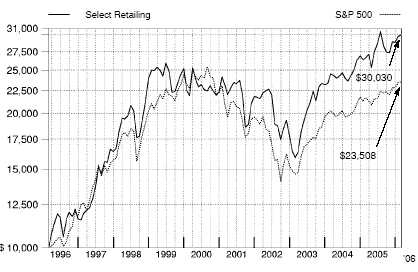
Management’s Discussion of Fund Performance
Comments from Martin Zinny, Portfolio Manager of Fidelity® Select Retailing Portfolio
With the exception of several popular large-cap stock performance measures, most major U.S. equity benchmarks had double-digit returns for the year ending February 28, 2006. For much of the period, market gains were driven largely by the energy sector, although utilities ultimately sneaked into the top spot for the year overall. Financials and telecommunication services also reached double figures, outperforming the 8.40% return of the broader market as measured by the large-cap-oriented Standard & Poor’s 500SM Index. The consumer discretionary segment — home to the weak performing automobile and media industries — was the biggest disappointment. Although the overall return for the S&P 500® beat the small-cap Russell 2000® Index in calendar year 2005 — the first time that’s happened in six years — small-caps stormed back in early 2006, leading to a 16.59% advance during the past 12 months, nearly twice the broader market’s gain. Mid-caps soared even higher, returning 17.67% according to the Russell Midcap® Index. The technology-heavy NASDAQ Composite® Index also fared well, climbing 12.13%, but the Dow Jones Industrial AverageSM, an index of 30 large-cap, blue-chip stocks, managed to rise only 4.52% .
The fund posted a solid 12.77% gain during the past year, topping the Goldman Sachs® Consumer Industries Index, which returned 3.31%, and the S&P 500. In addition to the fund’s focus on retail stocks, which outperformed most major consumer industries during the period, good stock selection played a key role in our success versus the sector benchmark. In terms of investment themes, the fund benefited most from turnarounds and profit margin recovery stories, with upscale department store chain Nordstrom leading the way during the period. Nordstrom continued to profit from better merchandising decisions aided by the recent completion of numerous systems upgrades. Office Depot also contributed. A new CEO implemented a restructuring plan to drive profit margins higher, refocused the organization on return on invested capital, and implemented an aggressive share repurchase plan. Another contributor was Zumiez, a surf/skate teen concept retailer that went public in May 2005. Solid business execution and strong merchandising drove better-than-expected same-store sales and earnings growth. Women’s apparel retailer Chico’s FAS boosted returns as well. The fund was hurt the most by not owning two major components of the sector index — tobacco/food conglomerate Altria Group and household products giant Procter & Gamble — that did well. eBay detracted when it announced weaker-than-expected growth rates in the United States and Germany. News of another acquisition by the company led some investors to question the future growth of eBay’s core business and whether it needs acquisitions in order to grow.
The views expressed above reflect those of the portfolio manager(s) only through the end of the period as stated on the cover of this report and do not necessarily represent the views of Fidelity or any other person in the Fidelity organization. Any such views are subject to change at any time based upon market or other conditions and Fidelity disclaims any responsibility to update such views. These views may not be relied on as investment advice and, because investment decisions for a Fidelity fund are based on numerous factors, may not be relied on as an indication of trading intent on behalf of any Fidelity fund.
49 49 Annual Report
Retailing Portfolio
Investment Changes
| Top Ten Stocks as of February 28, 2006 |
| | | % of fund’s | | % of fund’s net assets |
| | | net assets | | 6 months ago |
| Federated Department Stores, Inc. | | 6.6 | | 7.2 |
| Target Corp. | | 5.2 | | 6.0 |
| Wal-Mart Stores, Inc. | | 5.1 | | 5.1 |
| eBay, Inc. | | 4.2 | | 2.0 |
| McDonald’s Corp. | | 4.1 | | 3.8 |
| CVS Corp. | | 3.6 | | 6.8 |
| Best Buy Co., Inc. | | 3.5 | | 2.3 |
| Home Depot, Inc. | | 3.4 | | 4.8 |
| Deckers Outdoor Corp. | | 2.8 | | 0.0 |
| JCPenney Co., Inc. | | 2.8 | | 3.4 |
| | | 41.3 | | |
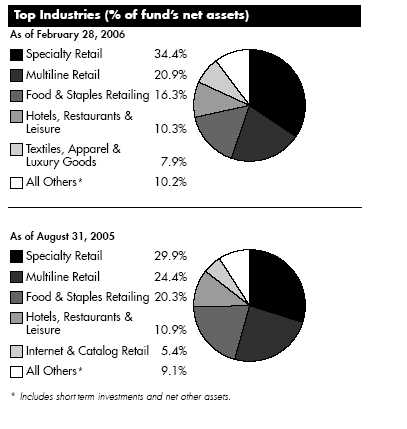
Annual Report 50
| Retailing Portfolio | | | | | | | | |
| Investments February 28, 2006 | | | | |
| Showing Percentage of Net Assets | | | | | | | | |
| |
| Common Stocks — 97.6% | | | | | | | | |
| | | | | | | Shares | | Value (Note 1) |
| |
| DIVERSIFIED CONSUMER SERVICES – 0.1% | | | | | | | | |
| Specialized Consumer Services – 0.1% | | | | | | | | |
| Sothebys Holdings, Inc. Class A (ltd. vtg.) (a) | | | | | | 4,400 | | $ 92,928 |
| FOOD & STAPLES RETAILING – 16.3% | | | | | | | | |
| Drug Retail – 6.0% | | | | | | | | |
| CVS Corp. | | | | | | 85,000 | | 2,408,050 |
| Walgreen Co. | | | | | | 35,500 | | 1,592,530 |
| | | | | | | | | 4,000,580 |
| Food Retail – 3.2% | | | | | | | | |
| Albertsons, Inc. | | | | | | 23,000 | | 585,120 |
| Safeway, Inc. | | | | | | 42,000 | | 1,021,020 |
| Whole Foods Market, Inc. | | | | | | 9,000 | | 574,920 |
| | | | | | | | | 2,181,060 |
| Hypermarkets & Super Centers – 7.1% | | | | | | | | |
| BJ’s Wholesale Club, Inc. (a) | | | | | | 5,700 | | 180,462 |
| Costco Wholesale Corp. | | | | | | 15,700 | | 805,096 |
| Wal-Mart de Mexico SA de CV Series V | | | | | | 129,000 | | 369,408 |
| Wal-Mart Stores, Inc. | | | | | | 75,000 | | 3,402,000 |
| | | | | | | | | 4,756,966 |
| |
| TOTAL FOOD & STAPLES RETAILING | | | | | | | | 10,938,606 |
| |
| HOTELS, RESTAURANTS & LEISURE – 10.3% | | | | | | | | |
| Restaurants – 10.3% | | | | | | | | |
| Buffalo Wild Wings, Inc. (a) | | | | | | 5,000 | | 189,650 |
| Cosi, Inc. (a) | | | | | | 40,000 | | 372,400 |
| Domino’s Pizza, Inc. | | | | | | 10,000 | | 255,000 |
| McDonald’s Corp. | | | | | | 78,500 | | 2,740,435 |
| Outback Steakhouse, Inc. | | | | | | 8,200 | | 342,842 |
| Red Robin Gourmet Burgers, Inc. (a) | | | | | | 9,600 | | 383,904 |
| Starbucks Corp. (a) | | | | | | 42,300 | | 1,536,336 |
| Wendy’s International, Inc. | | | | | | 18,000 | | 1,042,200 |
| Yum! Brands, Inc. | | | | | | 800 | | 38,160 |
| | | | | | | | | 6,900,927 |
| |
| HOUSEHOLD DURABLES – 0.2% | | | | | | | | |
| Housewares & Specialties – 0.2% | | | | | | | | |
| Yankee Candle Co., Inc. | | | | | | 5,000 | | 145,200 |
| INTERNET & CATALOG RETAIL – 2.8% | | | | | | | | |
| Catalog Retail – 1.9% | | | | | | | | |
| Coldwater Creek, Inc. (a) | | | | | | 56,000 | | 1,258,320 |
| Internet Retail – 0.9% | | | | | | | | |
| Amazon.com, Inc. (a) | | | | | | 3,100 | | 116,219 |
| Blue Nile, Inc. (a)(d) | | | | | | 13,300 | | 443,821 |
| GSI Commerce, Inc. (a) | | | | | | 5,000 | | 79,750 |
| | | | | | | | | 639,790 |
| |
| TOTAL INTERNET & CATALOG RETAIL | | | | | | | | 1,898,110 |
See accompanying notes which are an integral part of the financial statements.
|
51 Annual Report
51
| Retailing Portfolio | | | | |
| Investments - continued | | | | |
| |
| |
| |
| | | Shares | | Value (Note 1) |
| |
| INTERNET SOFTWARE & SERVICES – 4.2% | | | | |
| Internet Software & Services – 4.2% | | | | |
| eBay, Inc. (a) | | 69,500 | | $ 2,784,170 |
| LEISURE EQUIPMENT & PRODUCTS – 0.5% | | | | |
| Leisure Products – 0.5% | | | | |
| Nautilus, Inc. (d) | | 20,000 | | 329,000 |
| MULTILINE RETAIL – 20.9% | | | | |
| Department Stores – 15.6% | | | | |
| Federated Department Stores, Inc. | | 62,500 | | 4,439,999 |
| JCPenney Co., Inc. | | 31,500 | | 1,847,160 |
| KarstadtQuelle AG (a)(d) | | 30,000 | | 734,572 |
| Marks & Spencer Group PLC | | 9,700 | | 88,224 |
| Nordstrom, Inc. | | 43,000 | | 1,634,000 |
| Saks, Inc. | | 36,000 | | 680,400 |
| Sears Holdings Corp. (a) | | 8,364 | | 1,007,444 |
| | | | | 10,431,799 |
| General Merchandise Stores – 5.3% | | | | |
| Family Dollar Stores, Inc. | | 3,000 | | 77,160 |
| Target Corp. | | 64,000 | | 3,481,600 |
| | | | | 3,558,760 |
| |
| TOTAL MULTILINE RETAIL | | | | 13,990,559 |
| |
| SPECIALTY RETAIL – 34.4% | | | | |
| Apparel Retail – 14.7% | | | | |
| Abercrombie & Fitch Co. Class A | | 19,000 | | 1,279,080 |
| Aeropostale, Inc. (a) | | 16,000 | | 459,040 |
| AnnTaylor Stores Corp. (a) | | 1,500 | | 54,450 |
| bebe Stores, Inc. | | 2,000 | | 34,340 |
| Casual Male Retail Group, Inc. (a) | | 10,000 | | 91,100 |
| Charlotte Russe Holding, Inc. (a) | | 44,000 | | 800,800 |
| Chico’s FAS, Inc. (a) | | 21,500 | | 1,011,575 |
| Dress Barn, Inc. (a) | | 2,000 | | 86,360 |
| Eddie Bauer Holdings, Inc. (a) | | 15,000 | | 225,000 |
| Gymboree Corp. (a) | | 65,000 | | 1,485,900 |
| Hot Topic, Inc. (a) | | 16,100 | | 212,198 |
| Jos. A. Bank Clothiers, Inc. (a) | | 5,000 | | 223,050 |
| Limited Brands, Inc. | | 12,000 | | 284,040 |
| Pacific Sunwear of California, Inc. (a) | | 11,000 | | 261,910 |
| Ross Stores, Inc. | | 12,000 | | 339,840 |
| The Children’s Place Retail Stores, Inc. (a) | | 4,000 | | 186,680 |
| TJX Companies, Inc. | | 44,000 | | 1,077,560 |
| Too, Inc. (a) | | 5,000 | | 152,150 |
| Urban Outfitters, Inc. (a) | | 26,000 | | 730,600 |
| Volcom, Inc. | | 1,800 | | 61,632 |
| Wet Seal, Inc. Class A (a) | | 25,000 | | 132,750 |
| Zumiez, Inc. | | 12,000 | | 637,560 |
| | | | | 9,827,615 |
| Automotive Retail – 1.6% | | | | |
| Asbury Automotive Group, Inc. (a) | | 8,000 | | 153,200 |
See accompanying notes which are an integral part of the financial statements.
Annual Report 52
| Common Stocks – continued | | | | |
| | | Shares | | Value (Note 1) |
| |
| SPECIALTY RETAIL – CONTINUED | | | | |
| Automotive Retail – continued | | | | |
| AutoZone, Inc. (a) | | 7,000 | | $ 676,760 |
| Lithia Motors, Inc. Class A (sub. vtg.) | | 7,000 | | 224,280 |
| | | | | 1,054,240 |
| Computer & Electronics Retail – 6.4% | | | | |
| Best Buy Co., Inc. | | 43,000 | | 2,315,980 |
| Circuit City Stores, Inc. | | 57,000 | | 1,369,710 |
| Gamestop Corp. Class A (a) | | 14,563 | | 582,957 |
| | | | | 4,268,647 |
| Home Improvement Retail – 5.8% | | | | |
| Home Depot, Inc. | | 54,000 | | 2,276,100 |
| Lowe’s Companies, Inc. (d) | | 23,500 | | 1,602,230 |
| | | | | 3,878,330 |
| Homefurnishing Retail – 0.1% | | | | |
| Cost Plus, Inc. (a) | | 5,000 | | 95,950 |
| Specialty Stores – 5.8% | | | | |
| Office Depot, Inc. (a) | | 50,000 | | 1,784,000 |
| OfficeMax, Inc. | | 4,000 | | 117,320 |
| Staples, Inc. | | 61,500 | | 1,509,210 |
| Tiffany & Co., Inc. | | 13,000 | | 482,690 |
| | | | | 3,893,220 |
| |
| TOTAL SPECIALTY RETAIL | | | | 23,018,002 |
| |
| TEXTILES, APPAREL & LUXURY GOODS – 7.9% | | | | |
| Apparel, Accessories & Luxury Goods – 4.7% | | | | |
| Carter’s, Inc. (a) | | 16,000 | | 1,023,840 |
| Coach, Inc. (a) | | 31,500 | | 1,125,180 |
| Liz Claiborne, Inc. | | 3,000 | | 108,090 |
| Polo Ralph Lauren Corp. Class A | | 14,000 | | 811,440 |
| Quiksilver, Inc. (a) | | 5,000 | | 72,500 |
| | | | | 3,141,050 |
| Footwear – 3.2% | | | | |
| Deckers Outdoor Corp. (a)(d) | | 56,000 | | 1,898,400 |
| |
| |
| | | Shares | | Value (Note 1) |
| Iconix Brand Group, Inc. (a) | | 10,000 | | $ 133,800 |
| Skechers U.S.A., Inc. Class A (sub. vtg.) (a) | | 5,000 | | 106,000 |
| | | | | 2,138,200 |
| |
| TOTAL TEXTILES, APPAREL & LUXURY GOODS | | | | 5,279,250 |
| |
| TOTAL COMMON STOCKS | | | | |
| (Cost $52,184,410) | | | | 65,376,752 |
See accompanying notes which are an integral part of the financial statements.
|
53 Annual Report
53
| Retailing Portfolio | | | | |
| Investments - continued | | | | |
| |
| Money Market Funds — 10.6% | | | | |
| Fidelity Cash Central Fund, 4.57% (b) | | 2,404,166 | | 2,404,166 |
| Fidelity Securities Lending Cash Central Fund, 4.58% (b)(c) | | 4,702,300 | | 4,702,300 |
| TOTAL MONEY MARKET FUNDS | | | | |
| (Cost $7,106,466) | | | | 7,106,466 |
| TOTAL INVESTMENT PORTFOLIO - 108.2% | | | | |
| (Cost $59,290,876) | | | | 72,483,218 |
| |
| NET OTHER ASSETS – (8.2)% | | | | (5,474,127) |
| NET ASSETS – 100% | | $ | | 67,009,091 |
(a) Non-income producing
(b) Affiliated fund that is available only to investment companies and other accounts managed by Fidelity Investments. The rate quoted is the annualized seven-day yield of the fund at period end. A complete unaudited listing of the fund’s holdings as of its most recent quarter end is available upon request.
(c) Investment made with cash collateral received from securities on loan. (d) Security or a portion of the security is on loan at period end.
Information regarding fiscal year to date income earned by the fund from the affiliated Central funds is as follows:
| Fund | | Income earned |
| Fidelity Cash Central Fund | | $ 45,985 |
| Fidelity Securities Lending Cash Central Fund | | 76,842 |
| Total | | $ 122,827 |
See accompanying notes which are an integral part of the financial statements.
|
| Retailing Portfolio | | | | | | |
| |
| Financial Statements | | | | | | |
| |
| |
| Statement of Assets and Liabilities | | | | | | |
| | | | | | | February 28, 2006 |
| |
| Assets | | | | | | |
| Investment in securities, at value (including securities loaned of $4,421,083) — See accompanying schedule: | | | | | | |
| Unaffiliated issuers (cost $52,184,410) | | $ | | 65,376,752 | | |
| Affiliated Central Funds (cost $7,106,466) | | | | 7,106,466 | | |
| Total Investments (cost $59,290,876) | | | | | | $ 72,483,218 |
| Receivable for investments sold | | | | | | 558,172 |
| Receivable for fund shares sold | | | | | | 138,116 |
| Dividends receivable | | | | | | 23,507 |
| Interest receivable | | | | | | 1,956 |
| Prepaid expenses | | | | | | 442 |
| Other affiliated receivables | | | | | | 35 |
| Other receivables | | | | | | 12,332 |
| Total assets | | | | | | 73,217,778 |
| |
| Liabilities | | | | | | |
| Payable for investments purchased | | $ | | 1,191,714 | | |
| Payable for fund shares redeemed | | | | 236,448 | | |
| Accrued management fee | | | | 30,115 | | |
| Other affiliated payables | | | | 20,460 | | |
| Other payables and accrued expenses | | | | 27,650 | | |
| Collateral on securities loaned, at value | | | | 4,702,300 | | |
| Total liabilities | | | | | | 6,208,687 |
| |
| Net Assets | | | | | | $ 67,009,091 |
| Net Assets consist of: | | | | | | |
| Paid in capital | | | | | | $ 46,367,832 |
| Accumulated net investment loss | | | | | | (367) |
| Accumulated undistributed net realized gain (loss) on investments and foreign currency transactions | | | | | | 7,449,284 |
| Net unrealized appreciation (depreciation) on investments | | | | | | 13,192,342 |
| Net Assets, for 1,319,548 shares outstanding | | | | | | $ 67,009,091 |
| Net Asset Value, offering price and redemption price per share ($67,009,091 ÷ 1,319,548 shares) | | | | | | $ 50.78 |
| |
| Statement of Operations | | | | | | |
| | | | | | | Year ended February 28, 2006 |
| |
| Investment Income | | | | | | |
| Dividends | | | | $ | | 583,732 |
| Interest | | | | | | 116 |
| Income from affiliated Central Funds (including $76,842 from security lending) | | | | | | 122,827 |
| Total income | | | | | | 706,675 |
| |
| Expenses | | | | | | |
| Management fee | | $ | | 478,256 | | |
| Transfer agent fees | | | | 286,399 | | |
| Accounting and security lending fees | | | | | | |
| | | | | 42,980 | | |
| Independent trustees’ compensation | | | | 405 | | |
| Custodian fees and expenses | | | | 20,563 | | |
| Registration fees | | | | 29,783 | | |
| Audit | | | | 34,904 | | |
| Legal | | | | 545 | | |
| Miscellaneous | | | | 1,000 | | |
| Total expenses before reductions | | | | 894,835 | | |
| Expense reductions | | | | (20,658) | | 874,177 |
| |
| Net investment income (loss) | | | | | | (167,502) |
| Realized and Unrealized Gain (Loss) | | | | | | |
| Net realized gain (loss) on: | | | | | | |
| |
| See accompanying notes which are an integral part of the financial statements. | | | | | | |
55 Annual Report
| Retailing Portfolio | | | | |
| Financial Statements - continued | | | | |
| |
| |
| Investment securities: | | | | |
| Unaffiliated issuers | | 13,948,230 | | |
| Foreign currency transactions | | (1,295) | | |
| Total net realized gain (loss) | | | | 13,946,935 |
| Change in net unrealized appreciation (depreciation) on investment securities | | | | (4,974,621) |
| Net gain (loss) | | | | 8,972,314 |
| Net increase (decrease) in net assets resulting from operations | | | | $ 8,804,812 |
See accompanying notes which are an integral part of the financial statements.
Annual Report 56
| Statement of Changes in Net Assets | | | | | | | | | | | | | | | | | | | | | | |
| | | | | | | | | | | | | Year ended | | | | Year ended |
| | | | | | | | | | | | | February 28, | | | | February 28, |
| | | | | | | | | | | | | 2006 | | | | 2005 |
| Increase (Decrease) in Net Assets | | | | | | | | | | | | | | | | | | | | | | |
| Operations | | | | | | | | | | | | | | | | | | | | | | |
| Net investment income (loss) | | | | | | | | | | | | $ | | (167,502) | | $ | | | | (17,445) |
| Net realized gain (loss) | | | | | | | | | | | | | | 13,946,935 | | | | | | 5,780,924 |
| Change in net unrealized appreciation (depreciation) | | | | | | | | | | | | | | (4,974,621) | | | | | | 4,918,974 |
| Net increase (decrease) in net assets resulting from operations | | | | | | | | | | | | | | 8,804,812 | | | | 10,682,453 |
| Distributions to shareholders from net investment income | | | | | | | | | | | | | | | | — | | | | | | (26,703) |
| Distributions to shareholders from net realized gain | | | | | | | | | | | | | | (10,046,481) | | | | (1,335,153) |
| Total distributions | | | | | | | | | | | | | | (10,046,481) | | | | (1,361,856) |
| Share transactions | | | | | | | | | | | | | | | | | | | | | | |
| Proceeds from sales of shares | | | | | | | | | | | | | | 80,507,255 | | | | 95,086,571 |
| Reinvestment of distributions | | | | | | | | | | | | | | 9,613,165 | | | | | | 1,310,189 |
| Cost of shares redeemed | | | | | | | | | | | | (127,275,863) | | | | (87,502,356) |
| Net increase (decrease) in net assets resulting from share transactions | | | | | | | | | | | | (37,155,443) | | | | | | 8,894,404 |
| Redemption fees | | | | | | | | | | | | | | | | 59,867 | | | | | | 45,609 |
| Total increase (decrease) in net assets | | | | | | | | | | | | | | (38,337,245) | | | | 18,260,610 |
| |
| Net Assets | | | | | | | | | | | | | | | | | | | | | | |
| Beginning of period | | | | | | | | | | | | 105,346,336 | | | | 87,085,726 |
| End of period (including accumulated net investment loss of $367 and accumulated net investment loss of $512, | | | | | | | | | | | | |
| respectively) | | | | | | | | | | | | $ | | 67,009,091 | | $ | | 105,346,336 |
| |
| Other Information | | | | | | | | | | | | | | | | | | | | | | |
| Shares | | | | | | | | | | | | | | | | | | | | | | |
| Sold | | | | | | | | | | | | | | 1,540,646 | | | | | | 2,004,688 |
| Issued in reinvestment of distributions | | | | | | | | | | | | | | 193,514 | | | | | | 25,827 |
| Redeemed | | | | | | | | | | | | | | (2,484,756) | | | | (1,797,954) |
| Net increase (decrease) | | | | | | | | | | | | | | (750,596) | | | | | | 232,561 |
| |
| Financial Highlights | | | | | | | | | | | | | | | | | | | | | | |
| Years ended February 28, | | | | 2006 | | | | 2005 | | | | 2004E | | | | 2003 | | | | 2002 |
| Selected Per-Share Data | | | | | | | | | | | | | | | | | | | | | | |
| Net asset value, beginning of period | | $ | | 50.89 | | $ | | 47.39 | | $ | | 30.72 | | $ | | 41.67 | | $ | | 46.34 |
| Income from Investment Operations | | | | | | | | | | | | | | | | | | | | | | |
| Net investment income (loss)C | | | | (.10) | | | | (.01) | | | | (.19) | | | | (.28) | | | | (.23) |
| Net realized and unrealized gain (loss) | | | | 6.24 | | | | 4.00 | | | | 16.83 | | | | (10.70) | | | | (3.05) |
| Total from investment operations | | | | 6.14 | | | | 3.99 | | | | 16.64 | | | | (10.98) | | | | (3.28) |
| Distributions from net investment income | | | | — | | | | (.01) | | | | — | | | | — | | | | — |
| Distributions from net realized gain | | | | (6.29) | | | | (.50) | | | | — | | | | — | | | | (1.47) |
| Total distributions | | | | (6.29) | | | | (.51) | | | | — | | | | — | | | | (1.47) |
| Redemption fees added to paid in capitalC | | | | 04 | | | | .02 | | | | .03 | | | | .03 | | | | .08 |
| Net asset value, end of period | | $ | | 50.78 | | $ | | 50.89 | | $ | | 47.39 | | $ | | 30.72 | | $ | | 41.67 |
| Total ReturnA,B | | | | 12.77% | | | | 8.47% | | | | 54.26% | | | | (26.28)% | | | | (6.85)% |
| Ratios to Average Net AssetsD | | | | | | | | | | | | | | | | | | | | | | |
| Expenses before reductions | | | | 1.06% | | | | 1.08% | | | | 1.31% | | | | 1.32% | | | | 1.29% |
| Expenses net of fee waivers, if any | | | | 1.06% | | | | 1.08% | | | | 1.31% | | | | 1.32% | | | | 1.29% |
| Expenses net of all reductions | | | | 1.04% | | | | 1.03% | | | | 1.28% | | | | 1.25% | | | | 1.16% |
| Net investment income (loss) | | | | (.20)% | | | | (.02)% | | | | (.46)% | | | | (.74)% | | | | (.54)% |
| Supplemental Data | | | | | | | | | | | | | | | | | | | | | | |
| Net assets, end of period (000 omitted) | | $ | | 67,009 | | $ 105,346 | | $ | | 87,086 | | $ | | 63,627 | | $ 127,194 |
| Portfolio turnover rate | | | | 114% | | | | 94% | | | | 85% | | | | 149% | | | | 280% |
| |
| | | | | |
A Total returns would have been lower had certain expenses not been reduced during the periods shown. B Total returns do not include the effect of the former sales charges. C Calculated based on average shares outstanding during the period. DExpense ratios reflect operating expenses of the fund. Expenses before reductions do not reflect amounts reimbursed by the investment adviser or reductions from brokerage service arrangements or other expense offset arrangements and do not represent the amount paid by the fund during periods when reimbursements or reductions occur. Expenses net of fee waivers reflect expenses after reimbursement by the investment adviser but prior to reductions from brokerage service arrangements or other expense offset arrangements. Expenses net of all reductions represent the net expenses paid by the fund. EFor the year ended February 29.
See accompanying notes which are an integral part of the financial statements.
57
Notes to Financial Statements
For the period ended February 28, 2006
|
1. Significant Accounting Policies.
|
Consumer Industries Portfolio, Food and Agriculture Portfolio, Leisure Portfolio, Multimedia Portfolio, and Retailing Portfolio (the funds) are non-diversified funds of Fidelity Select Portfolios (the trust). The trust is registered under the Investment Company Act of 1940, as amended (the 1940 Act), as an open-end management investment company organized as a Massachusetts business trust. The funds invest primarily in securities of companies whose principal business activities fall within specific industries. Each fund is authorized to issue an unlimited number of shares. Certain funds may invest in affiliated money market central funds (Money Market Central Funds) which are open-end investment companies available to investment companies and other accounts managed by Fidelity Management & Research Company (FMR) and its affiliates. The financial statements have been prepared in conformity with accounting principles generally accepted in the United States of America, which require management to make certain estimates and assumptions at the date of the financial statements. The following summarizes the significant accounting policies of the funds:
Security Valuation. Investments are valued and net asset value (NAV) per share is calculated (NAV calculation) as of the close of business of the New York Stock Exchange (NYSE), normally 4:00 p.m. Eastern time. In addition, each fund intends to calculate a NAV each hour on the hour (commencing at 10:00 a.m. Eastern time until one hour prior to the close of business on the NYSE) under normal business conditions. Each fund’s investments are valued as of these times for the purpose of computing the fund’s hourly NAV. Wherever possible, each fund uses independent pricing services approved by the Board of Trustees to value their investments.
Equity securities, including restricted securities, for which market quotations are readily available, are valued at the last reported sale price or official closing price as reported by an independent pricing service on the primary market or exchange on which they are traded. In the event there were no sales during the day or closing prices are not available, securities are valued at the last quoted bid price. Investments in open-end mutual funds are valued at their closing net asset value each business day. Short-term securities with remaining maturities of sixty days or less for which quotations are not readily available are valued at amortized cost, which approximates value.
When current market prices or quotations are not readily available or do not accurately reflect fair value, valuations may be determined in accordance with procedures adopted by the Board of Trustees. For example, when developments occur between the close of a market and the close of the NYSE that may materially affect the value of some or all of the securities, or when trading in a security is halted, those securities may be fair valued. Factors used in the determination of fair value may include monitoring news to identify significant market or security specific events such as changes in the value of U.S. securities markets, reviewing developments in foreign markets and evaluating the performance of ADRs, futures contracts and exchange-traded funds. Because each fund’s utilization of fair value pricing depends on market activity, the frequency with which fair value pricing is used can not be predicted and may be utilized to a significant extent. The value of securities used for NAV calculation under fair value pricing may differ from published prices for the same securities. Fidelity may suspend the calculation of one or more hourly NAVs for funds for any period in which prices for a portion of the stocks or securities held by the funds are not readily available.
Foreign Currency. Certain funds may use foreign currency contracts to facilitate transactions in foreign-denominated securities. Losses from these transactions may arise from changes in the value of the foreign currency or if the counterparties do not perform under the contracts’ terms.
Foreign-denominated assets, including investment securities, and liabilities are translated into U.S. dollars at the exchange rate at period end. Purchases and sales of investment securities, income and dividends received and expenses denominated in foreign currencies are translated into U.S. dollars at the exchange rate in effect on the transaction date.
The effects of exchange rate fluctuations on investments are included with the net realized and unrealized gain (loss) on investment securities. Other foreign currency transactions resulting in realized and unrealized gain (loss) are disclosed separately.
Investment Transactions and Income. Security transactions are accounted for as of trade date. Gains and losses on securities sold are determined on the basis of identified cost and may include proceeds received from litigation. Dividend income is recorded on the ex-dividend date, except for certain dividends from foreign securities where the ex-dividend date may have passed, which are recorded as soon as the funds are informed of the ex-dividend date. Non-cash dividends included in dividend income, if any, are recorded at the fair market value of the securities received. Distributions received on securities that represent a return of capital or capital gain are recorded as a reduction of cost of investments and/or as a realized gain. The funds estimate the components of distributions received that may be considered return of capital distributions or capital gain distributions. Interest income is accrued as earned. Interest income includes coupon interest and amortization of premium and accretion of discount on debt securities. Investment income is recorded net of foreign taxes withheld where recovery of such taxes is uncertain.
Expenses. Most expenses of the trust can be directly attributed to a fund. Expenses which cannot be directly attributed are apportioned among each fund in the trust.
1. Significant Accounting Policies - continued
|
Income Tax Information and Distributions to Shareholders. Each year, each fund intends to qualify as a regulated investment company by distributing all of its taxable income and realized gains under Subchapter M of the Internal Revenue Code. As a result, no provision for income taxes is required in the accompanying financial statements. Foreign taxes are provided for based on each fund’s understanding of the tax rules and rates that exist in the foreign markets in which it invests.
Distributions are recorded on the ex-dividend date. Income and capital gain distributions are determined in accordance with income tax regulations, which may differ from generally accepted accounting principles. In addition, certain funds claimed a portion of the payment made to redeeming shareholders as a distribution for income tax purposes.
Capital accounts within the financial statements are adjusted for permanent book-tax differences. These adjustments have no impact on net assets or the results of operations. Temporary book-tax differences will reverse in a subsequent period.
Book-tax differences are primarily due to short-term capital gains, foreign currency transactions, deferred trustees compensation, net operating losses, and losses deferred due to wash sales and excise tax regulations.
The tax-basis components of distributable earnings and the federal tax cost as of period end were as follows for each fund:
| | | Cost for | | | | | | | | | | Net Unrealized |
| | | Federal Income | | Unrealized | | | | Unrealized | | | | Appreciation/ |
| | | Tax Purposes | | Appreciation | | | | Depreciation | | | | (Depreciation) |
| Consumer Industries Portfolio | | $ 44,799,479 | | $ 7,558,027 | | $ | | (1,247,997) | | $ | | 6,310,030 |
| Food and Agriculture Portfolio | | 103,703,101 | | 23,865,704 | | | | (1,307,687) | | | | 22,558,017 |
| Leisure Portfolio | | 188,226,739 | | 40,657,621 | | | | (2,163,583) | | | | 38,494,038 |
| Multimedia Portfolio | | 67,429,570 | | 22,836,429 | | | | (2,972,067) | | | | 19,864,362 |
| Retailing Portfolio | | 59,581,782 | | 13,952,475 | | | | (1,051,039) | | | | 12,901,436 |
| |
| | | | | | | | | Undistributed | | | | Undistributed |
| | | | | | | | | Ordinary | | | | Long-term |
| | | | | | | | | Income | | | | Capital Gain |
| Consumer Industries Portfolio | | | | | | $ | | 335,559 | | $ | | 835,381 |
| Food and Agriculture Portfolio | | | | | | | | 115,839 | | | | 1,269,140 |
| Leisure Portfolio | | | | | | | | 10,169 | | | | 7,823,646 |
| Multimedia Portfolio | | | | | | | | 931,447 | | | | 4,103,265 |
| Retailing Portfolio | | | | | | | | — | | | | 2,186,735 |
| |
| The tax character of distributions paid was as follows: | | | | | | | | | | | | |
| |
| February 28, 2006 | | | | | | | | | | | | |
| | | | | Ordinary | | | | Long-term | | | | |
| | | | | Income | | | | Capital Gains | | | | Total |
| Consumer Industries Portfolio | | | | $ — | | $ | | 484,881 | | $ | | 484,881 |
| Food and Agriculture Portfolio | | | | 1,906,227 | | | | 5,302,150 | | | | 7,208,377 |
| Leisure Portfolio | | | | — | | | | 7,936,173 | | | | 7,936,173 |
| Multimedia Portfolio | | | | — | | | | 1,681,202 | | | | 1,681,202 |
| Retailing Portfolio | | | | 956,672 | | | | 9,089,809 | | | | 10,046,481 |
| |
| February 28, 2005 | | | | | | | | | | | | |
| | | | | Ordinary | | | | Long-term | | | | |
| | | | | Income | | | | Capital Gains | | | | Total |
| Consumer Industries Portfolio | | | | $ 845,065 | | $ | | 665,470 | | $ | | 1,510,535 |
| Food and Agriculture Portfolio | | | | 683,408 | | | | — | | | | 683,408 |
| Leisure Portfolio | | | | 3,047,560 | | | | 9,849,661 | | | | 12,897,221 |
| Multimedia Portfolio | | | | 1,670,381 | | | | 2,141,578 | | | | 3,811,959 |
| Retailing Portfolio | | | | 320,436 | | | | 1,041,420 | | | | 1,361,856 |
Trading (Redemption) Fees. Shares in the funds held less than 30 days are subject to a redemption fee equal to .75% of the net asset value of shares redeemed. All redemption fees, including any estimated redemption fees paid by FMR, are retained by the fund and accounted for as an addition to paid in capital. Shareholders are also subject to an additional $7.50 fee for shares exchanged into another Fidelity fund (see Note 4).
59 Annual Report
Notes to Financial Statements - continued
2. Operating Policies.
|
Repurchase Agreements. FMR has received an Exemptive Order from the Securities and Exchange Commission (the SEC) which permits certain funds and other affiliated entities of FMR to transfer uninvested cash balances into joint trading accounts which are then invested in repurchase agreements. Certain funds may also invest directly with institutions in repurchase agreements. Repurchase agreements are collateralized by government or non-government securities. Upon settlement date, collateral is held in segregated accounts with custodian banks and may be obtained in the event of a default of the counterparty. Each applicable fund monitors, on a daily basis, the value of the collateral to ensure it is at least equal to the principal amount of the repurchase agreement (including accrued interest). In the event of a default by the counterparty, realization of the collateral proceeds could be delayed, during which time the value of the collateral may decline.
Restricted Securities. Certain funds may invest in securities that are subject to legal or contractual restrictions on resale. These securities generally may be resold in transactions exempt from registration or to the public if the securities are registered. Disposal of these securities may involve time-consuming negotiations and expense, and prompt sale at an acceptable price may be difficult. Information regarding restricted securities is included at the end of each applicable fund’s Schedule of Investments.
| 3. Purchases and Sales of Investments. | | | | |
| |
| Purchases and sales of securities, other than short-term securities and U.S. government securities, are noted in the table below. | | |
| | | Purchases ($) | | Sales ($) |
| Consumer Industries Portfolio | | 37,084,284 | | 29,658,290 |
| Food and Agriculture Portfolio | | 95,890,763 | | 114,438,645 |
| Leisure Portfolio | | 212,790,313 | | 243,827,135 |
| Multimedia Portfolio | | 43,844,728 | | 97,749,184 |
| Retailing Portfolio | | 94,243,484 | | 140,612,456 |
| |
| |
| 4. Fees and Other Transactions with Affiliates. | | | | |
Management Fee. FMR and its affiliates provide the funds with investment management related services for which the funds pay a monthly management fee. The management fee is the sum of an individual fund fee rate and a group fee rate. The individual fund fee rate is applied to each fund’s average net assets. The group fee rate is based upon the average net assets of all the mutual funds advised by FMR. The group fee rate decreases as assets under management increase and increases as assets under management decrease. For the period, each fund’s annual management fee rate expressed as a percentage of each fund’s average net assets was as follows:
| | | Individual Rate | | Group Rate | | Total |
| Consumer Industries Portfolio | | 30% | | .27% | | .57% |
| Food and Agriculture Portfolio | | 30% | | .27% | | .57% |
| Leisure Portfolio | | 30% | | .27% | | .57% |
| Multimedia Portfolio | | 30% | | .27% | | .57% |
| Retailing Portfolio | | 30% | | .27% | | .57% |
Sales Load. Fidelity Distributors Corporation (FDC), an affiliate of FMR, is the general distributor of the funds. Shares purchased prior to October 12, 1990, were subject to a 1% deferred sales charge upon redemption or exchange to any other Fidelity fund (other than Select funds). Effective July 1, 2005, the deferred sales charge was eliminated. For the period, sales charge amounts retained by FDC were as follows:
| | | Retained |
| | | by FDC |
| Consumer Industries Portfolio | | $ | | 111 |
| Food and Agriculture Portfolio | | | | 370 |
| Leisure Portfolio | | | | 4,365 |
| Multimedia Portfolio | | | | 516 |
| Retailing Portfolio | | | | 497 |
Transfer Agent Fees. Fidelity Service Company, Inc. (FSC), an affiliate of FMR, is the funds’ transfer, dividend disbursing and shareholder servicing agent. FSC receives account fees and asset-based fees that vary according to account size and type of account. FSC pays for typesetting, printing and mailing of shareholder reports, except proxy statements. For the period, the transfer agent fees were equivalent to the following annual rates expressed as a percentage of average net assets:
| Consumer Industries Portfolio | | 37% |
| Food and Agriculture Portfolio | | 35% |
| Leisure Portfolio | | 33% |
| Multimedia Portfolio | | 37% |
| Retailing Portfolio | | 34% |
4. Fees and Other Transactions with Affiliates - continued
Accounting and Security Lending Fees. FSC maintains each fund’s accounting records. The accounting fee is based on the level of average net assets for the month. Under a separate contract, FSC administers the security lending program. The security lending fee is based on the number and duration of lending transactions.
Affiliated Central Funds. Certain funds may invest in Money Market Central Funds which seek preservation of capital and current income and are managed by Fidelity Investments Money Management, Inc. (FIMM) an affiliate of FMR.
The Money Market Central Funds do not pay a management fee.
|
Exchange Fees. FSC receives the proceeds of $7.50 to cover administrative costs associated with exchanges out of the funds to any other Fidelity Select fund or to any other Fidelity fund. For the period, exchange fees retained by FSC were as follows:
| | | Retained |
| | | by FSC |
| Consumer Industries Portfolio | | $ | | 413 |
| Food and Agriculture Portfolio | | | | 3,473 |
| Leisure Portfolio | | | | 2,723 |
| Multimedia Portfolio | | | | 1,973 |
| Retailing Portfolio | | | | 5,738 |
Brokerage Commissions. Certain funds placed a portion of their portfolio transactions with brokerage firms which are affiliates of the investment adviser. The commissions paid to these affiliated firms were as follows:
| | | Amount |
| Consumer Industries Portfolio | | $ 1,725 |
| Food and Agriculture Portfolio | | 21,979 |
| Leisure Portfolio | | 6,568 |
| Multimedia Portfolio | | 1,794 |
| Retailing Portfolio | | 16,302 |
| |
| |
| 5. Committed Line of Credit. | | |
Certain funds participate with other funds managed by FMR in a $4.2 billion credit facility (the “line of credit”) to be utilized for temporary or emergency purposes to fund shareholder redemptions or for other short-term liquidity purposes. The participating funds have agreed to pay commitment fees on their pro rata portion of the line of credit. During the period, there were no borrowings on this line of credit.
Certain funds lend portfolio securities from time to time in order to earn additional income. On the settlement date of the loan, each applicable fund receives collateral (in the form of U.S. Treasury obligations, letters of credit and/or cash) against the loaned securities and maintains collateral in an amount not less than 100% of the market value of the loaned securities during the period of the loan. The market value of the loaned securities is determined at the close of business of the funds and any additional required collateral is delivered to the funds on the next business day. If the borrower defaults on its obligation to return the securities loaned because of insolvency or other reasons, a fund could experience delays and costs in recovering the securities loaned or in gaining access to the collateral. Any cash collateral received is invested in the Fidelity Securities Lending Cash Central Fund. The value of loaned securities and cash collateral at period end are disclosed on each applicable fund’s Statement of Assets and Liabilities. Security lending income represents the income earned on investing cash collateral, less fees and expenses associated with the loan, plus any premium payments that may be received on the loan of certain types of securities. Security lending income is presented on each applicable fund’s Statement of Operations as a component of income from affiliated central funds.
61 Annual Report
Notes to Financial Statements - continued
7. Expense Reductions.
|
Many of the brokers with whom FMR places trades on behalf of certain funds provided services to these funds in addition to trade execution. These services included payments of expenses on behalf of each applicable fund. In addition, through arrangements with each applicable fund’s custodian and transfer agent, credits realized as a result of uninvested cash balances were used to reduce each applicable fund’s expenses. All of the applicable expense reductions are noted in the table below.
| | | | | | | | | | | Transfer |
| | | Brokerage | | | | Custody | | | | Agent |
| | | Service | | | | expense | | | | expense |
| | | Arrangements | | | | reduction | | | | reduction |
| Consumer Industries Portfolio | | $ 7,699 | | $ | | — | | $ | | 1,085 |
| Food and Agriculture Portfolio | | 17,976 | | | | — | | | | 699 |
| Leisure Portfolio | | 100,050 | | | | — | | | | 1,205 |
| Multimedia Portfolio | | 25,962 | | | | — | | | | 375 |
| Retailing Portfolio | | 20,589 | | | | — | | | | 69 |
| |
| |
| 8. Other. | | | | | | | | | | |
The funds’ organizational documents provide former and current trustees and officers with a limited indemnification against liabilities arising in connection with the performance of their duties to the funds. In the normal course of business, the funds may also enter into contracts that provide general indemnifications. The funds’ maximum exposure under these arrangements is unknown as this would be dependent on future claims that may be made against the funds. The risk of material loss from such claims is considered remote.
Report of Independent Registered Public Accounting Firm
To the Trustees of Fidelity Select Portfolios and the Shareholders of Consumer Industries Portfolio, Food and Agriculture Portfolio, Leisure Portfolio, Multimedia Portfolio, and Retailing Portfolio:
In our opinion, the accompanying statements of assets and liabilities, including the schedules of investments, and the related statements of operations and of changes in net assets and the financial highlights present fairly, in all material respects, the financial position of Consumer Industries Portfolio, Food and Agriculture Portfolio, Leisure Portfolio, Multimedia Portfolio, and Retailing Portfolio (funds of Fidelity Select Portfolios) at Febru-ary 28, 2006, and the results of each of their operations, the changes in each of their net assets and the financial highlights for each of the periods indicated, in conformity with accounting principles generally accepted in the United States of America. These financial statements and financial highlights (hereafter referred to as “financial statements”) are the responsibility of the Fidelity Select Portfolios’ management; our responsibility is to express an opinion on these financial statements based on our audits. We conducted our audits of these financial statements in accordance with the standards of the Public Company Accounting Oversight Board (United States). Those standards require that we plan and perform the audit to obtain reasonable assurance about whether the financial statements are free of material misstatement. An audit includes examining, on a test basis, evidence supporting the amounts and disclosures in the financial statements, assessing the accounting principles used and significant estimates made by management, and evaluating the overall financial statement presentation. We believe that our audits, which included confirmation of securities at February 28, 2006 by correspondence with the custodian and brokers, provide a reasonable basis for our opinion.
/s/ PricewaterhouseCoopers LLP
PricewaterhouseCoopers LLP
Boston, Massachusetts
April 11, 2006
|
63 Annual Report
Trustees and Officers
The Trustees, Members of the Advisory Board, and executive officers of the trust and funds, as applicable, are listed below. The Board of Trustees governs each fund and is responsible for protecting the interests of shareholders. The Trustees are experienced executives who meet periodically throughout the year to oversee each fund’s activities, review contractual arrangements with companies that provide services to each fund, and review each fund’s performance. Except for William O. McCoy, each of the Trustees oversees 326 funds advised by FMR or an affiliate. Mr. McCoy oversees 328 funds advised by FMR or an affiliate.
The Trustees hold office without limit in time except that (a) any Trustee may resign; (b) any Trustee may be removed by written instrument, signed by at least two-thirds of the number of Trustees prior to such removal; (c) any Trustee who requests to be retired or who has become incapacitated by illness or injury may be retired by written instrument signed by a majority of the other Trustees; and (d) any Trustee may be removed at any special meeting of shareholders by a two-thirds vote of the outstanding voting securities of the trust. Each Trustee who is not an interested person (as defined in the 1940 Act) (Independent Trustee), shall retire not later than the last day of the calendar year in which his or her 72nd birthday occurs. The Independent Trustees may waive this mandatory retirement age policy with respect to individual Trustees. The executive officers and Advisory Board Members hold office without limit in time, except that any officer and Advisory Board Member may resign or may be removed by a vote of a majority of the Trustees at any regular meeting or any special meeting of the Trustees. Except as indicated, each individual has held the office shown or other offices in the same company for the past five years.
The funds’ Statement of Additional Information (SAI) includes more information about the Trustees. To request a free copy, call Fidelity at 1-800-544-8544.
Interested Trustees*:
Correspondence intended for each Trustee who is an interested person may be sent to Fidelity Investments, 82 Devonshire Street, Boston, Massachusetts 02109.
| Name, Age; Principal Occupation |
| |
| Edward C. Johnson 3d (75) |
| |
| Year of Election or Appointment: 1980 |
| Mr. Johnson is Chairman of the Board of Trustees. Mr. Johnson serves as Chief Executive Officer, Chairman, and a Director of FMR |
| Corp.; a Director and Chairman of the Board and of the Executive Committee of FMR; Chairman and a Director of Fidelity Re- |
| search & Analysis Company (FRAC); Chairman and a Director of Fidelity Investments Money Management, Inc.; and Chairman |
| (2001-present) and a Director (2000-present) of FMR Co., Inc. |
| |
| Stephen P. Jonas (53) |
| |
| Year of Election or Appointment: 2005 |
| Mr. Jonas is Senior Vice President of Consumer Industries (2005-present), Food and Agriculture (2005-present), Leisure |
| (2005-present), Multimedia (2005-present), and Retailing (2005-present). He also serves as Senior Vice President of other Fidelity |
| funds (2005-present). Mr. Jonas is Executive Director of FMR (2005-present). Previously, Mr. Jonas served as President of Fidelity |
| Enterprise Operations and Risk Services (2004-2005), Chief Administrative Officer (2002-2004), and Chief Financial Officer of |
| FMR Co. (1998-2000). Mr. Jonas has been with Fidelity Investments since 1987 and has held various financial and management |
| positions including Chief Financial Officer of FMR. In addition, he serves on the Boards of Boston Ballet (2003-present) and Sim- |
| mons College (2003-present). |
| |
| Robert L. Reynolds (53) |
| |
| Year of Election or Appointment: 2003 |
| Mr. Reynolds is a Director (2003-present) and Chief Operating Officer (2002-present) of FMR Corp. He also serves on the Board |
| at Fidelity Investments Canada, Ltd. (2000-present). Previously, Mr. Reynolds served as President of Fidelity Investments Institutional |
| Retirement Group (1996-2000). |
* Trustees have been determined to be “Interested Trustees” by virtue of, among other things, their affiliation with the trust or various entities under common control with FMR.
Annual Report 64
Independent Trustees:
Correspondence intended for each Independent Trustee (that is, the Trustees other than the Interested Trustees) may be sent to Fidelity Investments, P.O. Box 55235, Boston, Massachusetts 02205-5235.
| Name, Age; Principal Occupation |
| |
| Dennis J. Dirks (57) |
| |
| Year of Election or Appointment: 2005 |
| Prior to his retirement in May 2003, Mr. Dirks was Chief Operating Officer and a member of the Board of The Depository Trust & |
| Clearing Corporation (DTCC) (1999-2003). He also served as President, Chief Operating Officer, and Board member of The De- |
| pository Trust Company (DTC) (1999-2003) and President and Board member of the National Securities Clearing Corporation |
| (NSCC) (1999-2003). In addition, Mr. Dirks served as Chief Executive Officer and Board member of the Government Securities |
| Clearing Corporation (2001-2003) and Chief Executive Officer and Board member of the Mortgage-Backed Securities Clearing |
| Corporation (2001-2003). Mr. Dirks also serves as a Trustee and a member of the Finance Committee of Manhattan College |
| (2005-present) and a Trustee and a member of the Finance Committee of AHRC of Nassau County (2006-present). |
| |
| Robert M. Gates (62) |
| |
| Year of Election or Appointment: 1997 |
| Dr. Gates is Chairman of the Independent Trustees (2006-present). Dr. Gates is President of Texas A&M University (2002-present). |
| He was Director of the Central Intelligence Agency (CIA) from 1991 to 1993. From 1989 to 1991, Dr. Gates served as Assistant |
| to the President of the United States and Deputy National Security Advisor. Dr. Gates is a Director of NACCO Industries, Inc. |
| (mining and manufacturing), Parker Drilling Co., Inc. (drilling and rental tools for the energy industry, 2001-present), and Brinker |
| International (restaurant management, 2003-present). Previously, Dr. Gates served as a Director of LucasVarity PLC (automotive |
| components and diesel engines), a Director of TRW Inc. (automotive, space, defense, and information technology), and Dean of |
| the George Bush School of Government and Public Service at Texas A&M University (1999-2001). |
| |
| George H. Heilmeier (69) |
| |
| Year of Election or Appointment: 2004 |
| Dr. Heilmeier is Chairman Emeritus of Telcordia Technologies (communication software and systems), where prior to his retirement, |
| he served as company Chairman and Chief Executive Officer. He currently serves on the Boards of Directors of The Mitre Corpo- |
| ration (systems engineering and information technology support for the government), and HRL Laboratories (private research and |
| development, 2004-present). He is Chairman of the General Motors Science & Technology Advisory Board and a Life Fellow of |
| the Institute of Electrical and Electronics Engineers (IEEE). Dr. Heilmeier is a member of the Defense Science Board and the National |
| Security Agency Advisory Board. He is also a member of the National Academy of Engineering, the American Academy of Arts |
| and Sciences, and the Board of Overseers of the School of Engineering and Applied Science of the University of Pennsylvania. |
| Previously, Dr. Heilmeier served as a Director of TRW Inc. (automotive, space, defense, and information technology, 1992-2002), |
| Compaq (1994-2002), Automatic Data Processing, Inc. (ADP) (technology-based business outsourcing, 1995-2002), INET |
| Technologies Inc. (telecommunications network surveillance, 2001-2004), and Teletech Holdings (customer management services). |
| He is the recipient of the 2005 Kyoto Prize in Advanced Technology for his invention of the liquid crystal display. |
| |
| Marie L. Knowles (59) |
| |
| Year of Election or Appointment: 2001 |
| Prior to Ms. Knowles’ retirement in June 2000, she served as Executive Vice President and Chief Financial Officer of Atlantic Rich- |
| field Company (ARCO) (diversified energy, 1996-2000). From 1993 to 1996, she was a Senior Vice President of ARCO and |
| President of ARCO Transportation Company. She served as a Director of ARCO from 1996 to 1998. She currently serves as a |
| Director of Phelps Dodge Corporation (copper mining and manufacturing) and McKesson Corporation (healthcare service, |
| 2002-present). Ms. Knowles is a Trustee of the Brookings Institution and the Catalina Island Conservancy and also serves as a |
| member of the Advisory Board for the School of Engineering of the University of Southern California. |
| |
| Ned C. Lautenbach (62) |
| |
| Year of Election or Appointment: 2000 |
| Mr. Lautenbach has been a partner of Clayton, Dubilier & Rice, Inc. (private equity investment firm) since September 1998. Pre- |
| viously, Mr. Lautenbach was with the International Business Machines Corporation (IBM) from 1968 until his retirement in 1998. |
| Mr. Lautenbach serves as a Director of Italtel Holding S.p.A. (telecommunications (Milan, Italy), 2004-present) and Eaton Corpora- |
| tion (diversified industrial) as well as the Philharmonic Center for the Arts in Naples, Florida. He also is a member of the Board of |
| Trustees of Fairfield University (2005-present), as well as a member of the Council on Foreign Relations. |
65 Annual Report
Trustees and Officers - continued
| Name, Age; Principal Occupation |
| |
| William O. McCoy (72) |
| |
| Year of Election or Appointment: 1997 |
| Prior to his retirement in December 1994, Mr. McCoy was Vice Chairman of the Board of BellSouth Corporation (telecommunica- |
| tions) and President of BellSouth Enterprises. He is currently a Director of Duke Realty Corporation (real estate), and Progress |
| Energy, Inc. (electric utility). He is also a partner of Franklin Street Partners (private investment management firm) and a member of |
| the Research Triangle Foundation Board. In addition, Mr. McCoy served as the Interim Chancellor (1999-2000) and a member of |
| the Board of Visitors for the University of North Carolina at Chapel Hill and currently serves as Chairman of the Board of Directors |
| of the University of North Carolina Health Care System and the Board of Visitors of the Kenan-Flagler Business School (University |
| of North Carolina at Chapel Hill). He also served as Vice President of Finance for the University of North Carolina (16-school |
| system). |
| |
| Cornelia M. Small (61) |
| |
| Year of Election or Appointment: 2005 |
| Ms. Small is a member (2000-present) and Chairperson (2002-present) of the Investment Committee, and a member |
| (2002-present) of the Board of Trustees of Smith College. Previously, she served as Chief Investment Officer (1999-2000), Director |
| of Global Equity Investments (1996-1999), and a member of the Board of Directors of Scudder, Stevens & Clark (1990-1997) and |
| Scudder Kemper Investments (1997-1999). In addition, Ms. Small served as Co-Chair (2000-2003) of the Annual Fund for the |
| Fletcher School of Law and Diplomacy. |
| |
| William S. Stavropoulos (66) |
| |
| Year of Election or Appointment: 2002 |
| Mr. Stavropoulos is Chairman of the Board (2000-present) and a Member of the Board of Directors of The Dow Chemical |
| Company. Since joining The Dow Chemical Company in 1967, Mr. Stavropoulos served in numerous senior management posi- |
| tions, including President (1993-2000; 2002-2003), CEO (1995-2000; 2002-2004), and Chairman of the Executive Committee |
| (2000-2004). Currently, he is a Director of NCR Corporation (data warehousing and technology solutions), BellSouth Corporation |
| (telecommunications), Chemical Financial Corporation, Maersk Inc. (industrial conglomerate, 2002-present), and Metalmark Capi- |
| tal (private equity investment firm, 2005-present). He also serves as a member of the Board of Trustees of the American Enterprise |
| Institute for Public Policy Research. In addition, Mr. Stavropoulos is a member of The Business Council, J.P. Morgan International |
| Council and the University of Notre Dame Advisory Council for the College of Science. |
| |
| Kenneth L. Wolfe (67) |
| |
| Year of Election or Appointment: 2005 |
| Prior to his retirement in 2001, Mr. Wolfe was Chairman and Chief Executive Officer of Hershey Foods Corporation (1993-2001). |
| He currently serves as a member of the boards of Adelphia Communications Corporation (2003-present), Bausch & Lomb, Inc., |
| and Revlon Inc. (2004-present). |
Advisory Board Members and Executive Officers:
Correspondence intended for Messrs. Keyes and Gamper may be sent to Fidelity Investments, P.O. Box 55235, Boston, Massachusetts 02205-5235. Correspondence intended for each executive officer and Mr. Lynch may be sent to Fidelity Investments, 82 Devonshire Street, Boston, Massachusetts 02109.
| Name, Age; Principal Occupation |
| |
| Albert R. Gamper, Jr. (63) |
| |
| Year of Election or Appointment: 2005 |
| Member of the Advisory Board of Fidelity Select Portfolios. Mr. Gamper also serves as a Trustee (2006-present) or Member of the |
| Advisory Board (2005-present) of other investment companies advised by FMR. Prior to his retirement in December 2004, Mr. |
| Gamper served as Chairman of the Board of CIT Group Inc. (commercial finance). During his tenure with CIT Group Inc. Mr. |
| Gamper served in numerous senior management positions, including Chairman (1987-1989; 1999-2001; 2002-2004), Chief |
| Executive Officer (1987-2004), and President (1989-2002). He currently serves as a member of the Board of Directors of Public |
| Service Enterprise Group (utilities, 2001-present), Chairman of the Board of Governors, Rutgers University (2004-present), and |
| Chairman of the Board of Saint Barnabas Health Care System. |
| |
| James H. Keyes (66) |
| |
| Year of Election or Appointment: 2006 |
| Member of the Advisory Board of Fidelity Select Portfolios. Prior to his retirement in 2003, Mr. Keyes was Chairman, President, |
| and Chief Executive Officer of Johnson Controls, Inc. (automotive supplier, 1993-2003). He currently serves as a member of the |
| boards of LSI Logic Corporation (semiconductor technologies, 1984-present), Navistar International Corporation (manufacture and |
| sale of trucks, buses, and diesel engines, 2002-present), and Pitney Bowes, Inc. (integrated mail, messaging, and document man- |
| agement solutions, 1998-present). |
Annual Report 66
| Name, Age; Principal Occupation |
| |
| Peter S. Lynch (62) |
| |
| Year of Election or Appointment: 2003 |
| Member of the Advisory Board of Fidelity Select Portfolios. Vice Chairman and a Director of FMR, and Vice Chairman |
| (2001-present) and a Director (2000-present) of FMR Co., Inc. Previously, Mr. Lynch served as a Trustee of the Fidelity funds |
| (1990-2003). In addition, he serves as a Trustee of Boston College, Massachusetts Eye & Ear Infirmary, Historic Deerfield, John F. |
| Kennedy Library, and the Museum of Fine Arts of Boston. |
| |
| Eric D. Roiter (57) |
| |
| Year of Election or Appointment: 1998 |
| Secretary of Consumer Industries, Food and Agriculture, Leisure, Multimedia, and Retailing. He also serves as Secretary of other |
| Fidelity funds; Vice President, General Counsel, and Secretary of FMR Co., Inc. (2001-present) and FMR; Assistant Secretary of |
| Fidelity Management & Research (U.K.) Inc. (2001-present), Fidelity Research & Analysis Company (2001-present), and Fidelity |
| Investments Money Management, Inc. (2001-present). Mr. Roiter is an Adjunct Member, Faculty of Law, at Boston College Law |
| School (2003-present). Previously, Mr. Roiter served as Vice President and Secretary of Fidelity Distributors Corporation (FDC) |
| (1998-2005). |
| |
| Stuart Fross (46) |
| |
| Year of Election or Appointment: 2003 |
| Assistant Secretary of Consumer Industries, Food and Agriculture, Leisure, Multimedia, and Retailing. Mr. Fross also serves as As- |
| sistant Secretary of other Fidelity funds (2003-present), Vice President and Secretary of FDC (2005-present), and is an employee |
| of FMR. |
| Christine Reynolds (47) |
| |
| Year of Election or Appointment: 2004 |
| President and Treasurer of Consumer Industries, Food and Agriculture, Leisure, Multimedia, and Retailing. Ms. Reynolds also |
| serves as President and Treasurer of other Fidelity funds (2004-present) and is a Vice President (2003-present) and an employee |
| (2002-present) of FMR. Before joining Fidelity Investments, Ms. Reynolds worked at PricewaterhouseCoopers LLP (PwC) |
| (1980-2002), where she was most recently an audit partner with PwC’s investment management practice. |
| |
| R. Stephen Ganis (66) |
| |
| Year of Election or Appointment: 2006 |
| Anti-Money Laundering (AML) officer of Consumer Industries, Food and Agriculture, Leisure, Multimedia, and Retailing. Mr. Ganis |
| also serves as AML officer of other Fidelity funds (2006-present) and FMR Corp. (2003-present). Before joining Fidelity Invest- |
| ments, Mr. Ganis practiced law at Goodwin Procter, LLP (2000-2002). |
| Paul M. Murphy (58) |
| |
| Year of Election or Appointment: 2005 |
| Chief Financial Officer of Consumer Industries, Food and Agriculture, Leisure, Multimedia, and Retailing. Mr. Murphy also serves |
| as Chief Financial Officer of other Fidelity funds (2005-present). He also serves as Senior Vice President of Fidelity Pricing and |
| Cash Management Services Group (FPCMS). |
| Kenneth A. Rathgeber (58) |
| |
| Year of Election or Appointment: 2004 |
| Chief Compliance Officer of Consumer Industries, Food and Agriculture, Leisure, Multimedia, and Retailing. Mr. Rathgeber also |
| serves as Chief Compliance Officer of other Fidelity funds (2004-present) and Executive Vice President of Risk Oversight for |
| Fidelity Investments (2002-present). He is Chief Compliance Officer of FMR (2005-present), FMR Co., Inc. (2005-present), Fidelity |
| Management & Research (U.K.) Inc. (2005-present), Fidelity Research & Analysis Company (2005-present), Fidelity Investments |
| Money Management, Inc. ( 2005-present), and Strategic Advisers, Inc. (2005-present). Previously, Mr. Rathgeber served as Execu- |
| tive Vice President and Chief Operating Officer for Fidelity Investments Institutional Services Company, Inc. (1998-2002). |
| |
| Bryan A. Mehrmann (44) |
| |
| Year of Election or Appointment: 2005 |
| Deputy Treasurer of Consumer Industries, Food and Agriculture, Leisure, Multimedia, and Retailing. Mr. Mehrmann also serves as |
| Deputy Treasurer of other Fidelity funds (2005-present) and is an employee of FMR. Previously, Mr. Mehrmann served as Vice |
| President of Fidelity Investments Institutional Services Group (FIIS)/Fidelity Investments Institutional Operations Corporation, Inc. |
| (FIIOC) Client Services (1998-2004). |
67 Annual Report
Trustees and Officers - continued
| Name, Age; Principal Occupation |
| |
| Kimberley H. Monasterio (42) |
| |
| Year of Election or Appointment: 2004 |
| Deputy Treasurer of Consumer Industries, Food and Agriculture, Leisure, Multimedia, and Retailing. Ms. Monasterio also serves as |
| Deputy Treasurer of other Fidelity funds (2004) and is an employee of FMR (2004). Before joining Fidelity Investments, Ms. Monas- |
| terio served as Treasurer (2000-2004) and Chief Financial Officer (2002-2004) of the Franklin Templeton Funds and Senior Vice |
| President of Franklin Templeton Services, LLC (2000-2004). |
| |
| Kenneth B. Robins (36) |
| |
| Year of Election or Appointment: 2005 |
| Deputy Treasurer of Consumer Industries, Food and Agriculture, Leisure, Multimedia, and Retailing. Mr. Robins also serves as Dep- |
| uty Treasurer of other Fidelity funds (2005-present) and is an employee of FMR (2004-present). Before joining Fidelity Investments, |
| Mr. Robins worked at KPMG LLP, where he was a partner in KPMG’s department of professional practice (2002-2004) and a Se- |
| nior Manager (1999-2000). In addition, Mr. Robins served as Assistant Chief Accountant, United States Securities and Exchange |
| Commission (2000-2002). |
| |
| Robert G. Byrnes (39) |
| |
| Year of Election or Appointment: 2005 |
| Assistant Treasurer of Consumer Industries, Food and Agriculture, Leisure, Multimedia, and Retailing. Mr. Byrnes also serves as |
| Assistant Treasurer of other Fidelity funds (2005-present) and is an employee of FMR (2005-present). Previously, Mr. Byrnes served |
| as Vice President of FPCMS (2003-2005). Before joining Fidelity Investments, Mr. Byrnes worked at Deutsche Asset Management |
| where he served as Vice President of the Investment Operations Group (2000-2003). |
| |
| John H. Costello (59) |
| |
| Year of Election or Appointment: 1986 or1990 |
| Assistant Treasurer of Consumer Industries (1990), Food and Agriculture (1986), Leisure (1986), Multimedia (1986), and Retailing |
| (1986). Mr. Costello also serves as Assistant Treasurer of other Fidelity funds and is an employee of FMR. |
| Peter L. Lydecker (52) |
| |
| Year of Election or Appointment: 2004 |
| Assistant Treasurer of Consumer Industries, Food and Agriculture, Leisure, Multimedia, and Retailing. Mr. Lydecker also serves as |
| Assistant Treasurer of other Fidelity funds (2004) and is an employee of FMR. |
| Mark Osterheld (50) |
| |
| Year of Election or Appointment: 2003 |
| Assistant Treasurer of Consumer Industries, Food and Agriculture, Leisure, Multimedia, and Retailing. Mr. Osterheld also serves as |
| Assistant Treasurer of other Fidelity funds (2002) and is an employee of FMR. |
| Gary W. Ryan (47) |
| |
| Year of Election or Appointment: 2005 |
| Assistant Treasurer of Consumer Industries, Food and Agriculture, Leisure, Multimedia, and Retailing. Mr. Ryan also serves as As- |
| sistant Treasurer of other Fidelity funds (2005-present) and is an employee of FMR (2005-present). Previously, Mr. Ryan served as |
| Vice President of Fund Reporting in FPCMS (1999-2005). |
| Salvatore Schiavone (40) |
| |
| Year of Election or Appointment: 2005 |
| Assistant Treasurer of Consumer Industries, Food and Agriculture, Leisure, Multimedia, and Retailing. Mr. Schiavone also serves as |
| Assistant Treasurer of other Fidelity funds (2005-present) and is an employee of FMR (2005-present). Before joining Fidelity Invest- |
| ments, Mr. Schiavone worked at Deutsche Asset Management, where he most recently served as Assistant Treasurer (2003-2005) |
| of the Scudder Funds and Vice President and Head of Fund Reporting (1996-2003). |
Annual Report 68
The Board of Trustees of each fund voted to pay to shareholders of record at the opening of business on record date, the following distributions per share derived from capital gains realized from sales of portfolio securities, and dividends derived from net investment income:
| Fund | | Pay Date | | Record Date | | Dividends | | Capital Gains |
| Consumer Industries | | 4/10/06 | | 4/7/06 | | $ | | — | | $ .59 |
| Food and Agriculture | | 4/10/06 | | 4/7/06 | | $ | | .05 | | $ .52 |
| Leisure | | 4/10/06 | | 4/7/06 | | $ | | — | | $2.71 |
| Multimedia | | 4/10/06 | | 4/7/06 | | $ | | — | | $3.02 |
| Retailing | | 4/10/06 | | 4/7/06 | | $ | | — | | $1.70 |
The funds hereby designate as capital gain dividend the amounts noted below for the taxable year ended February 28, 2006, or, if subsequently determined to be different, the net capital gain of such year.
| Fund | | |
| Consumer Industries | | $ 1,320,262 |
| Food and Agriculture | | 6,088,592 |
| Leisure | | 12,236,813 |
| Multimedia | | 5,774,763 |
| Retailing | | 12,908,985 |
A percentage of the dividends distributed during the fiscal year for the following funds qualifies for the dividends-received deduction for corporate shareholders:
| Food and Agriculture | | April 2005 | | 99% |
| | | December 2005 | | 84% |
| Retailing | | April 2005 | | 50% |
A percentage of the dividends distributed during the fiscal year for the following funds may be taken into account as a dividend for purposes of the maximum rate under section 1(h)(11) of the Internal Revenue Code.
| Food and Agriculture | | April 2005 | | 100% |
| | | December 2005 | | 93% |
| Retailing | | April 2005 | | 50% |
The funds will notify shareholders in January 2007 of amounts for use in preparing 2006 income tax returns.
69 Annual Report
Board Approval of Investment Advisory Contracts and Management Fees
Select Consumer Industries Select Food and Agriculture Select Leisure Select Multimedia Select Retailing
On January 19, 2006, the Board of Trustees, including the Independent Trustees (together, the Board), voted to approve a general research services agreement (the Agreement) between FMR, FMR Co., Inc. (FMRC), Fidelity Investments Money Management, Inc. (FIMM), and Fidelity Research & Analysis Company (FRAC) (together, the Investment Advisers) for each fund, effective January 20, 2006, pursuant to which FRAC may provide general research and investment advisory support services to FMRC and FIMM. The Board considered that it has approved previously various sub-advisory agreements for each fund with affiliates of FMR that allow FMR to obtain research, non-discretionary advice, or discretionary portfolio management at no additional expense to each fund. The Board, assisted by the advice of fund counsel and independent Trustees’ counsel, considered a broad range of information and determined that it would be beneficial for each fund to access the research and investment advisory support services supplied by FRAC at no additional expense to each fund.
The Board reached this determination in part because the new arrangement will involve no changes in (i) the contractual terms of and fees payable under each fund’s management contract or sub-advisory agreements; (ii) the investment process or strategies employed in the management of each fund’s assets; (iii) the nature or level of services provided under each fund’s management contract or sub-advisory agreements; (iv) the day-to-day management of each fund or the persons primarily responsible for such management; or (v) the ultimate control or beneficial ownership of FMR, FMRC, or FIMM. The Board also considered that the establishment of each Agreement would not necessitate prior shareholder approval of the Agreement or result in an assignment and termination of each fund’s management contract or sub-advisory agreements under the Investment Company Act of 1940.
Because the Board was approving an arrangement with FRAC under which each fund will not bear any additional management fees or expenses and under which each fund’s portfolio manager would not change, it did not consider each fund’s investment performance, competitiveness of management fee and total expenses, costs of services and profitability, or economies of scale to be significant factors in its decision.
In connection with its future renewal of each fund’s management contract and sub-advisory agreements, the Board will consider: (i) the nature, extent, and quality of services provided to each fund, including shareholder and administrative services and investment performance; (ii) the competitiveness of each fund’s management fee and total expenses; (iii) the costs of the services and profitability, including the revenues earned and the expenses incurred by Fidelity in conducting the business of developing, marketing, distributing, managing, administering, and servicing each fund and its shareholders; and (iv) whether there have been economies of scale in respect of the management of the Fidelity funds, whether the Fidelity funds (including each fund) have appropriately benefited from any such economies of scale, and whether there is potential for realization of any further economies.
Based on its evaluation of all of the conclusions noted above, and after considering all material factors, the Board ultimately concluded that each fund’s Agreement is fair and reasonable, and that each fund’s Agreement should be approved.
Managing Your Investments
Fidelity offers several ways to conveniently manage your personal investments via your telephone or PC. You can access your account information, conduct trades and research your investments 24 hours a day.
By Phone
Fidelity Automated Service Telephone provides a single toll-free number to access account balances, positions, quotes and trading. It’s easy to navigate the service, and on your first call, the system will help you create a personal identification number (PIN) for security.

By PC
Fidelity’s web site on the Internet provides a wide range of information, including daily financial news, fund performance, interactive planning tools and news about Fidelity products and services.

* When you call the quotes line, please remember that a fund’s yield and return will vary and, except for money market funds, share price will also vary. This means that you may have a gain or loss when you sell your shares. There is no assurance that money market funds will be able to maintain a stable $1 share price; an investment in a money market fund is not insured or guaranteed by the U.S. government. Total returns are historical and include changes in share price, reinvestment of dividends and capital gains, and the effects of any sales charges.
71 71 Annual Report
To Write Fidelity
We’ll give your correspondence immediate attention and send you written confirmation upon completion of your request.

Annual Report 72
To Visit Fidelity
For directions and hours,
please call 1-800-544-9797.
Arizona
7001 West Ray Road
Chandler, AZ
7373 N. Scottsdale Road
Scottsdale, AZ
California
815 East Birch Street
Brea, CA
1411 Chapin Avenue
Burlingame, CA
851 East Hamilton Avenue
Campbell, CA
19200 Von Karman Avenue
Irvine, CA
601 Larkspur Landing Circle
Larkspur, CA
10100 Santa Monica Blvd.
Los Angeles, CA
27101 Puerta Real
Mission Viejo, CA
73-575 El Paseo
Palm Desert, CA
251 University Avenue
Palo Alto, CA
123 South Lake Avenue
Pasadena, CA
16995 Bernardo Ctr. Drive
Rancho Bernardo, CA
1740 Arden Way
Sacramento, CA
7676 Hazard Center Drive
San Diego, CA
8 Montgomery Street
San Francisco, CA
3793 State Street
Santa Barbara, CA
21701 Hawthorne Boulevard
Torrance, CA
2001 North Main Street
Walnut Creek, CA
6300 Canoga Avenue
Woodland Hills, CA
Colorado
1625 Broadway
Denver, CO
9185 East Westview Road
Littleton, CO
Connecticut
48 West Putnam Avenue
Greenwich, CT
265 Church Street
New Haven, CT
300 Atlantic Street
Stamford, CT
29 South Main Street
West Hartford, CT
Delaware
222 Delaware Avenue
Wilmington, DE
|
Florida
4400 N. Federal Highway
Boca Raton, FL
121 Alhambra Plaza
Coral Gables, FL
2948 N. Federal Highway
Ft. Lauderdale, FL
1907 West State Road 434
Longwood, FL
8880 Tamiami Trail, North
Naples, FL
3550 Tamiami Trail, South
Sarasota, FL
1502 N. Westshore Blvd.
Tampa, FL
2465 State Road 7
Wellington, FL
3501 PGA Boulevard
West Palm Beach, FL
Georgia
3445 Peachtree Road, N.E.
Atlanta, GA
1000 Abernathy Road
Atlanta, GA
Illinois
One North LaSalle Street
Chicago, IL
875 North Michigan Ave.
Chicago, IL
1415 West 22nd Street
Oak Brook, IL
1700 East Golf Road
Schaumburg, IL
3232 Lake Avenue
Wilmette, IL
Indiana
4729 East 82nd Street
Indianapolis, IN
Kansas
5400 College Boulevard
Overland Park, KS
Maine
Three Canal Plaza
Portland, ME
Maryland
7315 Wisconsin Avenue
Bethesda, MD
One W. Pennsylvania Ave.
Towson, MD
Massachusetts
801 Boylston Street
Boston, MA
155 Congress Street
Boston, MA
300 Granite Street
Braintree, MA
44 Mall Road
Burlington, MA
405 Cochituate Road
Framingham, MA
416 Belmont Street
Worcester, MA
|
Michigan
500 E. Eisenhower Pkwy.
Ann Arbor, MI
280 Old N. Woodward Ave.
Birmingham, MI
43420 Grand River Avenue
Novi, MI
29155 Northwestern Hwy.
Southfield, MI
Minnesota
7600 France Avenue South
Edina, MN
Missouri
8885 Ladue Road
Ladue, MO
Nevada
2225 Village Walk Drive
Henderson, NV
New Jersey
150 Essex Street
Millburn, NJ
56 South Street
Morristown, NJ
396 Route 17, North
Paramus, NJ
3518 Route 1 North
Princeton, NJ
530 Highway 35
Shrewsbury, NJ
New York
1055 Franklin Avenue
Garden City, NY
37 West Jericho Turnpike
Huntington Station, NY
1271 Avenue of the Americas
New York, NY
61 Broadway
New York, NY
350 Park Avenue
New York, NY
200 Fifth Avenue
New York, NY
733 Third Avenue
New York, NY
11 Penn Plaza
New York, NY
2070 Broadway
New York, NY
1075 Northern Blvd.
Roslyn, NY
North Carolina
4611 Sharon Road
Charlotte, NC
Ohio
3805 Edwards Road
Cincinnati, OH
1324 Polaris Parkway
Columbus, OH
28699 Chagrin Boulevard
Woodmere Village, OH
Oregon
16850 SW 72nd Avenue
Tigard, OR
|
Pennsylvania
600 West DeKalb Pike
King of Prussia, PA
1735 Market Street
Philadelphia, PA
12001 Perry Highway
Wexford, PA
Rhode Island
47 Providence Place
Providence, RI
Tennessee
6150 Poplar Avenue
Memphis, TN
Texas
10000 Research Boulevard
Austin, TX
4001 Northwest Parkway
Dallas, TX
12532 Memorial Drive
Houston, TX
2701 Drexel Drive
Houston, TX
6500 N. MacArthur Blvd.
Irving, TX
6005 West Park Boulevard
Plano, TX
14100 San Pedro
San Antonio, TX
1576 East Southlake Blvd.
Southlake, TX
19740 IH 45 North
Spring, TX
Utah
215 South State Street
Salt Lake City, UT
Virginia
1861 International Drive
McLean, VA
Washington
411 108th Avenue, N.E.
Bellevue, WA
1518 6th Avenue
Seattle, WA
Washington, DC
1900 K Street, N.W.
Washington, DC
Wisconsin
595 North Barker Road
Brookfield, WI
|
Fidelity Brokerage Services, Inc., 100 Summer St., Boston, MA 02110 Member NYSE/SIPC
73 Annual Report
Investment Adviser
Fidelity Management & Research Company
Boston, MA
Investment Sub-Advisers
FMR Co., Inc.
Fidelity Management & Research (U.K.) Inc.
Fidelity Research & Analysis Company (formerly Fidelity Management & Research (Far East) Inc.)
Fidelity Investments Japan Limited
Fidelity International Investment Advisors
Fidelity International Investment Advisors (U.K. Limited)
General Distributor
Fidelity Distributors Corporation
Boston, MA
Transfer and Service Agent
Fidelity Service Company, Inc.
Boston, MA
Custodian
Brown Brothers Harriman & Co.
Boston, MA
Corporate Headquarters
82 Devonshire Street
Boston, MA 02109
1-800-544-8888
The Fidelity Telephone Connection
Mutual Fund 24-Hour Service
Exchanges/Redemptions
and Account Assistance 1-800-544-6666
Product Information 1-800-544-8888
Retirement Accounts 1-800-544-4774
(8 a.m. - 9 p.m.)
TDD Service 1-800-544-0118
for the deaf and hearing impaired
(9 a.m. - 9 p.m. Eastern time)
Fidelity Automated Service Telephone
(FAST®) (automated graphic) 1-800-544-5555
| | (automated graphic) Automated line for quickest service
|

| SELCON-UANN-0406 | | Corporate Headquarters |
| 1.813632.101 | | 82 Devonshire St., Boston, MA 02109 |
| | | www.fidelity.com |
Fidelity®
Select Portfolios®
Cyclicals Sector
Air Transportation
Automotive
Chemicals
Construction and Housing
Cyclical Industries
Defense and Aerospace
Environmental
Industrial Equipment
Industrial Materials
Transportation
Annual Report
February 28, 2006


| Contents | | |
| |
| Chairman’s Message | | 3 |
| Shareholder Expense Example | | 4 |
| Fund Updates* | | |
| Cyclicals Sector | | |
| Air Transportation | | 6 |
| Automotive | | 14 |
| Chemicals | | 25 |
| Construction and Housing | | 34 |
| Cyclical Industries | | 43 |
| Defense and Aerospace | | 56 |
| Environmental | | 65 |
| Industrial Equipment | | 74 |
| Industrial Materials | | 84 |
| Transportation | | 94 |
| Notes to Financial Statements | | 105 |
| Report of Independent Registered | | 111 |
| Public Accounting Firm | | |
| Trustees and Officers | | 112 |
| Distributions | | 117 |
| Board Approval of Investment | | 119 |
| Advisory Contracts and | | |
| Management Fees | | |
* Fund updates for each Select Portfolio include: Performance, Management’s Discussion of Fund Performance, Investment Changes, Investments, and Financial Statements.
To view a fund’s proxy voting guidelines and proxy voting record for the 12-month period ended June 30, visit www.fidelity.com/proxyvotingresults or visit the Securities and Exchange Commission’s (SEC) website at www.sec.gov. You may also call 1-800-544-8544 to request a free copy of the proxy voting guidelines.
Standard & Poor’s, S&P and S&P 500 are registered service marks of The McGraw-Hill Companies, Inc. and have been licensed for use by Fidelity Distributors Corporation.
Other third party marks appearing herein are the property of their respective owners.
All other marks appearing herein are registered or unregistered trademarks or service marks of FMR Corp. or an affiliated company.
This report and the financial statements contained herein are submitted for the general information of the shareholders of the funds. This report is not authorized for distribution to prospective investors in the funds unless preceded or accompanied by an effective prospectus.
A fund files its complete schedule of portfolio holdings with the SEC for the first and third quarters of each fiscal year on Form N-Q. Forms N-Q are available on the SEC’s web site at http://www.sec.gov. A fund’s Forms N-Q may be reviewed and copied at the SEC’s Public Reference Room in Washing-ton, DC. Information regarding the operation of the SEC’s Public Reference Room may be obtained by calling 1-800-SEC-0330. For a complete list of a fund’s portfolio holdings, view the most recent quarterly holdings report, semiannual report, or annual report on Fidelity’s web site at http://www.fidelity.com/holdings.
NOT FDIC INSURED · MAY LOSE VALUE · NO BANK GUARANTEE
Neither the funds nor Fidelity Distributors Corporation is a bank.
|
(Photograph of Edward C. Johnson 3d.)
Although many securities markets made gains in early 2006, there is only one certainty when it comes to investing: There is no sure thing. There are, however, a number of time-tested, fundamental investment principles that can put the historical odds in your favor.
One of the basic tenets is to invest for the long term. Over time, riding out the markets’ inevitable ups and downs has proven much more effective than selling into panic or chasing the hottest trend. Even missing only a few of the markets’ best days can significantly diminish investor returns. Patience also affords the benefits of compounding — of earning interest on additional income or reinvested dividends and capital gains. There are tax advantages and cost benefits to consider as well. The more you sell, the more taxes you pay, and the more you trade, the higher the costs. While staying the course doesn’t eliminate risk, it can considerably lessen the effect of short-term declines.
You can further manage your investing risk through diversification. And today, more than ever, geographic diversification should be taken into account. Studies
indicate that asset allocation is the single most important determinant of a portfolio’s long-term success. The right mix of stocks, bonds and cash — aligned to your particular risk tolerance and investment objective — is very important. Age-appropriate rebalancing is also an essential aspect of asset allocation. For younger investors, an emphasis on equities — which historically have been the best performing asset class over time — is encouraged. As investors near their specific goal, such as retirement or sending a child to college, consideration may be given to replacing volatile assets (e.g. common stocks) with more-stable fixed investments (bonds or savings plans).
A third investment principle — investing regularly — can help lower the average cost of your purchases. Investing a certain amount of money each month or quarter helps ensure you won’t pay for all your shares at market highs. This strategy — known as dollar cost averaging — also reduces unconstructive “emotion” from investing, helping shareholders avoid selling weak performers just prior to an upswing, or chasing a hot performer just before a correction.
We invite you to contact us via the Internet, through our Investor Centers or over the phone. It is our privilege to provide you the information you need to make the investments that are right for you.

3 Annual Report
Shareholder Expense Example
|
As a shareholder of a Fund, you incur two types of costs: (1) transaction costs, including redemption fees, exchange fees, and (2) ongoing costs, including management fees and other Fund expenses. This Example is intended to help you understand your ongoing costs (in dollars) of investing in the Funds and to compare these costs with the ongoing costs of investing in other mutual funds.
The Example is based on an investment of $1,000 invested at the beginning of the period and held for the entire period (September 1, 2005 to Febru-ary 28, 2006).
The first line of the table below for each fund provides information about actual account values and actual expenses. You may use the information in this line, together with the amount you invested, to estimate the expenses that you paid over the period. Simply divide your account value by $1,000.00 (for example, an $8,600 account value divided by $1,000.00 = 8.6), then multiply the result by the number in the first line for a fund under the heading entitled “Expenses Paid During Period” to estimate the expenses you paid on your account during this period. A small balance maintenance fee of $12.00 that is charged once a year may apply for certain accounts with a value of less than $2,000. This fee is not included in the table below. If it was, the estimate of expenses you paid during the period would be higher, and your ending account value lower, by this amount.
Hypothetical Example for Comparison Purposes
|
The second line of the table below for each fund provides information about hypothetical account values and hypothetical expenses based on a fund’s actual expense ratio and an assumed rate of return of 5% per year before expenses, which is not the Fund’s actual return. The hypothetical account values and expenses may not be used to estimate the actual ending account balance or expenses you paid for the period. You may use this information to compare the ongoing costs of investing in the Fund and other funds. To do so, compare this 5% hypothetical example with the 5% hypothetical examples that appear in the shareholder reports of the other funds. A small balance maintenance fee of $12.00 that is charged once a year may apply for certain accounts with a value of less than $2,000. This fee is not included in the table below. If it was, the estimate of expenses you paid during the period would be higher, and your ending account value lower, by this amount.
Please note that the expenses shown in the table are meant to highlight your ongoing costs only and do not reflect any transaction costs. Therefore, the second line of the table is useful in comparing ongoing costs only, and will not help you determine the relative total costs of owning different funds. In addition, if these transactional costs were included, your costs would have been higher.
| | | | | | | Expenses Paid |
| | | Beginning | | Ending | | During Period* |
| | | Account Value | | Account Value | | September 1, 2005 to |
| | | September 1, 2005 | | February 28, 2006 | | February 28, 2006 |
| Air Transportation Portfolio | | | | | | | | |
| Actual | | $ 1,000.00 | | $ 1,205.40 | | $ | | 6.12 |
| HypotheticalA | | $ 1,000.00 | | $ 1,019.24 | | $ | | 5.61 |
| Automotive Portfolio | | | | | | | | |
| Actual | | $ 1,000.00 | | $ 957.20 | | $ | | 6.07 |
| HypotheticalA | | $ 1,000.00 | | $ 1,018.60 | | $ | | 6.26 |
| Chemicals Portfolio | | | | | | | | |
| Actual | | $ 1,000.00 | | $ 1,076.60 | | $ | | 5.35 |
| HypotheticalA | | $ 1,000.00 | | $ 1,019.64 | | $ | | 5.21 |
| Construction and Housing Portfolio | | | | | | | | |
| Actual | | $ 1,000.00 | | $ 1,034.50 | | $ | | 5.09 |
| HypotheticalA | | $ 1,000.00 | | $ 1,019.79 | | $ | | 5.06 |
| Cyclical Industries Portfolio | | | | | | | | |
| Actual | | $ 1,000.00 | | $ 1,133.30 | | $ | | 5.92 |
| HypotheticalA | | $ 1,000.00 | | $ 1,019.24 | | $ | | 5.61 |
| Defense and Aerospace Portfolio | | | | | | | | |
| Actual | | $ 1,000.00 | | $ 1,105.20 | | $ | | 4.96 |
| HypotheticalA | | $ 1,000.00 | | $ 1,020.08 | | $ | | 4.76 |
| Environmental Portfolio | | | | | | | | |
| Actual | | $ 1,000.00 | | $ 1,110.80 | | $ | | 6.54 |
| HypotheticalA | | $ 1,000.00 | | $ 1,018.60 | | $ | | 6.26 |
| Industrial Equipment Portfolio | | | | | | | | |
| Actual | | $ 1,000.00 | | $ 1,136.30 | | $ | | 5.30 |
| HypotheticalA | | $ 1,000.00 | | $ 1,019.84 | | $ | | 5.01 |
| Industrial Materials Portfolio | | | | | | | | |
| Actual | | $ 1,000.00 | | $ 1,192.70 | | $ | | 5.55 |
| HypotheticalA | | $ 1,000.00 | | $ 1,019.74 | | $ | | 5.11 |
| Transportation Portfolio | | | | | | | | |
| Actual | | $ 1,000.00 | | $ 1,201.10 | | $ | | 6.06 |
| HypotheticalA | | $ 1,000.00 | | $ 1,019.29 | | $ | | 5.56 |
| |
| A 5% return per year before expenses | | | | | | | | |
* Expenses are equal to each Fund’s annualized expense ratio (shown in the table below); multiplied by the average account value over the period, multiplied by 181/365 (to reflect the one-half year period).
| | | Annualized |
| | | Expense Ratio |
| Air Transportation Portfolio | | 1.12% |
| Automotive Portfolio | | 1.25% |
| Chemicals Portfolio | | 1.04% |
| Construction and Housing Portfolio | | 1.01% |
| Cyclical Industries Portfolio | | 1.12% |
| Defense and Aerospace Portfolio | | 95% |
| Environmental Portfolio | | 1.25% |
| Industrial Equipment Portfolio | | 1.00% |
| Industrial Materials Portfolio | | 1.02% |
| Transportation Portfolio | | 1.11% |
55 Annual Report
Air Transportation Portfolio
Performance
|

Average annual total return reflects the change in the value of an investment, assuming reinvestment of the fund’s dividend income and capital gains (the profits earned upon the sale of securities that have grown in value) and assuming a constant rate of performance each year. The $10,000 table and the fund’s returns do not reflect the deduction of taxes that a shareholder would pay on fund distributions or the redemption of fund shares. During periods of reimbursement by Fidelity a fund’s total returns will be greater than it would be had the reimbursement not occurred. How a fund did yesterday is no guarantee of how it will do tomorrow.
| Average Annual Total Returns | | | | | | |
| Periods ended February 28, 2006 | | Past 1 | | Past 5 | | Past 10 |
| | | year | | years | | years |
| Select Air Transportation | | 31.40% | | 5.86% | | 11.95% |
$10,000 Over 10 Years
Let’s say hypothetically that $10,000 was invested in Fidelity® Select Air Transportation Portfolio on February 29, 1996. The chart shows how the value of your investment would have changed, and also shows how the S&P 500® Index performed over the same period.
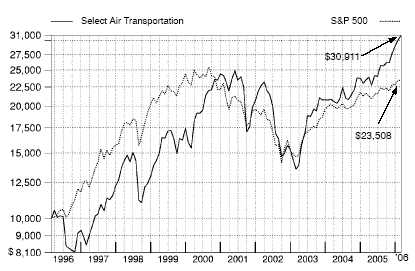
Air Transportation Portfolio
|
Management’s Discussion of Fund Performance
Comments from Andrew Hatem, Portfolio Manager of Fidelity® Select Air Transportation Portfolio
With the exception of several popular large-cap stock performance measures, most major U.S. equity benchmarks had double-digit returns for the year ending February 28, 2006. For much of the period, market gains were driven largely by the energy sector, although utilities ultimately sneaked into the top spot for the year overall. Financials and telecommunication services also reached double figures, outperforming the 8.40% return of the broader market as measured by the large-cap-oriented Standard & Poor’s 500SM Index. The consumer discretionary segment — home to the weak performing automobile and media industries — was the biggest disappointment. Although the overall return for the S&P 500® beat the small-cap Russell 2000® Index in calendar year 2005 — the first time that’s happened in six years — small-caps stormed back in early 2006, leading to a 16.59% advance during the past 12 months, nearly twice the broader market’s gain. Mid-caps soared even higher, returning 17.67% according to the Russell Midcap® Index. The technology-heavy NASDAQ Composite® Index also fared well, climbing 12.13%, but the Dow Jones Industrial AverageSM, an index of 30 large-cap, blue-chip stocks, managed to rise only 4.52% .
Select Air Transportation gained 31.40% for the 12 months ending February 28, 2006, well ahead of both the S&P 500 and the Goldman Sachs® Cyclical Industries Index, which returned 9.59% . Continued passenger demand amid an environment of limited aircraft supply helped some airline operators post solid earnings during the period. In commercial aerospace, orders for new aircraft, particularly from the developing world, benefited that segment of the industry. Many defense contractors beat Wall Street’s expectations when cuts to government programs didn’t materialize as expected. Strong stock selection overall within the commercial aerospace and defense groups and other related areas drove a good deal of the fund’s solid outperformance relative to the sector index. Among the top contributors were airline companies AirTran Holdings and AMR, parent of American Airlines; Titanium Metals, which supplies the commercial aerospace industry’s increasing demand for lighter structural materials; Precision Castparts, which makes components for jet engines; and aircraft manufacturer Boeing, whose new orders grew substantially during 2005. In addition, the fund’s concentration in a relatively narrow part of the broad cyclical industries universe benefited relative performance, as it insulated the fund from weaker performing areas of the index, such as industrial conglomerates and diversified chemicals. It also held back performance a bit by limiting our exposure to strong performing areas of the index, such as railroads and construction/farm machinery. The biggest individual detractors from performance were Delta Air Lines and Northwest Airlines, both of which filed for bankruptcy during the period.
The views expressed above reflect those of the portfolio manager(s) only through the end of the period as stated on the cover of this report and do not necessarily represent the views of Fidelity or any other person in the Fidelity organization. Any such views are subject to change at any time based upon market or other conditions and Fidelity disclaims any responsibility to update such views. These views may not be relied on as investment advice and, because investment decisions for a Fidelity fund are based on numerous factors, may not be relied on as an indication of trading intent on behalf of any Fidelity fund.
77 Annual Report
Air Transportation Portfolio
Investment Changes
| Top Ten Stocks as of February 28, 2006 |
| | | % of fund’s | | % of fund’s net assets |
| | | net assets | | 6 months ago |
| C.H. Robinson Worldwide, Inc. | | 6.1 | | 1.9 |
| General Dynamics Corp. | | 6.1 | | 3.9 |
| Rockwell Collins, Inc. | | 5.6 | | 6.5 |
| Precision Castparts Corp. | | 5.4 | | 6.7 |
| Expeditors International of | | | | |
| Washington, Inc. | | 5.1 | | 5.5 |
| AirTran Holdings, Inc. | | 5.1 | | 1.9 |
| Goodrich Corp. | | 4.9 | | 2.4 |
| AMR Corp. | | 4.7 | | 2.4 |
| Southwest Airlines Co. | | 4.1 | | 0.8 |
| United Technologies Corp. | | 3.7 | | 2.1 |
| | | 50.8 | | |
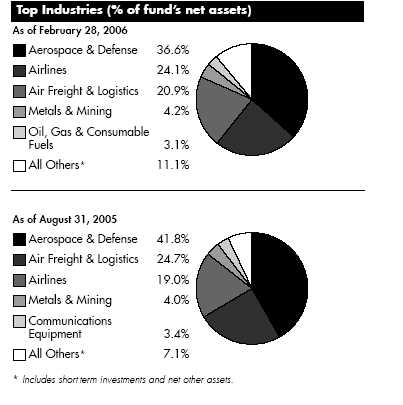
Annual Report 8
| Air Transportation Portfolio | | | | | | |
| Investments February 28, 2006 | | | | |
| Showing Percentage of Net Assets | | | | | | |
| |
| Common Stocks — 93.8% | | | | | | |
| | | | | Shares | | Value (Note 1) |
| |
| AEROSPACE & DEFENSE – 36.6% | | | | | | |
| Aerospace & Defense – 36.6% | | | | | | |
| Alliant Techsystems, Inc. (a) | | | | 11,700 | | $ 894,114 |
| BE Aerospace, Inc. (a) | | | | 26,200 | | 628,538 |
| Bombardier, Inc. Class B (sub. vtg.) (a) | | | | 752,000 | | 1,932,703 |
| General Dynamics Corp. | | | | 57,900 | | 7,137,333 |
| Goodrich Corp. | | | | 137,600 | | 5,757,184 |
| Hexcel Corp. (a) | | | | 71,600 | | 1,540,832 |
| Honeywell International, Inc. | | | | 21,000 | | 859,950 |
| L-3 Communications Holdings, Inc. | | | | 10,400 | | 864,344 |
| Lockheed Martin Corp. | | | | 22,800 | | 1,661,436 |
| Orbital Sciences Corp. (a) | | | | 60,200 | | 916,846 |
| Precision Castparts Corp. | | | | 119,700 | | 6,348,888 |
| Raytheon Co. | | | | 57,100 | | 2,478,140 |
| Rockwell Collins, Inc. | | | | 124,700 | | 6,627,805 |
| The Boeing Co. | | | | 14,300 | | 1,039,467 |
| United Technologies Corp. | | | | 74,800 | | 4,375,800 |
| | | | | | | 43,063,380 |
| |
| AIR FREIGHT & LOGISTICS – 20.9% | | | | | | |
| Air Freight & Logistics – 20.9% | | | | | | |
| C.H. Robinson Worldwide, Inc. | | | | 161,000 | | 7,216,019 |
| Dynamex, Inc. (a) | | | | 100 | | 2,032 |
| EGL, Inc. (a) | | | | 51,263 | | 2,073,588 |
| Expeditors International of Washington, Inc. | | | | 77,900 | | 6,059,841 |
| FedEx Corp. | | | | 950 | | 101,878 |
| Forward Air Corp. | | | | 89,700 | | 3,182,556 |
| Hub Group, Inc. Class A (a) | | | | 55,800 | | 2,326,860 |
| United Parcel Service, Inc. Class B | | | | 17,400 | | 1,299,954 |
| UTI Worldwide, Inc. | | | | 22,487 | | 2,352,815 |
| | | | | | | 24,615,543 |
| |
| AIRLINES – 24.1% | | | | | | |
| Airlines – 24.1% | | | | | | |
| AirTran Holdings, Inc. (a) | | | | 338,500 | | 6,018,530 |
| Alaska Air Group, Inc. (a) | | | | 15,200 | | 487,160 |
| AMR Corp. (a) | | | | 218,700 | | 5,489,370 |
| British Airways PLC ADR (a) | | | | 23,200 | | 1,331,448 |
| Continental Airlines, Inc. Class B (a) | | | | 16,800 | | 391,440 |
| Delta Air Lines, Inc. (a) | | | | 76,800 | | 38,784 |
| ExpressJet Holdings, Inc. Class A (a) | | | | 200 | | 1,504 |
| Frontier Airlines, Inc. (a) | | | | 300 | | 2,160 |
| JetBlue Airways Corp. (a)(d) | | | | 123,718 | | 1,410,385 |
| Northwest Airlines Corp. (a) | | | | 49,300 | | 18,734 |
| |
| |
| | | | | Shares | | Value (Note 1) |
| Pinnacle Airlines Corp. (a) | | | | 600 | | $ 4,530 |
| Republic Airways Holdings, Inc. (a) | | | | 109,200 | | 1,530,984 |
| Ryanair Holdings PLC sponsored ADR (a) | | | | 28,800 | | 1,528,992 |
| SkyWest, Inc. | | | | 200 | | 5,794 |
| Southwest Airlines Co. | | | | 283,025 | | 4,746,329 |
| UAL Corp. (a) | | | | 66,200 | | 2,348,114 |
| |
| See accompanying notes which are an integral part of the financial statements. | | | | |
9
9 Annual Report
| Air Transportation Portfolio | | | | |
| Investments - continued | | | | |
| |
| US Airways Group, Inc. (a)(d) | | 82,966 | | 2,745,345 |
| WestJet Airlines Ltd. (a) | | 22,050 | | 214,843 |
| | | | | 28,314,446 |
| |
| COMMERCIAL SERVICES & SUPPLIES – 2.4% | | | | |
| Diversified Commercial & Professional Services – 2.4% | | | | |
| The Brink’s Co. | | 57,800 | | 2,830,466 |
| COMMUNICATIONS EQUIPMENT – 1.4% | | | | |
| Communications Equipment – 1.4% | | | | |
| Harris Corp. | | 37,000 | | 1,690,160 |
| ENERGY EQUIPMENT & SERVICES – 1.1% | | | | |
| Oil & Gas Equipment & Services – 1.1% | | | | |
| Hornbeck Offshore Services, Inc. (a) | | 40,500 | | 1,302,480 |
| METALS & MINING – 4.2% | | | | |
| Diversified Metals & Mining – 3.2% | | | | |
| RTI International Metals, Inc. (a) | | 25,800 | | 1,084,890 |
| Titanium Metals Corp. (a)(d) | | 58,000 | | 2,379,160 |
| VSMPO-AVISMA Corp. warrants (UBS Warrant Programme) 10/28/06 (a) | | 1,180 | | 259,954 |
| | | | | 3,724,004 |
| Steel – 1.0% | | | | |
| Allegheny Technologies, Inc. | | 24,400 | | 1,232,444 |
| TOTAL METALS & MINING | | | | 4,956,448 |
| |
| OIL, GAS & CONSUMABLE FUELS – 3.1% | | | | |
| Oil & Gas Exploration & Production – 1.4% | | | | |
| Apache Corp. | | 12,200 | | 816,424 |
| Chesapeake Energy Corp. | | 28,800 | | 855,072 |
| | | | | 1,671,496 |
| Oil & Gas Refining & Marketing – 1.7% | | | | |
| Valero Energy Corp. | | 36,300 | | 1,952,577 |
| Oil & Gas Storage & Transport – 0.0% | | | | |
| Ship Finance International Ltd. (NY Shares) | | 18 | | 330 |
| TOTAL OIL, GAS & CONSUMABLE FUELS | | | | 3,624,403 |
| |
| TOTAL COMMON STOCKS | | | | |
| (Cost $94,844,755) | | | | 110,397,326 |
| |
| Money Market Funds — 12.6% | | | | |
| | | Shares | | Value (Note 1) |
| Fidelity Cash Central Fund, 4.57% (b) | | 9,504,951 | | $ 9,504,951 |
| Fidelity Securities Lending Cash Central Fund, 4.58% (b)(c) | | 5,274,525 | | 5,274,525 |
| TOTAL MONEY MARKET FUNDS | | | | |
| (Cost $14,779,476) | | | | 14,779,476 |
| |
| TOTAL INVESTMENT PORTFOLIO - 106.4% | | | | |
| (Cost $109,624,231) | | | | 125,176,802 |
| |
| NET OTHER ASSETS – (6.4)% | | | | (7,535,500) |
| NET ASSETS – 100% | | | | $ 117,641,302 |
| |
| Legend | | | | |
| (a) Non-income producing | | | | |
See accompanying notes which are an integral part of the financial statements.
Annual Report 10
(b) Affiliated fund that is available only to investment companies and other accounts managed by Fidelity Investments. The rate quoted is the annualized seven-day yield of the fund at period end. A complete unaudited listing of the fund’s holdings as of its most recent quarter end is available upon request.
(c) Investment made with cash collateral received from securities on loan. (d) Security or a portion of the security is on loan at period end.
Information regarding fiscal year to date income earned by the fund from the affiliated Central funds is as follows:
| Fund | | Income earned |
| Fidelity Cash Central Fund | | $ 85,810 |
| Fidelity Securities Lending Cash Central Fund | | 89,080 |
| Total | | $ 174,890 |
See accompanying notes which are an integral part of the financial statements.
|
11 Annual Report
11
| Air Transportation Portfolio | | | | | | |
| |
| Financial Statements | | | | |
| |
| |
| Statement of Assets and Liabilities | | | | |
| | | | | | | February 28, 2006 |
| |
| Assets | | | | | | | | |
| Investment in securities, at value (in- | | | | | | | | |
| cluding securities loaned of | | | | | | | | |
| $5,110,216) — See accompany- | | | | | | | | |
| ing schedule: | | | | | | | | |
| Unaffiliated issuers (cost | | | | | | | | |
| $94,844,755) | | $ | | 110,397,326 | | | | |
| Affiliated Central Funds (cost | | | | | | | | |
| $14,779,476) | | | | 14,779,476 | | | | |
| Total Investments (cost | | | | | | | | |
| $109,624,231) | | | | | | $ | | 125,176,802 |
| Receivable for fund shares sold | | | | | | | | 2,741,475 |
| Dividends receivable | | | | | | | | 41,403 |
| Interest receivable | | | | | | | | 20,847 |
| Prepaid expenses | | | | | | | | 141 |
| Other affiliated receivables | | | | | | | | 1,106 |
| Other receivables | | | | | | | | 11,523 |
| Total assets | | | | | | | | 127,993,297 |
| |
| Liabilities | | | | | | | | |
| Payable for investments purchased | | . $ | | 4,131,806 | | | | |
| Payable for fund shares redeemed | | . | | 850,933 | | | | |
| Accrued management fee | | | | 38,784 | | | | |
| Other affiliated payables | | | | 29,863 | | | | |
| Other payables and accrued | | | | | | | | |
| expenses | | | | 26,084 | | | | |
| Collateral on securities loaned, at | | | | | | | | |
| value | | | | 5,274,525 | | | | |
| Total liabilities | | | | | | | | 10,351,995 |
| |
| Net Assets | | | | | | $ | | 117,641,302 |
| Net Assets consist of: | | | | | | | | |
| Paid in capital | | | | | | $ | | 98,553,880 |
| Accumulated net investment loss | | | | | | | | (20) |
| Accumulated undistributed net real- | | | | | | | | |
| ized gain (loss) on investments and | | | | | | |
| foreign currency transactions | | | | | | | | 3,534,871 |
| Net unrealized appreciation (de- | | | | | | | | |
| preciation) on investments | | | | | | | | 15,552,571 |
| Net Assets, for 2,727,106 shares | | | | | | | | |
| outstanding | | | | | | $ | | 117,641,302 |
| Net Asset Value, offering price and | | | | | | | | |
| redemption price per share | | | | | | | | |
| ($117,641,302 ÷ 2,727,106 | | | | | | | | |
| shares) | | | | | | $ | | 43.14 |
| Statement of Operations | | | | |
| | | | | Year ended February 28, 2006 |
| |
| Investment Income | | | | | | |
| Dividends | | | | | | $ 297,237 |
| Interest | | | | | | 304 |
| Income from affiliated Central Funds | | | | |
| (including $89,080 from security | | | | |
| lending) | | | | | | 174,890 |
| Total income | | | | | | 472,431 |
| |
| Expenses | | | | | | |
| Management fee | | $ | | 272,683 | | |
| Transfer agent fees | | | | 181,728 | | |
| Accounting and security lending | | | | | | |
| fees | | | | 24,862 | | |
| Independent trustees’ compensation | | 185 | | |
| Custodian fees and expenses | | | | 9,532 | | |
| Registration fees | | | | 26,696 | | |
| Audit | | | | 33,793 | | |
| Legal | | | | 222 | | |
| Miscellaneous | | | | 413 | | |
| Total expenses before reductions | | 550,114 | | |
| Expense reductions | | | | (24,366) | | 525,748 |
| |
| Net investment income (loss) | | | | | | (53,317) |
| Realized and Unrealized Gain | | | | | | |
| (Loss) | | | | | | |
| Net realized gain (loss) on: | | | | | | |
| Investment securities: | | | | | | |
| Unaffiliated issuers | | | | 4,746,371 | | |
| Foreign currency transactions | | | | (3,030) | | |
| Total net realized gain (loss) | | | | | | 4,743,341 |
| Change in net unrealized appreci- | | | | |
| ation (depreciation) on investment | | | | |
| securities | | | | | | 9,148,901 |
| Net gain (loss) | | | | | | 13,892,242 |
| Net increase (decrease) in net as- | | | | |
| sets resulting from operations | | | | | | $ 13,838,925 |
See accompanying notes which are an integral part of the financial statements.
Annual Report 12
| Statement of Changes in Net Assets | | | | | | | | | | | | | | | | | | | | |
| | | | | | | | | | | | | | | Year ended | | Year ended |
| | | | | | | | | | | | | | | February 28, | | February 28, |
| | | | | | | | | | | | | | | 2006 | | | | 2005 |
| Increase (Decrease) in Net Assets | | | | | | | | | | | | | | | | | | | | |
| Operations | | | | | | | | | | | | | | | | | | | | |
| Net investment income (loss) | | | | | | | | | | | | $ | | | | (53,317) $ | | | | 80,186 |
| Net realized gain (loss) | | | | | | | | | | | | | | 4,743,341 | | | | 1,794,710 |
| Change in net unrealized appreciation (depreciation) | | | | | | | | | | | | | | 9,148,901 | | | | 1,673,873 |
| Net increase (decrease) in net assets resulting from operations | | | | | | | | | | | | | | 13,838,925 | | | | 3,548,769 |
| Distributions to shareholders from net investment income | | | | | | | | | | | | | | | | (11,065) | | | | (75,768) |
| Distributions to shareholders from net realized gain | | | | | | | | | | | | | | (1,175,691) | | | | (413,778) |
| Total distributions | | | | | | | | | | | | | | (1,186,756) | | | | (489,546) |
| Share transactions | | | | | | | | | | | | | | | | | | | | |
| Proceeds from sales of shares | | | | | | | | | | | | | | 140,976,982 | | | | 38,746,570 |
| Reinvestment of distributions | | | | | | | | | | | | | | 1,075,872 | | | | 467,993 |
| Cost of shares redeemed | | | | | | | | | | | | | | (72,407,983) | | (41,752,504) |
| Net increase (decrease) in net assets resulting from share transactions | | | | | | | | | | | | 69,644,871 | | | | (2,537,941) |
| Redemption fees | | | | | | | | | | | | | | | | 52,151 | | | | 47,025 |
| Total increase (decrease) in net assets | | | | | | | | | | | | | | 82,349,191 | | | | 568,307 |
| |
| Net Assets | | | | | | | | | | | | | | | | | | | | |
| Beginning of period | | | | | | | | | | | | | | 35,292,111 | | | | 34,723,804 |
| End of period (including accumulated net investment loss of $20 and undistributed net investment income of $10,488, | | | | | | | | |
| respectively) | | | | | | | | | | | | $ | | 117,641,302 $ | | | | 35,292,111 |
| |
| Other Information | | | | | | | | | | | | | | | | | | | | |
| Shares | | | | | | | | | | | | | | | | | | | | |
| Sold | | | | | | | | | | | | | | 3,522,772 | | | | 1,226,404 |
| Issued in reinvestment of distributions | | | | | | | | | | | | | | | | 26,955 | | | | 15,318 |
| Redeemed | | | | | | | | | | | | | | (1,877,480) | | | | (1,342,761) |
| Net increase (decrease) | | | | | | | | | | | | | | 1,672,247 | | | | (101,039) |
| |
| Financial Highlights | | | | | | | | | | | | | | | | | | | | |
| Years ended February 28, | | | | 2006 | | | | 2005 | | | | 2004E | | | | 2003 | | | | 2002 |
| Selected Per-Share Data | | | | | | | | | | | | | | | | | | | | |
| Net asset value, beginning of period | | $ | | 33.46 | | $ | | 30.04 | | $ | | 19.58 | | $ | | 32.96 | | $ | | 35.48 |
| Income from Investment Operations | | | | | | | | | | | | | | | | | | | | |
| Net investment income (loss)C | | | | (.04) | | | | .07 | | | | (.13) | | | | (.19) | | | | (.08) |
| Net realized and unrealized gain (loss) | | | | 10.44 | | | | 3.73 | | | | 10.55 | | | | (12.99) | | | | (.88) |
| Total from investment operations | | | | 10.40 | | | | 3.80 | | | | 10.42 | | | | (13.18) | | | | (.96) |
| Distributions from net investment income | | | | (.01) | | | | (.06) | | | | — | | | | — | | | | — |
| Distributions from net realized gain | | | | (.75) | | | | (.36) | | | | — | | | | (.24) | | | | (1.61) |
| Total distributions | | | | (.76) | | | | (.42) | | | | — | | | | (.24) | | | | (1.61) |
| Redemption fees added to paid in capitalC | | | | 04 | | | | .04 | | | | .04 | | | | .04 | | | | .05 |
| Net asset value, end of period | | $ | | 43.14 | | $ | | 33.46 | | $ | | 30.04 | | $ | | 19.58 | | $ | | 32.96 |
| Total ReturnA,B | | | | 31.40% | | | | 12.92% | | | | 53.42% | | | | (40.16)% | | | | (2.38)% |
| Ratios to Average Net AssetsD | | | | | | | | | | | | | | | | | | | | |
| Expenses before reductions | | | | 1.16% | | | | 1.23% | | | | 1.49% | | | | 1.63% | | | | 1.43% |
| Expenses net of fee waivers, if any | | | | 1.16% | | | | 1.23% | | | | 1.49% | | | | 1.63% | | | | 1.43% |
| Expenses net of all reductions | | | | 1.11% | | | | 1.21% | | | | 1.42% | | | | 1.58% | | | | 1.38% |
| Net investment income (loss) | | | | (.11)% | | | | .22% | | | | (.47)% | | | | (.73)% | | | | (.24)% |
| Supplemental Data | | | | | | | | | | | | | | | | | | | | |
| Net assets, end of period (000 omitted) | | $ | | 117,641 | | $ | | 35,292 | | $ | | 34,724 | | $ | | 23,440 | | $ | | 67,087 |
| Portfolio turnover rate | | | | 93% | | | | 71% | | | | 140% | | | | 56% | | | | 117% |
| |
| | | | | |
A Total returns would have been lower had certain expenses not been reduced during the periods shown. B Total returns do not include the effect of the former sales charges. C Calculated based on average shares outstanding during the period. DExpense ratios reflect operating expenses of the fund. Expenses before reductions do not reflect amounts reimbursed by the investment adviser or reductions from brokerage service arrangements or other expense offset arrangements and do not represent the amount paid by the fund during periods when reimbursements or reductions occur. Expenses net of fee waivers reflect expenses after reimbursement by the investment adviser but prior to reductions from brokerage service arrangements or other expense offset arrangements. Expenses net of all reductions represent the net expenses paid by the fund. EFor the year ended February 29.
See accompanying notes which are an integral part of the financial statements.
13
Automotive Portfolio
Performance
|
Average annual total return reflects the change in the value of an investment, assuming reinvestment of the fund’s dividend income and capital gains (the profits earned upon the sale of securities that have grown in value) and assuming a constant rate of performance each year. The $10,000 table and the fund’s returns do not reflect the deduction of taxes that a shareholder would pay on fund distributions or the redemption of fund shares. During periods of reimbursement by Fidelity a fund’s total returns will be greater than it would be had the reimbursement not occurred. How a fund did yesterday is no guarantee of how it will do tomorrow.
| Average Annual Total Returns | | | | | | |
| Periods ended February 28, 2006 | | Past 1 | | Past 5 | | Past 10 |
| | | year | | years | | years |
| Select Automotive | | 0.94% | | 10.60% | | 7.19% |
$10,000 Over 10 Years
Let’s say hypothetically that $10,000 was invested in Fidelity Select Automotive Portfolio on February 29, 1996. The chart shows how the value of your investment would have changed, and also shows how the S&P 500 Index performed over the same period.
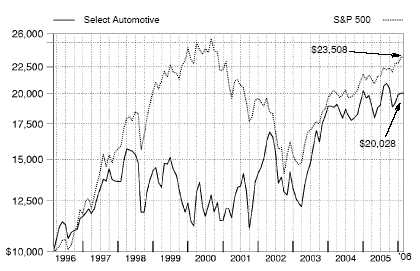
Management’s Discussion of Fund Performance
Comments from Anmol Mehra, Portfolio Manager of Fidelity® Select Automotive Portfolio
With the exception of several popular large-cap stock performance measures, most major U.S. equity benchmarks had double-digit returns for the year ending February 28, 2006. For much of the period, market gains were driven largely by the energy sector, although utilities ultimately sneaked into the top spot for the year overall. Financials and telecommunication services also reached double figures, outperforming the 8.40% return of the broader market as measured by the large-cap-oriented Standard & Poor’s 500SM Index. The consumer discretionary segment — home to the weak performing automobile and media industries — was the biggest disappointment. Although the overall return for the S&P 500® beat the small-cap Russell 2000® Index in calendar year 2005 — the first time that’s happened in six years — small-caps stormed back in early 2006, leading to a 16.59% advance during the past 12 months, nearly twice the broader market’s gain. Mid-caps soared even higher, returning 17.67% according to the Russell Midcap® Index. The technology-heavy NASDAQ Composite® Index also fared well, climbing 12.13%, but the Dow Jones Industrial AverageSM, an index of 30 large-cap, blue-chip stocks, managed to rise only 4.52% .
During the past year, the fund returned 0.94%, trailing the S&P 500 and the 9.59% return of the Goldman Sachs® Cyclical Industries Index. Unlike the fund, which is focused on a single industry, the sector index represents a broad range of cyclical industries, some of which posted considerably better performance than auto stocks did. In particular, the fund was hurt in roughly equal measure by an overweighting in the weak auto parts/equipment segment and by unfavorable stock selection within the group. The worst damage was inflicted by auto parts maker Delphi, which filed for bankruptcy protection in October 2005. Further, the fund had stakes in two other parts suppliers — Lear and American Axle & Manufacturing — whose share prices fell sharply in response to Delphi’s bankruptcy announcement. The fund no longer owned Delphi at period end. On the positive side, stock selection in the auto manufacturing group aided performance, as my picks in this area — led by Japanese automaker Toyota Motor and its South Korean rival Hyundai Motor — collectively posted a solid double-digit gain, versus a loss for the sector index’s components. Appealing product lines and disciplined cost structures enabled both companies to continue taking market share from the three major U.S. auto manufacturers. That said, the fund’s success with Japanese stocks was curbed a bit by currency fluctuations.
The views expressed above reflect those of the portfolio manager(s) only through the end of the period as stated on the cover of this report and do not necessarily represent the views of Fidelity or any other person in the Fidelity organization. Any such views are subject to change at any time based upon market or other conditions and Fidelity disclaims any responsibility to update such views. These views may not be relied on as investment advice and, because investment decisions for a Fidelity fund are based on numerous factors, may not be relied on as an indication of trading intent on behalf of any Fidelity fund.
15 15 Annual Report
Automotive Portfolio
Investment Changes
| Top Ten Stocks as of February 28, 2006 |
| | | % of fund’s | | % of fund’s net assets |
| | | net assets | | 6 months ago |
| Johnson Controls, Inc. | | 8.4 | | 7.4 |
| Toyota Motor Corp. | | 7.2 | | 7.7 |
| Hyundai Motor Co. | | 5.0 | | 4.3 |
| Harman International Industries, | | | | |
| Inc. | | 4.8 | | 6.6 |
| Nissan Motor Co. Ltd. sponsored | | | | |
| ADR | | 4.5 | | 4.6 |
| Honda Motor Co. Ltd. sponsored | | | | |
| ADR | | 4.4 | | 5.1 |
| BorgWarner, Inc. | | 4.4 | | 4.7 |
| Gentex Corp. | | 4.3 | | 3.3 |
| AutoZone, Inc. | | 4.0 | | 0.1 |
| NAVTEQ Corp. | | 3.9 | | 2.3 |
| | | 50.9 | | |
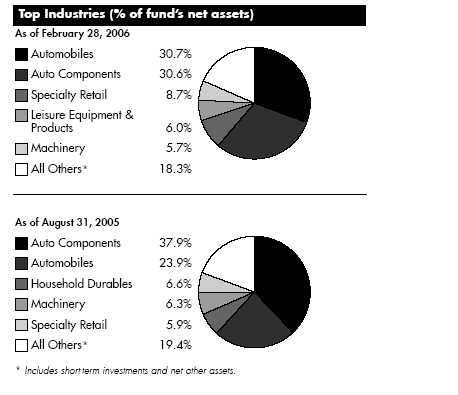
Annual Report 16
| Automotive Portfolio | | | | | | |
| Investments February 28, 2006 | | | | |
| Showing Percentage of Net Assets | | | | | | |
| |
| Common Stocks — 98.5% | | | | | | |
| | | | | Shares | | Value (Note 1) |
| |
| AUTO COMPONENTS – 30.6% | | | | | | |
| Auto Parts & Equipment – 28.7% | | | | | | |
| American Axle & Manufacturing Holdings, Inc. | | | | 6,796 | | $ 110,231 |
| Amerigon, Inc. (a) | | | | 67,000 | | 398,650 |
| Autoliv, Inc. | | | | 1,000 | | 53,550 |
| Bharat Forge Ltd. | | | | 21,262 | | 200,134 |
| BorgWarner, Inc. | | | | 12,100 | | 674,817 |
| Dana Corp. | | | | 12,300 | | 21,648 |
| Gentex Corp. | | | | 39,500 | | 658,070 |
| Hyundai Mobis | | | | 430 | | 35,942 |
| Johnson Controls, Inc. | | | | 18,090 | | 1,289,276 |
| Keystone Automotive Industries, Inc. (a) | | | | 1,000 | | 44,200 |
| Kongsberg Automotive AS | | | | 200 | | 1,675 |
| Lear Corp. (d) | | | | 12,000 | | 250,320 |
| LKQ Corp. (a) | | | | 3,600 | | 79,272 |
| Quantum Fuel Systems Technologies Worldwide, Inc. (a) | | | | 9,000 | | 40,770 |
| Tenneco, Inc. (a) | | | | 2,800 | | 63,420 |
| TRW Automotive Holdings Corp. (a) | | | | 11,300 | | 289,280 |
| Visteon Corp. (a) | | | | 42,500 | | 198,050 |
| | | | | | | 4,409,305 |
| Tires & Rubber – 1.9% | | | | | | |
| Continental AG | | | | 1,700 | | 174,001 |
| Goodyear Tire & Rubber Co. (a)(d) | | | | 6,000 | | 85,980 |
| Nokian Tyres Ltd. | | | | 1,630 | | 25,941 |
| | | | | | | 285,922 |
| |
| TOTAL AUTO COMPONENTS | | | | | | 4,695,227 |
| |
| AUTOMOBILES – 30.2% | | | | | | |
| Automobile Manufacturers – 29.2% | | | | | | |
| Bayerische Motoren Werke AG (BMW) | | | | 3,700 | | 177,930 |
| DaimlerChrysler AG | | | | 6,500 | | 360,555 |
| Ford Motor Co. | | | | 46,700 | | 372,199 |
| General Motors Corp. (d) | | | | 10,800 | | 219,348 |
| Honda Motor Co. Ltd. sponsored ADR | | | | 23,200 | | 681,616 |
| Hyundai Motor Co. | | | | 8,970 | | 760,760 |
| Maruti Udyog Ltd. | | | | 4,208 | | 78,182 |
| Monaco Coach Corp. | | | | 1,100 | | 15,741 |
| Nissan Motor Co. Ltd. sponsored ADR (d) | | | | 30,100 | | 692,601 |
| Toyota Motor Corp. | | | | 20,600 | | 1,100,761 |
| Winnebago Industries, Inc. | | | | 900 | | 28,908 |
| | | | | | | 4,488,601 |
| Motorcycle Manufacturers – 1.0% | | | | | | |
| Bajaj Auto Ltd. | | | | 1,855 | | 108,985 |
| Harley-Davidson, Inc. | | | | 700 | | 36,757 |
| | | | | | | 145,742 |
| |
| TOTAL AUTOMOBILES | | | | | | 4,634,343 |
See accompanying notes which are an integral part of the financial statements.
|
17 Annual Report
17
| Automotive Portfolio | | | | |
| Investments - continued | | | | |
| |
| |
| |
| | | Shares | | Value (Note 1) |
| |
| BUILDING PRODUCTS – 0.5% | | | | |
| Building Products – 0.5% | | | | |
| Quixote Corp. | | 3,700 | | $ 83,065 |
| COMMERCIAL SERVICES & SUPPLIES – 0.7% | | | | |
| Diversified Commercial & Professional Services – 0.7% | | | | |
| Adesa, Inc. | | 2,000 | | 50,000 |
| Copart, Inc. (a) | | 2,200 | | 56,848 |
| | | | | 106,848 |
| |
| COMMUNICATIONS EQUIPMENT – 0.4% | | | | |
| Communications Equipment – 0.4% | | | | |
| Ituran Location & Control Ltd. | | 3,400 | | 57,800 |
| DISTRIBUTORS – 1.6% | | | | |
| Distributors – 1.6% | | | | |
| Genuine Parts Co. | | 5,400 | | 240,408 |
| DIVERSIFIED CONSUMER SERVICES – 0.5% | | | | |
| Education Services – 0.5% | | | | |
| Universal Technical Institute, Inc. (a) | | 2,400 | | 73,944 |
| ELECTRICAL EQUIPMENT – 0.7% | | | | |
| Electrical Components & Equipment – 0.7% | | | | |
| Energy Conversion Devices, Inc. (a)(d) | | 2,100 | | 98,385 |
| Hoku Scientific, Inc. | | 500 | | 3,775 |
| | | | | 102,160 |
| |
| ELECTRONIC EQUIPMENT & INSTRUMENTS – 1.3% | | | | |
| Electronic Equipment & Instruments – 1.3% | | | | |
| Iteris, Inc. (a) | | 76,000 | | 163,400 |
| LoJack Corp. (a) | | 1,400 | | 31,850 |
| | | | | 195,250 |
| |
| HOUSEHOLD DURABLES – 5.2% | | | | |
| Consumer Electronics – 5.0% | | | | |
| Directed Electronics, Inc. | | 2,000 | | 28,300 |
| Harman International Industries, Inc. | | 6,700 | | 739,345 |
| | | | | 767,645 |
| Household Appliances – 0.2% | | | | |
| Snap-On, Inc. | | 800 | | 31,136 |
| TOTAL HOUSEHOLD DURABLES | | | | 798,781 |
| |
| INTERNET SOFTWARE & SERVICES – 0.2% | | | | |
| Internet Software & Services – 0.2% | | | | |
| Traffic.com, Inc. | | 3,500 | | 37,555 |
| LEISURE EQUIPMENT & PRODUCTS – 6.0% | | | | |
| Leisure Products – 6.0% | | | | |
| Brunswick Corp. | | 9,800 | | 384,454 |
| MarineMax, Inc. (a) | | 17,700 | | 546,222 |
| | | | | 930,676 |
See accompanying notes which are an integral part of the financial statements.
Annual Report 18
| Common Stocks – continued | | | | |
| | | Shares | | Value (Note |
| |
| MACHINERY – 5.7% | | | | |
| Construction & Farm Machinery & Heavy Trucks – 3.9% | | | | |
| Oshkosh Truck Co. | | 5,800 | | $ 329,034 |
| PACCAR, Inc. | | 2,225 | | 155,461 |
| Tata Motors Ltd. sponsored ADR | | 2,300 | | 42,159 |
| Terex Corp. (a) | | 1,000 | | 79,150 |
| | | | | 605,804 |
| Industrial Machinery – 1.8% | | | | |
| Eaton Corp. | | 3,900 | | 271,713 |
| TOTAL MACHINERY | | | | 877,517 |
| |
| MEDIA – 1.1% | | | | |
| Broadcasting & Cable TV – 1.1% | | | | |
| XM Satellite Radio Holdings, Inc. Class A (a) | | 7,700 | | 170,093 |
| METALS & MINING – 0.6% | | | | |
| Aluminum – 0.3% | | | | |
| Alcoa, Inc. | | 1,400 | | 41,048 |
| Steel – 0.3% | | | | |
| Allegheny Technologies, Inc. | | 900 | | 45,459 |
| TOTAL METALS & MINING | | | | 86,507 |
| |
| SEMICONDUCTORS & SEMICONDUCTOR EQUIPMENT – 0.3% | | | | |
| Semiconductors – 0.3% | | | | |
| SiRF Technology Holdings, Inc. (a) | | 1,484 | | 55,546 |
| SOFTWARE – 4.2% | | | | |
| Application Software – 3.9% | | | | |
| NAVTEQ Corp. (a) | | 12,800 | | 592,768 |
| Systems Software – 0.3% | | | | |
| Quorum Information Technologies, Inc. (a) | | 20,500 | | 47,815 |
| TOTAL SOFTWARE | | | | 640,583 |
| |
| SPECIALTY RETAIL – 8.7% | | | | |
| Automotive Retail – 8.7% | | | | |
| Advance Auto Parts, Inc. (a) | | 2,800 | | 115,780 |
| Asbury Automotive Group, Inc. (a) | | 3,300 | | 63,195 |
| AutoNation, Inc. (a) | | 6,200 | | 129,642 |
| |
| | | Shares | | Value (Note |
| AutoZone, Inc. (a) | | 6,300 | | $ 609,084 |
| Group 1 Automotive, Inc. (a) | | 6,000 | | 229,680 |
| Lithia Motors, Inc. Class A (sub. vtg.) | | 2,200 | | 70,488 |
| Monro Muffler Brake, Inc. | | 1,600 | | 57,888 |
| O’Reilly Automotive, Inc. (a) | | 600 | | 19,632 |
| United Auto Group, Inc. | | 1,000 | | 43,240 |
| | | | | 1,338,629 |
| |
| TOTAL COMMON STOCKS | | | | |
| (Cost $15,189,467) | | | | 15,124,932 |
| |
| |
| See accompanying notes which are an integral part of the financial statements. | | | | |
19
19 Annual Report
| Automotive Portfolio | | | | | | |
| Investments - continued | | | | | | |
| |
| Nonconvertible Preferred Stocks — 0.5% | | | | | | |
| |
| AUTOMOBILES – 0.5% | | | | | | |
| Automobile Manufacturers – 0.5% | | | | | | |
| Porsche AG (non-vtg.) | | | | | | |
| (Cost $77,696) | | 102 | | | | 85,901 |
| Money Market Funds — 10.0% | | | | | | |
| Fidelity Cash Central Fund, 4.57% (b) | | 241,329 | | | | 241,329 |
| Fidelity Securities Lending Cash Central Fund, 4.58% (b)(c) | | 1,291,600 | | | | 1,291,600 |
| TOTAL MONEY MARKET FUNDS | | | | | | |
| (Cost $1,532,929) | | | | | | 1,532,929 |
| TOTAL INVESTMENT PORTFOLIO - 109.0% | | | | | | |
| (Cost $16,800,092) | | | | | | 16,743,762 |
| |
| NET OTHER ASSETS – (9.0)% | | | | | | (1,382,807) |
| NET ASSETS – 100% | | | | $ | | 15,360,955 |
(a) Non-income producing
(b) Affiliated fund that is available only to investment companies and other accounts managed by Fidelity Investments. The rate quoted is the annualized seven-day yield of the fund at period end. A complete unaudited listing of the fund’s holdings as of its most recent quarter end is available upon request.
(c) Investment made with cash collateral received from securities on loan. (d) Security or a portion of the security is on loan at period end.
Information regarding fiscal year to date income earned by the fund from the affiliated Central funds is as follows:
| Fund | | Income earned |
| Fidelity Cash Central Fund | | $ | | 15,712 |
| Fidelity Securities Lending Cash Central Fund | | | | 8,509 |
| Total | | $ | | 24,221 |
See accompanying notes which are an integral part of the financial statements.
|
| Other Information | | |
| Distribution of investments by country of issue, as a percentage of total net assets, is as follows: | | |
| |
| United States of America | | 69.9% |
| Japan | | 16.1% |
| Korea (South) | | 5.2% |
| Germany | | 5.1% |
| India | | 2.8% |
| Others (individually less than 1%) | | 0.9% |
| | | 100.0% |
At February 28, 2006, the fund had a capital loss carryforward of approximately $4,454,347 of which $663,753, $947,164, $1,663,938 and $1,179,492 will expire on February 29, 2008, and February 28, 2009, 2010 and 2011, respectively.
See accompanying notes which are an integral part of the financial statements.
|
21 Annual Report
21
| Automotive Portfolio | | | | | | |
| |
| Financial Statements | | | | | | |
| |
| |
| Statement of Assets and Liabilities | | | | | | |
| | | | | | | February 28, 2006 |
| |
| Assets | | | | | | |
| Investment in securities, at value (including securities loaned of $1,249,758) — See accompanying schedule: | | | | | | |
| Unaffiliated issuers (cost $15,267,163) | | $ | | 15,210,833 | | |
| Affiliated Central Funds (cost $1,532,929) | | | | 1,532,929 | | |
| Total Investments (cost $16,800,092) | | | | | | $ 16,743,762 |
| Receivable for investments sold | | | | | | 61,434 |
| Receivable for fund shares sold | | | | | | 29,272 |
| Dividends receivable | | | | | | 24,085 |
| Interest receivable | | | | | | 1,688 |
| Prepaid expenses | | | | | | 72 |
| Receivable from investment adviser for expense reductions | | | | | | 7,197 |
| Other receivables | | | | | | 3,514 |
| Total assets | | | | | | 16,871,024 |
| |
| Liabilities | | | | | | |
| Payable for investments purchased | | $ | | 28,536 | | |
| Payable for fund shares redeemed | | | | 131,199 | | |
| Accrued management fee | | | | 7,778 | | |
| Other affiliated payables | | | | 7,052 | | |
| Other payables and accrued expenses | | | | 43,904 | | |
| Collateral on securities loaned, at value | | | | 1,291,600 | | |
| Total liabilities | | | | | | 1,510,069 |
| |
| Net Assets | | | | | | $ 15,360,955 |
| Net Assets consist of: | | | | | | |
| Paid in capital | | | | | | $ 20,025,847 |
| Accumulated net investment loss | | | | | | (256) |
| Accumulated undistributed net realized gain (loss) on investments and foreign currency transactions | | | | | | (4,596,894) |
| Net unrealized appreciation (depreciation) on investments and assets and liabilities in foreign currencies | | | | | | (67,742) |
| Net Assets, for 447,210 shares outstanding | | | | | | $ 15,360,955 |
| Net Asset Value, offering price and redemption price per share ($15,360,955 ÷ 447,210 shares) | | | | | | $ 34.35 |
| |
| Statement of Operations | | | | | | |
| | | | | | | Year ended February 28, 2006 |
| |
| Investment Income | | | | | | |
| Dividends | | | | | | $ 220,519 |
| Income from affiliated Central Funds (including $8,509 from security lending) | | | | | | 24,221 |
| Total income | | | | | | 244,740 |
| |
| Expenses | | | | | | |
| Management fee | | $ | | 102,404 | | |
| Transfer agent fees | | | | 76,838 | | |
| Accounting and security lending fees | | | | | | |
| | | | | 9,133 | | |
| Independent trustees’ compensation | | | | 66 | | |
| Custodian fees and expenses | | | | 42,830 | | |
| Registration fees | | | | 16,539 | | |
| Audit | | | | 36,905 | | |
| Legal | | | | 422 | | |
| Miscellaneous | | | | 1,261 | | |
| Total expenses before reductions | | | | 286,398 | | |
| Expense reductions | | | | (72,087) | | 214,311 |
| |
| Net investment income (loss) | | | | | | 30,429 |
| Realized and Unrealized Gain (Loss) | | | | | | |
| Net realized gain (loss) on: | | | | | | |
| Investment securities: | | | | | | |
See accompanying notes which are an integral part of the financial statements.
Annual Report 22
| Unaffiliated issuers (net of foreign taxes of $21,419) | | 274,703 | | |
| Foreign currency transactions | | (1,778) | | |
| Total net realized gain (loss) | | | | 272,925 |
| Change in net unrealized appreciation (depreciation) on: | | | | |
| Investment securities (net of increase in deferred foreign taxes of $7,394) | | (886,449) | | |
| Assets and liabilities in foreign currencies | | (301) | | |
| Total change in net unrealized appreciation (depreciation) | | | | (886,750) |
| Net gain (loss) | | | | (613,825) |
| Net increase (decrease) in net assets resulting from operations | | | | $ (583,396) |
See accompanying notes which are an integral part of the financial statements.
|
23 Annual Report
| Automotive Portfolio | | | | | | | | | | | | | | | | | | | | |
| Financial Statements - continued | | | | | | | | | | | | | | | | | | | | |
| |
| |
| Statement of Changes in Net Assets | | | | | | | | | | | | | | | | | | | | |
| | | | | | | | | | | | | Year ended | | Year ended |
| | | | | | | | | | | | | February 28, | | February 28, |
| | | | | | | | | | | | | 2006 | | 2005 |
| Increase (Decrease) in Net Assets | | | | | | | | | | | | | | | | | | | | |
| Operations | | | | | | | | | | | | | | | | | | | | |
| Net investment income (loss) | | | | | | | | | | | | $ | | | | 30,429 $ | | | | (65,367) |
| Net realized gain (loss) | | | | | | | | | | | | | | 272,925 | | | | 2,601,719 |
| Change in net unrealized appreciation (depreciation) | | | | | | | | | | | | | | (886,750) | | (2,139,135) |
| Net increase (decrease) in net assets resulting from operations | | | | | | | | | | | | | | (583,396) | | | | 397,217 |
| Distributions to shareholders from net investment income | | | | | | | | | | | | | | (29,914) | | | | — |
| Share transactions | | | | | | | | | | | | | | | | | | | | |
| Proceeds from sales of shares | | | | | | | | | | | | | | 32,879,236 | | 21,661,231 |
| Reinvestment of distributions | | | | | | | | | | | | | | | | 27,917 | | | | — |
| Cost of shares redeemed | | | | | | | | | | | | | | (33,914,891) | | (26,565,508) |
| Net increase (decrease) in net assets resulting from share transactions | | | | | | | | | | | | (1,007,738) | | (4,904,277) |
| Redemption fees | | | | | | | | | | | | | | | | 27,708 | | | | 23,140 |
| Total increase (decrease) in net assets | | | | | | | | | | | | | | (1,593,340) | | (4,483,920) |
| |
| Net Assets | | | | | | | | | | | | | | | | | | | | |
| Beginning of period | | | | | | | | | | | | | | 16,954,295 | | 21,438,215 |
| End of period (including accumulated net investment loss of $256 and accumulated net investment loss of $388, | | | | | | | | | | |
| respectively) | | | | | | | | | | | | $ | | 15,360,955 | | $ 16,954,295 |
| |
| Other Information | | | | | | | | | | | | | | | | | | | | |
| Shares | | | | | | | | | | | | | | | | | | | | |
| Sold | | | | | | | | | | | | | | 942,833 | | | | 660,054 |
| Issued in reinvestment of distributions | | | | | | | | | | | | | | | | 823 | | | | — |
| Redeemed | | | | | | | | | | | | | | (993,625) | | | | (825,418) |
| Net increase (decrease) | | | | | | | | | | | | | | (49,969) | | | | (165,364) |
| |
| Financial Highlights | | | | | | | | | | | | | | | | | | | | |
| Years ended February 28, | | | | 2006 | | | | 2005 | | | | 2004F | | | | 2003 | | | | 2002 |
| Selected Per-Share Data | | | | | | | | | | | | | | | | | | | | |
| Net asset value, beginning of period | | $ | | 34.10 | | $ | | 32.36 | | $ | | 21.27 | | $ | | 25.93 | | $ | | 20.80 |
| Income from Investment Operations | | | | | | | | | | | | | | | | | | | | |
| Net investment income (loss)C | | | | 06 | | | | (.11) | | | | (.22) | | | | (.13) | | | | (.05) |
| Net realized and unrealized gain (loss) | | | | 21D | | | | 1.81 | | | | 11.29 | | | | (4.59) | | | | 5.10 |
| Total from investment operations | | | | 27 | | | | 1.70 | | | | 11.07 | | | | (4.72) | | | | 5.05 |
| Distributions from net investment income | | | | (.07) | | | | — | | | | — | | | | — | | | | — |
| Redemption fees added to paid in capitalC | | | | 05 | | | | .04 | | | | .02 | | | | .06 | | | | .08 |
| Net asset value, end of period | | $ | | 34.35 | | $ | | 34.10 | | $ | | 32.36 | | $ | | 21.27 | | $ | | 25.93 |
| Total ReturnA,B | | | | 94% | | | | 5.38% | | | | 52.14% | | | | (17.97)% | | | | 24.66% |
| Ratios to Average Net AssetsE | | | | | | | | | | | | | | | | | | | | |
| Expenses before reductions | | | | 1.59% | | | | 1.64% | | | | 1.78% | | | | 1.71% | | | | 1.90% |
| Expenses net of fee waivers, if any | | | | 1.25% | | | | 1.58% | | | | 1.78% | | | | 1.71% | | | | 1.90% |
| Expenses net of all reductions | | | | 1.19% | | | | 1.56% | | | | 1.77% | | | | 1.68% | | | | 1.87% |
| Net investment income (loss) | | | | 17% | | | | (.34)% | | | | (.77)% | | | | (.52)% | | | | (.20)% |
| Supplemental Data | | | | | | | | | | | | | | | | | | | | |
| Net assets, end of period (000 omitted) | | $ | | 15,361 | | $ | | 16,954 | | $ | | 21,438 | | $ | | 15,241 | | $ | | 27,688 |
| Portfolio turnover rate | | | | 206% | | | | 188% | | | | 125% | | | | 217% | | | | 180% |
| |
| | | | | |
A Total returns would have been lower had certain expenses not been reduced during the periods shown. B Total returns do not include the effect of the former sales charges. C Calculated based on average shares outstanding during the period. DThe amount shown for a share outstanding does not correspond with the aggregate net gain (loss) on investments for the period due to the timing of sales and repurchases of shares in relation to fluctuating market values of the investments of the fund. EExpense ratios reflect operating expenses of the fund. Expenses before reductions do not reflect amounts reimbursed by the investment adviser or reductions from brokerage service arrangements or other expense offset arrangements and do not represent the amount paid by the fund during periods when reimbursements or reductions occur. Expenses net of fee waivers reflect expenses after reimbursement by the investment adviser but prior to reductions from brokerage service arrange ments or other expense offset arrangements. Expenses net of all reductions represent the net expenses paid by the fund. FFor the year ended February 29.
See accompanying notes which are an integral part of the financial statements.
Annual Report 24
Chemicals Portfolio
Performance
|

Average annual total return reflects the change in the value of an investment, assuming reinvestment of the fund’s dividend income and capital gains (the profits earned upon the sale of securities that have grown in value) and assuming a constant rate of performance each year. The $10,000 table and the fund’s returns do not reflect the deduction of taxes that a shareholder would pay on fund distributions or the redemption of fund shares. During periods of reimbursement by Fidelity a fund’s total returns will be greater than it would be had the reimbursement not occurred. How a fund did yesterday is no guarantee of how it will do tomorrow.
| Average Annual Total Returns | | | | | | |
| Periods ended February 28, 2006 | | Past 1 | | Past 5 | | Past 10 |
| | | year | | years | | years |
| Select Chemicals | | 0.51% | | 13.30% | | 9.99% |
| |
| $10,000 Over 10 Years | | | | | | |
Let’s say hypothetically that $10,000 was invested in Fidelity Select Chemicals Portfolio on February 29, 1996. The chart shows how the value of your investment would have changed, and also shows how the S&P 500 Index performed over the same period.
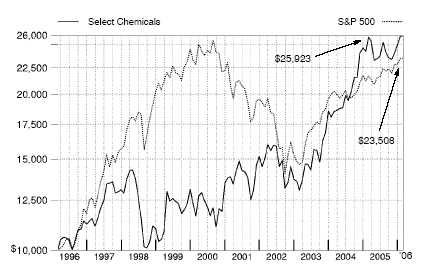
25 Annual Report
Management’s Discussion of Fund Performance
Comments from Christopher Bartel, who became Portfolio Manager of Fidelity® Select Chemicals Portfolio on April 10, 2006, after the period covered by this report
With the exception of several popular large-cap stock performance measures, most major U.S. equity benchmarks had double-digit returns for the year ending February 28, 2006. For much of the period, market gains were driven largely by the energy sector, although utilities ultimately sneaked into the top spot for the year overall. Financials and telecommunication services also reached double figures, outperforming the 8.40% return of the broader market as measured by the large-cap-oriented Standard & Poor’s 500SM Index. The consumer discretionary segment — home to the weak performing automobile and media industries — was the biggest disappointment. Although the overall return for the S&P 500® beat the small-cap Russell 2000® Index in calendar year 2005 — the first time that’s happened in six years — small-caps stormed back in early 2006, leading to a 16.59% advance during the past 12 months, nearly twice the broader market’s gain. Mid-caps soared even higher, returning 17.67% according to the Russell Midcap® Index. The technology-heavy NASDAQ Composite® Index also fared well, climbing 12.13%, but the Dow Jones Industrial AverageSM, an index of 30 large-cap, blue-chip stocks, managed to rise only 4.52% .
Fidelity Select Chemicals Portfolio was up 0.51% for the 12-month period ending February 28, 2006, underperforming the S&P 500 and the 9.59% return for the Goldman Sachsr Cyclical Industries Index. The underperformance of the chemicals industry relative to the overall market, combined with an overweighting in the particularly weak commodity chemicals group, hurt the fund a lot relative to its sector index. Another drag on performance came from stock selection in specialty chemicals and a lack of exposure to strong performing groups outside of the fund’s focus, including aerospace and defense. Among the fund’s top detractors were specialty chemical company Chemtura and commodity chemical businesses Lyondell Chemical, NOVA Chemicals and Georgia Gulf. Other notable detractors included diversified chemical makers Eastman Chemical and Dow Chemical. Performance was boosted by an overweighting and strong stock selection in the industrial gases segment as well as by an overweighting in the fertilizers and agricultural chemicals group. The fund was aided by holdings in industrial gases company Airgas and agricultural business Monsanto. The fund also benefited from its lack of exposure to industrial conglomerates and automobile manufacturers in the index — including Tyco International and Ford Motor, respectively — that fared poorly.
The views expressed above reflect those of the portfolio manager(s) only through the end of the period as stated on the cover of this report and do not necessarily represent the views of Fidelity or any other person in the Fidelity organization. Any such views are subject to change at any time based upon market or other conditions and Fidelity disclaims any responsibility to update such views. These views may not be relied on as investment advice and, because investment decisions for a Fidelity fund are based on numerous factors, may not be relied on as an indication of trading intent on behalf of any Fidelity fund.
Chemicals Portfolio
Investment Changes
Top Ten Stocks as of February 28, 2006
| | | % of fund’s | | % of fund’s net assets |
| | | net assets | | 6 months ago |
| FMC Corp. | | 10.4 | | 6.2 |
| Praxair, Inc. | | 6.6 | | 5.2 |
| 3M Co. | | 6.4 | | 4.0 |
| Air Products & Chemicals, Inc. | | 6.1 | | 6.4 |
| Monsanto Co. | | 5.6 | | 5.6 |
| Chemtura Corp. | | 5.3 | | 7.2 |
| Rohm & Haas Co. | | 4.5 | | 5.6 |
| Cytec Industries, Inc. | | 4.3 | | 1.9 |
| Georgia Gulf Corp. | | 4.2 | | 2.6 |
| Celanese Corp. Class A | | 4.0 | | 3.4 |
| | | 57.4 | | |
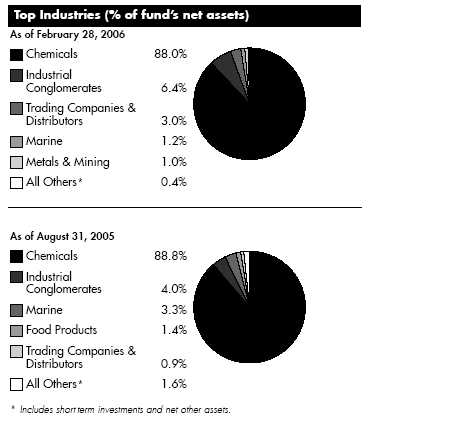
27 Annual Report
27
| Chemicals Portfolio | | | | | | | | |
| Investments February 28, 2006 | | | | |
| Showing Percentage of Net Assets | | | | | | | | |
| |
| Common Stocks — 99.8% | | | | | | | | |
| | | | | | | Shares | | Value (Note 1) |
| |
| CHEMICALS – 88.0% | | | | | | | | |
| Commodity Chemicals – 13.9% | | | | | | | | |
| Celanese Corp. Class A | | | | | | 216,086 | | $ 4,624,240 |
| Georgia Gulf Corp. | | | | | | 166,816 | | 4,787,619 |
| Lyondell Chemical Co. | | | | | | 19,423 | | 406,329 |
| NL Industries, Inc. | | | | | | 30,700 | | 404,933 |
| NOVA Chemicals Corp. | | | | | | 23,700 | | 772,026 |
| Pioneer Companies, Inc. (a) | | | | | | 45,200 | | 1,361,424 |
| Spartech Corp. | | | | | | 57,100 | | 1,381,820 |
| Westlake Chemical Corp. | | | | | | 65,800 | | 2,258,256 |
| | | | | | | | | 15,996,647 |
| Diversified Chemicals – 21.5% | | | | | | | | |
| Ashland, Inc. | | | | | | 11,200 | | 731,024 |
| BASF AG sponsored ADR | | | | | | 200 | | 15,118 |
| Dow Chemical Co. | | | | | | 80,000 | | 3,442,400 |
| E.I. du Pont de Nemours & Co. | | | | | | 59,800 | | 2,406,352 |
| Eastman Chemical Co. | | | | | | 43,200 | | 2,131,056 |
| Engelhard Corp. | | | | | | 90,100 | | 3,581,475 |
| FMC Corp. (a) | | | | | | 195,256 | | 11,873,517 |
| Hercules, Inc. (a) | | | | | | 41,100 | | 487,035 |
| | | | | | | | | 24,667,977 |
| Fertilizers & Agricultural Chemicals – 12.2% | | | | | | | | |
| Agrium, Inc. | | | | | | 23,900 | | 595,318 |
| Israel Chemicals Ltd. | | | | | | 63,000 | | 236,677 |
| Monsanto Co. | | | | | | 77,000 | | 6,458,760 |
| Mosaic Co. (a) | | | | | | 174,800 | | 2,779,320 |
| Potash Corp. of Saskatchewan | | | | | | 10,588 | | 1,015,699 |
| Syngenta AG sponsored ADR | | | | | | 30,000 | | 852,600 |
| The Scotts Co. Class A | | | | | | 43,000 | | 2,059,270 |
| | | | | | | | | 13,997,644 |
| Industrial Gases – 16.8% | | | | | | | | |
| Air Products & Chemicals, Inc. | | | | | | 109,600 | | 7,031,936 |
| Airgas, Inc. | | | | | | 116,600 | | 4,243,074 |
| L’Air Liquide SA | | | | | | 2,100 | | 414,565 |
| Praxair, Inc. (d) | | | | | | 140,660 | | 7,592,827 |
| | | | | | | | | 19,282,402 |
| Specialty Chemicals – 23.6% | | | | | | | | |
| Albemarle Corp. | | | | | | 100,400 | | 4,261,980 |
| Arch Chemicals, Inc. | | | | | | 60,550 | | 1,708,721 |
| Chemtura Corp. | | | | | | 550,573 | | 6,100,349 |
| Cytec Industries, Inc. | | | | | | 92,800 | | 4,949,952 |
| Ecolab, Inc. | | | | | | 41,700 | | 1,509,123 |
| Ferro Corp. | | | | | | 41,900 | | 841,352 |
| H.B. Fuller Co. | | | | | | 15,900 | | 645,540 |
| Lubrizol Corp. | | | | | | 5,300 | | 229,278 |
| Minerals Technologies, Inc. | | | | | | 12,600 | | 674,478 |
| OM Group, Inc. (a) | | | | | | 17,000 | | 360,570 |
See accompanying notes which are an integral part of the financial statements.
Annual Report 28
| | | Shares | | Value (Note 1) |
| PolyOne Corp. (a) | | 76,500 | | $ 667,845 |
| Rohm & Haas Co. | | 102,700 | | 5,109,325 |
| | | | | 27,058,513 |
| |
| TOTAL CHEMICALS | | | | 101,003,183 |
| |
| INDUSTRIAL CONGLOMERATES – 6.4% | | | | |
| Industrial Conglomerates – 6.4% | | | | |
| 3M Co. | | 99,900 | | 7,351,641 |
| MACHINERY – 0.2% | | | | |
| Industrial Machinery – 0.2% | | | | |
| Zenon Environmental, Inc. (a) | | 12,800 | | 203,353 |
| MARINE – 1.2% | | | | |
| Marine – 1.2% | | | | |
| Odfjell ASA (A Shares) | | 55,650 | | 997,947 |
| Stolt-Nielsen SA (d) | | 13,500 | | 422,156 |
| | | | | 1,420,103 |
| |
| METALS & MINING – 1.0% | | | | |
| Diversified Metals & Mining – 1.0% | | | | |
| Compass Minerals International, Inc. | | 46,700 | | 1,165,165 |
| TRADING COMPANIES & DISTRIBUTORS – 3.0% | | | | |
| Trading Companies & Distributors – 3.0% | | | | |
| UAP Holding Corp. | | 155,800 | | 3,390,208 |
| TOTAL COMMON STOCKS | | | | |
| (Cost $91,455,076) | | | | 114,533,653 |
| |
| Money Market Funds — 6.0% | | | | |
| |
| Fidelity Cash Central Fund, 4.57% (b) | | 401,694 | | 401,694 |
| Fidelity Securities Lending Cash Central Fund, 4.58% (b)(c) | | 6,446,240 | | 6,446,240 |
| TOTAL MONEY MARKET FUNDS | | | | |
| (Cost $6,847,934) | | | | 6,847,934 |
| |
| TOTAL INVESTMENT PORTFOLIO - 105.8% | | | | |
| (Cost $98,303,010) | | | | 121,381,587 |
| |
| NET OTHER ASSETS – (5.8)% | | | | (6,652,345) |
| NET ASSETS – 100% | | $ | | 114,729,242 |
(a) Non-income producing
(b) Affiliated fund that is available only to investment companies and other accounts managed by Fidelity Investments. The rate quoted is the annualized seven-day yield of the fund at period end. A complete unaudited listing of the fund’s holdings as of its most recent quarter end is available upon request.
(c) Investment made with cash collateral received from securities on loan. (d) Security or a portion of the security is on loan at period end.
Information regarding fiscal year to date income earned by the fund from the affiliated Central funds is as follows:
| Fund | | Income earned |
| Fidelity Cash Central Fund | | $ 79,968 |
| See accompanying notes which are an integral part of the financial statements. | | |
29
29 Annual Report
| Chemicals Portfolio | | |
| Investments - continued | | |
| |
| |
| Fidelity Securities Lending Cash Central Fund | | 45,498 |
| Total | | $ 125,466 |
See accompanying notes which are an integral part of the financial statements.
Annual Report 30
| Chemicals Portfolio | | | | | | |
| |
| Financial Statements | | | | | | |
| |
| |
| Statement of Assets and Liabilities | | | | | | |
| | | | | | | February 28, 2006 |
| |
| Assets | | | | | | |
| Investment in securities, at value (including securities loaned of $6,152,592) — See accompanying schedule: | | | | | | |
| Unaffiliated issuers (cost $91,455,076) | | $ 114,533,653 | | | | |
| Affiliated Central Funds (cost $6,847,934) | | 6,847,934 | | | | |
| Total Investments (cost $98,303,010) | | | | $ | | 121,381,587 |
| Receivable for fund shares sold | | | | | | 90,756 |
| Dividends receivable | | | | | | 184,054 |
| Interest receivable | | | | | | 2,629 |
| Prepaid expenses | | | | | | 841 |
| Other receivables | | | | | | 5,128 |
| Total assets | | | | | | 121,664,995 |
| |
| Liabilities | | | | | | |
| Payable to custodian bank | | $ 2,009 | | | | |
| Payable for fund shares redeemed | | 362,702 | | | | |
| Accrued management fee | | 55,246 | | | | |
| Other affiliated payables | | 39,720 | | | | |
| Other payables and accrued expenses | | 29,836 | | | | |
| Collateral on securities loaned, at value | | 6,446,240 | | | | |
| Total liabilities | | | | | | 6,935,753 |
| |
| Net Assets | | | | $ | | 114,729,242 |
| Net Assets consist of: | | | | | | |
| Paid in capital | | | | $ | | 85,242,864 |
| Undistributed net investment income | | | | | | 599,195 |
| Accumulated undistributed net realized gain (loss) on investments and foreign currency transactions | | | | | | 5,808,606 |
| Net unrealized appreciation (depreciation) on investments | | | | | | 23,078,577 |
| Net Assets, for 1,650,731 shares outstanding | | | | $ | | 114,729,242 |
| |
| Net Asset Value, offering price and redemption price per share ($114,729,242 ÷ 1,650,731 shares) | | | | $ | | 69.50 |
| Statement of Operations | | | | |
| | | | | Year ended February 28, 2006 |
| |
| Investment Income | | | | |
| Dividends | | $ | | 3,045,053 |
| Interest | | | | 151 |
| Income from affiliated Central Funds (including $45,498 from security lending) | | | | 125,466 |
| Total income | | | | 3,170,670 |
| |
| Expenses | | | | |
| Management fee | | $ 1,015,581 | | |
| Transfer agent fees | | 627,615 | | |
| Accounting and security lending fees | | | | |
| | | 89,917 | | |
| Independent trustees’ compensation | | 819 | | |
| Custodian fees and expenses | | 43,902 | | |
| Registration fees | | 40,885 | | |
| Audit | | 37,396 | | |
| Legal | | 1,042 | | |
| Interest | | 994 | | |
| Miscellaneous | | 2,582 | | |
| Total expenses before reductions | | 1,860,733 | | |
| Expense reductions | | (82,723) | | 1,778,010 |
| |
| Net investment income (loss) | | | | 1,392,660 |
| Realized and Unrealized Gain (Loss) | | | | |
| Net realized gain (loss) on: | | | | |
| Investment securities: | | | | |
See accompanying notes which are an integral part of the financial statements.
31 Annual Report
| Chemicals Portfolio | | | | |
| Financial Statements - continued | | | | |
| |
| |
| Unaffiliated issuers | | 8,481,558 | | |
| Foreign currency transactions | | (16,604) | | |
| Total net realized gain (loss) | | | | 8,464,954 |
| Change in net unrealized appreciation (depreciation) on: | | | | |
| Investment securities | | (19,059,430) | | |
| Assets and liabilities in foreign currencies | | (687) | | |
| Total change in net unrealized appreciation (depreciation) | | | | (19,060,117) |
| Net gain (loss) | | | | (10,595,163) |
| Net increase (decrease) in net assets resulting from operations | | $ | | (9,202,503) |
See accompanying notes which are an integral part of the financial statements.
Annual Report 32
| Statement of Changes in Net Assets | | | | | | | | | | | | | | | | | | | | | | |
| | | | | | | | | | | | | | | Year ended | | | | Year ended |
| | | | | | | | | | | | | | | February 28, | | | | February 28, |
| | | | | | | | | | | | | | | 2006 | | | | 2005 |
| Increase (Decrease) in Net Assets | | | | | | | | | | | | | | | | | | | | | | |
| Operations | | | | | | | | | | | | | | | | | | | | | | |
| Net investment income (loss) | | | | | | | | | | | | $ | | 1,392,660 | | $ | | | | 765,745 |
| Net realized gain (loss) | | | | | | | | | | | | | | 8,464,954 | | | | | | 4,303,293 |
| Change in net unrealized appreciation (depreciation) | | | | | | | | | | | | | | (19,060,117) | | | | | | 33,090,957 |
| Net increase (decrease) in net assets resulting from operations | | | | | | | | | | | | | | (9,202,503) | | | | | | 38,159,995 |
| Distributions to shareholders from net investment income | | | | | | | | | | | | | | (1,112,957) | | | | | | (438,130) |
| Distributions to shareholders from net realized gain | | | | | | | | | | | | | | (3,981,293) | | | | | | (1,035,799) |
| Total distributions | | | | | | | | | | | | | | (5,094,250) | | | | | | (1,473,929) |
| Share transactions | | | | | | | | | | | | | | | | | | | | | | |
| Proceeds from sales of shares | | | | | | | | | | | | | | 165,619,044 | | | | 260,346,486 |
| Reinvestment of distributions | | | | | | | | | | | | | | 4,584,255 | | | | | | 1,330,510 |
| Cost of shares redeemed | | | | | | | | | | | | | | (278,412,897) | | | | (111,811,107) |
| Net increase (decrease) in net assets resulting from share transactions | | | | | | | | | | | | (108,209,598) | | | | 149,865,889 |
| Redemption fees | | | | | | | | | | | | | | | | 91,100 | | | | | | 90,386 |
| Total increase (decrease) in net assets | | | | | | | | | | | | | | (122,415,251) | | | | 186,642,341 |
| |
| Net Assets | | | | | | | | | | | | | | | | | | | | | | |
| Beginning of period | | | | | | | | | | | | | | 237,144,493 | | | | | | 50,502,152 |
| End of period (including undistributed net investment income of $599,195 and undistributed net investment income of | | | | | | | | | | |
| $491,805, respectively) | | | | | | | | | | | | $ | | 114,729,242 | | $ | | 237,144,493 |
| |
| Other Information | | | | | | | | | | | | | | | | | | | | | | |
| Shares | | | | | | | | | | | | | | | | | | | | | | |
| Sold | | | | | | | | | | | | | | 2,445,897 | | | | | | 4,177,414 |
| Issued in reinvestment of distributions | | | | | | | | | | | | | | | | 70,266 | | | | | | 20,043 |
| Redeemed | | | | | | | | | | | | | | (4,180,989) | | | | | | (1,857,796) |
| Net increase (decrease) | | | | | | | | | | | | | | (1,664,826) | | | | | | 2,339,661 |
| |
| Financial Highlights | | | | | | | | | | | | | | | | | | | | | | |
| Years ended February 28, | | | | 2006 | | | | 2005 | | | | 2004E | | | | 2003 | | | | | | 2002 |
| Selected Per-Share Data | | | | | | | | | | | | | | | | | | | | | | |
| Net asset value, beginning of period | | $ | | 71.52 | | $ | | 51.75 | | $ | | 36.79 | | $ | | 43.09 | | | | $ | | 39.95 |
| Income from Investment Operations | | | | | | | | | | | | | | | | | | | | | | |
| Net investment income (loss)C | | | | 52 | | | | .45F | | | | .46 | | | | .38 | | | | | | .32 |
| Net realized and unrealized gain (loss) | | | | (.33) | | | | 19.83 | | | | 14.82 | | | | (6.21) | | | | | | 2.98 |
| Total from investment operations | | | | 19 | | | | 20.28 | | | | 15.28 | | | | (5.83) | | | | | | 3.30 |
| Distributions from net investment income | | | | (.52) | | | | (.18) | | | | (.37) | | | | (.39) | | | | | | (.32) |
| Distributions from net realized gain | | | | (1.72) | | | | (.38) | | | | — | | | | (.14) | | | | | | — |
| Total distributions | | | | (2.24) | | | | (.56) | | | | (.37) | | | | (.53) | | | | | | (.32) |
| Redemption fees added to paid in capitalC | | | | 03 | | | | .05 | | | | .05 | | | | .06 | | | | | | .16 |
| Net asset value, end of period | | $ | | 69.50 | | $ | | 71.52 | | $ | | 51.75 | | $ | | 36.79 | | | | $ | | 43.09 |
| Total ReturnA,B | | | | 51% | | | | 39.38% | | | | 41.73% | | | | (13.49)% | | | | | | 8.68% |
| Ratios to Average Net AssetsD | | | | | | | | | | | | | | | | | | | | | | |
| Expenses before reductions | | | | 1.04% | | | | 1.08% | | | | 1.48% | | | | 1.54% | | | | | | 1.34% |
| Expenses net of fee waivers, if any | | | | 1.04% | | | | 1.08% | | | | 1.48% | | | | 1.54% | | | | | | 1.34% |
| Expenses net of all reductions | | | | 99% | | | | 1.04% | | | | 1.43% | | | | 1.50% | | | | | | 1.23% |
| Net investment income (loss) | | | | 78% | | | | .73%F | | | | 1.03% | | | | .91% | | | | | | .79% |
| Supplemental Data | | | | | | | | | | | | | | | | | | | | | | |
| Net assets, end of period (000 omitted) | | $ 114,729 | | $ 237,144 | | $ | | 50,502 | | $ | | 28,339 | | | | $ | | 41,761 |
| Portfolio turnover rate | | | | 141% | | | | 73% | | | | 107% | | | | 114% | | | | | | 221% |
| |
| | | | | |
A Total returns would have been lower had certain expenses not been reduced during the periods shown. B Total returns do not include the effect of the former sales charges. C Calculated based on average shares outstanding during the period. DExpense ratios reflect operating expenses of the fund. Expenses before reductions do not reflect amounts reimbursed by the investment adviser or reductions from brokerage service arrangements or other expense offset arrangements and do not represent the amount paid by the fund during periods when reimbursements or reductions occur. Expenses net of fee waivers reflect expenses after reimbursement by the investment adviser but prior to reductions from brokerage service arrangements or other expense offset arrangements. Expenses net of all reductions represent the net expenses paid by the fund. EFor the year ended February 29. FAs a result of the change in the estimate of the return of capital component of dividend income realized in the year ended February 29, 2004, net investment income per share and the ratio of the net investment income to average net assets for the year ended February 28, 2005 have been reduced by $0.07 per share and .12%, respectively. The change in estimate has no impact on total net assets or total return of the fund.
See accompanying notes which are an integral part of the financial statements.
33
Construction and Housing Portfolio
Performance
|

Average annual total return reflects the change in the value of an investment, assuming reinvestment of the fund’s dividend income and capital gains (the profits earned upon the sale of securities that have grown in value) and assuming a constant rate of performance each year. The $10,000 table and the fund’s returns do not reflect the deduction of taxes that a shareholder would pay on fund distributions or the redemption of fund shares. During periods of reimbursement by Fidelity a fund’s total returns will be greater than it would be had the reimbursement not occurred. How a fund did yesterday is no guarantee of how it will do tomorrow.
| Average Annual Total Returns | | | | | | |
| Periods ended February 28, 2006 | | Past 1 | | Past 5 | | Past 10 |
| | | year | | years | | years |
| Select Construction and Housing | | 8.98% | | 18.34% | | 14.95% |
| |
| $10,000 Over 10 Years | | | | | | |
Let’s say hypothetically that $10,000 was invested in Fidelity Select Construction and Housing Portfolio on February 29, 1996. The chart shows how the value of your investment would have changed, and also shows how the S&P 500 Index performed over the same period.
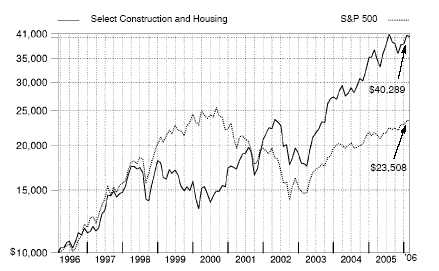
Construction and Housing Portfolio
|
Management’s Discussion of Fund Performance
Comments from Nora Creedon, who became Portfolio Manager of Fidelity® Select Construction and Housing Portfolio on February 1, 2006
With the exception of several popular large-cap stock performance measures, most major U.S. equity benchmarks had double-digit returns for the year ending February 28, 2006. For much of the period, market gains were driven largely by the energy sector, although utilities ultimately sneaked into the top spot for the year overall. Financials and telecommunication services also reached double figures, outperforming the 8.40% return of the broader market as measured by the large-cap-oriented Standard & Poor’s 500SM Index. The consumer discretionary segment — home to the weak performing automobile and media industries — was the biggest disappointment. Although the overall return for the S&P 500® beat the small-cap Russell 2000® Index in calendar year 2005 — the first time that’s happened in six years — small-caps stormed back in early 2006, leading to a 16.59% advance during the past 12 months, nearly twice the broader market’s gain. Mid-caps soared even higher, returning 17.67% according to the Russell Midcap® Index. The technology-heavy NASDAQ Composite® Index also fared well, climbing 12.13%, but the Dow Jones Industrial AverageSM, an index of 30 large-cap, blue-chip stocks, managed to rise only 4.52% .
Select Construction and Housing Portfolio gained 8.98% during the past year, slightly lagging the 9.59% gain of the Goldman Sachs® Cyclical Industries Index, but slightly ahead of the S&P 500. The fund’s large overweighting versus the sector index in U.S. homebuilding stocks drove nice returns through most of the period. In early 2006, however, the homebuilders began to sell off, while many other cyclicals continued their upward march. The sell-off came as indications of slowing orders for new homes triggered investors’ fears of a collapsing housing market. Even though I narrowed the overweighting, homebuilding stocks, including Standard Pacific, Toll Brothers and Pulte Homes, detracted the most. Unfavorable stock selection in the mortgage finance and building products industries — notably our positions in Doral Financial (which was sold from the Portfolio) and American Standard, respectively — also hurt, as did the fund’s lack of exposure to strong performing segments of the index, such as railroads and aerospace/defense. Fortunately, the construction stocks we owned — among them WESCO International, Caterpillar and Martin Marietta Materials, which were more levered to the still-healthy commercial development market — boosted performance, as did our lack of exposure to stocks in weak performing industrial conglomerates, such as Tyco International and General Electric.
The views expressed above reflect those of the portfolio manager(s) only through the end of the period as stated on the cover of this report and do not necessarily represent the views of Fidelity or any other person in the Fidelity organization. Any such views are subject to change at any time based upon market or other conditions and Fidelity disclaims any responsibility to update such views. These views may not be relied on as investment advice and, because investment decisions for a Fidelity fund are based on numerous factors, may not be relied on as an indication of trading intent on behalf of any Fidelity fund.
35 35 Annual Report
Construction and Housing Portfolio
Investment Changes
Top Ten Stocks as of February 28, 2006
| | | % of fund’s | | % of fund’s net assets |
| | | net assets | | 6 months ago |
| D.R. Horton, Inc. | | 7.4 | | 8.6 |
| Caterpillar, Inc. | | 6.4 | | 5.3 |
| Fannie Mae | | 6.0 | | 0.0 |
| Danaher Corp. | | 5.9 | | 5.1 |
| KB Home | | 5.6 | | 7.2 |
| Home Depot, Inc. | | 5.0 | | 5.1 |
| Pulte Homes, Inc. | | 4.9 | | 7.8 |
| Lennar Corp. Class A | | 4.8 | | 3.8 |
| Lowe’s Companies, Inc. | | 4.6 | | 1.5 |
| WESCO International, Inc. | | 4.0 | | 2.0 |
| | | 54.6 | | |
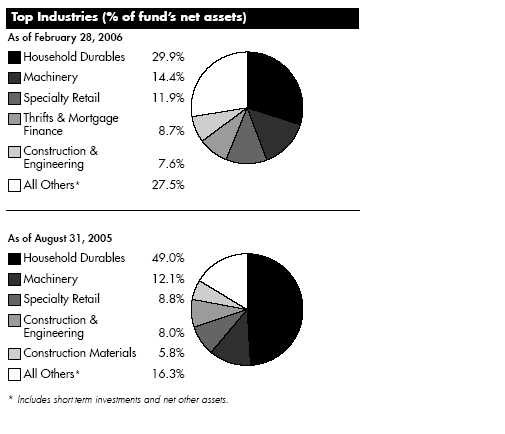
| Construction and Housing Portfolio | | | | | | |
| Investments February 28, 2006 | | | | |
| Showing Percentage of Net Assets | | | | | | |
| |
| Common Stocks — 94.1% | | | | | | |
| | | | | Shares | | Value (Note 1) |
| |
| BUILDING PRODUCTS – 3.8% | | | | | | |
| Building Products – 3.8% | | | | | | |
| American Standard Companies, Inc. (d) | | | | 188,500 | | $ 7,460,830 |
| NCI Building Systems, Inc. (a) | | | | 19,200 | | 1,107,456 |
| Quixote Corp. | | | | 32,300 | | 725,135 |
| | | | | | | 9,293,421 |
| |
| CHEMICALS – 0.3% | | | | | | |
| Diversified Chemicals – 0.3% | | | | | | |
| Ashland, Inc. | | | | 10,300 | | 672,281 |
| COMMUNICATIONS EQUIPMENT – 1.6% | | | | | | |
| Communications Equipment – 1.6% | | | | | | |
| Dycom Industries, Inc. (a) | | | | 142,700 | | 3,046,645 |
| MasTec, Inc. (a) | | | | 71,800 | | 929,810 |
| | | | | | | 3,976,455 |
| |
| CONSTRUCTION & ENGINEERING – 7.6% | | | | | | |
| Construction & Engineering – 7.6% | | | | | | |
| Chicago Bridge & Iron Co. NV (NY Shares) | | | | 47,000 | | 1,150,090 |
| Fluor Corp. | | | | 102,200 | | 8,819,860 |
| Granite Construction, Inc. | | | | 68,200 | | 3,161,070 |
| Infrasource Services, Inc. (a) | | | | 49,700 | | 888,139 |
| Perini Corp. (a) | | | | 25,600 | | 777,984 |
| Shaw Group, Inc. (a) | | | | 41,600 | | 1,387,360 |
| URS Corp. (a) | | | | 56,600 | | 2,467,194 |
| | | | | | | 18,651,697 |
| |
| CONSTRUCTION MATERIALS – 7.6% | | | | | | |
| Construction Materials – 7.6% | | | | | | |
| Florida Rock Industries, Inc. | | | | 93,475 | | 5,385,095 |
| Martin Marietta Materials, Inc. | | | | 53,900 | | 5,255,250 |
| Rinker Group Ltd. sponsored ADR (d) | | | | 10,900 | | 715,912 |
| Texas Industries, Inc. | | | | 200 | | 12,132 |
| Vulcan Materials Co. | | | | 92,500 | | 7,307,500 |
| | | | | | | 18,675,889 |
| |
| ELECTRICAL EQUIPMENT – 0.6% | | | | | | |
| Electrical Components & Equipment – 0.6% | | | | | | |
| Genlyte Group, Inc. (a) | | | | 24,900 | | 1,540,812 |
| ELECTRONIC EQUIPMENT & INSTRUMENTS – 0.2% | | | | | | |
| Electronic Equipment & Instruments – 0.2% | | | | | | |
| FARO Technologies, Inc. (a) | | | | 31,400 | | 502,086 |
| HOUSEHOLD DURABLES – 29.9% | | | | | | |
| Homebuilding – 29.9% | | | | | | |
| Beazer Homes USA, Inc. | | | | 50,900 | | 3,229,605 |
| D.R. Horton, Inc. | | | | 526,366 | | 17,954,344 |
| KB Home | | | | 205,200 | | 13,754,556 |
| Lennar Corp. Class A (d) | | | | 196,500 | | 11,762,490 |
| |
| |
| | | | | Shares | | Value (Note 1) |
| Meritage Homes Corp. (a) | | | | 29,000 | | $ 1,697,370 |
| |
| See accompanying notes which are an integral part of the financial statements. | | | | |
37
37 Annual Report
| Construction and Housing Portfolio | | | | |
| Investments - continued | | | | |
| |
| |
| Pulte Homes, Inc. | | 308,800 | | 11,861,008 |
| Ryland Group, Inc. | | 70,200 | | 4,896,450 |
| Standard Pacific Corp. | | 102,700 | | 3,373,695 |
| Toll Brothers, Inc. (a) | | 136,900 | | 4,430,084 |
| | | | | 72,959,602 |
| |
| INDUSTRIAL CONGLOMERATES – 0.9% | | | | |
| Industrial Conglomerates – 0.9% | | | | |
| Walter Industries, Inc. | | 34,600 | | 2,277,718 |
| MACHINERY – 14.4% | | | | |
| Construction & Farm Machinery & Heavy Trucks – 8.5% | | | | |
| A.S.V., Inc. (a)(d) | | 20,600 | | 662,908 |
| Astec Industries, Inc. (a) | | 19,100 | | 686,072 |
| Bucyrus International, Inc. Class A | | 21,800 | | 1,372,964 |
| Caterpillar, Inc. | | 214,200 | | 15,653,736 |
| Joy Global, Inc. | | 25,800 | | 1,330,248 |
| Toro Co. | | 20,600 | | 950,278 |
| | | | | 20,656,206 |
| Industrial Machinery – 5.9% | | | | |
| Danaher Corp. (d) | | 239,400 | | 14,502,852 |
| |
| TOTAL MACHINERY | | | | 35,159,058 |
| |
| REAL ESTATE – 1.7% | | | | |
| Real Estate Investment Trusts – 1.7% | | | | |
| Equity Lifestyle Properties, Inc. | | 5,800 | | 276,602 |
| General Growth Properties, Inc. | | 60,500 | | 3,048,595 |
| United Dominion Realty Trust, Inc. (SBI) | | 26,596 | | 711,443 |
| | | | | 4,036,640 |
| |
| SPECIALTY RETAIL – 11.9% | | | | |
| Home Improvement Retail – 11.9% | | | | |
| Home Depot, Inc. | | 291,750 | | 12,297,263 |
| Lowe’s Companies, Inc. | | 163,300 | | 11,133,794 |
| Sherwin-Williams Co. | | 124,700 | | 5,680,085 |
| | | | | 29,111,142 |
| |
| THRIFTS & MORTGAGE FINANCE – 8.7% | | | | |
| Thrifts & Mortgage Finance – 8.7% | | | | |
| Countrywide Financial Corp. | | 191,000 | | 6,585,680 |
| Fannie Mae | | 267,900 | | 14,648,772 |
| | | | | 21,234,452 |
| |
| TRADING COMPANIES & DISTRIBUTORS – 4.9% | | | | |
| Trading Companies & Distributors – 4.9% | | | | |
| MSC Industrial Direct Co., Inc. Class A | | 29,700 | | 1,406,889 |
| Watsco, Inc. | | 9,700 | | 675,314 |
| WESCO International, Inc. (a) | | 170,500 | | 9,773,060 |
| | | | | 11,855,263 |
| |
| TOTAL COMMON STOCKS | | | | |
| (Cost $178,954,484) | | | | 229,946,516 |
See accompanying notes which are an integral part of the financial statements.
Annual Report 38
| Money Market Funds — 13.0% | | | | | | |
| | | Shares | | | | Value (Note 1) |
| Fidelity Cash Central Fund, 4.57% (b) | | 15,718,674 | | $ | | 15,718,674 |
| Fidelity Securities Lending Cash Central Fund, 4.58% (b)(c) | | 16,054,325 | | | | 16,054,325 |
| TOTAL MONEY MARKET FUNDS | | | | | | |
| (Cost $31,772,999) | | | | | | 31,772,999 |
| TOTAL INVESTMENT PORTFOLIO - 107.1% | | | | | | |
| (Cost $210,727,483) | | | | | | 261,719,515 |
| |
| NET OTHER ASSETS – (7.1)% | | | | | | (17,316,411) |
| NET ASSETS – 100% | | | | $ | | 244,403,104 |
(a) Non-income producing
(b) Affiliated fund that is available only to investment companies and other accounts managed by Fidelity Investments. The rate quoted is the annualized seven-day yield of the fund at period end. A complete unaudited listing of the fund’s holdings as of its most recent quarter end is available upon request.
(c) Investment made with cash collateral received from securities on loan. (d) Security or a portion of the security is on loan at period end.
Information regarding fiscal year to date income earned by the fund from the affiliated Central funds is as follows:
| Fund | | Income earned |
| Fidelity Cash Central Fund | | $ 367,068 |
| Fidelity Securities Lending Cash Central Fund | | 40,013 |
| Total | | $ 407,081 |
See accompanying notes which are an integral part of the financial statements.
|
39 Annual Report
39
| Construction and Housing Portfolio | | | | | | | | |
| |
| Financial Statements | | | | | | | | |
| |
| |
| Statement of Assets and Liabilities | | | | | | | | |
| | | | | | | | | February 28, 2006 |
| |
| Assets | | | | | | | | |
| Investment in securities, at value (including securities loaned of $15,556,992) — See accompanying schedule: | | | | | | | | |
| Unaffiliated issuers (cost $178,954,484) | | $ | | 229,946,516 | | | | |
| Affiliated Central Funds (cost $31,772,999) | | | | 31,772,999 | | | | |
| Total Investments (cost $210,727,483) | | | | | | $ | | 261,719,515 |
| Receivable for fund shares sold | | | | | | | | 726,220 |
| Dividends receivable | | | | | | | | 114,672 |
| Interest receivable | | | | | | | | 18,779 |
| Prepaid expenses | | | | | | | | 1,259 |
| Other affiliated receivables | | | | | | | | 158 |
| Other receivables | | | | | | | | 16,320 |
| Total assets | | | | | | | | 262,596,923 |
| |
| Liabilities | | | | | | | | |
| Payable for fund shares redeemed | | | | 1,907,854 | | | | |
| Accrued management fee | | | | 116,580 | | | | |
| Other affiliated payables | | | | 83,672 | | | | |
| Other payables and accrued expenses | | | | 31,388 | | | | |
| Collateral on securities loaned, at value | | | | 16,054,325 | | | | |
| Total liabilities | | | | | | | | 18,193,819 |
| |
| Net Assets | | | | | | $ | | 244,403,104 |
| Net Assets consist of: | | | | | | | | |
| Paid in capital | | | | | | $ | | 187,591,853 |
| Distributions in excess of net investment income | | | | | | | | (32) |
| Accumulated undistributed net realized gain (loss) on investments and foreign currency transactions | | | | | | | | 5,819,251 |
| Net unrealized appreciation (depreciation) on investments | | | | | | | | 50,992,032 |
| Net Assets, for 4,945,798 shares outstanding | | | | | | $ | | 244,403,104 |
| Net Asset Value, offering price and redemption price per share ($244,403,104 ÷ 4,945,798 shares) | | | | | | $ | | 49.42 |
| |
| Statement of Operations | | | | | | | | |
| | | | | | | | | Year ended February 28, 2006 |
| |
| Investment Income | | | | | | | | |
| Dividends | | | | | | $ | | 2,328,274 |
| Interest | | | | | | | | 550 |
| Income from affiliated Central Funds (including $40,013 from security lending) | | | | | | | | 407,081 |
| Total income | | | | | | | | 2,735,905 |
| |
| Expenses | | | | | | | | |
| Management fee | | $ | | 1,532,344 | | | | |
| Transfer agent fees | | | | 995,945 | | | | |
| Accounting and security lending fees | | | | | | | | |
| | | | | 136,580 | | | | |
| Independent trustees’ compensation | | | | 1,145 | | | | |
| Custodian fees and expenses | | | | 27,092 | | | | |
| Registration fees | | | | 81,609 | | | | |
| Audit | | | | 34,816 | | | | |
| Legal | | | | 1,493 | | | | |
| Miscellaneous | | | | 2,921 | | | | |
| Total expenses before reductions | | | | 2,813,945 | | | | |
| Expense reductions | | | | (87,861) | | | | 2,726,084 |
| |
| Net investment income (loss) | | | | | | | | 9,821 |
| Realized and Unrealized Gain (Loss) | | | | | | | | |
| Net realized gain (loss) on: | | | | | | | | |
| Investment securities: | | | | | | | | |
| Unaffiliated issuers | | | | 6,318,890 | | | | |
See accompanying notes which are an integral part of the financial statements.
Annual Report 40
| Foreign currency transactions | | 681 | | | | |
| Total net realized gain (loss) | | | | | | 6,319,571 |
| Change in net unrealized appreciation (depreciation) on investment securities | | | | | | 8,021,493 |
| Net gain (loss) | | | | | | 14,341,064 |
| Net increase (decrease) in net assets resulting from operations | | | | $ | | 14,350,885 |
See accompanying notes which are an integral part of the financial statements.
|
41 Annual Report
| Construction and Housing Portfolio | | | | | | | | | | | | | | | | | | | | | | |
| Financial Statements - continued | | | | | | | | | | | | | | | | | | | | | | |
| |
| |
| Statement of Changes in Net Assets | | | | | | | | | | | | | | | | | | | | | | |
| | | | | | | | | | | | | Year ended | | | | Year ended |
| | | | | | | | | | | | | February 28, | | | | February 28, |
| | | | | | | | | | | | |
2006
| | | | 2005
|
| Increase (Decrease) in Net Assets | | | | | | | | | | | | | | |
| Operations | | | | | | | | | | | | | | | | | | | | | | |
| Net investment income (loss) | | | | | | | | | | | | $ | | | | 9,821 | | $ | | | | 48,201 |
| Net realized gain (loss) | | | | | | | | | | | | | | 6,319,571 | | | | | | 8,589,312 |
| Change in net unrealized appreciation (depreciation) | | | | | | | | | | | | | | 8,021,493 | | | | 23,411,115 |
| Net increase (decrease) in net assets resulting from operations | | | | | | | | | | | | 14,350,885 | | | | 32,048,628 |
| Distributions to shareholders from net investment income | | | | | | | | | | | | | | (48,224) | | | | | | — |
| Distributions to shareholders from net realized gain | | | | | | | | | | | | | | (2,067,434) | | | | (3,155,787) |
| Total distributions | | | | | | | | | | | | | | (2,115,658) | | | | (3,155,787) |
| Share transactions | | | | | | | | | | | | | | | | | | | | | | |
| Proceeds from sales of shares | | | | | | | | | | | | 370,971,483 | | | | 260,994,089 |
| Reinvestment of distributions | | | | | | | | | | | | | | 2,048,294 | | | | | | 3,059,923 |
| Cost of shares redeemed | | | | | | | | | | | | (380,317,030) | | | | (151,200,941) |
| Net increase (decrease) in net assets resulting from share transactions | | | | | | | | | | | | (7,297,253) | | | | 112,853,071 |
| Redemption fees | | | | | | | | | | | | | | 260,223 | | | | | | 121,358 |
| Total increase (decrease) in net assets | | | | | | | | | | | | | | 5,198,197 | | | | 141,867,270 |
| |
| Net Assets | | | | | | | | | | | | | | | | | | | | | | |
| Beginning of period | | | | | | | | | | | | 239,204,907 | | | | 97,337,637 |
| End of period (including distributions in excess of net investment income of $32 and undistributed net investment | | | | | | | | | | | | | | |
| income of $48,147, respectively) | | | | | | | | | | | | $ 244,403,104 | | $ | | 239,204,907 |
| |
| Other Information | | | | | | | | | | | | | | | | | | | | | | |
| Shares | | | | | | | | | | | | | | | | | | | | | | |
| Sold | | | | | | | | | | | | | | 7,902,684 | | | | | | 6,409,212 |
| Issued in reinvestment of distributions | | | | | | | | | | | | | | | | 49,218 | | | | | | 71,410 |
| Redeemed | | | | | | | | | | | | | | (8,226,702) | | | | (3,961,084) |
| Net increase (decrease) | | | | | | | | | | | | | | (274,800) | | | | | | 2,519,538 |
| |
| Financial Highlights | | | | | | | | | | | | | | | | | | | | | | |
| Years ended February 28, | | | | 2006 | | | | 2005 | | | | 2004F | | | | 2003 | | | | 2002 |
| Selected Per-Share Data | | | | | | | | | | | | | | | | | | | | | | |
| Net asset value, beginning of period | | $ | | 45.82 | | $ | | 36.04 | | $ | | 22.55 | | $ | | 28.41 | | $ | | 22.22 |
| Income from Investment Operations | | | | | | | | | | | | | | | | | | | | | | |
| Net investment income (loss)C | | | | —G | | | | .02 | | | | (.05)D | | | | (.10) | | | | (.04) |
| Net realized and unrealized gain (loss) | | | | 3.99 | | | | 10.78 | | | | 13.52 | | | | (5.81) | | | | 6.34 |
| Total from investment operations | | | | 3.99 | | | | 10.80 | | | | 13.47 | | | | (5.91) | | | | 6.30 |
| Distributions from net investment income | | | | (.01) | | | | — | | | | — | | | | — | | | | — |
| Distributions from net realized gain | | | | (.42) | | | | (1.06) | | | | — | | | | — | | | | (.17) |
| Total distributions | | | | (.43) | | | | (1.06) | | | | — | | | | — | | | | (.17) |
| Redemption fees added to paid in capitalC | | | | 04 | | | | .04 | | | | .02 | | | | .05 | | | | .06 |
| Net asset value, end of period | | $ | | 49.42 | | $ | | 45.82 | | $ | | 36.04 | | $ | | 22.55 | | $ | | 28.41 |
| Total ReturnA,B | | | | 8.98% | | | | 30.28% | | | | 59.82% | | | | (20.63)% | | | | 28.87% |
| Ratios to Average Net AssetsE | | | | | | | | | | | | | | | | | | | | | | |
| Expenses before reductions | | | | 1.05% | | | | 1.09% | | | | 1.37% | | | | 1.44% | | | | 1.45% |
| Expenses net of fee waivers, if any | | | | 1.05% | | | | 1.09% | | | | 1.37% | | | | 1.44% | | | | 1.45% |
| Expenses net of all reductions | | | | 1.01% | | | | 1.08% | | | | 1.35% | | | | 1.41% | | | | 1.44% |
| Net investment income (loss) | | | | —% | | | | .04% | | | | (.15)% | | | | (.37)% | | | | (.15)% |
| Supplemental Data | | | | | | | | | | | | | | | | | | | | |
| Net assets, end of period (000 omitted) | | $ 244,403 | | $ 239,205 | | $ | | 97,338 | | $ | | 47,083 | | $ | | 83,536 |
| Portfolio turnover rate | | | | 154% | | | | 119% | | | | 71% | | | | 133% | | | | 111% |
| |
| | | | | |
| | | |
A Total returns would have been lower had certain expenses not been reduced during the periods shown. B Total returns do not include the effect of the former sales charges. C Calculated based on average shares outstanding during the period. D Investment income per share reflects a special dividend which amounted to $.05 per share. E Expense ratios reflect operating expenses of the fund. Expenses before reductions do not reflect amounts reimbursed by the investment adviser or reductions from brokerage service arrangements or other expense offset arrangements and do not represent the amount paid by the fund during periods when reimbursements or reductions occur. Expenses net of fee waivers reflect expenses after reimbursement by the investment adviser but prior to reductions from brokerage service arrangements or other expense offset arrangements. Expenses net of all reductions represent the net expenses paid by the fund. FFor the year ended February 29. GAmount represents less than $.01 per share.
See accompanying notes which are an integral part of the financial statements.
Annual Report 42
Cyclical Industries Portfolio
Performance
|
Average annual total return reflects the change in the value of an investment, assuming reinvestment of the fund’s dividend income and capital gains (the profits earned upon the sale of securities that have grown in value) and assuming a constant rate of performance each year. The $10,000 table and the fund’s returns do not reflect the deduction of taxes that a shareholder would pay on fund distributions or the redemption of fund shares. During periods of reimbursement by Fidelity a fund’s total returns will be greater than it would be had the reimbursement not occurred. How a fund did yesterday is no guarantee of how it will do tomorrow.
| Average Annual Total Returns | | | | | | |
| Periods ended February 28, 2006 | | Past 1 | | Past 5 | | Life of |
| | | year | | years | | fundA |
| Select Cyclical Industries | | 17.23% | | 11.00% | | 11.16% |
| |
| A From March 3, 1997 | | | | | | |
| $10,000 Over Life of Fund | | | | | | |
Let’s say hypothetically that $10,000 was invested in Fidelity Select Cyclical Industries Portfolio on March 3, 1997, when the fund started. The chart shows how the value of your investment would have changed, and also shows how the S&P 500 Index performed over the same period.
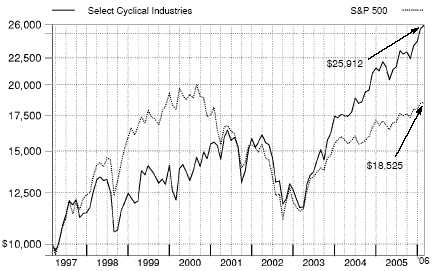
43 Annual Report
Cyclical Industries Portfolio
|
Management’s Discussion of Fund Performance
Comments from Christopher Bartel, who became Portfolio Manager of Fidelity® Select Cyclical Industries Portfolio on December 1, 2005
With the exception of several popular large-cap stock performance measures, most major U.S. equity benchmarks had double-digit returns for the year ending February 28, 2006. For much of the period, market gains were driven largely by the energy sector, although utilities ultimately sneaked into the top spot for the year overall. Financials and telecommunication services also reached double figures, outperforming the 8.40% return of the broader market as measured by the large-cap-oriented Standard & Poor’s 500SM Index. The consumer discretionary segment — home to the weak performing automobile and media industries — was the biggest disappointment. Although the overall return for the S&P 500® beat the small-cap Russell 2000® Index in calendar year 2005 — the first time that’s happened in six years — small-caps stormed back in early 2006, leading to a 16.59% advance during the past 12 months, nearly twice the broader market’s gain. Mid-caps soared even higher, returning 17.67% according to the Russell Midcap® Index. The technology-heavy NASDAQ Composite® Index also fared well, climbing 12.13%, but the Dow Jones Industrial AverageSM, an index of 30 large-cap, blue-chip stocks, managed to rise only 4.52% .
During the past year, the fund returned 17.23%, handily beating the S&P 500 and the 9.59% return of the Goldman Sachs® Cyclical Industries Index. An overweighting in construction and engineering stocks provided the biggest boost to performance versus the sector index, along with solid stock picking in that industry. For example, Fluor was the fund’s top contributor, as high energy prices resulted in a brisk business for builders of drilling rigs, refineries and the like. In the machinery group, Joy Global added value, benefiting from a resurgence in spending for mining equipment. AirTran Holdings, a low-fare airline, reacted positively to improving air traffic and reduced domestic capacity driven by the bankruptcy of some competitors. Tempering the fund’s gains to some extent were unfavorable picks in the marine and auto parts/equipment groups. A holding in the latter category, Delphi, had by far the biggest negative impact on fund performance. The company filed for bankruptcy protection in the fall, though I thought there was compelling evidence that it would remain solvent. Fortunately, the position was a relatively small one. The fund no longer owned Delphi at period end. Homebuilder Toll Brothers also held back our results, as the softening residential real estate market forced the company to scale back its earnings forecasts.
The views expressed above reflect those of the portfolio manager(s) only through the end of the period as stated on the cover of this report and do not necessarily represent the views of Fidelity or any other person in the Fidelity organization. Any such views are subject to change at any time based upon market or other conditions and Fidelity disclaims any responsibility to update such views. These views may not be relied on as investment advice and, because investment decisions for a Fidelity fund are based on numerous factors, may not be relied on as an indication of trading intent on behalf of any Fidelity fund.
Cyclical Industries Portfolio
Investment Changes
Top Ten Stocks as of February 28, 2006
| | | % of fund’s | | % of fund’s net assets |
| | | net assets | | 6 months ago |
| General Electric Co. | | 8.0 | | 2.3 |
| Fluor Corp. | | 4.4 | | 2.0 |
| Tyco International Ltd. | | 3.0 | | 3.6 |
| 3M Co. | | 2.8 | | 1.8 |
| Honeywell International, Inc. | | 2.6 | | 3.0 |
| United Technologies Corp. | | 2.4 | | 1.4 |
| Caterpillar, Inc. | | 2.3 | | 2.0 |
| Norfolk Southern Corp. | | 2.0 | | 1.6 |
| Canadian National Railway Co. | | 1.9 | | 1.3 |
| General Dynamics Corp. | | 1.7 | | 0.3 |
| | | 31.1 | | |
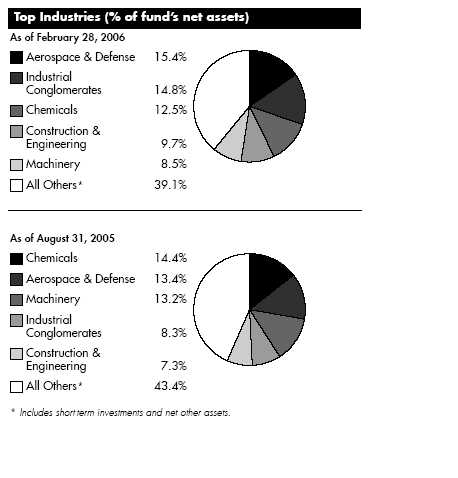
45 Annual Report
| Cyclical Industries Portfolio | | | | | | | | |
| Investments February 28, 2006 | | | | |
| Showing Percentage of Net Assets | | | | | | | | |
| |
| Common Stocks — 97.7% | | | | | | | | |
| | | | | | | Shares | | Value (Note 1) |
| |
| AEROSPACE & DEFENSE – 15.4% | | | | | | | | |
| Aerospace & Defense – 15.4% | | | | | | | | |
| Alliant Techsystems, Inc. (a) | | | | | | 1,300 | | $ 99,346 |
| Aviall, Inc. (a) | | | | | | 13,000 | | 495,950 |
| DRS Technologies, Inc. | | | | | | 7,400 | | 390,498 |
| General Dynamics Corp. | | | | | | 11,700 | | 1,442,259 |
| Goodrich Corp. | | | | | | 10,200 | | 426,768 |
| Hexcel Corp. (a) | | | | | | 21,200 | | 456,224 |
| Honeywell International, Inc. | | | | | | 53,500 | | 2,190,825 |
| L-3 Communications Holdings, Inc. | | | | | | 8,600 | | 714,746 |
| Lockheed Martin Corp. | | | | | | 14,300 | | 1,042,041 |
| Meggitt PLC | | | | | | 29,800 | | 195,111 |
| Precision Castparts Corp. | | | | | | 14,000 | | 742,560 |
| Raytheon Co. | | | | | | 19,400 | | 841,960 |
| Rockwell Collins, Inc. | | | | | | 6,940 | | 368,861 |
| Rolls-Royce Group PLC | | | | | | 20,792 | | 160,022 |
| The Boeing Co. | | | | | | 18,940 | | 1,376,749 |
| United Technologies Corp. | | | | | | 33,900 | | 1,983,150 |
| | | | | | | | | 12,927,070 |
| |
| AIR FREIGHT & LOGISTICS – 3.2% | | | | | | | | |
| Air Freight & Logistics – 3.2% | | | | | | | | |
| C.H. Robinson Worldwide, Inc. | | | | | | 8,700 | | 389,934 |
| Expeditors International of Washington, Inc. | | | | | | 4,100 | | 318,939 |
| FedEx Corp. | | | | | | 6,100 | | 654,164 |
| Forward Air Corp. | | | | | | 4,670 | | 165,692 |
| Hub Group, Inc. Class A (a) | | | | | | 10,811 | | 450,819 |
| UTI Worldwide, Inc. | | | | | | 6,296 | | 658,750 |
| | | | | | | | | 2,638,298 |
| |
| AIRLINES – 2.5% | | | | | | | | |
| Airlines – 2.5% | | | | | | | | |
| AirTran Holdings, Inc. (a) | | | | | | 62,700 | | 1,114,806 |
| JetBlue Airways Corp. (a) | | | | | | 100 | | 1,140 |
| Midwest Air Group, Inc. (a)(d) | | | | | | 15,100 | | 80,936 |
| Ryanair Holdings PLC sponsored ADR (a) | | | | | | 2,700 | | 143,343 |
| UAL Corp. (a) | | | | | | 11,100 | | 393,717 |
| US Airways Group, Inc. (a) | | | | | | 10,400 | | 344,136 |
| | | | | | | | | 2,078,078 |
| |
| AUTO COMPONENTS – 1.9% | | | | | | | | |
| Auto Parts & Equipment – 1.7% | | | | | | | | |
| Amerigon, Inc. (a) | | | | | | 61,427 | | 365,491 |
| BorgWarner, Inc. | | | | | | 5,800 | | 323,466 |
| Johnson Controls, Inc. | | | | | | 10,100 | | 719,827 |
| | | | | | | | | 1,408,784 |
| Tires & Rubber – 0.2% | | | | | | | | |
| Continental AG | | | | | | 1,900 | | 194,472 |
| |
| TOTAL AUTO COMPONENTS | | | | | | | | 1,603,256 |
See accompanying notes which are an integral part of the financial statements.
Annual Report 46
| | | Shares | | Value (Note 1) |
| |
| AUTOMOBILES – 2.1% | | | | |
| Automobile Manufacturers – 2.1% | | | | |
| Bayerische Motoren Werke AG (BMW) | | 17,700 | | $ 851,181 |
| Ford Motor Co. | | 35,900 | | 286,123 |
| General Motors Corp. (d) | | 22,700 | | 461,037 |
| Toyota Motor Corp. sponsored ADR | | 1,600 | | 170,992 |
| | | | | 1,769,333 |
| |
| BUILDING PRODUCTS – 1.3% | | | | |
| Building Products – 1.3% | | | | |
| American Standard Companies, Inc. | | 17,610 | | 697,004 |
| Masco Corp. | | 13,110 | | 408,901 |
| | | | | 1,105,905 |
| |
| CHEMICALS – 12.5% | | | | |
| Commodity Chemicals – 1.5% | | | | |
| Celanese Corp. Class A | | 6,100 | | 130,540 |
| Georgia Gulf Corp. | | 11,700 | | 335,790 |
| NOVA Chemicals Corp. | | 7,300 | | 237,797 |
| Pioneer Companies, Inc. (a) | | 6,300 | | 189,756 |
| Westlake Chemical Corp. | | 10,500 | | 360,360 |
| | | | | 1,254,243 |
| Diversified Chemicals – 3.6% | | | | |
| Ashland, Inc. | | 9,900 | | 646,173 |
| Dow Chemical Co. | | 23,200 | | 998,296 |
| E.I. du Pont de Nemours & Co. | | 14,900 | | 599,576 |
| FMC Corp. (a) | | 12,300 | | 747,963 |
| | | | | 2,992,008 |
| Fertilizers & Agricultural Chemicals – 2.1% | | | | |
| Agrium, Inc. | | 13,800 | | 343,740 |
| Monsanto Co. | | 10,200 | | 855,576 |
| Mosaic Co. (a) | | 11,800 | | 187,620 |
| Potash Corp. of Saskatchewan | | 2,800 | | 268,602 |
| The Scotts Co. Class A | | 2,000 | | 95,780 |
| | | | | 1,751,318 |
| Industrial Gases – 2.6% | | | | |
| Air Products & Chemicals, Inc. | | 8,800 | | 564,608 |
| Airgas, Inc. | | 12,100 | | 440,319 |
| Praxair, Inc. | | 21,800 | | 1,176,764 |
| | | | | 2,181,691 |
| Specialty Chemicals – 2.7% | | | | |
| Albemarle Corp. | | 9,700 | | 411,765 |
| Chemtura Corp. | | 42,241 | | 468,030 |
| Cytec Industries, Inc. | | 7,800 | | 416,052 |
| Ecolab, Inc. | | 15,100 | | 546,469 |
| Lubrizol Corp. | | 100 | | 4,326 |
| Minerals Technologies, Inc. | | 100 | | 5,353 |
| Rohm & Haas Co. | | 9,300 | | 462,675 |
| | | | | 2,314,670 |
| |
| TOTAL CHEMICALS | | | | 10,493,930 |
See accompanying notes which are an integral part of the financial statements.
47 Annual Report
47
| Cyclical Industries Portfolio | | | | |
| Investments - continued | | | | |
| |
| |
| Common Stocks – continued | | | | |
| | | Shares | | Value (Note 1) |
| |
| COMMERCIAL SERVICES & SUPPLIES – 2.6% | | | | |
| Diversified Commercial & Professional Services – 0.2% | | | | |
| The Brink’s Co. | | 3,900 | | $ 190,983 |
| Environmental & Facility Services – 1.4% | | | | |
| Republic Services, Inc. | | 4,400 | | 171,028 |
| Waste Connections, Inc. (a) | | 6,350 | | 232,664 |
| Waste Management, Inc. | | 22,700 | | 755,002 |
| | | | | 1,158,694 |
| Human Resource & Employment Services – 1.0% | | | | |
| CDI Corp. | | 17,600 | | 431,024 |
| Robert Half International, Inc. | | 10,200 | | 366,384 |
| | | | | 797,408 |
| |
| TOTAL COMMERCIAL SERVICES & SUPPLIES | | | | 2,147,085 |
| |
| COMMUNICATIONS EQUIPMENT – 0.9% | | | | |
| Communications Equipment – 0.9% | | | | |
| Dycom Industries, Inc. (a) | | 6,500 | | 138,775 |
| Harris Corp. | | 12,575 | | 574,426 |
| | | | | 713,201 |
| |
| CONSTRUCTION & ENGINEERING – 9.7% | | | | |
| Construction & Engineering – 9.7% | | | | |
| Chicago Bridge & Iron Co. NV (NY Shares) | | 36,100 | | 883,367 |
| Comfort Systems USA, Inc. | | 18,500 | | 203,315 |
| Fluor Corp. | | 42,900 | | 3,702,270 |
| Jacobs Engineering Group, Inc. (a) | | 2,800 | | 240,072 |
| Perini Corp. (a) | | 37,700 | | 1,145,703 |
| Shaw Group, Inc. (a) | | 37,800 | | 1,260,630 |
| SNC-Lavalin Group, Inc. | | 8,000 | | 666,320 |
| | | | | 8,101,677 |
| |
| CONSTRUCTION MATERIALS – 0.5% | | | | |
| Construction Materials – 0.5% | | | | |
| Martin Marietta Materials, Inc. | | 1,500 | | 146,250 |
| Vulcan Materials Co. | | 3,800 | | 300,200 |
| | | | | 446,450 |
| |
| CONTAINERS & PACKAGING – 0.3% | | | | |
| Metal & Glass Containers – 0.3% | | | | |
| Crown Holdings, Inc. (a) | | 7,100 | | 129,930 |
| Owens-Illinois, Inc. (a) | | 4,320 | | 80,957 |
| | | | | 210,887 |
| |
| DIVERSIFIED CONSUMER SERVICES – 0.1% | | | | |
| Education Services – 0.1% | | | | |
| Education Management Corp. (a) | | 2,500 | | 94,000 |
| ELECTRICAL EQUIPMENT – 2.3% | | | | |
| Electrical Components & Equipment – 2.0% | | | | |
| AMETEK, Inc. | | 2,600 | | 111,384 |
| Cooper Industries Ltd. Class A | | 6,000 | | 502,200 |
See accompanying notes which are an integral part of the financial statements.
Annual Report 48
| | | Shares | | Value (Note |
| Emerson Electric Co. | | 1,400 | | $ 114,534 |
| Rockwell Automation, Inc. | | 10,200 | | 695,334 |
| Roper Industries, Inc. | | 3,260 | | 146,928 |
| Thomas & Betts Corp. (a) | | 2,300 | | 113,160 |
| | | | | 1,683,540 |
| Heavy Electrical Equipment – 0.3% | | | | |
| Vestas Wind Systems AS (a) | | 11,800 | | 247,426 |
| |
| TOTAL ELECTRICAL EQUIPMENT | | | | 1,930,966 |
| |
| ELECTRONIC EQUIPMENT & INSTRUMENTS – 0.1% | | | | |
| Electronic Equipment & Instruments – 0.1% | | | | |
| FARO Technologies, Inc. (a) | | 4,900 | | 78,351 |
| HEALTH CARE EQUIPMENT & SUPPLIES – 0.1% | | | | |
| Health Care Equipment – 0.1% | | | | |
| Varian, Inc. (a) | | 1,200 | | 47,880 |
| HOUSEHOLD DURABLES – 3.7% | | | | |
| Homebuilding – 3.7% | | | | |
| D.R. Horton, Inc. | | 18,100 | | 617,391 |
| KB Home | | 14,400 | | 965,232 |
| Pulte Homes, Inc. | | 10,700 | | 410,987 |
| Ryland Group, Inc. | | 12,720 | | 887,220 |
| Toll Brothers, Inc. (a) | | 5,800 | | 187,688 |
| | | | | 3,068,518 |
| |
| INDEPENDENT POWER PRODUCERS & ENERGY TRADERS – 0.2% | | | | |
| Independent Power & Energy Trade – 0.2% | | | | |
| Mirant Corp. (a) | | 7,200 | | 177,120 |
| INDUSTRIAL CONGLOMERATES – 14.8% | | | | |
| Industrial Conglomerates – 14.8% | | | | |
| 3M Co. | | 31,860 | | 2,344,577 |
| General Electric Co. | | 203,760 | | 6,697,590 |
| Smiths Group PLC | | 20,900 | | 344,254 |
| Textron, Inc. | | 5,100 | | 449,361 |
| Tyco International Ltd. | | 97,530 | | 2,515,299 |
| | | | | 12,351,081 |
| |
| IT SERVICES – 0.4% | | | | |
| IT Consulting & Other Services – 0.4% | | | | |
| CACI International, Inc. Class A (a) | | 4,200 | | 253,134 |
| NCI, Inc. Class A | | 1,200 | | 16,752 |
| SI International, Inc. (a) | | 2,900 | | 94,424 |
| | | | | 364,310 |
| |
| MACHINERY – 8.5% | | | | |
| Construction & Farm Machinery & Heavy Trucks – 5.7% | | | | |
| AGCO Corp. (a) | | 4,000 | | 78,200 |
| American Railcar Industries, Inc. | | 100 | | 3,360 |
| Bucyrus International, Inc. Class A | | 6,300 | | 396,774 |
| Caterpillar, Inc. | | 26,800 | | 1,958,544 |
| Deere & Co. | | 10,200 | | 777,954 |
| Joy Global, Inc. | | 10,075 | | 519,467 |
| Manitowoc Co., Inc. | | 3,900 | | 300,573 |
49
See accompanying notes which are an integral part of the financial statements.
49 Annual Report
| Cyclical Industries Portfolio | | | | |
| Investments - continued | | | | |
| |
| |
| Common Stocks – continued | | | | |
| | | Shares | | Value (Note 1) |
| |
| MACHINERY – CONTINUED | | | | |
| Construction & Farm Machinery & Heavy Trucks – continued | | | | |
| Navistar International Corp. (a) | | 6,570 | | $ 192,830 |
| Samsung Heavy Industries Ltd. | | 350 | | 6,037 |
| Toro Co. | | 10,200 | | 470,526 |
| Wabash National Corp | | 5,000 | | 99,850 |
| | | | | 4,804,115 |
| Industrial Machinery – 2.8% | | | | |
| Actuant Corp. Class A | | 700 | | 38,570 |
| Badger Meter, Inc. | | 4,300 | | 229,792 |
| Briggs & Stratton Corp. | | 4,600 | | 163,208 |
| Danaher Corp. | | 12,500 | | 757,250 |
| Dover Corp. | | 8,000 | | 383,520 |
| ITT Industries, Inc. | | 7,500 | | 393,750 |
| KCI Konecranes Oyj | | 150 | | 9,441 |
| Pentair, Inc. | | 3,660 | | 146,949 |
| Schindler Holding AG | | 454 | | 215,243 |
| | | | | 2,337,723 |
| |
| TOTAL MACHINERY | | | | 7,141,838 |
| |
| MARINE – 1.1% | | | | |
| Marine – 1.1% | | | | |
| Alexander & Baldwin, Inc. | | 2,420 | | 117,927 |
| Camillo Eitzen & Co. ASA (d) | | 16,100 | | 172,393 |
| Odfjell ASA (A Shares) | | 17,350 | | 311,130 |
| Stolt-Nielsen SA (d) | | 10,800 | | 337,725 |
| | | | | 939,175 |
| |
| METALS & MINING – 3.8% | | | | |
| Steel – 3.8% | | | | |
| Allegheny Technologies, Inc. | | 20,500 | | 1,035,455 |
| Carpenter Technology Corp. | | 5,000 | | 417,950 |
| IPSCO, Inc. | | 2,200 | | 212,032 |
| Mittal Steel Co. NV Class A (NY Shares) | | 10,600 | | 351,072 |
| Nucor Corp. | | 5,800 | | 499,090 |
| Oregon Steel Mills, Inc. (a) | | 11,600 | | 439,408 |
| United States Steel Corp. | | 4,000 | | 218,000 |
| | | | | 3,173,007 |
| |
| OIL, GAS & CONSUMABLE FUELS – 0.9% | | | | |
| Coal & Consumable Fuels – 0.3% | | | | |
| CONSOL Energy, Inc. | | 2,800 | | 179,256 |
| Massey Energy Co. | | 3,000 | | 111,600 |
| | | | | 290,856 |
| Oil & Gas Storage & Transport – 0.6% | | | | |
| OMI Corp. | | 13,400 | | 234,500 |
| Overseas Shipholding Group, Inc. | | 5,000 | | 252,850 |
| | | | | 487,350 |
| |
| TOTAL OIL, GAS & CONSUMABLE FUELS | | | | 778,206 |
See accompanying notes which are an integral part of the financial statements.
Annual Report 50
| | | Shares | | Value (Note 1) |
| |
| REAL ESTATE – 0.1% | | | | |
| Real Estate Investment Trusts – 0.1% | | | | |
| Potlatch Corp. | | 3,200 | | $ 116,608 |
| ROAD & RAIL – 6.9% | | | | |
| Railroads – 5.9% | | | | |
| Burlington Northern Santa Fe Corp. | | 17,900 | | 1,407,656 |
| Canadian National Railway Co. | | 34,600 | | 1,620,138 |
| Kansas City Southern (a) | | 9,800 | | 227,066 |
| Norfolk Southern Corp. | | 32,120 | | 1,643,902 |
| | | | | 4,898,762 |
| Trucking – 1.0% | | | | |
| Laidlaw International, Inc. | | 7,388 | | 203,909 |
| Landstar System, Inc. | | 10,736 | | 500,190 |
| Old Dominion Freight Lines, Inc. (a) | | 5,200 | | 137,072 |
| | | | | 841,171 |
| |
| TOTAL ROAD & RAIL | | | | 5,739,933 |
| |
| SPECIALTY RETAIL – 0.3% | | | | |
| Computer & Electronics Retail – 0.1% | | | | |
| Gamestop Corp. Class B (a) | | 1,000 | | 36,510 |
| Home Improvement Retail – 0.2% | | | | |
| Sherwin-Williams Co. | | 3,800 | | 173,090 |
| TOTAL SPECIALTY RETAIL | | | | 209,600 |
| |
| TRADING COMPANIES & DISTRIBUTORS – 1.5% | | | | |
| Trading Companies & Distributors – 1.5% | | | | |
| H&E Equipment Services, Inc. | | 200 | | 5,018 |
| Watsco, Inc. | | 2,800 | | 194,936 |
| WESCO International, Inc. (a) | | 18,400 | | 1,054,688 |
| | | | | 1,254,642 |
| |
| TRANSPORTATION INFRASTRUCTURE – 0.0% | | | | |
| Airport Services – 0.0% | | | | |
| Grupo Aeroportuario del Pacifico SA de CV sponsored ADR | | 200 | | 5,760 |
| TOTAL COMMON STOCKS | | | | |
| (Cost $67,956,287) | | | | 81,706,165 |
| |
| Money Market Funds — 5.3% | | | | |
| | | Shares | | Value (Note 1) |
| Fidelity Cash Central Fund, 4.57% (b) | | 3,724,277 $ | | 3,724,277 |
| Fidelity Securities Lending Cash Central Fund, 4.58% (b)(c) | | 725,030 | | 725,030 |
| TOTAL MONEY MARKET FUNDS | | | | |
| (Cost $4,449,307) | | | | 4,449,307 |
| |
| TOTAL INVESTMENT PORTFOLIO - 103.0% | | | | |
| (Cost $72,405,594) | | | | 86,155,472 |
| |
| NET OTHER ASSETS – (3.0)% | | | | (2,475,086) |
| NET ASSETS – 100% | | $ | | 83,680,386 |
See accompanying notes which are an integral part of the financial statements.
51 Annual Report
Cyclical Industries Portfolio
Investments - continued
|
(a) Non-income producing
(b) Affiliated fund that is available only to investment companies and other accounts managed by Fidelity Investments. The rate quoted is the annualized seven-day yield of the fund at period end. A complete unaudited listing of the fund’s holdings as of its most recent quarter end is available upon request.
(c) Investment made with cash collateral received from securities on loan. (d) Security or a portion of the security is on loan at period end.
Information regarding fiscal year to date income earned by the fund from the affiliated Central funds is as follows:
| Fund | | Income earned |
| Fidelity Cash Central Fund | | $ | | 28,494 |
| Fidelity Securities Lending Cash Central Fund | | | | 7,533 |
| Total | | $ | | 36,027 |
Distribution of investments by country of issue, as a percentage of total net assets, is as follows:
| United States of America | | 88.9% |
| Canada | | 4.0% |
| Netherlands | | 1.5% |
| Germany | | 1.2% |
| Others (individually less than 1%) | | 4.4% |
| | | 100.0% |
See accompanying notes which are an integral part of the financial statements.
Annual Report 52
| Cyclical Industries Portfolio | | | | | | | | |
| |
| Financial Statements | | | | | | | | |
| |
| |
| Statement of Assets and Liabilities | | | | | | | | |
| | | | | | | | | February 28, 2006 |
| |
| Assets | | | | | | | | |
| Investment in securities, at value (including securities loaned of $697,461) — See accompanying schedule: | | | | | | | | |
| Unaffiliated issuers (cost $67,956,287) | | $ | | 81,706,165 | | | | |
| Affiliated Central Funds (cost $4,449,307) | | | | 4,449,307 | | | | |
| Total Investments (cost $72,405,594) | | | | | | $ | | 86,155,472 |
| Receivable for investments sold | | | | | | | | 242,017 |
| Receivable for fund shares sold | | | | | | | | 4,239,281 |
| Dividends receivable | | | | | | | | 183,489 |
| Interest receivable | | | | | | | | 3,807 |
| Prepaid expenses | | | | | | | | |
| Other affiliated receivables | | | | | | | | |
| Other receivables | | | | | | | | 3,306 |
| Total assets | | | | | | | | 90,827,629 |
| |
| Liabilities | | | | | | | | |
| Payable for investments purchased | | $ | | 6,226,467 | | | | |
| Payable for fund shares redeemed | | | | 107,615 | | | | |
| Accrued management fee | | | | 35,322 | | | | |
| Other affiliated payables | | | | 21,764 | | | | |
| Other payables and accrued expenses | | | | 31,045 | | | | |
| Collateral on securities loaned, at value | | | | 725,030 | | | | |
| Total liabilities | | | | | | | | 7,147,243 |
| |
| Net Assets | | | | | | $ | | 83,680,386 |
| Net Assets consist of: | | | | | | | | |
| Paid in capital | | | | | | $ | | 66,542,286 |
| Undistributed net investment income | | | | | | | | 108,975 |
| Accumulated undistributed net realized gain (loss) on investments and foreign currency transactions | | | | | | | | 3,279,920 |
| Net unrealized appreciation (depreciation) on investments and assets and liabilities in foreign currencies | | | | | | | | 13,749,205 |
| Net Assets, for 3,990,877 shares outstanding | | | | | | $ | | 83,680,386 |
| Net Asset Value, offering price and redemption price per share ($83,680,386 ÷ 3,990,877 shares) | | | | | | $ | | 20. |
| |
| Statement of Operations | | | | | | | | Year ended February 28, 2006 |
| | | | | | | | | |
| |
| Investment Income | | | | | | | | |
| Dividends | | | | | | $ | | 867,267 |
| Interest | | | | | | | | |
| Income from affiliated Central Funds (including $7,533 from security lending) | | | | | | | | 36,027 |
| Total income | | | | | | | | 903,365 |
| |
| Expenses | | | | | | | | |
| Management fee | | $ | | 365,905 | | | | |
| Transfer agent fees | | | | 223,001 | | | | |
| Accounting and security lending fees | | | | | | | | |
| | | | | 32,359 | | | | |
| Independent trustees’ compensation | | | | 272 | | | | |
| Custodian fees and expenses | | | | 37,562 | | | | |
| Registration fees | | | | 21,200 | | | | |
| Audit | | | | 33,894 | | | | |
| Legal | | | | 294 | | | | |
| Miscellaneous | | | | 2,544 | | | | |
| Total expenses before reductions | | | | 717,031 | | | | |
| Expense reductions | | | | (29,822) | | | | 687,209 |
| |
| Net investment income (loss) | | | | | | | | 216,156 |
| Realized and Unrealized Gain (Loss) | | | | | | | | |
| Net realized gain (loss) on: | | | | | | | | |
See accompanying notes which are an integral part of the financial statements.
|
53 Annual Report
| Cyclical Industries Portfolio | | | | |
| Financial Statements - continued | | | | |
| |
| |
| Investment securities: | | | | |
| Unaffiliated issuers | | 6,501,758 | | |
| Foreign currency transactions | | (3,209) | | |
| Total net realized gain (loss) | | | | 6,498,549 |
| Change in net unrealized appreciation (depreciation) on: | | | | |
| Investment securities | | 2,769,606 | | |
| Assets and liabilities in foreign currencies | | (981) | | |
| Total change in net unrealized appreciation (depreciation) | | | | 2,768,625 |
| Net gain (loss) | | | | 9,267,174 |
| Net increase (decrease) in net assets resulting from operations | | | | $ 9,483,330 |
See accompanying notes which are an integral part of the financial statements.
Annual Report 54
| Statement of Changes in Net Assets | | | | | | | | | | | | | | | | | | | | |
| | | | | | | | | | | Year ended | | | | Year ended |
| | | | | | | | | | | February 28, | | | | February 28, |
| | | | | | | | | | | 2006 | | | | 2005 |
| Increase (Decrease) in Net Assets | | | | | | | | | | | | | | | | | | | | |
| Operations | | | | | | | | | | | | | | | | | | | | |
| Net investment income (loss) | | | | | | | | | | $ | | 216,156 | | $ | | | | 116,244 |
| Net realized gain (loss) | | | | | | | | | | | | 6,498,549 | | | | | | 4,535,116 |
| Change in net unrealized appreciation (depreciation) | | | | | | | | | | | | 2,768,625 | | | | | | 5,491,387 |
| Net increase (decrease) in net assets resulting from operations | | | | | | | | | | | | 9,483,330 | | | | 10,142,747 |
| Distributions to shareholders from net investment income | | | | | | | | | | | | (167,989) | | | | | | (56,985) |
| Distributions to shareholders from net realized gain | | | | | | | | | | | | (4,339,314) | | | | (2,730,334) |
| Total distributions | | | | | | | | | | | | (4,507,303) | | | | (2,787,319) |
| Share transactions | | | | | | | | | | | | | | | | | | | | |
| Proceeds from sales of shares | | | | | | | | | | | | 57,428,807 | | | | 61,946,830 |
| Reinvestment of distributions | | | | | | | | | | | | 4,328,731 | | | | | | 2,651,999 |
| Cost of shares redeemed | | | | | | | | | | | | (48,044,834) | | | | (43,805,689) |
| Net increase (decrease) in net assets resulting from share transactions | | | | | | | | | | 13,712,704 | | | | 20,793,140 |
| Redemption fees | | | | | | | | | | | | | | 22,519 | | | | | | 23,426 |
| Total increase (decrease) in net assets | | | | | | | | | | | | 18,711,250 | | | | 28,171,994 |
| |
| Net Assets | | | | | | | | | | | | | | | | | | | | |
| Beginning of period | | | | | | | | | | | | 64,969,136 | | | | 36,797,142 |
| End of period (including undistributed net investment income of $108,975 and undistributed net investment income | | | | | | | | | | |
| of $85,267, respectively) | | | | | | | | | | $ | | 83,680,386 | | $ | | 64,969,136 |
| |
| Other Information | | | | | | | | | | | | | | | | | | | | |
| Shares | | | | | | | | | | | | | | | | | | | | |
| Sold | | | | | | | | | | | | 2,929,253 | | | | | | 3,530,020 |
| Issued in reinvestment of distributions | | | | | | | | | | | | 230,791 | | | | | | 148,545 |
| Redeemed | | | | | | | | | | | | (2,550,620) | | | | (2,565,250) |
| Net increase (decrease) | | | | | | | | | | | | 609,424 | | | | | | 1,113,315 |
| |
| Financial Highlights | | | | | | | | | | | | | | | | | | | | |
| Years ended February 28, | | | | 2006 | | | | 2005 | | 2004E | | | | 2003 | | | | 2002 |
| Selected Per-Share Data | | | | | | | | | | | | | | | | | | | | |
| Net asset value, beginning of period | | $ | | 19.21 | | $ | | 16.22 | | $ 11.04 | | $ | | 14.69 | | $ | | 14.47 |
| Income from Investment Operations | | | | | | | | | | | | | | | | | | | | |
| Net investment income (loss)C | | | | 06 | | | | .05 | | .02 | | | | (.05) | | | | (.04) |
| Net realized and unrealized gain (loss) | | | | 3.06 | | | | 3.99 | | 5.46 | | | | (3.61) | | | | .26 |
| Total from investment operations | | | | 3.12 | | | | 4.04 | | 5.48 | | | | (3.66) | | | | .22 |
| Distributions from net investment income | | | | (.05) | | | | (.02) | | (.01) | | | | — | | | | — |
| Distributions from net realized gain | | | | (1.32) | | | | (1.04) | | (.30) | | | | — | | | | (.01) |
| Total distributions | | | | (1.37) | | | | (1.06) | | (.31) | | | | — | | | | (.01) |
| Redemption fees added to paid in capitalC | | | | 01 | | | | .01 | | .01 | | | | .01 | | | | .01 |
| Net asset value, end of period | | $ | | 20.97 | | $ | | 19.21 | | $ 16.22 | | $ | | 11.04 | | $ | | 14.69 |
| Total ReturnA,B | | | | 17.23% | | | | 25.60% | | 49.87% | | | | (24.85)% | | | | 1.59% |
| Ratios to Average Net AssetsD | | | | | | | | | | | | | | | | | | | | |
| Expenses before reductions | | | | 1.12% | | | | 1.19% | | 1.60% | | | | 1.94% | | | | 1.79% |
| Expenses net of fee waivers, if any | | | | 1.12% | | | | 1.19% | | 1.60% | | | | 1.94% | | | | 1.79% |
| Expenses net of all reductions | | | | 1.07% | | | | 1.15% | | 1.57% | | | | 1.91% | | | | 1.78% |
| Net investment income (loss) | | | | 34% | | | | .27% | | .14% | | | | (.40)% | | | | (.32)% |
| Supplemental Data | | | | | | | | | | | | | | | | | | | | |
| Net assets, end of period (000 omitted) | | $ | | 83,680 | | $ | | 64,969 | | $ 36,797 | | $ | | 15,132 | | $ | | 22,694 |
| Portfolio turnover rate | | | | 168% | | | | 151% | | 166% | | | | 162% | | | | 67% |
| |
| | | | | |
A Total returns would have been lower had certain expenses not been reduced during the periods shown.B Total returns do not include the effect of the former sales charges. C Calculated based on average shares outstanding during the period. DExpense ratios reflect operating expenses of the fund. Expenses before reductions do not reflect amounts reimbursed by the investment adviser or reductions from brokerage service arrangements or other expense offset arrangements and do not represent the amount paid by the fund during periods when reimbursements or reductions occur. Expenses net of fee waivers reflect expenses after reimbursement by the investment adviser but prior to reductions from brokerage service arrangements or other expense offset arrangements. Expenses net of all reductions represent the net expenses paid by the fund. EFor the year ended February 29.See accompanying notes which are an integral part of the financial statements.
55
Defense and Aerospace Portfolio
Performance
|

Average annual total return reflects the change in the value of an investment, assuming reinvestment of the fund’s dividend income and capital gains (the profits earned upon the sale of securities that have grown in value) and assuming a constant rate of performance each year. The $10,000 table and the fund’s returns do not reflect the deduction of taxes that a shareholder would pay on fund distributions or the redemption of fund shares. During periods of reimbursement by Fidelity a fund’s total returns will be greater than it would be had the reimbursement not occurred. How a fund did yesterday is no guarantee of how it will do tomorrow.
| Average Annual Total Returns | | | | | | |
| Periods ended February 28, 2006 | | Past 1 | | Past 5 | | Past 10 |
| | | year | | years | | years |
| Select Defense and Aerospace | | 23.02% | | 14.54% | | 14.74% |
| |
| $10,000 Over 10 Years | | | | | | |
Let’s say hypothetically that $10,000 was invested in Fidelity Select Defense and Aerospace Portfolio on February 29, 1996. The chart shows how the value of your investment would have changed, and also shows how the S&P 500 Index performed over the same period.
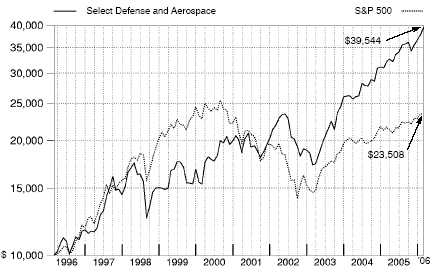
Defense and Aerospace Portfolio
|
Management’s Discussion of Fund Performance
Comments from Andrew Hatem, who became Portfolio Manager of Fidelity® Select Defense and Aerospace Portfolio on December 1, 2005
With the exception of several popular large-cap stock performance measures, most major U.S. equity benchmarks had double-digit returns for the year ending February 28, 2006. For much of the period, market gains were driven largely by the energy sector, although utilities ultimately sneaked into the top spot for the year overall. Financials and telecommunication services also reached double figures, outperforming the 8.40% return of the broader market as measured by the large-cap-oriented Standard & Poor’s 500SM Index. The consumer discretionary segment — home to the weak performing automobile and media industries — was the biggest disappointment. Although the overall return for the S&P 500® beat the small-cap Russell 2000® Index in calendar year 2005 — the first time that’s happened in six years — small-caps stormed back in early 2006, leading to a 16.59% advance during the past 12 months, nearly twice the broader market’s gain. Mid-caps soared even higher, returning 17.67% according to the Russell Midcap® Index. The technology-heavy NASDAQ Composite® Index also fared well, climbing 12.13%, but the Dow Jones Industrial AverageSM, an index of 30 large-cap, blue-chip stocks, managed to rise only 4.52% .
Select Defense and Aerospace was up 23.02% during the past year, well ahead of the S&P 500 and the Goldman Sachs® Cyclical Industries Index, which gained 9.59% . Healthy business fundamentals in commercial aerospace and defense — and the fund’s concentration in those two groups —helped performance relative to the sector index. Commercial aerospace benefited from accelerating order flows for new aircraft, particularly from developing world economies, while many defense contractors beat earnings expectations when cuts to several government programs didn’t materialize as expected. Favorable stock selection overall in commercial aerospace and defense, as well as in communications equipment, also helped. Among the fund’s top performers were military communications equipment maker Harris Corp., jet engine parts manufacturer Precision Castparts and aircraft builder Boeing. The fund’s narrow concentration within the cyclical industries universe also insulated it from weaker performing areas of the index, such as industrial conglomerates and diversified chemicals. However, its concentration also held back returns by limiting exposure to stronger areas of the index, including railroads and construction/farm machinery stocks such as Caterpillar. An out-of-index position in EchoStar Communications also hurt, as this satellite communications firm felt the pinch of higher acquisition costs in a super-competitive industry.
The views expressed above reflect those of the portfolio manager(s) only through the end of the period as stated on the cover of this report and do not necessarily represent the views of Fidelity or any other person in the Fidelity organization. Any such views are subject to change at any time based upon market or other conditions and Fidelity disclaims any responsibility to update such views. These views may not be relied on as investment advice and, because investment decisions for a Fidelity fund are based on numerous factors, may not be relied on as an indication of trading intent on behalf of any Fidelity fund.
57 57 Annual Report
Defense and Aerospace Portfolio
Investment Changes
Top Ten Stocks as of February 28, 2006
| | | % of fund’s | | % of fund’s net assets |
| | | net assets | | 6 months ago |
| General Dynamics Corp. | | 6.6 | | 3.2 |
| Precision Castparts Corp. | | 6.4 | | 5.5 |
| Rockwell Collins, Inc. | | 6.0 | | 4.5 |
| Harris Corp. | | 5.8 | | 6.6 |
| L-3 Communications Holdings, | | | | |
| Inc. | | 5.7 | | 5.9 |
| Goodrich Corp. | | 5.2 | | 4.9 |
| Raytheon Co. | | 5.1 | | 4.0 |
| EchoStar Communications Corp. | | | | |
| Class A | | 4.3 | | 4.7 |
| Lockheed Martin Corp. | | 3.7 | | 3.8 |
| DRS Technologies, Inc. | | 3.7 | | 1.7 |
| | | 52.5 | | |
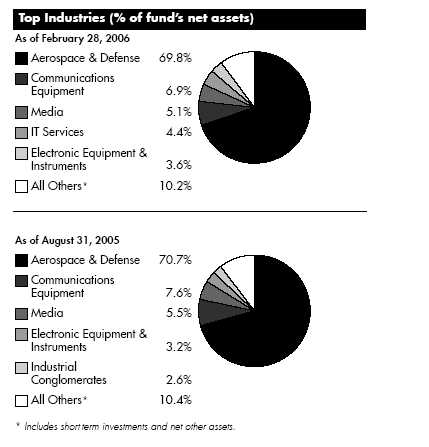
| Defense and Aerospace Portfolio | | | | |
| Investments February 28, 2006 | | | | |
| Showing Percentage of Net Assets | | | | |
| |
| Common Stocks — 94.3% | | | | |
| | | Shares | | Value (Note 1) |
| |
| AEROSPACE & DEFENSE – 69.8% | | | | |
| Aerospace & Defense – 69.8% | | | | |
| AAR Corp. (a) | | 524,200 | | $ 13,267,502 |
| Alliant Techsystems, Inc. (a) | | 376,655 | | 28,783,975 |
| Aviall, Inc. (a) | | 55,800 | | 2,128,770 |
| BE Aerospace, Inc. (a) | | 1,049,750 | | 25,183,503 |
| DRS Technologies, Inc. | | 625,400 | | 33,002,358 |
| EDO Corp. | | 101,900 | | 2,968,347 |
| Embraer – Empresa Brasileira de Aeronautica SA sponsored ADR | | 52,100 | | 2,070,975 |
| Essex Corp. (a) | | 23,900 | | 537,750 |
| GenCorp, Inc. (non-vtg.) (a)(d) | | 665,300 | | 12,807,025 |
| General Dynamics Corp. | | 486,000 | | 59,909,219 |
| Goodrich Corp. | | 1,128,050 | | 47,197,612 |
| Hexcel Corp. (a) | | 174,700 | | 3,759,544 |
| Honeywell International, Inc. | | 765,100 | | 31,330,845 |
| K&F Industries Holdings, Inc. | | 266,000 | | 4,117,680 |
| L-3 Communications Holdings, Inc. (d) | | 613,200 | | 50,963,052 |
| Lockheed Martin Corp. | | 460,100 | | 33,527,487 |
| Meggitt PLC | | 937,560 | | 6,138,547 |
| MTC Technologies, Inc. (a) | | 187,700 | | 5,178,643 |
| MTU Aero Engines Holding AG | | 9,200 | | 307,085 |
| Northrop Grumman Corp. | | 380,748 | | 24,405,947 |
| Orbital Sciences Corp. (a) | | 1,297,392 | | 19,759,280 |
| Precision Castparts Corp. | | 1,091,000 | | 57,866,640 |
| Raytheon Co. | | 1,057,252 | | 45,884,737 |
| Rockwell Collins, Inc. | | 1,024,100 | | 54,430,915 |
| The Boeing Co. | | 372,100 | | 27,047,949 |
| Triumph Group, Inc. (a) | | 199,800 | | 8,361,630 |
| United Technologies Corp. | | 498,200 | | 29,144,700 |
| | | | | 630,081,717 |
| |
| COMMUNICATIONS EQUIPMENT – 6.9% | | | | |
| Communications Equipment – 6.9% | | | | |
| Anaren, Inc. (a) | | 109,700 | | 1,884,646 |
| Harris Corp. | | 1,149,300 | | 52,500,024 |
| Powerwave Technologies, Inc. (a) | | 80,932 | | 1,188,082 |
| REMEC, Inc. | | 235,064 | | 312,635 |
| ViaSat, Inc. (a) | | 233,400 | | 6,266,790 |
| | | | | 62,152,177 |
| |
| ELECTRONIC EQUIPMENT & INSTRUMENTS – 3.6% | | | | |
| Electronic Equipment & Instruments – 0.9% | | | | |
| Aeroflex, Inc. (a) | | 628,300 | | 8,167,900 |
| Electronic Manufacturing Services – 2.7% | | | | |
| Mercury Computer Systems, Inc. (a) | | 85,700 | | 1,477,468 |
| Trimble Navigation Ltd. (a) | | 549,250 | | 22,469,818 |
| | | | | 23,947,286 |
| |
| TOTAL ELECTRONIC EQUIPMENT & INSTRUMENTS | | | | 32,115,186 |
| |
| HOUSEHOLD DURABLES – 0.9% | | | | |
| Consumer Electronics – 0.9% | | | | |
| Harman International Industries, Inc. | | 76,100 | | 8,397,635 |
59
See accompanying notes which are an integral part of the financial statements.
59 Annual Report
| Defense and Aerospace Portfolio | | | | | | |
| Investments - continued | | | | | | |
| |
| |
| |
| | | Shares | | Value (Note 1) |
| |
| INDUSTRIAL CONGLOMERATES – 1.0% | | | | | | |
| Industrial Conglomerates – 1.0% | | | | | | |
| General Electric Co. | | 1,300 | | $ | | 42,731 |
| Smiths Group PLC | | 250,000 | | | | 4,117,867 |
| Textron, Inc. | | 52,500 | | | | 4,625,775 |
| | | | | | | 8,786,373 |
| |
| IT SERVICES – 4.4% | | | | | | |
| IT Consulting & Other Services – 4.4% | | | | | | |
| CACI International, Inc. Class A (a) | | 235,900 | | | | 14,217,693 |
| NCI, Inc. Class A | | 158,556 | | | | 2,213,442 |
| SRA International, Inc. Class A (a) | | 671,000 | | | | 23,162,920 |
| | | | | | | 39,594,055 |
| |
| MEDIA – 5.1% | | | | | | |
| Broadcasting & Cable TV – 5.1% | | | | | | |
| EchoStar Communications Corp. Class A (a) | | 1,320,100 | | | | 38,771,337 |
| The DIRECTV Group, Inc. (a) | | 441,511 | | | | 6,958,213 |
| | | | | | | 45,729,550 |
| |
| METALS & MINING – 2.2% | | | | | | |
| Steel – 2.2% | | | | | | |
| Allegheny Technologies, Inc. | | 397,200 | | | | 20,062,572 |
| SOFTWARE – 0.4% | | | | | | |
| Application Software – 0.4% | | | | | | |
| NAVTEQ Corp. (a) | | 86,900 | | | | 4,024,339 |
| TOTAL COMMON STOCKS | | | | | | |
| (Cost $635,259,474) | | | | 850,943,604 |
| |
| Money Market Funds — 9.2% | | | | | | |
| |
| Fidelity Cash Central Fund, 4.57% (b) | | 58,893,082 | | 58,893,082 |
| Fidelity Securities Lending Cash Central Fund, 4.58% (b)(c) | | 23,964,175 | | 23,964,175 |
| TOTAL MONEY MARKET FUNDS | | | | | | |
| (Cost $82,857,257) | | | | 82,857,257 |
| |
| TOTAL INVESTMENT PORTFOLIO - 103.5% | | | | | | |
| (Cost $718,116,731) | | | | 933,800,861 |
| |
| NET OTHER ASSETS – (3.5)% | | | | (31,752,083) |
| NET ASSETS – 100% | | $ | | 902,048,778 |
(a) Non-income producing
(b) Affiliated fund that is available only to investment companies and other accounts managed by Fidelity Investments. The rate quoted is the annualized seven-day yield of the fund at period end. A complete unaudited listing of the fund’s holdings as of its most recent quarter end is available upon request.
(c) Investment made with cash collateral received from securities on loan. (d) Security or a portion of the security is on loan at period end.
Information regarding fiscal year to date income earned by the fund from the affiliated Central funds is as follows:
See accompanying notes which are an integral part of the financial statements.
Annual Report 60
| Fund | | Income earned |
| Fidelity Cash Central Fund | | $ 1,106,951 |
| Fidelity Securities Lending Cash Central Fund | | 67,651 |
| Total | | $ 1,174,602 |
See accompanying notes which are an integral part of the financial statements.
|
61 Annual Report
61
| Statement of Assets and Liabilities | | | | | | |
| | | | | | | February 28, 2006 |
| |
| Assets | | | | | | |
| Investment in securities, at value (including securities loaned of $23,200,437) — See accompanying schedule: | | | | | | |
| Unaffiliated issuers (cost $635,259,474) | | $ 850,943,604 | | | | |
| Affiliated Central Funds (cost $82,857,257) | | 82,857,257 | | | | |
| Total Investments (cost $718,116,731) | | | | $ | | 933,800,861 |
| Receivable for fund shares sold | | | | | | 6,968,548 |
| Dividends receivable | | | | | | 870,032 |
| Interest receivable | | | | | | 128,939 |
| Prepaid expenses | | | | | | 3,148 |
| Other affiliated receivables | | | | | | 229 |
| Other receivables | | | | | | 27,827 |
| Total assets | | | | | | 941,799,584 |
| |
| Liabilities | | | | | | |
| Payable for investments purchased | | $ 13,796,776 | | | | |
| Payable for fund shares redeemed | | 1,323,892 | | | | |
| Accrued management fee | | 397,883 | | | | |
| Other affiliated payables | | 229,563 | | | | |
| Other payables and accrued expenses | | 38,517 | | | | |
| Collateral on securities loaned, at value | | 23,964,175 | | | | |
| Total liabilities | | | | | | 39,750,806 |
| |
| Net Assets | | | | $ | | 902,048,778 |
| Net Assets consist of: | | | | | | |
| Paid in capital | | | | $ | | 654,080,017 |
| Undistributed net investment income | | | | | | 237,024 |
| Accumulated undistributed net realized gain (loss) on investments and foreign currency transactions | | | | | | 32,047,607 |
| Net unrealized appreciation (depreciation) on investments | | | | | | 215,684,130 |
| Net Assets, for 11,431,945 shares outstanding | | | | $ | | 902,048,778 |
| Net Asset Value, offering price and redemption price per share ($902,048,778 ÷ 11,431,945 shares) | | | | $ | | 78.91 |
| Statement of Operations | | | | |
| | | | | Year ended February 28, 2006 |
| |
| Investment Income | | | | |
| Dividends | | $ | | 7,530,361 |
| Interest | | | | 2,920 |
| Income from affiliated Central Funds (including $67,651 from security lending) | | | | 1,174,602 |
| Total income | | | | 8,707,883 |
| |
| Expenses | | | | |
| Management fee | | $ 4,372,314 | | |
| Transfer agent fees | | 2,551,086 | | |
| Accounting and security lending fees | | | | |
| | | 346,904 | | |
| Independent trustees’ compensation | | 3,197 | | |
| Custodian fees and expenses | | 22,329 | | |
| Registration fees | | 73,031 | | |
| Audit | | 37,326 | | |
| Legal | | 4,104 | | |
| Miscellaneous | | 5,925 | | |
| Total expenses before reductions | | 7,416,216 | | |
| Expense reductions | | (127,942) | | 7,288,274 |
| |
| Net investment income (loss) | | | | 1,419,609 |
| Realized and Unrealized Gain (Loss) | | | | |
| Net realized gain (loss) on: | | | | |
| Investment securities: | | | | |
See accompanying notes which are an integral part of the financial statements.
Annual Report 62
| Unaffiliated issuers | | 67,355,234 | | |
| Foreign currency transactions | | (16,209) | | |
| Total net realized gain (loss) | | | | 67,339,025 |
| Change in net unrealized appreciation (depreciation) on investment securities | | | | 88,845,184 |
| Net gain (loss) | | | | 156,184,209 |
| Net increase (decrease) in net assets resulting from operations | | | | $ 157,603,818 |
See accompanying notes which are an integral part of the financial statements.
|
63 Annual Report
| Defense and Aerospace Portfolio | | | | | | | | | | | | | | | | | | | | | | |
| Financial Statements - continued | | | | | | | | | | | | | | | | | | | | | | |
| |
| |
| Statement of Changes in Net Assets | | | | | | | | | | | | | | | | | | | | | | |
| | | | | | | | | | | | | | | Year ended | | | | Year ended |
| | | | | | | | | | | | | | | February 28, | | | | February 28, |
| | | | | | | | | | | | | | | 2006 | | | | 2005 |
| Increase (Decrease) in Net Assets | | | | | | | | | | | | | | | | | | | | | | |
| Operations | | | | | | | | | | | | | | | | | | | | | | |
| Net investment income (loss) | | | | | | | | | | | | $ | | 1,419,609 | | $ | | | | 1,649,723 |
| Net realized gain (loss) | | | | | | | | | | | | | | 67,339,025 | | | | | | 7,414,911 |
| Change in net unrealized appreciation (depreciation) | | | | | | | | | | | | | | 88,845,184 | | | | | | 74,061,537 |
| Net increase (decrease) in net assets resulting from operations | | | | | | | | | | | | | | 157,603,818 | | | | | | 83,126,171 |
| Distributions to shareholders from net investment income | | | | | | | | | | | | | | (1,154,317) | | | | | | (1,518,670) |
| Distributions to shareholders from net realized gain | | | | | | | | | | | | | | (34,919,985) | | | | | | (1,998,254) |
| Total distributions | | | | | | | | | | | | | | (36,074,302) | | | | | | (3,516,924) |
| Share transactions | | | | | | | | | | | | | | | | | | | | | | |
| Proceeds from sales of shares | | | | | | | | | | | | | | 520,738,976 | | | | 385,932,538 |
| Reinvestment of distributions | | | | | | | | | | | | | | 34,754,666 | | | | | | 3,383,852 |
| Cost of shares redeemed | | | | | | | | | | | | | | (358,203,751) | | | | (207,827,588) |
| Net increase (decrease) in net assets resulting from share transactions | | | | | | | | | | | | 197,289,891 | | | | 181,488,802 |
| Redemption fees | | | | | | | | | | | | | | | | 112,951 | | | | | | 103,217 |
| Total increase (decrease) in net assets | | | | | | | | | | | | | | 318,932,358 | | | | 261,201,266 |
| |
| Net Assets | | | | | | | | | | | | | | | | | | | | | | |
| Beginning of period | | | | | | | | | | | | | | 583,116,420 | | | | 321,915,154 |
| End of period (including undistributed net investment income of $237,024 and accumulated net investment loss of | | | | | | | | | | | | |
| $160, respectively) | | | | | | | | | | | | $ | | 902,048,778 | | $ | | 583,116,420 |
| |
| Other Information | | | | | | | | | | | | | | | | | | | | | | |
| Shares | | | | | | | | | | | | | | | | | | | | | | |
| Sold | | | | | | | | | | | | | | 7,213,251 | | | | | | 6,260,901 |
| Issued in reinvestment of distributions | | | | | | | | | | | | | | | | 475,557 | | | | | | 52,059 |
| Redeemed | | | | | | | | | | | | | | (4,936,594) | | | | | | (3,478,896) |
| Net increase (decrease) | | | | | | | | | | | | | | 2,752,214 | | | | | | 2,834,064 |
| |
| Financial Highlights | | | | | | | | | | | | | | | | | | | | | | |
| Years ended February 28, | | | | 2006 | | | | 2005 | | | | 2004E | | | | 2003 | | | | | | 2002 |
| Selected Per-Share Data | | | | | | | | | | | | | | | | | | | | | | |
| Net asset value, beginning of period | | $ | | 67.18 | | $ | | 55.07 | | $ | | 36.30 | | $ | | 46.08 | | | | $ | | 42.83 |
| Income from Investment Operations | | | | | | | | | | | | | | | | | | | | | | |
| Net investment income (loss)C | | | | 13 | | | | .25 | | | | (.09) | | | | —F | | | | | | .15 |
| Net realized and unrealized gain (loss) | | | | 15.04 | | | | 12.28 | | | | 18.85 | | | | (9.77) | | | | | | 3.59 |
| Total from investment operations | | | | 15.17 | | | | 12.53 | | | | 18.76 | | | | (9.77) | | | | | | 3.74 |
| Distributions from net investment income | | | | (.11) | | | | (.19) | | | | — | | | | (.04) | | | | | | (.05) |
| Distributions from net realized gain | | | | (3.34) | | | | (.25) | | | | — | | | | — | | | | | | (.49) |
| Total distributions | | | | (3.45) | | | | (.44) | | | | — | | | | (.04) | | | | | | (.54) |
| Redemption fees added to paid in capitalC | | | | 01 | | | | .02 | | | | .01 | | | | .03 | | | | | | .05 |
| Net asset value, end of period | | $ | | 78.91 | | $ | | 67.18 | | $ | | 55.07 | | $ | | 36.30 | | | | $ | | 46.08 |
| Total ReturnA,B | | | | 23.02% | | | | 22.82% | | | | 51.71% | | | | (21.16)% | | | | | | 9.09% |
| Ratios to Average Net AssetsD | | | | | | | | | | | | | | | | | | | | | | |
| Expenses before reductions | | | | 97% | | | | 1.02% | | | | 1.28% | | | | 1.25% | | | | | | 1.23% |
| Expenses net of fee waivers, if any | | | | 97% | | | | 1.02% | | | | 1.28% | | | | 1.25% | | | | | | 1.23% |
| Expenses net of all reductions | | | | 95% | | | | 1.00% | | | | 1.24% | | | | 1.21% | | | | | | 1.19% |
| Net investment income (loss) | | | | 19% | | | | .41% | | | | (.19)% | | | | —% | | | | | | .37% |
| Supplemental Data | | | | | | | | | | | | | | | | | | | | | | |
| Net assets, end of period (000 omitted) | | $ 902,049 | | $ 583,116 | | $ 321,915 | | $ 264,301 | | | | $ 286,831 |
| Portfolio turnover rate | | | | 50% | | | | 38% | | | | 47% | | | | 79% | | | | | | 76% |
| |
| | | | | |
A Total returns would have been lower had certain expenses not been reduced during the periods shown. B Total returns do not include the effect of the former sales charges. C Calculated based on average shares outstanding during the period. DExpense ratios reflect operating expenses of the fund. Expenses before reductions do not reflect amounts reimbursed by the investment adviser or reductions from brokerage service arrangements or other expense offset arrangements and do not represent the amount paid by the fund during periods when reimbursements or reductions occur. Expenses net of fee waivers reflect expenses after reimbursement by the investment adviser but prior to reductions from brokerage service arrangements or other expense offset arrangements. Expenses net of all reductions represent the net expenses paid by the fund. E For the year ended February 29. F Amount represents less than $.01 per share.| | | | | |
| See accompanying notes which are an integral part of the financial statements. | | | | |
Annual Report 64
Environmental Portfolio
Performance
|

Average annual total return reflects the change in the value of an investment, assuming reinvestment of the fund’s dividend income and capital gains (the profits earned upon the sale of securities that have grown in value) and assuming a constant rate of performance each year. The $10,000 table and the fund’s returns do not reflect the deduction of taxes that a shareholder would pay on fund distributions or the redemption of fund shares. During periods of reimbursement by Fidelity a fund’s total returns will be greater than it would be had the reimbursement not occurred. How a fund did yesterday is no guarantee of how it will do tomorrow.
| Average Annual Total Returns | | | | | | |
| Periods ended February 28, 2006 | | Past 1 | | Past 5 | | Past 10 |
| | | year | | years | | years |
| Select Environmental | | 25.72% | | 5.98% | | 3.45% |
| |
| $10,000 Over 10 Years | | | | | | |
Let’s say hypothetically that $10,000 was invested in Fidelity Select Environmental Portfolio on February 29, 1996. The chart shows how the value of your investment would have changed, and also shows how the S&P 500 Index performed over the same period.
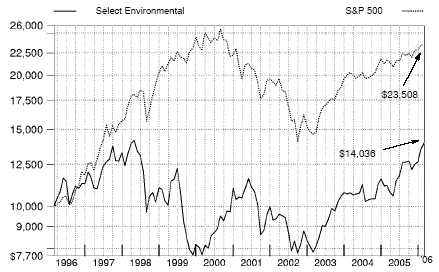
65 Annual Report
Management’s Discussion of Fund Performance
Comments from Douglas Simmons, Portfolio Manager of Fidelity® Select Environmental Portfolio
With the exception of several popular large-cap stock performance measures, most major U.S. equity benchmarks had double-digit returns for the year ending February 28, 2006. For much of the period, market gains were driven largely by the energy sector, although utilities ultimately sneaked into the top spot for the year overall. Financials and telecommunication services also reached double figures, outperforming the 8.40% return of the broader market as measured by the large-cap-oriented Standard & Poor’s 500SM Index. The consumer discretionary segment — home to the weak performing automobile and media industries — was the biggest disappointment. Although the overall return for the S&P 500® beat the small-cap Russell 2000® Index in calendar year 2005 — the first time that’s happened in six years — small-caps stormed back in early 2006, leading to a 16.59% advance during the past 12 months, nearly twice the broader market’s gain. Mid-caps soared even higher, returning 17.67% according to the Russell Midcap® Index. The technology-heavy NASDAQ Composite® Index also fared well, climbing 12.13%, but the Dow Jones Industrial AverageSM, an index of 30 large-cap, blue-chip stocks, managed to rise only 4.52% .
For the 12 months that ended February 28, 2006, the fund returned 25.72%, outperforming the S&P 500 and the 9.59% return of the Goldman Sachs® Cyclical Industries Index. Fund performance relative to the sector benchmark was helped by security selection in the multi-utilities and food retail industries — which are not included in the index — and from not holding investments in industrial conglomerates, a segment of the Goldman Sachs index that fared poorly. A significant overweighting of the environmental and facilities services group also bolstered fund performance. Not investing in defense/aerospace or railroads held back relative performance, as these groups outperformed. Top performance came from out-of-benchmark positions in France-based water utility and water treatment company Veolia Environnement and Millipore, a filtration firm. Other non-benchmark securities that did well were Capstone Turbine, which manufactures hybrid automobile engines and mircroturbines; Ormat Technologies, which develops and builds geothermal power plants; and Itron, a manufacturer of digital electric meters. Detractors included independent power producer Calpine and fuel cell manufacturers Plug Power and FuelCell Energy.
The views expressed above reflect those of the portfolio manager(s) only through the end of the period as stated on the cover of this report and do not necessarily represent the views of Fidelity or any other person in the Fidelity organization. Any such views are subject to change at any time based upon market or other conditions and Fidelity disclaims any responsibility to update such views. These views may not be relied on as investment advice and, because investment decisions for a Fidelity fund are based on numerous factors, may not be relied on as an indication of trading intent on behalf of any Fidelity fund.
Environmental Portfolio
Investment Changes
Top Ten Stocks as of February 28, 2006
| | | % of fund’s | | % of fund’s net assets |
| | | net assets | | 6 months ago |
| Waste Management, Inc. | | 7.6 | | 8.2 |
| Veolia Environnement sponsored | | | | |
| ADR | | 5.5 | | 8.8 |
| Stericycle, Inc. | | 4.7 | | 0.0 |
| Pall Corp. | | 4.5 | | 6.5 |
| Donaldson Co., Inc. | | 4.2 | | 5.5 |
| Millipore Corp. | | 4.1 | | 7.2 |
| Ecolab, Inc. | | 3.8 | | 5.1 |
| Nalco Holding Co. | | 3.8 | | 0.0 |
| Republic Services, Inc. | | 3.4 | | 5.4 |
| United Natural Foods, Inc. | | 3.3 | | 0.0 |
| | | 44.9 | | |
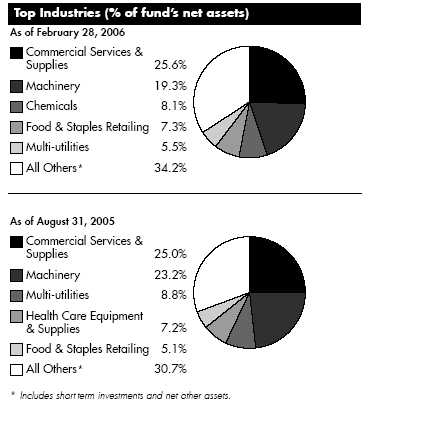
67 Annual Report
67
| Environmental Portfolio | | | | | | |
| Investments February 28, 2006 | | | | | | |
| Showing Percentage of Net Assets | | | | | | |
| |
| Common Stocks — 85.6% | | | | | | |
| | | | | Shares | | Value (Note 1) |
| |
| AUTO COMPONENTS – 1.7% | | | | | | |
| Auto Parts & Equipment – 1.7% | | | | | | |
| Ballard Power Systems, Inc. (a) | | | | 154,400 | | $ 944,488 |
| CHEMICALS – 8.1% | | | | | | |
| Commodity Chemicals – 0.5% | | | | | | |
| Calgon Carbon Corp. | | | | 34,700 | | 269,966 |
| Specialty Chemicals – 7.6% | | | | | | |
| Ecolab, Inc. | | | | 58,200 | | 2,106,258 |
| Nalco Holding Co. (a) | | | | 119,100 | | 2,084,250 |
| | | | | | | 4,190,508 |
| |
| TOTAL CHEMICALS | | | | | | 4,460,474 |
| |
| COMMERCIAL SERVICES & SUPPLIES – 25.6% | | | | | | |
| Diversified Commercial & Professional Services – 1.9% | | | | | | |
| Tetra Tech, Inc. (a) | | | | 59,300 | | 1,056,133 |
| Environmental & Facility Services – 23.7% | | | | | | |
| Allied Waste Industries, Inc. (a) | | | | 105,000 | | 1,124,550 |
| Bennett Environmental, Inc. (a) | | | | 17,900 | | 74,679 |
| Casella Waste Systems, Inc. Class A (a) | | | | 18,500 | | 261,775 |
| Clean Harbors, Inc. (a) | | | | 19,300 | | 636,514 |
| Duratek, Inc. (a) | | | | 12,000 | | 263,040 |
| Marsulex, Inc. (a) | | | | 38,000 | | 272,587 |
| Republic Services, Inc. | | | | 48,800 | | 1,896,856 |
| Stericycle, Inc. (a) | | | | 42,800 | | 2,587,260 |
| TRC Companies, Inc. (a) | | | | 6,300 | | 69,741 |
| Waste Connections, Inc. (a) | | | | 47,200 | | 1,729,408 |
| Waste Management, Inc. | | | | 126,793 | | 4,217,136 |
| | | | | | | 13,133,546 |
| |
| TOTAL COMMERCIAL SERVICES & SUPPLIES | | | | | | 14,189,679 |
| |
| CONSTRUCTION & ENGINEERING – 1.3% | | | | | | |
| Construction & Engineering – 1.3% | | | | | | |
| Insituform Technologies, Inc. Class A (a) | | | | 26,100 | | 702,351 |
| CONSTRUCTION MATERIALS – 2.4% | | | | | | |
| Construction Materials – 2.4% | | | | | | |
| Headwaters, Inc. (a) | | | | 36,300 | | 1,347,456 |
| ELECTRICAL EQUIPMENT – 2.0% | | | | | | |
| Electrical Components & Equipment – 1.0% | | | | | | |
| FuelCell Energy, Inc. (a)(d) | | | | 33,900 | | 377,307 |
| Hydrogenics Corp. (a)(d) | | | | 41,300 | | 163,942 |
| | | | | | | 541,249 |
| Heavy Electrical Equipment – 1.0% | | | | | | |
| Capstone Turbine Corp. (a)(d) | | | | 59,100 | | 186,756 |
| Plug Power, Inc. (a) | | | | 76,000 | | 386,840 |
| | | | | | | 573,596 |
| |
| TOTAL ELECTRICAL EQUIPMENT | | | | | | 1,114,845 |
See accompanying notes which are an integral part of the financial statements.
Annual Report 68
| | | Shares | | Value (Note |
| |
| ELECTRONIC EQUIPMENT & INSTRUMENTS – 1.4% | | | | |
| Electronic Equipment & Instruments – 1.4% | | | | |
| Itron, Inc. (a) | | 13,300 | | $ 790,818 |
| ENERGY EQUIPMENT & SERVICES – 1.0% | | | | |
| Oil & Gas Equipment & Services – 1.0% | | | | |
| Newpark Resources, Inc. (a) | | 75,300 | | 561,738 |
| FOOD & STAPLES RETAILING – 7.3% | | | | |
| Food Distributors – 3.3% | | | | |
| United Natural Foods, Inc. (a) | | 54,700 | | 1,819,322 |
| Food Retail – 4.0% | | | | |
| Whole Foods Market, Inc. | | 25,500 | | 1,628,940 |
| Wild Oats Markets, Inc. (a) | | 34,700 | | 622,865 |
| | | | | 2,251,805 |
| |
| TOTAL FOOD & STAPLES RETAILING | | | | 4,071,127 |
| |
| FOOD PRODUCTS – 2.0% | | | | |
| Packaged Foods & Meats – 2.0% | | | | |
| Green Mountain Coffee Roasters, Inc. (a) | | 3,200 | | 131,232 |
| Hain Celestial Group, Inc. (a) | | 21,000 | | 490,140 |
| SunOpta, Inc. (a) | | 61,700 | | 467,576 |
| | | | | 1,088,948 |
| |
| HEALTH CARE EQUIPMENT & SUPPLIES – 4.1% | | | | |
| Health Care Supplies – 4.1% | | | | |
| Millipore Corp. (a) | | 33,100 | | 2,294,823 |
| INDEPENDENT POWER PRODUCERS & ENERGY TRADERS – 2.7% | | | | |
| Independent Power & Energy Trade – 2.7% | | | | |
| Dynegy, Inc. Class A (a) | | 50,100 | | 271,041 |
| NRG Energy, Inc. (a) | | 5,500 | | 237,875 |
| Ormat Technologies, Inc. (d) | | 25,100 | | 964,593 |
| | | | | 1,473,509 |
| |
| MACHINERY – 19.3% | | | | |
| Construction & Farm Machinery & Heavy Trucks – 0.4% | | | | |
| Lindsay Manufacturing Co. | | 10,100 | | 247,450 |
| Industrial Machinery – 18.9% | | | | |
| CLARCOR, Inc. | | 36,000 | | 1,218,600 |
| Donaldson Co., Inc. | | 66,600 | | 2,308,356 |
| ESCO Technologies, Inc. (a) | | 22,600 | | 1,147,628 |
| Kadant, Inc. (a) | | 14,000 | | 264,460 |
| Pall Corp. | | 85,700 | | 2,521,294 |
| Pentair, Inc. | | 42,200 | | 1,694,330 |
| Zenon Environmental, Inc. (a) | | 81,700 | | 1,297,967 |
| | | | | 10,452,635 |
| |
| TOTAL MACHINERY | | | | 10,700,085 |
| |
| MULTI-UTILITIES – 5.5% | | | | |
| Multi-Utilities – 5.5% | | | | |
| Veolia Environnement sponsored ADR (d) | | 58,400 | | 3,064,832 |
69
See accompanying notes which are an integral part of the financial statements.
69 Annual Report
| Environmental Portfolio | | | | |
| Investments - continued | | | | |
| |
| Common Stocks – continued | | | | |
| | | Shares | | Value (Note 1) |
| OIL, GAS & CONSUMABLE FUELS – 0.4% | | | | |
| Oil & Gas Exploration & Production – 0.4% | | | | |
| Cheniere Energy, Inc. (a) | | 5,000 | | $ 198,250 |
| SEMICONDUCTORS & SEMICONDUCTOR EQUIPMENT – 0.8% | | | | |
| Semiconductor Equipment – 0.8% | | | | |
| Asyst Technologies, Inc. (a) | | 42,700 | | 416,752 |
| TOTAL COMMON STOCKS | | | | |
| (Cost $43,464,995) | | | | 47,420,175 |
| Money Market Funds — 15.0% | | | | |
| Fidelity Cash Central Fund, 4.57% (b) | | 5,434,911 | | 5,434,911 |
| Fidelity Securities Lending Cash Central Fund, 4.58% (b)(c) | | 2,851,525 | | 2,851,525 |
| TOTAL MONEY MARKET FUNDS | | | | |
| (Cost $8,286,436) | | | | 8,286,436 |
| TOTAL INVESTMENT PORTFOLIO - 100.6% | | | | |
| (Cost $51,751,431) | | | | 55,706,611 |
| |
| NET OTHER ASSETS – (0.6)% | | | | (309,192) |
| NET ASSETS – 100% | | $ | | 55,397,419 |
(a) Non-income producing
(b) Affiliated fund that is available only to investment companies and other accounts managed by Fidelity Investments. The rate quoted is the annualized seven-day yield of the fund at period end. A complete unaudited listing of the fund’s holdings as of its most recent quarter end is available upon request.
(c) Investment made with cash collateral received from securities on loan. (d) Security or a portion of the security is on loan at period end.
Information regarding fiscal year to date income earned by the fund from the affiliated Central funds is as follows:
| Fund | | Income earned |
| Fidelity Cash Central Fund | | $ | | 42,542 |
| Fidelity Securities Lending Cash Central Fund | | | | 37,900 |
| Total | | $ | | 80,442 |
Distribution of investments by country of issue, as a percentage of total net assets, is as follows:
| United States of America | | 88.7% |
| Canada | | 5.8% |
| France | | 5.5% |
| | | 100.0% |
At February 28, 2006, the fund had a capital loss carryforward of approximately $10,408 all of which will expire on February 29, 2012.
See accompanying notes which are an integral part of the financial statements.
Annual Report 70
| Environmental Portfolio | | | | | | | | |
| |
| Financial Statements | | | | | | | | |
| |
| |
| Statement of Assets and Liabilities | | | | | | | | |
| | | | | | | | | February 28, 2006 |
| |
| Assets | | | | | | | | |
| Investment in securities, at value (including securities loaned of $2,726,416) — See accompanying schedule: | | | | | | | | |
| Unaffiliated issuers (cost $43,464,995) | | $ | | 47,420,175 | | | | |
| Affiliated Central Funds (cost $8,286,436) | | | | 8,286,436 | | | | |
| Total Investments (cost $51,751,431) | | | | | | $ | | 55,706,611 |
| Cash | | | | | | | | 618,174 |
| Receivable for fund shares sold | | | | | | | | 3,957,077 |
| Dividends receivable | | | | | | | | 2,672 |
| Interest receivable | | | | | | | | 16,513 |
| Prepaid expenses | | | | | | | | 94 |
| Receivable from investment adviser for expense reductions | | | | | | | | 4,842 |
| Other affiliated receivables | | | | | | | | 110 |
| Other receivables | | | | | | | | 6,868 |
| Total assets | | | | | | | | 60,312,961 |
| |
| Liabilities | | | | | | | | |
| Payable for investments purchased | | $ | | 1,978,009 | | | | |
| Payable for fund shares redeemed | | | | 27,554 | | | | |
| Accrued management fee | | | | 15,767 | | | | |
| Other affiliated payables | | | | 17,469 | | | | |
| Other payables and accrued expenses | | | | 25,218 | | | | |
| Collateral on securities loaned, at value | | | | 2,851,525 | | | | |
| Total liabilities | | | | | | | | 4,915,542 |
| |
| Net Assets | | | | | | $ | | 55,397,419 |
| Net Assets consist of: | | | | | | | | |
| Paid in capital | | | | | | $ | | 51,985,480 |
| Accumulated net investment loss | | | | | | | | (223) |
| Accumulated undistributed net realized gain (loss) on investments and foreign currency transactions | | | | | | | | (543,018) |
| Net unrealized appreciation (depreciation) on investments | | | | | | | | 3,955,180 |
| Net Assets, for 3,193,723 shares outstanding | | | | | | $ | | 55,397,419 |
| Net Asset Value, offering price and redemption price per share ($55,397,419 ÷ 3,193,723 shares) | | | | | | $ | | 17.35 |
| |
| Statement of Operations | | | | | | | | |
| | | | | | | | | Year ended February 28, 2006 |
| |
| Investment Income | | | | | | | | |
| Dividends | | | | | | $ | | 135,832 |
| Interest | | | | | | | | 3,279 |
| Income from affiliated Central Funds (including $37,900 from security lending) | | | | | | | | 80,442 |
| Total income | | | | | | | | 219,553 |
| |
| Expenses | | | | | | | | |
| Management fee | | $ | | 122,147 | | | | |
| Transfer agent fees | | | | 97,879 | | | | |
| Accounting and security lending fees | | | | | | | | |
| | | | | 10,907 | | | | |
| Independent trustees’ compensation | | | | 97 | | | | |
| Custodian fees and expenses | | | | 10,288 | | | | |
| Registration fees | | | | 24,215 | | | | |
| Audit | | | | 33,475 | | | | |
| Legal | | | | 145 | | | | |
| Miscellaneous | | | | 175 | | | | |
| Total expenses before reductions | | | | 299,328 | | | | |
| Expense reductions | | | | (49,799) | | | | 249,529 |
| |
| Net investment income (loss) | | | | | | | | (29,976) |
| |
| |
| See accompanying notes which are an integral part of the financial statements. | | | | | | | | |
71 Annual Report
| Environmental Portfolio | | | | |
| Financial Statements - continued | | | | |
| |
| |
| Realized and Unrealized Gain (Loss) | | | | |
| Net realized gain (loss) on: | | | | |
| Investment securities: | | | | |
| Unaffiliated issuers | | 1,298,931 | | |
| Foreign currency transactions | | (778) | | |
| Total net realized gain (loss) | | | | 1,298,153 |
| Change in net unrealized appreciation (depreciation) on investment securities | | | | 3,984,704 |
| Net gain (loss) | | | | 5,282,857 |
| Net increase (decrease) in net assets resulting from operations | | | | $ 5,252,881 |
See accompanying notes which are an integral part of the financial statements.
Annual Report 72
| Statement of Changes in Net Assets | | | | | | | | | | | | | | | | |
| | | | | | | | | | | Year ended | | Year ended |
| | | | | | | | | | | February 28, | | February 28, |
| | | | | | | | | | | 2006 | | 2005 |
| Increase (Decrease) in Net Assets | | | | | | | | | | | | | | | | |
| Operations | | | | | | | | | | | | | | | | |
| Net investment income (loss) | | | | | | | | $ | | | | (29,976) | | | | $ (126,707) |
| Net realized gain (loss) | | | | | | | | | | 1,298,153 | | | | 1,327,705 |
| Change in net unrealized appreciation (depreciation) | | | | | | | | | | 3,984,704 | | | | (800,263) |
| Net increase (decrease) in net assets resulting from operations | | | | | | | | | | 5,252,881 | | | | 400,735 |
| Share transactions | | | | | | | | | | | | | | | | |
| Proceeds from sales of shares | | | | | | | | | | 75,524,136 | | | | 7,280,904 |
| Cost of shares redeemed | | | | | | | | | | (37,407,839) | | | | (7,951,612) |
| Net increase (decrease) in net assets resulting from share transactions | | | | | | | | | | 38,116,297 | | | | (670,708) |
| Redemption fees | | | | | | | | | | | | 23,557 | | | | 5,507 |
| Total increase (decrease) in net assets | | | | | | | | | | 43,392,735 | | | | (264,466) |
| |
| Net Assets | | | | | | | | | | | | | | | | |
| Beginning of period | | | | | | | | | | 12,004,684 | | | | 12,269,150 |
| End of period (including accumulated net investment loss of $223 and accumulated net investment loss of $306, | | | | | | | | | | |
| respectively) | | | | | | | | $ | | 55,397,419 | | | | $ 12,004,684 |
| |
| Other Information | | | | | | | | | | | | | | | | |
| Shares | | | | | | | | | | | | | | | | |
| Sold | | | | | | | | | | 4,815,847 | | | | 545,145 |
| Redeemed | | | | | | | | | | (2,492,334) | | | | (598,405) |
| Net increase (decrease) | | | | | | | | | | 2,323,513 | | | | (53,260) |
| |
| Financial Highlights | | | | | | | | | | | | | | | | |
| Years ended February 28, | | 2006 | | 2005 | | | | 2004E | | | | 2003 | | | | 2002 |
| Selected Per-Share Data | | | | | | | | | | | | | | | | |
| Net asset value, beginning of period | | $ 13.80 | | $ 13.29 | | $ | | 9.71 | | $ | | 11.58 | | $ | | 12.98 |
| Income from Investment Operations | | | | | | | | | | | | | | | | |
| Net investment income (loss)C | | (.02) | | (.14) | | | | (.25) | | | | (.20) | | | | (.17) |
| Net realized and unrealized gain (loss) | | 3.55 | | .64 | | | | 3.83 | | | | (1.68) | | | | (1.25) |
| Total from investment operations | | 3.53 | | .50 | | | | 3.58 | | | | (1.88) | | | | (1.42) |
| Redemption fees added to paid in capitalC | | 02 | | .01 | | | | —F | | | | .01 | | | | .02 |
| Net asset value, end of period | | $ 17.35 | | $ 13.80 | | $ | | 13.29 | | $ | | 9.71 | | $ | | 11.58 |
| Total ReturnA,B | | 25.72% | | 3.84% | | | | 36.87% | | | | (16.15)% | | | | (10.79)% |
| Ratios to Average Net AssetsD | | | | | | | | | | | | | | | | |
| Expenses before reductions | | 1.40% | | 1.87% | | | | 2.57% | | | | 2.64% | | | | 2.00% |
| Expenses net of fee waivers, if any | | 1.25% | | 1.83% | | | | 2.50% | | | | 2.50% | | | | 2.00% |
| Expenses net of all reductions | | 1.16% | | 1.74% | | | | 2.50% | | | | 2.45% | | | | 1.98% |
| Net investment income (loss) | | (.14)% | | (1.06)% | | | | (2.12)% | | | | (1.92)% | | | | (1.32)% |
| Supplemental Data | | | | | | | | | | | | | | | | |
| Net assets, end of period (000 omitted) | | $ 55,397 | | $ 12,005 | | $ | | 12,269 | | $ | | 9,987 | | $ | | 12,471 |
| Portfolio turnover rate | | 166% | | 220% | | | | 90% | | | | 67% | | | | 109% |
ATotal returns would have been lower had certain expenses not been reduced during the periods shown. BTotal returns do not include the effect of the former sales charges. CCalculated based on average shares outstanding during the period. DExpense ratios reflect operating expenses of the fund. Expenses before reductions do not reflect amounts reimbursed by the investment adviser or reductions from brokerage service arrangements or other expense offset arrangements and do not represent the amount paid by the fund during periods when reimbursements or reductions occur. Expenses net of fee waivers reflect expenses after reimbursement by the investment adviser but prior to reductions from brokerage service arrangements or other expense offset arrangements. Expenses net of all reductions represent the net expenses paid by the fund. EFor the year ended February 29. FAmount represents less than $.01 per share.
See accompanying notes which are an integral part of the financial statements.
|
Industrial Equipment Portfolio
Performance
Average annual total return reflects the change in the value of an investment, assuming reinvestment of the fund’s dividend income and capital gains (the profits earned upon the sale of securities that have grown in value) and assuming a constant rate of performance each year. The $10,000 table and the fund’s returns do not reflect the deduction of taxes that a shareholder would pay on fund distributions or the redemption of fund shares. During periods of reimbursement by Fidelity a fund’s total returns will be greater than it would be had the reimbursement not occurred. How a fund did yesterday is no guarantee of how it will do tomorrow.
| Average Annual Total Returns | | | | | | |
| Periods ended February 28, 2006 | | Past 1 | | Past 5 | | Past 10 |
| | | year | | years | | years |
| Select Industrial Equipment | | 16.17% | | 8.39% | | 9.45% |
$10,000 Over 10 Years
Let’s say hypothetically that $10,000 was invested in Fidelity Select Industrial Equipment Portfolio on February 29, 1996. The chart shows how the value of your investment would have changed, and also shows how the S&P 500 Index performed over the same period.
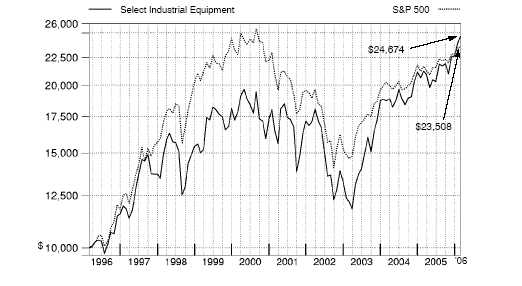
Annual Report 74
Industrial Equipment Portfolio
|
Management’s Discussion of Fund Performance
Comments from Christopher Bartel, Portfolio Manager of Fidelity® Select Industrial Equipment Portfolio
With the exception of several popular large-cap stock performance measures, most major U.S. equity benchmarks had double-digit returns for the year ending February 28, 2006. For much of the period, market gains were driven largely by the energy sector, although utilities ultimately sneaked into the top spot for the year overall. Financials and telecommunication services also reached double figures, outperforming the 8.40% return of the broader market as measured by the large-cap-oriented Standard & Poor’s 500SM Index. The consumer discretionary segment — home to the weak performing automobile and media industries — was the biggest disappointment. Although the overall return for the S&P 500® beat the small-cap Russell 2000® Index in calendar year 2005 — the first time that’s happened in six years — small-caps stormed back in early 2006, leading to a 16.59% advance during the past 12 months, nearly twice the broader market’s gain. Mid-caps soared even higher, returning 17.67% according to the Russell Midcap® Index. The technology-heavy NASDAQ Composite® Index also fared well, climbing 12.13%, but the Dow Jones Industrial AverageSM, an index of 30 large-cap, blue-chip stocks, managed to rise only 4.52% .
During the past year, the fund returned 16.17%, beating the S&P 500 and the 9.59% gain of the Goldman Sachs® Cyclical Industries Index. Relative to its sector index, the fund was aided by a sizable overweighting in the strong performing construction and farm machinery group, together with solid stock picking in industrial machinery, a lack of exposure to the lagging diversified chemicals group, and an overweighting and good stock selection in trading companies and distributors. Caterpillar was the fund’s top contributor, aided by strong demand for heavy equipment in the mining industry. Also helping was oil and gas equipment/services provider Halliburton, which benefited from increased energy exploration and robust demand for parts and service at refineries. WESCO International, an electrical products distributor, helped performance as well. On the negative side, a lack of exposure to railroads hurt performance, along with unfavorable picks in industrial conglomerates and in the aerospace and defense group. Industrial conglomerate Tyco International was the fund’s biggest detractor, hurt by a rough patch in its restructuring efforts and the announcement of its intention to split into three separate companies. Also holding back performance was Symbol Technologies, a provider of wireless bar code scanners and related products.
The views expressed above reflect those of the portfolio manager(s) only through the end of the period as stated on the cover of this report and do not necessarily represent the views of Fidelity or any other person in the Fidelity organization. Any such views are subject to change at any time based upon market or other conditions and Fidelity disclaims any responsibility to update such views. These views may not be relied on as investment advice and, because investment decisions for a Fidelity fund are based on numerous factors, may not be relied on as an indication of trading intent on behalf of any Fidelity fund.
75 75 Annual Report
Industrial Equipment Portfolio
Investment Changes
Top Ten Stocks as of February 28, 2006
| | | % of fund’s | | % of fund’s net assets |
| | | net assets | | 6 months ago |
| Honeywell International, Inc. | | 7.0 | | 9.2 |
| General Electric Co. | | 6.8 | | 5.8 |
| Tyco International Ltd. | | 6.3 | | 8.9 |
| Caterpillar, Inc. | | 5.3 | | 5.2 |
| Halliburton Co. | | 4.8 | | 4.1 |
| Applied Materials, Inc. | | 4.1 | | 5.6 |
| Deere & Co. | | 3.2 | | 2.5 |
| Danaher Corp. | | 3.1 | | 3.2 |
| Dover Corp. | | 2.6 | | 3.1 |
| WESCO International, Inc. | | 2.3 | | 1.0 |
| | | 45.5 | | |
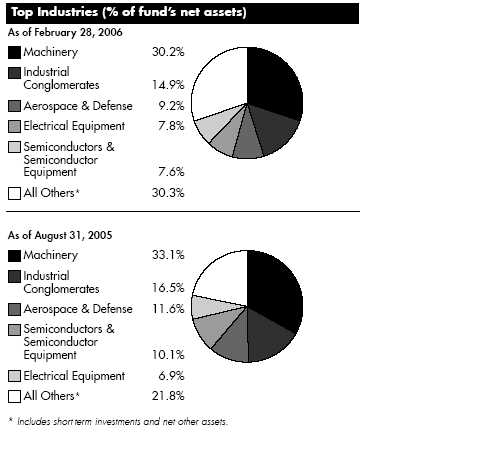
| Industrial Equipment Portfolio | | | | | | | | |
| Investments February 28, 2006 | | | | | | | | |
| Showing Percentage of Net Assets | | | | | | | | |
| |
| Common Stocks — 92.9% | | | | | | | | |
| | | | | | | Shares | | Value (Note 1) |
| |
| AEROSPACE & DEFENSE – 9.2% | | | | | | | | |
| Aerospace & Defense – 9.2% | | | | | | | | |
| Bombardier, Inc. Class B (sub. vtg.) (a) | | | | | | 79,600 | | $ 204,579 |
| Honeywell International, Inc. | | | | | | 128,300 | | 5,253,884 |
| Precision Castparts Corp. | | | | | | 26,500 | | 1,405,560 |
| | | | | | | | | 6,864,023 |
| |
| AUTO COMPONENTS – 0.5% | | | | | | | | |
| Auto Parts & Equipment – 0.5% | | | | | | | | |
| Johnson Controls, Inc. | | | | | | 5,400 | | 384,858 |
| BUILDING PRODUCTS – 2.1% | | | | | | | | |
| Building Products – 2.1% | | | | | | | | |
| American Standard Companies, Inc. | | | | | | 37,800 | | 1,496,124 |
| Trex Co., Inc. (a)(d) | | | | | | 3,500 | | 90,965 |
| | | | | | | | | 1,587,089 |
| |
| COMMERCIAL SERVICES & SUPPLIES – 0.6% | | | | | | | | |
| Office Services & Supplies – 0.6% | | | | | | | | |
| IKON Office Solutions, Inc. | | | | | | 32,900 | | 432,635 |
| COMPUTERS & PERIPHERALS – 0.5% | | | | | | | | |
| Computer Storage & Peripherals – 0.5% | | | | | | | | |
| EMC Corp. (a) | | | | | | 24,400 | | 342,088 |
| CONSTRUCTION & ENGINEERING – 2.6% | | | | | | | | |
| Construction & Engineering – 2.6% | | | | | | | | |
| EMCOR Group, Inc. (a) | | | | | | 23,600 | | 1,028,724 |
| SNC-Lavalin Group, Inc. | | | | | | 5,000 | | 416,450 |
| URS Corp. (a) | | | | | | 12,200 | | 531,798 |
| | | | | | | | | 1,976,972 |
| |
| ELECTRICAL EQUIPMENT – 7.8% | | | | | | | | |
| Electrical Components & Equipment – 7.8% | | | | | | | | |
| A.O. Smith Corp. | | | | | | 7,000 | | 324,100 |
| American Power Conversion Corp. | | | | | | 14,700 | | 300,321 |
| AMETEK, Inc. | | | | | | 8,100 | | 347,004 |
| Cooper Industries Ltd. Class A | | | | | | 11,700 | | 979,290 |
| Emerson Electric Co. | | | | | | 18,800 | | 1,538,028 |
| Hubbell, Inc. Class B | | | | | | 7,600 | | 353,172 |
| Rockwell Automation, Inc. | | | | | | 22,400 | | 1,527,008 |
| Roper Industries, Inc. | | | | | | 9,900 | | 446,193 |
| | | | | | | | | 5,815,116 |
| |
| ELECTRONIC EQUIPMENT & INSTRUMENTS – 3.5% | | | | | | | | |
| Electronic Equipment & Instruments – 2.9% | | | | | | | | |
| Cognex Corp. | | | | | | 3,100 | | 85,281 |
| Napco Security Systems, Inc. (a) | | | | | | 23,850 | | 362,759 |
| Newport Corp. (a) | | | | | | 22,700 | | 402,698 |
| Symbol Technologies, Inc. | | | | | | 113,900 | | 1,323,518 |
| | | | | | | | | 2,174,256 |
See accompanying notes which are an integral part of the financial statements.
|
77 Annual Report
77
| Industrial Equipment Portfolio | | | | |
| Investments - continued | | | | |
| |
| |
| |
| | | Shares | | Value (Note 1) |
| Electronic Manufacturing Services – 0.6% | | | | |
| Molex, Inc. | | 13,700 | | $ 436,071 |
| |
| TOTAL ELECTRONIC EQUIPMENT & INSTRUMENTS | | | | 2,610,327 |
| |
| ENERGY EQUIPMENT & SERVICES – 4.8% | | | | |
| Oil & Gas Equipment & Services – 4.8% | | | | |
| Halliburton Co. | | 53,200 | | 3,617,600 |
| HOUSEHOLD DURABLES – 0.5% | | | | |
| Household Appliances – 0.5% | | | | |
| Blount International, Inc. (a) | | 20,600 | | 336,604 |
| INDUSTRIAL CONGLOMERATES – 14.9% | | | | |
| Industrial Conglomerates – 14.9% | | | | |
| General Electric Co. | | 154,450 | | 5,076,772 |
| Siemens AG sponsored ADR | | 4,200 | | 386,316 |
| Textron, Inc. | | 11,300 | | 995,643 |
| Tyco International Ltd. | | 182,800 | | 4,714,412 |
| | | | | 11,173,143 |
| |
| MACHINERY – 30.2% | | | | |
| Construction & Farm Machinery & Heavy Trucks – 14.5% | | | | |
| AGCO Corp. (a) | | 11,400 | | 222,870 |
| American Railcar Industries, Inc. | | 100 | | 3,360 |
| Astec Industries, Inc. (a) | | 10,900 | | 391,528 |
| Bucyrus International, Inc. Class A | | 8,400 | | 529,032 |
| Caterpillar, Inc. | | 54,400 | | 3,975,552 |
| Cummins, Inc. | | 4,900 | | 530,572 |
| Deere & Co. | | 31,725 | | 2,419,666 |
| Manitowoc Co., Inc. | | 14,000 | | 1,078,980 |
| Navistar International Corp. (a) | | 37,300 | | 1,094,755 |
| Toro Co. | | 8,100 | | 373,653 |
| Wabash National Corp | | 10,100 | | 201,697 |
| | | | | 10,821,665 |
| Industrial Machinery – 15.7% | | | | |
| Actuant Corp. Class A | | 13,400 | | 738,340 |
| Albany International Corp. Class A | | 3,000 | | 111,510 |
| Crane Co. | | 1,300 | | 50,037 |
| Danaher Corp. | | 38,100 | | 2,308,098 |
| Donaldson Co., Inc. | | 10,700 | | 370,862 |
| Dover Corp. | | 39,800 | | 1,908,012 |
| Harsco Corp. | | 8,500 | | 678,130 |
| IDEX Corp. | | 5,100 | | 240,975 |
| Ingersoll-Rand Co. Ltd. Class A | | 20,400 | | 837,012 |
| ITT Industries, Inc. | | 28,800 | | 1,512,000 |
| KCI Konecranes Oyj | | 150 | | 9,441 |
| Pentair, Inc. | | 12,300 | | 493,845 |
| Schindler Holding AG | | 1,656 | | 785,115 |
| SPX Corp. | | 13,100 | | 645,175 |
See accompanying notes which are an integral part of the financial statements.
Annual Report 78
| Common Stocks – continued | | | | |
| | | Shares | | Value (Note 1) |
| |
| MACHINERY – CONTINUED | | | | |
| Industrial Machinery – continued | | | | |
| Stewart & Stevenson Services, Inc. | | 13,500 | | $ 465,075 |
| Watts Water Technologies, Inc. Class A | | 17,000 | | 608,260 |
| | | | | 11,761,887 |
| |
| TOTAL MACHINERY | | | | 22,583,552 |
| |
| OFFICE ELECTRONICS – 2.6% | | | | |
| Office Electronics – 2.6% | | | | |
| Xerox Corp. (a) | | 95,300 | | 1,419,970 |
| Zebra Technologies Corp. Class A (a) | | 12,200 | | 538,508 |
| | | | | 1,958,478 |
| |
| SEMICONDUCTORS & SEMICONDUCTOR EQUIPMENT – 7.6% | | | | |
| Semiconductor Equipment – 7.6% | | | | |
| Applied Materials, Inc. | | 167,700 | | 3,075,618 |
| Cascade Microtech, Inc. (a) | | 3,700 | | 48,396 |
| FormFactor, Inc. (a) | | 5,400 | | 198,936 |
| KLA-Tencor Corp. | | 19,900 | | 1,039,377 |
| Lam Research Corp. (a) | | 15,200 | | 655,120 |
| Teradyne, Inc. (a) | | 38,900 | | 653,131 |
| | | | | 5,670,578 |
| |
| TRADING COMPANIES & DISTRIBUTORS – 5.5% | | | | |
| Trading Companies & Distributors – 5.5% | | | | |
| Fastenal Co. | | 19,400 | | 851,854 |
| Finning International, Inc. | | 1,600 | | 52,824 |
| H&E Equipment Services, Inc. | | 200 | | 5,018 |
| Interline Brands, Inc. (a) | | 20,300 | | 471,975 |
| W.W. Grainger, Inc. | | 10,500 | | 777,420 |
| |
| |
| | | Shares | | Value (Note 1) |
| Watsco, Inc. | | 2,700 | | $ 187,974 |
| WESCO International, Inc. (a) | | 30,500 | | 1,748,260 |
| | | | | 4,095,325 |
| |
| TOTAL COMMON STOCKS | | | | |
| (Cost $56,135,285) | | | | 69,448,388 |
| |
| Money Market Funds — 5.0% | | | | |
| |
| Fidelity Cash Central Fund, 4.57% (b) | | 3,721,176 | | 3,721,176 |
| Fidelity Securities Lending Cash Central Fund, 4.58% (b)(c) | | 37,800 | | 37,800 |
| TOTAL MONEY MARKET FUNDS | | | | |
| (Cost $3,758,976) | | | | 3,758,976 |
| |
| TOTAL INVESTMENT PORTFOLIO - 97.9% | | | | |
| (Cost $59,894,261) | | | | 73,207,364 |
| |
| NET OTHER ASSETS – 2.1% | | | | 1,562,708 |
| NET ASSETS – 100% | | | | $ 74,770,072 |
79
See accompanying notes which are an integral part of the financial statements.
79 Annual Report
Industrial Equipment Portfolio
Investments - continued
|
(a) Non-income producing
(b) Affiliated fund that is available only to investment companies and other accounts managed by Fidelity Investments. The rate quoted is the annualized seven-day yield of the fund at period end. A complete unaudited listing of the fund’s holdings as of its most recent quarter end is available upon request.
(c) Investment made with cash collateral received from securities on loan. (d) Security or a portion of the security is on loan at period end.
Information regarding fiscal year to date income earned by the fund from the affiliated Central funds is as follows:
| Fund | | Income earned |
| Fidelity Cash Central Fund | | $ 45,162 |
| Fidelity Securities Lending Cash Central Fund | | 6,208 |
| Total | | $ 51,370 |
See accompanying notes which are an integral part of the financial statements.
|
| Industrial Equipment Portfolio | | | | | | | | |
| |
| Financial Statements | | | | | | | | |
| |
| |
| Statement of Assets and Liabilities | | | | | | | | |
| | | | | | | | | February 28, 2006 |
| |
| Assets | | | | | | | | |
| Investment in securities, at value (including securities loaned of $36,386) — See accompanying schedule: | | | | | | | | |
| Unaffiliated issuers (cost $56,135,285) | | $ | | 69,448,388 | | | | |
| Affiliated Central Funds (cost $3,758,976) | | | | 3,758,976 | | | | |
| Total Investments (cost $59,894,261) | | | | | | $ | | 73,207,364 |
| Receivable for fund shares sold | | | | | | | | 1,611,956 |
| Dividends receivable | | | | | | | | 126,813 |
| Interest receivable | | | | | | | | 9,820 |
| Prepaid expenses | | | | | | | | 168 |
| Other affiliated receivables | | | | | | | | 44 |
| Other receivables | | | | | | | | 1,022 |
| Total assets | | | | | | | | 74,957,187 |
| |
| Liabilities | | | | | | | | |
| Payable for investments purchased | | $ | | 9,275 | | | | |
| Payable for fund shares redeemed | | | | 69,196 | | | | |
| Accrued management fee | | | | 30,040 | | | | |
| Transfer agent fee payable | | | | 11,582 | | | | |
| Other affiliated payables | | | | 2,659 | | | | |
| Other payables and accrued expenses | | | | 26,563 | | | | |
| Collateral on securities loaned, at value | | | | 37,800 | | | | |
| Total liabilities | | | | | | | | 187,115 |
| |
| Net Assets | | | | | | $ | | 74,770,072 |
| Net Assets consist of: | | | | | | | | |
| Paid in capital | | | | | | $ | | 60,512,448 |
| Undistributed net investment income | | | | | | | | 88,453 |
| Accumulated undistributed net realized gain (loss) on investments and foreign currency transactions | | | | | | | | 856,076 |
| Net unrealized appreciation (depreciation) on investments and assets and liabilities in foreign currencies | | | | | | | | 13,313,095 |
| Net Assets, for 2,564,952 shares outstanding | | | | | | $ | | 74,770,072 |
| Net Asset Value, offering price and redemption price per share ($74,770,072 ÷ 2,564,952 shares) | | | | | | $ | | 29.15 |
| |
| Statement of Operations | | | | | | | | |
| | | | | | | | | Year ended February 28, 2006 |
| |
| Investment Income | | | | | | | | |
| Dividends | | | | | | $ | | 552,526 |
| Interest | | | | | | | | 107 |
| Income from affiliated Central Funds (including $6,208 from security lending) | | | | | | | | 51,370 |
| Total income | | | | | | | | 604,003 |
| |
| Expenses | | | | | | | | |
| Management fee | | $ | | 267,740 | | | | |
| Transfer agent fees | | | | 128,739 | | | | |
| Accounting and security lending fees | | | | | | | | |
| | | | | 23,957 | | | | |
| Independent trustees’ compensation | | | | 195 | | | | |
| Custodian fees and expenses | | | | 8,791 | | | | |
| Registration fees | | | | 16,420 | | | | |
| Audit | | | | 33,801 | | | | |
| Legal | | | | 265 | | | | |
| Miscellaneous | | | | 2,479 | | | | |
| Total expenses before reductions | | | | 482,387 | | | | |
| Expense reductions | | | | (4,262) | | | | 478,125 |
| |
| Net investment income (loss) | | | | | | | | 125,878 |
| Realized and Unrealized Gain (Loss) | | | | | | | | |
| Net realized gain (loss) on: | | | | | | | | |
See accompanying notes which are an integral part of the financial statements.
|
81 Annual Report
| Industrial Equipment Portfolio | | | | |
| Financial Statements - continued | | | | |
| |
| |
| Investment securities: | | | | |
| Unaffiliated issuers | | 3,137,910 | | |
| Foreign currency transactions | | (488) | | |
| Total net realized gain (loss) | | | | 3,137,422 |
| Change in net unrealized appreciation (depreciation) on: | | | | |
| Investment securities | | 3,947,928 | | |
| Assets and liabilities in foreign currencies | | (8) | | |
| Total change in net unrealized appreciation (depreciation) | | | | 3,947,920 |
| Net gain (loss) | | | | 7,085,342 |
| Net increase (decrease) in net assets resulting from operations | | $ | | 7,211,220 |
See accompanying notes which are an integral part of the financial statements.
Annual Report 82
| Statement of Changes in Net Assets | | | | | | | | | | | | | | | | |
| | | | | | | | | | | Year ended | | Year ended |
| | | | | | | | | | | February 28, | | February 28, |
| | | | | | | | | | | 2006 | | 2005 |
| Increase (Decrease) in Net Assets | | | | | | | | | | | | | | | | |
| Operations | | | | | | | | | | | | | | | | |
| Net investment income (loss) | | | | | | | | | | $ | | 125,878 | | $ | | (79,910) |
| Net realized gain (loss) | | | | | | | | | | | | 3,137,422 | | | | 3,085,331 |
| Change in net unrealized appreciation (depreciation) | | | | | | | | | | | | 3,947,920 | | | | 1,721,913 |
| Net increase (decrease) in net assets resulting from operations | | | | | | | | | | | | 7,211,220 | | | | 4,727,334 |
| Distributions to shareholders from net investment income | | | | | | | | | | | | (36,844) | | | | — |
| Distributions to shareholders from net realized gain | | | | | | | | | | | | (3,199,441) | | | | (1,909,931) |
| Total distributions | | | | | | | | | | | | (3,236,285) | | | | (1,909,931) |
| Share transactions | | | | | | | | | | | | | | | | |
| Proceeds from sales of shares | | | | | | | | | | | | 46,137,172 | | | | 34,460,298 |
| Reinvestment of distributions | | | | | | | | | | | | 3,125,450 | | | | 1,826,457 |
| Cost of shares redeemed | | | | | | | | | | | | (24,786,422) | | | | (59,200,952) |
| Net increase (decrease) in net assets resulting from share transactions | | | | | | | | 24,476,200 | | | | (22,914,197) |
| Redemption fees | | | | | | | | | | | | 13,961 | | | | 18,579 |
| Total increase (decrease) in net assets | | | | | | | | | | | | 28,465,096 | | | | (20,078,215) |
| |
| Net Assets | | | | | | | | | | | | | | | | |
| Beginning of period | | | | | | | | | | | | 46,304,976 | | | | 66,383,191 |
| End of period (including undistributed net investment income of $88,453 and accumulated net investment loss of $22, | | | | | | | | |
| respectively) | | | | | | | | | | $ | | 74,770,072 | | $ | | 46,304,976 |
| |
| Other Information | | | | | | | | | | | | | | | | |
| Shares | | | | | | | | | | | | | | | | |
| Sold | | | | | | | | | | | | 1,655,158 | | | | 1,377,884 |
| Issued in reinvestment of distributions | | | | | | | | | | | | 119,637 | | | | 71,580 |
| Redeemed | | | | | | | | | | | | (934,451) | | | | (2,422,974) |
| Net increase (decrease) | | | | | | | | | | | | 840,344 | | | | (973,510) |
| |
| Financial Highlights | | | | | | | | | | | | | | | | |
| Years ended February 28, | | 2006 | | 2005 | | 2004E | | | | 2003 | | | | 2002 |
| Selected Per-Share Data | | | | | | | | | | | | | | | | |
| Net asset value, beginning of period | | $ | | 26.85 | | $ 24.60 | | $ 16.00 | | $ | | 22.54 | | $ | | 21.69 |
| Income from Investment Operations | | | | | | | | | | | | | | | | |
| Net investment income (loss)C | | | | 07 | | (.04) | | (.02) | | | | (.12) | | | | (.03) |
| Net realized and unrealized gain (loss) | | | | 4.02 | | 3.26 | | 8.59 | | | | (6.43) | | | | .88 |
| Total from investment operations | | | | 4.09 | | 3.22 | | 8.57 | | | | (6.55) | | | | .85 |
| Distributions from net investment income | | | | (.02) | | — | | — | | | | — | | | | — |
| Distributions from net realized gain | | | | (1.78) | | (.98) | | — | | | | — | | | | (.03) |
| Total distributions | | | | (1.80) | | (.98) | | — | | | | — | | | | (.03) |
| Redemption fees added to paid in capitalC | | | | 01 | | .01 | | .03 | | | | .01 | | | | .03 |
| Net asset value, end of period | | $ | | 29.15 | | $ 26.85 | | $ 24.60 | | $ | | 16.00 | | $ | | 22.54 |
| Total ReturnA,B | | | | 16.17% | | 13.37% | | 53.75% | | | | (29.02)% | | | | 4.07% |
| Ratios to Average Net AssetsD | | | | | | | | | | | | | | | | |
| Expenses before reductions | | | | 1.03% | | 1.07% | | 1.37% | | | | 1.77% | | | | 1.46% |
| Expenses net of fee waivers, if any | | | | 1.03% | | 1.07% | | 1.37% | | | | 1.77% | | | | 1.46% |
| Expenses net of all reductions | | | | 1.02% | | 1.06% | | 1.33% | | | | 1.76% | | | | 1.45% |
| Net investment income (loss) | | | | 27% | | (.17)% | | (.08)% | | | | (.62)% | | | | (.16)% |
| Supplemental Data | | | | | | | | | | | | | | | | |
| Net assets, end of period (000 omitted) | | $ 74,770 | | $ 46,305 | | $ 66,383 | | $ | | 17,459 | | $ | | 24,775 |
| Portfolio turnover rate | | | | 40% | | 51% | | 95% | | | | 123% | | | | 131% |
| |
| | | |
A Total returns would have been lower had certain expenses not been reduced during the periods shown. B Total returns do not include the effect of the former sales charges. C Calculated based on average shares outstanding during the period. DExpense ratios reflect operating expenses of the fund. Expenses before reductions do not reflect amounts reimbursed by the investment adviser or reductions from brokerage service arrangements or other expense offset arrangements and do not represent the amount paid by the fund during periods when reimbursements or reductions occur. Expenses net of fee waivers reflect expenses after reimbursement by the investment adviser but prior to reductions from brokerage service arrangements or other expense offset arrangements. Expenses net of all reductions represent the net expenses paid by the fund. EFor the year ended February 29.See accompanying notes which are an integral part of the financial statements.
83
Industrial Materials Portfolio
Performance
|
Average annual total return reflects the change in the value of an investment, assuming reinvestment of the fund’s dividend income and capital gains (the profits earned upon the sale of securities that have grown in value) and assuming a constant rate of performance each year. The $10,000 table and the fund’s returns do not reflect the deduction of taxes that a shareholder would pay on fund distributions or the redemption of fund shares. During periods of reimbursement by Fidelity a fund’s total returns will be greater than it would be had the reimbursement not occurred. How a fund did yesterday is no guarantee of how it will do tomorrow.
| Average Annual Total Returns | | | | | | |
| Periods ended February 28, 2006 | | Past 1 | | Past 5 | | Past 10 |
| | | year | | years | | years |
| Select Industrial Materials | | 17.01% | | 16.92% | | 9.34% |
$10,000 Over 10 Years
Let’s say hypothetically that $10,000 was invested in Fidelity Select Industrial Materials Portfolio on February 29, 1996. The chart shows how the value of your investment would have changed, and also shows how the S&P 500 Index performed over the same period.
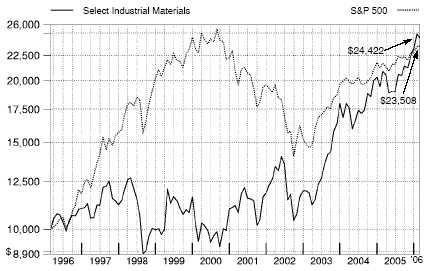
Industrial Materials Portfolio
|
Management’s Discussion of Fund Performance
Comments from Jody Simes, Portfolio Manager of Fidelity® Select Industrial Materials Portfolio
With the exception of several popular large-cap stock performance measures, most major U.S. equity benchmarks had double-digit returns for the year ending February 28, 2006. For much of the period, market gains were driven largely by the energy sector, although utilities ultimately sneaked into the top spot for the year overall. Financials and telecommunication services also reached double figures, outperforming the 8.40% return of the broader market as measured by the large-cap-oriented Standard & Poor’s 500SM Index. The consumer discretionary segment — home to the weak performing automobile and media industries — was the biggest disappointment. Although the overall return for the S&P 500® beat the small-cap Russell 2000® Index in calendar year 2005 — the first time that’s happened in six years — small-caps stormed back in early 2006, leading to a 16.59% advance during the past 12 months, nearly twice the broader market’s gain. Mid-caps soared even higher, returning 17.67% according to the Russell Midcap® Index. The technology-heavy NASDAQ Composite® Index also fared well, climbing 12.13%, but the Dow Jones Industrial AverageSM, an index of 30 large-cap, blue-chip stocks, managed to rise only 4.52% .
For the 12 months ending February 28, 2006, the fund returned 17.01%, outperforming the Goldman Sachs® Cyclical Industries Index, which returned 9.59%, and the S&P 500. The main catalyst for outperformance of the sector benchmark was an overweighting in railroads, one of the top performing segments of the index. Other gains came from security selection in the coal and consumable fuels group, as well as in the diversified metals and mining area; the latter group was not part of the index. I added to investments in these three industries. The fund also benefited from its overweighting in Canada, because the Canadian dollar appreciated versus the U.S. dollar. Not owning defense and aerospace stocks hurt the fund’s relative performance, as did overweighting diversified chemicals, an area where I reduced investments. The top three performers were not part of the Goldman Sachs index: Canadian mining company Falconbridge, Saskatchewan-based uranium producer Cameco, and Peru Copper. Oveweightings in railroads Burlington Northern Santa Fe, Canadian National Railway and Norfolk Southern also buoyed performance, as did not owning conglomerate Tyco International. The fund’s large holding in out-of-benchmark aluminum producer Alcoa was the main detractor. Other disappointments were diversified chemical manufacturers DuPont and Dow Chemical. Fund performance also was held back by not owning machinery company Caterpillar, which was among the index’s top performers.
The views expressed above reflect those of the portfolio manager(s) only through the end of the period as stated on the cover of this report and do not necessarily represent the views of Fidelity or any other person in the Fidelity organization. Any such views are subject to change at any time based upon market or other conditions and Fidelity disclaims any responsibility to update such views. These views may not be relied on as investment advice and, because investment decisions for a Fidelity fund are based on numerous factors, may not be relied on as an indication of trading intent on behalf of any Fidelity fund.
85 85 Annual Report
Industrial Materials Portfolio
Investment Changes
Top Ten Stocks as of February 28, 2006
| | | % of fund’s | | % of fund’s net assets |
| | | net assets | | 6 months ago |
| Alcoa, Inc. | | 6.6 | | 6.1 |
| Burlington Northern Santa Fe | | | | |
| Corp. | | 5.9 | | 5.3 |
| Newmont Mining Corp. | | 5.1 | | 0.0 |
| Canadian National Railway Co. | | 4.6 | | 4.4 |
| Falconbridge Ltd. | | 4.5 | | 4.0 |
| Norfolk Southern Corp. | | 4.4 | | 4.1 |
| Praxair, Inc. | | 3.9 | | 4.3 |
| E.I. du Pont de Nemours & Co. | | 3.6 | | 5.9 |
| Air Products & Chemicals, Inc. | | 3.5 | | 3.6 |
| Union Pacific Corp. | | 3.3 | | 3.4 |
| | | 45.4 | | |
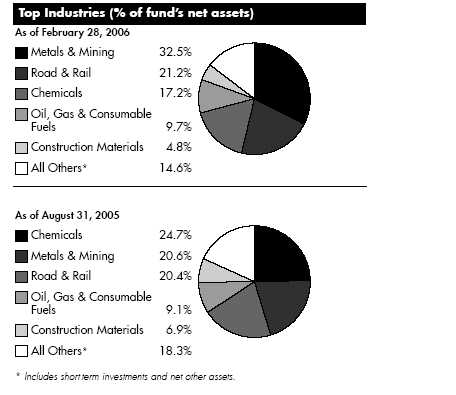
| Industrial Materials Portfolio | | | | | | |
| Investments February 28, 2006 | | | | |
| Showing Percentage of Net Assets | | | | | | |
| |
| Common Stocks — 95.6% | | | | | | |
| | | | | Shares | | Value (Note 1) |
| |
| BUILDING PRODUCTS – 3.2% | | | | | | |
| Building Products – 3.2% | | | | | | |
| American Standard Companies, Inc. | | | | 52,300 | | $ 2,070,034 |
| Masco Corp. (d) | | | | 110,000 | | 3,430,900 |
| | | | | | | 5,500,934 |
| |
| CHEMICALS – 17.2% | | | | | | |
| Diversified Chemicals – 4.8% | | | | | | |
| E.I. du Pont de Nemours & Co. (d) | | | | 151,700 | | 6,104,408 |
| Eastman Chemical Co. | | | | 40,000 | | 1,973,200 |
| | | | | | | 8,077,608 |
| Industrial Gases – 9.0% | | | | | | |
| Air Products & Chemicals, Inc. | | | | 91,800 | | 5,889,888 |
| Airgas, Inc. | | | | 76,800 | | 2,794,752 |
| Praxair, Inc. (d) | | | | 122,100 | | 6,590,958 |
| | | | | | | 15,275,598 |
| Specialty Chemicals – 3.4% | | | | | | |
| Albemarle Corp. | | | | 75,000 | | 3,183,750 |
| Chemtura Corp. | | | | 73,200 | | 811,056 |
| Cytec Industries, Inc. | | | | 32,400 | | 1,728,216 |
| | | | | | | 5,723,022 |
| |
| TOTAL CHEMICALS | | | | | | 29,076,228 |
| |
| CONSTRUCTION MATERIALS – 4.8% | | | | | | |
| Construction Materials – 4.8% | | | | | | |
| Florida Rock Industries, Inc. | | | | 15,000 | | 864,150 |
| Lafarge North America, Inc. | | | | 4 | | 331 |
| Martin Marietta Materials, Inc. | | | | 25,000 | | 2,437,500 |
| Polaris Minerals Corp. (e) | | | | 1,000,000 | | 4,048,761 |
| Vulcan Materials Co. | | | | 10,000 | | 790,000 |
| | | | | | | 8,140,742 |
| |
| CONTAINERS & PACKAGING – 2.3% | | | | | | |
| Metal & Glass Containers – 1.8% | | | | | | |
| Ball Corp. | | | | 40,000 | | 1,704,000 |
| Pactiv Corp. (a) | | | | 60,000 | | 1,375,800 |
| | | | | | | 3,079,800 |
| Paper Packaging – 0.5% | | | | | | |
| Smurfit-Stone Container Corp. (a) | | | | 62,800 | | 823,936 |
| TOTAL CONTAINERS & PACKAGING | | | | | | 3,903,736 |
| |
| INDUSTRIAL CONGLOMERATES – 2.6% | | | | | | |
| Industrial Conglomerates – 2.6% | | | | | | |
| 3M Co. | | | | 60,000 | | 4,415,400 |
| MACHINERY – 0.7% | | | | | | |
| Construction & Farm Machinery & Heavy Trucks – 0.7% | | | | | | |
| Bucyrus International, Inc. Class A | | | | 18,000 | | 1,133,640 |
| MARINE – 0.0% | | | | | | |
| Marine – 0.0% | | | | | | |
| Odfjell ASA (A Shares) | | | | 50 | | 897 |
| See accompanying notes which are an integral part of the financial statements. | | | | |
87 Annual Report
87
| Industrial Materials Portfolio | | | | |
| Investments - continued | | | | |
| |
| |
| |
| | | Shares | | Value (Note 1) |
| |
| METALS & MINING – 32.5% | | | | |
| Aluminum – 6.6% | | | | |
| Alcoa, Inc. | | 383,998 | | $ 11,258,819 |
| Novelis, Inc. | | 40 | | 731 |
| | | | | 11,259,550 |
| Diversified Metals & Mining – 16.4% | | | | |
| BHP Billiton Ltd. sponsored ADR | | 55,800 | | 2,013,822 |
| Birch Mountain Resources Ltd. (a) | | 500,000 | | 3,366,633 |
| Coalcorp Mining, Inc. (a) | | 7,170,500 | | 3,786,736 |
| Coalcorp Mining, Inc. warrants 2/8/11 (a) | | 89,000 | | 15,667 |
| Falconbridge Ltd. (d) | | 232,664 | | 7,525,769 |
| FNX Mining Co., Inc. (a) | | 68,000 | | 802,007 |
| Inmet Mining Corp. | | 32,000 | | 892,840 |
| Peru Copper, Inc. (a) | | 1,287,000 | | 4,100,638 |
| Phelps Dodge Corp. | | 5,200 | | 717,600 |
| Rio Tinto PLC sponsored ADR | | 20,900 | | 3,942,576 |
| Teck Cominco Ltd. Class B (sub. vtg.) | | 10,000 | | 625,358 |
| | | | | 27,789,646 |
| Gold – 6.0% | | | | |
| Cambior, Inc. (a) | | 500,000 | | 1,487,480 |
| Newmont Mining Corp. | | 164,200 | | 8,689,464 |
| Sasamat Capital Corp. (a) | | 3,261 | | 7,500 |
| | | | | 10,184,444 |
| Precious Metals & Minerals – 1.4% | | | | |
| Aber Diamond Corp. | | 30,000 | | 1,132,773 |
| Aquarius Platinum Ltd. (Australia) | | 100,000 | | 1,146,343 |
| | | | | 2,279,116 |
| Steel – 2.1% | | | | |
| IPSCO, Inc. | | 14,000 | | 1,349,294 |
| United States Steel Corp. (d) | | 40,000 | | 2,180,000 |
| | | | | 3,529,294 |
| |
| TOTAL METALS & MINING | | | | 55,042,050 |
| |
| OIL, GAS & CONSUMABLE FUELS – 9.7% | | | | |
| Coal & Consumable Fuels – 9.2% | | | | |
| Arch Coal, Inc. | | 25,700 | | 1,878,927 |
| Cameco Corp. | | 115,600 | | 4,298,816 |
| CONSOL Energy, Inc. | | 61,200 | | 3,918,024 |
| Paladin Resources Ltd. (a) | | 110,000 | | 294,010 |
| Peabody Energy Corp. | | 81,000 | | 3,909,870 |
| Uranium Participation Corp. | | 100,000 | | 641,641 |
| UrAsia Energy Ltd. (a) | | 300,000 | | 744,620 |
| | | | | 15,685,908 |
| Oil & Gas Refining & Marketing – 0.5% | | | | |
| Valero Energy Corp. | | 15,000 | | 806,850 |
| |
| TOTAL OIL, GAS & CONSUMABLE FUELS | | | | 16,492,758 |
See accompanying notes which are an integral part of the financial statements.
Annual Report 88
| Common Stocks – continued | | | | |
| | | Shares | | Value (Note 1) |
| |
| ROAD & RAIL – 21.2% | | | | |
| Railroads – 21.2% | | | | |
| Burlington Northern Santa Fe Corp. | | 125,600 | | $ 9,877,184 |
| Canadian National Railway Co. | | 167,300 | | 7,833,790 |
| CSX Corp. | | 92,200 | | 5,106,036 |
| Norfolk Southern Corp. | | 146,500 | | 7,497,870 |
| Union Pacific Corp. | | 63,200 | | 5,596,360 |
| | | | | 35,911,240 |
| |
| TRADING COMPANIES & DISTRIBUTORS – 1.4% | | | | |
| Trading Companies & Distributors – 1.4% | | | | |
| Finning International, Inc. (d) | | 72,300 | | 2,386,985 |
| TOTAL COMMON STOCKS | | | | |
| (Cost $133,653,851) | | | | 162,004,610 |
| |
| Money Market Funds — 15.7% | | | | |
| |
| Fidelity Cash Central Fund, 4.57% (b) | | 6,226,336 | | 6,226,336 |
| Fidelity Securities Lending Cash Central Fund, 4.58% (b)(c) | | 20,363,250 | | 20,363,250 |
| TOTAL MONEY MARKET FUNDS | | | | |
| (Cost $26,589,586) | | | | 26,589,586 |
| |
| Cash Equivalents — 0.0% | | | | |
| | | Maturity | | Value (Note 1) |
| | | Amount | | |
| Investments in repurchase agreements (Collateralized by U.S. Treasury Obligations, in a joint trading account at | | | | |
| 4.54%, dated 2/28/06 due 3/1/06) | | | | |
| (Cost $40,000) | | 40,005 | | $ 40,000 |
| |
| TOTAL INVESTMENT PORTFOLIO - 111.3% | | | | |
| (Cost $160,283,437) | | | | 188,634,196 |
| |
| NET OTHER ASSETS – (11.3)% | | | | (19,111,695) |
| NET ASSETS – 100% | | | | $ 169,522,501 |
(a) Non-income producing
(b) Affiliated fund that is available only to investment companies and other accounts managed by Fidelity Investments. The rate quoted is the annualized seven-day yield of the fund at period end. A complete unaudited listing of the fund’s holdings as of its most recent quarter end is available upon request.
(c) Investment made with cash collateral received from securities on loan. (d) Security or a portion of the security is on loan at period end.
(e) Security exempt from registration under Rule 144A of the Securities Act of 1933. These securities may be resold in transactions exempt from registration, normally to qualified institutional buyers. At the period end, the value of these securities amounted to $4,048,761 or 2.4% of net assets.
Information regarding fiscal year to date income earned by the fund from the affiliated Central funds is as follows:
| Fund | | Income earned |
| Fidelity Cash Central Fund | | $ 188,612 |
| Fidelity Securities Lending Cash Central Fund | | 39,613 |
| Total | | $ 228,225 |
89
See accompanying notes which are an integral part of the financial statements.
89 Annual Report
| Industrial Materials Portfolio | | |
| Investments - continued | | |
| |
| |
| Other Information | | |
| Distribution of investments by country of issue, as a percentage of total net assets, is as follows: | | |
| |
| United States of America | | 69.0% |
| Canada | | 26.6% |
| United Kingdom | | 2.3% |
| Australia | | 1.4% |
| Others (individually less than 1%) | | 0.7% |
| | | 100.0% |
See accompanying notes which are an integral part of the financial statements.
Annual Report 90
| Industrial Materials Portfolio | | | | | | | | |
| |
| Financial Statements | | | | | | | | |
| |
| |
| Statement of Assets and Liabilities | | | | | | | | |
| February 28, 2006 | | | | | | | | |
| |
| Assets | | | | | | | | |
| Investment in securities, at value (including securities loaned of $19,624,616 and repurchase agreements of $40,000) | | | | | | | | |
| — See accompanying schedule: | | | | | | | | |
| Unaffiliated issuers (cost $133,693,851) | | $ | | 162,044,610 | | | | |
| Affiliated Central Funds (cost $26,589,586) | | | | 26,589,586 | | | | |
| Total Investments (cost $160,283,437) | | | | | | $ | | 188,634,196 |
| Cash | | | | | | | | 841 |
| Receivable for fund shares sold | | | | | | | | 2,383,274 |
| Dividends receivable | | | | | | | | 345,222 |
| Interest receivable | | | | | | | | 15,424 |
| Prepaid expenses | | | | | | | | 458 |
| Other affiliated receivables | | | | | | | | 460 |
| Other receivables | | | | | | | | 13,311 |
| Total assets | | | | | | | | 191,393,186 |
| |
| Liabilities | | | | | | | | |
| Payable for fund shares redeemed | | | | 1,351,170 | | | | |
| Accrued management fee | | | | 78,146 | | | | |
| Other affiliated payables | | | | 48,597 | | | | |
| Other payables and accrued expenses | | | | 29,522 | | | | |
| Collateral on securities loaned, at value | | | | 20,363,250 | | | | |
| Total liabilities | | | | | | | | 21,870,685 |
| |
| Net Assets | | | | | | $ | | 169,522,501 |
| Net Assets consist of: | | | | | | | | |
| Paid in capital | | | | | | $ | | 133,838,139 |
| Undistributed net investment income | | | | | | | | 394,580 |
| Accumulated undistributed net realized gain (loss) on investments and foreign currency transactions | | | | | | | | 6,938,613 |
| Net unrealized appreciation (depreciation) on investments and assets and liabilities in foreign currencies | | | | | | | | 28,351,169 |
| Net Assets, for 3,657,090 shares outstanding | | | | | | $ | | 169,522,501 |
| Net Asset Value, offering price and redemption price per share ($169,522,501 ÷ 3,657,090 shares) | | | | | | $ | | 46.35 |
| |
| Statement of Operations | | | | | | | | |
| Year ended February 28, 2006 | | | | | | | | |
| |
| Investment Income | | | | | | | | |
| Dividends | | | | | | $ | | 2,185,790 |
| Interest | | | | | | | | 98 |
| Income from affiliated Central Funds (including $39,613 from security lending) | | | | | | | | 228,225 |
| Total income | | | | | | | | 2,414,113 |
| |
| Expenses | | | | | | | | |
| Management fee | | $ | | 771,230 | | | | |
| Transfer agent fees | | | | 472,999 | | | | |
| Accounting and security lending fees | | | | | | | | |
| | | | | 68,775 | | | | |
| Independent trustees’ compensation | | | | 567 | | | | |
| Custodian fees and expenses | | | | 20,474 | | | | |
| Registration fees | | | | 41,962 | | | | |
| Audit | | | | 34,258 | | | | |
| Legal | | | | 740 | | | | |
| Miscellaneous | | | | 1,170 | | | | |
| Total expenses before reductions | | | | 1,412,175 | | | | |
| Expense reductions | | | | (56,399) | | | | 1,355,776 |
| |
| Net investment income (loss) | | | | | | | | 1,058,337 |
| Realized and Unrealized Gain (Loss) | | | | | | | | |
| Net realized gain (loss) on: | | | | | | | | |
See accompanying notes which are an integral part of the financial statements.
|
91 Annual Report
| Industrial Materials Portfolio | | | | | | |
| Financial Statements - continued | | | | | | |
| |
| |
| Investment securities: | | | | | | |
| Unaffiliated issuers | | 8,431,498 | | | | |
| Foreign currency transactions | | 71,590 | | | | |
| Total net realized gain (loss) | | | | | | 8,503,088 |
| Change in net unrealized appreciation (depreciation) on: | | | | | | |
| Investment securities | | 6,934,037 | | | | |
| Assets and liabilities in foreign currencies | | 354 | | | | |
| Total change in net unrealized appreciation (depreciation) | | | | | | 6,934,391 |
| Net gain (loss) | | | | | | 15,437,479 |
| Net increase (decrease) in net assets resulting from operations | | | | $ | | 16,495,816 |
See accompanying notes which are an integral part of the financial statements.
Annual Report 92
| Statement of Changes in Net Assets | | | | | | | | | | | | | | | | |
| | | | | | | | | | | Year ended | | Year ended |
| | | | | | | | | | | February 28, | | February 28, |
| | | | | | | | | | | 2006 | | 2005 |
| Increase (Decrease) in Net Assets | | | | | | | | | | | | | | | | |
| Operations | | | | | | | | | | | | | | | | |
| Net investment income (loss) | | | | | | | | | | $ | | 1,058,337 | | $ | | 476,635 |
| Net realized gain (loss) | | | | | | | | | | | | 8,503,088 | | | | 2,490,630 |
| Change in net unrealized appreciation (depreciation) | | | | | | | | | | | | 6,934,391 | | | | 11,324,068 |
| Net increase (decrease) in net assets resulting from operations | | | | | | | | | | | | 16,495,816 | | | | 14,291,333 |
| Distributions to shareholders from net investment income | | | | | | | | | | | | (770,963) | | | | (397,474) |
| Distributions to shareholders from net realized gain | | | | | | | | | | | | (3,187,200) | | | | (2,652,984) |
| Total distributions | | | | | | | | | | | | (3,958,163) | | | | (3,050,458) |
| Share transactions | | | | | | | | | | | | | | | | |
| Proceeds from sales of shares | | | | | | | | | | 177,007,921 | | | | 146,550,908 |
| Reinvestment of distributions | | | | | | | | | | | | 3,742,752 | | | | 2,862,267 |
| Cost of shares redeemed | | | | | | | | | | (168,316,528) | | (151,431,505) |
| Net increase (decrease) in net assets resulting from share transactions | | | | | | | | | | 12,434,145 | | | | (2,018,330) |
| Redemption fees | | | | | | | | | | | | 108,867 | | | | 88,512 |
| Total increase (decrease) in net assets | | | | | | | | | | | | 25,080,665 | | | | 9,311,057 |
| |
| Net Assets | | | | | | | | | | | | | | | | |
| Beginning of period | | | | | | | | | | 144,441,836 | | | | 135,130,779 |
| End of period (including undistributed net investment income of $394,580 and undistributed net investment income of | | | | | | | | |
| $126,961, respectively) | | | | | | | | | | $ 169,522,501 | | $ | | 144,441,836 |
| |
| Other Information | | | | | | | | | | | | | | | | |
| Shares | | | | | | | | | | | | | | | | |
| Sold | | | | | | | | | | | | 4,217,962 | | | | 4,065,953 |
| Issued in reinvestment of distributions | | | | | | | | | | | | 93,814 | | | | 81,436 |
| Redeemed | | | | | | | | | | | | (4,196,527) | | | | (4,360,623) |
| Net increase (decrease) | | | | | | | | | | | | 115,249 | | | | (213,234) |
| |
| Financial Highlights | | | | | | | | | | | | | | | | |
| Years ended February 28, | | 2006 | | 2005 | | | | 2004F | | | | 2003 | | | | 2002 |
| Selected Per-Share Data | | | | | | | | | | | | | | | | |
| Net asset value, beginning of period | | $ 40.78 | | $ 35.99 | | $ | | 23.83 | | $ | | 25.89 | | $ | | 23.11 |
| Income from Investment Operations | | | | | | | | | | | | | | | | |
| Net investment income (loss)C | | 32 | | .15 | | | | .13D | | | | .04D | | | | .10 |
| Net realized and unrealized gain (loss) | | 6.40 | | 5.47 | | | | 12.07 | | | | (1.69) | | | | 2.81 |
| Total from investment operations | | 6.72 | | 5.62 | | | | 12.20 | | | | (1.65) | | | | 2.91 |
| Distributions from net investment income | | (.25) | | (.12) | | | | (.12) | | | | (.46) | | | | (.20) |
| Distributions from net realized gain | | (.93) | | (.74) | | | | — | | | | — | | | | — |
| Total distributions | | (1.18) | | (.86) | | | | (.12) | | | | (.46) | | | | (.20) |
| Redemption fees added to paid in capitalC | | 03 | | .03 | | | | .08 | | | | .05 | | | | .07 |
| Net asset value, end of period | | $ 46.35 | | $ 40.78 | | $ | | 35.99 | | $ | | 23.83 | | $ | | 25.89 |
| Total ReturnA,B | | 17.01% | | 16.09% | | | | 51.73% | | | | (6.16)% | | | | 12.98% |
| Ratios to Average Net AssetsE | | | | | | | | | | | | | | | | |
| Expenses before reductions | | 1.05% | | 1.06% | | | | 1.31% | | | | 1.57% | | | | 1.57% |
| Expenses net of fee waivers, if any | | 1.05% | | 1.06% | | | | 1.31% | | | | 1.57% | | | | 1.57% |
| Expenses net of all reductions | | 1.01% | | 1.02% | | | | 1.17% | | | | 1.42% | | | | 1.49% |
| Net investment income (loss) | | 78% | | .42% | | | | .43% | | | | .16% | | | | .42% |
| Supplemental Data | | | | | | | | | | | | | | | | |
| Net assets, end of period (000 omitted) | | $ 169,523 | | $ 144,442 | | $ 135,131 | | $ | | 41,275 | | $ | | 27,461 |
| Portfolio turnover rate | | 124% | | 89% | | | | 175% | | | | 226% | | | | 230% |
ATotal returns would have been lower had certain expenses not been reduced during the periods shown. BTotal returns do not include the effect of the former sales charges. CCalculated based on average shares outstanding during the period. DInvestment income per share reflects a special dividend which amounted to $.07 per share. EExpense ratios reflect operating expenses of the fund. Expenses before reductions do not reflect amounts reimbursed by the investment adviser or reductions from brokerage service arrangements or other expense offset arrangements and do not represent the amount paid by the fund during periods when reimbursements or reductions occur. Expenses net of fee waivers reflect expenses after reimbursement by the investment adviser but prior to reductions from brokerage service arrangements or other expense offset arrangements. Expenses net of all reductions represent the net expenses paid by the fund. FFor the year ended February 29.
See accompanying notes which are an integral part of the financial statements.
93 Annual Report
Transportation Portfolio
Performance
|

Average annual total return reflects the change in the value of an investment, assuming reinvestment of the fund’s dividend income and capital gains (the profits earned upon the sale of securities that have grown in value) and assuming a constant rate of performance each year. The $10,000 table and the fund’s returns do not reflect the deduction of taxes that a shareholder would pay on fund distributions or the redemption of fund shares. During periods of reimbursement by Fidelity a fund’s total returns will be greater than it would be had the reimbursement not occurred. How a fund did yesterday is no guarantee of how it will do tomorrow.
| Average Annual Total Returns | | | | | | |
| Periods ended February 28, 2006 | | Past 1 | | Past 5 | | Past 10 |
| | | year | | years | | years |
| Select Transportation | | 22.24% | | 12.30% | | 14.09% |
| |
| $10,000 Over 10 Years | | | | | | |
Let’s say hypothetically that $10,000 was invested in Fidelity Select Transportation Portfolio on February 29, 1996. The chart shows how the value of your investment would have changed, and also shows how the S&P 500 Index performed over the same period.
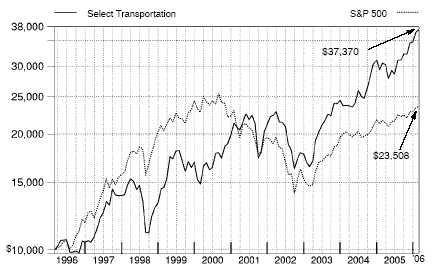
Management’s Discussion of Fund Performance
Comments from Christopher Bartel and Lindsay Connor, who became co-managers of Fidelity® Select Transportation Portfolio on April 10, 2006, after the period covered by this report
With the exception of several popular large-cap stock performance measures, most major U.S. equity benchmarks had double-digit returns for the year ending February 28, 2006. For much of the period, market gains were driven largely by the energy sector, although utilities ultimately sneaked into the top spot for the year overall. Financials and telecommunication services also reached double figures, outperforming the 8.40% return of the broader market as measured by the large-cap-oriented Standard & Poor’s 500SM Index. The consumer discretionary segment — home to the weak performing automobile and media industries — was the biggest disappointment. Although the overall return for the S&P 500® beat the small-cap Russell 2000® Index in calendar year 2005 — the first time that’s happened in six years — small-caps stormed back in early 2006, leading to a 16.59% advance during the past 12 months, nearly twice the broader market’s gain. Mid-caps soared even higher, returning 17.67% according to the Russell Midcap® Index. The technology-heavy NASDAQ Composite® Index also fared well, climbing 12.13%, but the Dow Jones Industrial AverageSM, an index of 30 large-cap, blue-chip stocks, managed to rise only 4.52% .
Fidelity Select Transportation Portfolio was up 22.24% for the 12-month period ending February 28, 2006, solidly outperforming the S&P 500 and the 9.59% return for the Goldman Sachs® Cyclical Industries Index. Overweighted positions in the railroad and airline groups, along with strong stock selection in the air freight and logistics group, made the biggest contributions to the fund’s performance relative to its sector index. The fund also was helped by avoiding the poorly performing industrial conglomerates and diversified chemicals groups, which are outside the fund’s focus. Among our top performers were railroads Burlington Northern Santa Fe, Norfolk Southern and Canadian National Railway; railcar maker FreightCar America; trucking broker C.H. Robinson Worldwide; and airline AirTran. The fund was hurt by an overweighting in oil/gas storage and transport, as well as by a lack of exposure to strong performing groups in the index, namely aerospace and defense, and electrical components and equipment. In terms of individual detractors, oil tanker companies Top Tankers and Teekay Shipping and air carrier Northwest Airlines held back the fund’s overall returns. Not owning farm machinery company Caterpillar and automobile manufacturer DaimlerChrysler — major index components — also dragged down the fund’s performance. Some stocks mentioned here were no longer held at period end.
The views expressed above reflect those of the portfolio manager(s) only through the end of the period as stated on the cover of this report and do not necessarily represent the views of Fidelity or any other person in the Fidelity organization. Any such views are subject to change at any time based upon market or other conditions and Fidelity disclaims any responsibility to update such views. These views may not be relied on as investment advice and, because investment decisions for a Fidelity fund are based on numerous factors, may not be relied on as an indication of trading intent on behalf of any Fidelity fund.
95 95 Annual Report
Transportation Portfolio
Investment Changes
Top Ten Stocks as of February 28, 2006
| | | % of fund’s | | % of fund’s net assets |
| | | net assets | | 6 months ago |
| Norfolk Southern Corp. | | 7.1 | | 6.5 |
| Burlington Northern Santa Fe | | | | |
| Corp. | | 6.4 | | 6.8 |
| Expeditors International of | | | | |
| Washington, Inc. | | 5.9 | | 2.5 |
| Canadian National Railway Co. | | 5.5 | | 5.5 |
| C.H. Robinson Worldwide, Inc. | | 4.1 | | 2.9 |
| Southwest Airlines Co. | | 3.9 | | 1.8 |
| Union Pacific Corp. | | 3.6 | | 1.7 |
| CSX Corp. | | 3.6 | | 4.4 |
| UTI Worldwide, Inc. | | 3.4 | | 2.1 |
| Canadian Pacific Railway Ltd. | | 2.9 | | 3.6 |
| | | 46.4 | | |
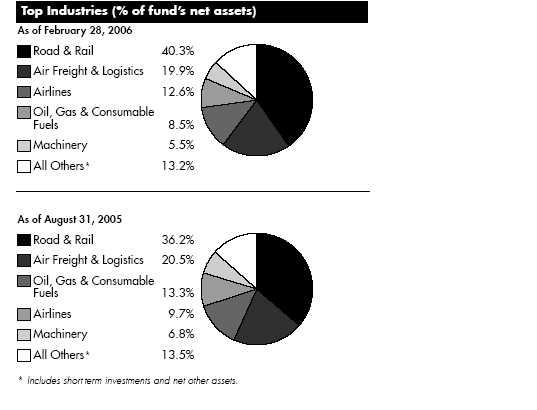
| Transportation Portfolio | | | | | | |
| Investments February 28, 2006 | | | | | | |
| Showing Percentage of Net Assets | | | | | | |
| |
| Common Stocks — 96.9% | | | | | | |
| | | | | Shares | | Value (Note 1) |
| |
| AEROSPACE & DEFENSE – 1.4% | | | | | | |
| Aerospace & Defense – 1.4% | | | | | | |
| Bombardier, Inc. Class B (sub. vtg.) (a) | | | | 103,400 | | $ 265,747 |
| Goodrich Corp. | | | | 5,800 | | 242,672 |
| Precision Castparts Corp. | | | | 12,700 | | 673,608 |
| Rockwell Collins, Inc. | | | | 4,800 | | 255,120 |
| | | | | | | 1,437,147 |
| |
| AIR FREIGHT & LOGISTICS – 19.9% | | | | | | |
| Air Freight & Logistics – 19.9% | | | | | | |
| C.H. Robinson Worldwide, Inc. | | | | 94,200 | | 4,222,044 |
| EGL, Inc. (a) | | | | 17,500 | | 707,875 |
| Expeditors International of Washington, Inc. | | | | 78,460 | | 6,103,403 |
| FedEx Corp. | | | | 23,700 | | 2,541,588 |
| Forward Air Corp. | | | | 21,050 | | 746,854 |
| Hub Group, Inc. Class A (a) | | | | 38,330 | | 1,598,361 |
| Ryder System, Inc. | | | | 5,800 | | 257,172 |
| United Parcel Service, Inc. Class B | | | | 13,400 | | 1,001,114 |
| UTI Worldwide, Inc. | | | | 33,600 | | 3,515,568 |
| | | | | | | 20,693,979 |
| |
| AIRLINES – 12.6% | | | | | | |
| Airlines – 12.6% | | | | | | |
| ACE Aviation Holdings, Inc. Class A (a) | | | | 8,800 | | 259,473 |
| AirTran Holdings, Inc. (a) | | | | 107,900 | | 1,918,462 |
| Alaska Air Group, Inc. (a) | | | | 3,900 | | 124,995 |
| AMR Corp. (a) | | | | 109,400 | | 2,745,940 |
| Continental Airlines, Inc. Class B (a) | | | | 17,600 | | 410,080 |
| Gol Linhas Aereas Inteligentes SA sponsored ADR (d) | | | | 6,900 | | 226,320 |
| JetBlue Airways Corp. (a)(d) | | | | 50,237 | | 572,702 |
| Republic Airways Holdings, Inc. (a) | | | | 14,200 | | 199,084 |
| Ryanair Holdings PLC sponsored ADR (a) | | | | 20,800 | | 1,104,272 |
| SkyWest, Inc. | | | | 4,900 | | 141,953 |
| Southwest Airlines Co. | | | | 240,287 | | 4,029,613 |
| UAL Corp. (a) | | | | 30,400 | | 1,078,288 |
| US Airways Group, Inc. (a) | | | | 9,500 | | 314,355 |
| | | | | | | 13,125,537 |
| |
| AUTO COMPONENTS – 1.0% | | | | | | |
| Auto Parts & Equipment – 1.0% | | | | | | |
| BorgWarner, Inc. | | | | 2,100 | | 117,117 |
| Johnson Controls, Inc. | | | | 2,700 | | 192,429 |
| TRW Automotive Holdings Corp. (a) | | | | 30,100 | | 770,560 |
| | | | | | | 1,080,106 |
| |
| COMMUNICATIONS EQUIPMENT – 0.3% | | | | | | |
| Communications Equipment – 0.3% | | | | | | |
| Harris Corp. | | | | 5,600 | | 255,808 |
See accompanying notes which are an integral part of the financial statements.
|
97 Annual Report
97
| Transportation Portfolio | | | | |
| Investments - continued | | | | |
| |
| |
| |
| | | Shares | | Value (Note 1) |
| |
| ENERGY EQUIPMENT & SERVICES – 0.8% | | | | |
| Oil & Gas Equipment & Services – 0.8% | | | | |
| Halliburton Co. | | 7,200 | | $ 489,600 |
| Hornbeck Offshore Services, Inc. (a) | | 10,600 | | 340,896 |
| | | | | 830,496 |
| |
| HOUSEHOLD DURABLES – 0.6% | | | | |
| Consumer Electronics – 0.6% | | | | |
| Harman International Industries, Inc. | | 5,432 | | 599,421 |
| MACHINERY – 5.5% | | | | |
| Construction & Farm Machinery & Heavy Trucks – 5.5% | | | | |
| American Railcar Industries, Inc. | | 6,000 | | 201,600 |
| Cummins, Inc. | | 3,700 | | 400,636 |
| FreightCar America, Inc. | | 8,000 | | 564,000 |
| Greenbrier Companies, Inc. | | 8,200 | | 309,796 |
| Navistar International Corp. (a) | | 9,800 | | 287,630 |
| Oshkosh Truck Co. | | 30,800 | | 1,747,284 |
| PACCAR, Inc. | | 6,775 | | 473,369 |
| Trinity Industries, Inc. | | 21,300 | | 1,128,900 |
| Wabash National Corp | | 16,200 | | 323,514 |
| Wabtec Corp. | | 8,700 | | 287,361 |
| | | | | 5,724,090 |
| |
| MARINE – 2.6% | | | | |
| Marine – 2.6% | | | | |
| Alexander & Baldwin, Inc. | | 13,900 | | 677,347 |
| American Commercial Lines, Inc. | | 22,100 | | 839,800 |
| Kirby Corp. (a) | | 11,700 | | 717,210 |
| Odfjell ASA (B Shares) | | 7,300 | | 110,352 |
| Seaspan Corp. | | 7,800 | | 155,688 |
| Stolt-Nielsen SA (d) | | 4,800 | | 150,100 |
| | | | | 2,650,497 |
| |
| METALS & MINING – 1.1% | | | | |
| Diversified Metals & Mining – 0.9% | | | | |
| RTI International Metals, Inc. (a) | | 3,400 | | 142,970 |
| Titanium Metals Corp. (a)(d) | | 19,500 | | 799,890 |
| | | | | 942,860 |
| Steel – 0.2% | | | | |
| Allegheny Technologies, Inc. | | 4,700 | | 237,397 |
| |
| TOTAL METALS & MINING | | | | 1,180,257 |
| |
| OIL, GAS & CONSUMABLE FUELS – 8.5% | | | | |
| Oil & Gas Refining & Marketing – 1.8% | | | | |
| Valero Energy Corp. | | 34,900 | | 1,877,271 |
| Oil & Gas Storage & Transport – 6.7% | | | | |
| Double Hull Tankers, Inc. | | 13,600 | | 181,832 |
| Frontline Ltd. (e) | | 4,500 | | 172,731 |
| Frontline Ltd. (NY Shares) | | 2,200 | | 84,744 |
| General Maritime Corp. | | 19,800 | | 725,274 |
| Maritrans, Inc. | | 21,400 | | 487,064 |
| OMI Corp. | | 89,500 | | 1,566,250 |
See accompanying notes which are an integral part of the financial statements.
Annual Report 98
| Common Stocks – continued | | | | |
| | | Shares | | Value (Note 1) |
| |
| OIL, GAS & CONSUMABLE FUELS – CONTINUED | | | | |
| Oil & Gas Storage & Transport – continued | | | | |
| Overseas Shipholding Group, Inc. | | 36,100 | | $ 1,825,577 |
| Teekay Shipping Corp. | | 49,400 | | 1,921,660 |
| | | | | 6,965,132 |
| |
| TOTAL OIL, GAS & CONSUMABLE FUELS | | | | 8,842,403 |
| |
| ROAD & RAIL – 40.3% | | | | |
| Railroads – 30.8% | | | | |
| Burlington Northern Santa Fe Corp. | | 84,400 | | 6,637,216 |
| Canadian National Railway Co. | | 122,500 | | 5,736,038 |
| Canadian Pacific Railway Ltd. | | 58,600 | | 3,001,822 |
| CSX Corp. | | 66,700 | | 3,693,846 |
| Genesee & Wyoming, Inc. Class A (a) | | 13,000 | | 594,750 |
| Kansas City Southern (a) | | 47,150 | | 1,092,466 |
| Norfolk Southern Corp. | | 144,600 | | 7,400,627 |
| Union Pacific Corp. | | 42,700 | | 3,781,085 |
| | | | | 31,937,850 |
| Trucking – 9.5% | | | | |
| CNF, Inc. | | 23,200 | | 1,164,176 |
| Dollar Thrifty Automotive Group, Inc. (a) | | 13,800 | | 557,244 |
| Heartland Express, Inc. | | 8,443 | | 195,287 |
| J.B. Hunt Transport Services, Inc. | | 88,800 | | 2,101,008 |
| Knight Transportation, Inc. | | 10,050 | | 198,890 |
| Laidlaw International, Inc. | | 46,500 | | 1,283,400 |
| Landstar System, Inc. | | 55,770 | | 2,598,324 |
| Old Dominion Freight Lines, Inc. (a) | | 13,500 | | 355,860 |
| P.A.M. Transportation Services, Inc. (a) | | 8,300 | | 174,549 |
| Swift Transportation Co., Inc. (a) | | 46,600 | | 1,110,944 |
| USA Truck, Inc. (a) | | 5,500 | | 161,865 |
| | | | | 9,901,547 |
| |
| TOTAL ROAD & RAIL | | | | 41,839,397 |
| |
| SOFTWARE – 2.0% | | | | |
| Application Software – 2.0% | | | | |
| NAVTEQ Corp. (a) | | 44,500 | | 2,060,795 |
| |
| |
| | | Shares | | Value (Note 1) |
| |
| TRADING COMPANIES & DISTRIBUTORS – 0.3% | | | | |
| Trading Companies & Distributors – 0.3% | | | | |
| GATX Corp. | | 8,400 | | $ 333,480 |
| TOTAL COMMON STOCKS | | | | |
| (Cost $74,765,610) | | | | 100,653,413 |
See accompanying notes which are an integral part of the financial statements.
|
99 Annual Report
99
| Transportation Portfolio | | | | |
| Investments - continued | | | | |
| |
| Money Market Funds — 7.5% | | | | |
| Fidelity Cash Central Fund, 4.57% (b) | | 6,721,229 | | 6,721,229 |
| Fidelity Securities Lending Cash Central Fund, 4.58% (b)(c) | | 1,121,570 | | 1,121,570 |
| TOTAL MONEY MARKET FUNDS | | | | |
| (Cost $7,842,799) | | | | 7,842,799 |
| TOTAL INVESTMENT PORTFOLIO - 104.4% | | | | |
| (Cost $82,608,409) | | | | 108,496,212 |
| |
| NET OTHER ASSETS – (4.4)% | | | | (4,569,411) |
| NET ASSETS – 100% | | $ | | 103,926,801 |
(a) Non-income producing
(b) Affiliated fund that is available only to investment companies and other accounts managed by Fidelity Investments. The rate quoted is the annualized seven-day yield of the fund at period end. A complete unaudited listing of the fund’s holdings as of its most recent quarter end is available upon request.
(c) Investment made with cash collateral received from securities on loan. (d) Security or a portion of the security is on loan at period end.
(e) Security exempt from registration under Rule 144A of the Securities Act of 1933. These securities may be resold in transactions exempt from registration, normally to qualified institutional buyers. At the period end, the value of these securities amounted to $172,731 or 0.2% of net assets.
Information regarding fiscal year to date income earned by the fund from the affiliated Central funds is as follows:
| Fund | | Income earned |
| Fidelity Cash Central Fund | | $ 96,629 |
| Fidelity Securities Lending Cash Central Fund | | 38,667 |
| Total | | $ 135,296 |
See accompanying notes which are an integral part of the financial statements.
|
| Other Information | | |
| Distribution of investments by country of issue, as a percentage of total net assets, is as follows: | | |
| |
| United States of America | | 81.4% |
| Canada | | 9.0% |
| Marshall Islands | | 4.4% |
| British Virgin Islands | | 3.4% |
| Ireland | | 1.1% |
| Others (individually less than 1%) | | 0.7% |
| | | 100.0% |
See accompanying notes which are an integral part of the financial statements.
|
101 Annual Report
101
| Statement of Assets and Liabilities | | | | | | | | |
| | | | | | | | | February 28, 2006 |
| |
| Assets | | | | | | | | |
| Investment in securities, at value (including securities loaned of $1,076,978) — See accompanying schedule: | | | | | | | | |
| Unaffiliated issuers (cost $74,765,610) | | $ | | 100,653,413 | | | | |
| Affiliated Central Funds (cost $7,842,799) | | | | 7,842,799 | | | | |
| Total Investments (cost $82,608,409) | | | | | | $ | | 108,496,212 |
| Receivable for investments sold | | | | | | | | 240,703 |
| Receivable for fund shares sold | | | | | | | | 1,772,424 |
| Dividends receivable | | | | | | | | 59,046 |
| Interest receivable | | | | | | | | 19,301 |
| Prepaid expenses | | | | | | | | 251 |
| Other affiliated receivables | | | | | | | | 93 |
| Other receivables | | | | | | | | 11,626 |
| Total assets | | | | | | | | 110,599,656 |
| |
| Liabilities | | | | | | | | |
| Payable for investments purchased | | $ | | 4,919,367 | | | | |
| Payable for fund shares redeemed | | | | 529,862 | | | | |
| Accrued management fee | | | | 41,200 | | | | |
| Other affiliated payables | | | | 25,169 | | | | |
| Other payables and accrued expenses | | | | 35,687 | | | | |
| Collateral on securities loaned, at value | | | | 1,121,570 | | | | |
| Total liabilities | | | | | | | | 6,672,855 |
| |
| Net Assets | | | | | | $ | | 103,926,801 |
| Net Assets consist of: | | | | | | | | |
| Paid in capital | | | | | | $ | | 74,398,228 |
| Undistributed net investment income | | | | | | | | 58,316 |
| Accumulated undistributed net realized gain (loss) on investments and foreign currency transactions | | | | | | | | 3,582,454 |
| Net unrealized appreciation (depreciation) on investments | | | | | | | | 25,887,803 |
| Net Assets, for 2,069,351 shares outstanding | | | | | | $ | | 103,926,801 |
| Net Asset Value, offering price and redemption price per share ($103,926,801 ÷ 2,069,351 shares) | | | | | | $ | | 50.22 |
| |
| Statement of Operations | | | | | | | | |
| | | | | | | | | Year ended February 28, 2006 |
| |
| Investment Income | | | | | | | | |
| Dividends | | | | | | $ | | 1,028,796 |
| Interest | | | | | | | | 27 |
| Income from affiliated Central Funds | | | | | | | | |
| (including $38,667 from security lending) | | | | | | | | 135,296 |
| Total income | | | | | | | | 1,164,119 |
| |
| Expenses | | | | | | | | |
| Management fee | | $ | | 440,013 | | | | |
| Transfer agent fees | | | | 281,667 | | | | |
| Accounting and security lending fees | | | | | | | | |
| | | | | 39,225 | | | | |
| Independent trustees’ compensation | | | | 330 | | | | |
| Custodian fees and expenses | | | | 40,070 | | | | |
| Registration fees | | | | 37,779 | | | | |
| Audit | | | | 33,974 | | | | |
| Legal | | | | 424 | | | | |
| Miscellaneous | | | | 748 | | | | |
| Total expenses before reductions | | | | 874,230 | | | | |
| Expense reductions | | | | (19,286) | | | | 854,944 |
| |
| Net investment income (loss) | | | | | | | | 309,175 |
| Realized and Unrealized Gain (Loss) | | | | | | | | |
| Net realized gain (loss) on: | | | | | | | | |
See accompanying notes which are an integral part of the financial statements.
Annual Report 102
| Investment securities: | | | | | | |
| Unaffiliated issuers | | 5,328,569 | | | | |
| Foreign currency transactions | | 12,212 | | | | |
| Total net realized gain (loss) | | | | | | 5,340,781 |
| Change in net unrealized appreciation (depreciation) on: | | | | | | |
| Investment securities | | 8,140,200 | | | | |
| Assets and liabilities in foreign currencies | | 15 | | | | |
| Total change in net unrealized appreciation (depreciation) | | | | | | 8,140,215 |
| Net gain (loss) | | | | | | 13,480,996 |
| Net increase (decrease) in net assets resulting from operations | | | | $ | | 13,790,171 |
See accompanying notes which are an integral part of the financial statements.
|
103 Annual Report
| Transportation Portfolio | | | | | | | | | | | | | | | | | | | | | | |
| Financial Statements - continued | | | | | | | | | | | | | | | | | | | | | | |
| |
| |
| Statement of Changes in Net Assets | | | | | | | | | | | | | | | | | | | | | | |
| | | | | | | | | | | | | Year ended | | | | Year ended |
| | | | | | | | | | | | | February 28, | | | | February 28, |
| | | | | | | | | | | | | 2006 | | | | 2005 |
| Increase (Decrease) in Net Assets | | | | | | | | | | | | | | | | | | | | | | |
| Operations | | | | | | | | | | | | | | | | | | | | | | |
| Net investment income (loss) | | | | | | | | | | | | $ | | 309,175 | | $ | | | | 352,423 |
| Net realized gain (loss) | | | | | | | | | | | | | | 5,340,781 | | | | | | 2,176,503 |
| Change in net unrealized appreciation (depreciation) | | | | | | | | | | | | | | 8,140,215 | | | | 11,247,461 |
| Net increase (decrease) in net assets resulting from operations | | | | | | | | | | | | 13,790,171 | | | | 13,776,387 |
| Distributions to shareholders from net investment income | | | | | | | | | | | | | | (250,837) | | | | | | (342,863) |
| Distributions to shareholders from net realized gain | | | | | | | | | | | | | | (2,277,096) | | | | | | (412,552) |
| Total distributions | | | | | | | | | | | | | | (2,527,933) | | | | | | (755,415) |
| Share transactions | | | | | | | | | | | | | | | | | | | | | | |
| Proceeds from sales of shares | | | | | | | | | | | | 147,323,750 | | | | 162,382,077 |
| Reinvestment of distributions | | | | | | | | | | | | | | 2,429,834 | | | | | | 709,864 |
| Cost of shares redeemed | | | | | | | | | | | | (139,120,153) | | | | (131,804,654) |
| Net increase (decrease) in net assets resulting from share transactions | | | | | | | | | | 10,633,431 | | | | 31,287,287 |
| Redemption fees | | | | | | | | | | | | | | | | 72,847 | | | | | | 66,613 |
| Total increase (decrease) in net assets | | | | | | | | | | | | 21,968,516 | | | | 44,374,872 |
| |
| Net Assets | | | | | | | | | | | | | | | | | | | | | | |
| Beginning of period | | | | | | | | | | | | 81,958,285 | | | | 37,583,413 |
| End of period (including undistributed net investment income of $58,316 and accumulated net investment loss | | | | | | | | | | | | | | |
| of $22, respectively) | | | | | | | | | | | | $ 103,926,801 | | $ | | 81,958,285 |
| |
| Other Information | | | | | | | | | | | | | | | | | | | | | | |
| Shares | | | | | | | | | | | | | | | | | | | | | | |
| Sold | | | | | | | | | | | | | | 3,256,955 | | | | | | 4,251,511 |
| Issued in reinvestment of distributions | | | | | | | | | | | | | | | | 54,997 | | | | | | 16,729 |
| Redeemed | | | | | | | | | | | | | | (3,190,130) | | | | (3,465,029) |
| Net increase (decrease) | | | | | | | | | | | | | | 121,822 | | | | | | 803,211 |
| |
| Financial Highlights | | | | | | | | | | | | | | | | | | | | | | |
| Years ended February 28, | | | | 2006 | | | | 2005 | | | | 2004F | | | | 2003 | | | | 2002 |
| Selected Per-Share Data | | | | | | | | | | | | | | | | | | | | | | |
| Net asset value, beginning of period | | $ | | 42.08 | | $ | | 32.84 | | $ | | 22.80 | | $ | | 30.95 | | $ | | 29.20 |
| Income from Investment Operations | | | | | | | | | | | | | | | | | | | | | | |
| Net investment income (loss)C | | | | 17 | | | | .20D | | | | (.12) | | | | (.18) | | | | (.06) |
| Net realized and unrealized gain (loss) | | | | 8.99 | | | | 9.24 | | | | 10.13 | | | | (8.02) | | | | 1.99 |
| Total from investment operations | | | | 9.16 | | | | 9.44 | | | | 10.01 | | | | (8.20) | | | | 1.93 |
| Distributions from net investment income | | | | (.10) | | | | (.11) | | | | — | | | | — | | | | — |
| Distributions from net realized gain | | | | (.96) | | | | (.13) | | | | — | | | | — | | | | (.23) |
| Total distributions | | | | (1.06) | | | | (.24) | | | | — | | | | —
| | | | (.23) |
| Redemption fees added to paid in capitalC | | | | 04 | | | | .04 | | | | .03 | | | | .05 | | | | .05 |
| Net asset value, end of period | | $ | | 50.22 | | $ | | 42.08 | | $ | | 32.84 | | $ | | 22.80 | | $ | | 30.95 |
| Total ReturnA,B | | | | 22.24% | | | | 28.86% | | | | 44.04% | | | | (26.33)% | | | | 6.85% |
| Ratios to Average Net AssetsE | | | | | | | | | | | | | | | | | | | | | | |
| Expenses before reductions | | | | 1.13% | | | | 1.17% | | | | 1.57% | | | | 1.77% | | | | 1.44% |
| Expenses net of fee waivers, if any | | | | 1.13% | | | | 1.17% | | | | 1.57% | | | | 1.77% | | | | 1.44% |
| Expenses net of all reductions | | | | 1.11% | | | | 1.14% | | | | 1.53% | | | | 1.75% | | | | 1.40% |
| Net investment income (loss) | | | | 40% | | | | .53%D | | | | (.40)% | | | | (.67)% | | | | (.21)% |
| Supplemental Data | | | | | | | | | | | | | | | | | | | | | | |
| Net assets, end of period (000 omitted) | | $ 103,927 | | $ | | 81,958 | | $ | | 37,583 | | $ | | 21,820 | | $ | | 71,526 |
| Portfolio turnover rate | | | | 142% | | | | 148% | | | | 86% | | | | 47% | | | | 155% |
| |
| | | | | |
A Total returns would have been lower had certain expenses not been reduced during the periods shown. B Total returns do not include the effect of the former sales charges. C Calculated based on average shares outstanding during the period. DInvestment income per share reflects a special dividend which amounted to $.09 per share and an in kind dividend received in a corporate reorganization which amounted to $.08 per share. Excluding these dividends, the ratio of net invest ment income to average net assets would have been .06%. EExpense ratios reflect operating expenses of the fund. Expenses before reductions do not reflect amounts reimbursed by the investment adviser or reductions from brokerage service arrange ments or other expense offset arrangements and do not represent the amount paid by the fund during periods when reimbursements or reductions occur. Expenses net of fee waivers reflect expenses after reimbursement by the investment adviser but prior to reductions from brokerage service arrangements or other expense offset arrangements. Expenses net of all reductions represent the net expenses paid by the fund. FFor the year ended February 29.See accompanying notes which are an integral part of the financial statements.
Annual Report 104
Notes to Financial Statements
For the period ended February 28, 2006
|
1. Significant Accounting Policies.
|
Air Transportation Portfolio, Automotive Portfolio, Chemicals Portfolio, Construction and Housing Portfolio, Cyclical Industries Portfolio, Defense and Aerospace Portfolio, Environmental Portfolio, Industrial Equipment Portfolio, Industrial Materials Portfolio, and Transportation Portfolio (the funds) are non-diversified funds of Fidelity Select Portfolios (the trust). The trust is registered under the Investment Company Act of 1940, as amended (the 1940 Act), as an open-end management investment company organized as a Massachusetts business trust. The funds invest primarily in securities of companies whose principal business activities fall within specific industries. Each fund is authorized to issue an unlimited number of shares. Certain funds may invest in affiliated money market central funds (Money Market Central Funds) which are open-end investment companies available to investment companies and other accounts managed by Fidelity Management & Research Company (FMR) and its affiliates. The financial statements have been prepared in conformity with accounting principles generally accepted in the United States of America, which require management to make certain estimates and assumptions at the date of the financial statements. The following summarizes the significant accounting policies of the funds:
Security Valuation. Investments are valued and net asset value (NAV) per share is calculated (NAV calculation) as of the close of business of the New York Stock Exchange (NYSE), normally 4:00 p.m. Eastern time. In addition, each fund intends to calculate a NAV each hour on the hour (commencing at 10:00 a.m. Eastern time until one hour prior to the close of business on the NYSE) under normal business conditions. Each fund’s investments are valued as of these times for the purpose of computing the fund’s hourly NAV. Wherever possible, each fund uses independent pricing services approved by the Board of Trustees to value their investments.
Equity securities, including restricted securities, for which market quotations are readily available, are valued at the last reported sale price or official closing price as reported by an independent pricing service on the primary market or exchange on which they are traded. In the event there were no sales during the day or closing prices are not available, securities are valued at the last quoted bid price. Investments in open-end mutual funds, are valued at their closing net asset value each business day. Short-term securities with remaining maturities of sixty days or less for which quotations are not readily available are valued at amortized cost, which approximates value.
When current market prices or quotations are not readily available or do not accurately reflect fair value, valuations may be determined in accordance with procedures adopted by the Board of Trustees. For example, when developments occur between the close of a market and the close of the NYSE that may materially affect the value of some or all of the securities, or when trading in a security is halted, those securities may be fair valued. Factors used in the determination of fair value may include monitoring news to identify significant market or security specific events such as changes in the value of U.S. securities markets, reviewing developments in foreign markets and evaluating the performance of ADRs, futures contracts and exchange-traded funds. Because each fund’s utilization of fair value pricing depends on market activity, the frequency with which fair value pricing is used can not be predicted and may be utilized to a significant extent. The value of securities used for NAV calculation under fair value pricing may differ from published prices for the same securities. Fidelity may suspend the calculation of one or more hourly NAVs for funds for any period in which prices for a portion of the stocks or securities held by the funds are not readily available.
Foreign Currency. Certain funds may use foreign currency contracts to facilitate transactions in foreign-denominated securities. Losses from these transactions may arise from changes in the value of the foreign currency or if the counterparties do not perform under the contracts’ terms.
Foreign-denominated assets, including investment securities, and liabilities are translated into U.S. dollars at the exchange rate at period end. Purchases and sales of investment securities, income and dividends received and expenses denominated in foreign currencies are translated into U.S. dollars at the exchange rate in effect on the transaction date.
The effects of exchange rate fluctuations on investments are included with the net realized and unrealized gain (loss) on investment securities. Other foreign currency transactions resulting in realized and unrealized gain (loss) are disclosed separately.
Investment Transactions and Income. Security transactions are accounted for as of trade date. Gains and losses on securities sold are determined on the basis of identified cost and may include proceeds received from litigation. Dividend income is recorded on the ex-dividend date, except for certain dividends from foreign securities where the ex-dividend date may have passed, which are recorded as soon as the funds are informed of the ex-dividend date. Non-cash dividends included in dividend income, if any, are recorded at the fair market value of the securities received. Distributions received on securities that represent a return of capital or capital gain are recorded as a reduction of cost of investments and/or as a realized gain. The funds estimate the components of distributions received that may be considered return of capital distributions or capital gain distributions. Interest income is accrued as earned. Interest income includes coupon interest and amortization of premium and accretion of discount on debt securities. Investment income is recorded net of foreign taxes withheld where recovery of such taxes is uncertain.
Expenses. Most expenses of the trust can be directly attributed to a fund. Expenses which cannot be directly attributed are apportioned among each fund in the trust.
105 Annual Report
Notes to Financial Statements - continued
1. Significant Accounting Policies - continued
|
Income Tax Information and Distributions to Shareholders. Each year, each fund intends to qualify as a regulated investment company by distributing all of its taxable income and realized gains under Subchapter M of the Internal Revenue Code. As a result, no provision for income taxes is required in the accompanying financial statements. Foreign taxes are provided for based on each fund’s understanding of the tax rules and rates that exist in the foreign markets in which it invests.
Distributions are recorded on the ex-dividend date. Income and capital gain distributions are determined in accordance with income tax regulations, which may differ from generally accepted accounting principles. In addition, certain funds will claim a portion of the payment made to redeeming shareholders as a distribution for income tax purposes.
Capital accounts within the financial statements are adjusted for permanent book-tax differences. These adjustments have no impact on net assets or the results of operations. Temporary book-tax differences will reverse in a subsequent period.
Book-tax differences are primarily due to short-term capital gains, foreign currency transactions, certain foreign taxes, passive foreign investment companies (PFIC), deferred trustees compensation, net operating losses, capital loss carryforwards and losses deferred due to wash sales and excise tax regulations.
The tax-basis components of distributable earnings and the federal tax cost as of period end were as follows for each fund:
| | | Cost for | | | | | | | | | | | | Net Unrealized |
| | | Federal Income | | | | Unrealized | | | | Unrealized | | | | Appreciation/ |
| | | Tax Purposes | | | | Appreciation | | | | Depreciation | | | | (Depreciation) |
| Air Transportation Portfolio | | $ 109,731,022 | | $ | | 17,866,277 | | $ | | (2,420,497) | | $ | | 15,445,780 |
| Automotive Portfolio | | 16,954,049 | | | | 929,671 | | | | (1,139,958) | | | | (210,287) |
| Chemicals Portfolio | | 98,757,460 | | | | 25,724,996 | | | | (3,100,869) | | | | 22,624,127 |
| Construction and Housing Portfolio | | 211,550,570 | | | | 52,305,178 | | | | (2,136,233) | | | | 50,168,945 |
| Cyclical Industries Portfolio | | 72,593,192 | | | | 14,833,203 | | | | (1,270,923) | | | | 13,562,280 |
| Defense and Aerospace Portfolio | | 718,566,877 | | | | 222,831,841 | | | | (7,597,857) | | | | 215,233,984 |
| Environmental Portfolio | | 52,199,422 | | | | 4,258,550 | | | | (751,361) | | | | 3,507,189 |
| Industrial Equipment Portfolio | | 60,059,205 | | | | 14,832,728 | | | | (1,684,569) | | | | 13,148,159 |
| Industrial Materials Portfolio | | 160,435,882 | | | | 32,456,497 | | | | (4,258,183) | | | | 28,198,314 |
| Transportation Portfolio | | 82,825,387 | | | | 26,632,074 | | | | (961,249) | | | | 25,670,825 |
| |
| | | | | | | | | | | Undistributed | | | | |
| | | | | | | Undistributed | | | | Long-term | | | | Capital Loss |
| | | | | | | Ordinary Income | | | | Capital Gain | | | | Carryforward |
| Air Transportation Portfolio | | | | $ | | 16,055 | | $ | | 2,086,645 | | $ | | — |
| Automotive Portfolio | | | | | | — | | | | — | | | | (4,454,347) |
| Chemicals Portfolio | | | | | | 361,810 | | | | 3,779,981 | | | | — |
| Construction and Housing Portfolio | | | | | | — | | | | 6,621,629 | | | | — |
| Cyclical Industries Portfolio | | | | | | 1,226,810 | | | | 1,291,456 | | | | — |
| Defense and Aerospace Portfolio | | | | | | 7,576,034 | | | | 14,486,656 | | | | — |
| Environmental Portfolio | | | | | | — | | | | — | | | | (10,408) |
| Industrial Equipment Portfolio | | | | | | 239,611 | | | | 302,895 | | | | — |
| Industrial Materials Portfolio | | | | | | 2,829,879 | | | | 2,633,911 | | | | — |
| Transportation Portfolio | | | | | | 36,373 | | | | 2,369,130 | | | | — |
| |
| The tax character of distributions paid was as follows: | | | | | | | | | | | | | | |
| |
| February 28, 2006 | | | | | | | | | | | | | | |
| | | | | | | | | | | Long-term | | | | |
| | | | | Ordinary Income | | | | Capital Gains | | | | Total |
| Air Transportation Portfolio | | | | $ | | 106,269 | | $ | | 1,080,487 | | $ | | 1,186,756 |
| Automotive Portfolio | | | | | | 29,914 | | | | — | | | | 29,914 |
| Chemicals Portfolio | | | | | | 2,230,128 | | | | 2,864,122 | | | | 5,094,250 |
| Construction and Housing Portfolio | | | | | | 578,638 | | | | 1,537,020 | | | | 2,115,658 |
| Cyclical Industries Portfolio | | | | | | 940,945 | | | | 3,566,358 | | | | 4,507,303 |
| Defense and Aerospace Portfolio | | | | | | 5,246,497 | | | | 30,827,805 | | | | 36,074,302 |
| Industrial Equipment Portfolio | | | | | | 36,844 | | | | 3,199,441 | | | | 3,236,285 |
| Industrial Materials Portfolio | | | | | | 770,963 | | | | 3,187,200 | | | | 3,958,163 |
| Transportation Portfolio | | | | | | 250,837 | | | | 2,277,096 | | | | 2,527,933 |
| 1. Significant Accounting Policies - continued | | | | | | | | | | |
| |
| Income Tax Information and Distributions to Shareholders - continued | | | | | | | | | | |
| February 28, 2005 | | | | | | | | | | |
| | | | | | | Long-term | | | | |
| | | Ordinary Income | | | | Capital Gains | | | | Total |
| Air Transportation Portfolio | | $ 75,768 | | $ | | 413,778 | | $ | | 489,546 |
| Chemicals Portfolio | | 438,130 | | | | 1,035,799 | | | | 1,473,929 |
| Construction and Housing Portfolio | | — | | | | 3,155,787 | | | | 3,155,787 |
| Cyclical Industries Portfolio | | 1,323,616 | | | | 1,463,703 | | | | 2,787,319 |
| Defense and Aerospace Portfolio | | 3,314,240 | | | | 202,684 | | | | 3,516,924 |
| Industrial Equipment Portfolio | | — | | | | 1,909,931 | | | | 1,909,931 |
| Industrial Materials Portfolio | | 402,218 | | | | 2,648,240 | | | | 3,050,458 |
| Transportation Portfolio | | 339,816 | | | | 415,599 | | | | 755,415 |
Trading (Redemption) Fees. Shares in the funds held less than 30 days are subject to a redemption fee equal to .75% of the net asset value of shares redeemed. All redemption fees, including any estimated redemption fees paid by FMR, are retained by the fund and accounted for as an addition to paid in capital. Shareholders are also subject to an additional $7.50 fee for shares exchanged into another Fidelity fund (see Note 4).
Repurchase Agreements. FMR has received an Exemptive Order from the Securities and Exchange Commission (the SEC) which permits certain funds and other affiliated entities of FMR to transfer uninvested cash balances into joint trading accounts which are then invested in repurchase agreements. Certain funds may also invest directly with institutions in repurchase agreements. Repurchase agreements are collateralized by government or non-government securities. Upon settlement date, collateral is held in segregated accounts with custodian banks and may be obtained in the event of a default of the counterparty. Each applicable fund monitors, on a daily basis, the value of the collateral to ensure it is at least equal to the principal amount of the repurchase agreement (including accrued interest). In the event of a default by the counterparty, realization of the collateral proceeds could be delayed, during which time the value of the collateral may decline.
Restricted Securities. Certain funds may invest in securities that are subject to legal or contractual restrictions on resale. These securities generally may be resold in transactions exempt from registration or to the public if the securities are registered. Disposal of these securities may involve time-consuming negotiations and expense, and prompt sale at an acceptable price may be difficult. Information regarding restricted securities is included at the end of each applicable fund’s Schedule of Investments.
| 3. Purchases and Sales of Investments. | | | | |
| |
| Purchases and sales of securities, other than short-term securities and U.S. government securities, are noted in the table below. | | |
| | | Purchases ($) | | Sales ($) |
| Air Transportation Portfolio | | 106,934,777 | | 45,579,166 |
| Automotive Portfolio | | 36,531,005 | | 37,299,495 |
| Chemicals Portfolio | | 246,990,966 | | 342,370,231 |
| Construction and Housing Portfolio | | 397,126,680 | | 405,484,638 |
| Cyclical Industries Portfolio | | 117,277,221 | | 107,589,893 |
| Defense and Aerospace Portfolio | | 500,098,677 | | 365,746,293 |
| Environmental Portfolio | | 66,016,723 | | 35,508,722 |
| Industrial Equipment Portfolio | | 35,766,194 | | 18,792,349 |
| Industrial Materials Portfolio | | 176,092,351 | | 163,863,034 |
| Transportation Portfolio | | 115,529,328 | | 109,256,745 |
| |
| |
| 4. Fees and Other Transactions with Affiliates. | | | | |
Management Fee. FMR and its affiliates provide the funds with investment management related services for which the funds pay a monthly management fee. The management fee is the sum of an individual fund fee rate and a group fee rate. The individual fund fee rate is applied to each fund’s average net assets. The group fee rate is based upon the average net assets of all the mutual funds advised by FMR. The group fee rate decreases as
107 Annual Report
Notes to Financial Statements - continued
4. Fees and Other Transactions with Affiliates - continued
Management Fee - continued
assets under management increase and increases as assets under management decrease. For the period, each fund’s annual management fee rate expressed as a percentage of each fund’s average net assets was as follows:
| | | Individual Rate | | Group Rate | | Total |
| Air Transportation Portfolio | | 30% | | .27% | | .57% |
| Automotive Portfolio | | 30% | | .27% | | .57% |
| Chemicals Portfolio | | 30% | | .27% | | .57% |
| Construction and Housing Portfolio | | 30% | | .27% | | .57% |
| Cyclical Industries Portfolio | | 30% | | .27% | | .57% |
| Defense and Aerospace Portfolio | | 30% | | .27% | | .57% |
| Environmental Portfolio | | 30% | | .27% | | .57% |
| Industrial Equipment Portfolio | | 30% | | .27% | | .57% |
| Industrial Materials Portfolio | | 30% | | .27% | | .57% |
| Transportation Portfolio | | 30% | | .27% | | .57% |
Sales Load. Fidelity Distributors Corporation (FDC), an affiliate of FMR, is the general distributor of the funds. Shares purchased prior to October 12, 1990, were subject to a 1% deferred sales charge upon redemption or exchange to any other Fidelity fund (other than Select funds). Effective July 1, 2005, the deferred sales charge was eliminated. For the period, sales charge amounts retained by FDC were as follows:
| | | Retained |
| | | by FDC |
| Air Transportation Portfolio | | $ | | 45 |
| Automotive Portfolio | | | | 3 |
| Chemicals Portfolio | | | | 824 |
| Construction and Housing Portfolio | | | | 565 |
| Cyclical Industries Portfolio | | | | 122 |
| Defense and Aerospace Portfolio | | | | 82 |
| Environmental Portfolio | | | | 836 |
| Industrial Equipment Portfolio | | | | 417 |
| Industrial Materials Portfolio | | | | 227 |
| Transportation Portfolio | | | | 29 |
Transfer Agent Fees. Fidelity Service Company, Inc. (FSC), an affiliate of FMR, is the funds’ transfer, dividend disbursing and shareholder servicing agent. FSC receives account fees and asset-based fees that vary according to account size and type of account. FSC pays for typesetting, printing and mailing of shareholder reports, except proxy statements. For the period, the transfer agent fees were equivalent to the following annual rates expressed as a percentage of average net assets:
| Air Transportation Portfolio | | 38% |
| Automotive Portfolio | | 43% |
| Chemicals Portfolio | | 35% |
| Construction and Housing Portfolio | | 37% |
| Cyclical Industries Portfolio | | 35% |
| Defense and Aerospace Portfolio | | 33% |
| Environmental Portfolio | | 46% |
| Industrial Equipment Portfolio | | 28% |
| Industrial Materials Portfolio | | 35% |
| Transportation Portfolio | | 37% |
Accounting and Security Lending Fees. FSC maintains each fund’s accounting records. The accounting fee is based on the level of average net assets for the month. Under a separate contract, FSC administers the security lending program. The security lending fee is based on the number and duration of lending transactions.
Affiliated Central Funds. Certain funds may invest in Money Market Central Funds which seek preservation of capital and current income and are managed by Fidelity Investments Money Management, Inc. (FIMM) an affiliate of FMR.
The Money Market Central Funds do not pay a management fee.
|
4. Fees and Other Transactions with Affiliates - continued
Exchange Fees. FSC receives the proceeds of $7.50 to cover administrative costs associated with exchanges out of the funds to any other Fidelity Select fund or to any other Fidelity fund. For the period, exchange fees retained by FSC were as follows:
| | | Retained |
| | | by FSC |
| Air Transportation Portfolio | | $ | | 773 |
| Automotive Portfolio | | | | 2,003 |
| Chemicals Portfolio | | | | 7,875 |
| Construction and Housing Portfolio | | | | 11,520 |
| Cyclical Industries Portfolio | | | | 1,598 |
| Defense and Aerospace Portfolio | | | | 9,653 |
| Environmental Portfolio | | | | 270 |
| Industrial Equipment Portfolio | | | | 623 |
| Industrial Materials Portfolio | | | | 3,270 |
| Transportation Portfolio | | | | 2,910 |
Brokerage Commissions. Certain funds placed a portion of their portfolio transactions with brokerage firms which are affiliates of the investment adviser. The commissions paid to these affiliated firms were as follows:
| | | Amount |
| Air Transportation Portfolio | | $ 5,915 |
| Automotive Portfolio | | 14,177 |
| Chemicals Portfolio | | 43,981 |
| Construction and Housing Portfolio | | 26,108 |
| Cyclical Industries Portfolio | | 9,426 |
| Defense and Aerospace Portfolio | | 9,801 |
| Environmental Portfolio | | 9,361 |
| Industrial Equipment Portfolio | | 2,624 |
| Industrial Materials Portfolio | | 2,189 |
| Transportation Portfolio | | 15,308 |
Interfund Lending Program. Pursuant to an Exemptive Order issued by the SEC, the funds, along with other registered investment companies having management contracts with FMR, may participate in an interfund lending program. This program provides an alternative credit facility allowing the funds to borrow from, or lend money to, other participating affiliated funds. At period end, there were no interfund loans outstanding. Each applicable fund’s activity in this program during the period for which loans were outstanding was as follows:
| | | | | | | Average Daily | | Weighted Average | | | | |
| | | Borrower or Lender | | | | Loan Balance | | Interest Rate | | | | Interest Expense |
| Chemicals Portfolio | | Borrower | | $ | | 4,155,000 | | 2.87% | | $ | | 994 |
| |
| 5. Committed Line of Credit. | | | | | | | | | | | | |
Certain funds participate with other funds managed by FMR in a $4.2 billion credit facility (the “line of credit”) to be utilized for temporary or emergency purposes to fund shareholder redemptions or for other short-term liquidity purposes. The participating funds have agreed to pay commitment fees on their pro rata portion of the line of credit. During the period, there were no borrowings on this line of credit.
Certain funds lend portfolio securities from time to time in order to earn additional income. On the settlement date of the loan, each applicable fund receives collateral (in the form of U.S. Treasury obligations, letters of credit and/or cash) against the loaned securities and maintains collateral in an amount not less than 100% of the market value of the loaned securities during the period of the loan. The market value of the loaned securities is determined at the close of business of the funds and any additional required collateral is delivered to the funds on the next business day. If the borrower defaults on its obligation to return the securities loaned because of insolvency or other reasons, a fund could experience delays and costs in recovering the securities loaned or in gaining access to the collateral. Any cash collateral received is invested in the Fidelity Securities Lending Cash Central Fund. The value of loaned securities and cash collateral at period end are disclosed on each applicable fund’s Statement of Assets and Liabilities. Security lending income represents the income earned on investing cash collateral, less fees and expenses associated with the loan, plus any premium payments that may be received on the loan of certain types of securities. Security lending income is presented on each applicable fund’s Statement of Operations as a component of income from affiliated central funds.
109 Annual Report
Notes to Financial Statements - continued
7. Expense Reductions.
|
FMR voluntarily agreed to reimburse funds to the extent annual operating expenses exceeded certain levels of average net assets as noted in the table below. Some expenses, for example interest expense, are excluded from this reimbursement.
| The following funds were in reimbursement during the period: | | | | | | |
| | | | | | | Reimbursement |
| | | Expense Limitations | | | | from adviser |
| Automotive Portfolio | | 1.25% | | $ | | 60,932 |
| Environmental Portfolio | | 1.25% | | | | 31,764 |
Many of the brokers with whom FMR places trades on behalf of certain funds provided services to these funds in addition to trade execution. These services included payments of expenses on behalf of each applicable fund. In addition, through arrangements with each applicable fund’s custodian and transfer agent, credits realized as a result of uninvested cash balances were used to reduce each applicable fund’s expenses. All of the applicable expense reductions are noted in the table below.
| | | | | | | | | | | Transfer |
| | | | | Custody | | | | | | Agent |
| | | Brokerage Service | | expense | | | | | | expense |
| | | Arrangements | | reduction | | | | | | reduction |
| Air Transportation Portfolio | | $ 24,366 | | $ | | — | | $ | | — |
| Automotive Portfolio | | 11,155 | | | | — | | | | — |
| Chemicals Portfolio | | 81,502 | | | | — | | | | 1,221 |
| Construction and Housing Portfolio | | 85,469 | | | | — | | | | 2,392 |
| Cyclical Industries Portfolio | | 28,119 | | | | — | | | | 1,703 |
| Defense and Aerospace Portfolio | | 121,257 | | | | 94 | | | | 6,591 |
| Environmental Portfolio | | 18,035 | | | | — | | | | — |
| Industrial Equipment Portfolio | | 3,716 | | | | — | | | | 546 |
| Industrial Materials Portfolio | | 56,399 | | | | — | | | | — |
| Transportation Portfolio | | 19,187 | | | | — | | | | 99 |
| |
| |
| 8. Other. | | | | | | | | | | |
The funds’ organizational documents provide former and current trustees and officers with a limited indemnification against liabilities arising in connection with the performance of their duties to the funds. In the normal course of business, the funds may also enter into contracts that provide general indemnifications. The funds’ maximum exposure under these arrangements is unknown as this would be dependent on future claims that may be made against the funds. The risk of material loss from such claims is considered remote.
In October 2002, a lawsuit was commenced against Construction and Housing Portfolio and numerous other defendants as a defendants’ class action suit by the Chapter 11 estate of Owens Corning. The Owens Corning estate alleges that 16 dividend payments made by Owens Corning between 1996 and the filing of Owens Corning’s petition for Chapter 11 relief in October 2000 were fraudulent conveyances and, thus, the Owens Corning estate seeks to recover those dividends. During this period Construction and Housing Portfolio received dividends in the amount of $42,780. The lawsuit has been stayed by order of the Bankruptcy Court for the District of Delaware until August 31, 2006. The fund intends to defend the proceedings vigorously.
Report of Independent Registered Public Accounting Firm
To the Trustees of Fidelity Select Portfolios and the Shareholders of Air Transportation Portfolio, Automotive Portfolio, Chemicals Portfolio, Construction and Housing Portfolio, Cyclical Industries Portfolio, Defense and Aerospace Portfolio, Environmental Portfolio, Industrial Equipment Portfolio, Industrial Materials Portfolio, and Transportation Portfolio:
In our opinion, the accompanying statements of assets and liabilities, including the schedules of investments, and the related statements of operations and of changes in net assets and the financial highlights present fairly, in all material respects, the financial position of Air Transportation Portfolio, Automotive Portfolio, Chemicals Portfolio, Construction and Housing Portfolio, Cyclical Industries Portfolio, Defense and Aerospace Portfolio, Environmental Portfolio, Industrial Equipment Portfolio, Industrial Materials Portfolio, and Transportation Portfolio (funds of Select Portfolios) at February 28, 2006, and the results of each of their operations, the changes in each of their net assets and the financial highlights for each of the periods indicated, in conformity with accounting principles generally accepted in the United States of America. These financial statements and financial highlights (hereafter referred to as “financial statements”) are the responsibility of the Fidelity Select Portfolios’ management; our responsibility is to express an opinion on these financial statements based on our audit. We conducted our audit of these financial statements in accordance with the standards of the Public Company Accounting Oversight Board (United States). Those standards require that we plan and perform the audit to obtain reasonable assurance about whether the financial statements are free of material misstatement. An audit includes examining, on a test basis, evidence supporting the amounts and disclosures in the financial statements, assessing the accounting principles used and significant estimates made by management, and evaluating the overall financial statement presentation. We believe that our audit, which included confirmation of securities at February 28, 2006 by correspondence with the custodian and brokers, provide a reasonable basis for our opinion.
/s/ PricewaterhouseCoopers LLP
PricewaterhouseCoopers LLP
Boston, Massachusetts
April 13, 2006
|
111 Annual Report
Trustees and Officers
The Trustees, Members of the Advisory Board, and executive officers of the trust and funds, as applicable, are listed below. The Board of Trustees governs each fund and is responsible for protecting the interests of shareholders. The Trustees are experienced executives who meet periodically throughout the year to oversee each fund’s activities, review contractual arrangements with companies that provide services to each fund, and review each fund’s performance. Except for William O. McCoy, each of the Trustees oversees 326 funds advised by FMR or an affiliate. Mr. McCoy oversees 328 funds advised by FMR or an affiliate.
The Trustees hold office without limit in time except that (a) any Trustee may resign; (b) any Trustee may be removed by written instrument, signed by at least two-thirds of the number of Trustees prior to such removal; (c) any Trustee who requests to be retired or who has become incapacitated by illness or injury may be retired by written instrument signed by a majority of the other Trustees; and (d) any Trustee may be removed at any special meeting of shareholders by a two-thirds vote of the outstanding voting securities of the trust. Each Trustee who is not an interested person (as defined in the 1940 Act) (Independent Trustee), shall retire not later than the last day of the calendar year in which his or her 72nd birthday occurs. The Independent Trustees may waive this mandatory retirement age policy with respect to individual Trustees. The executive officers and Advisory Board Members hold office without limit in time, except that any officer and Advisory Board Member may resign or may be removed by a vote of a majority of the Trustees at any regular meeting or any special meeting of the Trustees. Except as indicated, each individual has held the office shown or other offices in the same company for the past five years.
The funds’ Statement of Additional Information (SAI) includes more information about the Trustees. To request a free copy, call Fidelity at 1-800-544-8544.
Interested Trustees*:
Correspondence intended for each Trustee who is an interested person may be sent to Fidelity Investments, 82 Devonshire Street, Boston, Massachusetts 02109.
| Name, Age; Principal Occupation |
| |
| Edward C. Johnson 3d (75) |
| |
| Year of Election or Appointment: 1980 |
| Mr. Johnson is Chairman of the Board of Trustees. Mr. Johnson serves as Chief Executive Officer, Chairman, and a Director of FMR |
| Corp.; a Director and Chairman of the Board and of the Executive Committee of FMR; Chairman and a Director of Fidelity Re- |
| search & Analysis Company (FRAC); Chairman and a Director of Fidelity Investments Money Management, Inc.; and Chairman |
| (2001-present) and a Director (2000-present) of FMR Co., Inc. |
| |
| Stephen P. Jonas (53) |
| |
| Year of Election or Appointment: 2005 |
| Mr. Jonas is Senior Vice President of Air Transportation (2005-present), Automotive (2005-present), Chemicals (2005-present), |
| Construction and Housing (2005-present), Cyclical Industries (2005-present), Defense and Aerospace (2005-present), Environmen- |
| tal (2005-present), Industrial Equipment (2005-present), Industrial Materials (2005-present), and Transportation (2005-present). He |
| also serves as Senior Vice President of other Fidelity funds (2005-present). Mr. Jonas is Executive Director of FMR (2005-present). |
| Previously, Mr. Jonas served as President of Fidelity Enterprise Operations and Risk Services (2004-2005), Chief Administrative |
| Officer (2002-2004), and Chief Financial Officer of FMR Co. (1998-2000). Mr. Jonas has been with Fidelity Investments since |
| 1987 and has held various financial and management positions including Chief Financial Officer of FMR. In addition, he serves |
| on the Boards of Boston Ballet (2003-present) and Simmons College (2003-present). |
| |
| Robert L. Reynolds (53) |
| |
| Year of Election or Appointment: 2003 |
| Mr. Reynolds is a Director (2003-present) and Chief Operating Officer (2002-present) of FMR Corp. He also serves on the Board |
| at Fidelity Investments Canada, Ltd. (2000-present). Previously, Mr. Reynolds served as President of Fidelity Investments Institutional |
| Retirement Group (1996-2000). |
* Trustees have been determined to be “Interested Trustees” by virtue of, among other things, their affiliation with the trust or various entities under common control with FMR.
Annual Report 112
Independent Trustees:
Correspondence intended for each Independent Trustee (that is, the Trustees other than the Interested Trustees) may be sent to Fidelity Investments, P.O. Box 55235, Boston, Massachusetts 02205-5235.
| Name, Age; Principal Occupation |
| |
| Dennis J. Dirks (57) |
| |
| Year of Election or Appointment: 2005 |
| Prior to his retirement in May 2003, Mr. Dirks was Chief Operating Officer and a member of the Board of The Depository Trust & |
| Clearing Corporation (DTCC) (1999-2003). He also served as President, Chief Operating Officer, and Board member of The De- |
| pository Trust Company (DTC) (1999-2003) and President and Board member of the National Securities Clearing Corporation |
| (NSCC) (1999-2003). In addition, Mr. Dirks served as Chief Executive Officer and Board member of the Government Securities |
| Clearing Corporation (2001-2003) and Chief Executive Officer and Board member of the Mortgage-Backed Securities Clearing |
| Corporation (2001-2003). Mr. Dirks also serves as a Trustee and a member of the Finance Committee of Manhattan College |
| (2005-present) and a Trustee and a member of the Finance Committee of AHRC of Nassau County (2006-present). |
| |
| Robert M. Gates (62) |
| |
| Year of Election or Appointment: 1997 |
| Dr. Gates is Chairman of the Independent Trustees (2006-present). Dr. Gates is President of Texas A&M University (2002-present). |
| He was Director of the Central Intelligence Agency (CIA) from 1991 to 1993. From 1989 to 1991, Dr. Gates served as Assistant |
| to the President of the United States and Deputy National Security Advisor. Dr. Gates is a Director of NACCO Industries, Inc. |
| (mining and manufacturing), Parker Drilling Co., Inc. (drilling and rental tools for the energy industry, 2001-present), and Brinker |
| International (restaurant management, 2003-present). Previously, Dr. Gates served as a Director of LucasVarity PLC (automotive |
| components and diesel engines), a Director of TRW Inc. (automotive, space, defense, and information technology), and Dean of |
| the George Bush School of Government and Public Service at Texas A&M University (1999-2001). |
| |
| George H. Heilmeier (69) |
| |
| Year of Election or Appointment: 2004 |
| Dr. Heilmeier is Chairman Emeritus of Telcordia Technologies (communication software and systems), where prior to his retirement, |
| he served as company Chairman and Chief Executive Officer. He currently serves on the Boards of Directors of The Mitre Corpo- |
| ration (systems engineering and information technology support for the government), and HRL Laboratories (private research and |
| development, 2004-present). He is Chairman of the General Motors Science & Technology Advisory Board and a Life Fellow of |
| the Institute of Electrical and Electronics Engineers (IEEE). Dr. Heilmeier is a member of the Defense Science Board and the National |
| Security Agency Advisory Board. He is also a member of the National Academy of Engineering, the American Academy of Arts |
| and Sciences, and the Board of Overseers of the School of Engineering and Applied Science of the University of Pennsylvania. |
| Previously, Dr. Heilmeier served as a Director of TRW Inc. (automotive, space, defense, and information technology, 1992-2002), |
| Compaq (1994-2002), Automatic Data Processing, Inc. (ADP) (technology-based business outsourcing, 1995-2002), INET |
| Technologies Inc. (telecommunications network surveillance, 2001-2004), and Teletech Holdings (customer management services). |
| He is the recipient of the 2005 Kyoto Prize in Advanced Technology for his invention of the liquid crystal display. |
| |
| Marie L. Knowles (59) |
| |
| Year of Election or Appointment: 2001 |
| Prior to Ms. Knowles’ retirement in June 2000, she served as Executive Vice President and Chief Financial Officer of Atlantic Rich- |
| field Company (ARCO) (diversified energy, 1996-2000). From 1993 to 1996, she was a Senior Vice President of ARCO and |
| President of ARCO Transportation Company. She served as a Director of ARCO from 1996 to 1998. She currently serves as a |
| Director of Phelps Dodge Corporation (copper mining and manufacturing) and McKesson Corporation (healthcare service, |
| 2002-present). Ms. Knowles is a Trustee of the Brookings Institution and the Catalina Island Conservancy and also serves as a |
| member of the Advisory Board for the School of Engineering of the University of Southern California. |
| |
| Ned C. Lautenbach (62) |
| |
| Year of Election or Appointment: 2000 |
| Mr. Lautenbach has been a partner of Clayton, Dubilier & Rice, Inc. (private equity investment firm) since September 1998. Pre- |
| viously, Mr. Lautenbach was with the International Business Machines Corporation (IBM) from 1968 until his retirement in 1998. |
| Mr. Lautenbach serves as a Director of Italtel Holding S.p.A. (telecommunications (Milan, Italy), 2004-present) and Eaton Corpora- |
| tion (diversified industrial) as well as the Philharmonic Center for the Arts in Naples, Florida. He also is a member of the Board of |
| Trustees of Fairfield University (2005-present), as well as a member of the Council on Foreign Relations. |
113 Annual Report
Trustees and Officers - continued
| Name, Age; Principal Occupation |
| |
| William O. McCoy (72) |
| |
| Year of Election or Appointment: 1997 |
| Prior to his retirement in December 1994, Mr. McCoy was Vice Chairman of the Board of BellSouth Corporation (telecommunica- |
| tions) and President of BellSouth Enterprises. He is currently a Director of Duke Realty Corporation (real estate), and Progress |
| Energy, Inc. (electric utility). He is also a partner of Franklin Street Partners (private investment management firm) and a member of |
| the Research Triangle Foundation Board. In addition, Mr. McCoy served as the Interim Chancellor (1999-2000) and a member of |
| the Board of Visitors for the University of North Carolina at Chapel Hill and currently serves as Chairman of the Board of Directors |
| of the University of North Carolina Health Care System and the Board of Visitors of the Kenan-Flagler Business School (University |
| of North Carolina at Chapel Hill). He also served as Vice President of Finance for the University of North Carolina (16-school |
| system). |
| |
| Cornelia M. Small (61) |
| |
| Year of Election or Appointment: 2005 |
| Ms. Small is a member (2000-present) and Chairperson (2002-present) of the Investment Committee, and a member |
| (2002-present) of the Board of Trustees of Smith College. Previously, she served as Chief Investment Officer (1999-2000), Director |
| of Global Equity Investments (1996-1999), and a member of the Board of Directors of Scudder, Stevens & Clark (1990-1997) and |
| Scudder Kemper Investments (1997-1999). In addition, Ms. Small served as Co-Chair (2000-2003) of the Annual Fund for the |
| Fletcher School of Law and Diplomacy. |
| |
| William S. Stavropoulos (66) |
| |
| Year of Election or Appointment: 2002 |
| Mr. Stavropoulos is Chairman of the Board (2000-present) and a Member of the Board of Directors of The Dow Chemical |
| Company. Since joining The Dow Chemical Company in 1967, Mr. Stavropoulos served in numerous senior management posi- |
| tions, including President (1993-2000; 2002-2003), CEO (1995-2000; 2002-2004), and Chairman of the Executive Committee |
| (2000-2004). Currently, he is a Director of NCR Corporation (data warehousing and technology solutions), BellSouth Corporation |
| (telecommunications), Chemical Financial Corporation, Maersk Inc. (industrial conglomerate, 2002-present), and Metalmark Capi- |
| tal (private equity investment firm, 2005-present). He also serves as a member of the Board of Trustees of the American Enterprise |
| Institute for Public Policy Research. In addition, Mr. Stavropoulos is a member of The Business Council, J.P. Morgan International |
| Council and the University of Notre Dame Advisory Council for the College of Science. |
| |
| Kenneth L. Wolfe (67) |
| |
| Year of Election or Appointment: 2005 |
| Prior to his retirement in 2001, Mr. Wolfe was Chairman and Chief Executive Officer of Hershey Foods Corporation (1993-2001). |
| He currently serves as a member of the boards of Adelphia Communications Corporation (2003-present), Bausch & Lomb, Inc., |
| and Revlon Inc. (2004-present). |
Advisory Board Members and Executive Officers:
Correspondence intended for Messrs. Keyes and Gamper may be sent to Fidelity Investments, P.O. Box 55235, Boston, Massachusetts 02205-5235. Correspondence intended for each executive officer and Mr. Lynch may be sent to Fidelity Investments, 82 Devonshire Street, Boston, Massachu-setts 02109.
| Name, Age; Principal Occupation |
| |
| Albert R. Gamper, Jr. (63) |
| |
| Year of Election or Appointment: 2005 |
| Member of the Advisory Board of Fidelity Select Portfolios. Mr. Gamper also serves as a Trustee (2006-present) or Member of the |
| Advisory Board (2005-present) of other investment companies advised by FMR. Prior to his retirement in December 2004, Mr. |
| Gamper served as Chairman of the Board of CIT Group Inc. (commercial finance). During his tenure with CIT Group Inc. Mr. |
| Gamper served in numerous senior management positions, including Chairman (1987-1989; 1999-2001; 2002-2004), Chief |
| Executive Officer (1987-2004), and President (1989-2002). He currently serves as a member of the Board of Directors of Public |
| Service Enterprise Group (utilities, 2001-present), Chairman of the Board of Governors, Rutgers University (2004-present), and |
| Chairman of the Board of Saint Barnabas Health Care System. |
| |
| James H. Keyes (66) |
| |
| Year of Election or Appointment: 2006 |
| Member of the Advisory Board of Fidelity Select Portfolios. Prior to his retirement in 2003, Mr. Keyes was Chairman, President, |
| and Chief Executive Officer of Johnson Controls, Inc. (automotive supplier, 1993-2003). He currently serves as a member of the |
| �� boards of LSI Logic Corporation (semiconductor technologies, 1984-present), Navistar International Corporation (manufacture and |
| sale of trucks, buses, and diesel engines, 2002-present), and Pitney Bowes, Inc. (integrated mail, messaging, and document man- |
| agement solutions, 1998-present). |
Annual Report 114
| Name, Age; Principal Occupation |
| |
| Peter S. Lynch (62) |
| |
| Year of Election or Appointment: 2003 |
| Member of the Advisory Board of Fidelity Select Portfolios. Vice Chairman and a Director of FMR, and Vice Chairman |
| (2001-present) and a Director (2000-present) of FMR Co., Inc. Previously, Mr. Lynch served as a Trustee of the Fidelity funds |
| (1990-2003). In addition, he serves as a Trustee of Boston College, Massachusetts Eye & Ear Infirmary, Historic Deerfield, John F. |
| Kennedy Library, and the Museum of Fine Arts of Boston. |
| |
| Eric D. Roiter (57) |
| |
| Year of Election or Appointment: 1998 |
| Secretary of Air Transportation, Automotive, Chemicals, Construction and Housing, Cyclical Industries, Defense and Aerospace, |
| Environmental, Industrial Equipment, Industrial Materials, and Transportation. He also serves as Secretary of other Fidelity funds; |
| Vice President, General Counsel, and Secretary of FMR Co., Inc. (2001-present) and FMR; Assistant Secretary of Fidelity Manage- |
| ment & Research (U.K.) Inc. (2001-present), Fidelity Research & Analysis Company (2001-present), and Fidelity Investments |
| Money Management, Inc. (2001-present). Mr. Roiter is an Adjunct Member, Faculty of Law, at Boston College Law School |
| (2003-present). Previously, Mr. Roiter served as Vice President and Secretary of Fidelity Distributors Corporation (FDC) |
| (1998-2005). |
| |
| Stuart Fross (46) |
| |
| Year of Election or Appointment: 2003 |
| Assistant Secretary of Air Transportation, Automotive, Chemicals, Construction and Housing, Cyclical Industries, Defense and |
| Aerospace, Environmental, Industrial Equipment, Industrial Materials, and Transportation. Mr. Fross also serves as Assistant Secre- |
| tary of other Fidelity funds (2003-present), Vice President and Secretary of FDC (2005-present), and is an employee of FMR. |
| |
| Christine Reynolds (47) |
| |
| Year of Election or Appointment: 2004 |
| President and Treasurer of Air Transportation, Automotive, Chemicals, Construction and Housing, Cyclical Industries, Defense and |
| Aerospace, Environmental, Industrial Equipment, Industrial Materials, and Transportation. Ms. Reynolds also serves as President |
| and Treasurer of other Fidelity funds (2004-present) and is a Vice President (2003-present) and an employee (2002-present) of |
| FMR. Before joining Fidelity Investments, Ms. Reynolds worked at PricewaterhouseCoopers LLP (PwC) (1980-2002), where she was |
| most recently an audit partner with PwC’s investment management practice. |
| |
| R. Stephen Ganis (66) |
| |
| Year of Election or Appointment: 2006 |
| Anti-Money Laundering (AML) officer of Air Transportation, Automotive, Chemicals, Construction and Housing, Cyclical Industries, |
| Defense and Aerospace, Environmental, Industrial Equipment, Industrial Materials, and Transportation. Mr. Ganis also serves as |
| AML officer of other Fidelity funds (2006-present) and FMR Corp. (2003-present). Before joining Fidelity Investments, Mr. Ganis |
| practiced law at Goodwin Procter, LLP (2000-2002). |
| |
| Paul M. Murphy (58) |
| |
| Year of Election or Appointment: 2005 |
| Chief Financial Officer of Air Transportation, Automotive, Chemicals, Construction and Housing, Cyclical Industries, Defense and |
| Aerospace, Environmental, Industrial Equipment, Industrial Materials, and Transportation. Mr. Murphy also serves as Chief Finan- |
| cial Officer of other Fidelity funds (2005-present). He also serves as Senior Vice President of Fidelity Pricing and Cash Manage- |
| ment Services Group (FPCMS). |
| |
| Kenneth A. Rathgeber (58) |
| |
| Year of Election or Appointment: 2004 |
| Chief Compliance Officer of Air Transportation, Automotive, Chemicals, Construction and Housing, Cyclical Industries, Defense |
| and Aerospace, Environmental, Industrial Equipment, Industrial Materials, and Transportation. Mr. Rathgeber also serves as Chief |
| Compliance Officer of other Fidelity funds (2004-present) and Executive Vice President of Risk Oversight for Fidelity Investments |
| (2002-present). He is Chief Compliance Officer of FMR (2005-present), FMR Co., Inc. (2005-present), Fidelity Management & |
| Research (U.K.) Inc. (2005-present), Fidelity Research & Analysis Company (2005-present), Fidelity Investments Money Manage- |
| ment, Inc. ( 2005-present), and Strategic Advisers, Inc. (2005-present). Previously, Mr. Rathgeber served as Executive Vice Presi- |
| dent and Chief Operating Officer for Fidelity Investments Institutional Services Company, Inc. (1998-2002). |
| |
| Bryan A. Mehrmann (44) |
| |
| Year of Election or Appointment: 2005 |
| Deputy Treasurer of Air Transportation, Automotive, Chemicals, Construction and Housing, Cyclical Industries, Defense and Aero- |
| space, Environmental, Industrial Equipment, Industrial Materials, and Transportation. Mr. Mehrmann also serves as Deputy |
| Treasurer of other Fidelity funds (2005-present) and is an employee of FMR. Previously, Mr. Mehrmann served as Vice President of |
| Fidelity Investments Institutional Services Group (FIIS)/Fidelity Investments Institutional Operations Corporation, Inc. (FIIOC) Client |
| Services (1998-2004). |
115 Annual Report
Trustees and Officers - continued
| Name, Age; Principal Occupation |
| |
| Kimberley H. Monasterio (42) |
| |
| Year of Election or Appointment: 2004 |
| Deputy Treasurer of Air Transportation, Automotive, Chemicals, Construction and Housing, Cyclical Industries, Defense and Aero- |
| space, Environmental, Industrial Equipment, Industrial Materials, and Transportation. Ms. Monasterio also serves as Deputy |
| Treasurer of other Fidelity funds (2004) and is an employee of FMR (2004). Before joining Fidelity Investments, Ms. Monasterio |
| served as Treasurer (2000-2004) and Chief Financial Officer (2002-2004) of the Franklin Templeton Funds and Senior Vice Presi- |
| dent of Franklin Templeton Services, LLC (2000-2004). |
| |
| Kenneth B. Robins (36) |
| |
| Year of Election or Appointment: 2005 |
| Deputy Treasurer of Air Transportation, Automotive, Chemicals, Construction and Housing, Cyclical Industries, Defense and Aero- |
| space, Environmental, Industrial Equipment, Industrial Materials, and Transportation. Mr. Robins also serves as Deputy Treasurer of |
| other Fidelity funds (2005-present) and is an employee of FMR (2004-present). Before joining Fidelity Investments, Mr. Robins |
| worked at KPMG LLP, where he was a partner in KPMG’s department of professional practice (2002-2004) and a Senior Manager |
| (1999-2000). In addition, Mr. Robins served as Assistant Chief Accountant, United States Securities and Exchange Commission |
| (2000-2002). |
| |
| Robert G. Byrnes (39) |
| |
| Year of Election or Appointment: 2005 |
| Assistant Treasurer of Air Transportation, Automotive, Chemicals, Construction and Housing, Cyclical Industries, Defense and Aero- |
| space, Environmental, Industrial Equipment, Industrial Materials, and Transportation. Mr. Byrnes also serves as Assistant Treasurer |
| of other Fidelity funds (2005-present) and is an employee of FMR (2005-present). Previously, Mr. Byrnes served as Vice President |
| of FPCMS (2003-2005). Before joining Fidelity Investments, Mr. Byrnes worked at Deutsche Asset Management where he served |
| as Vice President of the Investment Operations Group (2000-2003). |
| |
| John H. Costello (59) |
| |
| Year of Election or Appointment: 1986, 1989, or 1997 |
| Assistant Treasurer of Air Transportation (1986), Automotive (1986), Chemicals (1986), Construction and Housing (1986), Cyclical |
| Industries (1997), Defense and Aerospace (1986), Environmental (1989), Industrial Equipment (1986), Industrial Materials (1986), |
| and Transportation (1986). Mr. Costello also serves as Assistant Treasurer of other Fidelity funds and is an employee of FMR. |
| |
| Peter L. Lydecker (52) |
| |
| Year of Election or Appointment: 2004 |
| Assistant Treasurer of Air Transportation, Automotive, Chemicals, Construction and Housing, Cyclical Industries, Defense and Aero- |
| space, Environmental, Industrial Equipment, Industrial Materials, and Transportation. Mr. Lydecker also serves as Assistant |
| Treasurer of other Fidelity funds (2004) and is an employee of FMR. |
| |
| Mark Osterheld (50) |
| |
| Year of Election or Appointment: 2003 |
| Assistant Treasurer of Air Transportation, Automotive, Chemicals, Construction and Housing, Cyclical Industries, Defense and Aero- |
| space, Environmental, Industrial Equipment, Industrial Materials, and Transportation. Mr. Osterheld also serves as Assistant |
| Treasurer of other Fidelity funds (2002) and is an employee of FMR. |
| |
| Gary W. Ryan (47) |
| |
| Year of Election or Appointment: 2005 |
| Assistant Treasurer of Air Transportation, Automotive, Chemicals, Construction and Housing, Cyclical Industries, Defense and Aero- |
| space, Environmental, Industrial Equipment, Industrial Materials, and Transportation. Mr. Ryan also serves as Assistant Treasurer of |
| other Fidelity funds (2005-present) and is an employee of FMR (2005-present). Previously, Mr. Ryan served as Vice President of |
| Fund Reporting in FPCMS (1999-2005). |
| |
| Salvatore Schiavone (40) |
| |
| Year of Election or Appointment: 2005 |
| Assistant Treasurer of Air Transportation, Automotive, Chemicals, Construction and Housing, Cyclical Industries, Defense and Aero- |
| space, Environmental, Industrial Equipment, Industrial Materials, and Transportation. Mr. Schiavone also serves as Assistant Trea- |
| surer of other Fidelity funds (2005-present) and is an employee of FMR (2005-present). Before joining Fidelity Investments, Mr. |
| Schiavone worked at Deutsche Asset Management, where he most recently served as Assistant Treasurer (2003-2005) of the |
| Scudder Funds and Vice President and Head of Fund Reporting (1996-2003). |
Annual Report 116
The Board of Trustees of each fund voted to pay to shareholders of record at the opening of business on record date, the following distributions per share derived from capital gains realized from sales of portfolio securities, and dividends derived from net investment income:
| | | Pay Date | | Record Date | | Dividends | | Capital Gains |
| Air Transportation | | 04/17/06 | | 04/13/06 | | $— | | $ .62 |
| Chemicals | | 04/17/06 | | 04/13/06 | | $.27 | | $2.71 |
| Construction and Housing | | 04/17/06 | | 04/13/06 | | $— | | $1.42 |
| Cyclical Industries | | 04/17/06 | | 04/13/06 | | $.02 | | $ .51 |
| Defense and Aerospace | | 04/17/06 | | 04/13/06 | | $.02 | | $1.76 |
| Industrial Equipment | | 04/17/06 | | 04/13/06 | | $.02 | | $ .17 |
| Industrial Materials | | 04/17/06 | | 04/13/06 | | $.08 | | $1.37 |
| Transportation | | 04/17/06 | | 04/13/06 | | $.02 | | $1.01 |
The funds hereby designate as capital gain dividend the amounts noted below for the taxable year ended February 28, 2006 or, if subsequently determined to be different, the net capital gain of such year.
| | | February 28, 2006 |
| Air Transportation | | $ | | 3,134,219 |
| Chemicals | | $ | | 8,464,296 |
| Construction and Housing | | $ | | 6,911,394 |
| Cyclical Industries | | $ | | 4,342,510 |
| Defense and Aerospace | | $ | | 43,953,120 |
| Industrial Equipment | | $ | | 2,517,461 |
| Industrial Materials | | $ | | 4,038,813 |
| Transportation | | $ | | 4,114,183 |
A percentage of the dividends distributed during the fiscal year for the following funds qualifies for the dividends-received deduction for corporate shareholders:
| Air Transportation | | April 2005 | | 100% |
| | | December 2005 | | 100% |
| Automotive | | April 2005 | | 100% |
| | | December 2005 | | 100% |
| Chemicals | | April 2005 | | 70% |
| | | December 2005 | | 100% |
| Construction and Housing | | April 2005 | | 100% |
| Cyclical Industries | | April 2005 | | 16% |
| | | December 2005 | | 100% |
| Defense and Aerospace | | December 2005 | | 100% |
| Industrial Equipment | | December 2005 | | 100% |
| Industrial Materials | | April 2005 | | 100% |
| | | December 2005 | | 100% |
| Transportation | | December 2005 | | 100% |
A percentage of the dividends distributed during the fiscal year for the following funds may be taken into account as a dividend for purposes of the maximum rate under section 1(h)(11) of the Internal Revenue Code.
117 Annual Report
| Distributions - continued | | | | |
| |
| |
| Air Transportation | | April 2005 | | 100% |
| | | December 2005 | | 100% |
| Automotive | | April 2005 | | 100% |
| | | December 2005 | | 100% |
| Chemicals | | April 2005 | | 74% |
| | | December 2005 | | 100% |
| Construction and Housing | | April 2005 | | 100% |
| Cyclical Industries | | April 2005 | | 15% |
| | | December 2005 | | 100% |
| Defense and Aerospace | | December 2005 | | 100% |
| Industrial Equipment | | December 2005 | | 100% |
| Industrial Materials | | April 2005 | | 100% |
| | | December 2005 | | 100% |
| Transportation | | December 2005 | | 100% |
The funds will notify shareholders in January 2007 of amounts for use in preparing 2006 income tax returns.
Board Approval of Investment Advisory Contracts and Management Fees
Select Air Transportation Select Automotive Select Chemicals Select Construction and Housing Select Cyclical Industries Select Defense and Aerospace Select Environmental Select Industrial Equipment Select Industrial Materials Select Transportation
On January 19, 2006, the Board of Trustees, including the Independent Trustees (together, the Board), voted to approve a general research services agreement (the Agreement) between FMR, FMR Co., Inc. (FMRC), Fidelity Investments Money Management, Inc. (FIMM), and Fidelity Research & Analysis Company (FRAC) (together, the Investment Advisers) for each fund, effective January 20, 2006, pursuant to which FRAC may provide general research and investment advisory support services to FMRC and FIMM. The Board considered that it has approved previously various sub-advisory agreements for each fund with affiliates of FMR that allow FMR to obtain research, non-discretionary advice, or discretionary portfolio management at no additional expense to each fund. The Board, assisted by the advice of fund counsel and independent Trustees’ counsel, considered a broad range of information and determined that it would be beneficial for each fund to access the research and investment advisory support services supplied by FRAC at no additional expense to each fund.
The Board reached this determination in part because the new arrangement will involve no changes in (i) the contractual terms of and fees payable under each fund’s management contract or sub-advisory agreements; (ii) the investment process or strategies employed in the management of each fund’s assets; (iii) the nature or level of services provided under each fund’s management contract or sub-advisory agreements; (iv) the day-to-day management of each fund or the persons primarily responsible for such management; or (v) the ultimate control or beneficial ownership of FMR, FMRC, or FIMM. The Board also considered that the establishment of each Agreement would not necessitate prior shareholder approval of the Agreement or result in an assignment and termination of each fund’s management contract or sub-advisory agreements under the Investment Company Act of 1940.
Because the Board was approving an arrangement with FRAC under which each fund will not bear any additional management fees or expenses and under which each fund’s portfolio manager would not change, it did not consider each fund’s investment performance, competitiveness of management fee and total expenses, costs of services and profitability, or economies of scale to be significant factors in its decision.
In connection with its future renewal of each fund’s management contract and sub-advisory agreements, the Board will consider: (i) the nature, extent, and quality of services provided to each fund, including shareholder and administrative services and investment performance; (ii) the competitiveness of each fund’s management fee and total expenses; (iii) the costs of the services and profitability, including the revenues earned and the expenses incurred by Fidelity in conducting the business of developing, marketing, distributing, managing, administering, and servicing each fund and its shareholders; and (iv) whether there have been economies of scale in respect of the management of the Fidelity funds, whether the Fidelity funds (including each fund) have appropriately benefited from any such economies of scale, and whether there is potential for realization of any further economies.
Based on its evaluation of all of the conclusions noted above, and after considering all material factors, the Board ultimately concluded that each fund’s Agreement is fair and reasonable, and that each fund’s Agreement should be approved.
119 Annual Report
Managing Your Investments
Fidelity offers several ways to conveniently manage your personal investments via your telephone or PC. You can access your account information, conduct trades and research your investments 24 hours a day.
By Phone
Fidelity Automated Service Telephone provides a single toll-free number to access account balances, positions, quotes and trading. It’s easy to navigate the service, and on your first call, the system will help you create a personal identification number (PIN) for security.

By PC
Fidelity’s web site on the Internet provides a wide range of information, including daily financial news, fund performance, interactive planning tools and news about Fidelity products and services.

* When you call the quotes line, please remember that a fund’s yield and return will vary and, except for money market funds, share price will also vary. This means that you may have a gain or loss when you sell your shares. There is no assurance that money market funds will be able to maintain a stable $1 share price; an investment in a money market fund is not insured or guaranteed by the U.S. government. Total returns are historical and include changes in share price, reinvestment of dividends and capital gains, and the effects of any sales charges.
Annual Report 120
Investment Adviser
Fidelity Management & Research Company
Boston, MA
Investment Sub-Advisers
FMR Co., Inc.
Fidelity Management & Research (U.K.) Inc.
Fidelity Research & Analysis Company (formerly Fidelity Management & Research (Far East) Inc.)
Fidelity Investments Japan Limited
Fidelity International Investment Advisors
Fidelity International Investment Advisors (U.K. Limited)
General Distributor
Fidelity Distributors Corporation
Boston, MA
Transfer and Service Agent
Fidelity Service Company, Inc.
Boston, MA
Custodian
Brown Brothers Harriman & Co.
Boston, MA
Corporate Headquarters
82 Devonshire Street
Boston, MA 02109
1-800-544-8888
The Fidelity Telephone Connection
Mutual Fund 24-Hour Service
Exchanges/Redemptions
and Account Assistance 1-800-544-6666
Product Information 1-800-544-8888
Retirement Accounts 1-800-544-4774
(8 a.m. - 9 p.m.)
TDD Service 1-800-544-0118
for the deaf and hearing impaired
(9 a.m. - 9 p.m. Eastern time)
Fidelity Automated Service
Telephone (FAST®) (automated graphic) 1-800-544-5555
| | (automated graphic) Automated line for quickest service
|

| SELCI-UANN-0406 | | Corporate Headquarters |
| 1.813656.101 | | 82 Devonshire St., Boston, MA 02109 |
| | | www.fidelity.com |
Fidelity®
Select Portfolios®
Health Care Sector
Biotechnology
Health Care
Medical Delivery
Medical Equipment and Systems
Pharmaceuticals
Annual Report
February 28, 2006


| Contents | | |
| |
| Chairman’s Message | | 3 |
| Shareholder Expense Example | | 4 |
| Fund Updates* | | |
| Health Care Sector | | |
| Biotechnology | | 5 |
| Health Care | | 15 |
| Medical Delivery | | 30 |
| Medical Equipment and Systems | | 42 |
| Pharmaceuticals | | 52 |
| Notes to Financial Statements | | 64 |
| Report of Independent Registered | | 69 |
| Public Accounting Firm | | |
| Trustees and Officers | | 70 |
| Distributions | | 75 |
| Board Approval of Investment | | 76 |
| Advisory Contracts and | | |
| Management Fees | | |
| * | Fund updates for each Select Portfolio include: Performance, Management’s Discussion of Fund Performance, Investment Changes, Investments, and Financial Statements. |
| |
To view a fund’s proxy voting guidelines and proxy voting record for the 12-month period ended June 30, visit www.fidelity.com/proxyvotingresults or visit the Securities and Exchange Commission’s (SEC) web site at www.sec.gov. You may also call 1-800-544-8544 to request a free copy of the proxy voting guidelines.
Standard & Poor’s, S&P and S&P 500 are registered service marks of The McGraw-Hill Companies, Inc. and have been licensed for use by Fidelity Distributors Corporation.
Other third party marks appearing herein are the property of their respective owners.
All other marks appearing herein are registered or unregistered trademarks or service marks of FMR Corp. or an affiliated company.
This report and the financial statements contained herein are submitted for the general information of the shareholders of the funds. This report is not authorized for distribution to prospective investors in the funds unless preceded or accompanied by an effective prospectus.
A fund files its complete schedule of portfolio holdings with the SEC for the first and third quarters of each fiscal year on Form N-Q. Forms N-Q are available on the SEC’s web site at http://www.sec.gov. A fund’s Forms N-Q may be reviewed and copied at the SEC’s Public Reference Room in Washing-ton, DC. Information regarding the operation of the SEC’s Public Reference Room may be obtained by calling 1-800-SEC-0330. For a complete list of a fund’s portfolio holdings, view the most recent quarterly holdings report, semiannual report, or annual report on Fidelity’s web site at http://www.fidelity.com/holdings.
NOT FDIC INSURED · MAY LOSE VALUE · NO BANK GUARANTEE
Neither the funds nor Fidelity Distributors Corporation is a bank.
|
(Photograph of Edward C. Johnson 3d.)
Although many securities markets made gains in early 2006, there is only one certainty when it comes to investing: There is no sure thing. There are, however, a number of time-tested, fundamental investment principles that can put the historical odds in your favor.
One of the basic tenets is to invest for the long term. Over time, riding out the markets’ inevitable ups and downs has proven much more effective than selling into panic or chasing the hottest trend. Even missing only a few of the markets’ best days can significantly diminish investor returns. Patience also affords the benefits of compounding — of earning interest on additional income or reinvested dividends and capital gains. There are tax advantages and cost benefits to consider as well. The more you sell, the more taxes you pay, and the more you trade, the higher the costs. While staying the course doesn’t eliminate risk, it can considerably lessen the effect of short-term declines.
You can further manage your investing risk through diversification. And today, more than ever, geographic diversification should be taken into account. Studies
indicate that asset allocation is the single most important determinant of a portfolio’s long-term success. The right mix of stocks, bonds and cash — aligned to your particular risk tolerance and investment objective — is very important. Age-appropriate rebalancing is also an essential aspect of asset allocation. For younger investors, an emphasis on equities — which historically have been the best performing asset class over time — is encouraged. As investors near their specific goal, such as retirement or sending a child to college, consideration may be given to replacing volatile assets (e.g. common stocks) with more-stable fixed investments (bonds or savings plans).
A third investment principle — investing regularly — can help lower the average cost of your purchases. Investing a certain amount of money each month or quarter helps ensure you won’t pay for all your shares at market highs. This strategy — known as dollar cost averaging — also reduces unconstructive “emotion” from investing, helping shareholders avoid selling weak performers just prior to an upswing, or chasing a hot performer just before a correction.
We invite you to contact us via the Internet, through our Investor Centers or over the phone. It is our privilege to provide you the information you need to make the investments that are right for you.

3 Annual Report
Shareholder Expense Example
|
As a shareholder of a Fund, you incur two types of costs: (1) transaction costs, including redemption fees, exchange fees, and (2) ongoing costs, including management fees and other Fund expenses. This Example is intended to help you understand your ongoing costs (in dollars) of investing in the Funds and to compare these costs with the ongoing costs of investing in other mutual funds.
The Example is based on an investment of $1,000 invested at the beginning of the period and held for the entire period (September 1, 2005 to Febru-ary 28, 2006).
The first line of the table below for each fund provides information about actual account values and actual expenses. You may use the information in this line, together with the amount you invested, to estimate the expenses that you paid over the period. Simply divide your account value by $1,000.00 (for example, an $8,600 account value divided by $1,000.00 = 8.6), then multiply the result by the number in the first line for a fund under the heading entitled “Expenses Paid During Period” to estimate the expenses you paid on your account during this period. A small balance maintenance fee of $12.00 that is charged once a year may apply for certain accounts with a value of less than $2,000. This fee is not included in the table below. If it was, the estimate of expenses you paid during the period would be higher, and your ending account value lower, by this amount.
Hypothetical Example for Comparison Purposes
|
The second line of the table below for each fund provides information about hypothetical account values and hypothetical expenses based on a fund’s actual expense ratio and an assumed rate of return of 5% per year before expenses, which is not the Fund’s actual return. The hypothetical account values and expenses may not be used to estimate the actual ending account balance or expenses you paid for the period. You may use this information to compare the ongoing costs of investing in the Fund and other funds. To do so, compare this 5% hypothetical example with the 5% hypothetical examples that appear in the shareholder reports of the other funds. A small balance maintenance fee of $12.00 that is charged once a year may apply for certain accounts with a value of less than $2,000. This fee is not included in the table below. If it was, the estimate of expenses you paid during the period would be higher, and your ending account value lower, by this amount.
Please note that the expenses shown in the table are meant to highlight your ongoing costs only and do not reflect any transaction costs. Therefore, the second line of the table is useful in comparing ongoing costs only, and will not help you determine the relative total costs of owning different funds. In addition, if these transactional costs were included, your costs would have been higher.
| | | | | | | Expenses Paid |
| | | Beginning | | Ending | | During Period* |
| | | Account Value | | Account Value | | September 1, 2005 to |
| | | September 1, 2005 | | February 28, 2006 | | February 28, 2006 |
| Biotechnology Portfolio | | | | | | | | |
| Actual | | $ 1,000.00 | | $ 1,134.90 | | $ | | 5.03 |
| HypotheticalA | | $ 1,000.00 | | $ 1,020.08 | | $ | | 4.76 |
| Health Care Portfolio | | | | | | | | |
| Actual | | $ 1,000.00 | | $ 1,057.30 | | $ | | 4.59 |
| HypotheticalA | | $ 1,000.00 | | $ 1,020.33 | | $ | | 4.51 |
| Medical Delivery Portfolio | | | | | | | | |
| Actual | | $ 1,000.00 | | $ 1,078.80 | | $ | | 4.85** |
| HypotheticalA | | $ 1,000.00 | | $ 1,020.13 | | $ | | 4.71** |
| Medical Equipment and Systems Portfolio | | | | | | | | |
| Actual | | $ 1,000.00 | | $ 1,012.90 | | $ | | 4.69 |
| HypotheticalA | | $ 1,000.00 | | $ 1,020.13 | | $ | | 4.71 |
| Pharmaceuticals Portfolio | | | | | | | | |
| Actual | | $ 1,000.00 | | $ 1,099.20 | | $ | | 5.62 |
| HypotheticalA | | $ 1,000.00 | | $ 1,019.44 | | $ | | 5.41 |
| |
| A 5% return per year before expenses | | | | | | | | |
* Expenses are equal to each Fund’s annualized expense ratio (shown in the table below); multiplied by the average account value over the period, multiplied by 181/365 (to reflect the one-half year period).
| | | Annualized |
| | | Expense Ratio |
| Biotechnology Portfolio | | 95% |
| Health Care Portfolio | | 90% |
| Medical Delivery Portfolio | | 94%** |
| Medical Equipment and Systems Portfolio | | 94% |
| Pharmaceuticals Portfolio | | 1.08% |
** If contractual expense reductions, effective January 1, 2006, had been in effect during the entire period, the annualized expense ratio and the expenses paid in the actual and hypothetical examples above would have been as follows:
| | | Annualized | | | | |
| | | Expense Ratio | | | | Expenses Paid |
| Medical Delivery Portfolio | | .91% | | | | |
| Actual | | | | $ | | 4.69 |
| HypotheticalA | | | | $ | | 4.56 |
| A 5% return per year before expenses | | | | | | |
Biotechnology Portfolio
Performance
|

Average annual total return reflects the change in the value of an investment, assuming reinvestment of the fund’s dividend income and capital gains (the profits earned upon the sale of securities that have grown in value) and assuming a constant rate of performance each year. The $10,000 table and the fund’s returns do not reflect the deduction of taxes that a shareholder would pay on fund distributions or the redemption of fund shares. During periods of reimbursement by Fidelity a fund’s total returns will be greater than it would be had the reimbursement not occurred. How a fund did yesterday is no guarantee of how it will do tomorrow.
| Average Annual Total Returns | | | | | | |
| Periods ended February 28, 2006 | | Past 1 | | Past 5 | | Past 10 |
| | | year | | years | | years |
| Select Biotechnology | | 38.78% | | --0.97% | | 10.77% |
| |
| $10,000 Over 10 Years | | | | | | |
Let’s say hypothetically that $10,000 was invested in Fidelity® Select Biotechnology Portfolio on February 29, 1996. The chart shows how the value of your investment would have changed, and also shows how the S&P 500® Index performed over the same period.
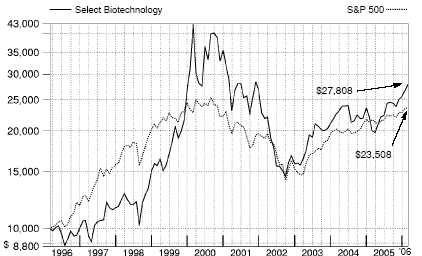
5 Annual Report
Management’s Discussion of Fund Performance
Comments from Rajiv Kaul, who became Portfolio Manager of Fidelity® Select Biotechnology Portfolio on October 12, 2005
With the exception of several popular large-cap stock performance measures, most major U.S. equity benchmarks had double-digit returns for the year ending February 28, 2006. For much of the period, market gains were driven largely by the energy sector, although utilities ultimately sneaked into the top spot for the year overall. Financials and telecommunication services also reached double figures, outperforming the 8.40% return of the broader market as measured by the large-cap-oriented Standard & Poor’s 500SM Index. The consumer discretionary segment — home to the weak performing automobile and media industries — was the biggest disappointment. Although the overall return for the S&P 500® beat the small-cap Russell 2000® Index in calendar year 2005 — the first time that’s happened in six years — small-caps stormed back in early 2006, leading to a 16.59% advance during the past 12 months, nearly twice the broader market’s gain. Mid-caps soared even higher, returning 17.67% according to the Russell Midcap® Index. The technology-heavy NASDAQ Composite® Index also fared well, climbing 12.13%, but the Dow Jones Industrial AverageSM, an index of 30 large-cap, blue-chip stocks, managed to rise only 4.52% .
During the past year, the fund returned 38.78%, finishing well ahead of both the S&P 500 and the 14.85% return of the Goldman Sachs® Health Care Index. A sizable overweighting and solid stock selection in biotechnology were the driving forces behind the fund’s favorable results relative to the sector index. In fact, after taking over the fund in October, I trimmed its pharmaceutical exposure while boosting its biotechnology weighting. Among individual holdings, Celgene was the fund’s top contributor. Near the end of 2005, the company received regulatory approval to market Revlimid, its treatment for a group of blood disorders. Another holding that helped performance was Genentech, as positive test results for a number of the company’s drugs fueled the stock’s strong showing. Also aiding performance was Cephalon. The company was able to extend patent protection for its most lucrative drug, narcolepsy medication Provigil. Not owning lagging index component Johnson & Johnson was helpful as well. Conversely, a lack of exposure to the strong performing managed health care group and a considerable underweighting in health care services worked against us. Pharmaceutical stock Sepracor was a major detractor, as the company struggled with losses for much of the period before reporting surprisingly strong earnings growth for the fourth quarter of 2005. Also holding back our results was ImClone Systems, a biotech holding that dropped sharply in November on the news of positive test results for a rival’s medication that might compete with ImClone’s Erbitux.
The views expressed above reflect those of the portfolio manager(s) only through the end of the period as stated on the cover of this report and do not necessarily represent the views of Fidelity or any other person in the Fidelity organization. Any such views are subject to change at any time based upon market or other conditions and Fidelity disclaims any responsibility to update such views. These views may not be relied on as investment advice and, because investment decisions for a Fidelity fund are based on numerous factors, may not be relied on as an indication of trading intent on behalf of any Fidelity fund.
Biotechnology Portfolio
Investment Changes
| Top Ten Stocks as of February 28, 2006 |
| | | % of fund’s | | % of fund’s net assets |
| | | net assets | | 6 months ago |
| Biogen Idec, Inc. | | 6.3 | | 5.4 |
| Celgene Corp. | | 6.3 | | 6.6 |
| Genentech, Inc. | | 6.3 | | 12.2 |
| Gilead Sciences, Inc. | | 5.9 | | 4.4 |
| Amgen, Inc. | | 5.5 | | 6.4 |
| MedImmune, Inc. | | 5.0 | | 4.4 |
| Cephalon, Inc. | | 4.7 | | 3.8 |
| Genzyme Corp. | | 4.2 | | 3.3 |
| Sepracor, Inc. | | 3.9 | | 4.1 |
| Vertex Pharmaceuticals, Inc. | | 3.6 | | 0.0 |
| | | 51.7 | | |
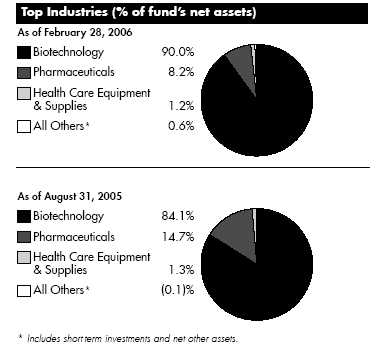
7 Annual Report
| Biotechnology Portfolio | | | | | | | | |
| Investments February 28, 2006 | | | | | | | | |
| Showing Percentage of Net Assets | | | | | | | | |
| |
| Common Stocks — 99.2% | | | | | | | | |
| | | | | | | Shares | | Value (Note 1) |
| |
| BIOTECHNOLOGY – 89.8% | | | | | | | | |
| Biotechnology – 89.8% | | | | | | | | |
| Acadia Pharmaceuticals, Inc. (a)(d) | | | | | | 469,600 | | $ 7,029,912 |
| Affymetrix, Inc. (a) | | | | | | 764,000 | | 27,129,640 |
| Albany Molecular Research, Inc. (a) | | | | | | 373,500 | | 3,768,615 |
| Alexion Pharmaceuticals, Inc. (a)(d) | | | | | | 1,019,300 | | 38,305,294 |
| Alkermes, Inc. (a) | | | | | | 1,136,057 | | 28,867,208 |
| Alnylam Pharmaceuticals, Inc. (a) | | | | | | 279,100 | | 4,487,928 |
| Altus Pharmaceuticals, Inc. | | | | | | 111,500 | | 2,341,500 |
| Amgen, Inc. (a)(d) | | | | | | 1,327,300 | | 100,197,877 |
| Amylin Pharmaceuticals, Inc. (a)(d) | | | | | | 1,162,698 | | 50,437,839 |
| Anadys Pharmaceuticals, Inc. (a) | | | | | | 307,200 | | 3,993,600 |
| Applera Corp.: | | | | | | | | |
| – Applied Biosystems Group | | | | | | 1,392,900 | | 39,377,283 |
| – Celera Genomics Group (a) | | | | | | 482,300 | | 5,541,627 |
| Arena Pharmaceuticals, Inc. (a)(d) | | | | | | 302,900 | | 5,364,359 |
| Biogen Idec, Inc. (a) | | | | | | 2,432,542 | | 114,937,611 |
| BioMarin Pharmaceutical, Inc. (a) | | | | | | 488,500 | | 6,389,580 |
| Celgene Corp. (a) | | | | | | 3,014,334 | | 114,544,692 |
| Cephalon, Inc. (a)(d) | | | | | | 1,073,140 | | 85,293,167 |
| Charles River Laboratories International, Inc. (a) | | | | | | 774,000 | | 37,422,900 |
| Coley Pharmaceutical Group, Inc. (d) | | | | | | 185,700 | | 2,785,500 |
| Combinatorx, Inc. (d) | | | | | | 353,100 | | 4,615,017 |
| Cotherix, Inc. (a) | | | | | | 259,500 | | 2,989,440 |
| Critical Therapeutics, Inc. (a)(d) | | | | | | 100,600 | | 547,264 |
| Cubist Pharmaceuticals, Inc. (a) | | | | | | 556,000 | | 12,293,160 |
| CV Therapeutics, Inc. (a)(d) | | | | | | 515,400 | | 13,869,414 |
| Dendreon Corp. (a) | | | | | | 2,300 | | 11,201 |
| Digene Corp. (a) | | | | | | 225,400 | | 9,345,084 |
| DOV Pharmaceutical, Inc. (a)(d) | | | | | | 470,800 | | 9,062,900 |
| Enzo Biochem, Inc. (a) | | | | | | 117,500 | | 1,547,475 |
| Enzon Pharmaceuticals, Inc. (a) | | | | | | 505,000 | | 3,413,800 |
| Exelixis, Inc. (a) | | | | | | 865,700 | | 9,401,502 |
| Genentech, Inc. (a)(d) | | | | | | 1,323,800 | | 113,436,422 |
| Genomic Health, Inc. (d) | | | | | | 224,400 | | 3,361,512 |
| Genzyme Corp. (a) | | | | | | 1,085,800 | | 75,289,372 |
| Gilead Sciences, Inc. (a) | | | | | | 1,703,200 | | 106,058,264 |
| Harvard Bioscience, Inc. (a) | | | | | | 11,600 | | 57,884 |
| Human Genome Sciences, Inc. (a)(d) | | | | | | 1,681,000 | | 21,046,120 |
| Idenix Pharmaceuticals, Inc. (a)(d) | | | | | | 539,072 | | 11,034,804 |
| ImClone Systems, Inc. (a)(d) | | | | | | 374,300 | | 14,369,377 |
| Incyte Corp. (a) | | | | | | 997,300 | | 5,864,124 |
| Inhibitex, Inc. (a) | | | | | | 331,830 | | 2,694,460 |
| Invitrogen Corp. (a) | | | | | | 619,254 | | 43,923,686 |
| Isis Pharmaceuticals, Inc. (a) | | | | | | 473,000 | | 3,802,920 |
| Ligand Pharmaceuticals, Inc. Class B (a) | | | | | | 365,100 | | 4,545,495 |
| Luminex Corp. (a) | | | | | | 75,300 | | 1,054,200 |
| MannKind Corp. (a)(d) | | | | | | 509,600 | | 8,810,984 |
| Martek Biosciences (a)(d) | | | | | | 358,900 | | 12,231,312 |
| Medarex, Inc. (a) | | | | | | 1,166,800 | | 17,221,968 |
See accompanying notes which are an integral part of the financial statements.
Annual Report 8
| | | Shares | | Value (Note 1) |
| MedImmune, Inc. (a) | | 2,486,420 | | $ 90,729,466 |
| Millennium Pharmaceuticals, Inc. (a) | | 1,193,062 | | 12,503,290 |
| Momenta Pharmaceuticals, Inc. (a)(d) | | 322,092 | | 7,678,673 |
| Myogen, Inc. (a) | | 910,908 | | 34,523,413 |
| Myriad Genetics, Inc. (a) | | 349,600 | | 8,977,728 |
| Nektar Therapeutics (a)(d) | | 250,200 | | 5,231,682 |
| Neurochem, Inc. (a)(d) | | 409,000 | | 6,123,390 |
| Neurocrine Biosciences, Inc. (a) | | 317,300 | | 20,818,053 |
| OSI Pharmaceuticals, Inc. (a)(d) | | 998,600 | | 32,434,528 |
| PDL BioPharma, Inc. (a)(d) | | 1,441,600 | | 45,136,496 |
| Regeneron Pharmaceuticals, Inc. (a) | | 445,800 | | 7,297,746 |
| Renovis, Inc. (a) | | 418,000 | | 9,053,880 |
| Serologicals Corp. (a) | | 274,200 | | 6,632,898 |
| SGX Pharmaceuticals, Inc. | | 241,400 | | 1,622,208 |
| Tanox, Inc. (a) | | 804,500 | | 15,349,860 |
| Techne Corp. (a) | | 433,200 | | 25,762,404 |
| Telik, Inc. (a) | | 43,400 | | 960,008 |
| Tercica, Inc. (a)(d) | | 422,200 | | 3,255,162 |
| Theravance, Inc. (a) | | 519,400 | | 14,574,364 |
| Threshold Pharmaceuticals, Inc. | | 361,622 | | 5,442,411 |
| Vertex Pharmaceuticals, Inc. (a) | | 1,502,000 | | 64,946,480 |
| ViaCell, Inc. (a) | | 17,500 | | 91,175 |
| Vion Pharmaceuticals, Inc. (a) | | 454,987 | | 1,091,969 |
| Zymogenetics, Inc. (a) | | 723,600 | | 16,020,504 |
| | | | | 1,626,373,081 |
| |
| COMPUTERS & PERIPHERALS – 0.0% | | | | |
| Computer Storage & Peripherals – 0.0% | | | | |
| iCAD, Inc. (a) | | 208,300 | | 310,367 |
| HEALTH CARE EQUIPMENT & SUPPLIES – 1.2% | | | | |
| Health Care Equipment – 1.1% | | | | |
| IDEXX Laboratories, Inc. (a) | | 258,100 | | 20,281,498 |
| Health Care Supplies – 0.1% | | | | |
| Gen-Probe, Inc. (a) | | 44,700 | | 2,233,212 |
| |
| TOTAL HEALTH CARE EQUIPMENT & SUPPLIES | | | | 22,514,710 |
| |
| PHARMACEUTICALS – 8.2% | | | | |
| Pharmaceuticals – 8.2% | | | | |
| Adams Respiratory Therapeutics, Inc. | | 377,700 | | 14,167,527 |
| Adolor Corp. (a) | | 291,949 | | 8,019,839 |
| Barrier Therapeutics, Inc. (a) | | 112,900 | | 1,141,419 |
| Connetics Corp. (a) | | 176,800 | | 2,807,584 |
| Elan Corp. PLC sponsored ADR (a)(d) | | 713,100 | | 9,056,370 |
| Kos Pharmaceuticals, Inc. (a) | | 345,408 | | 15,153,049 |
| MGI Pharma, Inc. (a) | | 74,577 | | 1,314,793 |
| New River Pharmaceuticals, Inc. (a) | | 537,200 | | 16,427,576 |
| NitroMed, Inc. (a)(d) | | 356,655 | | 4,190,696 |
| Sepracor, Inc. (a) | | 1,240,500 | | 71,093,055 |
See accompanying notes which are an integral part of the financial statements.
|
9
| Biotechnology Portfolio | | | | |
| Investments - continued | | | | |
| |
| Common Stocks – continued | | | | |
| | | Shares | | Value (Note 1) |
| PHARMACEUTICALS – CONTINUED | | | | |
| Pharmaceuticals – continued | | | | |
| Somaxon Pharmaceuticals, Inc. | | 128,200 | | $ 2,396,058 |
| Xenoport, Inc. | | 122,300 | | 2,350,606 |
| | | | | 148,118,572 |
| TOTAL COMMON STOCKS | | | | |
| (Cost $1,364,393,000) | | 1,797,316,730 |
| Preferred Stocks — 0.2% | | | | |
| |
| Convertible Preferred Stocks – 0.2% | | | | |
| |
| BIOTECHNOLOGY – 0.2% | | | | |
| Biotechnology – 0.2% | | | | |
| Xenon Pharmaceuticals, Inc. Series E (e) | | 981,626 | | 3,416,058 |
| Nonconvertible Preferred Stocks – 0.0% | | | | |
| BIOTECHNOLOGY – 0.0% | | | | |
| Biotechnology – 0.0% | | | | |
| GeneProt, Inc. Series A (a)(e) | | 180,000 | | 180 |
| TOTAL PREFERRED STOCKS | | | | |
| (Cost $7,704,238) | | | | 3,416,238 |
| Money Market Funds — 14.6% | | | | |
| Fidelity Cash Central Fund, 4.57% (b) | | 14,335,817 | | 14,335,817 |
| Fidelity Securities Lending Cash Central Fund, 4.58% (b)(c) | | 249,211,950 | | 249,211,950 |
| TOTAL MONEY MARKET FUNDS | | | | |
| (Cost $263,547,767) | | | | 263,547,767 |
| TOTAL INVESTMENT PORTFOLIO - 114.0% | | | | |
| (Cost $1,635,645,005) | | 2,064,280,735 |
| |
| NET OTHER ASSETS – (14.0)% | | (252,788,403) |
| NET ASSETS – 100% | | $ 1,811,492,332 |
(a) Non-income producing
(b) Affiliated fund that is available only to investment companies and other accounts managed by Fidelity Investments. The rate quoted is the annualized seven-day yield of the fund at period end. A complete unaudited listing of the fund’s holdings as of its most recent quarter end is available upon request.
(c) Investment made with cash collateral received from securities on loan. (d) Security or a portion of the security is on loan at period end.
(e) Restricted securities – Investment in securities not registered under the Securities Act of 1933 (excluding 144A issues). At the end of the period, the value of restricted securities (excluding 144A issues) amounted to $3,416,238 or 0.2% of net assets.
| Additional information on each holding is as follows: | | | | |
| Security | | Acquisition Date | | Acquisition Cost |
| GeneProt, Inc. Series A | | 7/7/00 | | $ 980,100 |
| Xenon Pharmaceuticals, Inc. Series E | | 3/23/01 | | $ 6,724,138 |
See accompanying notes which are an integral part of the financial statements.
Annual Report 10
| Affiliated Central Funds | | |
| Information regarding fiscal year to date income earned by the fund from the affiliated Central funds is as follows: | | |
| |
| Fund | | Income earned |
| Fidelity Cash Central Fund | | $ 254,427 |
| Fidelity Securities Lending Cash Central Fund | | 778,005 |
| Total | | $ 1,032,432 |
An affiliated company is a company in which the fund has ownership of at least 5% of the voting securities. Fiscal year to date transactions with companies which are or were affiliates are as follows:
| | | Value, | | | | | | | | | | | | | | | | | | Value, | | |
| | | beginning | | | | | | | | Sales | | | | Dividend | | | | | | end of | | |
| Affiliate | | of period | | | | Purchases | | | | Proceeds | | | | Income | | | | | | period | | |
| DOV Pharmaceutical, Inc. | | $ — | | | | $ 25,766,989 | | | | $15,805,438 | | | | $— | | | | | | $— | | |
At February 28, 2006, the fund had a capital loss carryforward of approximately $650,622,260 all of which will expire on February 28, 2011.
See accompanying notes which are an integral part of the financial statements.
|
11 Annual Report
11
| Biotechnology Portfolio | | | | | | | | |
| |
| Financial Statements | | | | | | | | |
| |
| |
| Statement of Assets and Liabilities | | | | | | | | |
| | | | | | | | | February 28, 2006 |
| |
| Assets | | | | | | | | |
| Investment in securities, at value (including securities loaned of $240,168,716) — See accompanying schedule: | | | | | | | | |
| Unaffiliated issuers (cost $1,372,097,238) | | $1,800,732,968 | | | | |
| Affiliated Central Funds (cost $263,547,767) | | | | 263,547,767 | | | | |
| Total Investments (cost $1,635,645,005) | | | | | | $2,064,280,735 |
| Foreign currency held at value (cost $582,477) | | | | | | | | 589,449 |
| Receivable for investments sold | | | | | | | | 8,773,232 |
| Receivable for fund shares sold | | | | | | | | 12,521,433 |
| Dividends receivable | | | | | | | | 59,198 |
| Interest receivable | | | | | | | | 9,611 |
| Prepaid expenses | | | | | | | | 6,685 |
| Other affiliated receivables | | | | | | | | 440 |
| Other receivables | | | | | | | | 202,062 |
| Total assets | | | | | | | | 2,086,442,845 |
| |
| Liabilities | | | | | | | | |
| Payable for investments purchased | | $ | | 22,089,628 | | | | |
| Payable for fund shares redeemed | | | | 2,300,028 | | | | |
| Accrued management fee | | | | 820,145 | | | | |
| Other affiliated payables | | | | 493,916 | | | | |
| Other payables and accrued expenses | | | | 34,846 | | | | |
| Collateral on securities loaned, at value | | | | 249,211,950 | | | | |
| Total liabilities | | | | | | | | 274,950,513 |
| |
| Net Assets | | | | | | $ 1,811,492,332 |
| Net Assets consist of: | | | | | | | | |
| Paid in capital | | | | | | $2,047,559,523 |
| Accumulated net investment loss | | | | | | | | (3,835) |
| Accumulated undistributed net realized gain (loss) on investments and foreign currency transactions | | | | | | | | (664,694,811) |
| Net unrealized appreciation (depreciation) on investments and assets and liabilities in foreign currencies | | | | | | | | 428,631,455 |
| Net Assets, for 26,617,110 shares outstanding | | | | | | $ 1,811,492,332 |
| Net Asset Value, offering price and redemption price per share ($1,811,492,332 ÷ 26,617,110 shares) | | | | | | | | $ 68.06 |
| |
| Statement of Operations | | | | | | | | |
| | | | | | | | | Year ended February 28, 2006 |
| |
| Investment Income | | | | | | | | |
| Dividends | | | | | | $ | | 701,258 |
| Interest | | | | | | | | 15,264 |
| Income from affiliated Central Funds (including $778,005 from security lending) | | | | | | | | 1,032,432 |
| | | | | | | | | 1,748,954 |
| Less foreign taxes withheld | | | | | | | | (87,516) |
| Total income | | | | | | | | 1,661,438 |
| |
| Expenses | | | | | | | | |
| Management fee | | $ | | 9,307,268 | | | | |
| Transfer agent fees | | | | 5,637,749 | | | | |
| Accounting and security lending fees | | | | | | | | |
| | | | | 664,497 | | | | |
| Independent trustees’ compensation | | | | 7,340 | | | | |
| Custodian fees and expenses | | | | 69,059 | | | | |
| Registration fees | | | | 63,513 | | | | |
| Audit | | | | 41,932 | | | | |
| Legal | | | | 9,471 | | | | |
| Interest | | | | 13,944 | | | | |
| Miscellaneous | | | | 19,673 | | | | |
| Total expenses before reductions | | | | 15,834,446 | | | | |
| Expense reductions | | | | (652,381) | | | | 15,182,065 |
See accompanying notes which are an integral part of the financial statements.
Annual Report 12
| Net investment income (loss) | | | | (13,520,627) |
| Realized and Unrealized Gain (Loss) | | | | |
| Net realized gain (loss) on: | | | | |
| Investment securities: | | | | |
| Unaffiliated issuers | | 160,537,901 | | |
| Other affiliated issuers | | (1,876,913) | | |
| Foreign currency transactions | | 20,978 | | |
| Total net realized gain (loss) | | | | 158,681,966 |
| Change in net unrealized appreciation (depreciation) on: | | | | |
| Investment securities | | 384,301,011 | | |
| Assets and liabilities in foreign currencies | | (4,275) | | |
| Total change in net unrealized appreciation (depreciation) | | | | 384,296,736 |
| Net gain (loss) | | | | 542,978,702 |
| Net increase (decrease) in net assets resulting from operations | | | | $ 529,458,075 |
See accompanying notes which are an integral part of the financial statements.
|
13 Annual Report
| Biotechnology Portfolio | | | | | | | | | | | | | | | | | | |
| Financial Statements - continued | | | | | | | | | | | | | | | | | | |
| |
| |
| Statement of Changes in Net Assets | | | | | | | | | | | | | | | | | | |
| | | | | | | | | Year ended | | | | Year ended |
| | | | | | | | | February 28, | | | | February 28, |
| | | | | | | | | 2006 | | | | 2005 |
| Increase (Decrease) in Net Assets | | | | | | | | | | | | | | | | | | |
| Operations | | | | | | | | | | | | | | | | | | |
| Net investment income (loss) | | | | | | | | $ | | (13,520,627) | | $ | | (17,826,237) |
| Net realized gain (loss) | | | | | | | | 158,681,966 | | | | 238,493,623 |
| Change in net unrealized appreciation (depreciation) | | | | | | | | 384,296,736 | | | | (429,856,074) |
| Net increase (decrease) in net assets resulting from operations | | | | | | | | 529,458,075 | | | | (209,188,688) |
| Share transactions | | | | | | | | | | | | | | | | | | |
| Proceeds from sales of shares | | | | | | | | 414,412,377 | | | | 437,295,435 |
| Cost of shares redeemed | | | | | | | | (619,998,822) | | | | (689,594,787) |
| Net increase (decrease) in net assets resulting from share transactions | | | | | | (205,586,445) | | | | (252,299,352) |
| Redemption fees | | | | | | | | | | 220,761 | | | | | | 313,845 |
| Total increase (decrease) in net assets | | | | | | | | 324,092,391 | | | | (461,174,195) |
| |
| Net Assets | | | | | | | | | | | | | | | | | | |
| Beginning of period | | | | | | | | 1,487,399,941 | | | | 1,948,574,136 |
| End of period (including accumulated net investment loss of $3,835 and accumulated net investment loss | | | | | | | | | | | | |
| of $5,181, respectively) | | | | | | | | $ 1,811,492,332 | | $ 1,487,399,941 |
| |
| Other Information | | | | | | | | | | | | | | | | | | |
| Shares | | | | | | | | | | | | | | | | | | |
| Sold | | | | | | | | | | 7,153,448 | | | | | | 7,719,402 |
| Redeemed | | | | | | | | | | (10,864,160) | | | | (12,571,982) |
| Net increase (decrease) | | | | | | | | | | (3,710,712) | | | | (4,852,580) |
| |
| Financial Highlights | | | | | | | | | | | | | | | | | | |
| Years ended February 28, | | | | 2006 | | 2005 | | 2004E | | | | 2003 | | | | | | 2002 |
| Selected Per-Share Data | | | | | | | | | | | | | | | | | | |
| Net asset value, beginning of period | | $ | | 49.04 | | $ 55.39 | | $ 38.42 | | $ | | 53.48 | | | | $ | | 71.46 |
| Income from Investment Operations | | | | | | | | | | | | | | | | | | |
| Net investment income (loss)C | | | | (.48) | | (.52) | | (.43) | | | | (.36) | | | | | | (.42) |
| Net realized and unrealized gain (loss) | | | | 19.49 | | (5.84) | | 17.39 | | | | (14.71) | | | | | | (17.59) |
| Total from investment operations | | | | 19.01 | | (6.36) | | 16.96 | | | | (15.07) | | | | | | (18.01) |
| Redemption fees added to paid in capitalC | | | | 01 | | .01 | | .01 | | | | .01 | | | | | | .03 |
| Net asset value, end of period | | $ | | 68.06 | | $ 49.04 | | $ 55.39 | | $ | | 38.42 | | | | $ | | 53.48 |
| Total ReturnA,B | | | | 38.78% | | (11.46)% | | 44.17% | | | | (28.16)% | | | | (25.16)% |
| Ratios to Average Net AssetsD | | | | | | | | | | | | | | | | | | |
| Expenses before reductions | | | | 97% | | .99% | | 1.17% | | | | 1.29% | | | | 1.11% |
| Expenses net of fee waivers, if any | | | | 97% | | .99% | | 1.17% | | | | 1.29% | | | | 1.11% |
| Expenses net of all reductions | | | | 93% | | .98% | | 1.15% | | | | 1.24% | | | | 1.09% |
| Net investment income (loss) | | | | (.83)% | | (.94)% | | (.88)% | | | | (.87)% | | | | (.67)% |
| Supplemental Data | | | | | | | | | | | | | | | | | | |
| Net assets, end of period (000 omitted) | | $ 1,811,492 | | $1,487,400 | | $1,948,574 | | $ 1,484,303 | | $ 2,433,835 |
| Portfolio turnover rate | | | | 63% | | 19% | | 50% | | | | 73% | | | | 96% |
| |
| | | | | |
A Total returns would have been lower had certain expenses not been reduced during the periods shown. B Total returns do not include the effect of the former sales charges. C Calculated based on average shares outstanding during the period. DExpense ratios reflect operating expenses of the fund. Expenses before reductions do not reflect amounts reimbursed by the investment adviser or reductions from brokerage service arrangements or other expense offset arrangements and do not represent the amount paid by the fund during periods when reimbursements or reductions occur. Expenses net of fee waivers reflect expenses after reimbursement by the investment adviser but prior to reductions from brokerage service arrangements or other expense offset arrangements. Expenses net of all reductions represent the net expenses paid by the fund. EFor the year ended February 29.See accompanying notes which are an integral part of the financial statements.
Annual Report 14
Health Care Portfolio
Performance
|
Average annual total return reflects the change in the value of an investment, assuming reinvestment of the fund’s dividend income and capital gains (the profits earned upon the sale of securities that have grown in value) and assuming a constant rate of performance each year. The $10,000 table and the fund’s returns do not reflect the deduction of taxes that a shareholder would pay on fund distributions or the redemption of fund shares. During periods of reimbursement by Fidelity a fund’s total returns will be greater than it would be had the reimbursement not occurred. How a fund did yesterday is no guarantee of how it will do tomorrow.
| Average Annual Total Returns | | | | | | |
| Periods ended February 28, 2006 | | Past 1 | | Past 5 | | Past 10 |
| | | year | | years | | years |
| Select Health Care | | 20.42% | | 3.26% | | 11.19% |
$10,000 Over 10 Years
Let’s say hypothetically that $10,000 was invested in Fidelity Select Health Care Portfolio on February 29, 1996. The chart shows how the value your investment would have changed, and also shows how the S&P 500 Index performed over the same period.
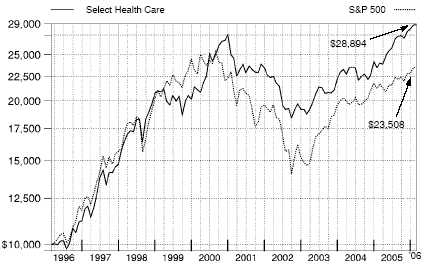
15 Annual Report
Management’s Discussion of Fund Performance
Comments from Harlan Carere, Portfolio Manager of Fidelity® Select Health Care Portfolio
With the exception of several popular large-cap stock performance measures, most major U.S. equity benchmarks had double-digit returns for the year ending February 28, 2006. For much of the period, market gains were driven largely by the energy sector, although utilities ultimately sneaked into the top spot for the year overall. Financials and telecommunication services also reached double figures, outperforming the 8.40% return of the broader market as measured by the large-cap-oriented Standard & Poor’s 500SM Index. The consumer discretionary segment — home to the weak performing automobile and media industries — was the biggest disappointment. Although the overall return for the S&P 500® beat the small-cap Russell 2000® Index in calendar year 2005 — the first time that’s happened in six years — small-caps stormed back in early 2006, leading to a 16.59% advance during the past 12 months, nearly twice the broader market’s gain. Mid-caps soared even higher, returning 17.67% according to the Russell Midcap® Index. The technology-heavy NASDAQ Composite® Index also fared well, climbing 12.13%, but the Dow Jones Industrial AverageSM, an index of 30 large-cap, blue-chip stocks, managed to rise only 4.52% .
The fund gained 20.42% during the past year, handily outperforming both the S&P 500 and the Goldman Sachs® Health Care Index, which was up 14.85% . Good security selection in pharmaceuticals contributed the most to the fund’s outperformance of its sector benchmark. Particularly helpful were substantial underweightings in weak large-cap pharmaceutical stocks — such as Pfizer and Bristol-Myers Squibb — that were under pressure from lower-cost competitors. Security selection in biotechnology was another area of strength, led by an overweighted position in Genentech, which had two cancer drugs that showed better-than-expected clinical results in new applications. The fund also benefited from overweightings in several strong-performing managed care stocks, including Health Net, a California company that appeared to be a good candidate for acquisition. The fund was hurt by its underweighted position in medical device maker Guidant, a company whose share price climbed when it became the target in a protracted takeover battle. Overweighted positions in laboratory equipment maker Beckman Coulter, where accounting changes gave investors pause, and medical products company Baxter International, where turnaround momentum stalled, also detracted from relative performance.
The views expressed above reflect those of the portfolio manager(s) only through the end of the period as stated on the cover of this report and do not necessarily represent the views of Fidelity or any other person in the Fidelity organization. Any such views are subject to change at any time based upon market or other conditions and Fidelity disclaims any responsibility to update such views. These views may not be relied on as investment advice and, because investment decisions for a Fidelity fund are based on numerous factors, may not be relied on as an indication of trading intent on behalf of any Fidelity fund.
Health Care Portfolio
Investment Changes
Top Ten Stocks as of February 28, 2006
| | | % of fund’s | | % of fund’s net assets |
| | | net assets | | 6 months ago |
| Pfizer, Inc. | | 8.8 | | 1.8 |
| Wyeth | | 5.2 | | 3.8 |
| UnitedHealth Group, Inc. | | 5.1 | | 5.9 |
| Merck & Co., Inc. | | 4.4 | | 0.2 |
| Johnson & Johnson | | 4.2 | | 7.1 |
| Amgen, Inc. | | 4.1 | | 5.6 |
| Genentech, Inc. | | 3.5 | | 6.7 |
| WellPoint, Inc. | | 2.5 | | 2.6 |
| Allergan, Inc. | | 2.3 | | 1.5 |
| Alcon, Inc. | | 2.0 | | 2.1 |
| | | 42.1 | | |
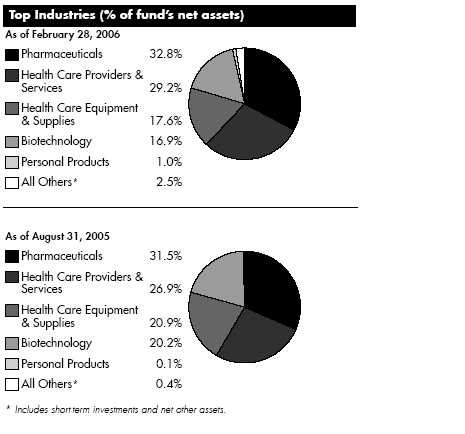
17 Annual Report
17
| Health Care Portfolio | | | | | | | | |
| Investments February 28, 2006 | | | | |
| Showing Percentage of Net Assets | | | | | | | | |
| |
| Common Stocks — 99.8% | | | | | | | | |
| | | | | | | Shares | | Value (Note 1) |
| |
| BEVERAGES – 0.3% | | | | | | | | |
| Soft Drinks – 0.3% | | | | | | | | |
| Hansen Natural Corp. (a) | | | | | | 71,489 | | $ 6,672,783 |
| BIOTECHNOLOGY – 16.9% | | | | | | | | |
| Biotechnology – 16.9% | | | | | | | | |
| Acadia Pharmaceuticals, Inc. (a) | | | | | | 4,200 | | 62,874 |
| Affymetrix, Inc. (a) | | | | | | 200,500 | | 7,119,755 |
| Alizyme PLC (a) | | | | | | 71,600 | | 208,805 |
| Alnylam Pharmaceuticals, Inc. (a) | | | | | | 46,000 | | 739,680 |
| Altus Pharmaceuticals, Inc. | | | | | | 85,300 | | 1,791,300 |
| Amgen, Inc. (a) | | | | | | 1,306,604 | | 98,635,536 |
| Amylin Pharmaceuticals, Inc. (a) | | | | | | 199,500 | | 8,654,310 |
| Anadys Pharmaceuticals, Inc. (a) | | | | | | 17,100 | | 222,300 |
| Applera Corp.: | | | | | | | | |
| – Applied Biosystems Group | | | | | | 275,000 | | 7,774,250 |
| – Celera Genomics Group (a) | | | | | | 54,700 | | 628,503 |
| Arena Pharmaceuticals, Inc. (a) | | | | | | 21,000 | | 371,910 |
| Biogen Idec, Inc. (a) | | | | | | 384,700 | | 18,177,075 |
| BioMarin Pharmaceutical, Inc. (a) | | | | | | 453,053 | | 5,925,933 |
| Celgene Corp. (a) | | | | | | 306,800 | | 11,658,400 |
| Cephalon, Inc. (a) | | | | | | 69,000 | | 5,484,120 |
| Charles River Laboratories International, Inc. (a) | | | | | | 131,900 | | 6,377,365 |
| DOV Pharmaceutical, Inc. (a) | | | | | | 49,100 | | 945,175 |
| DUSA Pharmaceuticals, Inc. (a) | | | | | | 250,138 | | 1,813,501 |
| Exelixis, Inc. (a) | | | | | | 210,500 | | 2,286,030 |
| Genentech, Inc. (a) | | | | | | 982,400 | | 84,181,856 |
| Genzyme Corp. (a) | | | | | | 11,700 | | 811,278 |
| Gilead Sciences, Inc. (a) | | | | | | 575,700 | | 35,848,839 |
| Human Genome Sciences, Inc. (a) | | | | | | 175,500 | | 2,197,260 |
| ICOS Corp. (a) | | | | | | 204,100 | | 4,924,933 |
| Illumina, Inc. (a) | | | | | | 200 | | 5,086 |
| ImClone Systems, Inc. (a) | | | | | | 112,900 | | 4,334,231 |
| Inhibitex, Inc. (a) | | | | | | 23,000 | | 186,760 |
| Invitrogen Corp. (a) | | | | | | 98,500 | | 6,986,605 |
| Martek Biosciences (a) | | | | | | 76,800 | | 2,617,344 |
| MedImmune, Inc. (a) | | | | | | 300,770 | | 10,975,097 |
| Millennium Pharmaceuticals, Inc. (a) | | | | | | 403,200 | | 4,225,536 |
| Myogen, Inc. (a) | | | | | | 57,600 | | 2,183,040 |
| Nektar Therapeutics (a) | | | | | | 107,500 | | 2,247,825 |
| Neopharm, Inc. (a) | | | | | | 8,400 | | 85,008 |
| Neurocrine Biosciences, Inc. (a) | | | | | | 287,000 | | 18,830,070 |
| ONYX Pharmaceuticals, Inc. (a) | | | | | | 95,200 | | 2,713,200 |
| Panacos Pharmaceuticals, Inc. (a) | | | | | | 54,200 | | 394,576 |
| PDL BioPharma, Inc. (a) | | | | | | 148,000 | | 4,633,880 |
| Renovis, Inc. (a) | | | | | | 133,400 | | 2,889,444 |
| Rigel Pharmaceuticals, Inc. (a) | | | | | | 17,800 | | 169,100 |
| Seracare Life Sciences, Inc. (a) | | | | | | 113,000 | | 1,266,730 |
| Serologicals Corp. (a) | | | | | | 118,700 | | 2,871,353 |
| Solexa, Inc. (a)(d) | | | | | | 142,300 | | 1,085,749 |
| Techne Corp. (a) | | | | | | 108,500 | | 6,452,495 |
| Tercica, Inc. (a) | | | | | | 659,900 | | 5,087,829 |
See accompanying notes which are an integral part of the financial statements.
Annual Report 18
| | | Shares | | Value (Note 1) |
| Theravance, Inc. (a) | | 19,900 | | $ 558,394 |
| Vertex Pharmaceuticals, Inc. (a) | | 319,500 | | 13,815,180 |
| | | | | 401,455,520 |
| |
| CHEMICALS – 0.4% | | | | |
| Fertilizers & Agricultural Chemicals – 0.4% | | | | |
| Monsanto Co. | | 104,400 | | 8,757,072 |
| Syngenta AG sponsored ADR | | 9,300 | | 264,306 |
| | | | | 9,021,378 |
| |
| COMMERCIAL SERVICES & SUPPLIES – 0.5% | | | | |
| Diversified Commercial & Professional Services – 0.2% | | | | |
| Advisory Board Co. (a) | | 94,323 | | 5,090,612 |
| PICO Holdings, Inc. (a) | | 10,616 | | 358,502 |
| | | | | 5,449,114 |
| Human Resource & Employment Services – 0.2% | | | | |
| Kforce, Inc. (a) | | 178,400 | | 2,160,424 |
| On Assignment, Inc. (a) | | 178,458 | | 1,979,099 |
| | | | | 4,139,523 |
| Office Services & Supplies – 0.1% | | | | |
| Mine Safety Appliances Co. | | 47,900 | | 1,908,815 |
| TOTAL COMMERCIAL SERVICES & SUPPLIES | | | | 11,497,452 |
| |
| DIVERSIFIED CONSUMER SERVICES – 0.1% | | | | |
| Specialized Consumer Services – 0.1% | | | | |
| Service Corp. International (SCI) | | 178,700 | | 1,420,665 |
| FOOD & STAPLES RETAILING – 0.2% | | | | |
| Drug Retail – 0.0% | | | | |
| CVS Corp. | | 3,600 | | 101,988 |
| Food Distributors – 0.1% | | | | |
| United Natural Foods, Inc. (a) | | 71,500 | | 2,378,090 |
| Food Retail – 0.1% | | | | |
| Whole Foods Market, Inc. | | 36,800 | | 2,350,784 |
| TOTAL FOOD & STAPLES RETAILING | | | | 4,830,862 |
| |
| FOOD PRODUCTS – 0.2% | | | | |
| Agricultural Products – 0.0% | | | | |
| Bunge Ltd. | | 21,400 | | 1,213,166 |
| Packaged Foods & Meats – 0.2% | | | | |
| Groupe Danone | | 34,400 | | 3,977,799 |
| Nestle SA sponsored ADR | | 2,900 | | 213,730 |
| | | | | 4,191,529 |
| |
| TOTAL FOOD PRODUCTS | | | | 5,404,695 |
| |
| HEALTH CARE EQUIPMENT & SUPPLIES – 17.6% | | | | |
| Health Care Equipment – 13.7% | | | | |
| Advanced Medical Optics, Inc. (a) | | 82,500 | | 3,669,600 |
| American Medical Systems Holdings, Inc. (a) | | 700 | | 15,169 |
| Aspect Medical Systems, Inc. (a) | | 383,100 | | 10,263,249 |
19
See accompanying notes which are an integral part of the financial statements.
19 Annual Report
| Health Care Portfolio | | | | |
| Investments - continued | | | | |
| |
| |
| Common Stocks – continued | | | | |
| | | Shares | | Value (Note 1) |
| |
| HEALTH CARE EQUIPMENT & SUPPLIES – CONTINUED | | | | |
| Health Care Equipment – continued | | | | |
| Baxter International, Inc. | | 818,700 | | $ 30,987,795 |
| Beckman Coulter, Inc. | | 43,700 | | 2,357,615 |
| Becton, Dickinson & Co. | | 473,700 | | 30,245,745 |
| Biomet, Inc. | | 40 | | 1,456 |
| Boston Scientific Corp. (a) | | 1,277,500 | | 31,196,550 |
| C.R. Bard, Inc. | | 294,600 | | 19,293,354 |
| China Medical Technologies, Inc. sponsored ADR (d) | | 83,900 | | 2,898,745 |
| Conceptus, Inc. (a) | | 241,200 | | 3,456,396 |
| CONMED Corp. (a) | | 100 | | 1,936 |
| Cyberonics, Inc. (a) | | 700 | | 19,019 |
| Cytyc Corp. (a) | | 354,700 | | 10,226,001 |
| Dade Behring Holdings, Inc. | | 116,900 | | 4,264,512 |
| Edwards Lifesciences Corp. (a) | | 300 | | 12,405 |
| Epix Pharmaceuticals, Inc. (a) | | 416,300 | | 1,810,905 |
| Fisher Scientific International, Inc. (a) | | 149,500 | | 10,189,920 |
| Hillenbrand Industries, Inc. | | 35,800 | | 1,820,072 |
| Hologic, Inc. (a) | | 86,900 | | 4,156,427 |
| Hospira, Inc. (a) | | 117,540 | | 4,666,338 |
| IDEXX Laboratories, Inc. (a) | | 38,800 | | 3,048,904 |
| Imaging Dynamics Co. Ltd. (a) | | 377,400 | | 1,810,351 |
| Integra LifeSciences Holdings Corp. (a) | | 100 | | 3,984 |
| IntraLase Corp. (a)(d) | | 230,100 | | 4,263,753 |
| Intuitive Surgical, Inc. (a) | | 122,400 | | 11,040,480 |
| Invacare Corp. | | 83,200 | | 2,604,992 |
| Kinetic Concepts, Inc. (a) | | 89,000 | | 3,301,900 |
| Medtronic, Inc. | | 468,860 | | 25,294,997 |
| Mentor Corp. | | 148,600 | | 6,395,744 |
| Natus Medical, Inc. (a) | | 202,303 | | 4,037,968 |
| NMT Medical, Inc. (a) | | 13,300 | | 316,540 |
| NuVasive, Inc. (a) | | 65,200 | | 1,205,548 |
| Optos PLC | | 340,200 | | 1,411,342 |
| Palomar Medical Technologies, Inc. (a) | | 3,600 | | 115,020 |
| Phonak Holding AG | | 3,574 | | 172,714 |
| PhotoMedex, Inc. (a) | | 334,004 | | 744,829 |
| Quidel Corp. (a) | | 700 | | 7,868 |
| ResMed, Inc. (a) | | 251,200 | | 10,196,208 |
| Respironics, Inc. (a) | | 127,800 | | 4,646,808 |
| SonoSite, Inc. (a) | | 200,400 | | 8,088,144 |
| St. Jude Medical, Inc. (a) | | 252,400 | | 11,509,440 |
| Stereotaxis, Inc. (a) | | 819,571 | | 10,842,924 |
| Steris Corp. | | 59,000 | | 1,461,430 |
| Stryker Corp. | | 78,800 | | 3,642,136 |
| Syneron Medical Ltd. (a) | | 313,500 | | 8,589,900 |
| Synthes, Inc. | | 20,791 | | 2,270,933 |
| Thermo Electron Corp. (a) | | 200,600 | | 6,944,772 |
| Varian Medical Systems, Inc. (a) | | 87,300 | | 5,052,924 |
| Waters Corp. (a) | | 235,521 | | 10,063,812 |
| Zimmer Holdings, Inc. (a) | | 67,900 | | 4,697,322 |
| | | | | 325,336,896 |
See accompanying notes which are an integral part of the financial statements.
Annual Report 20
| | | Shares | | Value (Note 1) |
| Health Care Supplies – 3.9% | | | | |
| Alcon, Inc. | | 403,400 | | $ 46,455,544 |
| Arrow International, Inc. | | 64,198 | | 1,986,286 |
| Bausch & Lomb, Inc. | | 100 | | 6,921 |
| Cooper Companies, Inc. | | 93,800 | | 4,921,686 |
| Cynosure, Inc. Class A | | 9,800 | | 180,223 |
| DENTSPLY International, Inc. | | 99,000 | | 5,642,010 |
| DJ Orthopedics, Inc. (a) | | 284,600 | | 9,926,848 |
| ev3, Inc. | | 100 | | 1,666 |
| Gen-Probe, Inc. (a) | | 59,400 | | 2,967,624 |
| Haemonetics Corp. (a) | | 100 | | 5,180 |
| Immucor, Inc. (a) | | 58,000 | | 1,729,560 |
| Inverness Medical Innovations, Inc. (a) | | 121,000 | | 3,205,290 |
| Inverness Medical Innovations, Inc. (a)(e) | | 42,205 | | 1,006,209 |
| LifeCell Corp. (a) | | 100 | | 2,206 |
| Lifecore Biomedical, Inc. (a) | | 186,500 | | 2,439,420 |
| Medical Action Industries, Inc. (a) | | 100 | | 2,368 |
| Millipore Corp. (a) | | 93,130 | | 6,456,703 |
| NUCRYST Pharmaceuticals Corp. | | 223,000 | | 2,276,812 |
| Nutraceutical International Corp. (a) | | 223,300 | | 3,208,821 |
| West Pharmaceutical Services, Inc. | | 3,100 | | 100,099 |
| | | | | 92,521,476 |
| |
| TOTAL HEALTH CARE EQUIPMENT & SUPPLIES | | | | 417,858,372 |
| |
| HEALTH CARE PROVIDERS & SERVICES – 29.2% | | | | |
| Health Care Distributors & Services – 3.1% | | | | |
| AmerisourceBergen Corp. | | 151,800 | | 6,981,282 |
| Andrx Corp. (a) | | 97,000 | | 1,901,200 |
| Arcadia Resources, Inc. (a) | | 100 | | 292 |
| Cardinal Health, Inc. | | 332,600 | | 24,146,760 |
| Henry Schein, Inc. (a) | | 212,100 | | 9,894,465 |
| McKesson Corp. | | 554,500 | | 30,015,085 |
| Patterson Companies, Inc. (a) | | 100 | | 3,604 |
| Symbion Health Ltd. | | 448,500 | | 1,115,513 |
| | | | | 74,058,201 |
| Health Care Facilities – 5.4% | | | | |
| Acibadem Saglik Hizmetleri AS | | 183,340 | | 1,925,489 |
| American Retirement Corp. (a) | | 711,600 | | 19,156,272 |
| Apollo Hospitals Enterprise Ltd. | | 61,375 | | 738,302 |
| Brookdale Senior Living, Inc. | | 551,500 | | 18,260,165 |
| Bumrungrad Hospital PCL (For. Reg.) | | 3,382,300 | | 2,897,138 |
| Capital Senior Living Corp. (a) | | 705,200 | | 7,580,900 |
| Community Health Systems, Inc. (a) | | 361,200 | | 13,696,704 |
| Genesis HealthCare Corp. (a) | | 700 | | 27,825 |
| HCA, Inc. | | 41,800 | | 2,002,220 |
| Health Management Associates, Inc. Class A | | 165,000 | | 3,512,850 |
| HealthSouth Corp. (a) | | 35,700 | | 174,216 |
| LCA-Vision, Inc. | | 700 | | 30,520 |
| LifePoint Hospitals, Inc. (a) | | 73,100 | | 2,270,486 |
| NovaMed Eyecare, Inc. (a) | | 12,500 | | 92,500 |
21
See accompanying notes which are an integral part of the financial statements.
21 Annual Report
| Health Care Portfolio | | | | |
| Investments - continued | | | | |
| |
| |
| Common Stocks – continued | | | | |
| | | Shares | | Value (Note 1) |
| |
| HEALTH CARE PROVIDERS & SERVICES – CONTINUED | | | | |
| Health Care Facilities – continued | | | | |
| Odyssey Healthcare, Inc. (a) | | 285,734 | | $ 5,377,514 |
| Psychiatric Solutions, Inc. (a) | | 408,200 | | 13,482,846 |
| Radiation Therapy Services, Inc. (a) | | 700 | | 19,873 |
| Sunrise Senior Living, Inc. (a) | | 99,900 | | 3,542,454 |
| Symbion, Inc. (a) | | 7,100 | | 167,418 |
| Tenet Healthcare Corp. (a) | | 236,500 | | 1,865,985 |
| Triad Hospitals, Inc. (a) | | 55,900 | | 2,407,054 |
| U.S. Physical Therapy, Inc. (a) | | 63,404 | | 1,220,527 |
| United Surgical Partners International, Inc. (a) | | 369,700 | | 12,994,955 |
| Universal Health Services, Inc. Class B | | 9,100 | | 457,093 |
| VCA Antech, Inc. (a) | | 541,700 | | 15,140,515 |
| | | | | 129,041,821 |
| Health Care Services – 8.5% | | | | |
| American Dental Partners, Inc. (a) | | 137,521 | | 1,791,899 |
| Apria Healthcare Group, Inc. (a) | | 14,200 | | 326,458 |
| Caremark Rx, Inc. (a) | | 560,800 | | 27,899,800 |
| Cerner Corp. (a) | | 65,100 | | 2,710,113 |
| Chemed Corp. | | 280,200 | | 15,534,288 |
| Covance, Inc. (a) | | 118,400 | | 6,683,680 |
| Cross Country Healthcare, Inc. (a) | | 700 | | 12,817 |
| DaVita, Inc. (a) | | 298,200 | | 17,411,898 |
| Eclipsys Corp. (a) | | 453,600 | | 11,666,592 |
| Emdeon Corp. (a) | | 378,430 | | 3,988,652 |
| Emergency Medical Services Corp. Class A | | 151,800 | | 2,038,674 |
| Express Scripts, Inc. (a) | | 179,500 | | 15,664,965 |
| Fresenius Medical Care AG sponsored ADR | | 700 | | 25,039 |
| Gentiva Health Services, Inc. (a) | | 700 | | 11,662 |
| Health Grades, Inc. (a) | | 416,120 | | 2,438,463 |
| Healthways, Inc. (a) | | 336,300 | | 14,645,865 |
| I-trax, Inc. (a) | | 71,500 | | 240,240 |
| IMS Health, Inc. | | 271,800 | | 6,550,380 |
| Laboratory Corp. of America Holdings (a) | | 100 | | 5,811 |
| Lincare Holdings, Inc. (a) | | 103,000 | | 4,212,700 |
| Matria Healthcare, Inc. (a) | | 57,200 | | 2,475,044 |
| Medco Health Solutions, Inc. (a) | | 440,700 | | 24,555,804 |
| Nighthawk Radiology Holdings, Inc. | | 38,200 | | 904,194 |
| Omnicare, Inc. | | 234,900 | | 14,293,665 |
| PAREXEL International Corp. (a) | | 700 | | 17,934 |
| Pediatric Services of America, Inc. (a) | | 22,900 | | 291,517 |
| Pediatrix Medical Group, Inc. (a) | | 29,600 | | 2,793,648 |
| Pharmaceutical Product Development, Inc. | | 37,200 | | 2,588,748 |
| QMed, Inc. (a) | | 25,000 | | 236,000 |
| Quest Diagnostics, Inc. | | 100 | | 5,287 |
| RehabCare Group, Inc. (a) | | 126,000 | | 2,542,680 |
| ResCare, Inc. (a) | | 390,811 | | 7,147,933 |
| SFBC International, Inc. (a)(d) | | 105,900 | | 2,499,240 |
See accompanying notes which are an integral part of the financial statements.
Annual Report 22
| | | Shares | | Value (Note 1) |
| Systems Xcellence, Inc. (a) | | 71,500 | | $ 241,029 |
| WebMD Health Corp. Class A (d) | | 177,414 | | 6,592,704 |
| | | | | 201,045,423 |
| Managed Health Care – 12.2% | | | | |
| Aetna, Inc. | | 837,400 | | 42,707,400 |
| AMERIGROUP Corp. (a) | | 197,200 | | 4,218,108 |
| CIGNA Corp. | | 109,800 | | 13,477,950 |
| Coventry Health Care, Inc. (a) | | 43,000 | | 2,563,660 |
| Health Net, Inc. (a) | | 585,800 | | 28,089,110 |
| Healthspring, Inc. | | 26,100 | | 615,960 |
| Humana, Inc. (a) | | 220,100 | | 11,372,567 |
| Magellan Health Services, Inc. (a) | | 37,200 | | 1,420,668 |
| Sierra Health Services, Inc. (a) | | 135,400 | | 5,644,826 |
| UnitedHealth Group, Inc. | | 2,086,220 | | 121,480,591 |
| Wellcare Health Plans, Inc. (a) | | 24,000 | | 934,800 |
| WellPoint, Inc. (a) | | 762,700 | | 58,567,733 |
| | | | | 291,093,373 |
| |
| TOTAL HEALTH CARE PROVIDERS & SERVICES | | | | 695,238,818 |
| |
| HOTELS, RESTAURANTS & LEISURE – 0.0% | | | | |
| Leisure Facilities – 0.0% | | | | |
| Life Time Fitness, Inc. (a) | | 6,700 | | 281,132 |
| HOUSEHOLD DURABLES – 0.1% | | | | |
| Consumer Electronics – 0.1% | | | | |
| Koninklijke Philips Electronics NV (NY Shares) | | 72,200 | | 2,347,944 |
| INTERNET & CATALOG RETAIL – 0.5% | | | | |
| Internet Retail – 0.5% | | | | |
| NutriSystem, Inc. (a)(d) | | 287,500 | | 12,353,875 |
| PERSONAL PRODUCTS – 1.0% | | | | |
| Personal Products – 1.0% | | | | |
| Herbalife Ltd. (a) | | 733,700 | | 22,737,363 |
| NBTY, Inc. (a) | | 100,600 | | 2,203,140 |
| | | | | 24,940,503 |
| |
| PHARMACEUTICALS – 32.8% | | | | |
| Pharmaceuticals – 32.8% | | | | |
| Abbott Laboratories | | 205,900 | | 9,096,662 |
| Adams Respiratory Therapeutics, Inc. | | 36,202 | | 1,357,937 |
| Allergan, Inc. | | 497,100 | | 53,816,046 |
| American Pharmaceutical Partners, Inc. (a) | | 100 | | 3,024 |
| Astellas Pharma, Inc. | | 95,400 | | 3,656,773 |
| AstraZeneca PLC sponsored ADR | | 100 | | 4,625 |
| Axcan Pharma, Inc. (a) | | 71,500 | | 864,683 |
| Barr Pharmaceuticals, Inc. (a) | | 193,800 | | 13,019,484 |
| Bristol-Myers Squibb Co. | | 100 | | 2,310 |
| Collagenex Pharmaceuticals, Inc. (a) | | 91,500 | | 1,212,375 |
| Dr. Reddy’s Laboratories Ltd. sponsored ADR | | 15,500 | | 445,935 |
| Endo Pharmaceuticals Holdings, Inc. (a) | | 181,400 | | 5,717,728 |
See accompanying notes which are an integral part of the financial statements.
|
23 Annual Report
23
| Health Care Portfolio | | | | |
| Investments - continued | | | | |
| |
| |
| Common Stocks – continued | | | | |
| | | Shares | | Value (Note 1) |
| |
| PHARMACEUTICALS – CONTINUED | | | | |
| Pharmaceuticals – continued | | | | |
| First Horizon Pharmaceutical Corp. (a) | | 140,400 | | $ 2,881,008 |
| Flamel Technologies SA sponsored ADR (a) | | 100 | | 2,386 |
| Forest Laboratories, Inc. (a) | | 590,800 | | 27,117,720 |
| GlaxoSmithKline PLC sponsored ADR | | 100 | | 5,082 |
| Impax Laboratories, Inc. (a) | | 26,400 | | 295,680 |
| Johnson & Johnson | | 1,746,584 | | 100,690,568 |
| King Pharmaceuticals, Inc. (a) | | 315,000 | | 5,118,750 |
| Kos Pharmaceuticals, Inc. (a) | | 81,003 | | 3,553,602 |
| Labopharm, Inc. (a) | | 15,000 | | 115,786 |
| Mayne Pharma Ltd. (a) | | 586,300 | | 1,205,777 |
| Medicis Pharmaceutical Corp. Class A | | 286,300 | | 8,142,372 |
| Merck & Co., Inc. | | 3,033,300 | | 105,740,838 |
| MGI Pharma, Inc. (a) | | 90,800 | | 1,600,804 |
| Mylan Laboratories, Inc. | | 170,800 | | 3,928,400 |
| Novartis AG sponsored ADR | | 58,400 | | 3,109,800 |
| Par Pharmaceutical Companies, Inc. (a) | | 44,000 | | 1,308,560 |
| Penwest Pharmaceuticals Co. (a) | | 170,100 | | 3,954,825 |
| Pfizer, Inc. | | 7,960,510 | | 208,485,757 |
| Ranbaxy Laboratories Ltd. sponsored GDR | | 170,608 | | 1,625,894 |
| Roche Holding AG (participation certificate) (d) | | 113,003 | | 16,701,309 |
| Salix Pharmaceuticals Ltd. (a) | | 920,100 | | 14,500,776 |
| Sanofi-Aventis sponsored ADR | | 184,500 | | 7,865,235 |
| Schering-Plough Corp. | | 609,200 | | 11,270,200 |
| Schwarz Pharma AG sponsored ADR | | 100 | | 6,355 |
| Sepracor, Inc. (a) | | 129,800 | | 7,438,838 |
| Takeda Pharamaceutical Co. Ltd. | | 39,600 | | 2,192,531 |
| Taro Pharmaceutical Industries Ltd. (a) | | 10,700 | | 176,871 |
| Teva Pharmaceutical Industries Ltd. sponsored ADR | | 615,463 | | 25,843,291 |
| Valeant Pharmaceuticals International | | 34,700 | | 618,354 |
| ViroPharma, Inc. (a) | | 116,600 | | 2,256,210 |
| Watson Pharmaceuticals, Inc. (a) | | 38,500 | | 1,154,230 |
| Wyeth | | 2,479,770 | | 123,492,546 |
| | | | | 781,597,937 |
| |
| REAL ESTATE – 0.0% | | | | |
| Real Estate Investment Trusts – 0.0% | | | | |
| Ventas, Inc. | | 7,100 | | 220,100 |
| TEXTILES, APPAREL & LUXURY GOODS – 0.0% | | | | |
| Apparel, Accessories & Luxury Goods – 0.0% | | | | |
| Quiksilver, Inc. (a) | | 100 | | 1,450 |
| Under Armour, Inc. Class A | | 100 | | 2,819 |
| | | | | 4,269 |
See accompanying notes which are an integral part of the financial statements.
Annual Report 24
| | | Shares | | Value (Note 1) |
| Footwear – 0.0% | | | | | | |
| NIKE, Inc. Class B | | 100 | | $ | | 8,678 |
| TOTAL TEXTILES, APPAREL & LUXURY GOODS | | | | | | 12,947 |
| TOTAL COMMON STOCKS | | | | | | |
| (Cost $1,897,637,701) | | 2,375,154,983 |
| Nonconvertible Preferred Stocks — 0.0% | | | | | | |
| |
| BIOTECHNOLOGY – 0.0% | | | | | | |
| Biotechnology – 0.0% | | | | | | |
| GeneProt, Inc. Series A (a)(e) | | | | | | |
| (Cost $604,395) | | 111,000 | | | | 111 |
| Money Market Funds — 1.9% | | | | | | |
| Fidelity Cash Central Fund, 4.57% (b) | | 2,410,236 | | | | 2,410,236 |
| Fidelity Securities Lending Cash Central Fund, 4.58% (b)(c) | | 42,771,148 | | 42,771,148 |
| TOTAL MONEY MARKET FUNDS | | | | | | |
| (Cost $45,181,384) | | | | 45,181,384 |
| TOTAL INVESTMENT PORTFOLIO - 101.7% | | | | | | |
| (Cost $1,943,423,480) | | 2,420,336,478 |
| |
| NET OTHER ASSETS – (1.7)% | | | | (40,013,241) |
| NET ASSETS – 100% | | $ 2,380,323,237 |
(a) Non-income producing
(b) Affiliated fund that is available only to investment companies and other accounts managed by Fidelity Investments. The rate quoted is the annualized seven-day yield of the fund at period end. A complete unaudited listing of the fund’s holdings as of its most recent quarter end is available upon request.
(c) Investment made with cash collateral received from securities on loan. (d) Security or a portion of the security is on loan at period end.
(e) Restricted securities – Investment in securities not registered under the Securities Act of 1933 (excluding 144A issues). At the end of the period, the value of restricted securities (excluding 144A issues) amounted to $1,006,320 or 0.0% of net assets.
| Additional information on each holding is as follows: | | | | |
| Security | | Acquisition Date | | Acquisition Cost |
| GeneProt, Inc. Series A | | 7/7/00 | | $ 604,395 |
| Inverness Medical Innovations, Inc. | | 2/8/06 | | $ 1,030,224 |
See accompanying notes which are an integral part of the financial statements.
|
25 Annual Report
25
| Health Care Portfolio | | |
| Investments - continued | | |
| |
| |
| Affiliated Central Funds | | |
| Information regarding fiscal year to date income earned by the fund from the affiliated Central funds is as follows: | | |
| |
| Fund | | Income earned |
| Fidelity Cash Central Fund | | $ 482,406 |
| Fidelity Securities Lending Cash Central Fund | | 277,466 |
| Total | | $ 759,872 |
See accompanying notes which are an integral part of the financial statements.
|
| Health Care Portfolio | | | | | | |
| |
| Financial Statements | | | | | | |
| |
| |
| Statement of Assets and Liabilities | | | | | | |
| | | | | | | February 28, 2006 |
| |
| Assets | | | | | | |
| Investment in securities, at value (including securities loaned of $41,197,837) — See accompanying schedule: | | | | | | |
| Unaffiliated issuers (cost $1,898,242,096) | | $2,375,155,094 | | |
| Affiliated Central Funds (cost $45,181,384) | | | | 45,181,384 | | |
| Total Investments (cost $1,943,423,480) | | | | | | $2,420,336,478 |
| Cash | | | | | | 43,056 |
| Foreign currency held at value (cost $1,491,905) | | | | | | 1,491,905 |
| Receivable for investments sold | | | | | | 5,442,942 |
| Receivable for fund shares sold | | | | | | 4,565,583 |
| Dividends receivable | | | | | | 2,891,421 |
| Interest receivable | | | | | | 13,604 |
| Prepaid expenses | | | | | | 8,725 |
| Other affiliated receivables | | | | | | 19,578 |
| Other receivables | | | | | | 174,253 |
| Total assets | | | | | | 2,434,987,545 |
| |
| Liabilities | | | | | | |
| Payable for investments purchased | | $ | | 6,977,290 | | |
| Payable for fund shares redeemed | | | | 3,100,843 | | |
| Accrued management fee | | | | 1,116,483 | | |
| Other affiliated payables | | | | 653,239 | | |
| Other payables and accrued expenses | | | | 45,305 | | |
| Collateral on securities loaned, at value | | | | 42,771,148 | | |
| Total liabilities | | | | | | 54,664,308 |
| |
| Net Assets | | | | | | $ 2,380,323,237 |
| Net Assets consist of: | | | | | | |
| Paid in capital | | | | | | $1,667,909,412 |
| Accumulated net investment loss | | | | | | (58,050) |
| Accumulated undistributed net realized gain (loss) on investments and foreign currency transactions | | | | | | 235,568,087 |
| Net unrealized appreciation (depreciation) on investments and assets and liabilities in foreign currencies | | | | | | 476,903,788 |
| Net Assets, for 17,113,095 shares outstanding | | | | | | $ 2,380,323,237 |
| Net Asset Value, offering price and redemption price per share ($2,380,323,237 ÷ 17,113,095 shares) | | | | | | $ 139.09 |
| |
| Statement of Operations | | | | | | |
| | | | | | | Year ended February 28, 2006 |
| |
| Investment Income | | | | | | |
| Dividends | | | | | | $ 15,716,833 |
| Interest | | | | | | 14,724 |
| Income from affiliated Central Funds (including $277,466 from security lending) | | | | | | 759,872 |
| Total income | | | | | | 16,491,429 |
| |
| Expenses | | | | | | |
| Management fee | | $ | | 12,561,974 | | |
| Transfer agent fees | | | | 6,401,782 | | |
| Accounting and security lending fees | | | | | | |
| | | | | 853,509 | | |
| Independent trustees’ compensation | | | | 9,330 | | |
| Appreciation in deferred trustee compensation account | | | | 5,547 | | |
| Custodian fees and expenses | | | | 87,276 | | |
| Registration fees | | | | 93,105 | | |
| Audit | | | | 45,489 | | |
| Legal | | | | 11,148 | | |
| Interest | | | | 7,811 | | |
| Miscellaneous | | | | 23,337 | | |
| Total expenses before reductions | | | | 20,100,308 | | |
| Expense reductions | | | | (937,237) | | 19,163,071 |
| |
| See accompanying notes which are an integral part of the financial statements. | | | | | | |
27 Annual Report
| Health Care Portfolio | | | | |
| Financial Statements - continued | | | | |
| |
| |
| |
| Net investment income (loss) | | | | (2,671,642) |
| Realized and Unrealized Gain (Loss) | | | | |
| Net realized gain (loss) on: | | | | |
| Investment securities: | | | | |
| Unaffiliated issuers | | 467,871,640 | | |
| Foreign currency transactions | | 53,880 | | |
| Total net realized gain (loss) | | | | 467,925,520 |
| Change in net unrealized appreciation (depreciation) on: | | | | |
| Investment securities | | (62,059,830) | | |
| Assets and liabilities in foreign currencies | | (9,210) | | |
| Total change in net unrealized appreciation (depreciation) | | | | (62,069,040) |
| Net gain (loss) | | | | 405,856,480 |
| Net increase (decrease) in net assets resulting from operations | | | | $ 403,184,838 |
See accompanying notes which are an integral part of the financial statements.
Annual Report 28
| Statement of Changes in Net Assets | | | | | | | | | | | | | | | | | | |
| | | | | | | | | | | Year ended | | | | Year ended |
| | | | | | | | | | | February 28, | | | | February 28, |
| | | | | | | | | | | 2006 | | | | 2005 |
| Increase (Decrease) in Net Assets | | | | | | | | | | | | | | | | | | |
| Operations | | | | | | | | | | | | | | | | | | |
| Net investment income (loss) | | | | | | | | $ | | (2,671,642) | | $ | | | | 2,249,911 |
| Net realized gain (loss) | | | | | | | | | | 467,925,520 | | | | 62,712,506 |
| Change in net unrealized appreciation (depreciation) | | | | | | | | | | (62,069,040) | | | | (11,381,747) |
| Net increase (decrease) in net assets resulting from operations | | | | | | | | | | 403,184,838 | | | | 53,580,670 |
| Distributions to shareholders from net investment income | | | | | | | | | | (592,623) | | | | | | (2,031,580) |
| Distributions to shareholders from net realized gain | | | | | | | | | | (214,985,606) | | | | | | — |
| Total distributions | | | | | | | | | | (215,578,229) | | | | | | (2,031,580) |
| Share transactions | | | | | | | | | | | | | | | | | | |
| Proceeds from sales of shares | | | | | | | | | | 714,309,159 | | | | 311,473,261 |
| Reinvestment of distributions | | | | | | | | | | 202,655,649 | | | | | | 1,902,938 |
| Cost of shares redeemed | | | | | | | | | | (630,625,737) | | | | (494,547,994) |
| Net increase (decrease) in net assets resulting from share transactions | | | | | | | | 286,339,071 | | | | (181,171,795) |
| Redemption fees | | | | | | | | | | | | 126,010 | | | | | | 91,866 |
| Total increase (decrease) in net assets | | | | | | | | | | 474,071,690 | | | | (129,530,839) |
| |
| Net Assets | | | | | | | | | | | | | | | | | | |
| Beginning of period | | | | | | | | 1,906,251,547 | | | | 2,035,782,386 |
| End of period (including accumulated net investment loss of $58,050 and undistributed net investment income | | | | | | | | | | | | |
| of $476,847, respectively) | | | | | | | | $ 2,380,323,237 | | $ 1,906,251,547 |
| |
| Other Information | | | | | | | | | | | | | | | | | | |
| Shares | | | | | | | | | | | | | | | | | | |
| Sold | | | | | | | | | | 5,197,779 | | | | | | 2,545,356 |
| Issued in reinvestment of distributions | | | | | | | | | | 1,471,110 | | | | | | 15,395 |
| Redeemed | | | | | | | | | | (4,557,268) | | | | | | (4,062,696) |
| Net increase (decrease) | | | | | | | | | | 2,111,621 | | | | | | (1,501,945) |
| |
| Financial Highlights | | | | | | | | | | | | | | | | | | |
| Years ended February 28, | | | | 2006 | | 2005 | | 2004E | | | | 2003 | | | | | | 2002 |
| Selected Per-Share Data | | | | | | | | | | | | | | | | | | |
| Net asset value, beginning of period | | $ | | 127.07 | | $ 123.36 | | $ 99.56 | | $ | | 121.42 | | | | $ | | 134.00 |
| Income from Investment Operations | | | | | | | | | | | | | | | | | | |
| Net investment income (loss)C | | | | (.17) | | .14 | | .13 | | | | .23 | | | | | | .17 |
| Net realized and unrealized gain (loss) | | | | 25.97 | | 3.69 | | 23.84 | | | | (19.48) | | | | | | (12.45) |
| Total from investment operations | | | | 25.80 | | 3.83 | | 23.97 | | | | (19.25) | | | | | | (12.28) |
| Distributions from net investment income | | | | (.04) | | (.13) | | (.18) | | | | (.20) | | | | | | (.13) |
| Distributions from net realized gain | | | | (13.75) | | — | | — | | | | (2.42) | | | | | | (.19) |
| Total distributions | | | | (13.79) | | (.13) | | (.18) | | | | (2.62) | | | | | | (.32) |
| Redemption fees added to paid in capitalC | | | | 01 | | .01 | | .01 | | | | .01 | | | | | | .02 |
| Net asset value, end of period | | $ | | 139.09 | | $ 127.07 | | $ 123.36 | | $ | | 99.56 | | | | $ | | 121.42 |
| Total ReturnA,B | | | | 20.42% | | 3.12% | | 24.11% | | | | (16.14)% | | | | | | (9.15)% |
| Ratios to Average Net AssetsD | | | | | | | | | | | | | | | | | | |
| Expenses before reductions | | | | 91% | | .93% | | 1.02% | | | | 1.05% | | | | | | .99% |
| Expenses net of fee waivers, if any | | | | 91% | | .93% | | 1.02% | | | | 1.05% | | | | | | .99% |
| Expenses net of all reductions | | | | 87% | | .92% | | .99% | | | | .99% | | | | | | .96% |
| Net investment income (loss) | | | | (.12)% | | .11% | | .12% | | | | .22% | | | | | | .13% |
| Supplemental Data | | | | | | | | | | | | | | | | | | |
| Net assets, end of period (000 omitted) | | $ 2,380,323 | | $1,906,252 | | $2,035,782 | | $ 1,748,459 | | | | $ 2,367,412 |
| Portfolio turnover rate | | | | 120% | | 32% | | 104% | | | | 139% | | | | | | 135% |
| |
| | | | | |
A Total returns would have been lower had certain expenses not been reduced during the periods shown. B Total returns do not include the effect of the former sales charges. C Calculated based on average shares outstanding during the period. DExpense ratios reflect operating expenses of the fund. Expenses before reductions do not reflect amounts reimbursed by the investment adviser or reductions from brokerage service arrangements or other expense offset arrangements and do not represent the amount paid by the fund during periods when reimbursements or reductions occur. Expenses net of fee waivers reflect expenses after reimbursement by the investment adviser but prior to reductions from brokerage service arrangements or other expense offset arrangements. Expenses net of all reductions represent the net expenses paid by the fund. EFor the year ended February 29.See accompanying notes which are an integral part of the financial statements.
29
Medical Delivery Portfolio
Performance
|

Average annual total return reflects the change in the value of an investment, assuming reinvestment of the fund’s dividend income and capital gains (the profits earned upon the sale of securities that have grown in value) and assuming a constant rate of performance each year. The $10,000 table and the fund’s returns do not reflect the deduction of taxes that a shareholder would pay on fund distributions or the redemption of fund shares. During periods of reimbursement by Fidelity a fund’s total returns will be greater than it would be had the reimbursement not occurred. How a fund did yesterday is no guarantee of how it will do tomorrow.
| Average Annual Total Returns | | | | | | |
| Periods ended February 28, 2006 | | Past 1 | | Past 5 | | Past 10 |
| | | year | | years | | years |
| Select Medical Delivery | | 24.54% | | 17.76% | | 11.25% |
$10,000 Over 10 Years
Let’s say hypothetically that $10,000 was invested in Fidelity Select Medical Delivery Portfolio on February 29, 1996. The chart shows how the value of your investment would have changed, and also shows how the S&P 500 Index performed over the same period.
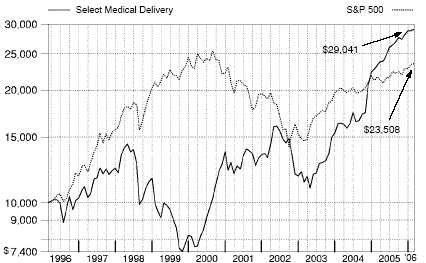
Medical Delivery Portfolio
|
Management’s Discussion of Fund Performance
Comments from Matthew Sabel, Portfolio Manager of Fidelity® Select Medical Delivery Portfolio
With the exception of several popular large-cap stock performance measures, most major U.S. equity benchmarks had double-digit returns for the year ending February 28, 2006. For much of the period, market gains were driven largely by the energy sector, although utilities ultimately sneaked into the top spot for the year overall. Financials and telecommunication services also reached double figures, outperforming the 8.40% return of the broader market as measured by the large-cap-oriented Standard & Poor’s 500SM Index. The consumer discretionary segment — home to the weak performing automobile and media industries — was the biggest disappointment. Although the overall return for the S&P 500® beat the small-cap Russell 2000® Index in calendar year 2005 — the first time that’s happened in six years — small-caps stormed back in early 2006, leading to a 16.59% advance during the past 12 months, nearly twice the broader market’s gain. Mid-caps soared even higher, returning 17.67% according to the Russell Midcap® Index. The technology-heavy NASDAQ Composite® Index also fared well, climbing 12.13%, but the Dow Jones Industrial AverageSM, an index of 30 large-cap, blue-chip stocks, managed to rise only 4.52% .
For the 12 months ending February 28, 2006, the fund returned 24.54%, outperforming the S&P 500 and the 14.85% return of the Goldman Sachs® Health Care Index. Strong stock selection and an overweighting in the managed health care group helped the fund most relative to the sector benchmark, followed by positive security selection and an underweighting in pharmaceuticals. Solid stock picking and an overweighting in health care distributors also helped. Carrying a significant underweighting in biotechnology — which lies outside the scope of this fund — ate into returns, as did a weak stock pick in industrial conglomerates. The fund benefited from carrying a significant underweighting in index heavyweight and pharmaceutical giant Johnson & Johnson, which it did not own at period end. Several managed care companies were among the top performers, including Health Net, Humana, UnitedHealth Group and Aetna. Drug distributor McKesson also offered strong performance, as did an out-of-benchmark position in Teva Pharmaceutical. On the downside, not owning Genentech and underweighting Gilead Sciences, both biotechnology firms in the index, held back the fund’s performance. The fund also lost ground with industrial conglomerate Tyco International and health care equipment provider Kinetic Concepts.
The views expressed above reflect those of the portfolio manager(s) only through the end of the period as stated on the cover of this report and do not necessarily represent the views of Fidelity or any other person in the Fidelity organization. Any such views are subject to change at any time based upon market or other conditions and Fidelity disclaims any responsibility to update such views. These views may not be relied on as investment advice and, because investment decisions for a Fidelity fund are based on numerous factors, may not be relied on as an indication of trading intent on behalf of any Fidelity fund.
31 31 Annual Report
Medical Delivery Portfolio
Investment Changes
Top Ten Stocks as of February 28, 2006
| | | % of fund’s | | % of fund’s net assets |
| | | net assets | | 6 months ago |
| UnitedHealth Group, Inc. | | 9.1 | | 9.5 |
| Medco Health Solutions, Inc. | | 6.8 | | 1.7 |
| Omnicare, Inc. | | 6.3 | | 0.0 |
| Aetna, Inc. | | 6.1 | | 6.1 |
| CIGNA Corp. | | 5.7 | | 0.5 |
| Health Net, Inc. | | 5.4 | | 5.2 |
| Humana, Inc. | | 5.4 | | 3.4 |
| McKesson Corp. | | 5.2 | | 6.1 |
| Caremark Rx, Inc. | | 4.6 | | 4.1 |
| WellPoint, Inc. | | 4.3 | | 6.5 |
| | | 58.9 | | |
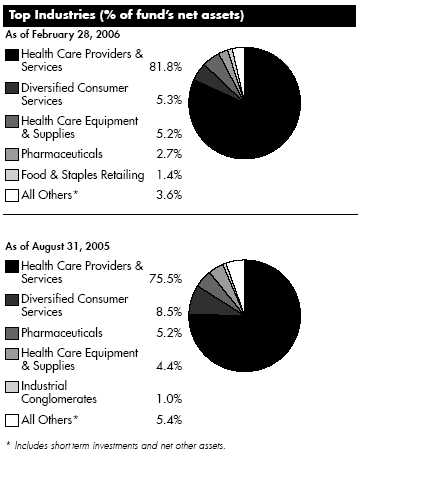
| Medical Delivery Portfolio | | | | | | |
| Investments February 28, 2006 | | | | |
| Showing Percentage of Net Assets | | | | | | |
| |
| Common Stocks — 99.7% | | | | | | |
| | | | | Shares | | Value (Note 1) |
| |
| BIOTECHNOLOGY – 0.7% | | | | | | |
| Biotechnology – 0.7% | | | | | | |
| Alnylam Pharmaceuticals, Inc. (a) | | | | 37,900 | | $ 609,432 |
| Cepheid, Inc. (a) | | | | 5,000 | | 45,800 |
| DUSA Pharmaceuticals, Inc. (a) | | | | 175,000 | | 1,268,750 |
| Gilead Sciences, Inc. (a) | | | | 50,000 | | 3,113,500 |
| Martek Biosciences (a)(e) | | | | 100,250 | | 3,416,520 |
| Seracare Life Sciences, Inc. (a) | | | | 100,000 | | 1,121,000 |
| Theravance, Inc. (a) | | | | 12,800 | | 359,168 |
| | | | | | | 9,934,170 |
| |
| COMMERCIAL SERVICES & SUPPLIES – 0.2% | | | | | | |
| Diversified Commercial & Professional Services – 0.0% | | | | | | |
| Healthcare Services Group, Inc. | | | | 10,000 | | 184,600 |
| Human Resource & Employment Services – 0.2% | | | | | | |
| Watson Wyatt Worldwide, Inc. Class A | | | | 108,800 | | 3,324,928 |
| |
| TOTAL COMMERCIAL SERVICES & SUPPLIES | | | | | | 3,509,528 |
| |
| DIVERSIFIED CONSUMER SERVICES – 5.3% | | | | | | |
| Specialized Consumer Services – 5.3% | | | | | | |
| Alderwoods Group, Inc. (a) | | | | 120,489 | | 2,057,952 |
| Carriage Services, Inc. Class A (a) | | | | 506,549 | | 2,512,483 |
| Service Corp. International (SCI) | | | | 5,454,930 | | 43,366,694 |
| Weight Watchers International, Inc. (a) | | | | 579,800 | | 30,422,106 |
| | | | | | | 78,359,235 |
| |
| FOOD & STAPLES RETAILING – 1.4% | | | | | | |
| Drug Retail – 0.3% | | | | | | |
| Allion Healthcare, Inc. | | | | 60,000 | | 993,000 |
| Cosmos Pharmaceutical Corp. | | | | 70,000 | | 2,104,796 |
| Rite Aid Corp. (a) | | | | 475,000 | | 1,752,750 |
| | | | | | | 4,850,546 |
| Food Retail – 1.1% | | | | | | |
| Safeway, Inc. | | | | 670,000 | | 16,287,700 |
| |
| TOTAL FOOD & STAPLES RETAILING | | | | | | 21,138,246 |
| |
| HEALTH CARE EQUIPMENT & SUPPLIES – 5.2% | | | | | | |
| Health Care Equipment – 3.6% | | | | | | |
| Abiomed, Inc. (a) | | | | 500 | | 5,200 |
| Aspect Medical Systems, Inc. (a) | | | | 376,100 | | 10,075,719 |
| IDEXX Laboratories, Inc. (a) | | | | 10,000 | | 785,800 |
| INAMED Corp. (a) | | | | 145,000 | | 12,822,350 |
| Kinetic Concepts, Inc. (a) | | | | 277,400 | | 10,291,540 |
| Mentor Corp. | | | | 6,600 | | 284,064 |
| NeuroMetrix, Inc. (a) | | | | 57,700 | | 2,072,584 |
| Phonak Holding AG | | | | 15,000 | | 724,875 |
| PhotoMedex, Inc. (a) | | | | 100,000 | | 223,000 |
| Quidel Corp. (a) | | | | 80,000 | | 899,200 |
| Syneron Medical Ltd. (a)(e) | | | | 540,300 | | 14,804,220 |
| William Demant Holding AS (a) | | | | 10,000 | | 582,320 |
| | | | | | | 53,570,872 |
33
See accompanying notes which are an integral part of the financial statements.
33 Annual Report
| Medical Delivery Portfolio | | | | |
| Investments - continued | | | | |
| |
| |
| |
| | | Shares | | Value (Note 1) |
| Health Care Supplies – 1.6% | | | | |
| Align Technology, Inc. (a) | | 5,000 | | $ 40,800 |
| Coloplast AS Series B | | 12,500 | | 834,738 |
| Cynosure, Inc. Class A | | 60,000 | | 1,103,406 |
| Inverness Medical Innovations, Inc. (a) | | 778,600 | | 20,625,114 |
| Regeneration Technologies, Inc. (a) | | 50,000 | | 367,500 |
| | | | | 22,971,558 |
| |
| TOTAL HEALTH CARE EQUIPMENT & SUPPLIES | | | | 76,542,430 |
| |
| HEALTH CARE PROVIDERS & SERVICES – 81.7% | | | | |
| Health Care Distributors & Services – 7.5% | | | | |
| Cardinal Health, Inc. | | 58,300 | | 4,232,580 |
| DrugMax, Inc. (a) | | 677,500 | | 609,750 |
| Henry Schein, Inc. (a) | | 429,200 | | 20,022,180 |
| McKesson Corp. | | 1,418,000 | | 76,756,340 |
| NationsHealth, Inc. (a) | | 65,904 | | 282,069 |
| Patterson Companies, Inc. (a) | | 215,135 | | 7,753,465 |
| PSS World Medical, Inc. (a) | | 65,000 | | 1,123,200 |
| | | | | 110,779,584 |
| Health Care Facilities – 7.9% | | | | |
| Acibadem Saglik Hizmetleri AS | | 276,000 | | 2,898,630 |
| American Retirement Corp. (a) | | 259,000 | | 6,972,280 |
| AmSurg Corp. (a) | | 50,500 | | 1,106,455 |
| Apollo Hospitals Enterprise Ltd. | | 966,565 | | 11,627,160 |
| Bangkok Dusit Medical Service PCL Class F (For. Reg.) | | 1,772,600 | | 1,074,166 |
| Brookdale Senior Living, Inc. | | 440,000 | | 14,568,400 |
| Bumrungrad Hospital PCL (For. Reg.) | | 2,268,300 | | 1,942,931 |
| Capital Senior Living Corp. (a) | | 180,000 | | 1,935,000 |
| Community Health Systems, Inc. (a) | | 736,700 | | 27,935,664 |
| Emeritus Corp. (a) | | 115,000 | | 2,863,500 |
| Five Star Quality Care, Inc. (a) | | 35,000 | | 290,500 |
| Health Management Associates, Inc. Class A | | 185,600 | | 3,951,424 |
| HealthSouth Corp. (a) | | 2,180 | | 10,638 |
| Kindred Healthcare, Inc. (a) | | 100 | | 2,162 |
| LifePoint Hospitals, Inc. (a) | | 2,200 | | 68,332 |
| Medcath Corp. (a) | | 40,000 | | 916,800 |
| Odyssey Healthcare, Inc. (a) | | 50,000 | | 941,000 |
| Radiation Therapy Services, Inc. (a) | | 440,964 | | 12,518,968 |
| Sunrise Senior Living, Inc. (a) | | 256,400 | | 9,091,944 |
| Symbion, Inc. (a) | | 50,000 | | 1,179,000 |
| Tenet Healthcare Corp. (a) | | 100 | | 789 |
| Triad Hospitals, Inc. (a) | | 117,500 | | 5,059,550 |
| U.S. Physical Therapy, Inc. (a) | | 409,552 | | 7,883,876 |
| United Surgical Partners International, Inc. (a) | | 3,750 | | 131,813 |
| Universal Health Services, Inc. Class B | | 500 | | 25,115 |
| VCA Antech, Inc. (a) | | 30,000 | | 838,500 |
| | | | | 115,834,597 |
See accompanying notes which are an integral part of the financial statements.
Annual Report 34
| Common Stocks – continued | | | | |
| | | Shares | | Value (Note 1) |
| |
| HEALTH CARE PROVIDERS & SERVICES – CONTINUED | | | | |
| Health Care Services – 27.2% | | | | |
| Allied Healthcare International, Inc. (a) | | 90,321 | | $ 437,154 |
| Allscripts Healthcare Solutions, Inc. (a)(e) | | 290,000 | | 5,437,500 |
| American Dental Partners, Inc. (a) | | 113,488 | | 1,478,749 |
| AMICAS, Inc. (a) | | 50,000 | | 245,500 |
| AMN Healthcare Services, Inc. (a) | | 60,000 | | 1,244,400 |
| Apria Healthcare Group, Inc. (a) | | 95,500 | | 2,195,545 |
| Caremark Rx, Inc. (a) | | 1,353,500 | | 67,336,625 |
| Cerner Corp. (a) | | 197,401 | | 8,217,804 |
| Covance, Inc. (a) | | 185,700 | | 10,482,765 |
| DaVita, Inc. (a) | | 233,700 | | 13,645,743 |
| Diagnosticos da America SA (a) | | 105,000 | | 2,565,837 |
| Emageon, Inc. | | 188,698 | | 3,311,650 |
| Emdeon Corp. (a) | | 150,000 | | 1,581,000 |
| Emergency Medical Services Corp. Class A | | 240,600 | | 3,231,258 |
| Express Scripts, Inc. (a) | | 400 | | 34,908 |
| Health Grades, Inc. (a) | | 879,570 | | 5,154,280 |
| Healthways, Inc. (a) | | 207,948 | | 9,056,135 |
| HMS Holdings Corp. (a) | | 646,929 | | 5,563,589 |
| Hooper Holmes, Inc. | | 5,000 | | 14,200 |
| Lincare Holdings, Inc. (a) | | 100 | | 4,090 |
| Medco Health Solutions, Inc. (a) | | 1,795,900 | | 100,067,548 |
| Nighthawk Radiology Holdings, Inc. | | 50,000 | | 1,183,500 |
| Omnicare, Inc. | | 1,511,500 | | 91,974,775 |
| Pediatric Services of America, Inc. (a) | | 37,500 | | 477,375 |
| Pharmaceutical Product Development, Inc. | | 400 | | 27,836 |
| Phase Forward, Inc. (a) | | 100,000 | | 994,000 |
| PRA International (a) | | 835,046 | | 22,003,462 |
| Providence Service Corp. (a) | | 20,000 | | 616,600 |
| Quest Diagnostics, Inc. | | 129,900 | | 6,867,813 |
| RehabCare Group, Inc. (a) | | 213,800 | | 4,314,484 |
| Rural/Metro Corp. (a)(f) | | 1,957,400 | | 16,872,788 |
| SFBC International, Inc. (a)(e) | | 45,400 | | 1,071,440 |
| TriZetto Group, Inc. (a) | | 115,000 | | 1,927,400 |
| VistaCare, Inc. Class A (a) | | 236,100 | | 3,199,155 |
| Vital Images, Inc. (a) | | 152,997 | | 5,079,500 |
| WebMD Health Corp. Class A (e) | | 63,400 | | 2,355,944 |
| | | | | 400,272,352 |
| Managed Health Care – 39.1% | | | | |
| Aetna, Inc. | | 1,742,800 | | 88,882,800 |
| AMERIGROUP Corp. (a) | | 342,600 | | 7,328,214 |
| Centene Corp. (a) | | 1,800 | | 49,230 |
| CIGNA Corp. | | 681,900 | | 83,703,225 |
| Coventry Health Care, Inc. (a) | | 317,700 | | 18,941,274 |
| Health Net, Inc. (a) | | 1,663,500 | | 79,764,825 |
| Healthspring, Inc. | | 123,000 | | 2,902,800 |
| Humana, Inc. (a) | | 1,540,700 | | 79,607,969 |
| Molina Healthcare, Inc. (a) | | 1,473 | | 41,848 |
| |
| |
| | | Shares | | Value (Note 1) |
| National Medical Health Card Systems, Inc. (a) | | 35,000 | | $ 1,058,750 |
| |
| See accompanying notes which are an integral part of the financial statements. | | | | |
35 Annual Report
35
| Medical Delivery Portfolio | | | | |
| Investments - continued | | | | |
| |
| |
| Sierra Health Services, Inc. (a) | | 270,600 | | 11,281,314 |
| UnitedHealth Group, Inc. | | 2,291,092 | | 133,410,289 |
| Wellcare Health Plans, Inc. (a) | | 92,800 | | 3,614,560 |
| WellPoint, Inc. (a) | | 824,100 | | 63,282,639 |
| | | | | 573,869,737 |
| |
| TOTAL HEALTH CARE PROVIDERS & SERVICES | | | | 1,200,756,270 |
| |
| HOTELS, RESTAURANTS & LEISURE – 0.2% | | | | |
| Leisure Facilities – 0.2% | | | | |
| Life Time Fitness, Inc. (a) | | 63,700 | | 2,672,852 |
| INDUSTRIAL CONGLOMERATES – 0.1% | | | | |
| Industrial Conglomerates – 0.1% | | | | |
| Max India Ltd. (a) | | 50,000 | | 879,277 |
| Tyco International Ltd. | | 6,800 | | 175,372 |
| | | | | 1,054,649 |
| |
| INSURANCE – 1.1% | | | | |
| Life & Health Insurance – 1.1% | | | | |
| Ceres Group, Inc. (a) | | 150,000 | | 811,500 |
| China Life Insurance Co. Ltd. ADR (a) | | 55,000 | | 2,501,400 |
| Discovery Holdings Ltd. (a) | | 99,910 | | 398,312 |
| Universal American Financial Corp. (a) | | 838,300 | | 12,700,245 |
| | | | | 16,411,457 |
| |
| INTERNET & CATALOG RETAIL – 0.9% | | | | |
| Internet Retail – 0.9% | | | | |
| NutriSystem, Inc. (a)(e) | | 297,656 | | 12,790,278 |
| PERSONAL PRODUCTS – 0.2% | | | | |
| Personal Products – 0.2% | | | | |
| Herbalife Ltd. (a) | | 10,000 | | 309,900 |
| Natura Cosmeticos SA | | 36,600 | | 2,094,482 |
| Nature’s Sunshine Products, Inc. | | 10,000 | | 169,700 |
| | | | | 2,574,082 |
| |
| PHARMACEUTICALS – 2.7% | | | | |
| Pharmaceuticals – 2.7% | | | | |
| Adams Respiratory Therapeutics, Inc. | | 75,551 | | 2,833,918 |
| Allergan, Inc. | | 152,500 | | 16,509,650 |
| Atherogenics, Inc. (a) | | 57,100 | | 920,452 |
| Barr Pharmaceuticals, Inc. (a) | | 22,500 | | 1,511,550 |
| Cipla Ltd. | | 300 | | 3,741 |
| Endo Pharmaceuticals Holdings, Inc. (a) | | 20,000 | | 630,400 |
| Strides Arcolab Ltd. | | 20,000 | | 157,199 |
| Teva Pharmaceutical Industries Ltd. sponsored ADR | | 258,000 | | 10,833,420 |
| ViroPharma, Inc. (a) | | 309,900 | | 5,996,565 |
| | | | | 39,396,895 |
See accompanying notes which are an integral part of the financial statements.
Annual Report 36
| Common Stocks – continued | | | | | | |
| | | Shares | | | | Value (Note 1) |
| SOFTWARE – 0.0% | | | | | | |
| Systems Software – 0.0% | | | | | | |
| DATATRAK International, Inc. (a) | | 40,000 | | $ | | 300,000 |
| TOTAL COMMON STOCKS | | | | | | |
| (Cost $1,226,061,720) | | 1,465,440,092 |
| Nonconvertible Bonds — 0.1% | | | | | | |
| | | Principal | | | | |
| | | Amount | | | | |
| HEALTH CARE PROVIDERS & SERVICES – 0.1% | | | | | | |
| Health Care Services – 0.1% | | | | | | |
| Rural/Metro Corp.: | | | | | | |
| 0% 3/15/16 (d) | | $ 2,790,000 | | | | 1,994,850 |
| 9.875% 3/15/15 | | 20,000 | | | | 21,700 |
| TOTAL NONCONVERTIBLE BONDS | | | | | | |
| (Cost $1,713,242) | | | | | | 2,016,550 |
| Money Market Funds — 2.3% | | | | | | |
| | | Shares | | | | |
| Fidelity Cash Central Fund, 4.57% (b) | | 8,692,227 | | | | 8,692,227 |
| Fidelity Securities Lending Cash Central Fund, 4.58% (b)(c) | | 24,673,650 | | | | 24,673,650 |
| TOTAL MONEY MARKET FUNDS | | | | | | |
| (Cost $33,365,877) | | | | 33,365,877 |
| TOTAL INVESTMENT PORTFOLIO - 102.1% | | | | | | |
| (Cost $1,261,140,839) | | 1,500,822,519 |
| |
| NET OTHER ASSETS – (2.1)% | | | | (30,961,471) |
| NET ASSETS – 100% | | $ 1,469,861,048 |
(a) Non-income producing
(b) Affiliated fund that is available only to investment companies and other accounts managed by Fidelity Investments. The rate quoted is the annualized seven-day yield of the fund at period end. A complete unaudited listing of the fund’s holdings as of its most recent quarter end is available upon request.
(c) Investment made with cash collateral received from securities on loan.
(d) Debt obligation initially issued in zero coupon form which converts to coupon form at a specified rate and date. The rate shown is the rate at period end. (e) Security or a portion of the security is on loan at period end.
(f) Affiliated company
Information regarding fiscal year to date income earned by the fund from the affiliated Central funds is as follows:
| Fund | | | | Income earned |
| Fidelity Cash Central Fund | | $ | | 1,381,356 |
| Fidelity Securities Lending Cash Central Fund | | | | 114,604 |
| | | $ | | 1,495,960 |
Other Affiliated Issuers
An affiliated company is a company in which the fund has ownership of at least 5% of the voting securities. Fiscal year to date transactions with companies which are or were affiliates are as follows:
See accompanying notes which are an integral part of the financial statements.
37 Annual Report
37
| Medical Delivery Portfolio | | | | | | | | | | | | | | | | | | |
| Investments - continued | | | | | | | | | | | | | | | | | | |
| |
| |
| | | Value, | | | | | | | | | | | | | | | | Value, |
| | | beginning | | | | | | Sales | | | | | | Dividend | | | | end of |
| Affiliate | | of period | | Purchases | | | | Proceeds | | | | | | Income | | | | period |
| Rural/Metro Corp. | | $ 54,736 | | $ 15,040,199 | | | | $— | | | | | | $— | | | | $ 16,872,788 |
See accompanying notes which are an integral part of the financial statements.
Annual Report 38
| Medical Delivery Portfolio | | | | | | | | |
| |
| Financial Statements | | | | | | | | |
| |
| |
| Statement of Assets and Liabilities | | | | | | | | |
| | | | | | | | | February 28, 2006 |
| |
| Assets | | | | | | | | |
| Investment in securities, at value (including securities loaned of $23,666,360) — See accompanying schedule: | | | | | | | | |
| Unaffiliated issuers (cost $1,212,682,228) | | $1,450,583,854 | | | | |
| Affiliated Central Funds (cost $33,365,877) | | | | 33,365,877 | | | | |
| Other affiliated issuers (cost $15,092,734) | | | | 16,872,788 | | | | |
| Total Investments (cost $1,261,140,839) | | | | | | $1,500,822,519 |
| Receivable for investments sold | | | | | | | | 11,016,382 |
| Receivable for fund shares sold | | | | | | | | 5,219,992 |
| Dividends receivable | | | | | | | | 104,632 |
| Interest receivable | | | | | | | | 26,431 |
| Prepaid expenses | | | | | | | | 5,057 |
| Other affiliated receivables | | | | | | | | 380 |
| Other receivables | | | | | | | | 110,271 |
| Total assets | | | | | | | | 1,517,305,664 |
| |
| Liabilities | | | | | | | | |
| Payable for investments purchased | | $ | | 8,372,074 | | | | |
| Payable for fund shares redeemed | | | | 13,003,207 | | | | |
| Accrued management fee | | | | 706,136 | | | | |
| Other affiliated payables | | | | 410,895 | | | | |
| Other payables and accrued expenses | | | | 278,654 | | | | |
| Collateral on securities loaned, at value | | | | 24,673,650 | | | | |
| Total liabilities | | | | | | | | 47,444,616 |
| |
| Net Assets | | | | | | $ 1,469,861,048 |
| Net Assets consist of: | | | | | | | | |
| Paid in capital | | | | | | $1,181,855,067 |
| Accumulated net investment loss | | | | | | | | (953) |
| Accumulated undistributed net realized gain (loss) on investments and foreign currency transactions | | | | | | | | 48,538,908 |
| Net unrealized appreciation (depreciation) on investments and assets and liabilities in foreign currencies | | | | | | | | 239,468,026 |
| Net Assets, for 26,732,934 shares outstanding | | | | | | $ 1,469,861,048 |
| Net Asset Value, offering price and redemption price per share ($1,469,861,048 ÷ 26,732,934 shares) | | | | | | $ | | 54.98 |
| |
| Statement of Operations | | | | | | | | |
| | | | | | | | | Year ended February 28, 2006 |
| |
| Investment Income | | | | | | | | |
| Dividends | | | | | | $ | | 2,209,125 |
| Interest | | | | | | | | 302,424 |
| Income from affiliated Central Funds (including $114,604 from security lending) | | | | | | | | 1,495,960 |
| Total income | | | | | | | | 4,007,509 |
| |
| Expenses | | | | | | | | |
| Management fee | | $ | | 7,339,423 | | | | |
| Transfer agent fees | | | | 4,013,992 | | | | |
| Accounting and security lending fees | | | | | | | | |
| | | | | 528,440 | | | | |
| Independent trustees’ compensation | | | | 5,442 | | | | |
| Custodian fees and expenses | | | | 89,945 | | | | |
| Registration fees | | | | 172,045 | | | | |
| Audit | | | | 39,635 | | | | |
| Legal | | | | 6,576 | | | | |
| Interest | | | | 9,529 | | | | |
| Miscellaneous | | | | 8,972 | | | | |
| Total expenses before reductions | | | | 12,213,999 | | | | |
| Expense reductions | | | | (574,170) | | | | 11,639,829 |
| |
| Net investment income (loss) | | | | | | | | (7,632,320) |
See accompanying notes which are an integral part of the financial statements.
39 Annual Report
| Medical Delivery Portfolio | | | | |
| Financial Statements - continued | | | | |
| |
| |
| Realized and Unrealized Gain (Loss) | | | | |
| Net realized gain (loss) on: | | | | |
| Investment securities: | | | | |
| Unaffiliated issuers (net of foreign taxes of $173,004) | | 87,150,431 | | |
| Foreign currency transactions | | (32,246) | | |
| Total net realized gain (loss) | | | | 87,118,185 |
| Change in net unrealized appreciation (depreciation) on: | | | | |
| Investment securities (net of increase in deferred foreign taxes of $214,748) | | 181,512,443 | | |
| Assets and liabilities in foreign currencies | | 1,866 | | |
| Total change in net unrealized appreciation (depreciation) | | | | 181,514,309 |
| Net gain (loss) | | | | 268,632,494 |
| Net increase (decrease) in net assets resulting from operations | | | | $ 261,000,174 |
See accompanying notes which are an integral part of the financial statements.
Annual Report 40
| Statement of Changes in Net Assets | | | | | | | | | | | | | | | | | | |
| | | | | | | | | Year ended | | | | Year ended |
| | | | | | | | | February 28, | | | | February 28, |
| | | | | | | | | 2006 | | | | 2005 |
| Increase (Decrease) in Net Assets | | | | | | | | | | | | | | | | | | |
| Operations | | | | | | | | | | | | | | | | | | |
| Net investment income (loss) | | | | | | | | $ | | (7,632,320) | | $ | | (1,944,302) |
| Net realized gain (loss) | | | | | | | | 87,118,185 | | | | 71,191,513 |
| Change in net unrealized appreciation (depreciation) | | | | | | | | 181,514,309 | | | | 29,777,960 |
| Net increase (decrease) in net assets resulting from operations | | | | | | | | 261,000,174 | | | | 99,025,171 |
| Distributions to shareholders from net realized gain | | | | | | | | (63,142,749) | | | | | | — |
| Share transactions | | | | | | | | | | | | | | | | | | |
| Proceeds from sales of shares | | | | | | | | 1,611,776,758 | | | | 807,944,418 |
| Reinvestment of distributions | | | | | | | | 60,447,547 | | | | | | — |
| Cost of shares redeemed | | | | | | | | (1,106,838,737) | | | | (411,306,636) |
| Net increase (decrease) in net assets resulting from share transactions | | | | | | | | 565,385,568 | | | | 396,637,782 |
| Redemption fees | | | | | | | | | | 435,074 | | | | | | 264,708 |
| Total increase (decrease) in net assets | | | | | | | | 763,678,067 | | | | 495,927,661 |
| |
| Net Assets | | | | | | | | | | | | | | | | | | |
| Beginning of period | | | | | | | | 706,182,981 | | | | 210,255,320 |
| End of period (including accumulated net investment loss of $953 and accumulated net investment loss | | | | | | | | | | | | |
| of $1,105, respectively) | | | | | | | | $ 1,469,861,048 | | $ | | 706,182,981 |
| |
| Other Information | | | | | | | | | | | | | | | | | | |
| Shares | | | | | | | | | | | | | | | | | | |
| Sold | | | | | | | | 31,776,334 | | | | 19,232,382 |
| Issued in reinvestment of distributions | | | | | | | | | | 1,194,823 | | | | | | — |
| Redeemed | | | | | | | | (21,329,025) | | | | (10,559,063) |
| Net increase (decrease) | | | | | | | | 11,642,132 | | | | | | 8,673,319 |
| |
| Financial Highlights | | | | | | | | | | | | | | | | | | |
| Years ended February 28, | | | | 2006 | | 2005 | | 2004E | | | | 2003 | | | | 2002 |
| Selected Per-Share Data | | | | | | | | | | | | | | | | | | |
| Net asset value, beginning of period | | $ | | 46.80 | | $ 32.76 | | $ 22.84 | | $ | | 26.49 | | $ | | 25.74 |
| Income from Investment Operations | | | | | | | | | | | | | | | | | | |
| Net investment income (loss)C | | | | (.31) | | (.28) | | (.30) | | | | (.28) | | | | (.20) |
| Net realized and unrealized gain (loss) | | | | 11.41 | | 14.28 | | 10.20 | | | | (3.46) | | | | .91 |
| Total from investment operations | | | | 11.10 | | 14.00 | | 9.90 | | | | (3.74) | | | | .71 |
| Distributions from net realized gain | | | | (2.94) | | — | | — | | | | — | | | | — |
| Redemption fees added to paid in capitalC | | | | 02 | | .04 | | .02 | | | | .09 | | | | .04 |
| Net asset value, end of period | | $ | | 54.98 | | $ 46.80 | | $ 32.76 | | $ | | 22.84 | | $ | | 26.49 |
| Total ReturnA,B | | | | 24.54% | | 42.86% | | 43.43% | | | | (13.78)% | | | | 2.91% |
| Ratios to Average Net AssetsD | | | | | | | | | | | | | | | | | | |
| Expenses before reductions | | | | 95% | | 1.03% | | 1.30% | | | | 1.25% | | | | 1.22% |
| Expenses net of fee waivers, if any | | | | 95% | | 1.03% | | 1.30% | | | | 1.25% | | | | 1.22% |
| Expenses net of all reductions | | | | 91% | | .92% | | 1.24% | | | | 1.13% | | | | 1.19% |
| Net investment income (loss) | | | | (.60)% | | (.72)% | | (1.11)% | | | | (.99)% | | | | (.77)% |
| Supplemental Data | | | | | | | | | | | | | | | | | | |
| Net assets, end of period (000 omitted) | | $ 1,469,861 | | $ 706,183 | | $ 210,255 | | $ 117,635 | | $ 139,252 |
| Portfolio turnover rate | | | | 106% | | 244% | | 196% | | | | 269% | | | | 106% |
ATotal returns would have been lower had certain expenses not been reduced during the periods shown. BTotal returns do not include the effect of the former sales charges. CCalculated based on average shares outstanding during the period. DExpense ratios reflect operating expenses of the fund. Expenses before reductions do not reflect amounts reimbursed by the investment adviser or reductions from brokerage service arrangements or other expense offset arrangements and do not represent the amount paid by the fund during periods when reimbursements or reductions occur. Expenses net of fee waivers reflect expenses after reimbursement by the investment adviser but prior to reductions from brokerage service arrangements or other expense offset arrangements. Expenses net of all reductions represent the net expenses paid by the fund. EFor the year ended February 29.
See accompanying notes which are an integral part of the financial statements.
|
Medical Equipment and Systems Portfolio
|
Average annual total return reflects the change in the value of an investment, assuming reinvestment of the fund’s dividend income and capital gains (the profits earned upon the sale of securities that have grown in value) and assuming a constant rate of performance each year. The $10,000 table and the fund’s returns do not reflect the deduction of taxes that a shareholder would pay on fund distributions or the redemption of fund shares. During periods of reimbursement by Fidelity a fund’s total returns will be greater than it would be had the reimbursement not occurred. How a fund did yesterday is no guarantee of how it will do tomorrow.
| Average Annual Total Returns | | | | | | |
| Periods ended February 28, 2006 | | Past 1 | | Past 5 | | Life of |
| | | year | | years | | fundA |
| Select Medical Equipment and Systems | | 7.36% | | 10.85% | | 16.30% |
| |
| A From April 28, 1998. | | | | | | |
$10,000 Over Life of Fund
Let’s say hypothetically that $10,000 was invested in Fidelity Select Medical Equipment and Systems Portfolio on April 28, 1998, when the fund started. The chart shows how the value of your investment would have changed, and also shows how the S&P 500 Index performed
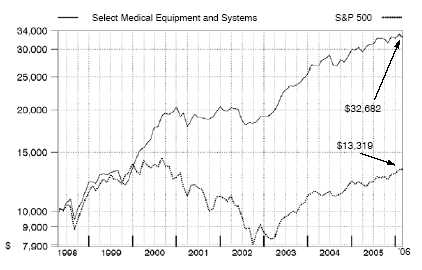
Medical Equipment and Systems Portfolio
|
Management’s Discussion of Fund Performance
Comments from Aaron Cooper, Portfolio Manager of Fidelity® Select Medical Equipment and Systems Portfolio
With the exception of several popular large-cap stock performance measures, most major U.S. equity benchmarks had double-digit returns for the year ending February 28, 2006. For much of the period, market gains were driven largely by the energy sector, although utilities ultimately sneaked into the top spot for the year overall. Financials and telecommunication services also reached double figures, outperforming the 8.40% return of the broader market as measured by the large-cap-oriented Standard & Poor’s 500SM Index. The consumer discretionary segment — home to the weak performing automobile and media industries — was the biggest disappointment. Although the overall return for the S&P 500® beat the small-cap Russell 2000® Index in calendar year 2005 — the first time that’s happened in six years — small-caps stormed back in early 2006, leading to a 16.59% advance during the past 12 months, nearly twice the broader market’s gain. Mid-caps soared even higher, returning 17.67% according to the Russell Midcap® Index. The technology-heavy NASDAQ Composite® Index also fared well, climbing 12.13%, but the Dow Jones Industrial AverageSM, an index of 30 large-cap, blue-chip stocks, managed to rise only 4.52% .
Select Medical Equipment and Systems was up 7.36% during the past year, lagging both the S&P 500 and the Goldman Sachs® Health Care Index, which gained 14.85% . The fund’s narrow focus shielded it from the still-weak performance of the health care sector’s pharmaceuticals group, but it also meant the fund missed the recent upside in the biotechnology group, which was the sector’s best-performing component during the period. Not owning Genentech, a particularly strong biotech stock, was the biggest drag on performance relative to the Goldman Sachs benchmark. Meanwhile, the medical equipment segment, which produced few significant product innovations during the period, was one of the index’s weakest performers, further dampening the fund’s relative results. Competitive concerns drove down the stock prices of several “med-tech” equipment manufacturers, including Kinetic Concepts, which makes wound-care products; diagnostic equipment company Beckman Coulter; and Boston Scientific, whose core business is producing drug-eluting coronary stents. Fortunately, good stock picking within the fund’s principal universe helped offset some of the shortfall versus the index, with such names as Alcon, the Swiss vision care company, and Allergan, which produces both eye care and cosmetic products, both helping to boost performance.
The views expressed above reflect those of the portfolio manager(s) only through the end of the period as stated on the cover of this report and do not necessarily represent the views of Fidelity or any other person in the Fidelity organization. Any such views are subject to change at any time based upon market or other conditions and Fidelity disclaims any responsibility to update such views. These views may not be relied on as investment advice and, because investment decisions for a Fidelity fund are based on numerous factors, may not be relied on as an indication of trading intent on behalf of any Fidelity fund.
43 43 Annual Report
Medical Equipment and Systems Portfolio
Investment Changes
| Top Ten Stocks as of February 28, 2006 |
| | | % of fund’s | | % of fund’s net assets |
| | | net assets | | 6 months ago |
| Johnson & Johnson | | 9.5 | | 7.6 |
| Allergan, Inc. | | 8.6 | | 4.9 |
| Becton, Dickinson & Co. | | 6.4 | | 4.5 |
| Baxter International, Inc. | | 6.2 | | 5.6 |
| Boston Scientific Corp. | | 5.8 | | 2.8 |
| Alcon, Inc. | | 5.5 | | 7.5 |
| St. Jude Medical, Inc. | | 5.2 | | 4.4 |
| Guidant Corp. | | 4.8 | | 4.9 |
| C.R. Bard, Inc. | | 4.2 | | 4.1 |
| Cooper Companies, Inc. | | 4.0 | | 1.1 |
| | | 60.2 | | |
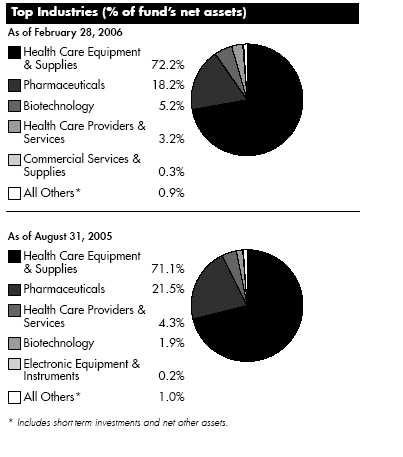
Annual Report 44
| Medical Equipment and Systems Portfolio | | | | | | |
| Investments February 28, | | 2006 | | | | |
| Showing Percentage of Net Assets | | | | | | |
| |
| Common Stocks — 99.8% | | | | | | |
| | | | | Shares | | Value (Note |
| |
| BIOTECHNOLOGY – 5.2% | | | | | | |
| Biotechnology – 5.2% | | | | | | |
| Affymetrix, Inc. (a) | | | | 192,230 | | $ 6,826,087 |
| Alnylam Pharmaceuticals, Inc. (a) | | | | 556,600 | | 8,950,128 |
| BioSphere Medical, Inc. (a) | | | | 320,484 | | 2,435,678 |
| BioSphere Medical, Inc. (a)(f) | | | | 150,000 | | 1,026,000 |
| CuraGen Corp. (a) | | | | 112,900 | | 563,371 |
| deCODE genetics, Inc. (a) | | | | 203,500 | | 1,916,970 |
| DUSA Pharmaceuticals, Inc. (a)(d)(e) | | | | 1,145,200 | | 8,302,700 |
| Epigenomics AG (a) | | | | 63,300 | | 422,576 |
| Illumina, Inc. (a) | | | | 95,274 | | 2,422,818 |
| Invitrogen Corp. (a) | | | | 113,300 | | 8,036,369 |
| MannKind Corp. (a) | | | | 70,500 | | 1,218,945 |
| QIAGEN NV (a) | | | | 206,100 | | 3,072,951 |
| Seracare Life Sciences, Inc. (a)(e) | | | | 744,800 | | 8,349,208 |
| Serologicals Corp. (a) | | | | 109,700 | | 2,653,643 |
| Sirna Therapeutics, Inc. (a)(d) | | | | 122,400 | | 752,760 |
| Solexa, Inc. (a)(d) | | | | 152,261 | | 1,161,751 |
| | | | | | | 58,111,955 |
| |
| CHEMICALS – 0.3% | | | | | | |
| Specialty Chemicals – 0.3% | | | | | | |
| Lonza Group AG | | | | 44,900 | | 2,914,162 |
| COMMERCIAL SERVICES & SUPPLIES – 0.3% | | | | | | |
| Diversified Commercial & Professional Services – 0.3% | | | | | | |
| Advisory Board Co. (a) | | | | 64,400 | | 3,475,668 |
| ELECTRONIC EQUIPMENT & INSTRUMENTS – 0.3% | | | | | | |
| Electronic Equipment & Instruments – 0.3% | | | | | | |
| Agilent Technologies, Inc. (a) | | | | 94,500 | | 3,402,000 |
| HEALTH CARE EQUIPMENT & SUPPLIES – 72.2% | | | | | | |
| Health Care Equipment – 56.1% | | | | | | |
| Advanced Medical Optics, Inc. (a)(d) | | | | 476,994 | | 21,216,693 |
| Aspect Medical Systems, Inc. (a) | | | | 811,400 | | 21,737,406 |
| Baxter International, Inc. | | | | 1,819,220 | | 68,857,477 |
| Becton, Dickinson & Co. | | | | 1,126,600 | | 71,933,410 |
| Boston Scientific Corp. (a)(d) | | | | 2,649,000 | | 64,688,580 |
| C.R. Bard, Inc. | | | | 712,300 | | 46,648,527 |
| Conceptus, Inc. (a) | | | | 885,800 | | 12,693,514 |
| Conor Medsystems, Inc. (a) | | | | 127,800 | | 3,290,850 |
| Cyberonics, Inc. (a) | | | | 103,100 | | 2,801,227 |
| Cytyc Corp. (a) | | | | 502,200 | | 14,478,426 |
| Dade Behring Holdings, Inc. | | | | 120,100 | | 4,381,248 |
| Edwards Lifesciences Corp. (a) | | | | 129,300 | | 5,346,555 |
| GN Store Nordic AS | | | | 86,600 | | 1,155,229 |
| Guidant Corp. | | | | 691,900 | | 53,110,244 |
| Intermagnetics General Corp. (a) | | | | 92,950 | | 2,734,589 |
| IntraLase Corp. (a) | | | | 58,300 | | 1,080,299 |
| Kinetic Concepts, Inc. (a) | | | | 195,300 | | 7,245,630 |
| Kyphon, Inc. (a) | | | | 131,700 | | 4,703,007 |
| Medtronic, Inc. | | | | 204,900 | | 11,054,355 |
| Mentor Corp. | | | | 121,500 | | 5,229,360 |
| Meridian Bioscience, Inc. | | | | 1,050 | | 23,405 |
45
See accompanying notes which are an integral part of the financial statements.
45 Annual Report
| Medical Equipment and Systems Portfolio | | | | |
| Investments - continued | | | | |
| |
| |
| |
| | | Shares | | Value (Note 1) |
| NeuroMetrix, Inc. (a) | | 571,900 | | $ 20,542,648 |
| NMT Medical, Inc. (a)(d) | | 376,804 | | 8,967,935 |
| Nobel Biocare Holding AG (Switzerland) | | 32,628 | | 7,286,866 |
| NuVasive, Inc. (a) | | 31,600 | | 584,284 |
| Phonak Holding AG | | 25,400 | | 1,227,455 |
| PhotoMedex, Inc. (a) | | 485,700 | | 1,083,111 |
| ResMed, Inc. (a) | | 332,200 | | 13,483,998 |
| Respironics, Inc. (a) | | 265,200 | | 9,642,672 |
| Sonic Innovations, Inc. (a) | | 150,000 | | 648,000 |
| SonoSite, Inc. (a) | | 98,800 | | 3,987,568 |
| St. Jude Medical, Inc. (a) | | 1,274,700 | | 58,126,320 |
| Stereotaxis, Inc. (a)(d) | | 847,929 | | 11,218,101 |
| Straumann Holding AG | | 20,485 | | 4,828,680 |
| Syneron Medical Ltd. (a) | | 152,500 | | 4,178,500 |
| Thermo Electron Corp. (a) | | 72,700 | | 2,516,874 |
| Thoratec Corp. (a) | | 287,900 | | 5,792,548 |
| Ventana Medical Systems, Inc. (a) | | 91,013 | | 3,301,042 |
| William Demant Holding AS (a) | | 21,100 | | 1,228,694 |
| Zimmer Holdings, Inc. (a) | | 617,600 | | 42,725,568 |
| | | | | 625,780,895 |
| Health Care Supplies – 16.1% | | | | |
| Alcon, Inc. | | 528,600 | | 60,873,576 |
| Bausch & Lomb, Inc. (d) | | 218,900 | | 15,150,069 |
| Cooper Companies, Inc. | | 858,500 | | 45,045,495 |
| DENTSPLY International, Inc. | | 61,900 | | 3,527,681 |
| DJ Orthopedics, Inc. (a) | | 69,500 | | 2,424,160 |
| Gen-Probe, Inc. (a) | | 12,300 | | 614,508 |
| Inverness Medical Innovations, Inc. (a) | | 1,601,000 | | 42,410,490 |
| Inverness Medical Innovations, Inc. (a)(f) | | 20,683 | | 493,103 |
| Merit Medical Systems, Inc. (a) | | 305,600 | | 4,354,800 |
| Millipore Corp. (a) | | 36,900 | | 2,558,277 |
| NUCRYST Pharmaceuticals Corp. | | 109,800 | | 1,121,049 |
| Shamir Optical Industry Ltd. | | 2,000 | | 19,120 |
| Utah Medical Products, Inc. | | 41,600 | | 1,373,216 |
| | | | | 179,965,544 |
| |
| TOTAL HEALTH CARE EQUIPMENT & SUPPLIES | | | | 805,746,439 |
| |
| HEALTH CARE PROVIDERS & SERVICES – 3.2% | | | | |
| Health Care Distributors & Services – 0.2% | | | | |
| Henry Schein, Inc. (a) | | 56,600 | | 2,640,390 |
| Health Care Facilities – 0.2% | | | | |
| Odyssey Healthcare, Inc. (a) | | 86,900 | | 1,635,458 |
| Health Care Services – 2.1% | | | | |
| Amedisys, Inc. (a)(d) | | 40,200 | | 1,293,636 |
| Chemed Corp. | | 33,700 | | 1,868,328 |
| DaVita, Inc. (a) | | 32,400 | | 1,891,836 |
| Emageon, Inc. | | 151,400 | | 2,657,070 |
| Fresenius Medical Care AG sponsored ADR | | 33,600 | | 1,201,872 |
| Gentiva Health Services, Inc. (a) | | 94,900 | | 1,581,034 |
| Health Grades, Inc. (a) | | 208,300 | | 1,220,638 |
See accompanying notes which are an integral part of the financial statements.
Annual Report 46
| Common Stocks – continued | | | | |
| | | Shares | | Value (Note 1) |
| |
| HEALTH CARE PROVIDERS & SERVICES – CONTINUED | | | | |
| Health Care Services – continued | | | | |
| Healthways, Inc. (a) | | 80,500 | | $ 3,505,775 |
| Merge Technologies, Inc. (a)(d) | | 153,183 | | 2,961,027 |
| QMed, Inc. (a) | | 60,900 | | 574,896 |
| VistaCare, Inc. Class A (a) | | 86,500 | | 1,172,075 |
| Vital Images, Inc. (a) | | 68,300 | | 2,267,560 |
| WebMD Health Corp. Class A | | 39,630 | | 1,472,651 |
| | | | | 23,668,398 |
| Managed Health Care – 0.7% | | | | |
| Magellan Health Services, Inc. (a) | | 68,300 | | 2,608,377 |
| UnitedHealth Group, Inc. | | 81,900 | | 4,769,037 |
| | | | | 7,377,414 |
| |
| TOTAL HEALTH CARE PROVIDERS & SERVICES | | | | 35,321,660 |
| |
| PERSONAL PRODUCTS – 0.1% | | | | |
| Personal Products – 0.1% | | | | |
| Herbalife Ltd. (a) | | 51,300 | | 1,589,787 |
| PHARMACEUTICALS – 18.2% | | | | |
| Pharmaceuticals – 18.2% | | | | |
| Allergan, Inc. | | 887,200 | | 96,048,272 |
| Johnson & Johnson | | 1,827,400 | | 105,349,611 |
| Medicis Pharmaceutical Corp. Class A | | 37,900 | | 1,077,876 |
| | | | | 202,475,759 |
| |
| TOTAL COMMON STOCKS | | | | |
| (Cost $936,376,993) | | 1,113,037,430 |
| |
| Money Market Funds — 3.5% | | | | |
| | | Shares | | Value (Note 1) |
| Fidelity Cash Central Fund, 4.57% (b) | | 1,572,153 $ | | 1,572,153 |
| Fidelity Securities Lending Cash Central Fund, 4.58% (b)(c) | | 37,108,475 | | 37,108,475 |
| TOTAL MONEY MARKET FUNDS | | | | |
| (Cost $38,680,628) | | | | 38,680,628 |
| |
| TOTAL INVESTMENT PORTFOLIO - 103.3% | | | | |
| (Cost $975,057,621) | | 1,151,718,058 |
| |
| NET OTHER ASSETS – (3.3)% | | | | (36,601,004) |
| NET ASSETS – 100% | | $ 1,115,117,054 |
(a) Non-income producing
(b) Affiliated fund that is available only to investment companies and other accounts managed by Fidelity Investments. The rate quoted is the annualized seven-day yield of the fund at period end. A complete unaudited listing of the fund’s holdings as of its most recent quarter end is available upon request.
(c) Investment made with cash collateral received from securities on loan. (d) Security or a portion of the security is on loan at period end.
See accompanying notes which are an integral part of the financial statements.
|
47 Annual Report
47
Medical Equipment and Systems Portfolio
Investments - continued
|
(e) Affiliated company
(f) Restricted securities – Investment in securities not registered under the Securities Act of 1933 (excluding 144A issues). At the end of the period, the value of restricted securities (excluding 144A issues) amounted to $1,519,103 or 0.1% of net assets.
| Additional information on each holding is as follows: | | | | | | |
| |
| Security | | Acquisition Date | | Acquisition Cost |
| BioSphere Medical, Inc. | | 2/21/06 | | $ 1,050,000 | | |
| Inverness Medical Innovations, Inc. | | 2/8/06 | | $ 504,872 | | |
| |
| Affiliated Central Funds | | | | | | |
| Information regarding fiscal year to date income earned by the fund from the affiliated Central funds is as follows: | | | | |
| |
| Fund | | | | | | Income earned |
| Fidelity Cash Central Fund | | | | $ | | 513,076 |
| Fidelity Securities Lending Cash Central Fund | | | | | | 291,630 |
| Total | | | | $ | | 804,706 |
Other Affiliated Issuers
An affiliated company is a company in which the fund has ownership of at least 5% of the voting securities. Fiscal year to date transactions with companies which are or were affiliates are as follows:
| | | Value, | | | | | | | | | | | | | | |
| | | beginning | | | | | | Sales | | | | Dividend | | | | Value, end |
| Affiliate | | of period | | | | Purchases | | Proceeds | | | | Income | | | | of period |
| DUSA Pharmaceuticals, Inc. | | $ — | | | | $ 10,640,949 | | $— | | | | $— | | | | $ 8,302,700 |
| Seracare Life Sciences, Inc. | | — | | | | 9,114,359 | | — | | | | — | | | | 8,349,208 |
| Total | | $ — | | | | $ 19,755,308 | | $— | | | | $— | | | | $ 16,651,908 |
See accompanying notes which are an integral part of the financial statements.
|
| Medical Equipment and Systems Portfolio | | | | | | | | |
| |
| Financial Statements | | | | | | | | |
| |
| |
| Statement of Assets and Liabilities | | | | | | | | |
| | | | | | | | | February 28, 2006 |
| |
| Assets | | | | | | | | |
| Investment in securities, at value (including securities loaned of $35,668,324) — See accompanying schedule: | | | | | | | | |
| Unaffiliated issuers (cost $916,621,686) | | $1,096,385,522 | | | | |
| Affiliated Central Funds (cost $38,680,628) | | | | 38,680,628 | | | | |
| Other affiliated issuers (cost $19,755,307) | | | | 16,651,908 | | | | |
| Total Investments (cost $975,057,621) | | | | | | $1,151,718,058 |
| Cash | | | | | | | | 32,292 |
| Receivable for investments sold | | | | | | | | 8,150,416 |
| Receivable for fund shares sold | | | | | | | | 1,822,658 |
| Dividends receivable | | | | | | | | 768,979 |
| Interest receivable | | | �� | | | | | 11,533 |
| Prepaid expenses | | | | | | | | 4,569 |
| Other affiliated receivables | | | | | | | | 81 |
| Other receivables | | | | | | | | 69,063 |
| Total assets | | | | | | | | 1,162,577,649 |
| |
| Liabilities | | | | | | | | |
| Payable for investments purchased | | $ | | 688,264 | | | | |
| Payable for fund shares redeemed | | | | 8,748,697 | | | | |
| Accrued management fee | | | | 537,537 | | | | |
| Other affiliated payables | | | | 326,314 | | | | |
| Other payables and accrued expenses | | | | 51,308 | | | | |
| Collateral on securities loaned, at value | | | | 37,108,475 | | | | |
| Total liabilities | | | | | | | | 47,460,595 |
| |
| Net Assets | | | | | | $ 1,115,117,054 |
| Net Assets consist of: | | | | | | | | |
| Paid in capital | | | | | | $ | | 897,605,773 |
| Accumulated undistributed net realized gain (loss) on investments and foreign currency transactions | | | | | | | | 40,850,513 |
| Net unrealized appreciation (depreciation) on investments and assets and liabilities in foreign currencies | | | | | | | | 176,660,768 |
| Net Assets, for 45,284,527 shares outstanding | | | | | | $ 1,115,117,054 |
| Net Asset Value, offering price and redemption price per share ($1,115,117,054 ÷ 45,284,527 shares) | | | | | | $ | | 24.62 |
| |
| Statement of Operations | | | | | | | | |
| | | | | | | | | Year ended February 28, 2006 |
| |
| Investment Income | | | | | | | | |
| Dividends | | | | | | $ | | 7,596,113 |
| Interest | | | | | | | | 3,818 |
| Income from affiliated Central Funds (including $291,630 from security lending) | | | | | | | | 804,706 |
| Total income | | | | | | | | 8,404,637 |
| |
| Expenses | | | | | | | | |
| Management fee | | $ | | 6,448,483 | | | | |
| Transfer agent fees | | | | 3,712,489 | | | | |
| Accounting and security lending fees | | | | | | | | |
| | | | | 478,797 | | | | |
| Independent trustees’ compensation | | | | 4,803 | | | | |
| Custodian fees and expenses | | | | 51,095 | | | | |
| Registration fees | | | | 86,121 | | | | |
| Audit | | | | 39,238 | | | | |
| Legal | | | | 6,180 | | | | |
| Interest | | | | 969 | | | | |
| Miscellaneous | | | | 9,919 | | | | |
| Total expenses before reductions | | | | 10,838,094 | | | | |
| Expense reductions | | | | (410,819) | | | | 10,427,275 |
| |
| Net investment income (loss) | | | | | | | | (2,022,638) |
See accompanying notes which are an integral part of the financial statements.
49 Annual Report
| Medical Equipment and Systems Portfolio | | | | |
| Financial Statements - continued | | | | |
| |
| |
| Realized and Unrealized Gain (Loss) | | | | |
| Net realized gain (loss) on: | | | | |
| Investment securities: | | | | |
| Unaffiliated issuers | | 89,936,619 | | |
| Foreign currency transactions | | (17,175) | | |
| Total net realized gain (loss) | | | | 89,919,444 |
| Change in net unrealized appreciation (depreciation) on: | | | | |
| Investment securities | | (6,935,503) | | |
| Assets and liabilities in foreign currencies | | 304 | | |
| Total change in net unrealized appreciation (depreciation) | | | | (6,935,199) |
| Net gain (loss) | | | | 82,984,245 |
| Net increase (decrease) in net assets resulting from operations | | | | $80,961,607 |
See accompanying notes which are an integral part of the financial statements.
Annual Report 50
| Statement of Changes in Net Assets | | | | | | | | | | | | | | | | |
| | | | | | | Year ended | | | | Year ended |
| | | | | | | February 28, | | | | February 28, |
| | | | | | | 2006 | | | | 2005 |
| Increase (Decrease) in Net Assets | | | | | | | | | | | | | | | | |
| Operations | | | | | | | | | | | | | | | | |
| Net investment income (loss) | | | | | | $ | | (2,022,638) | | $ | | (2,132,342) |
| Net realized gain (loss) | | | | | | 89,919,444 | | | | (6,881,471) |
| Change in net unrealized appreciation (depreciation) | | | | | | | | (6,935,199) | | | | 102,472,752 |
| Net increase (decrease) in net assets resulting from operations | | | | | | 80,961,607 | | | | 93,458,939 |
| Distributions to shareholders from net realized gain | | | | | | (39,838,684) | | | | (3,137,864) |
| Share transactions | | | | | | | | | | | | | | | | |
| Proceeds from sales of shares | | | | | | 565,874,282 | | | | 672,666,363 |
| Reinvestment of distributions | | | | | | 38,098,805 | | | | | | 3,014,782 |
| Cost of shares redeemed | | | | | | (496,658,412) | | | | (371,154,907) |
| Net increase (decrease) in net assets resulting from share transactions | | | | | | 107,314,675 | | | | 304,526,238 |
| Redemption fees | | | | | | | | 100,516 | | | | | | 135,874 |
| Total increase (decrease) in net assets | | | | | | 148,538,114 | | | | 394,983,187 |
| |
| Net Assets | | | | | | | | | | | | | | | | |
| Beginning of period | | | | | | 966,578,940 | | | | 571,595,753 |
| End of period | | | | | | $ 1,115,117,054 | | $ | | 966,578,940 |
| |
| Other Information | | | | | | | | | | | | | | | | |
| Shares | | | | | | | | | | | | | | | | |
| Sold | | | | | | 23,177,404 | | | | 30,485,914 |
| Issued in reinvestment of distributions | | | | | | | | 1,520,304 | | | | | | 139,509 |
| Redeemed | | | | | | (20,201,783) | | | | (17,070,667) |
| Net increase (decrease) | | | | | | | | 4,495,925 | | | | 13,554,756 |
| |
| Financial Highlights | | | | | | | | | | | | | | | | |
| Years ended February 28, | | 2006 | | 2005 | | 2004E | | | | 2003 | | | | 2002 |
| Selected Per-Share Data | | | | | | | | | | | | | | | | |
| Net asset value, beginning of period | | $ 23.70 | | $ 20.99 | | $ 15.63 | | $ | | 16.02 | | $ | | 16.19 |
| Income from Investment Operations | | | | | | | | | | | | | | | | |
| Net investment income (loss)C | | (.04) | | (.06) | | (.09) | | | | (.08) | | | | (.07) |
| Net realized and unrealized gain (loss) | | 1.80 | | 2.88 | | 5.97 | | | | (.21) | | | | .23 |
| Total from investment operations | | 1.76 | | 2.82 | | 5.88 | | | | (.29) | | | | .16 |
| Distributions from net realized gain | | (.84) | | (.11) | | (.53) | | | | (.11) | | | | (.34) |
| Redemption fees added to paid in capitalC | | —F | | —F | | .01 | | | | .01 | | | | .01 |
| Net asset value, end of period | | $ 24.62 | | $ 23.70 | | $ 20.99 | | $ | | 15.63 | | $ | | 16.02 |
| Total ReturnA,B | | 7.36% | | 13.49% | | 37.94% | | | | (1.76)% | | | | 1.37% |
| Ratios to Average Net AssetsD | | | | | | | | | | | | | | | | |
| Expenses before reductions | | 96% | | 1.00% | | 1.18% | | | | 1.33% | | | | 1.26% |
| Expenses net of fee waivers, if any | | 96% | | 1.00% | | 1.18% | | | | 1.33% | | | | 1.26% |
| Expenses net of all reductions | | 92% | | .98% | | 1.15% | | | | 1.29% | | | | 1.23% |
| Net investment income (loss) | | (.18)% | | (.28)% | | (.46)% | | | | (.55)% | | | | (.49)% |
| Supplemental Data | | | | | | | | | | | | | | | | |
| Net assets, end of period (000 omitted) | | $1,115,117 | | $ 966,579 | | $ 571,596 | | $ 155,970 | | $ 146,665 |
| Portfolio turnover rate | | 99% | | 28% | | 33% | | | | 82% | | | | 87% |
ATotal returns would have been lower had certain expenses not been reduced during the periods shown. BTotal returns do not include the effect of the former sales charges. CCalculated based on average shares outstanding during the period. DExpense ratios reflect operating expenses of the fund. Expenses before reductions do not reflect amounts reimbursed by the investment adviser or reductions from brokerage service arrangements or other expense offset arrangements and do not represent the amount paid by the fund during periods when reimbursements or reductions occur. Expenses net of fee waivers reflect expenses after reimbursement by the investment adviser but prior to reductions from brokerage service arrangements or other expense offset arrangements. Expenses net of all reductions represent the net expenses paid by the fund. EFor the year ended February 29. FAmount represents less than $.01 per share.
See accompanying notes which are an integral part of the financial statements.
|
Pharmaceuticals Portfolio
Performance
|
Average annual total return reflects the change in the value of an investment, assuming reinvestment of the fund’s dividend income and capital gains (the profits earned upon the sale of securities that have grown in value) and assuming a constant rate of performance each year. The $10,000 table and the fund’s returns do not reflect the deduction of taxes that a shareholder would pay on fund distributions or the redemption of fund shares. During periods of reimbursement by Fidelity a fund’s total returns will be greater than it would be had the reimbursement not occurred. How a fund did yesterday is no guarantee of how it will do tomorrow.
| Average Annual Total Returns | | | | |
| Periods ended February 28, 2006 | | Past 1 | | Life of |
| | | year | | fundA |
| Select Pharmaceuticals | | 20.68% | | 0.89% |
| |
| A From June 18, 2001. | | | | |
$10,000 Over Life of Fund
Let’s say hypothetically that $10,000 was invested in Fidelity Select Pharmaceuticals Portfolio on June 18, 2001, when the fund started. The chart shows how the value of your investment would have changed, and also shows how the S&P 500 Index performed over the same period.
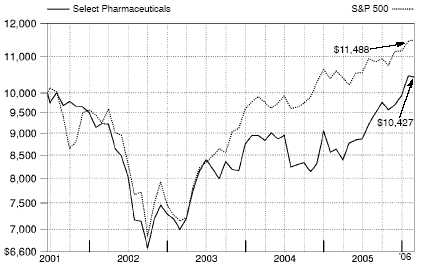
Pharmaceuticals Portfolio
|
Management’s Discussion of Fund Performance
Comments from Harlan Carere, Portfolio Manager of Fidelity® Select Pharmaceuticals Portfolio
With the exception of several popular large-cap stock performance measures, most major U.S. equity benchmarks had double-digit returns for the year ending February 28, 2006. For much of the period, market gains were driven largely by the energy sector, although utilities ultimately sneaked into the top spot for the year overall. Financials and telecommunication services also reached double figures, outperforming the 8.40% return of the broader market as measured by the large-cap-oriented Standard & Poor’s 500SM Index. The consumer discretionary segment — home to the weak performing automobile and media industries — was the biggest disappointment. Although the overall return for the S&P 500® beat the small-cap Russell 2000® Index in calendar year 2005 — the first time that’s happened in six years — small-caps stormed back in early 2006, leading to a 16.59% advance during the past 12 months, nearly twice the broader market’s gain. Mid-caps soared even higher, returning 17.67% according to the Russell Midcap® Index. The technology-heavy NASDAQ Composite® Index also fared well, climbing 12.13%, but the Dow Jones Industrial AverageSM, an index of 30 large-cap, blue-chip stocks, managed to rise only 4.52% .
The fund gained 20.68% during the past year, outperforming both the Goldman Sachs® Health Care Index, which was up 14.85%, and the S&P 500. Although the fund’s significant overweighting in the lagging pharmaceuticals industry detracted from performance versus the sector index, good stock picking in this area had a very positive impact. The fund benefited from substantial underweightings in large-cap U.S. companies such as Johnson & Johnson and Pfizer that faced competition from lower-priced products. Performance was further aided by an out-of-benchmark investment in Roche Holding, a large Swiss-based pharmaceutical maker that owns 55% of Genentech — a biotech company with two cancer drugs that showed better-than-expected clinical results in new applications. The investment in Roche helped counteract the fund’s underweighting in Genentech’s stock. Holdings in Myogen and Illumina, two biotech stocks, also boosted performance, as did an overweighting in selected generic drug stocks, some good picks in health care facilities, and an underweighting in the weak health care equipment area. Detractors from relative performance included overweighted positions in Sepracor, a pharmaceutical company that failed to meet investor expectations for its new sleep drug, Lunesta, and in Kos Pharmaceuticals, which faced new competition to its drug for raising HDL, the good cholesterol. An underweighting in UnitedHealth Group, a managed care company, also detracted from relative performance, as did weak results within biotechnology early in the period. Because of the fund’s large stake in foreign-based companies, unfavorable currency movements also hurt.
The views expressed above reflect those of the portfolio manager(s) only through the end of the period as stated on the cover of this report and do not necessarily represent the views of Fidelity or any other person in the Fidelity organization. Any such views are subject to change at any time based upon market or other conditions and Fidelity disclaims any responsibility to update such views. These views may not be relied on as investment advice and, because investment decisions for a Fidelity fund are based on numerous factors, may not be relied on as an indication of trading intent on behalf of any Fidelity fund.
53 53 Annual Report
| Pharmaceuticals Portfolio | | | | |
| Investment Changes | | |
| |
| |
| Top Ten Stocks as of February 28, 2006 |
| | | % of fund’s | | % of fund’s net assets |
| | | net assets | | 6 months ago |
| Merck & Co., Inc. | | 9.6 | | 0.0 |
| Pfizer, Inc. | | 7.0 | | 0.0 |
| Novartis AG sponsored ADR | | 6.5 | | 8.3 |
| Wyeth | | 6.0 | | 5.5 |
| Sanofi-Aventis sponsored ADR | | 5.3 | | 0.0 |
| Teva Pharmaceutical Industries Ltd. | | | | |
| sponsored ADR | | 3.8 | | 4.9 |
| AstraZeneca PLC sponsored ADR | | 3.4 | | 8.4 |
| Roche Holding AG (participation | | | | |
| certificate) | | 3.1 | | 5.7 |
| Takeda Pharamaceutical Co. Ltd. | | 3.1 | | 1.1 |
| Astellas Pharma, Inc. | | 2.9 | | 1.6 |
| | | 50.7 | | |
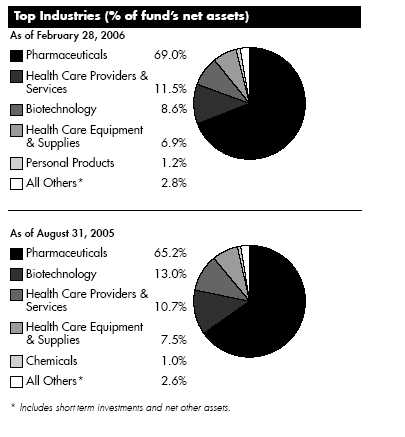
Annual Report 54
| Pharmaceuticals Portfolio | | | | | | | | |
| Investments February 28, 2006 | | | | |
| Showing Percentage of Net Assets | | | | | | | | |
| |
| Common Stocks — 99.1% | | | | | | | | |
| | | | | | | Shares | | Value (Note 1) |
| |
| BEVERAGES – 0.0% | | | | | | | | |
| Soft Drinks – 0.0% | | | | | | | | |
| Hansen Natural Corp. (a) | | | | | | 100 | | $ 9,334 |
| BIOTECHNOLOGY – 8.6% | | | | | | | | |
| Biotechnology – 8.6% | | | | | | | | |
| Acambis PLC (a) | | | | | | 27,600 | | 102,155 |
| AEterna Zentaris, Inc. (sub. vtg.) (a) | | | | | | 48,400 | | 294,792 |
| Alizyme PLC (a) | | | | | | 57,400 | | 167,394 |
| Alnylam Pharmaceuticals, Inc. (a) | | | | | | 25,900 | | 416,472 |
| Altus Pharmaceuticals, Inc. | | | | | | 4,800 | | 100,800 |
| Amylin Pharmaceuticals, Inc. (a) | | | | | | 6,060 | | 262,883 |
| Applera Corp. – Celera Genomics Group (a) | | | | | | 1,000 | | 11,490 |
| Arena Pharmaceuticals, Inc. (a) | | | | | | 1,100 | | 19,481 |
| Basilea Pharmaceutica AG (a) | | | | | | 1,200 | | 152,750 |
| Biogen Idec, Inc. (a) | | | | | | 5,500 | | 259,875 |
| BioMarin Pharmaceutical, Inc. (a) | | | | | | 59,500 | | 778,260 |
| BioSphere Medical, Inc. (a) | | | | | | 25,000 | | 190,000 |
| BioSphere Medical, Inc. (a)(e) | | | | | | 200,000 | | 1,368,000 |
| Cephalon, Inc. (a) | | | | | | 8,200 | | 651,736 |
| Critical Therapeutics, Inc. (a) | | | | | | 5,000 | | 27,200 |
| CSL Ltd. | | | | | | 16,965 | | 663,792 |
| DUSA Pharmaceuticals, Inc. (a) | | | | | | 16,500 | | 119,625 |
| Exelixis, Inc. (a) | | | | | | 12,300 | | 133,578 |
| Genentech, Inc. (a) | | | | | | 3,100 | | 265,639 |
| GTx, Inc. (a) | | | | | | 1,000 | | 10,820 |
| Human Genome Sciences, Inc. (a) | | | | | | 37,300 | | 466,996 |
| Illumina, Inc. (a) | | | | | | 73,400 | | 1,866,562 |
| MannKind Corp. (a) | | | | | | 500 | | 8,645 |
| Memory Pharmaceuticals Corp. (a)(d) | | | | | | 25,000 | | 60,250 |
| Myogen, Inc. (a) | | | | | | 13,000 | | 492,700 |
| Neopharm, Inc. (a)(d) | | | | | | 36,300 | | 367,356 |
| Neurocrine Biosciences, Inc. (a) | | | | | | 3,900 | | 255,879 |
| Panacos Pharmaceuticals, Inc. (a) | | | | | | 135,700 | | 987,896 |
| QLT, Inc. (a) | | | | | | 2,690 | | 19,178 |
| Renovis, Inc. (a) | | | | | | 6,500 | | 140,790 |
| Seattle Genetics, Inc. (a) | | | | | | 48,100 | | 253,968 |
| Speedel Holding AG | | | | | | 1,200 | | 150,006 |
| Tercica, Inc. (a)(d) | | | | | | 141,700 | | 1,092,507 |
| Theravance, Inc. (a) | | | | | | 2,900 | | 81,374 |
| | | | | | | | | 12,240,849 |
| |
| CHEMICALS – 1.2% | | | | | | | | |
| Fertilizers & Agricultural Chemicals – 1.1% | | | | | | | | |
| Bodisen Biotech, Inc. (a) | | | | | | 20,200 | | 313,100 |
| Monsanto Co. | | | | | | 15,371 | | 1,289,319 |
| | | | | | | | | 1,602,419 |
| Specialty Chemicals – 0.1% | | | | | | | | |
| Senomyx, Inc. (a) | | | | | | 9,000 | | 146,340 |
| |
| TOTAL CHEMICALS | | | | | | | | 1,748,759 |
See accompanying notes which are an integral part of the financial statements.
|
55 Annual Report
55
| Pharmaceuticals Portfolio | | | | |
| Investments - continued | | | | |
| |
| |
| |
| | | Shares | | Value (Note 1) |
| |
| COMMERCIAL SERVICES & SUPPLIES – 0.0% | | | | |
| Human Resource & Employment Services – 0.0% | | | | |
| Kforce, Inc. (a) | | 4,147 | | $ 50,220 |
| DIVERSIFIED CONSUMER SERVICES – 0.1% | | | | |
| Specialized Consumer Services – 0.1% | | | | |
| Weight Watchers International, Inc. (a) | | 1,900 | | 99,693 |
| FOOD & STAPLES RETAILING – 0.2% | | | | |
| Food Distributors – 0.2% | | | | |
| United Natural Foods, Inc. (a) | | 10,000 | | 332,600 |
| FOOD PRODUCTS – 0.4% | | | | |
| Packaged Foods & Meats – 0.4% | | | | |
| Groupe Danone | | 1,600 | | 185,014 |
| Hain Celestial Group, Inc. (a) | | 10,100 | | 235,734 |
| Koninklijke Numico NV (a) | | 3,100 | | 134,258 |
| | | | | 555,006 |
| |
| HEALTH CARE EQUIPMENT & SUPPLIES – 6.9% | | | | |
| Health Care Equipment – 4.0% | | | | |
| Adeza Biomedical Corp. (a) | | 3,000 | | 66,600 |
| Aspect Medical Systems, Inc. (a) | | 2,600 | | 69,654 |
| BioLase Technology, Inc. | | 17,000 | | 130,390 |
| Conceptus, Inc. (a) | | 2,100 | | 30,093 |
| Elekta AB (B Shares) | | 8,600 | | 127,169 |
| Encore Medical Corp. (a) | | 2,600 | | 15,496 |
| Epix Pharmaceuticals, Inc. (a)(d) | | 148,600 | | 646,410 |
| HealthTronics, Inc. (a) | | 19,000 | | 138,130 |
| Imaging Dynamics Co. Ltd. (a) | | 328,900 | | 1,577,701 |
| Intuitive Surgical, Inc. (a) | | 3,000 | | 270,600 |
| NeuroMetrix, Inc. (a) | | 9,600 | | 344,832 |
| NMT Medical, Inc. (a) | | 2,200 | | 52,360 |
| Nobel Biocare Holding AG (Switzerland) | | 2,618 | | 584,682 |
| NuVasive, Inc. (a) | | 3,800 | | 70,262 |
| Optos PLC | | 65,000 | | 269,657 |
| SonoSite, Inc. (a) | | 6,400 | | 258,304 |
| Stereotaxis, Inc. (a) | | 35,300 | | 467,019 |
| Straumann Holding AG | | 1,000 | | 235,718 |
| Syneron Medical Ltd. (a) | | 5,200 | | 142,480 |
| The Spectranetics Corp. (a) | | 10,000 | | 114,600 |
| | | | | 5,612,157 |
| Health Care Supplies – 2.9% | | | | |
| Cooper Companies, Inc. | | 200 | | 10,494 |
| Cynosure, Inc. Class A | | 6,800 | | 125,053 |
| Gen-Probe, Inc. (a) | | 4,300 | | 214,828 |
| Inverness Medical Innovations, Inc. (a) | | 136,400 | | 3,613,236 |
| Inverness Medical Innovations, Inc. (a)(e) | | 2,497 | | 59,531 |
| OraSure Technologies, Inc. (a) | | 13,000 | | 123,760 |
| | | | | 4,146,902 |
| |
| TOTAL HEALTH CARE EQUIPMENT & SUPPLIES | | | | 9,759,059 |
See accompanying notes which are an integral part of the financial statements.
Annual Report 56
| Common Stocks – continued | | | | |
| | | Shares | | Value (Note |
| |
| HEALTH CARE PROVIDERS & SERVICES – 11.5% | | | | |
| Health Care Distributors & Services – 4.9% | | | | |
| AmerisourceBergen Corp. | | 13,200 | | $ 607,068 |
| Cardinal Health, Inc. | | 44,962 | | 3,264,241 |
| McKesson Corp. | | 56,730 | | 3,070,795 |
| | | | | 6,942,104 |
| Health Care Facilities – 1.9% | | | | |
| Acibadem Saglik Hizmetleri AS | | 10,000 | | 105,023 |
| American Retirement Corp. (a) | | 38,300 | | 1,031,036 |
| Apollo Hospitals Enterprise Ltd. | | 11,490 | | 138,217 |
| Brookdale Senior Living, Inc. | | 16,300 | | 539,693 |
| Bumrungrad Hospital PCL (For. Reg.) | | 85,800 | | 73,493 |
| LCA-Vision, Inc. | | 2,500 | | 109,000 |
| NovaMed Eyecare, Inc. (a) | | 82,500 | | 610,500 |
| Odyssey Healthcare, Inc. (a) | | 6,000 | | 112,920 |
| | | | | 2,719,882 |
| Health Care Services – 4.3% | | | | |
| Computer Programs & Systems, Inc. | | 8,000 | | 367,680 |
| DaVita, Inc. (a) | | 17,900 | | 1,045,181 |
| Diagnosticos da America SA (a) | | 6,000 | | 146,619 |
| Emdeon Corp. (a) | | 12,948 | | 136,472 |
| Health Grades, Inc. (a) | | 20,300 | | 118,958 |
| HealthExtras, Inc. (a) | | 5,000 | | 154,800 |
| Healthways, Inc. (a) | | 22,700 | | 988,585 |
| HMS Holdings Corp. (a) | | 22,100 | | 190,060 |
| I-trax, Inc. (a) | | 10,000 | | 33,600 |
| LHC Group, Inc. | | 100 | | 1,621 |
| Matria Healthcare, Inc. (a) | | 3,200 | | 138,464 |
| Medco Health Solutions, Inc. (a) | | 2,400 | | 133,728 |
| Omnicare, Inc. | | 18,500 | | 1,125,725 |
| QMed, Inc. (a) | | 10,000 | | 94,400 |
| ResCare, Inc. (a) | | 13,000 | | 237,770 |
| SFBC International, Inc. (a)(d) | | 14,600 | | 344,560 |
| Systems Xcellence, Inc. (a) | | 188,500 | | 635,440 |
| Vital Images, Inc. (a) | | 8,500 | | 282,200 |
| | | | | 6,175,863 |
| Managed Health Care – 0.4% | | | | |
| CIGNA Corp. | | 3,100 | | 380,525 |
| Humana, Inc. (a) | | 3,300 | | 170,511 |
| | | | | 551,036 |
| |
| TOTAL HEALTH CARE PROVIDERS & SERVICES | | | | 16,388,885 |
| |
| PERSONAL PRODUCTS – 1.2% | | | | |
| Personal Products – 1.2% | | | | |
| Herbalife Ltd. (a) | | 35,700 | | 1,106,343 |
| Mannatech, Inc. | | 11,000 | | 147,290 |
| Nature’s Sunshine Products, Inc. | | 15,000 | | 254,550 |
| Reliv International, Inc. | | 15,000 | | 197,700 |
| | | | | 1,705,883 |
57
See accompanying notes which are an integral part of the financial statements.
57 Annual Report
| Pharmaceuticals Portfolio | | | | |
| Investments - continued | | | | |
| |
| |
| |
| | | Shares | | Value (Note 1) |
| |
| PHARMACEUTICALS – 69.0% | | | | |
| Pharmaceuticals – 69.0% | | | | |
| Adams Respiratory Therapeutics, Inc. | | 5,800 | | $ 217,558 |
| Adolor Corp. (a) | | 1,000 | | 27,470 |
| Allergan, Inc. | | 33,950 | | 3,675,427 |
| Altana AG | | 5,970 | | 320,756 |
| Altana AG sponsored ADR | | 13,400 | | 721,054 |
| AnorMED, Inc. (a) | | 2,000 | | 12,674 |
| Astellas Pharma, Inc. | | 108,700 | | 4,166,575 |
| AstraZeneca PLC sponsored ADR | | 103,530 | | 4,788,263 |
| AVANIR Pharmaceuticals Class A (a) | | 250 | | 4,285 |
| Barr Pharmaceuticals, Inc. (a) | | 22,250 | | 1,494,755 |
| Biovail Corp. | | 23,910 | | 601,880 |
| Chugai Pharmaceutical Co. Ltd. | | 15,900 | | 289,156 |
| Daiichi Sankyo Co. Ltd. (a) | | 44,400 | | 903,895 |
| Eisai Co. Ltd. | | 18,600 | | 857,131 |
| Elan Corp. PLC sponsored ADR (a)(d) | | 75,000 | | 952,500 |
| Forest Laboratories, Inc. (a) | | 65,620 | | 3,011,958 |
| GlaxoSmithKline PLC sponsored ADR | | 100 | | 5,082 |
| H. Lundbeck AS | | 8,880 | | 183,007 |
| Hi-Tech Pharmacal Co., Inc. (a) | | 4,650 | | 114,576 |
| Johnson & Johnson | | 15,200 | | 876,280 |
| King Pharmaceuticals, Inc. (a) | | 300 | | 4,875 |
| Kos Pharmaceuticals, Inc. (a) | | 13,800 | | 605,406 |
| Labopharm, Inc. (a) | | 40,000 | | 308,762 |
| Medicines Co. (a) | | 36,700 | | 748,313 |
| Medicis Pharmaceutical Corp. Class A | | 9,800 | | 278,712 |
| Merck & Co., Inc. | | 391,800 | | 13,658,148 |
| Merck KGaA | | 4,020 | | 402,548 |
| MGI Pharma, Inc. (a) | | 15,700 | | 276,791 |
| Mylan Laboratories, Inc. | | 11,547 | | 265,581 |
| New River Pharmaceuticals, Inc. (a) | | 18,800 | | 574,904 |
| Novartis AG sponsored ADR (d) | | 174,240 | | 9,278,280 |
| Novo Nordisk AS: | | | | |
| Series B | | 17,650 | | 1,037,663 |
| Series B sponsored ADR | | 26,400 | | 1,553,640 |
| Penwest Pharmaceuticals Co. (a) | | 13,700 | | 318,525 |
| Perrigo Co. | | 170 | | 2,701 |
| Pfizer, Inc. | | 377,500 | | 9,886,725 |
| Recordati Spa | | 26,800 | | 198,622 |
| Roche Holding AG (participation certificate) (d) | | 30,213 | | 4,465,338 |
| Salix Pharmaceuticals Ltd. (a) | | 18,200 | | 286,832 |
| Sanofi-Aventis | | 100 | | 8,526 |
| Sanofi-Aventis sponsored ADR | | 177,056 | | 7,547,897 |
| Schering AG | | 20,400 | | 1,463,088 |
| Schering-Plough Corp. | | 104,490 | | 1,933,065 |
| Shionogi & Co. Ltd. | | 66,000 | | 902,873 |
| Takeda Pharamaceutical Co. Ltd. | | 79,100 | | 4,379,525 |
| Teva Pharmaceutical Industries Ltd. sponsored ADR | | 127,701 | | 5,362,165 |
| Valeant Pharmaceuticals International | | 15,100 | | 269,082 |
| ViroPharma, Inc. (a) | | 27,600 | | 534,060 |
See accompanying notes which are an integral part of the financial statements.
Annual Report 58
| Common Stocks – continued | | | | | | |
| | | Shares | | Value (Note 1) |
| |
| PHARMACEUTICALS – CONTINUED | | | | | | |
| Pharmaceuticals – continued | | | | | | |
| Watson Pharmaceuticals, Inc. (a) | | 100 | | $ | | 2,998 |
| Wyeth | | 171,620 | | | | 8,546,676 |
| | | | | | | 98,326,603 |
| |
| TEXTILES, APPAREL & LUXURY GOODS – 0.0% | | | | | | |
| Apparel, Accessories & Luxury Goods – 0.0% | | | | | | |
| Gildan Activewear, Inc. Class A (a) | | 100 | | | | 4,995 |
| TOTAL COMMON STOCKS | | | | | | |
| (Cost $133,027,961) | | | | 141,221,886 |
| |
| Money Market Funds — 12.8% | | | | | | |
| |
| Fidelity Cash Central Fund, 4.57% (b) | | 943,538 | | | | 943,538 |
| Fidelity Securities Lending Cash Central Fund, 4.58% (b)(c) | | 17,228,375 | | 17,228,375 |
| TOTAL MONEY MARKET FUNDS | | | | | | |
| (Cost $18,171,913) | | | | 18,171,913 |
| |
| TOTAL INVESTMENT PORTFOLIO - 111.9% | | | | | | |
| (Cost $151,199,874) | | | | 159,393,799 |
| |
| NET OTHER ASSETS – (11.9)% | | | | (16,922,405) |
| NET ASSETS – 100% | | | | $ 142,471,394 |
(a) Non-income producing
(b) Affiliated fund that is available only to investment companies and other accounts managed by Fidelity Investments. The rate quoted is the annualized seven-day yield of the fund at period end. A complete unaudited listing of the fund’s holdings as of its most recent quarter end is available upon request.
(c) Investment made with cash collateral received from securities on loan. (d) Security or a portion of the security is on loan at period end.
(e) Restricted securities – Investment in securities not registered under the Securities Act of 1933 (excluding 144A issues). At the end of the period, the value of restricted securities (excluding 144A issues) amounted to $1,427,531 or 1.0% of net assets.
| Additional information on each holding is as follows: | | | | |
| Security | | Acquisition Date | | Acquisition Cost |
| BioSphere Medical, Inc. | | 2/21/06 | | $ 1,400,000 |
| Inverness Medical Innovations, Inc. | | 2/8/06 | | $ 60,952 |
Information regarding fiscal year to date income earned by the fund from the affiliated Central funds is as follows:
| Fund | | Income earned |
| Fidelity Cash Central Fund | | $ 44,548 |
| Fidelity Securities Lending Cash Central Fund | | 57,670 |
| Total | | $ 102,218 |
| |
| Other Information | | |
| Distribution of investments by country of issue, as a percentage of total net assets, is as follows: | | |
| |
| United States of America | | 59 |
| Switzerland | | 10 |
59
See accompanying notes which are an integral part of the financial statements.
59 Annual Report
| Pharmaceuticals Portfolio | | |
| Investments - continued | | |
| |
| |
| Japan | | 8.0% |
| France | | 5.4% |
| Israel | | 3.9% |
| United Kingdom | | 3.8% |
| Canada | | 2.3% |
| Germany | | 2.0% |
| Denmark | | 1.9% |
| Others (individually less than 1%) | | 2.6% |
| | | 100.0% |
See accompanying notes which are an integral part of the financial statements.
Annual Report 60
| Pharmaceuticals Portfolio | | | | | | | | |
| |
| Financial Statements | | | | | | | | |
| |
| |
| Statement of Assets and Liabilities | | | | | | | | |
| | | | | | | | | February 28, 2006 |
| |
| Assets | | | | | | | | |
| Investment in securities, at value (including securities loaned of $16,289,217) — See accompanying schedule: | | | | | | | | |
| Unaffiliated issuers (cost $133,027,961) | | $ | | 141,221,886 | | | | |
| Affiliated Central Funds (cost $18,171,913) | | | | 18,171,913 | | | | |
| Total Investments (cost $151,199,874) | | | | | | $ | | 159,393,799 |
| Foreign currency held at value (cost $5,006) | | | | | | | | 5,098 |
| Receivable for investments sold | | | | | | | | 1,405,578 |
| Receivable for fund shares sold | | | | | | | | 604,531 |
| Dividends receivable | | | | | | | | 363,658 |
| Interest receivable | | | | | | | | 912 |
| Prepaid expenses | | | | | | | | 411 |
| Other affiliated receivables | | | | | | | | 103 |
| Other receivables | | | | | | | | 20,801 |
| Total assets | | | | | | | | 161,794,891 |
| |
| Liabilities | | | | | | | | |
| Payable to custodian bank | | $ | | 419,431 | | | | |
| Payable for investments purchased | | | | 748,331 | | | | |
| Payable for fund shares redeemed | | | | 779,817 | | | | |
| Accrued management fee | | | | 66,481 | | | | |
| Other affiliated payables | | | | 44,358 | | | | |
| Other payables and accrued expenses | | | | 36,704 | | | | |
| Collateral on securities loaned, at value | | | | 17,228,375 | | | | |
| Total liabilities | | | | | | | | 19,323,497 |
| |
| Net Assets | | | | | | $ | | 142,471,394 |
| Net Assets consist of: | | | | | | | | |
| Paid in capital | | | | | | $ | | 129,952,719 |
| Undistributed net investment income | | | | | | | | 128,024 |
| Accumulated undistributed net realized gain (loss) on investments and foreign currency transactions | | | | | | | | 4,196,799 |
| Net unrealized appreciation (depreciation) on investments and assets and liabilities in foreign currencies | | | | | | | | 8,193,852 |
| Net Assets, for 13,685,281 shares outstanding | | | | | | $ | | 142,471,394 |
| |
| Net Asset Value, offering price and redemption price per share ($142,471,394 ÷ 13,685,281 shares) | | | | | | $ | | 10.41 |
| |
| Statement of Operations | | | | | | | | |
| | | | | | | | | Year ended February 28, 2006 |
| |
| Investment Income | | | | | | | | |
| Dividends | | | | | | $ | | 1,401,389 |
| Interest | | | | | | | | 29 |
| Income from affiliated Central Funds | | | | | | | | |
| (including $57,670 from security lending) | | | | | | | | 102,218 |
| | | | | | | | | 1,503,636 |
| Less foreign taxes withheld | | | | | | | | (82,590) |
| Total income | | | | | | | | 1,421,046 |
| |
| Expenses | | | | | | | | |
| Management fee | | $ | | 648,339 | | | | |
| Transfer agent fees | | | | 436,405 | | | | |
| Accounting and security lending fees | | | | | | | | |
| | | | | 58,457 | | | | |
| Independent trustees’ compensation | | | | 474 | | | | |
| Custodian fees and expenses | | | | 33,543 | | | | |
| Registration fees | | | | 39,371 | | | | |
| Audit | | | | 34,124 | | | | |
| Legal | | | | 614 | | | | |
| Miscellaneous | | | | 3,996 | | | | |
| Total expenses before reductions | | | | 1,255,323 | | | | |
| See accompanying notes which are an integral part of the financial statements. | | | | | | | | |
61 Annual Report
| Pharmaceuticals Portfolio | | | | |
| Financial Statements - continued | | | | |
| |
| |
| Expense reductions | | (93,559) | | 1,161,764 |
| |
| Net investment income (loss) | | | | 259,282 |
| Realized and Unrealized Gain (Loss) | | | | |
| Net realized gain (loss) on: | | | | |
| Investment securities: | | | | |
| Unaffiliated issuers | | 9,728,346 | | |
| Foreign currency transactions | | (14,082) | | |
| Total net realized gain (loss) | | | | 9,714,264 |
| Change in net unrealized appreciation (depreciation) on: | | | | |
| Investment securities (net of increase in deferred foreign taxes of $192) | | 10,591,581 | | |
| Assets and liabilities in foreign currencies | | (738) | | |
| Total change in net unrealized appreciation (depreciation) | | | | 10,590,843 |
| Net gain (loss) | | | | 20,305,107 |
| Net increase (decrease) in net assets resulting from operations | | | | $20,564,389 |
See accompanying notes which are an integral part of the financial statements.
Annual Report 62
| Statement of Changes in Net Assets | | | | | | | | | | | | | | | | | | |
| | | | | | | | | Year ended | | | | Year ended |
| | | | | | | | | February 28, | | | | February 28, |
| | | | | | | | | 2006 | | | | 2005 |
| Increase (Decrease) in Net Assets | | | | | | | | | | | | | | | | | | |
| Operations | | | | | | | | | | | | | | | | | | |
| Net investment income (loss) | | | | | | | | $ | | 259,282 | | $ | | | | 39,850 |
| Net realized gain (loss) | | | | | | | | | | 9,714,264 | | | | | | 914,109 |
| Change in net unrealized appreciation (depreciation) | | | | | | | | 10,590,843 | | | | (4,663,010) |
| Net increase (decrease) in net assets resulting from operations | | | | | | | | 20,564,389 | | | | (3,709,051) |
| Distributions to shareholders from net investment income | | | | | | | | | | (167,947) | | | | | | — |
| Share transactions | | | | | | | | | | | | | | | | | | |
| Proceeds from sales of shares | | | | | | | | 127,608,958 | | | | 81,431,449 |
| Reinvestment of distributions | | | | | | | | | | 139,899 | | | | | | — |
| Cost of shares redeemed | | | | | | | | (101,231,583) | | | | (69,421,605) |
| Net increase (decrease) in net assets resulting from share transactions | | | | | | | | 26,517,274 | | | | 12,009,844 |
| Redemption fees | | | | | | | | | | | | 56,069 | | | | | | 42,545 |
| Total increase (decrease) in net assets | | | | | | | | 46,969,785 | | | | | | 8,343,338 |
| |
| Net Assets | | | | | | | | | | | | | | | | | | |
| Beginning of period | | | | | | | | 95,501,609 | | | | 87,158,271 |
| End of period (including undistributed net investment income of $128,024 and undistributed net investment income of | | | | | | | | | | |
| $49,703, respectively) | | | | | | | | $ 142,471,394 | | $ | | 95,501,609 |
| |
| Other Information | | | | | | | | | | | | | | | | | | |
| Shares | | | | | | | | | | | | | | | | | | |
| Sold | | | | | | | | 13,503,357 | | | | | | 9,359,061 |
| Issued in reinvestment of distributions | | | | | | | | | | | | 14,823 | | | | | | — |
| Redeemed | | | | | | | | (10,882,911) | | | | (8,050,503) |
| Net increase (decrease) | | | | | | | | | | 2,635,269 | | | | | | 1,308,558 |
| |
| Financial Highlights | | | | | | | | | | | | | | | | | | |
| Years ended February 28, | | 2006 | | 2005 | | | | 2004H | | | | 2003 | | | | 2002F |
| Selected Per-Share Data | | | | | | | | | | | | | | | | | | |
| Net asset value, beginning of period | | $ 8.64 | | $ 8.95 | | $ | | 7.00 | | $ | | 9.23 | | $ | | 10.00 |
| Income from Investment Operations | | | | | | | | | | | | | | | | | | |
| Net investment income (loss)E | | 02 | | —I | | | | (.01) | | | | (.02) | | | | (.03) |
| Net realized and unrealized gain (loss) | | 1.77 | | (.31) | | | | 1.95 | | | | (2.22) | | | | (.75) |
| Total from investment operations | | 1.79 | | (.31) | | | | 1.94 | | | | (2.24) | | | | (.78) |
| Distributions from net investment income | | (.02) | | — | | | | — | | | | — | | | | — |
| Redemption fees added to paid in capitalE | | —I | | —I | | | | .01 | | | | .01 | | | | .01 |
| Net asset value, end of period | | $ 10.41 | | $ 8.64 | | $ | | 8.95 | | $ | | 7.00 | | $ | | 9.23 |
| Total ReturnB,C,D | | 20.68% | | (3.46)% | | | | 27.86% | | | | (24.16)% | | | | (7.70)% |
| Ratios to Average Net AssetsG | | | | | | | | | | | | | | | | | | |
| Expenses before reductions | | 1.11% | | 1.20% | | | | 1.59% | | | | 1.80% | | | | 1.69%A |
| Expenses net of fee waivers, if any | | 1.11% | | 1.20% | | | | 1.59% | | | | 1.80% | | | | 1.69%A |
| Expenses net of all reductions | | 1.03% | | 1.19% | | | | 1.57% | | | | 1.74% | | | | 1.68%A |
| Net investment income (loss) | | 23% | | .05% | | | | (.10)% | | | | (.26)% | | | | (.40)%A |
| Supplemental Data | | | | | | | | | | | | | | | | | | |
| Net assets, end of period (000 omitted) | | $ 142,471 | | $ 95,502 | | $ | | 87,158 | | $ | | 50,456 | | | | $ | | 60,706 |
| Portfolio turnover rate | | 207% | | 42% | | | | 80% | | | | 140% | | | | 26%A |
A Annualized B Total returns for periods of less than one year are not annualized. C Total returns would have been lower had certain expenses not been reduced during the periods shown. D Total returns do not include the effect of the former sales charges. E Calculated based on average shares outstanding during the period. F For the period June 18, 2001 (commencement of operations) to February 28, 2002. G Expense ratios reflect operating expenses of the fund. Expenses before reductions do not reflect amounts reimbursed by the investment adviser or reductions from brokerage service arrangements or other expense offset arrangements and do not represent the amount paid by the fund during periods when reimbursements or reductions occur. Expense ratios before reductions for start up periods may not be representative of longer term operating periods. Expenses net of fee waivers reflect expenses after reimbursement by the investment adviser but prior to reductions from brokerage service arrangements or other expense offset arrangements. Expenses net of all reductions represent the net expenses paid by the fund. HFor the year ended February 29. IAmount represents less than $.01 per share.See accompanying notes which are an integral part of the financial statements.
|
Notes to Financial Statements
For the period ended February 28, 2006
|
1. Significant Accounting Policies.
|
Biotechnology Portfolio, Health Care Portfolio, Medical Delivery Portfolio, Medical Equipment and Systems Portfolio, and Pharmaceuticals Portfolio (the funds) are non-diversified funds of Fidelity Select Portfolios (the trust). The trust is registered under the Investment Company Act of 1940, as amended (the 1940 Act), as an open-end management investment company organized as a Massachusetts business trust. The funds invest primarily in securities of companies whose principal business activities fall within specific industries. Each fund is authorized to issue an unlimited number of shares. The financial statements have been prepared in conformity with accounting principles generally accepted in the United States of America, which require management to make certain estimates and assumptions at the date of the financial statements. The following summarizes the significant accounting policies of the funds:
Security Valuation. Investments are valued and net asset value (NAV) per share is calculated (NAV calculation) as of the close of business of the New York Stock Exchange (NYSE), normally 4:00 p.m. Eastern time. In addition, each fund intends to calculate a NAV each hour on the hour (commencing at 10:00 a.m. Eastern time until one hour prior to the close of business on the NYSE) under normal business conditions. Each fund’s investments are valued as of these times for the purpose of computing the fund’s hourly NAV. Wherever possible, each fund uses independent pricing services approved by the Board of Trustees to value their investments.
Equity securities, including restricted securities, for which market quotations are readily available, are valued at the last reported sale price or official closing price as reported by an independent pricing service on the primary market or exchange on which they are traded. In the event there were no sales during the day or closing prices are not available, securities are valued at the last quoted bid price. Debt securities, including restricted securities, for which quotations are readily available are valued by independent pricing services or by dealers who make markets in such securities. Pricing services consider yield or price of bonds of comparable quality, coupon, maturity and type as well as dealer supplied prices. Investments in open-end mutual funds, are valued at their closing net asset value each business day. Short-term securities with remaining maturities of sixty days or less for which quotations are not readily available are valued at amortized cost, which approximates value.
When current market prices or quotations are not readily available or do not accurately reflect fair value, valuations may be determined in accordance with procedures adopted by the Board of Trustees. For example, when developments occur between the close of a market and the close of the NYSE that may materially affect the value of some or all of the securities, or when trading in a security is halted, those securities may be fair valued. Factors used in the determination of fair value may include monitoring news to identify significant market or security specific events such as changes in the value of U.S. securities markets, reviewing developments in foreign markets and evaluating the performance of ADRs, futures contracts and exchange-traded funds. Because each fund’s utilization of fair value pricing depends on market activity, the frequency with which fair value pricing is used can not be predicted and may be utilized to a significant extent. The value of securities used for NAV calculation under fair value pricing may differ from published prices for the same securities. Fidelity may suspend the calculation of one or more hourly NAVs for funds for any period in which prices for a portion of the stocks or securities held by the funds are not readily available.
Foreign Currency. Certain funds may use foreign currency contracts to facilitate transactions in foreign-denominated securities. Losses from these transactions may arise from changes in the value of the foreign currency or if the counterparties do not perform under the contracts’ terms.
Foreign-denominated assets, including investment securities, and liabilities are translated into U.S. dollars at the exchange rate at period end. Purchases and sales of investment securities, income and dividends received and expenses denominated in foreign currencies are translated into U.S. dollars at the exchange rate in effect on the transaction date.
The effects of exchange rate fluctuations on investments are included with the net realized and unrealized gain (loss) on investment securities. Other foreign currency transactions resulting in realized and unrealized gain (loss) are disclosed separately.
Investment Transactions and Income. Security transactions are accounted for as of trade date. Gains and losses on securities sold are determined on the basis of identified cost and may include proceeds received from litigation. Dividend income is recorded on the ex-dividend date, except for certain dividends from foreign securities where the ex-dividend date may have passed, which are recorded as soon as the funds are informed of the ex-dividend date. Non-cash dividends included in dividend income, if any, are recorded at the fair market value of the securities received. Distributions received on securities that represent a return of capital or capital gain are recorded as a reduction of cost of investments and/or as a realized gain. The funds estimate the components of distributions received that may be considered return of capital distributions or capital gain distributions. Interest income is accrued as earned. Interest income includes coupon interest and amortization of premium and accretion of discount on debt securities. Investment income is recorded net of foreign taxes withheld where recovery of such taxes is uncertain.
Expenses. Most expenses of the trust can be directly attributed to a fund. Expenses which cannot be directly attributed are apportioned among each fund in the trust.
1. Significant Accounting Policies - continued
|
Deferred Trustee Compensation. Under a Deferred Compensation Plan (the Plan) for Health Care Portfolio, independent Trustees must defer receipt of a portion of, and may elect to defer receipt of an additional portion of, their annual compensation. Deferred amounts are treated as though equivalent dollar amounts had been invested in shares of each applicable fund or are invested in a cross-section of other Fidelity funds, and are marked-to-market. Deferred amounts remain in the fund until distributed in accordance with the Plan.
Income Tax Information and Distributions to Shareholders. Each year, each fund intends to qualify as a regulated investment company by distributing all of its taxable income and realized gains under Subchapter M of the Internal Revenue Code. As a result, no provision for income taxes is required in the accompanying financial statements. Foreign taxes are provided for based on each fund’s understanding of the tax rules and rates that exist in the foreign markets in which it invests.
Distributions are recorded on the ex-dividend date. Income and capital gain distributions are determined in accordance with income tax regulations, which may differ from generally accepted accounting principles. In addition, certain funds will claim a portion of the payment made to redeeming shareholders as a distribution for income tax purposes.
Capital accounts within the financial statements are adjusted for permanent book-tax differences. These adjustments have no impact on net assets or the results of operations. Temporary book-tax differences will reverse in a subsequent period.
Book-tax differences are primarily due to short-term capital gains, foreign currency transactions, deferred trustees compensation, net operating losses, capital loss carryforwards and losses deferred due to wash sales and excise tax regulations.
The tax-basis components of distributable earnings and the federal tax cost as of period end were as follows for each fund:
| | | Cost for | | | | | | | | | | | | Net Unrealized |
| | | Federal Income | | Unrealized | | | | Unrealized | | | | Appreciation/ |
| | | Tax Purposes | | Appreciation | | | | Depreciation | | | | (Depreciation) |
| Biotechnology Portfolio | | $ 1,649,721,830 | | $ 505,516,245 | | $ | | (90,957,340) | | $ | | 414,558,905 |
| Health Care Portfolio | | 1,946,342,725 | | 518,209,623 | | | | (44,215,870) | | | | 473,993,753 |
| Medical Delivery Portfolio | | 1,263,308,724 | | 256,877,859 | | | | (19,364,064) | | | | 237,513,795 |
| Medical Equipment and Systems Portfolio | | 981,191,359 | | 204,366,545 | | | | (33,839,846) | | | | 170,526,699 |
| Pharmaceuticals Portfolio | | 151,663,011 | | 13,700,822 | | | | (5,970,034) | | | | 7,730,788 |
| |
| | | | | | | | | | | Undistributed | | | | |
| | | | | Undistributed | | | | Long-term | | | | Capital Loss |
| | | | | Ordinary Income | | | | Capital Gain | | | | Carryforward |
| Biotechnology Portfolio | | | | $ | | — | | $ | | — | | $ | | (650,622,260) |
| Health Care Portfolio | | | | 22,638,367 | | | | 185,203,522 | | | | — |
| Medical Delivery Portfolio | | | | 17,718,254 | | | | 16,899,342 | | | | — |
| Medical Equipment and Systems Portfolio | | | | | | — | | | | 41,296,945 | | | | — |
| Pharmaceuticals Portfolio | | | | 1,736,585 | | | | 2,773,298 | | | | — |
| |
| The tax character of distributions paid was as follows: | | | | | | | | | | | | | | |
| |
| February 28, 2006 | | | | | | | | | | | | | | |
| | | | | | | | | | | Long-term | | | | |
| | | | | Ordinary Income | | | | Capital Gains | | | | Total |
| Health Care Portfolio | | | | $ 592,623 | | $ | | 214,985,606 | | $ | | 215,578,229 |
| Medical Delivery Portfolio | | | | 42,224,323 | | | | 20,918,426 | | | | 63,142,749 |
| Medical Equipment and Systems Portfolio | | | | | | — | | | | 39,838,684 | | | | 39,838,684 |
| Pharmaceuticals Portfolio | | | | 167,947 | | | | — | | | | 167,947 |
| |
| February 28, 2005 | | | | | | | | | | | | | | |
| | | | | | | | | | | Long-term | | | | |
| | | | | Ordinary Income | | | | Capital Gains | | | | Total |
| Health Care Portfolio | | | | $ 2,031,580 | | $ | | — | | $ | | 2,031,580 |
| Medical Equipment and Systems Portfolio | | | | 3,117,915 | | | | 19,949 | | | | 3,137,864 |
Trading (Redemption) Fees. Shares in the funds held less than 30 days are subject to a redemption fee equal to .75% of the net asset value of shares redeemed. All redemption fees, including any estimated redemption fees paid by Fidelity Management & Research Company (FMR), are retained by the fund and accounted for as an addition to paid in capital. Shareholders are also subject to an additional $7.50 fee for shares exchanged into another Fidelity fund (see Note 4).
65 Annual Report
Notes to Financial Statements - continued
2. Operating Policies.
|
Repurchase Agreements. FMR has received an Exemptive Order from the Securities and Exchange Commission (the SEC) which permits certain funds and other affiliated entities of FMR to transfer uninvested cash balances into joint trading accounts which are then invested in repurchase agreements. Certain funds may also invest directly with institutions in repurchase agreements. Repurchase agreements are collateralized by government or non-government securities. Upon settlement date, collateral is held in segregated accounts with custodian banks and may be obtained in the event of a default of the counterparty. Each applicable fund monitors, on a daily basis, the value of the collateral to ensure it is at least equal to the principal amount of the repurchase agreement (including accrued interest). In the event of a default by the counterparty, realization of the collateral proceeds could be delayed, during which time the value of the collateral may decline.
Restricted Securities. Certain funds may invest in securities that are subject to legal or contractual restrictions on resale. These securities generally may be resold in transactions exempt from registration or to the public if the securities are registered. Disposal of these securities may involve time-consuming negotiations and expense, and prompt sale at an acceptable price may be difficult. Information regarding restricted securities is included at the end of each applicable fund’s Schedule of Investments.
| 3. Purchases and Sales of Investments. | | | | |
| |
| Purchases and sales of securities, other than short-term securities and U.S. government securities, are noted in the table below. | | |
| | | Purchases | | Sales |
| Biotechnology Portfolio | | $ 1,021,061,317 | | $ 1,242,782,304 |
| Health Care Portfolio | | 2,714,969,579 | | 2,628,750,674 |
| Medical Delivery Portfolio | | 1,820,382,207 | | 1,309,777,315 |
| Medical Equipment and Systems Portfolio | | 1,180,883,610 | | 1,094,349,905 |
| Pharmaceuticals Portfolio | | 259,084,687 | | 231,801,748 |
| |
| |
| 4. Fees and Other Transactions with Affiliates. | | | | |
Management Fee. FMR and its affiliates provide the funds with investment management related services for which the funds pay a monthly management fee. The management fee is the sum of an individual fund fee rate and a group fee rate. The individual fund fee rate is applied to each fund’s average net assets. The group fee rate is based upon the average net assets of all the mutual funds advised by FMR. The group fee rate decreases as assets under management increase and increases as assets under management decrease. For the period, each fund’s annual management fee rate expressed as a percentage of each fund’s average net assets was as follows:
| | | Individual Rate | | Group Rate | | Total |
| Biotechnology Portfolio | | 30% | | .27% | | .57% |
| Health Care Portfolio | | 30% | | .27% | | .57% |
| Medical Delivery Portfolio | | 30% | | .27% | | .57% |
| Medical Equipment and Systems Portfolio | | 30% | | .27% | | .57% |
| Pharmaceuticals Portfolio | | 30% | | .27% | | .57% |
Sales Load. Fidelity Distributors Corporation (FDC), an affiliate of FMR, is the general distributor of the funds. Shares purchased prior to October 12, 1990, were subject to a 1% deferred sales charge upon redemption or exchange to any other Fidelity fund (other than Select funds). Effective July 1, 2005, the deferred sales charge was eliminated. For the period, sales charge amounts retained by FDC were as follows:
| | | Retained |
| | | by FDC |
| Biotechnology Portfolio | | $ 14,905 |
| Health Care Portfolio | | 29,300 |
| Medical Delivery Portfolio | | 696 |
| Medical Equipment and Systems Portfolio | | 486 |
| Pharmaceuticals Portfolio | | 131 |
Transfer Agent Fees. Fidelity Service Company, Inc. (FSC), an affiliate of FMR, is the funds’ transfer, dividend disbursing and shareholder servicing agent. FSC receives account fees and asset-based fees that vary according to account size and type of account. FSC pays for typesetting, printing and
4. Fees and Other Transactions with Affiliates - continued
Transfer Agent Fees - continued
|
mailing of shareholder reports, except proxy statements. For the period, the transfer agent fees were equivalent to the following annual rates expressed as a percentage of average net assets:
| Biotechnology Portfolio | | 35% |
| Health Care Portfolio | | 29% |
| Medical Delivery Portfolio | | 31% |
| Medical Equipment and Systems Portfolio | | 33% |
| Pharmaceuticals Portfolio | | 39% |
Accounting and Security Lending Fees. FSC maintains each fund’s accounting records. The accounting fee is based on the level of average net assets for the month. Under a separate contract, FSC administers the security lending program. The security lending fee is based on the number and duration of lending transactions.
Affiliated Central Funds. Certain funds may invest in Money Market Central Funds which seek preservation of capital and current income and are managed by Fidelity Investments Money Management, Inc. (FIMM), an affiliate of FMR.
The Money Market Central Funds do not pay a management fee.
|
Exchange Fees. FSC receives the proceeds of $7.50 to cover administrative costs associated with exchanges out of the funds to any other Fidelity Select fund or to any other Fidelity fund. For the period, exchange fees retained by FSC were as follows:
| | | Retained |
| | | by FSC |
| Biotechnology Portfolio | | $ | | 31,560 |
| Health Care Portfolio | | | | 15,563 |
| Medical Delivery Portfolio | | | | 27,705 |
| Medical Equipment and Systems Portfolio | | | | 17,325 |
| Pharmaceuticals Portfolio | | | | 3,180 |
Brokerage Commissions. Certain funds placed a portion of their portfolio transactions with brokerage firms which are affiliates of the investment adviser. The commissions paid to these affiliated firms were as follows:
| | | Amount |
| Biotechnology Portfolio | | $ 63,072 |
| Health Care Portfolio | | 18,901 |
| Medical Delivery Portfolio | | 40,022 |
| Medical Equipment and Systems Portfolio | | 17,208 |
| Pharmaceuticals Portfolio | | 6,109 |
Interfund Lending Program. Pursuant to an Exemptive Order issued by the SEC, the funds, along with other registered investment companies having management contracts with FMR, may participate in an interfund lending program. This program provides an alternative credit facility allowing the funds to borrow from, or lend money to, other participating affiliated funds. At period end, there were no interfund loans outstanding. Each applicable fund’s activity in this program during the period for which loans were outstanding was as follows:
| | | | | Average Daily | | Weighted Average | | |
| | | Borrower or Lender | | Loan Balance | | Interest Rate | | Interest Expense |
| Biotechnology Portfolio | | Borrower | | $ 5,279,957 | | 4.13% | | $ 13,944 |
| Health Care Portfolio | | Borrower | | 8,460,778 | | 3.69% | | 7,811 |
| Medical Delivery Portfolio | | Borrower | | 5,211,714 | | 4.53% | | 9,188 |
| Medical Equipment and Systems Portfolio | | Borrower | | 3,983,500 | | 4.38% | | 969 |
| |
| 5. Committed Line of Credit. | | | | | | | | |
Certain funds participate with other funds managed by FMR in a $4.2 billion credit facility (the “line of credit”) to be utilized for temporary or emergency purposes to fund shareholder redemptions or for other short-term liquidity purposes. The participating funds have agreed to pay commitment fees on their pro rata portion of the line of credit. During the period, there were no borrowings on this line of credit.
67 Annual Report
Notes to Financial Statements - continued
6. Security Lending.
|
Certain funds lend portfolio securities from time to time in order to earn additional income. On the settlement date of the loan, each applicable fund receives collateral (in the form of U.S. Treasury obligations, letters of credit and/or cash) against the loaned securities and maintains collateral in an amount not less than 100% of the market value of the loaned securities during the period of the loan. The market value of the loaned securities is determined at the close of business of the funds and any additional required collateral is delivered to the funds on the next business day. If the borrower defaults on its obligation to return the securities loaned because of insolvency or other reasons, a fund could experience delays and costs in recovering the securities loaned or in gaining access to the collateral. Any cash collateral received is invested in the Fidelity Securities Lending Cash Central Fund. The value of loaned securities and cash collateral at period end are disclosed on each applicable fund’s Statement of Assets and Liabilities. Security lending income represents the income earned on investing cash collateral, less fees and expenses associated with the loan, plus any premium payments that may be received on the loan of certain types of securities. Security lending income is presented on each applicable fund’s Statement of Operations as a component of income from affiliated central funds.
Each fund is permitted to have bank borrowings for temporary or emergency purposes to fund shareholder redemptions. Each fund has established borrowing arrangements with certain banks. The interest rate on the borrowings is the bank’s base rate, as revised from time to time. At period end, there were no bank borrowings outstanding. Each applicable fund’s activity in this program during the period for which loans were outstanding was as follows:
| | | Average Daily | | Weighted Average |
| | | Loan Balance | | Interest Rate |
| Medical Delivery Portfolio | | $ 2,582,000 | | 4.75% |
| |
| 8. Expense Reductions. | | | | |
Many of the brokers with whom FMR places trades on behalf of certain funds provided services to these funds in addition to trade execution. These services included payments of expenses on behalf of each applicable fund. In addition, through arrangements with each applicable fund’s custodian and transfer agent, credits realized as a result of uninvested cash balances were used to reduce each applicable fund’s expenses. All of the applicable expense reductions are noted in the table below.
| | | | | | | | | Transfer |
| | | | | | | Custody | | Agent |
| | | Brokerage Service | | | | expense | | expense |
| | | Arrangements | | | | reduction | | reduction |
| Biotechnology Portfolio | | $ 634,755 | | $ | | — | | $ 17,626 |
| Health Care Portfolio | | 913,591 | | | | — | | 23,646 |
| Medical Delivery Portfolio | | 562,082 | | | | 4,849 | | 7,239 |
| Medical Equipment and Systems Portfolio | | 395,992 | | | | 1,441 | | 13,386 |
| Pharmaceuticals Portfolio | | 92,438 | | | | — | | 1,121 |
| |
| |
| 9. Other. | | | | | | | | |
The funds’ organizational documents provide former and current trustees and officers with a limited indemnification against liabilities arising in connection with the performance of their duties to the funds. In the normal course of business, the funds may also enter into contracts that provide general indemnifications. The funds’ maximum exposure under these arrangements is unknown as this would be dependent on future claims that may be made against the funds. The risk of material loss from such claims is considered remote.
Report of Independent Registered Public Accounting Firm
To the Trustees of Fidelity Select Portfolios and the Shareholders of Biotechnology Portfolio, Health Care Portfolio, Medical Delivery Portfolio, Medical Equipment and Systems Portfolio, and Pharmaceuticals Portfolio:
In our opinion, the accompanying statements of assets and liabilities, including the schedules of investments, and the related statements of operations and of changes in net assets and the financial highlights present fairly, in all material respects, the financial position of Biotechnology Portfolio, Health Care Portfolio, Medical Delivery Portfolio, Medical Equipment and Systems Portfolio, and Pharmaceuticals Portfolio (funds of Fidelity Select Portfolios) at February 28, 2006, and the results of each of their operations, the changes in each of their net assets and the financial highlights for each of the periods indicated, in conformity with accounting principles generally accepted in the United States of America. These financial statements and financial highlights (hereafter referred to as “financial statements”) are the responsibility of the Fidelity Select Portfolios’ management; our responsibility is to express an opinion on these financial statements based on our audits. We conducted our audits of these financial statements in accordance with the standards of the Public Company Accounting Oversight Board (United States). Those standards require that we plan and perform the audit to obtain reasonable assurance about whether the financial statements are free of material misstatement. An audit includes examining, on a test basis, evidence supporting the amounts and disclosures in the financial statements, assessing the accounting principles used and significant estimates made by management, and evaluating the overall financial statement presentation. We believe that our audits, which included confirmation of securities at February 28, 2006 by correspondence with the custodian and brokers, provide a reasonable basis for our opinion.
/s/ PricewaterhouseCoopers LLP
PricewaterhouseCoopers LLP
Boston, Massachusetts
April 17, 2006
|
69 Annual Report
Trustees and Officers
The Trustees, Members of the Advisory Board, and executive officers of the trust and funds, as applicable, are listed below. The Board of Trustees governs each fund and is responsible for protecting the interests of shareholders. The Trustees are experienced executives who meet periodically throughout the year to oversee each fund’s activities, review contractual arrangements with companies that provide services to each fund, and review each fund’s performance. Except for William O. McCoy, each of the Trustees oversees 326 funds advised by FMR or an affiliate. Mr. McCoy oversees 328 funds advised by FMR or an affiliate.
The Trustees hold office without limit in time except that (a) any Trustee may resign; (b) any Trustee may be removed by written instrument, signed by at least two-thirds of the number of Trustees prior to such removal; (c) any Trustee who requests to be retired or who has become incapacitated by illness or injury may be retired by written instrument signed by a majority of the other Trustees; and (d) any Trustee may be removed at any special meeting of shareholders by a two-thirds vote of the outstanding voting securities of the trust. Each Trustee who is not an interested person (as defined in the 1940 Act) (Independent Trustee), shall retire not later than the last day of the calendar year in which his or her 72nd birthday occurs. The Independent Trustees may waive this mandatory retirement age policy with respect to individual Trustees. The executive officers and Advisory Board Members hold office without limit in time, except that any officer and Advisory Board Member may resign or may be removed by a vote of a majority of the Trustees at any regular meeting or any special meeting of the Trustees. Except as indicated, each individual has held the office shown or other offices in the same company for the past five years.
The funds’ Statement of Additional Information (SAI) includes more information about the Trustees. To request a free copy, call Fidelity at 1-800-544-8544.
Interested Trustees*:
Correspondence intended for each Trustee who is an interested person may be sent to Fidelity Investments, 82 Devonshire Street, Boston, Massa-chusetts 02109.
| Name, Age; Principal Occupation |
| |
| Edward C. Johnson 3d (75) |
| |
| Year of Election or Appointment: 1980 |
| Mr. Johnson is Chairman of the Board of Trustees. Mr. Johnson serves as Chief Executive Officer, Chairman, and a Director of FMR |
| Corp.; a Director and Chairman of the Board and of the Executive Committee of FMR; Chairman and a Director of Fidelity Re- |
| search & Analysis Company (FRAC); Chairman and a Director of Fidelity Investments Money Management, Inc.; and Chairman |
| (2001-present) and a Director (2000-present) of FMR Co., Inc. |
| |
| Stephen P. Jonas (53) |
| |
| Year of Election or Appointment: 2005 |
| Mr. Jonas is Senior Vice President of Biotechnology (2005-present), Health Care (2005-present), Medical Delivery (2005-present), |
| Medical Equipment and Systems (2005-present), and Pharmaceuticals (2005-present). He also serves as Senior Vice President of |
| other Fidelity funds (2005-present). Mr. Jonas is Executive Director of FMR (2005-present). Previously, Mr. Jonas served as Presi- |
| dent of Fidelity Enterprise Operations and Risk Services (2004-2005), Chief Administrative Officer (2002-2004), and Chief Finan- |
| cial Officer of FMR Co. (1998-2000). Mr. Jonas has been with Fidelity Investments since 1987 and has held various financial and |
| management positions including Chief Financial Officer of FMR. In addition, he serves on the Boards of Boston Ballet |
| (2003-present) and Simmons College (2003-present). |
| |
| Robert L. Reynolds (53) |
| |
| Year of Election or Appointment: 2003 |
| Mr. Reynolds is a Director (2003-present) and Chief Operating Officer (2002-present) of FMR Corp. He also serves on the Board |
| at Fidelity Investments Canada, Ltd. (2000-present). Previously, Mr. Reynolds served as President of Fidelity Investments Institutional |
| Retirement Group (1996-2000). |
* Trustees have been determined to be “Interested Trustees” by virtue of, among other things, their affiliation with the trust or various entities under common control with FMR.
Independent Trustees:
Correspondence intended for each Independent Trustee (that is, the Trustees other than the Interested Trustees) may be sent to Fidelity Investments, P.O. Box 55235, Boston, Massachusetts 02205-5235.
| Name, Age; Principal Occupation |
| |
| Dennis J. Dirks (57) |
| |
| Year of Election or Appointment: 2005 |
| Prior to his retirement in May 2003, Mr. Dirks was Chief Operating Officer and a member of the Board of The Depository Trust & |
| Clearing Corporation (DTCC) (1999-2003). He also served as President, Chief Operating Officer, and Board member of The De- |
| pository Trust Company (DTC) (1999-2003) and President and Board member of the National Securities Clearing Corporation |
| (NSCC) (1999-2003). In addition, Mr. Dirks served as Chief Executive Officer and Board member of the Government Securities |
| Clearing Corporation (2001-2003) and Chief Executive Officer and Board member of the Mortgage-Backed Securities Clearing |
| Corporation (2001-2003). Mr. Dirks also serves as a Trustee and a member of the Finance Committee of Manhattan College |
| (2005-present) and a Trustee and a member of the Finance Committee of AHRC of Nassau County (2006-present). |
| |
| Robert M. Gates (62) |
| |
| Year of Election or Appointment: 1997 |
| Dr. Gates is Chairman of the Independent Trustees (2006-present). Dr. Gates is President of Texas A&M University (2002-present). |
| He was Director of the Central Intelligence Agency (CIA) from 1991 to 1993. From 1989 to 1991, Dr. Gates served as Assistant |
| to the President of the United States and Deputy National Security Advisor. Dr. Gates is a Director of NACCO Industries, Inc. |
| (mining and manufacturing), Parker Drilling Co., Inc. (drilling and rental tools for the energy industry, 2001-present), and Brinker |
| International (restaurant management, 2003-present). Previously, Dr. Gates served as a Director of LucasVarity PLC (automotive |
| components and diesel engines), a Director of TRW Inc. (automotive, space, defense, and information technology), and Dean of |
| the George Bush School of Government and Public Service at Texas A&M University (1999-2001). |
| |
| George H. Heilmeier (69) |
| |
| Year of Election or Appointment: 2004 |
| Dr. Heilmeier is Chairman Emeritus of Telcordia Technologies (communication software and systems), where prior to his retirement, |
| he served as company Chairman and Chief Executive Officer. He currently serves on the Boards of Directors of The Mitre Corpo- |
| ration (systems engineering and information technology support for the government), and HRL Laboratories (private research and |
| development, 2004-present). He is Chairman of the General Motors Science & Technology Advisory Board and a Life Fellow of |
| the Institute of Electrical and Electronics Engineers (IEEE). Dr. Heilmeier is a member of the Defense Science Board and the National |
| Security Agency Advisory Board. He is also a member of the National Academy of Engineering, the American Academy of Arts |
| and Sciences, and the Board of Overseers of the School of Engineering and Applied Science of the University of Pennsylvania. |
| Previously, Dr. Heilmeier served as a Director of TRW Inc. (automotive, space, defense, and information technology, 1992-2002), |
| Compaq (1994-2002), Automatic Data Processing, Inc. (ADP) (technology-based business outsourcing, 1995-2002), INET |
| Technologies Inc. (telecommunications network surveillance, 2001-2004), and Teletech Holdings (customer management services). |
| He is the recipient of the 2005 Kyoto Prize in Advanced Technology for his invention of the liquid crystal display. |
| |
| Marie L. Knowles (59) |
| |
| Year of Election or Appointment: 2001 |
| Prior to Ms. Knowles’ retirement in June 2000, she served as Executive Vice President and Chief Financial Officer of Atlantic Rich- |
| field Company (ARCO) (diversified energy, 1996-2000). From 1993 to 1996, she was a Senior Vice President of ARCO and |
| President of ARCO Transportation Company. She served as a Director of ARCO from 1996 to 1998. She currently serves as a |
| Director of Phelps Dodge Corporation (copper mining and manufacturing) and McKesson Corporation (healthcare service, |
| 2002-present). Ms. Knowles is a Trustee of the Brookings Institution and the Catalina Island Conservancy and also serves as a |
| member of the Advisory Board for the School of Engineering of the University of Southern California. |
| |
| Ned C. Lautenbach (62) |
| |
| Year of Election or Appointment: 2000 |
| Mr. Lautenbach has been a partner of Clayton, Dubilier & Rice, Inc. (private equity investment firm) since September 1998. Pre- |
| viously, Mr. Lautenbach was with the International Business Machines Corporation (IBM) from 1968 until his retirement in 1998. |
| Mr. Lautenbach serves as a Director of Italtel Holding S.p.A. (telecommunications (Milan, Italy), 2004-present) and Eaton Corpora- |
| tion (diversified industrial) as well as the Philharmonic Center for the Arts in Naples, Florida. He also is a member of the Board of |
| Trustees of Fairfield University (2005-present), as well as a member of the Council on Foreign Relations. |
71 Annual Report
Trustees and Officers - continued
| Name, Age; Principal Occupation |
| |
| William O. McCoy (72) |
| |
| Year of Election or Appointment: 1997 |
| Prior to his retirement in December 1994, Mr. McCoy was Vice Chairman of the Board of BellSouth Corporation (telecommunica- |
| tions) and President of BellSouth Enterprises. He is currently a Director of Duke Realty Corporation (real estate), and Progress |
| Energy, Inc. (electric utility). He is also a partner of Franklin Street Partners (private investment management firm) and a member of |
| the Research Triangle Foundation Board. In addition, Mr. McCoy served as the Interim Chancellor (1999-2000) and a member of |
| the Board of Visitors for the University of North Carolina at Chapel Hill and currently serves as Chairman of the Board of Directors |
| of the University of North Carolina Health Care System and the Board of Visitors of the Kenan-Flagler Business School (University |
| of North Carolina at Chapel Hill). He also served as Vice President of Finance for the University of North Carolina (16-school |
| system). |
| |
| Cornelia M. Small (61) |
| |
| Year of Election or Appointment: 2005 |
| Ms. Small is a member (2000-present) and Chairperson (2002-present) of the Investment Committee, and a member |
| (2002-present) of the Board of Trustees of Smith College. Previously, she served as Chief Investment Officer (1999-2000), Director |
| of Global Equity Investments (1996-1999), and a member of the Board of Directors of Scudder, Stevens & Clark (1990-1997) and |
| Scudder Kemper Investments (1997-1999). In addition, Ms. Small served as Co-Chair (2000-2003) of the Annual Fund for the |
| Fletcher School of Law and Diplomacy. |
| |
| William S. Stavropoulos (66) |
| |
| Year of Election or Appointment: 2002 |
| Mr. Stavropoulos is Chairman of the Board (2000-present) and a Member of the Board of Directors of The Dow Chemical |
| Company. Since joining The Dow Chemical Company in 1967, Mr. Stavropoulos served in numerous senior management posi- |
| tions, including President (1993-2000; 2002-2003), CEO (1995-2000; 2002-2004), and Chairman of the Executive Committee |
| (2000-2004). Currently, he is a Director of NCR Corporation (data warehousing and technology solutions), BellSouth Corporation |
| (telecommunications), Chemical Financial Corporation, Maersk Inc. (industrial conglomerate, 2002-present), and Metalmark Capi- |
| tal (private equity investment firm, 2005-present). He also serves as a member of the Board of Trustees of the American Enterprise |
| Institute for Public Policy Research. In addition, Mr. Stavropoulos is a member of The Business Council, J.P. Morgan International |
| Council and the University of Notre Dame Advisory Council for the College of Science. |
| |
| Kenneth L. Wolfe (67) |
| |
| Year of Election or Appointment: 2005 |
| Prior to his retirement in 2001, Mr. Wolfe was Chairman and Chief Executive Officer of Hershey Foods Corporation (1993-2001). |
| He currently serves as a member of the boards of Adelphia Communications Corporation (2003-present), Bausch & Lomb, Inc., |
| and Revlon Inc. (2004-present). |
Advisory Board Members and Executive Officers:
Correspondence intended for Messrs. Keyes and Gamper may be sent to Fidelity Investments, P.O. Box 55235, Boston, Massachusetts 02205-5235. Correspondence intended for each executive officer and Mr. Lynch may be sent to Fidelity Investments, 82 Devonshire Street, Boston, Massachu-setts 02109.
| Name, Age; Principal Occupation |
| |
| Albert R. Gamper, Jr. (63) |
| |
| Year of Election or Appointment: 2005 |
| Member of the Advisory Board of Fidelity Select Portfolios. Mr. Gamper also serves as a Trustee (2006-present) or Member of the |
| Advisory Board (2005-present) of other investment companies advised by FMR. Prior to his retirement in December 2004, Mr. |
| Gamper served as Chairman of the Board of CIT Group Inc. (commercial finance). During his tenure with CIT Group Inc. Mr. |
| Gamper served in numerous senior management positions, including Chairman (1987-1989; 1999-2001; 2002-2004), Chief |
| Executive Officer (1987-2004), and President (1989-2002). He currently serves as a member of the Board of Directors of Public |
| Service Enterprise Group (utilities, 2001-present), Chairman of the Board of Governors, Rutgers University (2004-present), and |
| Chairman of the Board of Saint Barnabas Health Care System. |
| |
| James H. Keyes (66) |
| |
| Year of Election or Appointment: 2006 |
| Member of the Advisory Board of Fidelity Select Portfolios. Prior to his retirement in 2003, Mr. Keyes was Chairman, President, |
| and Chief Executive Officer of Johnson Controls, Inc. (automotive supplier, 1993-2003). He currently serves as a member of the |
| boards of LSI Logic Corporation (semiconductor technologies, 1984-present), Navistar International Corporation (manufacture and |
| sale of trucks, buses, and diesel engines, 2002-present), and Pitney Bowes, Inc. (integrated mail, messaging, and document man- |
| agement solutions, 1998-present). |
Annual Report 72
| Name, Age; Principal Occupation |
| |
| Peter S. Lynch (62) |
| |
| Year of Election or Appointment: 2003 |
| Member of the Advisory Board of Fidelity Select Portfolios. Vice Chairman and a Director of FMR, and Vice Chairman |
| (2001-present) and a Director (2000-present) of FMR Co., Inc. Previously, Mr. Lynch served as a Trustee of the Fidelity funds |
| (1990-2003). In addition, he serves as a Trustee of Boston College, Massachusetts Eye & Ear Infirmary, Historic Deerfield, John F. |
| Kennedy Library, and the Museum of Fine Arts of Boston. |
| |
| Eric D. Roiter (57) |
| |
| Year of Election or Appointment: 1998 or 2001 |
| Secretary of Biotechnology (1998), Health Care (1998), Medical Delivery (1998), Medical Equipment and Systems (1998), and |
| Pharmaceuticals (2001). He also serves as Secretary of other Fidelity funds; Vice President, General Counsel, and Secretary of |
| FMR Co., Inc. (2001-present) and FMR; Assistant Secretary of Fidelity Management & Research (U.K.) Inc. (2001-present), Fidelity |
| Research & Analysis Company (2001-present), and Fidelity Investments Money Management, Inc. (2001-present). Mr. Roiter is an |
| Adjunct Member, Faculty of Law, at Boston College Law School (2003-present). Previously, Mr. Roiter served as Vice President and |
| Secretary of Fidelity Distributors Corporation (FDC) (1998-2005). |
| |
| Stuart Fross (46) |
| |
| Year of Election or Appointment: 2003 |
| Assistant Secretary of Biotechnology, Health Care, Medical Delivery, Medical Equipment and Systems, and Pharmaceuticals. Mr. |
| Fross also serves as Assistant Secretary of other Fidelity funds (2003-present), Vice President and Secretary of FDC (2005-present), |
| and is an employee of FMR. |
| |
| Christine Reynolds (47) |
| |
| Year of Election or Appointment: 2004 |
| President and Treasurer of Biotechnology, Health Care, Medical Delivery, Medical Equipment and Systems, and Pharmaceuticals. |
| Ms. Reynolds also serves as President and Treasurer of other Fidelity funds (2004-present) and is a Vice President (2003-present) |
| and an employee (2002-present) of FMR. Before joining Fidelity Investments, Ms. Reynolds worked at PricewaterhouseCoopers LLP |
| (PwC) (1980-2002), where she was most recently an audit partner with PwC’s investment management practice. |
| |
| R. Stephen Ganis (66) |
| |
| Year of Election or Appointment: 2006 |
| Anti-Money Laundering (AML) officer of Biotechnology, Health Care, Medical Delivery, Medical Equipment and Systems, and Phar- |
| maceuticals. Mr. Ganis also serves as AML officer of other Fidelity funds (2006-present) and FMR Corp. (2003-present). Before |
| joining Fidelity Investments, Mr. Ganis practiced law at Goodwin Procter, LLP (2000-2002). |
| |
| Paul M. Murphy (58) |
| |
| Year of Election or Appointment: 2005 |
| Chief Financial Officer of Biotechnology, Health Care, Medical Delivery, Medical Equipment and Systems, and Pharmaceuticals. |
| Mr. Murphy also serves as Chief Financial Officer of other Fidelity funds (2005-present). He also serves as Senior Vice President of |
| Fidelity Pricing and Cash Management Services Group (FPCMS). |
| |
| Kenneth A. Rathgeber (58) |
| |
| Year of Election or Appointment: 2004 |
| Chief Compliance Officer of Biotechnology, Health Care, Medical Delivery, Medical Equipment and Systems, and Pharmaceuticals. |
| Mr. Rathgeber also serves as Chief Compliance Officer of other Fidelity funds (2004-present) and Executive Vice President of Risk |
| Oversight for Fidelity Investments (2002-present). He is Chief Compliance Officer of FMR (2005-present), FMR Co., Inc. |
| (2005-present), Fidelity Management & Research (U.K.) Inc. (2005-present), Fidelity Research & Analysis Company |
| (2005-present), Fidelity Investments Money Management, Inc. ( 2005-present), and Strategic Advisers, Inc. (2005-present). Pre- |
| viously, Mr. Rathgeber served as Executive Vice President and Chief Operating Officer for Fidelity Investments Institutional Services |
| Company, Inc. (1998-2002). |
| |
| Bryan A. Mehrmann (44) |
| |
| Year of Election or Appointment: 2005 |
| Deputy Treasurer of Biotechnology, Health Care, Medical Delivery, Medical Equipment and Systems, and Pharmaceuticals. Mr. |
| Mehrmann also serves as Deputy Treasurer of other Fidelity funds (2005-present) and is an employee of FMR. Previously, Mr. |
| Mehrmann served as Vice President of Fidelity Investments Institutional Services Group (FIIS)/Fidelity Investments Institutional Op- |
| erations Corporation, Inc. (FIIOC) Client Services (1998-2004). |
73 Annual Report
Trustees and Officers - continued
| Name, Age; Principal Occupation |
| |
| Kimberley H. Monasterio (42) |
| |
| Year of Election or Appointment: 2004 |
| Deputy Treasurer of Biotechnology, Health Care, Medical Delivery, Medical Equipment and Systems, and Pharmaceuticals. Ms. |
| Monasterio also serves as Deputy Treasurer of other Fidelity funds (2004) and is an employee of FMR (2004). Before joining |
| Fidelity Investments, Ms. Monasterio served as Treasurer (2000-2004) and Chief Financial Officer (2002-2004) of the Franklin |
| Templeton Funds and Senior Vice President of Franklin Templeton Services, LLC (2000-2004). |
| |
| Kenneth B. Robins (36) |
| |
| Year of Election or Appointment: 2005 |
| Deputy Treasurer of Biotechnology, Health Care, Medical Delivery, Medical Equipment and Systems, and Pharmaceuticals. Mr. |
| Robins also serves as Deputy Treasurer of other Fidelity funds (2005-present) and is an employee of FMR (2004-present). Before |
| joining Fidelity Investments, Mr. Robins worked at KPMG LLP, where he was a partner in KPMG’s department of professional prac- |
| tice (2002-2004) and a Senior Manager (1999-2000). In addition, Mr. Robins served as Assistant Chief Accountant, United States |
| Securities and Exchange Commission (2000-2002). |
| |
| Robert G. Byrnes (39) |
| |
| Year of Election or Appointment: 2005 |
| Assistant Treasurer of Biotechnology, Health Care, Medical Delivery, Medical Equipment and Systems, and Pharmaceuticals. Mr. |
| Byrnes also serves as Assistant Treasurer of other Fidelity funds (2005-present) and is an employee of FMR (2005-present). Pre- |
| viously, Mr. Byrnes served as Vice President of FPCMS (2003-2005). Before joining Fidelity Investments, Mr. Byrnes worked at |
| Deutsche Asset Management where he served as Vice President of the Investment Operations Group (2000-2003). |
| |
| John H. Costello (59) |
| |
| Year of Election or Appointment: 1986, 1998, or 2001 |
| Assistant Treasurer of Biotechnology (1986), Health Care (1986), Medical Delivery (1986), Medical Equipment and Systems |
| (1998), and Pharmaceuticals (2001). Mr. Costello also serves as Assistant Treasurer of other Fidelity funds and is an employee of |
| FMR. |
| |
| Peter L. Lydecker (52) |
| |
| Year of Election or Appointment: 2004 |
| Assistant Treasurer of Biotechnology, Health Care, Medical Delivery, Medical Equipment and Systems, and Pharmaceuticals. Mr. |
| Lydecker also serves as Assistant Treasurer of other Fidelity funds (2004) and is an employee of FMR. |
| |
| Mark Osterheld (50) |
| |
| Year of Election or Appointment: 2003 |
| Assistant Treasurer of Biotechnology, Health Care, Medical Delivery, Medical Equipment and Systems, and Pharmaceuticals. Mr. |
| Osterheld also serves as Assistant Treasurer of other Fidelity funds (2002) and is an employee of FMR. |
| |
| Gary W. Ryan (47) |
| |
| Year of Election or Appointment: 2005 |
| Assistant Treasurer of Biotechnology, Health Care, Medical Delivery, Medical Equipment and Systems, and Pharmaceuticals. Mr. |
| Ryan also serves as Assistant Treasurer of other Fidelity funds (2005-present) and is an employee of FMR (2005-present). |
| Previously, Mr. Ryan served as Vice President of Fund Reporting in FPCMS (1999-2005). |
| |
| Salvatore Schiavone (40) |
| |
| Year of Election or Appointment: 2005 |
| Assistant Treasurer of Biotechnology, Health Care, Medical Delivery, Medical Equipment and Systems, and Pharmaceuticals. Mr. |
| Schiavone also serves as Assistant Treasurer of other Fidelity funds (2005-present) and is an employee of FMR (2005-present). |
| Before joining Fidelity Investments, Mr. Schiavone worked at Deutsche Asset Management, where he most recently served as Assis- |
| tant Treasurer (2003-2005) of the Scudder Funds and Vice President and Head of Fund Reporting (1996-2003). |
Annual Report 74
The Board of Trustees of each fund voted to pay to shareholders of record at the opening of business on record date, the following distributions per share derived from capital gains realized from sales of portfolio securities, and dividends derived from net investment income:
| Fund | | Pay Date | | Record Date | | Dividends | | Capital Gains |
| Health Care | | 04/10/06 | | 04/07/06 | | $— | | $ 12.33 |
| Medical Delivery | | 04/10/06 | | 04/07/06 | | $— | | $ 1.46 |
| Medical Equipment and Systems | | 04/10/06 | | 04/07/06 | | $— | | $ .99 |
| Pharmaceuticals | | 04/10/06 | | 04/07/06 | | $.01 | | $ .31 |
The funds hereby designate as capital gain dividend the amounts noted below for the taxable year ended February 28, 2006, or, if subsequently determined to be different, the net capital gain of such year.
| Fund | | |
| Health Care | | $ 400,189,128 |
| Medical Delivery | | $ 19,596,597 |
| Medical Equipment and Systems | | $ 83,301,209 |
| Pharmaceuticals | | $ 2,773,298 |
A percentage of the dividends distributed during the fiscal year for the following funds qualifies for the dividends-received deduction for corporate shareholders:
| Health Care | | April 2005 | | 100% |
| Medical Delivery | | December 2005 | | 6% |
| Pharmaceuticals | | April 2005 | | 100% |
| | | December 2005 | | 100% |
A percentage of the dividends distributed during the fiscal year for the following funds may be taken into account as a dividend for purposes of the maximum rate under section 1(h)(11) of the Internal Revenue Code.
| Health Care | | April 2005 | | 100% |
| Medical Delivery | | April 2005 | | 1% |
| | | December 2005 | | 7% |
| Pharmaceuticals | | April 2005 | | 100% |
| | | December 2005 | | 100% |
The funds will notify shareholders in January 2007 of amounts for use in preparing 2006 income tax returns.
75 Annual Report
Board Approval of Investment Advisory Contracts and Management Fees
Select Biotechnology
Select Health Care
Select Medical Delivery
Select Medical Equipment and Systems
Select Pharmaceuticals
|
On January 19, 2006, the Board of Trustees, including the Independent Trustees (together, the Board), voted to approve a general research services agreement (the Agreement) between FMR, FMR Co., Inc. (FMRC), Fidelity Investments Money Management, Inc. (FIMM), and Fidelity Research & Analysis Company (FRAC) (together, the Investment Advisers) for each fund, effective January 20, 2006, pursuant to which FRAC may provide general research and investment advisory support services to FMRC and FIMM. The Board considered that it has approved previously various sub-advisory agreements for each fund with affiliates of FMR that allow FMR to obtain research, non-discretionary advice, or discretionary portfolio management at no additional expense to each fund. The Board, assisted by the advice of fund counsel and independent Trustees’ counsel, considered a broad range of information and determined that it would be beneficial for each fund to access the research and investment advisory support services supplied by FRAC at no additional expense to each fund.
The Board reached this determination in part because the new arrangement will involve no changes in (i) the contractual terms of and fees payable under each fund’s management contract or sub-advisory agreements; (ii) the investment process or strategies employed in the management of each fund’s assets; (iii) the nature or level of services provided under each fund’s management contract or sub-advisory agreements; (iv) the day-to-day management of each fund or the persons primarily responsible for such management; or (v) the ultimate control or beneficial ownership of FMR, FMRC, or FIMM. The Board also considered that the establishment of each Agreement would not necessitate prior shareholder approval of the Agreement or result in an assignment and termination of each fund’s management contract or sub-advisory agreements under the Investment Company Act of 1940.
Because the Board was approving an arrangement with FRAC under which each fund will not bear any additional management fees or expenses and under which each fund’s portfolio manager would not change, it did not consider each fund’s investment performance, competitiveness of management fee and total expenses, costs of services and profitability, or economies of scale to be significant factors in its decision.
In connection with its future renewal of each fund’s management contract and sub-advisory agreements, the Board will consider: (i) the nature, extent, and quality of services provided to each fund, including shareholder and administrative services and investment performance; (ii) the competitiveness of each fund’s management fee and total expenses; (iii) the costs of the services and profitability, including the revenues earned and the expenses incurred by Fidelity in conducting the business of developing, marketing, distributing, managing, administering, and servicing each fund and its shareholders; and (iv) whether there have been economies of scale in respect of the management of the Fidelity funds, whether the Fidelity funds (including each fund) have appropriately benefited from any such economies of scale, and whether there is potential for realization of any further economies.
Based on its evaluation of all of the conclusions noted above, and after considering all material factors, the Board ultimately concluded that each fund’s Agreement is fair and reasonable, and that each fund’s Agreement should be approved.
Managing Your Investments
Fidelity offers several ways to conveniently manage your personal investments via your telephone or PC. You can access your account information, conduct trades and research your investments 24 hours a day.
By Phone
Fidelity Automated Service Telephone provides a single toll-free number to access account balances, positions, quotes and trading. It’s easy to navigate the service, and on your first call, the system will help you create a personal identification number (PIN) for security.

By PC
Fidelity’s web site on the Internet provides a wide range of information, including daily financial news, fund performance, interactive planning tools and news about Fidelity products and services.

* When you call the quotes line, please remember that a fund’s yield and return will vary and, except for money market funds, share price will also vary. This means that you may have a gain or loss when you sell your shares. There is no assurance that money market funds will be able to maintain a stable $1 share price; an investment in a money market fund is not insured or guaranteed by the U.S. government. Total returns are historical and include changes in share price, reinvestment of dividends and capital gains, and the effects of any sales charges.
77 77 Annual Report
To Write Fidelity
We’ll give your correspondence immediate attention and send you written confirmation upon completion of your request.
Annual Report 78
To Visit Fidelity
For directions and hours,
please call 1-800-544-9797.
Arizona
7001 West Ray Road
Chandler, AZ
7373 N. Scottsdale Road
Scottsdale, AZ
California
815 East Birch Street
Brea, CA
1411 Chapin Avenue
Burlingame, CA
851 East Hamilton Avenue
Campbell, CA
19200 Von Karman Avenue
Irvine, CA
601 Larkspur Landing Circle
Larkspur, CA
10100 Santa Monica Blvd.
Los Angeles, CA
27101 Puerta Real
Mission Viejo, CA
73-575 El Paseo
Palm Desert, CA
251 University Avenue
Palo Alto, CA
123 South Lake Avenue
Pasadena, CA
16995 Bernardo Ctr. Drive
Rancho Bernardo, CA
1740 Arden Way
Sacramento, CA
7676 Hazard Center Drive
San Diego, CA
8 Montgomery Street
San Francisco, CA
3793 State Street
Santa Barbara, CA
21701 Hawthorne Boulevard
Torrance, CA
2001 North Main Street
Walnut Creek, CA
6300 Canoga Avenue
Woodland Hills, CA
Colorado
1625 Broadway
Denver, CO
9185 East Westview Road
Littleton, CO
Connecticut
48 West Putnam Avenue
Greenwich, CT
265 Church Street
New Haven, CT
300 Atlantic Street
Stamford, CT
29 South Main Street
West Hartford, CT
Delaware
222 Delaware Avenue
Wilmington, DE
|
Florida
4400 N. Federal Highway
Boca Raton, FL
121 Alhambra Plaza
Coral Gables, FL
2948 N. Federal Highway
Ft. Lauderdale, FL
1907 West State Road 434
Longwood, FL
8880 Tamiami Trail, North
Naples, FL
3550 Tamiami Trail, South
Sarasota, FL
1502 N. Westshore Blvd.
Tampa, FL
2465 State Road 7
Wellington, FL
3501 PGA Boulevard
West Palm Beach, FL
Georgia
3445 Peachtree Road, N.E.
Atlanta, GA
1000 Abernathy Road
Atlanta, GA
Illinois
One North LaSalle Street
Chicago, IL
875 North Michigan Ave.
Chicago, IL
1415 West 22nd Street
Oak Brook, IL
1700 East Golf Road
Schaumburg, IL
3232 Lake Avenue
Wilmette, IL
Indiana
4729 East 82nd Street
Indianapolis, IN
Kansas
5400 College Boulevard
Overland Park, KS
Maine
Three Canal Plaza
Portland, ME
Maryland
7315 Wisconsin Avenue
Bethesda, MD
One W. Pennsylvania Ave.
Towson, MD
Massachusetts
801 Boylston Street
Boston, MA
155 Congress Street
Boston, MA
300 Granite Street
Braintree, MA
44 Mall Road
Burlington, MA
405 Cochituate Road
Framingham, MA
416 Belmont Street
Worcester, MA
|
Michigan
500 E. Eisenhower Pkwy.
Ann Arbor, MI
280 Old N. Woodward Ave.
Birmingham, MI
43420 Grand River Avenue
Novi, MI
29155 Northwestern Hwy.
Southfield, MI
Minnesota
7600 France Avenue South
Edina, MN
Missouri
8885 Ladue Road
Ladue, MO
Nevada
2225 Village Walk Drive
Henderson, NV
New Jersey
150 Essex Street
Millburn, NJ
56 South Street
Morristown, NJ
396 Route 17, North
Paramus, NJ
3518 Route 1 North
Princeton, NJ
530 Highway 35
Shrewsbury, NJ
New York
1055 Franklin Avenue
Garden City, NY
37 West Jericho Turnpike
Huntington Station, NY
1271 Avenue of the Americas
New York, NY
61 Broadway
New York, NY
350 Park Avenue
New York, NY
200 Fifth Avenue
New York, NY
733 Third Avenue
New York, NY
11 Penn Plaza
New York, NY
2070 Broadway
New York, NY
1075 Northern Blvd.
Roslyn, NY
North Carolina
4611 Sharon Road
Charlotte, NC
Ohio
3805 Edwards Road
Cincinnati, OH
1324 Polaris Parkway
Columbus, OH
28699 Chagrin Boulevard
Woodmere Village, OH
Oregon
16850 SW 72nd Avenue
Tigard, OR
|
Pennsylvania
600 West DeKalb Pike
King of Prussia, PA
1735 Market Street
Philadelphia, PA
12001 Perry Highway
Wexford, PA
Rhode Island
47 Providence Place
Providence, RI
Tennessee
6150 Poplar Avenue
Memphis, TN
Texas
10000 Research Boulevard
Austin, TX
4001 Northwest Parkway
Dallas, TX
12532 Memorial Drive
Houston, TX
2701 Drexel Drive
Houston, TX
6500 N. MacArthur Blvd.
Irving, TX
6005 West Park Boulevard
Plano, TX
14100 San Pedro
San Antonio, TX
1576 East Southlake Blvd.
Southlake, TX
19740 IH 45 North
Spring, TX
Utah
215 South State Street
Salt Lake City, UT
Virginia
1861 International Drive
McLean, VA
Washington
411 108th Avenue, N.E.
Bellevue, WA
1518 6th Avenue
Seattle, WA
Washington, DC
1900 K Street, N.W.
Washington, DC
Wisconsin
595 North Barker Road
Brookfield, WI
|
Fidelity Brokerage Services, Inc., 100 Summer St., Boston, MA 02110 Member NYSE/SIPC
79 Annual Report
Investment Adviser
Fidelity Management & Research Company
Boston, MA
Investment Sub-Advisers
FMR Co., Inc.
Fidelity Management & Research (U.K.) Inc.
Fidelity Research & Analysis Company (formerly Fidelity Management & Research (Far East) Inc.)
Fidelity Investments Japan Limited
Fidelity International Investment Advisors
Fidelity International Investment Advisors (U.K. Limited)
General Distributor
Fidelity Distributors Corporation
Boston, MA
Transfer and Service Agent
Fidelity Service Company, Inc.
Boston, MA
Custodian
Brown Brothers Harriman & Co.
Boston, MA
Corporate Headquarters
82 Devonshire Street
Boston, MA 02109
1-800-544-8888
The Fidelity Telephone Connection
Mutual Fund 24-Hour Service
Exchanges/Redemptions
and Account Assistance 1-800-544-6666
Product Information 1-800-544-8888
Retirement Accounts 1-800-544-4774
(8 a.m. - 9 p.m.)
TDD Service 1-800-544-0118
for the deaf and hearing impaired
(9 a.m. - 9 p.m. Eastern time)
Fidelity Automated Service
Telephone (FAST®) (automated graphic) 1-800-544-5555
| | (automated graphic) Automated line for quickest service
|

| SELHC-UANN-0406 | | Corporate Headquarters |
| 1.813639.101 | | 82 Devonshire St., Boston, MA 02109 |
| | | www.fidelity.com |
Fidelity®
Select Portfolios®
Financial Services Sector
Banking
Brokerage and Investment Management
Financial Services
Home Finance
Insurance
Annual Report
February 28, 2006


| Contents | | |
| |
| Chairman’s Message | | 3 |
| Shareholder Expense Example | | 4 |
| Fund Updates* | | |
| Financial Services Sector | | |
| Banking | | 5 |
| Brokerage and Investment Management | | 14 |
| Financial Services | | 24 |
| Home Finance | | 35 |
| Insurance | | 44 |
| Notes to Financial Statements | | 53 |
| Report of Independent Registered | | 58 |
| Public Accounting Firm | | |
| Trustees and Officers | | 59 |
| Distributions | | 64 |
| Board Approval of Investment | | 65 |
| Advisory Contracts and | | |
| Management Fees | | |
* Fund updates for each Select Portfolio include: Performance, Management’s Discussion of Fund Performance, Investment Changes, Investments, and Financial Statements.
To view a fund’s proxy voting guidelines and proxy voting record for the 12-month period ended June 30, visit www.fidelity.com/proxyvotingresults or visit the Securities and Exchange Commission’s (SEC) website at www.sec.gov. You may also call 1-800-544-8544 to request a free copy of the proxy voting guidelines.
Standard & Poor’s, S&P and S&P 500 are registered service marks of The McGraw-Hill Companies, Inc. and have been licensed for use by Fidelity Distributors Corporation.
Other third party marks appearing herein are the property of their respective owners.
All other marks appearing herein are registered or unregistered trademarks or service marks of FMR Corp. or an affiliated company.
This report and the financial statements contained herein are submitted for the general information of the shareholders of the funds. This report is not authorized for distribution to prospective investors in the funds unless preceded or accompanied by an effective prospectus.
A fund files its complete schedule of portfolio holdings with the SEC for the first and third quarters of each fiscal year on Form N-Q. Forms N-Q are available on the SEC’s web site at http://www.sec.gov. A fund’s Forms N-Q may be reviewed and copied at the SEC’s Public Reference Room in Washing-ton, DC. Information regarding the operation of the SEC’s Public Reference Room may be obtained by calling 1-800-SEC-0330. For a complete list of a fund’s portfolio holdings, view the most recent quarterly holdings report, semiannual report, or annual report on Fidelity’s web site at http://www.fidelity.com/holdings.
NOT FDIC INSURED · MAY LOSE VALUE · NO BANK GUARANTEE
Neither the funds nor Fidelity Distributors Corporation is a bank.
|
(Photograph of Edward C. Johnson 3d.)
Although many securities markets made gains in early 2006, there is only one certainty when it comes to investing: There is no sure thing. There are, however, a number of time-tested, fundamental investment principles that can put the historical odds in your favor.
One of the basic tenets is to invest for the long term. Over time, riding out the markets’ inevitable ups and downs has proven much more effective than selling into panic or chasing the hottest trend. Even missing only a few of the markets’ best days can significantly diminish investor returns. Patience also affords the benefits of compounding — of earning interest on additional income or reinvested dividends and capital gains. There are tax advantages and cost benefits to consider as well. The more you sell, the more taxes you pay, and the more you trade, the higher the costs. While staying the course doesn’t eliminate risk, it can considerably lessen the effect of short-term declines.
You can further manage your investing risk through diversification. And today, more than ever, geographic diversification should be taken into account. Studies
indicate that asset allocation is the single most important determinant of a portfolio’s long-term success. The right mix of stocks, bonds and cash — aligned to your particular risk tolerance and investment objective — is very important. Age-appropriate rebalancing is also an essential aspect of asset allocation. For younger investors, an emphasis on equities — which historically have been the best performing asset class over time — is encouraged. As investors near their specific goal, such as retirement or sending a child to college, consideration may be given to replacing volatile assets (e.g. common stocks) with more-stable fixed investments (bonds or savings plans).
A third investment principle — investing regularly — can help lower the average cost of your purchases. Investing a certain amount of money each month or quarter helps ensure you won’t pay for all your shares at market highs. This strategy — known as dollar cost averaging — also reduces unconstructive “emotion” from investing, helping shareholders avoid selling weak performers just prior to an upswing, or chasing a hot performer just before a correction.
We invite you to contact us via the Internet, through our Investor Centers or over the phone. It is our privilege to provide you the information you need to make the investments that are right for you.

3 Annual Report
Shareholder Expense Example
|
As a shareholder of a Fund, you incur two types of costs: (1) transaction costs, including redemption fees, exchange fees, and (2) ongoing costs, including management fees and other Fund expenses. This Example is intended to help you understand your ongoing costs (in dollars) of investing in the Funds and to compare these costs with the ongoing costs of investing in other mutual funds.
The Example is based on an investment of $1,000 invested at the beginning of the period and held for the entire period (September 1, 2005 to Febru-ary 28, 2006).
The first line of the table below for each fund provides information about actual account values and actual expenses. You may use the information in this line, together with the amount you invested, to estimate the expenses that you paid over the period. Simply divide your account value by $1,000.00 (for example, an $8,600 account value divided by $1,000.00 = 8.6), then multiply the result by the number in the first line for a fund under the heading entitled “Expenses Paid During Period” to estimate the expenses you paid on your account during this period. A small balance maintenance fee of $12.00 that is charged once a year may apply for certain accounts with a value of less than $2,000. This fee is not included in the table below. If it was, the estimate of expenses you paid during the period would be higher, and your ending account value lower, by this amount.
Hypothetical Example for Comparison Purposes
|
The second line of the table below for each fund provides information about hypothetical account values and hypothetical expenses based on a fund’s actual expense ratio and an assumed rate of return of 5% per year before expenses, which is not the Fund’s actual return. The hypothetical account values and expenses may not be used to estimate the actual ending account balance or expenses you paid for the period. You may use this information to compare the ongoing costs of investing in the Fund and other funds. To do so, compare this 5% hypothetical example with the 5% hypothetical examples that appear in the shareholder reports of the other funds. A small balance maintenance fee of $12.00 that is charged once a year may apply for certain accounts with a value of less than $2,000. This fee is not included in the table below. If it was, the estimate of expenses you paid during the period would be higher, and your ending account value lower, by this amount.
Please note that the expenses shown in the table are meant to highlight your ongoing costs only and do not reflect any transaction costs. Therefore, the second line of the table is useful in comparing ongoing costs only, and will not help you determine the relative total costs of owning different funds. In addition, if these transactional costs were included, your costs would have been higher.
| | | | | | | | | Expenses Paid |
| | | Beginning | | | | Ending | | During Period* |
| | | Account Value | | | | Account Value | | September 1, 2005 to |
| | | September 1, 2005 | | | | February 28, 2006 | | February 28, 2006 |
| Banking Portfolio | | | | | | | | | | |
| Actual | | $ 1,000.00 | | $ | | 1,066.50 | | $ | | 4.82 |
| HypotheticalA | | $ 1,000.00 | | $ | | 1,020.13 | | $ | | 4.71 |
| Brokerage and Investment Management Portfolio | | | | | | | | | | |
| Actual | | $ 1,000.00 | | $ | | 1,285.20 | | $ | | 5.27 |
| HypotheticalA | | $ 1,000.00 | | $ | | 1,020.18 | | $ | | 4.66 |
| Financial Services Portfolio | | | | | | | | | | |
| Actual | | $ 1,000.00 | | $ | | 1,134.80 | | $ | | 5.08 |
| HypotheticalA | | $ 1,000.00 | | $ | | 1,020.03 | | $ | | 4.81 |
| Home Finance Portfolio | | | | | | | | | | |
| Actual | | $ 1,000.00 | | $ | | 1,056.50 | | $ | | 4.90 |
| HypotheticalA | | $ 1,000.00 | | $ | | 1,020.03 | | $ | | 4.81 |
| Insurance Portfolio | | | | | | | | | | |
| Actual | | $ 1,000.00 | | $ | | 1,093.20 | | $ | | 5.29 |
| HypotheticalA | | $ 1,000.00 | | $ | | 1,019.74 | | $ | | 5.11 |
A 5% return per year before expenses
* Expenses are equal to each Fund’s annualized expense ratio (shown in the table below); multiplied by the average account value over the period, multiplied by 181/365 (to reflect the one-half year period).
| | | Annualized |
| | | Expense Ratio |
| Banking Portfolio | | 94% |
| Brokerage and Investment Management Portfolio | | 93% |
| Financial Services Portfolio | | 96% |
| Home Finance Portfolio | | 96% |
| Insurance Portfolio | | 1.02% |
Banking Portfolio
Performance
Average annual total return reflects the change in the value of an investment, assuming reinvestment of the fund’s dividend income and capital gains (the profits earned upon the sale of securities that have grown in value) and assuming a constant rate of performance each year. The $10,000 table and the fund’s returns do not reflect the deduction of taxes that a shareholder would pay on fund distributions or the redemption of fund shares. During periods of reimbursement by Fidelity a fund’s total returns will be greater than it would be had the reimbursement not occurred. How a fund did yesterday is no guarantee of how it will do tomorrow.
| Average Annual Total Returns | | | | | | |
| Periods ended February 28, 2006 | | Past 1 | | Past 5 | | Past 10 |
| | | year | | years | | years |
| Select Banking | | 7.22% | | 7.18% | | 12.05% |
$10,000 Over 10 Years
Let’s say hypothetically that $10,000 was invested in Fidelity® Select Banking Portfolio on February 29, 1996. The chart shows how the value of your investment would have changed, and also shows how the S&P 500® Index performed over the same period.
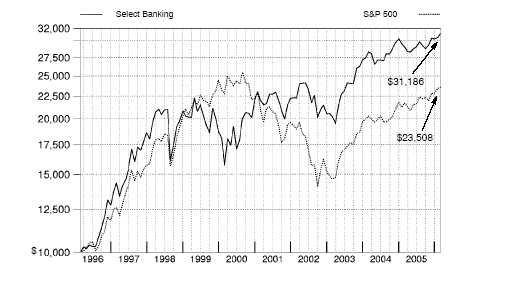
5 Annual Report
Management’s Discussion of Fund Performance
Comments from Ramona Persaud, who became Portfolio Manager of Fidelity® Select Banking Portfolio on February 1, 2006
With the exception of several popular large-cap stock performance measures, most major U.S. equity benchmarks had double-digit returns for the year ending February 28, 2006. For much of the period, market gains were driven largely by the energy sector, although utilities ultimately sneaked into the top spot for the year overall. Financials and telecommunication services also reached double figures, outperforming the 8.40% return of the broader market as measured by the large-cap-oriented Standard & Poor’s 500SM Index. The consumer discretionary segment — home to the weak performing automobile and media industries — was the biggest disappointment. Although the overall return for the S&P 500® beat the small-cap Russell 2000® Index in calendar year 2005 — the first time that’s happened in six years — small-caps stormed back in early 2006, leading to a 16.59% advance during the past 12 months, nearly twice the broader market’s gain. Mid-caps soared even higher, returning 17.67% according to the Russell Midcap® Index. The technology-heavy NASDAQ Composite® Index also fared well, climbing 12.13%, but the Dow Jones Industrial AverageSM, an index of 30 large-cap, blue-chip stocks, managed to rise only 4.52% .
During the past year, the fund returned 7.22%, underperforming the S&P 500 and the 15.23% return of the Goldman Sachs® Financial Services Index. The fund underperformed the Goldman Sachs index mainly because it focuses on banking stocks, which lagged, and due to its underweighting in top performing groups within the sector index, including investment banking and brokerage, life and health insurance, and real estate investment trusts (REITs). Weak stock selection in diversified banks also ate into returns. The fund benefited from underweighting index groups that underperformed, including property and casualty insurance. Several of the main detractors were regional bank stocks, including Puerto Rico-based Popular, Cincinnati-based Fifth Third Bancorp and North Fork Bankcorp, located in New York. The fund’s relative performance also was held back by not owning some of the top performers in the index, including life and health insurance firm Manulife Financial, based in Canada. The fund was helped by not owning property and casualty insurer Berkshire Hathaway, and by its investment in regional bank stock PNC Financial Services Group. An out-of-benchmark position in Turkish Finansbank also contributed.
The views expressed above reflect those of the portfolio manager(s) only through the end of the period as stated on the cover of this report and do not necessarily represent the views of Fidelity or any other person in the Fidelity organization. Any such views are subject to change at any time based upon market or other conditions and Fidelity disclaims any responsibility to update such views. These views may not be relied on as investment advice and, because investment decisions for a Fidelity fund are based on numerous factors, may not be relied on as an indication of trading intent on behalf of any Fidelity fund.
Banking Portfolio
Investment Changes
| Top Ten Stocks as of February 28, 2006 |
| | | % of fund’s | | % of fund’s net assets |
| | | net assets | | 6 months ago |
| Wachovia Corp. | | 6.9 | | 5.6 |
| Wells Fargo & Co. | | 6.0 | | 5.1 |
| Bank of America Corp. | | 5.5 | | 4.4 |
| PNC Financial Services Group, | | | | |
| Inc. | | 4.6 | | 3.4 |
| JPMorgan Chase & Co. | | 4.2 | | 3.8 |
| Bank of New York Co., Inc. | | 4.0 | | 3.5 |
| SunTrust Banks, Inc. | | 4.0 | | 4.0 |
| Citigroup, Inc. | | 3.7 | | 3.5 |
| KeyCorp | | 3.2 | | 2.5 |
| Mellon Financial Corp. | | 3.1 | | 2.8 |
| | | 45.2 | | |
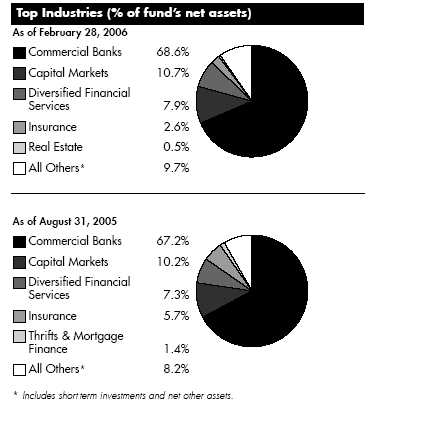
7 Annual Report
| Banking Portfolio | | | | | | |
| Investments February 28, 2006 | | | | |
| Showing Percentage of Net Assets | | | | | | |
| |
| Common Stocks — 90.8% | | | | | | |
| | | | | Shares | | Value (Note 1) |
| |
| CAPITAL MARKETS – 10.7% | | | | | | |
| Asset Management & Custody Banks – 10.4% | | | | | | |
| Bank of New York Co., Inc. | | | | 427,996 | | $ 14,654,583 |
| Investors Financial Services Corp. | | | | 26,900 | | 1,213,459 |
| Mellon Financial Corp. | | | | 311,200 | | 11,231,208 |
| Northern Trust Corp. | | | | 177,700 | | 9,368,344 |
| State Street Corp. | | | | 29,500 | | 1,843,160 |
| | | | | | | 38,310,754 |
| Investment Banking & Brokerage – 0.3% | | | | | | |
| TD Ameritrade Holding Corp. | | | | 45,800 | | 996,608 |
| |
| TOTAL CAPITAL MARKETS | | | | | | 39,307,362 |
| |
| COMMERCIAL BANKS – 68.6% | | | | | | |
| Diversified Banks – 23.5% | | | | | | |
| Banco Bilbao Vizcaya Argentaria SA sponsored ADR | | | | 45,200 | | 918,012 |
| Bank of America Corp. | | | | 437,369 | | 20,053,369 |
| Comerica, Inc. | | | | 53,700 | | 3,078,084 |
| Finansbank AS | | | | 892,340 | | 4,889,534 |
| Kookmin Bank sponsored ADR | | | | 11,500 | | 871,125 |
| U.S. Bancorp, Delaware | | | | 297,000 | | 9,180,270 |
| Wachovia Corp. | | | | 450,092 | | 25,236,658 |
| Wells Fargo & Co. | | | | 342,900 | | 22,014,180 |
| | | | | | | 86,241,232 |
| Regional Banks – 45.1% | | | | | | |
| AmSouth Bancorp. | | | | 185,500 | | 5,147,625 |
| Associated Banc-Corp. | | | | 71,420 | | 2,461,847 |
| Bank of Hawaii Corp | | | | 37,600 | | 2,007,840 |
| BB&T Corp. | | | | 180,842 | | 7,148,684 |
| BOK Financial Corp. | | | | 48,300 | | 2,215,521 |
| Cathay General Bancorp | | | | 25,200 | | 897,876 |
| Center Financial Corp., California | | | | 80,700 | | 1,869,819 |
| City National Corp. | | | | 35,600 | | 2,704,176 |
| Commerce Bancshares, Inc. | | | | 30,768 | | 1,586,090 |
| Compass Bancshares, Inc. | | | | 67,510 | | 3,394,403 |
| East West Bancorp, Inc. | | | | 40,100 | | 1,511,369 |
| Fifth Third Bancorp | | | | 94,200 | | 3,640,830 |
| First Bancorp, Puerto Rico | | | | 58,600 | | 741,876 |
| FirstMerit Corp. | | | | 67,400 | | 1,667,476 |
| Fulton Financial Corp. | | | | 63,315 | | 1,114,344 |
| Hiroshima Bank Ltd. | | | | 300,000 | | 1,804,110 |
| Huntington Bancshares, Inc. | | | | 83,170 | | 2,000,239 |
| KeyCorp | | | | 313,100 | | 11,669,237 |
| M&T Bank Corp. | | | | 64,300 | | 7,227,320 |
| Marshall & Ilsley Corp. | | | | 148,800 | | 6,547,200 |
| Mercantile Bankshares Corp. | | | | 88,450 | | 3,378,790 |
| Nara Bancorp, Inc. | | | | 205,800 | | 3,595,326 |
| National City Corp. | | | | 256,589 | | 8,929,297 |
| Nishi-Nippon City Bank Ltd. | | | | 160,000 | | 817,727 |
| North Fork Bancorp, Inc., New York | | | | 133,178 | | 3,401,366 |
See accompanying notes which are an integral part of the financial statements.
Annual Report 8
| | | Shares | | Value (Note 1) |
| PNC Financial Services Group, Inc. | | 237,900 | | $ 16,736,265 |
| Popular, Inc. | | 199,400 | | 4,073,742 |
| Preferred Bank, Los Angeles California | | 1,300 | | 62,478 |
| Regions Financial Corp. | | 120,600 | | 4,194,468 |
| Signature Bank, New York (a) | | 10,100 | | 327,240 |
| SunTrust Banks, Inc. | | 201,748 | | 14,600,503 |
| SVB Financial Group (a) | | 19,900 | | 1,014,701 |
| Synovus Financial Corp. | | 226,000 | | 6,407,100 |
| TD Banknorth, Inc. | | 178,520 | | 5,485,920 |
| Texas Capital Bancshares, Inc. (a) | | 34,900 | | 753,142 |
| Texas Regional Bancshares, Inc. Class A | | 35,850 | | 1,107,048 |
| The Keiyo Bank Ltd. | | 239,000 | | 1,618,461 |
| Tokyo Tomin Bank Ltd. | | 48,100 | | 2,151,006 |
| UCBH Holdings, Inc. | | 96,300 | | 1,723,770 |
| UnionBanCal Corp. | | 77,834 | | 5,377,551 |
| Valley National Bancorp | | 80,599 | | 1,957,750 |
| Westamerica Bancorp. | | 23,000 | | 1,247,520 |
| Wilmington Trust Corp., Delaware | | 6,800 | | 291,108 |
| Wintrust Financial Corp. | | 34,200 | | 1,801,656 |
| Zions Bancorp | | 87,001 | | 7,179,323 |
| | | | | 165,591,140 |
| |
| TOTAL COMMERCIAL BANKS | | | | 251,832,372 |
| |
| DIVERSIFIED FINANCIAL SERVICES – 7.9% | | | | |
| Other Diversifed Financial Services – 7.9% | | | | |
| Citigroup, Inc. | | 291,300 | | 13,507,581 |
| JPMorgan Chase & Co. | | 379,426 | | 15,609,586 |
| | | | | 29,117,167 |
| |
| INSURANCE – 2.6% | | | | |
| Multi-Line Insurance – 0.7% | | | | |
| American International Group, Inc. | | 13,100 | | 869,316 |
| Hartford Financial Services Group, Inc. | | 11,000 | | 906,180 |
| HCC Insurance Holdings, Inc. | | 27,100 | | 872,349 |
| | | | | 2,647,845 |
| Property & Casualty Insurance – 0.8% | | | | |
| Axis Capital Holdings Ltd. | | 28,600 | | 885,456 |
| The St. Paul Travelers Companies, Inc. | | 20,200 | | 868,196 |
| XL Capital Ltd. Class A | | 13,500 | | 911,925 |
| | | | | 2,665,577 |
| Reinsurance – 1.1% | | | | |
| Endurance Specialty Holdings Ltd. | | 27,200 | | 856,800 |
| Everest Re Group Ltd. | | 1,400 | | 138,656 |
| PartnerRe Ltd. | | 14,600 | | 884,906 |
| Platinum Underwriters Holdings Ltd. | | 71,600 | | 2,192,392 |
| | | | | 4,072,754 |
| |
| TOTAL INSURANCE | | | | 9,386,176 |
See accompanying notes which are an integral part of the financial statements.
|
9
| Banking Portfolio | | | | | | |
| Investments - continued | | | | | | |
| |
| |
| Common Stocks – continued | | | | | | |
| | | | | Shares | | Value (Note 1) |
| |
| REAL ESTATE – 0.5% | | | | | | |
| Real Estate Management & Development – 0.5% | | | | |
| New World Development Co. Ltd. | | | | 617,900 | | $ 987,633 |
| Wharf Holdings Ltd. | | | | 248,300 | | 921,775 |
| | | | | | | 1,909,408 |
| |
| THRIFTS & MORTGAGE FINANCE – 0.5% | | | | | | |
| Thrifts & Mortgage Finance – 0.5% | | | | | | |
| Washington Federal, Inc. | | | | 76,300 | | 1,805,258 |
| TOTAL COMMON STOCKS | | | | | | |
| (Cost $220,206,799) | | | | | | 333,357,743 |
| |
| Money Market Funds — 9.1% | | | | |
| |
| Fidelity Cash Central Fund, 4.57% (b) | | | | | | |
| (Cost $33,345,336) | | | | 33,345,336 | | 33,345,336 |
| |
| TOTAL INVESTMENT PORTFOLIO - 99.9% | | | | | | |
| (Cost $253,552,135) | | | | | | 366,703,079 |
| |
| NET OTHER ASSETS – 0.1% | | | | | | 305,783 |
| NET ASSETS – 100% | | | | | | $ 367,008,862 |
(a) Non-income producing
(b) Affiliated fund that is available only to investment companies and other accounts managed by Fidelity Investments. The rate quoted is the annualized seven-day yield of the fund at period end. A complete unaudited listing of the fund’s holdings as of its most recent quarter end is available upon request.
Information regarding fiscal year to date income earned by the fund from the affiliated Central funds is as follows:
| Fund | | Income earned |
| Fidelity Cash Central Fund | | $ 1,036,332 |
| Fidelity Securities Lending Cash Central Fund | | 20,404 |
| Total | | $ 1,056,736 |
See accompanying notes which are an integral part of the financial statements.
|
| Banking Portfolio | | | | | | | | |
| |
| Financial Statements | | | | | | | | |
| |
| |
| Statement of Assets and Liabilities | | | | | | | | |
| | | | | | | | | February 28, 2006 |
| |
| Assets | | | | | | | | |
| Investment in securities, at value — See accompanying schedule: | | | | | | | | |
| Unaffiliated issuers (cost $220,206,799) | | $ | | 333,357,743 | | | | |
| Affiliated Central Funds (cost $33,345,336) | | | | 33,345,336 | | | | |
| Total Investments (cost $253,552,135) | | | | | | $ | | 366,703,079 |
| Receivable for investments sold | | | | | | | | 200,191 |
| Receivable for fund shares sold | | | | | | | | 255,934 |
| Dividends receivable | | | | | | | | 779,080 |
| Interest receivable | | | | | | | | 111,375 |
| Prepaid expenses | | | | | | | | 1,788 |
| Other affiliated receivables | | | | | | | | 54 |
| Other receivables | | | | | | | | 13,288 |
| Total assets | | | | | | | | 368,064,789 |
| |
| Liabilities | | | | | | | | |
| Payable for investments purchased | | $ | | 175,272 | | | | |
| Payable for fund shares redeemed | | | | 582,675 | | | | |
| Accrued management fee | | | | 170,303 | | | | |
| Transfer agent fee payable | | | | 83,502 | | | | |
| Other affiliated payables | | | | 15,911 | | | | |
| Other payables and accrued expenses | | | | 28,264 | | | | |
| Total liabilities | | | | | | | | 1,055,927 |
| |
| Net Assets | | | | | | $ | | 367,008,862 |
| Net Assets consist of: | | | | | | | | |
| Paid in capital | | | | | | $ | | 237,787,698 |
| Undistributed net investment income | | | | | | | | 3,248,767 |
| Accumulated undistributed net realized gain (loss) on investments and foreign currency transactions | | | | | | | | 12,821,569 |
| Net unrealized appreciation (depreciation) on investments and assets and liabilities in foreign currencies | | | | | | | | 113,150,828 |
| Net Assets, for 9,997,687 shares outstanding | | | | | | $ | | 367,008,862 |
| Net Asset Value, offering price and redemption price per share ($367,008,862 ÷ 9,997,687 shares) | | | | | | $ | | 36.71 |
| |
| Statement of Operations | | | | | | | | |
| | | | | | | | | Year ended February 28, 2006 |
| |
| Investment Income | | | | | | | | |
| Dividends | | | | | | $ | | 11,025,048 |
| Interest | | | | | | | | 152 |
| Income from affiliated Central Funds | | | | | | | | 1,056,736 |
| Total income | | | | | | | | 12,081,936 |
| |
| Expenses | | | | | | | | |
| Management fee | | $ | | 2,325,775 | | | | |
| Transfer agent fees | | | | 1,226,485 | | | | |
| Accounting and security lending fees | | | | | | | | |
| | | | | 204,864 | | | | |
| Independent trustees’ compensation | | | | 1,795 | | | | |
| Custodian fees and expenses | | | | 17,819 | | | | |
| Registration fees | | | | 32,325 | | | | |
| Audit | | | | 36,625 | | | | |
| Legal | | | | 2,469 | | | | |
| Miscellaneous | | | | 4,983 | | | | |
| Total expenses before reductions | | | | 3,853,140 | | | | |
| Expense reductions | | | | (103,938) | | | | 3,749,202 |
| |
| Net investment income (loss) | | | | | | | | 8,332,734 |
Realized and Unrealized Gain (Loss)
Net realized gain (loss) on: | | | | | | | | |
See accompanying notes which are an integral part of the financial statements.
|
11 Annual Report
| Banking Portfolio | | | | |
| Financial Statements - continued | | | | |
| |
| |
| Investment securities: | | | | |
| Unaffiliated issuers | | 39,216,075 | | |
| Foreign currency transactions | | (22,836) | | |
| Total net realized gain (loss) | | | | 39,193,239 |
| Change in net unrealized appreciation (depreciation) on: | | | | |
| Investment securities | | (20,357,474) | | |
| Assets and liabilities in foreign currencies | | (116) | | |
| Total change in net unrealized appreciation (depreciation) | | | | (20,357,590) |
| Net gain (loss) | | | | 18,835,649 |
| Net increase (decrease) in net assets resulting from operations | | | | $ 27,168,383 |
See accompanying notes which are an integral part of the financial statements.
Annual Report 12
| Statement of Changes in Net Assets | | | | | | | | | | | | | | | | | | | | |
| | | | | | | | | | | Year ended | | | | Year ended |
| | | | | | | | | | | February 28, | | | | February 28, |
| | | | | | | | | | | 2006 | | | | 2005 |
| Increase (Decrease) in Net Assets | | | | | | | | | | | | | | | | | | | | |
| Operations | | | | | | | | | | | | | | | | | | | | |
| Net investment income (loss) | | | | | | | | | | $ | | 8,332,734 | | $ | | | | 8,120,739 |
| Net realized gain (loss) | | | | | | | | | | | | 39,193,239 | | | | 51,540,660 |
| Change in net unrealized appreciation (depreciation) | | | | | | | | | | | | (20,357,590) | | | | (46,850,658) |
| Net increase (decrease) in net assets resulting from operations | | | | | | | | | | | | 27,168,383 | | | | 12,810,741 |
| Distributions to shareholders from net investment income | | | | | | | | | | | | (6,336,315) | | | | (6,747,905) |
| Distributions to shareholders from net realized gain | | | | | | | | | | | | (32,980,078) | | | | (40,954,844) |
| Total distributions | | | | | | | | | | | | (39,316,393) | | | | (47,702,749) |
| Share transactions | | | | | | | | | | | | | | | | | | | | |
| Proceeds from sales of shares | | | | | | | | | | | | 85,190,205 | | | | 114,891,007 |
| Reinvestment of distributions | | | | | | | | | | | | 37,286,501 | | | | 45,458,056 |
| Cost of shares redeemed | | | | | | | | | | (218,870,245) | | | | (139,370,221) |
| Net increase (decrease) in net assets resulting from share transactions | | | | | | | | | | (96,393,539) | | | | 20,978,842 |
| Redemption fees | | | | | | | | | | | | | | 41,260 | | | | | | 46,774 |
| Total increase (decrease) in net assets | | | | | | | | | | (108,500,289) | | | | (13,866,392) |
| |
| Net Assets | | | | | | | | | | | | | | | | | | | | |
| Beginning of period | | | | | | | | | | | | 475,509,151 | | | | 489,375,543 |
| End of period (including undistributed net investment income of $3,248,767 and undistributed net investment | | | | | | | | | | | | |
| income of $2,080,311, respectively) | | | | | | | | | | $ | | 367,008,862 | | $ | | 475,509,151 |
| |
| Other Information | | | | | | | | | | | | | | | | | | | | |
| Shares | | | | | | | | | | | | | | | | | | | | |
| Sold | | | | | | | | | | | | 2,286,589 | | | | | | 2,896,208 |
| Issued in reinvestment of distributions | | | | | | | | | | | | 1,042,335 | | | | | | 1,157,708 |
| Redeemed | | | | | | | | | | | | (5,850,883) | | | | (3,528,468) |
| Net increase (decrease) | | | | | | | | | | | | (2,521,959) | | | | | | 525,448 |
| |
| Financial Highlights | | | | | | | | | | | | | | | | | | | | |
| Years ended February 28, | | | | 2006 | | | | 2005 | | 2004E | | | | 2003 | | | | 2002 |
| Selected Per-Share Data | | | | | | | | | | | | | | | | | | | | |
| Net asset value, beginning of period | | $ | | 37.98 | | $ | | 40.80 | | $ 29.86 | | $ | | 33.26 | | $ | | 33.40 |
| Income from Investment Operations | | | | | | | | | | | | | | | | | | | | |
| Net investment income (loss)C | | | | 76 | | | | .67 | | .52 | | | | .50 | | | | .51 |
| Net realized and unrealized gain (loss) | | | | 1.82 | | | | .54 | | 11.36 | | | | (3.57) | | | | (.17) |
| Total from investment operations | | | | 2.58 | | | | 1.21 | | 11.88 | | | | (3.07) | | | | .34 |
| Distributions from net investment income | | | | (.62) | | | | (.57) | | (.48) | | | | (.34) | | | | (.47) |
| Distributions from net realized gain | | | | (3.23) | | | | (3.46) | | (.46) | | | | — | | | | (.02) |
| Total distributions | | | | (3.85) | | | | (4.03) | | (.94) | | | | (.34) | | | | (.49) |
| Redemption fees added to paid in capitalC | | | | —F | | | | —F | | —F | | | | .01 | | | | .01 |
| Net asset value, end of period | | $ | | 36.71 | | $ | | 37.98 | | $ 40.80 | | $ | | 29.86 | | $ | | 33.26 |
| Total ReturnA,B | | | | 7.22% | | | | 2.68% | | 40.08% | | | | (9.24)% | | | | 1.07% |
| Ratios to Average Net AssetsD | | | | | | | | | | | | | | | | | | | | |
| Expenses before reductions | | | | 94% | | | | .95% | | 1.08% | | | | 1.11% | | | | 1.11% |
| Expenses net of fee waivers, if any | | | | 94% | | | | .95% | | 1.08% | | | | 1.11% | | | | 1.11% |
| Expenses net of all reductions | | | | 92% | | | | .94% | | 1.07% | | | | 1.10% | | | | 1.09% |
| Net investment income (loss) | | | | 2.04% | | | | 1.70% | | 1.46% | | | | 1.54% | | | | 1.55% |
| Supplemental Data | | | | | | | | | | | | | | | | | | | | |
| Net assets, end of period (000 omitted) | | $ 367,009 | | $ 475,509 | | $ 489,376 | | $ 383,138 | | $ 473,589 |
| Portfolio turnover rate | | | | 70% | | | | 51% | | 28% | | | | 33% | | | | 41% |
| |
| | | | | |
A Total returns would have been lower had certain expenses not been reduced during the periods shown. B Total returns do not include the effect of the former sales charges. C Calculated based on average shares outstanding during the period. DExpense ratios reflect operating expenses of the fund. Expenses before reductions do not reflect amounts reimbursed by the investment adviser or reductions from brokerage service arrangements or other expense offset arrangements and do not represent the amount paid by the fund during periods when reimbursements or reductions occur. Expenses net of fee waivers reflect expenses after reimbursement by the investment adviser but prior to reductions from brokerage service arrangements or other expense offset arrangements. Expenses net of all reductions represent the net expenses paid by the fund. EFor the year ended February 29. FAmount represents less than $.01 per share.See accompanying notes which are an integral part of the financial statements.
13 Annual Report
Brokerage and Investment Management Portfolio
|
Average annual total return reflects the change in the value of an investment, assuming reinvestment of the fund’s dividend income and capital gains (the profits earned upon the sale of securities that have grown in value) and assuming a constant rate of performance each year. The $10,000 table and the fund’s returns do not reflect the deduction of taxes that a shareholder would pay on fund distributions or the redemption of fund shares. During periods of reimbursement by Fidelity a fund’s total returns will be greater than it would be had the reimbursement not occurred. How a fund did yesterday is no guarantee of how it will do tomorrow.| Average Annual Total Returns | | | | | | |
| Periods ended February 28, 2006 | | Past 1 | | Past 5 | | Past 10 |
| | | year | | years | | years |
| Select Brokerage and Investment Management | | 45.77% | | 12.02% | | 20.00% |
$10,000 Over 10 Years
Let’s say hypothetically that $10,000 was invested in Fidelity Select Brokerage and Investment Management Portfolio on February 29, 1996 The chart shows how the value of your investment would have changed, and also shows how the S&P 500 Index performed over the same period.
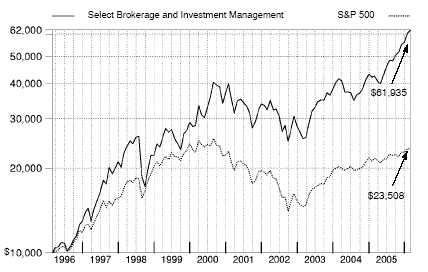
Brokerage and Investment Management Portfolio
|
Management’s Discussion of Fund Performance
Comments from Charles Hebard, who became Portfolio Manager of Fidelity® Select Brokerage and Investment Management Portfolio on March 10, 2006, after the end of the period covered by this report
With the exception of several popular large-cap stock performance measures, most major U.S. equity benchmarks had double-digit returns for the year ending February 28, 2006. For much of the period, market gains were driven largely by the energy sector, although utilities ultimately sneaked into the top spot for the year overall. Financials and telecommunication services also reached double figures, outperforming the 8.40% return of the broader market as measured by the large-cap-oriented Standard & Poor’s 500SM Index. The consumer discretionary segment — home to the weak performing automobile and media industries — was the biggest disappointment. Although the overall return for the S&P 500® beat the small-cap Russell 2000® Index in calendar year 2005 — the first time that’s happened in six years — small-caps stormed back in early 2006, leading to a 16.59% advance during the past 12 months, nearly twice the broader market’s gain. Mid-caps soared even higher, returning 17.67% according to the Russell Midcap® Index. The technology-heavy NASDAQ Composite® Index also fared well, climbing 12.13%, but the Dow Jones Industrial AverageSM, an index of 30 large-cap, blue-chip stocks, managed to rise only 4.52% .
The fund had a total return of 45.77% during the past year, significantly outperforming both the Goldman Sachs® Financial Services Index, which returned 15.23%, and the S&P 500. Brokers and investment managers constituted the best performing group within the financials sector. Solid economic growth, expanding capital markets activity, heavy trading volumes and consolidation within the industry provided a favorable backdrop. In addition, with the help of good stock selection, the fund took advantage of important trends, including the growth of electronic trading. Our strong gains in stocks tied to the securities business were curbed a bit, though, by weak results in consumer finance and a lack of exposure to the real estate industry, a component of the sector index that fared well. The consolidation of trading exchanges and the movement to electronic trading helped propel the performance of both the Nasdaq Stock Market and Archipelago Holdings, which acquired the New York Stock Exchange. The fund’s overweighted position in online brokerages, including Ameritrade — which began trading under TD Ameritrade after acquiring TD Waterhouse during the period —E*TRADE, TradeStation Group and optionsXpress, also helped, as did a large stake in asset manager Legg Mason. Despite the strong overall performance, some holdings disappointed. First Marblehead, which specializes in securitizing student loans, fell after concerns grew about its outlook and the company’s chief executive officer resigned. REFCO, the nation’s largest derivatives broker, declined following a regulatory investigation into a transaction with another company controlled by REFCO’s CEO. The positions in both First Marblehead and REFCO were sold from the fund by period end. American International Group, the fund’s largest holding at the close of the period, struggled because of regulatory investigations, the resignation of its CEO and the restatement of past earnings.
The views expressed above reflect those of the portfolio manager(s) only through the end of the period as stated on the cover of this report and do not necessarily represent the views of Fidelity or any other person in the Fidelity organization. Any such views are subject to change at any time based upon market or other conditions and Fidelity disclaims any responsibility to update such views. These views may not be relied on as investment advice and, because investment decisions for a Fidelity fund are based on numerous factors, may not be relied on as an indication of trading intent on behalf of any Fidelity fund.
15 15 Annual Report
Brokerage and Investment Management Portfolio
Investment Changes
Top Ten Stocks as of February 28, 2006
| | | % of fund’s | | % of fund’s net assets |
| | | net assets | | 6 months ago |
| American International Group, | | | | |
| Inc. | | 9.3 | | 10.1 |
| TD Ameritrade Holding Corp. | | 5.2 | | 3.6 |
| E*TRADE Financial Corp. | | 5.0 | | 5.1 |
| Franklin Resources, Inc. | | 5.0 | | 3.7 |
| Merrill Lynch & Co., Inc. | | 5.0 | | 3.9 |
| UBS AG (NY Shares) | | 4.8 | | 4.7 |
| American Express Co. | | 4.7 | | 5.0 |
| Affiliated Managers Group, Inc. | | 3.9 | | 3.5 |
| T. Rowe Price Group, Inc. | | 3.5 | | 3.1 |
| State Street Corp. | | 3.4 | | 3.1 |
| | | 49.8 | | |
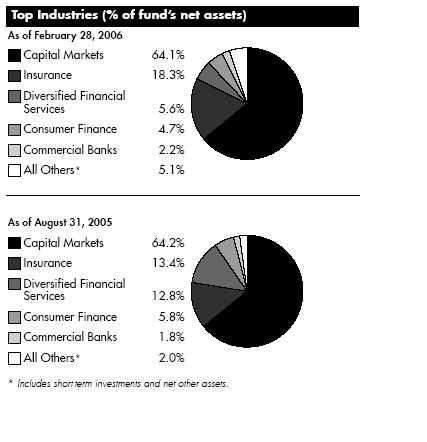
| Brokerage and Investment Management Portfolio | | | | |
| Investments February 28, 2006 | | | | | | |
| Showing Percentage of Net Assets | | | | | | |
| |
| Common Stocks — 96.0% | | | | | | |
| | | | | Shares | | Value (Note 1) |
| |
| CAPITAL MARKETS – 64.1% | | | | | | |
| Asset Management & Custody Banks – 25.0% | | | | | | |
| Affiliated Managers Group, Inc. (a)(d) | | | | 491,900 | | $ 48,417,717 |
| American Capital Strategies Ltd. (d) | | | | 984,000 | | 35,128,800 |
| Ares Capital Corp. | | | | 100,000 | | 1,734,000 |
| Cohen & Steers, Inc. | | | | 50,000 | | 1,123,500 |
| Eaton Vance Corp. (non-vtg.) | | | | 232,100 | | 6,540,578 |
| EFG International | | | | 175,000 | | 4,835,360 |
| Federated Investors, Inc. Class B (non-vtg.) | | | | 301,600 | | 11,729,224 |
| Franklin Resources, Inc. | | | | 602,100 | | 61,823,628 |
| Investors Financial Services Corp. | | | | 205,060 | | 9,250,257 |
| Janus Capital Group, Inc. | | | | 384,500 | | 8,432,085 |
| Julius Baer Holding AG (Bearer) | | | | 73,750 | | 6,340,943 |
| Legg Mason, Inc. | | | | 106,948 | | 13,966,339 |
| Nuveen Investments, Inc. Class A | | | | 356,700 | | 17,182,239 |
| SEI Investments Co. | | | | 1,000 | | 41,790 |
| State Street Corp. | | | | 672,500 | | 42,017,800 |
| T. Rowe Price Group, Inc. | | | | 561,100 | | 43,081,258 |
| U.S. Global Investments, Inc. Class A (a) | | | | 19,404 | | 272,238 |
| | | | | | | 311,917,756 |
| Diversified Capital Markets – 4.8% | | | | | | |
| UBS AG (NY Shares) | | | | 565,200 | | 60,041,196 |
| Investment Banking & Brokerage – 34.3% | | | | | | |
| A.G. Edwards, Inc | | | | 100,000 | | 4,470,000 |
| Bear Stearns Companies, Inc. | | | | 91,300 | | 12,274,372 |
| Charles Schwab Corp. | | | | 678,100 | | 10,992,001 |
| Daiwa Securities Group, Inc. | | | | 573,000 | | 6,833,132 |
| E*TRADE Financial Corp. (a) | | | | 2,440,800 | | 62,435,664 |
| E*TRADE Securities Co. Ltd. (d) | | | | 5,560 | | 12,834,568 |
| GFI Group, Inc. (a) | | | | 287,200 | | 17,249,232 |
| Greenhill & Co., Inc. | | | | 77,800 | | 5,080,340 |
| IL&Fs Investsmart Ltd. | | | | 931,430 | | 4,936,421 |
| Indiabulls Financial Services Ltd. | | | | 2,772,896 | | 11,721,005 |
| Indiabulls Financial Services Ltd. GDR (e) | | | | 33,573 | | 141,545 |
| Jefferies Group, Inc. | | | | 249,800 | | 14,248,592 |
| Knight Capital Group, Inc. Class A (a) | | | | 450,000 | | 5,665,500 |
| Lazard Ltd. Class A | | | | 323,000 | | 12,429,040 |
| MCF Corp. (a) | | | | 3,574,800 | | 3,860,784 |
| Merrill Lynch & Co., Inc. | | | | 800,450 | | 61,802,745 |
| Morgan Stanley | | | | 500,000 | | 29,830,000 |
| Nikko Cordial Corp. | | | | 419,500 | | 6,653,479 |
| Nomura Holdings, Inc. sponsored ADR | | | | 521,200 | | 10,053,948 |
| optionsXpress Holdings, Inc. | | | | 1,084,339 | | 33,375,954 |
| Piper Jaffray Companies (a) | | | | 19,400 | | 963,792 |
| Stifel Financial Corp. (a) | | | | 28,200 | | 1,080,906 |
| TD Ameritrade Holding Corp. | | | | 2,985,149 | | 64,956,842 |
| Technology Investment Capital Corp. | | | | 219,151 | | 3,342,053 |
See accompanying notes which are an integral part of the financial statements.
|
17 Annual Report
17
| Brokerage and Investment Management Portfolio | | | | |
| Investments - continued | | | | |
| |
| |
| |
| | | Shares | | Value (Note 1) |
| Thomas Weisel Partners Group, Inc. | | 1,700 | | $ 36,329 |
| TradeStation Group, Inc. (a) | | 1,876,239 | | 29,794,675 |
| | | | | 427,062,919 |
| |
| TOTAL CAPITAL MARKETS | | | | 799,021,871 |
| |
| COMMERCIAL BANKS – 2.2% | | | | |
| Diversified Banks – 2.2% | | | | |
| HDFC Bank Ltd. | | 170,000 | | 2,830,390 |
| HDFC Bank Ltd. sponsored ADR | | 114,900 | | 6,111,531 |
| KBC Groupe SA | | 35,000 | | 3,654,979 |
| Kookmin Bank sponsored ADR | | 180,000 | | 13,635,000 |
| State Bank of India | | 27,505 | | 603,277 |
| | | | | 26,835,177 |
| |
| CONSUMER FINANCE – 4.7% | | | | |
| Consumer Finance – 4.7% | | | | |
| American Express Co. | | 1,089,900 | | 58,723,812 |
| DIVERSIFIED CONSUMER SERVICES – 0.7% | | | | |
| Education Services – 0.3% | | | | |
| INVESTools, Inc. (a) | | 425,400 | | 3,296,850 |
| Specialized Consumer Services – 0.4% | | | | |
| Jackson Hewitt Tax Service, Inc. | | 191,800 | | 5,447,120 |
| |
| TOTAL DIVERSIFIED CONSUMER SERVICES | | | | 8,743,970 |
| |
| DIVERSIFIED FINANCIAL SERVICES – 5.6% | | | | |
| Specialized Finance – 5.6% | | | | |
| Deutsche Boerse AG | | 51,000 | | 6,418,958 |
| Hong Kong Exchanges & Clearing Ltd. | | 500,000 | | 2,568,350 |
| IntercontinentalExchange, Inc. | | 309,812 | | 16,962,207 |
| OMX AB | | 125,000 | | 2,132,755 |
| Osaka Securities Exchange Co. Ltd. (a) | | 372 | | 3,327,127 |
| Primus Guaranty Ltd. (a) | | 202,900 | | 2,536,250 |
| Singapore Exchange Ltd. | | 1,778,000 | | 4,186,108 |
| The Nasdaq Stock Market, Inc. (a) | | 768,700 | | 31,140,037 |
| | | | | 69,271,792 |
| |
| INSURANCE – 18.3% | | | | |
| Insurance Brokers – 2.6% | | | | |
| Marsh & McLennan Companies, Inc. | | 728,600 | | 22,521,026 |
| National Financial Partners Corp. | | 166,600 | | 9,804,410 |
| | | | | 32,325,436 |
| Life & Health Insurance – 3.0% | | | | |
| Phoenix Companies, Inc. | | 50,000 | | 717,500 |
| Prudential Financial, Inc. | | 471,700 | | 36,339,768 |
| | | | | 37,057,268 |
| Multi-Line Insurance – 10.8% | | | | |
| American International Group, Inc. | | 1,741,600 | | 115,572,576 |
| Assurant, Inc. | | 250,000 | | 11,350,000 |
| Hartford Financial Services Group, Inc. | | 100,000 | | 8,238,000 |
| | | | | 135,160,576 |
See accompanying notes which are an integral part of the financial statements.
Annual Report 18
| Common Stocks – continued | | | | |
| | | Shares | | Value (Note 1) |
| |
| INSURANCE – CONTINUED | | | | |
| Property & Casualty Insurance – 0.9% | | | | |
| Aspen Insurance Holdings Ltd. | | 410,000 | | $ 9,516,100 |
| Republic Companies Group, Inc. | | 32,600 | | 560,068 |
| XL Capital Ltd. Class A | | 13,800 | | 932,190 |
| | | | | 11,008,358 |
| Reinsurance – 1.0% | | | | |
| Endurance Specialty Holdings Ltd. | | 310,000 | | 9,765,000 |
| PartnerRe Ltd. | | 55,100 | | 3,339,611 |
| | | | | 13,104,611 |
| |
| TOTAL INSURANCE | | | | 228,656,249 |
| |
| REAL ESTATE – 0.3% | | | | |
| Real Estate Investment Trusts – 0.3% | | | | |
| KKR Financial Corp. | | 153,700 | | 3,515,119 |
| THRIFTS & MORTGAGE FINANCE – 0.1% | | | | |
| Thrifts & Mortgage Finance – 0.1% | | | | |
| NetBank, Inc. | | 173,800 | | 1,294,810 |
| TOTAL COMMON STOCKS | | | | |
| (Cost $942,285,011) | | 1,196,062,800 |
| |
| Money Market Funds — 10.0% | | | | |
| | | Shares | | Value (Note 1) |
| Fidelity Cash Central Fund, 4.57% (b) | | 73,476,811 | | $73,476,811 |
| Fidelity Securities Lending Cash Central Fund, 4.58% (b)(c) | | 50,956,411 | | 50,956,411 |
| TOTAL MONEY MARKET FUNDS | | | | |
| (Cost $124,433,222) | | | | 124,433,222 |
| |
| TOTAL INVESTMENT PORTFOLIO - 106.0% | | | | |
| (Cost $1,066,718,233) | | 1,320,496,022 |
| |
| NET OTHER ASSETS – (6.0)% | | | | (74,198,077) |
| NET ASSETS – 100% | | $1,246,297,945 |
| |
| Legend | | | | |
(a) Non-income producing
(b) Affiliated fund that is available only to investment companies and other accounts managed by Fidelity Investments. The rate quoted is the annualized seven-day yield of the fund at period end. A complete unaudited listing of the fund’s holdings as of its most recent quarter end is available upon request.
(c) Investment made with cash collateral received from securities on loan. (d) Security or a portion of the security is on loan at period end.
(e) Security exempt from registration under Rule 144A of the Securities Act of 1933. These securities may be resold in transactions exempt from registration, normally to qualified institutional buyers. At the period end, the value of these securities amounted to $141,545 or 0.0% of net assets.
Information regarding fiscal year to date income earned by the fund from the affiliated Central funds is as follows:
| Fund | | Income earned |
| Fidelity Cash Central Fund | | $ 1,212,656 |
19
See accompanying notes which are an integral part of the financial statements.
19 Annual Report
| Brokerage and Investment Management Portfolio | | |
| Investments - continued | | |
| |
| |
| Fidelity Securities Lending Cash Central Fund | | 340,618 |
| Total | | $ 1,553,274 |
| |
| Other Information | | |
| Distribution of investments by country of issue, as a percentage of total net assets, is as follows: | | |
| |
| United States of America | | 83.5% |
| Switzerland | | 5.7% |
| Japan | | 3.1% |
| Bermuda | | 3.0% |
| India | | 2.1% |
| Korea (South) | | 1.1% |
| Others (individually less than 1%) | | 1.5% |
| | | 100.0% |
See accompanying notes which are an integral part of the financial statements.
Annual Report 20
| Brokerage and Investment Management Portfolio | | | | | | | | |
| |
| Financial Statements | | | | | | | | |
| |
| |
| Statement of Assets and Liabilities | | | | | | | | |
| | | | | | | | | February 28, 2006 |
| |
| Assets | | | | | | | | |
| Investment in securities, at value (including securities loaned of $48,716,824) — See accompanying schedule: | | | | | | | | |
| Unaffiliated issuers (cost $942,285,011) | | $ 1,196,062,800 | | | | |
| Affiliated Central Funds (cost $124,433,222) | | | | 124,433,222 | | | | |
| Total Investments (cost $1,066,718,233) | | | | | | $1,320,496,022 |
| Receivable for investments sold | | | | | | | | 14,066,666 |
| Receivable for fund shares sold | | | | | | | | 12,901,104 |
| Dividends receivable | | | | | | | | 1,055,981 |
| Interest receivable | | | | | | | | 177,710 |
| Prepaid expenses | | | | | | | | 1,994 |
| Other affiliated receivables | | | | | | | | 355 |
| Other receivables | | | | | | | | 39,208 |
| Total assets | | | | | | | | 1,348,739,040 |
| |
| Liabilities | | | | | | | | |
| Payable for investments purchased | | $ | | 49,339,039 | | | | |
| Payable for fund shares redeemed | | | | 1,120,221 | | | | |
| Accrued management fee | | | | 556,291 | | | | |
| Other affiliated payables | | | | 270,850 | | | | |
| Other payables and accrued expenses | | | | 198,283 | | | | |
| Collateral on securities loaned, at value | | | | 50,956,411 | | | | |
| Total liabilities | | | | | | | | 102,441,095 |
| |
| Net Assets | | | | | | $ 1,246,297,945 |
| Net Assets consist of: | | | | | | | | |
| Paid in capital | | | | | | $ | | 936,693,250 |
| Undistributed net investment income | | | | | | | | 7,022,564 |
| Accumulated undistributed net realized gain (loss) on investments and foreign currency transactions | | | | | | | | 48,953,662 |
| Net unrealized appreciation (depreciation) on investments and assets and liabilities in foreign currencies | | | | | | | | 253,628,469 |
| Net Assets, for 16,373,261 shares outstanding | | | | | | $ 1,246,297,945 |
| |
| Net Asset Value, offering price and redemption price per share ($1,246,297,945 ÷ 16,373,261 shares) | | | | | | $ | | 76.12 |
| |
| Statement of Operations | | | | | | | | |
| | | | | | | | | Year ended February 28, 2006 |
| |
| Investment Income | | | | | | | | |
| Dividends | | | | | | $ | | 8,337,805 |
| Special dividends | | | | | | | | 5,740,521 |
| Interest | | | | | | | | 735 |
| Income from affiliated Central Funds | | | | | | | | 1,553,274 |
| Total income | | | | | | | | 15,632,335 |
| |
| Expenses | | | | | | | | |
| Management fee | | $ | | 3,742,983 | | | | |
| Transfer agent fees | | | | 1,874,094 | | | | |
| Accounting and security lending fees | | | | | | | | |
| | | | | 305,433 | | | | |
| Independent trustees’ compensation | | | | 2,487 | | | | |
| Custodian fees and expenses | | | | 61,716 | | | | |
| Registration fees | | | | 134,789 | | | | |
| Audit | | | | 40,112 | | | | |
| Legal | | | | 2,943 | | | | |
| Miscellaneous | | | | 5,871 | | | | |
| Total expenses before reductions | | | | 6,170,428 | | | | |
| Expense reductions | | | | (358,794) | | | | 5,811,634 |
| |
| Net investment income (loss) | | | | | | | | 9,820,701 |
| |
| |
| See accompanying notes which are an integral part of the financial statements. | | | | | | | | |
21 Annual Report
| Brokerage and Investment Management Portfolio | | | | |
| Financial Statements - continued | | | | |
| |
| |
| Realized and Unrealized Gain (Loss) | | | | |
| Net realized gain (loss) on: | | | | |
| Investment securities: | | | | |
| Unaffiliated issuers (net of foreign taxes of $265,132) | | 103,295,401 | | |
| Foreign currency transactions | | 13,897 | | |
| Total net realized gain (loss) | | | | 103,309,298 |
| Change in net unrealized appreciation (depreciation) on: | | | | |
| Investment securities (net of decrease in deferred foreign taxes of $221,350) | | 153,342,251 | | |
| Assets and liabilities in foreign currencies | | (1,134) | | |
| Total change in net unrealized appreciation (depreciation) | | | | 153,341,117 |
| Net gain (loss) | | | | 256,650,415 |
| Net increase (decrease) in net assets resulting from operations | | | | $266,471,116 |
See accompanying notes which are an integral part of the financial statements.
Annual Report 22
| Statement of Changes in Net Assets | | | | | | | | | | | | | | | | | | | | |
| | | | | | | | | | | | | Year ended | | | | Year ended |
| | | | | | | | | | | | | February 28, | | | | February 28, |
| | | | | | | | | | | | | 2006 | | | | 2005 |
| Increase (Decrease) in Net Assets | | | | | | | | | | | | | | | | | | | | |
| Operations | | | | | | | | | | | | | | | | | | | | |
| Net investment income (loss) | | | | | | | | | | $ | | 9,820,701 | | $ | | | | 1,584,026 |
| Net realized gain (loss) | | | | | | | | | | | | 103,309,298 | | | | 33,154,581 |
| Change in net unrealized appreciation (depreciation) | | | | | | | | | | | | 153,341,117 | | | | (33,842,057) |
| Net increase (decrease) in net assets resulting from operations | | | | | | | | | | | | 266,471,116 | | | | | | 896,550 |
| Distributions to shareholders from net investment income | | | | | | | | | | | | (2,635,364) | | | | (1,897,672) |
| Distributions to shareholders from net realized gain | | | | | | | | | | | | (49,077,063) | | | | | | — |
| Total distributions | | | | | | | | | | | | (51,712,427) | | | | (1,897,672) |
| Share transactions | | | | | | | | | | | | | | | | | | | | |
| Proceeds from sales of shares | | | | | | | | | | | | 905,653,225 | | | | 155,320,545 |
| Reinvestment of distributions | | | | | | | | | | | | 49,399,557 | | | | | | 1,797,563 |
| Cost of shares redeemed | | | | | | | | | | (338,928,303) | | | | (201,538,178) |
| Net increase (decrease) in net assets resulting from share transactions | | | | | | | | | | 616,124,479 | | | | (44,420,070) |
| Redemption fees | | | | | | | | | | | | 178,219 | | | | | | 83,829 |
| Total increase (decrease) in net assets | | | | | | | | | | | | 831,061,387 | | | | (45,337,363) |
| |
| Net Assets | | | | | | | | | | | | | | | | | | | | |
| Beginning of period | | | | | | | | | | | | 415,236,558 | | | | 460,573,921 |
| End of period (including undistributed net investment income of $7,022,564 and undistributed net investment | | | | | | | | | | | | |
| income of $74,919, respectively) | | | | | | | | | | $ 1,246,297,945 | | $ | | 415,236,558 |
| |
| Other Information | | | | | | | | | | | | | | | | | | | | |
| Shares | | | | | | | | | | | | | | | | | | | | |
| Sold | | | | | | | | | | | | 13,298,513 | | | | | | 2,968,378 |
| Issued in reinvestment of distributions | | | | | | | | | | | | 708,725 | | | | | | 32,811 |
| Redeemed | | | | | | | | | | | | (5,190,450) | | | | (3,953,706) |
| Net increase (decrease) | | | | | | | | | | | | 8,816,788 | | | | | | (952,517) |
| |
| Financial Highlights | | | | | | | | | | | | | | | | | | | | |
| Years ended February 28, | | | | 2006 | | | | 2005 | | 2004G | | | | 2003 | | | | | | 2002 |
| Selected Per-Share Data | | | | | | | | | | | | | | | | | | | | |
| Net asset value, beginning of period | | $ | | 54.95 | | $ | | 54.13 | | $ 33.22 | | $ | | 42.32 | | | | $ | | 50.10 |
| Income from Investment Operations | | | | | | | | | | | | | | | | | | | | |
| Net investment income (loss)C | | | | 98D | | | | .20 | | .17 | | | | .30 | | | | | | .04 |
| Net realized and unrealized gain (loss) | | | | 23.81 | | | | .85E | | 20.88 | | | | (9.19) | | | | | | (4.31) |
| Total from investment operations | | | | 24.79 | | | | 1.05 | | 21.05 | | | | (8.89) | | | | | | (4.27) |
| Distributions from net investment income | | | | (.19) | | | | (.24) | | (.16) | | | | (.23) | | | | | | (.12) |
| Distributions from net realized gain | | | | (3.45) | | | | — | | — | | | | — | | | | | | (3.41) |
| Total distributions | | | | (3.64) | | | | (.24) | | (.16) | | | | (.23) | | | | | | (3.53) |
| Redemption fees added to paid in capitalC | | | | 02 | | | | .01 | | .02 | | | | .02 | | | | | | .02 |
| Net asset value, end of period | | $ | | 76.12 | | $ | | 54.95 | | $ 54.13 | | $ | | 33.22 | | | | $ | | 42.32 |
| Total ReturnA,B | | | | 45.77% | | | | 1.96% | | 63.56% | | | | (21.02)% | | | | | | (8.13)% |
| Ratios to Average Net AssetsF | | | | | | | | | | | | | | | | | | | | |
| Expenses before reductions | | | | 95% | | | | .98% | | 1.12% | | | | 1.20% | | | | | | 1.15% |
| Expenses net of fee waivers, if any | | | | 95% | | | | .98% | | 1.12% | | | | 1.20% | | | | | | 1.15% |
| Expenses net of all reductions | | | | 89% | | | | .94% | | 1.10% | | | | 1.16% | | | | | | 1.11% |
| Net investment income (loss) | | | | 1.51%D | | | | .40% | | .39% | | | | .78% | | | | | | .10% |
| Supplemental Data | | | | | | | | | | | | | | | | | | | | |
| Net assets, end of period (000 omitted) | | $ 1,246,298 | | $ 415,237 | | $ 460,574 | | $ | | 281,885 | | | | $ 425,746 |
| Portfolio turnover rate | | | | 112% | | | | 98% | | 64% | | | | 64% | | | | | | 74% |
| ATotal returns would have been lower had certain expenses not been reduced during the periods shown.BTotal returns do not include the effect of the former sales charges. CCalculated based on average shares outstanding during the period. DInvestment income per share reflects a special dividend which amounted to $.58 per share. Excluding the special dividend, the ratio of net investment income (loss) to average net assets would have been .63%. The amount shown for a share outstanding does not correspond with the aggregate net gain (loss) on investments for the period due to the timing of sales and repurchases of shares in relation to fluctuating market values of the investments of the fund. FExpense ratios reflect operating expenses of the fund. Expenses before reductions do not reflect amounts reimbursed by the investment adviser or reductions from brokerage service arrangements or other expense offset arrangements and do not represent the amount paid by the fund during periods when reimbursements or reductions occur. Expenses net of fee waivers reflect expenses after reimbursement by the investment adviser but prior to reductions from brokerage service arrangements or other expense offset arrangements. Expenses net of all reductions represent the net expenses paid by the fund. GFor the year ended February 29. |
See accompanying notes which are an integral part of the financial statements.
23
Financial Services Portfolio
Performance
|
Average annual total return reflects the change in the value of an investment, assuming reinvestment of the fund’s dividend income and capital gains (the profits earned upon the sale of securities that have grown in value) and assuming a constant rate of performance each year. The $10,000 table and the fund’s returns do not reflect the deduction of taxes that a shareholder would pay on fund distributions or the redemption of fund shares. During periods of reimbursement by Fidelity a fund’s total returns will be greater than it would be had the reimbursement not occurred. How a fund did yesterday is no guarantee of how it will do tomorrow.
| Average Annual Total Returns | | | | | | |
| Periods ended February 28, 2006 | | Past 1 | | Past 5 | | Past 10 |
| | | year | | years | | years |
| Select Financial Services | | 14.51% | | 7.05% | | 13.24% |
$10,000 Over 10 Years
Let’s say hypothetically that $10,000 was invested in Fidelity Select Financial Services Portfolio on February 29, 1996. The chart shows how the value of your investment would have changed, and also shows how the S&P 500 Index performed over the same period.
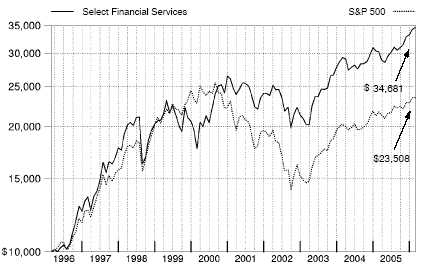
Financial Services Portfolio
|
Management’s Discussion of Fund Performance
Comments from Charles Hebard, Portfolio Manager of Fidelity® Select Financial Services Portfolio
With the exception of several popular large-cap stock performance measures, most major U.S. equity benchmarks had double-digit returns for the year ending February 28, 2006. For much of the period, market gains were driven largely by the energy sector, although utilities ultimately sneaked into the top spot for the year overall. Financials and telecommunication services also reached double figures, outperforming the 8.40% return of the broader market as measured by the large-cap-oriented Standard & Poor’s 500SM Index. The consumer discretionary segment — home to the weak performing automobile and media industries — was the biggest disappointment. Although the overall return for the S&P 500® beat the small-cap Russell 2000® Index in calendar year 2005 — the first time that’s happened in six years — small-caps stormed back in early 2006, leading to a 16.59% advance during the past 12 months, nearly twice the broader market’s gain. Mid-caps soared even higher, returning 17.67% according to the Russell Midcap® Index. The technology-heavy NASDAQ Composite® Index also fared well, climbing 12.13%, but the Dow Jones Industrial AverageSM, an index of 30 large-cap, blue-chip stocks, managed to rise only 4.52% .
During the past year, the fund had a total return of 14.51%, modestly trailing the Goldman Sachs® Financial Services Index, which returned 15.23%, while outdistancing the S&P 500. The fund trailed the Goldman Sachs index primarily because of weak performance by some consumer finance holdings and an overweighting in the reinsurance industry, where several companies were hit by unprecedented hurricane-related losses. The fund’s overweighted position in securities brokers and investment banks, as well as stock selection within that industry, supported performance, as the group benefited from unexpectedly high trading activity and investment banking fees. Holdings in online brokerages E*TRADE, TradeStation Group and Ameritrade — which began trading under TD Ameritrade after acquiring TD Waterhouse during the period — all were major contributors. Another excellent performer was Westcorp, a California-based company specializing in banking and automobile lending, whose stock gained following the announcement that it would be acquired by Wachovia Bank. On the downside, the heavy losses following the onslaughts of Hurricanes Katrina and Rita on the Gulf Coast hurt companies writing property reinsurance policies, among them Endurance Specialty Holdings, Montpelier Re Holdings and Aspen Insurance Holdings. The position in Montpelier Re was sold. American International Group, the fund’s largest holding at period end, had a positive return but lagged the Goldman Sachs index because of the market’s reaction to regulatory investigations into its reinsurance transactions. These investigations resulted in the forced resignation of the company’s long-time CEO and the restatement of past earnings.
The views expressed above reflect those of the portfolio manager(s) only through the end of the period as stated on the cover of this report and do not necessarily represent the views of Fidelity or any other person in the Fidelity organization. Any such views are subject to change at any time based upon market or other conditions and Fidelity disclaims any responsibility to update such views. These views may not be relied on as investment advice and, because investment decisions for a Fidelity fund are based on numerous factors, may not be relied on as an indication of trading intent on behalf of any Fidelity fund.
25 25 Annual Report
Financial Services Portfolio
Investment Changes
Top Ten Stocks as of February 28, 2006
| | | % of fund’s | | % of fund’s net assets |
| | | net assets | | 6 months ago |
| American International Group, | | | | |
| Inc. | | 8.1 | | 9.1 |
| Bank of America Corp. | | 5.7 | | 5.9 |
| JPMorgan Chase & Co. | | 5.1 | | 4.8 |
| Merrill Lynch & Co., Inc. | | 3.6 | | 4.5 |
| Wachovia Corp. | | 3.5 | | 3.1 |
| Wells Fargo & Co. | | 3.4 | | 4.6 |
| ACE Ltd. | | 2.7 | | 2.0 |
| American Express Co. | | 2.6 | | 4.4 |
| Fannie Mae | | 2.2 | | 1.7 |
| Endurance Specialty Holdings Ltd. | | 2.0 | | 1.4 |
| | | 38.9 | | |
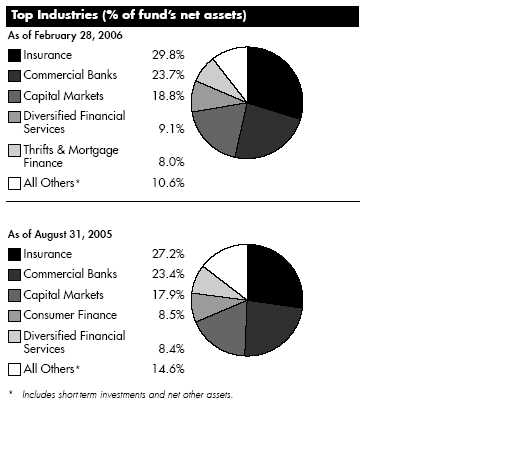
| Financial Services Portfolio | | | | | | |
| Investments February 28, 2006 | | | | |
| Showing Percentage of Net Assets | | | | | | |
| |
| Common Stocks — 99.1% | | | | | | |
| | | | | Shares | | Value (Note 1) |
| |
| CAPITAL MARKETS – 18.8% | | | | | | |
| Asset Management & Custody Banks – 5.9% | | | | | | |
| Affiliated Managers Group, Inc. (a) | | | | 12,700 | | $ 1,250,061 |
| American Capital Strategies Ltd. | | | | 65,000 | | 2,320,500 |
| Ameriprise Financial, Inc. | | | | 47,140 | | 2,143,927 |
| Bank of New York Co., Inc. | | | | 53,736 | | 1,839,921 |
| Federated Investors, Inc. Class B (non-vtg.) | | | | 16,750 | | 651,408 |
| Franklin Resources, Inc. | | | | 45,500 | | 4,671,940 |
| Investors Financial Services Corp. | | | | 95,200 | | 4,294,472 |
| Legg Mason, Inc. | | | | 15,200 | | 1,984,968 |
| Northern Trust Corp. | | | | 46,600 | | 2,456,752 |
| Nuveen Investments, Inc. Class A | | | | 29,300 | | 1,411,381 |
| State Street Corp. | | | | 96,300 | | 6,016,824 |
| | | | | | | 29,042,154 |
| Diversified Capital Markets – 1.7% | | | | | | |
| Deutsche Bank AG (NY Shares) | | | | 6,200 | | 686,650 |
| UBS AG (NY Shares) | | | | 70,300 | | 7,467,969 |
| | | | | | | 8,154,619 |
| Investment Banking & Brokerage – 11.2% | | | | | | |
| Bear Stearns Companies, Inc. | | | | 15,700 | | 2,110,708 |
| Charles Schwab Corp. | | | | 116,300 | | 1,885,223 |
| Daiwa Securities Group, Inc. | | | | 74,000 | | 882,464 |
| E*TRADE Financial Corp. (a) | | | | 353,600 | | 9,045,088 |
| Goldman Sachs Group, Inc. | | | | 47,900 | | 6,767,791 |
| Indiabulls Financial Services Ltd. | | | | 328,346 | | 1,387,915 |
| Lazard Ltd. Class A | | | | 41,000 | | 1,577,680 |
| Lehman Brothers Holdings, Inc. | | | | 15,600 | | 2,276,820 |
| MCF Corp. (a) | | | | 443,500 | | 478,980 |
| Merrill Lynch & Co., Inc. | | | | 225,700 | | 17,426,297 |
| Morgan Stanley | | | | 76,200 | | 4,546,092 |
| Nikko Cordial Corp. | | | | 55,500 | | 880,258 |
| Nomura Holdings, Inc. | | | | 58,600 | | 1,130,394 |
| TD Ameritrade Holding Corp. | | | | 65,965 | | 1,435,398 |
| Technology Investment Capital Corp. | | | | 65,700 | | 1,001,925 |
| TradeStation Group, Inc. (a) | | | | 138,947 | | 2,206,478 |
| | | | | | | 55,039,511 |
| |
| TOTAL CAPITAL MARKETS | | | | | | 92,236,284 |
| |
| COMMERCIAL BANKS – 23.7% | | | | | | |
| Diversified Banks – 19.6% | | | | | | |
| ABN-AMRO Holding NV sponsored ADR | | | | 48,500 | | 1,412,320 |
| Banco Popolare di Verona e Novara | | | | 117,800 | | 2,826,843 |
| Bangkok Bank Ltd. PCL (For. Reg.) | | | | 400,200 | | 1,299,550 |
| Bank of America Corp. | | | | 607,331 | | 27,846,126 |
| Bank of Montreal, Quebec | | | | 84,100 | | 5,105,292 |
| Deutsche Postbank AG (d) | | | | 14,400 | | 1,018,473 |
| HDFC Bank Ltd. sponsored ADR | | | | 45,400 | | 2,414,826 |
| |
| |
| | | | | Shares | | Value (Note 1) |
| ICICI Bank Ltd. | | | | 104,030 | | $ 1,486,566 |
| Korea Exchange Bank (a) | | | | 115,930 | | 1,656,450 |
| See accompanying notes which are an integral part of the financial statements. | | | | |
27
27 Annual Report
| Financial Services Portfolio | | | | |
| Investments - continued | | | | |
| |
| |
| Standard Chartered PLC (United Kingdom) | | 150,500 | | 3,933,594 |
| State Bank of India | | 83,035 | | 1,821,238 |
| Toronto-Dominion Bank | | 56,600 | | 3,258,056 |
| U.S. Bancorp, Delaware | | 253,700 | | 7,841,867 |
| Wachovia Corp. | | 307,659 | | 17,250,440 |
| Wells Fargo & Co. | | 260,150 | | 16,701,630 |
| | | | | 95,873,271 |
| Regional Banks – 4.1% | | | | |
| Cathay General Bancorp | | 71,843 | | 2,559,766 |
| Center Financial Corp., California | | 66,000 | | 1,529,220 |
| City National Corp. | | 11,600 | | 881,136 |
| East West Bancorp, Inc. | | 12,523 | | 471,992 |
| Higashi-Nippon Bank Ltd. | | 131,600 | | 683,790 |
| Hokuhoku Financial Group, Inc. | | 183,000 | | 787,190 |
| Kansai Urban Banking Corp. | | 175,000 | | 733,399 |
| Kyushu-Shinwa Holdings, Inc. (a)(d) | | 361,000 | | 830,249 |
| M&T Bank Corp. | | 9,800 | | 1,101,520 |
| Nara Bancorp, Inc. | | 17,507 | | 305,847 |
| Nishi-Nippon City Bank Ltd. | | 99,000 | | 505,969 |
| North Fork Bancorp, Inc., New York | | 43,632 | | 1,114,361 |
| SVB Financial Group (a) | | 58,400 | | 2,977,816 |
| The Keiyo Bank Ltd. | | 106,000 | | 717,811 |
| UCBH Holdings, Inc. | | 55,300 | | 989,870 |
| UnionBanCal Corp. | | 27,600 | | 1,906,884 |
| Westcorp | | 29,600 | | 2,126,760 |
| | | | | 20,223,580 |
| |
| TOTAL COMMERCIAL BANKS | | | | 116,096,851 |
| |
| CONSUMER FINANCE – 4.5% | | | | |
| Consumer Finance – 4.5% | | | | |
| American Express Co. | | 235,600 | | 12,694,128 |
| Capital One Financial Corp. (d) | | 36,400 | | 3,188,640 |
| Dollar Financial Corp. (a) | | 177,279 | | 2,508,498 |
| SLM Corp. | | 63,500 | | 3,582,035 |
| | | | | 21,973,301 |
| |
| DIVERSIFIED CONSUMER SERVICES – 0.2% | | | | |
| Specialized Consumer Services – 0.2% | | | | |
| Jackson Hewitt Tax Service, Inc. | | 39,600 | | 1,124,640 |
| DIVERSIFIED FINANCIAL SERVICES – 9.1% | | | | |
| Other Diversifed Financial Services – 6.8% | | | | |
| Citigroup, Inc. | | 160,234 | | 7,430,051 |
| ING Groep NV sponsored ADR | | 25,100 | | 943,509 |
| JPMorgan Chase & Co. | | 608,245 | | 25,023,199 |
| | | | | 33,396,759 |
| Specialized Finance – 2.3% | | | | |
| Asset Acceptance Capital Corp. (a) | | 62,638 | | 1,252,134 |
| CIT Group, Inc. | | 59,300 | | 3,188,561 |
| IntercontinentalExchange, Inc. | | 56,900 | | 3,115,275 |
See accompanying notes which are an integral part of the financial statements.
Annual Report 28
| Common Stocks – continued | | | | |
| | | Shares | | Value (Note |
| |
| DIVERSIFIED FINANCIAL SERVICES – CONTINUED | | | | |
| Specialized Finance – continued | | | | |
| Marlin Business Services Corp. (a) | | 44,234 | | $ 1,017,382 |
| NETeller PLC (a) | | 114,400 | | 1,509,074 |
| Singapore Exchange Ltd. | | 576,000 | | 1,356,129 |
| | | | | 11,438,555 |
| |
| TOTAL DIVERSIFIED FINANCIAL SERVICES | | | | 44,835,314 |
| |
| HOUSEHOLD DURABLES – 0.2% | | | | |
| Homebuilding – 0.2% | | | | |
| D.R. Horton, Inc. | | 33,300 | | 1,135,863 |
| INSURANCE – 29.8% | | | | |
| Insurance Brokers – 0.7% | | | | |
| Marsh & McLennan Companies, Inc. | | 18,200 | | 562,562 |
| National Financial Partners Corp. | | 33,000 | | 1,942,050 |
| Willis Group Holdings Ltd. | | 20,500 | | 706,020 |
| | | | | 3,210,632 |
| Life & Health Insurance – 4.8% | | | | |
| AFLAC, Inc. | | 107,600 | | 4,976,500 |
| American Equity Investment Life Holding Co. | | 36,500 | | 488,735 |
| MetLife, Inc. | | 124,200 | | 6,224,904 |
| Protective Life Corp. | | 10,500 | | 511,875 |
| Prudential Financial, Inc. | | 56,500 | | 4,352,760 |
| Sun Life Financial, Inc. | | 135,100 | | 5,915,790 |
| Torchmark Corp. | | 19,900 | | 1,087,933 |
| | | | | 23,558,497 |
| Multi-Line Insurance – 9.7% | | | | |
| American International Group, Inc. | | 594,351 | | 39,441,131 |
| Genworth Financial, Inc. Class A (non-vtg.) | | 19,500 | | 620,490 |
| Hartford Financial Services Group, Inc. | | 72,900 | | 6,005,502 |
| HCC Insurance Holdings, Inc. | | 49,350 | | 1,588,577 |
| | | | | 47,655,700 |
| Property & Casualty Insurance – 9.0% | | | | |
| ACE Ltd. | | 240,200 | | 13,386,346 |
| Allstate Corp. | | 91,500 | | 5,012,370 |
| AMBAC Financial Group, Inc. | | 31,700 | | 2,382,255 |
| Aspen Insurance Holdings Ltd. | | 176,400 | | 4,094,244 |
| Axis Capital Holdings Ltd. | | 56,200 | | 1,739,952 |
| Berkshire Hathaway, Inc. Class B (a) | | 1,420 | | 4,100,960 |
| Fidelity National Financial, Inc. | | 37,475 | | 1,415,056 |
| MBIA, Inc. | | 20,400 | | 1,198,296 |
| The St. Paul Travelers Companies, Inc. | | 139,800 | | 6,008,604 |
| XL Capital Ltd. Class A | | 69,500 | | 4,694,725 |
| | | | | 44,032,808 |
| |
| |
| | | Shares | | Value (Note |
| Reinsurance – 5.6% | | | | |
| Endurance Specialty Holdings Ltd. | | 314,070 | | $ 9,893,205 |
| Everest Re Group Ltd. | | 10,400 | | 1,030,016 |
29
See accompanying notes which are an integral part of the financial statements.
29 Annual Report
| Financial Services Portfolio | | | | |
| Investments - continued | | | | |
| |
| |
| IPC Holdings Ltd. | | 6,200 | | 162,874 |
| Max Re Capital Ltd. | | 80,299 | | 1,960,099 |
| PartnerRe Ltd. | | 67,100 | | 4,066,931 |
| Platinum Underwriters Holdings Ltd. | | 228,400 | | 6,993,608 |
| Scottish Re Group Ltd. | | 92,900 | | 2,322,500 |
| Swiss Reinsurance Co. (Reg.) | | 17,963 | | 1,279,502 |
| | | | | 27,708,735 |
| |
| TOTAL INSURANCE | | | | 146,166,372 |
| |
| REAL ESTATE – 4.8% | | | | |
| Real Estate Investment Trusts – 4.5% | | | | |
| Apartment Investment & Management Co. Class A | | 25,300 | | 1,121,043 |
| CBL & Associates Properties, Inc. | | 30,360 | | 1,293,336 |
| Digital Realty Trust, Inc. | | 57,000 | | 1,573,770 |
| Duke Realty Corp. | | 26,300 | | 923,130 |
| Equity Lifestyle Properties, Inc. | | 16,300 | | 777,347 |
| Equity Residential (SBI) | | 83,000 | | 3,758,240 |
| General Growth Properties, Inc. | | 18,500 | | 932,215 |
| Healthcare Realty Trust, Inc. | | 55,200 | | 2,059,512 |
| Kimco Realty Corp. | | 25,800 | | 926,994 |
| Reckson Associates Realty Corp. | | 28,900 | | 1,182,010 |
| Simon Property Group, Inc. | | 55,100 | | 4,571,647 |
| The Mills Corp. | | 36,500 | | 1,442,845 |
| United Dominion Realty Trust, Inc. (SBI) | | 45,100 | | 1,206,425 |
| | | | | 21,768,514 |
| Real Estate Management & Development – 0.3% | | | | |
| Mitsui Fudosan Co. Ltd. | | 73,000 | | 1,511,006 |
| |
| TOTAL REAL ESTATE | | | | 23,279,520 |
| |
| THRIFTS & MORTGAGE FINANCE – 8.0% | | | | |
| Thrifts & Mortgage Finance – 8.0% | | | | |
| Countrywide Financial Corp. | | 151,944 | | 5,239,029 |
| Doral Financial Corp. | | 26,150 | | 291,834 |
| Downey Financial Corp. | | 8,100 | | 514,755 |
| Fannie Mae | | 197,500 | | 10,799,300 |
| Freddie Mac | | 31,600 | | 2,129,524 |
| Golden West Financial Corp., Delaware | | 56,300 | | 3,998,989 |
| Hudson City Bancorp, Inc. | | 250,411 | | 3,232,806 |
| Hypo Real Estate Holding AG | | 18,100 | | 1,191,051 |
| MGIC Investment Corp. | | 19,600 | | 1,249,500 |
| Radian Group, Inc. | | 24,000 | | 1,362,000 |
| Sovereign Bancorp, Inc. | | 89,100 | | 1,855,953 |
| The PMI Group, Inc. | | 27,300 | | 1,182,090 |
See accompanying notes which are an integral part of the financial statements.
Annual Report 30
| Common Stocks – continued | | | | |
| | | Shares | | Value (Note 1) |
| THRIFTS & MORTGAGE FINANCE – CONTINUED | | | | |
| Thrifts & Mortgage Finance – continued | | | | |
| W Holding Co., Inc. | | 118,907 | | $ 956,012 |
| Washington Mutual, Inc. | | 123,500 | | 5,273,450 |
| | | | | 39,276,293 |
| TOTAL COMMON STOCKS | | | | |
| (Cost $336,891,281) | | | | 486,124,438 |
| Money Market Funds — 0.9% | | | | |
| Fidelity Cash Central Fund, 4.57% (b) | | 1,997,114 | | 1,997,114 |
| Fidelity Securities Lending Cash Central Fund, 4.58% (b)(c) | | 2,356,495 | | 2,356,495 |
| TOTAL MONEY MARKET FUNDS | | | | |
| (Cost $4,353,609) | | | | 4,353,609 |
| TOTAL INVESTMENT PORTFOLIO - 100.0% | | | | |
| (Cost $341,244,890) | | | | 490,478,047 |
| |
| NET OTHER ASSETS – 0.0% | | | | (239,185) |
| NET ASSETS – 100% | | | | $490,238,862 |
(a) Non-income producing
(b) Affiliated fund that is available only to investment companies and other accounts managed by Fidelity Investments. The rate quoted is the annualized seven-day yield of the fund at period end. A complete unaudited listing of the fund’s holdings as of its most recent quarter end is available upon request.
(c) Investment made with cash collateral received from securities on loan. (d) Security or a portion of the security is on loan at period end.
| Affiliated Central Funds | | |
| Information regarding fiscal year to date income earned by the fund from the affiliated Central funds is as follows: | | |
| |
| Fund | | Income earned |
| Fidelity Cash Central Fund | | $ 179,014 |
| Fidelity Securities Lending Cash Central Fund | | 81,042 |
| Total | | $ 260,056 |
| |
| Other Information | | |
| Distribution of investments by country of issue, as a percentage of total net assets, is as follows: | | |
| United States of America | | 78.6% |
| Bermuda | | 9.2% |
| Canada | | 2.9% |
| Switzerland | | 1.8% |
| Japan | | 1.8% |
| India | | 1.5% |
| United Kingdom | | 1.1% |
| Others (individually less than 1%) | | 3.1% |
| | | 100.0% |
See accompanying notes which are an integral part of the financial statements.
|
31 Annual Report
31
| Financial Services Portfolio | | | | | | | | |
| |
| Financial Statements | | | | | | | | |
| |
| |
| Statement of Assets and Liabilities | | | | | | | | |
| | | | | | | | | February 28, 2006 |
| |
| Assets | | | | | | | | |
| Investment in securities, at value (including securities loaned of $2,260,017) — See accompanying schedule: | | | | | | | | |
| Unaffiliated issuers (cost $336,891,281) | | $ | | 486,124,438 | | | | |
| Affiliated Central Funds (cost $4,353,609) | | | | 4,353,609 | | | | |
| Total Investments (cost $341,244,890) | | | | | | $ | | 490,478,047 |
| Receivable for investments sold | | | | | | | | 2,235,860 |
| Receivable for fund shares sold | | | | | | | | 823,253 |
| Dividends receivable | | | | | | | | 656,327 |
| Interest receivable | | | | | | | | 4,020 |
| Prepaid expenses | | | | | | | | 1,847 |
| Other affiliated receivables | | | | | | | | 59 |
| Other receivables | | | | | | | | 21,974 |
| Total assets | | | | | | | | 494,221,387 |
| |
| Liabilities | | | | | | | | |
| Payable for investments purchased | | $ | | 467,684 | | | | |
| Payable for fund shares redeemed | | | | 747,813 | | | | |
| Accrued management fee | | | | 229,568 | | | | |
| Other affiliated payables | | | | 138,893 | | | | |
| Other payables and accrued expenses | | | | 42,072 | | | | |
| Collateral on securities loaned, at value | | | | 2,356,495 | | | | |
| Total liabilities | | | | | | | | 3,982,525 |
| |
| Net Assets | | | | | | $ | | 490,238,862 |
| Net Assets consist of: | | | | | | | | |
| Paid in capital | | | | | | $ | | 323,261,321 |
| Undistributed net investment income | | | | | | | | 1,375,614 |
| Accumulated undistributed net realized gain (loss) on investments and foreign currency transactions | | | | | | | | 16,375,473 |
| Net unrealized appreciation (depreciation) on investments and assets and liabilities in foreign currencies | | | | | | | | 149,226,454 |
| Net Assets, for 4,085,076 shares outstanding | | | | | | $ | | 490,238,862 |
| Net Asset Value, offering price and redemption price per share ($490,238,862 ÷ 4,085,076 shares) | | | | | | $ | | 120.01 |
| |
| Statement of Operations | | | | | | | | |
| | | | | | | | | Year ended February 28, 2006 |
| |
| Investment Income | | | | | | | | |
| Dividends | | | | | | $ | | 9,994,003 |
| Interest | | | | | | | | 229 |
| Income from affiliated Central Funds | | | | | | | | 260,056 |
| Total income | | | | | | | | 10,254,288 |
| |
| Expenses | | | | | | | | |
| Management fee | | $ | | 2,646,531 | | | | |
| Transfer agent fees | | | | 1,485,801 | | | | |
| Accounting and security lending fees | | | | | | | | |
| | | | | 233,501 | | | | |
| Independent trustees’ compensation | | | | 2,041 | | | | |
| Custodian fees and expenses | | | | 40,220 | | | | |
| Registration fees | | | | 40,937 | | | | |
| Audit | | | | 38,034 | | | | |
| Legal | | | | 2,387 | | | | |
| Interest | | | | 686 | | | | |
| Miscellaneous | | | | 6,341 | | | | |
| Total expenses before reductions | | | | 4,496,479 | | | | |
| Expense reductions | | | | (90,587) | | | | 4,405,892 |
| |
| Net investment income (loss) | | | | | | | | 5,848,396 |
See accompanying notes which are an integral part of the financial statements.
Annual Report 32
| Realized and Unrealized Gain (Loss) | | | | |
| Net realized gain (loss) on: | | | | |
| Investment securities: | | | | |
| Unaffiliated issuers (net of foreign taxes of $79,926) | | 29,895,266 | | |
| Payment from investment adviser for losses on investments not meeting investment restrictions | | 10,241 | | |
| Foreign currency transactions | | (14,265) | | |
| Total net realized gain (loss) | | | | 29,891,242 |
| Change in net unrealized appreciation (depreciation) on: | | | | |
| Investment securities (net of increase in deferred foreign taxes of $6,747) | | 27,122,144 | | |
| Assets and liabilities in foreign currencies | | (3,978) | | |
| Total change in net unrealized appreciation (depreciation) | | | | 27,118,166 |
| Net gain (loss) | | | | 57,009,408 |
| Net increase (decrease) in net assets resulting from operations | | | | $62,857,804 |
See accompanying notes which are an integral part of the financial statements.
|
33 Annual Report
| Financial Services Portfolio | | | | | | | | | | | | | | | | | | |
| Financial Statements - continued | | | | | | | | | | | | | | | | | | |
| |
| |
| Statement of Changes in Net Assets | | | | | | | | | | | | | | | | | | |
| | | | | | | | | | | | | | | Year ended | | | | Year ended |
| | | | | | | | | | | | | | | February 28, | | | | February 28, |
| | | | | | | | | | | | | | | 2006 | | | | 2005 |
| Increase (Decrease) in Net Assets | | | | | | | | | | | | | | | | | | |
| Operations | | | | | | | | | | | | | | | | | | |
| Net investment income (loss) | | | | | | | | | | | | $ | | 5,848,396 | | $ | | 4,914,141 |
| Net realized gain (loss) | | | | | | | | | | | | | | 29,891,242 | | | | 62,130,819 |
| Change in net unrealized appreciation (depreciation) | | | | | | | | | | | | | | 27,118,166 | | | | (52,538,812) |
| Net increase (decrease) in net assets resulting from operations | | | | | | | | | | | | 62,857,804 | | | | 14,506,148 |
| Distributions to shareholders from net investment income | | | | | | | | | | | | | | (5,599,282) | | | | (3,801,680) |
| Distributions to shareholders from net realized gain | | | | | | | | | | | | | | (34,940,068) | | | | (40,142,276) |
| Total distributions | | | | | | | | | | | | | | (40,539,350) | | | | (43,943,956) |
| Share transactions | | | | | | | | | | | | | | | | | | |
| Proceeds from sales of shares | | | | | | | | | | | | | | 130,389,343 | | | | 107,991,182 |
| Reinvestment of distributions | | | | | | | | | | | | | | 38,466,222 | | | | 41,813,485 |
| Cost of shares redeemed | | | | | | | | | | | | | | (188,068,301) | | | | (188,907,620) |
| Net increase (decrease) in net assets resulting from share transactions | | | | | | | | | | (19,212,736) | | | | (39,102,953) |
| Redemption fees | | | | | | | | | | | | | | 59,944 | | | | 36,802 |
| Total increase (decrease) in net assets | | | | | | | | | | | | | | 3,165,662 | | | | (68,503,959) |
| |
| Net Assets | | | | | | | | | | | | | | | | | | |
| Beginning of period | | | | | | | | | | | | | | 487,073,200 | | | | 555,577,159 |
| End of period (including undistributed net investment income of $1,375,614 and undistributed net investment income | | | | | | | | |
| of $1,483,892, respectively) | | | | | | | | | | | | $ | | 490,238,862 | | $ | | 487,073,200 |
| |
| Other Information | | | | | | | | | | | | | | | | | | |
| Shares | | | | | | | | | | | | | | | | | | |
| Sold | | | | | | | | | | | | | | 1,151,335 | | | | 931,486 |
| Issued in reinvestment of distributions | | | | | | | | | | | | | | 360,852 | | | | 364,072 |
| Redeemed | | | | | | | | | | | | | | (1,673,743) | | | | (1,636,996) |
| Net increase (decrease) | | | | | | | | | | | | | | (161,556) | | | | (341,438) |
| |
| Financial Highlights | | | | | | | | | | | | | | | | | | |
| Years ended February 28, | | | | 2006 | | 2005 | | | | 2004E | | | | 2003 | | | | 2002 |
| Selected Per-Share Data | | | | | | | | | | | | | | | | | | |
| Net asset value, beginning of period | | $ | | 114.70 | | $ 121.09 | | $ | | 84.14 | | $ | | 99.95 | | $ | | 108.59 |
| Income from Investment Operations | | | | | | | | | | | | | | | | | | |
| Net investment income (loss)C | | | | 1.41 | | 1.11 | | | | .96 | | | | .74 | | | | .96 |
| Net realized and unrealized gain (loss) | | | | 13.73 | | 2.75 | | | | 36.92 | | | | (15.75) | | | | (4.95) |
| Total from investment operations | | | | 15.14 | | 3.86 | | | | 37.88 | | | | (15.01) | | | | (3.99) |
| Distributions from net investment income | | | | (1.34) | | (.89) | | | | (.94) | | | | (.82) | | | | (1.03) |
| Distributions from net realized gain | | | | (8.50) | | (9.37) | | | | — | | | | — | | | | (3.64) |
| Total distributions | | | | (9.84) | | (10.26) | | | | (.94) | | | | (.82) | | | | (4.67) |
| Redemption fees added to paid in capitalC | | | | 01 | | .01 | | | | .01 | | | | .02 | | | | .02 |
| Net asset value, end of period | | $ | | 120.01 | | $ 114.70 | | $ | | 121.09 | | $ | | 84.14 | | $ | | 99.95 |
| Total ReturnA,B | | | | 14.51% | | 3.29% | | | | 45.17% | | | | (15.06)% | | | | (3.58)% |
| Ratios to Average Net AssetsD | | | | | | | | | | | | | | | | | | |
| Expenses before reductions | | | | 97% | | .97% | | | | 1.09% | | | | 1.12% | | | | 1.07% |
| Expenses net of fee waivers, if any | | | | 97% | | .97% | | | | 1.09% | | | | 1.12% | | | | 1.07% |
| Expenses net of all reductions | | | | 95% | | .94% | | | | 1.07% | | | | 1.09% | | | | 1.03% |
| Net investment income (loss) | | | | 1.26% | | .96% | | | | .92% | | | | .79% | | | | .93% |
| Supplemental Data | | | | | | | | | | | | | | | | | | |
| Net assets, end of period (000 omitted) | | $ 490,239 | | $ 487,073 | | $ 555,577 | | $ 389,392 | | $ 560,002 |
| Portfolio turnover rate | | | | 47% | | 101% | | | | 51% | | | | 76% | | | | 127% |
| |
| | | |
A Total returns would have been lower had certain expenses not been reduced during the periods shown.B Total returns do not include the effect of the former sales charges. C Calculated based on average shares outstanding during the period. DExpense ratios reflect operating expenses of the fund. Expenses before reductions do not reflect amounts reimbursed by the investment adviser or reductions from brokerage service arrangements or other expense offset arrangements and do not represent the amount paid by the fund during periods when reimbursements or reductions occur. Expenses net of fee waivers reflect expenses after reimbursement by the investment adviser but prior to reductions from brokerage service arrangements or other expense offset arrangements. Expenses net of all reductions represent the net expenses paid by the fund. EFor the year ended February 29.See accompanying notes which are an integral part of the financial statements.
Annual Report 34
Home Finance Portfolio
Performance
|
Average annual total return reflects the change in the value of an investment, assuming reinvestment of the fund’s dividend income and capital gains (the profits earned upon the sale of securities that have grown in value) and assuming a constant rate of performance each year. The $10,000 table and the fund’s returns do not reflect the deduction of taxes that a shareholder would pay on fund distributions or the redemption of fund shares. During periods of reimbursement by Fidelity a fund’s total returns will be greater than it would be had the reimbursement not occurred. How a fund did yesterday is no guarantee of how it will do tomorrow.
| Average Annual Total Returns | | | | | | |
| Periods ended February 28, 2006 | | Past 1 | | Past 5 | | Past 10 |
| | | year | | years | | years |
| Select Home Finance | | 0.99% | | 8.54% | | 11.67% |
| |
| $10,000 Over 10 Years | | | | | | |
Let’s say hypothetically that $10,000 was invested in Fidelity Select Home Finance Portfolio on February 29, 1996. The chart shows how the value of your investment would have changed, and also shows how the S&P 500 Index performed over the same period.
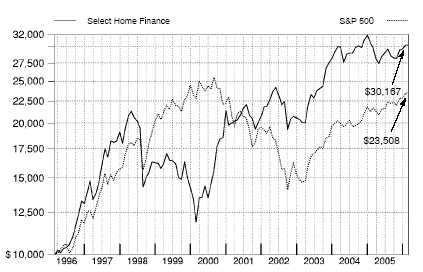
35 Annual Report
Management’s Discussion of Fund Performance
Comments from Valerie Friedholm, Portfolio Manager of Fidelity® Select Home Finance Portfolio
With the exception of several popular large-cap stock performance measures, most major U.S. equity benchmarks had double-digit returns for the year ending February 28, 2006. For much of the period, market gains were driven largely by the energy sector, although utilities ultimately sneaked into the top spot for the year overall. Financials and telecommunication services also reached double figures, outperforming the 8.40% return of the broader market as measured by the large-cap-oriented Standard & Poor’s 500SM Index. The consumer discretionary segment — home to the weak performing automobile and media industries — was the biggest disappointment. Although the overall return for the S&P 500® beat the small-cap Russell 2000® Index in calendar year 2005 — the first time that’s happened in six years — small-caps stormed back in early 2006, leading to a 16.59% advance during the past 12 months, nearly twice the broader market’s gain. Mid-caps soared even higher, returning 17.67% according to the Russell Midcap® Index. The technology-heavy NASDAQ Composite® Index also fared well, climbing 12.13%, but the Dow Jones Industrial AverageSM, an index of 30 large-cap, blue-chip stocks, managed to rise only 4.52% .
Select Home Finance was up 0.99% for the 12 months ending February 28, 2006, well behind both the Goldman Sachs® Financial Services Index, which rose 15.23%, and the S&P 500. A flattening yield curve — meaning the increasingly smaller difference between short-term interest rates, which the Federal Reserve Board continued to raise during the period, and longer-term rates, which remained low — made it difficult for home finance lenders to generate strong earnings on interest rate margins. This unfavorable environment hurt the performance of many mortgage lenders in the portfolio. In addition, inopportune security selection in two names — Doral Financial, a Puerto Rican lender, and Fannie Mae, the large mortgage underwriter —hurt relative to the sector index, as accounting issues at both firms precipitated sell-offs in their stocks. Competitive worries about First Marblehead, which securitizes student loans, sent its stock price lower, and I sold the position. On the plus side, the fund was helped by title insurance underwriter Fidelity National Financial and PNC Financial, a diversified banking company with low reliance on interest-sensitive earnings. The fund also was helped by a lack of exposure to several large index components — including Citigroup — that underperformed.
The views expressed above reflect those of the portfolio manager(s) only through the end of the period as stated on the cover of this report and do not necessarily represent the views of Fidelity or any other person in the Fidelity organization. Any such views are subject to change at any time based upon market or other conditions and Fidelity disclaims any responsibility to update such views. These views may not be relied on as investment advice and, because investment decisions for a Fidelity fund are based on numerous factors, may not be relied on as an indication of trading intent on behalf of any Fidelity fund.
Home Finance Portfolio
Investment Changes
Top Ten Stocks as of February 28, 2006
| | | % of fund’s | | % of fund’s net assets |
| | | net assets | | 6 months ago |
| Fannie Mae | | 6.9 | | 4.4 |
| Countrywide Financial Corp. | | 6.8 | | 6.2 |
| Freddie Mac | | 5.8 | | 4.2 |
| Golden West Financial Corp., | | | | |
| Delaware | | 5.6 | | 6.0 |
| PNC Financial Services Group, | | | | |
| Inc. | | 4.4 | | 3.3 |
| Radian Group, Inc. | | 4.4 | | 4.0 |
| Wells Fargo & Co. | | 4.3 | | 4.1 |
| Sovereign Bancorp, Inc. | | 4.3 | | 4.0 |
| MGIC Investment Corp. | | 4.2 | | 4.2 |
| Old Republic International Corp. | | 4.1 | | 4.2 |
| | | 50.8 | | |
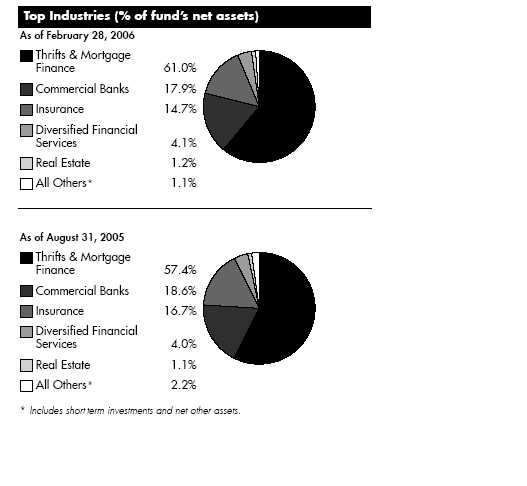
37 Annual Report
37
| Home Finance Portfolio | | | | | | | | |
| Investments February 28, 2006 | | | | |
| Showing Percentage of Net Assets | | | | | | | | |
| |
| Common Stocks — 99.0% | | | | | | | | |
| | | | | | | Shares | | Value (Note 1) |
| |
| COMMERCIAL BANKS – 17.9% | | | | | | | | |
| Diversified Banks – 4.3% | | | | | | | | |
| Wells Fargo & Co. | | | | | | 197,400 | | $ 12,673,080 |
| Regional Banks – 13.6% | | | | | | | | |
| Center Financial Corp., California | | | | | | 29,788 | | 690,188 |
| Colonial Bancgroup, Inc. | | | | | | 339,100 | | 8,514,801 |
| East West Bancorp, Inc. | | | | | | 25,600 | | 964,864 |
| Nara Bancorp, Inc. | | | | | | 27,200 | | 475,184 |
| North Fork Bancorp, Inc., New York | | | | | | 110,359 | | 2,818,569 |
| PNC Financial Services Group, Inc. | | | | | | 181,700 | | 12,782,595 |
| TCF Financial Corp. | | | | | | 114,200 | | 2,896,112 |
| TD Banknorth, Inc. (d) | | | | | | 309,675 | | 9,516,313 |
| UCBH Holdings, Inc. | | | | | | 59,144 | | 1,058,678 |
| | | | | | | | | 39,717,304 |
| |
| TOTAL COMMERCIAL BANKS | | | | | | | | 52,390,384 |
| |
| DIVERSIFIED FINANCIAL SERVICES – 4.1% | | | | | | | | |
| Other Diversifed Financial Services – 4.1% | | | | | | | | |
| EuroBancshares, Inc. (a) | | | | | | 47,200 | | 590,472 |
| JPMorgan Chase & Co. | | | | | | 275,300 | | 11,325,842 |
| | | | | | | | | 11,916,314 |
| |
| INSURANCE – 14.7% | | | | | | | | |
| Multi-Line Insurance – 3.5% | | | | | | | | |
| Genworth Financial, Inc. Class A (non-vtg.) | | | | | | 317,435 | | 10,100,782 |
| Property & Casualty Insurance – 11.2% | | | | | | | | |
| Fidelity National Financial, Inc. | | | | | | 290,366 | | 10,964,220 |
| First American Corp., California | | | | | | 228,700 | | 9,641,992 |
| Old Republic International Corp. | | | | | | 569,275 | | 12,119,865 |
| | | | | | | | | 32,726,077 |
| |
| TOTAL INSURANCE | | | | | | | | 42,826,859 |
| |
| INTERNET SOFTWARE & SERVICES – 0.1% | | | | | | | | |
| Internet Software & Services – 0.1% | | | | | | | | |
| Homestore, Inc. (a) | | | | | | 71,659 | | 445,719 |
| REAL ESTATE – 1.2% | | | | | | | | |
| Real Estate Investment Trusts – 1.2% | | | | | | | | |
| American Financial Realty Trust (SBI) | | | | | | 195,500 | | 2,310,810 |
| CapitalSource, Inc. | | | | | | 32,913 | | 809,989 |
| Origen Financial, Inc. | | | | | | 44,400 | | 300,588 |
| | | | | | | | | 3,421,387 |
| |
| THRIFTS & MORTGAGE FINANCE – 61.0% | | | | | | | | |
| Thrifts & Mortgage Finance – 61.0% | | | | | | | | |
| Astoria Financial Corp. | | | | | | 237,700 | | 6,814,859 |
| BankAtlantic Bancorp, Inc. Class A (non-vtg.) | | | | | | 50,700 | | 692,055 |
| |
| |
| | | | | | | Shares | | Value (Note 1) |
| Capitol Federal Financial (d) | | | | | | 91,100 | | $ 3,002,656 |
| Countrywide Financial Corp. | | | | | | 577,800 | | 19,922,544 |
See accompanying notes which are an integral part of the financial statements.
Annual Report 38
| Dime Community Bancshares, Inc. | | 33,300 | | 455,544 |
| Doral Financial Corp. (d) | | 266,292 | | 2,971,819 |
| Downey Financial Corp. | | 13,800 | | 876,990 |
| Fannie Mae | | 370,800 | | 20,275,343 |
| FirstFed Financial Corp., Delaware (a) | | 10,600 | | 636,106 |
| Freddie Mac | | 252,600 | | 17,022,714 |
| Golden West Financial Corp., Delaware | | 230,300 | | 16,358,209 |
| Independence Community Bank Corp. | | 196,082 | | 8,035,440 |
| IndyMac Bancorp, Inc. | | 600 | | 23,292 |
| MGIC Investment Corp. | | 193,500 | | 12,335,625 |
| New York Community Bancorp, Inc. (d) | | 569,037 | | 9,599,654 |
| People’s Bank, Connecticut | | 318,300 | | 9,848,202 |
| Radian Group, Inc. | | 224,700 | | 12,751,725 |
| Sovereign Bancorp, Inc. | | 601,199 | | 12,522,975 |
| The PMI Group, Inc. | | 111,657 | | 4,834,748 |
| Triad Guaranty, Inc. (a) | | 17,900 | | 812,481 |
| Washington Federal, Inc. | | 186,062 | | 4,402,227 |
| Washington Mutual, Inc. | | 210,400 | | 8,984,080 |
| Webster Financial Corp. | | 106,900 | | 5,040,335 |
| | | | | 178,219,623 |
| |
| TOTAL COMMON STOCKS | | | | |
| (Cost $220,225,196) | | | | 289,220,286 |
| |
| Money Market Funds — 6.1% | | | | |
| |
| Fidelity Cash Central Fund, 4.57% (b) | | 4,695,991 | | 4,695,991 |
| Fidelity Securities Lending Cash Central Fund, 4.58% (b)(c) | | 13,157,938 | | 13,157,938 |
| TOTAL MONEY MARKET FUNDS | | | | |
| (Cost $17,853,929) | | | | 17,853,929 |
| |
| TOTAL INVESTMENT PORTFOLIO - 105.1% | | | | |
| (Cost $238,079,125) | | | | 307,074,215 |
| |
| NET OTHER ASSETS – (5.1)% | | | | (14,949,963) |
| NET ASSETS – 100% | | $ | | 292,124,252 |
(a) Non-income producing
(b) Affiliated fund that is available only to investment companies and other accounts managed by Fidelity Investments. The rate quoted is the annualized seven-day yield of the fund at period end. A complete unaudited listing of the fund’s holdings as of its most recent quarter end is available upon request.
(c) Investment made with cash collateral received from securities on loan. (d) Security or a portion of the security is on loan at period end.
See accompanying notes which are an integral part of the financial statements.
|
39 Annual Report
39
| Home Finance Portfolio | | |
| Investments - continued | | |
| |
| |
| Affiliated Central Funds | | |
| Information regarding fiscal year to date income earned by the fund from the affiliated Central funds is as follows: | | |
| |
| Fund | | Income earned |
| Fidelity Cash Central Fund | | $ 357,649 |
| Fidelity Securities Lending Cash Central Fund | | 45,770 |
| Total | | $ 403,419 |
See accompanying notes which are an integral part of the financial statements.
|
| Home Finance Portfolio | | | | | | | | |
| |
| Financial Statements | | | | | | | | |
| |
| |
| Statement of Assets and Liabilities | | | | | | | | |
| | | | | | | | | February 28, 2006 |
| |
| Assets | | | | | | | | |
| Investment in securities, at value (including securities loaned of $12,610,842) — See accompanying schedule: | | | | | | | | |
| Unaffiliated issuers (cost $220,225,196) | | $ | | 289,220,286 | | | | |
| Affiliated Central Funds (cost $17,853,929) | | | | 17,853,929 | | | | |
| Total Investments (cost $238,079,125) | | | | | | $ | | 307,074,215 |
| Receivable for fund shares sold | | | | | | | | 242,644 |
| Dividends receivable | | | | | | | | 405,007 |
| Interest receivable | | | | | | | | 25,488 |
| Prepaid expenses | | | | | | | | 1,446 |
| Other affiliated receivables | | | | | | | | 4 |
| Other receivables | | | | | | | | 61,735 |
| Total assets | | | | | | | | 307,810,539 |
| |
| Liabilities | | | | | | | | |
| Payable for investments purchased | | $ | | 1,632,089 | | | | |
| Payable for fund shares redeemed | | | | 644,404 | | | | |
| Accrued management fee | | | | 138,881 | | | | |
| Other affiliated payables | | | | 87,041 | | | | |
| Other payables and accrued expenses | | | | 25,934 | | | | |
| Collateral on securities loaned, at value | | | | 13,157,938 | | | | |
| Total liabilities | | | | | | | | 15,686,287 |
| |
| Net Assets | | | | | | $ | | 292,124,252 |
| Net Assets consist of: | | | | | | | | |
| Paid in capital | | | | | | $ | | 215,917,296 |
| Undistributed net investment income | | | | | | | | 2,696,950 |
| Accumulated undistributed net realized gain (loss) on investments and foreign currency transactions | | | | | | | | 4,514,916 |
| Net unrealized appreciation (depreciation) on investments | | | | | | | | 68,995,090 |
| Net Assets, for 5,635,923 shares outstanding | | | | | | $ | | 292,124,252 |
| Net Asset Value, offering price and redemption price per share ($292,124,252 ÷ 5,635,923 shares) | | | | | | $ | | 51.83 |
| |
| Statement of Operations | | | | | | | | |
| | | | | | | | | Year ended February 28, 2006 |
| |
| Investment Income | | | | | | | | |
| Dividends | | | | | | $ | | 7,367,520 |
| Special dividends | | | | | | | | 3,220,660 |
| Interest | | | | | | | | 67 |
| Income from affiliated Central Funds | | | | | | | | 403,419 |
| Total income | | | | | | | | 10,991,666 |
| |
| Expenses | | | | | | | | |
| Management fee | | $ | | 1,895,122 | | | | |
| Transfer agent fees | | | | 1,072,912 | | | | |
| Accounting and security lending fees | | | | | | | | |
| | | | | 168,327 | | | | |
| Independent trustees’ compensation | | | | 1,425 | | | | |
| Custodian fees and expenses | | | | 12,084 | | | | |
| Registration fees | | | | 30,102 | | | | |
| Audit | | | | 36,223 | | | | |
| Legal | | | | 3,427 | | | | |
| Miscellaneous | | | | 4,289 | | | | |
| Total expenses before reductions | | | | 3,223,911 | | | | |
| Expense reductions | | | | (102,504) | | | | 3,121,407 |
| |
| Net investment income (loss) | | | | | | | | 7,870,259 |
Realized and Unrealized Gain (Loss)
Net realized gain (loss) on: | | | | | | | | |
See accompanying notes which are an integral part of the financial statements.
|
41 Annual Report
| Home Finance Portfolio | | | | | | |
| Financial Statements - continued | | | | | | |
| |
| |
| Investment securities: | | | | | | |
| Unaffiliated issuers | | 40,363,923 | | | | |
| Payment from investment adviser for losses on investments not meeting investment restrictions | | 93,207 | | | | |
| Foreign currency transactions | | 45 | | | | |
| Total net realized gain (loss) | | | | | | 40,457,175 |
| Change in net unrealized appreciation (depreciation) on investment securities | | | | | | (47,918,726) |
| Net gain (loss) | | | | | | (7,461,551) |
| Net increase (decrease) in net assets resulting from operations | | | | $ | | 408,708 |
See accompanying notes which are an integral part of the financial statements.
Annual Report 42
| Statement of Changes in Net Assets | | | | | | | | | | | | | | | | | | | | | | |
| | | | | | | | | | | | | | | Year ended | | | | Year ended |
| | | | | | | | | | | | | | | February 28, | | | | February 28, |
| | | | | | | | | | | | | | | 2006 | | | | 2005 |
| Increase (Decrease) in Net Assets | | | | | | | | | | | | | | | | | | | | | | |
| Operations | | | | | | | | | | | | | | | | | | | | | | |
| Net investment income (loss) | | | | | | | | | | | | $ | | 7,870,259 | | $ | | | | 3,408,910 |
| Net realized gain (loss) | | | | | | | | | | | | | | 40,457,175 | | | | 53,745,806 |
| Change in net unrealized appreciation (depreciation) | | | | | | | | | | | | | | (47,918,726) | | | | (61,157,170) |
| Net increase (decrease) in net assets resulting from operations | | | | | | | | | | | | | | 408,708 | | | | (4,002,454) |
| Distributions to shareholders from net investment income | | | | | | | | | | | | | | (5,380,189) | | | | (3,477,354) |
| Distributions to shareholders from net realized gain | | | | | | | | | | | | | | (37,238,765) | | | | (56,184,735) |
| Total distributions | | | | | | | | | | | | | | (42,618,954) | | | | (59,662,089) |
| Share transactions | | | | | | | | | | | | | | | | | | | | | | |
| Proceeds from sales of shares | | | | | | | | | | | | | | 36,144,380 | | | | 98,974,765 |
| Reinvestment of distributions | | | | | | | | | | | | | | 40,625,810 | | | | 56,903,069 |
| Cost of shares redeemed | | | | | | | | | | | | (138,541,892) | | | | (145,235,716) |
| Net increase (decrease) in net assets resulting from share transactions | | | | | | | | | | | | (61,771,702) | | | | 10,642,118 |
| Redemption fees | | | | | | | | | | | | | | | | 18,308 | | | | | | 50,578 |
| Total increase (decrease) in net assets | | | | | | | | | | | | | | | | | | | | | | |
| | | | | | | | | | | | | (103,963,640) | | | | (52,971,847) |
| Net Assets | | | | | | | | | | | | | | | | | | | | | | |
| Beginning of period | | | | | | | | | | | | | | 396,087,892 | | | | 449,059,739 |
| End of period (including undistributed net investment income of $2,696,950 and undistributed net investment | | | | | | | | | | | | | | |
| income of $949,442, respectively) | | | | | | | | | | | | $ | | 292,124,252 | | $ | | 396,087,892 |
| |
| Other Information | | | | | | | | | | | | | | | | | | | | | | |
| Shares | | | | | | | | | | | | | | | | | | | | | | |
| Sold | | | | | | | | | | | | | | 643,172 | | | | | | 1,511,280 |
| Issued in reinvestment of distributions | | | | | | | | | | | | | | 783,468 | | | | | | 911,406 |
| Redeemed | | | | | | | | | | | | | | (2,490,689) | | | | (2,253,150) |
| Net increase (decrease) | | | | | | | | | | | | | | (1,064,049) | | | | | | 169,536 |
| |
| Financial Highlights | | | | | | | | | | | | | | | | | | | | | | |
| Years ended February 28, | | | | 2006 | | | | 2005 | | | | 2004F | | | | 2003 | | | | | | 2002 |
| Selected Per-Share Data | | | | | | | | | | | | | | | | | | | | | | |
| Net asset value, beginning of period | | $ | | 59.12 | | $ | | 68.76 | | $ | | 47.60 | | $ | | 52.95 | | | | $ | | 51.82 |
| Income from Investment Operations | | | | | | | | | | | | | | | | | | | | | | |
| Net investment income (loss)C | | | | 1.32D | | | | .54 | | | | .61 | | | | .39 | | | | | | .41 |
| Net realized and unrealized gain (loss) | | | | (.77) | | | | (.54) | | | | 22.67 | | | | (4.77) | | | | | | 4.07 |
| Total from investment operations | | | | 55 | | | | — | | | | 23.28 | | | | (4.38) | | | | | | 4.48 |
| Distributions from net investment income | | | | (.99) | | | | (.56) | | | | (.41) | | | | (.30) | | | | | | (.17) |
| Distributions from net realized gain | | | | (6.85) | | | | (9.09) | | | | (1.72) | | | | (.70) | | | | | | (3.23) |
| Total distributions | | | | (7.84) | | | | (9.65) | | | | (2.13) | | | | (1.00) | | | | | | (3.40) |
| Redemption fees added to paid in capitalC | | | | —G | | | | .01 | | | | .01 | | | | .03 | | | | | | .05 |
| Net asset value, end of period | | $ | | 51.83 | | $ | | 59.12 | | $ | | 68.76 | | $ | | 47.60 | | | | $ | | 52.95 |
| Total ReturnA,B | | | | 99% | | | | (.46)% | | | | 49.39% | | | | (8.30)% | | | | | | 9.40% |
| Ratios to Average Net AssetsE | | | | | | | | | | | | | | | | | | | | | | |
| Expenses before reductions | | | | 97% | | | | .97% | | | | 1.11% | | | | 1.14% | | | | | | 1.15% |
| Expenses net of fee waivers, if any | | | | 97% | | | | .97% | | | | 1.11% | | | | 1.14% | | | | | | 1.15% |
| Expenses net of all reductions | | | | 94% | | | | .96% | | | | 1.10% | | | | 1.11% | | | | | | 1.12% |
| Net investment income (loss) | | | | 2.36%D | | | | .83% | | | | 1.05% | | | | .75% | | | | | | .82% |
| Supplemental Data | | | | | | | | | | | | | | | | | | | | | | |
| Net assets, end of period (000 omitted) | | $ 292,124 | | $ �� 396,088 | | $ 449,060 | | $ 327,394 | | | | $ 408,779 |
| Portfolio turnover rate | | | | 76% | | | | 37% | | | | 38% | | | | 78% | | | | | | 72% |
| |
| | | | | |
| | |
A Total returns would have been lower had certain expenses not been reduced during the periods shown. B Total returns do not include the effect of the former sales charges. C Calculated based on average shares outstanding during the period. D Investment income per share reflects a special dividend which amounted to $.54 per share. Excluding the special dividend, the ratio of net investment income (loss) to average net assets would have been 1.40%. E Expense ratios reflect operating expenses of the fund. Expenses before reductions do not reflect amounts reimbursed by the investment adviser or reductions from brokerage service arrangements or other expense offset arrangements and do not represent the amount paid by the fund during periods when reimbursements or reductions occur. Expenses net of fee waivers reflect expenses after reimbursement by the investment adviser but prior to reductions from brokerage service arrangements or other expense offset arrange ments. Expenses net of all reductions represent the net expenses paid by the fund. FFor the year ended February 29. GAmount represents less than $.01 per share.See accompanying notes which are an integral part of the financial statements.
43
Insurance Portfolio
Performance
|
Average annual total return reflects the change in the value of an investment, assuming reinvestment of the fund’s dividend income and capital gains (the profits earned upon the sale of securities that have grown in value) and assuming a constant rate of performance each year. The $10,000 table and the fund’s returns do not reflect the deduction of taxes that a shareholder would pay on fund distributions or the redemption of fund shares. During periods of reimbursement by Fidelity a fund’s total returns will be greater than it would be had the reimbursement not occurred. How a fund did yesterday is no guarantee of how it will do tomorrow.
| Average Annual Total Returns | | | | | | |
| Periods ended February 28, 2006 | | Past 1 | | Past 5 | | Past 10 |
| | | year | | years | | years |
| Select Insurance | | 13.68% | | 10.13% | | 15.96% |
| |
| $10,000 Over 10 Years | | | | | | |
Let’s say hypothetically that $10,000 was invested in Fidelity Select Insurance Portfolio on February 29, 1996. The chart shows how the value of your investment would have changed, and also shows how the S&P 500 Index performed over the same period.
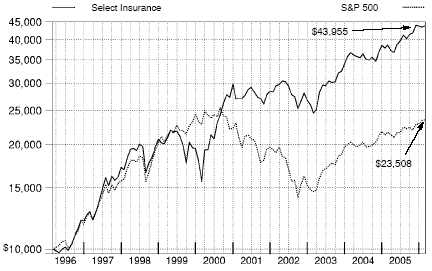
Management’s Discussion of Fund Performance
Comments from Charles Hebard, who managed Fidelity® Select Insurance Portfolio during the period covered by this report
With the exception of several popular large-cap stock performance measures, most major U.S. equity benchmarks had double-digit returns for the year ending February 28, 2006. For much of the period, market gains were driven largely by the energy sector, although utilities ultimately sneaked into the top spot for the year overall. Financials and telecommunication services also reached double figures, outperforming the 8.40% return of the broader market as measured by the large-cap-oriented Standard & Poor’s 500SM Index. The consumer discretionary segment — home to the weak performing automobile and media industries — was the biggest disappointment. Although the overall return for the S&P 500® beat the small-cap Russell 2000® Index in calendar year 2005 — the first time that’s happened in six years — small-caps stormed back in early 2006, leading to a 16.59% advance during the past 12 months, nearly twice the broader market’s gain. Mid-caps soared even higher, returning 17.67% according to the Russell Midcap® Index. The technology-heavy NASDAQ Composite® Index also fared well, climbing 12.13%, but the Dow Jones Industrial AverageSM, an index of 30 large-cap, blue-chip stocks, managed to rise only 4.52% .
During the 12 months that ended February 28, 2006, the fund had a total return of 13.68%, trailing the Goldman Sachs® Financial Services Index, which returned 15.23%, while surpassing the S&P 500. Insurance stocks performed well during the period considering that property and casualty companies suffered the largest claims losses in their history as a result of the devastating effects of Hurricanes Katrina and Rita in the Gulf Coast. The principal reasons the fund lagged the Goldman Sachs benchmark were that we overweighted the weak reinsurance industry and did not own security brokers and investment banks, which constituted the best performing group in the financial index. Two of the biggest contributors were property and casualty insurers W.R. Berkley and Bermuda-based ACE Ltd. Both had little exposure to hurricanes but both stood to benefit from the stronger pricing power anticipated by the industry as a result of the hurricanes. Life insurer Prudential Financial was another big gainer, primarily based on strong results from its international operations. AFLAC, a provider of supplemental insurance, also contributed. Three notable detractors from performance were Bermudan property and casualty reinsurers Montpelier Re Holdings, Endurance Specialty Holdings and XL Capital, all of which were hurt by hurricane claims. The fund’s largest holding during the period, American International Group, also underperformed. The company’s chief executive officer was forced to resign and the firm restated its past earnings reports amid regulatory investigations into several reinsurance transactions.
Note to shareholders: Stephen Hermsdorf was named manager of the fund on March 13, 2006.
The views expressed above reflect those of the portfolio manager(s) only through the end of the period as stated on the cover of this report and do not necessarily represent the views of Fidelity or any other person in the Fidelity organization. Any such views are subject to change at any time based upon market or other conditions and Fidelity disclaims any responsibility to update such views. These views may not be relied on as investment advice and, because investment decisions for a Fidelity fund are based on numerous factors, may not be relied on as an indication of trading intent on behalf of any Fidelity fund.
45 45 Annual Report
| Insurance Portfolio | | | | |
| Investment Changes | | |
| |
| |
| Top Ten Stocks as of February 28, 2006 |
| | | % of fund’s | | % of fund’s net assets |
| | | net assets | | 6 months ago |
| American International Group, | | | | |
| Inc. | | 8.7 | | 9.9 |
| ACE Ltd. | | 5.7 | | 5.3 |
| The St. Paul Travelers Companies, | | | | |
| Inc. | | 5.4 | | 5.3 |
| Hartford Financial Services | | | | |
| Group, Inc. | | 4.9 | | 4.2 |
| MetLife, Inc. | | 4.3 | | 5.5 |
| WellPoint, Inc. | | 4.2 | | 4.5 |
| AFLAC, Inc. | | 4.1 | | 5.2 |
| Allstate Corp. | | 4.1 | | 3.4 |
| Prudential Financial, Inc. | | 3.9 | | 4.5 |
| W.R. Berkley Corp. | | 3.0 | | 2.9 |
| | | 48.3 | | |
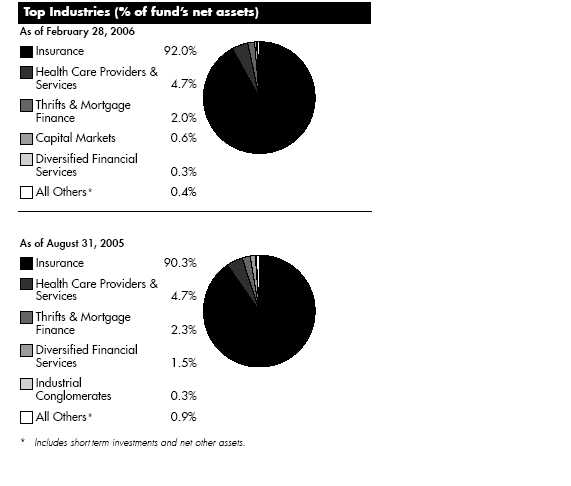
Annual Report 46
| Insurance Portfolio | | | | | | | | |
| Investments February 28, 2006 | | | | |
| Showing Percentage of Net Assets | | | | | | | | |
| |
| Common Stocks — 99.6% | | | | | | | | |
| | | | | | | Shares | | Value (Note 1) |
| |
| CAPITAL MARKETS – 0.6% | | | | | | | | |
| Asset Management & Custody Banks – 0.6% | | | | | | | | |
| Ameriprise Financial, Inc. | | | | | | 27,400 | | $ 1,246,152 |
| DIVERSIFIED FINANCIAL SERVICES – 0.3% | | | | | | | | |
| Multi-Sector Holdings – 0.3% | | | | | | | | |
| Leucadia National Corp. | | | | | | 11,000 | | 596,750 |
| HEALTH CARE PROVIDERS & SERVICES – 4.7% | | | | | | | | |
| Managed Health Care – 4.7% | | | | | | | | |
| Aetna, Inc. | | | | | | 13,200 | | 673,200 |
| Health Net, Inc. (a) | | | | | | 7,500 | | 359,625 |
| WellPoint, Inc. (a) | | | | | | 114,448 | | 8,788,462 |
| | | | | | | | | 9,821,287 |
| |
| INSURANCE – 92.0% | | | | | | | | |
| Insurance Brokers – 6.7% | | | | | | | | |
| Aon Corp. | | | | | | 82,200 | | 3,255,942 |
| Arthur J. Gallagher & Co. | | | | | | 12,600 | | 371,574 |
| Brown & Brown, Inc. | | | | | | 20,400 | | 637,908 |
| Hilb Rogal & Hobbs Co. | | | | | | 10,000 | | 386,500 |
| Marsh & McLennan Companies, Inc. | | | | | | 119,700 | | 3,699,927 |
| National Financial Partners Corp. | | | | | | 26,200 | | 1,541,870 |
| USI Holdings Corp. (a) | | | | | | 109,200 | | 1,565,928 |
| Willis Group Holdings Ltd. | | | | | | 74,200 | | 2,555,448 |
| | | | | | | | | 14,015,097 |
| Life & Health Insurance – 19.1% | | | | | | | | |
| AFLAC, Inc. | | | | | | 184,200 | | 8,519,250 |
| American Equity Investment Life Holding Co. | | | | | | 52,100 | | 697,619 |
| Jefferson-Pilot Corp. | | | | | | 8,050 | | 485,013 |
| Lincoln National Corp. | | | | | | 18,800 | | 1,067,276 |
| Manulife Financial Corp. | | | | | | 63,311 | | 4,045,016 |
| MetLife, Inc. | | | | | | 181,300 | | 9,086,756 |
| Phoenix Companies, Inc. | | | | | | 37,000 | | 530,950 |
| Principal Financial Group, Inc. | | | | | | 31,800 | | 1,549,296 |
| Protective Life Corp. | | | | | | 23,800 | | 1,160,250 |
| Prudential Financial, Inc. | | | | | | 105,500 | | 8,127,720 |
| StanCorp Financial Group, Inc. | | | | | | 22,400 | | 1,211,840 |
| Torchmark Corp. | | | | | | 20,100 | | 1,098,867 |
| UICI | | | | | | 21,100 | | 774,159 |
| UnumProvident Corp. | | | | | | 78,935 | | 1,633,165 |
| | | | | | | | | 39,987,177 |
| Multi-Line Insurance – 17.5% | | | | | | | | |
| American Financial Group, Inc., Ohio | | | | | | 31,000 | | 1,283,400 |
| American International Group, Inc. | | | | | | 275,800 | | 18,302,089 |
| Assurant, Inc. | | | | | | 35,400 | | 1,607,160 |
| Genworth Financial, Inc. Class A (non-vtg.) | | | | | | 63,300 | | 2,014,206 |
| Hanover Insurance Group, Inc. | | | | | | 26,273 | | 1,272,927 |
| Hartford Financial Services Group, Inc. | | | | | | 123,350 | | 10,161,573 |
| HCC Insurance Holdings, Inc. | | | | | | 58,900 | | 1,895,991 |
| | | | | | | | | 36,537,346 |
See accompanying notes which are an integral part of the financial statements.
|
47 Annual Report
47
| Insurance Portfolio | | | | |
| Investments - continued | | | | |
| |
| |
| |
| | | Shares | | Value (Note 1) |
| Property & Casualty Insurance – 36.2% | | | | |
| ACE Ltd. | | 213,700 | | $ 11,909,501 |
| Admiral Group PLC | | 61,500 | | 609,523 |
| Alleghany Corp. | | 1,740 | | 501,120 |
| Allstate Corp. | | 155,000 | | 8,490,900 |
| AMBAC Financial Group, Inc. | | 29,850 | | 2,243,228 |
| Aspen Insurance Holdings Ltd. | | 102,700 | | 2,383,667 |
| Axis Capital Holdings Ltd. | | 93,200 | | 2,885,472 |
| Berkshire Hathaway, Inc.: | | | | |
| Class A (a) | | 33 | | 2,864,400 |
| Class B (a) | | 62 | | 179,056 |
| Catlin Group Ltd. | | 162,900 | | 1,468,046 |
| Cincinnati Financial Corp. | | 13,701 | | 607,776 |
| Fidelity National Financial, Inc. | | 58,284 | | 2,200,804 |
| Fidelity National Title Group, Inc. Class A | | 12,402 | | 293,927 |
| James River Group, Inc. | | 10,500 | | 252,000 |
| Markel Corp. (a) | | 3,500 | | 1,149,925 |
| MBIA, Inc. | | 53,900 | | 3,166,086 |
| Navigators Group, Inc. (a) | | 13,100 | | 614,390 |
| Old Republic International Corp. | | 76,625 | | 1,631,346 |
| Philadelphia Consolidated Holdings Corp. (a) | | 6,400 | | 684,800 |
| RLI Corp. | | 8,700 | | 458,664 |
| Specialty Underwriters’ Alliance, Inc. (a) | | 87,400 | | 549,737 |
| The Chubb Corp. | | 63,229 | | 6,054,177 |
| The St. Paul Travelers Companies, Inc. | | 261,591 | | 11,243,181 |
| United America Indemnity Ltd. Class A (a) | | 51,000 | | 1,160,250 |
| W.R. Berkley Corp. | | 109,562 | | 6,342,544 |
| White Mountains Insurance Group Ltd. | | 900 | | 496,809 |
| XL Capital Ltd. Class A | | 77,500 | | 5,235,125 |
| | | | | 75,676,454 |
| Reinsurance – 12.5% | | | | |
| Arch Capital Group Ltd. (a) | | 19,800 | | 1,119,888 |
| Benfield Group PLC | | 55,700 | | 346,857 |
| Endurance Specialty Holdings Ltd. | | 188,400 | | 5,934,600 |
| Everest Re Group Ltd. | | 38,900 | | 3,852,656 |
| IPC Holdings Ltd. | | 20,700 | | 543,789 |
| Max Re Capital Ltd. | | 39,500 | | 964,195 |
| Montpelier Re Holdings Ltd. | | 24,500 | | 422,380 |
| Muenchener Rueckversicherungs-Gesellschaft AG (Reg.) | | 8,500 | | 1,152,612 |
| Odyssey Re Holdings Corp. (d) | | 13,600 | | 319,328 |
| PartnerRe Ltd. | | 58,200 | | 3,527,502 |
| Platinum Underwriters Holdings Ltd. | | 132,100 | | 4,044,902 |
| Reinsurance Group of America, Inc. | | 22,400 | | 1,035,552 |
| Scottish Re Group Ltd. | | 60,000 | | 1,500,000 |
| Swiss Reinsurance Co. (Reg.) | | 14,328 | | 1,020,581 |
| Transatlantic Holdings, Inc. | | 4,862 | | 297,263 |
| | | | | 26,082,105 |
| |
| TOTAL INSURANCE | | | | 192,298,179 |
See accompanying notes which are an integral part of the financial statements.
Annual Report 48
| Common Stocks – continued | | | | |
| | | Shares | | Value (Note 1) |
| |
| THRIFTS & MORTGAGE FINANCE – 2.0% | | | | |
| Thrifts & Mortgage Finance – 2.0% | | | | |
| MGIC Investment Corp. | | 31,100 | | $ 1,982,625 |
| Radian Group, Inc. | | 21,300 | | 1,208,775 |
| The PMI Group, Inc. | | 23,000 | | 995,900 |
| | | | | 4,187,300 |
| |
| TOTAL COMMON STOCKS | | | | |
| (Cost $151,437,506) | | | | 208,149,668 |
| |
| Money Market Funds — 0.8% | | | | |
| |
| Fidelity Cash Central Fund, 4.57% (b) | | 1,345,042 | | 1,345,042 |
| Fidelity Securities Lending Cash Central Fund, 4.58% (b)(c) | | 242,500 | | 242,500 |
| TOTAL MONEY MARKET FUNDS | | | | |
| (Cost $1,587,542) | | | | 1,587,542 |
| |
| TOTAL INVESTMENT PORTFOLIO - 100.4% | | | | |
| (Cost $153,025,048) | | | | 209,737,210 |
| |
| NET OTHER ASSETS – (0.4)% | | | | (810,149) |
| NET ASSETS – 100% | | | | $208,927,061 |
(a) Non-income producing
(b) Affiliated fund that is available only to investment companies and other accounts managed by Fidelity Investments. The rate quoted is the annualized seven-day yield of the fund at period end. A complete unaudited listing of the fund’s holdings as of its most recent quarter end is available upon request.
(c) Investment made with cash collateral received from securities on loan. (d) Security or a portion of the security is on loan at period end.
Information regarding fiscal year to date income earned by the fund from the affiliated Central funds is as follows:
| Fund | | Income earned |
| Fidelity Cash Central Fund | | $ 115,438 |
| Fidelity Securities Lending Cash Central Fund | | 13,687 |
| Total | | $ 129,125 |
| |
| Other Information | | |
| Distribution of investments by country of issue, as a percentage of total net assets, is as follows: | | |
| United States of America | | 75.2% |
| Bermuda | | 20.0% |
| Canada | | 1.9% |
| Cayman Islands | | 1.3% |
| Others (individually less than 1%) | | 1.6% |
| | | 100.0% |
See accompanying notes which are an integral part of the financial statements.
|
49 Annual Report
49
| Insurance Portfolio | | | | | | | | |
| |
| Financial Statements | | | | | | | | |
| |
| |
| Statement of Assets and Liabilities | | | | | | | | |
| | | | | | | | | February 28, 2006 |
| |
| Assets | | | | | | | | |
| Investment in securities, at value (including securities loaned of $234,800) — See accompanying schedule: | | | | | | | | |
| Unaffiliated issuers (cost $151,437,506) | | $ | | 208,149,668 | | | | |
| Affiliated Central Funds (cost $1,587,542) | | | | 1,587,542 | | | | |
| Total Investments (cost $153,025,048) | | | | | | $ | | 209,737,210 |
| Receivable for investments sold | | | | | | | | 945,584 |
| Receivable for fund shares sold | | | | | | | | 257,980 |
| Dividends receivable | | | | | | | | 166,109 |
| Interest receivable | | | | | | | | 5,596 |
| Prepaid expenses | | | | | | | | 741 |
| Other affiliated receivables | | | | | | | | 101 |
| Other receivables | | | | | | | | 2,444 |
| Total assets | | | | | | | | 211,115,765 |
| |
| Liabilities | | | | | | | | |
| Payable for investments purchased | | $ | | 844,679 | | | | |
| Payable for fund shares redeemed | | | | 909,902 | | | | |
| Accrued management fee | | | | 98,522 | | | | |
| Other affiliated payables | | | | 64,871 | | | | |
| Other payables and accrued expenses | | | | 28,230 | | | | |
| Collateral on securities loaned, at value | | | | 242,500 | | | | |
| Total liabilities | | | | | | | | 2,188,704 |
| |
| Net Assets | | | | | | $ | | 208,927,061 |
| Net Assets consist of: | | | | | | | | |
| Paid in capital | | | | | | $ | | 149,712,672 |
| Undistributed net investment income | | | | | | | | 356,778 |
| Accumulated undistributed net realized gain (loss) on investments and foreign currency transactions | | | | | | | | 2,144,959 |
| Net unrealized appreciation (depreciation) on investments and assets and liabilities in foreign currencies | | | | | | | | 56,712,652 |
| Net Assets, for 3,040,366 shares outstanding | | | | | | $ | | 208,927,061 |
| Net Asset Value, offering price and redemption price per share ($208,927,061 ÷ 3,040,366 shares) | | | | | | $ | | 68.72 |
| |
| Statement of Operations | | | | | | | | |
| | | | | | | | | Year ended February 28, 2006 |
| |
| Investment Income | | | | | | | | |
| Dividends | | | | | | $ | | 2,744,808 |
| Special dividends | | | | | | | | 1,096,590 |
| Interest | | | | | | | | 23 |
| Income from affiliated Central Funds | | | | | | | | 129,125 |
| Total income | | | | | | | | 3,970,546 |
| |
| Expenses | | | | | | | | |
| Management fee | | $ | | 1,077,829 | | | | |
| Transfer agent fees | | | | 672,875 | | | | |
| Accounting and security lending fees | | | | | | | | |
| | | | | 94,736 | | | | |
| Independent trustees’ compensation | | | | 800 | | | | |
| Custodian fees and expenses | | | | 19,627 | | | | |
| Registration fees | | | | 44,855 | | | | |
| Audit | | | | 34,525 | | | | |
| Legal | | | | 1,057 | | | | |
| Miscellaneous | | | | 1,803 | | | | |
| Total expenses before reductions | | | | 1,948,107 | | | | |
| Expense reductions | | | | (22,112) | | | | 1,925,995 |
| |
| Net investment income (loss) | | | | | | | | 2,044,551 |
See accompanying notes which are an integral part of the financial statements.
Annual Report 50
| Realized and Unrealized Gain (Loss) | | | | | | |
| Net realized gain (loss) on: | | | | | | |
| Investment securities: | | | | | | |
| Unaffiliated issuers | | 6,226,467 | | | | |
| Foreign currency transactions | | 13,610 | | | | |
| Total net realized gain (loss) | | | | | | 6,240,077 |
| Change in net unrealized appreciation (depreciation) on: | | | | | | |
| Investment securities | | 15,534,286 | | | | |
| Assets and liabilities in foreign currencies | | 541 | | | | |
| Total change in net unrealized appreciation (depreciation) | | | | | | 15,534,827 |
| Net gain (loss) | | | | | | 21,774,904 |
| Net increase (decrease) in net assets resulting from operations | | | | $ | | 23,819,455 |
See accompanying notes which are an integral part of the financial statements.
|
51 Annual Report
| Insurance Portfolio | | | | | | | | | | | | | | | | | | | | |
| Financial Statements - continued | | | | | | | | | | | | | | | | | | | | |
| |
| |
| Statement of Changes in Net Assets | | | | | | | | | | | | | | | | | | | | |
| | | | | | | | | | | | | | | | | Year ended | | | | Year ended |
| | | | | | | | | | | | | | | | | February 28, | | | | February 28, |
| | | | | | | | | | | | | | | | | 2006 | | | | 2005 |
| Increase (Decrease) in Net Assets | | | | | | | | | | | | | | | | | | | | |
| Operations | | | | | | | | | | | | | | | | | | | | |
| Net investment income (loss) | | | | | | | | | | | | | | $ | | 2,044,551 | | $ | | 671,918 |
| Net realized gain (loss) | | | | | | | | | | | | | | | | 6,240,077 | | | | 976,881 |
| Change in net unrealized appreciation (depreciation) | | | | | | | | | | | | | | | | 15,534,827 | | | | 4,724,498 |
| Net increase (decrease) in net assets resulting from operations | | | | | | | | | | | | | | 23,819,455 | | | | 6,373,297 |
| Distributions to shareholders from net investment income | | | | | | | | | | | | | | | | (1,925,489) | | | | (267,343) |
| Distributions to shareholders from net realized gain | | | | | | | | | | | | | | | | (4,025,157) | | | | (1,505,092) |
| Total distributions | | | | | | | | | | | | | | | | (5,950,646) | | | | (1,772,435) |
| Share transactions | | | | | | | | | | | | | | | | | | | | |
| Proceeds from sales of shares | | | | | | | | | | | | | | | | 160,969,117 | | | | 178,636,899 |
| Reinvestment of distributions | | | | | | | | | | | | | | | | 5,726,500 | | | | 1,708,932 |
| Cost of shares redeemed | | | | | | | | | | | | | | | | (149,078,874) | | | | (163,507,040) |
| Net increase (decrease) in net assets resulting from share transactions | | | | | | | | | | | | 17,616,743 | | | | 16,838,791 |
| Redemption fees | | | | | | | | | | | | | | | | 64,892 | | | | 61,658 |
| Total increase (decrease) in net assets | | | | | | | | | | | | | | | | 35,550,444 | | | | 21,501,311 |
| |
| Net Assets | | | | | | | | | | | | | | | | | | | | |
| Beginning of period | | | | | | | | | | | | | | | | 173,376,617 | | | | 151,875,306 |
| End of period (including undistributed net investment income of $356,778 and undistributed net investment income | | | | | | | | |
| of $400,116, respectively) | | | | | | | | | | | | | | $ | | 208,927,061 | | $ | | 173,376,617 |
| |
| Other Information | | | | | | | | | | | | | | | | | | | | |
| Shares | | | | | | | | | | | | | | | | | | | | |
| Sold | | | | | | | | | | | | | | | | 2,435,562 | | | | 3,055,553 |
| Issued in reinvestment of distributions | | | | | | | | | | | | | | | | 85,883 | | | | 28,451 |
| Redeemed | | | | | | | | | | | | | | | | (2,270,942) | | | | (2,839,438) |
| Net increase (decrease) | | | | | | | | | | | | | | | | 250,503 | | | | 244,566 |
| |
| Financial Highlights | | | | | | | | | | | | | | | | | | | | |
| Years ended February 28, | | | | 2006 | | 2005 | | | | 2004F | | | | 2003 | | | | 2002 |
| Selected Per-Share Data | | | | | | | | | | | | | | | | | | | | |
| Net asset value, beginning of period | | $ | | 62.15 | | $ | | 59.67 | | $ | | 41.06 | | $ | | 50.79 | | $ | | 47.12 |
| Income from Investment Operations | | | | | | | | | | | | | | | | | | | | |
| Net investment income (loss)C | | | | 70D | | | | .23 | | | | .08 | | | | .02 | | | | .13 |
| Net realized and unrealized gain (loss) | | | | 7.71 | | | | 2.92 | | | | 19.88 | | | | (8.14) | | | | 3.83 |
| Total from investment operations | | | | 8.41 | | | | 3.15 | | | | 19.96 | | | | (8.12) | | | | 3.96 |
| Distributions from net investment income | | | | (.60) | | | | (.10) | | | | (.08) | | | | (.09) | | | | (.03) |
| Distributions from net realized gain | | | | (1.26) | | | | (.59) | | | | (1.29) | | | | (1.55) | | | | (.30) |
| Total distributions | | | | (1.86) | | | | (.69) | | | | (1.37) | | | | (1.64) | | | | (.33) |
| Redemption fees added to paid in capitalC | | | | 02 | | | | .02 | | | | .02 | | | | .03 | | | | .04 |
| Net asset value, end of period | | $ | | 68.72 | | $ | | 62.15 | | $ | | 59.67 | | $ | | 41.06 | | $ | | 50.79 |
| Total ReturnA,B | | | | 13.68% | | | | 5.35% | | | | 49.04% | | | | (16.41)% | | | | 8.56% |
| Ratios to Average Net AssetsE | | | | | | | | | | | | | | | | | | | | |
| Expenses before reductions | | | | 1.03% | | | | 1.05% | | | | 1.24% | | | | 1.26% | | | | 1.20% |
| Expenses net of fee waivers, if any | | | | 1.03% | | | | 1.05% | | | | 1.24% | | | | 1.26% | | | | 1.20% |
| Expenses net of all reductions | | | | 1.02% | | | | 1.04% | | | | 1.23% | | | | 1.24% | | | | 1.17% |
| Net investment income (loss) | | | | 1.08%D | | | | .39% | | | | .16% | | | | .05% | | | | .28% |
| Supplemental Data | | | | | | | | | | | | | | | | | | | | |
| Net assets, end of period (000 omitted) | | $ 208,927 | | $ 173,377 | | $ 151,875 | | $ | | 88,150 | | $ | | 143,213 |
| Portfolio turnover rate | | | | 44% | | | | 50% | | | | 59% | | | | 95% | | | | 104% |
| |
| | | |
| | |
A Total returns would have been lower had certain expenses not been reduced during the periods shown.B Total returns do not include the effect of the former sales charges. C Calculated based on average shares outstanding during the period. D Investment income per share reflects special dividends which amounted to $.38 per share. Excluding these special dividends, the ratio of net investment income (loss) to average net assets would have been .50%. E Expense ratios reflect operating expenses of the fund. Expenses before reductions do not reflect amounts reimbursed by the investment adviser or reductions from brokerage service arrangements or other expense offset arrangements and do not represent the amount paid by the fund during periods when reimbursements or reductions occur. Expenses net of fee waivers reflect expenses after reimbursement by the investment adviser but prior to reductions from brokerage service arrangements or other expense offset arrange ments. Expenses net of all reductions represent the net expenses paid by the fund. FFor the year ended February 29.See accompanying notes which are an integral part of the financial statements.
Annual Report 52
Notes to Financial Statements
For the period ended February 28, 2006
|
1. Significant Accounting Policies.
|
Banking Portfolio, Brokerage and Investment Management Portfolio, Financial Services Portfolio, Home Finance Portfolio, and Insurance Portfolio (the funds) are funds of Fidelity Select Portfolios (the trust). The trust is registered under the Investment Company Act of 1940, as amended (the 1940 Act), as an open-end management investment company organized as a Massachusetts business trust. The funds are non-diversified with the exception of Fidelity Select Home Finance, Financial Services, and Banking. The funds invest primarily in securities of companies whose principal business activities fall within specific industries. Each fund is authorized to issue an unlimited number of shares. Certain funds may invest in affiliated money market central funds (Money Market Central Funds) collectively referred to as Central Funds, which are open-end investment companies available to investment companies and other accounts managed by Fidelity Management & Research Company (FMR) and its affiliates. The financial statements have been prepared in conformity with accounting principles generally accepted in the United States of America, which require management to make certain estimates and assumptions at the date of the financial statements. The following summarizes the significant accounting policies of the funds:
Security Valuation. Investments are valued and net asset value (NAV) per share is calculated (NAV calculation) as of the close of business of the New York Stock Exchange (NYSE), normally 4:00 p.m. Eastern time. In addition, each fund intends to calculate a NAV each hour on the hour (commencing at 10:00 a.m. Eastern time until one hour prior to the close of business on the NYSE) under normal business conditions. Each fund’s investments are valued as of these times for the purpose of computing the fund’s hourly NAV. Wherever possible, each fund uses independent pricing services approved by the Board of Trustees to value their investments.
Equity securities, including restricted securities, for which market quotations are readily available, are valued at the last reported sale price or official closing price as reported by an independent pricing service on the primary market or exchange on which they are traded. In the event there were no sales during the day or closing prices are not available, securities are valued at the last quoted bid price. Investments in open-end mutual funds, are valued at their closing net asset value each business day. Short-term securities with remaining maturities of sixty days or less for which quotations are not readily available are valued at amortized cost, which approximates value.
When current market prices or quotations are not readily available or do not accurately reflect fair value, valuations may be determined in accordance with procedures adopted by the Board of Trustees. For example, when developments occur between the close of a market and the close of the NYSE that may materially affect the value of some or all of the securities, or when trading in a security is halted, those securities may be fair valued. Factors used in the determination of fair value may include monitoring news to identify significant market or security specific events such as changes in the value of U.S. securities markets, reviewing developments in foreign markets and evaluating the performance of ADRs, futures contracts and exchange-traded funds. Because each fund’s utilization of fair value pricing depends on market activity, the frequency with which fair value pricing is used can not be predicted and may be utilized to a significant extent. The value of securities used for NAV calculation under fair value pricing may differ from published prices for the same securities. Fidelity may suspend the calculation of one or more hourly NAVs for funds for any period in which prices for a portion of the stocks or securities held by the funds are not readily available.
Foreign Currency. Certain funds may use foreign currency contracts to facilitate transactions in foreign-denominated securities. Losses from these transactions may arise from changes in the value of the foreign currency or if the counterparties do not perform under the contracts’ terms.
Foreign-denominated assets, including investment securities, and liabilities are translated into U.S. dollars at the exchange rate at period end. Purchases and sales of investment securities, income and dividends received and expenses denominated in foreign currencies are translated into U.S. dollars at the exchange rate in effect on the transaction date.
The effects of exchange rate fluctuations on investments are included with the net realized and unrealized gain (loss) on investment securities. Other foreign currency transactions resulting in realized and unrealized gain (loss) are disclosed separately.
Investment Transactions and Income. Security transactions are accounted for as of trade date. Gains and losses on securities sold are determined on the basis of identified cost and may include proceeds received from litigation. Dividend income is recorded on the ex-dividend date, except for certain dividends from foreign securities where the ex-dividend date may have passed, which are recorded as soon as the funds are informed of the ex-dividend date. Non-cash dividends included in dividend income, if any, are recorded at the fair market value of the securities received. Distributions received on securities that represent a return of capital or capital gain are recorded as a reduction of cost of investments and/or as a realized gain. The funds estimate the components of distributions received that may be considered return of capital distributions or capital gain distributions. Large, non-recurring dividends recognized by the funds are presented separately on the Statement of Operations as “Special Dividends” and the impact of these dividends is presented in the Financial Highlights. Interest income is accrued as earned. Interest income includes coupon interest and amortization of premium and accretion of discount on debt securities. Investment income is recorded net of foreign taxes withheld where recovery of such taxes is uncertain.
Expenses. Most expenses of the trust can be directly attributed to a fund. Expenses which cannot be directly attributed are apportioned among each fund in the trust.
53 Annual Report
Notes to Financial Statements - continued
1. Significant Accounting Policies - continued
|
Income Tax Information and Distributions to Shareholders. Each year, each fund intends to qualify as a regulated investment company by distributing all of its taxable income and realized gains under Subchapter M of the Internal Revenue Code. As a result, no provision for income taxes is required in the accompanying financial statements. Foreign taxes are provided for based on each fund’s understanding of the tax rules and rates that exist in the foreign markets in which it invests.
Distributions are recorded on the ex-dividend date. Income and capital gain distributions are determined in accordance with income tax regulations, which may differ from generally accepted accounting principles. In addition, certain funds will claim a portion of the payment made to redeeming shareholders as a distribution for income tax purposes.
Capital accounts within the financial statements are adjusted for permanent book-tax differences. These adjustments have no impact on net assets or the results of operations. Temporary book-tax differences will reverse in a subsequent period.
Book-tax differences are primarily due to losses deferred due to wash sales.
|
The tax-basis components of distributable earnings and the federal tax cost as of period end were as follows for each fund:
| | | Cost for | | | | | | | | | | Net Unrealized |
| | | Federal Income | | Unrealized | | | | Unrealized | | | | Appreciation/ |
| | | Tax Purposes | | Appreciation | | | | Depreciation | | | | (Depreciation) |
| Banking Portfolio | | $ 253,674,529 | | $ 114,942,799 | | $ | | (1,914,249) | | $ | | 113,028,550 |
| Brokerage and Investment Management Portfolio | | 1,068,190,471 | | 257,464,754 | | | | (5,159,203) | | | | 252,305,551 |
| Financial Services Portfolio | | 342,302,177 | | 152,376,788 | | | | (4,200,918) | | | | 148,175,870 |
| Home Finance Portfolio | | 240,648,357 | | 71,755,237 | | | | (5,329,379) | | | | 66,425,858 |
| Insurance Portfolio | | 153,660,371 | | 57,866,641 | | | | (1,789,802) | | | | 56,076,839 |
| |
| | | | | | | | | | | | | Undistributed |
| | | | | | | | | Undistributed | | | | Long-term |
| | | | | | | | | Ordinary Income | | | | Capital Gain |
| Banking Portfolio | | | | | | $ | | 1,392,487 | | $ | | 5,574,708 |
| Brokerage and Investment Management Portfolio | | | | | | | | 34,893,418 | | | | 8,480,295 |
| Financial Services Portfolio | | | | | | | | 1,756,008 | | | | 13,588,420 |
| Home Finance Portfolio | | | | | | | | 1,045,245 | | | | 2,744,570 |
| Insurance Portfolio | | | | | | | | 162,202 | | | | 1,264,059 |
| |
| The tax character of distributions paid was as follows: | | | | | | | | | | | | |
| |
| February 28, 2006 | | | | | | | | | | | | |
| | | | | Ordinary | | | | Long-term | | | | |
| | | | | Income | | | | Capital Gains | | | | Total |
| Banking Portfolio | | | | $ 7,062,913 | | $ | | 32,253,480 | | $ | | 39,316,393 |
| Brokerage and Investment Management Portfolio | | | | 6,267,935 | | | | 45,444,492 | | | | 51,712,427 |
| Financial Services Portfolio | | | | 6,776,322 | | | | 33,763,028 | | | | 40,539,350 |
| Home Finance Portfolio | | | | 5,380,189 | | | | 37,238,765 | | | | 42,618,954 |
| Insurance Portfolio | | | | 1,925,489 | | | | 4,025,157 | | | | 5,950,646 |
| |
| February 28, 2005 | | | | | | | | | | | | |
| | | | | Ordinary | | | | Long-term | | | | |
| | | | | Income | | | | Capital Gains | | | | Total |
| Banking Portfolio | | | | $ 6,747,905 | | $ | | 40,954,844 | | | | $47,702,749 |
| Brokerage and Investment Management Portfolio | | | | 1,897,672 | | | | — | | | | 1,897,672 |
| Financial Services Portfolio | | | | 3,801,680 | | | | 40,142,276 | | | | 43,943,956 |
| Home Finance Portfolio | | | | 3,477,354 | | | | 56,184,735 | | | | 59,662,089 |
| Insurance Portfolio | | | | 267,343 | | | | 1,505,092 | | | | 1,772,435 |
Trading (Redemption) Fees. Shares in the funds held less than 30 days are subject to a redemption fee equal to .75% of the net asset value of shares redeemed. All redemption fees, including any estimated redemption fees paid by FMR, are retained by the fund and accounted for as an addition to paid in capital. Shareholders are also subject to an additional $7.50 fee for shares exchanged into another Fidelity fund (see Note 4).
Repurchase Agreements. FMR has received an Exemptive Order from the Securities and Exchange Commission (the SEC) which permits certain funds and other affiliated entities of FMR to transfer uninvested cash balances into joint trading accounts which are then invested in repurchase agreements. Certain funds may also invest directly with institutions in repurchase agreements. Repurchase agreements are collateralized by government or non-government securities. Upon settlement date, collateral is held in segregated accounts with custodian banks and may be obtained in the event of a default of the counterparty. Each applicable fund monitors, on a daily basis, the value of the collateral to ensure it is at least equal to the principal amount of the repurchase agreement (including accrued interest). In the event of a default by the counterparty, realization of the collateral proceeds could be delayed, during which time the value of the collateral may decline.
Restricted Securities. Certain funds may invest in securities that are subject to legal or contractual restrictions on resale. These securities generally may be resold in transactions exempt from registration or to the public if the securities are registered. Disposal of these securities may involve time-consuming negotiations and expense, and prompt sale at an acceptable price may be difficult. Information regarding restricted securities is included at the end of each applicable fund’s Schedule of Investments.
| 3. Purchases and Sales of Investments. | | | | |
| |
| Purchases and sales of securities, other than short-term securities and U.S. government securities, are noted in the table below. | | |
| |
| | | Purchases ($) | | Sales ($) |
| Banking Portfolio | | 265,014,484 | | 383,489,476 |
| Brokerage and Investment Management Portfolio | | 1,247,566,592 | | 714,871,868 |
| Financial Services Portfolio | | 217,032,817 | | 268,327,601 |
| Home Finance Portfolio | | 242,629,935 | | 333,662,834 |
| Insurance Portfolio | | 96,660,051 | | 81,508,865 |
Select Financial Services and Select Home Finance were reimbursed by the funds’ investment adviser for losses on the sale of investments in a prior period that did not meet the investment restrictions of the funds.
4. Fees and Other Transactions with Affiliates.
|
Management Fee. FMR and its affiliates provide the funds with investment management related services for which the funds pay a monthly management fee. The management fee is the sum of an individual fund fee rate and a group fee rate. The individual fund fee rate is applied to each fund’s average net assets. The group fee rate is based upon the average net assets of all the mutual funds advised by FMR. The group fee rate decreases as assets under management increase and increases as assets under management decrease. For the period, each fund’s annual management fee rate expressed as a percentage of each fund’s average net assets was as follows:
| | | Individual Rate | | Group Rate | | Total |
| Banking Portfolio | | 30% | | .27% | | .57% |
| Brokerage and Investment Management Portfolio | | 30% | | .27% | | .58% |
| Financial Services Portfolio | | 30% | | .27% | | .57% |
| Home Finance Portfolio | | 30% | | .27% | | .57% |
| Insurance Portfolio | | 30% | | .27% | | .57% |
Sales Load. Fidelity Distributors Corporation (FDC), an affiliate of FMR, is the general distributor of the funds. Shares purchased prior to October 12, 1990, were subject to a 1% deferred sales charge upon redemption or exchange to any other Fidelity fund (other than Select funds). Effective July 1, 2005, the deferred sales charge was eliminated. For the period, sales charge amounts retained by FDC were as follows:
| | | Retained |
| | | by FDC |
| Banking Portfolio | | $ 1,665 |
| Brokerage and Investment Management Portfolio | | 556 |
| Financial Services Portfolio | | 5,676 |
| Home Finance Portfolio | | 821 |
| Insurance Portfolio | | 426 |
Transfer Agent Fees. Fidelity Service Company, Inc. (FSC), an affiliate of FMR, is the funds’ transfer, dividend disbursing and shareholder servicing agent. FSC receives account fees and asset-based fees that vary according to account size and type of account. FSC pays for typesetting, printing and mailing of shareholder reports, except proxy statements. For the period, the transfer agent fees were equivalent to the following annual rates expressed as a percentage of average net assets:
| Banking Portfolio | | 30% |
| Brokerage and Investment Management Portfolio | | 29% |
| Financial Services Portfolio | | 32% |
| Home Finance Portfolio | | 32% |
| Insurance Portfolio | | 36% |
55 Annual Report
Notes to Financial Statements - continued
4. Fees and Other Transactions with Affiliates - continued
Accounting and Security Lending Fees. FSC maintains each fund’s accounting records. The accounting fee is based on the level of average net assets for the month. Under a separate contract, FSC administers the security lending program. The security lending fee is based on the number and duration of lending transactions.
Affiliated Central Funds. Certain funds may invest in Money Market Central Funds which seek preservation of capital and current income and are managed by Fidelity Investments Money Management, Inc. (FIMM) an affiliate of FMR.
The Money Market Central Funds do not pay a management fee.
|
Exchange Fees. FSC receives the proceeds of $7.50 to cover administrative costs associated with exchanges out of the funds to any other Fidelity Select fund or to any other Fidelity fund. For the period, exchange fees retained by FSC were as follows:
| | | Retained |
| | | by FSC |
| Banking Portfolio | | $ | | 8,213 |
| Brokerage and Investment Management Portfolio | | | | 5,610 |
| Financial Services Portfolio | | | | 5,700 |
| Home Finance Portfolio | | | | 7,583 |
| Insurance Portfolio | | | | 3,023 |
Brokerage Commissions. Certain funds placed a portion of their portfolio transactions with brokerage firms which are affiliates of the investment adviser. The commissions paid to these affiliated firms were as follows:
| | | Amount |
| Banking Portfolio | | $ 6,605 |
| Brokerage and Investment Management Portfolio | | 50,322 |
| Financial Services Portfolio | | 9,305 |
| Home Finance Portfolio | | 7,389 |
| Insurance Portfolio | | 3,510 |
Interfund Lending Program. Pursuant to an Exemptive Order issued by the SEC, the funds, along with other registered investment companies having management contracts with FMR, may participate in an interfund lending program. This program provides an alternative credit facility allowing the funds to borrow from, or lend money to, other participating affiliated funds. At period end, there were no interfund loans outstanding. Each applicable fund’s activity in this program during the period for which loans were outstanding was as follows:
| | | Borrower | | Average Daily | | Weighted Average | | Interest |
| | | or Lender | | Loan Balance | | Interest Rate | | Expense |
| Financial Services Portfolio | | Borrower | | $9,240,000 | | 2.67% | | $ 686 |
| |
| 5. Committed Line of Credit. | | | | | | | | |
Certain funds participate with other funds managed by FMR in a $4.2 billion credit facility (the “line of credit”) to be utilized for temporary or emergency purposes to fund shareholder redemptions or for other short-term liquidity purposes. The participating funds have agreed to pay commitment fees on their pro rata portion of the line of credit. During the period, there were no borrowings on this line of credit.
Certain funds lend portfolio securities from time to time in order to earn additional income. On the settlement date of the loan, each applicable fund receives collateral (in the form of U.S. Treasury obligations, letters of credit and/or cash) against the loaned securities and maintains collateral in an amount not less than 100% of the market value of the loaned securities during the period of the loan. The market value of the loaned securities is determined at the close of business of the funds and any additional required collateral is delivered to the funds on the next business day. If the borrower defaults on its obligation to return the securities loaned because of insolvency or other reasons, a fund could experience delays and costs in recovering the securities loaned or in gaining access to the collateral. Any cash collateral received is invested in the Fidelity Securities Lending Cash Central Fund. The value of loaned securities and cash collateral at period end are disclosed on each applicable fund’s Statement of Assets and Liabilities. Security lending income represents the income earned on investing cash collateral, less fees and expenses associated with the loan, plus any premium
6. Security Lending - continued
|
payments that may be received on the loan of certain types of securities. Security lending income is presented on each applicable fund’s Statement of Operations as a component of income from affiliated central funds. Net income from lending portfolio securities during the period amounted to:
| Banking Portfolio | | $ 20,404 |
| Brokerage and Investment Management Portfolio | | 340,618 |
| Financial Services Portfolio | | 81,042 |
| Home Finance Portfolio | | 45,770 |
| Insurance Portfolio | | 13,687 |
| |
| |
| 7. Expense Reductions. | | |
Many of the brokers with whom FMR places trades on behalf of certain funds provided services to these funds in addition to trade execution. These services included payments of expenses on behalf of each applicable fund. In addition, through arrangements with each applicable fund’s custodian and transfer agent, credits realized as a result of uninvested cash balances were used to reduce each applicable fund’s expenses. All of the applicable expense reductions are noted in the table below.
| | | | | | | | | | | Transfer |
| | | | | | | Custody | | | | Agent |
| | | Brokerage Service | | | | expense | | | | expense |
| | | Arrangements | | | | reduction | | | | reduction |
| Banking Portfolio | | $ 100,357 | | $ | | 805 | | $ | | 2,776 |
| Brokerage and Investment Management Portfolio | | 354,982 | | | | 1,753 | | | | 2,059 |
| Financial Services Portfolio | | 83,794 | | | | 10 | | | | 6,783 |
| Home Finance Portfolio | | 98,464 | | | | — | | | | 4,040 |
| Insurance Portfolio | | 20,892 | | | | — | | | | 1,220 |
| |
| 8. Other. | | | | | | | | | | |
The funds’ organizational documents provide former and current trustees and officers with a limited indemnification against liabilities arising in connection with the performance of their duties to the funds. In the normal course of business, the funds may also enter into contracts that provide general indemnifications. The funds’ maximum exposure under these arrangements is unknown as this would be dependent on future claims that may be made against the funds. The risk of material loss from such claims is considered remote.
57 Annual Report
Report of Independent Registered Public Accounting Firm
To the Trustees of Fidelity Select Portfolios and the Shareholders of Banking Portfolio, Brokerage and Investment Management Portfolio, Financial Services Portfolio, Home Finance Portfolio, and Insurance Portfolio:
In our opinion, the accompanying statements of assets and liabilities, including the schedules of investments, and the related statements of operations and of changes in net assets and the financial highlights present fairly, in all material respects, the financial position of Banking Portfolio, Brokerage and Investment Management Portfolio, Financial Services Portfolio, Home Finance Portfolio, and Insurance Portfolio (funds of Fidelity Select Portfolios) at February 28, 2006, and the results of each of their operations, the changes in each of their net assets and the financial highlights for each of the periods indicated, in conformity with accounting principles generally accepted in the United States of America. These financial statements and financial highlights (hereafter referred to as “financial statements”) are the responsibility of the Fidelity Select Portfolios’ management; our responsibility is to express an opinion on these financial statements based on our audits. We conducted our audits of these financial statements in accordance with the standards of the Public Company Accounting Oversight Board (United States). Those standards require that we plan and perform the audit to obtain reasonable assurance about whether the financial statements are free of material misstatement. An audit includes examining, on a test basis, evidence supporting the amounts and disclosures in the financial statements, assessing the accounting principles used and significant estimates made by management, and evaluating the overall financial statement presentation. We believe that our audits, which included confirmation of securities at February 28, 2006 by correspondence with the custodian and brokers, provide a reasonable basis for our opinion.
/s/ PricewaterhouseCoopers LLP
PricewaterhouseCoopers LLP
Boston, Massachusetts
April 17, 2006
|
Trustees and Officers
The Trustees, Members of the Advisory Board, and executive officers of the trust and funds, as applicable, are listed below. The Board of Trustees governs each fund and is responsible for protecting the interests of shareholders. The Trustees are experienced executives who meet periodically throughout the year to oversee each fund’s activities, review contractual arrangements with companies that provide services to each fund, and review each fund’s performance. Except for William O. McCoy, each of the Trustees oversees 326 funds advised by FMR or an affiliate. Mr. McCoy oversees 328 funds advised by FMR or an affiliate.
The Trustees hold office without limit in time except that (a) any Trustee may resign; (b) any Trustee may be removed by written instrument, signed by at least two-thirds of the number of Trustees prior to such removal; (c) any Trustee who requests to be retired or who has become incapacitated by illness or injury may be retired by written instrument signed by a majority of the other Trustees; and (d) any Trustee may be removed at any special meeting of shareholders by a two-thirds vote of the outstanding voting securities of the trust. Each Trustee who is not an interested person (as defined in the 1940 Act) (Independent Trustee), shall retire not later than the last day of the calendar year in which his or her 72nd birthday occurs. The Independent Trustees may waive this mandatory retirement age policy with respect to individual Trustees. The executive officers and Advisory Board Members hold office without limit in time, except that any officer and Advisory Board Member may resign or may be removed by a vote of a majority of the Trustees at any regular meeting or any special meeting of the Trustees. Except as indicated, each individual has held the office shown or other offices in the same company for the past five years.
The funds’ Statement of Additional Information (SAI) includes more information about the Trustees. To request a free copy, call Fidelity at 1-800-544-8544.
Interested Trustees*:
Correspondence intended for each Trustee who is an interested person may be sent to Fidelity Investments, 82 Devonshire Street, Boston, Massachusetts 02109.
| Name, Age; Principal Occupation |
| |
| Edward C. Johnson 3d (75) |
| |
| Year of Election or Appointment: 1980 |
| Mr. Johnson is Chairman of the Board of Trustees. Mr. Johnson serves as Chief Executive Officer, Chairman, and a Director of |
| FMR Corp.; a Director and Chairman of the Board and of the Executive Committee of FMR; Chairman and a Director of Fidelity |
| Research & Analysis Company (FRAC); Chairman and a Director of Fidelity Investments Money Management, Inc.; and Chairman |
| (2001-present) and a Director (2000-present) of FMR Co., Inc. |
| |
| Stephen P. Jonas (53) |
| |
| Year of Election or Appointment: 2005 |
| Mr. Jonas is Senior Vice President of Banking (2005-present), Brokerage and Investment Management (2005-present), Financial |
| Services (2005-present), Home Finance (2005-present), and Insurance (2005-present). He also serves as Senior Vice President of |
| �� other Fidelity funds (2005-present). Mr. Jonas is Executive Director of FMR (2005-present). Previously, Mr. Jonas served as Presi- |
| dent of Fidelity Enterprise Operations and Risk Services (2004-2005), Chief Administrative Officer (2002-2004), and Chief Finan- |
| cial Officer of FMR Co. (1998-2000). Mr. Jonas has been with Fidelity Investments since 1987 and has held various financial and |
| management positions including Chief Financial Officer of FMR. In addition, he serves on the Boards of Boston Ballet |
| (2003-present) and Simmons College (2003-present). |
| |
| Robert L. Reynolds (53) |
| |
| Year of Election or Appointment: 2003 |
| Mr. Reynolds is a Director (2003-present) and Chief Operating Officer (2002-present) of FMR Corp. He also serves on the Board |
| at Fidelity Investments Canada, Ltd. (2000-present). Previously, Mr. Reynolds served as President of Fidelity Investments Institutional |
| Retirement Group (1996-2000). |
* Trustees have been determined to be “Interested Trustees” by virtue of, among other things, their affiliation with the trust or various entities under common control with FMR.
59 Annual Report
Trustees and Officers - continued
Independent Trustees:
Correspondence intended for each Independent Trustee (that is, the Trustees other than the Interested Trustees) may be sent to Fidelity Investments, P.O. Box 55235, Boston, Massachusetts 02205-5235.
| Name, Age; Principal Occupation |
| |
| Dennis J. Dirks (57) |
| |
| Year of Election or Appointment: 2005 |
| Prior to his retirement in May 2003, Mr. Dirks was Chief Operating Officer and a member of the Board of The Depository Trust & |
| Clearing Corporation (DTCC) (1999-2003). He also served as President, Chief Operating Officer, and Board member of The De- |
| pository Trust Company (DTC) (1999-2003) and President and Board member of the National Securities Clearing Corporation |
| (NSCC) (1999-2003). In addition, Mr. Dirks served as Chief Executive Officer and Board member of the Government Securities |
| Clearing Corporation (2001-2003) and Chief Executive Officer and Board member of the Mortgage-Backed Securities Clearing |
| Corporation (2001-2003). Mr. Dirks also serves as a Trustee and a member of the Finance Committee of Manhattan College |
| (2005-present) and a Trustee and a member of the Finance Committee of AHRC of Nassau County (2006-present). |
| |
| Robert M. Gates (62) |
| |
| Year of Election or Appointment: 1997 |
| Dr. Gates is Chairman of the Independent Trustees (2006-present). Dr. Gates is President of Texas A&M University (2002-present). |
| He was Director of the Central Intelligence Agency (CIA) from 1991 to 1993. From 1989 to 1991, Dr. Gates served as Assistant |
| to the President of the United States and Deputy National Security Advisor. Dr. Gates is a Director of NACCO Industries, Inc. |
| (mining and manufacturing), Parker Drilling Co., Inc. (drilling and rental tools for the energy industry, 2001-present), and Brinker |
| International (restaurant management, 2003-present). Previously, Dr. Gates served as a Director of LucasVarity PLC (automotive |
| components and diesel engines), a Director of TRW Inc. (automotive, space, defense, and information technology), and Dean of |
| the George Bush School of Government and Public Service at Texas A&M University (1999-2001). |
| |
| George H. Heilmeier (69) |
| |
| Year of Election or Appointment: 2004 |
| Dr. Heilmeier is Chairman Emeritus of Telcordia Technologies (communication software and systems), where prior to his retirement, |
| he served as company Chairman and Chief Executive Officer. He currently serves on the Boards of Directors of The Mitre Corpo- |
| ration (systems engineering and information technology support for the government), and HRL Laboratories (private research and |
| development, 2004-present). He is Chairman of the General Motors Science & Technology Advisory Board and a Life Fellow of |
| the Institute of Electrical and Electronics Engineers (IEEE). Dr. Heilmeier is a member of the Defense Science Board and the National |
| Security Agency Advisory Board. He is also a member of the National Academy of Engineering, the American Academy of Arts |
| and Sciences, and the Board of Overseers of the School of Engineering and Applied Science of the University of Pennsylvania. |
| Previously, Dr. Heilmeier served as a Director of TRW Inc. (automotive, space, defense, and information technology, 1992-2002), |
| Compaq (1994-2002), Automatic Data Processing, Inc. (ADP) (technology-based business outsourcing, 1995-2002), INET |
| Technologies Inc. (telecommunications network surveillance, 2001-2004), and Teletech Holdings (customer management services). |
| He is the recipient of the 2005 Kyoto Prize in Advanced Technology for his invention of the liquid crystal display. |
| |
| Marie L. Knowles (59) |
| |
| Year of Election or Appointment: 2001 |
| Prior to Ms. Knowles’ retirement in June 2000, she served as Executive Vice President and Chief Financial Officer of Atlantic Rich- |
| field Company (ARCO) (diversified energy, 1996-2000). From 1993 to 1996, she was a Senior Vice President of ARCO and |
| President of ARCO Transportation Company. She served as a Director of ARCO from 1996 to 1998. She currently serves as a |
| Director of Phelps Dodge Corporation (copper mining and manufacturing) and McKesson Corporation (healthcare service, |
| 2002-present). Ms. Knowles is a Trustee of the Brookings Institution and the Catalina Island Conservancy and also serves as a |
| member of the Advisory Board for the School of Engineering of the University of Southern California. |
| |
| Ned C. Lautenbach (62) |
| |
| Year of Election or Appointment: 2000 |
| Mr. Lautenbach has been a partner of Clayton, Dubilier & Rice, Inc. (private equity investment firm) since September 1998. Pre- |
| viously, Mr. Lautenbach was with the International Business Machines Corporation (IBM) from 1968 until his retirement in 1998. |
| Mr. Lautenbach serves as a Director of Italtel Holding S.p.A. (telecommunications (Milan, Italy), 2004-present) and Eaton Corpora- |
| tion (diversified industrial) as well as the Philharmonic Center for the Arts in Naples, Florida. He also is a member of the Board of |
| Trustees of Fairfield University (2005-present), as well as a member of the Council on Foreign Relations. |
Annual Report 60
| Name, Age; Principal Occupation |
| |
| William O. McCoy (72) |
| |
| Year of Election or Appointment: 1997 |
| Prior to his retirement in December 1994, Mr. McCoy was Vice Chairman of the Board of BellSouth Corporation (telecommunica- |
| tions) and President of BellSouth Enterprises. He is currently a Director of Duke Realty Corporation (real estate), and Progress |
| Energy, Inc. (electric utility). He is also a partner of Franklin Street Partners (private investment management firm) and a member of |
| the Research Triangle Foundation Board. In addition, Mr. McCoy served as the Interim Chancellor (1999-2000) and a member of |
| the Board of Visitors for the University of North Carolina at Chapel Hill and currently serves as Chairman of the Board of Directors |
| of the University of North Carolina Health Care System and the Board of Visitors of the Kenan-Flagler Business School (University |
| of North Carolina at Chapel Hill). He also served as Vice President of Finance for the University of North Carolina (16-school |
| system). |
| |
| Cornelia M. Small (61) |
| |
| Year of Election or Appointment: 2005 |
| Ms. Small is a member (2000-present) and Chairperson (2002-present) of the Investment Committee, and a member |
| (2002-present) of the Board of Trustees of Smith College. Previously, she served as Chief Investment Officer (1999-2000), Director |
| of Global Equity Investments (1996-1999), and a member of the Board of Directors of Scudder, Stevens & Clark (1990-1997) and |
| Scudder Kemper Investments (1997-1999). In addition, Ms. Small served as Co-Chair (2000-2003) of the Annual Fund for the |
| Fletcher School of Law and Diplomacy. |
| |
| William S. Stavropoulos (66) |
| |
| Year of Election or Appointment: 2002 |
| Mr. Stavropoulos is Chairman of the Board (2000-present) and a Member of the Board of Directors of The Dow Chemical |
| Company. Since joining The Dow Chemical Company in 1967, Mr. Stavropoulos served in numerous senior management posi- |
| tions, including President (1993-2000; 2002-2003), CEO (1995-2000; 2002-2004), and Chairman of the Executive Committee |
| (2000-2004). Currently, he is a Director of NCR Corporation (data warehousing and technology solutions), BellSouth Corporation |
| (telecommunications), Chemical Financial Corporation, Maersk Inc. (industrial conglomerate, 2002-present), and Metalmark Capi- |
| tal (private equity investment firm, 2005-present). He also serves as a member of the Board of Trustees of the American Enterprise |
| Institute for Public Policy Research. In addition, Mr. Stavropoulos is a member of The Business Council, J.P. Morgan International |
| Council and the University of Notre Dame Advisory Council for the College of Science. |
| |
| Kenneth L. Wolfe (67) |
| |
| Year of Election or Appointment: 2005 |
| Prior to his retirement in 2001, Mr. Wolfe was Chairman and Chief Executive Officer of Hershey Foods Corporation (1993-2001). |
| He currently serves as a member of the boards of Adelphia Communications Corporation (2003-present), Bausch & Lomb, Inc., |
| and Revlon Inc. (2004-present). |
Advisory Board Members and Executive Officers:
Correspondence intended for Messrs. Keyes and Gamper may be sent to Fidelity Investments, P.O. Box 55235, Boston, Massachusetts 02205-5235. Correspondence intended for each executive officer and Mr. Lynch may be sent to Fidelity Investments, 82 Devonshire Street, Boston, Massachusetts 02109.
| Name, Age; Principal Occupation |
| |
| Albert R. Gamper, Jr. (63) |
| |
| Year of Election or Appointment: 2005 |
| Member of the Advisory Board of Fidelity Select Portfolios. Mr. Gamper also serves as a Trustee (2006-present) or Member of the |
| Advisory Board (2005-present) of other investment companies advised by FMR. Prior to his retirement in December 2004, Mr. |
| Gamper served as Chairman of the Board of CIT Group Inc. (commercial finance). During his tenure with CIT Group Inc. Mr. |
| Gamper served in numerous senior management positions, including Chairman (1987-1989; 1999-2001; 2002-2004), Chief |
| Executive Officer (1987-2004), and President (1989-2002). He currently serves as a member of the Board of Directors of Public |
| Service Enterprise Group (utilities, 2001-present), Chairman of the Board of Governors, Rutgers University (2004-present), and |
| Chairman of the Board of Saint Barnabas Health Care System. |
| |
| James H. Keyes (66) |
| |
| Year of Election or Appointment: 2006 |
| Member of the Advisory Board of Fidelity Select Portfolios. Prior to his retirement in 2003, Mr. Keyes was Chairman, President, |
| and Chief Executive Officer of Johnson Controls, Inc. (automotive supplier, 1993-2003). He currently serves as a member of the |
| boards of LSI Logic Corporation (semiconductor technologies, 1984-present), Navistar International Corporation (manufacture and |
| sale of trucks, buses, and diesel engines, 2002-present), and Pitney Bowes, Inc. (integrated mail, messaging, and document man- |
| agement solutions, 1998-present). |
61 Annual Report
Trustees and Officers - continued
| Name, Age; Principal Occupation |
| |
| Peter S. Lynch (62) |
| |
| Year of Election or Appointment: 2003 |
| Member of the Advisory Board of Fidelity Select Portfolios. Vice Chairman and a Director of FMR, and Vice Chairman |
| (2001-present) and a Director (2000-present) of FMR Co., Inc. Previously, Mr. Lynch served as a Trustee of the Fidelity funds |
| (1990-2003). In addition, he serves as a Trustee of Boston College, Massachusetts Eye & Ear Infirmary, Historic Deerfield, John F. |
| Kennedy Library, and the Museum of Fine Arts of Boston. |
| |
| Eric D. Roiter (57) |
| |
| Year of Election or Appointment: 1998 |
| Secretary of Banking, Brokerage and Investment Management, Financial Services, Home Finance, and Insurance. He also serves |
| as Secretary of other Fidelity funds; Vice President, General Counsel, and Secretary of FMR Co., Inc. (2001-present) and FMR; |
| Assistant Secretary of Fidelity Management & Research (U.K.) Inc. (2001-present), Fidelity Research & Analysis Company |
| (2001-present), and Fidelity Investments Money Management, Inc. (2001-present). Mr. Roiter is an Adjunct Member, Faculty of |
| Law, at Boston College Law School (2003-present). Previously, Mr. Roiter served as Vice President and Secretary of Fidelity Distrib- |
| utors Corporation (FDC) (1998-2005). |
| |
| Stuart Fross (46) |
| |
| Year of Election or Appointment: 2003 |
| Assistant Secretary of Banking, Brokerage and Investment Management, Financial Services, Home Finance, and Insurance. Mr. |
| Fross also serves as Assistant Secretary of other Fidelity funds (2003-present), Vice President and Secretary of FDC (2005-present), |
| and is an employee of FMR. |
| |
| Christine Reynolds (47) |
| |
| Year of Election or Appointment: 2004 |
| President and Treasurer of Banking, Brokerage and Investment Management, Financial Services, Home Finance, and Insurance. |
| Ms. Reynolds also serves as President and Treasurer of other Fidelity funds (2004-present) and is a Vice President (2003-present) |
| and an employee (2002-present) of FMR. Before joining Fidelity Investments, Ms. Reynolds worked at PricewaterhouseCoopers LLP |
| (PwC) (1980-2002), where she was most recently an audit partner with PwC’s investment management practice. |
| |
| R. Stephen Ganis (66) |
| |
| Year of Election or Appointment: 2006 |
| Anti-Money Laundering (AML) officer of Banking, Brokerage and Investment Management, Financial Services, Home Finance, and |
| Insurance. Mr. Ganis also serves as AML officer of other Fidelity funds (2006-present) and FMR Corp. (2003-present). Before join- |
| ing Fidelity Investments, Mr. Ganis practiced law at Goodwin Procter, LLP (2000-2002). |
| |
| Paul M. Murphy (58) |
| |
| Year of Election or Appointment: 2005 |
| Chief Financial Officer of Banking, Brokerage and Investment Management, Financial Services, Home Finance, and Insurance. Mr. |
| Murphy also serves as Chief Financial Officer of other Fidelity funds (2005-present). He also serves as Senior Vice President of |
| Fidelity Pricing and Cash Management Services Group (FPCMS). |
| |
| Kenneth A. Rathgeber (58) |
| |
| Year of Election or Appointment: 2004 |
| Chief Compliance Officer of Banking, Brokerage and Investment Management, Financial Services, Home Finance, and Insurance. |
| Mr. Rathgeber also serves as Chief Compliance Officer of other Fidelity funds (2004-present) and Executive Vice President of Risk |
| Oversight for Fidelity Investments (2002-present). He is Chief Compliance Officer of FMR (2005-present), FMR Co., Inc. |
| (2005-present), Fidelity Management & Research (U.K.) Inc. (2005-present), Fidelity Research & Analysis Company |
| (2005-present), Fidelity Investments Money Management, Inc. ( 2005-present), and Strategic Advisers, Inc. (2005-present). Pre- |
| viously, Mr. Rathgeber served as Executive Vice President and Chief Operating Officer for Fidelity Investments Institutional Services |
| Company, Inc. (1998-2002). |
| |
| Bryan A. Mehrmann (44) |
| |
| Year of Election or Appointment: 2005 |
| Deputy Treasurer of Banking, Brokerage and Investment Management, Financial Services, Home Finance, and Insurance. Mr. |
| Mehrmann also serves as Deputy Treasurer of other Fidelity funds (2005-present) and is an employee of FMR. Previously, Mr. |
| Mehrmann served as Vice President of Fidelity Investments Institutional Services Group (FIIS)/Fidelity Investments Institutional Op- |
| erations Corporation, Inc. (FIIOC) Client Services (1998-2004). |
Annual Report 62
| Name, Age; Principal Occupation |
| |
| Kimberley H. Monasterio (42) |
| |
| Year of Election or Appointment: 2004 |
| Deputy Treasurer of Banking, Brokerage and Investment Management, Financial Services, Home Finance, and Insurance. Ms. |
| Monasterio also serves as Deputy Treasurer of other Fidelity funds (2004) and is an employee of FMR (2004). Before joining |
| Fidelity Investments, Ms. Monasterio served as Treasurer (2000-2004) and Chief Financial Officer (2002-2004) of the Franklin |
| Templeton Funds and Senior Vice President of Franklin Templeton Services, LLC (2000-2004). |
| |
| Kenneth B. Robins (36) |
| |
| Year of Election or Appointment: 2005 |
| Deputy Treasurer of Banking, Brokerage and Investment Management, Financial Services, Home Finance, and Insurance. Mr. |
| Robins also serves as Deputy Treasurer of other Fidelity funds (2005-present) and is an employee of FMR (2004-present). Before |
| joining Fidelity Investments, Mr. Robins worked at KPMG LLP, where he was a partner in KPMG’s department of professional prac- |
| tice (2002-2004) and a Senior Manager (1999-2000). In addition, Mr. Robins served as Assistant Chief Accountant, United States |
| Securities and Exchange Commission (2000-2002). |
| |
| Robert G. Byrnes (39) |
| |
| Year of Election or Appointment: 2005 |
| Assistant Treasurer of Banking, Brokerage and Investment Management, Financial Services, Home Finance, and Insurance. Mr. |
| Byrnes also serves as Assistant Treasurer of other Fidelity funds (2005-present) and is an employee of FMR (2005-present). Pre- |
| viously, Mr. Byrnes served as Vice President of FPCMS (2003-2005). Before joining Fidelity Investments, Mr. Byrnes worked at |
| Deutsche Asset Management where he served as Vice President of the Investment Operations Group (2000-2003). |
| |
| John H. Costello (59) |
| |
| Year of Election or Appointment: 1986 |
| Assistant Treasurer of Banking, Brokerage and Investment Management, Financial Services, Home Finance, and Insurance. Mr. |
| Costello also serves as Assistant Treasurer of other Fidelity funds and is an employee of FMR. |
| |
| Peter L. Lydecker (52) |
| |
| Year of Election or Appointment: 2004 |
| Assistant Treasurer of Banking, Brokerage and Investment Management, Financial Services, Home Finance, and Insurance. Mr. |
| Lydecker also serves as Assistant Treasurer of other Fidelity funds (2004) and is an employee of FMR. |
| |
| Mark Osterheld (50) |
| |
| Year of Election or Appointment: 2003 |
| Assistant Treasurer of Banking, Brokerage and Investment Management, Financial Services, Home Finance, and Insurance. Mr. |
| Osterheld also serves as Assistant Treasurer of other Fidelity funds (2002) and is an employee of FMR. |
| |
| Gary W. Ryan (47) |
| |
| Year of Election or Appointment: 2005 |
| Assistant Treasurer of Banking, Brokerage and Investment Management, Financial Services, Home Finance, and Insurance. Mr. |
| Ryan also serves as Assistant Treasurer of other Fidelity funds (2005-present) and is an employee of FMR (2005-present). Pre- |
| viously, Mr. Ryan served as Vice President of Fund Reporting in FPCMS (1999-2005). |
| |
| Salvatore Schiavone (40) |
| |
| Year of Election or Appointment: 2005 |
| Assistant Treasurer of Banking, Brokerage and Investment Management, Financial Services, Home Finance, and Insurance. Mr. |
| Schiavone also serves as Assistant Treasurer of other Fidelity funds (2005-present) and is an employee of FMR (2005-present). |
| Before joining Fidelity Investments, Mr. Schiavone worked at Deutsche Asset Management, where he most recently served as Assis- |
| tant Treasurer (2003-2005) of the Scudder Funds and Vice President and Head of Fund Reporting (1996-2003). |
63 Annual Report
The Board of Trustees of each fund voted to pay to shareholders of record at the opening of business on record date, the following distributions per share derived from capital gains realized from sales of portfolio securities, and dividends derived from net investment income:
| Fund | | Pay Date | | Record Date | | Dividends | | Capital Gains |
| Banking | | 04/17/06 | | 04/13/06 | | $.15 | | $ | | .58 |
| Brokerage and Investment Management | | 04/17/06 | | 04/13/06 | | $.34 | | $ | | 2.40 |
| Financial Services | | 04/17/06 | | 04/13/06 | | $.28 | | $ | | 3.51 |
| Home Finance | | 04/17/06 | | 04/13/06 | | $.20 | | $ | | .50 |
| Insurance | | 04/17/06 | | 04/13/06 | | $.06 | | $ | | .44 |
The funds hereby designate as capital gain dividends the amounts noted below for the taxable year indicated or for dividends for the taxable year ended 2006, if subsequently determined to be different, the net capital gain of such year; and for dividends for the taxable year ended 2005, if subsequently determined to be different, the excess of: (a) the net capital gain of such year, over (b) amounts previously designated as capital gain dividends with respect to such year.
| Fund | | February 28, 2006 |
| Banking | | $ | | 32,698,380 |
| Brokerage and Investment Management | | $ | | 53,924,787 |
| Financial Services | | $ | | 25,873,770 |
| Home Finance | | $ | | 41,629,078 |
| Insurance | | $ | | 5,571,415 |
A percentage of the dividends distributed during the fiscal year for the following funds qualifies for the dividends-received deduction for corporate shareholders:
| Banking | | April 2005 | | 100% |
| | | December 2005 | | 100% |
| Brokerage and Investment Management | | April 2005 | | 99% |
| | | December 2005 | | 79% |
| Financial Services | | April 2005 | | 100% |
| | | December 2005 | | 100% |
| Home Finance | | April 2005 | | 100% |
| | | December 2005 | | 100% |
| Insurance | | April 2005 | | 100% |
| | | December 2005 | | 100% |
A percentage of the dividends distributed during the fiscal year for the following funds may be taken into account as a dividend for purposes of the maximum rate under section 1(h)(11) of the Internal Revenue Code.
| Banking | | April 2005 | | 100% |
| | | December 2005 | | 100% |
| Brokerage and Investment Management | | April 2005 | | 100% |
| | | December 2005 | | 90% |
| Financial Services | | April 2005 | | 100% |
| | | December 2005 | | 100% |
| Home Finance | | April 2005 | | 100% |
| | | December 2005 | | 100% |
| Insurance | | April 2005 | | 100% |
| | | December 2005 | | 100% |
The funds will notify shareholders in January 2007 of amounts for use in preparing 2006 income tax returns.
Board Approval of Investment Advisory Contracts and Management Fees
Select Banking
Select Brokerage and Investment Management
Select Financial Services
Select Home Finance
Select Insurance
|
On January 19, 2006, the Board of Trustees, including the Independent Trustees (together, the Board), voted to approve a general research services agreement (the Agreement) between FMR, FMR Co., Inc. (FMRC), Fidelity Investments Money Management, Inc. (FIMM), and Fidelity Research & Analysis Company (FRAC) (together, the Investment Advisers) for each fund, effective January 20, 2006, pursuant to which FRAC may provide general research and investment advisory support services to FMRC and FIMM. The Board considered that it has approved previously various sub-advisory agreements for each fund with affiliates of FMR that allow FMR to obtain research, non-discretionary advice, or discretionary portfolio management at no additional expense to each fund. The Board, assisted by the advice of fund counsel and independent Trustees’ counsel, considered a broad range of information and determined that it would be beneficial for each fund to access the research and investment advisory support services supplied by FRAC at no additional expense to each fund.
The Board reached this determination in part because the new arrangement will involve no changes in (i) the contractual terms of and fees payable under each fund’s management contract or sub-advisory agreements; (ii) the investment process or strategies employed in the management of each fund’s assets; (iii) the nature or level of services provided under each fund’s management contract or sub-advisory agreements; (iv) the day-to-day management of each fund or the persons primarily responsible for such management; or (v) the ultimate control or beneficial ownership of FMR, FMRC, or FIMM. The Board also considered that the establishment of each Agreement would not necessitate prior shareholder approval of the Agreement or result in an assignment and termination of each fund’s management contract or sub-advisory agreements under the Investment Company Act of 1940.
Because the Board was approving an arrangement with FRAC under which each fund will not bear any additional management fees or expenses and under which each fund’s portfolio manager would not change, it did not consider each fund’s investment performance, competitiveness of management fee and total expenses, costs of services and profitability, or economies of scale to be significant factors in its decision.
In connection with its future renewal of each fund’s management contract and sub-advisory agreements, the Board will consider: (i) the nature, extent, and quality of services provided to each fund, including shareholder and administrative services and investment performance; (ii) the competitiveness of each fund’s management fee and total expenses; (iii) the costs of the services and profitability, including the revenues earned and the expenses incurred by Fidelity in conducting the business of developing, marketing, distributing, managing, administering, and servicing each fund and its shareholders; and (iv) whether there have been economies of scale in respect of the management of the Fidelity funds, whether the Fidelity funds (including each fund) have appropriately benefited from any such economies of scale, and whether there is potential for realization of any further economies.
Based on its evaluation of all of the conclusions noted above, and after considering all material factors, the Board ultimately concluded that each fund’s Agreement is fair and reasonable, and that each fund’s Agreement should be approved.
65 Annual Report
Investment Adviser
Fidelity Management & Research Company
Boston, MA
Investment Sub-Advisers
FMR Co., Inc.
Fidelity Management & Research (U.K.) Inc.
Fidelity Research & Analysis Company (formerly Fidelity Management & Research (Far East) Inc.)
Fidelity Investments Japan Limited
Fidelity International Investment Advisors
Fidelity International Investment Advisors (U.K. Limited)
General Distributor
Fidelity Distributors Corporation
Boston, MA
Transfer and Service Agent
Fidelity Service Company, Inc.
Boston, MA
Custodian
Brown Brothers Harriman & Co.
Boston, MA
Corporate Headquarters
82 Devonshire Street
Boston, MA 02109
1-800-544-8888
The Fidelity Telephone Connection
Mutual Fund 24-Hour Service
Exchanges/Redemptions
and Account Assistance 1-800-544-6666
Product Information 1-800-544-8888
Retirement Accounts 1-800-544-4774
(8 a.m. - 9 p.m.)
TDD Service 1-800-544-0118
for the deaf and hearing impaired
(9 a.m. - 9 p.m. Eastern time)
Fidelity Automated Service
Telephone (FAST®) (automated graphic) 1-800-544-5555
(automated graphic) Automated line for quickest service
| SELFIN-UANN-0406 | | Corporate Headquarters |
| 1.813662.101 | | 82 Devonshire St., Boston, MA 02109 |
| | | www.fidelity.com |
Fidelity®
Select Portfolios®
Money Market
Annual Report
February 28, 2006


| Contents | | | | |
| |
| Chairman’s Message | | 3 | | |
| Shareholder Expense Example | | 4 | | An example of Shareholder Expenses |
| Fund Update* | | | | |
| Money Market | | 5 | | |
| Notes to Financial Statements | | 16 | | Notes to the Financial Statements |
| Report of Independent Registered | | 18 | | |
| Public Accounting Firm | | | | |
| Trustees and Officers | | 19 | | |
| Distributions | | 25 | | |
| Board Approval of | | 26 | | |
| Investment Advisory Contracts | | | | |
| and Management Fees | | | | |
| * Fund update includes: Investment Changes, Investments, and Financial Statements. |
To view a fund’s proxy voting guidelines and proxy voting record for the 12-month period ended June 30, visit www.fidelity.com/proxyvotingresults or visit the Securities
and Exchange Commission’s (SEC) web site at www.sec.gov. You may also call 1-800-544-8544 to request a free copy of the proxy voting guidelines.
Standard & Poor’s, S&P and S&P 500 are registered service marks of The McGraw-Hill Companies, Inc. and have been licensed for use by Fidelity Distributors
Corporation.
Other third party marks appearing herein are the property of their respective owners.
All other marks appearing herein are registered or unregistered trademarks or service marks of FMR Corp. or an affiliated company.
This report and the financial statements contained herein are submitted for the general information of the shareholders of the fund. This report is not
authorized for distribution to prospective investors in the fund unless preceded or accompanied by an effective prospectus.
A fund files its complete schedule of portfolio holdings with the SEC for the first and third quarters of each fiscal year on Form N-Q. Forms N-Q are
available on the SEC’s web site at http://www.sec.gov. A fund’s Forms N-Q may be reviewed and copied at the SEC’s Public Reference Room in Washing-
ton, DC. Information regarding the operation of the SEC’s Public Reference Room may be obtained by calling 1-800-SEC-0330. For a complete list of a
fund’s portfolio holdings, view the most recent quarterly holdings report, semiannual report, or annual report on Fidelity’s web site at
http://www.fidelity.com/holdings.
NOT FDIC INSURED · MAY LOSE VALUE · NO BANK GUARANTEE
Neither the funds nor Fidelity Distributors Corporation is a bank.
Annual Report 2
|
(Photograph of Edward C. Johnson 3d.)
Although many securities markets made gains in early 2006, there is only one certainty when it comes to investing: There is no sure thing. There are, however, a number of time-tested, fundamental investment principles that can put the historical odds in your favor.
One of the basic tenets is to invest for the long term. Over time, riding out the markets’ inevitable ups and downs has proven much more effective than selling into panic or chasing the hottest trend. Even missing only a few of the markets’ best days can significantly diminish investor returns. Patience also affords the benefits of compounding — of earning interest on additional income or reinvested dividends and capital gains. There are tax advantages and cost benefits to consider as well. The more you sell, the more taxes you pay, and the more you trade, the higher the costs. While staying the course doesn’t eliminate risk, it can considerably lessen the effect of short-term declines.
You can further manage your investing risk through diversification. And today, more than ever, geographic diversification should be taken into account. Studies
indicate that asset allocation is the single most important determinant of a portfolio’s long-term success. The right mix of stocks, bonds and cash — aligned to your particular risk tolerance and investment objective — is very important. Age-appropriate rebalancing is also an essential aspect of asset allocation. For younger investors, an emphasis on equities — which historically have been the best performing asset class over time — is encouraged. As investors near their specific goal, such as retirement or sending a child to college, consideration may be given to replacing volatile assets (e.g. common stocks) with more-stable fixed investments (bonds or savings plans).
A third investment principle — investing regularly — can help lower the average cost of your purchases. Investing a certain amount of money each month or quarter helps ensure you won’t pay for all your shares at market highs. This strategy — known as dollar cost averaging — also reduces unconstructive “emotion” from investing, helping shareholders avoid selling weak performers just prior to an upswing, or chasing a hot performer just before a correction.
We invite you to contact us via the Internet, through our Investor Centers or over the phone. It is our privilege to provide you the information you need to make the investments that are right for you.

3 Annual Report
Shareholder Expense Example
|
As a shareholder of the Fund, you incur two types of costs: (1) transaction costs, and (2) ongoing costs, including management fees and other Fund expenses. This Example is intended to help you understand your ongoing costs (in dollars) of investing in the Fund and to compare these costs with the ongoing costs of investing in other mutual funds.
The Example is based on an investment of $1,000 invested at the beginning of the period and held for the entire period (September 1, 2005 to Febru-ary 28, 2006).
The first line of the table below provides information about actual account values and actual expenses. You may use the information in this line, together with the amount you invested, to estimate the expenses that you paid over the period. Simply divide your account value by $1,000.00 (for example, an $8,600 account value divided by $1,000.00 = 8.6), then multiply the result by the number in the first line under the heading entitled “Expenses Paid During Period” to estimate the expenses you paid on your account during this period. A small balance maintenance fee of $12.00 that is charged once a year may apply for certain accounts with a value of less than $2,000. This fee is not included in the table below. If it was, the estimate of expenses you paid during the period would be higher, and your ending account value lower, by this amount.
Hypothetical Example for Comparison Purposes
|
The second line of the table below provides information about hypothetical account values and hypothetical expenses based on the Fund’s actual expense ratio and an assumed rate of return of 5% per year before expenses, which is not the Fund’s actual return. The hypothetical account values and expenses may not be used to estimate the actual ending account balance or expenses you paid for the period. You may use this information to compare the ongoing costs of investing in the Fund and other funds. To do so, compare this 5% hypothetical example with the 5% hypothetical examples that appear in the shareholder reports of the other funds. A small balance maintenance fee of $12.00 that is charged once a year may apply for certain accounts with a value of less than $2,000. This fee is not included in the table below. If it was, the estimate of expenses you paid during the period would be higher, and your ending account value lower, by this amount.
Please note that the expenses shown in the table are meant to highlight your ongoing costs only and do not reflect any transaction costs. Therefore, the second line of the table is useful in comparing ongoing costs only, and will not help you determine the relative total costs of owning different funds.
| | | | | | | | | Expenses Paid |
| | | Beginning | | | | Ending | | During Period* |
| | | Account Value | | | | Account Value | | September 1, 2005 to |
| | | September 1, 2005 | | | | February 28, 2006 | | February 28, 2006 |
| Actual | | $ 1,000.00 | | $ | | 1,018.90 | | $ | | 2.00 |
| Hypothetical (5% return per year before expenses) | | $ 1,000.00 | | $ | | 1,022.81 | | $ | | 2.01 |
* Expenses are equal to the Fund’s annualized expense ratio of .40%; multiplied by the average account value over the period, multiplied by 181/365 (to reflect the one-half year period).
| Money Market Portfolio | | | | |
| Investment Changes | | |
| |
| |
| Maturity Diversification | | | | |
| Days | | % of fund’s | | % of fund’s | | % of fund’s |
| | | investments | | investments | | investments |
| | | 2/28/06 | | 8/31/05 | | 2/28/05 |
| 0 – 30 | | 70.8 | | 72.5 | | 66.2 |
| 31 – 90 | | 19.5 | | 21.3 | | 28.6 |
| 91 – 180 | | 5.3 | | 2.0 | | 5.2 |
| 181 – 397 | | 4.4 | | 4.2 | | 0.0 |
| Weighted Average Maturity | | | | |
| | | 2/28/06 | | 8/31/05 | | 2/28/05 |
| Money Market Portfolio | | 39 Days | | 36 Days | | 29 Days |
| All Taxable Money Market | | | | | | |
| Funds Average* | | 39 Days | | 36 Days | | 35 Days |
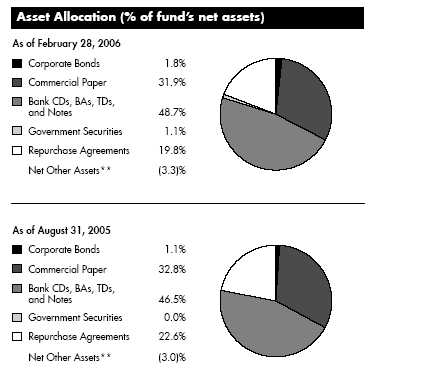
| Current and Historical Seven-Day Yields | | |
| | | 2/28/06 | | 11/29/05 | | 8/30/05 | | 5/31/05 | | 3/1/05 |
| Money Market | | | | | | | | | | |
| Portfolio | | 4.24% | | 3.72% | | 3.27% | | 2.73% | | 2.16% |
| | Yield refers to the income paid by the fund over a given period. Yields
for money market funds are usually for seven-day periods, as they are
here, though they are expressed as annual percentage rates. Past
performance is no guarantee of future results. Yield will vary and it is
possible to lose money by investing in the fund.
* Source: iMoneyNet, Inc.
** Net Other Assets are not included in the pie chart.
5 Annual Report
5
|
| Money Market Portfolio | | | | | | | | | | |
| Investments February 28, 2006 | | | | | | | | |
| Showing Percentage of Net Assets | | | | | | | | | | |
| |
| Corporate Bonds — 1.8% | | | | | | | | | | |
| Due Date | | | | Annualized Yield | | Principal | | | | Value |
| | | | | at Time of | | Amount | | | | (Note 1) |
| | | | | Purchase | | | | | | |
| AOL Time Warner, Inc. | | | | | | | | | | |
| 4/15/06 | | | | 4.03% | | $ 400,000 | | $ | | 400,921 |
| 4/15/06 | | | | 4.14 | | 190,000 | | | | 190,414 |
| Conoco Funding Co. | | | | | | | | | | |
| 10/15/06 | | | | 4.77 | | 4,635,000 | | | | 4,650,332 |
| Continental Cablevision, Inc. | | | | | | | | | | |
| 5/15/06 | | | | 4.70 | | 600,000 | | | | 604,338 |
| France Telecom SA | | | | | | | | | | |
| 3/1/06 | | | | 3.37 | | 35,000 | | | | 35,000 |
| 3/1/06 | | | | 3.41 | | 110,000 | | | | 110,000 |
| 3/1/06 | | | | 3.43 | | 130,000 | | | | 130,000 |
| 3/1/06 | | | | 3.45 | | 35,000 | | | | 35,000 |
| 3/1/06 | | | | 3.54 | | 150,000 | | | | 150,000 |
| 3/1/06 | | | | 3.55 | | 225,000 | | | | 225,000 |
| 3/1/06 | | | | 3.56 | | 285,000 | | | | 285,000 |
| 3/1/06 | | | | 3.59 | | 60,000 | | | | 60,000 |
| Household Finance Corp. | | | | | | | | | | |
| 1/30/07 | | | | 4.64 | | 7,300,000 | | | | 7,358,547 |
| PNC Funding Corp. | | | | | | | | | | |
| 8/1/06 | | | | 4.66 | | 1,000,000 | | | | 1,003,783 |
| Sprint Capital Corp. | | | | | | | | | | |
| 8/17/06 | | | | 4.76 | | 1,010,000 | | | | 1,009,720 |
| TOTAL CORPORATE BONDS | | | | | | | | 16,248,055 |
| |
| Certificates of Deposit — 21.7% | | | | | | | | | | |
| |
| Domestic Certificates Of Deposit – 1.0% | | | | | | | | | | |
| Countrywide Bank, Alexandria Virginia | | | | | | | | | | |
| 5/15/06 | | | | 4.76 (d) | | 2,000,000 | | | | 1,999,908 |
| Huntington National Bank, Columbus | | | | | | | | | | |
| 3/23/06 | | | | 4.31 | | 1,000,000 | | | | 1,000,000 |
| PNC Bank NA, Pittsburgh | | | | | | | | | | |
| 1/24/07 | | | | 5.15 | | 500,000 | | | | 498,369 |
| Washington Mutual Bank FA | | | | | | | | | | |
| 3/14/06 | | | | 4.45 | | 5,000,000 | | | | 5,000,000 |
| | | | | | | | | | | 8,498,277 |
| London Branch, Eurodollar, Foreign Banks – 5.8% | | | | | | | | | | |
| Banca Intesa Spa | | | | | | | | | | |
| 3/31/06 | | | | 4.57 | | 10,000,000 | | | | 10,000,000 |
| Calyon | | | | | | | | | | |
| 7/18/06 | | | | 4.00 | | 5,000,000 | | | | 5,000,000 |
| 10/4/06 | | | | 4.40 | | 3,000,000 | | | | 3,000,000 |
| 2/12/07 | | | | 5.00 | | 5,000,000 | | | | 5,000,000 |
| Credit Agricole SA | | | | | | | | | | |
| 7/17/06 | | | | 4.00 | | 5,000,000 | | | | 5,000,000 |
| 7/19/06 | | | | 4.00 | | 5,000,000 | | | | 5,000,000 |
| Credit Industriel et Commercial | | | | | | | | | | |
| 11/7/06 | | | | 4.76 | | 5,000,000 | | | | 5,000,000 |
See accompanying notes which are an integral part of the financial statements.
Annual Report 6
| Due Date | | Annualized Yield | | Principal | | | | Value |
| | | at Time of | | Amount | | | | (Note 1) |
| | | Purchase | | | | | | |
| Deutsche Bank AG | | | | | | | | |
| 3/28/06 | | 4.55% | | $ 1,000,000 | | $ | | 999,993 |
| 1/30/07 | | 4.86 | | 5,000,000 | | | | 5,000,000 |
| Societe Generale | | | | | | | | |
| 8/18/06 | | 4.25 | | 3,000,000 | | | | 3,000,000 |
| 12/6/06 | | 4.80 | | 5,000,000 | | | | 5,000,000 |
| | | | | | | | | 51,999,993 |
| New York Branch, Yankee Dollar, Foreign Banks – 14.9% | | | | | | | | |
| Barclays Bank PLC | | | | | | | | |
| 5/10/06 | | 4.80 (c) | | 25,000,000 | | | | 25,000,000 |
| BNP Paribas SA | | | | | | | | |
| 11/8/06 | | 4.93 | | 5,000,000 | | | | 5,000,000 |
| Canadian Imperial Bank of Commerce | | | | | | | | |
| 5/15/06 | | 4.63 (d) | | 14,000,000 | | | | 14,000,000 |
| Credit Industriel et Commercial | | | | | | | | |
| 6/28/06 | | 4.27 | | 5,000,000 | | | | 5,000,000 |
| Credit Suisse First Boston New York Branch | | | | | | | | |
| 3/20/06 | | 4.55 (d) | | 5,000,000 | | | | 5,000,000 |
| 3/27/06 | | 4.49 (d) | | 5,000,000 | | | | 5,000,000 |
| 4/19/06 | | 4.57 (d) | | 5,000,000 | | | | 5,000,000 |
| DEPFA BANK PLC | | | | | | | | |
| 3/30/06 | | 4.56 | | 5,000,000 | | | | 5,000,000 |
| Deutsche Bank AG | | | | | | | | |
| 3/3/06 | | 4.41 (d) | | 5,000,000 | | | | 5,000,000 |
| Eurohypo AG | | | | | | | | |
| 3/8/06 | | 4.57 | | 1,000,000 | | | | 999,850 |
| 3/28/06 | | 4.59 | | 3,000,000 | | | | 3,000,000 |
| 5/2/06 | | 4.62 (a) | | 5,000,000 | | | | 5,000,000 |
| Landesbank Hessen-Thuringen | | | | | | | | |
| 4/3/06 | | 4.50 | | 10,000,000 | | | | 10,000,000 |
| Mizuho Corporate Bank Ltd. | | | | | | | | |
| 3/21/06 | | 4.57 | | 10,000,000 | | | | 10,000,000 |
| 3/28/06 | | 4.58 | | 5,000,000 | | | | 5,000,000 |
| Skandinaviska Enskilda Banken AB | | | | | | | | |
| 4/6/06 | | 4.50 (d) | | 10,000,000 | | | | 9,999,479 |
| Sumitomo Mitsui Banking Corp. | | | | | | | | |
| 3/8/06 | | 4.55 | | 1,000,000 | | | | 1,000,000 |
| 3/14/06 | | 4.56 | | 1,000,000 | | | | 1,000,000 |
| 3/15/06 | | 4.56 | | 1,000,000 | | | | 1,000,000 |
| 3/22/06 | | 4.57 | | 1,000,000 | | | | 1,000,000 |
| 3/30/06 | | 4.57 | | 1,000,000 | | | | 1,000,000 |
| Toronto-Dominion Bank | | | | | | | | |
| 4/7/06 | | 3.86 | | 5,000,000 | | | | 5,000,000 |
| Unicredito Italiano Spa | | | | | | | | |
| 5/12/06 | | 4.69 (d) | | 5,000,000 | | | | 4,999,853 |
| | | | | | | 132,999,182 |
| |
| TOTAL CERTIFICATES OF DEPOSIT | | | | | | 193,497,452 |
See accompanying notes which are an integral part of the financial statements.
|
7
| Money Market Portfolio | | | | | | |
| Investments - continued | | | | | | |
| |
| |
| Commercial Paper — 31.9% | | | | | | |
| Due Date | | Annualized Yield | | Principal | | Value |
| | | at Time of | | Amount | | (Note 1) |
| | | Purchase | | | | |
| Amsterdam Funding Corp. | | | | | | |
| 3/20/06 | | 4.54% | | $ 5,000,000 | | $ 4,988,059 |
| Bavaria TRR Corp. | | | | | | |
| 3/3/06 | | 4.56 | | 6,000,000 | | 5,998,486 |
| 3/17/06 | | 4.57 | | 25,000,000 | | 24,949,444 |
| 3/20/06 | | 4.57 | | 5,000,000 | | 4,987,993 |
| 3/20/06 | | 4.58 | | 1,949,000 | | 1,944,309 |
| British Telecommunications PLC | | | | | | |
| 3/6/06 | | 4.61 | | 1,000,000 | | 999,363 |
| 3/8/06 | | 4.60 | | 500,000 | | 499,555 |
| 3/10/06 | | 4.58 | | 1,000,000 | | 998,860 |
| Cafco LLC | | | | | | |
| 3/17/06 | | 4.51 | | 2,800,000 | | 2,794,425 |
| Charta LLC | | | | | | |
| 3/10/06 | | 4.53 | | 1,000,000 | | 998,875 |
| Citibank Credit Card Master Trust I (Dakota Certificate Program) | | | | | | |
| 3/2/06 | | 4.55 | | 5,000,000 | | 4,999,371 |
| 3/3/06 | | 4.54 | | 5,000,000 | | 4,998,744 |
| 3/10/06 | | 4.53 | | 10,000,000 | | 9,988,700 |
| 4/3/06 | | 4.53 | | 5,000,000 | | 4,979,421 |
| 4/4/06 | | 4.53 | | 2,000,000 | | 1,991,519 |
| 4/10/06 | | 4.63 | | 5,000,000 | | 4,974,444 |
| Comcast Corp. | | | | | | |
| 3/13/06 | | 4.62 (b) | | 3,000,000 | | 2,995,397 |
| Countrywide Financial Corp. | | | | | | |
| 3/1/06 | | 4.57 | | 2,000,000 | | 2,000,000 |
| 3/15/06 | | 4.57 | | 2,000,000 | | 1,996,461 |
| 3/27/06 | | 4.57 | | 5,000,000 | | 4,983,642 |
| 3/27/06 | | 4.58 | | 1,500,000 | | 1,495,071 |
| 5/26/06 | | 4.81 | | 5,000,000 | | 4,943,264 |
| Credit Suisse First Boston New York Branch | | | | | | |
| 3/2/06 | | 4.54 | | 10,000,000 | | 9,998,744 |
| Cullinan Finance Corp. | | | | | | |
| 5/8/06 | | 4.69 (b) | | 1,000,000 | | 991,236 |
| DaimlerChrysler NA Holding Corp. | | | | | | |
| 3/2/06 | | 4.67 | | 1,000,000 | | 999,871 |
| 3/17/06 | | 4.67 | | 1,000,000 | | 997,933 |
| 3/21/06 | | 4.67 | | 1,000,000 | | 997,417 |
| 3/22/06 | | 4.71 | | 1,000,000 | | 997,264 |
| Dominion Resources, Inc. | | | | | | |
| 3/21/06 | | 4.62 | | 1,000,000 | | 997,450 |
| DZ Bank AG | | | | | | |
| 3/23/06 | | 4.54 | | 5,000,000 | | 4,986,250 |
| Emerald (MBNA Credit Card Master Note Trust) | | | | | | |
| 3/14/06 | | 4.48 | | 5,000,000 | | 4,992,001 |
| 3/30/06 | | 4.58 | | 10,000,000 | | 9,963,428 |
| 4/5/06 | | 4.53 | | 5,000,000 | | 4,978,174 |
| FCAR Owner Trust | | | | | | |
| 3/7/06 | | 4.55 | | 5,000,000 | | 4,996,225 |
| 4/4/06 | | 4.52 | | 5,000,000 | | 4,978,939 |
See accompanying notes which are an integral part of the financial statements.
Annual Report 8
| Due Date | | Annualized Yield | | Principal | | Value |
| | | at Time of | | Amount | | (Note 1) |
| | | Purchase | | | | |
| 7/18/06 | | 4.76% | | $ 5,000,000 | | $ 4,910,229 |
| Federated Retail Holdings, Inc. | | | | | | |
| 3/1/06 | | 4.60 | | 1,000,000 | | 1,000,000 |
| 3/3/06 | | 4.59 | | 500,000 | | 499,873 |
| Fortune Brands, Inc. | | | | | | |
| 4/10/06 | | 4.72 | | 500,000 | | 497,394 |
| 4/24/06 | | 4.76 | | 1,000,000 | | 992,920 |
| 4/26/06 | | 4.79 | | 1,000,000 | | 992,611 |
| France Telecom SA | | | | | | |
| 3/2/06 | | 4.60 (b) | | 500,000 | | 499,936 |
| 3/6/06 | | 4.60 (b) | | 500,000 | | 499,682 |
| 3/21/06 | | 4.57 (b) | | 2,500,000 | | 2,493,694 |
| 4/20/06 | | 4.65 (b) | | 2,500,000 | | 2,484,028 |
| 5/3/06 | | 4.74 (b) | | 500,000 | | 495,901 |
| Giro Funding US Corp. | | | | | | |
| 3/3/06 | | 4.55 | | 5,000,000 | | 4,998,742 |
| 3/27/06 | | 4.60 | | 1,000,000 | | 996,692 |
| 5/8/06 | | 4.69 | | 1,000,000 | | 991,236 |
| HBOS Treasury Services PLC | | | | | | |
| 3/29/06 | | 4.57 | | 2,000,000 | | 1,992,938 |
| Intesa Funding LLC | | | | | | |
| 3/27/06 | | 4.55 | | 5,000,000 | | 4,983,678 |
| Kellogg Co. | | | | | | |
| 4/18/06 | | 4.72 | | 1,000,000 | | 993,747 |
| 4/25/06 | | 4.73 | | 1,000,000 | | 992,835 |
| Market Street Funding Corp. | | | | | | |
| 4/21/06 | | 4.58 | | 2,720,000 | | 2,702,621 |
| Motown Notes Program | | | | | | |
| 4/7/06 | | 4.64 | | 5,000,000 | | 4,976,361 |
| Nissan Motor Acceptance Corp. | | | | | | |
| 3/20/06 | | 4.53 | | 1,000,000 | | 997,636 |
| 3/23/06 | | 4.56 | | 500,000 | | 498,622 |
| 5/30/06 | | 4.84 | | 1,000,000 | | 988,050 |
| Nordea North America, Inc. | | | | | | |
| 4/6/06 | | 4.60 | | 1,500,000 | | 1,493,160 |
| Paradigm Funding LLC | | | | | | |
| 3/1/06 | | 4.54 | | 10,000,000 | | 10,000,000 |
| 3/1/06 | | 4.55 | | 9,000,000 | | 9,000,000 |
| 3/28/06 | | 4.55 | | 2,000,000 | | 1,993,220 |
| Park Granada LLC | | | | | | |
| 3/27/06 | | 4.57 | | 5,000,000 | | 4,983,606 |
| 3/28/06 | | 4.55 | | 10,000,000 | | 9,966,175 |
| 4/27/06 | | 4.72 | | 3,000,000 | | 2,977,770 |
| Park Sienna LLC | | | | | | |
| 3/15/06 | | 4.56 | | 10,000,000 | | 9,982,306 |
| 3/15/06 | | 4.57 | | 5,000,000 | | 4,991,153 |
| Strand Capital LLC | | | | | | |
| 4/28/06 | | 4.65 | | 500,000 | | 496,294 |
| Stratford Receivables Co. LLC | | | | | | |
| 3/8/06 | | 4.53 | | 5,000,000 | | 4,995,615 |
| 3/17/06 | | 4.54 | | 5,000,000 | | 4,989,978 |
9
See accompanying notes which are an integral part of the financial statements.
9 Annual Report
| Money Market Portfolio | | | | | | | | |
| Investments - continued | | | | | | | | |
| |
| |
| Commercial Paper – continued | | | | | | | | |
| Due Date | | Annualized Yield | | | | Principal | | Value |
| | | at Time of | | | | Amount | | (Note 1) |
| | | Purchase | | | | | | |
| Stratford Receivables Co. LLC – continued | | | | | | | | |
| 3/21/06 | | 4.53% | | $ | | 10,000,000 | | $ 9,975,028 |
| 3/22/06 | | 4.57 | | | | 5,000,000 | | 4,986,729 |
| 3/23/06 | | 4.57 | | | | 3,933,000 | | 3,922,064 |
| 3/24/06 | | 4.58 | | | | 5,000,000 | | 4,985,465 |
| The Walt Disney Co. | | | | | | | | |
| 4/18/06 | | 4.68 | | | | 2,000,000 | | 1,987,653 |
| Weatherford International Ltd. | | | | | | | | |
| 3/22/06 | | 4.56 (b) | | | | 500,000 | | 498,685 |
| TOTAL COMMERCIAL PAPER | | | | | | | | 284,084,662 |
| |
| U.S. Treasury Obligations — 1.1% | | | | | | | | |
| |
| U.S. Treasury Bills – 1.1% | | | | | | | | |
| 8/3/06 | | 4.53 | | | | 10,000,000 | | 9,809,264 |
| |
| Master Notes — 2.3% | | | | | | | | |
| |
| Goldman Sachs Group, Inc. | | | | | | | | |
| 3/9/06 | | 4.62 (d)(f) | | | | 15,000,000 | | 15,000,000 |
| 3/10/06 | | 4.63 (d)(f) | | | | 5,000,000 | | 5,000,000 |
| TOTAL MASTER NOTES | | | | | | | | 20,000,000 |
| |
| Medium-Term Notes — 22.7% | | | | | | | | |
| |
| AIG Matched Funding Corp. | | | | | | | | |
| 3/15/06 | | 4.51 (d) | | | | 5,000,000 | | 5,000,000 |
| 4/3/06 | | 4.54 (d) | | | | 5,000,000 | | 5,000,000 |
| 4/11/06 | | 4.57 (d) | | | | 5,000,000 | | 5,000,000 |
| 4/23/06 | | 4.62 (d) | | | | 5,000,000 | | 5,000,000 |
| Australia & New Zealand Banking Group Ltd. | | | | | | | | |
| 3/23/06 | | 4.55 (b)(d) | | | | 2,000,000 | | 2,000,000 |
| Bank of New York Co., Inc. | | | | | | | | |
| 3/27/06 | | 4.62 (b)(d) | | | | 5,000,000 | | 5,000,000 |
| Bayerische Landesbank Girozentrale | | | | | | | | |
| 5/19/06 | | 4.78 (d) | | | | 5,000,000 | | 5,000,000 |
| BellSouth Corp. | | | | | | | | |
| 4/26/06 | | 4.26 (b)(d) | | | | 500,000 | | 500,025 |
| BMW U.S. Capital LLC | | | | | | | | |
| 3/15/06 | | 4.54 (d) | | | | 1,000,000 | | 1,000,000 |
| Commonwealth Bank of Australia | | | | | | | | |
| 3/24/06 | | 4.54 (d) | | | | 2,000,000 | | 2,000,000 |
| GE Capital Assurance Co. | | | | | | | | |
| 3/1/06 | | 4.65 (d)(f) | | | | 5,000,000 | | 5,000,000 |
| |
| Due Date | | Annualized Yield | | | | Principal | | Value |
| | | at Time of | | | | Amount | | (Note 1) |
| | | Purchase | | | | | | |
| General Electric Capital Corp. | | | | | | | | |
| 3/7/06 | | 4.59% (d) | | $ | | 5,000,000 | | $ 5,000,000 |
| 3/9/06 | | 4.67 (d) | | | | 10,000,000 | | 10,005,748 |
See accompanying notes which are an integral part of the financial statements.
Annual Report 10
| 3/17/06 | | 4.67 (d) | | 9,000,000 | | 9,002,625 |
| 3/30/06 | | 3.85 | | 4,000,000 | | 4,004,319 |
| HBOS Treasury Services PLC | | | | | | |
| 3/24/06 | | 4.57 (d) | | 10,000,000 | | 10,000,000 |
| HSBC Finance Corp. | | | | | | |
| 3/24/06 | | 4.56 (d) | | 2,000,000 | | 2,000,000 |
| HSH Nordbank AG | | | | | | |
| 3/23/06 | | 4.57 (b)(d) | | 2,000,000 | | 2,000,000 |
| ING USA Annuity & Life Insurance Co. | | | | | | |
| 3/24/06 | | 4.60 (d)(f) | | 1,000,000 | | 1,000,000 |
| Links Finance LLC | | | | | | |
| 3/20/06 | | 4.53 (b)(d) | | 10,000,000 | | 9,998,796 |
| MBIA Global Funding LLC | | | | | | |
| 4/18/06 | | 4.56 (b)(d) | | 1,000,000 | | 1,000,000 |
| Merrill Lynch & Co., Inc. | | | | | | |
| 3/6/06 | | 4.63 (d) | | 2,000,000 | | 2,001,681 |
| 3/13/06 | | 4.77 (d) | | 1,000,000 | | 1,001,758 |
| 3/15/06 | | 4.55 (d) | | 4,000,000 | | 4,000,000 |
| Metropolitan Life Insurance Co. | | | | | | |
| 3/6/06 | | 4.56 (b)(d) | | 2,213,000 | | 2,213,000 |
| Morgan Stanley | | | | | | |
| 3/1/06 | | 4.67 (d) | | 1,000,000 | | 1,000,000 |
| 3/6/06 | | 4.63 (d) | | 5,000,000 | | 5,000,000 |
| 3/15/06 | | 4.60 (d) | | 2,000,000 | | 2,000,000 |
| Nationwide Building Society | | | | | | |
| 3/28/06 | | 4.58 (b)(d) | | 5,000,000 | | 5,002,571 |
| Nordea Bank AB | | | | | | |
| 3/13/06 | | 4.55 (b)(d) | | 3,000,000 | | 3,000,068 |
| RACERS | | | | | | |
| 3/22/06 | | 4.57 (b)(d) | | 10,000,000 | | 10,000,000 |
| Royal Bank of Scotland PLC | | | | | | |
| 3/21/06 | | 4.54 (b)(d) | | 5,000,000 | | 5,000,000 |
| SBC Communications, Inc. | | | | | | |
| 6/5/06 | | 3.96 (b) | | 1,600,000 | | 1,601,506 |
| 6/5/06 | | 4.11 (b) | | 100,000 | | 100,039 |
| 6/5/06 | | 4.68 (b) | | 850,000 | | 848,739 |
| Security Life of Denver Insurance Co. | | | | | | |
| 5/30/06 | | 4.89 (d)(f) | | 1,000,000 | | 1,000,000 |
| Societe Generale | | | | | | |
| 3/2/06 | | 4.54 (b)(d) | | 5,000,000 | | 5,000,000 |
See accompanying notes which are an integral part of the financial statements.
|
11 Annual Report
11
| Money Market Portfolio | | | | | | | | |
| Investments - continued | | | | | | | | |
| |
| |
| Medium-Term Notes – continued | | | | | | | | |
| Due Date | | Annualized Yield at | | | | Principal | | Value |
| | | Time of Purchase | | | | Amount | | (Note 1) |
| Verizon Global Funding Corp. | | | | | | | | |
| 3/15/06 | | 4.60% (d) | | $ | | 20,000,000 | | $ 20,000,024 |
| Washington Mutual Bank, California | | | | | | | | |
| 3/20/06 | | 4.48 (d) | | | | 4,000,000 | | 4,000,000 |
| 3/27/06 | | 4.50 (d) | | | | 10,000,000 | | 9,999,815 |
| 4/27/06 | | 4.62 (d) | | | | 5,000,000 | | 5,000,000 |
| 5/31/06 | | 4.74 (d) | | | | 5,000,000 | | 5,000,000 |
| Wells Fargo & Co. | | | | | | | | |
| 3/2/06 | | 4.62 (d) | | | | 5,000,000 | | 5,000,000 |
| 3/15/06 | | 4.56 (d) | | | | 5,000,000 | | 5,000,000 |
| WestLB AG | | | | | | | | |
| 3/10/06 | | 4.58 (b)(d) | | | | 2,000,000 | | 2,000,000 |
| 3/30/06 | | 4.53 (b)(d) | | | | 3,000,000 | | 3,000,000 |
| World Savings Bank FSB | | | | | | | | |
| 3/2/06 | | 4.42 (d) | | | | 450,000 | | 450,000 |
| TOTAL MEDIUM-TERM NOTES | | | | | | | | 202,730,714 |
| |
| Short-Term Notes — 1.1% | | | | | | | | |
| |
| Metropolitan Life Insurance Co. | | | | | | | | |
| 4/3/06 | | 4.65 (d)(f) | | | | 5,000,000 | | 5,000,000 |
| New York Life Insurance Co. | | | | | | | | |
| 4/3/06 | | 4.66 (d)(f) | | | | 5,000,000 | | 5,000,000 |
| TOTAL SHORT-TERM NOTES | | | | | | | | 10,000,000 |
| |
| Municipal Securities — 0.9% | | | | | | | | |
| |
| Connecticut Hsg. Fin. Auth. (Hsg. Mortgage Fin. Prog.) Series F2, 4.57% (AMBAC Insured), VRDN 3/7/06 (d) | | | | 5,000,000 | | 5,000,000 |
| New York State Dorm. Auth. Revs. Series A, 4.56% (MBIA Insured), VRDN 3/7/06 (d) | | | | | | 2,900,000 | | 2,900,000 |
| |
| TOTAL MUNICIPAL SECURITIES | | | | | | | | 7,900,000 |
| |
| Repurchase Agreements — 19.8% | | | | | | | | |
| | | | | | | Maturity | | |
| | | | | | | Amount | | |
| In a joint trading account (Collateralized by U.S. Government Obligations dated 2/28/06 due 3/1/06 At 4.5817%) | | $ | | 21,893,786 | | 21,891,000 |
| With: | | | | | | | | |
| Banc of America Securities LLC At 4.67%, dated 2/28/06 due 3/1/06 (Collateralized by Corporate Obligations | | | | | | |
| valued at $42,000,000, 6.3% – 9.75%, 2/15/08 – 3/1/46) | | | | | | 40,005,189 | | 40,000,000 |
| |
| |
| | | | | Maturity | | Value |
| | | | | Amount | | (Note 1) |
| Goldman Sachs & Co. At 4.66%, dated: | | | | | | | | |
| 2/22/06 due 5/23/06 (Collateralized by Mortgage Loan Obligations valued at $14,280,353, 5.38% – 6%, | | | | | | |
| 5/15/08 – 11/15/11) (d)(e) | | $14,163,100 $ | | 14,000,000 |
| 2/28/06 due 3/1/06 (Collateralized by Mortgage Loan Obligations valued at $10,200,367, 6%, 5/15/08) | | 10,001,295 | | 10,000,000 |
| J.P. Morgan Securities, Inc. At 4.69%, dated 2/1/06 due 3/29/06 (Collateralized by Corporate Obligations | | | | | | |
| valued at $2,118,023, 6.38% – 10.18%, 10/1/06 -- 1/2/13) (d)(e) | | | | 2,014,591 | | 2,000,000 |
| Merrill Lynch, Pierce, Fenner & Smith At: | | | | | | | | |
| 4.61%, dated 2/28/06 due 3/1/06 (Collateralized by Mortgage Loan Obligations valued at $33,601,149, | | | | | | |
| 4.57% – 7.58%, 11/12/08 – 5/10/43) | | | | 32,004,100 | | 32,000,000 |
See accompanying notes which are an integral part of the financial statements.
Annual Report 12
| 4.69%, dated 1/23/06 due 4/21/06 (Collateralized by Corporate Obligations valued at $5,258,100, 6.45%, | | | | |
| 8/15/14) (d)(e) | | 5,057,322 | | 5,000,000 |
| Morgan Stanley & Co. At 4.63%, dated 2/1/06 due 3/29/06 (Collateralized by Mortgage Loan Obligations | | | | |
| valued at $14,905,786, 0.86% – 2.14%, 8/14/22 -- 11/11/30) | | 14,100,831 | | 14,000,000 |
| Wachovia Securities, Inc. At 4.63%, dated 2/28/06 due 3/1/06 (Collateralized by Mortgage Loan Obligations | | | | |
| valued at $38,760,000, 0.97% – 8.9%, 3/15/08 -- 7/10/43) | | 38,004,887 | | 38,000,000 |
| TOTAL REPURCHASE AGREEMENTS | | | | 176,891,000 |
| |
| TOTAL INVESTMENT PORTFOLIO - 103.3% | | | | |
| (Cost $921,161,147) | | | | 921,161,147 |
| |
| NET OTHER ASSETS – (3.3)% | | | | (29,364,747) |
| NET ASSETS – 100% | | $ | | 891,796,400 |
| |
| Security Type Abbreviations | | | | |
| VRDN -- VARIABLE RATE DEMAND NOTE | | | | |
(a) Debt obligation initially issued at one coupon which converts to a higher coupon at a specified date. The rate shown is the rate at period end.
(b) Security exempt from registration under Rule 144A of the Securities Act of 1933. These securities may be resold in transactions exempt from registration, normally to qualified institutional buyers. At the period end, the value of these securities amounted to $69,223,303 or 7.8% of net assets.
(c) Security or a portion of the security purchased on a delayed delivery or when-issued basis.
(d) The coupon rate shown on floating or adjustable rate securities represents the rate at period end. The due dates on these types of securities reflect the next interest rate reset date or, when applicable, the final maturity date.
(e) The maturity amount is based on the rate at period end.
(f) Restricted securities – Investment in securities not registered under the Securities Act of 1933 (excluding 144A issues). At the end of the period, the value of restricted securities (excluding 144A issues) amounted to $37,000,000 or 4.1% of net assets.
| Additional information on each holding is as follows: | | | | | | |
| Security | | Acquisition Date | | Cost | | |
| GE Capital Assurance Co. 4.65%, 3/1/06 | | 7/28/05 | | $ 5,000,000 | | |
| Goldman Sachs Group, Inc.: 4.62%, 3/9/06 | | 1/9/06 | | $ 15,000,000 | | |
| 4.63%, 3/10/06 | | 11/10/05 | | $ 5,000,000 | | |
| ING USA Annuity & Life Insurance Co. 4.6%, 3/24/06 | | 6/23/05 | | $ 1,000,000 | | |
| Metropolitan Life Insurance Co. 4.65%, 4/3/06 | | 3/26/02 | | $ 5,000,000 | | |
| New York Life Insurance Co. 4.66%, 4/3/06 | | 2/28/02 | | $ 5,000,000 | | |
| Security Life of Denver Insurance Co. 4.89%, 5/30/06 | | 8/26/05 | | $ 1,000,000 | | |
Income Tax Information
At February 28, 2006, the fund had a capital loss carryforward of approximately $138,740 of which $19,605, $93,644, and $25,491 will expire on February 29, 2012, February 28, 2013 and 2014, respectively.
See accompanying notes which are an integral part of the financial statements.
|
13 Annual Report
13
| Money Market Portfolio | | | | | | | | |
| |
| Financial Statements | | | | | | | | |
| |
| |
| Statement of Assets and Liabilities | | | | | | | | |
| | | | | | | | | February 28, 2006 |
| |
| Assets | | | | | | | | |
| Investment in securities, at value (including repurchase agreements of $176,891,000) — See accompanying schedule: | | | | | | | | |
| Unaffiliated issuers (cost $921,161,147) | | | | | | $ | | 921,161,147 |
| Cash | | | | | | | | 19,389 |
| Receivable for fund shares sold | | | | | | | | 9,686,824 |
| Interest receivable | | | | | | | | 2,971,049 |
| Prepaid expenses | | | | | | | | 2,449 |
| Total assets | | | | | | | | 933,840,858 |
| |
| Liabilities | | | | | | | | |
| Payable for investments purchased on a delayed delivery basis | | $ | | 25,000,000 | | | | |
| Payable for fund shares redeemed | | | | 16,529,804 | | | | |
| Distributions payable | | | | 220,442 | | | | |
| Accrued management fee | | | | 157,503 | | | | |
| Other affiliated payables | | | | 107,359 | | | | |
| Other payables and accrued expenses | | | | 29,350 | | | | |
| Total liabilities | | | | | | | | 42,044,458 |
| |
| Net Assets | | | | | | $ | | 891,796,400 |
| Net Assets consist of: | | | | | | | | |
| Paid in capital | | | | | | $ | | 892,028,471 |
| Distributions in excess of net investment income | | | | | | | | (93,331) |
| Accumulated undistributed net realized gain (loss) on investments | | | | | | | | (138,740) |
| Net Assets, for 891,816,798 shares outstanding | | | | | | $ | | 891,796,400 |
| Net Asset Value, offering price and redemption price per share ($891,796,400 ÷ 891,816,798 shares) | | | | | | $ | | 1.00 |
| |
| Statement of Operations | | | | | | | | |
| | | | | | | | | Year ended February 28, 2006 |
| |
| Investment Income | | | | | | | | |
| |
| Interest (including $63,427 from affiliated interfund lending) | | | | | | $ | | 26,665,405 |
| |
| Expenses | | | | | | | | |
| Management fee | | $ | | 1,494,928 | | | | |
| Transfer agent fees | | | | 1,061,570 | | | | |
| Accounting fees and expenses | | | | 91,240 | | | | |
| Independent trustees’ compensation | | | | 3,039 | | | | |
| Custodian fees and expenses | | | | 32,358 | | | | |
| Registration fees | | | | 122,848 | | | | |
| Audit | | | | 34,062 | | | | |
| Legal | | | | 1,745 | | | | |
| Miscellaneous | | | | 4,891 | | | | |
| Total expenses before reductions | | | | 2,846,681 | | | | |
| Expense reductions | | | | (16,824) | | | | 2,829,857 |
| |
| Net investment income | | | | | | | | 23,835,548 |
| Realized and Unrealized Gain (Loss) | | | | | | | | |
| Net realized gain (loss) on: | | | | | | | | |
| Investment securities: | | | | | | | | |
| Unaffiliated issuers | | | | | | | | 9,709 |
| Net increase in net assets resulting from operations | | | | | | $ | | 23,845,257 |
See accompanying notes which are an integral part of the financial statements.
Annual Report 14
| Statement of Changes in Net Assets | | | | | | | | | | | | | | | | | | |
| | | | | | | | | | | | | Year ended | | Year ended |
| | | | | | | | | | | | | February 28, | | February 28, |
| | | | | | | | | | | | | 2006 | | 2005 |
| Increase (Decrease) in Net Assets | | | | | | | | | | | | | | | | | | |
| Operations | | | | | | | | | | | | | | | | | | |
| Net investment income | | | | | | | | | | | | $ 23,835,548 | | $ | | 7,972,498 |
| Net realized gain (loss) | | | | | | | | | | | | | | 9,709 | | | | (126,516) |
| Net increase in net assets resulting from operations | | | | | | | | | | | | 23,845,257 | | | | 7,845,982 |
| Distributions to shareholders from net investment income | | | | | | | | | | | | (23,834,293) | | | | (7,972,316) |
| Share transactions at net asset value of $1.00 per share | | | | | | | | | | | | | | | | | | |
| Proceeds from sales of shares | | | | | | | | | | | | 1,877,724,222 | | 1,130,467,367 |
| Reinvestment of distributions | | | | | | | | | | | | 22,431,760 | | | | 7,706,807 |
| Cost of shares redeemed | | | | | | | | | | | | (1,593,125,497) | | (1,160,912,799) |
| Net increase (decrease) in net assets and shares resulting from share transactions | | | | | | | | 307,030,485 | | | | (22,738,625) |
| Total increase (decrease) in net assets | | | | | | | | | | | | 307,041,449 | | | | (22,864,959) |
| |
| Net Assets | | | | | | | | | | | | | | | | | | |
| Beginning of period | | | | | | | | | | | | 584,754,951 | | 607,619,910 |
| End of period (including distributions in excess of net investment income of $93,331 and distributions in excess of net | | | | | | | | |
| investment income of $94,585, respectively) | | | | | | | | | | | | $ 891,796,400 | | $ 584,754,951 |
| |
| Financial Highlights | | | | | | | | | | | | | | | | | | |
| |
| Years ended February 28, | | | | 2006 | | 2005 | | 2004D | | | | 2003 | | | | 2002 |
| Selected Per-Share Data | | | | | | | | | | | | | | | | | | |
| Net asset value, beginning of period | | $ | | 1.00 | | $ 1.00 | | $ | | 1.00 | | $ | | 1.00 | | $ | | 1.00 |
| Income from Investment Operations | | | | | | | | | | | | | | | | | | |
| Net investment income | | | | 033 | | .013 | | | | .009 | | | | .015 | | | | .033 |
| Distributions from net investment income | | | | (.033) | | (.013) | | | | (.009) | | | | (.015) | | | | (.033) |
| Net asset value, end of period | | $ | | 1.00 | | $ 1.00 | | $ | | 1.00 | | $ | | 1.00 | | $ | | 1.00 |
| Total ReturnA,B | | | | 3.32% | | 1.29% | | | | .86% | | | | 1.50% | | | | 3.30% |
| Ratios to Average Net AssetsC | | | | | | | | | | | | | | | | | | |
| Expenses before reductions | | | | 40% | | .39% | | | | .40% | | | | .38% | | | | .37% |
| Expenses net of fee waivers, if any | | | | 40% | | .39% | | | | .40% | | | | .38% | | | | .37% |
| Expenses net of all reductions | | | | 40% | | .39% | | | | .40% | | | | .38% | | | | .37% |
| Net investment income | | | | 3.34% | | 1.26% | | | | .86% | | | | 1.45% | | | | 3.38% |
| Supplemental Data | | | | | | | | | | | | | | | | | | |
| Net assets, end of period (000 omitted) | | $ 891,796 | | $ 584,755 | | $ 607,620 | | $ 1,079,578 | | $ 1,037,869 |
ATotal returns would have been lower had certain expenses not been reduced during the periods shown. BTotal returns do not include the effect of the former sales charges. CExpense ratios reflect operating expenses of the fund. Expenses before reductions do not reflect amounts reimbursed by the investment adviser or expense offset arrangements and do not represent the amount paid by the fund during periods when reimbursements or reductions occur. Expenses net of fee waivers reflect expenses after reimbursement by the investment adviser but prior to reductions from expense offset arrangements. Expenses net of all reductions represent the net expenses paid by the fund. DFor the year ended February 29.
See accompanying notes which are an integral part of the financial statements.
|
15 Annual Report
Notes to Financial Statements
For the period ended February 28, 2006
|
1. Significant Accounting Policies.
|
Money Market Portfolio (the fund) is a fund of Fidelity Select Portfolios (the trust) and is authorized to issue an unlimited number of shares. The trust is registered under the Investment Company Act of 1940, as amended (the 1940 Act), as an open-end management investment company organized as a Massachusetts business trust. The financial statements have been prepared in conformity with accounting principles generally accepted in the United States of America, which require management to make certain estimates and assumptions at the date of the financial statements. The following summarizes the significant accounting policies of the fund:
Security Valuation. Net asset value per share is calculated as of the close of business of the New York Stock Exchange, normally 4:00 p.m. Eastern time. As permitted by compliance with certain conditions under Rule 2a-7 of the 1940 Act, securities are valued at amortized cost, which approximates value.
Investment Transactions and Income. Security transactions are accounted for as of trade date. Gains and losses on securities sold are determined on the basis of identified cost. Interest income is accrued as earned. Interest income includes coupon interest and amortization of premium and accretion of discount on debt securities.
Expenses. Most expenses of the trust can be directly attributed to a fund. Expenses which cannot be directly attributed are apportioned among each fund in the trust.
Income Tax Information and Distributions to Shareholders. Each year, the fund intends to qualify as a regulated investment company by distributing all of its taxable income and realized gains under Subchapter M of the Internal Revenue Code. As a result, no provision for income taxes is required in the accompanying financial statements.
Dividends are declared daily and paid monthly from net investment income. Distributions from realized gains, if any, are recorded on the ex-dividend date. Income and capital gain distributions are determined in accordance with income tax regulations, which may differ from generally accepted accounting principles.
Capital accounts within the financial statements are adjusted for permanent book-tax differences. These adjustments have no impact on net assets or the results of operations. Temporary book-tax differences will reverse in a subsequent period.
Book-tax differences are primarily due to deferred trustees compensation, capital loss carryforwards, and losses deferred due to wash sales.
| The tax-basis components of distributable earnings and the federal tax cost as of period end were as follows: | | | | |
| Unrealized appreciation | | $ | | — | | |
| Unrealized depreciation | | | | — | | |
| Net unrealized appreciation (depreciation) | | | | — | | |
| Capital loss carryforward | | | | (138,740) | | |
| Cost for federal income tax purposes | | $ | | 921,161,147 | | |
| |
| The tax character of distributions paid was as follows: | | | | | | |
| | | | | February 28, 2006 | | February 28, 2005 |
| Ordinary Income | | $ | | 23,834,293 | | $ 7,972,316 |
| |
| 2. Operating Policies. | | | | | | |
Repurchase Agreements. Fidelity Management & Research Company (FMR) has received an Exemptive Order from the Securities and Exchange Commission (the SEC) which permits the fund and other affiliated entities of FMR to transfer uninvested cash balances into joint trading accounts which are then invested in repurchase agreements. The fund may also invest directly with institutions in repurchase agreements. Repurchase agreements are collateralized by government or non-government securities. Upon settlement date, collateral is held in segregated accounts with custodian banks and may be obtained in the event of a default of the counterparty. The fund monitors, on a daily basis, the value of the collateral to ensure it is at least equal to the principal amount of the repurchase agreement (including accrued interest). In the event of a default by the counterparty, realization of the collateral proceeds could be delayed, during which time the value of the collateral may decline.
Delayed Delivery Transactions and When-Issued Securities. The fund may purchase or sell securities on a delayed delivery or when-issued basis. Payment and delivery may take place after the customary settlement period for that security. The price of the underlying securities and the date when the securities will be delivered and paid for are fixed at the time the transaction is negotiated. During the time a delayed delivery sell is outstanding, the contract is marked-to-market daily and equivalent deliverable securities are held for the transaction. The value of the securities purchased on a delayed delivery or when-issued basis are identified as such in the fund’s Schedule of Investments. The fund may receive compensation for interest
2. Operating Policies - continued
Delayed Delivery Transactions and When-Issued Securities - continued
forgone in the purchase of a delayed delivery or when-issued security. With respect to purchase commitments, the fund identifies securities as segregated in its records with a value at least equal to the amount of the commitment. Losses may arise due to changes in the value of the underlying securities or if the counterparty does not perform under the contract’s terms, or if the issuer does not issue the securities due to political, economic, or other factors.
Restricted Securities. The fund may invest in securities that are subject to legal or contractual restrictions on resale. These securities generally may be resold in transactions exempt from registration or to the public if the securities are registered. Disposal of these securities may involve time-consuming negotiations and expense, and prompt sale at an acceptable price may be difficult. Information regarding restricted securities is included at the end of the fund’s Schedule of Investments.
3. Fees and Other Transactions with Affiliates.
|
Management Fee. FMR and its affiliates provide the fund with investment management related services for which the fund pays a monthly management fee. The management fee is calculated on the basis of a group fee rate plus a total income-based component. The group fee rate averaged .12% during the period. The group fee rate is based upon the average net assets of all the mutual funds advised by FMR. The group fee rate decreases as assets under management increase and increases as assets under management decrease. The total income-based component is calculated according to a graduated schedule providing for different rates based on the fund’s gross annualized yield. The rate increases as the fund’s gross yield increases.
During the period the income-based portion of this fee was $609,074 or an annual rate of .09% of the fund’s average net assets. For the period, the fund’s total annual management fee rate was .21% of the fund’s average net assets.
Sales Load. Fidelity Distributors Corporation (FDC), an affiliate of FMR, is the general distributor of the fund. Shares purchased prior to October 12, 1990, were subject to a 1% deferred sales charge upon redemption or exchange to any other Fidelity fund (other than Select funds). For the period, FDC retained $10,037 on redemption of shares of the fund. Effective July 1, 2005, the deferred sales charge was eliminated.
Transfer Agent Fees. Fidelity Service Company, Inc. (FSC), an affiliate of FMR, is the fund’s transfer, dividend disbursing and shareholder servicing agent. FSC receives account fees and asset-based fees that vary according to account size and type of account. FSC pays for typesetting, printing and mailing of shareholder reports, except proxy statements. For the period, the transfer agent fees were equivalent to an annual rate of .15% of average net assets.
Accounting Fees. FSC maintains the fund’s accounting records. The fee is based on the level of average net assets for the month.
Interfund Lending Program. Pursuant to an Exemptive Order issued by the SEC, the fund, along with other registered investment companies having management contracts with FMR, may participate in an interfund lending program. This program provides an alternative credit facility allowing the funds to borrow from, or lend money to, other participating affiliated funds. At period end, there were no interfund loans outstanding. The fund’s activity in this program during the period for which loans were outstanding was as follows:
| | | Average Daily | | Weighted Average |
| Borrower or Lender | | Loan Balance | | Interest Rate |
| Lender | | $ 16,330,342 | | 3.68% |
| |
| 4. Expense Reductions. | | | | |
Through arrangements with the fund’s custodian and transfer agent, credits realized as a result of uninvested cash balances were used to reduce the fund’s expenses. During the period, these credits reduced the fund’s custody and transfer agent expenses by $1,633 and $15,191, respectively.
The fund’s organizational documents provide former and current trustees and officers with a limited indemnification against liabilities arising in connection with the performance of their duties to the fund. In the normal course of business, the fund may also enter into contracts that provide general indemnifications. The fund’s maximum exposure under these arrangements is unknown as this would be dependent on future claims that may be made against the fund. The risk of material loss from such claims is considered remote.
17 Annual Report
Report of Independent Registered Public Accounting Firm
To the Trustees of Fidelity Select Portfolios and the Shareholders of Money Market Portfolio:
In our opinion, the accompanying statement of assets and liabilities, including the schedule of investments, and the related statements of operations and of changes in net assets and the financial highlights present fairly, in all material respects, the financial position of Money Market Portfolio (a fund of Fidelity Select Portfolios) at February 28, 2006 and the results of its operations, the changes in its net assets and the financial highlights for each of the periods indicated, in conformity with accounting principles generally accepted in the United States of America. These financial statements and financial highlights (hereafter referred to as “financial statements”) are the responsibility of the Money Market Portfolio’s management; our responsibility is to express an opinion on these financial statements based on our audits. We conducted our audits of these financial statements in accordance with the standards of the Public Company Accounting Oversight Board (United States). Those standards require that we plan and perform the audit to obtain reasonable assurance about whether the financial statements are free of material misstatement. An audit includes examining, on a test basis, evidence supporting the amounts and disclosures in the financial statements, assessing the accounting principles used and significant estimates made by management, and evaluating the overall financial statement presentation. We believe that our audits, which included confirmation of securities at February 28, 2006 by correspondence with the custodian and brokers, provide a reasonable basis for our opinion.
/s/ PricewaterhouseCoopers LLP
PricewaterhouseCoopers LLP
Boston, Massachusetts
April 7, 2006
|
Trustees and Officers
The Trustees, Members of the Advisory Board, and executive officers of the trust and fund, as applicable, are listed below. The Board of Trustees governs the fund and is responsible for protecting the interests of shareholders. The Trustees are experienced executives who meet periodically throughout the year to oversee the fund’s activities, review contractual arrangements with companies that provide services to the fund, and review the fund’s performance. Except for William O. McCoy, each of the Trustees oversees 326 funds advised by FMR or an affiliate. Mr. McCoy oversees 328 funds advised by FMR or an affiliate.
The Trustees hold office without limit in time except that (a) any Trustee may resign; (b) any Trustee may be removed by written instrument, signed by at least two-thirds of the number of Trustees prior to such removal; (c) any Trustee who requests to be retired or who has become incapacitated by illness or injury may be retired by written instrument signed by a majority of the other Trustees; and (d) any Trustee may be removed at any special meeting of shareholders by a two-thirds vote of the outstanding voting securities of the trust. Each Trustee who is not an interested person (as defined in the 1940 Act) (Independent Trustee), shall retire not later than the last day of the calendar year in which his or her 72nd birthday occurs. The Independent Trustees may waive this mandatory retirement age policy with respect to individual Trustees. The executive officers and Advisory Board Members hold office without limit in time, except that any officer and Advisory Board Member may resign or may be removed by a vote of a majority of the Trustees at any regular meeting or any special meeting of the Trustees. Except as indicated, each individual has held the office shown or other offices in the same company for the past five years.
The fund’s Statement of Additional Information (SAI) includes more information about the Trustees. To request a free copy, call Fidelity at 1-800-544-8544.
Interested Trustees*:
Correspondence intended for each Trustee who is an interested person may be sent to Fidelity Investments, 82 Devonshire Street, Boston, Massachusetts 02109.
| Name, Age; Principal Occupation |
| |
| Edward C. Johnson 3d (75) |
| |
| Year of Election or Appointment: 1980 |
| Mr. Johnson is Chairman of the Board of Trustees. Mr. Johnson serves as Chief Executive Officer, Chairman, and a Director of |
| FMR Corp.; a Director and Chairman of the Board and of the Executive Committee of FMR; Chairman and a Director of Fidelity |
| Research & Analysis Company; Chairman and a Director of Fidelity Investments Money Management, Inc.; and Chairman |
| (2001-present) and a Director (2000-present) of FMR Co., Inc. |
| |
| Stephen P. Jonas (53) |
| |
| Year of Election or Appointment: 2005 |
| Mr. Jonas is Senior Vice President of Money Market (2005-present). He also serves as Senior Vice President of other Fidelity funds |
| (2005-present). Mr. Jonas is Executive Director of FMR (2005-present). Previously, Mr. Jonas served as President of Fidelity Enter- |
| prise Operations and Risk Services (2004-2005), Chief Administrative Officer (2002-2004), and Chief Financial Officer of FMR |
| Co. (1998-2000). Mr. Jonas has been with Fidelity Investments since 1987 and has held various financial and management posi- |
| tions including Chief Financial Officer of FMR. In addition, he serves on the Boards of Boston Ballet (2003-present) and Simmons |
| College (2003-present). |
| |
| Robert L. Reynolds (53) |
| |
| Year of Election or Appointment: 2003 |
| Mr. Reynolds is a Director (2003-present) and Chief Operating Officer (2002-present) of FMR Corp. He also serves on the Board |
| at Fidelity Investments Canada, Ltd. (2000-present). Previously, Mr. Reynolds served as President of Fidelity Investments Institutional |
| Retirement Group (1996-2000). |
* Trustees have been determined to be “Interested Trustees” by virtue of, among other things, their affiliation with the trust or various enti-
ties under common control with FMR.
19 Annual Report
|
Trustees and Officers - continued
Independent Trustees:
Correspondence intended for each Independent Trustee (that is, the Trustees other than the Interested Trustees) may be sent to Fidelity Investments, P.O. Box 55235, Boston, Massachusetts 02205-5235.
| Name, Age; Principal Occupation |
| |
| Dennis J. Dirks (57) |
| |
| Year of Election or Appointment: 2005 |
| Prior to his retirement in May 2003, Mr. Dirks was Chief Operating Officer and a member of the Board of The Depository Trust & |
| Clearing Corporation (DTCC) (1999-2003). He also served as President, Chief Operating Officer, and Board member of The |
| Depository Trust Company (DTC) (1999-2003) and President and Board member of the National Securities Clearing Corporation |
| (NSCC) (1999-2003). In addition, Mr. Dirks served as Chief Executive Officer and Board member of the Government Securities |
| Clearing Corporation (2001-2003) and Chief Executive Officer and Board member of the Mortgage-Backed Securities Clearing |
| Corporation (2001-2003). Mr. Dirks also serves as a Trustee and a member of the Finance Committee of Manhattan College |
| (2005-present) and a Trustee and a member of the Finance Committee of AHRC of Nassau County (2006-present). |
| |
| Robert M. Gates (62) |
| |
| Year of Election or Appointment: 1997 |
| Dr. Gates is Chairman of the Independent Trustees (2006-present). Dr. Gates is President of Texas A&M University (2002-present). |
| He was Director of the Central Intelligence Agency (CIA) from 1991 to 1993. From 1989 to 1991, Dr. Gates served as Assistant |
| to the President of the United States and Deputy National Security Advisor. Dr. Gates is a Director of NACCO Industries, Inc. |
| (mining and manufacturing), Parker Drilling Co., Inc. (drilling and rental tools for the energy industry, 2001-present), and Brinker |
| International (restaurant management, 2003-present). Previously, Dr. Gates served as a Director of LucasVarity PLC (automotive |
| components and diesel engines), a Director of TRW Inc. (automotive, space, defense, and information technology), and Dean of |
| the George Bush School of Government and Public Service at Texas A&M University (1999-2001). |
| |
| George H. Heilmeier (69) |
| |
| Year of Election or Appointment: 2004 |
| Dr. Heilmeier is Chairman Emeritus of Telcordia Technologies (communication software and systems), where prior to his retirement, |
| he served as company Chairman and Chief Executive Officer. He currently serves on the Boards of Directors of The Mitre Corpo- |
| ration (systems engineering and information technology support for the government), and HRL Laboratories (private research and |
| development, 2004-present). He is Chairman of the General Motors Science & Technology Advisory Board and a Life Fellow of |
| the Institute of Electrical and Electronics Engineers (IEEE). Dr. Heilmeier is a member of the Defense Science Board and the National |
| Security Agency Advisory Board. He is also a member of the National Academy of Engineering, the American Academy of Arts |
| and Sciences, and the Board of Overseers of the School of Engineering and Applied Science of the University of Pennsylvania. |
| Previously, Dr. Heilmeier served as a Director of TRW Inc. (automotive, space, defense, and information technology, 1992-2002), |
| Compaq (1994-2002), Automatic Data Processing, Inc. (ADP) (technology-based business outsourcing, 1995-2002), INET |
| Technologies Inc. (telecommunications network surveillance, 2001-2004), and Teletech Holdings (customer management services). |
| He is the recipient of the 2005 Kyoto Prize in Advanced Technology for his invention of the liquid crystal display. |
| |
| Marie L. Knowles (59) |
| |
| Year of Election or Appointment: 2001 |
| Prior to Ms. Knowles’ retirement in June 2000, she served as Executive Vice President and Chief Financial Officer of Atlantic |
| Richfield Company (ARCO) (diversified energy, 1996-2000). From 1993 to 1996, she was a Senior Vice President of ARCO and |
| President of ARCO Transportation Company. She served as a Director of ARCO from 1996 to 1998. She currently serves as a |
| Director of Phelps Dodge Corporation (copper mining and manufacturing) and McKesson Corporation (healthcare service, |
| 2002-present). Ms. Knowles is a Trustee of the Brookings Institution and the Catalina Island Conservancy and also serves as a |
| member of the Advisory Board for the School of Engineering of the University of Southern California. |
| |
| Ned C. Lautenbach (62) |
| |
| Year of Election or Appointment: 2000 |
| Mr. Lautenbach has been a partner of Clayton, Dubilier & Rice, Inc. (private equity investment firm) since September 1998. Pre- |
| viously, Mr. Lautenbach was with the International Business Machines Corporation (IBM) from 1968 until his retirement in 1998. |
| Mr. Lautenbach serves as a Director of Italtel Holding S.p.A. (telecommunications (Milan, Italy), 2004-present) and Eaton Corpora- |
| tion (diversified industrial) as well as the Philharmonic Center for the Arts in Naples, Florida. He also is a member of the Board of |
| Trustees of Fairfield University (2005-present), as well as a member of the Council on Foreign Relations. |
Annual Report 20
| Name, Age; Principal Occupation |
| |
| William O. McCoy (72) |
| |
| Year of Election or Appointment: 1997 |
| Prior to his retirement in December 1994, Mr. McCoy was Vice Chairman of the Board of BellSouth Corporation (telecommunications) |
| and President of BellSouth Enterprises. He is currently a Director of Duke Realty Corporation (real estate), and Progress Energy, Inc. |
| (electric utility). He is also a partner of Franklin Street Partners (private investment management firm) and a member of the |
| Research Triangle Foundation Board. In addition, Mr. McCoy served as the Interim Chancellor (1999-2000) and a member of the |
| Board of Visitors for the University of North Carolina at Chapel Hill and currently serves as Chairman of the Board of Directors of the |
| University of North Carolina Health Care System and the Board of Visitors of the Kenan-Flagler Business School (University of North |
| Carolina at Chapel Hill). He also served as Vice President of Finance for the University of North Carolina (16-school system). |
| |
| Cornelia M. Small (61) |
| |
| Year of Election or Appointment: 2005 |
| Ms. Small is a member (2000-present) and Chairperson (2002-present) of the Investment Committee, and a member (2002-present) |
| of the Board of Trustees of Smith College. Previously, she served as Chief Investment Officer (1999-2000), Director of Global |
| Equity Investments (1996-1999), and a member of the Board of Directors of Scudder, Stevens & Clark (1990-1997) and Scudder |
| Kemper Investments (1997-1999). In addition, Ms. Small served as Co-Chair (2000-2003) of the Annual Fund for the Fletcher |
| School of Law and Diplomacy. |
| |
| William S. Stavropoulos (66) |
| |
| Year of Election or Appointment: 2001 |
| Mr. Stavropoulos is Chairman of the Board (2000-present) and a Member of the Board of Directors of The Dow Chemical Company. |
| Since joining The Dow Chemical Company in 1967, Mr. Stavropoulos served in numerous senior management positions, including |
| President (1993-2000; 2002-2003), CEO (1995-2000; 2002-2004), and Chairman of the Executive Committee (2000-2004). |
| Currently, he is a Director of NCR Corporation (data warehousing and technology solutions), BellSouth Corporation (telecommu- |
| nications), Chemical Financial Corporation, Maersk Inc. (industrial conglomerate, 2002-present), and Metalmark Capital (private |
| equity investment firm, 2005-present). He also serves as a member of the Board of Trustees of the American Enterprise Institute for |
| Public Policy Research. In addition, Mr. Stavropoulos is a member of The Business Council, J.P. Morgan International Council and |
| the University of Notre Dame Advisory Council for the College of Science. |
| |
| Kenneth L. Wolfe (67) |
| |
| Year of Election or Appointment: 2005 |
| Prior to his retirement in 2001, Mr. Wolfe was Chairman and Chief Executive Officer of Hershey Foods Corporation (1993-2001). |
| He currently serves as a member of the boards of Adelphia Communications Corporation (2003-present), Bausch & Lomb, Inc., |
| and Revlon Inc. (2004-present). |
Advisory Board Members and Executive Officers:
Correspondence intended for Messrs. Keyes and Gamper may be sent to Fidelity Investments, P.O. Box 55235, Boston, Massachusetts 02205-5235. Correspondence intended for each executive officer and Mr. Lynch may be sent to Fidelity Investments, 82 Devonshire Street, Boston, Massachusetts 02109.
| Name, Age; Principal Occupation |
| |
| Albert R. Gamper, Jr. (63) |
| |
| Year of Election or Appointment: 2005 |
| Member of the Advisory Board of Fidelity Select Portfolios. Mr. Gamper also serves as a Trustee (2006-present) or Member of the |
| Advisory Board (2005-present) of other investment companies advised by FMR. Prior to his retirement in December 2004, |
| Mr. Gamper served as Chairman of the Board of CIT Group Inc. (commercial finance). During his tenure with CIT Group Inc. |
| Mr. Gamper served in numerous senior management positions, including Chairman (1987-1989; 1999-2001; 2002-2004), Chief |
| Executive Officer (1987-2004), and President (1989-2002). He currently serves as a member of the Board of Directors of Public |
| Service Enterprise Group (utilities, 2001-present), Chairman of the Board of Governors, Rutgers University (2004-present), and |
| Chairman of the Board of Saint Barnabas Health Care System. |
| |
| James H. Keyes (65) |
| |
| Year of Election or Appointment: 2006 |
| Member of the Advisory Board of Fidelity Select Portfolios. Prior to his retirement in 2003, Mr. Keyes was Chairman, President, |
| and Chief Executive Officer of Johnson Controls, Inc. (automotive supplier, 1993-2003). He currently serves as a member of the |
| boards of LSI Logic Corporation (semiconductor technologies, 1984-present), Navistar International Corporation (manufacture and |
| sale of trucks, buses, and diesel engines, 2002-present), and Pitney Bowes, Inc. (integrated mail, messaging, and document |
| management solutions, 1998-present). |
21 Annual Report
Trustees and Officers - continued
| Name, Age; Principal Occupation |
| |
| Peter S. Lynch (62) |
| |
| Year of Election or Appointment: 2003 |
| Member of the Advisory Board of Fidelity Select Portfolios. Vice Chairman and a Director of FMR, and Vice Chairman (2001-present) |
| and a Director (2000-present) of FMR Co., Inc. Previously, Mr. Lynch served as a Trustee of the Fidelity funds (1990-2003). In |
| addition, he serves as a Trustee of Boston College, Massachusetts Eye & Ear Infirmary, Historic Deerfield, John F. Kennedy Library, |
| and the Museum of Fine Arts of Boston. |
| |
| Walter C. Donovan (43) |
| |
| Year of Election or Appointment: 2005 |
| Vice President of Money Market. Mr. Donovan also serves as Vice President of Fidelity’s High Income Funds (2005-present), Fidelity’s |
| Fixed-Income Funds (2005-present), certain Asset Allocation Funds (2005-present), and certain Balanced Funds (2005-present). |
| Mr. Donovan also serves as Executive Vice President of FMR (2005-present) and FMRC (2005-present). Previously, Mr. Donovan |
| served as Vice President and Director of Fidelity’s International Equity Trading group (1998-2005). |
| |
| Charles S. Morrison (45) |
| |
| Year of Election or Appointment: 2005 |
| Vice President of Money Market. Mr. Morrison also serves as Vice President of Fidelity’s Money Market Funds (2005-present) |
| and certain Asset Allocation Funds (2002-present). Previously, he served as Vice President of Fidelity’s Bond Funds (2002-2005) |
| and certain Balanced Funds (2002-2005). He served as Vice President (2002-2005) and Bond Group Leader (2002-2005) of |
| Fidelity Investments Fixed Income Division. Mr. Morrison is also Vice President of FIMM (2002-present) and FMR (2002-present). |
| Mr. Morrison joined Fidelity Investments in 1987 as a Corporate Bond Analyst in the Fixed Income Research Division. |
| |
| David L. Murphy (58) |
| |
| Year of Election or Appointment: 2002 |
| Vice President of Money Market. Mr. Murphy also serves as Vice President of Fidelity’s Money Market Funds (2002-present), |
| certain Asset Allocation Funds (2003-present), Fidelity’s Investment Grade-Bond Funds (2005-present), and Fidelity’s Balanced |
| Funds (2005-present). He serves as Senior Vice President (2000-present) and Head (2004-present) of the Fidelity Investments |
| Fixed Income Division. Mr. Murphy is also a Senior Vice President of Fidelity Investments Money Management, Inc. (2003-present) |
| and an Executive Vice President of FMR (2005-present). Previously, Mr. Murphy served as Money Market Group Leader |
| (2002-2004), Bond Group Leader (2000-2002), and Vice President of Fidelity’s Taxable Bond Funds (2000-2002) and Fidelity’s |
| Municipal Bond Funds (2001-2002). |
| |
| Robert A. Litterst (46) |
| |
| Year of Election or Appointment: 2004 |
| Vice President of Money Market. Mr. Litterst also serves as Vice President of other funds advised by FMR. Prior to assuming his |
| current responsibilities, Mr. Litterst worked as a portfolio manager. |
| |
| Eric D. Roiter (57) |
| |
| Year of Election or Appointment: 1998 |
| Secretary of Money Market. He also serves as Secretary of other Fidelity funds; Vice President, General Counsel, and Secretary of |
| FMR Co., Inc. (2001-present) and FMR; Assistant Secretary of Fidelity Management & Research (U.K.) Inc. (2001-present), Fidelity |
| Research & Analysis Company (2001-present), and Fidelity Investments Money Management, Inc. (2001-present). Mr. Roiter is an |
| Adjunct Member, Faculty of Law, at Boston College Law School (2003-present). Previously, Mr. Roiter served as Vice President and |
| Secretary of Fidelity Distributors Corporation (FDC) (1998-2005). |
| |
| Stuart Fross (46) |
| |
| Year of Election or Appointment: 2003 |
| �� Assistant Secretary of Money Market. Mr. Fross also serves as Assistant Secretary of other Fidelity funds (2003-present), Vice |
| President and Secretary of FDC (2005-present), and is an employee of FMR. |
| |
| Christine Reynolds (47) |
| |
| Year of Election or Appointment: 2004 |
| President and Treasurer of Money Market. Ms. Reynolds also serves as President and Treasurer of other Fidelity funds (2004-present) |
| and is a Vice President (2003-present) and an employee (2002-present) of FMR. Before joining Fidelity Investments, Ms. Reynolds |
| worked at PricewaterhouseCoopers LLP (PwC) (1980-2002), where she was most recently an audit partner with PwC’s investment |
| management practice. |
| |
| R. Stephen Ganis (39) |
| |
| Year of Election or Appointment: 2006 |
| Anti-Money Laundering (AML) officer of Money Market. Mr. Ganis also serves as AML officer of other Fidelity funds (2006-present) |
| and FMR Corp. (2003-present). Before joining Fidelity Investments, Mr. Ganis practiced law at Goodwin Procter, LLP (2000-2002). |
Annual Report 22
| Name, Age; Principal Occupation |
| |
| Paul M. Murphy (58) |
| |
| Year of Election or Appointment: 2005 |
| Chief Financial Officer of Money Market. Mr. Murphy also serves as Chief Financial Officer of other Fidelity funds (2005-present). |
| He also serves as Senior Vice President of Fidelity Pricing and Cash Management Services Group (FPCMS). |
| |
| Kenneth A. Rathgeber (58) |
| |
| Year of Election or Appointment: 2004 |
| Chief Compliance Officer of Money Market. Mr. Rathgeber also serves as Chief Compliance Officer of other Fidelity funds |
| (2004-present) and Executive Vice President of Risk Oversight for Fidelity Investments (2002-present). He is Chief Compliance |
| Officer of FMR (2005-present), FMR Co., Inc. (2005-present), Fidelity Management & Research (U.K.) Inc. (2005-present), Fidelity |
| Research & Analysis Company (2005-present), Fidelity Investments Money Management, Inc. (2005-present), and Strategic |
| Advisers, Inc. (2005-present). Previously, Mr. Rathgeber served as Executive Vice President and Chief Operating Officer for Fidelity |
| Investments Institutional Services Company, Inc. (1998-2002). |
| |
| Bryan A. Mehrmann (44) |
| |
| Year of Election or Appointment: 2005 |
| Deputy Treasurer of Money Market. Mr. Mehrmann also serves as Deputy Treasurer of other Fidelity funds (2005-present) and is |
| an employee of FMR. Previously, Mr. Mehrmann served as Vice President of Fidelity Investments Institutional Services Group |
| (FIIS)/Fidelity Investments Institutional Operations Corporation, Inc. (FIIOC) Client Services (1998-2004). |
| |
| Kimberley H. Monasterio (42) |
| |
| Year of Election or Appointment: 2004 |
| Deputy Treasurer of Money Market. Ms. Monasterio also serves as Deputy Treasurer of other Fidelity funds (2004) and is an employee |
| of FMR (2004). Before joining Fidelity Investments, Ms. Monasterio served as Treasurer (2000-2004) and Chief Financial Officer |
| (2002-2004) of the Franklin Templeton Funds and Senior Vice President of Franklin Templeton Services, LLC (2000-2004). |
| |
| Kenneth B. Robins (36) |
| |
| Year of Election or Appointment: 2005 |
| Deputy Treasurer of Money Market. Mr. Robins also serves as Deputy Treasurer of other Fidelity funds (2005-present) and is an |
| employee of FMR (2004-present). Before joining Fidelity Investments, Mr. Robins worked at KPMG LLP, where he was a partner in |
| KPMG’s department of professional practice (2002-2004) and a Senior Manager (1999-2000). In addition, Mr. Robins served as |
| Assistant Chief Accountant, United States Securities and Exchange Commission (2000-2002). |
| |
| Robert G. Byrnes (39) |
| |
| Year of Election or Appointment: 2005 |
| Assistant Treasurer of Money Market. Mr. Byrnes also serves as Assistant Treasurer of other Fidelity funds (2005-present) and is an |
| employee of FMR (2005-present). Previously, Mr. Byrnes served as Vice President of FPCMS (2003-2005). Before joining Fidelity |
| Investments, Mr. Byrnes worked at Deutsche Asset Management where he served as Vice President of the Investment Operations |
| Group (2000-2003). |
| |
| John H. Costello (59) |
| |
| Year of Election or Appointment: 1986 |
| Assistant Treasurer of Money Market. Mr. Costello also serves as Assistant Treasurer of other Fidelity funds and is an employee of |
| FMR. |
| |
| Peter L. Lydecker (52) |
| |
| Year of Election or Appointment: 2004 |
| Assistant Treasurer of Money Market. Mr. Lydecker also serves as Assistant Treasurer of other Fidelity funds (2004) and is an |
| employee of FMR. |
| |
| Mark Osterheld (50) |
| |
| Year of Election or Appointment: 2002 |
| Assistant Treasurer of Money Market. Mr. Osterheld also serves as Assistant Treasurer of other Fidelity funds (2002) and is an |
| employee of FMR. |
| |
| Gary W. Ryan (47) |
| |
| Year of Election or Appointment: 2005 |
| Assistant Treasurer of Money Market. Mr. Ryan also serves as Assistant Treasurer of other Fidelity funds (2005-present) and is an |
| employee of FMR (2005-present). Previously, Mr. Ryan served as Vice President of Fund Reporting in FPCMS (1999-2005). |
23 Annual Report
Trustees and Officers - continued
| Name, Age; Principal Occupation |
| |
| Salvatore Schiavone (40) |
| |
| Year of Election or Appointment: 2005 |
| Assistant Treasurer of Money Market. Mr. Schiavone also serves as Assistant Treasurer of other Fidelity funds (2005-present) and is |
| an employee of FMR (2005-present). Before joining Fidelity Investments, Mr. Schiavone worked at Deutsche Asset Management, |
| where he most recently served as Assistant Treasurer (2003-2005) of the Scudder Funds and Vice President and Head of Fund |
| Reporting (1996-2003). |
Annual Report 24
A total of .29% of the dividends distributed during the fiscal year was derived from interest on U.S. Government securities which is generally exempt from state income tax.
The fund designates $5,549,764 of distributions paid during the period January 1, 2006 to February 28, 2006 as qualifying to be taxed as interest-related dividends for nonresident alien shareholders.
The fund will notify shareholders in January 2007 of amounts for use in preparing 2006 income tax returns.
25 Annual Report
Board Approval of Investment Advisory Contracts and Management Fees
Select Money Market Portfolio
|
On January 19, 2006, the Board of Trustees, including the Independent Trustees (together, the Board), voted to approve a general research services agreement (the Agreement) between FMR, FMR Co., Inc. (FMRC), Fidelity Investments Money Management, Inc. (FIMM), and Fidelity Research & Analysis Company (FRAC) (together, the Investment Advisers) for the fund, effective January 20, 2006, pursuant to which FRAC may provide general research and investment advisory support services to FMRC and FIMM. The Board considered that it has approved previously various sub-advisory agreements for the fund with affiliates of FMR that allow FMR to obtain research, non-discretionary advice, or discretionary portfolio management at no additional expense to the fund. The Board, assisted by the advice of fund counsel and independent Trustees’ counsel, considered a broad range of information and determined that it would be beneficial for the fund to access the research and investment advisory support services supplied by FRAC at no additional expense to the fund.
The Board reached this determination in part because the new arrangement will involve no changes in (i) the contractual terms of and fees payable under the fund’s management contract or sub-advisory agreements; (ii) the investment process or strategies employed in the management of the fund’s assets; (iii) the nature or level of services provided under the fund’s management contract or sub-advisory agreements; (iv) the day-to-day management of the fund or the persons primarily responsible for such management; or (v) the ultimate control or beneficial ownership of FMR, FMRC, or FIMM. The Board also considered that the establishment of the Agreement would not necessitate prior shareholder approval of the Agreement or result in an assignment and termination of the fund’s management contract or sub-advisory agreements under the Investment Company Act of 1940.
Because the Board was approving an arrangement with FRAC under which the fund will not bear any additional management fees or expenses and under which the fund’s portfolio manager would not change, it did not consider the fund’s investment performance, competitiveness of management fee and total expenses, costs of services and profitability, or economies of scale to be significant factors in its decision.
In connection with its future renewal of the fund’s management contract and sub-advisory agreements, the Board will consider: (i) the nature, extent, and quality of services provided to the fund, including shareholder and administrative services and investment performance; (ii) the competitiveness of the fund’s management fee and total expenses; (iii) the costs of the services and profitability, including the revenues earned and the expenses incurred by Fidelity in conducting the business of developing, marketing, distributing, managing, administering, and servicing the fund and its shareholders; and (iv) whether there have been economies of scale in respect of the management of the Fidelity funds, whether the Fidelity funds (including the fund) have appropriately benefited from any such economies of scale, and whether there is potential for realization of any further economies.
Based on its evaluation of all of the conclusions noted above, and after considering all material factors, the Board ultimately concluded that the fund’s Agreement is fair and reasonable, and that the fund’s Agreement should be approved.
Managing Your Investments
Fidelity offers several ways to conveniently manage your personal investments via your telephone or PC. You can access your account information, conduct trades and research your investments 24 hours a day.
By Phone
Fidelity Automated Service Telephone provides a single toll-free number to access account balances, positions, quotes and trading. It’s easy to navigate the service, and on your first call, the system will help you create a personal identification number (PIN) for security.

By PC
Fidelity’s web site on the Internet provides a wide range of information, including daily financial news, fund performance, interactive planning tools and news about Fidelity products and services.

* When you call the quotes line, please remember that a fund’s yield and return will vary and, except for money market funds, share price will also vary. This means that you may have a gain or loss when you sell your shares. There is no assurance that money market funds will be able to maintain a stable $1 share price; an investment in a money market fund is not insured or guaranteed by the U.S. government. Total returns are historical and include changes in share price, reinvestment of dividends and capital gains, and the effects of any sales charges.
27 27 Annual Report
To Visit Fidelity
For directions and hours,
please call 1-800-544-9797.
Arizona
7001 West Ray Road
Chandler, AZ
7373 N. Scottsdale Road
Scottsdale, AZ
California
815 East Birch Street
Brea, CA
1411 Chapin Avenue
Burlingame, CA
851 East Hamilton Avenue
Campbell, CA
19200 Von Karman Avenue
Irvine, CA
601 Larkspur Landing Circle
Larkspur, CA
10100 Santa Monica Blvd.
Los Angeles, CA
27101 Puerta Real
Mission Viejo, CA
73-575 El Paseo
Palm Desert, CA
251 University Avenue
Palo Alto, CA
123 South Lake Avenue
Pasadena, CA
16995 Bernardo Ctr. Drive
Rancho Bernardo, CA
1740 Arden Way
Sacramento, CA
7676 Hazard Center Drive
San Diego, CA
8 Montgomery Street
San Francisco, CA
3793 State Street
Santa Barbara, CA
21701 Hawthorne Boulevard
Torrance, CA
2001 North Main Street
Walnut Creek, CA
6300 Canoga Avenue
Woodland Hills, CA
Colorado
1625 Broadway
Denver, CO
9185 East Westview Road
Littleton, CO
Connecticut
48 West Putnam Avenue
Greenwich, CT
265 Church Street
New Haven, CT
300 Atlantic Street
Stamford, CT
29 South Main Street
West Hartford, CT
Delaware
222 Delaware Avenue
Wilmington, DE
|
Florida
4400 N. Federal Highway
Boca Raton, FL
121 Alhambra Plaza
Coral Gables, FL
2948 N. Federal Highway
Ft. Lauderdale, FL
1907 West State Road 434
Longwood, FL
8880 Tamiami Trail, North
Naples, FL
3550 Tamiami Trail, South
Sarasota, FL
1502 N. Westshore Blvd.
Tampa, FL
2465 State Road 7
Wellington, FL
3501 PGA Boulevard
West Palm Beach, FL
Georgia
3445 Peachtree Road, N.E.
Atlanta, GA
1000 Abernathy Road
Atlanta, GA
Illinois
One North LaSalle Street
Chicago, IL
875 North Michigan Ave.
Chicago, IL
1415 West 22nd Street
Oak Brook, IL
1700 East Golf Road
Schaumburg, IL
3232 Lake Avenue
Wilmette, IL
Indiana
4729 East 82nd Street
Indianapolis, IN
Kansas
5400 College Boulevard
Overland Park, KS
Maine
Three Canal Plaza
Portland, ME
Maryland
7315 Wisconsin Avenue
Bethesda, MD
One W. Pennsylvania Ave.
Towson, MD
Massachusetts
801 Boylston Street
Boston, MA
155 Congress Street
Boston, MA
300 Granite Street
Braintree, MA
44 Mall Road
Burlington, MA
405 Cochituate Road
Framingham, MA
416 Belmont Street
Worcester, MA
|
Michigan
500 E. Eisenhower Pkwy.
Ann Arbor, MI
280 Old N. Woodward Ave.
Birmingham, MI
43420 Grand River Avenue
Novi, MI
29155 Northwestern Hwy.
Southfield, MI
Minnesota
7600 France Avenue South
Edina, MN
Missouri
8885 Ladue Road
Ladue, MO
Nevada
2225 Village Walk Drive
Henderson, NV
New Jersey
150 Essex Street
Millburn, NJ
56 South Street
Morristown, NJ
396 Route 17, North
Paramus, NJ
3518 Route 1 North
Princeton, NJ
530 Highway 35
Shrewsbury, NJ
New York
1055 Franklin Avenue
Garden City, NY
37 West Jericho Turnpike
Huntington Station, NY
1271 Avenue of the Americas
New York, NY
61 Broadway
New York, NY
350 Park Avenue
New York, NY
200 Fifth Avenue
New York, NY
733 Third Avenue
New York, NY
11 Penn Plaza
New York, NY
2070 Broadway
New York, NY
1075 Northern Blvd.
Roslyn, NY
North Carolina
4611 Sharon Road
Charlotte, NC
Ohio
3805 Edwards Road
Cincinnati, OH
1324 Polaris Parkway
Columbus, OH
28699 Chagrin Boulevard
Woodmere Village, OH
Oregon
16850 SW 72nd Avenue
Tigard, OR
|
Pennsylvania
600 West DeKalb Pike
King of Prussia, PA
1735 Market Street
Philadelphia, PA
12001 Perry Highway
Wexford, PA
Rhode Island
47 Providence Place
Providence, RI
Tennessee
6150 Poplar Avenue
Memphis, TN
Texas
10000 Research Boulevard
Austin, TX
4001 Northwest Parkway
Dallas, TX
12532 Memorial Drive
Houston, TX
2701 Drexel Drive
Houston, TX
6500 N. MacArthur Blvd.
Irving, TX
6005 West Park Boulevard
Plano, TX
14100 San Pedro
San Antonio, TX
1576 East Southlake Blvd.
Southlake, TX
19740 IH 45 North
Spring, TX
Utah
215 South State Street
Salt Lake City, UT
Virginia
1861 International Drive
McLean, VA
Washington
411 108th Avenue, N.E.
Bellevue, WA
1518 6th Avenue
Seattle, WA
Washington, DC
1900 K Street, N.W.
Washington, DC
Wisconsin
595 North Barker Road
Brookfield, WI
|
Annual Report 28
Investment Adviser
Fidelity Management & Research Company
Boston, MA
Investment Sub-Advisers
Fidelity Investments Money Management, Inc.,
Fidelity International Investment Advisors
Fidelity International Investment Advisors
(U.K. Limited)
Fidelity Research & Analysis Company
(formerly Fidelity Management & Research (Far East) Inc.)
General Distributor
Fidelity Distributors Corporation
Boston, MA
Transfer and Service Agent
Fidelity Service Company, Inc.
Boston, MA
Custodian
The Bank of New York
New York, NY
Corporate Headquarters
82 Devonshire Street
Boston, MA 02109
1-800-544-8888
The Fidelity Telephone Connection
Mutual Fund 24-Hour Service
Exchanges/Redemptions
and Account Assistance 1-800-544-6666
Product Information 1-800-544-8888
Retirement Accounts 1-800-544-4774
(8 a.m. - 9 p.m.)
TDD Service 1-800-544-0118
for the deaf and hearing impaired
(9 a.m. - 9 p.m. Eastern time)
Fidelity Automated Service
Telephone (FAST®) (automated graphic) 1-800-544-5555
(automated graphic) Automated line for quickest service

Fidelity®
Select Portfolios®
Natural Resources Sector
Energy
Energy Service
Gold
Natural Gas
Natural Resources
Paper and Forest Products
Annual Report
February 28, 2006


| Contents | | |
| |
| Chairman’s Message | | 3 |
| Shareholder Expense Example | | 4 |
| Fund Updates* | | |
| Natural Resources Sector | | |
| Energy | | 6 |
| Energy Service | | 17 |
| Gold | | 26 |
| Natural Gas | | 36 |
| Natural Resources | | 45 |
| Paper and Forest Products | | 58 |
| Notes to Financial Statements | | 67 |
| Report of Independent Registered | | 72 |
| Public Accounting Firm | | |
| Trustees and Officers | | 73 |
| Distributions | | 78 |
| Board Approval of Investment | | 80 |
| Advisory Contracts and | | |
| Management Fees | | |
* Fund updates for each Select Portfolio include: Performance, Management’s Discussion of Fund Performance, Investment Changes, Investments, and Financial Statements.
To view a fund’s proxy voting guidelines and proxy voting record for the 12-month period ended June 30, visit www.fidelity.com/proxyvotingresults or visit the Securities and Exchange Commission’s (SEC) web site at www.sec.gov. You may also call 1-800-544-8544 to request a free copy of the proxy voting guidelines.
Standard & Poor’s, S&P and S&P 500 are registered service marks of The McGraw-Hill Companies, Inc. and have been licensed for use by Fidelity Distributors Corporation.
Other third party marks appearing herein are the property of their respective owners.
All other marks appearing herein are registered or unregistered trademarks or service marks of FMR Corp. or an affiliated company.
This report and the financial statements contained herein are submitted for the general information of the shareholders of the funds. This report is not authorized for distribution to prospective investors in the funds unless preceded or accompanied by an effective prospectus.
A fund files its complete schedule of portfolio holdings with the SEC for the first and third quarters of each fiscal year on Form N-Q. Forms N-Q are available on the SEC’s web site at http://www.sec.gov. A fund’s Forms N-Q may be reviewed and copied at the SEC’s Public Reference Room in Washing-ton, DC. Information regarding the operation of the SEC’s Public Reference Room may be obtained by calling 1-800-SEC-0330. For a complete list of a fund’s portfolio holdings, view the most recent quarterly holdings report, semiannual report, or annual report on Fidelity’s web site at http://www.fidelity.com/holdings.
NOT FDIC INSURED · MAY LOSE VALUE · NO BANK GUARANTEE
Neither the funds nor Fidelity Distributors Corporation is a bank.
|
(Photograph of Edward C. Johnson 3d.)
Although many securities markets made gains in early 2006, there is only one certainty when it comes to investing: There is no sure thing. There are, however, a number of time-tested, fundamental investment principles that can put the historical odds in your favor.
One of the basic tenets is to invest for the long term. Over time, riding out the markets’ inevitable ups and downs has proven much more effective than selling into panic or chasing the hottest trend. Even missing only a few of the markets’ best days can significantly diminish investor returns. Patience also affords the benefits of compounding — of earning interest on additional income or reinvested dividends and capital gains. There are tax advantages and cost benefits to consider as well. The more you sell, the more taxes you pay, and the more you trade, the higher the costs. While staying the course doesn’t eliminate risk, it can considerably lessen the effect of short-term declines.
You can further manage your investing risk through diversification. And today, more than ever, geographic diversification should be taken into account. Studies
indicate that asset allocation is the single most important determinant of a portfolio’s long-term success. The right mix of stocks, bonds and cash — aligned to your particular risk tolerance and investment objective — is very important. Age-appropriate rebalancing is also an essential aspect of asset allocation. For younger investors, an emphasis on equities — which historically have been the best performing asset class over time — is encouraged. As investors near their specific goal, such as retirement or sending a child to college, consideration may be given to replacing volatile assets (e.g. common stocks) with more-stable fixed investments (bonds or savings plans).
A third investment principle — investing regularly — can help lower the average cost of your purchases. Investing a certain amount of money each month or quarter helps ensure you won’t pay for all your shares at market highs. This strategy — known as dollar cost averaging — also reduces unconstructive “emotion” from investing, helping shareholders avoid selling weak performers just prior to an upswing, or chasing a hot performer just before a correction.
We invite you to contact us via the Internet, through our Investor Centers or over the phone. It is our privilege to provide you the information you need to make the investments that are right for you.

3 Annual Report
Shareholder Expense Example
|
As a shareholder of a Fund, you incur two types of costs: (1) transaction costs, including redemption fees, exchange fees, and (2) ongoing costs, including management fees and other Fund expenses. This Example is intended to help you understand your ongoing costs (in dollars) of investing in the Funds and to compare these costs with the ongoing costs of investing in other mutual funds.
The Example is based on an investment of $1,000 invested at the beginning of the period and held for the entire period (September 1, 2005 to Febru-ary 28, 2006).
Actual Expenses
The first line of the table below for each fund provides information about actual account values and actual expenses. You may use the information in this line, together with the amount you invested, to estimate the expenses that you paid over the period. Simply divide your account value by $1,000.00 (for example, an $8,600 account value divided by $1,000.00 = 8.6), then multiply the result by the number in the first line for a fund under the heading entitled “Expenses Paid During Period” to estimate the expenses you paid on your account during this period. A small balance maintenance fee of $12.00 that is charged once a year may apply for certain accounts with a value of less than $2,000. This fee is not included in the table below. If it was, the estimate of expenses you paid during the period would be higher, and your ending account value lower, by this amount.
Hypothetical Example for Comparison Purposes
The second line of the table below for each fund provides information about hypothetical account values and hypothetical expenses based on a fund’s actual expense ratio and an assumed rate of return of 5% per year before expenses, which is not the Fund’s actual return. The hypothetical account values and expenses may not be used to estimate the actual ending account balance or expenses you paid for the period. You may use this information to compare the ongoing costs of investing in the Fund and other funds. To do so, compare this 5% hypothetical example with the 5% hypothetical examples that appear in the shareholder reports of the other funds. A small balance maintenance fee of $12.00 that is charged once a year may apply for certain accounts with a value of less than $2,000. This fee is not included in the table below. If it was, the estimate of expenses you paid during the period would be higher, and your ending account value lower, by this amount.
Please note that the expenses shown in the table are meant to highlight your ongoing costs only and do not reflect any transaction costs. Therefore, the second line of the table is useful in comparing ongoing costs only, and will not help you determine the relative total costs of owning different funds. In addition, if these transactional costs were included, your costs would have been higher.
| | | | | | | | | | | | | Expenses Paid |
| | | | | Beginning | | | | Ending | | | | During Period* |
| | | | | Account Value | | | | Account Value | | | | September 1, 2005 to |
| | | | | September 1, 2005 | | | | February 28, 2006 | | | | February 28, 2006 |
| Energy Portfolio | | | | | | | | | | | | |
| Actual | | $ | | 1,000.00 | | $ | | 1,085.50 | | $ | | 4.81** |
| HypotheticalA | | $ | | 1,000.00 | | $ | | 1,020.18 | | $ | | 4.66** |
| Energy Service Portfolio | | | | | | | | | | | | |
| Actual | | $ | | 1,000.00 | | $ | | 1,110.70 | | $ | | 4.87** |
| HypotheticalA | | $ | | 1,000.00 | | $ | | 1,020.18 | | $ | | 4.66** |
| Gold Portfolio | | | | | | | | | | | | |
| Actual | | $ | | 1,000.00 | | $ | | 1,514.30 | | $ | | 5.98 |
| HypotheticalA | | $ | | 1,000.00 | | $ | | 1,020.03 | | $ | | 4.81 |
| Natural Gas Portfolio | | | | | | | | | | | | |
| Actual | | $ | | 1,000.00 | | $ | | 1,037.10 | | $ | | 4.75** |
| HypotheticalA | | $ | | 1,000.00 | | $ | | 1,020.13 | | $ | | 4.71** |
| Natural Resources Portfolio | | | | | | | | | | | | |
| Actual | | $ | | 1,000.00 | | $ | | 1,133.90 | | $ | | 5.19** |
| HypotheticalA | | $ | | 1,000.00 | | $ | | 1,019.93 | | $ | | 4.91** |
| Paper and Forest Products Portfolio | | | | | | | | | | | | |
| Actual | | $ | | 1,000.00 | | $ | | 1,110.70 | | $ | | 6.54 |
| HypotheticalA | | $ | | 1,000.00 | | $ | | 1,018.60 | | $ | | 6.26 |
A 5% return per year before expenses
* Expenses are equal to each Fund’s annualized expense ratio (shown in the table below); multiplied by the average account value over the period, multiplied by 181/365 (to reflect the one-half year period).
| | | Annualized |
| | | Expense Ratio |
| Energy Portfolio | | 93%** |
| Energy Service Portfolio | | 93%** |
| Gold Portfolio | | 96% |
| Natural Gas Portfolio | | 94%** |
| Natural Resources Portfolio | | 98%** |
| Paper and Forest Products Portfolio | | 1.25% |
** If contractual expense reductions, effective January 1, 2006, had been in effect during the entire period, the annualized expense ratio and the expenses paid in the actual and hypothetical examples above would have been as follows:
| | | Annualized | | | | |
| | | Expense Ratio | | | | Expenses Paid |
| Energy Portfolio | | .90% | | | | |
| Actual | | | | $ | | 4.65 |
| HypotheticalA | | | | $ | | 4.51 |
| Energy Service Portfolio | | .90% | | | | |
| Actual | | | | $ | | 4.71 |
| HypotheticalA | | | | $ | | 4.51 |
| Natural Gas Portfolio | | .90% | | | | |
| Actual | | | | $ | | 4.55 |
| HypotheticalA | | | | $ | | 4.51 |
| Natural Resources Portfolio | | .95% | | | | |
| Actual | | | | $ | | 5.03 |
| HypotheticalA | | | | $ | | 4.76 |
| |
| A 5% return per year before expenses | | | | | | |
55 Annual Report
Energy Portfolio
Performance
|
Average annual total return reflects the change in the value of an investment, assuming reinvestment of the fund’s dividend income and capital gains (the profits earned upon the sale of securities that have grown in value) and assuming a constant rate of performance each year. The $10,000 table and the fund’s returns do not reflect the deduction of taxes that a shareholder would pay on fund distributions or the redemption of fund shares. During periods of reimbursement by Fidelity, a fund’s total returns will be greater than it would be had the reimbursement not occurred. How a fund did yesterday is no guarantee of how it will do tomorrow.
| Average Annual Total Returns | | | | | | |
| Periods ended February 28, 2006 | | Past 1 | | Past 5 | | Past 10 |
| | | year | | years | | years |
| Select Energy | | 34.39% | | 15.81% | | 15.96% |
| |
| $10,000 Over 10 Years | | | | | | |
Let’s say hypothetically that $10,000 was invested in Fidelity® Select Energy Portfolio on February 29, 1996. The chart shows how the value of your investment would have changed, and also shows how the S&P 500® Index performed over the same period.
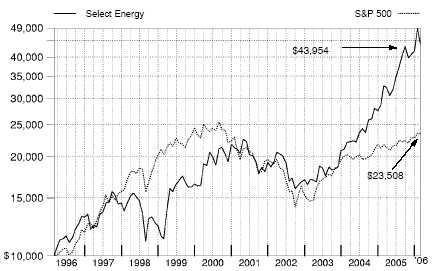
Management’s Discussion of Fund Performance
Comments from Matthew Friedman, Portfolio Manager of Fidelity® Select Energy Portfolio
With the exception of several popular large-cap stock performance measures, most major U.S. equity benchmarks had double-digit returns for the year ending February 28, 2006. For much of the period, market gains were driven largely by the energy sector, although utilities ultimately sneaked into the top spot for the year overall. Financials and telecommunication services also reached double figures, outperforming the 8.40% return of the broader market as measured by the large-cap-oriented Standard & Poor’s 500SM Index. The consumer discretionary segment — home to the weak performing automobile and media industries — was the biggest disappointment. Although the overall return for the S&P 500® beat the small-cap Russell 2000® Index in calendar year 2005 — the first time that’s happened in six years — small-caps stormed back in early 2006, leading to a 16.59% advance during the past 12 months, nearly twice the broader market’s gain. Mid-caps soared even higher, returning 17.67% according to the Russell Midcap® Index. The technology-heavy NASDAQ Composite® Index also fared well, climbing 12.13%, but the Dow Jones Industrial AverageSM, an index of 30 large-cap, blue-chip stocks, managed to rise only 4.52% .
During the past year, the fund returned 34.39%, beating both the S&P 500 and the Goldman Sachs® Natural Resources Index, which returned 23.71% . During the period, industry allocation within the energy universe drove the fund’s outperformance relative to the sector index, including overweighted investments in energy services companies such as Halliburton, Schlumberger and Grant Prideco that benefited from increased capital spending by oil producers. Refiners Frontier Oil and Premcor — which was acquired by Valero Energy — also boosted relative performance as refining demand outstripped refining capacity, particularly in the aftermath of major hurricanes in the United States. Also, an investment in coal producer Peabody Energy benefited from expectations of higher demand for a less costly fuel alternative. Lastly, the fund’s relative return benefited from underweighting the more defensive integrated oil companies, such as Chevron, Exxon Mobil and BP. On the other hand, the portfolio’s lack of exposure to Canadian oil sands companies Suncor Energy and Petro-Canada — both index components — detracted from the fund’s relative return, as the stocks performed well in the high oil price environment. French integrated oil company Total suffered from diminished growth expectations, while Marathon Oil —which I underweighted — outperformed my expectations in response to strength in its refining division. Diversified utility Dominion Resources was dragged down by its utility business, despite growth elsewhere in the company. The fund no longer holds the stock as of period end. Of final note, the fund’s underweighting in several higher-growth exploration and production companies, such as Burlington Resources, curbed performance relative to the sector benchmark.
The views expressed above reflect those of the portfolio manager(s) only through the end of the period of the report as stated on the cover of this report and do not necessarily represent the views of Fidelity or any other person in the Fidelity organization. Any such views are subject to change at any time based upon market or other conditions and Fidelity disclaims any responsibility to update such views. These views may not be relied on as investment advice and, because investment decisions for a Fidelity fund are based on numerous factors, may not be relied on as an indication of trading intent on behalf of any Fidelity fund.
77 Annual Report
| Energy Portfolio | | | | |
| Investment Changes | | |
| |
| |
| Top Ten Stocks as of February 28, 2006 |
| | | % of fund’s | | % of fund’s net assets |
| | | net assets | | 6 months ago |
| Halliburton Co. | | 5.9 | | 5.6 |
| Schlumberger Ltd. (NY Shares) | | 4.9 | | 6.1 |
| National Oilwell Varco, Inc. | | 4.3 | | 3.7 |
| GlobalSantaFe Corp. | | 4.1 | | 2.1 |
| ConocoPhillips | | 3.7 | | 2.9 |
| Canadian Natural Resources Ltd. | | 3.4 | | 3.0 |
| Valero Energy Corp. | | 3.2 | | 4.3 |
| Total SA sponsored ADR | | 3.1 | | 4.3 |
| Baker Hughes, Inc. | | 2.9 | | 2.2 |
| Smith International, Inc. | | 2.8 | | 1.9 |
| | | 38.3 | | |
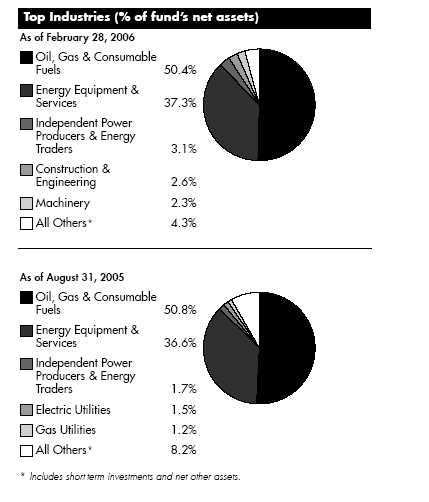
Annual Report 8
| Energy Portfolio | | | | | | | | |
| Investments February 28, 2006 | | | | |
| Showing Percentage of Net Assets | | | | | | | | |
| |
| Common Stocks — 99.2% | | | | | | | | |
| | | | | | | Shares | | Value (Note 1) |
| |
| CHEMICALS – 0.5% | | | | | | | | |
| Diversified Chemicals – 0.4% | | | | | | | | |
| Ashland, Inc. | | | | | | 173,800 | | $ 11,343,926 |
| Specialty Chemicals – 0.1% | | | | | | | | |
| Tokuyama Corp. | | | | | | 78,600 | | 1,168,972 |
| |
| TOTAL CHEMICALS | | | | | | | | 12,512,898 |
| |
| COMMERCIAL SERVICES & SUPPLIES – 0.1% | | | | | | | | |
| Environmental & Facility Services – 0.1% | | | | | | | | |
| Team, Inc. (a) | | | | | | 103,700 | | 3,069,520 |
| Human Resource & Employment Services – 0.0% | | | | | | | | |
| CDI Corp. | | | | | | 12,100 | | 296,329 |
| |
| TOTAL COMMERCIAL SERVICES & SUPPLIES | | | | | | | | 3,365,849 |
| |
| CONSTRUCTION & ENGINEERING – 2.6% | | | | | | | | |
| Construction & Engineering – 2.6% | | | | | | | | |
| Chicago Bridge & Iron Co. NV (NY Shares) | | | | | | 231,000 | | 5,652,570 |
| Fluor Corp. | | | | | | 199,700 | | 17,234,110 |
| Infrasource Services, Inc. (a) | | | | | | 437,600 | | 7,819,912 |
| Jacobs Engineering Group, Inc. (a) | | | | | | 106,800 | | 9,157,032 |
| JGC Corp. | | | | | | 202,000 | | 4,301,585 |
| McDermott International, Inc. (a) | | | | | | 277,900 | | 14,325,745 |
| SNC-Lavalin Group, Inc. | | | | | | 96,300 | | 8,020,833 |
| | | | | | | | | 66,511,787 |
| |
| ELECTRIC UTILITIES – 1.4% | | | | | | | | |
| Electric Utilities – 1.4% | | | | | | | | |
| Allegheny Energy, Inc. (a) | | | | | | 169,000 | | 6,043,440 |
| Edison International | | | | | | 88,600 | | 3,930,296 |
| Exelon Corp. | | | | | | 455,500 | | 26,013,605 |
| | | | | | | | | 35,987,341 |
| |
| ELECTRICAL EQUIPMENT – 1.0% | | | | | | | | |
| Electrical Components & Equipment – 0.5% | | | | | | | | |
| Energy Conversion Devices, Inc. (a)(d) | | | | | | 236,600 | | 11,084,710 |
| Evergreen Solar, Inc. (a) | | | | | | 25,400 | | 395,986 |
| Suntech Power Holdings Co. Ltd. sponsored ADR | | | | | | 36,300 | | 1,363,428 |
| | | | | | | | | 12,844,124 |
| Heavy Electrical Equipment – 0.5% | | | | | | | | |
| Vestas Wind Systems AS (a)(d) | | | | | | 611,100 | | 12,813,726 |
| |
| TOTAL ELECTRICAL EQUIPMENT | | | | | | | | 25,657,850 |
| |
| ENERGY EQUIPMENT & SERVICES – 37.3% | | | | | | | | |
| Oil & Gas Drilling – 10.9% | | | | | | | | |
| AKITA Drilling Ltd. Class A (non-vtg.) | | | | | | 623,800 | | 12,628,086 |
| Cathedral Energy Services Income Trust | | | | | | 915,200 | | 8,796,360 |
| Diamond Offshore Drilling, Inc. | | | | | | 687,800 | | 53,228,842 |
| ENSCO International, Inc. | | | | | | 4,900 | | 218,981 |
| GlobalSantaFe Corp. | | | | | | 1,890,300 | | 104,609,202 |
9
See accompanying notes which are an integral part of the financial statements.
9 Annual Report
| Energy Portfolio | | | | |
| Investments - continued | | | | |
| |
| |
| |
| | | Shares | | Value (Note 1) |
| Noble Corp. | | 528,600 | | $ 39,068,826 |
| Patterson-UTI Energy, Inc. | | 10,000 | | 275,500 |
| Pride International, Inc. (a) | | 1,392,716 | | 43,132,415 |
| Rowan Companies, Inc. | | 8,500 | | 342,125 |
| Stoneham Drilling Trust (d) | | 189,600 | | 4,130,265 |
| TODCO Class A | | 9,500 | | 318,440 |
| Transocean, Inc. (a) | | 124,200 | | 9,213,156 |
| Union Drilling, Inc. | | 21,500 | | 269,825 |
| | | | | 276,232,023 |
| Oil & Gas Equipment & Services – 26.4% | | | | |
| Baker Hughes, Inc. | | 1,098,750 | | 74,682,038 |
| BJ Services Co. | | 958,000 | | 29,994,980 |
| Cooper Cameron Corp. (a) | | 7,000 | | 283,500 |
| Core Laboratories NV (a) | | 274,200 | | 12,572,070 |
| Dawson Geophysical Co. (a)(d) | | 343,900 | | 9,171,813 |
| Dril-Quip, Inc. (a) | | 4,200 | | 213,360 |
| FMC Technologies, Inc. (a) | | 73,400 | | 3,443,928 |
| Grant Prideco, Inc. (a) | | 7,100 | | 287,337 |
| Halliburton Co. | | 2,203,400 | | 149,831,196 |
| Hydril Co. (a) | | 107,700 | | 7,252,518 |
| NATCO Group, Inc. Class A (a) | | 218,400 | | 5,411,952 |
| National Oilwell Varco, Inc. (a) | | 1,788,850 | | 108,905,188 |
| NS Group, Inc. (a) | | 7,500 | | 305,925 |
| Oceaneering International, Inc. (a) | | 163,600 | | 9,020,904 |
| Oil States International, Inc. (a) | | 281,900 | | 9,734,007 |
| Petrofac Ltd. | | 1,009,000 | | 5,256,714 |
| RPC, Inc. | | 7,950 | | 168,461 |
| Saipem Spa | | 13,900 | | 294,800 |
| Savanna Energy Services Corp. (a) | | 385,200 | | 8,442,090 |
| Schlumberger Ltd. (NY Shares) | | 1,094,780 | | 125,899,700 |
| Smith International, Inc. | | 1,821,700 | | 70,554,441 |
| Superior Energy Services, Inc. (a) | | 519,200 | | 13,499,200 |
| Technip-Coflexip SA sponsored ADR | | 4,000 | | 241,040 |
| TETRA Technologies, Inc. (a) | | 289,100 | | 10,870,160 |
| Veritas DGC, Inc. (a) | | 360,800 | | 15,200,504 |
| Weatherford International Ltd. (a) | | 30,800 | | 1,328,096 |
| | | | | 672,865,922 |
| |
| TOTAL ENERGY EQUIPMENT & SERVICES | | | | 949,097,945 |
| |
| GAS UTILITIES – 0.3% | | | | |
| Gas Utilities – 0.3% | | | | |
| Questar Corp. | | 4,000 | | 293,000 |
| Xinao Gas Holdings Ltd. | | 8,693,000 | | 7,339,506 |
| | | | | 7,632,506 |
| |
| INDEPENDENT POWER PRODUCERS & ENERGY TRADERS – 3.1% | | | | |
| Independent Power & Energy Trade – 3.1% | | | | |
| AES Corp. (a) | | 1,443,600 | | 24,974,280 |
| Mirant Corp. (a)(d) | | 754,200 | | 18,553,320 |
| NRG Energy, Inc. (a) | | 418,300 | | 18,091,475 |
| TXU Corp. | | 306,000 | | 16,031,340 |
| | | | | 77,650,415 |
See accompanying notes which are an integral part of the financial statements.
Annual Report 10
| Common Stocks – continued | | | | |
| | | Shares | | Value (Note 1) |
| |
| INSURANCE – 0.1% | | | | |
| Property & Casualty Insurance – 0.1% | | | | |
| Navigators Group, Inc. (a) | | 27,700 | | $ 1,299,130 |
| MACHINERY – 2.3% | | | | |
| Construction & Farm Machinery & Heavy Trucks – 2.3% | | | | |
| Bucyrus International, Inc. Class A | | 428,200 | | 26,968,036 |
| Joy Global, Inc. | | 607,700 | | 31,333,012 |
| | | | | 58,301,048 |
| |
| METALS & MINING – 0.1% | | | | |
| Steel – 0.1% | | | | |
| Hitachi Metals Ltd. | | 272,000 | | 2,875,265 |
| OIL, GAS & CONSUMABLE FUELS – 50.4% | | | | |
| Coal & Consumable Fuels – 5.4% | | | | |
| Arch Coal, Inc. | | 258,100 | | 18,869,691 |
| CONSOL Energy, Inc. | | 808,400 | | 51,753,768 |
| International Coal Group, Inc. (a) | | 1,500,900 | | 12,832,695 |
| Peabody Energy Corp. | | 1,117,800 | | 53,956,206 |
| | | | | 137,412,360 |
| Integrated Oil & Gas – 18.1% | | | | |
| Amerada Hess Corp. | | 325,500 | | 45,019,905 |
| BG Group PLC sponsored ADR | | 525,100 | | 30,881,131 |
| BP PLC sponsored ADR | | 2,500 | | 166,050 |
| Chevron Corp. (d) | | 1,088,132 | | 61,457,695 |
| CNX Gas Corp. (a) | | 538,000 | | 11,588,520 |
| ConocoPhillips | | 1,542,072 | | 94,004,709 |
| ENI Spa sponsored ADR | | 2,750 | | 157,493 |
| Exxon Mobil Corp. | | 749,410 | | 44,492,472 |
| Marathon Oil Corp. | | 3,137 | | 221,472 |
| MOL Magyar Olay-es Gazipari RT GDR | | 3,552 | | 365,856 |
| OAO Gazprom sponsored ADR | | 167,000 | | 14,195,000 |
| Occidental Petroleum Corp. | | 594,600 | | 54,429,684 |
| OMV AG | | 426,900 | | 26,488,635 |
| Royal Dutch Shell PLC Class A sponsored ADR | | 1,300 | | 78,624 |
| Total SA sponsored ADR | | 616,700 | | 77,784,371 |
| | | | | 461,331,617 |
| Oil & Gas Exploration & Production – 18.2% | | | | |
| Abraxas Petroleum Corp. (a) | | 405,600 | | 2,307,864 |
| Apache Corp. | | 2,900 | | 194,068 |
| Blackrock Ventures, Inc. (a) | | 516,500 | | 5,427,989 |
| Burlington Resources, Inc. | | 1,600 | | 144,288 |
| Cabot Oil & Gas Corp. | | 116,500 | | 5,272,790 |
| Callon Petroleum Co. (a) | | 154,600 | | 2,733,328 |
| Canadian Natural Resources Ltd. | | 1,573,500 | | 85,990,947 |
| Cano Petroleum, Inc. (a) | | 271,600 | | 2,248,848 |
| |
| |
| | | Shares | | Value (Note 1) |
| Chesapeake Energy Corp. | | 2,120,500 | | $ 62,957,645 |
| Comstock Resources, Inc. (a) | | 8,600 | | 241,660 |
| Devon Energy Corp. | | 6,200 | | 363,506 |
| EnCana Corp. | | 7,476 | | 309,266 |
11
See accompanying notes which are an integral part of the financial statements.
11 Annual Report
| Energy Portfolio | | | | |
| Investments - continued | | | | |
| |
| |
| Energy Partners Ltd. (a) | | 627,700 | | 14,430,823 |
| EOG Resources, Inc. | | 1,800 | | 121,320 |
| EXCO Resources, Inc. | | 50,700 | | 648,960 |
| Forest Oil Corp. (a) | | 363,300 | | 18,037,845 |
| Gastar Exploration Ltd. (a) | | 985,400 | | 4,275,863 |
| Houston Exploration Co. (a) | | 454,900 | | 26,311,416 |
| Kerr-McGee Corp. | | 43,100 | | 4,210,870 |
| Newfield Exploration Co. (a) | | 4,300 | | 166,195 |
| Nexen, Inc. | | 250,600 | | 13,106,238 |
| Parallel Petroleum Corp. (a) | | 124,900 | | 2,124,549 |
| Penn West Energy Trust (d) | | 354,300 | | 12,202,402 |
| Pioneer Natural Resources Co. | | 3,100 | | 130,479 |
| Plains Exploration & Production Co. (a) | | 587,400 | | 23,936,550 |
| Quicksilver Resources, Inc. (a) | | 405,100 | | 14,713,232 |
| Range Resources Corp. | | 1,363,300 | | 32,623,769 |
| Talisman Energy, Inc. | | 520,600 | | 27,359,967 |
| Ultra Petroleum Corp. (a) | | 993,500 | | 51,701,740 |
| UTS Energy Corp. (a) | | 2,791,400 | | 16,362,913 |
| XTO Energy, Inc. | | 834,300 | | 34,948,827 |
| | | | | 465,606,157 |
| Oil & Gas Refining & Marketing – 6.8% | | | | |
| Frontier Oil Corp. | | 338,600 | | 15,660,250 |
| Giant Industries, Inc. (a) | | 125,800 | | 7,321,560 |
| Holly Corp. | | 287,900 | | 17,187,630 |
| Neste Oil Oyj | | 9,950 | | 304,719 |
| Nippon Oil Corp. | | 1,419,600 | | 10,677,360 |
| Polski Koncern Naftowy Orlen SA unit | | 4,000 | | 150,120 |
| Sunoco, Inc. | | 449,100 | | 33,278,310 |
| Tesoro Corp. | | 85,800 | | 5,183,178 |
| Valero Energy Corp. | | 1,500,932 | | 80,735,132 |
| Western Refining, Inc. | | 19,400 | | 315,056 |
| World Fuel Services Corp. | | 75,300 | | 2,281,590 |
| | | | | 173,094,905 |
| Oil & Gas Storage & Transport – 1.9% | | | | |
| El Paso Corp. | | 18,800 | | 245,904 |
| OMI Corp. | | 1,051,500 | | 18,401,250 |
| Overseas Shipholding Group, Inc. | | 213,100 | | 10,776,467 |
| Plains All American Pipeline LP | | 402,600 | | 18,040,506 |
| Teekay Shipping Corp. | | 3,100 | | 120,590 |
| Williams Companies, Inc. | | 8,600 | | 185,502 |
| | | | | 47,770,219 |
| |
| TOTAL OIL, GAS & CONSUMABLE FUELS | | | | 1,285,215,258 |
| |
| TOTAL COMMON STOCKS | | | | |
| (Cost $2,028,675,697) | | | | 2,526,107,292 |
See accompanying notes which are an integral part of the financial statements.
Annual Report 12
| Money Market Funds — 5.2% | | | | | | |
| | | Shares | | | | Value (Note 1) |
| Fidelity Cash Central Fund, 4.57% (b) | | 76,861,920 | | $ | | 76,861,920 |
| Fidelity Securities Lending Cash Central Fund, 4.58% (b)(c) | | 56,277,495 | | | | 56,277,495 |
| TOTAL MONEY MARKET FUNDS | | | | | | |
| (Cost $133,139,415) | | | | | | 133,139,415 |
| TOTAL INVESTMENT PORTFOLIO - 104.4% | | | | | | |
| (Cost $2,161,815,112) | | | | 2,659,246,707 |
| |
| NET OTHER ASSETS – (4.4)% | | | | | | (111,447,515) |
| NET ASSETS – 100% | | | | $2,547,799,192 |
(a) Non-income producing
(b) Affiliated fund that is available only to investment companies and other accounts managed by Fidelity Investments. The rate quoted is the annualized seven-day yield of the fund at period end. A complete unaudited listing of the fund’s holdings as of its most recent quarter end is available upon request.
(c) Investment made with cash collateral received from securities on loan. (d) Security or a portion of the security is on loan at period end.
Information regarding fiscal year to date income earned by the fund from the affiliated Central funds is as follows:
| Fund | | Income earned |
| Fidelity Cash Central Fund | | $ 2,118,569 |
| Fidelity Securities Lending Cash Central Fund | | 397,351 |
| Total | | $ 2,515,920 |
Distribution of investments by country of issue, as a percentage of total net assets, is as follows:
| United States of America | | 69.5% |
| Canada | | 10.2% |
| Cayman Islands | | 5.7% |
| Netherlands Antilles | | 4.9% |
| France | | 3.1% |
| United Kingdom | | 1.4% |
| Austria | | 1.0% |
| Others (individually less than 1%) | | 4.2% |
| | | 100.0% |
See accompanying notes which are an integral part of the financial statements.
|
13 Annual Report
13
| Energy Portfolio | | | | | | |
| |
| Financial Statements | | | | | | |
| |
| |
| Statement of Assets and Liabilities | | | | | | |
| | | | | | | February 28, 2006 |
| |
| Assets | | | | | | |
| Investment in securities, at value (including securities loaned of $53,657,859) — See accompanying schedule: | | | | | | |
| Unaffiliated issuers (cost $2,028,675,697) | | $2,526,107,292 |
| Affiliated Central Funds (cost $133,139,415) | | | | 133,139,415 | | |
| Total Investments (cost $2,161,815,112) | | | | | | $2,659,246,707 |
| Receivable for investments sold | | | | | | 6,408,404 |
| Receivable for fund shares sold | | | | | | 10,627,526 |
| Dividends receivable | | | | | | 3,443,561 |
| Interest receivable | | | | | | 355,751 |
| Prepaid expenses | | | | | | 6,979 |
| Other affiliated receivables | | | | | | 10,193 |
| Other receivables | | | | | | 214,159 |
| Total assets | | | | | | 2,680,313,280 |
| |
| Liabilities | | | | | | |
| Payable for investments purchased | | $ | | 58,389,613 | | |
| Payable for fund shares redeemed | | | | 15,831,973 | | |
| Accrued management fee | | | | 1,249,440 | | |
| Other affiliated payables | | | | 684,728 | | |
| Other payables and accrued expenses | | | | 80,839 | | |
| Collateral on securities loaned, at value | | | | 56,277,495 | | |
| Total liabilities | | | | | | 132,514,088 |
| |
| Net Assets | | | | | | $ 2,547,799,192 |
| Net Assets consist of: | | | | | | |
| Paid in capital | | | | | | $1,891,750,754 |
| Undistributed net investment income | | | | | | 1,501,978 |
| Accumulated undistributed net realized gain (loss) on investments and foreign currency transactions | | | | | | 157,112,801 |
| Net unrealized appreciation (depreciation) on investments and assets and liabilities in foreign currencies | | | | | | 497,433,659 |
| Net Assets, for 51,780,003 shares outstanding | | | | | | $ 2,547,799,192 |
| Net Asset Value, offering price and redemption price per share ($2,547,799,192 ÷ 51,780,003 shares) | | | | | | $ 49.20 |
| |
| Statement of Operations | | | | | | |
| | | | | | | Year ended February 28, 2006 |
| |
| Investment Income | | | | | | |
| Dividends | | | | | | $ 20,044,815 |
| Interest | | | | | | 27,790 |
| Income from affiliated Central Funds (including $397,351 from security lending) | | | | | | 2,515,920 |
| Total income | | | | | | 22,588,525 |
| |
| Expenses | | | | | | |
| Management fee | | $ | | 11,195,847 | | |
| Transfer agent fees | | | | 5,914,610 | | |
| Accounting and security lending fees | | | | | | |
| | | | | 767,564 | | |
| Independent trustees’ compensation | | | | 8,010 | | |
| Custodian fees and expenses | | | | 113,477 | | |
| Registration fees | | | | 327,591 | | |
| Audit | | | | 42,371 | | |
| Legal | | | | 9,472 | | |
| Interest | | | | 53,497 | | |
| Miscellaneous | | | | 11,216 | | |
| Total expenses before reductions | | | | 18,443,655 | | |
| Expense reductions | | | | (1,050,675) | | 17,392,980 |
| |
| Net investment income (loss) | | | | | | 5,195,545 |
See accompanying notes which are an integral part of the financial statements.
Annual Report 14
| Realized and Unrealized Gain (Loss) | | | | |
| Net realized gain (loss) on: | | | | |
| Investment securities: | | | | |
| Unaffiliated issuers | | 241,437,583 | | |
| Foreign currency transactions | | (334,825) | | |
| Total net realized gain (loss) | | | | 241,102,758 |
| Change in net unrealized appreciation (depreciation) on: | | | | |
| Investment securities | | 263,296,170 | | |
| Assets and liabilities in foreign currencies | | (3,296) | | |
| Total change in net unrealized appreciation (depreciation) | | | | 263,292,874 |
| Net gain (loss) | | | | 504,395,632 |
| Net increase (decrease) in net assets resulting from operations | | $ | | 509,591,177 |
See accompanying notes which are an integral part of the financial statements.
|
15 Annual Report
| Energy Portfolio | | | | | | | | | | | | | | | | | | | | |
| Financial Statements - continued | | | | | | | | | | | | | | | | | | | | |
| |
| |
| Statement of Changes in Net Assets | | | | | | | | | | | | | | | | | | | | |
| | | | | | | | | | | | | | | Year ended | | Year ended |
| | | | | | | | | | | | | | | February 28, | | February 28, |
| | | | | | | | | | | | | | | 2006 | | 2005 |
| Increase (Decrease) in Net Assets | | | | | | | | | | | | | | | | | | | | |
| Operations | | | | | | | | | | | | | | | | | | | | |
| Net investment income (loss) | | | | | | | | | | | | $ | | 5,195,545 | | $ | | 3,191,728 |
| Net realized gain (loss) | | | | | | | | | | | | | | 241,102,758 | | | | 53,703,604 |
| Change in net unrealized appreciation (depreciation) | | | | | | | | | | | | | | 263,292,874 | | 182,985,442 |
| Net increase (decrease) in net assets resulting from operations | | | | | | | | | | | | | | 509,591,177 | | 239,880,774 |
| Distributions to shareholders from net investment income | | | | | | | | | | | | | | (4,035,148) | | | | (2,738,124) |
| Distributions to shareholders from net realized gain | | | | | | | | | | | | | | (107,681,031) | | | | (4,765,904) |
| Total distributions | | | | | | | | | | | | | | (111,716,179) | | | | (7,504,028) |
| Share transactions | | | | | | | | | | | | | | | | | | | | |
| Proceeds from sales of shares | | | | | | | | | | | | | | 2,697,973,308 | | 1,019,538,844 |
| Reinvestment of distributions | | | | | | | | | | | | | | 107,368,613 | | | | 7,111,138 |
| Cost of shares redeemed | | | | | | | | | | | | (1,805,743,615) | | (397,323,594) |
| Net increase (decrease) in net assets resulting from share transactions | | | | | | | | | | | | 999,598,306 | | 629,326,388 |
| Redemption fees | | | | | | | | | | | | | | 1,466,118 | | | | 309,685 |
| Total increase (decrease) in net assets | | | | | | | | | | | | | | 1,398,939,422 | | 862,012,819 |
| |
| Net Assets | | | | | | | | | | | | | | | | | | | | |
| Beginning of period | | | | | | | | | | | | | | 1,148,859,770 | | 286,846,951 |
| End of period (including undistributed net investment income of $1,501,978 and undistributed net investment income | | | | | | | | |
| of $843,816, respectively) | | | | | | | | | | | | $ 2,547,799,192 | | $ 1,148,859,770 |
| |
| Other Information | | | | | | | | | | | | | | | | | | | | |
| Shares | | | | | | | | | | | | | | | | | | | | |
| Sold | | | | | | | | | | | | | | 61,223,035 | | | | 31,774,046 |
| Issued in reinvestment of distributions | | | | | | | | | | | | | | 2,375,548 | | | | 226,801 |
| Redeemed | | | | | | | | | | | | | | (41,499,308) | | (13,136,664) |
| Net increase (decrease) | | | | | | | | | | | | | | 22,099,275 | | | | 18,864,183 |
| |
| Financial Highlights | | | | | | | | | | | | | | | | | | | | |
| Years ended February 28, | | | | 2006 | | | | 2005 | | | | 2004E | | | | 2003 | | | | 2002 |
| Selected Per-Share Data | | | | | | | | | | | | | | | | | | | | |
| Net asset value, beginning of period | | $ | | 38.71 | | $ | | 26.52 | | $ | | 20.63 | | $ | | 23.45 | | $ | | 26.41 |
| Income from Investment Operations | | | | | | | | | | | | | | | | | | | | |
| Net investment income (loss)C | | | | 12 | | | | .19 | | | | .13 | | | | .12 | | | | .19 |
| Net realized and unrealized gain (loss) | | | | 12.87 | | | | 12.43 | | | | 5.89 | | | | (2.81) | | | | (2.44) |
| Total from investment operations | | | | 12.99 | | | | 12.62 | | | | 6.02 | | | | (2.69) | | | | (2.25) |
| Distributions from net investment income | | | | (.09) | | | | (.17) | | | | (.14) | | | | (.14) | | | | (.04) |
| Distributions from net realized gain | | | | (2.44) | | | | (.28) | | | | — | | | | — | | | | (.69) |
| Total distributions | | | | (2.53) | | | | (.45) | | | | (.14) | | | | (.14) | | | | (.73) |
| Redemption fees added to paid in capitalC | | | | 03 | | | | .02 | | | | .01 | | | | .01 | | | | .02 |
| Net asset value, end of period | | $ | | 49.20 | | $ | | 38.71 | | $ | | 26.52 | | $ | | 20.63 | | $ | | 23.45 |
| Total ReturnA,B | | | | 34.39% | | | | 48.07% | | | | 29.34% | | | | (11.46)% | | | | (8.57)% |
| Ratios to Average Net AssetsD | | | | | | | | | | | | | | | | | | | | |
| Expenses before reductions | | | | 94% | | | | .97% | | | | 1.18% | | | | 1.22% | | | | 1.16% |
| Expenses net of fee waivers, if any | | | | 94% | | | | .97% | | | | 1.18% | | | | 1.22% | | | | 1.16% |
| Expenses net of all reductions | | | | 89% | | | | .93% | | | | 1.17% | | | | 1.21% | | | | 1.12% |
| Net investment income (loss) | | | | 27% | | | | .62% | | | | .59% | | | | .54% | | | | .77% |
| Supplemental Data | | | | | | | | | | | | | | | | | | | | |
| Net assets, end of period (000 omitted) | | $ 2,547,799 | | $ 1,148,860 | | $ 286,847 | | $ 194,294 | | $ 224,570 |
| Portfolio turnover rate | | | | 128% | | | | 91% | | | | 33% | | | | 73% | | | | 119% |
| |
| | | | | |
A Total returns would have been lower had certain expenses not been reduced during the periods shown. B Total returns do not include the effect of the former sales charges. C Calculated based on average shares outstanding during the period. DExpense ratios reflect operating expenses of the fund. Expenses before reductions do not reflect amounts reimbursed by the investment adviser or reductions from brokerage service arrangements or other expense offset arrangements and do not represent the amount paid by the fund during periods when reimbursements or reductions occur. Expenses net of fee waivers reflect expenses after reimbursement by the investment adviser but prior to reductions from brokerage service arrangements or other expense offset arrangements. Expenses net of all reductions represent the net expenses paid by the fund. EFor the year ended February 29.See accompanying notes which are an integral part of the financial statements.
Annual Report 16
Energy Service Portfolio
Performance
Average annual total return reflects the change in the value of an investment, assuming reinvestment of the fund’s dividend income and capital gains (the profits earned upon the sale of securities that have grown in value) and assuming a constant rate of performance each year. The $10,000 table and the fund’s returns do not reflect the deduction of taxes that a shareholder would pay on fund distributions or the redemption of fund shares. During periods of reimbursement by Fidelity, a fund’s total returns will be greater than it would be had the reimbursement not occurred. How a fund did yesterday is no guarantee of how it will do tomorrow.
| Average Annual Total Returns | | | | | | |
| Periods ended February 28, 2006 | | Past 1 | | Past 5 | | Past 10 |
| | | year | | years | | years |
| Select Energy Service | | 37.60% | | 12.05% | | 17.56% |
$10,000 Over 10 Years
Let’s say hypothetically that $10,000 was invested in Fidelity Select Energy Service Portfolio on February 29, 1996. The chart shows how the value of your investment would have changed, and also shows how the S&P 500 Index performed over the same period.
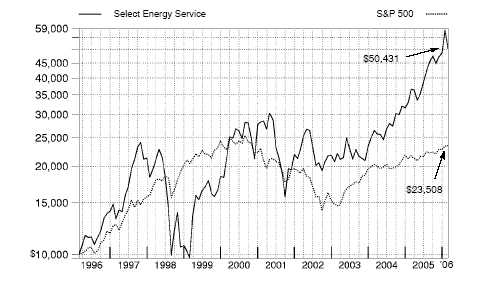
17 Annual Report
Management’s Discussion of Fund Performance
Comments from John Dowd, who became Portfolio Manager of Fidelity® Select Energy Service Portfolio on December 19, 2005
With the exception of several popular large-cap stock performance measures, most major U.S. equity benchmarks had double-digit returns for the year ending February 28, 2006. For much of the period, market gains were driven largely by the energy sector, although utilities ultimately sneaked into the top spot for the year overall. Financials and telecommunication services also reached double figures, outperforming the 8.40% return of the broader market as measured by the large-cap-oriented Standard & Poor’s 500SM Index. The consumer discretionary segment — home to the weak performing automobile and media industries — was the biggest disappointment. Although the overall return for the S&P 500® beat the small-cap Russell 2000® Index in calendar year 2005 — the first time that’s happened in six years — small-caps stormed back in early 2006, leading to a 16.59% advance during the past 12 months, nearly twice the broader market’s gain. Mid-caps soared even higher, returning 17.67% according to the Russell Midcap® Index. The technology-heavy NASDAQ Composite® Index also fared well, climbing 12.13%, but the Dow Jones Industrial AverageSM, an index of 30 large-cap, blue-chip stocks, managed to rise only 4.52% .
For the 12 months ending February 28, 2006, the fund posted a gain of 37.60%, topping the Goldman Sachs® Natural Resources Index, which returned 23.71%, and the S&P 500. Oil and natural gas prices were strong for most of the 12-month period and propelled profitability for energy services stocks. Given the fund’s narrow focus, it was well-positioned in this environment relative to the sector index, with sizable overweightings in strong-performing oil and gas drillers and equipment/services companies, as well as a lack of exposure to lagging integrated oil and gas producers. The fund’s overweighted position in oil field services provider Halliburton added the most value. Also helpful were overweightings in drill pipe maker Grant Prideco and deep-water drilling company Schlumberger, both of which benefited as demand for their products increased and they were able to take advantage of improved pricing. Not owning integrated oil and gas producers Chevron, Exxon Mobil and BP — major components of the index that struggled —was beneficial as well. On the flip side, not holding Canadian integrated energy company Suncor Energy hurt the most relative to the index. A lack of exposure to several strong-performing exploration and production (E&P) names in the Goldman Sachs benchmark — including Burlington Resources and Canadian Natural Resources — also took away from the fund’s relative return. Offshore oil driller ENSCO International, which underperformed, was one of the few stocks we overweighted that hurt.
The views expressed above reflect those of the portfolio manager(s) only through the end of the period as stated on the cover of this report and do not necessarily represent the views of Fidelity or any other person in the Fidelity organization. Any such views are subject to change at any time based upon market or other conditions and Fidelity disclaims any responsibility to update such views. These views may not be relied on as investment advice and, because investment decisions for a Fidelity fund are based on numerous factors, may not be relied on as an indication of trading intent on behalf of any Fidelity fund.
| Energy Service Portfolio | | | | |
| Investment Changes | | |
| |
| |
| Top Ten Stocks as of February 28, 2006 |
| | | % of fund’s | | % of fund’s net assets |
| | | net assets | | 6 months ago |
| GlobalSantaFe Corp. | | 7.3 | | 5.3 |
| National Oilwell Varco, Inc. | | 7.0 | | 8.0 |
| Halliburton Co. | | 7.0 | | 9.8 |
| Noble Corp. | | 6.9 | | 4.0 |
| Diamond Offshore Drilling, Inc. | | 6.8 | | 2.4 |
| BJ Services Co. | | 5.8 | | 4.3 |
| Weatherford International Ltd. | | 4.9 | | 4.3 |
| Baker Hughes, Inc. | | 4.9 | | 5.0 |
| Schlumberger Ltd. (NY Shares) | | 4.9 | | 5.9 |
| ENSCO International, Inc. | | 4.7 | | 0.0 |
| | | 60.2 | | |
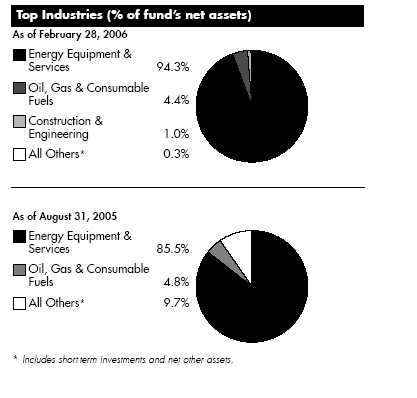
19 Annual Report
| Energy Service Portfolio | | | | | | | | |
| Investments February 28, 2006 | | | | |
| Showing Percentage of Net Assets | | | | | | | | |
| |
| Common Stocks — 99.7% | | | | | | | | |
| | | | | | | Shares | | Value (Note 1) |
| |
| CONSTRUCTION & ENGINEERING – 1.0% | | | | | | | | |
| Construction & Engineering – 1.0% | | | | | | | | |
| McDermott International, Inc. (a) | | | | | | 329,900 | | $ 17,006,345 |
| ENERGY EQUIPMENT & SERVICES – 94.3% | | | | | | | | |
| Oil & Gas Drilling – 39.0% | | | | | | | | |
| Atwood Oceanics, Inc. (a) | | | | | | 79,900 | | 7,205,382 |
| Diamond Offshore Drilling, Inc. (d) | | | | | | 1,520,900 | | 117,702,451 |
| ENSCO International, Inc. | | | | | | 1,823,200 | | 81,478,808 |
| GlobalSantaFe Corp. | | | | | | 2,284,510 | | 126,424,783 |
| Grey Wolf, Inc. (a) | | | | | | 112,800 | | 782,832 |
| Helmerich & Payne, Inc. | | | | | | 3,700 | | 243,349 |
| Hercules Offshore, Inc. | | | | | | 190,600 | | 5,794,240 |
| Nabors Industries Ltd. (a) | | | | | | 533,777 | | 35,202,593 |
| Noble Corp. | | | | | | 1,623,350 | | 119,981,799 |
| Patterson-UTI Energy, Inc. | | | | | | 381,200 | | 10,502,060 |
| Pride International, Inc. (a) | | | | | | 1,702,986 | | 52,741,476 |
| Rowan Companies, Inc. | | | | | | 924,600 | | 37,215,150 |
| TODCO Class A | | | | | | 324,900 | | 10,890,648 |
| Transocean, Inc. (a) | | | | | | 922,227 | | 68,410,799 |
| Trinidad Energy Services Income Trust | | | | | | 172,300 | | 2,464,353 |
| | | | | | | | | 677,040,723 |
| Oil & Gas Equipment & Services – 55.3% | | | | | | | | |
| Allis-Chalmers Energy, Inc. | | | | | | 84,800 | | 1,390,720 |
| Baker Hughes, Inc. | | | | | | 1,250,836 | | 85,019,323 |
| Basic Energy Services, Inc. | | | | | | 313,400 | | 7,230,138 |
| BJ Services Co. | | | | | | 3,209,874 | | 100,501,155 |
| Cal Dive International, Inc. (a) | | | | | | 756,600 | | 26,639,886 |
| Carbo Ceramics, Inc. | | | | | | 30,100 | | 1,647,975 |
| Cooper Cameron Corp. (a) | | | | | | 210,500 | | 8,525,250 |
| Core Laboratories NV (a) | | | | | | 248,000 | | 11,370,800 |
| Dresser-Rand Group, Inc. | | | | | | 150,700 | | 3,811,203 |
| Dril-Quip, Inc. (a) | | | | | | 179,800 | | 9,133,840 |
| FMC Technologies, Inc. (a) | | | | | | 139,200 | | 6,531,264 |
| Grant Prideco, Inc. (a) | | | | | | 1,797,205 | | 72,732,886 |
| Halliburton Co. | | | | | | 1,772,867 | | 120,554,956 |
| Hornbeck Offshore Services, Inc. (a) | | | | | | 436,200 | | 14,028,192 |
| Hydril Co. (a) | | | | | | 121,400 | | 8,175,076 |
| Key Energy Services, Inc. (a) | | | | | | 1,200 | | 17,940 |
| Lone Star Technologies, Inc. (a) | | | | | | 280,800 | | 13,955,760 |
| Maverick Tube Corp. (a) | | | | | | 208,600 | | 9,706,158 |
| National Oilwell Varco, Inc. (a) | | | | | | 2,007,931 | | 122,242,839 |
| NS Group, Inc. (a) | | | | | | 98,000 | | 3,997,420 |
| Oceaneering International, Inc. (a) | | | | | | 267,600 | | 14,755,464 |
| Oil States International, Inc. (a) | | | | | | 597,900 | | 20,645,487 |
| Pason Systems, Inc. | | | | | | 150,200 | | 4,270,088 |
| RPC, Inc. | | | | | | 796,450 | | 16,876,776 |
| Savanna Energy Services Corp. (a) | | | | | | 309,500 | | 6,783,039 |
| Schlumberger Ltd. (NY Shares) | | | | | | 738,245 | | 84,898,175 |
| Smith International, Inc. | | | | | | 1,251,256 | | 48,461,145 |
| Superior Energy Services, Inc. (a) | | | | | | 795,900 | | 20,693,400 |
| TETRA Technologies, Inc. (a) | | | | | | 106,900 | | 4,019,440 |
See accompanying notes which are an integral part of the financial statements.
Annual Report 20
| | | Shares | | Value (Note 1) |
| Tidewater, Inc. | | 53,600 | | $ 2,800,600 |
| Trico Marine Services, Inc. (a) | | 27,600 | | 803,988 |
| Veritas DGC, Inc. (a) | | 444,900 | | 18,743,637 |
| W-H Energy Services, Inc. (a) | | 68,500 | | 2,705,750 |
| Weatherford International Ltd. (a) | | 1,971,910 | | 85,028,759 |
| | | | | 958,698,529 |
| |
| TOTAL ENERGY EQUIPMENT & SERVICES | | | | 1,635,739,252 |
| |
| OIL, GAS & CONSUMABLE FUELS – 4.4% | | | | |
| Coal & Consumable Fuels – 0.6% | | | | |
| Arch Coal, Inc. | | 60,700 | | 4,437,777 |
| Peabody Energy Corp. | | 115,700 | | 5,584,839 |
| | | | | 10,022,616 |
| Oil & Gas Exploration & Production – 3.1% | | | | |
| Forest Oil Corp. (a) | | 293,100 | | 14,552,415 |
| Quicksilver Resources, Inc. (a) | | 345,500 | | 12,548,560 |
| Range Resources Corp. | | 540,450 | | 12,932,969 |
| Ultra Petroleum Corp. (a) | | 237,600 | | 12,364,704 |
| XTO Energy, Inc. | | 37,300 | | 1,562,497 |
| | | | | 53,961,145 |
| Oil & Gas Refining & Marketing – 0.7% | | | | |
| Valero Energy Corp. | | 227,000 | | 12,210,330 |
| |
| TOTAL OIL, GAS & CONSUMABLE FUELS | | | | 76,194,091 |
| |
| TOTAL COMMON STOCKS | | | | |
| (Cost $1,220,752,469) | | 1,728,939,688 |
| |
| Money Market Funds — 1.7% | | | | |
| |
| Fidelity Cash Central Fund, 4.57% (b) | | 11,216,869 | | 11,216,869 |
| Fidelity Securities Lending Cash Central Fund, 4.58% (b)(c) | | 18,251,250 | | 18,251,250 |
| TOTAL MONEY MARKET FUNDS | | | | |
| (Cost $29,468,119) | | | | 29,468,119 |
| |
| TOTAL INVESTMENT PORTFOLIO - 101.4% | | | | |
| (Cost $1,250,220,588) | | 1,758,407,807 |
| |
| NET OTHER ASSETS – (1.4)% | | | | (24,331,732) |
| NET ASSETS – 100% | | $ 1,734,076,075 |
(a) Non-income producing
(b) Affiliated fund that is available only to investment companies and other accounts managed by Fidelity Investments. The rate quoted is the annualized seven-day yield of the fund at period end. A complete unaudited listing of the fund’s holdings as of its most recent quarter end is available upon request.
(c) Investment made with cash collateral received from securities on loan. (d) Security or a portion of the security is on loan at period end.
Information regarding fiscal year to date income earned by the fund from the affiliated Central funds is as follows:
See accompanying notes which are an integral part of the financial statements.
|
21 Annual Report
21
| Energy Service Portfolio | | |
| Investments - continued | | |
| |
| |
| Fund | | Income earned |
| Fidelity Cash Central Fund | | $ 1,631,278 |
| Fidelity Securities Lending Cash Central Fund | | 141,498 |
| Total | | $ 1,772,776 |
| |
| Other Information | | |
| Distribution of investments by country of issue, as a percentage of total net assets, is as follows: | | |
| |
| United States of America | | 77.8% |
| Cayman Islands | | 14.2% |
| Netherlands Antilles | | 4.9% |
| Canada | | 1.4% |
| Panama | | 1.0% |
| Others (individually less than 1%) | | 0.7% |
| | | 100.0% |
See accompanying notes which are an integral part of the financial statements.
Annual Report 22
| Energy Service Portfolio | | | | | | | | |
| |
| Financial Statements | | | | | | | | |
| |
| |
| Statement of Assets and Liabilities | | | | | | | | |
| | | | | | | | | February 28, 2006 |
| |
| Assets | | | | | | | | |
| Investment in securities, at value (including securities loaned of $18,225,345) — See accompanying schedule: | | | | | | | | |
| Unaffiliated issuers (cost $1,220,752,469) | | $1,728,939,688 | | | | |
| Affiliated Central Funds (cost $29,468,119) | | | | 29,468,119 | | | | |
| Total Investments (cost $1,250,220,588) | | | | | | $1,758,407,807 |
| Receivable for investments sold | | | | | | | | 30,400,967 |
| Receivable for fund shares sold | | | | | | | | 5,969,740 |
| Dividends receivable | | | | | | | | 2,380,305 |
| Interest receivable | | | | | | | | 145,973 |
| Prepaid expenses | | | | | | | | 4,168 |
| Other affiliated receivables | | | | | | | | 24,946 |
| Other receivables | | | | | | | | 79,773 |
| Total assets | | | | | | | | 1,797,413,679 |
| |
| Liabilities | | | | | | | | |
| Payable for investments purchased | | $ | | 20,100,013 | | | | |
| Payable for fund shares redeemed | | | | 23,575,127 | | | | |
| Accrued management fee | | | | 897,255 | | | | |
| Other affiliated payables | | | | 474,722 | | | | |
| Other payables and accrued expenses | | | | 39,237 | | | | |
| Collateral on securities loaned, at value | | | | 18,251,250 | | | | |
| Total liabilities | | | | | | | | 63,337,604 |
| |
| Net Assets | | | | | | $ 1,734,076,075 |
| Net Assets consist of: | | | | | | | | |
| Paid in capital | | | | | | $1,198,239,522 |
| Accumulated net investment loss | | | | | | | | (957) |
| Accumulated undistributed net realized gain (loss) on investments and foreign currency transactions | | | | | | | | 27,650,146 |
| Net unrealized appreciation (depreciation) on investments and assets and liabilities in foreign currencies | | | | | | | | 508,187,364 |
| Net Assets, for 25,490,993 shares outstanding | | | | | | $ 1,734,076,075 |
| |
| Net Asset Value, offering price and redemption price per share ($1,734,076,075 ÷ 25,490,993 shares) | | | | | | $ | | 68.03 |
| |
| Statement of Operations | | | | | | | | |
| | | | | | | | | Year ended February 28, 2006 |
| |
| Investment Income | | | | | | | | |
| Dividends | | | | | | $ | | 5,288,326 |
| Special dividends | | | | | | | | 1,662,300 |
| Interest | | | | | | | | 4,015 |
| Income from affiliated Central Funds (including $141,498 from security lending) | | | | | | | | 1,772,776 |
| Total income | | | | | | | | 8,727,417 |
| |
| Expenses | | | | | | | | |
| Management fee | | $ | | 7,092,316 | | | | |
| Transfer agent fees | | | | 3,620,377 | | | | |
| Accounting and security lending fees | | | | | | | | |
| | | | | 516,466 | | | | |
| Independent trustees’ compensation | | | | 5,187 | | | | |
| Custodian fees and expenses | | | | 32,650 | | | | |
| Registration fees | | | | 199,707 | | | | |
| Audit | | | | 39,216 | | | | |
| Legal | | | | 5,899 | | | | |
| Interest | | | | 46,205 | | | | |
| Miscellaneous | | | | 8,081 | | | | |
| Total expenses before reductions | | | | 11,566,104 | | | | |
| Expense reductions | | | | (281,183) | | | | 11,284,921 |
| |
| Net investment income (loss) | | | | | | | | (2,557,504) |
| |
| See accompanying notes which are an integral part of the financial statements. | | | | | | | | |
23 Annual Report
| Energy Service Portfolio | | | | |
| Financial Statements - continued | | | | |
| |
| |
| Realized and Unrealized Gain (Loss) | | | | |
| Net realized gain (loss) on: | | | | |
| Investment securities: | | | | |
| Unaffiliated issuers | | 59,964,264 | | |
| Foreign currency transactions | | (14,500) | | |
| Total net realized gain (loss) | | | | 59,949,764 |
| Change in net unrealized appreciation (depreciation) on: | | | | |
| Investment securities | | 254,167,322 | | |
| Assets and liabilities in foreign currencies | | 145 | | |
| Total change in net unrealized appreciation (depreciation) | | | | 254,167,467 |
| Net gain (loss) | | | | 314,117,231 |
| Net increase (decrease) in net assets resulting from operations | | $ | | 311,559,727 |
See accompanying notes which are an integral part of the financial statements.
Annual Report 24
| Statement of Changes in Net Assets | | | | | | | | | | | | | | | | | | |
| | | | | | | | | Year ended | | | | Year ended |
| | | | | | | | | February 28, | | | | February 28, |
| | | | | | | | | 2006 | | | | 2005 |
| Increase (Decrease) in Net Assets | | | | | | | | | | | | | | | | | | |
| Operations | | | | | | | | | | | | | | | | | | |
| Net investment income (loss) | | | | | | | | $ | | (2,557,504) | | $ | | (2,750,594) |
| Net realized gain (loss) | | | | | | | | 59,949,764 | | | | 26,489,827 |
| Change in net unrealized appreciation (depreciation) | | | | | | | | 254,167,467 | | | | 166,091,313 |
| Net increase (decrease) in net assets resulting from operations | | | | | | | | 311,559,727 | | | | 189,830,546 |
| Share transactions | | | | | | | | | | | | | | | | | | |
| Proceeds from sales of shares | | | | | | | | 1,674,189,408 | | | | 690,238,874 |
| Cost of shares redeemed | | | | | | | | (1,149,311,141) | | | | (447,731,275) |
| Net increase (decrease) in net assets resulting from share transactions | | | | | | | | 524,878,267 | | | | 242,507,599 |
| Redemption fees | | | | | | | | | | 1,385,968 | | | | | | 530,463 |
| Total increase (decrease) in net assets | | | | | | | | 837,823,962 | | | | 432,868,608 |
| |
| Net Assets | | | | | | | | | | | | | | | | | | |
| Beginning of period | | | | | | | | 896,252,113 | | | | 463,383,505 |
| End of period (including accumulated net investment loss of $957 and accumulated net investment loss of $981, | | | | | | | | | | | | |
| respectively) | | | | | | | | $ 1,734,076,075 | | $ | | 896,252,113 |
| |
| Other Information | | | | | | | | | | | | | | | | | | |
| Shares | | | | | | | | | | | | | | | | | | |
| Sold | | | | | | | | 27,015,130 | | | | 16,952,149 |
| Redeemed | | | | | | | | (19,650,559) | | | | (11,822,799) |
| Net increase (decrease) | | | | | | | | | | 7,364,571 | | | | | | 5,129,350 |
| |
| Financial Highlights | | | | | | | | | | | | | | | | | | |
| Years ended February 28, | | | | 2006 | | 2005 | | 2004G | | | | 2003 | | | | 2002 |
| Selected Per-Share Data | | | | | | | | | | | | | | | | | | |
| Net asset value, beginning of period | | $ | | 49.44 | | $ 35.65 | | $ 29.73 | | $ | | 30.75 | | $ | | 38.51 |
| Income from Investment Operations | | | | | | | | | | | | | | | | | | |
| Net investment income (loss)C | | | | (.12)D | | (.20) | | (.24) | | | | (.21)E | | | | (.14) |
| Net realized and unrealized gain (loss) | | | | 18.64 | | 13.95 | | 6.14 | | | | (.85) | | | | (7.71) |
| Total from investment operations | | | | 18.52 | | 13.75 | | 5.90 | | | | (1.06) | | | | (7.85) |
| Redemption fees added to paid in capitalC | | | | 07 | | .04 | | .02 | | | | .04 | | | | .09 |
| Net asset value, end of period | | $ | | 68.03 | | $ 49.44 | | $ 35.65 | | $ | | 29.73 | | $ | | 30.75 |
| Total ReturnA,B | | | | 37.60% | | 38.68% | | 19.91% | | | | (3.32)% | | | | (20.15)% |
| Ratios to Average Net AssetsF | | | | | | | | | | | | | | | | | | |
| Expenses before reductions | | | | 94% | | .98% | | 1.14% | | | | 1.15% | | | | 1.13% |
| Expenses net of fee waivers, if any | | | | 94% | | .98% | | 1.14% | | | | 1.15% | | | | 1.13% |
| Expenses net of all reductions | | | | 91% | | .96% | | 1.13% | | | | 1.12% | | | | 1.07% |
| Net investment income (loss) | | | | (.21)%D | | (.53)% | | (.79)% | | | | (.68)% | | | | (.46)% |
| Supplemental Data | | | | | | | | | | | | | | | | | | |
| Net assets, end of period (000 omitted) | | $ 1,734,076 | | $ 896,252 | | $ 463,384 | | $ 455,122 | | $ 526,138 |
| Portfolio turnover rate | | | | 58% | | 34% | | 23% | | | | 64% | | | | 90% |
ATotal returns would have been lower had certain expenses not been reduced during the periods shown. BTotal returns do not include the effect of the former sales charges. CCalculated based on average shares outstanding during the period. DInvestment income per share reflects a special dividend which amounted to $.08 per share. Excluding the special dividend, the ratio of net investment income (loss) to average net assets would have been (.34)%. EInvestment income per share reflects a special dividend which amounted to $.01 per share. FExpense ratios reflect operating expenses of the fund. Expenses before reductions do not reflect amounts reimbursed by the investment adviser or reductions from brokerage service arrangements or other expense offset arrangements and do not represent the amount paid by the fund during periods when reimbursements or reductions occur. Expenses net of fee waivers reflect expenses after reimbursement by the investment adviser but prior to reductions from brokerage service arrangements or other expense offset arrangements. Expenses net of all reductions represent the net expenses paid by the fund. GFor the year ended February 29.
See accompanying notes which are an integral part of the financial statements.
|
Gold Portfolio
Performance
Average annual total return reflects the change in the value of an investment, assuming reinvestment of the fund’s dividend income and capital gains (the profits earned upon the sale of securities that have grown in value) and assuming a constant rate of performance each year. The $10,000 table and the fund’s returns do not reflect the deduction of taxes that a shareholder would pay on fund distributions or the redemption of fund shares. During periods of reimbursement by Fidelity, a fund’s total returns will be greater than it would be had the reimbursement not occurred. How a fund did yesterday is no guarantee of how it will do tomorrow.
| Average Annual Total Returns | | | | | | |
| Periods ended February 28, 2006 | | Past 1 | | Past 5 | | Past 10 |
| | | year | | years | | years |
| Select Gold | | 48.84% | | 29.30% | | 5.99% |
$10,000 Over 10 Years
Let’s say hypothetically that $10,000 was invested in Fidelity Select Gold Portfolio on February 29, 1996. The chart shows how the value of your investment would have changed, and also shows how the S&P 500 Index performed over the same period.
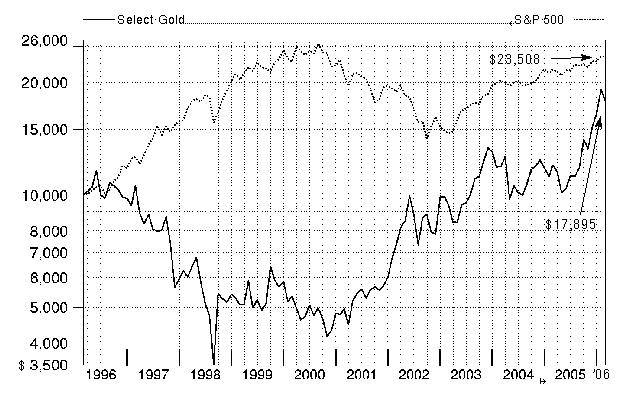
Annual Report 26
Management’s Discussion of Fund Performance
Comments from Daniel Dupont, Portfolio Manager of Fidelity® Select Gold Portfolio
With the exception of several popular large-cap stock performance measures, most major U.S. equity benchmarks had double-digit returns for the year ending February 28, 2006. For much of the period, market gains were driven largely by the energy sector, although utilities ultimately sneaked into the top spot for the year overall. Financials and telecommunication services also reached double figures, outperforming the 8.40% return of the broader market as measured by the large-cap-oriented Standard & Poor’s 500SM Index. The consumer discretionary segment — home to the weak performing automobile and media industries — was the biggest disappointment. Although the overall return for the S&P 500® beat the small-cap Russell 2000® Index in calendar year 2005 — the first time that’s happened in six years — small-caps stormed back in early 2006, leading to a 16.59% advance during the past 12 months, nearly twice the broader market’s gain. Mid-caps soared even higher, returning 17.67% according to the Russell Midcap® Index. The technology-heavy NASDAQ Composite® Index also fared well, climbing 12.13%, but the Dow Jones Industrial AverageSM, an index of 30 large-cap, blue-chip stocks, managed to rise only 4.52% .
During the past year, the fund returned 48.84%, powering past both the S&P 500 and the 23.71% return of the energy-sensitive Goldman Sachs® Natural Resources Index. Versus the sector index, the fund benefited most from solid stock picking in the gold mining group. An overweighting in that group also was beneficial, as were a lack of exposure to the integrated oil and gas segment and stock selection in precious metals and minerals. Our overall results were further boosted by extensive investments in Canada, whose currency appreciated versus the U.S. dollar. Goldcorp was the fund’s top contributor compared with the sector index. The company acquired some assets that the market felt would materially benefit the company. Also helping performance was Placer Dome, which received a lucrative buyout offer from Barrick Gold. The shares of Harmony Gold Mining, a low-quality, high-cost South African mine, had a positive impact as well. Other notable contributors included Eldorado Gold and Aquarius Platinum. I sold Eldorado by period end to lock in profits. Conversely, the fund’s gains were curbed by not investing in several strong performing energy stocks in the index, such as Schlumberger. Minefinders, a mining development company based in Mexico, was hampered by various delays. Also holding back our results was Newmont Mining — the fund’s second largest holding at period end — which reported disappointing fourth-quarter earnings.
The views expressed above reflect those of the portfolio manager(s) only through the end of the period as stated on the cover of this report and do not necessarily represent the views of Fidelity or any other person in the Fidelity organization. Any such views are subject to change at any time based upon market or other conditions and Fidelity disclaims any responsibility to update such views. These views may not be relied on as investment advice and, because investment decisions for a Fidelity fund are based on numerous factors, may not be relied on as an indication of trading intent on behalf of any Fidelity fund.
27 27 Annual Report
Gold Portfolio
Investment Changes
| Top Ten Stocks as of February 28, 2006 |
| | | % of fund’s | | % of fund’s net assets |
| | | net assets | | 6 months ago |
| Meridian Gold, Inc. | | 9.5 | | 0.0 |
| Newmont Mining Corp. | | 8.4 | | 5.2 |
| Aber Diamond Corp. | | 7.7 | | 1.5 |
| Newcrest Mining Ltd. | | 6.9 | | 1.7 |
| Barrick Gold Corp. | | 6.1 | | 4.5 |
| Cambior, Inc. | | 4.9 | | 1.5 |
| Compania de Minas | | | | |
| Buenaventura SA | | 4.0 | | 3.6 |
| Impala Platinum Holdings Ltd. | | 3.9 | | 3.9 |
| Teck Cominco Ltd. Class B | | | | |
| (sub. vtg.) | | 3.3 | | 2.8 |
| Crystallex International Corp. | | 3.2 | | 0.0 |
| | | 57.9 | | |
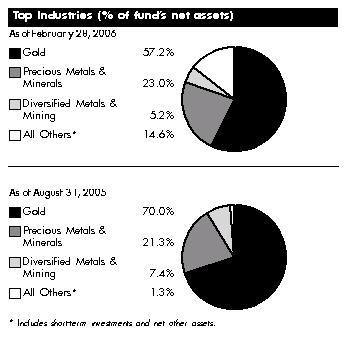
| Gold Portfolio | | | | | | |
| Investments February 28, 2006 | | | | |
| Showing Percentage of Net Assets | | | | | | |
| |
| Common Stocks — 85.4% | | | | | | |
| | | | | Shares | | Value (Note 1) |
| Australia – 6.9% | | | | | | |
| METALS & MINING – 6.9% | | | | | | |
| Gold – 6.9% | | | | | | |
| Newcrest Mining Ltd. | | | | 5,800,271 | | $ 91,295,917 |
| Bermuda – 2.8% | | | | | | |
| METALS & MINING – 2.8% | | | | | | |
| Precious Metals & Minerals – 2.8% | | | | | | |
| Aquarius Platinum Ltd.: | | | | | | |
| (Australia) | | | | 3,042,877 | | 34,881,801 |
| (United Kingdom) | | | | 221,030 | | 2,520,179 |
| | | | | | | 37,401,980 |
| Canada – 49.2% | | | | | | |
| METALS & MINING – 49.2% | | | | | | |
| Diversified Metals & Mining – 3.6% | | | | | | |
| IMA Exploration, Inc. (a) | | | | 999,600 | | 3,431,272 |
| Teck Cominco Ltd. Class B (sub. vtg.) | | | | 700,000 | | 43,775,030 |
| | | | | | | 47,206,302 |
| Gold – 35.3% | | | | | | |
| Arizona Star Resource Corp. (a) | | | | 1,834,300 | | 15,418,356 |
| Barrick Gold Corp. | | | | 2,948,730 | | 80,586,249 |
| Bema Gold Corp. (a) | | | | 4,600,000 | | 19,029,177 |
| Bolivar Gold Corp. (a)(e) | | | | 11,050,000 | | 31,025,393 |
| Cambior, Inc. (a)(e) | | | | 22,000,000 | | 65,449,104 |
| Chesapeake Gold Corp. (a)(f) | | | | 140,000 | | 730,713 |
| Crystallex International Corp. (a)(d)(e) | | | | 15,000,000 | | 42,908,067 |
| Gabriel Resources Ltd. (a) | | | | 1,370,000 | | 3,352,198 |
| Gabriel Resources Ltd. (a)(f) | | | | 1,130,000 | | 2,764,952 |
| Gabriel Resources Ltd. warrants 3/31/07 (a) | | | | 83,350 | | 75,563 |
| Goldcorp, Inc. | | | | 96,100 | | 2,448,704 |
| Goldcorp, Inc. Class C warrants 5/30/07 (a) | | | | 2,820,000 | | 14,098,138 |
| High River Gold Mines Ltd. warrants 10/26/06 (a) | | | | 1,832,500 | | 16 |
| IAMGOLD Corp. | | | | 500,000 | | 4,449,236 |
| Kinross Gold Corp. (a)(f) | | | | 866,666 | | 8,001,872 |
| Kinross Gold Corp. (a) | | | | 3,133,334 | | 28,929,872 |
| Meridian Gold, Inc. (a) | | | | 5,000,000 | | 126,303,743 |
| Orezone Resources, Inc. Class A (a)(e) | | | | 7,000,000 | | 14,417,110 |
| Richmont Mines, Inc. (a) | | | | 300,000 | | 1,072,042 |
| Sasamat Capital Corp. (a) | | | | 31,500 | | 72,450 |
| Virginia Gold Mines, Inc. (a) | | | | 575,900 | | 6,518,571 |
| | | | | | | 467,651,526 |
| Precious Metals & Minerals – 10.3% | | | | | | |
| Aber Diamond Corp. | | | | 2,699,990 | | 101,949,189 |
| Intrepid Minerals Corp. (a) | | | | 499,700 | | 466,208 |
| Minefinders Corp. Ltd. (a)(e) | | | | 3,660,000 | | 29,636,932 |
See accompanying notes which are an integral part of the financial statements.
|
29 Annual Report
29
| Gold Portfolio | | | | |
| Investments - continued | | | | |
| |
| |
| |
| | | Shares | | Value (Note 1) |
| Shore Gold, Inc. (a) | | 387,300 | | $ 2,423,714 |
| SouthernEra Diamonds, Inc. Class A (a) | | 6,094,500 | | 2,682,084 |
| | | | | 137,158,127 |
| |
| TOTAL METALS & MINING | | | | 652,015,955 |
| |
| Cayman Islands – 1.0% | | | | |
| METALS & MINING – 1.0% | | | | |
| Precious Metals & Minerals – 1.0% | | | | |
| Apex Silver Mines Ltd. (a)(d) | | 600,000 | | 13,866,000 |
| Papua New Guinea – 1.7% | | | | |
| METALS & MINING – 1.7% | | | | |
| Gold – 1.7% | | | | |
| Lihir Gold Ltd. (a) | | 14,000,020 | | 22,139,891 |
| Peru – 4.0% | | | | |
| METALS & MINING – 4.0% | | | | |
| Precious Metals & Minerals – 4.0% | | | | |
| Compania de Minas Buenaventura SA | | 400,000 | | 10,500,759 |
| Compania de Minas Buenaventura SA sponsored ADR | | 1,600,000 | | 41,952,000 |
| | | | | 52,452,759 |
| South Africa – 8.4% | | | | |
| METALS & MINING – 8.4% | | | | |
| Diversified Metals & Mining – 0.5% | | | | |
| African Rainbow Minerals Ltd. (a) | | 1,000,000 | | 6,968,641 |
| Gold – 4.0% | | | | |
| Gold Fields Ltd. sponsored ADR | | 1,000,000 | | 22,230,000 |
| Harmony Gold Mining Co. Ltd. (a) | | 2,111,990 | | 29,546,742 |
| Harmony Gold Mining Co. Ltd. sponsored ADR (a) | | 88,010 | | 1,231,260 |
| | | | | 53,008,002 |
| Precious Metals & Minerals – 3.9% | | | | |
| Impala Platinum Holdings Ltd. | | 300,000 | | 51,049,348 |
| Northam Platinum Ltd. | | 22 | | 90 |
| | | | | 51,049,438 |
| |
| TOTAL METALS & MINING | | | | 111,026,081 |
| |
| United Kingdom – 2.2% | | | | |
| METALS & MINING – 2.2% | | | | |
| Diversified Metals & Mining – 0.7% | | | | |
| African Platinum PLC (a) | | 17,900,000 | | 9,969,273 |
| Gold – 0.6% | | | | |
| Randgold Resources Ltd. | | | | |
| sponsored ADR (a) | | 440,000 | | 7,524,000 |
| Precious Metals & Minerals – 0.9% | | | | |
| Lonmin PLC | | 303,422 | | 12,082,023 |
| TOTAL METALS & MINING | | | | 29,575,296 |
See accompanying notes which are an integral part of the financial statements.
Annual Report 30
| Common Stocks – continued | | | | |
| | | Shares | | Value (Note 1) |
| United States of America – 9.2% | | | | |
| METALS & MINING – 9.2% | | | | |
| Diversified Metals & Mining – 0.4% | | | | |
| Freeport-McMoRan Copper & Gold, Inc. Class B | | 100,000 | | $ 5,063,000 |
| Gold – 8.7% | | | | |
| Newmont Mining Corp. | | 2,100,000 | | 111,132,000 |
| US Gold Corp. (subscription receipt)(a)(g) | | 728,400 | | 4,412,364 |
| | | | | 115,544,364 |
| Precious Metals & Minerals – 0.1% | | | | |
| Stillwater Mining Co. (a) | | 100,000 | | 1,301,000 |
| TOTAL METALS & MINING | | | | 121,908,364 |
| |
| TOTAL COMMON STOCKS | | | | |
| (Cost $922,898,653) | | | | 1,131,682,243 |
| Money Market Funds — 15.8% | | | | |
| Fidelity Cash Central Fund, 4.57% (b) | | 201,956,066 | | 201,956,066 |
| Fidelity Securities Lending Cash Central Fund, 4.58% (b)(c) | | 7,979,400 | | 7,979,400 |
| TOTAL MONEY MARKET FUNDS | | | | |
| (Cost $209,935,466) | | | | 209,935,466 |
| TOTAL INVESTMENT PORTFOLIO - 101.2% | | | | |
| (Cost $1,132,834,119) | | 1,341,617,709 |
| |
| NET OTHER ASSETS – (1.2)% | | | | (15,952,225) |
| NET ASSETS – 100% | | $1,325,665,484 |
(a) Non-income producing
(b) Affiliated fund that is available only to investment companies and other accounts managed by Fidelity Investments. The rate quoted is the annualized seven-day yield of the fund at period end. A complete unaudited listing of the fund’s holdings as of its most recent quarter end is available upon request.
(c) Investment made with cash collateral received from securities on loan. (d) Security or a portion of the security is on loan at period end.
(e) Affiliated company
(f) Security exempt from registration under Rule 144A of the Securities Act of 1933. These securities may be resold in transactions exempt from registration, normally to qualified institutional buyers. At the period end, the value of these securities amounted to $11,497,537 or 0.9% of net assets.
(g) Restricted securities – Investment in securities not registered under the Securities Act of 1933 (excluding 144A issues). At the end of the period, the value of restricted securities (excluding 144A issues) amounted to $4,412,364 or 0.3% of net assets.
| Additional information on each holding is as follows: | | | | |
| |
| Security | | Acquisition Date | | Acquisition Cost |
| US Gold Corp. (subscription receipt) | | 2/8/06 | | $ 3,277,800 |
See accompanying notes which are an integral part of the financial statements.
|
31 Annual Report
31
| Gold Portfolio | | |
| Investments - continued | | |
| |
| |
| Affiliated Central Funds | | |
| Information regarding fiscal year to date income earned by the fund from the affiliated Central funds is as follows: | | |
| |
| Fund | | Income earned |
| Fidelity Cash Central Fund | | $ 2,584,466 |
| Fidelity Securities Lending Cash Central Fund | | 415,140 |
| Total | | $ 2,999,606 |
An affiliated company is a company in which the fund has ownership of at least 5% of the voting securities. Fiscal year to date transactions with companies which are or were affiliates are as follows:
| | | Value, | | | | | | | | �� | | | | | | Value, |
| | | beginning of | | | | | | Sales | | Dividend | | | | end of |
| Affiliate | | period | | | | Purchases | | Proceeds | | Income | | | | period |
| Alamos Gold, Inc. | | $ 9,732,228 | | $ | | 5,044,772 | | $ 27,435,912 | | $ | | — | | $ | | — |
| Bolivar Gold Corp. | | — | | | | 22,778,797 | | — | | | | — | | | | 31,025,393 |
| Cambior, Inc. | | — | | | | 54,898,506 | | — | | | | — | | | | 65,449,104 |
| Crystallex International Corp. | | 2,018,728 | | | | 29,850,118 | | 4,751,282 | | | | — | | | | 42,908,067 |
| Eldorado Gold Corp. | | 49,908,792 | | | | 2,344,241 | | 80,229,419 | | | | — | | | | — |
| Gabriel Resources Ltd | | 16,344,975 | | | | 1,694,783 | | 24,930,105 | | | | — | | | | — |
| Gabriel Resources Ltd. (144A) | | 1,740,646 | | | | — | | — | | | | — | | | | — |
| Guinor Gold Corp. | | 5,958,896 | | | | 2,763,944 | | 11,823,969 | | | | — | | | | — |
| High River Gold Mines Ltd. | | 9,307,228 | | | | 6,286,623 | | 17,273,380 | | | | — | | | | — |
| High River Gold Mines Ltd. (Private Placement) | | 3,324,010 | | | | — | | 4,028,458 | | | | — | | | | — |
| Intrepid Minerals Corp. | | 2,524,490 | | | | — | | 2,706,492 | | | | — | | | | — |
| Minefinders Corp. Ltd. | | 25,936,257 | | | | 1,254,130 | | 1,250,385 | | | | — | | | | 29,636,932 |
| Orezone Resources, Inc. Class A | | 5,156,269 | | | | 5,814,436 | | — | | | | — | | | | 14,417,110 |
| Richmont Mines, Inc. | | 3,810,450 | | | | 797,267 | | 3,429,950 | | | | — | | | | — |
| SouthernEra Diamonds, Inc. Class A | | 2,806,914 | | | | — | | 578,955 | | | | — | | | | — |
| Total | | $ 138,569,883 | | $ | | 133,527,617 | | $ 178,438,307 | | $ | | — | | $ | | 183,436,606 |
The fund has a capital loss carryforward of $11,923,858 which was acquired in the merger with Select Precious Metals and Minerals and is available to offset future capital gains of the fund up to $5,961,929 per year as provided by regulations.
See accompanying notes which are an integral part of the financial statements.
Annual Report 32
| Gold Portfolio | | | | | | | | |
| |
| Financial Statements | | | | | | | | |
| |
| |
| Statement of Assets and Liabilities | | | | | | | | |
| | | | | | | | | February 28, 2006 |
| |
| Assets | | | | | | | | |
| Investment in securities, at value (including securities loaned of $7,877,275) — See accompanying schedule: | | | | | | | | |
| Unaffiliated issuers (cost $786,143,013) | | $ | | 948,245,637 | | | | |
| Affiliated Central Funds (cost $209,935,466) | | | | 209,935,466 | | | | |
| Other affiliated issuers (cost $136,755,640) | | | | 183,436,606 | | | | |
| Total Investments (cost $1,132,834,119) | | | | | | $1,341,617,709 |
| Receivable for investments sold | | | | | | | | 13,179,031 |
| Receivable for fund shares sold | | | | | | | | 6,879,777 |
| Dividends receivable | | | | | | | | 265,098 |
| Interest receivable | | | | | | | | 757,929 |
| Prepaid expenses | | | | | | | | 2,593 |
| Other affiliated receivables | | | | | | | | 34,728 |
| Other receivables | | | | | | | | 304,264 |
| Total assets | | | | | | | | 1,363,041,129 |
| |
| Liabilities | | | | | | | | |
| Payable to custodian bank | | $ | | 8,758,740 | | | | |
| Payable for investments purchased | | | | 5,591,201 | | | | |
| Payable for fund shares redeemed | | | | 13,991,293 | | | | |
| Accrued management fee | | | | 635,300 | | | | |
| Other affiliated payables | | | | 329,163 | | | | |
| Other payables and accrued expenses | | | | 90,548 | | | | |
| Collateral on securities loaned, at value | | | | 7,979,400 | | | | |
| Total liabilities | | | | | | | | 37,375,645 |
| |
| Net Assets | | | | | | $ 1,325,665,484 |
| Net Assets consist of: | | | | | | | | |
| Paid in capital | | | | | | $ | | 998,049,769 |
| Undistributed net investment income | | | | | | | | 1,049,798 |
| Accumulated undistributed net realized gain (loss) on investments and foreign currency transactions | | | | | | | | 117,619,958 |
| Net unrealized appreciation (depreciation) on investments and assets and liabilities in foreign currencies | | | | | | | | 208,945,959 |
| Net Assets, for 36,911,785 shares outstanding | | | | | | $ 1,325,665,484 |
| Net Asset Value, offering price and redemption price per share ($1,325,665,484 ÷ 36,911,785 shares) | | | | | | $ | | 35.91 |
| |
| Statement of Operations | | | | | | | | |
| | | | | | | | | Year ended February 28, 2006 |
| |
| Investment Income | | | | | | | | |
| Dividends | | | | | | $ | | 4,704,502 |
| Interest | | | | | | | | 4,895 |
| Income from affiliated Central Funds (including $415,140 from security lending) | | | | | | | | 2,999,606 |
| Total income | | | | | | | | 7,709,003 |
| |
| Expenses | | | | | | | | |
| Management fee | | $ | | 4,693,130 | | | | |
| Transfer agent fees | | | | 2,427,912 | | | | |
| Accounting and security lending fees | | | | | | | | |
| | | | | 371,963 | | | | |
| Independent trustees’ compensation | | | | 5,044 | | | | |
| Custodian fees and expenses | | | | 268,153 | | | | |
| Registration fees | | | | 115,982 | | | | |
| Audit | | | | 37,489 | | | | |
| Legal | | | | 4,147 | | | | |
| Miscellaneous | | | | 7,408 | | | | |
| Total expenses before reductions | | | | 7,931,228 | | | | |
| Expense reductions | | | | (1,273,868) | | | | 6,657,360 |
| |
| Net investment income (loss) | | | | | | | | 1,051,643 |
See accompanying notes which are an integral part of the financial statements.
33 Annual Report
| Gold Portfolio | | | | |
| Financial Statements - continued | | | | |
| |
| |
| Realized and Unrealized Gain (Loss) | | | | |
| Net realized gain (loss) on: | | | | |
| Investment securities: | | | | |
| Unaffiliated issuers (net of foreign taxes of $13,668) | | 162,827,140 | | |
| Other affiliated issuers | | 52,644,386 | | |
| Foreign currency transactions | | (284,632) | | |
| Total net realized gain (loss) | | | | 215,186,894 |
| Change in net unrealized appreciation (depreciation) on: | | | | |
| Investment securities | | 130,221,886 | | |
| Assets and liabilities in foreign currencies | | 159,631 | | |
| Total change in net unrealized appreciation (depreciation) | | | | 130,381,517 |
| Net gain (loss) | | | | 345,568,411 |
| Net increase (decrease) in net assets resulting from operations | | | | $ 346,620,054 |
See accompanying notes which are an integral part of the financial statements.
Annual Report 34
| Statement of Changes in Net Assets | | | | | | | | | | | | | | | | | | | | | | |
| | | | | | | | | | | | | | | Year ended | | | | Year ended |
| | | | | | | | | | | | | | | February 28, | | | | February 28, |
| | | | | | | | | | | | | | | 2006 | | | | 2005 |
| Increase (Decrease) in Net Assets | | | | | | | | | | | | | | | | | | | | | | |
| Operations | | | | | | | | | | | | | | | | | | | | | | |
| Net investment income (loss) | | | | | | | | | | | | $ | | 1,051,643 | | $ | | | | 473,673 |
| Net realized gain (loss) | | | | | | | | | | | | | | 215,186,894 | | | | 108,286,605 |
| Change in net unrealized appreciation (depreciation) | | | | | | | | | | | | | | 130,381,517 | | | | (109,824,666) |
| Net increase (decrease) in net assets resulting from operations | | | | | | | | | | | | | | 346,620,054 | | | | | | (1,064,388) |
| Distributions to shareholders from net investment income | | | | | | | | | | | | | | | | (507,609) | | | | | | — |
| Distributions to shareholders from net realized gain | | | | | | | | | | | | | | (106,134,254) | | | | | | — |
| Total distributions | | | | | | | | | | | | | | (106,641,863) | | | | | | — |
| Share transactions | | | | | | | | | | | | | | | | | | | | | | |
| Proceeds from sales of shares | | | | | | | | | | | | 1,098,070,139 | | | | 565,734,932 |
| Reinvestment of distributions | | | | | | | | | | | | | | 102,614,627 | | | | | | — |
| Cost of shares redeemed | | | | | | | | | | | | | | (821,889,539) | | | | (596,590,373) |
| Net increase (decrease) in net assets resulting from share transactions | | | | | | | | | | | | 378,795,227 | | | | (30,855,441) |
| Redemption fees | | | | | | | | | | | | | | 1,675,648 | | | | | | 1,392,457 |
| Total increase (decrease) in net assets | | | | | | | | | | | | | | 620,449,066 | | | | (30,527,372) |
| |
| Net Assets | | | | | | | | | | | | | | | | | | | | | | |
| Beginning of period | | | | | | | | | | | | | | 705,216,418 | | | | 735,743,790 |
| End of period (including undistributed net investment income of $1,049,798 and distributions in excess of net invest- | | | | | | | | | | |
| ment income of $8,523,093, respectively) | | | | | | | | | | | | $ 1,325,665,484 | | $ | | 705,216,418 |
| |
| Other Information | | | | | | | | | | | | | | | | | | | | | | |
| Shares | | | | | | | | | | | | | | | | | | | | | | |
| Sold | | | | | | | | | | | | | | 35,716,956 | | | | | | 22,113,910 |
| Issued in reinvestment of distributions | | | | | | | | | | | | | | 3,522,978 | | | | | | — |
| Redeemed | | | | | | | | | | | | | | (28,011,502) | | | | (23,466,147) |
| Net increase (decrease) | | | | | | | | | | | | | | 11,228,432 | | | | | | (1,352,237) |
| |
| Financial Highlights | | | | | | | | | | | | | | | | | | | | | | |
| Years ended February 28, | | | | 2006 | | | | 2005 | | | | 2004H | | | | 2003 | | | | | | 2002 |
| Selected Per-Share Data | | | | | | | | | | | | | | | | | | | | | | |
| Net asset value, beginning of period | | $ | | 27.46 | | $ | | 27.21 | | $ | | 22.73 | | $ | | 18.25 | | | | $ | | 12.38 |
| Income from Investment Operations | | | | | | | | | | | | | | | | | | | | | | |
| Net investment income (loss)C | | | | 04 | | | | .02E | | | | (.01) | | | | .05 | | | | | | .25D |
| Net realized and unrealized gain (loss) | | | | 12.21 | | | | .18F | | | | 5.85 | | | | 4.67 | | | | | | 5.78 |
| Total from investment operations | | | | 12.25 | | | | .20 | | | | 5.84 | | | | 4.72 | | | | | | 6.03 |
| Distributions from net investment income | | | | (.02) | | | | — | | | | (1.42) | | | | (.36) | | | | | | (.22) |
| Distributions from net realized gain | | | | (3.84) | | | | — | | | | — | | | | — | | | | | | — |
| Total distributions | | | | (3.86) | | | | — | | | | (1.42) | | | | (.36) | | | | | | (.22) |
| Redemption fees added to paid in capitalC | | | | 06 | | | | .05 | | | | .06 | | | | .12 | | | | | | .06 |
| Net asset value, end of period | | $ | | 35.91 | | $ | | 27.46 | | $ | | 27.21 | | $ | | 22.73 | | | | $ | | 18.25 |
| Total ReturnA,B | | | | 48.84% | | | | .92% | | | | 26.79% | | | | 26.68% | | | | | | 49.79% |
| Ratios to Average Net AssetsG | | | | | | | | | | | | | | | | | | | | | | |
| Expenses before reductions | | | | 97% | | | | 1.00% | | | | 1.12% | | | | 1.18% | | | | | | 1.29% |
| Expenses net of fee waivers, if any | | | | 97% | | | | 1.00% | | | | 1.12% | | | | 1.18% | | | | | | 1.29% |
| Expenses net of all reductions | | | | 82% | | | | .89% | | | | 1.04% | | | | 1.11% | | | | | | 1.24% |
| Net investment income (loss) | | | | 13% | | | | .07%E | | | | (.03)% | | | | .22% | | | | | | 1.76% |
| Supplemental Data | | | | | | | | | | | | | | | | | | | | | | |
| Net assets, end of period (000 omitted) | | $ 1,325,665 | | $ 705,216 | | $ 735,744 | | $ 686,029 | | | | $ 443,849 |
| Portfolio turnover rate | | | | 108% | | | | 79% | | | | 41% | | | | 44% | | | | | | 49% |
| |
| | | | | |
| | | |
A Total returns would have been lower had certain expenses not been reduced during the periods shown. B Total returns do not include the effect of the former sales charges.C Calculated based on average shares outstanding during the period. D Investment income per share reflects a special dividend which amounted to $.04 per share. E Investment income per share reflects a special dividend which amounted to $.04 per share. Excluding the special dividend, the ratio of net investment income (loss) to average net assets would have been (.08)%. FThe amount shown for a share outstanding does not correspond with the aggregate net gain (loss) on investments for the period due to the timing of sales and repurchases of shares in relation to fluctuating market values of the investments of the fund. GExpense ratios reflect operating expenses of the fund. Expenses before reductions do not reflect amounts reimbursed by the investment adviser or reductions from brokerage service arrangements or other expense offset arrangements and do not represent the amount paid by the fund during periods when reimbursements or reductions occur. Expenses net of fee waivers reflect expenses after reimbursement by the investment adviser but prior to reductions from brokerage service arrangements or other expense offset arrangements. Expenses net of all reductions represent the net expenses paid by the fund. HFor the year ended February 29.See accompanying notes which are an integral part of the financial statements.
35 Annual Report
Natural Gas Portfolio
Performance
Average annual total return reflects the change in the value of an investment, assuming reinvestment of the fund’s dividend income and capital gains (the profits earned upon the sale of securities that have grown in value) and assuming a constant rate of performance each year. The $10,000 table and the fund’s returns do not reflect the deduction of taxes that a shareholder would pay on fund distributions or the redemption of fund shares. During periods of reimbursement by Fidelity, a fund’s total returns will be greater than it would be had the reimbursement not occurred. How a fund did yesterday is no guarantee of how it will do tomorrow.
| Average Annual Total Returns | | | | | | |
| Periods ended February 28, 2006 | | Past 1 | | Past 5 | | Past 10 |
| | | year | | years | | years |
| Select Natural Gas | | 26.28% | | 13.96% | | 15.64% |
$10,000 Over 10 Years
Let’s say hypothetically that $10,000 was invested in Fidelity Select Natural Gas Portfolio on February 29, 1996. The chart shows how the value of your investment would have changed, and also shows how the S&P 500 Index performed over the same period.
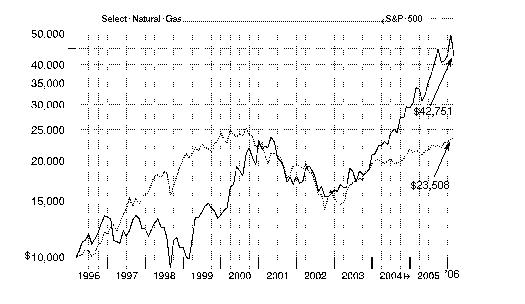
Annual Report 36
Management’s Discussion of Fund Performance
Comments from James McElligott, who became Portfolio Manager of Fidelity® Select Natural Gas Portfolio on November 1, 2005
With the exception of several popular large-cap stock performance measures, most major U.S. equity benchmarks had double-digit returns for the year ending February 28, 2006. For much of the period, market gains were driven largely by the energy sector, although utilities ultimately sneaked into the top spot for the year overall. Financials and telecommunication services also reached double figures, outperforming the 8.40% return of the broader market as measured by the large-cap-oriented Standard & Poor’s 500SM Index. The consumer discretionary segment — home to the weak performing automobile and media industries — was the biggest disappointment. Although the overall return for the S&P 500® beat the small-cap Russell 2000® Index in calendar year 2005 — the first time that’s happened in six years — small-caps stormed back in early 2006, leading to a 16.59% advance during the past 12 months, nearly twice the broader market’s gain. Mid-caps soared even higher, returning 17.67% according to the Russell Midcap® Index. The technology-heavy NASDAQ Composite® Index also fared well, climbing 12.13%, but the Dow Jones Industrial AverageSM, an index of 30 large-cap, blue-chip stocks, managed to rise only 4.52% .
Select Natural Gas gained 26.28% during the past year, outperforming both the S&P 500 and the Goldman Sachs® Natural Resources Index, which rose 23.71% . Already high energy prices rose even more sharply in the wake of the late summer’s Gulf Coast hurricanes, which severely disrupted energy supplies. Strong demand and very limited supply created a favorable environment for energy-related stocks, and the portfolio performed well for most of the period. An abnormally warm winter heating season, however, slackened demand, and natural gas prices fell off sharply. Overall, the portfolio benefited from favorable industry positioning versus the sector index. A big underweighting in integrated energy companies, such as Chevron and Exxon Mobil — which tend to be more defensive-oriented stocks — provided the biggest lift, while an overweighting in refining and marketing stocks — including a position in Valero Energy — also helped. Several equipment and services companies contributed as well, including drill pipe maker Grant Prideco and energy services giant Halliburton. Having no exposure to Canadian oil sands producer Suncor Energy hurt returns, as did underweightings in energy services giant Schlumberger and Canadian natural gas producer EnCana. Oil transporter General Maritime also detracted, and I sold the position.
The views expressed above reflect those of the portfolio manager(s) only through the end of the period as stated on the cover of this report and do not necessarily represent the views of Fidelity or any other person in the Fidelity organization. Any such views are subject to change at any time based upon market or other conditions and Fidelity disclaims any responsibility to update such views. These views may not be relied on as investment advice and, because investment decisions for a Fidelity fund are based on numerous factors, may not be relied on as an indication of trading intent on behalf of any Fidelity fund.
37 37 Annual Report
| Natural Gas Portfolio | | | | |
| Investment Changes | | |
| |
| |
| Top Ten Stocks as of February 28, 2006 |
| | | % of fund’s | | % of fund’s net assets |
| | | net assets | | 6 months ago |
| Valero Energy Corp. | | 6.1 | | 5.5 |
| Range Resources Corp. | | 6.0 | | 4.1 |
| Canadian Natural Resources Ltd. | | 5.8 | | 2.6 |
| Plains Exploration & Production | | | | |
| Co. | | 5.4 | | 3.9 |
| Quicksilver Resources, Inc. | | 4.6 | | 2.6 |
| XTO Energy, Inc. | | 3.8 | | 1.3 |
| Halliburton Co. | | 3.5 | | 3.9 |
| Houston Exploration Co. | | 3.5 | | 2.4 |
| Talisman Energy, Inc. | | 3.4 | | 2.4 |
| Chesapeake Energy Corp. | | 3.2 | | 3.8 |
| | | 45.3 | | |
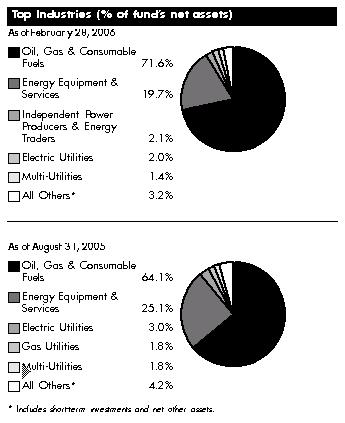
Annual Report 38
| Natural Gas Portfolio | | | | | | |
| Investments February 28, 2006 | | | | |
| Showing Percentage of Net Assets | | | | | | |
| |
| Common Stocks — 99.2% | | | | | | |
| | | | | Shares | | Value (Note 1) |
| |
| CHEMICALS – 0.6% | | | | | | |
| Fertilizers & Agricultural Chemicals – 0.6% | | | | | | |
| Mosaic Co. (a) | | | | 575,500 | | $ 9,150,450 |
| COMMERCIAL SERVICES & SUPPLIES – 0.2% | | | | | | |
| Human Resource & Employment Services – 0.2% | | | | | | |
| CDI Corp. | | | | 123,800 | | 3,031,862 |
| ELECTRIC UTILITIES – 2.0% | | | | | | |
| Electric Utilities – 2.0% | | | | | | |
| Exelon Corp. | | | | 474,100 | | 27,075,851 |
| PPL Corp. | | | | 108,800 | | 3,459,840 |
| | | | | | | 30,535,691 |
| |
| ELECTRICAL EQUIPMENT – 0.1% | | | | | | |
| Heavy Electrical Equipment – 0.1% | | | | | | |
| Vestas Wind Systems AS (a) | | | | 83,600 | | 1,752,950 |
| ENERGY EQUIPMENT & SERVICES – 19.7% | | | | | | |
| Oil & Gas Drilling – 8.8% | | | | | | |
| Cathedral Energy Services Income Trust | | | | 494,600 | | 4,753,802 |
| Diamond Offshore Drilling, Inc. | | | | 69,700 | | 5,394,083 |
| ENSCO International, Inc. | | | | 530,600 | | 23,712,514 |
| GlobalSantaFe Corp. | | | | 697,500 | | 38,599,650 |
| Noble Corp. | | | | 267,700 | | 19,785,707 |
| Patterson-UTI Energy, Inc. | | | | 249,800 | | 6,881,990 |
| Pride International, Inc. (a) | | | | 960,100 | | 29,734,297 |
| TODCO Class A | | | | 244,700 | | 8,202,344 |
| | | | | | | 137,064,387 |
| Oil & Gas Equipment & Services – 10.9% | | | | | | |
| BJ Services Co. | | | | 358,300 | | 11,218,373 |
| Cal Dive International, Inc. (a) | | | | 261,100 | | 9,193,331 |
| Grant Prideco, Inc. (a) | | | | 17,696 | | 716,157 |
| Halliburton Co. | | | | 796,500 | | 54,162,000 |
| Hydril Co. (a) | | | | 133,700 | | 9,003,358 |
| National Oilwell Varco, Inc. (a) | | | | 467,928 | | 28,487,457 |
| Savanna Energy Services Corp. (a) | | | | 68,700 | | 1,505,637 |
| Schlumberger Ltd. (NY Shares) | | | | 113,900 | | 13,098,500 |
| Smith International, Inc. | | | | 775,890 | | 30,050,220 |
| TETRA Technologies, Inc. (a) | | | | 146,900 | | 5,523,440 |
| Veritas DGC, Inc. (a) | | | | 133,800 | | 5,636,994 |
| | | | | | | 168,595,467 |
| |
| TOTAL ENERGY EQUIPMENT & SERVICES | | | | | | 305,659,854 |
| |
| INDEPENDENT POWER PRODUCERS & ENERGY TRADERS – 2.1% | | | | |
| Independent Power & Energy Trade – 2.1% | | | | | | |
| AES Corp. (a) | | | | 267,400 | | 4,626,020 |
| NRG Energy, Inc. (a) | | | | 231,200 | | 9,999,400 |
| TXU Corp. | | | | 338,600 | | 17,739,254 |
| | | | | | | 32,364,674 |
See accompanying notes which are an integral part of the financial statements.
|
39 Annual Report
39
| Natural Gas Portfolio | | | | |
| Investments - continued | | | | |
| |
| |
| |
| | | Shares | | Value (Note 1) |
| |
| MACHINERY – 0.7% | | | | |
| Construction & Farm Machinery & Heavy Trucks – 0.7% | | | | |
| Bucyrus International, Inc. Class A | | 161,800 | | $ 10,190,164 |
| METALS & MINING – 0.8% | | | | |
| Steel – 0.8% | | | | |
| Oregon Steel Mills, Inc. (a) | | 348,000 | | 13,182,240 |
| MULTI-UTILITIES – 1.4% | | | | |
| Multi-Utilities – 1.4% | | | | |
| Public Service Enterprise Group, Inc. | | 74,000 | | 5,134,860 |
| Sempra Energy | | 362,500 | | 17,342,000 |
| | | | | 22,476,860 |
| |
| OIL, GAS & CONSUMABLE FUELS – 71.6% | | | | |
| Coal & Consumable Fuels – 4.0% | | | | |
| Arch Coal, Inc. | | 113,200 | | 8,276,052 |
| Cameco Corp. | | 193,900 | | 7,210,558 |
| CONSOL Energy, Inc. | | 252,700 | | 16,177,854 |
| International Coal Group, Inc. (a) | | 1,203,000 | | 10,285,650 |
| Peabody Energy Corp. | | 408,200 | | 19,703,814 |
| | | | | 61,653,928 |
| Integrated Oil & Gas – 3.4% | | | | |
| Amerada Hess Corp. (d) | | 202,400 | | 27,993,944 |
| Murphy Oil Corp. | | 357,700 | | 16,765,399 |
| OAO Gazprom sponsored ADR | | 89,500 | | 7,607,500 |
| | | | | 52,366,843 |
| Oil & Gas Exploration & Production – 56.2% | | | | |
| Apache Corp. | | 642,700 | | 43,009,484 |
| Cabot Oil & Gas Corp. | | 479,400 | | 21,697,644 |
| Canadian Natural Resources Ltd. | | 1,639,700 | | 89,608,743 |
| Chesapeake Energy Corp. (d) | | 1,685,400 | | 50,039,526 |
| Denbury Resources, Inc. (a) | | 282,700 | | 8,014,545 |
| EnCana Corp. | | 388,300 | | 16,063,108 |
| Encore Acquisition Co. (a) | | 461,250 | | 14,132,700 |
| Energy Partners Ltd. (a) | | 398,800 | | 9,168,412 |
| EOG Resources, Inc. | | 631,000 | | 42,529,400 |
| Forest Oil Corp. (a) | | 833,300 | | 41,373,345 |
| Goodrich Petroleum Corp. (a) | | 116,800 | | 2,824,224 |
| Houston Exploration Co. (a) | | 931,400 | | 53,872,176 |
| Kerr-McGee Corp. | | 247,600 | | 24,190,520 |
| Newfield Exploration Co. (a) | | 187,500 | | 7,246,875 |
| Penn Virginia Corp. | | 215,000 | | 13,297,750 |
| Plains Exploration & Production Co. (a) | | 2,073,400 | | 84,491,050 |
| Quicksilver Resources, Inc. (a)(d) | | 1,969,300 | | 71,524,976 |
| Range Resources Corp. | | 3,938,400 | | 94,245,912 |
| Southwestern Energy Co. (a) | | 850,600 | | 27,295,754 |
| Talisman Energy, Inc. | | 1,001,400 | | 52,628,257 |
| Ultra Petroleum Corp. (a) | | 946,500 | | 49,255,860 |
| XTO Energy, Inc. | | 1,396,100 | | 58,482,629 |
| | | | | 874,992,890 |
| Oil & Gas Refining & Marketing – 6.7% | | | | |
| Holly Corp. | | 68,900 | | 4,113,330 |
See accompanying notes which are an integral part of the financial statements.
Annual Report 40
| Common Stocks – continued | | | | |
| | | Shares | | Value (Note 1) |
| |
| OIL, GAS & CONSUMABLE FUELS – CONTINUED | | | | |
| Oil & Gas Refining & Marketing – continued | | | | |
| Tesoro Corp. | | 83,300 | | $ 5,032,153 |
| Valero Energy Corp. | | 1,762,400 | | 94,799,495 |
| Western Refining, Inc. | | 25,100 | | 407,624 |
| | | | | 104,352,602 |
| Oil & Gas Storage & Transport – 1.3% | | | | |
| OMI Corp. | | 698,500 | | 12,223,750 |
| Overseas Shipholding Group, Inc. | | 170,500 | | 8,622,185 |
| | | | | 20,845,935 |
| |
| TOTAL OIL, GAS & CONSUMABLE FUELS | | | | 1,114,212,198 |
| |
| TOTAL COMMON STOCKS | | | | |
| (Cost $1,302,916,810) | | | | 1,542,556,943 |
| |
| Money Market Funds — 3.4% | | | | |
| | | Shares | | Value (Note 1) |
| Fidelity Cash Central Fund, 4.57% (b) | | 2,916,821 | | $ 2,916,821 |
| Fidelity Securities Lending Cash Central Fund, 4.58% (b)(c) | | 49,925,725 | | 49,925,725 |
| TOTAL MONEY MARKET FUNDS | | | | |
| (Cost $52,842,546) | | | | 52,842,546 |
| |
| TOTAL INVESTMENT PORTFOLIO - 102.6% | | | | |
| (Cost $1,355,759,356) | | | | 1,595,399,489 |
| |
| NET OTHER ASSETS – (2.6)% | | | | (39,820,782) |
| NET ASSETS – 100% | | $1,555,578,707 |
(a) Non-income producing
(b) Affiliated fund that is available only to investment companies and other accounts managed by Fidelity Investments. The rate quoted is the annualized seven-day yield of the fund at period end. A complete unaudited listing of the fund’s holdings as of its most recent quarter end is available upon request.
(c) Investment made with cash collateral received from securities on loan. (d) Security or a portion of the security is on loan at period end.
Information regarding fiscal year to date income earned by the fund from the affiliated Central funds is as follows:
| Fund | | Income earned |
| Fidelity Cash Central Fund | | $ 957,582 |
| Fidelity Securities Lending Cash Central Fund | | 80,213 |
| Total | | $ 1,037,795 |
Distribution of investments by country of issue, as a percentage of total net assets, is as follows:
| United States of America | | 79.7% |
| Canada | | 14.3% |
| Cayman Islands | | 3.8% |
| Others (individually less than 1%) | | 2.2% |
| | | 100.0% |
41
See accompanying notes which are an integral part of the financial statements.
41 Annual Report
| Natural Gas Portfolio | | | | | | | | |
| |
| Financial Statements | | | | | | | | |
| |
| |
| Statement of Assets and Liabilities | | | | | | | | |
| | | | | | | | | February 28, 2006 |
| |
| Assets | | | | | | | | |
| Investment in securities, at value (including securities loaned of $48,731,654) — See accompanying schedule: | | | | | | | | |
| Unaffiliated issuers (cost $1,302,916,810) | | $1,542,556,943 | | | | |
| Affiliated Central Funds (cost $52,842,546) | | | | 52,842,546 | | | | |
| Total Investments (cost $1,355,759,356) | | | | | | $1,595,399,489 |
| Receivable for investments sold | | | | | | | | 50,593,041 |
| Receivable for fund shares sold | | | | | | | | 2,415,789 |
| Dividends receivable | | | | | | | | 715,359 |
| Interest receivable | | | | | | | | 19,116 |
| Prepaid expenses | | | | | | | | 4,591 |
| Other affiliated receivables | | | | | | | | 17,697 |
| Other receivables | | | | | | | | 41,639 |
| Total assets | | | | | | | | 1,649,206,721 |
| |
| Liabilities | | | | | | | | |
| Payable for investments purchased | | $ | | 16,802,399 | | | | |
| Payable for fund shares redeemed | | | | 25,537,584 | | | | |
| Accrued management fee | | | | 824,366 | | | | |
| Other affiliated payables | | | | 476,594 | | | | |
| Other payables and accrued expenses | | | | 61,346 | | | | |
| Collateral on securities loaned, at value | | | | 49,925,725 | | | | |
| Total liabilities | | | | | | | | 93,628,014 |
| |
| Net Assets | | | | | | $ 1,555,578,707 |
| Net Assets consist of: | | | | | | | | |
| Paid in capital | | | | | | $1,239,193,883 |
| Accumulated net investment loss | | | | | | | | (79) |
| Accumulated undistributed net realized gain (loss) on investments and foreign currency transactions | | | | | | | | 76,746,470 |
| Net unrealized appreciation (depreciation) on investments and assets and liabilities in foreign currencies | | | | | | | | 239,638,433 |
| Net Assets, for 40,032,321 shares outstanding | | | | | | $ 1,555,578,707 |
| |
| Net Asset Value, offering price and redemption price per share ($1,555,578,707 ÷ 40,032,321 shares) | | | | | | $ | | 38.86 |
| |
| Statement of Operations | | | | | | | | |
| | | | | | | | | Year ended February 28, 2006 |
| |
| Investment Income | | | | | | | | |
| Dividends | | | | | | $ | | 8,026,447 |
| Interest | | | | | | | | 14,633 |
| Income from affiliated Central Funds (including $80,213 from security lending) | | | | | | | | 1,037,795 |
| Total income | | | | | | | | 9,078,875 |
| |
| Expenses | | | | | | | | |
| Management fee | | $ | | 8,099,434 | | | | |
| Transfer agent fees | | | | 4,318,519 | | | | |
| Accounting and security lending fees | | | | | | | | |
| | | | | 575,178 | | | | |
| Independent trustees’ compensation | | | | 5,683 | | | | |
| Custodian fees and expenses | | | | 63,232 | | | | |
| Registration fees | | | | 226,934 | | | | |
| Audit | | | | 41,110 | | | | |
| Legal | | | | 6,984 | | | | |
| Interest | | | | 67,022 | | | | |
| Miscellaneous | | | | 8,140 | | | | |
| Total expenses before reductions | | | | 13,412,236 | | | | |
| Expense reductions | | | | (969,442) | | | | 12,442,794 |
| |
| Net investment income (loss) | | | | | | | | (3,363,919) |
See accompanying notes which are an integral part of the financial statements.
Annual Report 42
| Realized and Unrealized Gain (Loss) | | | | |
| Net realized gain (loss) on: | | | | |
| Investment securities: | | | | |
| Unaffiliated issuers | | 165,758,918 | | |
| Foreign currency transactions | | (413,790) | | |
| Total net realized gain (loss) | | | | 165,345,128 |
| Change in net unrealized appreciation (depreciation) on: | | | | |
| Investment securities | | 100,304,504 | | |
| Assets and liabilities in foreign currencies | | (1,700) | | |
| Total change in net unrealized appreciation (depreciation) | | | | 100,302,804 |
| Net gain (loss) | | | | 265,647,932 |
| Net increase (decrease) in net assets resulting from operations | | | | $262,284,013 |
See accompanying notes which are an integral part of the financial statements.
|
43 Annual Report
| Natural Gas Portfolio | | | | | | | | | | | | | | | | | | | | | | |
| Financial Statements - continued | | | | | | | | | | | | | | | | | | | | | | |
| |
| |
| Statement of Changes in Net Assets | | | | | | | | | | | | | | | | | | | | | | |
| | | | | | | | | | | | | | | Year ended | | | | Year ended |
| | | | | | | | | | | | | | | February 28, | | | | February 28, |
| | | | | | | | | | | | | | | 2006 | | | | 2005 |
| Increase (Decrease) in Net Assets | | | | | | | | | | | | | | | | | | | | | | |
| Operations | | | | | | | | | | | | | | | | | | | | | | |
| Net investment income (loss) | | | | | | | | | | | | $ | | (3,363,919) | | $ | | | | 94,365 |
| Net realized gain (loss) | | | | | | | | | | | | | | 165,345,128 | | | | 102,445,040 |
| Change in net unrealized appreciation (depreciation) | | | | | | | | | | | | | | 100,302,804 | | | | 104,647,040 |
| Net increase (decrease) in net assets resulting from operations | | | | | | | | | | | | | | 262,284,013 | | | | 207,186,445 |
| Distributions to shareholders from net investment income | | | | | | | | | | | | | | | | — | | | | | | (399,135) |
| Distributions to shareholders from net realized gain | | | | | | | | | | | | | | (152,139,802) | | | | | | (8,780,955) |
| Total distributions | | | | | | | | | | | | | | (152,139,802) | | | | | | (9,180,090) |
| Share transactions | | | | | | | | | | | | | | | | | | | | | | |
| Proceeds from sales of shares | | | | | | | | | | | | 1,819,254,857 | | | | 897,135,404 |
| Reinvestment of distributions | | | | | | | | | | | | | | 145,498,281 | | | | | | 8,662,735 |
| Cost of shares redeemed | | | | | | | | | | | | (1,468,412,444) | | | | (381,169,506) |
| Net increase (decrease) in net assets resulting from share transactions | | | | | | | | | | | | 496,340,694 | | | | 524,628,633 |
| Redemption fees | | | | | | | | | | | | | | 1,555,343 | | | | | | 428,943 |
| Total increase (decrease) in net assets | | | | | | | | | | | | | | 608,040,248 | | | | 723,063,931 |
| |
| Net Assets | | | | | | | | | | | | | | | | | | | | | | |
| Beginning of period | | | | | | | | | | | | | | 947,538,459 | | | | 224,474,528 |
| End of period (including accumulated net investment loss of $79 and distributions in excess of net investment income of | | | | | | | | | | |
| $110, respectively) | | | | | | | | | | | | $ 1,555,578,707 | | $ | | 947,538,459 |
| |
| Other Information | | | | | | | | | | | | | | | | | | | | | | |
| Shares | | | | | | | | | | | | | | | | | | | | | | |
| Sold | | | | | | | | | | | | | | 48,076,717 | | | | | | 31,705,170 |
| Issued in reinvestment of distributions | | | | | | | | | | | | | | 4,018,204 | | | | | | 302,153 |
| Redeemed | | | | | | | | | | | | | | (39,599,586) | | | | (14,231,520) |
| Net increase (decrease) | | | | | | | | | | | | | | 12,495,335 | | | | | | 17,775,803 |
| |
| Financial Highlights | | | | | | | | | | | | | | | | | | | | | | |
| Years ended February 28, | | | | 2006 | | | | 2005 | | | | 2004E | | | | 2003 | | | | | | 2002 |
| Selected Per-Share Data | | | | | | | | | | | | | | | | | | | | | | |
| Net asset value, beginning of period | | $ | | 34.41 | | $ | | 23.00 | | $ | | 17.42 | | $ | | 17.91 | | | | $ | | 23.26 |
| Income from Investment Operations | | | | | | | | | | | | | | | | | | | | | | |
| Net investment income (loss)C | | | | (.09) | | | | .01 | | | | (.09) | | | | .05 | | | | | | .14 |
| Net realized and unrealized gain (loss) | | | | 8.58 | | | | 11.83 | | | | 5.65 | | | | (.45) | | | | | | (5.35) |
| Total from investment operations | | | | 8.49 | | | | 11.84 | | | | 5.56 | | | | (.40) | | | | | | (5.21) |
| Distributions from net investment income | | | | — | | | | (.02) | | | | — | | | | (.10) | | | | | | (.03) |
| Distributions from net realized gain | | | | (4.08) | | | | (.44) | | | | — | | | | — | | | | | | (.13) |
| Total distributions | | | | (4.08) | | | | (.46) | | | | — | | | | (.10) | | | | | | (.16) |
| Redemption fees added to paid in capitalC | | | | 04 | | | | .03 | | | | .02 | | | | .01 | | | | | | .02 |
| Net asset value, end of period | | $ | | 38.86 | | $ | | 34.41 | | $ | | 23.00 | | $ | | 17.42 | | | | $ | | 17.91 |
| Total ReturnA,B | | | | 26.28% | | | | 52.01% | | | | 32.03% | | | | (2.17)% | | | | | | (22.47)% |
| Ratios to Average Net AssetsD | | | | | | | | | | | | | | | | | | | | | | |
| Expenses before reductions | | | | 95% | | | | .98% | | | | 1.21% | | | | 1.30% | | | | | | 1.17% |
| Expenses net of fee waivers, if any | | | | 95% | | | | .98% | | | | 1.21% | | | | 1.30% | | | | | | 1.17% |
| Expenses net of all reductions | | | | 88% | | | | .94% | | | | 1.14% | | | | 1.24% | | | | | | 1.13% |
| Net investment income (loss) | | | | (.24)% | | | | .02% | | | | (.46)% | | | | .27% | | | | | | .67% |
| Supplemental Data | | | | | | | | | | | | | | | | | | | | | | |
| Net assets, end of period (000 omitted) | | $ 1,555,579 | | $ 947,538 | | $ 224,475 | | $ 163,005 | | | | $ 185,685 |
| Portfolio turnover rate | | | | 148% | | | | 190% | | | | 171% | | | | 108% | | | | | | 68% |
| |
| | | | | |
A Total returns would have been lower had certain expenses not been reduced during the periods shown.B Total returns do not include the effect of the former sales charges.C Calculated based on average shares outstanding during the period. DExpense ratios reflect operating expenses of the fund. Expenses before reductions do not reflect amounts reimbursed by the investment adviser or reductions from brokerage service arrangements or other expense offset arrangements and do not represent the amount paid by the fund during periods when reimbursements or reductions occur. Expenses net of fee waivers reflect expenses after reimbursement by the investment adviser but prior to reductions from brokerage service arrangements or other expense offset arrangements. Expenses net of all reductions represent the net expenses paid by the fund. EFor the year ended February 29.See accompanying notes which are an integral part of the financial statements.
Annual Report 44
Natural Resources Portfolio
Performance
|
Average annual total return reflects the change in the value of an investment, assuming reinvestment of the fund’s dividend income and capital gains (the profits earned upon the sale of securities that have grown in value) and assuming a constant rate of performance each year. The $10,000 table and the fund’s returns do not reflect the deduction of taxes that a shareholder would pay on fund distributions or the redemption of fund shares. During periods of reimbursement by Fidelity, a fund’s total returns will be greater than it would be had the reimbursement not occurred. How a fund did yesterday is no guarantee of how it will do tomorrow.
| Average Annual Total Returns | | | | | | |
| Periods ended February 28, 2006 | | Past 1 | | Past 5 | | Life of |
| | | year | | years | | FundA |
| Select Natural Resources | | 34.50% | | 15.03% | | 13.54% |
| |
| A From March 3, 1997 | | | | | | |
| $10,000 Over Life of Fund | | | | | | |
Let’s say hypothetically that $10,000 was invested in Fidelity Select Natural Resources Portfolio on March 3, 1997, when the fund started. The chart shows how the value of your investment would have changed, and also shows how the S&P 500 Index performed over the same period.
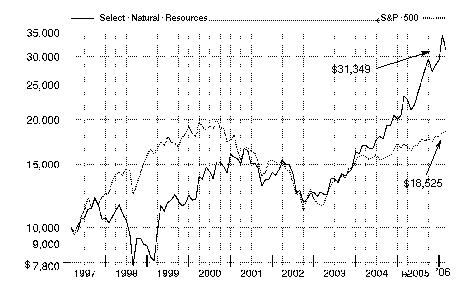
45 Annual Report
Natural Resources Portfolio
|
Management’s Discussion of Fund Performance
Comments from Matthew Friedman, Portfolio Manager of Fidelity® Select Natural Resources Portfolio
With the exception of several popular large-cap stock performance measures, most major U.S. equity benchmarks had double-digit returns for the year ending February 28, 2006. For much of the period, market gains were driven largely by the energy sector, although utilities ultimately sneaked into the top spot for the year overall. Financials and telecommunication services also reached double figures, outperforming the 8.40% return of the broader market as measured by the large-cap-oriented Standard & Poor’s 500SM Index. The consumer discretionary segment — home to the weak performing automobile and media industries — was the biggest disappointment. Although the overall return for the S&P 500® beat the small-cap Russell 2000® Index in calendar year 2005 — the first time that’s happened in six years — small-caps stormed back in early 2006, leading to a 16.59% advance during the past 12 months, nearly twice the broader market’s gain. Mid-caps soared even higher, returning 17.67% according to the Russell Midcap® Index. The technology-heavy NASDAQ Composite® Index also fared well, climbing 12.13%, but the Dow Jones Industrial AverageSM, an index of 30 large-cap, blue-chip stocks, managed to rise only 4.52% .
During the past year, the fund returned 34.50%, beating both the S&P 500 and the Goldman Sachs® Natural Resources Index, which returned 23.71% . During the period, industry allocation within the energy universe drove the fund’s performance relative to the sector index, including overweighted investments in energy services companies such as Halliburton that benefited from increased capital spending by oil producers. Refiners Frontier Oil and Premcor — which was acquired by Valero Energy — also boosted relative performance as refining demand outstripped refining capacity, particularly in the aftermath of major hurricanes in the United States. Also, independent exploration and production (E&P) companies such as Ultra Petroleum helped returns, as investors valued their high-potential properties. Lastly, the fund benefited from underweighting the more defensive integrated oil companies, such as Chevron, Exxon Mobil and BP. On the other hand, little-to-no exposure to Canadian oil sands companies Suncor Energy and Petro-Canada detracted from returns, as the stocks performed well in the high oil price environment. Valero Energy hurt because I didn’t own enough of it early in the period when performance was very strong. Also, some of our holdings in metals stocks, including Newmont Mining, detracted from performance, although an investment in Titanium Metals performed very well as demand for the metal was robust. Lastly, the fund’s underweighting of several higher-growth E&P companies, such as Burlington Resources and Nexen, curbed performance relative to the sector benchmark.
The views expressed above reflect those of the portfolio manager(s) only through the end of the period of the report as stated on the cover of this report and do not necessarily represent the views of Fidelity or any other person in the Fidelity organization. Any such views are subject to change at any time based upon market or other conditions and Fidelity disclaims any responsibility to update such views. These views may not be relied on as investment advice and, because investment decisions for a Fidelity fund are based on numerous factors, may not be relied on as an indication of trading intent on behalf of any Fidelity fund.
Natural Resources Portfolio
Investment Changes
| Top Ten Stocks as of February 28, 2006 |
| | | % of fund’s | | % of fund’s net assets |
| | | net assets | | 6 months ago |
| GlobalSantaFe Corp. | | 4.4 | | 1.5 |
| Halliburton Co. | | 4.2 | | 4.2 |
| National Oilwell Varco, Inc. | | 3.9 | | 5.3 |
| Schlumberger Ltd. (NY Shares) | | 3.3 | | 4.4 |
| Smith International, Inc. | | 3.1 | | 2.6 |
| Alcoa, Inc. | | 3.0 | | 2.5 |
| Newmont Mining Corp. | | 2.9 | | 3.1 |
| ConocoPhillips | | 2.6 | | 4.6 |
| Valero Energy Corp. | | 2.5 | | 2.1 |
| Occidental Petroleum Corp. | | 2.1 | | 1.3 |
| | | 32.0 | | |
47 Annual Report
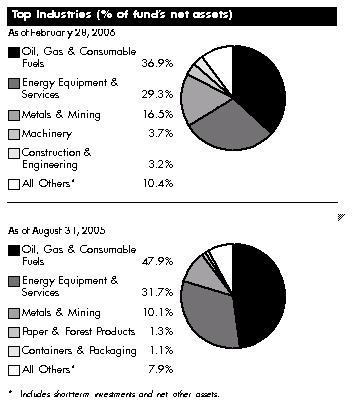
| Natural Resources Portfolio | | | | | | | | |
| Investments February 28, 2006 | | | | |
| Showing Percentage of Net Assets | | | | | | | | |
| |
| Common Stocks — 99.7% | | | | | | | | |
| | | | | | | Shares | | Value (Note 1) |
| |
| CHEMICALS – 2.0% | | | | | | | | |
| Diversified Chemicals – 0.7% | | | | | | | | |
| Ashland, Inc. | | | | | | 92,500 | | $ 6,037,475 |
| FMC Corp. (a) | | | | | | 300 | | 18,243 |
| | | | | | | | | 6,055,718 |
| Fertilizers & Agricultural Chemicals – 1.1% | | | | | | | | |
| CF Industries Holdings, Inc. | | | | | | 227,700 | | 4,012,074 |
| Mosaic Co. (a) | | | | | | 107,800 | | 1,714,020 |
| Potash Corp. of Saskatchewan | | | | | | 45,900 | | 4,403,152 |
| | | | | | | | | 10,129,246 |
| Specialty Chemicals – 0.2% | | | | | | | | |
| Tokuyama Corp. | | | | | | 117,000 | | 1,740,072 |
| TOTAL CHEMICALS | | | | | | | | 17,925,036 |
| |
| COMMERCIAL SERVICES & SUPPLIES – 0.5% | | | | | | | | |
| Environmental & Facility Services – 0.1% | | | | | | | | |
| Team, Inc. (a) | | | | | | 32,500 | | 962,000 |
| Human Resource & Employment Services – 0.4% | | | | | | | | |
| Brunel International NV | | | | | | 66,200 | | 1,838,767 |
| CDI Corp. | | | | | | 66,000 | | 1,616,340 |
| | | | | | | | | 3,455,107 |
| |
| TOTAL COMMERCIAL SERVICES & SUPPLIES | | | | | | | | 4,417,107 |
| |
| CONSTRUCTION & ENGINEERING – 3.2% | | | | | | | | |
| Construction & Engineering – 3.2% | | | | | | | | |
| Chicago Bridge & Iron Co. NV (NY Shares) | | | | | | 332,800 | | 8,143,616 |
| Fluor Corp. | | | | | | 44,800 | | 3,866,240 |
| McDermott International, Inc. (a) | | | | | | 161,700 | | 8,335,635 |
| Shaw Group, Inc. (a) | | | | | | 143,129 | | 4,773,352 |
| SNC-Lavalin Group, Inc. | | | | | | 32,600 | | 2,715,256 |
| | | | | | | | | 27,834,099 |
| |
| CONTAINERS & PACKAGING – 0.4% | | | | | | | | |
| Metal & Glass Containers – 0.4% | | | | | | | | |
| Owens-Illinois, Inc. (a) | | | | | | 177,400 | | 3,324,476 |
| ELECTRIC UTILITIES – 0.5% | | | | | | | | |
| Electric Utilities – 0.5% | | | | | | | | |
| E.ON AG | | | | | | 42,100 | | 4,678,152 |
| ELECTRICAL EQUIPMENT – 1.2% | | | | | | | | |
| Electrical Components & Equipment – 0.2% | | | | | | | | |
| Suntech Power Holdings Co. Ltd. sponsored ADR | | | | | | 46,700 | | 1,754,052 |
| Heavy Electrical Equipment – 1.0% | | | | | | | | |
| ABB Ltd. sponsored ADR (a) | | | | | | 223,200 | | 2,689,560 |
| Areva (investment certificates)(non-vtg.) | | | | | | 100 | | 63,837 |
| Vestas Wind Systems AS (a)(d) | | | | | | 313,800 | | 6,579,851 |
| | | | | | | | | 9,333,248 |
| |
| TOTAL ELECTRICAL EQUIPMENT | | | | | | | | 11,087,300 |
See accompanying notes which are an integral part of the financial statements.
Annual Report 48
| | | Shares | | Value (Note 1) |
| |
| ELECTRONIC EQUIPMENT & INSTRUMENTS – 0.2% | | | | |
| Electronic Equipment & Instruments – 0.2% | | | | |
| Itron, Inc. (a) | | 34,400 | | $ 2,045,424 |
| ENERGY EQUIPMENT & SERVICES – 29.3% | | | | |
| Oil & Gas Drilling – 8.9% | | | | |
| Cathedral Energy Services Income Trust | | 135,600 | | 1,303,307 |
| Diamond Offshore Drilling, Inc. | | 135,300 | | 10,470,867 |
| ENSCO International, Inc. | | 1,800 | | 80,442 |
| GlobalSantaFe Corp. | | 695,700 | | 38,500,036 |
| Nabors Industries Ltd. (a) | | 1,300 | | 85,735 |
| Noble Corp. | | 80,300 | | 5,934,973 |
| Patterson-UTI Energy, Inc. | | 3,200 | | 88,160 |
| Pride International, Inc. (a) | | 395,400 | | 12,245,538 |
| Rowan Companies, Inc. | | 1,000 | | 40,250 |
| Stoneham Drilling Trust (d) | | 64,700 | | 1,409,431 |
| TODCO Class A | | 1,400 | | 46,928 |
| Transocean, Inc. (a) | | 114,400 | | 8,486,192 |
| | | | | 78,691,859 |
| Oil & Gas Equipment & Services – 20.4% | | | | |
| Baker Hughes, Inc. | | 211,590 | | 14,381,772 |
| Basic Energy Services, Inc. | | 6,300 | | 145,341 |
| BJ Services Co. | | 442,100 | | 13,842,151 |
| Cooper Cameron Corp. (a) | | 3,000 | | 121,500 |
| Core Laboratories NV (a) | | 74,100 | | 3,397,485 |
| Dawson Geophysical Co. (a) | | 88,500 | | 2,360,295 |
| FMC Technologies, Inc. (a) | | 2,300 | | 107,916 |
| Global Industries Ltd. (a) | | 4,900 | | 62,279 |
| Grant Prideco, Inc. (a) | | 2,400 | | 97,128 |
| Halliburton Co. | | 539,200 | | 36,665,600 |
| Hydril Co. (a) | | 28,700 | | 1,932,658 |
| Maverick Tube Corp. (a) | | 2,400 | | 111,672 |
| NATCO Group, Inc. Class A (a) | | 43,900 | | 1,087,842 |
| National Oilwell Varco, Inc. (a) | | 558,011 | | 33,971,710 |
| Oil States International, Inc. (a) | | 4,400 | | 151,932 |
| RPC, Inc. | | 3,550 | | 75,225 |
| Saipem Spa | | 4,500 | | 95,439 |
| Savanna Energy Services Corp. (a) | | 134,100 | | 2,938,952 |
| Schlumberger Ltd. (NY Shares) | | 251,026 | | 28,867,990 |
| Smith International, Inc. | | 700,900 | | 27,145,857 |
| Technip-Coflexip SA sponsored ADR | | 28,900 | | 1,741,514 |
| Veritas DGC, Inc. (a) | | 125,200 | | 5,274,676 |
| Weatherford International Ltd. (a) | | 106,990 | | 4,613,409 |
| | | | | 179,190,343 |
| |
| TOTAL ENERGY EQUIPMENT & SERVICES | | | | 257,882,202 |
| |
| FOOD PRODUCTS – 0.2% | | | | |
| Agricultural Products – 0.2% | | | | |
| Archer-Daniels-Midland Co. | | 68,400 | | 2,169,648 |
| Global Bio-Chem Technology Group Co. Ltd. | | 78,700 | | 44,636 |
| | | | | 2,214,284 |
See accompanying notes which are an integral part of the financial statements.
49 Annual Report
| Natural Resources Portfolio | | | | |
| Investments - continued | | | | |
| |
| |
| Common Stocks – continued | | | | |
| | | Shares | | Value (Note 1) |
| |
| GAS UTILITIES – 0.0% | | | | |
| Gas Utilities – 0.0% | | | | |
| Questar Corp. | | 900 | | $ 65,925 |
| INDEPENDENT POWER PRODUCERS & ENERGY TRADERS – 1.8% | | | | |
| Independent Power & Energy Trade – 1.8% | | | | |
| AES Corp. (a) | | 116,600 | | 2,017,180 |
| Mirant Corp. (a)(d) | | 250,500 | | 6,162,300 |
| NRG Energy, Inc. (a) | | 87,900 | | 3,801,675 |
| TXU Corp. | | 72,800 | | 3,813,992 |
| | | | | 15,795,147 |
| |
| INSURANCE – 0.3% | | | | |
| Property & Casualty Insurance – 0.3% | | | | |
| Covanta Holding Corp. (a) | | 113,300 | | 1,965,755 |
| Navigators Group, Inc. (a) | | 7,900 | | 370,510 |
| | | | | 2,336,265 |
| |
| IT SERVICES – 0.2% | | | | |
| IT Consulting & Other Services – 0.2% | | | | |
| Telvent GIT SA (a) | | 149,200 | | 1,954,311 |
| MACHINERY – 3.7% | | | | |
| Construction & Farm Machinery & Heavy Trucks – 3.7% | | | | |
| AGCO Corp. (a) | | 46,300 | | 905,165 |
| Bucyrus International, Inc. Class A | | 224,070 | | 14,111,929 |
| Hanjin Heavy Industries & Construction Co. Ltd. | | 82,950 | | 2,082,600 |
| Hyundai Mipo Dockyard Co. Ltd. | | 57,120 | | 4,547,128 |
| Joy Global, Inc. | | 209,150 | | 10,783,774 |
| | | | | 32,430,596 |
| |
| MARINE – 0.7% | | | | |
| Marine – 0.7% | | | | |
| Camillo Eitzen & Co. ASA | | 117,100 | | 1,253,868 |
| Odfjell ASA (A Shares) | | 176,200 | | 3,159,718 |
| Stolt-Nielsen SA | | 48,000 | | 1,501,000 |
| | | | | 5,914,586 |
| |
| METALS & MINING – 16.5% | | | | |
| Aluminum – 3.2% | | | | |
| Alcan, Inc. | | 900 | | 39,291 |
| Alcoa, Inc. | | 898,300 | | 26,338,156 |
| Alumina Ltd. sponsored ADR | | 100,300 | | 2,057,153 |
| Century Aluminum Co. (a) | | 1,900 | | 67,621 |
| | | | | 28,502,221 |
| Diversified Metals & Mining – 4.5% | | | | |
| BHP Billiton PLC | | 116,300 | | 1,958,473 |
| Birch Mountain Resources Ltd. (a) | | 280,400 | | 1,888,008 |
| Breakwater Resources Ltd. (a) | | 1,270,500 | | 1,107,068 |
| Falconbridge Ltd. (d) | | 76,700 | | 2,480,944 |
| Freeport-McMoRan Copper & Gold, Inc. Class B | | 1,363 | | 69,009 |
| Grupo Mexico SA de CV Series B | | 770,608 | | 1,975,607 |
| Phelps Dodge Corp. | | 600 | | 82,800 |
See accompanying notes which are an integral part of the financial statements.
Annual Report 50
| | | Shares | | Value (Note 1) |
| Rio Tinto PLC sponsored ADR | | 19,800 | | $ 3,735,072 |
| RTI International Metals, Inc. (a) | | 82,200 | | 3,456,510 |
| Teck Cominco Ltd. Class B (sub. vtg.) | | 156,200 | | 9,768,085 |
| Titanium Metals Corp. (a)(d) | | 248,400 | | 10,189,368 |
| VSMPO-AVISMA Corp. warrants (UBS Warrant Programme) 10/28/06 (a) | | 5,900 | | 1,299,770 |
| Xstrata PLC | | 62,700 | | 1,831,254 |
| | | | | 39,841,968 |
| Gold – 4.4% | | | | |
| Bema Gold Corp. (a) | | 591,600 | | 2,447,318 |
| Eldorado Gold Corp. (a) | | 1,036,400 | | 4,442,431 |
| Meridian Gold, Inc. (a) | | 236,300 | | 5,969,115 |
| Newmont Mining Corp. | | 481,600 | | 25,486,272 |
| | | | | 38,345,136 |
| Precious Metals & Minerals – 1.9% | | | | |
| Apex Silver Mines Ltd. (a)(d) | | 434,800 | | 10,048,228 |
| Coeur d’Alene Mines Corp. (a) | | 175,819 | | 974,037 |
| Industrias Penoles SA de CV | | 423,700 | | 2,702,242 |
| Stillwater Mining Co. (a) | | 212,300 | | 2,762,023 |
| | | | | 16,486,530 |
| Steel – 2.5% | | | | |
| Allegheny Technologies, Inc. | | 98,600 | | 4,980,286 |
| Carpenter Technology Corp. | | 10,500 | | 877,695 |
| Companhia Vale do Rio Doce sponsored ADR | | 1,800 | | 83,574 |
| Hitachi Metals Ltd. | | 27,000 | | 285,412 |
| Oregon Steel Mills, Inc. (a) | | 266,000 | | 10,076,080 |
| United States Steel Corp. | | 31,500 | | 1,716,750 |
| Usinas Siderurgicas de Minas Gerais SA (Usiminas) (PN-A) | | 118,100 | | 3,823,415 |
| | | | | 21,843,212 |
| |
| TOTAL METALS & MINING | | | | 145,019,067 |
| |
| OIL, GAS & CONSUMABLE FUELS – 36.9% | | | | |
| Coal & Consumable Fuels – 5.2% | | | | |
| Arch Coal, Inc. | | 84,400 | | 6,170,484 |
| Cameco Corp. | | 213,000 | | 7,920,829 |
| China Shenhua Energy Co. Ltd. | | | | |
| (H Shares) | | 1,758,500 | | 2,674,732 |
| CONSOL Energy, Inc. | | 183,200 | | 11,728,464 |
| Peabody Energy Corp. | | 348,600 | | 16,826,922 |
| UrAsia Energy Ltd. (a) | | 176,200 | | 437,340 |
| USEC, Inc. | | 1,600 | | 19,904 |
| | | | | 45,778,675 |
| Integrated Oil & Gas – 9.9% | | | | |
| Amerada Hess Corp. | | 68,800 | | 9,515,728 |
| BG Group PLC sponsored ADR | | 173,900 | | 10,227,059 |
| BP PLC sponsored ADR | | 1,064 | | 70,671 |
| Chevron Corp. | | 162,232 | | 9,162,863 |
| ConocoPhillips | | 381,464 | | 23,254,045 |
| ENI Spa sponsored ADR | | 500 | | 28,635 |
| Exxon Mobil Corp. | | 36,196 | | 2,148,957 |
See accompanying notes which are an integral part of the financial statements.
|
51 Annual Report
51
| Natural Resources Portfolio | | | | |
| Investments - continued | | | | |
| |
| |
| Common Stocks – continued | | | | |
| | | Shares | | Value (Note 1) |
| |
| OIL, GAS & CONSUMABLE FUELS – CONTINUED | | | | |
| Integrated Oil & Gas – continued | | | | |
| MOL Magyar Olay-es Gazipari RT Series A (For. Reg.) | | 600 | | $ 62,126 |
| OAO Gazprom sponsored ADR | | 60,783 | | 5,166,555 |
| Occidental Petroleum Corp. | | 198,300 | | 18,152,382 |
| OMV AG | | 91,935 | | 5,704,457 |
| Total SA sponsored ADR | | 31,278 | | 3,945,094 |
| | | | | 87,438,572 |
| Oil & Gas Exploration & Production – 15.3% | | | | |
| Abraxas Petroleum Corp. (a) | | 136,700 | | 777,823 |
| Anadarko Petroleum Corp | | 900 | | 89,244 |
| Apache Corp. | | 800 | | 53,536 |
| Blackrock Ventures, Inc. (a) | | 118,500 | | 1,245,337 |
| Burlington Resources, Inc. | | 84,700 | | 7,638,246 |
| Cabot Oil & Gas Corp. | | 88,700 | | 4,014,562 |
| Callon Petroleum Co. (a) | | 52,000 | | 919,360 |
| Canadian Natural Resources Ltd. | | 261,900 | | 14,312,697 |
| Cano Petroleum, Inc. (a) | | 91,900 | | 760,932 |
| Chesapeake Energy Corp. | | 489,200 | | 14,524,348 |
| Comstock Resources, Inc. (a) | | 1,300 | | 36,530 |
| Denbury Resources, Inc. (a) | | 2,300 | | 65,205 |
| Devon Energy Corp. | | 800 | | 46,904 |
| EnCana Corp. | | 1,784 | | 73,800 |
| Energy Partners Ltd. (a) | | 91,100 | | 2,094,389 |
| EOG Resources, Inc. | | 1,300 | | 87,620 |
| EXCO Resources, Inc. | | 3,600 | | 46,080 |
| Forest Oil Corp. (a) | | 103,700 | | 5,148,705 |
| Gastar Exploration Ltd. (a) | | 294,600 | | 1,278,333 |
| Goodrich Petroleum Corp. (a) | | 4,300 | | 103,974 |
| Houston Exploration Co. (a) | | 105,800 | | 6,119,472 |
| Kerr-McGee Corp. | | 1,200 | | 117,240 |
| Newfield Exploration Co. (a) | | 1,800 | | 69,570 |
| Nexen, Inc. | | 81,800 | | 4,278,094 |
| Norsk Hydro ASA sponsored ADR | | 18,900 | | 2,206,575 |
| Penn West Energy Trust | | 63,200 | | 2,176,663 |
| Pioneer Natural Resources Co. | | 1,600 | | 67,344 |
| Plains Exploration & Production Co. (a) | | 223,300 | | 9,099,475 |
| Pogo Producing Co. | | 1,300 | | 64,818 |
| Quicksilver Resources, Inc. (a) | | 139,050 | | 5,050,296 |
| Range Resources Corp. | | 436,000 | | 10,433,480 |
| Sasol Ltd. sponsored ADR | | 17,600 | | 605,440 |
| Southwestern Energy Co. (a) | | 1,800 | | 57,762 |
| Talisman Energy, Inc. | | 239,900 | | 12,607,868 |
| Ultra Petroleum Corp. (a) | | 219,300 | | 11,412,372 |
| UTS Energy Corp. (a) | | 828,500 | | 4,856,586 |
| XTO Energy, Inc. | | 300,000 | | 12,567,000 |
| | | | | 135,107,680 |
| Oil & Gas Refining & Marketing – 5.6% | | | | |
| ERG Spa | | 3,400 | | 80,062 |
| Frontier Oil Corp. | | 124,700 | | 5,767,375 |
| Holly Corp. | | 52,300 | | 3,122,310 |
See accompanying notes which are an integral part of the financial statements.
Annual Report 52
| | | Shares | | Value (Note 1) |
| Neste Oil Oyj | | 92,900 | | $ 2,845,067 |
| Polski Koncern Naftowy Orlen SA | | 131,200 | | 2,417,995 |
| Sunoco, Inc. | | 124,000 | | 9,188,400 |
| Tesoro Corp. | | 47,000 | | 2,839,270 |
| Valero Energy Corp. | | 411,888 | | 22,155,456 |
| Western Refining, Inc. | | 5,800 | | 94,192 |
| World Fuel Services Corp. | | 9,300 | | 281,790 |
| | | | | 48,791,917 |
| Oil & Gas Storage & Transport – 0.9% | | | | |
| El Paso Corp. | | 6,500 | | 85,020 |
| OMI Corp. | | 271,000 | | 4,742,500 |
| Overseas Shipholding Group, Inc. | | 62,800 | | 3,175,796 |
| Williams Companies, Inc. | | 3,900 | | 84,123 |
| | | | | 8,087,439 |
| |
| TOTAL OIL, GAS & CONSUMABLE FUELS | | | | 325,204,283 |
| |
| PAPER & FOREST PRODUCTS – 1.2% | | | | |
| Forest Products – 1.2% | | | | |
| Canfor Corp. (a) | | 341 | | 4,052 |
| Sino-Forest Corp. (a) | | 630,600 | | 3,463,402 |
| Weyerhaeuser Co. | | 100,100 | | 6,835,829 |
| | | | | 10,303,283 |
| |
| ROAD & RAIL – 0.4% | | | | |
| Railroads – 0.4% | | | | |
| Burlington Northern Santa Fe Corp. | | 42,000 | | 3,302,880 |
| SEMICONDUCTORS & SEMICONDUCTOR EQUIPMENT – 0.2% | | | | |
| Semiconductors – 0.2% | | | | |
| Q-Cells AG | | 21,600 | | 2,194,103 |
| TRADING COMPANIES & DISTRIBUTORS – 0.3% | | | | |
| Trading Companies & Distributors – 0.3% | | | | |
| UAP Holding Corp. | | 116,562 | | 2,536,389 |
| TOTAL COMMON STOCKS | | | | |
| (Cost $727,462,621) | | | | 878,464,915 |
| |
| Money Market Funds — 4.8% | | | | |
| |
| |
| Fidelity Cash Central Fund, 4.57% (b) | | 12,127,765 | | 12,127,765 |
| Fidelity Securities Lending Cash Central Fund, 4.58% (b)(c) | | 30,046,380 | | 30,046,380 |
| TOTAL MONEY MARKET FUNDS | | | | |
| (Cost $42,174,145) | | | | 42,174,145 |
| |
| TOTAL INVESTMENT PORTFOLIO - 104.5% | | | | |
| (Cost $769,636,766) | | | | 920,639,060 |
| |
| NET OTHER ASSETS – (4.5)% | | | | (39,799,521) |
| NET ASSETS – 100% | | $ | | 880,839,539 |
See accompanying notes which are an integral part of the financial statements.
|
53 Annual Report
53
Natural Resources Portfolio
Investments - continued
|
| (a) | Non-income producing |
| |
| (b) | Affiliated fund that is available only to investment companies and other accounts managed by Fidelity Investments. The rate quoted is the annualized seven-day yield of the fund at period end. A complete unaudited listing of the fund’s holdings as of its most recent quarter end is available upon request. |
| |
| (c) | Investment made with cash collateral received from securities on loan. |
| |
| (d) | Security or a portion of the security is on loan at period end. |
| |
Information regarding fiscal year to date income earned by the fund from the affiliated Central funds is as follows:
| Fund | | Income earned |
| Fidelity Cash Central Fund | | $ 484,777 |
| Fidelity Securities Lending Cash Central Fund | | 113,400 |
| Total | | $ 598,177 |
Distribution of investments by country of issue, as a percentage of total net assets, is as follows:
| United States of America | | 65.3% |
| Canada | | 11.8% |
| Cayman Islands | | 6.5% |
| Netherlands Antilles | | 3.3% |
| United Kingdom | | 2.0% |
| Netherlands | | 1.5% |
| Panama | | 1.0% |
| Others (individually less than 1%) | | 8.6% |
| | | 100.0% |
See accompanying notes which are an integral part of the financial statements.
Annual Report 54
| Natural Resources Portfolio | | | | | | | | |
| |
| Financial Statements | | | | | | | | |
| |
| |
| Statement of Assets and Liabilities | | | | | | | | |
| | | | | | | | | February 28, 2006 |
| |
| Assets | | | | | | | | |
| Investment in securities, at value (including securities loaned of $28,736,391) — See accompanying schedule: | | | | | | | | |
| Unaffiliated issuers (cost $727,462,621) | | $ | | 878,464,915 | | | | |
| Affiliated Central Funds (cost $42,174,145) | | | | 42,174,145 | | | | |
| Total Investments (cost $769,636,766) | | | | | | $ | | 920,639,060 |
| Foreign currency held at value (cost $178,133) | | | | | | | | 178,133 |
| Receivable for investments sold | | | | | | | | 10,765,674 |
| Receivable for fund shares sold | | | | | | | | 4,545,404 |
| Dividends receivable | | | | | | | | 955,020 |
| Interest receivable | | | | | | | | 63,729 |
| Prepaid expenses | | | | | | | | 1,675 |
| Other affiliated receivables | | | | | | | | 7,244 |
| Other receivables | | | | | | | | 91,142 |
| Total assets | | | | | | | | 937,247,081 |
| |
| Liabilities | | | | | | | | |
| Payable for investments purchased | | $ | | 16,255,481 | | | | |
| Payable for fund shares redeemed | | | | 9,376,989 | | | | |
| Accrued management fee | | | | 426,867 | | | | |
| Other affiliated payables | | | | 241,001 | | | | |
| Other payables and accrued expenses | | | | 60,824 | | | | |
| Collateral on securities loaned, at value | | | | 30,046,380 | | | | |
| Total liabilities | | | | | | | | 56,407,542 |
| |
| Net Assets | | | | | | $ | | 880,839,539 |
| Net Assets consist of: | | | | | | | | |
| Paid in capital | | | | | | $ | | 704,663,758 |
| Undistributed net investment income | | | | | | | | 367,985 |
| Accumulated undistributed net realized gain (loss) on investments and foreign currency transactions | | | | | | | | 24,800,425 |
| Net unrealized appreciation (depreciation) on investments and assets and liabilities in foreign currencies | | | | | | | | 151,007,371 |
| Net Assets, for 34,051,917 shares outstanding | | | | | | $ | | 880,839,539 |
| Net Asset Value, offering price and redemption price per share ($880,839,539 ÷ 34,051,917 shares) | | | | | | $ | | 25.87 |
| |
| Statement of Operations | | | | | | | | |
| | | | | | | | | Year ended February 28, 2006 |
| |
| Investment Income | | | | | | | | |
| Dividends | | | | | | $ | | 5,498,461 |
| Interest | | | | | | | | 2,124 |
| Income from affiliated Central Funds (including $113,400 from security lending) | | | | | | | | 598,177 |
| Total income | | | | | | | | 6,098,762 |
| |
| Expenses | | | | | | | | |
| Management fee | | $ | | 3,091,282 | | | | |
| Transfer agent fees | | | | 1,737,744 | | | | |
| Accounting and security lending fees | | | | | | | | |
| | | | | 257,635 | | | | |
| Independent trustees’ compensation | | | | 2,051 | | | | |
| Custodian fees and expenses | | | | 89,263 | | | | |
| Registration fees | | | | 115,518 | | | | |
| Audit | | | | 35,992 | | | | |
| Legal | | | | 2,205 | | | | |
| Interest | | | | 980 | | | | |
| Miscellaneous | | | | 3,087 | | | | |
| Total expenses before reductions | | | | 5,335,757 | | | | |
| Expense reductions | | | | (343,758) | | | | 4,991,999 |
| |
| Net investment income (loss) | | | | | | | | 1,106,763 |
See accompanying notes which are an integral part of the financial statements.
55 Annual Report
| Natural Resources Portfolio | | | | |
| Financial Statements - continued | | | | |
| |
| |
| Realized and Unrealized Gain (Loss) | | | | |
| Net realized gain (loss) on: | | | | |
| Investment securities: | | | | |
| Unaffiliated issuers | | 43,592,493 | | |
| Foreign currency transactions | | (72,340) | | |
| Total net realized gain (loss) | | | | 43,520,153 |
| Change in net unrealized appreciation (depreciation) on: | | | | |
| Investment securities | | 95,730,566 | | |
| Assets and liabilities in foreign currencies | | 1,345 | | |
| Total change in net unrealized appreciation (depreciation) | | | | 95,731,911 |
| Net gain (loss) | | | | 139,252,064 |
| Net increase (decrease) in net assets resulting from operations | | | | $140,358,827 |
See accompanying notes which are an integral part of the financial statements.
Annual Report 56
| Statement of Changes in Net Assets | | | | | | | | | | | | | | | | | | | | | | |
| | | | | | | | | | | | | | | Year ended | | | | Year ended |
| | | | | | | | | | | | | | | February 28, | | | | February 28, |
| | | | | | | | | | | | | | | 2006 | | | | 2005 |
| Increase (Decrease) in Net Assets | | | | | | | | | | | | | | | | | | | | | | |
| Operations | | | | | | | | | | | | | | | | | | | | | | |
| Net investment income (loss) | | | | | | | | | | | | $ | | | | 1,106,763 | | $ | | | | 779,445 |
| Net realized gain (loss) | | | | | | | | | | | | | | 43,520,153 | | | | 9,784,555 |
| Change in net unrealized appreciation (depreciation) | | | | | | | | | | | | | | 95,731,911 | | | | 45,867,954 |
| Net increase (decrease) in net assets resulting from operations | | | | | | | | | | | | | | 140,358,827 | | | | 56,431,954 |
| Distributions to shareholders from net investment income | | | | | | | | | | | | | | | | (980,210) | | | | | | (635,882) |
| Distributions to shareholders from net realized gain | | | | | | | | | | | | | | (22,978,849) | | | | (2,792,186) |
| Total distributions | | | | | | | | | | | | | | (23,959,059) | | | | (3,428,068) |
| Share transactions | | | | | | | | | | | | | | | | | | | | | | |
| Proceeds from sales of shares | | | | | | | | | | | | | | 885,245,672 | | | | 304,667,076 |
| Reinvestment of distributions | | | | | | | | | | | | | | 23,245,108 | | | | 3,297,926 |
| Cost of shares redeemed | | | | | | | | | | | | | | (453,189,533) | | | | (129,149,815) |
| Net increase (decrease) in net assets resulting from share transactions | | | | | | | | | | | | 455,301,247 | | | | 178,815,187 |
| Redemption fees | | | | | | | | | | | | | | | | 443,375 | | | | | | 98,410 |
| Total increase (decrease) in net assets | | | | | | | | | | | | | | 572,144,390 | | | | 231,917,483 |
| |
| Net Assets | | | | | | | | | | | | | | | | | | | | | | |
| Beginning of period | | | | | | | | | | | | | | 308,695,149 | | | | 76,777,666 |
| End of period (including undistributed net investment income of $367,985 and undistributed net investment income of | | | | | | | | | | |
| $265,156, respectively) | | �� | | | | | | | | | | $ | | 880,839,539 | | $ | | 308,695,149 |
| |
| Other Information | | | | | | | | | | | | | | | | | | | | | | |
| Shares | | | | | | | | | | | | | | | | | | | | | | |
| Sold | | | | | | | | | | | | | | 37,984,838 | | | | 18,022,560 |
| Issued in reinvestment of distributions | | | | | | | | | | | | | | | | 995,604 | | | | | | 195,626 |
| Redeemed | | | | | | | | | | | | | | (20,310,503) | | | | (7,987,419) |
| Net increase (decrease) | | | | | | | | | | | | | | 18,669,939 | | | | 10,230,767 |
| |
| Financial Highlights | | | | | | | | | | | | | | | | | | | | | | |
| Years ended February 28, | | | | 2006 | | | | 2005 | | | | 2004E | | | | 2003 | | | | 2002 |
| Selected Per-Share Data | | | | | | | | | | | | | | | | | | | | | | |
| Net asset value, beginning of period | | $ | | 20.07 | | $ | | 14.90 | | $ | | 11.04 | | $ | | 12.78 | | | | $ | | 14.11 |
| Income from Investment Operations | | | | | | | | | | | | | | | | | | | | | | |
| Net investment income (loss)C | | | | 05 | | | | .09 | | | | .03 | | | | —F | | | | | | .05 |
| Net realized and unrealized gain (loss) | | | | 6.72 | | | | 5.42 | | | | 3.82 | | | | (1.73) | | | | | | (.98) |
| Total from investment operations | | | | 6.77 | | | | 5.51 | | | | 3.85 | | | | (1.73) | | | | | | (.93) |
| Distributions from net investment income | | | | (.04) | | | | (.07) | | | | — | | | | (.02) | | | | | | (.01) |
| Distributions from net realized gain | | | | (.95) | | | | (.28) | | | | — | | | | — | | | | | | (.40) |
| Total distributions | | | | (.99) | | | | (.35) | | | | — | | | | (.02) | | | | | | (.41) |
| Redemption fees added to paid in capitalC | | | | 02 | | | | .01 | | | | .01 | | | | .01 | | | | | | .01 |
| Net asset value, end of period | | $ | | 25.87 | | $ | | 20.07 | | $ | | 14.90 | | $ | | 11.04 | | | | $ | | 12.78 |
| Total ReturnA,B | | | | 34.50% | | | | 37.51% | | | | 34.96% | | | | (13.48)% | | | | | | (6.73)% |
| Ratios to Average Net AssetsD | | | | | | | | | | | | | | | | | | | | | | |
| Expenses before reductions | | | | 99% | | | | 1.04% | | | | 1.59% | | | | 1.75% | | | | | | 1.61% |
| Expenses net of fee waivers, if any | | | | 99% | | | | 1.04% | | | | 1.59% | | | | 1.75% | | | | | | 1.61% |
| Expenses net of all reductions | | | | 93% | | | | 1.00% | | | | 1.59% | | | | 1.72% | | | | | | 1.56% |
| Net investment income (loss) | | | | 21% | | | | .55% | | | | .24% | | | | .01% | | | | | | .36% |
| Supplemental Data | | | | | | | | | | | | | | | | | | | | | | |
| Net assets, end of period (000 omitted) | | $ 880,840 | | $ 308,695 | | $ | | 76,778 | | $ | | 27,198 | | | | $ 27,962 |
| Portfolio turnover rate | | | | 119% | | | | 101% | | | | 32% | | | | 70% | | | | | | 115% |
| |
| | | | | |
A Total returns would have been lower had certain expenses not been reduced during the periods shown. B Total returns do not include the effect of the former sales charges.C Calculated based on average shares outstanding during the period. DExpense ratios reflect operating expenses of the fund. Expenses before reductions do not reflect amounts reimbursed by the investment adviser or reductions from brokerage service arrangements or other expense offset arrangements and do not represent the amount paid by the fund during periods when reimbursements or reductions occur. Expenses net of fee waivers reflect expenses after reimbursement by the investment adviser but prior to reductions from brokerage service arrangements or other expense offset arrangements. Expenses net of all reductions represent the net expenses paid by the fund. EFor the year ended February 29. FAmount represents less than $.01 per share.See accompanying notes which are an integral part of the financial statements.
57 Annual Report
Paper and Forest Products Portfolio
Performance
Average annual total return reflects the change in the value of an investment, assuming reinvestment of the fund’s dividend income and capital gains (the profits earned upon the sale of securities that have grown in value) and assuming a constant rate of performance each year. The $10,000 table and the fund’s returns do not reflect the deduction of taxes that a shareholder would pay on fund distributions or the redemption of fund shares. During periods of reimbursement by Fidelity, a fund’s total returns will be greater than it would be had the reimbursement not occurred. How a fund did yesterday is no guarantee of how it will do tomorrow.
| Average Annual Total Returns | | | | | | |
| Periods ended February 28, 2006 | | Past 1 | | Past 5 | | Past 10 |
| | | year | | years | | years |
| Select Paper and Forest Products | | --2.77% | | 4.44% | | 6.06% |
$10,000 Over 10 Years
Let’s say hypothetically that $10,000 was invested in Fidelity Select Paper and Forest Products Portfolio on February 29, 1996. The chart shows how the value of your investment would have changed, and also shows how the S&P 500 Index performed over the same period.
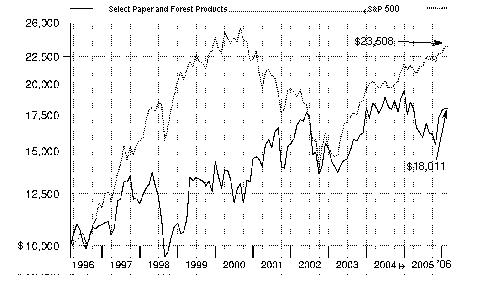
Annual Report 58
Paper and Forest Products Portfolio
|
Management’s Discussion of Fund Performance
Comments from Anmol Mehra, who managed Fidelity® Select Paper and Forest Products Portfolio during the period covered by this report
With the exception of several popular large-cap stock performance measures, most major U.S. equity benchmarks had double-digit returns for the year ending February 28, 2006. For much of the period, market gains were driven largely by the energy sector, although utilities ultimately sneaked into the top spot for the year overall. Financials and telecommunication services also reached double figures, outperforming the 8.40% return of the broader market as measured by the large-cap-oriented Standard & Poor’s 500SM Index. The consumer discretionary segment — home to the weak performing automobile and media industries — was the biggest disappointment. Although the overall return for the S&P 500® beat the small-cap Russell 2000® Index in calendar year 2005 — the first time that’s happened in six years — small-caps stormed back in early 2006, leading to a 16.59% advance during the past 12 months, nearly twice the broader market’s gain. Mid-caps soared even higher, returning 17.67% according to the Russell Midcap® Index. The technology-heavy NASDAQ Composite® Index also fared well, climbing 12.13%, but the Dow Jones Industrial AverageSM, an index of 30 large-cap, blue-chip stocks, managed to rise only 4.52% .
During the past year, the fund returned -2.77%, trailing the S&P 500 and also the 23.71% gain of the energy-heavy Goldman Sachs® Natural Resources Index. A very weak first half resulted in disappointing results for the period overall. The fund suffered mainly because of its focus on the paper packaging, paper products and forest products segments, which were some of the weakest groups in the Goldman Sachs index. The fund’s largest holding at period end also was its biggest detractor — Smurfit-Stone Container, a containerboard manufacturer. High energy costs and other expenses curbed the company’s earnings growth, leading to a double-digit loss in its stock price. Packaging Corp. of America, a competitor of Smurfit-Stone, encountered similar difficulties, although a relatively strong balance sheet limited the stock’s decline. Newsprint maker Bowater also wrestled with high fuel costs while suffering from electronic substitution due to the Internet. Paper and forest products giant International Paper was another big detractor, and I reduced the position considerably. On the positive side, forest products company Georgia-Pacific was a strong contributor, as it received a private buyout offer at approximately a 40% premium to where the stock had been trading. Rayonier, a real estate investment trust with a focus on timberland management and development, as well as the sale of wood products, benefited from investors’ strong interest in real estate plays.
Note to shareholders: Christopher Bartel and Justin Bennett were named Co-managers of the fund on March 1, 2006.
The views expressed above reflect those of the portfolio manager(s) only through the end of the period as stated on the cover of this report and do not necessarily represent the views of Fidelity or any other person in the Fidelity organization. Any such views are subject to change at any time based upon market or other conditions and Fidelity disclaims any responsibility to update such views. These views may not be relied on as investment advice and, because investment decisions for a Fidelity fund are based on numerous factors, may not be relied on as an indication of trading intent on behalf of any Fidelity fund.
59 59 Annual Report
Paper and Forest Products Portfolio
Investment Changes
Top Ten Stocks as of February 28, 2006
| | | % of fund’s | | % of fund’s net assets |
| | | net assets | | 6 months ago |
| Smurfit-Stone Container Corp. | | 8.5 | | 10.1 |
| Weyerhaeuser Co. | | 6.6 | | 5.6 |
| Packaging Corp. of America | | 6.4 | | 5.7 |
| Louisiana-Pacific Corp. | | 5.6 | | 2.5 |
| Rayonier, Inc. | | 5.5 | | 3.1 |
| Temple-Inland, Inc. | | 5.4 | | 5.4 |
| Bemis Co., Inc. | | 5.0 | | 2.5 |
| Plum Creek Timber Co., Inc. | | 4.6 | | 3.2 |
| Sealed Air Corp. | | 4.5 | | 4.1 |
| Sonoco Products Co. | | 4.1 | | 3.2 |
| | | 56.2 | | |
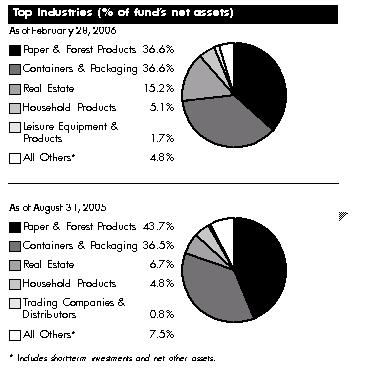
| Paper and Forest Products Portfolio | | | | | | | | |
| Investments February 28, 2006 | | | | |
| Showing Percentage of Net Assets | | | | | | | | |
| |
| Common Stocks — 97.1% | | | | | | | | |
| | | | | | | Shares | | Value (Note 1) |
| |
| BUILDING PRODUCTS – 0.5% | | | | | | | | |
| Building Products – 0.5% | | | | | | | | |
| Trex Co., Inc. (a)(d) | | | | | | 5,700 | | $ 148,143 |
| CONTAINERS & PACKAGING – 36.6% | | | | | | | | |
| Metal & Glass Containers – 2.5% | | | | | | | | |
| Ball Corp. | | | | | | 3,400 | | 144,840 |
| Owens-Illinois, Inc. (a) | | | | | | 14,800 | | 277,352 |
| Silgan Holdings, Inc. | | | | | | 7,700 | | 303,534 |
| | | | | | | | | 725,726 |
| Paper Packaging – 34.1% | | | | | | | | |
| Bemis Co., Inc. | | | | | | 47,300 | | 1,418,054 |
| Caraustar Industries, Inc. (a) | | | | | | 6,600 | | 67,122 |
| Nine Dragons Paper (Holdings) Ltd. | | | | | | 12,000 | | 5,259 |
| Packaging Corp. of America | | | | | | 79,800 | | 1,820,238 |
| Sealed Air Corp. | | | | | | 22,400 | | 1,274,112 |
| Smurfit-Stone Container Corp. (a) | | | | | | 186,270 | | 2,443,862 |
| Sonoco Products Co. | | | | | | 36,300 | | 1,187,736 |
| Temple-Inland, Inc. | | | | | | 36,500 | | 1,557,455 |
| | | | | | | | | 9,773,838 |
| |
| TOTAL CONTAINERS & PACKAGING | | | | | | | | 10,499,564 |
| |
| HOUSEHOLD PRODUCTS – 5.1% | | | | | | | | |
| Household Products – 5.1% | | | | | | | | |
| Kimberly-Clark Corp. | | | | | | 19,800 | | 1,171,764 |
| Procter & Gamble Co. | | | | | | 4,700 | | 281,671 |
| | | | | | | | | 1,453,435 |
| |
| LEISURE EQUIPMENT & PRODUCTS – 1.7% | | | | | | | | |
| Leisure Products – 1.7% | | | | | | | | |
| MarineMax, Inc. (a) | | | | | | 15,500 | | 478,330 |
| PAPER & FOREST PRODUCTS – 36.6% | | | | | | | | |
| Forest Products – 19.4% | | | | | | | | |
| Canfor Corp. (a) | | | | | | 97,100 | | 1,153,765 |
| Louisiana-Pacific Corp. | | | | | | 56,000 | | 1,592,080 |
| West Fraser Timber Co. Ltd. | | | | | | 25,200 | | 931,567 |
| Weyerhaeuser Co. | | | | | | 27,900 | | 1,905,291 |
| | | | | | | | | 5,582,703 |
| Paper Products – 17.2% | | | | | | | | |
| Abitibi-Consolidated, Inc. | | | | | | 91,700 | | 319,616 |
| Aracruz Celulose SA (PN-B) | | | | | | | | |
| sponsored ADR | | | | | | 6,200 | | 304,730 |
| Bowater, Inc. | | | | | | 21,300 | | 554,226 |
| Buckeye Technologies, Inc. (a) | | | | | | 24,300 | | 214,083 |
| Cascades, Inc. | | | | | | 44,300 | | 411,359 |
| Domtar, Inc. (a) | | | | | | 92,800 | | 502,328 |
| International Paper Co. | | | | | | 26,700 | | 874,959 |
| Lee & Man Paper Manufacturing Ltd. | | | | | | 54,000 | | 73,783 |
| |
| |
| | | | | | | Shares | | Value (Note 1) |
| MeadWestvaco Corp. | | | | | | 38,800 | | $ 1,079,416 |
61
See accompanying notes which are an integral part of the financial statements.
61 Annual Report
| Paper and Forest Products Portfolio | | | | |
| Investments - continued | | | | |
| |
| P.H. Glatfelter Co. | | 14,400 | | 236,736 |
| Wausau-Mosinee Paper Corp. | | 27,600 | | 358,800 |
| | | | | 4,930,036 |
| |
| TOTAL PAPER & FOREST PRODUCTS | | | | 10,512,739 |
| |
| REAL ESTATE – 15.2% | | | | |
| Real Estate Investment Trusts – 15.2% | | | | |
| Longview Fibre Co. | | 30,200 | | 568,364 |
| Plum Creek Timber Co., Inc. | | 35,600 | | 1,322,540 |
| Potlatch Corp. | | 24,500 | | 892,780 |
| Rayonier, Inc. | | 36,687 | | 1,581,210 |
| | | | | 4,364,894 |
| |
| TEXTILES, APPAREL & LUXURY GOODS – 0.3% | | | | |
| Textiles – 0.3% | | | | |
| Xerium Technologies, Inc. | | 9,300 | | 86,025 |
| TRADING COMPANIES & DISTRIBUTORS – 1.1% | | | | |
| Trading Companies & Distributors – 1.1% | | | | |
| BlueLinx Corp. | | 20,800 | | 330,304 |
| TOTAL COMMON STOCKS | | | | |
| (Cost $29,600,484) | | | | 27,873,434 |
| |
| Money Market Funds — 3.7% | | | | |
| |
| Fidelity Cash Central Fund, 4.57% (b) | | 837,533 | | 837,533 |
| Fidelity Securities Lending Cash Central Fund, 4.58% (b)(c) | | 229,500 | | 229,500 |
| TOTAL MONEY MARKET FUNDS | | | | |
| (Cost $1,067,033) | | | | 1,067,033 |
| |
| TOTAL INVESTMENT PORTFOLIO - 100.8% | | | | |
| (Cost $30,667,517) | | | | 28,940,467 |
| |
| NET OTHER ASSETS – (0.8)% | | | | (224,505) |
| NET ASSETS – 100% | | | | $28,715,962 |
(a) Non-income producing
(b) Affiliated fund that is available only to investment companies and other accounts managed by Fidelity Investments. The rate quoted is the annualized seven-day yield of the fund at period end. A complete unaudited listing of the fund’s holdings as of its most recent quarter end is available upon request.
(c) Investment made with cash collateral received from securities on loan. (d) Security or a portion of the security is on loan at period end.
See accompanying notes which are an integral part of the financial statements.
Annual Report 62
| Affiliated Central Funds | | |
| Information regarding fiscal year to date income earned by the fund from the affiliated Central funds is as follows: | | |
| Fund | | Income earned |
| Fidelity Cash Central Fund | | $ 35,899 |
| Fidelity Securities Lending Cash Central Fund | | 3,915 |
| Total | | $ 39,814 |
| Other Information | | |
| Distribution of investments by country of issue, as a percentage of total net assets, is as follows: | | |
| |
| United States of America | | 87.1% |
| Canada | | 11.5% |
| Brazil | | 1.1% |
| Others (individually less than 1%) | | 0.3% |
| | | 100.0% |
At February 28, 2006, the fund had a capital loss carryforward of approximately $4,421,794 of which $1,564,044 and $2,857,750 will expire on February 28, 2010 and 2011, respectively.
See accompanying notes which are an integral part of the financial statements.
|
63 Annual Report
63
| Paper and Forest Products Portfolio | | | | | | | | |
| |
| Financial Statements | | | | | | | | |
| |
| |
| Statement of Assets and Liabilities | | | | | | | | |
| | | | | | | | | February 28, 2006 |
| |
| Assets | | | | | | | | |
| Investment in securities, at value (including securities loaned of $148,143) — See accompanying schedule: | | | | | | | | |
| Unaffiliated issuers (cost $29,600,484) | | $ | | 27,873,434 | | | | |
| Affiliated Central Funds (cost $1,067,033) | | | | 1,067,033 | | | | |
| Total Investments (cost $30,667,517) | | | | | | $ | | 28,940,467 |
| Receivable for investments sold | | | | | | | | 77,859 |
| Receivable for fund shares sold | | | | | | | | 33,410 |
| Dividends receivable | | | | | | | | 482,336 |
| Interest receivable | | | | | | | | 1,135 |
| Prepaid expenses | | | | | | | | 82 |
| Other receivables | | | | | | | | 3,057 |
| Total assets | | | | | | | | 29,538,346 |
| |
| Liabilities | | | | | | | | |
| Payable to custodian bank | | $ | | 77,859 | | | | |
| Payable for investments purchased | | | | 169,616 | | | | |
| Payable for fund shares redeemed | | | | 287,589 | | | | |
| Accrued management fee | | | | 14,875 | | | | |
| Other affiliated payables | | | | 11,105 | | | | |
| Other payables and accrued expenses | | | | 31,840 | | | | |
| Collateral on securities loaned, at value | | | | 229,500 | | | | |
| Total liabilities | | | | | | | | 822,384 |
| |
| Net Assets | | | | | | $ | | 28,715,962 |
| Net Assets consist of: | | | | | | | | |
| Paid in capital | | | | | | $ | | 35,118,310 |
| Undistributed net investment income | | | | | | | | 448,818 |
| Accumulated undistributed net realized gain (loss) on investments and foreign currency transactions | | | | | | | | (5,123,231) |
| Net unrealized appreciation (depreciation) on investments and assets and liabilities in foreign currencies | | | | | | | | (1,727,935) |
| Net Assets, for 937,589 shares outstanding | | | | | | $ | | 28,715,962 |
| |
| Net Asset Value, offering price and redemption price per share ($28,715,962 ÷ 937,589 shares) | | | | | | $ | | 30.63 |
| |
| Statement of Operations | | | | | | | | |
| | | | | | | | | Year ended February 28, 2006 |
| |
| Investment Income | | | | | | | | |
| Dividends | | | | | | $ | | 489,605 |
| Special dividends | | | | | | | | 416,625 |
| Interest | | | | | | | | 128 |
| Income from affiliated Central Funds (including $3,915 from security lending) | | | | | | | | 39,814 |
| Total income | | | | | | | | 946,172 |
| |
| Expenses | | | | | | | | |
| Management fee | | $ | | 163,512 | | | | |
| Transfer agent fees | | | | 111,449 | | | | |
| Accounting and security lending fees | | | | | | | | |
| | | | | 14,383 | | | | |
| Independent trustees’ compensation | | | | 119 | | | | |
| Custodian fees and expenses | | | | 23,762 | | | | |
| Registration fees | | | | 25,973 | | | | |
| Audit | | | | 33,714 | | | | |
| Legal | | | | 138 | | | | |
| Miscellaneous | | | | 264 | | | | |
| Total expenses before reductions | | | | 373,314 | | | | |
| Expense reductions | | | | (27,387) | | | | 345,927 |
| |
| Net investment income (loss) | | | | | | | | 600,245 |
See accompanying notes which are an integral part of the financial statements.
Annual Report 64
| Realized and Unrealized Gain (Loss) | | | | |
| Net realized gain (loss) on: | | | | |
| Investment securities: | | | | |
| Unaffiliated issuers | | 1,362,197 | | |
| Foreign currency transactions | | (4,372) | | |
| Total net realized gain (loss) | | | | 1,357,825 |
| Change in net unrealized appreciation (depreciation) on: | | | | |
| Investment securities | | (1,961,553) | | |
| Assets and liabilities in foreign currencies | | (1,055) | | |
| Total change in net unrealized appreciation (depreciation) | | | | (1,962,608) |
| Net gain (loss) | | | | (604,783) |
| Net increase (decrease) in net assets resulting from operations | | | | $ (4,538) |
See accompanying notes which are an integral part of the financial statements.
|
65 Annual Report
| Fund Name | | | | | | | | | | | | | | | | | | | | | | |
| Financial Statements - continued | | | | | | | | | | | | | | | | | | | | | | |
| |
| |
| Statement of Changes in Net Assets | | | | | | | | | | | | | | | | | | | | | | |
| | | | | | | | | | | | | Year ended | | | | Year ended |
| | | | | | | | | | | | | February 28, | | | | February 28, |
| | | | | | | | | | | | | 2006 | | | | 2005 |
| Increase (Decrease) in Net Assets | | | | | | | | | | | | | | | | | | | | | | |
| Operations | | | | | | | | | | | | | | | | | | | | | | |
| Net investment income (loss) | | | | | | | | | | | | $ | | 600,245 | | $ | | | | 115,825 |
| Net realized gain (loss) | | | | | | | | | | | | | | 1,357,825 | | | | | | 1,462,172 |
| Change in net unrealized appreciation (depreciation) | | | | | | | | | | | | | | (1,962,608) | | | | (1,792,373) |
| Net increase (decrease) in net assets resulting from operations | | | | | | | | | | | | | | | | (4,538) | | | | | | (214,376) |
| Distributions to shareholders from net investment income | | | | | | | | | | | | | | (163,629) | | | | | | (95,718) |
| Share transactions | | | | | | | | | | | | | | | | | | | | | | |
| Proceeds from sales of shares | | | | | | | | | | | | | | 68,917,639 | | | | 26,886,142 |
| Reinvestment of distributions | | | | | | | | | | | | | | 148,392 | | | | | | 91,507 |
| Cost of shares redeemed | | | | | | | | | | | | (67,907,502) | | | | (27,831,332) |
| Net increase (decrease) in net assets resulting from share transactions | | | | | | | | | | | | 1,158,529 | | | | | | (853,683) |
| Redemption fees | | | | | | | | | | | | | | | | 40,871 | | | | | | 30,169 |
| Total increase (decrease) in net assets | | | | | | | | | | | | | | 1,031,233 | | | | (1,133,608) |
| |
| Net Assets | | | | | | | | | | | | | | | | | | | | | | |
| Beginning of period | | | | | | | | | | | | | | 27,684,729 | | | | 28,818,337 |
| End of period (including undistributed net investment income of $448,818 and undistributed net investment income | | | | | | | | | | | | |
| of $16,344, respectively) | | | | | | | | | | | | $ | | 28,715,962 | | $ | | 27,684,729 |
| |
| Other Information | | | | | | | | | | | | | | | | | | | | | | |
| Shares | | | | | | | | | | | | | | | | | | | | | | |
| Sold | | | | | | | | | | | | | | 2,357,344 | | | | | | 855,530 |
| Issued in reinvestment of distributions | | | | | | | | | | | | | | | | 4,956 | | | | | | 2,810 |
| Redeemed | | | | | | | | | | | | | | (2,299,721) | | | | | | (894,069) |
| Net increase (decrease) | | | | | | | | | | | | | | | | 62,579 | | | | | | (35,729) |
| |
| Financial Highlights | | | | | | | | | | | | | | | | | | | | | | |
| Years ended February 28, | | | | 2006 | | | | 2005 | | | | 2004F | | | | 2003 | | | | | | 2002 |
| Selected Per-Share Data | | | | | | | | | | | | | | | | | | | | | | |
| Net asset value, beginning of period | | $ | | 31.64 | | $ | | 31.64 | | $ | | 24.07 | | $ | | 28.78 | | | | $ | | 25.00 |
| Income from Investment Operations | | | | | | | | | | | | | | | | | | | | | | |
| Net investment income (loss)C | | | | 61D | | | | .14 | | | | (.05) | | | | (.02) | | | | | | .11 |
| Net realized and unrealized gain (loss) | | | | (1.53) | | | | (.06) | | | | 7.59 | | | | (4.74) | | | | | | 3.71 |
| Total from investment operations | | | | (.92) | | | | .08 | | | | 7.54 | | | | (4.76) | | | | | | 3.82 |
| Distributions from net investment income | | | | (.13) | | | | (.12) | | | | — | | | | — | | | | | | (.16) |
| Redemption fees added to paid in capitalC | | | | 04 | | | | .04 | | | | .03 | | | | .05 | | | | | | .12 |
| Net asset value, end of period | | $ | | 30.63 | | $ | | 31.64 | | $ | | 31.64 | | $ | | 24.07 | | | | $ | | 28.78 |
| Total ReturnA,B | | | | (2.77)% | | | | .37% | | | | 31.45% | | | | (16.37)% | | | | | | 15.82% |
| Ratios to Average Net AssetsE | | | | | | | | | | | | | | | | | | | | | | |
| Expenses before reductions | | | | 1.31% | | | | 1.33% | | | | 2.01% | | | | 1.81% | | | | | | 1.82% |
| Expenses net of fee waivers, if any | | | | 1.25% | | | | 1.32% | | | | 2.01% | | | | 1.81% | | | | | | 1.82% |
| Expenses net of all reductions | | | | 1.21% | | | | 1.30% | | | | 1.94% | | | | 1.73% | | | | | | 1.69% |
| Net investment income (loss) | | | | 2.10%D | | | | .45% | | | | (.20)% | | | | (.07)% | | | | | | .42% |
| Supplemental Data | | | | | | | | | | | | | | | | | | | | | | |
| Net assets, end of period (000 omitted) | | $ | | 28,716 | | $ | | 27,685 | | $ | | 28,818 | | $ | | 21,308 | | | | $ | | 26,076 |
| Portfolio turnover rate | | | | 207% | | | | 65% | | | | 188% | | | | 201% | | | | | | 247% |
| |
| | | | | |
| | |
A Total returns would have been lower had certain expenses not been reduced during the periods shown. B Total returns do not include the effect of the former sales charges. C Calculated based on average shares outstanding during the period. D Investment income per share reflects a special dividend which amounted to $.42 per share. Excluding the special dividend, the ratio of net investment income (loss) to average net assets would have been ..64%. E Expense ratios reflect operating expenses of the fund. Expenses before reductions do not reflect amounts reimbursed by the investment adviser or reductions from brokerage service arrangements or other expense offset arrangements and do not represent the amount paid by the fund during periods when reimbursements or reductions occur. Expenses net of fee waivers reflect expenses after reimbursement by the investment adviser but prior to reductions from brokerage service arrangements or other expense offset arrange ments. Expenses net of all reductions represent the net expenses paid by the fund. FFor the year ended February 29.
See accompanying notes which are an integral part of the financial statements.
Annual Report 66
Notes to Financial Statements
For the period ended February 28, 2006
|
1. Significant Accounting Policies.
|
Energy Portfolio, Energy Service Portfolio, Gold Portfolio, Natural Gas Portfolio, Natural Resources Portfolio, and Paper and Forest Products Portfolio (the funds) are non-diversified funds of Fidelity Select Portfolios (the trust). The trust is registered under the Investment Company Act of 1940, as amended (the 1940 Act), as an open-end management investment company organized as a Massachusetts business trust. The funds invest primarily in securities of companies whose principal business activities fall within specific industries. Each fund is authorized to issue an unlimited number of shares. The Gold Portfolio and Natural Resources Portfolio may also invest in certain precious metals. Certain funds may invest in affiliated money market central funds (Money Market Central Funds) which are open-end investment companies available to investment companies and other accounts managed by Fidelity Management & Research Company (FMR) and its affiliates. The financial statements have been prepared in conformity with accounting principles generally accepted in the United States of America, which require management to make certain estimates and assumptions at the date of the financial statements. The following summarizes the significant accounting policies of the funds:
Security Valuation. Investments are valued and net asset value (NAV) per share is calculated (NAV calculation) as of the close of business of the New York Stock Exchange (NYSE), normally 4:00 p.m. Eastern time. In addition, each fund intends to calculate a NAV each hour on the hour (commencing at 10:00 a.m. Eastern time until one hour prior to the close of business on the NYSE) under normal business conditions. Each fund’s investments are valued as of these times for the purpose of computing the fund’s hourly NAV. Wherever possible, each fund uses independent pricing services approved by the Board of Trustees to value their investments.
Equity securities, including restricted securities, for which market quotations are readily available, are valued at the last reported sale price or official closing price as reported by an independent pricing service on the primary market or exchange on which they are traded. In the event there were no sales during the day or closing prices are not available, securities are valued at the last quoted bid price. Investments in open-end mutual funds are valued at their closing net asset value each business day. Short-term securities with remaining maturities of sixty days or less for which quotations are not readily available are valued at amortized cost, which approximates value.
When current market prices or quotations are not readily available or do not accurately reflect fair value, valuations may be determined in accordance with procedures adopted by the Board of Trustees. For example, when developments occur between the close of a market and the close of the NYSE that may materially affect the value of some or all of the securities, or when trading in a security is halted, those securities may be fair valued. Factors used in the determination of fair value may include monitoring news to identify significant market or security specific events such as changes in the value of U.S. securities markets, reviewing developments in foreign markets and evaluating the performance of ADRs, futures contracts and exchange-traded funds. Because each fund’s utilization of fair value pricing depends on market activity, the frequency with which fair value pricing is used can not be predicted and may be utilized to a significant extent. The value of securities used for NAV calculation under fair value pricing may differ from published prices for the same securities. Fidelity may suspend the calculation of one or more hourly NAVs for funds for any period in which prices for a portion of the stocks or securities held by the funds are not readily available.
Foreign Currency. Certain funds may use foreign currency contracts to facilitate transactions in foreign-denominated securities. Losses from these transactions may arise from changes in the value of the foreign currency or if the counterparties do not perform under the contracts’ terms.
Foreign-denominated assets, including investment securities, and liabilities are translated into U.S. dollars at the exchange rate at period end. Purchases and sales of investment securities, income and dividends received and expenses denominated in foreign currencies are translated into U.S. dollars at the exchange rate in effect on the transaction date.
The effects of exchange rate fluctuations on investments are included with the net realized and unrealized gain (loss) on investment securities. Other foreign currency transactions resulting in realized and unrealized gain (loss) are disclosed separately.
Investment Transactions and Income. Security transactions are accounted for as of trade date. Gains and losses on securities sold are determined on the basis of identified cost and may include proceeds received from litigation. Dividend income is recorded on the ex-dividend date, except for certain dividends from foreign securities where the ex-dividend date may have passed, which are recorded as soon as the funds are informed of the ex-dividend date. Non-cash dividends included in dividend income, if any, are recorded at the fair market value of the securities received. Distributions received on securities that represent a return of capital or capital gain are recorded as a reduction of cost of investments and/or as a realized gain. The funds estimate the components of distributions received that may be considered return of capital distributions or capital gain distributions. Large, non-recurring dividends recognized by the funds are presented separately on the Statement of Operations as “Special Dividends” and the impact of these dividends is presented in the Financial Highlights. Interest income is accrued as earned. Interest income includes coupon interest and amortization of premium and accretion of discount on debt securities. Investment income is recorded net of foreign taxes withheld where recovery of such taxes is uncertain.
Expenses. Most expenses of the trust can be directly attributed to a fund. Expenses which cannot be directly attributed are apportioned among each fund in the trust.
67 Annual Report
Notes to Financial Statements - continued
1. Significant Accounting Policies - continued
|
Income Tax Information and Distributions to Shareholders. Each year, each fund intends to qualify as a regulated investment company by distributing all of its taxable income and realized gains under Subchapter M of the Internal Revenue Code. As a result, no provision for income taxes is required in the accompanying financial statements. Foreign taxes are provided for based on each fund’s understanding of the tax rules and rates that exist in the foreign markets in which it invests.
Distributions are recorded on the ex-dividend date. Income and capital gain distributions are determined in accordance with income tax regulations, which may differ from generally accepted accounting principles. In addition, certain funds will claim a portion of the payment made to redeeming shareholders as a distribution for income tax purposes.
Capital accounts within the financial statements are adjusted for permanent book-tax differences. These adjustments have no impact on net assets or the results of operations. Temporary book-tax differences will reverse in a subsequent period.
Book-tax differences are primarily due to short-term capital gains, foreign currency transactions, passive foreign investment companies (PFIC), deferred trustees compensation, net operating losses, capital loss carryforwards and losses deferred due to wash sales.
The tax-basis components of distributable earnings and the federal tax cost as of period end were as follows for each fund:
| | | Cost for | | | | | | | | | | | | Net Unrealized |
| | | Federal Income | | | | Unrealized | | | | Unrealized | | | | Appreciation/ |
| | | Tax Purposes | | | | Appreciation | | | | Depreciation | | | | (Depreciation) |
| Energy Portfolio | | $ 2,168,130,257 | | $ | | 541,261,915 | | $ | | (50,145,465) | | $ | | 491,116,450 |
| Energy Service Portfolio | | 1,262,659,742 | | | | 542,044,465 | | | | (46,296,400) | | | | 495,748,065 |
| Gold Portfolio | | 1,179,837,318 | | | | 208,408,742 | | | | (46,628,351) | | | | 161,780,391 |
| Natural Gas Portfolio | | 1,359,120,978 | | | | 261,050,397 | | | | (24,771,886) | | | | 236,278,511 |
| Natural Resources Portfolio | | 774,375,151 | | | | 162,069,213 | | | | (15,805,304) | | | | 146,263,909 |
| Paper and Forest Products Portfolio | | 31,369,837 | | | | 579,146 | | | | (3,008,516) | | | | (2,429,370) |
| |
| | | | | | | | | | | Undistributed | | | | |
| | | | | | | Undistributed | | | | Long-term | | | | Capital Loss |
| | | | | | | Ordinary Income | | | | Capital Gain | | | | Carryforward |
| Energy Portfolio | | | | $ | | 74,844,652 | | $ | | 47,302,374 | | $ | | — |
| Energy Service Portfolio | | | | | | 2,609,814 | | | | 37,349,357 | | | | — |
| Gold Portfolio | | | | | | 69,290,728 | | | | 80,911,165 | | | | —* |
| Natural Gas Portfolio | | | | | | 13,405,322 | | | | 28,765,328 | | | | — |
| Natural Resources Portfolio | | | | | | 11,373,426 | | | | 13,057,079 | | | | — |
| Paper and Forest Products Portfolio | | | | | | 448,822 | | | | — | | | | (4,421,794) |
* The fund had a capital loss carryforward of $11,923,858 which was acquired in the merger with Select Precious Metals and Minerals and is available to offset future capital gains of the fund up to $5,961,929 per year as provided by regulations.
| The tax character of distributions paid was as follows: | | | | | | | | |
| |
| February 28, 2006 | | | | | | | | |
| | | | | | | Long-term | | |
| | | Ordinary Income | | | | Capital Gains | | Total |
| Energy Portfolio | | $ 43,006,359 | | $ | | 68,709,820 | | $ 111,716,179 |
| Gold Portfolio | | 8,953,658 | | | | 97,688,205 | | 106,641,863 |
| Natural Gas Portfolio | | 57,454,659 | | | | 94,685,143 | | 152,139,802 |
| Natural Resources Portfolio | | 10,307,159 | | | | 13,651,900 | | 23,959,059 |
| Paper and Forest Products Portfolio | | 163,629 | | | | — | | 163,629 |
| |
| February 28, 2005 | | | | | | | | |
| | | | | | | Long-term | | |
| | | Ordinary Income | | | | Capital Gains | | Total |
| Energy Portfolio | | $ 2,738,124 | | $ | | 4,765,904 | | $ 7,504,028 |
| Natural Gas Portfolio | | 399,135 | | | | 8,780,955 | | 9,180,090 |
| Natural Resources Portfolio | | 1,034,766 | | | | 2,393,302 | | 3,428,068 |
| Paper and Forest Products Portfolio | | 95,718 | | | | — | | 95,718 |
Trading (Redemption) Fees. Shares in the funds held less than 30 days are subject to a redemption fee equal to .75% of the net asset value of shares redeemed. All redemption fees, including any estimated redemption fees paid by FMR, are retained by the fund and accounted for as an addition to paid in capital. Shareholders are also subject to an additional $7.50 fee for shares exchanged into another Fidelity fund (see Note 4).
Repurchase Agreements. FMR has received an Exemptive Order from the Securities and Exchange Commission (the SEC) which permits certain funds and other affiliated entities of FMR to transfer uninvested cash balances into joint trading accounts which are then invested in repurchase agreements. Certain funds may also invest directly with institutions in repurchase agreements. Repurchase agreements are collateralized by government or non-government securities. Upon settlement date, collateral is held in segregated accounts with custodian banks and may be obtained in the event of a default of the counterparty. Each applicable fund monitors, on a daily basis, the value of the collateral to ensure it is at least equal to the principal amount of the repurchase agreement (including accrued interest). In the event of a default by the counterparty, realization of the collateral proceeds could be delayed, during which time the value of the collateral may decline.
Restricted Securities. Certain funds may invest in securities that are subject to legal or contractual restrictions on resale. These securities generally may be resold in transactions exempt from registration or to the public if the securities are registered. Disposal of these securities may involve time-consuming negotiations and expense, and prompt sale at an acceptable price may be difficult. Information regarding restricted securities is included at the end of each applicable fund’s Schedule of Investments.
| 3. Purchases and Sales of Investments. | | | | |
| |
| Purchases and sales of securities, other than short-term securities and U.S. government securities, are noted in the table below. | | |
| | | Purchases ($) | | Sales ($) |
| Energy Portfolio | | 3,415,970,560 | | 2,460,884,702 |
| Energy Service Portfolio | | 1,260,796,447 | | 709,259,231 |
| Gold Portfolio | | 938,929,959 | | 829,823,561 |
| Natural Gas Portfolio | | 2,466,837,705 | | 2,058,780,862 |
| Natural Resources Portfolio | | 1,083,836,339 | | 638,923,867 |
| Paper and Forest Products Portfolio | | 58,824,376 | | 57,109,720 |
| |
| |
| 4. Fees and Other Transactions with Affiliates. | | | | |
Management Fee. FMR and its affiliates provide the funds with investment management related services for which the funds pay a monthly management fee. The management fee is the sum of an individual fund fee rate and a group fee rate. The individual fund fee rate is applied to each fund’s average net assets. The group fee rate is based upon the average net assets of all the mutual funds advised by FMR. The group fee rate decreases as assets under management increase and increases as assets under management decrease. For the period, each fund’s annual management fee rate expressed as a percentage of each fund’s average net assets was as follows:
| | | Individual Rate | | Group Rate | | Total |
| Energy Portfolio | | 30% | | .27% | | .57% |
| Energy Service Portfolio | | 30% | | .27% | | .57% |
| Gold Portfolio | | 30% | | .27% | | .58% |
| Natural Gas Portfolio | | 30% | | .27% | | .57% |
| Natural Resources Portfolio | | 30% | | .27% | | .58% |
| Paper and Forest Products Portfolio | | 30% | | .27% | | .57% |
Sales Load. Fidelity Distributors Corporation (FDC), an affiliate of FMR, is the general distributor of the funds. Shares purchased prior to October 12, 1990, were subject to a 1% deferred sales charge upon redemption or exchange to any other Fidelity fund (other than Select funds). Effective July 1, 2005, the deferred sales charge was eliminated. For the period, sales charge amounts retained by FDC were as follows:
| | | Retained |
| | | by FDC |
| Energy Portfolio | | $ 4,146 |
| Energy Service Portfolio | | 2,320 |
| Gold Portfolio | | 7,423 |
| Natural Gas Portfolio | | 1,750 |
| Natural Resources Portfolio | | 278 |
| Paper and Forest Products Portfolio | | 803 |
69 Annual Report
Notes to Financial Statements - continued
4. Fees and Other Transactions with Affiliates - continued
Transfer Agent Fees. Fidelity Service Company, Inc. (FSC), an affiliate of FMR, is the funds’ transfer, dividend disbursing and shareholder servicing agent. FSC receives account fees and asset-based fees that vary according to account size and type of account. FSC pays for typesetting, printing and mailing of shareholder reports, except proxy statements. For the period, the transfer agent fees were equivalent to the following annual rates expressed as a percentage of average net assets:
| Energy Portfolio | | 30% |
| Energy Service Portfolio | | 29% |
| Gold Portfolio | | 30% |
| Natural Gas Portfolio | | 31% |
| Natural Resources Portfolio | | 32% |
| Paper and Forest Products Portfolio | | 39% |
Accounting and Security Lending Fees. FSC maintains each fund’s accounting records. The accounting fee is based on the level of average net assets for the month. Under a separate contract, FSC administers the security lending program. The security lending fee is based on the number and duration of lending transactions.
Affiliated Central Funds. Certain funds may invest in Money Market Central Funds which seek preservation of capital and current income and are managed by Fidelity Investments Money Management, Inc. (FIMM), an affiliate of FMR.
The Money Market Central Funds do not pay a management fee.
|
Exchange Fees. FSC receives the proceeds of $7.50 to cover administrative costs associated with exchanges out of the funds to any other Fidelity Select fund or to any other Fidelity fund. For the period, exchange fees retained by FSC were as follows:
| | | Retained |
| | | by FSC |
| Energy Portfolio | | $ 28,103 |
| Energy Service Portfolio | | 19,755 |
| Gold Portfolio | | 12,195 |
| Natural Gas Portfolio | | 29,333 |
| Natural Resources Portfolio | | 7,853 |
| Paper and Forest Products Portfolio | | 630 |
Brokerage Commissions. Certain funds placed a portion of their portfolio transactions with brokerage firms which are affiliates of the investment adviser. The commissions paid to these affiliated firms were as follows:
| | | Amount |
| Energy Portfolio | | $ 33,099 |
| Energy Service Portfolio | | 7,795 |
| Gold Portfolio | | 747 |
| Natural Gas Portfolio | | 5,125 |
| Natural Resources Portfolio | | 16,838 |
| Paper and Forest Products Portfolio | | 11,037 |
Interfund Lending Program. Pursuant to an Exemptive Order issued by the SEC, the funds, along with other registered investment companies having management contracts with FMR, may participate in an interfund lending program. This program provides an alternative credit facility allowing the funds to borrow from, or lend money to, other participating affiliated funds. At period end, there were no interfund loans outstanding. Each applicable fund’s activity in this program during the period for which loans were outstanding was as follows:
| | | Borrower | | Average Daily | | Weighted Average | | | | |
| | | or Lender | | Loan Balance | | Interest Rate | | Interest Expense |
| Energy Portfolio | | Borrower | | $30,304,941 | | 3.74% | | $ | | 53,497 |
| Energy Service Portfolio | | Borrower | | 16,256,167 | | 4.04% | | | | 43,818 |
| Natural Gas Portfolio | | Borrower | | 13,816,512 | | 4.03% | | | | 66,439 |
| Natural Resources Portfolio | | Borrower | | 9,235,000 | | 3.82% | | | | 980 |
| |
| 5. Committed Line of Credit. | | | | | | | | | | |
Certain funds participate with other funds managed by FMR in a $4.2 billion credit facility (the “line of credit”) to be utilized for temporary or emergency purposes to fund shareholder redemptions or for other short-term liquidity purposes. The participating funds have agreed to pay commitment fees on their pro rata portion of the line of credit. During the period, there were no borrowings on this line of credit.
Certain funds lend portfolio securities from time to time in order to earn additional income. On the settlement date of the loan, each applicable fund receives collateral (in the form of U.S. Treasury obligations, letters of credit and/or cash) against the loaned securities and maintains collateral in an amount not less than 100% of the market value of the loaned securities during the period of the loan. The market value of the loaned securities is determined at the close of business of the funds and any additional required collateral is delivered to the funds on the next business day. If the borrower defaults on its obligation to return the securities loaned because of insolvency or other reasons, a fund could experience delays and costs in recovering the securities loaned or in gaining access to the collateral. Any cash collateral received is invested in the Fidelity Securities Lending Cash Central Fund. The value of loaned securities and cash collateral at period end are disclosed on each applicable fund’s Statement of Assets and Liabilities. Security lending income represents the income earned on investing cash collateral, less fees and expenses associated with the loan, plus any premium payments that may be received on the loan of certain types of securities. Security lending income is presented on each applicable fund’s Statement of Operations as a component of income from affiliated central funds.
Each fund is permitted to have bank borrowings for temporary or emergency purposes to fund shareholder redemptions. Each fund has established borrowing arrangements with certain banks. The interest rate on the borrowings is the bank’s base rate, as revised from time to time. At period end, there were no bank borrowings outstanding. Each applicable fund’s activity in this program during the period for which loans were outstanding was as follows:
| | | Average Daily | | Weighted Average |
| | | Loan Balance | | Interest Rate |
| Energy Service Portfolio | | $ 10,622,000 | | 4.04% |
| Natural Gas Portfolio | | 4,364,000 | | 4.81% |
| |
| 8. Expense Reductions. | | | | |
FMR voluntarily agreed to reimburse funds to the extent annual operating expenses exceeded certain levels of average net assets as noted in the table below. Some expenses, for example interest expense, are excluded from this reimbursement.
| The following funds were in reimbursement during the period: | | | | | | |
| | | | | | | Reimbursement |
| | | Expense Limitations | | | | from adviser |
| Paper and Forest Products Portfolio | | 1.25% | | $ | | 16,539 |
Many of the brokers with whom FMR places trades on behalf of certain funds provided services to these funds in addition to trade execution. These services included payments of expenses on behalf of each applicable fund. In addition, through arrangements with each applicable fund’s custodian and transfer agent, credits realized as a result of uninvested cash balances were used to reduce each applicable fund’s expenses. All of the applicable expense reductions are noted in the table below.
| | | | | | | | | | | Transfer |
| | | | | | | Custody | | | | Agent |
| | | Brokerage Service | | | | expense | | | | expense |
| | | Arrangements | | | | reduction | | | | reduction |
| Energy Portfolio | | $ 1,035,147 | | $ | | 3,419 | | $ | | 12,109 |
| Energy Service Portfolio | | 274,532 | | | | — | | | | 6,651 |
| Gold Portfolio | | 1,260,588 | | | | 5,102 | | | | 8,178 |
| Natural Gas Portfolio | | 959,267 | | | | — | | | | 10,175 |
| Natural Resources Portfolio | | 334,778 | | | | — | | | | 8,980 |
| Paper and Forest Products Portfolio | | 10,848 | | | | — | | | | — |
| |
| 9. Other. | | | | | | | | | | |
The funds’ organizational documents provide former and current trustees and officers with a limited indemnification against liabilities arising in connection with the performance of their duties to the funds. In the normal course of business, the funds may also enter into contracts that provide general indemnifications. The funds’ maximum exposure under these arrangements is unknown as this would be dependent on future claims that may be made against the funds. The risk of material loss from such claims is considered remote.
71 Annual Report
Report of Independent Registered Public Accounting Firm
To the Trustees of Fidelity Select Portfolios and the Shareholders of Energy Portfolio, Energy Service Portfolio, Gold Portfolio, Natural Gas Portfolio, Natural Resources Portfolio, and Paper and Forest Products Portfolio:
In our opinion, the accompanying statements of assets and liabilities, including the schedules of investments, and the related statements of operations and of changes in net assets and the financial highlights present fairly, in all material respects, the financial position of Energy Portfolio, Energy Service Portfolio, Gold Portfolio, Natural Gas Portfolio, Natural Resources Portfolio, and Paper and Forest Products Portfolio (funds of Fidelity Select Portfolios) at February 28, 2006, and the results of each of their operations, the changes in each of their net assets and the financial highlights for each of the periods indicated, in conformity with accounting principles generally accepted in the United States of America. These financial statements and financial highlights (hereafter referred to as “financial statements”) are the responsibility of the Fidelity Select Portfolios’ management; our responsibility is to express an opinion on these financial statements based on our audits. We conducted our audits of these financial statements in accordance with the standards of the Public Company Accounting Oversight Board (United States). Those standards require that we plan and perform the audit to obtain reasonable assurance about whether the financial statements are free of material misstatement. An audit includes examining, on a test basis, evidence supporting the amounts and disclosures in the financial statements, assessing the accounting principles used and significant estimates made by management, and evaluating the overall financial statement presentation. We believe that our audits, which included confirmation of securities at February 28, 2006 by correspondence with the custodian and brokers, provide a reasonable basis for our opinion.
/s/ PricewaterhouseCoopers LLP
PricewaterhouseCoopers LLP
Boston, Massachusetts
April 13, 2006
|
Trustees and Officers
The Trustees, Members of the Advisory Board, and executive officers of the trust and funds, as applicable, are listed below. The Board of Trustees governs each fund and is responsible for protecting the interests of shareholders. The Trustees are experienced executives who meet periodically throughout the year to oversee each fund’s activities, review contractual arrangements with companies that provide services to each fund, and review each fund’s performance. Except for William O. McCoy, each of the Trustees oversees 326 funds advised by FMR or an affiliate. Mr. McCoy oversees 328 funds advised by FMR or an affiliate.
The Trustees hold office without limit in time except that (a) any Trustee may resign; (b) any Trustee may be removed by written instrument, signed by at least two-thirds of the number of Trustees prior to such removal; (c) any Trustee who requests to be retired or who has become incapacitated by illness or injury may be retired by written instrument signed by a majority of the other Trustees; and (d) any Trustee may be removed at any special meeting of shareholders by a two-thirds vote of the outstanding voting securities of the trust. Each Trustee who is not an interested person (as defined in the 1940 Act) (Independent Trustee), shall retire not later than the last day of the calendar year in which his or her 72nd birthday occurs. The Independent Trustees may waive this mandatory retirement age policy with respect to individual Trustees. The executive officers and Advisory Board Members hold office without limit in time, except that any officer and Advisory Board Member may resign or may be removed by a vote of a majority of the Trustees at any regular meeting or any special meeting of the Trustees. Except as indicated, each individual has held the office shown or other offices in the same company for the past five years.
The funds’ Statement of Additional Information (SAI) includes more information about the Trustees. To request a free copy, call Fidelity at 1-800-544-8544.
Interested Trustees*:
Correspondence intended for each Trustee who is an interested person may be sent to Fidelity Investments, 82 Devonshire Street, Boston, Massachusetts 02109.
| Name, Age; Principal Occupation |
| |
| Edward C. Johnson 3d (75) |
| |
| Year of Election or Appointment: 1980 |
| Mr. Johnson is Chairman of the Board of Trustees. Mr. Johnson serves as Chief Executive Officer, Chairman, and a Director of FMR |
| Corp.; a Director and Chairman of the Board and of the Executive Committee of FMR; Chairman and a Director of Fidelity Re- |
| search & Analysis Company; Chairman and a Director of Fidelity Investments Money Management, Inc.; and Chairman |
| (2001-present) and a Director (2000-present) of FMR Co., Inc. |
| |
| Stephen P. Jonas (53) |
| |
| Year of Election or Appointment: 2005 |
| Mr. Jonas is Senior Vice President of Energy (2005-present), Energy Services (2005-present), Gold (2005-present), Natural Gas |
| (2005-present), Natural Resources (2005-present), and Paper and Forest Products (2005-present). He also serves as Senior Vice |
| President of other Fidelity funds (2005-present). Mr. Jonas is Executive Director of FMR (2005-present). Previously, Mr. Jonas |
| served as President of Fidelity Enterprise Operations and Risk Services (2004-2005), Chief Administrative Officer (2002-2004), |
| and Chief Financial Officer of FMR Co. (1998-2000). Mr. Jonas has been with Fidelity Investments since 1987 and has held vari- |
| ous financial and management positions including Chief Financial Officer of FMR. In addition, he serves on the Boards of Boston |
| Ballet (2003-present) and Simmons College (2003-present). |
| |
| Robert L. Reynolds (53) |
| |
| Year of Election or Appointment: 2003 |
| Mr. Reynolds is a Director (2003-present) and Chief Operating Officer (2002-present) of FMR Corp. He also serves on the Board |
| at Fidelity Investments Canada, Ltd. (2000-present). Previously, Mr. Reynolds served as President of Fidelity Investments Institutional |
| Retirement Group (1996-2000). |
* Trustees have been determined to be “Interested Trustees” by virtue of, among other things, their affiliation with the trust or various entities under common control with FMR.
73 Annual Report
Trustees and Officers - continued
Independent Trustees:
Correspondence intended for each Independent Trustee (that is, the Trustees other than the Interested Trustees) may be sent to Fidelity Investments, P.O. Box 55235, Boston, Massachusetts 02205-5235.
| Name, Age; Principal Occupation |
| |
| Dennis J. Dirks (57) |
| |
| Year of Election or Appointment: 2005 |
| Prior to his retirement in May 2003, Mr. Dirks was Chief Operating Officer and a member of the Board of The Depository Trust & |
| Clearing Corporation (DTCC) (1999-2003). He also served as President, Chief Operating Officer, and Board member of The De- |
| pository Trust Company (DTC) (1999-2003) and President and Board member of the National Securities Clearing Corporation |
| (NSCC) (1999-2003). In addition, Mr. Dirks served as Chief Executive Officer and Board member of the Government Securities |
| Clearing Corporation (2001-2003) and Chief Executive Officer and Board member of the Mortgage-Backed Securities Clearing |
| Corporation (2001-2003). Mr. Dirks also serves as a Trustee and a member of the Finance Committee of Manhattan College |
| (2005-present) and a Trustee and a member of the Finance Committee of AHRC of Nassau County (2006-present). |
| |
| Robert M. Gates (62) |
| |
| Year of Election or Appointment: 1997 |
| Dr. Gates is Chairman of the Independent Trustees (2006-present). Dr. Gates is President of Texas A&M University (2002-present). |
| He was Director of the Central Intelligence Agency (CIA) from 1991 to 1993. From 1989 to 1991, Dr. Gates served as Assistant |
| to the President of the United States and Deputy National Security Advisor. Dr. Gates is a Director of NACCO Industries, Inc. |
| (mining and manufacturing), Parker Drilling Co., Inc. (drilling and rental tools for the energy industry, 2001-present), and Brinker |
| International (restaurant management, 2003-present). Previously, Dr. Gates served as a Director of LucasVarity PLC (automotive |
| components and diesel engines), a Director of TRW Inc. (automotive, space, defense, and information technology), and Dean of |
| the George Bush School of Government and Public Service at Texas A&M University (1999-2001). |
| |
| George H. Heilmeier (69) |
| |
| Year of Election or Appointment: 2004 |
| Dr. Heilmeier is Chairman Emeritus of Telcordia Technologies (communication software and systems), where prior to his retirement, |
| he served as company Chairman and Chief Executive Officer. He currently serves on the Boards of Directors of The Mitre Corpo- |
| ration (systems engineering and information technology support for the government), and HRL Laboratories (private research and |
| development, 2004-present). He is Chairman of the General Motors Science & Technology Advisory Board and a Life Fellow of |
| the Institute of Electrical and Electronics Engineers (IEEE). Dr. Heilmeier is a member of the Defense Science Board and the National |
| Security Agency Advisory Board. He is also a member of the National Academy of Engineering, the American Academy of Arts |
| and Sciences, and the Board of Overseers of the School of Engineering and Applied Science of the University of Pennsylvania. |
| Previously, Dr. Heilmeier served as a Director of TRW Inc. (automotive, space, defense, and information technology, 1992-2002), |
| Compaq (1994-2002), Automatic Data Processing, Inc. (ADP) (technology-based business outsourcing, 1995-2002), INET |
| Technologies Inc. (telecommunications network surveillance, 2001-2004), and Teletech Holdings (customer management services). |
| He is the recipient of the 2005 Kyoto Prize in Advanced Technology for his invention of the liquid crystal display. |
| |
| Marie L. Knowles (59) |
| |
| Year of Election or Appointment: 2001 |
| Prior to Ms. Knowles’ retirement in June 2000, she served as Executive Vice President and Chief Financial Officer of Atlantic Rich- |
| field Company (ARCO) (diversified energy, 1996-2000). From 1993 to 1996, she was a Senior Vice President of ARCO and |
| President of ARCO Transportation Company. She served as a Director of ARCO from 1996 to 1998. She currently serves as a |
| Director of Phelps Dodge Corporation (copper mining and manufacturing) and McKesson Corporation (healthcare service, |
| 2002-present). Ms. Knowles is a Trustee of the Brookings Institution and the Catalina Island Conservancy and also serves as a |
| member of the Advisory Board for the School of Engineering of the University of Southern California. |
| |
| Ned C. Lautenbach (62) |
| |
| Year of Election or Appointment: 2000 |
| Mr. Lautenbach has been a partner of Clayton, Dubilier & Rice, Inc. (private equity investment firm) since September 1998. Pre- |
| viously, Mr. Lautenbach was with the International Business Machines Corporation (IBM) from 1968 until his retirement in 1998. |
| Mr. Lautenbach serves as a Director of Italtel Holding S.p.A. (telecommunications (Milan, Italy), 2004-present) and Eaton Corpora- |
| tion (diversified industrial) as well as the Philharmonic Center for the Arts in Naples, Florida. He also is a member of the Board of |
| Trustees of Fairfield University (2005-present), as well as a member of the Council on Foreign Relations. |
Annual Report 74
| Name, Age; Principal Occupation |
| |
| William O. McCoy (72) |
| |
| Year of Election or Appointment: 1997 |
| Prior to his retirement in December 1994, Mr. McCoy was Vice Chairman of the Board of BellSouth Corporation (telecommunica- |
| tions) and President of BellSouth Enterprises. He is currently a Director of Duke Realty Corporation (real estate), and Progress |
| Energy, Inc. (electric utility). He is also a partner of Franklin Street Partners (private investment management firm) and a member of |
| the Research Triangle Foundation Board. In addition, Mr. McCoy served as the Interim Chancellor (1999-2000) and a member of |
| the Board of Visitors for the University of North Carolina at Chapel Hill and currently serves as Chairman of the Board of Directors |
| of the University of North Carolina Health Care System and the Board of Visitors of the Kenan-Flagler Business School (University |
| of North Carolina at Chapel Hill). He also served as Vice President of Finance for the University of North Carolina (16-school |
| system). |
| |
| Cornelia M. Small (61) |
| |
| Year of Election or Appointment: 2005 |
| Ms. Small is a member (2000-present) and Chairperson (2002-present) of the Investment Committee, and a member |
| (2002-present) of the Board of Trustees of Smith College. Previously, she served as Chief Investment Officer (1999-2000), Director |
| of Global Equity Investments (1996-1999), and a member of the Board of Directors of Scudder, Stevens & Clark (1990-1997) and |
| Scudder Kemper Investments (1997-1999). In addition, Ms. Small served as Co-Chair (2000-2003) of the Annual Fund for the |
| Fletcher School of Law and Diplomacy. |
| |
| William S. Stavropoulos (66) |
| |
| Year of Election or Appointment: 2001 |
| Mr. Stavropoulos is Chairman of the Board (2000-present) and a Member of the Board of Directors of The Dow Chemical |
| Company. Since joining The Dow Chemical Company in 1967, Mr. Stavropoulos served in numerous senior management posi- |
| tions, including President (1993-2000; 2002-2003), CEO (1995-2000; 2002-2004), and Chairman of the Executive Committee |
| (2000-2004). Currently, he is a Director of NCR Corporation (data warehousing and technology solutions), BellSouth Corporation |
| (telecommunications), Chemical Financial Corporation, Maersk Inc. (industrial conglomerate, 2002-present), and Metalmark Capi- |
| tal (private equity investment firm, 2005-present). He also serves as a member of the Board of Trustees of the American Enterprise |
| Institute for Public Policy Research. In addition, Mr. Stavropoulos is a member of The Business Council, J.P. Morgan International |
| Council and the University of Notre Dame Advisory Council for the College of Science. |
| |
| Kenneth L. Wolfe (67) |
| |
| Year of Election or Appointment: 2005 |
| Prior to his retirement in 2001, Mr. Wolfe was Chairman and Chief Executive Officer of Hershey Foods Corporation (1993-2001). |
| He currently serves as a member of the boards of Adelphia Communications Corporation (2003-present), Bausch & Lomb, Inc., |
| and Revlon Inc. (2004-present). |
Advisory Board Members and Executive Officers:
Correspondence intended for Messrs. Keyes and Gamper may be sent to Fidelity Investments, P.O. Box 55235, Boston, Massachusetts 02205-5235. Correspondence intended for each executive officer and Mr. Lynch may be sent to Fidelity Investments, 82 Devonshire Street, Boston, Massachusetts 02109.
| Name, Age; Principal Occupation |
| |
| Albert R. Gamper, Jr. (63) |
| |
| Year of Election or Appointment: 2005 |
| Member of the Advisory Board of Fidelity Select Portfolios. Mr. Gamper also serves as a Trustee (2006-present) or Member of the |
| Advisory Board (2005-present) of other investment companies advised by FMR. Prior to his retirement in December 2004, Mr. |
| Gamper served as Chairman of the Board of CIT Group Inc. (commercial finance). During his tenure with CIT Group Inc. Mr. |
| Gamper served in numerous senior management positions, including Chairman (1987-1989; 1999-2001; 2002-2004), Chief |
| Executive Officer (1987-2004), and President (1989-2002). He currently serves as a member of the Board of Directors of Public |
| Service Enterprise Group (utilities, 2001-present), Chairman of the Board of Governors, Rutgers University (2004-present), and |
| Chairman of the Board of Saint Barnabas Health Care System. |
| |
| James H. Keyes (65) |
| |
| Year of Election or Appointment: 2006 |
| Member of the Advisory Board of Fidelity Select Portfolios. Prior to his retirement in 2003, Mr. Keyes was Chairman, President, |
| and Chief Executive Officer of Johnson Controls, Inc. (automotive supplier, 1993-2003). He currently serves as a member of the |
| boards of LSI Logic Corporation (semiconductor technologies, 1984-present), Navistar International Corporation (manufacture and |
| sale of trucks, buses, and diesel engines, 2002-present), and Pitney Bowes, Inc. (integrated mail, messaging, and document man- |
| agement solutions, 1998-present). |
75 Annual Report
Trustees and Officers - continued
| Name, Age; Principal Occupation |
| |
| Peter S. Lynch (62) |
| |
| Year of Election or Appointment: 2003 |
| Member of the Advisory Board of Fidelity Select Portfolios. Vice Chairman and a Director of FMR, and Vice Chairman |
| (2001-present) and a Director (2000-present) of FMR Co., Inc. Previously, Mr. Lynch served as a Trustee of the Fidelity funds |
| (1990-2003). In addition, he serves as a Trustee of Boston College, Massachusetts Eye & Ear Infirmary, Historic Deerfield, John F. |
| Kennedy Library, and the Museum of Fine Arts of Boston. |
| |
| Eric D. Roiter (57) |
| |
| Year of Election or Appointment: 1998 |
| Secretary of Energy, Energy Service, Gold, Natural Gas, Natural Resources, and Paper and Forest Products. He also serves as |
| Secretary of other Fidelity funds; Vice President, General Counsel, and Secretary of FMR Co., Inc. (2001-present) and FMR; |
| Assistant Secretary of Fidelity Management & Research (U.K.) Inc. (2001-present), Fidelity Research & Analysis Company |
| (2001-present), and Fidelity Investments Money Management, Inc. (2001-present). Mr. Roiter is an Adjunct Member, Faculty of |
| Law, at Boston College Law School (2003-present). Previously, Mr. Roiter served as Vice President and Secretary of Fidelity |
| Distributors Corporation (FDC) (1998-2005). |
| |
| Stuart Fross (46) |
| |
| Year of Election or Appointment: 2003 |
| Assistant Secretary of Energy, Energy Service, Gold, Natural Gas, Natural Resources, and Paper and Forest Products. Mr. Fross |
| also serves as Assistant Secretary of other Fidelity funds (2003-present), Vice President and Secretary of FDC (2005-present), and |
| is an employee of FMR. |
| |
| Christine Reynolds (47) |
| |
| Year of Election or Appointment: 2004 |
| President and Treasurer of Energy, Energy Service, Gold, Natural Gas, Natural Resources, and Paper and Forest Products. Ms. |
| Reynolds also serves as President and Treasurer of other Fidelity funds (2004-present) and is a Vice President (2003-present) and |
| an employee (2002-present) of FMR. Before joining Fidelity Investments, Ms. Reynolds worked at PricewaterhouseCoopers LLP |
| (PwC) (1980-2002), where she was most recently an audit partner with PwC’s investment management practice. |
| |
| R. Stephen Ganis (39) |
| |
| Year of Election or Appointment: 2006 |
| Anti-Money Laundering (AML) officer of Energy, Energy Service, Gold, Natural Gas, Natural Resources, and Paper and Forest |
| Products. Mr. Ganis also serves as AML officer of other Fidelity funds (2006-present) and FMR Corp. (2003-present). Before join- |
| ing Fidelity Investments, Mr. Ganis practiced law at Goodwin Procter, LLP (2000-2002). |
| |
| Paul M. Murphy (58) |
| |
| Year of Election or Appointment: 2005 |
| Chief Financial Officer of Energy, Energy Service, Gold, Natural Gas, Natural Resources, and Paper and Forest Products. Mr. |
| Murphy also serves as Chief Financial Officer of other Fidelity funds (2005-present). He also serves as Senior Vice President of |
| Fidelity Pricing and Cash Management Services Group (FPCMS). |
| |
| Kenneth A. Rathgeber (58) |
| |
| Year of Election or Appointment: 2004 |
| Chief Compliance Officer of Energy, Energy Service, Gold, Natural Gas, Natural Resources, and Paper and Forest Products. Mr. |
| Rathgeber also serves as Chief Compliance Officer of other Fidelity funds (2004-present) and Executive Vice President of Risk |
| Oversight for Fidelity Investments (2002-present). He is Chief Compliance Officer of FMR (2005-present), FMR Co., Inc. |
| (2005-present), Fidelity Management & Research (U.K.) Inc. (2005-present), Fidelity Research & Analysis Company |
| (2005-present), Fidelity Investments Money Management, Inc. ( 2005-present), and Strategic Advisers, Inc. (2005-present). Pre- |
| viously, Mr. Rathgeber served as Executive Vice President and Chief Operating Officer for Fidelity Investments Institutional Services |
| Company, Inc. (1998-2002). |
| |
| Bryan A. Mehrmann (44) |
| |
| Year of Election or Appointment: 2005 |
| Deputy Treasurer of Energy, Energy Service, Gold, Natural Gas, Natural Resources, and Paper and Forest Products. Mr. |
| Mehrmann also serves as Deputy Treasurer of other Fidelity funds (2005-present) and is an employee of FMR. Previously, Mr. |
| Mehrmann served as Vice President of Fidelity Investments Institutional Services Group (FIIS)/Fidelity Investments Institutional |
| Operations Corporation, Inc. (FIIOC) Client Services (1998-2004). |
Annual Report 76
| Name, Age; Principal Occupation |
| |
| Kimberley H. Monasterio (42) |
| |
| Year of Election or Appointment: 2004 |
| Deputy Treasurer of Energy, Energy Service, Gold, Natural Gas, Natural Resources, and Paper and Forest Products. Ms. Monas- |
| terio also serves as Deputy Treasurer of other Fidelity funds (2004) and is an employee of FMR (2004). Before joining Fidelity |
| Investments, Ms. Monasterio served as Treasurer (2000-2004) and Chief Financial Officer (2002-2004) of the Franklin Templeton |
| Funds and Senior Vice President of Franklin Templeton Services, LLC (2000-2004). |
| |
| Kenneth B. Robins (36) |
| |
| Year of Election or Appointment: 2005 |
| Deputy Treasurer of Energy, Energy Service, Gold, Natural Gas, Natural Resources, and Paper and Forest Products. Mr. Robins |
| also serves as Deputy Treasurer of other Fidelity funds (2005-present) and is an employee of FMR (2004-present). Before joining |
| Fidelity Investments, Mr. Robins worked at KPMG LLP, where he was a partner in KPMG’s department of professional practice |
| (2002-2004) and a Senior Manager (1999-2000). In addition, Mr. Robins served as Assistant Chief Accountant, United States |
| Securities and Exchange Commission (2000-2002). |
| |
| Robert G. Byrnes (39) |
| |
| Year of Election or Appointment: 2005 |
| Assistant Treasurer of Energy, Energy Service, Gold, Natural Gas, Natural Resources, and Paper and Forest Products. Mr. Byrnes |
| also serves as Assistant Treasurer of other Fidelity funds (2005-present) and is an employee of FMR (2005-present). Previously, Mr. |
| Byrnes served as Vice President of FPCMS (2003-2005). Before joining Fidelity Investments, Mr. Byrnes worked at Deutsche Asset |
| Management where he served as Vice President of the Investment Operations Group (2000-2003). |
| |
| John H. Costello (59) |
| |
| Year of Election or Appointment: 1986 |
| Assistant Treasurer of Energy, Energy Service, Gold, Natural Gas, Natural Resources, and Paper and Forest Products. Mr. Costello |
| also serves as Assistant Treasurer of other Fidelity funds and is an employee of FMR. |
| |
| Peter L. Lydecker (52) |
| |
| Year of Election or Appointment: 2004 |
| Assistant Treasurer of Energy, Energy Service, Gold, Natural Gas, Natural Resources, and Paper and Forest Products. Mr. Lydecker |
| also serves as Assistant Treasurer of other Fidelity funds (2004) and is an employee of FMR. |
| |
| Mark Osterheld (50) |
| |
| Year of Election or Appointment: 2002 |
| Assistant Treasurer of Energy, Energy Service, Gold, Natural Gas, Natural Resources, and Paper and Forest Products. Mr. |
| Osterheld also serves as Assistant Treasurer of other Fidelity funds (2002) and is an employee of FMR. |
| |
| Gary W. Ryan (47) |
| |
| Year of Election or Appointment: 2005 |
| Assistant Treasurer of Energy, Energy Service, Gold, Natural Gas, Natural Resources, and Paper and Forest Products. Mr. Ryan |
| also serves as Assistant Treasurer of other Fidelity funds (2005-present) and is an employee of FMR (2005-present). Previously, Mr. |
| Ryan served as Vice President of Fund Reporting in FPCMS (1999-2005). |
| |
| Salvatore Schiavone (40) |
| |
| Year of Election or Appointment: 2005 |
| Assistant Treasurer of Energy, Energy Service, Gold, Natural Gas, Natural Resources, and Paper and Forest Products. Mr. |
| Schiavone also serves as Assistant Treasurer of other Fidelity funds (2005-present) and is an employee of FMR (2005-present). |
| Before joining Fidelity Investments, Mr. Schiavone worked at Deutsche Asset Management, where he most recently served as |
| Assistant Treasurer (2003-2005) of the Scudder Funds and Vice President and Head of Fund Reporting (1996-2003). |
77 Annual Report
The Board of Trustees of each fund voted to pay to shareholders of record at the opening of business on record date, the following distributions per share derived from capital gains realized from sales of portfolio securities, and dividends derived from net investment income:
| | | Pay Date | | Record Date | | Dividends | | Capital Gains |
| Energy | | 4/10/06 | | 4/7/06 | | $0.020 | | $ | | 2.350 |
| Energy Service | | 4/10/06 | | 4/7/06 | | $ — | | $ | | 1.600 |
| Gold | | 4/10/06 | | 4/7/06 | | $0.020 | | $ | | 4.040 |
| Natural Gas | | 4/10/06 | | 4/7/06 | | $ — | | $ | | 1.170 |
| Natural Resources | | 4/10/06 | | 4/7/06 | | $0.010 | | $ | | 0.670 |
| Paper and Forest Products | | 4/10/06 | | 4/7/06 | | $0.530 | | $ | | — |
The funds hereby designate as capital gain dividend the amounts noted below for the taxable year ended, or, if subsequently determined to be different, the net capital gain of such year.
| | | 2006 |
| Energy | | $ 99,451,990 |
| Energy Service | | $ 37,349,357 |
| Gold | | $ 132,598,478 |
| Natural Gas | | $ 91,078,711 |
| Natural Resources | | $ 23,819,585 |
A percentage of the dividends distributed during the fiscal year for the following funds qualifies for the dividends-received deduction for corporate shareholders:
| Energy | | April 2005 | | 17% |
| | | December 2005 | | 28% |
| Gold | | April 2005 | | 8% |
| | | December 2005 | | 93% |
| Natural Gas | | April 2005 | | 5% |
| | | December 2005 | | 20% |
| Natural Resources | | April 2005 | | 16% |
| | | December 2005 | | 33% |
| Paper and Forest Products | | April 2005 | | 100% |
| | | December 2005 | | 100% |
A percentage of the dividends distributed during the fiscal year for the following funds may be taken into account as a dividend for purposes of the maximum rate under section 1(h)(11) of the Internal Revenue Code.
| Energy | | April 2005 | | 37% |
| | | December 2005 | | 40% |
| Gold | | April 2005 | | 43% |
| | | December 2005 | | 100% |
| Natural Gas | | April 2005 | | 6% |
| | | December 2005 | | 31% |
| Natural Resources | | April 2005 | | 38% |
| | | December 2005 | | 49% |
| Paper and Forest Products | | April 2005 | | 100% |
| | | December 2005 | | 100% |
The amounts per share which represent income derived from sources within, and taxes paid to, foreign countries or possessions of the United States are as follows:
| Fund | | Pay Date | | | | Income | | | | Taxes |
| Gold | | 4/11/05 | | $ | | 0.062 | | $ | | 0.0002 |
| | | 12/12/05 | | $ | | 0.021 | | $ | | 0.0007 |
The funds will notify shareholders in January 2007 of amounts for use in preparing 2006 income tax returns.
79 Annual Report
Board Approval of Investment Advisory Contracts and Management Fees
Select Energy
Select Energy Service
Select Gold
Select Natural Gas
Select Natural Resources
Select Paper and Forest Products
|
On January 19, 2006, the Board of Trustees, including the Independent Trustees (together, the Board), voted to approve a general research services agreement (the Agreement) between FMR, FMR Co., Inc. (FMRC), Fidelity Investments Money Management, Inc. (FIMM), and Fidelity Research & Analysis Company (FRAC) (together, the Investment Advisers) for each fund, effective January 20, 2006, pursuant to which FRAC may provide general research and investment advisory support services to FMRC and FIMM. The Board considered that it has approved previously various sub-advisory agreements for each fund with affiliates of FMR that allow FMR to obtain research, non-discretionary advice, or discretionary portfolio management at no additional expense to each fund. The Board, assisted by the advice of fund counsel and independent Trustees’ counsel, considered a broad range of information and determined that it would be beneficial for each fund to access the research and investment advisory support services supplied by FRAC at no additional expense to each fund.
The Board reached this determination in part because the new arrangement will involve no changes in (i) the contractual terms of and fees payable under each fund’s management contract or sub-advisory agreements; (ii) the investment process or strategies employed in the management of each fund’s assets; (iii) the nature or level of services provided under each fund’s management contract or sub-advisory agreements; (iv) the day-to-day management of each fund or the persons primarily responsible for such management; or (v) the ultimate control or beneficial ownership of FMR, FMRC, or FIMM. The Board also considered that the establishment of each Agreement would not necessitate prior shareholder approval of the Agreement or result in an assignment and termination of each fund’s management contract or sub-advisory agreements under the Investment Company Act of 1940.
Because the Board was approving an arrangement with FRAC under which each fund will not bear any additional management fees or expenses and under which each fund’s portfolio manager would not change, it did not consider each fund’s investment performance, competitiveness of management fee and total expenses, costs of services and profitability, or economies of scale to be significant factors in its decision.
In connection with its future renewal of each fund’s management contract and sub-advisory agreements, the Board will consider: (i) the nature, extent, and quality of services provided to each fund, including shareholder and administrative services and investment performance; (ii) the competitiveness of each fund’s management fee and total expenses; (iii) the costs of the services and profitability, including the revenues earned and the expenses incurred by Fidelity in conducting the business of developing, marketing, distributing, managing, administering, and servicing each fund and its shareholders; and (iv) whether there have been economies of scale in respect of the management of the Fidelity funds, whether the Fidelity funds (including each fund) have appropriately benefited from any such economies of scale, and whether there is potential for realization of any further economies.
Based on its evaluation of all of the conclusions noted above, and after considering all material factors, the Board ultimately concluded that each fund’s Agreement is fair and reasonable, and that each fund’s Agreement should be approved.
Managing Your Investments
Fidelity offers several ways to conveniently manage your personal investments via your telephone or PC. You can access your account information, conduct trades and research your investments 24 hours a day.
By Phone
Fidelity Automated Service Telephone provides a single toll-free number to access account balances, positions, quotes and trading. It’s easy to navigate the service, and on your first call, the system will help you create a personal identification number (PIN) for security.

By PC
Fidelity’s web site on the Internet provides a wide range of information, including daily financial news, fund performance, interactive planning tools and news about Fidelity products and services.

* When you call the quotes line, please remember that a fund’s yield and return will vary and, except for money market funds, share price will also vary. This means
that you may have a gain or loss when you sell your shares. There is no assurance that money market funds will be able to maintain a stable $1 share price; an
investment in a money market fund is not insured or guaranteed by the U.S. government. Total returns are historical and include changes in share price, reinvest-
ment of dividends and capital gains, and the effects of any sales charges.
81 81 Annual Report
|
To Write Fidelity
We’ll give your correspondence immediate attention and send you written confirmation upon completion of your request.
Annual Report 82
Investment Adviser
Fidelity Management & Research Company
Boston, MA
Investment Sub-Advisers
FMR Co., Inc.
Fidelity Management & Research (U.K.) Inc.
Fidelity Research & Analysis Company (formerly Fidelity Management & Research (Far East) Inc.)
Fidelity Investments Japan Limited
Fidelity International Investment Advisors
Fidelity International Investment Advisors (U.K. Limited)
General Distributor
Fidelity Distributors Corporation
Boston, MA
Transfer and Service Agent
Fidelity Service Company, Inc.
Boston, MA
Custodian
Brown Brothers Harriman & Co.
Boston, MA
Corporate Headquarters
82 Devonshire Street
Boston, MA 02109
1-800-544-8888
The Fidelity Telephone Connection
Mutual Fund 24-Hour Service
Exchanges/Redemptions
and Account Assistance 1-800-544-6666
Product Information 1-800-544-8888
Retirement Accounts 1-800-544-4774
(8 a.m. - 9 p.m.)
TDD Service 1-800-544-0118
for the deaf and hearing impaired
(9 a.m. - 9 p.m. Eastern time)
Fidelity Automated Service
Telephone (FAST®) (automated graphic) 1-800-544-5555
| | (automated graphic) Automated line for quickest service
|

| SELNR-UANN-0406 | | Corporate Headquarters |
| 1.813647.101 | | 82 Devonshire St., Boston, MA 02109 |
| | | www.fidelity.com |
Fidelity®
Select Portfolios®
Technology Sector
Business Services and Outsourcing
Computers
Developing Communications
Electronics
Networking and Infrastructure
Software and Computer Services
Technology
Annual Report
February 28, 2006


| Contents | | |
| |
| Chairman’s Message | | 3 |
| Shareholder Expense Example | | 4 |
| Fund Updates* | | |
| Technology Sector | | |
| Business Services and Outsourcing | | 6 |
| Computers | | 16 |
| Developing Communications | | 25 |
| Electronics | | 36 |
| Networking and Infrastructure | | 47 |
| Software and Computer Services | | 58 |
| Technology | | 69 |
| Notes to Financial Statements | | 82 |
| Report of Independent Registered | | 88 |
| Public Accounting Firm | | |
| Trustees and Officers | | 89 |
| Distributions | | 94 |
| Board Approval of Investment | | 95 |
| Advisory Contracts and | | |
| Management Fees | | |
* Fund updates for each Select Portfolio include: Performance, Management’s Discussion of Fund Performance, Investment Changes, Investments, and Financial Statements.
To view a fund’s proxy voting guidelines and proxy voting record for the 12-month period ended June 30, visit www.fidelity.com/proxyvotingresults or visit the Securities and Exchange Commission’s (SEC) web site at www.sec.gov. You may also call 1-800-544-8544 to request a free copy of the proxy voting guidelines.
Standard & Poor’s, S&P and S&P 500 are registered service marks of The McGraw-Hill Companies, Inc. and have been licensed for use by Fidelity Distributors Corporation.
Other third party marks appearing herein are the property of their respective owners.
All other marks appearing herein are registered or unregistered trademarks or service marks of FMR Corp. or an affiliated company.
This report and the financial statements contained herein are submitted for the general information of the shareholders of the funds. This report is not authorized for distribution to prospective investors in the funds unless preceded or accompanied by an effective prospectus.
A fund files its complete schedule of portfolio holdings with the SEC for the first and third quarters of each fiscal year on Form N-Q. Forms N-Q are available on the SEC’s web site at http://www.sec.gov. A fund’s Forms N-Q may be reviewed and copied at the SEC’s Public Reference Room in Washing-ton, DC. Information regarding the operation of the SEC’s Public Reference Room may be obtained by calling 1-800-SEC-0330. For a complete list of a fund’s portfolio holdings, view the most recent quarterly holdings report, semiannual report, or annual report on Fidelity’s web site at http://www.fidelity.com/holdings.
NOT FDIC INSURED · MAY LOSE VALUE · NO BANK GUARANTEE
Neither the funds nor Fidelity Distributors Corporation is a bank.
|
(Photograph of Edward C. Johnson 3d.)
Although many securities markets made gains in early 2006, there is only one certainty when it comes to investing: There is no sure thing. There are, however, a number of time-tested, fundamental investment principles that can put the historical odds in your favor.
One of the basic tenets is to invest for the long term. Over time, riding out the markets’ inevitable ups and downs has proven much more effective than selling into panic or chasing the hottest trend. Even missing only a few of the markets’ best days can significantly diminish investor returns. Patience also affords the benefits of compounding — of earning interest on additional income or reinvested dividends and capital gains. There are tax advantages and cost benefits to consider as well. The more you sell, the more taxes you pay, and the more you trade, the higher the costs. While staying the course doesn’t eliminate risk, it can considerably lessen the effect of short-term declines.
You can further manage your investing risk through diversification. And today, more than ever, geographic diversification should be taken into account. Studies
indicate that asset allocation is the single most important determinant of a portfolio’s long-term success. The right mix of stocks, bonds and cash — aligned to your particular risk tolerance and investment objective — is very important. Age-appropriate rebalancing is also an essential aspect of asset allocation. For younger investors, an emphasis on equities — which historically have been the best performing asset class over time — is encouraged. As investors near their specific goal, such as retirement or sending a child to college, consideration may be given to replacing volatile assets (e.g. common stocks) with more-stable fixed investments (bonds or savings plans).
A third investment principle — investing regularly — can help lower the average cost of your purchases. Investing a certain amount of money each month or quarter helps ensure you won’t pay for all your shares at market highs. This strategy — known as dollar cost averaging — also reduces unconstructive “emotion” from investing, helping shareholders avoid selling weak performers just prior to an upswing, or chasing a hot performer just before a correction.
We invite you to contact us via the Internet, through our Investor Centers or over the phone. It is our privilege to provide you the information you need to make the investments that are right for you.

3 Annual Report
Shareholder Expense Example
|
As a shareholder of a Fund, you incur two types of costs: (1) transaction costs, including redemption fees and exchange fees, and (2) ongoing costs, including management fees and other Fund expenses. This Example is intended to help you understand your ongoing costs (in dollars) of investing in the Funds and to compare these costs with the ongoing costs of investing in other mutual funds.
The Example is based on an investment of $1,000 invested at the beginning of the period and held for the entire period (September 1, 2005 to Febru-ary 28, 2006).
Actual Expenses
The first line of the table below for each fund provides information about actual account values and actual expenses. You may use the information in this line, together with the amount you invested, to estimate the expenses that you paid over the period. Simply divide your account value by $1,000.00 (for example, an $8,600 account value divided by $1,000.00 = 8.6), then multiply the result by the number in the first line for a fund under the heading entitled “Expenses Paid During Period” to estimate the expenses you paid on your account during this period. A small balance maintenance fee of $12.00 that is charged once a year may apply for certain accounts with a value of less than $2,000. This fee is not included in the table below. If it was, the estimate of expenses you paid during the period would be higher, and your ending account value lower, by this amount.
Hypothetical Example for Comparison Purposes
The second line of the table below for each fund provides information about hypothetical account values and hypothetical expenses based on a fund’s actual expense ratio and an assumed rate of return of 5% per year before expenses, which is not the Fund’s actual return. The hypothetical account values and expenses may not be used to estimate the actual ending account balance or expenses you paid for the period. You may use this information to compare the ongoing costs of investing in the Fund and other funds. To do so, compare this 5% hypothetical example with the 5% hypothetical examples that appear in the shareholder reports of the other funds. A small balance maintenance fee of $12.00 that is charged once a year may apply for certain accounts with a value of less than $2,000. This fee is not included in the table below. If it was, the estimate of expenses you paid during the period would be higher, and your ending account value lower, by this amount.
Please note that the expenses shown in the table are meant to highlight your ongoing costs only and do not reflect any transaction costs. Therefore, the second line of the table is useful in comparing ongoing costs only, and will not help you determine the relative total costs of owning different funds. In addition, if these transactional costs were included, your costs would have been higher.
| | | | | | | Expenses Paid |
| | | Beginning | | Ending | | During Period* |
| | | Account Value | | Account Value | | September 1, 2005 to |
| | | September 1, 2005 | | February 28, 2006 | | February 28, 2006 |
| Business Services and Outsourcing Portfolio | | | | | | | | |
| Actual | | $ 1,000.00 | | $ 1,132.60 | | $ | | 6.50 |
| HypotheticalA | | $ 1,000.00 | | $ 1,018.70 | | $ | | 6.16 |
| Computers Portfolio | | | | | | | | |
| Actual | | $ 1,000.00 | | $ 1,054.50 | | $ | | 5.25** |
| HypotheticalA | | $ 1,000.00 | | $ 1,019.69 | | $ | | 5.16** |
| Developing Communications Portfolio | | | | | | | | |
| Actual | | $ 1,000.00 | | $ 1,147.80 | | $ | | 5.54 |
| HypotheticalA | | $ 1,000.00 | | $ 1,019.64 | | $ | | 5.21 |
| Electronics Portfolio | | | | | | | | |
| Actual | | $ 1,000.00 | | $ 1,109.00 | | $ | | 4.86 |
| HypotheticalA | | $ 1,000.00 | | $ 1,020.18 | | $ | | 4.66 |
| Networking and Infrastructure Portfolio | | | | | | | | |
| Actual | | $ 1,000.00 | | $ 1,167.40 | | $ | | 6.13 |
| HypotheticalA | | $ 1,000.00 | | $ 1,019.14 | | $ | | 5.71 |
| Software and Computer Services Portfolio | | | | | | | | |
| Actual | | $ 1,000.00 | | $ 1,071.70 | | $ | | 4.83 |
| HypotheticalA | | $ 1,000.00 | | $ 1,020.13 | | $ | | 4.71 |
| Technology Portfolio | | | | | | | | |
| Actual | | $ 1,000.00 | | $ 1,069.70 | | $ | | 5.03** |
| HypotheticalA | | $ 1,000.00 | | $ 1,019.93 | | $ | | 4.91** |
A 5% return per year before expenses
* Expenses are equal to each Fund’s annualized expense ratio (shown in the table below); multiplied by the average account value over the period, multiplied by 181/365 (to reflect the one-half year period).
| | | Annualized |
| | | Expense Ratio |
| Business Services and Outsourcing Portfolio | | 1.23% |
| Computers Portfolio | | 1.03%** |
| Developing Communications Portfolio | | 1.04% |
| Electronics Portfolio | | 93% |
| Networking and Infrastructure Portfolio | | 1.14% |
| Software and Computer Services Portfolio | | 94% |
| Technology Portfolio | | 98%** |
** If contractual expense reductions, effective January 1, 2006, had been in effect during the entire period, the annualized expense ratios and the expenses paid in the actual and hypothetical examples above would have been as follows:
| | | Annualized | | | | |
| | | Expense Ratio | | | | Expenses Paid |
| Computers Portfolio | | 1.00% | | | | |
| Actual | | | | $ | | 5.09 |
| HypotheticalA | | | | $ | | 5.01 |
| Technology Portfolio | | 0.95% | | | | |
| Actual | | | | $ | | 4.88 |
| HypotheticalA | | | | $ | | 4.76 |
| A 5% return per year before expenses | | | | | | |
55 Annual Report
Business Services and Outsourcing Portfolio
|
Average annual total return reflects the change in the value of an investment, assuming reinvestment of the fund’s dividend income and capital gains (the profits earned upon the sale of securities that have grown in value) and assuming a constant rate of performance each year. The $10,000 table and the fund’s returns do not reflect the deduction of taxes that a shareholder would pay on fund distributions or the redemption of fund shares. During periods of reimbursement by Fidelity, a fund’s total returns will be greater than it would be had the reimbursement not occurred. How a fund did yesterday is no guarantee of how it will do tomorrow.
| Average Annual Total Returns | | | | | | |
| Periods ended February 28, 2006 | | Past 1 | | Past 5 | | Life of |
| | | year | | years | | fundA |
| Select Business Services and Outsourcing | | 17.14% | | 4.98% | | 10.66% |
| |
| A From February 4, 1998 | | | | | | |
$10,000 Over Life of Fund
Let’s say hypothetically that $10,000 was invested in Fidelity® Select Business Services and Outsourcing Portfolio on February 4, 1998, when the fund started. The chart shows how the value of your investment would have changed, and also shows how the S&P 500® Index performed over the same period.
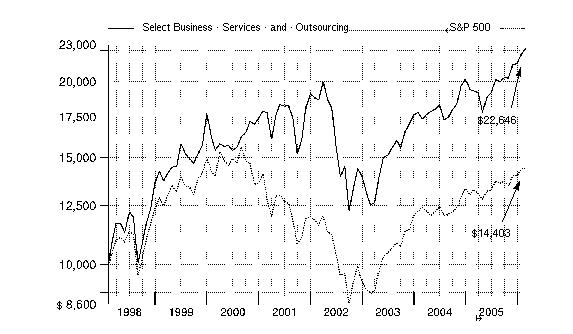
Business Services and Outsourcing Portfolio
|
Management’s Discussion of Fund Performance
Comments from Nicola Stafford, who managed Fidelity® Select Business Services and Outsourcing Portfolio during the period covered by this report
With the exception of several popular large-cap stock performance measures, most major U.S. equity benchmarks had double-digit returns for the year ending February 28, 2006. For much of the period, market gains were driven largely by the energy sector, although utilities ultimately sneaked into the top spot for the year overall. Financials and telecommunication services also reached double figures, outperforming the 8.40% return of the broader market as measured by the large-cap-oriented Standard & Poor’s 500SM Index. The consumer discretionary segment — home to the weak performing automobile and media industries — was the biggest disappointment. Although the overall return for the S&P 500® beat the small-cap Russell 2000® Index in calendar year 2005 — the first time that’s happened in six years — small-caps stormed back in early 2006, leading to a 16.59% advance during the past 12 months, nearly twice the broader market’s gain. Mid-caps soared even higher, returning 17.67% according to the Russell Midcap® Index. The technology-heavy NASDAQ Composite® Index also fared well, climbing 12.13%, but the Dow Jones Industrial AverageSM, an index of 30 large-cap, blue-chip stocks, managed to rise only 4.52% .
Fidelity Select Business Services and Outsourcing Portfolio was up 17.14% for the 12-month period ending February 28, 2006, solidly outperforming the S&P 500 and the 11.34% return for the Goldman Sachs® Technology Index. Overweighted positions in the information technology (IT) consulting group — especially in India-based companies — and in data processing and outsourced services companies made the biggest contributions to the fund’s performance relative to its sector index. Good stock selection in these areas also helped. An out-of-benchmark stake in asset management and custody banks further aided returns, as did not owning some major computer hardware and semiconductor companies in the index — including Dell and Intel, respectively — that underperformed. Among the fund’s top contributors were domestic IT consulting services firm Accenture, payroll outsourcing firm Ceridian and Affiliated Computer Services, a business process outsourcing company. In terms of disappointments, advertising and marketing company Omnicom and The BISYS Group, which provides outsourcing and back-office services to corporations, held back the fund’s overall returns. Elsewhere, the fund was hurt by weak stock picking in education services and advertising, as well as by a lack of exposure to strong performing groups in the index, namely communications equipment and computer storage/peripherals. Another drag on performance came from not owning some computer hardware and communications equipment companies — including benchmark components Hewlett-Packard and Corning, respectively — that fared particularly well.
Note to shareholders: James Morrow and Benjamin Hesse were named co-managers of the fund on March 1, 2006.
The views expressed above reflect those of the portfolio manager(s) only through the end of the period as stated on the cover of this report and do not necessarily represent the views of Fidelity or any other person in the Fidelity organization. Any such views are subject to change at any time based upon market or other conditions and Fidelity disclaims any responsibility to update such views. These views may not be relied on as investment advice and, because investment decisions for a Fidelity fund are based on numerous factors, may not be relied on as an indication of trading intent on behalf of any Fidelity fund.
77 Annual Report
| Business Services and Outsourcing Portfolio |
| Investment Changes | | |
| |
| |
| Top Ten Stocks as of February 28, 2006 |
| | | % of fund’s | | % of fund’s net assets |
| | | net assets | | 6 months ago |
| First Data Corp. | | 8.5 | | 5.2 |
| Affiliated Computer Services, Inc. | | | | |
| Class A | | 8.3 | | 7.3 |
| Accenture Ltd. Class A | | 6.5 | | 6.2 |
| State Street Corp. | | 5.1 | | 3.4 |
| Automatic Data Processing, Inc. | | 4.7 | | 1.1 |
| Ceridian Corp. | | 4.0 | | 4.2 |
| Paychex, Inc. | | 3.7 | | 5.6 |
| Alliance Data Systems Corp. | | 3.3 | | 3.0 |
| Electronic Data Systems Corp. | | 2.8 | | 0.0 |
| Cognizant Technology Solutions | | | | |
| Corp. Class A | | 2.7 | | 2.2 |
| | | 49.6 | | |
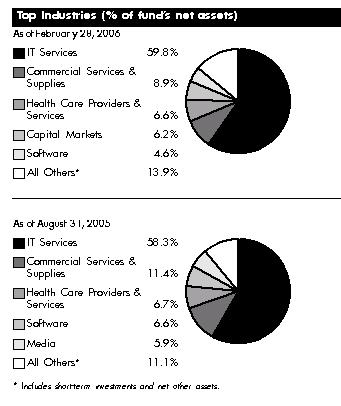
Annual Report 8
| Business Services and Outsourcing Portfolio | | | | | | |
| Investments February 28, 2006 | | | | |
| Showing Percentage of Net Assets | | | | | | |
| |
| Common Stocks — 97.8% | | | | | | |
| | | | | Shares | | Value (Note 1) |
| |
| CAPITAL MARKETS – 6.2% | | | | | | |
| Asset Management & Custody Banks – 5.1% | | | | | | |
| State Street Corp. | | | | 32,200 | | $ 2,011,856 |
| Investment Banking & Brokerage – 1.1% | | | | | | |
| TD Ameritrade Holding Corp. | | | | 18,800 | | 409,088 |
| |
| TOTAL CAPITAL MARKETS | | | | | | 2,420,944 |
| |
| COMMERCIAL SERVICES & SUPPLIES – 8.9% | | | | | | |
| Commercial Printing – 0.7% | | | | | | |
| Banta Corp. | | | | 5,800 | | 282,518 |
| Diversified Commercial & Professional Services – 5.0% | | | | | | |
| ChoicePoint, Inc. (a) | | | | 2,100 | | 93,240 |
| Cintas Corp. | | | | 19,700 | | 809,473 |
| Dun & Bradstreet Corp. (a) | | | | 2,900 | | 210,946 |
| Equifax, Inc. | | | | 10,800 | | 395,712 |
| Exponent, Inc. (a) | | | | 5,700 | | 181,260 |
| First Advantage Corp. Class A (a) | | | | 5,400 | | 128,628 |
| Navigant Consulting, Inc. (a) | | | | 7,800 | | 152,022 |
| | | | | | | 1,971,281 |
| Human Resource & Employment Services – 3.2% | | | | | | |
| Capita Group PLC | | | | 13,700 | | 114,151 |
| CDI Corp. | | | | 3,900 | | 95,511 |
| Kforce, Inc. (a) | | | | 10,400 | | 125,944 |
| Korn/Ferry International (a) | | | | 9,100 | | 191,555 |
| Robert Half International, Inc. | | | | 20,600 | | 739,952 |
| | | | | | | 1,267,113 |
| |
| TOTAL COMMERCIAL SERVICES & SUPPLIES | | | | | | 3,520,912 |
| |
| COMPUTERS & PERIPHERALS – 1.1% | | | | | | |
| Computer Hardware – 1.1% | | | | | | |
| Apple Computer, Inc. (a) | | | | 2,400 | | 164,496 |
| International Business Machines Corp. | | | | 3,400 | | 272,816 |
| | | | | | | 437,312 |
| Computer Storage & Peripherals – 0.0% | | | | | | |
| Electronics for Imaging, Inc. (a) | | | | 100 | | 2,682 |
| |
| TOTAL COMPUTERS & PERIPHERALS | | | | | | 439,994 |
| |
| DIVERSIFIED CONSUMER SERVICES – 2.3% | | | | | | |
| Education Services – 2.0% | | | | | | |
| Apollo Group, Inc. Class A (a) | | | | 16,146 | | 797,289 |
| Specialized Consumer Services – 0.3% | | | | | | |
| H&R Block, Inc. | | | | 600 | | 13,380 |
| Weight Watchers International, Inc. (a) | | | | 2,000 | | 104,940 |
| | | | | | | 118,320 |
| |
| TOTAL DIVERSIFIED CONSUMER SERVICES | | | | | | 915,609 |
See accompanying notes which are an integral part of the financial statements.
|
9
| Business Services and Outsourcing Portfolio | | | | |
| Investments - continued | | | | |
| |
| |
| |
| | | Shares | | Value (Note 1) |
| |
| DIVERSIFIED FINANCIAL SERVICES – 2.8% | | | | |
| Specialized Finance – 2.8% | | | | |
| Moody’s Corp. | | 14,900 | | $ 998,300 |
| NETeller PLC (a) | | 8,300 | | 109,487 |
| | | | | 1,107,787 |
| |
| HEALTH CARE PROVIDERS & SERVICES – 6.6% | | | | |
| Health Care Services – 6.4% | | | | |
| DaVita, Inc. (a) | | 13,700 | | 799,943 |
| IMS Health, Inc. | | 28,678 | | 691,140 |
| Quest Diagnostics, Inc. | | 19,300 | | 1,020,391 |
| | | | | 2,511,474 |
| Managed Health Care – 0.2% | | | | |
| Health Net, Inc. (a) | | 2,200 | | 105,490 |
| |
| TOTAL HEALTH CARE PROVIDERS & SERVICES | | | | 2,616,964 |
| |
| INTERNET SOFTWARE & SERVICES – 0.5% | | | | |
| Internet Software & Services – 0.5% | | | | |
| Google, Inc. Class A (sub. vtg.) (a) | | 500 | | 181,310 |
| IT SERVICES – 59.8% | | | | |
| Data Processing & Outsourced Services – 44.7% | | | | |
| Affiliated Computer Services, Inc. Class A (a) | | 52,200 | | 3,284,424 |
| Alliance Data Systems Corp. (a) | | 30,500 | | 1,319,430 |
| Automatic Data Processing, Inc. | | 39,900 | | 1,842,981 |
| Ceridian Corp. (a) | | 61,400 | | 1,587,804 |
| Computer Sciences Corp. (a) | | 8,400 | | 456,456 |
| Convergys Corp. (a) | | 400 | | 6,948 |
| DST Systems, Inc. (a)(d) | | 4,900 | | 275,527 |
| eFunds Corp. (a) | | 4,900 | | 132,692 |
| Electronic Data Systems Corp. | | 41,700 | | 1,113,390 |
| Fidelity National Information Services, Inc. | | 25,100 | | 995,215 |
| First Data Corp. | | 73,800 | | 3,330,594 |
| Fiserv, Inc. (a) | | 8,700 | | 361,050 |
| Hewitt Associates, Inc. Class A (a) | | 6,600 | | 178,134 |
| Iron Mountain, Inc. (a) | | 10,700 | | 467,590 |
| MoneyGram International, Inc. | | 6,500 | | 186,355 |
| Paychex, Inc. | | 36,487 | | 1,461,304 |
| Sabre Holdings Corp. Class A | | 7,800 | | 188,214 |
| Syntel, Inc. | | 8,500 | | 144,500 |
| The BISYS Group, Inc. (a) | | 18,400 | | 259,624 |
| | | | | 17,592,232 |
| IT Consulting & Other Services – 15.1% | | | | |
| Accenture Ltd. Class A | | 77,800 | | 2,540,948 |
| BearingPoint, Inc. (a) | | 18,000 | | 160,380 |
| CACI International, Inc. Class A (a) | | 3,200 | | 192,864 |
| Cognizant Technology Solutions Corp. Class A (a) | | 18,708 | | 1,077,768 |
| Forrester Research, Inc. (a) | | 7,500 | | 169,575 |
| HCL Infosystems Ltd. | | 13,609 | | 54,083 |
| HCL Technologies Ltd. | | 43,854 | | 604,150 |
See accompanying notes which are an integral part of the financial statements.
Annual Report 10
| Common Stocks – continued | | | | |
| | | Shares | | Value (Note 1) |
| |
| IT SERVICES – CONTINUED | | | | |
| IT Consulting & Other Services – continued | | | | |
| Kanbay International, Inc. (a) | | 6,400 | | $ 108,672 |
| NCI, Inc. Class A | | 4,400 | | 61,424 |
| Ness Technologies, Inc. (a) | | 18,600 | | 208,692 |
| Sapient Corp. (a) | | 34,100 | | 255,750 |
| Satyam Computer Services Ltd. sponsored ADR | | 100 | | 4,115 |
| SRA International, Inc. Class A (a) | | 8,200 | | 283,064 |
| Unisys Corp. (a) | | 35,200 | | 235,136 |
| | | | | 5,956,621 |
| |
| TOTAL IT SERVICES | | | | 23,548,853 |
| |
| MEDIA – 3.6% | | | | |
| Advertising – 3.6% | | | | |
| Interpublic Group of Companies, Inc. (a) | | 791 | | 8,195 |
| Lamar Advertising Co. Class A (a) | | 14,300 | | 729,586 |
| Omnicom Group, Inc. | | 8,300 | | 662,506 |
| | | | | 1,400,287 |
| |
| OFFICE ELECTRONICS – 1.2% | | | | |
| Office Electronics – 1.2% | | | | |
| Xerox Corp. (a) | | 32,800 | | 488,720 |
| SOFTWARE – 4.6% | | | | |
| Application Software – 3.8% | | | | |
| Amdocs Ltd. (a) | | 10,200 | | 337,824 |
| BEA Systems, Inc. (a) | | 12,700 | | 145,669 |
| Intuit, Inc. (a) | | 9,000 | | 437,220 |
| NAVTEQ Corp. (a) | | 7,700 | | 356,587 |
| Open Solutions, Inc. (a) | | 8,100 | | 219,915 |
| | | | | 1,497,215 |
| Systems Software – 0.8% | | | | |
| Microsoft Corp. | | 11,900 | | 320,110 |
| |
| TOTAL SOFTWARE | | | | 1,817,325 |
| |
| |
| | | Shares | | Value (Note 1) |
| |
| TEXTILES, APPAREL & LUXURY GOODS – 0.2% | | | | |
| Apparel, Accessories & Luxury Goods – 0.2% | | | | |
| Quiksilver, Inc. (a) | | 4,900 | | $ 71,050 |
| TOTAL COMMON STOCKS | | | | |
| (Cost $30,317,846) | | | | 38,529,755 |
See accompanying notes which are an integral part of the financial statements.
|
11 Annual Report
11
| Business Services and Outsourcing Portfolio | | | | |
| Investments - continued | | | | |
| |
| Money Market Funds — 3.2% | | | | |
| Fidelity Cash Central Fund, 4.57% (b) | | 1,200,116 | | 1,200,116 |
| Fidelity Securities Lending Cash Central Fund, 4.58% (b)(c) | | 64,350 | | 64,350 |
| TOTAL MONEY MARKET FUNDS | | | | |
| (Cost $1,264,466) | | | | 1,264,466 |
| TOTAL INVESTMENT PORTFOLIO - 101.0% | | | | |
| (Cost $31,582,312) | | | | 39,794,221 |
| |
| NET OTHER ASSETS – (1.0)% | | | | (402,216) |
| NET ASSETS – 100% | | $ | | 39,392,005 |
(a) Non-income producing
(b) Affiliated fund that is available only to investment companies and other accounts managed by Fidelity Investments. The rate quoted is the annualized seven-day yield of the fund at period end. A complete unaudited listing of the fund’s holdings as of its most recent quarter end is available upon request.
(c) Investment made with cash collateral received from securities on loan. (d) Security or a portion of the security is on loan at period end.
Information regarding fiscal year to date income earned by the fund from the affiliated Central funds is as follows:
| Fund | | Income earned |
| Fidelity Cash Central Fund | | $ 29,030 |
| Fidelity Securities Lending Cash Central Fund | | 7,084 |
| Total | | $ 36,114 |
See accompanying notes which are an integral part of the financial statements.
|
| Business Services and Outsourcing Portfolio | | | | | | | | |
| |
| Financial Statements | | | | | | | | |
| |
| |
| Statement of Assets and Liabilities | | | | | | | | |
| | | | | | | | | February 28, 2006 |
| |
| Assets | | | | | | | | |
| Investment in securities, at value (including securities loaned of $61,853) — See accompanying schedule: | | | | | | | | |
| Unaffiliated issuers (cost $30,317,846) | | $ | | 38,529,755 | | | | |
| Affiliated Central Funds (cost $1,264,466) | | | | 1,264,466 | | | | |
| Total Investments (cost $31,582,312) | | | | | | $ | | 39,794,221 |
| Receivable for fund shares sold | | | | | | | | 206,334 |
| Dividends receivable | | | | | | | | 14,714 |
| Interest receivable | | | | | | | | 1,827 |
| Prepaid expenses | | | | | | | | 135 |
| Other affiliated receivables | | | | | | | | 8 |
| Other receivables | | | | | | | | 2,242 |
| Total assets | | | | | | | | 40,019,481 |
| |
| Liabilities | | | | | | | | |
| Payable for investments purchased | | $ | | 414,009 | | | | |
| Payable for fund shares redeemed | | | | 83,671 | | | | |
| Accrued management fee | | | | 17,961 | | | | |
| Other affiliated payables | | | | 12,592 | | | | |
| Other payables and accrued expenses | | | | 34,893 | | | | |
| Collateral on securities loaned, at value | | | | 64,350 | | | | |
| Total liabilities | | | | | | | | 627,476 |
| |
| Net Assets | | | | | | $ | | 39,392,005 |
| Net Assets consist of: | | | | | | | | |
| Paid in capital | | | | | | $ | | 29,313,557 |
| Accumulated undistributed net realized gain (loss) on investments and foreign currency transactions | | | | | | | | 1,873,413 |
| Net unrealized appreciation (depreciation) on investments | | | | | | | | 8,205,035 |
| Net Assets, for 2,259,396 shares outstanding | | | | | | $ | | 39,392,005 |
| |
| Net Asset Value, offering price and redemption price per share ($39,392,005 ÷ 2,259,396 shares) | | | | | | $ | | 17.43 |
| |
| Statement of Operations | | | | | | | | |
| | | | | | | | | Year ended February 28, 2006 |
| |
| Investment Income | | | | | | | | |
| Dividends | | | | | | $ | | 206,253 |
| Special dividends | | | | | | | | 116,385 |
| Interest | | | | | | | | 70 |
| Income from affiliated Central Funds | | | | | | | | |
| (including $7,084 from security lending) | | | | | | | | 36,114 |
| Total income | | | | | | | | 358,822 |
| |
| Expenses | | | | | | | | |
| Management fee | | $ | | 202,624 | | | | |
| Transfer agent fees | | | | 139,946 | | | | |
| Accounting and security lending fees | | | | | | | | |
| | | | | 18,275 | | | | |
| Independent trustees’ compensation | | | | 153 | | | | |
| Custodian fees and expenses | | | | 15,543 | | | | |
| Registration fees | | | | 18,843 | | | | |
| Audit | | | | 36,257 | | | | |
| Legal | | | | 481 | | | | |
| Miscellaneous | | | | 1,440 | | | | |
| Total expenses before reductions | | | | 433,562 | | | | |
| Expense reductions | | | | (13,757) | | | | 419,805 |
| |
| Net investment income (loss) | | | | | | | | (60,983) |
| Realized and Unrealized Gain (Loss) | | | | | | | | |
| Net realized gain (loss) on: | | | | | | | | |
| |
| See accompanying notes which are an integral part of the financial statements. | | | | | | | | |
13 Annual Report
| Business Services and Outsourcing Portfolio | | | | |
| Financial Statements - continued | | | | |
| |
| |
| Investment securities: | | | | |
| Unaffiliated issuers (net of foreign taxes of $65,541) | | 2,851,704 | | |
| Foreign currency transactions | | (3,295) | | |
| Total net realized gain (loss) | | | | 2,848,409 |
| Change in net unrealized appreciation (depreciation) on: | | | | |
| Investment securities (net of decrease in deferred foreign taxes of $126,092) | | 3,037,586 | | |
| Assets and liabilities in foreign currencies | | (95) | | |
| Total change in net unrealized appreciation (depreciation) | | | | 3,037,491 |
| Net gain (loss) | | | | 5,885,900 |
| Net increase (decrease) in net assets resulting from operations | | | | $5,824,917 |
See accompanying notes which are an integral part of the financial statements.
Annual Report 14
| Statement of Changes in Net Assets | | | | | | | | | | | | | | | | | | | | |
| | | | | | | | | | | Year ended | | | | Year ended |
| | | | | | | | | | | February 28, | | | | February 28, |
| | | | | | | | | | | 2006 | | | | 2005 |
| Increase (Decrease) in Net Assets | | | | | | | | | | | | | | | | | | | | |
| Operations | | | | | | | | | | | | | | | | | | | | |
| Net investment income (loss) | | | | | | | | | | $ | | (60,983) | | $ | | | | (255,059) |
| Net realized gain (loss) | | | | | | | | | | | | 2,848,409 | | | | | | 4,175,588 |
| Change in net unrealized appreciation (depreciation) | | | | | | | | | | | | 3,037,491 | | | | | | (461,461) |
| Net increase (decrease) in net assets resulting from operations | | | | | | | | | | | | 5,824,917 | | | | | | 3,459,068 |
| Distributions to shareholders from net realized gain | | | | | | | | | | | | (1,570,115) | | | | | | (565,955) |
| Share transactions | | | | | | | | | | | | | | | | | | | | |
| Proceeds from sales of shares | | | | | | | | | | | | 21,849,620 | | | | 29,097,016 |
| Reinvestment of distributions | | | | | | | | | | | | 1,513,925 | | | | | | 550,054 |
| Cost of shares redeemed | | | | | | | | | | (25,398,907) | | | | (30,455,132) |
| Net increase (decrease) in net assets resulting from share transactions | | | | | | | | | | | | (2,035,362) | | | | | | (808,062) |
| Redemption fees | | | | | | | | | | | | | | 7,908 | | | | | | 11,865 |
| Total increase (decrease) in net assets | | | | | | | | | | | | 2,227,348 | | | | | | 2,096,916 |
| |
| Net Assets | | | | | | | | | | | | | | | | | | | | |
| Beginning of period | | | | | | | | | | | | 37,164,657 | | | | 35,067,741 |
| End of period | | | | | | | | | | $ | | 39,392,005 | | $ | | 37,164,657 |
| |
| Other Information | | | | | | | | | | | | | | | | | | | | |
| Shares | | | | | | | | | | | | | | | | | | | | |
| Sold | | | | | | | | | | | | 1,348,274 | | | | | | 1,958,566 |
| Issued in reinvestment of distributions | | | | | | | | | | | | | | 98,617 | | | | | | 34,357 |
| Redeemed | | | | | | | | | | | | (1,585,831) | | | | (2,074,435) |
| Net increase (decrease) | | | | | | | | | | | | (138,940) | | | | | | (81,512) |
| |
| Financial Highlights | | | | | | | | | | | | | | | | | | | | |
| Years ended February 28, | | | | 2006 | | | | 2005 | | 2004G | | | | 2003 | | | | | | 2002 |
| Selected Per-Share Data | | | | | | | | | | | | | | | | | | | | |
| Net asset value, beginning of period | | $ | | 15.50 | | $ | | 14.14 | | $ 10.20 | | $ | | 15.21 | | | | $ | | 14.66 |
| Income from Investment Operations | | | | | | | | | | | | | | | | | | | | |
| Net investment income (loss)C | | | | (.03)D | | | | (.10)E | | (.15) | | | | (.12) | | | | | | (.11) |
| Net realized and unrealized gain (loss) | | | | 2.59 | | | | 1.70 | | 4.09 | | | | (4.90) | | | | | | .81 |
| Total from investment operations | | | | 2.56 | | | | 1.60 | | 3.94 | | | | (5.02) | | | | | | .70 |
| Distributions from net realized gain | | | | (.63) | | | | (.24) | | — | | | | — | | | | | | (.19) |
| Redemption fees added to paid in capitalC | | | | —H | | | | —H | | —H | | | | .01 | | | | | | .04 |
| Net asset value, end of period | | $ | | 17.43 | | $ | | 15.50 | | $ 14.14 | | $ | | 10.20 | | | | $ | | 15.21 |
| Total ReturnA,B | | | | 17.14% | | | | 11.26% | | 38.63% | | | | (32.94)% | | | | | | 5.23% |
| Ratios to Average Net AssetsF | | | | | | | | | | | | | | | | | | | | |
| Expenses before reductions | | | | 1.22% | | | | 1.24% | | 1.64% | | | | 1.61% | | | | | | 1.42% |
| Expenses net of fee waivers, if any | | | | 1.22% | | | | 1.23% | | 1.64% | | | | 1.61% | | | | | | 1.42% |
| Expenses net of all reductions | | | | 1.18% | | | | 1.21% | | 1.63% | | | | 1.57% | | | | | | 1.39% |
| Net investment income (loss) | | | | (.17)%D | | | | (.66)%E | | (1.17)% | | | | (.97)% | | | | | | (.74)% |
| Supplemental Data | | | | | | | | | | | | | | | | | | | | |
| Net assets, end of period (000 omitted) | | $ | | 39,392 | | $ | | 37,165 | | $ 35,068 | | $ | | 27,888 | | | | $ | | 63,326 |
| Portfolio turnover rate | | | | 73% | | | | 88% | | 54% | | | | 129% | | | | | | 159% |
| |
| |
A Total returns would have been lower had certain expenses not been reduced during the periods shown. B Total returns do not include the effect of the former sales charges. C Calculated based on average shares outstanding during the period. D Investment income per share reflects special dividends which amounted to $.05 per share. Excluding these special dividends, the ratio of net investment income (loss) to average net assets would have been (.50)%. EInvestment income per share reflects a special dividend which amounted to $.02 per share. Excluding the special dividend, the ratio of net investment income (loss) to average net assets would have been (.81)%. FExpense ratios reflect operating expenses of the fund. Expenses before reductions do not reflect amounts reimbursed by the investment adviser or reductions from brokerage service arrangements or other expense offset arrangements and do not represent the amount paid by the fund during periods when reimbursements or reductions occur. Expenses net of fee waivers reflect expenses after reimbursement by the investment adviser but prior to reductions from brokerage service arrangements or other expense offset arrangements. Expenses net of all reductions represent the net expenses paid by the fund. GFor the year ended February 29. HAmount represents less than $.01 per share.
See accompanying notes which are an integral part of the financial statements.
|
Computers Portfolio
Performance
Average annual total return reflects the change in the value of an investment, assuming reinvestment of the fund’s dividend income and capital gains (the profits earned upon the sale of securities that have grown in value) and assuming a constant rate of performance each year. The $10,000 table and the fund’s returns do not reflect the deduction of taxes that a shareholder would pay on fund distributions or the redemption of fund shares. During periods of reimbursement by Fidelity, a fund’s total returns will be greater than it would be had the reimbursement not occurred. How a fund did yesterday is no guarantee of how it will do tomorrow.
| Average Annual Total Returns | | | | | | |
| Periods ended February 28, 2006 | | Past 1 | | Past 5 | | Past 10 |
| | | year | | years | | years |
| Select Computers | | 8.37% | | --1.89% | | 8.32% |
$10,000 Over 10 Years
Let’s say hypothetically that $10,000 was invested in Fidelity Select Computers Portfolio on February 29, 1996. The chart shows how the value of your investment would have changed, and also shows how the S&P 500 Index performed over the same period.
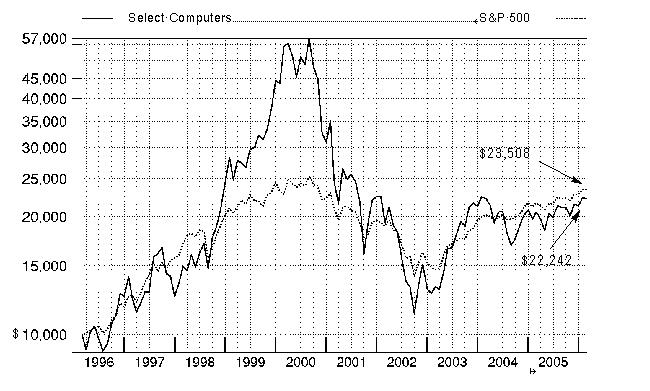
Annual Report 16
Management’s Discussion of Fund Performance
Comments from James Morrow, who managed Fidelity® Select Computers Portfolio during the period covered by this report
With the exception of several popular large-cap stock performance measures, most major U.S. equity benchmarks had double-digit returns for the year ending February 28, 2006. For much of the period, market gains were driven largely by the energy sector, although utilities ultimately sneaked into the top spot for the year overall. Financials and telecommunication services also reached double figures, outperforming the 8.40% return of the broader market as measured by the large-cap-oriented Standard & Poor’s 500SM Index. The consumer discretionary segment — home to the weak performing automobile and media industries — was the biggest disappointment. Although the overall return for the S&P 500® beat the small-cap Russell 2000® Index in calendar year 2005 — the first time that’s happened in six years — small-caps stormed back in early 2006, leading to a 16.59% advance during the past 12 months, nearly twice the broader market’s gain. Mid-caps soared even higher, returning 17.67% according to the Russell Midcap® Index. The technology-heavy NASDAQ Composite® Index also fared well, climbing 12.13%, but the Dow Jones Industrial AverageSM, an index of 30 large-cap, blue-chip stocks, managed to rise only 4.52% .
During the past year, the fund returned 8.37%, about even with the S&P 500 and trailing the 11.34% gain of the Goldman Sachs® Technology Index. Versus the sector index, performance was hampered by both an underweighting and unfavorable stock selection in the communications equipment area. My picks in the computer storage and peripherals group also hurt. Computer maker Dell was the fund’s largest detractor, as the stock was hampered by stiffer competition. Printer maker Lexmark International also struggled, its stock price falling after the company issued disappointing financial guidance in October 2005. Another stock that hurt performance was Canada-based Research In Motion, maker of the popular BlackBerry handheld messaging device. A long-running patent dispute slowed the company’s flow of new subscribers. I sold the stock by period end. Conversely, underweighting the relatively weak performing systems software group aided performance. The fund’s biggest contributor was major index component IBM because we had a relatively small stake for most of the period and the stock struggled. Near period end, though, I built IBM into a much larger position for valuation reasons. Another contributor was Apple Computer, which performed well primarily because of robust sales of its iPod digital music player.
Note to shareholders: Heather Lawrence was named manager of the fund on April 1, 2006.
The views expressed above reflect those of the portfolio manager(s) only through the end of the period as stated on the cover of this report and do not necessarily represent the views of Fidelity or any other person in the Fidelity organization. Any such views are subject to change at any time based upon market or other conditions and Fidelity disclaims any responsibility to update such views. These views may not be relied on as investment advice and, because investment decisions for a Fidelity fund are based on numerous factors, may not be relied on as an indication of trading intent on behalf of any Fidelity fund.
17 17 Annual Report
| Computers Portfolio | | | | |
| Investment Changes | | |
| |
| |
| Top Ten Stocks as of February 28, 2006 |
| | | % of fund’s | | % of fund’s net assets |
| | | net assets | | 6 months ago |
| Apple Computer, Inc. | | 9.7 | | 7.2 |
| Dell, Inc. | | 6.3 | | 5.5 |
| Intel Corp. | | 5.8 | | 10.1 |
| EMC Corp. | | 5.3 | | 3.9 |
| Cisco Systems, Inc. | | 5.0 | | 5.4 |
| International Business Machines | | | | |
| Corp. | | 4.9 | | 0.0 |
| Best Buy Co., Inc. | | 4.5 | | 3.2 |
| Samsung Electronics Co. Ltd. | | 4.5 | | 3.6 |
| Staples, Inc. | | 3.2 | | 0.0 |
| Google, Inc. Class A (sub. vtg.) | | 3.1 | | 0.0 |
| | | 52.3 | | |
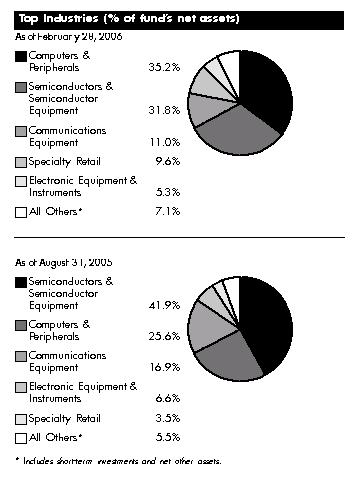
Annual Report 18
| Computers Portfolio | | | | | | |
| Investments February 28, 2006 | | | | |
| Showing Percentage of Net Assets | | | | | | |
| |
| Common Stocks — 99.7% | | | | | | |
| | | | | Shares | | Value (Note 1) |
| |
| COMMUNICATIONS EQUIPMENT – 11.0% | | | | | | |
| Communications Equipment – 11.0% | | | | | | |
| Cisco Systems, Inc. (a) | | | | 1,300,000 | | $ 26,312,000 |
| Comverse Technology, Inc. (a) | | | | 90,000 | | 2,588,400 |
| Corning, Inc. (a) | | | | 400,000 | | 9,764,000 |
| F5 Networks, Inc. (a) | | | | 90,000 | | 6,103,800 |
| ITF Optical Technologies, Inc. Series A (e) | | | | 31,365 | | 0 |
| Juniper Networks, Inc. (a) | | | | 750,032 | | 13,793,088 |
| | | | | | | 58,561,288 |
| |
| COMPUTERS & PERIPHERALS – 35.2% | | | | | | |
| Computer Hardware – 25.1% | | | | | | |
| Acer, Inc. | | | | 1,200,000 | | 2,641,217 |
| Apple Computer, Inc. (a) | | | | 750,000 | | 51,405,001 |
| Dell, Inc. (a) | | | | 1,150,000 | | 33,350,000 |
| International Business Machines Corp. | | | | 325,000 | | 26,078,000 |
| NCR Corp. (a) | | | | 250,000 | | 10,022,500 |
| Sun Microsystems, Inc. (a) | | | | 2,000,000 | | 8,340,000 |
| Toshiba Corp. | | | | 250,000 | | 1,418,245 |
| | | | | | | 133,254,963 |
| Computer Storage & Peripherals – 10.1% | | | | | | |
| EMC Corp. (a) | | | | 2,000,000 | | 28,040,000 |
| Lexmark International, Inc. Class A (a) | | | | 50,000 | | 2,354,500 |
| Network Appliance, Inc. (a) | | | | 200,000 | | 6,632,000 |
| SanDisk Corp. (a) | | | | 190,000 | | 11,464,600 |
| Seagate Technology | | | | 200,000 | | 5,314,000 |
| | | | | | | 53,805,100 |
| |
| TOTAL COMPUTERS & PERIPHERALS | | | | | | 187,060,063 |
| |
| ELECTRONIC EQUIPMENT & INSTRUMENTS – 5.3% | | | | | | |
| Electronic Equipment & Instruments – 0.3% | | | | | | |
| AU Optronics Corp. sponsored ADR | | | | 99,956 | | 1,590,300 |
| Electronic Manufacturing Services – 1.8% | | | | | | |
| Hon Hai Precision Industry Co. Ltd. (Foxconn) | | | | 1,500,035 | | 9,446,238 |
| Technology Distributors – 3.2% | | | | | | |
| Arrow Electronics, Inc. (a) | | | | 150,000 | | 5,218,500 |
| Avnet, Inc. (a) | | | | 100,000 | | 2,513,000 |
| Bell Microproducts, Inc. (a) | | | | 200,000 | | 1,202,000 |
| CDW Corp. | | | | 75,000 | | 4,264,500 |
| Ingram Micro, Inc. Class A (a) | | | | 200,000 | | 3,956,000 |
| | | | | | | 17,154,000 |
| |
| TOTAL ELECTRONIC EQUIPMENT & INSTRUMENTS | | | | | | 28,190,538 |
| |
| HOUSEHOLD DURABLES – 0.4% | | | | | | |
| Consumer Electronics – 0.4% | | | | | | |
| LG Electronics, Inc. | | | | 25,040 | | 2,057,238 |
See accompanying notes which are an integral part of the financial statements.
|
19 Annual Report
19
| Computers Portfolio | | | | |
| Investments - continued | | | | |
| |
| |
| |
| | | Shares | | Value (Note 1) |
| |
| INTERNET & CATALOG RETAIL – 0.2% | | | | |
| Catalog Retail – 0.2% | | | | |
| Insight Enterprises, Inc. (a) | | 50,000 | | $ 1,076,500 |
| INTERNET SOFTWARE & SERVICES – 3.1% | | | | |
| Internet Software & Services – 3.1% | | | | |
| Google, Inc. Class A (sub. vtg.) (a) | | 45,000 | | 16,317,900 |
| OFFICE ELECTRONICS – 2.2% | | | | |
| Office Electronics – 2.2% | | | | |
| Xerox Corp. (a) | | 800,000 | | 11,920,000 |
| SEMICONDUCTORS & SEMICONDUCTOR EQUIPMENT – 31.8% | | | | |
| Semiconductor Equipment – 1.3% | | | | |
| MEMC Electronic Materials, Inc. (a) | | 200,000 | | 6,698,000 |
| Semiconductors – 30.5% | | | | |
| Altera Corp. (a) | | 475,000 | | 9,519,000 |
| Analog Devices, Inc. | | 424,970 | | 16,208,356 |
| Cypress Semiconductor Corp. (a) | | 150,000 | | 2,664,000 |
| Freescale Semiconductor, Inc. Class A (a) | | 250,000 | | 6,722,500 |
| Intel Corp. | | 1,500,000 | | 30,900,000 |
| Linear Technology Corp. | | 325,000 | | 11,979,500 |
| Marvell Technology Group Ltd. (a) | | 200,000 | | 12,244,000 |
| Maxim Integrated Products, Inc. | | 350,000 | | 13,681,500 |
| MediaTek, Inc. | | 100,000 | | 1,025,611 |
| National Semiconductor Corp. | | 500,000 | | 14,025,000 |
| O2Micro International Ltd. sponsored ADR (a) | | 150,000 | | 1,890,000 |
| PMC-Sierra, Inc. (a) | | 460,000 | | 4,696,600 |
| Samsung Electronics Co. Ltd. | | 34,033 | | 23,862,248 |
| Taiwan Semiconductor Manufacturing Co. Ltd. | | 1,000,000 | | 1,861,691 |
| Taiwan Semiconductor Manufacturing Co. Ltd. sponsored ADR | | 999,969 | | 9,729,698 |
| Volterra Semiconductor Corp. (a) | | 75,000 | | 1,305,750 |
| | | | | 162,315,454 |
| |
| TOTAL SEMICONDUCTORS & SEMICONDUCTOR | | | | |
| EQUIPMENT | | | | 169,013,454 |
| |
| SOFTWARE – 0.9% | | | | |
| Application Software – 0.9% | | | | |
| NAVTEQ Corp. (a) | | 100,000 | | 4,631,000 |
| SPECIALTY RETAIL – 9.6% | | | | |
| Computer & Electronics Retail – 4.5% | | | | |
| Best Buy Co., Inc. (d) | | 450,000 | | 24,237,000 |
| Specialty Stores – 5.1% | | | | |
| Office Depot, Inc. (a) | | 275,000 | | 9,812,000 |
| Staples, Inc. | | 700,000 | | 17,178,000 |
| | | | | 26,990,000 |
| |
| TOTAL SPECIALTY RETAIL | | | | 51,227,000 |
| |
| TOTAL COMMON STOCKS | | | | |
| (Cost $507,765,854) | | | | 530,054,981 |
See accompanying notes which are an integral part of the financial statements.
Annual Report 20
|
| Money Market Funds — 3.6% | | | | | | |
| | | Shares | | | | Value (Note 1) |
| Fidelity Cash Central Fund, 4.57% (b) | | 10,671,782 | | $ | | 10,671,782 |
| Fidelity Securities Lending Cash Central Fund, 4.58% (b)(c) | | 8,563,650 | | | | 8,563,650 |
| TOTAL MONEY MARKET FUNDS | | | | | | |
| (Cost $19,235,432) | | | | | | 19,235,432 |
| TOTAL INVESTMENT PORTFOLIO - 103.3% | | | | | | |
| (Cost $527,001,286) | | | | | | 549,290,413 |
| |
| NET OTHER ASSETS – (3.3)% | | | | | | (17,583,251) |
| NET ASSETS – 100% | | | | $ | | 531,707,162 |
(a) Non-income producing
(b) Affiliated fund that is available only to investment companies and other accounts managed by Fidelity Investments. The rate quoted is the annualized seven-day yield of the fund at period end. A complete unaudited listing of the fund’s holdings as of its most recent quarter end is available upon request.
(c) Investment made with cash collateral received from securities on loan. (d) Security or a portion of the security is on loan at period end.
(e) Restricted securities – Investment in securities not registered under the Securities Act of 1933 (excluding 144A issues). At the end of the period, the value of restricted securities (excluding 144A issues) amounted to $0 or 0.0% of net assets.
| Additional information on each holding is as follows: | | | | | | | | | | |
| |
| Security | | Acquisition Date | | Acquisition Cost | | |
| ITF Optical Technologies, Inc. Series A | | 10/11/00 | | $ | | 1,575,000 | | | | |
| |
| Affiliated Central Funds | | | | | | | | | | |
| Information regarding fiscal year to date income earned by the fund from the affiliated Central funds is as follows: | | | | | | | | |
| |
| Fund | | | | | | | | | | Income earned |
| Fidelity Cash Central Fund | | | | | | | | $ | | 251,020 |
| Fidelity Securities Lending Cash Central Fund | | | | | | | | | | 14,125 |
| Total | | | | | | | | $ | | 265,145 |
Distribution of investments by country of issue, as a percentage of total net assets, is as follows:
| United States of America | | 86.3% |
| Taiwan | | 4.9% |
| Korea (South) | | 4.9% |
| Bermuda | | 2.3% |
| Cayman Islands | | 1.4% |
| Others (individually less than 1%) | | 0.2% |
| | | 100.0% |
At February 28, 2006, the fund had a capital loss carryforward of approximately $801,330,392 of which $549,550,193 and $251,780,199 will expire on February 28, 2010 and 2011, respectively.
See accompanying notes which are an integral part of the financial statements.
|
21 Annual Report
21
| Computers Portfolio | | | | | | |
| |
| Financial Statements | | | | | | |
| |
| |
| Statement of Assets and Liabilities | | | | | | |
| | | | | | | February 28, 2006 |
| |
| Assets | | | | | | |
| Investment in securities, at value (including securities loaned of $8,310,598) — See accompanying schedule: | | | | | | |
| Unaffiliated issuers (cost $507,765,854) | | $ | | 530,054,981 | | |
| Affiliated Central Funds (cost $19,235,432) | | | | 19,235,432 | | |
| Total Investments (cost $527,001,286) | | | | $ | | 549,290,413 |
| Foreign currency held at value (cost $623) | | | | | | 627 |
| Receivable for fund shares sold | | | | | | 155,684 |
| Dividends receivable | | | | | | 391,142 |
| Interest receivable | | | | | | 22,449 |
| Prepaid expenses | | | | | | 2,460 |
| Other affiliated receivables | | | | | | 34 |
| Other receivables | | | | | | 45,412 |
| Total assets | | | | | | 549,908,221 |
| |
| Liabilities | | | | | | |
| Payable for investments purchased | | $ | | 7,585,754 | | |
| Payable for fund shares redeemed | | | | 1,577,799 | | |
| Accrued management fee | | | | 253,510 | | |
| Other affiliated payables | | | | 184,462 | | |
| Other payables and accrued expenses | | | | 35,884 | | |
| Collateral on securities loaned, at value | | | | 8,563,650 | | |
| Total liabilities | | | | | | 18,201,059 |
| |
| Net Assets | | | | $ | | 531,707,162 |
| Net Assets consist of: | | | | | | |
| Paid in capital | | | | $1,313,386,290 |
| Accumulated net investment loss | | | | | | (884) |
| Accumulated undistributed net realized gain (loss) on investments and foreign currency transactions | | | | | | (803,973,104) |
| Net unrealized appreciation (depreciation) on investments and assets and liabilities in foreign currencies | | | | | | 22,294,860 |
| Net Assets, for 14,161,179 shares outstanding | | | | $ | | 531,707,162 |
| Net Asset Value, offering price and redemption price per share ($531,707,162 ÷ 14,161,179 shares) | | | | $ | | 37.55 |
| |
| Statement of Operations | | | | | | |
| | | | | | | Year ended February 28, 2006 |
| |
| Investment Income | | | | | | |
| Dividends | | | | $ | | 2,421,152 |
| Interest | | | | | | 1,532 |
| Income from affiliated Central Funds (including $14,125 from security lending) | | | | | | 265,145 |
| | | | | | | 2,687,829 |
| Less foreign taxes withheld | | | | | | (226,752) |
| Total income | | | | | | 2,461,077 |
| |
| Expenses | | | | | | |
| Management fee | | $ | | 3,308,312 | | |
| Transfer agent fees | | | | 2,295,013 | | |
| Accounting and security lending fees | | | | | | |
| | | | | 278,743 | | |
| Independent trustees’ compensation | | | | 2,565 | | |
| Custodian fees and expenses | | | | 75,167 | | |
| Registration fees | | | | 22,230 | | |
| Audit | | | | 42,626 | | |
| Legal | | | | 6,841 | | |
| Interest | | | | 687 | | |
| Miscellaneous | | | | 8,576 | | |
| Total expenses before reductions | | | | 6,040,760 | | |
| Expense reductions | | | | (331,433) | | 5,709,327 |
See accompanying notes which are an integral part of the financial statements.
Annual Report 22
| Net investment income (loss) | | | | (3,248,250) |
| Realized and Unrealized Gain (Loss) | | | | |
| Net realized gain (loss) on: | | | | |
| Investment securities: | | | | |
| Unaffiliated issuers (net of foreign taxes of $52,746) | | 48,029,802 | | |
| Foreign currency transactions | | (169,312) | | |
| Total net realized gain (loss) | | | | 47,860,490 |
| Change in net unrealized appreciation (depreciation) on: | | | | |
| Investment securities (net of decrease in deferred foreign taxes of $44,875) | | (1,299,275) | | |
| Assets and liabilities in foreign currencies | | (31,508) | | |
| Total change in net unrealized appreciation (depreciation) | | | | (1,330,783) |
| Net gain (loss) | | | | 46,529,707 |
| Net increase (decrease) in net assets resulting from operations | | | | $43,281,457 |
See accompanying notes which are an integral part of the financial statements.
|
23 Annual Report
| Computers Portfolio | | | | |
| Financial Statements - continued | | | | |
| |
| |
| Statement of Changes in Net Assets | | | | |
| | | Year ended | | Year ended |
| | | February 28, | | February 28, |
| | | 2006 | | 2005 |
| Increase (Decrease) in Net Assets | | | | |
| Operations | | | | |
| Net investment income (loss) | | $ (3,248,250) | | $ (4,755,248) |
| Net realized gain (loss) | | 47,860,490 | | 57,835,029 |
| Change in net unrealized appreciation (depreciation) | | (1,330,783) | | (136,754,796) |
| Net increase (decrease) in net assets resulting from operations | | 43,281,457 | | (83,675,015) |
| Share transactions | | | | |
| Proceeds from sales of shares | | 56,362,094 | | 97,044,809 |
| Cost of shares redeemed | | (235,793,382) | | (345,369,255) |
| Net increase (decrease) in net assets resulting from share transactions | | (179,431,288) | | (248,324,446) |
| Redemption fees | | 55,832 | | 92,882 |
| Total increase (decrease) in net assets | | (136,093,999) | | (331,906,579) |
| |
| Net Assets | | | | |
| Beginning of period | | 667,801,161 | | 999,707,740 |
| End of period (including accumulated net investment loss of $884 and accumulated net investment loss of $1,216, | | | | |
| respectively) | | $ 531,707,162 | | $ 667,801,161 |
| |
| Other Information | | | | |
| Shares | | | | |
| Sold | | 1,603,028 | | 2,922,849 |
| Redeemed | | (6,713,561) | | (10,308,447) |
| Net increase (decrease) | | (5,110,533) | | (7,385,598) |
| Financial Highlights | | | | | | | | | | | | | | | | | | | | |
| Years ended February 28, | | | | 2006 | | | | 2005 | | | | 2004F | | | | 2003 | | | | 2002 |
| Selected Per-Share Data | | | | | | | | | | | | | | | | | | | | |
| Net asset value, beginning of period | | $ | | 34.65 | | $ | | 37.50 | | $ | | 22.36 | | $ | | 32.73 | | $ | | 41.31 |
| Income from Investment Operations | | | | | | | | | | | | | | | | | | | | |
| Net investment income (loss)C | | | | (.20) | | | | (.21)D | | | | (.27) | | | | (.25) | | | | (.30) |
| Net realized and unrealized gain (loss) | | | | 3.10 | | | | (2.64) | | | | 15.40 | | | | (10.12) | | | | (8.29) |
| Total from investment operations | | | | 2.90 | | | | (2.85) | | | | 15.13 | | | | (10.37) | | | | (8.59) |
| Redemption fees added to paid in capitalC | | | | —G | | | | —G | | | | .01 | | | | —G | | | | .01 |
| Net asset value, end of period | | $ | | 37.55 | | $ | | 34.65 | | $ | | 37.50 | | $ | | 22.36 | | $ | | 32.73 |
| Total ReturnA,B | | | | 8.37% | | | | (7.60)% | | | | 67.71% | | | | (31.68)% | | | | (20.77)% |
| Ratios to Average Net AssetsE | | | | | | | | | | | | | | | | | | | | |
| Expenses before reductions | | | | 1.04% | | | | 1.05% | | | | 1.23% | | | | 1.40% | | | | 1.19% |
| Expenses net of fee waivers, if any | | | | 1.04% | | | | 1.05% | | | | 1.23% | | | | 1.40% | | | | 1.19% |
| Expenses net of all reductions | | | | 98% | | | | .98% | | | | 1.16% | | | | 1.31% | | | | 1.13% |
| Net investment income (loss) | | | | (.56)% | | | | (.63)%D | | | | (.85)% | | | | (.96)% | | | | (.77)% |
| Supplemental Data | | | | | | | | | | | | | | | | | | | | |
| Net assets, end of period (000 omitted) | | $ | | 531,707 | | $ | | 667,801 | | $ | | 999,708 | | $ | | 572,488 | | $ | | 966,235 |
| Portfolio turnover rate | | | | 112% | | | | 100% | | | | 138% | | | | 106% | | | | 206% |
| |
| | | | | |
| | | |
A Total returns would have been lower had certain expenses not been reduced during the periods shown.B Total returns do not include the effect of the former sales charges. C Calculated based on average shares outstanding during the period. D Investment income per share reflects a special dividend which amounted to $.02 per share. Excluding the special dividend, the ratio of net investment income (loss) to average net assets would have been (.69)%. E Expense ratios reflect operating expenses of the fund. Expenses before reductions do not reflect amounts reimbursed by the investment adviser or reductions from brokerage service arrangements or other expense offset arrangements and do not represent the amount paid by the fund during periods when reimbursements or reductions occur. Expenses net of fee waivers reflect expenses after reimbursement by the investment adviser but prior to reductions from brokerage service arrangements or other expense offset arrangements. Expenses net of all reductions represent the net expenses paid by the fund. FFor the year ended February 29. GAmount represents less than $.01 per share.See accompanying notes which are an integral part of the financial statements.
Annual Report 24
Developing Communications Portfolio
Performance
|
Average annual total return reflects the change in the value of an investment, assuming reinvestment of the fund’s dividend income and capital gains (the profits earned upon the sale of securities that have grown in value) and assuming a constant rate of performance each year. The $10,000 table and the fund’s returns do not reflect the deduction of taxes that a shareholder would pay on fund distributions or the redemption of fund shares. During periods of reimbursement by Fidelity, a fund’s total returns will be greater than it would be had the reimbursement not occurred. How a fund did yesterday is no guarantee of how it will do tomorrow.
| Average Annual Total Returns | | | | | | |
| Periods ended February 28, 2006 | | Past 1 | | Past 5 | | Past 10 |
| | | year | | years | | years |
| Select Developing Communications | | 22.64% | | --1.97% | | 8.49% |
$10,000 Over 10 Years
Let’s say hypothetically that $10,000 was invested in Fidelity Select Developing Communications Portfolio on February 29, 1996. The chart shows how the value of your investment would have changed, and also shows how the S&P 500 Index performed over the same period.
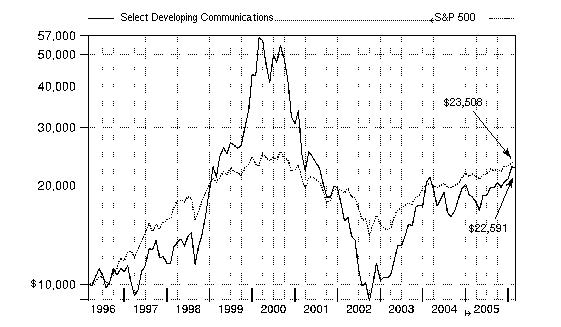
25 Annual Report
Developing Communications Portfolio
|
Management’s Discussion of Fund Performance
Comments from Charlie Chai, Portfolio Manager of Fidelity® Select Developing Communications Portfolio
With the exception of several popular large-cap stock performance measures, most major U.S. equity benchmarks had double-digit returns for the year ending February 28, 2006. For much of the period, market gains were driven largely by the energy sector, although utilities ultimately sneaked into the top spot for the year overall. Financials and telecommunication services also reached double figures, outperforming the 8.40% return of the broader market as measured by the large-cap-oriented Standard & Poor’s 500SM Index. The consumer discretionary segment —home to the weak performing automobile and media industries —was the biggest disappointment. Although the overall return for the S&P 500® beat the small-cap Russell 2000® Index in calendar year 2005 —the first time that’s happened in six years —small-caps stormed back in early 2006, leading to a 16.59% advance during the past 12 months, nearly twice the broader market’s gain. Mid-caps soared even higher, returning 17.67% according to the Russell Midcap® Index. The technology-heavy NASDAQ Composite® Index also fared well, climbing 12.13%, but the Dow Jones Industrial AverageSM, an index of 30 large-cap, blue-chip stocks, managed to rise only 4.52% .
During the past year, the fund returned 22.64%, roughly doubling the 11.34% gain of the Goldman Sachs® Technology Index. It did even better compared with the S&P 500. Favorable stock picking in Internet software and services provided a significant boost to performance versus the sector benchmark, along with a sizable overweighting in the strong performing communications equipment group, where the fund normally has a much larger exposure than the Goldman Sachs index does. Most of the value added in Internet software and services came from Google, which offers paid-search services that were in high demand during the period. Not owning major index components Dell and IBM also aided performance, as they performed poorly. Meanwhile, wireline equipment providers CIENA and Corning were two beneficiaries of the recent push by telecom services companies to expand their fiber-optic networks. On the other hand, the fund’s performance was held back by weak stock selection in communications equipment, among other areas. Avaya — a purveyor of VoIP (Voice over Internet Protocol) infrastructure equipment — was the largest detractor. The company encountered difficulties in executing a sales reorganization and released disappointing earnings. Canada-based wireline equipment maker Nortel Networks also hampered fund performance.
The views expressed above reflect those of the portfolio manager(s) only through the end of the period as stated on the cover of this report and do not necessarily represent the views of Fidelity or any other person in the Fidelity organization. Any such views are subject to change at any time based upon market or other conditions and Fidelity disclaims any responsibility to update such views. These views may not be relied on as investment advice and, because investment decisions for a Fidelity fund are based on numerous factors, may not be relied on as an indication of trading intent on behalf of any Fidelity fund.
| Developing Communications Portfolio | | |
| Investment Changes | | |
| |
| |
| Top Ten Stocks as of February 28, 2006 |
| | | % of fund’s | | % of fund’s net assets |
| | | net assets | | 6 months ago |
| Google, Inc. Class A (sub. vtg.) | | 9.9 | | 4.9 |
| QUALCOMM, Inc. | | 7.4 | | 8.7 |
| Nortel Networks Corp. | | 6.5 | | 0.0 |
| Corning, Inc. | | 5.5 | | 6.1 |
| Sprint Nextel Corp. | | 5.4 | | 0.6 |
| Comverse Technology, Inc. | | 4.6 | | 1.5 |
| Motorola, Inc. | | 4.6 | | 3.1 |
| Crown Castle International Corp. | | 3.4 | | 1.0 |
| Lucent Technologies, Inc. | | 3.3 | | 0.0 |
| F5 Networks, Inc. | | 3.1 | | 2.0 |
| | | 53.7 | | |
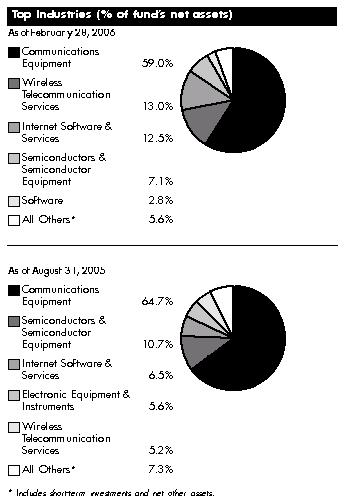
27 Annual Report
| Developing Communications Portfolio | | | | | | |
| Investments February 28, 2006 | | | | |
| Showing Percentage of Net Assets | | | | | | |
| |
| Common Stocks — 100.1% | | | | | | |
| | | | | Shares | | Value (Note 1) |
| |
| COMMERCIAL SERVICES & SUPPLIES – 0.5% | | | | | | |
| Diversified Commercial & Professional Services – 0.5% | | | | | | |
| Tele Atlas NV (a) | | | | 85,000 | | $ 2,481,535 |
| COMMUNICATIONS EQUIPMENT – 59.0% | | | | | | |
| Communications Equipment – 59.0% | | | | | | |
| 3Com Corp. (a) | | | | 410,900 | | 1,910,685 |
| ADC Telecommunications, Inc. (a) | | | | 155,200 | | 3,929,664 |
| Adtran, Inc. | | | | 7,200 | | 198,144 |
| Airspan Networks, Inc. (a) | | | | 97,500 | | 599,625 |
| Alcatel SA sponsored ADR (a)(d) | | | | 1,029,200 | | 13,894,200 |
| Alvarion Ltd. (a) | | | | 194,900 | | 1,820,366 |
| Andrew Corp. (a) | | | | 331,200 | | 4,491,072 |
| Arris Group, Inc. (a) | | | | 43,200 | | 548,208 |
| AudioCodes Ltd. (a) | | | | 491,990 | | 5,648,045 |
| Avanex Corp. (a) | | | | 681,300 | | 967,446 |
| Avaya, Inc. (a) | | | | 224,900 | | 2,500,888 |
| Bookham, Inc. (a)(d) | | | | 617,028 | | 4,306,855 |
| C-COR, Inc. (a) | | | | 33,600 | | 238,560 |
| Ceragon Networks Ltd. (a) | | | | 212,500 | | 1,034,875 |
| CIENA Corp. (a) | | | | 2,784,444 | | 11,193,465 |
| Cisco Systems, Inc. (a) | | | | 149,500 | | 3,025,880 |
| CommScope, Inc. (a) | | | | 34,100 | | 818,059 |
| Comtech Group, Inc. (a) | | | | 99,500 | | 987,040 |
| Comverse Technology, Inc. (a) | | | | 772,610 | | 22,220,264 |
| Corning, Inc. (a) | | | | 1,088,100 | | 26,560,521 |
| CSR PLC (a) | | | | 134,000 | | 2,127,258 |
| ECI Telecom Ltd. (a) | | | | 271,200 | | 2,364,864 |
| Extreme Networks, Inc. (a) | | | | 198,200 | | 917,666 |
| F5 Networks, Inc. (a) | | | | 220,300 | | 14,940,746 |
| Foundry Networks, Inc. (a) | | | | 141,400 | | 1,985,256 |
| Foxconn International Holdings Ltd. | | | | 80,000 | | 138,697 |
| InterDigital Communication Corp. (a) | | | | 2,800 | | 72,100 |
| Ixia (a) | | | | 195,700 | | 2,360,142 |
| JDS Uniphase Corp. (a) | | | | 2,976,600 | | 9,048,864 |
| Juniper Networks, Inc. (a) | | | | 696,859 | | 12,815,237 |
| Lucent Technologies, Inc. (a) | | | | 5,656,400 | | 15,837,920 |
| Motorola, Inc. | | | | 1,024,400 | | 21,922,160 |
| MRV Communications, Inc. (a) | | | | 365,183 | | 1,069,986 |
| NMS Communications Corp. (a) | | | | 496,202 | | 1,766,479 |
| Nortel Networks Corp. (a) | | | | 10,884,200 | | 31,128,812 |
| Orckit Communications Ltd. (a) | | | | 64,100 | | 1,602,500 |
| QUALCOMM, Inc. | | | | 748,600 | | 35,341,406 |
| RADWARE Ltd. (a) | | | | 107,800 | | 2,148,454 |
| Research In Motion Ltd. (a) | | | | 34,000 | | 2,406,619 |
| Riverstone Networks, Inc. (a) | | | | 1,129,500 | | 598,635 |
| Sonus Networks, Inc. (a) | | | | 1,030,496 | | 4,997,906 |
| Stratex Networks, Inc. (a) | | | | 97,500 | | 501,150 |
| Symmetricom, Inc. (a) | | | | 261,100 | | 2,342,067 |
| Tekelec (a) | | | | 499,400 | | 6,696,954 |
| Telefonaktiebolaget LM Ericsson (B Shares) sponsored ADR | | | | 1,848 | | 63,017 |
See accompanying notes which are an integral part of the financial statements.
Annual Report 28
| | | Shares | | Value (Note 1) |
| Telson Electronics Co. Ltd. (a) | | 850,529 | | $ | | 0 |
| Terayon Communication Systems, Inc. (a) | | 187,000 | | 501,160 |
| TomTom Group BV (d) | | 10,800 | | 333,454 |
| Tut Systems, Inc. (a) | | 109,700 | | 329,100 |
| | | | | 283,252,471 |
| |
| COMPUTERS & PERIPHERALS – 1.5% | | | | | | |
| Computer Hardware – 1.3% | | | | | | |
| Compal Electronics, Inc. | | 240,559 | | 223,556 |
| Concurrent Computer Corp. (a) | | 2,274,778 | | 5,959,918 |
| NEC Corp. sponsored ADR | | 700 | | | | 4,326 |
| | | | | 6,187,800 |
| Computer Storage & Peripherals – 0.2% | | | | | | |
| SanDisk Corp. (a) | | 15,000 | | 905,100 |
| |
| TOTAL COMPUTERS & PERIPHERALS | | | | 7,092,900 |
| |
| DIVERSIFIED TELECOMMUNICATION SERVICES – 0.8% | | | | | | |
| Alternative Carriers – 0.4% | | | | | | |
| Level 3 Communications, Inc. (a)(d) | | 487,100 | | 1,656,140 |
| Integrated Telecommunication Services – 0.4% | | | | | | |
| Philippine Long Distance Telephone Co. sponsored ADR | | 57,300 | | 1,976,850 |
| |
| TOTAL DIVERSIFIED TELECOMMUNICATION | | | | | | |
| SERVICES | | | | 3,632,990 |
| |
| ELECTRONIC EQUIPMENT & INSTRUMENTS – 2.1% | | | | | | |
| Electronic Equipment & Instruments – 1.6% | | | | | | |
| Applied Films Corp. (a) | | 216,200 | | 4,153,202 |
| Chi Mei Optoelectronics Corp. | | 396,582 | | 602,531 |
| Dolby Laboratories, Inc. Class A | | 79,700 | | 1,623,489 |
| HannStar Display Corp. | | 2,368,000 | | 438,677 |
| Photon Dynamics, Inc. (a) | | 43,484 | | 921,426 |
| | | | | 7,739,325 |
| Electronic Manufacturing Services – 0.5% | | | | | | |
| Molex, Inc. | | 25,700 | | 818,031 |
| Trimble Navigation Ltd. (a) | | 13,500 | | 552,285 |
| Xyratex Ltd. (a) | | 42,100 | | 1,065,130 |
| | | | | 2,435,446 |
| |
| TOTAL ELECTRONIC EQUIPMENT & INSTRUMENTS | | | | 10,174,771 |
| |
| HOUSEHOLD DURABLES – 0.6% | | | | | | |
| Consumer Electronics – 0.6% | | | | | | |
| Directed Electronics, Inc. | | 85,300 | | 1,206,995 |
| Garmin Ltd. | | 3,800 | | 261,516 |
| Thomson SA | | 70,900 | | 1,218,777 |
| | | | | 2,687,288 |
| |
| INTERNET SOFTWARE & SERVICES – 12.5% | | | | | | |
| Internet Software & Services – 12.5% | | | | | | |
| Google, Inc. Class A (sub. vtg.) (a) | | 131,307 | | 47,614,546 |
29
See accompanying notes which are an integral part of the financial statements.
29 Annual Report
| Developing Communications Portfolio | | | | |
| Investments - continued | | | | |
| |
| |
| Common Stocks – continued | | | | |
| | | Shares | | Value (Note 1) |
| |
| INTERNET SOFTWARE & SERVICES – CONTINUED | | | | |
| Internet Software & Services – continued | | | | |
| Openwave Systems, Inc. (a) | | 556,519 | | $ 11,046,902 |
| VeriSign, Inc. (a) | | 59,300 | | 1,403,038 |
| | | | | 60,064,486 |
| |
| SEMICONDUCTORS & SEMICONDUCTOR EQUIPMENT – 7.1% | | | | |
| Semiconductor Equipment – 1.2% | | | | |
| EMCORE Corp. (a) | | 200 | | 1,550 |
| MEMC Electronic Materials, Inc. (a) | | 170,700 | | 5,716,743 |
| | | | | 5,718,293 |
| Semiconductors – 5.9% | | | | |
| Advanced Analogic Technologies, Inc. | | 69,000 | | 823,860 |
| AMIS Holdings, Inc. (a) | | 248,100 | | 2,138,622 |
| Applied Micro Circuits Corp. (a) | | 739,868 | | 2,670,923 |
| ARM Holdings PLC sponsored ADR | | 232,100 | | 1,671,120 |
| ATI Technologies, Inc. (a) | | 270,600 | | 4,308,546 |
| Exar Corp. (a) | | 6,701 | | 83,427 |
| Ikanos Communications, Inc. | | 1,700 | | 37,400 |
| Marvell Technology Group Ltd. (a) | | 22,600 | | 1,383,572 |
| Microtune, Inc. (a) | | 276,300 | | 1,492,020 |
| Mindspeed Technologies, Inc. (a)(d) | | 956,763 | | 3,559,158 |
| Netlogic Microsystems, Inc. (a) | | 48,700 | | 1,721,545 |
| O2Micro International Ltd. sponsored ADR (a) | | 366,400 | | 4,616,640 |
| Pericom Semiconductor Corp. (a) | | 48,700 | | 438,787 |
| PMC-Sierra, Inc. (a) | | 1,200 | | 12,252 |
| PowerDsine Ltd. (a) | | 142,300 | | 1,139,823 |
| Sigma Designs, Inc. (a) | | 8,312 | | 122,186 |
| SiRF Technology Holdings, Inc. (a) | | 7,600 | | 284,468 |
| Transmeta Corp. (a) | | 108,800 | | 179,520 |
| Vimicro International Corp. sponsored ADR | | 57,000 | | 625,860 |
| Volterra Semiconductor Corp. (a) | | 55,100 | | 959,291 |
| | | | | 28,269,020 |
| |
| TOTAL SEMICONDUCTORS & SEMICONDUCTOR | | | | |
| EQUIPMENT | | | | 33,987,313 |
| |
| SOFTWARE – 2.8% | | | | |
| Application Software – 2.4% | | | | |
| Catapult Communications Corp. (a) | | 42,242 | | 587,586 |
| NAVTEQ Corp. (a) | | 63,200 | | 2,926,792 |
| Ulticom, Inc. (a) | | 709,578 | | 7,933,082 |
| | | | | 11,447,460 |
| Home Entertainment Software – 0.2% | | | | |
| Ubisoft Entertainment SA (a) | | 23,600 | | 918,561 |
| |
| |
| | | Shares | | Value (Note 1) |
| |
| Systems Software – 0.2% | | | | |
| Wind River Systems, Inc. (a) | | 73,000 $ | | 1,129,310 |
| |
| TOTAL SOFTWARE | | | | 13,495,331 |
See accompanying notes which are an integral part of the financial statements.
Annual Report 30
| SPECIALTY RETAIL – 0.2% | | | | |
| Computer & Electronics Retail – 0.2% | | | | |
| Gamestop Corp. Class B (a) | | 32,400 | | 1,182,924 |
| WIRELESS TELECOMMUNICATION SERVICES – 13.0% | | | | |
| Wireless Telecommunication Services – 13.0% | | | | |
| American Tower Corp. Class A (a) | | 441,300 | | 14,046,579 |
| Crown Castle International Corp. (a) | | 523,100 | | 16,399,185 |
| MTN Group Ltd. | | 154,700 | | 1,504,254 |
| NII Holdings, Inc. (a) | | 29,800 | | 1,526,356 |
| Sprint Nextel Corp. | | 1,070,400 | | 25,721,712 |
| Syniverse Holdings, Inc. | | 101,700 | | 1,454,310 |
| Vimpel Communications sponsored ADR (a) | | 29,200 | | 1,284,800 |
| WiderThan Co. Ltd. ADR | | 25,600 | | 371,200 |
| | | | | 62,308,396 |
| |
| TOTAL COMMON STOCKS | | | | |
| (Cost $473,638,512) | | | | 480,360,405 |
| |
| Money Market Funds — 5.0% | | | | |
| |
| Fidelity Cash Central Fund, 4.57% (b) | | 2,066,333 | | 2,066,333 |
| Fidelity Securities Lending Cash Central Fund, 4.58% (b)(c) | | 22,148,590 | | 22,148,590 |
| TOTAL MONEY MARKET FUNDS | | | | |
| (Cost $24,214,923) | | | | 24,214,923 |
| |
| TOTAL INVESTMENT PORTFOLIO - 105.1% | | | | |
| (Cost $497,853,435) | | | | 504,575,328 |
| |
| NET OTHER ASSETS – (5.1)% | | | | (24,448,518) |
| NET ASSETS – 100% | | $ | | 480,126,810 |
(a) Non-income producing
(b) Affiliated fund that is available only to investment companies and other accounts managed by Fidelity Investments. The rate quoted is the annualized seven-day yield of the fund at period end. A complete unaudited listing of the fund’s holdings as of its most recent quarter end is available upon request.
(c) Investment made with cash collateral received from securities on loan. (d) Security or a portion of the security is on loan at period end.
See accompanying notes which are an integral part of the financial statements.
|
31 Annual Report
31
| Developing Communications Portfolio | | |
| Investments - continued | | |
| |
| |
| Affiliated Central Funds | | |
| Information regarding fiscal year to date income earned by the fund from the affiliated Central funds is as follows: | | |
| |
| Fund | | Income earned |
| Fidelity Cash Central Fund | | $ 185,800 |
| Fidelity Securities Lending Cash Central Fund | | 270,292 |
| Total | | $ 456,092 |
Distribution of investments by country of issue, as a percentage of total net assets, is as follows:
| United States of America | | 80.8% |
| Canada | | 7.9% |
| France | | 3.4% |
| Israel | | 3.3% |
| Cayman Islands | | 1.2% |
| Others (individually less than 1%) | | 3.4% |
| | | 100.0% |
At February 28, 2006, the fund had a capital loss carryforward of approximately $1,232,103,818 of which $876,655,867 and $355,447,951 will expire on February 28, 2010 and 2011, respectively.
The fund intends to elect to defer to its fiscal year ending February 28, 2007 approximately $7,544,000 of losses recognized during the period November 1, 2005 to February 28, 2006.
See accompanying notes which are an integral part of the financial statements.
Annual Report 32
| Developing Communications Portfolio | | | | | | |
| |
| Financial Statements | | | | | | |
| |
| |
| Statement of Assets and Liabilities | | | | | | |
| | | | | | | February 28, 2006 |
| |
| Assets | | | | | | |
| Investment in securities, at value (including securities loaned of $21,506,330) — See accompanying schedule: | | | | | | |
| Unaffiliated issuers (cost $473,638,512) | | $ | | 480,360,405 | | |
| Affiliated Central Funds (cost $24,214,923) | | | | 24,214,923 | | |
| Total Investments (cost $497,853,435) | | | | $ | | 504,575,328 |
| Foreign currency held at value (cost $22) | | | | | | 22 |
| Receivable for investments sold | | | | | | 1,032,831 |
| Receivable for fund shares sold | | | | | | 1,541,747 |
| Dividends receivable | | | | | | 67,374 |
| Interest receivable | | | | | | 7,275 |
| Prepaid expenses | | | | | | 1,913 |
| Other affiliated receivables | | | | | | 401 |
| Other receivables | | | | | | 85,575 |
| Total assets | | | | | | 507,312,466 |
| |
| Liabilities | | | | | | |
| Payable for investments purchased | | $ | | 3,148,623 | | |
| Payable for fund shares redeemed | | | | 1,466,910 | | |
| Accrued management fee | | | | 228,424 | | |
| Other affiliated payables | | | | 164,794 | | |
| Other payables and accrued expenses | | | | 28,315 | | |
| Collateral on securities loaned, at value | | | | 22,148,590 | | |
| Total liabilities | | | | | | 27,185,656 |
| |
| Net Assets | | | | $ | | 480,126,810 |
| Net Assets consist of: | | | | | | |
| Paid in capital | | | | $1,717,245,273 |
| Accumulated net investment loss | | | | | | (789) |
| Accumulated undistributed net realized gain (loss) on investments and foreign currency transactions | | | | (1,243,839,567) |
| Net unrealized appreciation (depreciation) on investments | | | | | | 6,721,893 |
| Net Assets, for 22,154,148 shares outstanding | | | | $ | | 480,126,810 |
| Net Asset Value, offering price and redemption price per share ($480,126,810 ÷ 22,154,148 shares) | | | | $ | | 21.67 |
| |
| Statement of Operations | | | | | | |
| | | | | | | Year ended February 28, 2006 |
| |
| Investment Income | | | | | | |
| Dividends | | | | $ | | 1,906,285 |
| Interest | | | | | | 5,299 |
| Income from affiliated Central Funds (including $270,292 from security lending) | | | | | | 456,092 |
| | | | | | | 2,367,676 |
| Less foreign taxes withheld | | | | | | (246,539) |
| Total income | | | | | | 2,121,137 |
| |
| Expenses | | | | | | |
| Management fee | | $ | | 2,643,641 | | |
| Transfer agent fees | | | | 1,927,427 | | |
| Accounting and security lending fees | | | | | | |
| | | | | 236,716 | | |
| Independent trustees’ compensation | | | | 2,024 | | |
| Custodian fees and expenses | | | | 31,807 | | |
| Registration fees | | | | 28,724 | | |
| Audit | | | | 37,005 | | |
| Legal | | | | 5,832 | | |
| Interest | | | | 1,227 | | |
| Miscellaneous | | | | 6,442 | | |
| Total expenses before reductions | | | | 4,920,845 | | |
| Expense reductions | | | | (551,818) | | 4,369,027 |
| See accompanying notes which are an integral part of the financial statements. | | | | | | |
33 Annual Report
| Developing Communications Portfolio | | | | |
| Financial Statements - continued | | | | |
| |
| |
| |
| Net investment income (loss) | | | | (2,247,890) |
| Realized and Unrealized Gain (Loss) | | | | |
| Net realized gain (loss) on: | | | | |
| Investment securities: | | | | |
| Unaffiliated issuers | | 28,087,951 | | |
| Foreign currency transactions | | (7,814) | | |
| Total net realized gain (loss) | | | | 28,080,137 |
| Change in net unrealized appreciation (depreciation) on: | | | | |
| Investment securities | | 65,842,662 | | |
| Assets and liabilities in foreign currencies | | (5,275) | | |
| Total change in net unrealized appreciation (depreciation) | | | | 65,837,387 |
| Net gain (loss) | | | | 93,917,524 |
| Net increase (decrease) in net assets resulting from operations | | | | $91,669,634 |
See accompanying notes which are an integral part of the financial statements.
Annual Report 34
| Statement of Changes in Net Assets | | | | | | | | | | | | | | | | | | |
| | | | | | | | | Year ended | | | | Year ended |
| | | | | | | | | February 28, | | | | February 28, |
| | | | | | | | | 2006 | | | | 2005 |
| Increase (Decrease) in Net Assets | | | | | | | | | | | | | | | | | | |
| Operations | | | | | | | | | | | | | | | | | | |
| Net investment income (loss) | | | | | | | | $ | | (2,247,890) | | $ | | (4,330,345) |
| Net realized gain (loss) | | | | | | | | | | 28,080,137 | | | | 101,737,018 |
| Change in net unrealized appreciation (depreciation) | | | | | | | | | | 65,837,387 | | | | (229,054,454) |
| Net increase (decrease) in net assets resulting from operations | | | | | | | | | | 91,669,634 | | | | (131,647,781) |
| Share transactions | | | | | | | | | | | | | | | | | | |
| Proceeds from sales of shares | | | | | | | | | | 135,493,900 | | | | 377,401,809 |
| Cost of shares redeemed | | | | | | | | (258,336,137) | | | | (675,034,861) |
| Net increase (decrease) in net assets resulting from share transactions | | | | | | | | (122,842,237) | | | | (297,633,052) |
| Redemption fees | | | | | | | | | | | | 89,299 | | | | | | 429,952 |
| Total increase (decrease) in net assets | | | | | | | | | | (31,083,304) | | | | (428,850,881) |
| |
| Net Assets | | | | | | | | | | | | | | | | | | |
| Beginning of period | | | | | | | | | | 511,210,114 | | | | 940,060,995 |
| End of period (including accumulated net investment loss of $789 and accumulated net investment loss of $1,083, | | | | | | | | | | | | |
| respectively) | | | | | | | | $ | | 480,126,810 | | $ | | 511,210,114 |
| |
| Other Information | | | | | | | | | | | | | | | | | | |
| Shares | | | | | | | | | | | | | | | | | | |
| Sold | | | | | | | | | | 6,969,732 | | | | 20,731,445 |
| Redeemed | | | | | | | | | | (13,742,323) | | | | (38,219,713) |
| Net increase (decrease) | | | | | | | | | | (6,772,591) | | | | (17,488,268) |
| |
| Financial Highlights | | | | | | | | | | | | | | | | | | |
| Years ended February 28, | | 2006 | | 2005 | | 2004E | | | | 2003 | | | | | | 2002 |
| Selected Per-Share Data | | | | | | | | | | | | | | | | | | |
| Net asset value, beginning of period | | $ 17.67 | | $ 20.25 | | $ | | 10.03 | | $ | | 14.98 | | | | $ | | 23.94 |
| Income from Investment Operations | | | | | | | | | | | | | | | | | | |
| Net investment income (loss)C | | (.09) | | (.11) | | | | (.13) | | | | (.10) | | | | | | (.11) |
| Net realized and unrealized gain (loss) | | 4.09 | | (2.48) | | | | 10.34 | | | | (4.85) | | | | | | (8.85) |
| Total from investment operations | | 4.00 | | (2.59) | | | | 10.21 | | | | (4.95) | | | | | | (8.96) |
| Redemption fees added to paid in capitalC | | —F | | .01 | | | | .01 | | | | —F | | | | | | —F |
| Net asset value, end of period | | $ 21.67 | | $ 17.67 | | $ | | 20.25 | | $ | | 10.03 | | | | $ | | 14.98 |
| Total ReturnA,B | | 22.64% | | (12.74)% | | 101.89% | | | | (33.04)% | | | | | | (37.43)% |
| Ratios to Average Net AssetsD | | | | | | | | | | | | | | | | | | |
| Expenses before reductions | | 1.06% | | 1.07% | | | | 1.37% | | | | 1.76% | | | | | | 1.31% |
| Expenses net of fee waivers, if any | | 1.06% | | 1.07% | | | | 1.37% | | | | 1.76% | | | | | | 1.31% |
| Expenses net of all reductions | | 94% | | .89% | | | | 1.23% | | | | 1.58% | | | | | | 1.22% |
| Net investment income (loss) | | (.48)% | | (.64)% | | | | (.87)% | | | | (.93)% | | | | | | (.55)% |
| Supplemental Data | | | | | | | | | | | | | | | | | | |
| Net assets, end of period (000 omitted) | | $ 480,127 | | $ 511,210 | | $ 940,061 | | $ 319,521 | | | | $ 592,703 |
| Portfolio turnover rate | | 167% | | 226% | | | | 205% | | | | 111% | | | | | | 198% |
ATotal returns would have been lower had certain expenses not been reduced during the periods shown. BTotal returns do not include the effect of the former sales charges. CCalculated based on average shares outstanding during the period. DExpense ratios reflect operating expenses of the fund. Expenses before reductions do not reflect amounts reimbursed by the investment adviser or reductions from brokerage service arrangements or other expense offset arrangements and do not represent the amount paid by the fund during periods when reimbursements or reductions occur. Expenses net of fee waivers reflect expenses after reimbursement by the investment adviser but prior to reductions from brokerage service arrangements or other expense offset arrangements. Expenses net of all reductions represent the net expenses paid by the fund. EFor the year ended February 29. FAmount represents less than $.01 per share.
See accompanying notes which are an integral part of the financial statements.
|
Electronics Portfolio
Performance
|
Average annual total return reflects the change in the value of an investment, assuming reinvestment of the fund’s dividend income and capital gains (the profits earned upon the sale of securities that have grown in value) and assuming a constant rate of performance each year. The $10,000 table and the fund’s returns do not reflect the deduction of taxes that a shareholder would pay on fund distributions or the redemption of fund shares. During periods of reimbursement by Fidelity, a fund’s total returns will be greater than it would be had the reimbursement not occurred. How a fund did yesterday is no guarantee of how it will do tomorrow.
| Average Annual Total Returns | | | | | | |
| Periods ended February 28, 2006 | | Past 1 | | Past 5 | | Past 10 |
| | | year | | years | | years |
| Select Electronics | | 19.70% | | --0.69% | | 11.83% |
$10,000 Over 10 Years
Let’s say hypothetically that $10,000 was invested in Fidelity Select Electronics Portfolio on February 29, 1996. The chart shows how the value of your investment would have changed, and also shows how the S&P 500 Index performed over the same period.
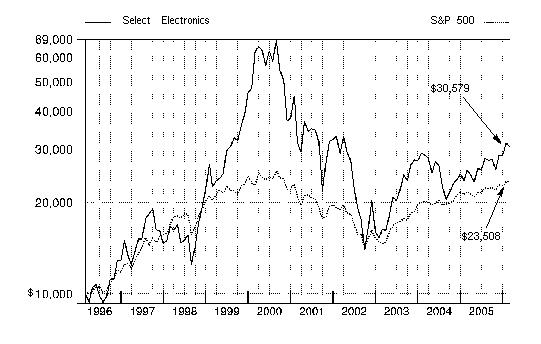
Management’s Discussion of Fund Performance
Comments from James Morrow, Portfolio Manager of Fidelity® Select Electronics Portfolio
With the exception of several popular large-cap stock performance measures, most major U.S. equity benchmarks had double-digit returns for the year ending February 28, 2006. For much of the period, market gains were driven largely by the energy sector, although utilities ultimately sneaked into the top spot for the year overall. Financials and telecommunication services also reached double figures, outperforming the 8.40% return of the broader market as measured by the large-cap-oriented Standard & Poor’s 500SM Index. The consumer discretionary segment — home to the weak performing automobile and media industries — was the biggest disappointment. Although the overall return for the S&P 500® beat the small-cap Russell 2000® Index in calendar year 2005 — the first time that’s happened in six years — small-caps stormed back in early 2006, leading to a 16.59% advance during the past 12 months, nearly twice the broader market’s gain. Mid-caps soared even higher, returning 17.67% according to the Russell Midcap® Index. The technology-heavy NASDAQ Composite® Index also fared well, climbing 12.13%, but the Dow Jones Industrial AverageSM, an index of 30 large-cap, blue-chip stocks, managed to rise only 4.52% .
During the past year, the fund posted a return of 19.70%, which compared favorably with the performance of the S&P 500 and the 11.34% gain of the Goldman Sachs® Technology Index. Favorable stock selection in semiconductor stocks — which comprised roughly 60% of the fund’s net assets on average — provided the biggest boost to performance versus the sector index. The top contributor was National Semiconductor, a restructuring story in which the fund had a heavily overweighted position. Other semiconductor positions that were beneficial to performance included Marvell Technology Group, Korea-based Samsung Electronics and Texas Instruments. Tight inventories and strong demand for chips used in wireless handsets, flat-panel displays, high-definition television sets and other applications pushed these stocks higher. I sold Texas Instruments by period end. Conversely, a relatively modest stake in the strong performing communications equipment industry hurt performance. Not owning computer hardware maker Hewlett-Packard — a large index component — had the biggest negative impact versus the sector index. Under recently appointed CEO Mark Hurd, the company made strides in cutting costs and streamlining its operations, which boosted its stock. Maxim Integrated Products was one of the fund’s chip holdings that disappointed me, despite an improving earnings trend.
The views expressed above reflect those of the portfolio manager(s) only through the end of the period as stated on the cover of this report and do not necessarily represent the views of Fidelity or any other person in the Fidelity organization. Any such views are subject to change at any time based upon market or other conditions and Fidelity disclaims any responsibility to update such views. These views may not be relied on as investment advice and, because investment decisions for a Fidelity fund are based on numerous factors, may not be relied on as an indication of trading intent on behalf of any Fidelity fund.
37 37 Annual Report
| Electronics Portfolio | | | | |
| Investment Changes | | |
| |
| |
| Top Ten Stocks as of February 28, 2006 |
| | | % of fund’s | | % of fund’s net assets |
| | | net assets | | 6 months ago |
| Intel Corp. | | 6.9 | | 10.2 |
| Linear Technology Corp. | | 6.0 | | 4.2 |
| National Semiconductor Corp. | | 5.9 | | 7.8 |
| Analog Devices, Inc. | | 5.6 | | 7.4 |
| Maxim Integrated Products, Inc. | | 5.5 | | 6.8 |
| Marvell Technology Group Ltd. | | 4.8 | | 2.5 |
| Altera Corp. | | 4.5 | | 2.4 |
| Hon Hai Precision Industry Co. | | | | |
| Ltd. (Foxconn) | | 4.4 | | 3.4 |
| Samsung Electronics Co. Ltd. | | 3.7 | | 2.2 |
| KLA-Tencor Corp. | | 3.1 | | 2.4 |
| | | 50.4 | | |
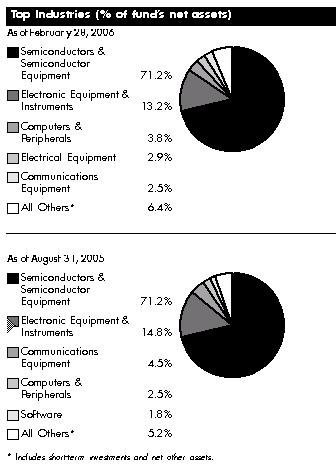
Annual Report 38
| Electronics Portfolio | | | | | | | | |
| Investments February 28, 2006 | | | | |
| Showing Percentage of Net Assets | | | | | | | | |
| |
| Common Stocks — 98.3% | | | | | | | | |
| | | | | | | Shares | | Value (Note 1) |
| |
| BUILDING PRODUCTS – 0.3% | | | | | | | | |
| Building Products – 0.3% | | | | | | | | |
| Asahi Glass Co. Ltd. | | | | | | 700,000 | | $ 9,838,279 |
| CHEMICALS – 1.4% | | | | | | | | |
| Specialty Chemicals – 1.4% | | | | | | | | |
| Nitto Denko Corp. | | | | | | 200,000 | | 17,138,198 |
| Tokuyama Corp. | | | | | | 1,505,000 | | 22,382,980 |
| | | | | | | | | 39,521,178 |
| |
| COMMUNICATIONS EQUIPMENT – 2.5% | | | | | | | | |
| Communications Equipment – 2.5% | | | | | | | | |
| CSR PLC (a) | | | | | | 1,500,000 | | 23,812,586 |
| Motorola, Inc. | | | | | | 2,250,000 | | 48,150,000 |
| | | | | | | | | 71,962,586 |
| |
| COMPUTERS & PERIPHERALS – 3.8% | | | | | | | | |
| Computer Hardware – 2.2% | | | | | | | | |
| Acer, Inc. | | | | | | 5,000,000 | | 11,005,069 |
| Apple Computer, Inc. (a) | | | | | | 250,000 | | 17,135,000 |
| Dell, Inc. (a) | | | | | | 1,000,000 | | 29,000,000 |
| Quanta Computer, Inc. | | | | | | 4,000,000 | | 6,071,130 |
| | | | | | | | | 63,211,199 |
| Computer Storage & Peripherals – 1.6% | | | | | | | | |
| Ichia Technologies, Inc. | | | | | | 5,000,000 | | 3,874,701 |
| Phison Electronics Corp. | | | | | | 700,000 | | 3,209,812 |
| QLogic Corp. (a) | | | | | | 300,000 | | 12,342,000 |
| SanDisk Corp. (a) | | | | | | 75,000 | | 4,525,500 |
| Seagate Technology | | | | | | 600,000 | | 15,942,000 |
| TPV Technology Ltd. | | | | | | 4,000,000 | | 4,408,409 |
| | | | | | | | | 44,302,422 |
| |
| TOTAL COMPUTERS & PERIPHERALS | | | | | | | | 107,513,621 |
| |
| ELECTRICAL EQUIPMENT – 2.7% | | | | | | | | |
| Electrical Components & Equipment – 2.7% | | | | | | | | |
| Evergreen Solar, Inc. (a) | | | | | | 2,000,000 | | 31,180,000 |
| Motech Industries, Inc. | | | | | | 1,500,000 | | 33,336,189 |
| Suntech Power Holdings Co. Ltd. sponsored ADR | | | | | | 310,400 | | 11,658,624 |
| | | | | | | | | 76,174,813 |
| |
| ELECTRONIC EQUIPMENT & INSTRUMENTS – 13.2% | | | | | | | | |
| Electronic Equipment & Instruments – 3.9% | | | | | | | | |
| Agilent Technologies, Inc. (a) | | | | | | 300,000 | | 10,800,000 |
| Amphenol Corp. Class A | | | | | | 600,000 | | 30,138,000 |
| AU Optronics Corp. sponsored ADR | | | | | | 1,800,000 | | 28,638,000 |
| Cogent, Inc. (a) | | | | | | 500,000 | | 11,630,000 |
| Cognex Corp. | | | | | | 300,000 | | 8,253,000 |
| Ibiden Co. Ltd. | | | | | | 125,000 | | 5,877,414 |
| Kyocera Corp. sponsored ADR | | | | | | 55,000 | | 4,877,950 |
| Vishay Intertechnology, Inc. (a) | | | | | | 700,000 | | 10,164,000 |
| | | | | | | | | 110,378,364 |
See accompanying notes which are an integral part of the financial statements.
|
39 Annual Report
39
| Electronics Portfolio | | | | |
| Investments - continued | | | | |
| |
| |
| |
| | | Shares | | Value (Note 1) |
| Electronic Manufacturing Services – 5.3% | | | | |
| Flextronics International Ltd. (a) | | 2,300,000 | | $ 24,817,000 |
| Hon Hai Precision Industry Co. Ltd. (Foxconn) | | 20,000,000 | | 125,946,903 |
| | | | | 150,763,903 |
| Technology Distributors – 4.0% | | | | |
| Arrow Electronics, Inc. (a) | | 1,800,000 | | 62,622,000 |
| Avnet, Inc. (a) | | 1,500,014 | | 37,695,352 |
| Wolfson Microelectronics PLC (a) | | 2,000,000 | | 12,682,504 |
| | | | | 112,999,856 |
| |
| TOTAL ELECTRONIC EQUIPMENT & INSTRUMENTS | | | | 374,142,123 |
| |
| HOUSEHOLD DURABLES – 1.3% | | | | |
| Consumer Electronics – 1.3% | | | | |
| Koninklijke Philips Electronics NV (NY Shares) | | 500,000 | | 16,260,000 |
| LG Electronics, Inc. | | 100,000 | | 8,215,808 |
| Sharp Corp. | | 750,000 | | 13,224,181 |
| | | | | 37,699,989 |
| |
| INTERNET & CATALOG RETAIL – 0.1% | | | | |
| Catalog Retail – 0.1% | | | | |
| Insight Enterprises, Inc. (a) | | 200,000 | | 4,306,000 |
| INTERNET SOFTWARE & SERVICES – 0.3% | | | | |
| Internet Software & Services – 0.3% | | | | |
| Google, Inc. Class A (sub. vtg.) (a) | | 25,000 | | 9,065,500 |
| OFFICE ELECTRONICS – 0.7% | | | | |
| Office Electronics – 0.7% | | | | |
| Canon, Inc. sponsored ADR | | 300,000 | | 18,744,000 |
| SEMICONDUCTORS & SEMICONDUCTOR EQUIPMENT – 71.2% | | | | |
| Semiconductor Equipment – 15.4% | | | | |
| Applied Materials, Inc. | | 3,000,000 | | 55,020,000 |
| ASML Holding NV (NY Shares) (a) | | 3,500,000 | | 72,380,000 |
| ATMI, Inc. (a) | | 300,000 | | 9,009,000 |
| Brooks Automation, Inc. (a) | | 300,000 | | 4,707,000 |
| Cohu, Inc. (e) | | 1,400,000 | | 29,568,000 |
| Credence Systems Corp. (a) | | 800,000 | | 6,928,000 |
| Cymer, Inc. (a) | | 250,000 | | 11,245,000 |
| Entegris, Inc. (a) | | 1,000,000 | | 10,460,000 |
| FormFactor, Inc. (a) | | 500,000 | | 18,420,000 |
| KLA-Tencor Corp. (d) | | 1,700,000 | | 88,791,000 |
| Lam Research Corp. (a) | | 1,000,000 | | 43,100,000 |
| MEMC Electronic Materials, Inc. (a) | | 1,250,000 | | 41,862,500 |
| MKS Instruments, Inc. (a) | | 300,000 | | 6,708,000 |
| Teradyne, Inc. (a) | | 1,000,000 | | 16,790,000 |
| Varian Semiconductor Equipment Associates, Inc. (a) | | 300,000 | | 14,148,000 |
| Veeco Instruments, Inc. (a) | | 400,000 | | 8,036,000 |
| | | | | 437,172,500 |
| Semiconductors – 55.8% | | | | |
| Altera Corp. (a) | | 6,300,000 | | 126,252,000 |
See accompanying notes which are an integral part of the financial statements.
Annual Report 40
| Common Stocks – continued | | | | |
| | | Shares | | Value (Note 1) |
| |
| SEMICONDUCTORS & SEMICONDUCTOR EQUIPMENT – CONTINUED | | | | |
| Semiconductors – continued | | | | |
| AMIS Holdings, Inc. (a) | | 550,000 | | $ 4,741,000 |
| Analog Devices, Inc. | | 4,200,000 | | 160,188,000 |
| ARM Holdings PLC sponsored ADR | | 8,000,000 | | 57,600,000 |
| Cree, Inc. (a) | | 700,000 | | 20,965,000 |
| Cypress Semiconductor Corp. (a) | | 1,000,000 | | 17,760,000 |
| Exar Corp. (a) | | 500,000 | | 6,225,000 |
| Freescale Semiconductor, Inc.: | | | | |
| Class A (a) | | 850,000 | | 22,856,500 |
| Class B (a) | | 850,048 | | 22,985,298 |
| Holtek Semiconductor, Inc. | | 5,000,000 | | 7,672,979 |
| Intel Corp. (d) | | 9,500,000 | | 195,700,001 |
| Intersil Corp. Class A | | 200,000 | | 5,668,000 |
| Linear Technology Corp. | | 4,600,000 | | 169,556,000 |
| LSI Logic Corp. (a) | | 3,000,000 | | 29,250,000 |
| Marvell Technology Group Ltd. (a) | | 2,225,000 | | 136,214,500 |
| Maxim Integrated Products, Inc. | | 4,000,000 | | 156,360,000 |
| Microchip Technology, Inc. | | 350,000 | | 12,320,000 |
| Mindspeed Technologies, Inc. (a) | | 2,750,000 | | 10,230,000 |
| National Semiconductor Corp. (d) | | 6,000,000 | | 168,300,000 |
| O2Micro International Ltd. sponsored ADR (a) | | 300,000 | | 3,780,000 |
| ON Semiconductor Corp. (a) | | 2,500,000 | | 16,475,000 |
| PMC-Sierra, Inc. (a) | | 3,411,300 | | 34,829,373 |
| Q-Cells AG | | 75,000 | | 7,618,413 |
| Rambus, Inc. (a)(d) | | 750,000 | | 23,287,500 |
| Saifun Semiconductors Ltd. | | 164,700 | | 4,891,590 |
| Samsung Electronics Co. Ltd. | | 150,000 | | 105,172,542 |
| Siliconware Precision Industries Co. Ltd. sponsored ADR (d) | | 2,500,002 | | 15,975,013 |
| Sumco Corp. | | 50,000 | | 2,487,253 |
| Taiwan Semiconductor Manufacturing Co. Ltd. sponsored ADR | | 2,250,000 | | 21,892,500 |
| Volterra Semiconductor Corp. (a)(d) | | 1,000,000 | | 17,410,000 |
| | | | | 1,584,663,462 |
| |
| TOTAL SEMICONDUCTORS & SEMICONDUCTOR | | | | |
| EQUIPMENT | | | | 2,021,835,962 |
| |
| SOFTWARE – 0.5% | | | | |
| Application Software – 0.5% | | | | |
| Cadence Design Systems, Inc. (a) | | 400,000 | | 7,100,000 |
| Synopsys, Inc. (a) | | 300,000 | | 6,561,000 |
| | | | | 13,661,000 |
| |
| SPECIALTY RETAIL – 0.3% | | | | |
| Computer & Electronics Retail – 0.3% | | | | |
| Gamestop Corp. Class B (a) | | 200,000 | | 7,302,000 |
| TOTAL COMMON STOCKS | | | | |
| (Cost $2,506,232,939) | | 2,791,767,051 |
See accompanying notes which are an integral part of the financial statements.
|
41 Annual Report
41
Electronics Portfolio
Investments - continued
|
| Convertible Bonds — 0.2% | | | | |
| | | Principal | | Value |
| | | Amount | | (Note 1) |
| ELECTRICAL EQUIPMENT – 0.2% | | | | |
| Electrical Components & Equipment – 0.2% | | | | |
| Evergreen Solar, Inc. 4.375% 7/1/12 (f) | | | | |
| (Cost $2,980,000) | | $ 2,980,000 | | $6,481,500 |
| Money Market Funds — 5.5% | | | | |
| | | Shares | | |
| Fidelity Cash Central Fund, 4.57% (b) | | 49,093,948 | | 49,093,948 |
| Fidelity Securities Lending Cash Central Fund, 4.58% (b)(c) | | 107,673,450 | | 107,673,450 |
| TOTAL MONEY MARKET FUNDS | | | | |
| (Cost $156,767,398) | | | | 156,767,398 |
| Cash Equivalents — 0.1% | | | | |
| | | Maturity | | |
| | | Amount | | |
| Investments in repurchase agreements (Collateralized by U.S. Treasury Obligations, in a joint trading account at | | | | |
| 4.5%, dated 2/28/06 due 3/1/06) | | | | |
| (Cost $3,382,000) | | $ 3,382,423 | | 3,382,000 |
| TOTAL INVESTMENT PORTFOLIO - 104.1% | | | | |
| (Cost $2,669,362,337) | | 2,958,397,949 |
| |
| NET OTHER ASSETS – (4.1)% | | (117,827,936) |
| NET ASSETS – 100% | | $2,840,570,013 |
(a) Non-income producing
(b) Affiliated fund that is available only to investment companies and other accounts managed by Fidelity Investments. The rate quoted is the annualized seven-day yield of the fund at period end. A complete unaudited listing of the fund’s holdings as of its most recent quarter end is available upon request.
(c) Investment made with cash collateral received from securities on loan. (d) Security or a portion of the security is on loan at period end.
(e) Affiliated company
(f) Security exempt from registration under Rule 144A of the Securities Act of 1933. These securities may be resold in transactions exempt from registration, normally to qualified institutional buyers. At the period end, the value of these securities amounted to $6,481,500 or 0.2% of net assets.
See accompanying notes which are an integral part of the financial statements.
Annual Report 42
| Affiliated Central Funds | | |
| Information regarding fiscal year to date income earned by the fund from the affiliated Central funds is as follows: | | |
| |
| Fund | | Income earned |
| Fidelity Cash Central Fund | | $ 2,347,261 |
| Fidelity Securities Lending Cash Central Fund | | 474,811 |
| Total | | $ 2,822,072 |
| Other Affiliated Issuers | | |
An affiliated company is a company in which the fund has ownership of at least 5% of the voting securities. Fiscal year to date transactions with companies which are or were affiliates are as follows:
| | | Value, beginning | | | | | | Sales | | | | Dividend | | | | Value, end |
| Affiliate | | of period | | | | Purchases | | Proceeds | | | | Income | | | | of period |
| Cohu, Inc. | | $ — | | $ | | 34,232,872 | | $ — | | $ | | 48,000 | | $ | | 29,568,000 |
Distribution of investments by country of issue, as a percentage of total net assets, is as follows:
| United States of America | | 69.6% |
| Taiwan | | 9.1% |
| Bermuda | | 5.0% |
| Korea (South) | | 4.0% |
| Japan | | 3.3% |
| United Kingdom | | 3.3% |
| Netherlands | | 3.2% |
| Cayman Islands | | 1.1% |
| Others (individually less than 1%) | | 1.4% |
| | | 100.0% |
At February 28, 2006, the fund had a capital loss carryforward of approximately $2,795,466,298 of which $1,213,182,479, $1,514,779,921 and $67,503,898 will expire on February 28, 2010, 2011 and February 29, 2012, respectively.
See accompanying notes which are an integral part of the financial statements.
|
43 Annual Report
43
| Electronics Portfolio | | | | | | | | |
| |
| Financial Statements | | | | | | | | |
| |
| |
| Statement of Assets and Liabilities | | | | | | | | |
| | | | | | | | | February 28, 2006 |
| |
| Assets | | | | | | | | |
| Investment in securities, at value (including securities loaned of $104,898,383 and repurchase agreements of | | | | | | | | |
| $3,382,000) — See accompanying schedule: | | | | | | | | |
| Unaffiliated issuers (cost $2,478,362,067) | | $2,772,062,551 | | | | |
| Affiliated Central Funds (cost $156,767,398) | | | | 156,767,398 | | | | |
| Other affiliated issuers (cost $34,232,872) | | | | 29,568,000 | | | | |
| Total Investments (cost $2,669,362,337) | | | | | | $2,958,397,949 |
| Cash | | | | | | | | 350 |
| Foreign currency held at value (cost $3,008) | | | | | | | | 3,026 |
| Receivable for fund shares sold | | | | | | | | 2,883,432 |
| Dividends receivable | | | | | | | | 2,601,542 |
| Interest receivable | | | | | | | | 336,387 |
| Prepaid expenses | | | | | | | | 11,191 |
| Other affiliated receivables | | | | | | | | 11,966 |
| Other receivables | | | | | | | | 169,928 |
| Total assets | | | | | | | | 2,964,415,771 |
| |
| Liabilities | | | | | | | | |
| Payable for investments purchased | | $ | | 3,451,233 | | | | |
| Payable for fund shares redeemed | | | | 10,439,718 | | | | |
| Accrued management fee | | | | 1,378,846 | | | | |
| Other affiliated payables | | | | 796,886 | | | | |
| Other payables and accrued expenses | | | | 105,625 | | | | |
| Collateral on securities loaned, at value | | | | 107,673,450 | | | | |
| Total liabilities | | | | | | | | 123,845,758 |
| |
| Net Assets | | | | | | $ 2,840,570,013 |
| Net Assets consist of: | | | | | | | | |
| Paid in capital | | | | | | $5,349,588,721 |
| Accumulated net investment loss | | | | | | | | (38,218) |
| Accumulated undistributed net realized gain (loss) on investments and foreign currency transactions | | | | | | (2,798,042,643) |
| Net unrealized appreciation (depreciation) on investments and assets and liabilities in foreign currencies | | | | | | | | 289,062,153 |
| Net Assets, for 60,957,920 shares outstanding | | | | | | $ 2,840,570,013 |
| Net Asset Value, offering price and redemption price per share ($2,840,570,013 ÷ 60,957,920 shares) | | | | | | $ | | 46.60 |
| |
| Statement of Operations | | | | | | | | |
| | | | | | | | | Year ended February 28, 2006 |
| |
| Investment Income | | | | | | | | |
| Dividends (including $48,000 received from other affiliated issuers) | | | | | | $ | | 17,553,991 |
| Interest | | | | | | | | 116,108 |
| Income from affiliated Central Funds (including $474,811 from security lending) | | | | | | | | 2,822,072 |
| | | | | | | | | 20,492,171 |
| Less foreign taxes withheld | | | | | | | | (1,309,976) |
| Total income | | | | | | | | 19,182,195 |
| |
| Expenses | | | | | | | | |
| Management fee | | $ | | 15,361,915 | | | | |
| Transfer agent fees | | | | 8,455,963 | | | | |
| Accounting and security lending fees | | | | | | | | |
| | | | | 1,030,494 | | | | |
| Independent trustees’ compensation | | | | 11,561 | | | | |
| Appreciation in deferred trustee compensation account | | | | 3,647 | | | | |
| Custodian fees and expenses | | | | 437,675 | | | | |
| Registration fees | | | | 112,948 | | | | |
| Audit | | | | 50,949 | | | | |
| Legal | | | | 20,736 | | | | |
| Miscellaneous | | | | 32,223 | | | | |
See accompanying notes which are an integral part of the financial statements.
Annual Report 44
| Total expenses before reductions | | 25,518,111 | | |
| Expense reductions | | (1,767,365) | | 23,750,746 |
| |
| Net investment income (loss) | | | | (4,568,551) |
| Realized and Unrealized Gain (Loss) | | | | |
| Net realized gain (loss) on: | | | | |
| Investment securities: | | | | |
| Unaffiliated issuers | | 254,864,482 | | |
| Foreign currency transactions | | (466,449) | | |
| Total net realized gain (loss) | | | | 254,398,033 |
| Change in net unrealized appreciation (depreciation) on: | | | | |
| Investment securities | | 225,608,763 | | |
| Assets and liabilities in foreign currencies | | (717,420) | | |
| Total change in net unrealized appreciation (depreciation) | | | | 224,891,343 |
| Net gain (loss) | | | | 479,289,376 |
| Net increase (decrease) in net assets resulting from operations | | | | $474,720,825 |
See accompanying notes which are an integral part of the financial statements.
|
45 Annual Report
| Electronics Portfolio | | | | | | | | | | | | | | | | | | | | |
| Financial Statements - continued | | | | | | | | | | | | | | | | | | | | |
| |
| |
| Statement of Changes in Net Assets | | | | | | | | | | | | | | | | | | | | |
| | | | | | | | | | | Year ended | | | | Year ended |
| | | | | | | | | | | February 28, | | | | February 28, |
| | | | | | | | | | | 2006 | | | | 2005 |
| Increase (Decrease) in Net Assets | | | | | | | | | | | | | | | | | | | | |
| Operations | | | | | | | | | | | | | | | | | | | | |
| Net investment income (loss) | | | | | | | | | | $ | | (4,568,551) | | $ (14,049,765) |
| Net realized gain (loss) | | | | | | | | | | 254,398,033 | | | | 83,220,477 |
| Change in net unrealized appreciation (depreciation) | | | | | | | | | | 224,891,343 | | | | (567,467,767) |
| Net increase (decrease) in net assets resulting from operations | | | | | | | | | | 474,720,825 | | | | (498,297,055) |
| Share transactions | | | | | | | | | | | | | | | | | | | | |
| Proceeds from sales of shares | | | | | | | | | | 798,575,652 | | | | 590,476,590 |
| Cost of shares redeemed | | | | | | | | | | (1,230,676,689) | | | | (1,405,794,768) |
| Net increase (decrease) in net assets resulting from share transactions | | | | | | | | (432,101,037) | | | | (815,318,178) |
| Redemption fees | | | | | | | | | | | | 626,614 | | | | | | 865,842 |
| Total increase (decrease) in net assets | | | | | | | | | | | | 43,246,402 | | | | (1,312,749,391) |
| |
| Net Assets | | | | | | | | | | | | | | | | | | | | |
| Beginning of period | | | | | | | | | | 2,797,323,611 | | | | 4,110,073,002 |
| End of period (including accumulated net investment loss of $38,218 and accumulated net investment loss of | | | | | | | | | | | | |
| $30,793, respectively) | | | | | | | | | | $ 2,840,570,013 | | $ 2,797,323,611 |
| |
| Other Information | | | | | | | | | | | | | | | | | | | | |
| Shares | | | | | | | | | | | | | | | | | | | | |
| Sold | | | | | | | | | | | | 18,890,263 | | | | 15,643,549 |
| Redeemed | | | | | | | | | | | | (29,782,062) | | | | (37,909,258) |
| Net increase (decrease) | | | | | | | | | | | | (10,891,799) | | | | (22,265,709) |
| |
| Financial Highlights | | | | | | | | | | | | | | | | | | | | |
| Years ended February 28, | | | | 2006 | | | | 2005 | | 2004E | | | | 2003 | | | | | | 2002 |
| Selected Per-Share Data | | | | | | | | | | | | | | | | | | | | |
| Net asset value, beginning of period | | $ | | 38.93 | | $ | | 43.67 | | $ 24.90 | | $ | | 44.26 | | | | $ | | 48.25 |
| Income from Investment Operations | | | | | | | | | | | | | | | | | | | | |
| Net investment income (loss)C | | | | (.07) | | | | (.17) | | (.25) | | | | (.26) | | | | | | (.29) |
| Net realized and unrealized gain (loss) | | | | 7.73 | | | | (4.58) | | 19.01 | | | | (19.12) | | | | | | (3.73) |
| Total from investment operations | | | | 7.66 | | | | (4.75) | | 18.76 | | | | (19.38) | | | | | | (4.02) |
| Redemption fees added to paid in capitalC | | | | 01 | | | | .01 | | .01 | | | | .02 | | | | | | .03 |
| Net asset value, end of period | | $ | | 46.60 | | $ | | 38.93 | | $ 43.67 | | $ | | 24.90 | | | | $ | | 44.26 |
| Total ReturnA,B | | | | 19.70% | | | | (10.85)% | | 75.38% | | | | (43.74)% | | | | | | (8.27)% |
| Ratios to Average Net AssetsD | | | | | | | | | | | | | | | | | | | | |
| Expenses before reductions | | | | 95% | | | | .96% | | 1.08% | | | | 1.14% | | | | | | .99% |
| Expenses net of fee waivers, if any | | | | 95% | | | | .96% | | 1.08% | | | | 1.14% | | | | | | .99% |
| Expenses net of all reductions | | | | 88% | | | | .89% | | 1.06% | | | | 1.06% | | | | | | .97% |
| Net investment income (loss) | | | | (.17)% | | | | (.45)% | | (.70)% | | | | (.78)% | | | | | | (.59)% |
| Supplemental Data | | | | | | | | | | | | | | | | | | | | |
| Net assets, end of period (000 omitted) | | $ 2,840,570 | | $ 2,797,324 | | $4,110,073 | | $ 2,204,036 | | | | $ 4,539,791 |
| Portfolio turnover rate | | | | 80% | | | | 119% | | 50% | | | | 70% | | | | | | 57% |
| |
| | | | | |
A Total returns would have been lower had certain expenses not been reduced during the periods shown.B Total returns do not include the effect of the former sales charges. C Calculated based on average shares outstanding during the period. DExpense ratios reflect operating expenses of the fund. Expenses before reductions do not reflect amounts reimbursed by the investment adviser or reductions from brokerage service arrangements or other expense offset arrangements and do not represent the amount paid by the fund during periods when reimbursements or reductions occur. Expenses net of fee waivers reflect expenses after reimbursement by the investment adviser but prior to reductions from brokerage service arrangements or other expense offset arrangements. Expenses net of all reductions represent the net expenses paid by the fund. EFor the year ended February 29.See accompanying notes which are an integral part of the financial statements.
Annual Report 46
Networking and Infrastructure Portfolio
Performance
Average annual total return reflects the change in the value of an investment, assuming reinvestment of the fund’s dividend income and capital gains (the profits earned upon the sale of securities that have grown in value) and assuming a constant rate of performance each year. The $10,000 table and the fund’s returns do not reflect the deduction of taxes that a shareholder would pay on fund distributions or the redemption of fund shares. During periods of reimbursement by Fidelity, a fund’s total returns will be greater than it would be had the reimbursement not occurred. How a fund did yesterday is no guarantee of how it will do tomorrow.
| Average Annual Total Returns | | | | | | |
| Periods ended February 28, 2006 | | Past 1 | | Past 5 | | Life of |
| | | year | | years | | fundA |
| Select Networking and Infrastructure | | 20.56% | | --9.02% | | --22.04% |
A From September 21, 2000
$10,000 Over Life of Fund
Let’s say hypothetically that $10,000 was invested in Fidelity Select Networking and Infrastructure Portfolio on September 21, 2000, when the fund started. The chart shows how the value of your investment would have changed, and also shows how the S&P 500 Index performed over the same period.
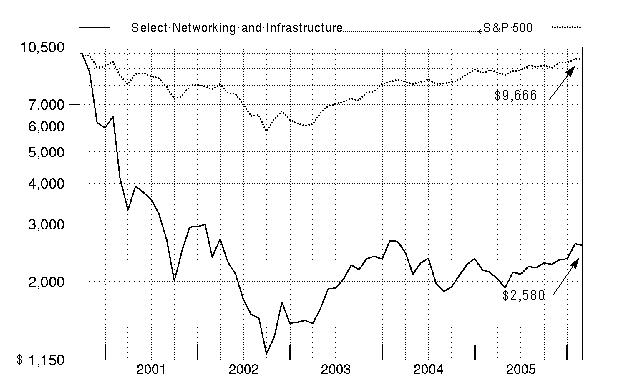
Networking and Infrastructure Portfolio
|
Management’s Discussion of Fund Performance
Comments from Charlie Chai, Portfolio Manager of Fidelity® Select Networking and Infrastructure Portfolio
With the exception of several popular large-cap stock performance measures, most major U.S. equity benchmarks had double-digit returns for the year ending February 28, 2006. For much of the period, market gains were driven largely by the energy sector, although utilities ultimately sneaked into the top spot for the year overall. Financials and telecommunication services also reached double figures, outperforming the 8.40% return of the broader market as measured by the large-cap-oriented Standard & Poor’s 500SM Index. The consumer discretionary segment — home to the weak performing automobile and media industries — was the biggest disappointment. Although the overall return for the S&P 500® beat the small-cap Russell 2000® Index in calendar year 2005 — the first time that’s happened in six years — small-caps stormed back in early 2006, leading to a 16.59% advance during the past 12 months, nearly twice the broader market’s gain. Mid-caps soared even higher, returning 17.67% according to the Russell Midcap® Index. The technology-heavy NASDAQ Composite® Index also fared well, climbing 12.13%, but the Dow Jones Industrial AverageSM, an index of 30 large-cap, blue-chip stocks, managed to rise only 4.52% .
During the past year, the fund returned 20.56%, almost doubling the 11.34% gain of the Goldman Sachs® Technology Index and faring even better versus the S&P 500. Favorable stock picking in semiconductors and in Internet software and services provided the most significant boosts to performance versus the sector benchmark. In the latter category, Internet paid-search provider Google added significant value, as the company enjoyed rapid growth in revenues and earnings during the period. A sizable overweighting in the strong performing communications equipment group also helped, although the benefits there were offset by unfavorable stock picking. Within that group, CIENA and Corning were aided by the recent push by telecom services companies to expand their fiber-optic networks. Not owning major index components Dell and IBM also aided performance, as they performed poorly. Conversely, stock selection in systems software and in wireless telecom services hurt results. The fund’s largest individual detractor was Avaya, which makes VoIP (Voice over Internet Protocol) infrastructure equipment. The stock fell sharply in the first half of the period because of the company’s difficulties in executing a sales reorganization. I sold the position by period end. Also holding back performance was Canada-based wireline equipment maker Nortel Networks.
The views expressed above reflect those of the portfolio manager(s) only through the end of the period as stated on the cover of this report and do not necessarily represent the views of Fidelity or any other person in the Fidelity organization. Any such views are subject to change at any time based upon market or other conditions and Fidelity disclaims any responsibility to update such views. These views may not be relied on as investment advice and, because investment decisions for a Fidelity fund are based on numerous factors, may not be relied on as an indication of trading intent on behalf of any Fidelity fund.
| Networking and Infrastructure Portfolio |
| Investment Changes | | |
| |
| |
| Top Ten Stocks as of February 28, 2006 |
| | | % of fund’s | | % of fund’s net assets |
| | | net assets | | 6 months ago |
| Google, Inc. Class A (sub. vtg.) | | 9.5 | | 5.4 |
| EMC Corp. | | 5.7 | | 6.6 |
| Corning, Inc. | | 5.5 | | 6.3 |
| Nortel Networks Corp. | | 5.1 | | 0.5 |
| Sun Microsystems, Inc. | | 4.8 | | 0.0 |
| Broadcom Corp. Class A | | 4.6 | | 0.0 |
| Network Appliance, Inc. | | 4.3 | | 4.1 |
| Agilent Technologies, Inc. | | 4.0 | | 3.4 |
| Marvell Technology Group Ltd. | | 4.0 | | 2.4 |
| Lucent Technologies, Inc. | | 3.9 | | 0.0 |
| | | 51.4 | | |
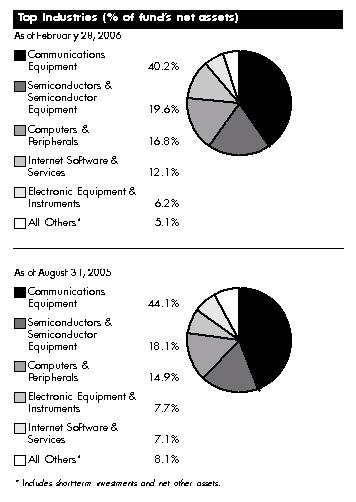
49 Annual Report
| Networking and Infrastructure Portfolio | | | | | | |
| Investments February 28, 2006 | | | | |
| Showing Percentage of Net Assets | | | | | | |
| |
| Common Stocks — 100.3% | | | | | | |
| | | | | Shares | | Value (Note 1) |
| |
| COMMUNICATIONS EQUIPMENT – 40.2% | | | | | | |
| Communications Equipment – 40.2% | | | | | | |
| 3Com Corp. (a) | | | | 122,100 | | $ 567,765 |
| ADC Telecommunications, Inc. (a) | | | | 35,128 | | 889,441 |
| Adtran, Inc. | | | | 50,000 | | 1,376,000 |
| ADVA AG Optical Networking (a) | | | | 30,000 | | 299,694 |
| Alcatel SA sponsored ADR (a) | | | | 177,300 | | 2,393,550 |
| Andrew Corp. (a) | | | | 17,300 | | 234,588 |
| AudioCodes Ltd. (a) | | | | 122,300 | | 1,404,004 |
| Avanex Corp. (a) | | | | 596,900 | | 847,598 |
| Bookham, Inc. (a)(d) | | | | 226,300 | | 1,579,574 |
| Ceragon Networks Ltd. (a) | | | | 228,000 | | 1,110,360 |
| CIENA Corp. (a) | | | | 645,428 | | 2,594,621 |
| Cisco Systems, Inc. (a) | | | | 65,100 | | 1,317,624 |
| CommScope, Inc. (a) | | | | 16,400 | | 393,436 |
| Comtech Group, Inc. (a) | | | | 32,300 | | 320,416 |
| Comverse Technology, Inc. (a) | | | | 34,800 | | 1,000,848 |
| Corning, Inc. (a) | | | | 283,400 | | 6,917,794 |
| ECI Telecom Ltd. (a) | | | | 97,000 | | 845,840 |
| Extreme Networks, Inc. (a) | | | | 126,800 | | 587,084 |
| F5 Networks, Inc. (a) | | | | 56,200 | | 3,811,484 |
| Foundry Networks, Inc. (a) | | | | 23,900 | | 335,556 |
| Foxconn International Holdings Ltd. | | | | 40,000 | | 69,349 |
| Ixia (a) | | | | 16,400 | | 197,784 |
| JDS Uniphase Corp. (a) | | | | 766,400 | | 2,329,856 |
| Juniper Networks, Inc. (a) | | | | 192,909 | | 3,547,597 |
| Lucent Technologies, Inc. (a) | | | | 1,731,500 | | 4,848,200 |
| NMS Communications Corp. (a) | | | | 79,900 | | 284,444 |
| Nortel Networks Corp. (a) | | | | 2,219,600 | | 6,348,056 |
| Oplink Communications, Inc. (a) | | | | 6,500 | | 106,275 |
| Optical Communication Products, Inc. (a) | | | | 36,100 | | 102,163 |
| QUALCOMM, Inc. | | | | 6,900 | | 325,749 |
| RADWARE Ltd. (a) | | | | 11,000 | | 219,230 |
| Research In Motion Ltd. (a) | | | | 9,000 | | 637,046 |
| Riverstone Networks, Inc. (a) | | | | 94,100 | | 49,873 |
| Sonus Networks, Inc. (a) | | | | 179,000 | | 868,150 |
| Symmetricom, Inc. (a) | | | | 65,500 | | 587,535 |
| Tekelec (a) | | | | 56,200 | | 753,642 |
| Terayon Communication Systems, Inc. (a) | | | | 55,900 | | 149,812 |
| Tut Systems, Inc. (a) | | | | 66,700 | | 200,100 |
| | | | | | | 50,452,138 |
| |
| COMPUTERS & PERIPHERALS – 16.8% | | | | | | |
| Computer Hardware – 5.9% | | | | | | |
| Concurrent Computer Corp. (a) | | | | 541,300 | | 1,418,206 |
| Sun Microsystems, Inc. (a) | | | | 1,435,100 | | 5,984,367 |
| | | | | | | 7,402,573 |
| Computer Storage & Peripherals – 10.9% | | | | | | |
| ASUSTeK Computer, Inc. | | | | 4,356 | | 12,264 |
| EMC Corp. (a) | | | | 503,800 | | 7,063,276 |
| McDATA Corp. Class A (a) | | | | 121,900 | | 538,798 |
| Network Appliance, Inc. (a) | | | | 162,900 | | 5,401,764 |
| QLogic Corp. (a) | | | | 12,500 | | 514,250 |
See accompanying notes which are an integral part of the financial statements.
Annual Report 50
| | | Shares | | Value (Note 1) |
| Quantum Corp. (a) | | 20,000 | | $ 71,400 |
| Read-Rite Corp. (a) | | 44,000 | | 4 |
| | | | | 13,601,756 |
| |
| TOTAL COMPUTERS & PERIPHERALS | | | | 21,004,329 |
| |
| ELECTRONIC EQUIPMENT & INSTRUMENTS – 6.2% | | | | |
| Electronic Equipment & Instruments – 5.4% | | | | |
| Aeroflex, Inc. (a) | | 23,100 | | 300,300 |
| Agilent Technologies, Inc. (a) | | 140,700 | | 5,065,200 |
| Applied Films Corp. (a) | | 25,200 | | 484,092 |
| Chi Mei Optoelectronics Corp. | | 81,000 | | 123,064 |
| HannStar Display Corp. | | 341,000 | | 63,171 |
| Orbotech Ltd. (a) | | 20,000 | | 476,600 |
| Photon Dynamics, Inc. (a) | | 13,900 | | 294,541 |
| | | | | 6,806,968 |
| Electronic Manufacturing Services – 0.8% | | | | |
| Benchmark Electronics, Inc. (a) | | 15,200 | | 535,344 |
| M-Flex Electronix, Inc. (a) | | 100 | | 5,694 |
| Xyratex Ltd. (a) | | 18,900 | | 478,170 |
| | | | | 1,019,208 |
| |
| TOTAL ELECTRONIC EQUIPMENT & INSTRUMENTS | | | | 7,826,176 |
| |
| HOUSEHOLD DURABLES – 0.5% | | | | |
| Consumer Electronics – 0.5% | | | | |
| Directed Electronics, Inc. | | 30,600 | | 432,990 |
| Thomson SA | | 12,500 | | 214,876 |
| | | | | 647,866 |
| |
| INTERNET SOFTWARE & SERVICES – 12.1% | | | | |
| Internet Software & Services – 12.1% | | | | |
| Ariba, Inc. (a) | | 25,100 | | 256,020 |
| Baidu.com, Inc. sponsored ADR | | 800 | | 41,136 |
| Google, Inc. Class A (sub. vtg.) (a) | | 32,900 | | 11,930,196 |
| Openwave Systems, Inc. (a) | | 146,400 | | 2,906,040 |
| | | | | 15,133,392 |
| |
| IT SERVICES – 0.3% | | | | |
| IT Consulting & Other Services – 0.3% | | | | |
| Sapient Corp. (a) | | 46,700 | | 350,250 |
| SEMICONDUCTORS & SEMICONDUCTOR EQUIPMENT – 19.6% | | | | |
| Semiconductor Equipment – 1.0% | | | | |
| LTX Corp. (a) | | 19,300 | | 109,238 |
| MEMC Electronic Materials, Inc. (a) | | 35,200 | | 1,178,848 |
| | | | | 1,288,086 |
| Semiconductors – 18.6% | | | | |
| Advanced Analogic Technologies, Inc. | | 19,900 | | 237,606 |
| Altera Corp. (a) | | 33,500 | | 671,340 |
| AMIS Holdings, Inc. (a) | | 23,000 | | 198,260 |
| Applied Micro Circuits Corp. (a) | | 184,200 | | 664,962 |
| ARM Holdings PLC sponsored ADR | | 77,900 | | 560,880 |
| Atheros Communications, Inc. (a) | | 32,100 | | 660,618 |
51
See accompanying notes which are an integral part of the financial statements.
51 Annual Report
| Networking and Infrastructure Portfolio | | | | | | |
| Investments - continued | | | | | | |
| |
| |
| Common Stocks – continued | | | | | | |
| | | | | Shares | | Value (Note 1) |
| |
| SEMICONDUCTORS & SEMICONDUCTOR EQUIPMENT – CONTINUED | | | | |
| Semiconductors – continued | | | | | | |
| ATI Technologies, Inc. (a) | | | | 13,600 | | $ 216,542 |
| Broadcom Corp. Class A (a) | | | | 127,750 | | 5,760,248 |
| Cree, Inc. (a) | | | | 2,700 | | 80,865 |
| Cypress Semiconductor Corp. (a) | | | | 13,300 | | 236,208 |
| Exar Corp. (a) | | | | 55,500 | | 690,975 |
| Ikanos Communications, Inc. | | | | 300 | | 6,600 |
| Marvell Technology Group Ltd. (a) | | | | 81,040 | | 4,961,269 |
| Maxim Integrated Products, Inc. | | | | 8,300 | | 324,447 |
| Microtune, Inc. (a) | | | | 68,800 | | 371,520 |
| Mindspeed Technologies, Inc. (a)(d) | | | | 418,333 | | 1,556,199 |
| National Semiconductor Corp. | | | | 94,700 | | 2,656,335 |
| Netlogic Microsystems, Inc. (a) | | | | 18,700 | | 661,045 |
| O2Micro International Ltd. sponsored ADR (a) | | | | 63,400 | | 798,840 |
| Pericom Semiconductor Corp. (a) | | | | 4,100 | | 36,941 |
| Pixelworks, Inc. (a) | | | | 6,400 | | 28,864 |
| PMC-Sierra, Inc. (a) | | | | 400 | | 4,084 |
| PowerDsine Ltd. (a) | | | | 40,500 | | 324,405 |
| Xilinx, Inc. (d) | | | | 48,600 | | 1,325,808 |
| Zoran Corp. (a) | | | | 10,600 | | 209,668 |
| | | | | | | 23,244,529 |
| |
| TOTAL SEMICONDUCTORS & SEMICONDUCTOR EQUIPMENT | | | | | | 24,532,615 |
| |
| SOFTWARE – 4.2% | | | | | | |
| Application Software – 1.1% | | | | | | |
| Cognos, Inc. (a) | | | | 2,400 | | 92,248 |
| Ulticom, Inc. (a) | | | | 119,000 | | 1,330,420 |
| | | | | | | 1,422,668 |
| Home Entertainment Software – 0.1% | | | | | | |
| Ubisoft Entertainment SA (a) | | | | 2,300 | | 89,521 |
| Systems Software – 3.0% | | | | | | |
| McAfee, Inc. (a) | | | | 34,200 | | 795,492 |
| Symantec Corp. (a) | | | | 154,000 | | 2,601,060 |
| Wind River Systems, Inc. (a) | | | | 22,000 | | 340,340 |
| | | | | | | 3,736,892 |
| |
| TOTAL SOFTWARE | | | | | | 5,249,081 |
| |
| |
| | | | | Shares | | Value (Note 1) |
| |
| WIRELESS TELECOMMUNICATION SERVICES – 0.4% | | | | | | |
| Wireless Telecommunication Services – 0.4% | | | | | | |
| InPhonic, Inc. (a) | | | | 200 $ | | 1,124 |
| Syniverse Holdings, Inc. | | | | 30,500 | | 436,150 |
| WiderThan Co. Ltd. ADR | | | | 5,500 | | 79,750 |
| | | | | | | 517,024 |
| |
| TOTAL COMMON STOCKS | | | | | | |
| (Cost $116,756,395) | | | | | | 125,712,871 |
See accompanying notes which are an integral part of the financial statements.
Annual Report 52
| Money Market Funds — 4.2% | | | | |
| Fidelity Cash Central Fund, 4.57% (b) | | 422,466 | | 422,466 |
| Fidelity Securities Lending Cash Central Fund, 4.58% (b)(c) | | 4,883,925 | | 4,883,925 |
| TOTAL MONEY MARKET FUNDS | | | | |
| (Cost $5,306,391) | | | | 5,306,391 |
| TOTAL INVESTMENT PORTFOLIO - 104.5% | | | | |
| (Cost $122,062,786) | | | | 131,019,262 |
| |
| NET OTHER ASSETS – (4.5)% | | | | (5,652,313) |
| NET ASSETS – 100% | | $ | | 125,366,949 |
(a) Non-income producing
(b) Affiliated fund that is available only to investment companies and other accounts managed by Fidelity Investments. The rate quoted is the annualized seven-day yield of the fund at period end. A complete unaudited listing of the fund’s holdings as of its most recent quarter end is available upon request.
(c) Investment made with cash collateral received from securities on loan. (d) Security or a portion of the security is on loan at period end.
Information regarding fiscal year to date income earned by the fund from the affiliated Central funds is as follows:
| Fund | | Income earned |
| Fidelity Cash Central Fund | | $ 50,787 |
| Fidelity Securities Lending Cash Central Fund | | 38,848 |
| Total | | $ 89,635 |
See accompanying notes which are an integral part of the financial statements.
|
53 Annual Report
53
| Networking and Infrastructure Portfolio | | |
| Investments - continued | | |
| |
| |
| Other Information | | |
| Distribution of investments by country of issue, as a percentage of total net assets, is as follows: | | |
| |
| United States of America | | 82.3% |
| Canada | | 5.9% |
| Bermuda | | 4.4% |
| Israel | | 3.6% |
| France | | 2.2% |
| Others (individually less than 1%) | | 1.6% |
| | | 100.0% |
At February 28, 2006, the fund had a capital loss carryforward of approximately $196,502,774 of which $109,595,892, $83,559,188 and $3,347,694 will expire on February 28, 2010, 2011 and 2013, respectively.
See accompanying notes which are an integral part of the financial statements.
Annual Report 54
| Networking and Infrastructure Portfolio | | | | | | | | |
| |
| Financial Statements | | | | | | | | |
| |
| |
| Statement of Assets and Liabilities | | | | | | | | |
| | | | | | | | | February 28, 2006 |
| |
| Assets | | | | | | | | |
| Investment in securities, at value (including securities loaned of $4,455,520) — See accompanying schedule: | | | | | | | | |
| Unaffiliated issuers (cost $116,756,395) | | $ | | 125,712,871 | | | | |
| Affiliated Central Funds (cost $5,306,391) | | | | 5,306,391 | | | | |
| Total Investments (cost $122,062,786) | | | | | | $ | | 131,019,262 |
| Foreign currency held at value (cost $11) | | | | | | | | 11 |
| Receivable for investments sold | | | | | | | | 7,257,370 |
| Receivable for fund shares sold | | | | | | | | 2,414,096 |
| Dividends receivable | | | | | | | | 4,596 |
| Interest receivable | | | | | | | | 7,134 |
| Prepaid expenses | | | | | | | | 420 |
| Other affiliated receivables | | | | | | | | 967 |
| Other receivables | | | | | | | | 19,298 |
| Total assets | | | | | | | | 140,723,154 |
| |
| Liabilities | | | | | | | | |
| Payable for investments purchased | | $ | | 6,460,332 | | | | |
| Payable for fund shares redeemed | | | | 3,874,538 | | | | |
| Accrued management fee | | | | 60,130 | | | | |
| Other affiliated payables | | | | 44,445 | | | | |
| Other payables and accrued expenses | | | | 32,835 | | | | |
| Collateral on securities loaned, at value | | | | 4,883,925 | | | | |
| Total liabilities | | | | | | | | 15,356,205 |
| |
| Net Assets | | | | | | $ | | 125,366,949 |
| Net Assets consist of: | | | | | | | | |
| Paid in capital | | | | | | $ | | 313,031,037 |
| Accumulated undistributed net realized gain (loss) on investments and foreign currency transactions | | | | | | | | (196,620,564) |
| Net unrealized appreciation (depreciation) on investments | | | | | | | | 8,956,476 |
| Net Assets, for 48,558,220 shares outstanding | | | | | | $ | | 125,366,949 |
| Net Asset Value, offering price and redemption price per share ($125,366,949 ÷ 48,558,220 shares) | | | | | | $ | | 2.58 |
| |
| Statement of Operations | | | | | | | | |
| | | | | | | | | Year ended February 28, 2006 |
| |
| Investment Income | | | | | | | | |
| Dividends | | | | | | $ | | 105,270 |
| Interest | | | | | | | | 220 |
| Income from affiliated Central Funds (including $38,848 from security lending) | | | | | | | | 89,635 |
| | | | | | | | | 195,125 |
| Less foreign taxes withheld | | | | | | | | (12,205) |
| Total income | | | | | | | | 182,920 |
| |
| Expenses | | | | | | | | |
| Management fee | | $ | | 579,903 | | | | |
| Transfer agent fees | | | | 438,401 | | | | |
| Accounting and security lending fees | | | | | | | | |
| | | | | 51,349 | | | | |
| Independent trustees’ compensation | | | | 437 | | | | |
| Custodian fees and expenses | | | | 21,089 | | | | |
| Registration fees | | | | 29,552 | | | | |
| Audit | | | | 34,545 | | | | |
| Legal | | | | 1,035 | | | | |
| Miscellaneous | | | | 1,226 | | | | |
| Total expenses before reductions | | | | 1,157,537 | | | | |
| Expense reductions | | | | (122,754) | | | | 1,034,783 |
| |
| Net investment income (loss) | | | | | | | | (851,863) |
| See accompanying notes which are an integral part of the financial statements. | | | | | | | | |
55 Annual Report
| Networking and Infrastructure Portfolio | | | | |
| Financial Statements - continued | | | | |
| |
| |
| Realized and Unrealized Gain (Loss) | | | | |
| Net realized gain (loss) on: | | | | |
| Investment securities: | | | | |
| Unaffiliated issuers | | 8,423,088 | | |
| Foreign currency transactions | | 5,767 | | |
| Total net realized gain (loss) | | | | 8,428,855 |
| Change in net unrealized appreciation (depreciation) on: | | | | |
| Investment securities | | 10,427,680 | | |
| Assets and liabilities in foreign currencies | | (9,316) | | |
| Total change in net unrealized appreciation (depreciation) | | | | 10,418,364 |
| Net gain (loss) | | | | 18,847,219 |
| Net increase (decrease) in net assets resulting from operations | | $ | | 17,995,356 |
See accompanying notes which are an integral part of the financial statements.
Annual Report 56
| Statement of Changes in Net Assets | | | | | | | | | | | | | | | | | | | | | | |
| | | | | | | | | | | | | | | Year ended | | | | Year ended |
| | | | | | | | | | | | | | | February 28, | | | | February 28, |
| | | | | | | | | | | | | | | 2006 | | | | 2005 |
| Increase (Decrease) in Net Assets | | | | | | | | | | | | | | | | | | | | | | |
| Operations | | | | | | | | | | | | | | | | | | | | | | |
| Net investment income (loss) | | | | | | | | | | | | $ | | | | (851,863) | | $ | | (1,254,482) |
| Net realized gain (loss) | | | | | | | | | | | | | | | | 8,428,855 | | | | (1,911,635) |
| Change in net unrealized appreciation (depreciation) | | | | | | | | | | | | | | 10,418,364 | | | | (35,483,085) |
| Net increase (decrease) in net assets resulting from operations | | | | | | | | | | | | | | 17,995,356 | | | | (38,649,202) |
| Share transactions | | | | | | | | | | | | | | | | | | | | | | |
| Proceeds from sales of shares | | | | | | | | | | | | | | 99,416,849 | | | | 115,763,770 |
| Cost of shares redeemed | | | | | | | | | | | | | | (102,088,170) | | | | (178,809,269) |
| Net increase (decrease) in net assets resulting from share transactions | | | | | | | | | | | | | | (2,671,321) | | | | (63,045,499) |
| Redemption fees | | | | | | | | | | | | | | | | 82,946 | | | | | | 186,620 |
| Total increase (decrease) in net assets | | | | | | | | | | | | | | 15,406,981 | | | | (101,508,081) |
| |
| Net Assets | | | | | | | | | | | | | | | | | | | | | | |
| Beginning of period | | | | | | | | | | | | | | 109,959,968 | | | | 211,468,049 |
| End of period | | | | | | | | | | | | $ | | 125,366,949 | | $ | | 109,959,968 |
| |
| Other Information | | | | | | | | | | | | | | | | | | | | | | |
| Shares | | | | | | | | | | | | | | | | | | | | | | |
| Sold | | | | | | | | | | | | | | 42,500,481 | | | | 52,179,386 |
| Redeemed | | | | | | | | | | | | | | (45,315,892) | | | | (80,221,748) |
| Net increase (decrease) | | | | | | | | | | | | | | (2,815,411) | | | | (28,042,362) |
| |
| Financial Highlights | | | | | | | | | | | | | | | | | | | | | | |
| Years ended February 28, | | 2006 | | | | 2005 | | | | 2004E | | | | 2003 | | | | 2002 |
| Selected Per-Share Data | | | | | | | | | | | | | | | | | | | | | | |
| Net asset value, beginning of period | | $ | | 2.14 | | $ | | 2.66 | | $ | | 1.52 | | $ | | 2.38 | | | | $ | | 4.14 |
| Income from Investment Operations | | | | | | | | | | | | | | | | | | | | | | |
| Net investment income (loss)C | | | | (.02) | | | | (.02) | | | | (.02) | | | | (.03) | | | | | | (.03) |
| Net realized and unrealized gain (loss) | | | | 46 | | | | (.50) | | | | 1.16 | | | | (.84) | | | | | | (1.74) |
| Total from investment operations | | | | 44 | | | | (.52) | | | | 1.14 | | | | (.87) | | | | | | (1.77) |
| Redemption fees added to paid in capitalC | | | | —F | | | | —F | | | | —F | | | | .01 | | | | | | .01 |
| Net asset value, end of period | | $ | | 2.58 | | $ | | 2.14 | | $ | | 2.66 | | $ | | 1.52 | | | | $ | | 2.38 |
| Total ReturnA,B | | | | 20.56% | | | | (19.55)% | | | | 75.00% | | | | (36.13)% | | | | (42.51)% |
| Ratios to Average Net AssetsD | | | | | | | | | | | | | | | | | | | | | | |
| Expenses before reductions | | | | 1.14% | | | | 1.17% | | | | 1.43% | | | | 1.93% | | | | | | 1.58% |
| Expenses net of fee waivers, if any | | | | 1.14% | | | | 1.17% | | | | 1.43% | | | | 1.93% | | | | | | 1.58% |
| Expenses net of all reductions | | | | 1.02% | | | | 1.07% | | | | 1.39% | | | | 1.78% | | | | | | 1.52% |
| Net investment income (loss) | | | | (.84)% | | | | (.89)% | | | | (1.00)% | | | | (1.45)% | | | | | | (1.03)% |
| Supplemental Data | | | | | | | | | | | | | | | | | | | | | | |
| Net assets, end of period (000 omitted) | | $ 125,367 | | $ 109,960 | | $ 211,468 | | $ | | 77,981 | | | | $ 110,547 |
| Portfolio turnover rate | | | | 201% | | | | 160% | | | | 57% | | | | 120% | | | | | | 177% |
| |
| | | |
A Total returns would have been lower had certain expenses not been reduced during the periods shown. B Total returns do not include the effect of the former sales charges. C Calculated based on average shares outstanding during the period. DExpense ratios reflect operating expenses of the fund. Expenses before reductions do not reflect amounts reimbursed by the investment adviser or reductions from brokerage service arrangements or other expense offset arrangements and do not represent the amount paid by the fund during periods when reimbursements or reductions occur. Expenses net of fee waivers reflect expenses after reimbursement by the investment adviser but prior to reductions from brokerage service arrangements or other expense offset arrangements. Expenses net of all reductions represent the net expenses paid by the fund. EFor the year ended February 29. FAmount represents less than $.01 per share.See accompanying notes which are an integral part of the financial statements.
|
Software and Computer Services Portfolio
|
Average annual total return reflects the change in the value of an investment, assuming reinvestment of the fund’s dividend income and capital gains (the profits earned upon the sale of securities that have grown in value) and assuming a constant rate of performance each year. The $10,000 table and the fund’s returns do not reflect the deduction of taxes that a shareholder would pay on fund distributions or the redemption of fund shares. During periods of reimbursement by Fidelity, a fund’s total returns will be greater than it would be had the reimbursement not occurred. How a fund did yesterday is no guarantee of how it will do tomorrow.
| Average Annual Total Returns | | | | | | |
| Periods ended February 28, 2006 | | Past 1 | | Past 5 | | Past 10 |
| | | year | | years | | years |
| Select Software and Computer Services | | 13.32% | | 3.88% | | 12.62% |
$10,000 Over 10 Years
Let’s say hypothetically that $10,000 was invested in Fidelity Select Software and Computer Services Portfolio on February 29, 1996. The chart shows how the value of your investment would have changed, and also shows how the S&P 500 Index performed over the same period.
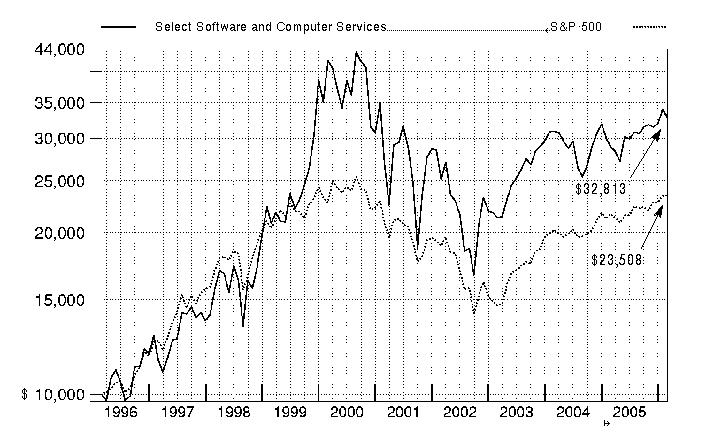
Software and Computer Services Portfolio
|
Management’s Discussion of Fund Performance
Comments from Kelly Cardwell, Portfolio Manager of Fidelity® Select Software and Computer Services Portfolio
With the exception of several popular large-cap stock performance measures, most major U.S. equity benchmarks had double-digit returns for the year ending February 28, 2006. For much of the period, market gains were driven largely by the energy sector, although utilities ultimately sneaked into the top spot for the year overall. Financials and telecommunication services also reached double figures, outperforming the 8.40% return of the broader market as measured by the large-cap-oriented Standard & Poor’s 500SM Index. The consumer discretionary segment — home to the weak performing automobile and media industries — was the biggest disappointment. Although the overall return for the S&P 500® beat the small-cap Russell 2000® Index in calendar year 2005 — the first time that’s happened in six years — small-caps stormed back in early 2006, leading to a 16.59% advance during the past 12 months, nearly twice the broader market’s gain. Mid-caps soared even higher, returning 17.67% according to the Russell Midcap® Index. The technology-heavy NASDAQ Composite® Index also fared well, climbing 12.13%, but the Dow Jones Industrial AverageSM, an index of 30 large-cap, blue-chip stocks, managed to rise only 4.52% .
For the 12-month period ending February 28, 2006, Fidelity Select Software and Computer Services Portfolio returned 13.32%, outpacing both the Goldman Sachs® Technology Index, which gained 11.34%, and the S&P 500. Good security selection, including large exposures to a handful of top-performing software and services stocks, aided the fund’s performance versus its sector benchmark. One of these strong performers was Google, the Internet search engine whose soaring stock price continued to reflect its earnings growth as it reshapes the world of advertising. Other key contributors included application server software producer BEA Systems and video game manufacturer Nintendo, both of which rebounded strongly after having been out of favor with investors. At period end, the fund continued to hold all three stocks. Security software maker Symantec was by far the fund’s largest detractor and led to weak results in the systems software space. The stock reflected poor execution after the company’s acquisition of VERITAS. However, because the company’s problems appeared temporary, the fund retained a position in Symantec. RadioShack and Kanbay International, an Indian information technology services firm, also turned in disappointing results.
The views expressed above reflect those of the portfolio manager(s) only through the end of the period as stated on the cover of this report and do not necessarily represent the views of Fidelity or any other person in the Fidelity organization. Any such views are subject to change at any time based upon market or other conditions and Fidelity disclaims any responsibility to update such views. These views may not be relied on as investment advice and, because investment decisions for a Fidelity fund are based on numerous factors, may not be relied on as an indication of trading intent on behalf of any Fidelity fund.
59 59 Annual Report
| Software and Computer Services Portfolio |
| Investment Changes | | |
| |
| |
| Top Ten Stocks as of February 28, 2006 |
| | | % of fund’s | | % of fund’s net assets |
| | | net assets | | 6 months ago |
| Symantec Corp. | | 14.7 | | 16.8 |
| Microsoft Corp. | | 12.5 | | 16.1 |
| Google, Inc. Class A (sub. vtg.) | | 10.1 | | 5.9 |
| BEA Systems, Inc. | | 8.4 | | 10.6 |
| Oracle Corp. | | 4.9 | | 4.4 |
| Nintendo Co. Ltd. | | 4.8 | | 3.3 |
| Affiliated Computer Services, Inc. | | | | |
| Class A | | 3.9 | | 2.2 |
| Yahoo!, Inc. | | 3.3 | | 0.0 |
| Sun Microsystems, Inc. | | 2.7 | | 0.3 |
| RadioShack Corp. | | 2.1 | | 2.0 |
| | | 67.4 | | |
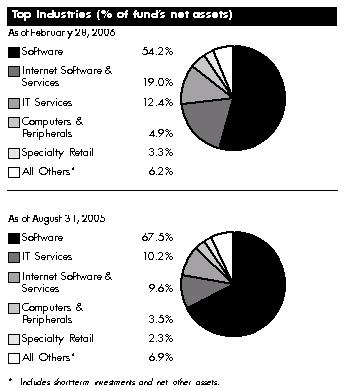
Annual Report 60
| Software and Computer Services Portfolio | | | | | | |
| Investments February 28, 2006 | | | | |
| Showing Percentage of Net Assets | | | | | | |
| |
| Common Stocks — 98.5% | | | | | | |
| | | | | Shares | | Value (Note 1) |
| |
| COMPUTERS & PERIPHERALS – 4.9% | | | | | | |
| Computer Hardware – 3.9% | | | | | | |
| Acer, Inc. | | | | 2,183,000 | | $ 4,804,813 |
| Cray, Inc. (a) | | | | 1,152,090 | | 2,258,096 |
| International Business Machines Corp. | | | | 1,000 | | 80,240 |
| Sun Microsystems, Inc. (a) | | | | 3,628,100 | | 15,129,177 |
| | | | | | | 22,272,326 |
| Computer Storage & Peripherals – 1.0% | | | | | | |
| ActivCard Corp. (a) | | | | 1,525,000 | | 5,581,500 |
| TOTAL COMPUTERS & PERIPHERALS | | | | | | 27,853,826 |
| |
| ELECTRONIC EQUIPMENT & INSTRUMENTS – 2.9% | | | | | | |
| Electronic Equipment & Instruments – 0.5% | | | | | | |
| National Instruments Corp. | | | | 83,900 | | 2,722,555 |
| Electronic Manufacturing Services – 1.8% | | | | | | |
| Xyratex Ltd. (a) | | | | 395,900 | | 10,016,270 |
| Technology Distributors – 0.6% | | | | | | |
| CDW Corp. | | | | 60,900 | | 3,462,774 |
| TOTAL ELECTRONIC EQUIPMENT & INSTRUMENTS | | | | | | 16,201,599 |
| |
| HEALTH CARE PROVIDERS & SERVICES – 1.1% | | | | | | |
| Health Care Services – 1.1% | | | | | | |
| IMS Health, Inc. | | | | 257,100 | | 6,196,110 |
| HOUSEHOLD DURABLES – 0.2% | | | | | | |
| Consumer Electronics – 0.2% | | | | | | |
| Ngai Lik Industrial Holdings Ltd. | | | | 7,430,000 | | 1,101,393 |
| INTERNET & CATALOG RETAIL – 0.5% | | | | | | |
| Internet Retail – 0.5% | | | | | | |
| Expedia, Inc. (a) | | | | 155,100 | | 2,942,247 |
| INTERNET SOFTWARE & SERVICES – 19.0% | | | | | | |
| Internet Software & Services – 19.0% | | | | | | |
| Art Technology Group, Inc. (a) | | | | 953,900 | | 2,794,927 |
| Google, Inc. Class A (sub. vtg.) (a) | | | | 157,000 | | 56,931,340 |
| Interwoven, Inc. (a) | | | | 436,200 | | 3,794,940 |
| MatrixOne, Inc. (a) | | | | 562,200 | | 3,412,554 |
| RealNetworks, Inc. (a) | | | | 41,400 | | 325,404 |
| S1 Corp. (a) | | | | 182,410 | | 751,529 |
| SonicWALL, Inc. (a) | | | | 1,206,050 | | 8,092,596 |
| Traffic.com, Inc. | | | | 153,600 | | 1,648,128 |
| VeriSign, Inc. (a) | | | | 205,500 | | 4,862,130 |
| Vitria Technology, Inc. (a)(e) | | | | 2,023,170 | | 5,523,254 |
| Yahoo!, Inc. (a) | | | | 585,700 | | 18,777,542 |
| | | | | | | 106,914,344 |
| |
| |
| | | | | Shares | | Value (Note 1) |
| |
| IT SERVICES – 12.4% | | | | | | |
| Data Processing & Outsourced Services – 7.4% | | | | | | |
| Affiliated Computer Services, Inc. Class A (a) | | | | 348,000 | | $ 21,896,160 |
61
See accompanying notes which are an integral part of the financial statements.
61 Annual Report
| Software and Computer Services Portfolio | | | | |
| Investments - continued | | | | |
| |
| |
| eFunds Corp. (a) | | 10,000 | | 270,800 |
| First Data Corp. | | 130,000 | | 5,866,900 |
| Sabre Holdings Corp. Class A | | 79,000 | | 1,906,270 |
| The BISYS Group, Inc. (a) | | 708,200 | | 9,992,702 |
| VeriFone Holdings, Inc. | | 75,000 | | 1,980,000 |
| | | | | 41,912,832 |
| IT Consulting & Other Services – 5.0% | | | | |
| Accenture Ltd. Class A | | 134,600 | | 4,396,036 |
| Ciber, Inc. (a) | | 189,000 | | 1,094,310 |
| HCL Technologies Ltd. | | 207,287 | | 2,855,668 |
| Infosys Technologies Ltd. | | 89,520 | | 5,719,878 |
| Infosys Technologies Ltd. sponsored ADR | | 73,300 | | 5,189,640 |
| Kanbay International, Inc. (a) | | 520,611 | | 8,839,975 |
| | | | | 28,095,507 |
| |
| TOTAL IT SERVICES | | | | 70,008,339 |
| |
| SOFTWARE – 54.2% | | | | |
| Application Software – 15.0% | | | | |
| Agile Software Corp. (a) | | 238,500 | | 1,655,190 |
| Altiris, Inc. (a) | | 8,900 | | 176,309 |
| Ansys, Inc. (a) | | 90,000 | | 4,267,800 |
| BEA Systems, Inc. (a) | | 4,147,200 | | 47,568,384 |
| Citrix Systems, Inc. (a) | | 90,100 | | 2,915,636 |
| FileNET Corp. (a) | | 442,086 | | 11,379,294 |
| Hyperion Solutions Corp. (a) | | 50,000 | | 1,677,500 |
| Informatica Corp. (a) | | 214,600 | | 3,437,892 |
| NAVTEQ Corp. (a) | | 93,300 | | 4,320,723 |
| Ninetowns Digital World Trade Ltd. sponsored ADR (a)(d) | | 380,300 | | 2,068,832 |
| SAP AG sponsored ADR | | 4,200 | | 214,620 |
| SPSS, Inc. (a) | | 1,400 | | 45,696 |
| TIBCO Software, Inc. (a) | | 450,000 | | 3,901,500 |
| Verint Systems, Inc. (a) | | 19,010 | | 688,732 |
| | | | | 84,318,108 |
| Home Entertainment Software – 5.1% | | | | |
| Nintendo Co. Ltd. | | 185,300 | | 27,242,903 |
| Ubisoft Entertainment SA (a) | | 40,000 | | 1,556,883 |
| | | | | 28,799,786 |
| Systems Software – 34.1% | | | | |
| BMC Software, Inc. (a) | | 177,700 | | 3,886,299 |
| Microsoft Corp. | | 2,621,900 | | 70,529,110 |
| Moldflow Corp. (a) | | 1,500 | | 21,105 |
| Oracle Corp. (a) | | 2,259,700 | | 28,065,474 |
See accompanying notes which are an integral part of the financial statements.
Annual Report 62
| Common Stocks – continued | | | | |
| | | Shares | | Value (Note 1) |
| |
| SOFTWARE – CONTINUED | | | | |
| Systems Software – continued | | | | |
| Symantec Corp. (a) | | 4,903,871 | | $ 82,826,381 |
| WatchGuard Technologies, Inc. (a)(e) | | 1,779,312 | | 7,224,007 |
| | | | | 192,552,376 |
| |
| TOTAL SOFTWARE | | | | 305,670,270 |
| |
| SPECIALTY RETAIL – 3.3% | | | | |
| Computer & Electronics Retail – 3.3% | | | | |
| Circuit City Stores, Inc. | | 222,000 | | 5,334,660 |
| RadioShack Corp. | | 606,100 | | 11,849,255 |
| Tweeter Home Entertainment Group, Inc. (a)(d) | | 143,700 | | 1,155,348 |
| | | | | 18,339,263 |
| |
| TOTAL COMMON STOCKS | | | | |
| (Cost $580,627,701) | | | | 555,227,391 |
| |
| Money Market Funds — 1.5% | | | | |
| |
| Fidelity Cash Central Fund, 4.57% (b) | | 7,479,281 | | 7,479,281 |
| Fidelity Securities Lending Cash Central Fund, 4.58% (b)(c) | | 852,455 | | 852,455 |
| TOTAL MONEY MARKET FUNDS | | | | |
| (Cost $8,331,736) | | | | 8,331,736 |
| |
| TOTAL INVESTMENT PORTFOLIO - 100.0% | | | | |
| (Cost $588,959,437) | | | | 563,559,127 |
| |
| NET OTHER ASSETS – 0.0% | | | | 239,544 |
| NET ASSETS – 100% | | | | $563,798,671 |
(a) Non-income producing
(b) Affiliated fund that is available only to investment companies and other accounts managed by Fidelity Investments. The rate quoted is the annualized seven-day yield of the fund at period end. A complete unaudited listing of the fund’s holdings as of its most recent quarter end is available upon request.
(c) Investment made with cash collateral received from securities on loan. (d) Security or a portion of the security is on loan at period end.
(e) Affiliated company
Information regarding fiscal year to date income earned by the fund from the affiliated Central funds is as follows:
| Fund | | Income earned |
| Fidelity Cash Central Fund | | $ 539,117 |
| Fidelity Securities Lending Cash Central Fund | | 24,973 |
| Total | | $ 564,090 |
An affiliated company is a company in which the fund has ownership of at least 5% of the voting securities. Fiscal year to date transactions with companies which are or were affiliates are as follows:
See accompanying notes which are an integral part of the financial statements.
|
63 Annual Report
63
| Software and Computer Services Portfolio | | | | | | | | | | | | | | | | | | | | |
| Investments - continued | | | | | | | | | | | | | | | | | | | | |
| |
| |
| | | Value, beginning | | | | | | | | Sales | | | | Dividend | | | | | | Value, end |
| Affiliates | | of period | | | | Purchases | | | | Proceeds | | | | Income | | | | | | of period |
| Vitria Technology, Inc. | | $ 7,360,058 | | $ | | 380,963 | | $ | | 855,749 | | $ | | | | — | | $ | | 5,523,254 |
| WatchGuard Technologies, Inc. | | 2,711,610 | | | | 4,925,261 | | | | 1,587,231 | | | | | | — | | | | 7,224,007 |
| Total | | $ 10,071,668 | | $ | | 5,306,224 | | $ | | 2,442,980 | | $ | | | | — | | $ | | 12,747,261 |
See accompanying notes which are an integral part of the financial statements.
|
| Other Information | | |
| Distribution of investments by country of issue, as a percentage of total net assets, is as follows: | | |
| |
| United States of America | | 88.4% |
| Japan | | 4.8% |
| Bermuda | | 2.8% |
| India | | 2.4% |
| Others (individually less than 1%) | | 1.6% |
| | | 100.0% |
At February 28, 2006, the fund had a capital loss carryforward of approximately $101,031,277 all of which will expire on February 28, 2011.
See accompanying notes which are an integral part of the financial statements.
|
65 Annual Report
65
| Software and Computer Services Portfolio | | | | | | | | |
| |
| Financial Statements | | | | | | | | |
| |
| |
| Statement of Assets and Liabilities | | | | | | | | |
| | | | | | | | | February 28, 2006 |
| |
| Assets | | | | | | | | |
| Investment in securities, at value (including securities loaned of $806,323) — See accompanying schedule: | | | | | | | | |
| Unaffiliated issuers (cost $566,368,728) | | $ | | 542,480,130 | | | | |
| Affiliated Central Funds (cost $8,331,736) | | | | 8,331,736 | | | | |
| Other affiliated issuers (cost $14,258,973) | | | | 12,747,261 | | | | |
| Total Investments (cost $588,959,437) | | | | | | $ | | 563,559,127 |
| Foreign currency held at value | | | | | | | | |
| (cost $9) | | | | | | | | 9 |
| Receivable for investments sold | | | | | | | | 5,111,950 |
| Receivable for fund shares sold | | | | | | | | 362,220 |
| Dividends receivable | | | | | | | | 243,884 |
| Interest receivable | | | | | | | | 22,037 |
| Prepaid expenses | | | | | | | | 2,552 |
| Other affiliated receivables | | | | | | | | 26 |
| Other receivables | | | | | | | | 47,459 |
| Total assets | | | | | | | | 569,349,264 |
| |
| Liabilities | | | | | | | | |
| Payable for investments purchased | | $ | | 2,487,489 | | | | |
| Payable for fund shares redeemed | | | | 1,678,112 | | | | |
| Accrued management fee | | | | 275,523 | | | | |
| Other affiliated payables | | | | 170,162 | | | | |
| Other payables and accrued expenses | | | | 86,852 | | | | |
| Collateral on securities loaned, at value | | | | 852,455 | | | | |
| Total liabilities | | | | | | | | 5,550,593 |
| |
| Net Assets | | | | | | $ | | 563,798,671 |
| Net Assets consist of: | | | | | | | | |
| Paid in capital | | | | | | $ | | 696,666,341 |
| Accumulated net investment loss | | | | | | | | (1,204) |
| Accumulated undistributed net realized gain (loss) on investments and foreign currency transactions | | | | | | | | (107,415,745) |
| Net unrealized appreciation (depreciation) on investments and assets and liabilities in foreign currencies | | | | | | | | (25,450,721) |
| Net Assets, for 10,452,747 shares outstanding | | | | | | $ | | 563,798,671 |
| Net Asset Value, offering price and redemption price per share ($563,798,671 ÷ 10,452,747 shares) | | | | | | $ | | 53.94 |
| |
| Statement of Operations | | | | | | | | |
| | | | | | | | | Year ended February 28, 2006 |
| |
| Investment Income | | | | | | | | |
| Dividends | | | | | | $ | | 2,065,133 |
| Interest | | | | | | | | 2,983 |
| Income from affiliated Central Funds (including $24,973 from security lending) | | | | | | | | 564,090 |
| Total income | | | | | | | | 2,632,206 |
| |
| Expenses | | | | | | | | |
| Management fee | | $ | | 3,582,821 | | | | |
| Transfer agent fees | | | | 1,985,497 | �� | | | |
| Accounting and security lending fees | | | | | | | | |
| | | | | 296,605 | | | | |
| Independent trustees’ compensation | | | | 2,721 | | | | |
| Custodian fees and expenses | | | | 46,497 | | | | |
| Registration fees | | | | 35,855 | | | | |
| Audit | | | | 42,710 | | | | |
| Legal | | | | 5,496 | | | | |
| Miscellaneous | | | | 8,753 | | | | |
| Total expenses before reductions | | | | 6,006,955 | | | | |
| Expense reductions | | | | (286,335) | | | | 5,720,620 |
See accompanying notes which are an integral part of the financial statements.
Annual Report 66
| Net investment income (loss) | | | | (3,088,414) |
| Realized and Unrealized Gain (Loss) | | | | |
| Net realized gain (loss) on: | | | | |
| Investment securities: | | | | |
| Unaffiliated issuers (net of foreign taxes of $1,494,002) | | 56,544,928 | | |
| Other affiliated issuers | | 507,497 | | |
| Foreign currency transactions | | (12,775) | | |
| Total net realized gain (loss) | | | | 57,039,650 |
| Change in net unrealized appreciation (depreciation) on: | | | | |
| Investment securities (net of decrease in deferred foreign taxes of $1,875,323) | | 21,856,070 | | |
| Assets and liabilities in foreign currencies | | 7,197 | | |
| Total change in net unrealized appreciation (depreciation) | | | | 21,863,267 |
| Net gain (loss) | | | | 78,902,917 |
| Net increase (decrease) in net assets resulting from operations | | | | $75,814,503 |
See accompanying notes which are an integral part of the financial statements.
|
67 Annual Report
| Software and Computers Services Portfolio | | | | | | | | | | | | | | | | | | | | |
| Financial Statements - continued | | | | | | | | | | | | | | | | | | | | |
| |
| |
| Statement of Changes in Net Assets | | | | | | | | | | | | | | | | | | | | |
| | | | | | | | | | | | | | | Year ended | | Year ended |
| | | | | | | | | | | | | | | February 28, | | February 28, |
| | | | | | | | | | | | | | | 2006 | | 2005 |
| Increase (Decrease) in Net Assets | | | | | | | | | | | | | | | | | | | | |
| Operations | | | | | | | | | | | | | | | | | | | | |
| Net investment income (loss) | | | | | | | | | | | | $ | | (3,088,414) | | $ 8,278,210 |
| Net realized gain (loss) | | | | | | | | | | | | | | 57,039,650 | | 95,409,101 |
| Change in net unrealized appreciation (depreciation) | | | | | | | | | | | | | | 21,863,267 | | (157,612,606) |
| Net increase (decrease) in net assets resulting from operations | | | | | | | | | | | | | | 75,814,503 | | (53,925,295) |
| Distributions to shareholders from net investment income | | | | | | | | | | | | | | | | — | | (8,110,612) |
| Share transactions | | | | | | | | | | | | | | | | | | | | |
| Proceeds from sales of shares | | | | | | | | | | | | | | 171,883,514 | | 155,011,085 |
| Reinvestment of distributions | | | | | | | | | | | | | | | | — | | 7,703,457 |
| Cost of shares redeemed | | | | | | | | | | | | | | (364,978,616) | | (266,698,522) |
| Net increase (decrease) in net assets resulting from share transactions | | | | | | | | | | | | (193,095,102) | | (103,983,980) |
| Redemption fees | | | | | | | | | | | | | | | | 90,805 | | | | 61,959 |
| Total increase (decrease) in net assets | | | | | | | | | | | | | | (117,189,794) | | (165,957,928) |
| |
| Net Assets | | | | | | | | | | | | | | | | | | | | |
| Beginning of period | | | | | | | | | | | | | | 680,988,465 | | 846,946,393 |
| End of period (including accumulated net investment loss of $1,204 and accumulated net investment loss of $1,724, | | | | | | | | |
| respectively) | | | | | | | | | | | | $ | | 563,798,671 | | $ 680,988,465 |
| |
| Other Information | | | | | | | | | | | | | | | | | | | | |
| Shares | | | | | | | | | | | | | | | | | | | | |
| Sold | | | | | | | | | | | | | | | | 3,386,990 | | 3,179,188 |
| Issued in reinvestment of distributions | | | | | | | | | | | | | | | | — | | | | 148,715 |
| Redeemed | | | | | | | | | | | | | | (7,240,815) | | (5,507,739) |
| Net increase (decrease) | | | | | | | | | | | | | | (3,853,825) | | (2,179,836) |
| |
| Financial Highlights | | | | | | | | | | | | | | | | | | | | |
| Years ended February 28, | | | | 2006 | | | | 2005 | | | | 2004G | | | | 2003 | | 2002 |
| Selected Per-Share Data | | | | | | | | | | | | | | | | | | | | |
| Net asset value, beginning of period | | $ | | 47.60 | | $ | | 51.37 | | $ | | 35.48 | | $ | | 41.84 | | $ | | 45.33 |
| Income from Investment Operations | | | | | | | | | | | | | | | | | | | | |
| Net investment income (loss)C | | | | (.25) | | | | .53D | | | | (.24)E | | | | (.24) | | | | (.26) |
| Net realized and unrealized gain (loss) | | | | 6.58 | | | | (3.79) | | | | 16.12 | | | | (6.13) | | | | (3.02) |
| Total from investment operations | | | | 6.33 | | | | (3.26) | | | | 15.88 | | | | (6.37) | | | | (3.28) |
| Distributions from net investment income | | | | — | | | | (.51) | | | | �� | | | | — | | | | — |
| Distributions from net realized gain | | | | — | | | | — | | | | — | | | | — | | | | (.24) |
| Total distributions | | | | — | | | | (.51) | | | | — | | | | — | | | | (.24) |
| Redemption fees added to paid in capitalC | | | | 01 | | | | —H | | | | .01 | | | | .01 | | | | .03 |
| Net asset value, end of period | | $ | | 53.94 | | $ | | 47.60 | | $ | | 51.37 | | $ | | 35.48 | | $ | | 41.84 |
| Total ReturnA,B | | | | 13.32% | | | | (6.43)% | | | | 44.79% | | | | (15.20)% | | | | (7.08)% |
| Ratios to Average Net AssetsF | | | | | | | | | | | | | | | | | | | | |
| Expenses before reductions | | | | 96% | | | | .98% | | | | 1.09% | | | | 1.18% | | | | 1.09% |
| Expenses net of fee waivers, if any | | | | 96% | | | | .98% | | | | 1.09% | | | | 1.18% | | | | 1.09% |
| Expenses net of all reductions | | | | 91% | | | | .92% | | | | 1.06% | | | | 1.05% | | | | 1.05% |
| Net investment income (loss) | | | | (.49)% | | | | 1.09%D | | | | (.53)% | | | | (.65)% | | | | (.57)% |
| Supplemental Data | | | | | | | | | | | | | | | | | | | | |
| Net assets, end of period (000 omitted) | | $ 563,799 | | $ 680,988 | | $ 846,946 | | $ 617,904 | | $ 782,519 |
| Portfolio turnover rate | | | | 59% | | | | 94% | | | | 81% | | | | 198% | | | | 325% |
| |
| | | | | |
| | | |
A Total returns would have been lower had certain expenses not been reduced during the periods shown. B Total returns do not include the effect of the former sales charges. C Calculated based on average shares outstanding during the period. D Investment income per share reflects a special dividend which amounted to $.76 per share. Excluding the special dividend, the ratio of net investment income (loss) to average net assets would have been (.48)%. E Investment income per share reflects a special dividend which amounted to $.03 per share. FExpense ratios reflect operating expenses of the fund. Expenses before reductions do not reflect amounts reimbursed by the investment adviser or reductions from brokerage service arrangements or other expense offset arrangements and do not represent the amount paid by the fund during periods when reimbursements or reductions occur. Expenses net of fee waivers reflect expenses after reimbursement by the investment adviser but prior to reductions from brokerage service arrangements or other expense offset arrangements. Expenses net of all reductions represent the net expenses paid by the fund. GFor the year ended February 29. HAmount represents less than $.01 per share.See accompanying notes which are an integral part of the financial statements.
Annual Report 68
Technology Portfolio
Performance
|
Average annual total return reflects the change in the value of an investment, assuming reinvestment of the fund’s dividend income and capital gains (the profits earned upon the sale of securities that have grown in value) and assuming a constant rate of performance each year. The $10,000 table and the fund’s returns do not reflect the deduction of taxes that a shareholder would pay on fund distributions or the redemption of fund shares. During periods of reimbursement by Fidelity, a fund’s total returns will be greater than it would be had the reimbursement not occurred. How a fund did yesterday is no guarantee of how it will do tomorrow.
| Average Annual Total Returns | | | | | | |
| Periods ended February 28, 2006 | | Past 1 | | Past 5 | | Past 10 |
| | | year | | years | | years |
| Select Technology | | 13.22% | | --1.06% | | 9.22% |
$10,000 Over 10 Years
Let’s say hypothetically that $10,000 was invested in Fidelity Select Technology Portfolio on February 29, 1996. The chart shows how the value of your investment would have changed, and also shows how the S&P 500 Index performed over the same period.
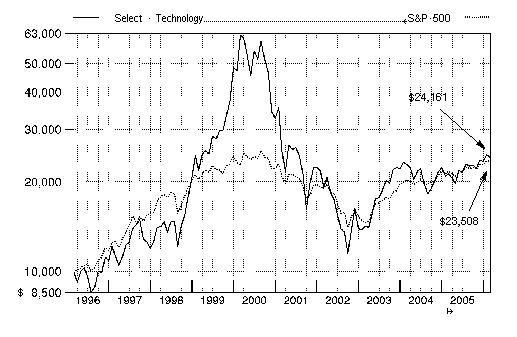
69 Annual Report
Management’s Discussion of Fund Performance
Comments from James Morrow, Portfolio Manager of Fidelity® Select Technology Portfolio
With the exception of several popular large-cap stock performance measures, most major U.S. equity benchmarks had double-digit returns for the year ending February 28, 2006. For much of the period, market gains were driven largely by the energy sector, although utilities ultimately sneaked into the top spot for the year overall. Financials and telecommunication services also reached double figures, outperforming the 8.40% return of the broader market as measured by the large-cap-oriented Standard & Poor’s 500SM Index. The consumer discretionary segment — home to the weak performing automobile and media industries — was the biggest disappointment. Although the overall return for the S&P 500® beat the small-cap Russell 2000® Index in calendar year 2005 — the first time that’s happened in six years — small-caps stormed back in early 2006, leading to a 16.59% advance during the past 12 months, nearly twice the broader market’s gain. Mid-caps soared even higher, returning 17.67% according to the Russell Midcap® Index. The technology-heavy NASDAQ Composite® Index also fared well, climbing 12.13%, but the Dow Jones Industrial AverageSM, an index of 30 large-cap, blue-chip stocks, managed to rise only 4.52% .
During the past year, the fund returned 13.22%, beating both the S&P 500 and the 11.34% gain of the Goldman Sachs® Technology Index. Strong stock picking in the electrical components/equipment segment provided a significant boost to performance versus the sector index, with stock selection in Internet software/services and electronic manufacturing services also helping. In the first category, our gains were due primarily to a trio of out-of-index positions with exposure to the solar power/fuel cell industry — Evergreen Solar, Germany-based SolarWorld and Motech Industries, headquartered in Taiwan. The cost/benefit picture for solar energy continued to improve relative to traditional fossil fuels. Internet search engine Google also did extremely well, buoyed by upward revisions in estimated earnings. On the negative side, fund performance was dampened by unfavorable stock picking in computer hardware, communications equipment and semiconductors. Not owning computer hardware manufacturer Hewlett-Packard — a large index component — was a mistake, as the stock turned in a strong gain. Conversely, we owned too much of another index component, computer maker Dell, which fell prey to stiffer competition from its rivals. In the case of PC chip maker Intel, weaker products and a shortage of manufacturing capacity caused the company to lose market share to a competitor.
The views expressed above reflect those of the portfolio manager(s) only through the end of the period as stated on the cover of this report and do not necessarily represent the views of Fidelity or any other person in the Fidelity organization. Any such views are subject to change at any time based upon market or other conditions and Fidelity disclaims any responsibility to update such views. These views may not be relied on as investment advice and, because investment decisions for a Fidelity fund are based on numerous factors, may not be relied on as an indication of trading intent on behalf of any Fidelity fund.
| Technology Portfolio | | | | |
| Investment Changes | | |
| |
| |
| Top Ten Stocks as of February 28, 2006 |
| | | % of fund’s | | % of fund’s net assets |
| | | net assets | | 6 months ago |
| Intel Corp. | | 6.9 | | 10.4 |
| Dell, Inc. | | 6.5 | | 5.2 |
| Google, Inc. Class A (sub. vtg.) | | 5.2 | | 3.4 |
| Microsoft Corp. | | 4.9 | | 7.3 |
| Oracle Corp. | | 4.7 | | 4.3 |
| Apple Computer, Inc. | | 3.7 | | 2.5 |
| Cisco Systems, Inc. | | 3.7 | | 4.7 |
| First Data Corp. | | 3.3 | | 1.6 |
| Motorola, Inc. | | 2.2 | | 2.3 |
| Samsung Electronics Co. Ltd. | | 2.2 | | 0.4 |
| | | 43.3 | | |
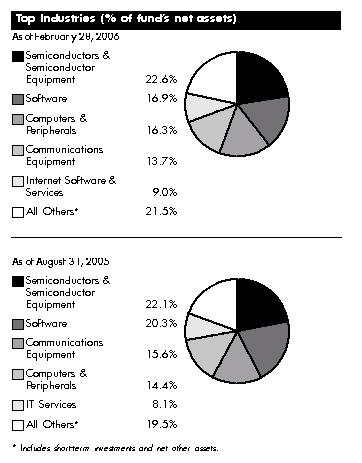
71 Annual Report
| Technology Portfolio | | | | | | |
| Investments February 28, 2006 | | | | |
| Showing Percentage of Net Assets | | | | | | |
| |
| Common Stocks — 98.9% | | | | | | |
| | | | | Shares | | Value (Note 1) |
| |
| AUTO COMPONENTS – 0.3% | | | | | | |
| Auto Parts & Equipment – 0.3% | | | | | | |
| IMPCO Technologies, Inc. (a) | | | | 900,000 | | $ 5,634,000 |
| COMMERCIAL SERVICES & SUPPLIES – 0.3% | | | | | | |
| Diversified Commercial & Professional Services – 0.3% | | | | | | |
| Equifax, Inc. | | | | 150,000 | | 5,496,000 |
| COMMUNICATIONS EQUIPMENT – 13.7% | | | | | | |
| Communications Equipment – 13.7% | | | | | | |
| Alcatel SA sponsored ADR (a) | | | | 750,000 | | 10,125,000 |
| Arris Group, Inc. (a) | | | | 200,000 | | 2,538,000 |
| Avaya, Inc. (a) | | | | 400,000 | | 4,448,000 |
| Cisco Systems, Inc. (a) | | | | 3,500,000 | | 70,840,000 |
| Comverse Technology, Inc. (a) | | | | 600,030 | | 17,256,863 |
| Corning, Inc. (a) | | | | 750,000 | | 18,307,500 |
| CSR PLC (a) | | | | 300,000 | | 4,762,517 |
| F5 Networks, Inc. (a) | | | | 200,000 | | 13,564,000 |
| ITF Optical Technologies, Inc. Series A (f) | | | | 65,118 | | 1 |
| Juniper Networks, Inc. (a) | | | | 1,000,000 | | 18,390,000 |
| Lucent Technologies, Inc. (a) | | | | 5,000,000 | | 14,000,000 |
| Motorola, Inc. | | | | 2,000,000 | | 42,800,000 |
| Nortel Networks Corp. (a) | | | | 6,500,000 | | 18,590,000 |
| Research In Motion Ltd. (a) | | | | 300,000 | | 21,234,872 |
| Tellabs, Inc. (a) | | | | 500,000 | | 7,345,000 |
| | | | | | | 264,201,753 |
| |
| COMPUTERS & PERIPHERALS – 16.3% | | | | | | |
| Computer Hardware – 11.8% | | | | | | |
| Apple Computer, Inc. (a) | | | | 1,050,000 | | 71,967,000 |
| Avid Technology, Inc. (a) | | | | 200,000 | | 9,368,000 |
| Dell, Inc. (a) | | | | 4,300,000 | | 124,700,000 |
| NCR Corp. (a) | | | | 100,000 | | 4,009,000 |
| Quanta Computer, Inc. | | | | 3,500,000 | | 5,312,239 |
| Sun Microsystems, Inc. (a) | | | | 2,750,000 | | 11,467,500 |
| | | | | | | 226,823,739 |
| Computer Storage & Peripherals – 4.5% | | | | | | |
| EMC Corp. (a) | | | | 3,000,000 | | 42,060,000 |
| Network Appliance, Inc. (a) | | | | 600,000 | | 19,896,000 |
| SanDisk Corp. (a) | | | | 100,000 | | 6,034,000 |
| Seagate Technology | | | | 400,000 | | 10,628,000 |
| TPV Technology Ltd. | | | | 3,000,000 | | 3,306,307 |
| Western Digital Corp. (a) | | | | 200,000 | | 4,450,000 |
| | | | | | | 86,374,307 |
| |
| TOTAL COMPUTERS & PERIPHERALS | | | | | | 313,198,046 |
| |
| DIVERSIFIED CONSUMER SERVICES – 0.4% | | | | | | |
| Education Services – 0.4% | | | | | | |
| Apollo Group, Inc. Class A (a) | | | | 160,000 | | 7,900,800 |
See accompanying notes which are an integral part of the financial statements.
Annual Report 72
| | | Shares | | Value (Note 1) |
| |
| ELECTRICAL EQUIPMENT – 4.5% | | | | |
| Electrical Components & Equipment – 4.5% | | | | |
| Energy Conversion Devices, Inc. (a)(d) | | 225,000 | | $ 10,541,250 |
| Evergreen Solar, Inc. (a)(d) | | 1,800,000 | | 28,062,000 |
| Hoku Scientific, Inc. (d) | | 200,000 | | 1,510,000 |
| Motech Industries, Inc. | | 700,000 | | 15,556,888 |
| SolarWorld AG | | 85,000 | | 22,093,666 |
| Suntech Power Holdings Co. Ltd. sponsored ADR | | 256,900 | | 9,649,164 |
| | | | | 87,412,968 |
| |
| ELECTRONIC EQUIPMENT & INSTRUMENTS – 4.1% | | | | |
| Electronic Equipment & Instruments – 0.5% | | | | |
| Amphenol Corp. Class A | | 175,000 | | 8,790,250 |
| Symbol Technologies, Inc. | | 149,997 | | 1,742,965 |
| | | | | 10,533,215 |
| Electronic Manufacturing Services – 1.9% | | | | |
| Flextronics International Ltd. (a) | | 400,000 | | 4,316,000 |
| Hon Hai Precision Industry Co. Ltd. (Foxconn) | | 4,999,971 | | 31,486,543 |
| | | | | 35,802,543 |
| Technology Distributors – 1.7% | | | | |
| Arrow Electronics, Inc. (a) | | 300,000 | | 10,437,000 |
| Avnet, Inc. (a) | | 500,000 | | 12,565,000 |
| CDW Corp. | | 175,000 | | 9,950,500 |
| | | | | 32,952,500 |
| |
| TOTAL ELECTRONIC EQUIPMENT & INSTRUMENTS | | | | 79,288,258 |
| |
| FOOD PRODUCTS – 0.1% | | | | |
| Packaged Foods & Meats – 0.1% | | | | |
| Orkla ASA (A Shares) | | 25,000 | | 1,091,145 |
| HOTELS, RESTAURANTS & LEISURE – 0.1% | | | | |
| Hotels, Resorts & Cruise Lines – 0.1% | | | | |
| eLong, Inc. sponsored ADR (a) | | 200,000 | | 2,546,000 |
| HOUSEHOLD DURABLES – 0.5% | | | | |
| Consumer Electronics – 0.5% | | | | |
| Directed Electronics, Inc. | | 250,000 | | 3,537,500 |
| Harman International Industries, Inc. | | 50,000 | | 5,517,500 |
| | | | | 9,055,000 |
| |
| INTERNET & CATALOG RETAIL – 0.3% | | | | |
| Internet Retail – 0.3% | | | | |
| Expedia, Inc. (a) | | 250,000 | | 4,742,500 |
| INTERNET SOFTWARE & SERVICES – 9.0% | | | | |
| Internet Software & Services – 9.0% | | | | |
| Akamai Technologies, Inc. (a) | | 100,000 | | 2,650,000 |
| eBay, Inc. (a)(d) | | 850,000 | | 34,051,000 |
| Equinix, Inc. (a) | | 125,000 | | 6,555,000 |
| Google, Inc. Class A (sub. vtg.) (a) | | 275,000 | | 99,720,500 |
| Openwave Systems, Inc. (a) | | 400,010 | | 7,940,199 |
| Spark Networks PLC unit (a) | | 50,000 | | 336,768 |
73
See accompanying notes which are an integral part of the financial statements.
73 Annual Report
| Technology Portfolio | | | | |
| Investments - continued | | | | |
| |
| |
| Common Stocks – continued | | | | |
| | | Shares | | Value (Note 1) |
| |
| INTERNET SOFTWARE & SERVICES – CONTINUED | | | | |
| Internet Software & Services – continued | | | | |
| VeriSign, Inc. (a) | | 500,000 | | $ 11,830,000 |
| Yahoo!, Inc. (a) | | 300,000 | | 9,618,000 |
| | | | | 172,701,467 |
| |
| IT SERVICES – 7.5% | | | | |
| Data Processing & Outsourced Services – 5.5% | | | | |
| Affiliated Computer Services, Inc. | | | | |
| Class A (a) | | 200,000 | | 12,584,000 |
| Alliance Data Systems Corp. (a) | | 50,000 | | 2,163,000 |
| First Data Corp. | | 1,400,000 | | 63,182,000 |
| Hewitt Associates, Inc. Class A (a) | | 400,000 | | 10,796,000 |
| Paychex, Inc. | | 325,000 | | 13,016,250 |
| The BISYS Group, Inc. (a) | | 250,000 | | 3,527,500 |
| | | | | 105,268,750 |
| IT Consulting & Other Services – 2.0% | | | | |
| Accenture Ltd. Class A | | 450,000 | | 14,697,000 |
| Cognizant Technology Solutions Corp. Class A (a) | | 50,000 | | 2,880,500 |
| HCL Infosystems Ltd. | | 500,000 | | 1,987,013 |
| HCL Technologies Ltd. | | 250,000 | | 3,444,099 |
| Infosys Technologies Ltd. | | 150,000 | | 9,584,246 |
| Satyam Computer Services Ltd. sponsored ADR | | 150,000 | | 6,172,500 |
| | | | | 38,765,358 |
| |
| TOTAL IT SERVICES | | | | 144,034,108 |
| |
| MEDIA – 0.2% | | | | |
| Movies & Entertainment – 0.1% | | | | |
| Playboy Enterprises, Inc. Class B (non-vtg.) (a) | | 130,000 | | 1,801,800 |
| Publishing – 0.1% | | | | |
| Getty Images, Inc. (a) | | 25,000 | | 2,025,750 |
| |
| TOTAL MEDIA | | | | 3,827,550 |
| |
| SEMICONDUCTORS & SEMICONDUCTOR EQUIPMENT – 22.6% | | | | |
| Semiconductor Equipment – 3.2% | | | | |
| ASML Holding NV (NY Shares) (a) | | 400,000 | | 8,272,000 |
| Cohu, Inc. | | 400,000 | | 8,448,000 |
| KLA-Tencor Corp. | | 400,000 | | 20,892,000 |
| Lam Research Corp. (a) | | 125,000 | | 5,387,500 |
| MEMC Electronic Materials, Inc. (a) | | 500,000 | | 16,745,000 |
| Varian Semiconductor Equipment Associates, Inc. (a) | | 50,000 | | 2,358,000 |
| | | | | 62,102,500 |
| Semiconductors – 19.4% | | | | |
| Altera Corp. (a) | | 1,000,000 | | 20,040,000 |
| Analog Devices, Inc. | | 725,000 | | 27,651,500 |
| ARM Holdings PLC sponsored ADR | | 1,250,000 | | 9,000,000 |
| Freescale Semiconductor, Inc.: | | | | |
| Class A (a) | | 250,000 | | 6,722,500 |
See accompanying notes which are an integral part of the financial statements.
Annual Report 74
| | | Shares | | Value (Note 1) |
| Class B (a) | | 450,000 | | $ 12,168,000 |
| Intel Corp. | | 6,400,000 | | 131,840,000 |
| Intersil Corp. Class A | | 200,000 | | 5,668,000 |
| Linear Technology Corp. | | 500,000 | | 18,430,000 |
| Marvell Technology Group Ltd. (a) | | 400,000 | | 24,488,000 |
| Maxim Integrated Products, Inc. | | 500,000 | | 19,545,000 |
| National Semiconductor Corp. | | 1,225,000 | | 34,361,250 |
| PMC-Sierra, Inc. (a) | | 632,995 | | 6,462,879 |
| Q-Cells AG | | 45,000 | | 4,571,048 |
| Samsung Electronics Co. Ltd. | | 60,000 | | 42,069,017 |
| Taiwan Semiconductor Manufacturing Co. Ltd. sponsored ADR | | 1,000,000 | | 9,730,000 |
| | | | | 372,747,194 |
| |
| TOTAL SEMICONDUCTORS & SEMICONDUCTOR EQUIPMENT | | | | 434,849,694 |
| |
| SOFTWARE – 16.9% | | | | |
| Application Software – 4.2% | | | | |
| Adobe Systems, Inc. | | 250,000 | | 9,655,000 |
| Amdocs Ltd. (a) | | 400,000 | | 13,248,000 |
| Autodesk, Inc. | | 200,000 | | 7,530,000 |
| BEA Systems, Inc. (a) | | 700,000 | | 8,029,000 |
| Citrix Systems, Inc. (a) | | 175,000 | | 5,663,000 |
| Cognos, Inc. (a) | | 250,000 | | 9,609,207 |
| Hyperion Solutions Corp. (a) | | 75,000 | | 2,516,250 |
| Mercury Interactive Corp. (a) | | 175,000 | | 6,212,500 |
| NAVTEQ Corp. (a) | | 75,000 | | 3,473,250 |
| Parametric Technology Corp. (a) | | 200,000 | | 3,044,000 |
| Quest Software, Inc. (a) | | 600,000 | | 8,742,000 |
| TIBCO Software, Inc. (a) | | 500,000 | | 4,335,000 |
| | | | | 82,057,207 |
| Home Entertainment Software – 1.2% | | | | |
| Activision, Inc. (a) | | 1,200,000 | | 15,000,000 |
| Take-Two Interactive Software, Inc. (a)(d) | | 500,000 | | 7,790,000 |
| | | | | 22,790,000 |
| Systems Software – 11.5% | | | | |
| Check Point Software Technologies Ltd. (a) | | 175,000 | | 3,720,500 |
| McAfee, Inc. (a) | | 175,000 | | 4,070,500 |
| Microsoft Corp. | | 3,500,000 | | 94,150,000 |
| Oracle Corp. (a) | | 7,200,000 | | 89,424,000 |
| Symantec Corp. (a) | | 1,500,000 | | 25,335,000 |
| Wind River Systems, Inc. (a) | | 250,000 | | 3,867,500 |
| | | | | 220,567,500 |
| |
| TOTAL SOFTWARE | | | | 325,414,707 |
| |
| SPECIALTY RETAIL – 0.4% | | | | |
| Computer & Electronics Retail – 0.4% | | | | |
| Best Buy Co., Inc. | | 150,000 | | 8,079,000 |
See accompanying notes which are an integral part of the financial statements.
|
75 Annual Report
75
| Technology Portfolio | | | | |
| Investments - continued | | | | |
| |
| |
| Common Stocks – continued | | | | |
| | | Shares | | Value (Note 1) |
| |
| WIRELESS TELECOMMUNICATION SERVICES – 1.7% | | | | |
| Wireless Telecommunication Services – 1.7% | | | | |
| China Mobile (Hong Kong) Ltd. sponsored ADR | | 300,000 | | $ 7,269,000 |
| Crown Castle International Corp. (a) | | 500,000 | | 15,675,000 |
| Sprint Nextel Corp. | | 300,000 | | 7,209,000 |
| Syniverse Holdings, Inc. | | 200,000 | | 2,860,000 |
| | | | | 33,013,000 |
| |
| TOTAL COMMON STOCKS | | | | |
| (Cost $1,828,905,482) | | 1,902,485,996 |
| |
| Convertible Preferred Stocks — 0.0% | | | | |
| |
| COMMUNICATIONS EQUIPMENT – 0.0% | | | | |
| Communications Equipment – 0.0% | | | | |
| Chorum Technologies, Inc. Series E (a)(f) | | | | |
| (Cost $496,562) | | 33,100 | | 0 |
| |
| Convertible Bonds — 0.2% | | | | |
| | | Principal | | |
| | | Amount | | |
| |
| ELECTRICAL EQUIPMENT – 0.2% | | | | |
| Electrical Components & Equipment – 0.2% | | | | |
| Evergreen Solar, Inc. 4.375% 7/1/12 (e) | | | | |
| (Cost $2,020,000) | | $ 2,020,000 | | 4,393,500 |
| |
| Money Market Funds — 4.1% | | | | |
| | | Shares | | |
| Fidelity Cash Central Fund, 4.57% (b) | | 26,869,861 | | 26,869,861 |
| Fidelity Securities Lending Cash Central Fund, 4.58% (b)(c) | | 51,850,525 | | 51,850,525 |
| TOTAL MONEY MARKET FUNDS | | | | |
| (Cost $78,720,386) | | | | 78,720,386 |
| |
| TOTAL INVESTMENT PORTFOLIO - 103.2% | | | | |
| (Cost $1,910,142,430) | | 1,985,599,882 |
| |
| NET OTHER ASSETS – (3.2)% | | | | (62,283,552) |
| NET ASSETS – 100% | | $ 1,923,316,330 |
(a) Non-income producing
(b) Affiliated fund that is available only to investment companies and other accounts managed by Fidelity Investments. The rate quoted is the annualized seven-day yield of the fund at period end. A complete unaudited listing of the fund’s holdings as of its most recent quarter end is available upon request.
(c) Investment made with cash collateral received from securities on loan. (d) Security or a portion of the security is on loan at period end.
(e) Security exempt from registration under Rule 144A of the Securities Act of 1933. These securities may be resold in transactions exempt from registration, normally to qualified institutional buyers. At the period end, the value of these securities amounted to $4,393,500 or 0.2% of net assets.
(f) Restricted securities – Investment in securities not registered under the Securities Act of 1933 (excluding 144A issues). At the end of the period, the value of restricted securities (excluding 144A issues) amounted to $1 or 0.0% of net assets.
Additional information on each holding is as follows:
|
See accompanying notes which are an integral part of the financial statements.
Annual Report 76
| Security | | Acquisition Date | | Acquisition Cost |
| Chorum Technologies, Inc. Series E | | 9/19/00 | | $ 496,562 |
| ITF Optical Technologies, Inc. Series A | | 10/11/00 | | $ 3,269,910 |
| |
| Affiliated Central Funds | | | | | | |
| Information regarding fiscal year to date income earned by the fund from the affiliated Central funds is as follows: | | | | |
| Fund | | | | | | Income earned |
| Fidelity Cash Central Fund | | | | $ | | 1,099,803 |
| Fidelity Securities Lending Cash Central Fund | | | | | | 302,867 |
| Total | | | | $ | | 1,402,670 |
See accompanying notes which are an integral part of the financial statements.
|
77 Annual Report
77
| Technology Portfolio | | |
| Investments - continued | | |
| |
| |
| Other Information | | |
| Distribution of investments by country of issue, as a percentage of total net assets, is as follows: | | |
| United States of America | | 82.8% |
| Taiwan | | 3.3% |
| Canada | | 2.6% |
| Bermuda | | 2.3% |
| Korea (South) | | 2.2% |
| United Kingdom | | 1.4% |
| Germany | | 1.3% |
| Cayman Islands | | 1.2% |
| India | | 1.1% |
| Others (individually less than 1%) | | 1.8% |
| | | 100.0% |
Income Tax Information
At February 28, 2006, the fund had a capital loss carryforward of approximately $2,622,811,486 of which $1,844,360,998 and $778,450,488 will expire on February 28, 2010 and 2011, respectively.
See accompanying notes which are an integral part of the financial statements.
Annual Report 78
| Technology Portfolio | | | | | | | | |
| |
| Financial Statements | | | | | | | | |
| |
| |
| Statement of Assets and Liabilities | | | | | | | | |
| | | | | | | | | February 28, 2006 |
| |
| Assets | | | | | | | | |
| Investment in securities, at value (including securities loaned of $50,779,998) — See accompanying schedule: | | | | | | | | |
| Unaffiliated issuers (cost $1,831,422,044) | | $1,906,879,496 | | | | |
| Affiliated Central Funds (cost $78,720,386) | | | | 78,720,386 | | | | |
| Total Investments (cost $1,910,142,430) | | | | | | $1,985,599,882 |
| Foreign currency held at value (cost $3,890) | | | | | | | | 3,838 |
| Receivable for fund shares sold | | | | | | | | 2,323,683 |
| Dividends receivable | | | | | | | | 1,170,858 |
| Interest receivable | | | | | | | | 119,794 |
| Prepaid expenses | | | | | | | | 7,759 |
| Other affiliated receivables | | | | | | | | 246 |
| Other receivables | | | | | | | | 800,925 |
| Total assets | | | | | | | | 1,990,026,985 |
| |
| Liabilities | | | | | | | | |
| Payable for investments purchased | | $ | | 8,377,328 | | | | |
| Payable for fund shares redeemed | | | | 4,641,498 | | | | |
| Accrued management fee | | | | 913,986 | | | | |
| Other affiliated payables | | | | 591,292 | | | | |
| Other payables and accrued expenses | | | | 336,026 | | | | |
| Collateral on securities loaned, at value | | | | 51,850,525 | | | | |
| Total liabilities | | | | | | | | 66,710,655 |
| |
| Net Assets | | | | | | $ 1,923,316,330 |
| Net Assets consist of: | | | | | | | | |
| Paid in capital | | | | | | $4,484,409,922 |
| Distributions in excess of net investment income | | | | | | | | (2,084) |
| Accumulated undistributed net realized gain (loss) on investments and foreign currency transactions | | | | | | (2,636,273,068) |
| Net unrealized appreciation (depreciation) on investments and assets and liabilities in foreign currencies | | | | | | | | 75,181,560 |
| Net Assets, for 29,480,727 shares outstanding | | | | | | $ 1,923,316,330 |
| |
| Net Asset Value, offering price and redemption price per share ($1,923,316,330 ÷ 29,480,727 shares) | | | | | | $ | | 65.24 |
| |
| Statement of Operations | | | | | | | | |
| | | | | | | | | Year ended February 28, 2006 |
| |
| Investment Income | | | | | | | | |
| Dividends | | | | | | $ | �� | 7,752,778 |
| Interest | | | | | | | | 78,077 |
| Income from affiliated Central Funds | | | | | | | | |
| (including $302,867 from security lending) | | | | | | | | 1,402,670 |
| Total income | | | | | | | | 9,233,525 |
| |
| Expenses | | | | | | | | |
| Management fee | | $ | | 10,713,846 | | | | |
| Transfer agent fees | | | | 6,869,170 | | | | |
| Accounting and security lending fees | | | | | | | | |
| | | | | 738,912 | | | | |
| Independent trustees’ compensation | | | | 8,151 | | | | |
| Custodian fees and expenses | | | | 197,808 | | | | |
| Registration fees | | | | 54,997 | | | | |
| Audit | | | | 46,834 | | | | |
| Legal | | | | 15,345 | | | | |
| Interest | | | | 1,268 | | | | |
| Miscellaneous | | | | 23,414 | | | | |
| Total expenses before reductions | | | | 18,669,745 | | | | |
| Expense reductions | | | | (1,161,482) | | | | 17,508,263 |
| |
| Net investment income (loss) | | | | | | | | (8,274,738) |
| See accompanying notes which are an integral part of the financial statements. | | | | | | | | |
79 Annual Report
| Technology Portfolio | | | | |
| Financial Statements - continued | | | | |
| |
| |
| Realized and Unrealized Gain (Loss) | | | | |
| Net realized gain (loss) on: | | | | |
| Investment securities: | | | | |
| Unaffiliated issuers (net of foreign taxes of $180,851) | | 160,428,930 | | |
| Foreign currency transactions | | (1,180,035) | | |
| Total net realized gain (loss) | | | | 159,248,895 |
| Change in net unrealized appreciation (depreciation) on: | | | | |
| Investment securities (net of increase in deferred foreign taxes of $278,480) | | 78,156,344 | | |
| Assets and liabilities in foreign currencies | | (10,385) | | |
| Total change in net unrealized appreciation (depreciation) | | | | 78,145,959 |
| Net gain (loss) | | | | 237,394,854 |
| Net increase (decrease) in net assets resulting from operations | | | | $229,120,116 |
See accompanying notes which are an integral part of the financial statements.
Annual Report 80
| Statement of Changes in Net Assets | | | | | | | | | | | | | | | | | | | | |
| | | | | | | | | | | Year ended | | | | Year ended |
| | | | | | | | | | | February 28, | | | | February 28, |
| | | | | | | | | | | 2006 | | | | 2005 |
| Increase (Decrease) in Net Assets | | | | | | | | | | | | | | | | | | | | |
| Operations | | | | | | | | | | | | | | | | | | | | |
| Net investment income (loss) | | | | | | | | | | $ | | (8,274,738) | | $ | | | | 4,302,339 |
| Net realized gain (loss) | | | | | | | | | | 159,248,895 | | | | 189,387,528 |
| Change in net unrealized appreciation (depreciation) | | | | | | | | | | 78,145,959 | | | | (375,897,548) |
| Net increase (decrease) in net assets resulting from operations | | | | | | | | | | 229,120,116 | | | | (182,207,681) |
| Distributions to shareholders from net investment income | | | | | | | | | | | | | | — | | | | (5,976,190) |
| Share transactions | | | | | | | | | | | | | | | | | | | | |
| Proceeds from sales of shares | | | | | | | | | | 453,428,844 | | | | 381,187,720 |
| Reinvestment of distributions | | | | | | | | | | | | | | — | | | | | | 5,775,266 |
| Cost of shares redeemed | | | | | | | | | | (713,469,270) | | | | (844,222,054) |
| Net increase (decrease) in net assets resulting from share transactions | | | | | | | | | | (260,040,426) | | | | (457,259,068) |
| Redemption fees | | | | | | | | | | | | 219,628 | | | | | | 287,814 |
| Total increase (decrease) in net assets | | | | | | | | | | (30,700,682) | | | | (645,155,125) |
| |
| Net Assets | | | | | | | | | | | | | | | | | | | | |
| Beginning of period | | | | | | | | | | 1,954,017,012 | | 2,599,172,137 |
| End of period (including distributions in excess of net investment income of $2,084 and distributions in excess of net | | | | | | | | | | | | |
| investment income of $2,818, respectively) | | | | | | | | | | $ 1,923,316,330 | | $ 1,954,017,012 |
| |
| Other Information | | | | | | | | | | | | | | | | | | | | |
| Shares | | | | | | | | | | | | | | | | | | | | |
| Sold | | | | | | | | | | | | 7,377,352 | | | | | | 6,743,814 |
| Issued in reinvestment of distributions | | | | | | | | | | | | | | — | | | | | | 94,599 |
| Redeemed | | | | | | | | | | (11,808,572) | | | | (14,886,227) |
| Net increase (decrease) | | | | | | | | | | | | (4,431,220) | | | | (8,047,814) |
| |
| Financial Highlights | | | | | | | | | | | | | | | | | | | | |
| Years ended February 28, | | 2006 | | | | 2005 | | | | 2004F | | | | 2003 | | | | | | 2002 |
| Selected Per-Share Data | | | | | | | | | | | | | | | | | | | | |
| Net asset value, beginning of period | | $ 57.62 | | $ | | 61.94 | | $ | | 38.44 | | $ | | 52.07 | | | | $ | | 69.00 |
| Income from Investment Operations | | | | | | | | | | | | | | | | | | | | |
| Net investment income (loss)C | | (.27) | | | | .11D | | | | (.42) | | | | (.37) | | | | | | (.45) |
| Net realized and unrealized gain (loss) | | 7.88 | | | | (4.28) | | | | 23.91 | | | | (13.28) | | | | | | (16.50) |
| Total from investment operations | | 7.61 | | | | (4.17) | | | | 23.49 | | | | (13.65) | | | | | | (16.95) |
| Distributions from net investment income | | — | | | | (.16) | | | | — | | | | — | | | | | | — |
| Redemption fees added to paid in capitalC | | 01 | | | | .01 | | | | .01 | | | | .02 | | | | | | .02 |
| Net asset value, end of period | | $ 65.24 | | $ | | 57.62 | | $ | | 61.94 | | $ | | 38.44 | | | | $ | | 52.07 |
| Total ReturnA,B | | 13.22% | | | | (6.73)% | | | | 61.13% | | | | (26.18)% | | | | | | (24.54)% |
| Ratios to Average Net AssetsE | | | | | | | | | | | | | | | | | | | | |
| Expenses before reductions | | 99% | | | | 1.01% | | | | 1.19% | | | | 1.39% | | | | | | 1.19% |
| Expenses net of fee waivers, if any | | 99% | | | | 1.01% | | | | 1.19% | | | | 1.39% | | | | | | 1.19% |
| Expenses net of all reductions | | 93% | | | | .94% | | | | 1.14% | | | | 1.22% | | | | | | 1.13% |
| Net investment income (loss) | | (.44)% | | | | .20%D | | | | (.80)% | | | | (.86) % | | | | | | (.73)% |
| Supplemental Data | | | | | | | | | | | | | | | | | | | | |
| Net assets, end of period (000 omitted) | | $1,923,316 | | $ 1,954,017 | | $ 2,599,172 | | $ 1,484,150 | | | | $ 2,245,312 |
| Portfolio turnover rate | | 100% | | | | 104% | | | | 127% | | | | 153% | | | | | | 184% |
ATotal returns would have been lower had certain expenses not been reduced during the periods shown. BTotal returns do not include the effect of the former sales charges. CCalculated based on average shares outstanding during the period. DInvestment income per share reflects a special dividend which amounted to $.48 per share. Excluding the special dividend, the ratio of net investment income (loss) to average net assets would have been (.65)%. EExpense ratios reflect operating expenses of the fund. Expenses before reductions do not reflect amounts reimbursed by the investment adviser or reductions from brokerage service arrangements or other expense offset arrangements and do not represent the amount paid by the fund during periods when reimbursements or reductions occur. Expenses net of fee waivers reflect expenses after reimbursement by the investment adviser but prior to reductions from brokerage service arrangements or other expense offset arrange ments. Expenses net of all reductions represent the net expenses paid by the fund. FFor the year ended February 29.
See accompanying notes which are an integral part of the financial statements.
|
Notes to Financial Statements
For the period ended February 28, 2006
|
1. Significant Accounting Policies.
|
Business Services and Outsourcing Portfolio, Computers Portfolio, Developing Communications Portfolio, Electronics Portfolio, Networking and Infrastructure Portfolio, Software and Computer Services Portfolio, and Technology Portfolio (the funds) are non-diversified funds of Fidelity Select Portfolios (the trust). The trust is registered under the Investment Company Act of 1940, as amended (the 1940 Act), as an open-end management investment company organized as a Massachusetts business trust. The funds invest primarily in securities of companies whose principal business activities fall within specific industries. Each fund is authorized to issue an unlimited number of shares. Certain funds may invest in affiliated money market central funds (Money Market Central Funds) which are open-end investment companies available to investment companies and other accounts managed by Fidelity Management & Research Company (FMR) and its affiliates. The financial statements have been prepared in conformity with accounting principles generally accepted in the United States of America, which require management to make certain estimates and assumptions at the date of the financial statements. The following summarizes the significant accounting policies of the funds:
Security Valuation. Investments are valued and net asset value (NAV) per share is calculated (NAV calculation) as of the close of business of the New York Stock Exchange (NYSE), normally 4:00 p.m. Eastern time. In addition, each fund intends to calculate a NAV each hour on the hour (commencing at 10:00 a.m. Eastern time until one hour prior to the close of business on the NYSE) under normal business conditions. Each fund’s investments are valued as of these times for the purpose of computing the fund’s hourly NAV. Wherever possible, each fund uses independent pricing services approved by the Board of Trustees to value their investments.
Equity securities, including restricted securities, for which market quotations are readily available, are valued at the last reported sale price or official closing price as reported by an independent pricing service on the primary market or exchange on which they are traded. In the event there were no sales during the day or closing prices are not available, securities are valued at the last quoted bid price. Debt securities, including restricted securities, for which quotations are readily available, are valued by independent pricing services or by dealers who make markets in such securities. Pricing services consider yield or price of bonds of comparable quality, coupon, maturity and type as well as dealer supplied prices. Investments in open-end mutual funds, are valued at their closing net asset value each business day. Short-term securities with remaining maturities of sixty days or less for which quotations are not readily available are valued at amortized cost, which approximates value.
When current market prices or quotations are not readily available or do not accurately reflect fair value, valuations may be determined in accordance with procedures adopted by the Board of Trustees. For example, when developments occur between the close of a market and the close of the NYSE that may materially affect the value of some or all of the securities, or when trading in a security is halted, those securities may be fair valued. Factors used in the determination of fair value may include monitoring news to identify significant market or security specific events such as changes in the value of U.S. securities markets, reviewing developments in foreign markets and evaluating the performance of ADRs, futures contracts and exchange-traded funds. Because the fund’s utilization of fair value pricing depends on market activity, the frequency with which fair value pricing is used can not be predicted and may be utilized to a significant extent. The value of securities used for NAV calculation under fair value pricing may differ from published prices for the same securities. Fidelity may suspend the calculation of one or more hourly NAVs for funds for any period in which prices for a portion of the stocks or securities held by the funds are not readily available.
Foreign Currency. Certain funds may use foreign currency contracts to facilitate transactions in foreign-denominated securities. Losses from these transactions may arise from changes in the value of the foreign currency or if the counterparties do not perform under the contracts’ terms.
Foreign-denominated assets, including investment securities, and liabilities are translated into U.S. dollars at the exchange rate at period end. Purchases and sales of investment securities, income and dividends received and expenses denominated in foreign currencies are translated into U.S. dollars at the exchange rate in effect on the transaction date.
The effects of exchange rate fluctuations on investments are included with the net realized and unrealized gain (loss) on investment securities. Other foreign currency transactions resulting in realized and unrealized gain (loss) are disclosed separately.
Investment Transactions and Income. Security transactions are accounted for as of trade date. Gains and losses on securities sold are determined on the basis of identified cost and may include proceeds received from litigation. Dividend income is recorded on the ex-dividend date, except for certain dividends from foreign securities where the ex-dividend date may have passed, which are recorded as soon as the funds are informed of the ex-dividend date. Non-cash dividends included in dividend income, if any, are recorded at the fair market value of the securities received. Distributions received on securities that represent a return of capital or capital gain are recorded as a reduction of cost of investments and/or as a realized gain. The funds estimate the components of distributions received that may be considered return of capital distributions or capital gain distributions. As a result in the change in the estimate of the return of capital component of dividend income realized in the year ended February 28, 2005, dividend income has been increased $152,684 for Developing Communications Portfolio and $13,846 for Networking and Infrastructure Portfolio, with a corresponding decrease to net unrealized appreciation (depreciation). The change in estimate has no impact on total net assets or total return of each applicable fund. Large, non-recurring dividends recognized by the funds are presented separately on the Statement of Operations as “Special Dividends” and the impact of these dividends is presented in the Financial Highlights. Interest income is accrued as earned. Interest income includes coupon interest and amortization of premium and accretion of discount on debt securities. Investment income is recorded net of foreign taxes withheld where recovery of such taxes is uncertain.
1. Significant Accounting Policies - continued
|
Expenses. Most expenses of the trust can be directly attributed to a fund. Expenses which cannot be directly attributed are apportioned among each fund in the trust.
Deferred Trustee Compensation. Under a Deferred Compensation Plan (the Plan) for Electronics Portfolio, independent Trustees must defer receipt of a portion of, and may elect to defer receipt of an additional portion of, their annual compensation. Deferred amounts are treated as though equivalent dollar amounts had been invested in shares of each applicable fund or are invested in a cross-section of other Fidelity funds, and are marked-to-market. Deferred amounts remain in the fund until distributed in accordance with the Plan.
Income Tax Information and Distributions to Shareholders. Each year, each fund intends to qualify as a regulated investment company by distributing all of its taxable income and realized gains under Subchapter M of the Internal Revenue Code. As a result, no provision for income taxes is required in the accompanying financial statements. Foreign taxes are provided for based on each fund’s understanding of the tax rules and rates that exist in the foreign markets in which it invests.
Distributions are recorded on the ex-dividend date. Income and capital gain distributions are determined in accordance with income tax regulations, which may differ from generally accepted accounting principles. In addition, certain funds will claim a portion of the payment made to redeeming shareholders as a distribution for income tax purposes.
Capital accounts within the financial statements are adjusted for permanent book-tax differences. These adjustments have no impact on net assets or the results of operations. Temporary book-tax differences will reverse in a subsequent period.
Book-tax differences are primarily due to short-term capital gains, foreign currency transactions, certain foreign taxes, deferred trustees compensation, net operating losses, capital loss carryforwards and losses deferred due to wash sales and excise tax regulations.
The tax-basis components of distributable earnings and the federal tax cost as of period end were as follows for each fund:
| | | Cost for | | | | | | | | | | | | Net Unrealized |
| | | Federal Income | | | | Unrealized | | | | Unrealized | | | | Appreciation/ |
| | | Tax Purposes | | | | Appreciation | | | | Depreciation | | | | (Depreciation) |
| Business Services and Outsourcing Portfolio | | $ 31,605,995 | | $ | | 8,594,792 | | $ | | (406,566) | | $ | | 8,188,226 |
| Computers Portfolio | | 529,638,266 | | | | 64,001,173 | | | | (44,349,026) | | | | 19,652,147 |
| Developing Communications Portfolio | | 502,045,454 | | | | 45,712,294 | | | | (43,182,420) | | | | 2,529,874 |
| Electronics Portfolio | | 2,671,912,139 | | | | 479,742,784 | | | | (193,256,974) | | | | 286,485,810 |
| Networking and Infrastructure Portfolio | | 122,180,567 | | | | 15,024,450 | | | | (6,185,755) | | | | 8,838,695 |
| Software and Computer Services Portfolio | | 595,394,320 | | | | 51,832,878 | | | | (83,668,071) | | | | (31,835,193) |
| Technology Portfolio | | 1,922,309,280 | | | | 222,717,625 | | | | (159,427,023) | | | | 63,290,602 |
| |
| | | | | | | | | | | Undistributed | | | | |
| | | | | | | Undistributed | | | | Long-term | | | | Capital Loss |
| | | | | | | Ordinary Income | | | | Capital Gain | | | | Carryforward |
| Business Services and Outsourcing Portfolio | | | | $ | | 105,164 | | $ | | 1,577,607 | | $ | | — |
| Computers Portfolio | | | | | | — | | | | — | | | | (801,330,392) |
| Developing Communications Portfolio | | | | | | — | | | | — | | (1,232,103,818) |
| Electronics Portfolio | | | | | | — | | | | — | | (2,795,466,298) |
| Networking and Infrastructure Portfolio | | | | | | — | | | | — | | | | (196,502,774) |
| Software and Computer Services Portfolio | | | | | | — | | | | — | | | | (101,031,277) |
| Technology Portfolio | | | | | | — | | | | — | | (2,622,811,486) |
| |
| The tax character of distributions paid was as follows: | | | | | | | | | | | | | | |
| |
| February 28, 2006 | | | | | | | | | | | | | | |
| | | | | | | Ordinary | | | | Long-term | | | | |
| | | | | | | Income | | | | Capital Gains | | | | Total |
| Business Services and Outsourcing Portfolio | | | | $ | | — | | $ | | 1,570,115 | | $ | | 1,570,115 |
| |
| |
| February 28, 2005 | | | | | | | | | | | | | | |
| | | | | | | Ordinary | | | | Long-term | | | | |
| | | | | | | Income | | | | Capital Gains | | | | Total |
| Business Services and Outsourcing Portfolio | | | | $ | | — | | $ | | 565,955 | | $ | | 565,955 |
| Software and Computer Services Portfolio | | | | | | 8,110,612 | | | | — | | | | 8,110,612 |
| Technology Portfolio | | | | | | 5,976,190 | | | | — | | | | 5,976,190 |
83 Annual Report
Notes to Financial Statements - continued
1. Significant Accounting Policies - continued
|
Trading (Redemption) Fees. Shares in the funds held less than 30 days are subject to a redemption fee equal to .75% of the net asset value of shares redeemed. All redemption fees, including any estimated redemption fees paid by FMR, are retained by the fund and accounted for as an addition to paid in capital. Shareholders are also subject to an additional $7.50 fee for shares exchanged into another Fidelity fund (see Note 4).
Repurchase Agreements. FMR has received an Exemptive Order from the Securities and Exchange Commission (the SEC) which permits certain funds and other affiliated entities of FMR to transfer uninvested cash balances into joint trading accounts which are then invested in repurchase agreements. Certain funds may also invest directly with institutions in repurchase agreements. Repurchase agreements are collateralized by government or non-government securities. Upon settlement date, collateral is held in segregated accounts with custodian banks and may be obtained in the event of a default of the counterparty. Each applicable fund monitors, on a daily basis, the value of the collateral to ensure it is at least equal to the principal amount of the repurchase agreement (including accrued interest). In the event of a default by the counterparty, realization of the collateral proceeds could be delayed, during which time the value of the collateral may decline.
Restricted Securities. Certain funds may invest in securities that are subject to legal or contractual restrictions on resale. These securities generally may be resold in transactions exempt from registration or to the public if the securities are registered. Disposal of these securities may involve time-consuming negotiations and expense, and prompt sale at an acceptable price may be difficult. Information regarding restricted securities is included at the end of each applicable fund’s Schedule of Investments.
| 3. Purchases and Sales of Investments. | | | | |
| |
| Purchases and sales of securities, other than short-term securities and U.S. government securities, are noted in the table below. | | |
| | | Purchases ($) | | Sales ($) |
| Business Services and Outsourcing Portfolio | | 25,641,543 | | 29,866,156 |
| Computers Portfolio | | 642,584,300 | | 824,895,258 |
| Developing Communications Portfolio | | 767,822,325 | | 888,113,419 |
| Electronics Portfolio | | 2,091,323,563 | | 2,499,365,252 |
| Networking and Infrastructure Portfolio | | 203,420,216 | | 205,631,851 |
| Software and Computer Services Portfolio | | 360,241,030 | | 562,445,747 |
| Technology Portfolio | | 1,842,698,023 | | 2,113,180,740 |
| |
| 4. Fees and Other Transactions with Affiliates. | | | | |
Management Fee. FMR and its affiliates provide the funds with investment management related services for which the funds pay a monthly management fee. The management fee is the sum of an individual fund fee rate and a group fee rate. The individual fund fee rate is applied to each fund’s average net assets. The group fee rate is based upon the average net assets of all the mutual funds advised by FMR. The group fee rate decreases as assets under management increase and increases as assets under management decrease. For the period, each fund’s annual management fee rate expressed as a percentage of each fund’s average net assets was as follows:
| | | Individual Rate | | Group Rate | | Total |
| Business Services and Outsourcing Portfolio | | 30% | | .27% | | .57% |
| Computers Portfolio | | 30% | | .27% | | .57% |
| Developing Communications Portfolio | | 30% | | .27% | | .57% |
| Electronics Portfolio | | 30% | | .27% | | .57% |
| Networking and Infrastructure Portfolio | | 30% | | .27% | | .57% |
| Software and Computer Services Portfolio | | 30% | | .27% | | .57% |
| Technology Portfolio | | 30% | | .27% | | .57% |
4. Fees and Other Transactions with Affiliates - continued
Sales Load. Fidelity Distributors Corporation (FDC), an affiliate of FMR, is the general distributor of the funds. Shares purchased prior to October 12, 1990, were subject to a 1% deferred sales charge upon redemption or exchange to any other Fidelity fund (other than Select funds). Effective July 1, 2005, the deferred sales charge was eliminated. For the period, sales charge amounts retained by FDC were as follows:
| | | Retained |
| | | by FDC |
| Business Services and Outsourcing Portfolio | | $ | | 369 |
| Computers Portfolio | | | | 1,300 |
| Developing Communications Portfolio | | | | 1,333 |
| Electronics Portfolio | | | | 3,714 |
| Networking and Infrastructure Portfolio | | | | 40 |
| Software and Computer Services Portfolio | | | | 2,221 |
| Technology Portfolio | | | | 15,463 |
Transfer Agent Fees. Fidelity Service Company, Inc. (FSC), an affiliate of FMR, is the funds’ transfer, dividend disbursing and shareholder servicing agent. FSC receives account fees and asset-based fees that vary according to account size and type of account. FSC pays for typesetting, printing and mailing of shareholder reports, except proxy statements. For the period, the transfer agent fees were equivalent to the following annual rates expressed as a percentage of average net assets:
| Business Services and Outsourcing Portfolio | | 39% |
| Computers Portfolio | | 40% |
| Developing Communications Portfolio | | 42% |
| Electronics Portfolio | | 31% |
| Networking and Infrastructure Portfolio | | 43% |
| Software and Computer Services Portfolio | | 32% |
| Technology Portfolio | | 37% |
Accounting and Security Lending Fees. FSC maintains each fund’s accounting records. The accounting fee is based on the level of average net assets for the month. Under a separate contract, FSC administers the security lending program. The security lending fee is based on the number and duration of lending transactions.
Affiliated Central Funds. Certain funds may invest in Money Market Central Funds which seek preservation of capital and current income and are managed by Fidelity Investments Money Management, Inc. (FIMM) an affiliate of FMR.
The Money Market Central Funds do not pay a management fee.
|
Exchange Fees. FSC receives the proceeds of $7.50 to cover administrative costs associated with exchanges out of the funds to any other Fidelity Select fund or to any other Fidelity fund. For the period, exchange fees retained by FSC were as follows:
| | | Retained |
| | | by FSC |
| Business Services and Outsourcing Portfolio | | $ | | 720 |
| Computers Portfolio | | | | 17,625 |
| Developing Communications Portfolio | | | | 18,383 |
| Electronics Portfolio | | | | 46,440 |
| Networking and Infrastructure Portfolio | | | | 3,038 |
| Software and Computer Services Portfolio | | | | 13,845 |
| Technology Portfolio | | | | 38,273 |
Brokerage Commissions. Certain funds placed a portion of their portfolio transactions with brokerage firms which are affiliates of the investment adviser. The commissions paid to these affiliated firms were as follows:
| | | Amount |
| Business Services and Outsourcing Portfolio | | $ 4,369 |
| Computers Portfolio | | 32,900 |
| Developing Communications Portfolio | | 98,416 |
| Electronics Portfolio | | 117,401 |
| Networking and Infrastructure Portfolio | | 31,045 |
| Software and Computer Services Portfolio | | 87,980 |
| Technology Portfolio | | 181,172 |
85 Annual Report
Notes to Financial Statements - continued
4. Fees and Other Transactions with Affiliates - continued
Interfund Lending Program. Pursuant to an Exemptive Order issued by the SEC, the funds, along with other registered investment companies having management contracts with FMR, may participate in an interfund lending program. This program provides an alternative credit facility allowing the funds to borrow from, or lend money to, other participating affiliated funds. At period end, there were no interfund loans outstanding. Each applicable fund’s activity in this program during the period for which loans were outstanding was as follows:
| | | Borrower or | | Average Daily | | Weighted Average | | Interest |
| | | Lender | | Loan Balance | | Interest Rate | | Expense |
| Computers Portfolio | | Borrower | | $ 3,663,500 | | 3.37% | | $ 687 |
| Developing Communications Portfolio | | Borrower | | 1,471,250 | | 3.88% | | 633 |
| Technology Portfolio | | Borrower | | 4,440,667 | | 3.43% | | 1,268 |
| |
| 5. Committed Line of Credit. | | | | | | | | |
Certain funds participate with other funds managed by FMR in a $4.2 billion credit facility (the “line of credit”) to be utilized for temporary or emergency purposes to fund shareholder redemptions or for other short-term liquidity purposes. The participating funds have agreed to pay commitment fees on their pro rata portion of the line of credit. During the period, there were no borrowings on this line of credit.
Certain funds lend portfolio securities from time to time in order to earn additional income. On the settlement date of the loan, each applicable fund receives collateral (in the form of U.S. Treasury obligations, letters of credit and/or cash) against the loaned securities and maintains collateral in an amount not less than 100% of the market value of the loaned securities during the period of the loan. The market value of the loaned securities is determined at the close of business of the funds and any additional required collateral is delivered to the funds on the next business day. If the borrower defaults on its obligation to return the securities loaned because of insolvency or other reasons, a fund could experience delays and costs in recovering the securities loaned or in gaining access to the collateral. Any cash collateral received is invested in the Fidelity Securities Lending Cash Central Fund. The value of loaned securities and cash collateral at period end are disclosed on each applicable fund’s Statement of Assets and Liabilities. Security lending income represents the income earned on investing cash collateral, less fees and expenses associated with the loan, plus any premium payments that may be received on the loan of certain types of securities. Security lending income is presented on each applicable fund’s Statement of Operations as a component of income from affiliated central funds.
Each fund is permitted to have bank borrowings for temporary or emergency purposes to fund shareholder redemptions. Each fund has established borrowing arrangements with certain banks. The interest rate on the borrowings is the bank’s base rate, as revised from time to time. At period end, there were no bank borrowings outstanding. Each applicable fund’s activity in this program during the period for which loans were outstanding was as follows:
| | | Average Daily | | Weighted Average |
| | | Loan Balance | | Interest Rate |
| Developing Communications Portfolio | | $ 6,101,000 | | 3.50% |
| |
| 8. Expense Reductions. | | | | |
Many of the brokers with whom FMR places trades on behalf of certain funds provided services to these funds in addition to trade execution. These services included payments of expenses on behalf of each applicable fund. In addition, through arrangements with each applicable fund’s custodian and transfer agent, credits realized as a result of uninvested cash balances were used to reduce each applicable fund’s expenses. All of the applicable expense reductions are noted in the table below.
| | | | | | | Custody | | | | Transfer Agent |
| | | Brokerage Service | | | | expense | | | | expense |
| | | Arrangements | | | | reduction | | | | reduction |
| |
| Business Services and Outsourcing Portfolio | | $ 13,757 | | $ | | — | | $ | | — |
| Computers Portfolio | | 326,440 | | | | — | | | | 4,993 |
| Developing Communications Portfolio | | 548,073 | | | | — | | | | 3,745 |
| Electronics Portfolio | | 1,738,214 | | | | 1,609 | | | | 27,542 |
| Networking and Infrastructure Portfolio | | 121,765 | | | | — | | | | 989 |
| Software and Computer Services Portfolio | | 279,784 | | | | 1,327 | | | | 5,224 |
| Technology Portfolio | | 1,135,632 | | | | 127 | | | | 25,723 |
The funds’ organizational documents provide former and current trustees and officers with a limited indemnification against liabilities arising in connection with the performance of their duties to the funds. In the normal course of business, the funds may also enter into contracts that provide general indemnifications. The funds’ maximum exposure under these arrangements is unknown as this would be dependent on future claims that may be made against the funds. The risk of material loss from such claims is considered remote.
87 Annual Report
Report of Independent Registered Public Accounting Firm
To the Trustees of Fidelity Select Portfolios and the Shareholders of Business Services and Outsourcing Portfolio, Computers Portfolio, Developing Communications Portfolio, Electronics Portfolio, Networking and Infrastructure Portfolio, Software and Computer Services Portfolio, and Technology Portfolio:
In our opinion, the accompanying statements of assets and liabilities, including the schedules of investments, and the related statements of operations and of changes in net assets and the financial highlights present fairly, in all material respects, the financial position of Business Services and Out-sourcing Portfolio, Computers Portfolio, Developing Communications Portfolio, Electronics Portfolio, Networking and Infrastructure Portfolio, Software and Computer Services Portfolio, and Technology Portfolio (funds of Fidelity Select Portfolios) at February 28, 2006, and the results of each of their operations, the changes in each of their net assets and the financial highlights for each of the periods indicated, in conformity with accounting principles generally accepted in the United States of America. These financial statements and financial highlights (hereafter referred to as “financial statements”) are the responsibility of the Fidelity Select Portfolios’ management; our responsibility is to express an opinion on these financial statements based on our audits. We conducted our audits of these financial statements in accordance with the standards of the Public Company Accounting Oversight Board (United States). Those standards require that we plan and perform the audit to obtain reasonable assurance about whether the financial statements are free of material misstatement. An audit includes examining, on a test basis, evidence supporting the amounts and disclosures in the financial statements, assessing the accounting principles used and significant estimates made by management, and evaluating the overall financial statement presentation. We believe that our audits, which included confirmation of securities at February 28, 2006 by correspondence with the custodian and brokers, provide a reasonable basis for our opinion.
/s/ PricewaterhouseCoopers LLP
PricewaterhouseCoopers LLP
Boston, Massachusetts
April 17, 2006
|
Trustees and Officers
The Trustees, Members of the Advisory Board, and executive officers of the trust and funds, as applicable, are listed below. The Board of Trustees governs each fund and is responsible for protecting the interests of shareholders. The Trustees are experienced executives who meet periodically throughout the year to oversee each fund’s activities, review contractual arrangements with companies that provide services to each fund, and review each fund’s performance. Except for William O. McCoy, each of the Trustees oversees 326 funds advised by FMR or an affiliate. Mr. McCoy oversees 328 funds advised by FMR or an affiliate.
The Trustees hold office without limit in time except that (a) any Trustee may resign; (b) any Trustee may be removed by written instrument, signed by at least two-thirds of the number of Trustees prior to such removal; (c) any Trustee who requests to be retired or who has become incapacitated by illness or injury may be retired by written instrument signed by a majority of the other Trustees; and (d) any Trustee may be removed at any special meeting of shareholders by a two-thirds vote of the outstanding voting securities of the trust. Each Trustee who is not an interested person (as defined in the 1940 Act) (Independent Trustee), shall retire not later than the last day of the calendar year in which his or her 72nd birthday occurs. The Independent Trustees may waive this mandatory retirement age policy with respect to individual Trustees. The executive officers and Advisory Board Members hold office without limit in time, except that any officer and Advisory Board Member may resign or may be removed by a vote of a majority of the Trustees at any regular meeting or any special meeting of the Trustees. Except as indicated, each individual has held the office shown or other offices in the same company for the past five years.
The funds’ Statement of Additional Information (SAI) includes more information about the Trustees. To request a free copy, call Fidelity at 1-800-544-8544.
Interested Trustees*:
Correspondence intended for each Trustee who is an interested person may be sent to Fidelity Investments, 82 Devonshire Street, Boston, Massachusetts 02109.
| Name, Age; Principal Occupation |
| |
| Edward C. Johnson 3d (75) |
| |
| Year of Election or Appointment: 1980 |
| Mr. Johnson is Chairman of the Board of Trustees. Mr. Johnson serves as Chief Executive Officer, Chairman, and a Director of FMR |
| Corp.; a Director and Chairman of the Board and of the Executive Committee of FMR; Chairman and a Director of Fidelity Re- |
| search & Analysis Company; Chairman and a Director of Fidelity Investments Money Management, Inc.; and Chairman |
| (2001-present) and a Director (2000-present) of FMR Co., Inc. |
| |
| Stephen P. Jonas (53) |
| |
| Year of Election or Appointment: 2005 |
| Mr. Jonas is Senior Vice President of Business Services and Outsourcing (2005-present), Computers (2005-present), Developing |
| Communications (2005-present), Electronics (2005-present), Networking and Infrastructure (2005-present), Software and |
| Computer Services (2005-present), and Technology (2005-present). He also serves as Senior Vice President of other Fidelity funds |
| (2005-present). Mr. Jonas is Executive Director of FMR (2005-present). Previously, Mr. Jonas served as President of Fidelity Enter- |
| prise Operations and Risk Services (2004-2005), Chief Administrative Officer (2002-2004), and Chief Financial Officer of FMR |
| Co. (1998-2000). Mr. Jonas has been with Fidelity Investments since 1987 and has held various financial and management posi- |
| tions including Chief Financial Officer of FMR. In addition, he serves on the Boards of Boston Ballet (2003-present) and Simmons |
| College (2003-present). |
| |
| Robert L. Reynolds (53) |
| |
| Year of Election or Appointment: 2003 |
| Mr. Reynolds is a Director (2003-present) and Chief Operating Officer (2002-present) of FMR Corp. He also serves on the Board |
| at Fidelity Investments Canada, Ltd. (2000-present). Previously, Mr. Reynolds served as President of Fidelity Investments Institutional |
| Retirement Group (1996-2000). |
* Trustees have been determined to be “Interested Trustees” by virtue of, among other things, their affiliation with the trust or various entities under common control with FMR.
89 Annual Report
Trustees and Officers - continued
Independent Trustees:
Correspondence intended for each Independent Trustee (that is, the Trustees other than the Interested Trustees) may be sent to Fidelity Investments, P.O. Box 55235, Boston, Massachusetts 02205-5235.
| Name, Age; Principal Occupation |
| |
| Dennis J. Dirks (57) |
| |
| Year of Election or Appointment: 2005 |
| Prior to his retirement in May 2003, Mr. Dirks was Chief Operating Officer and a member of the Board of The Depository Trust & |
| Clearing Corporation (DTCC) (1999-2003). He also served as President, Chief Operating Officer, and Board member of The De- |
| pository Trust Company (DTC) (1999-2003) and President and Board member of the National Securities Clearing Corporation |
| (NSCC) (1999-2003). In addition, Mr. Dirks served as Chief Executive Officer and Board member of the Government Securities |
| Clearing Corporation (2001-2003) and Chief Executive Officer and Board member of the Mortgage-Backed Securities Clearing |
| Corporation (2001-2003). Mr. Dirks also serves as a Trustee and a member of the Finance Committee of Manhattan College |
| (2005-present) and a Trustee and a member of the Finance Committee of AHRC of Nassau County (2006-present). |
| |
| Robert M. Gates (62) |
| |
| Year of Election or Appointment: 1997 |
| Dr. Gates is Chairman of the Independent Trustees (2006-present). Dr. Gates is President of Texas A&M University (2002-present). |
| He was Director of the Central Intelligence Agency (CIA) from 1991 to 1993. From 1989 to 1991, Dr. Gates served as Assistant |
| to the President of the United States and Deputy National Security Advisor. Dr. Gates is a Director of NACCO Industries, Inc. |
| (mining and manufacturing), Parker Drilling Co., Inc. (drilling and rental tools for the energy industry, 2001-present), and Brinker |
| International (restaurant management, 2003-present). Previously, Dr. Gates served as a Director of LucasVarity PLC (automotive |
| components and diesel engines), a Director of TRW Inc. (automotive, space, defense, and information technology), and Dean of |
| the George Bush School of Government and Public Service at Texas A&M University (1999-2001). |
| |
| George H. Heilmeier (69) |
| |
| Year of Election or Appointment: 2004 |
| Dr. Heilmeier is Chairman Emeritus of Telcordia Technologies (communication software and systems), where prior to his retirement, |
| he served as company Chairman and Chief Executive Officer. He currently serves on the Boards of Directors of The Mitre Corpo- |
| ration (systems engineering and information technology support for the government), and HRL Laboratories (private research and |
| development, 2004-present). He is Chairman of the General Motors Science & Technology Advisory Board and a Life Fellow of |
| the Institute of Electrical and Electronics Engineers (IEEE). Dr. Heilmeier is a member of the Defense Science Board and the National |
| Security Agency Advisory Board. He is also a member of the National Academy of Engineering, the American Academy of Arts |
| and Sciences, and the Board of Overseers of the School of Engineering and Applied Science of the University of Pennsylvania. |
| Previously, Dr. Heilmeier served as a Director of TRW Inc. (automotive, space, defense, and information technology, 1992-2002), |
| Compaq (1994-2002), Automatic Data Processing, Inc. (ADP) (technology-based business outsourcing, 1995-2002), INET |
| Technologies Inc. (telecommunications network surveillance, 2001-2004), and Teletech Holdings (customer management services). |
| He is the recipient of the 2005 Kyoto Prize in Advanced Technology for his invention of the liquid crystal display. |
| |
| Marie L. Knowles (59) |
| |
| Year of Election or Appointment: 2001 |
| Prior to Ms. Knowles’ retirement in June 2000, she served as Executive Vice President and Chief Financial Officer of Atlantic Rich- |
| field Company (ARCO) (diversified energy, 1996-2000). From 1993 to 1996, she was a Senior Vice President of ARCO and |
| President of ARCO Transportation Company. She served as a Director of ARCO from 1996 to 1998. She currently serves as a |
| Director of Phelps Dodge Corporation (copper mining and manufacturing) and McKesson Corporation (healthcare service, |
| 2002-present). Ms. Knowles is a Trustee of the Brookings Institution and the Catalina Island Conservancy and also serves as a |
| member of the Advisory Board for the School of Engineering of the University of Southern California. |
| |
| Ned C. Lautenbach (62) |
| |
| Year of Election or Appointment: 2000 |
| Mr. Lautenbach has been a partner of Clayton, Dubilier & Rice, Inc. (private equity investment firm) since September 1998. Pre- |
| viously, Mr. Lautenbach was with the International Business Machines Corporation (IBM) from 1968 until his retirement in 1998. |
| Mr. Lautenbach serves as a Director of Italtel Holding S.p.A. (telecommunications (Milan, Italy), 2004-present) and Eaton Corpora- |
| tion (diversified industrial) as well as the Philharmonic Center for the Arts in Naples, Florida. He also is a member of the Board of |
| Trustees of Fairfield University (2005-present), as well as a member of the Council on Foreign Relations. |
Annual Report 90
| Name, Age; Principal Occupation |
| |
| William O. McCoy (72) |
| |
| Year of Election or Appointment: 1997 |
| Prior to his retirement in December 1994, Mr. McCoy was Vice Chairman of the Board of BellSouth Corporation (telecommunica- |
| tions) and President of BellSouth Enterprises. He is currently a Director of Duke Realty Corporation (real estate), and Progress |
| Energy, Inc. (electric utility). He is also a partner of Franklin Street Partners (private investment management firm) and a member of |
| the Research Triangle Foundation Board. In addition, Mr. McCoy served as the Interim Chancellor (1999-2000) and a member of |
| the Board of Visitors for the University of North Carolina at Chapel Hill and currently serves as Chairman of the Board of Directors |
| of the University of North Carolina Health Care System and the Board of Visitors of the Kenan-Flagler Business School (University |
| of North Carolina at Chapel Hill). He also served as Vice President of Finance for the University of North Carolina (16-school |
| system). |
| |
| Cornelia M. Small (61) |
| |
| Year of Election or Appointment: 2005 |
| Ms. Small is a member (2000-present) and Chairperson (2002-present) of the Investment Committee, and a member |
| (2002-present) of the Board of Trustees of Smith College. Previously, she served as Chief Investment Officer (1999-2000), Director |
| of Global Equity Investments (1996-1999), and a member of the Board of Directors of Scudder, Stevens & Clark (1990-1997) and |
| Scudder Kemper Investments (1997-1999). In addition, Ms. Small served as Co-Chair (2000-2003) of the Annual Fund for the |
| Fletcher School of Law and Diplomacy. |
| |
| William S. Stavropoulos (66) |
| |
| Year of Election or Appointment: 2001 |
| Mr. Stavropoulos is Chairman of the Board (2000-present) and a Member of the Board of Directors of The Dow Chemical |
| Company. Since joining The Dow Chemical Company in 1967, Mr. Stavropoulos served in numerous senior management posi- |
| tions, including President (1993-2000; 2002-2003), CEO (1995-2000; 2002-2004), and Chairman of the Executive Committee |
| (2000-2004). Currently, he is a Director of NCR Corporation (data warehousing and technology solutions), BellSouth Corporation |
| (telecommunications), Chemical Financial Corporation, Maersk Inc. (industrial conglomerate, 2002-present), and Metalmark Capi- |
| tal (private equity investment firm, 2005-present). He also serves as a member of the Board of Trustees of the American Enterprise |
| Institute for Public Policy Research. In addition, Mr. Stavropoulos is a member of The Business Council, J.P. Morgan International |
| Council and the University of Notre Dame Advisory Council for the College of Science. |
| |
| Kenneth L. Wolfe (67) |
| |
| Year of Election or Appointment: 2005 |
| Prior to his retirement in 2001, Mr. Wolfe was Chairman and Chief Executive Officer of Hershey Foods Corporation (1993-2001). |
| He currently serves as a member of the boards of Adelphia Communications Corporation (2003-present), Bausch & Lomb, Inc., |
| and Revlon Inc. (2004-present). |
Advisory Board Members and Executive Officers:
Correspondence intended for Messrs. Keyes and Gamper may be sent to Fidelity Investments, P.O. Box 55235, Boston, Massachusetts 02205-5235. Correspondence intended for each executive officer and Mr. Lynch may be sent to Fidelity Investments, 82 Devonshire Street, Boston, Massachusetts 02109.
| Name, Age; Principal Occupation |
| |
| Albert R. Gamper, Jr. (63) |
| |
| Year of Election or Appointment: 2005 |
| Member of the Advisory Board of Fidelity Select Portfolios. Mr. Gamper also serves as a Trustee (2006-present) or Member of the |
| Advisory Board (2005-present) of other investment companies advised by FMR. Prior to his retirement in December 2004, Mr. |
| Gamper served as Chairman of the Board of CIT Group Inc. (commercial finance). During his tenure with CIT Group Inc. Mr. |
| Gamper served in numerous senior management positions, including Chairman (1987-1989; 1999-2001; 2002-2004), Chief |
| Executive Officer (1987-2004), and President (1989-2002). He currently serves as a member of the Board of Directors of Public |
| Service Enterprise Group (utilities, 2001-present), Chairman of the Board of Governors, Rutgers University (2004-present), and |
| Chairman of the Board of Saint Barnabas Health Care System. |
| |
| James H. Keyes (65) |
| |
| Year of Election or Appointment: 2006 |
| Member of the Advisory Board of Fidelity Select Portfolios. Prior to his retirement in 2003, Mr. Keyes was Chairman, President, |
| and Chief Executive Officer of Johnson Controls, Inc. (automotive supplier, 1993-2003). He currently serves as a member of the |
| boards of LSI Logic Corporation (semiconductor technologies, 1984-present), Navistar International Corporation (manufacture and |
| sale of trucks, buses, and diesel engines, 2002-present), and Pitney Bowes, Inc. (integrated mail, messaging, and document man- |
| agement solutions, 1998-present). |
91 Annual Report
Trustees and Officers - continued
| Name, Age; Principal Occupation |
| |
| Peter S. Lynch (62) |
| |
| Year of Election or Appointment: 2003 |
| Member of the Advisory Board of Fidelity Select Portfolios. Vice Chairman and a Director of FMR, and Vice Chairman |
| (2001-present) and a Director (2000-present) of FMR Co., Inc. Previously, Mr. Lynch served as a Trustee of the Fidelity funds |
| (1990-2003). In addition, he serves as a Trustee of Boston College, Massachusetts Eye & Ear Infirmary, Historic Deerfield, John F. |
| Kennedy Library, and the Museum of Fine Arts of Boston. |
| |
| Eric D. Roiter (57) |
| |
| Year of Election or Appointment: 1998 |
| Secretary of Business Services and Outsourcing, Computers, Developing Communications, Electronics, Networking and Infrastruc- |
| ture, Software and Computer Services, and Technology. He also serves as Secretary of other Fidelity funds; Vice President, General |
| Counsel, and Secretary of FMR Co., Inc. (2001-present) and FMR; Assistant Secretary of Fidelity Management & Research (U.K.) |
| Inc. (2001-present), Fidelity Research & Analysis Company (2001-present), and Fidelity Investments Money Management, Inc. |
| (2001-present). Mr. Roiter is an Adjunct Member, Faculty of Law, at Boston College Law School (2003-present). Previously, Mr. |
| Roiter served as Vice President and Secretary of Fidelity Distributors Corporation (FDC) (1998-2005). |
| |
| Stuart Fross (46) |
| |
| Year of Election or Appointment: 2003 |
| Assistant Secretary of Business Services and Outsourcing, Computers, Developing Communications, Electronics, Networking and |
| Infrastructure, Software and Computer Services, and Technology. Mr. Fross also serves as Assistant Secretary of other Fidelity funds |
| (2003-present), Vice President and Secretary of FDC (2005-present), and is an employee of FMR. |
| |
| Christine Reynolds (47) |
| |
| Year of Election or Appointment: 2004 |
| President and Treasurer of Business Services and Outsourcing, Computers, Developing Communications, Electronics, Networking |
| and Infrastructure, Software and Computer Services, and Technology. Ms. Reynolds also serves as President and Treasurer of other |
| Fidelity funds (2004-present) and is a Vice President (2003-present) and an employee (2002-present) of FMR. Before joining |
| Fidelity Investments, Ms. Reynolds worked at PricewaterhouseCoopers LLP (PwC) (1980-2002), where she was most recently an |
| audit partner with PwC’s investment management practice. |
| |
| R. Stephen Ganis (39) |
| |
| Year of Election or Appointment: 2006 |
| Anti-Money Laundering (AML) officer of Business Services and Outsourcing, Computers, Developing Communications, Electronics, |
| Networking and Infrastructure, Software and Computer Services, and Technology. Mr. Ganis also serves as AML officer of other |
| Fidelity funds (2006-present) and FMR Corp. (2003-present). Before joining Fidelity Investments, Mr. Ganis practiced law at Good- |
| win Procter, LLP (2000-2002). |
| |
| Paul M. Murphy (58) |
| |
| Year of Election or Appointment: 2005 |
| Chief Financial Officer of Business Services and Outsourcing, Computers, Developing Communications, Electronics, Networking |
| and Infrastructure, Software and Computer Services, and Technology. Mr. Murphy also serves as Chief Financial Officer of other |
| Fidelity funds (2005-present). He also serves as Senior Vice President of Fidelity Pricing and Cash Management Services Group |
| (FPCMS). |
| |
| Kenneth A. Rathgeber (58) |
| |
| Year of Election or Appointment: 2004 |
| Chief Compliance Officer of Business Services and Outsourcing, Computers, Developing Communications, Electronics, Networking |
| and Infrastructure, Software and Computer Services, and Technology. Mr. Rathgeber also serves as Chief Compliance Officer of |
| other Fidelity funds (2004-present) and Executive Vice President of Risk Oversight for Fidelity Investments (2002-present). He is |
| Chief Compliance Officer of FMR (2005-present), FMR Co., Inc. (2005-present), Fidelity Management & Research (U.K.) Inc. |
| (2005-present), Fidelity Research & Analysis Company (2005-present), Fidelity Investments Money Management, Inc. |
| (2005-present), and Strategic Advisers, Inc. (2005-present). Previously, Mr. Rathgeber served as Executive Vice President and |
| Chief Operating Officer for Fidelity Investments Institutional Services Company, Inc. (1998-2002). |
| |
| Bryan A. Mehrmann (44) |
| |
| Year of Election or Appointment: 2005 |
| Deputy Treasurer of Business Services and Outsourcing, Computers, Developing Communications, Electronics, Networking and |
| Infrastructure, Software and Computer Services, and Technology. Mr. Mehrmann also serves as Deputy Treasurer of other Fidelity |
| funds (2005-present) and is an employee of FMR. Previously, Mr. Mehrmann served as Vice President of Fidelity Investments Institu- |
| tional Services Group (FIIS)/Fidelity Investments Institutional Operations Corporation, Inc. (FIIOC) Client Services (1998-2004). |
Annual Report 92
| Name, Age; Principal Occupation |
| |
| Kimberley H. Monasterio (42) |
| |
| Year of Election or Appointment: 2004 |
| Deputy Treasurer of Business Services and Outsourcing, Computers, Developing Communications, Electronics, Networking and |
| Infrastructure, Software and Computer Services, and Technology. Ms. Monasterio also serves as Deputy Treasurer of other Fidelity |
| funds (2004) and is an employee of FMR (2004). Before joining Fidelity Investments, Ms. Monasterio served as Treasurer |
| (2000-2004) and Chief Financial Officer (2002-2004) of the Franklin Templeton Funds and Senior Vice President of Franklin Tem- |
| pleton Services, LLC (2000-2004). |
| |
| Kenneth B. Robins (36) |
| |
| Year of Election or Appointment: 2005 |
| Deputy Treasurer of Business Services and Outsourcing, Computers, Developing Communications, Electronics, Networking and |
| Infrastructure, Software and Computer Services, and Technology. Mr. Robins also serves as Deputy Treasurer of other Fidelity funds |
| (2005-present) and is an employee of FMR (2004-present). Before joining Fidelity Investments, Mr. Robins worked at KPMG LLP, |
| where he was a partner in KPMG’s department of professional practice (2002-2004) and a Senior Manager (1999-2000). In |
| addition, Mr. Robins served as Assistant Chief Accountant, United States Securities and Exchange Commission (2000-2002). |
| |
| Robert G. Byrnes (39) |
| |
| Year of Election or Appointment: 2005 |
| Assistant Treasurer of Business Services and Outsourcing, Computers, Developing Communications, Electronics, Networking and |
| Infrastructure, Software and Computer Services, and Technology. Mr. Byrnes also serves as Assistant Treasurer of other Fidelity |
| funds (2005-present) and is an employee of FMR (2005-present). Previously, Mr. Byrnes served as Vice President of FPCMS |
| (2003-2005). Before joining Fidelity Investments, Mr. Byrnes worked at Deutsche Asset Management where he served as Vice |
| President of the Investment Operations Group (2000-2003). |
| |
| John H. Costello (59) |
| |
| Year of Election or Appointment: 1986 |
| Assistant Treasurer of Business Services and Outsourcing, Computers, Developing Communications, Electronics, Networking and |
| Infrastructure, Software and Computer Services, and Technology. Mr. Costello also serves as Assistant Treasurer of other Fidelity |
| funds and is an employee of FMR. |
| |
| Peter L. Lydecker (52) |
| |
| Year of Election or Appointment: 2004 |
| Assistant Treasurer of Business Services and Outsourcing, Computers, Developing Communications, Electronics, Networking and |
| Infrastructure, Software and Computer Services, and Technology. Mr. Lydecker also serves as Assistant Treasurer of other Fidelity |
| funds (2004) and is an employee of FMR. |
| |
| Mark Osterheld (50) |
| |
| Year of Election or Appointment: 2002 |
| Assistant Treasurer of Business Services and Outsourcing, Computers, Developing Communications, Electronics, Networking and |
| Infrastructure, Software and Computer Services, and Technology. Mr. Osterheld also serves as Assistant Treasurer of other Fidelity |
| funds (2002) and is an employee of FMR. |
| |
| Gary W. Ryan (47) |
| |
| Year of Election or Appointment: 2005 |
| Assistant Treasurer of Business Services and Outsourcing, Computers, Developing Communications, Electronics, Networking and |
| Infrastructure, Software and Computer Services, and Technology. Mr. Ryan also serves as Assistant Treasurer of other Fidelity funds |
| (2005-present) and is an employee of FMR (2005-present). Previously, Mr. Ryan served as Vice President of Fund Reporting in |
| FPCMS (1999-2005). |
| |
| Salvatore Schiavone (40) |
| |
| Year of Election or Appointment: 2005 |
| Assistant Treasurer of Business Services and Outsourcing, Computers, Developing Communications, Electronics, Networking and |
| Infrastructure, Software and Computer Services, and Technology. Mr. Schiavone also serves as Assistant Treasurer of other Fidelity |
| funds (2005-present) and is an employee of FMR (2005-present). Before joining Fidelity Investments, Mr. Schiavone worked at |
| Deutsche Asset Management, where he most recently served as Assistant Treasurer (2003-2005) of the Scudder Funds and Vice |
| President and Head of Fund Reporting (1996-2003). |
93 Annual Report
The Board of Trustees of each fund voted to pay to shareholders of record at the opening of business on record date, the following distributions per share derived from capital gains realized from sales of portfolio securities, and dividends derived from net investment income:
| | | Pay Date | | Record Date | | Dividends | | Capital Gains |
| Business Services and Outsourcing | | 4/17/06 | | 4/13/06 | | $— | | $.69 |
The funds hereby designate as capital gain dividends the amounts noted below for the taxable year ended February 28, 2006, or, if subsequently determined to be different, the net capital gain of such year.
| | | February 28, 2006 |
| Business Services and Outsourcing | | $2,369,325 |
Board Approval of Investment Advisory Contracts and Management Fees
Select Business Services and Outsourcing
Select Computers
Select Developing Communications
Select Electronics
Select Networking and Infrastructure
Select Software and Computer Services
Select Technology
|
On January 19, 2006, the Board of Trustees, including the Independent Trustees (together, the Board), voted to approve a general research services agreement (the Agreement) between FMR, FMR Co., Inc. (FMRC), Fidelity Investments Money Management, Inc. (FIMM), and Fidelity Research & Analysis Company (FRAC) (together, the Investment Advisers) for each fund, effective January 20, 2006, pursuant to which FRAC may provide general research and investment advisory support services to FMRC and FIMM. The Board considered that it has approved previously various sub-advisory agreements for each fund with affiliates of FMR that allow FMR to obtain research, non-discretionary advice, or discretionary portfolio management at no additional expense to each fund. The Board, assisted by the advice of fund counsel and independent Trustees’ counsel, considered a broad range of information and determined that it would be beneficial for each fund to access the research and investment advisory support services supplied by FRAC at no additional expense to each fund.
The Board reached this determination in part because the new arrangement will involve no changes in (i) the contractual terms of and fees payable under each fund’s management contract or sub-advisory agreements; (ii) the investment process or strategies employed in the management of each fund’s assets; (iii) the nature or level of services provided under each fund’s management contract or sub-advisory agreements; (iv) the day-to-day management of each fund or the persons primarily responsible for such management; or (v) the ultimate control or beneficial ownership of FMR, FMRC, or FIMM. The Board also considered that the establishment of each Agreement would not necessitate prior shareholder approval of the Agreement or result in an assignment and termination of each fund’s management contract or sub-advisory agreements under the Investment Company Act of 1940.
Because the Board was approving an arrangement with FRAC under which each fund will not bear any additional management fees or expenses and under which each fund’s portfolio manager would not change, it did not consider each fund’s investment performance, competitiveness of management fee and total expenses, costs of services and profitability, or economies of scale to be significant factors in its decision.
In connection with its future renewal of each fund’s management contract and sub-advisory agreements, the Board will consider: (i) the nature, extent, and quality of services provided to each fund, including shareholder and administrative services and investment performance; (ii) the competitiveness of each fund’s management fee and total expenses; (iii) the costs of the services and profitability, including the revenues earned and the expenses incurred by Fidelity in conducting the business of developing, marketing, distributing, managing, administering, and servicing each fund and its shareholders; and (iv) whether there have been economies of scale in respect of the management of the Fidelity funds, whether the Fidelity funds (including each fund) have appropriately benefited from any such economies of scale, and whether there is potential for realization of any further economies.
Based on its evaluation of all of the conclusions noted above, and after considering all material factors, the Board ultimately concluded that each fund’s Agreement is fair and reasonable, and that each fund’s Agreement should be approved.
95 Annual Report
Managing Your Investments
Fidelity offers several ways to conveniently manage your personal investments via your telephone or PC. You can access your account information, conduct trades and research your investments 24 hours a day.
By Phone
Fidelity Automated Service Telephone provides a single toll-free number to access account balances, positions, quotes and trading. It’s easy to navigate the service, and on your first call, the system will help you create a personal identification number (PIN) for security.

By PC
Fidelity’s web site on the Internet provides a wide range of information, including daily financial news, fund performance, interactive planning tools and news about Fidelity products and services.

* When you call the quotes line, please remember that a fund’s yield and return will vary and, except for money market funds, share price will also vary. This means that you may have a gain or loss when you sell your shares. There is no assurance that money market funds will be able to maintain a stable $1 share price; an investment in a money market fund is not insured or guaranteed by the U.S. government. Total returns are historical and include changes in share price, reinvestment of dividends and capital gains, and the effects of any sales charges.
Annual Report 96
Investment Adviser
Fidelity Management & Research Company
Boston, MA
Investment Sub-Advisers
FMR Co., Inc.
Fidelity Management & Research (U.K.) Inc.
Fidelity Research & Analysis Company (formerly Fidelity Management & Research (Far East) Inc.)
Fidelity Investments Japan Limited
Fidelity International Investment Advisors
Fidelity International Investment Advisors (U.K. Limited)
General Distributor
Fidelity Distributors Corporation
Boston, MA
Transfer and Service Agent
Fidelity Service Company, Inc.
Boston, MA
Custodian
Brown Brothers Harriman & Co.
Boston, MA
Corporate Headquarters
82 Devonshire Street
Boston, MA 02109
1-800-544-8888
The Fidelity Telephone Connection
Mutual Fund 24-Hour Service
Exchanges/Redemptions
and Account Assistance 1-800-544-6666
Product Information 1-800-544-8888
Retirement Accounts 1-800-544-4774
(8 a.m. - 9 p.m.)
TDD Service 1-800-544-0118
for the deaf and hearing impaired
(9 a.m. - 9 p.m. Eastern time)
Fidelity Automated Service
Telephone (FAST®) (automated graphic)1-800-544-5555
| | (automated graphic) Automated line for quickest service
|

| SELTEC-UANN-0406 | | Corporate Headquarters |
| 1.813668.101 | | 82 Devonshire St., Boston, MA 02109 |
| | | www.fidelity.com |
Fidelity®
Select Portfolios®
Utilities Sector
Telecommunications
Utilities Growth
Wireless
Annual Report
February 28, 2006


| Contents | | |
| |
| Chairman’s Message | | 3 |
| Shareholder Expense Example | | 4 |
| Fund Updates* | | |
| Utilities Sector | | |
| Telecommunications | | 5 |
| Utilities Growth | | 13 |
| Wireless | | 22 |
| Notes to Financial Statements | | 31 |
| Report of Independent Registered | | 35 |
| Public Accounting Firm | | |
| Trustees and Officers | | 36 |
| Distributions | | 41 |
| Board Approval of Investment | | 42 |
| Advisory Contracts and | | |
| Management Fees | | |
* Fund updates for each Select Portfolio include: Performance, Management’s Discussion of Fund Performance, Investment Changes, Investments, and Financial Statements.
To view a fund’s proxy voting guidelines and proxy voting record for the 12-month period ended June 30, visit www.fidelity.com/proxyvotingresults or visit the Securities and Exchange Commission’s (SEC) web site at www.sec.gov. You may also call 1-800-544-8544 to request a free copy of the proxy voting guidelines.
Standard & Poor’s, S&P and S&P 500 are registered service marks of The McGraw-Hill Companies, Inc. and have been licensed for use by Fidelity Distributors Corporation.
Other third party marks appearing herein are the property of their respective owners.
All other marks appearing herein are registered or unregistered trademarks or service marks of FMR Corp. or an affiliated company.
This report and the financial statements contained herein are submitted for the general information of the shareholders of the funds. This report is not authorized for distribution to prospective investors in the funds unless preceded or accompanied by an effective prospectus.
A fund files its complete schedule of portfolio holdings with the SEC for the first and third quarters of each fiscal year on Form N-Q. Forms N-Q are available on the SEC’s web site at http://www.sec.gov. A fund’s Forms N-Q may be reviewed and copied at the SEC’s Public Reference Room in Washing-ton, DC. Information regarding the operation of the SEC’s Public Reference Room may be obtained by calling 1-800-SEC-0330. For a complete list of a fund’s portfolio holdings, view the most recent quarterly holdings report, semiannual report, or annual report on Fidelity’s web site at http://www.fidelity.com/holdings.
NOT FDIC INSURED · MAY LOSE VALUE · NO BANK GUARANTEE
Neither the funds nor Fidelity Distributors Corporation is a bank.
|
(Photograph of Edward C. Johnson 3d.)
Although many securities markets made gains in early 2006, there is only one certainty when it comes to investing: There is no sure thing. There are, however, a number of time-tested, fundamental investment principles that can put the historical odds in your favor.
One of the basic tenets is to invest for the long term. Over time, riding out the markets’ inevitable ups and downs has proven much more effective than selling into panic or chasing the hottest trend. Even missing only a few of the markets’ best days can significantly diminish investor returns. Patience also affords the benefits of compounding — of earning interest on additional income or reinvested dividends and capital gains. There are tax advantages and cost benefits to consider as well. The more you sell, the more taxes you pay, and the more you trade, the higher the costs. While staying the course doesn’t eliminate risk, it can considerably lessen the effect of short-term declines.
You can further manage your investing risk through diversification. And today, more than ever, geographic diversification should be taken into account. Studies
indicate that asset allocation is the single most important determinant of a portfolio’s long-term success. The right mix of stocks, bonds and cash — aligned to your particular risk tolerance and investment objective — is very important. Age-appropriate rebalancing is also an essential aspect of asset allocation. For younger investors, an emphasis on equities — which historically have been the best performing asset class over time — is encouraged. As investors near their specific goal, such as retirement or sending a child to college, consideration may be given to replacing volatile assets (e.g. common stocks) with more-stable fixed investments (bonds or savings plans).
A third investment principle — investing regularly — can help lower the average cost of your purchases. Investing a certain amount of money each month or quarter helps ensure you won’t pay for all your shares at market highs. This strategy — known as dollar cost averaging — also reduces unconstructive “emotion” from investing, helping shareholders avoid selling weak performers just prior to an upswing, or chasing a hot performer just before a correction.
We invite you to contact us via the Internet, through our Investor Centers or over the phone. It is our privilege to provide you the information you need to make the investments that are right for you.

3 Annual Report
Shareholder Expense Example
|
As a shareholder of a Fund, you incur two types of costs: (1) transaction costs, including redemption fees, exchange fees, and (2) ongoing costs, including management fees and other Fund expenses. This Example is intended to help you understand your ongoing costs (in dollars) of investing in the Funds and to compare these costs with the ongoing costs of investing in other mutual funds.
The Example is based on an investment of $1,000 invested at the beginning of the period and held for the entire period (September 1, 2005 to Febru-ary 28, 2006).
The first line of the table below for each fund provides information about actual account values and actual expenses. You may use the information in this line, together with the amount you invested, to estimate the expenses that you paid over the period. Simply divide your account value by $1,000.00 (for example, an $8,600 account value divided by $1,000.00 = 8.6), then multiply the result by the number in the first line for a fund under the heading entitled “Expenses Paid During Period” to estimate the expenses you paid on your account during this period. A small balance maintenance fee of $12.00 that is charged once a year may apply for certain accounts with a value of less than $2,000. This fee is not included in the table below. If it was, the estimate of expenses you paid during the period would be higher, and your ending account value lower, by this amount.
Hypothetical Example for Comparison Purposes
|
The second line of the table below for each fund provides information about hypothetical account values and hypothetical expenses based on a fund’s actual expense ratio and an assumed rate of return of 5% per year before expenses, which is not the Fund’s actual return. The hypothetical account values and expenses may not be used to estimate the actual ending account balance or expenses you paid for the period. You may use this information to compare the ongoing costs of investing in the Fund and other funds. To do so, compare this 5% hypothetical example with the 5% hypothetical examples that appear in the shareholder reports of the other funds. A small balance maintenance fee of $12.00 that is charged once a year may apply for certain accounts with a value of less than $2,000. This fee is not included in the table below. If it was, the estimate of expenses you paid during the period would be higher, and your ending account value lower, by this amount.
Please note that the expenses shown in the table are meant to highlight your ongoing costs only and do not reflect any transaction costs. Therefore, the second line of the table is useful in comparing ongoing costs only, and will not help you determine the relative total costs of owning different funds. In addition, if these transactional costs were included, your costs would have been higher.
| | | | | | | Expenses Paid |
| | | Beginning | | Ending | | During Period* |
| | | Account Value | | Account Value | | September 1, 2005 to |
| | | September 1, 2005 | | February 28, 2006 | | February 28, 2006 |
| Telecommunications Portfolio | | | | | | | | |
| Actual | | $ 1,000.00 | | $ 1,128.40 | | $ | | 5.44 |
| HypotheticalA | | $ 1,000.00 | | $ 1,019.69 | | $ | | 5.16 |
| Utilities Growth Portfolio | | | | | | | | |
| Actual | | $ 1,000.00 | | $ 1,072.10 | | $ | | 4.93 |
| HypotheticalA | | $ 1,000.00 | | $ 1,020.03 | | $ | | 4.81 |
| Wireless Portfolio | | | | | | | | |
| Actual | | $ 1,000.00 | | $ 1,081.10 | | $ | | 5.11 |
| HypotheticalA | | $ 1,000.00 | | $ 1,019.89 | | $ | | 4.96 |
A 5% return per year before expenses
* Expenses are equal to each Fund’s annualized expense ratio (shown in the table below); multiplied by the average account value over the period, multiplied by 181/365 (to reflect the one-half year period).
| | | Annualized |
| | | Expense Ratio |
| Telecommunications Portfolio | | 1.03% |
| Utilities Growth Portfolio | | 96% |
| Wireless Portfolio | | 99% |
Telecommunications Portfolio
Performance
|
Average annual total return reflects the change in the value of an investment, assuming reinvestment of the fund’s dividend income and capital gains (the profits earned upon the sale of securities that have grown in value) and assuming a constant rate of performance each year. The $10,000 table and the fund’s returns do not reflect the deduction of taxes that a shareholder would pay on fund distributions or the redemption of fund shares. During periods of reimbursement by Fidelity, a fund’s total returns will be greater than it would be had the reimbursement not occurred. How a fund did yesterday is no guarantee of how it will do tomorrow.
| Average Annual Total Returns | | | | | | |
| Periods ended February 28, 2006 | | Past 1 | | Past 5 | | Past 10 |
| | | year | | years | | years |
| Select Telecommunications | | 21.54% | | --1.28% | | 5.33% |
$10,000 Over 10 Years
Let’s say hypothetically that $10,000 was invested in Fidelity® Select Telecommunications Portfolio on February 29, 1996. The chart shows how the value of your investment would have changed, and also shows how the S&P 500® Index performed over the same period.
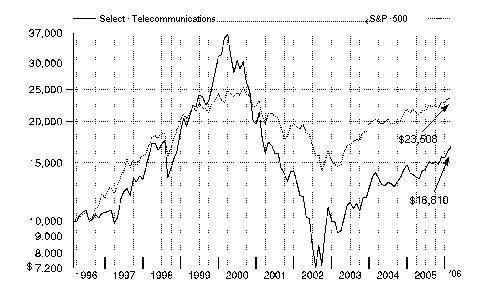
5 Annual Report
Telecommunications Portfolio
|
Management’s Discussion of Fund Performance
Comments from Brian Younger, Portfolio Manager of Fidelity® Select Telecommunications Portfolio
With the exception of several popular large-cap stock performance measures, most major U.S. equity benchmarks had double-digit returns for the year ending February 28, 2006. For much of the period, market gains were driven largely by the energy sector, although utilities ultimately sneaked into the top spot for the year overall. Financials and telecommunication services also reached double figures, outperforming the 8.40% return of the broader market as measured by the large-cap-oriented Standard & Poor’s 500SM Index. The consumer discretionary segment — home to the weak performing automobile and media industries — was the biggest disappointment. Although the overall return for the S&P 500® beat the small-cap Russell 2000® Index in calendar year 2005 — the first time that’s happened in six years — small-caps stormed back in early 2006, leading to a 16.59% advance during the past 12 months, nearly twice the broader market’s gain. Mid-caps soared even higher, returning 17.67% according to the Russell Midcap® Index. The technology-heavy NASDAQ Composite® Index also fared well, climbing 12.13%, but the Dow Jones Industrial AverageSM, an index of 30 large-cap, blue-chip stocks, managed to rise only 4.52% .
For the 12 months that ended February 28, 2006, the fund returned 21.54%, beating the S&P 500 and the 14.95% return for the Goldman Sachs® Utilities Index. Strong stock selection among integrated telecommunication services providers — companies that typically offer both wireline and wireless services — and wireless-only carriers helped the fund outpace the sector index. An overweighted position in communications equipment stocks — which I increased during the period — further aided returns. Stock picking in this area, however, could have been better. A lack of exposure to some strong performing groups outside of the fund’s focus — including electric utilities — also dampened returns a bit. Among the top individual contributors to relative performance were Qwest Communications International, an integrated telecom provider based in the western United States, and NII Holdings, a wireless carrier operating in Latin America. Both stocks, which were overweighted positions on average, benefited as the companies grew revenues and profits. I sold NII late in the period. Other standouts included Corning and Motorola, communications equipment companies that saw strong demand for their products. Among the stocks that detracted from relative returns were Great Britain’s Vodafone Group, a leading wireless provider worldwide, and Nortel Networks, which makes networking equipment. Vodafone suffered from weakness in some of its European markets, while Nortel Networks lost ground as accounting irregularities and management changes shook investor confidence.
The views expressed above reflect those of the portfolio manager(s) only through the end of the period as stated on the cover of this report and do not necessarily represent the views of Fidelity or any other person in the Fidelity organization. Any such views are subject to change at any time based upon market or other conditions and Fidelity disclaims any responsibility to update such views. These views may not be relied on as investment advice and, because investment decisions for a Fidelity fund are based on numerous factors, may not be relied on as an indication of trading intent on behalf of any Fidelity fund.
| Telecommunications Portfolio | | |
| Investment Changes | | |
| |
| |
| Top Ten Stocks as of February 28, 2006 |
| | | % of fund’s | | % of fund’s net assets |
| | | net assets | | 6 months ago |
| Qwest Communications | | | | |
| International, Inc. | | 12.1 | | 10.9 |
| AT&T, Inc. | | 11.2 | | 10.5 |
| Verizon Communications, Inc. | | 10.4 | | 9.0 |
| Sprint Nextel Corp. | | 7.8 | | 9.6 |
| QUALCOMM, Inc. | | 5.6 | | 2.7 |
| BellSouth Corp. | | 4.8 | | 4.7 |
| Nortel Networks Corp. | | 4.0 | | 2.3 |
| Cisco Systems, Inc. | | 3.9 | | 0.4 |
| Lucent Technologies, Inc. | | 3.4 | | 1.6 |
| Motorola, Inc. | | 3.2 | | 6.0 |
| | | 66.4 | | |
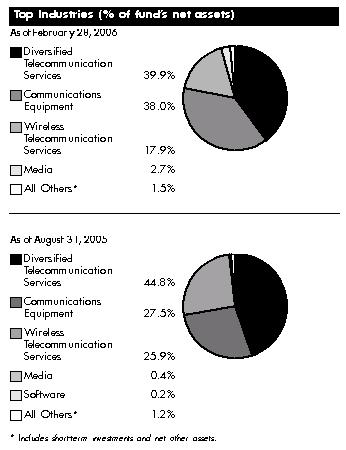
7 Annual Report
| Telecommunications Portfolio | | | | | | |
| Investments February 28, 2006 | | | | |
| Showing Percentage of Net Assets | | | | | | |
| |
| Common Stocks — 98.5% | | | | | | |
| | | | | Shares | | Value (Note 1) |
| |
| COMMUNICATIONS EQUIPMENT – 38.0% | | | | | | |
| Communications Equipment – 38.0% | | | | | | |
| ADC Telecommunications, Inc. (a) | | | | 342,600 | | $ 8,674,632 |
| Alcatel SA sponsored ADR (a)(d) | | | | 726,500 | | 9,807,750 |
| Andrew Corp. (a) | | | | 106,500 | | 1,444,140 |
| Cisco Systems, Inc. (a) | | | | 764,200 | | 15,467,408 |
| Comverse Technology, Inc. (a) | | | | 225,200 | | 6,476,752 |
| Corning, Inc. (a) | | | | 448,600 | | 10,950,326 |
| JDS Uniphase Corp. (a) | | | | 3,101,900 | | 9,429,776 |
| Juniper Networks, Inc. (a) | | | | 576,000 | | 10,592,640 |
| Lucent Technologies, Inc. (a) | | | | 4,850,000 | | 13,580,000 |
| Motorola, Inc. | | | | 603,200 | | 12,908,480 |
| Nortel Networks Corp. (a) | | | | 5,672,800 | | 16,224,208 |
| Powerwave Technologies, Inc. (a) | | | | 101,400 | | 1,488,552 |
| QUALCOMM, Inc. | | | | 473,100 | | 22,335,051 |
| Tekelec (a) | | | | 219,800 | | 2,947,518 |
| Tellabs, Inc. (a) | | | | 705,900 | | 10,369,671 |
| | | | | | | 152,696,904 |
| |
| DIVERSIFIED TELECOMMUNICATION SERVICES – 39.9% | | | | | | |
| Integrated Telecommunication Services – 39.9% | | | | | | |
| AT&T, Inc. | | | | 1,626,442 | | 44,873,535 |
| BellSouth Corp. | | | | 615,000 | | 19,421,700 |
| Cbeyond Communications, Inc. | | | | 191,600 | | 2,059,700 |
| Cincinnati Bell, Inc. (a) | | | | 600,000 | | 2,454,000 |
| Comstar United Telesystems GDR (a)(e) | | | | 75,000 | | 531,750 |
| Qwest Communications International, Inc. (a) | | | | 7,714,044 | | 48,752,758 |
| SureWest Communications | | | | 10,000 | | 252,800 |
| Telenor ASA sponsored ADR | | | | 11,000 | | 358,600 |
| Verizon Communications, Inc. | | | | 1,243,924 | | 41,920,239 |
| | | | | | | 160,625,082 |
| |
| MEDIA – 2.7% | | | | | | |
| Broadcasting & Cable TV – 2.7% | | | | | | |
| EchoStar Communications Corp. Class A (a) | | | | 100,000 | | 2,937,000 |
| The DIRECTV Group, Inc. (a) | | | | 500,000 | | 7,880,000 |
| | | | | | | 10,817,000 |
| |
| WIRELESS TELECOMMUNICATION SERVICES – 17.9% | | | | | | |
| Wireless Telecommunication Services – 17.9% | | | | | | |
| ALLTEL Corp. | | | | 151,300 | | 9,554,595 |
| American Tower Corp. Class A (a) | | | | 260,000 | | 8,275,800 |
| Bharti Televentures Ltd. (a) | | | | 1,816 | | 15,880 |
| |
| |
| | | | | Shares | | Value (Note 1) |
| Crown Castle International Corp. (a) | | | | 213,200 | | $ 6,683,820 |
| Dobson Communications Corp. Class A (a) | | | | 125,000 | | 905,000 |
| Investcom LLC GDR | | | | 185,000 | | 3,209,750 |
| Leap Wireless International, Inc. (a) | | | | 85,000 | | 3,579,350 |
| MTN Group Ltd. | | | | 140,000 | | 1,361,316 |
| Sprint Nextel Corp. | | | | 1,312,498 | | 31,539,327 |
| Syniverse Holdings, Inc. | | | | 21,700 | | 310,310 |
See accompanying notes which are an integral part of the financial statements.
Annual Report 8
| Vimpel Communications sponsored ADR (a) | | 65,000 | | 2,860,000 |
| Vodafone Group PLC sponsored ADR | | 200,000 | | 3,864,000 |
| | | | | 72,159,148 |
| TOTAL COMMON STOCKS | | | | |
| (Cost $358,667,503) | | | | 396,298,134 |
| Money Market Funds — 4.2% | | | | |
| Fidelity Cash Central Fund, 4.57% (b) | | 7,374,174 | | 7,374,174 |
| Fidelity Securities Lending Cash Central Fund, 4.58% (b)(c) | | 9,376,125 | | 9,376,125 |
| TOTAL MONEY MARKET FUNDS | | | | |
| (Cost $16,750,299) | | | | 16,750,299 |
| TOTAL INVESTMENT PORTFOLIO - 102.7% | | | | |
| (Cost $375,417,802) | | | | 413,048,433 |
| |
| NET OTHER ASSETS – (2.7)% | | | | (10,714,526) |
| NET ASSETS – 100% | | | | $402,333,907 |
(a) Non-income producing
(b) Affiliated fund that is available only to investment companies and other accounts managed by Fidelity Investments. The rate quoted is the annualized seven-day yield of the fund at period end. A complete unaudited listing of the fund’s holdings as of its most recent quarter end is available upon request.
(c) Investment made with cash collateral received from securities on loan. (d) Security or a portion of the security is on loan at period end.
(e) Security exempt from registration under Rule 144A of the Securities Act of 1933. These securities may be resold in transactions exempt from registration, normally to qualified institutional buyers. At the period end, the value of these securities amounted to $531,750 or 0.1% of net assets.
Information regarding fiscal year to date income earned by the fund from the affiliated Central funds is as follows:
| Fund | | Income earned |
| Fidelity Cash Central Fund | | $ 82,981 |
| Fidelity Securities Lending Cash Central Fund | | 116,790 |
| Total | | $ 199,771 |
At February 28, 2006, the fund had a capital loss carryforward of approximately $525,296,523 of which $351,665,365, $161,866,685 and $11,764,473 will expire on February 28, 2010, 2011 and February 29, 2012, respectively.
See accompanying notes which are an integral part of the financial statements.
|
9
| Telecommunications Portfolio | | | | | | | | |
| |
| Financial Statements | | | | | | | | |
| |
| |
| Statement of Assets and Liabilities | | | | | | | | |
| | | | | | | | | February 28, 2006 |
| |
| Assets | | | | | | | | |
| Investment in securities, at value (including securities loaned of $9,205,650) — See accompanying schedule: | | | | | | | | |
| Unaffiliated issuers (cost $358,667,503) | | $ | | 396,298,134 | | | | |
| Affiliated Central Funds (cost $16,750,299) | | | | 16,750,299 | | | | |
| Total Investments (cost $375,417,802) | | | | | | $ | | 413,048,433 |
| Cash | | | | | | | | 539,060 |
| Receivable for investments sold | | | | | | | | 968,905 |
| Receivable for fund shares sold | | | | | | | | 5,702,709 |
| Dividends receivable | | | | | | | | 93,705 |
| Interest receivable | | | | | | | | 18,809 |
| Prepaid expenses | | | | | | | | 1,426 |
| Other affiliated receivables | | | | | | | | 997 |
| Other receivables | | | | | | | | 384,042 |
| Total assets | | | | | | | | 420,758,086 |
| |
| Liabilities | | | | | | | | |
| Payable for investments purchased | | $ | | 8,062,363 | | | | |
| Payable for fund shares redeemed | | | | 659,918 | | | | |
| Accrued management fee | | | | 175,224 | | | | |
| Other affiliated payables | | | | 120,664 | | | | |
| Other payables and accrued expenses | | | | 29,885 | | | | |
| Collateral on securities loaned, at value | | | | 9,376,125 | | | | |
| Total liabilities | | | | | | | | 18,424,179 |
| |
| Net Assets | | | | | | $ | | 402,333,907 |
| Net Assets consist of: | | | | | | | | |
| Paid in capital | | | | | | $ | | 893,863,277 |
| Undistributed net investment income | | | | | | | | 965,295 |
| Accumulated undistributed net realized gain (loss) on investments and foreign currency transactions | | | | | | | | (530,125,296) |
| Net unrealized appreciation (depreciation) on investments | | | | | | | | 37,630,631 |
| Net Assets, for 9,586,812 shares outstanding | | | | | | $ | | 402,333,907 |
| Net Asset Value, offering price and redemption price per share ($402,333,907 ÷ 9,586,812 shares) | | | | | | $ | | 41.97 |
| |
| Statement of Operations | | | | | | | | |
| | | | | | | | | Year ended February 28, 2006 |
| |
| Investment Income | | | | | | | | |
| Dividends | | | | | | $ | | 6,475,552 |
| Interest | | | | | | | | 950 |
| Income from affiliated Central Funds (including $116,790 from security lending) | | | | | | | | 199,771 |
| Total income | | | | | | | | 6,676,273 |
| |
| Expenses | | | | | | | | |
| Management fee | | $ | | 1,978,420 | | | | |
| Transfer agent fees | | | | 1,392,567 | | | | |
| Accounting and security lending fees | | | | | | | | |
| | | | | 176,689 | | | | |
| Independent trustees’ compensation | | | | 1,498 | | | | |
| Custodian fees and expenses | | | | 19,970 | | | | |
| Registration fees | | | | 30,554 | | | | |
| Audit | | | | 35,339 | | | | |
| Legal | | | | 5,938 | | | | |
| Miscellaneous | | | | 4,893 | | | | |
| Total expenses before reductions | | | | 3,645,868 | | | | |
| Expense reductions | | | | (308,594) | | | | 3,337,274 |
| |
| Net investment income (loss) | | | | | | | | 3,338,999 |
See accompanying notes which are an integral part of the financial statements.
Annual Report 10
| Realized and Unrealized Gain (Loss) | | | | | | |
| Net realized gain (loss) on: | | | | | | |
| Investment securities: | | | | | | |
| Unaffiliated issuers (net of foreign taxes of $14,555) | | 55,393,626 | | | | |
| Foreign currency transactions | | 13,562 | | | | |
| Total net realized gain (loss) | | | | | | 55,407,188 |
| Change in net unrealized appreciation (depreciation) on investment securities | | | | | | 10,244,776 |
| Net gain (loss) | | | | | | 65,651,964 |
| Net increase (decrease) in net assets resulting from operations | | | | $ | | 68,990,963 |
See accompanying notes which are an integral part of the financial statements.
|
11 Annual Report
| Telecommunications Portfolio | | | | | | | | | | | | | | | | | | | | |
| Financial Statements - continued | | | | | | | | | | | | | | | | | | | | |
| |
| |
| Statement of Changes in Net Assets | | | | | | | | | | | | | | | | | | | | |
| | | | | | | | | | | | | Year ended | | | | Year ended |
| | | | | | | | | | | | | February 28, | | | | February 28, |
| | | | | | | | | | | | | 2006 | | | | 2005 |
| Increase (Decrease) in Net Assets | | | | | | | | | | | | | | | | | | | | |
| Operations | | | | | | | | | | | | | | | | | | | | |
| Net investment income (loss) | | | | | | | | | | $ | | 3,338,999 | | $ | | | | 5,299,087 |
| Net realized gain (loss) | | | | | | | | | | | | 55,407,188 | | | | | | 42,732,867 |
| Change in net unrealized appreciation (depreciation) | | | | | | | | | | | | 10,244,776 | | | | (57,132,074) |
| Net increase (decrease) in net assets resulting from operations | | | | | | | | | | | | 68,990,963 | | | | | | (9,100,120) |
| Distributions to shareholders from net investment income | | | | | | | | | | | | (3,005,035) | | | | | | (5,054,509) |
| Share transactions | | | | | | | | | | | | | | | | | | | | |
| Proceeds from sales of shares | | | | | | | | | | | | 116,810,248 | | | | | | 51,781,700 |
| Reinvestment of distributions | | | | | | | | | | | | 2,869,866 | | | | | | 4,784,932 |
| Cost of shares redeemed | | | | | | | | | | | | (116,998,712) | | | | (148,168,834) |
| Net increase (decrease) in net assets resulting from share transactions | | | | | | | | | | | | 2,681,402 | | | | (91,602,202) |
| Redemption fees | | | | | | | | | | | | | | 25,069 | | | | | | 48,101 |
| Total increase (decrease) in net assets | | | | | | | | | | | | 68,692,399 | | | | (105,708,730) |
| |
| Net Assets | | | | | | | | | | | | | | | | | | | | |
| Beginning of period | | | | | | | | | | | | 333,641,508 | | | | 439,350,238 |
| End of period (including undistributed net investment income of $965,295 and undistributed net investment income of | | | | | | | | | | |
| $637,265, respectively) | | | | | | | | | | $ | | 402,333,907 | | $ | | 333,641,508 |
| |
| Other Information | | | | | | | | | | | | | | | | | | | | |
| Shares | | | | | | | | | | | | | | | | | | | | |
| Sold | | | | | | | | | | | | 3,070,553 | | | | | | 1,495,805 |
| Issued in reinvestment of distributions | | | | | | | | | | | | | | 74,920 | | | | | | 128,885 |
| Redeemed | | | | | | | | | | | | (3,137,526) | | | | | | (4,322,254) |
| Net increase (decrease) | | | | | | | | | | | | | | 7,947 | | | | | | (2,697,564) |
| |
| Financial Highlights | | | | | | | | | | | | | | | | | | | | |
| Years ended February 28, | | | | 2006 | | | | 2005 | | 2004F | | | | 2003 | | | | | | 2002 |
| Selected Per-Share Data | | | | | | | | | | | | | | | | | | | | |
| Net asset value, beginning of period | | $ | | 34.83 | | $ | | 35.79 | | $ 23.62 | | $ | | 30.55 | | | | $ | | 45.89 |
| Income from Investment Operations | | | | | | | | | | | | | | | | | | | | |
| Net investment income (loss)C | | | | 36 | | | | .49D | | .08 | | | | .03 | | | | | | .01 |
| Net realized and unrealized gain (loss) | | | | 7.11 | | | | (.96) | | 12.13 | | | | (6.95) | | | | | | (15.33) |
| Total from investment operations | | | | 7.47 | | | | (.47) | | 12.21 | | | | (6.92) | | | | | | (15.32) |
| Distributions from net investment income | | | | (.33) | | | | (.49) | | (.05) | | | | (.03) | | | | | | (.02) |
| Redemption fees added to paid in capitalC | | | | —G | | | | —G | | .01 | | | | .02 | | | | | | —G |
| Net asset value, end of period | | $ | | 41.97 | | $ | | 34.83 | | $ 35.79 | | $ | | 23.62 | | | | $ | | 30.55 |
| Total ReturnA,B | | | | 21.54% | | | | (1.40)% | | 51.78% | | | | (22.60)% | | | | | | (33.39)% |
| Ratios to Average Net AssetsE | | | | | | | | | | | | | | | | | | | | |
| Expenses before reductions | | | | 1.05% | | | | 1.09% | | 1.40% | | | | 1.56% | | | | | | 1.29% |
| Expenses net of fee waivers, if any | | | | 1.05% | | | | 1.09% | | 1.40% | | | | 1.56% | | | | | | 1.29% |
| Expenses net of all reductions | | | | 96% | | | | 1.02% | | 1.34% | | | | 1.34% | | | | | | 1.20% |
| Net investment income (loss) | | | | 96% | | | | 1.44%D | | .27% | | | | .13% | | | | | | .02% |
| Supplemental Data | | | | | | | | | | | | | | | | | | | | |
| Net assets, end of period (000 omitted) | | $ 402,334 | | $ 333,642 | | $ 439,350 | | $ 312,839 | | | | $ 456,116 |
| Portfolio turnover rate | | | | 148% | | | | 56% | | 98% | | | | 163% | | | | | | 169% |
ATotal returns would have been lower had certain expenses not been reduced during the periods shown. BTotal returns do not include the effect of the former sales charges. CCalculated based on average shares outstanding during the period. DInvestment income per share reflects a special dividend which amounted to $.26 per share. Excluding the special dividend, the ratio of net investment income (loss) to average net assets would have been .68%. EExpense ratios reflect operating expenses of the fund. Expenses before reductions do not reflect amounts reimbursed by the investment adviser or reductions from brokerage service arrangements or other expense offset arrangements and do not represent the amount paid by the fund during periods when reimbursements or reductions occur. Expenses net of fee waivers reflect expenses after reimbursement by the investment adviser but prior to reductions from brokerage service arrangements or other expense offset arrange ments. Expenses net of all reductions represent the net expenses paid by the fund. FFor the year ended February 29. GAmount represents less than $.01 per share.
See accompanying notes which are an integral part of the financial statements.
Annual Report 12
Utilities Growth Portfolio
Performance
|
Average annual total return reflects the change in the value of an investment, assuming reinvestment of the fund’s dividend income and capital gains (the profits earned upon the sale of securities that have grown in value) and assuming a constant rate of performance each year. The $10,000 table and the fund’s returns do not reflect the deduction of taxes that a shareholder would pay on fund distributions or the redemption of fund shares. During periods of reimbursement by Fidelity, a fund’s total returns will be greater than it would be had the reimbursement not occurred. How a fund did yesterday is no guarantee of how it will do tomorrow.
| Average Annual Total Returns | | | | | | |
| Periods ended February 28, 2006 | | Past 1 | | Past 5 | | Past 10 |
| | | year | | years | | years |
| Select Utilities Growth | | 18.48% | | 0.29% | | 8.71% |
$10,000 Over 10 Years
Let’s say hypothetically that $10,000 was invested in Fidelity Select Utilities Growth Portfolio on February 29, 1996. The chart shows how the value of your investment would have changed, and also shows how the S&P 500 Index performed over the same period.
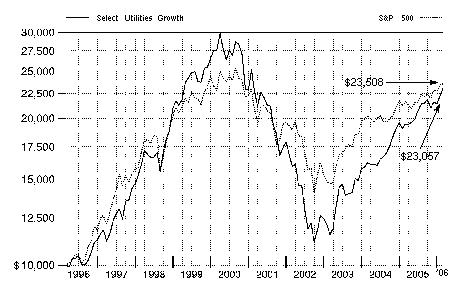
13 Annual Report
Utilities Growth Portfolio
|
Management’s Discussion of Fund Performance
Comments from Brian Younger, Portfolio Manager of Fidelity® Select Utilities Growth Portfolio
With the exception of several popular large-cap stock performance measures, most major U.S. equity benchmarks had double-digit returns for the year ending February 28, 2006. For much of the period, market gains were driven largely by the energy sector, although utilities ultimately sneaked into the top spot for the year overall. Financials and telecommunication services also reached double figures, outperforming the 8.40% return of the broader market as measured by the large-cap-oriented Standard & Poor’s 500SM Index. The consumer discretionary segment — home to the weak performing automobile and media industries — was the biggest disappointment. Although the overall return for the S&P 500® beat the small-cap Russell 2000® Index in calendar year 2005 — the first time that’s happened in six years — small-caps stormed back in early 2006, leading to a 16.59% advance during the past 12 months, nearly twice the broader market’s gain. Mid-caps soared even higher, returning 17.67% according to the Russell Midcap® Index. The technology-heavy NASDAQ Composite® Index also fared well, climbing 12.13%, but the Dow Jones Industrial AverageSM, an index of 30 large-cap, blue-chip stocks, managed to rise only 4.52% .
For the 12 months ending February 28, 2006, the fund returned 18.48%, putting it ahead of the Goldman Sachs® Utilities Index, which returned 14.95%, and the S&P 500. Strong stock picking overall and an overweighting in integrated telecommunication services providers aided returns relative to the sector index. Both wireline and wireless telecom stocks benefited from a more stable competitive environment, while utilities stocks received a boost from higher energy prices. Top contributors to performance relative to the sector index included Qwest Communications, a large telecom company in the western United States with improving revenues and profits; NII Holdings, a Latin American wireless carrier fueled by accelerating subscriber growth; and Public Service Enterprise, a New Jersey-based utility with regulated and unregulated businesses poised to merge with Exelon, a large nuclear power operator. I sold NII Holdings during the period. While no one stock made a huge dent in returns, overweightings in Verizon Communications and EchoStar Communications hampered relative returns. Shares of Verizon, a Northeast integrated telecom provider, made little headway as investors worried that the company had overspent on building new networks and acquiring MCI. Competitive threats from telecom and cable companies dogged EchoStar, an attractively valued satellite TV operator.
The views expressed above reflect those of the portfolio manager(s) only through the end of the period as stated on the cover of this report and do not necessarily represent the views of Fidelity or any other person in the Fidelity organization. Any such views are subject to change at any time based upon market or other conditions and Fidelity disclaims any responsibility to update such views. These views may not be relied on as investment advice and, because investment decisions for a Fidelity fund are based on numerous factors, may not be relied on as an indication of trading intent on behalf of any Fidelity fund.
| Utilities Growth Portfolio | | | | |
| Investment Changes | | |
| |
| |
| Top Ten Stocks as of February 28, 2006 |
| | | % of fund’s | | % of fund’s net assets |
| | | net assets | | 6 months ago |
| Verizon Communications, Inc. | | 13.7 | | 8.9 |
| AT&T, Inc. | | 12.6 | | 9.5 |
| BellSouth Corp. | | 10.7 | | 8.9 |
| Sprint Nextel Corp. | | 8.6 | | 8.9 |
| Public Service Enterprise Group, | | | | |
| Inc. | | 4.7 | | 4.3 |
| Qwest Communications | | | | |
| International, Inc. | | 4.6 | | 2.7 |
| Exelon Corp. | | 4.6 | | 5.4 |
| TXU Corp. | | 3.1 | | 3.5 |
| Entergy Corp. | | 3.1 | | 3.3 |
| AES Corp. | | 3.0 | | 3.3 |
| | | 68.7 | | |
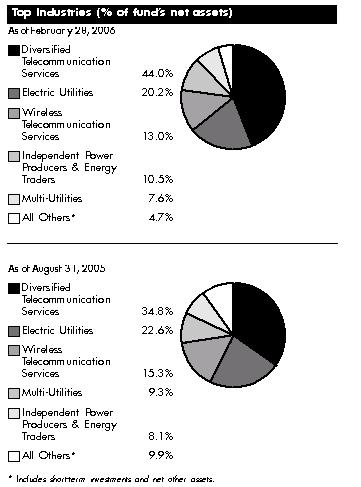
15 Annual Report
| Utilities Growth Portfolio | | | | | | |
| Investments February 28, 2006 | | | | |
| Showing Percentage of Net Assets | | | | | | |
| |
| Common Stocks — 97.0% | | | | | | |
| | | | | Shares | | Value (Note 1) |
| |
| DIVERSIFIED TELECOMMUNICATION SERVICES – 44.0% | | | | | | |
| Integrated Telecommunication Services – 44.0% | | | | | | |
| Alaska Communication Systems Group, Inc. | | | | 137,700 | | $ 1,527,093 |
| AT&T, Inc. | | | | 1,367,226 | | 37,721,765 |
| BellSouth Corp. | | | | 1,008,100 | | 31,835,798 |
| Cbeyond Communications, Inc. | | | | 159,200 | | 1,711,400 |
| Cincinnati Bell, Inc. (a) | | | | 291,600 | | 1,192,644 |
| NTELOS Holding Corp. | | | | 13,600 | | 160,480 |
| Qwest Communications International, Inc. (a) | | | | 2,184,600 | | 13,806,672 |
| TELUS Corp. (non-vtg.) | | | | 63,300 | | 2,462,580 |
| Verizon Communications, Inc. | | | | 1,215,410 | | 40,959,317 |
| | | | | | | 131,377,749 |
| |
| ELECTRIC UTILITIES – 20.2% | | | | | | |
| Electric Utilities – 20.2% | | | | | | |
| Allegheny Energy, Inc. (a) | | | | 149,000 | | 5,328,240 |
| Edison International | | | | 116,400 | | 5,163,504 |
| Entergy Corp. | | | | 126,600 | | 9,179,766 |
| Exelon Corp. | | | | 240,700 | | 13,746,377 |
| FirstEnergy Corp. | | | | 177,400 | | 9,061,592 |
| FPL Group, Inc. | | | | 168,800 | | 7,077,784 |
| Northeast Utilities | | | | 22,300 | | 437,526 |
| PPL Corp. | | | | 39,300 | | 1,249,740 |
| Southern Co. | | | | 263,800 | | 8,977,114 |
| | | | | | | 60,221,643 |
| |
| GAS UTILITIES – 0.4% | | | | | | |
| Gas Utilities – 0.4% | | | | | | |
| ONEOK, Inc. | | | | 28,000 | | 856,520 |
| UGI Corp. | | | | 19,200 | | 431,040 |
| | | | | | | 1,287,560 |
| |
| INDEPENDENT POWER PRODUCERS & ENERGY TRADERS – 10.5% | | | | |
| Independent Power & Energy Trade – 10.5% | | | | | | |
| AES Corp. (a) | | | | 525,700 | | 9,094,610 |
| Constellation Energy Group, Inc. | | | | 57,000 | | 3,348,180 |
| Mirant Corp. (a) | | | | 290,400 | | 7,143,840 |
| NRG Energy, Inc. (a) | | | | 60,000 | | 2,595,000 |
| TXU Corp. | | | | 176,000 | | 9,220,640 |
| | | | | | | 31,402,270 |
| |
| MEDIA – 1.3% | | | | | | |
| Broadcasting & Cable TV – 1.3% | | | | | | |
| EchoStar Communications Corp. Class A (a) | | | | 73,100 | | 2,146,947 |
| The DIRECTV Group, Inc. (a) | | | | 101,200 | | 1,594,912 |
| | | | | | | 3,741,859 |
| |
| |
| | | | | Shares | | Value (Note 1) |
| |
| MULTI-UTILITIES – 7.6% | | | | | | |
| Multi-Utilities – 7.6% | | | | | | |
| CMS Energy Corp. (a) | | | | 171,600 | | $ 2,416,128 |
| Dominion Resources, Inc. | | | | 41,600 | | 3,124,160 |
See accompanying notes which are an integral part of the financial statements.
Annual Report 16
| Public Service Enterprise Group, Inc. | | 201,900 | | 14,009,841 |
| Sempra Energy | | 67,200 | | 3,214,848 |
| | | | | 22,764,977 |
| |
| WIRELESS TELECOMMUNICATION SERVICES – 13.0% | | | | |
| Wireless Telecommunication Services – 13.0% | | | | |
| ALLTEL Corp. | | 141,169 | | 8,914,822 |
| American Tower Corp. Class A (a) | | 29,585 | | 941,691 |
| Crown Castle International Corp. (a) | | 43,500 | | 1,363,725 |
| Dobson Communications Corp. Class A (a) | | 235,700 | | 1,706,468 |
| Sprint Nextel Corp. | | 1,071,223 | | 25,741,489 |
| | | | | 38,668,195 |
| |
| TOTAL COMMON STOCKS | | | | |
| (Cost $276,143,566) | | | | 289,464,253 |
| |
| Money Market Funds — 1.4% | | | | |
| |
| Fidelity Cash Central Fund, 4.57% (b) | | | | |
| (Cost $4,121,659) | | 4,121,659 | | 4,121,659 |
| |
| TOTAL INVESTMENT PORTFOLIO - 98.4% | | | | |
| (Cost $280,265,225) | | | | 293,585,912 |
| |
| NET OTHER ASSETS – 1.6% | | | | 4,785,016 |
| NET ASSETS – 100% | | | | $298,370,928 |
(a) Non-income producing
(b) Affiliated fund that is available only to investment companies and other accounts managed by Fidelity Investments. The rate quoted is the annualized seven-day yield of the fund at period end. A complete unaudited listing of the fund’s holdings as of its most recent quarter end is available upon request.
See accompanying notes which are an integral part of the financial statements.
|
17 Annual Report
17
| Utilities Growth Portfolio | | |
| Investments - continued | | |
| |
| |
| Affiliated Central Funds | | |
| Information regarding fiscal year to date income earned by the fund from the affiliated Central funds is as follows: | | |
| |
| Fund | | Income earned |
| Fidelity Cash Central Fund | | $ 138,088 |
| Fidelity Securities Lending Cash Central Fund | | 34,279 |
| Total | | $ 172,367 |
Income Tax Information
At February 28, 2006, the fund had a capital loss carryforward of approximately $94,867,710 all of which will expire on February 28, 2011.
| See accompanying notes which are an integral part of the financial statements. | | |
| Annual Report | | 18 |
| Utilities Growth Portfolio | | | | | | | | |
| |
| Financial Statements | | | | | | | | |
| |
| |
| Statement of Assets and Liabilities | | | | | | | | |
| | | | | | | | | February 28, 2006 |
| |
| Assets | | | | | | | | |
| Investment in securities, at value — See accompanying schedule: | | | | | | | | |
| Unaffiliated issuers (cost $276,143,566) | | $ | | 289,464,253 | | | | |
| Affiliated Central Funds (cost $4,121,659) | | | | 4,121,659 | | | | |
| Total Investments (cost $280,265,225) | | | | | | $ | | 293,585,912 |
| Receivable for investments sold | | | | | | | | 697,210 |
| Receivable for fund shares sold | | | | | | | | 4,426,791 |
| Dividends receivable | | | | | | | | 320,727 |
| Interest receivable | | | | | | | | 17,157 |
| Prepaid expenses | | | | | | | | 1,446 |
| Other affiliated receivables | | | | | | | | 737 |
| Other receivables | | | | | | | | 94,434 |
| Total assets | | | | | | | | 299,144,414 |
| |
| Liabilities | | | | | | | | |
| Payable for fund shares redeemed | | $ | | 529,152 | | | | |
| Accrued management fee | | | | 134,476 | | | | |
| Transfer agent fee payable | | | | 70,497 | | | | |
| Other affiliated payables | | | | 13,093 | | | | |
| Other payables and accrued expenses | | | | 26,268 | | | | |
| Total liabilities | | | | | | | | 773,486 |
| |
| Net Assets | | | | | | $ | | 298,370,928 |
| Net Assets consist of: | | | | | | | | |
| Paid in capital | | | | | | $ | | 385,738,881 |
| Undistributed net investment income | | | | | | | | 315,700 |
| Accumulated undistributed net realized gain (loss) on investments and foreign currency transactions | | | | | | | | (101,004,340) |
| Net unrealized appreciation (depreciation) on investments | | | | | | | | 13,320,687 |
| Net Assets, for 6,424,754 shares outstanding | | | | | | $ | | 298,370,928 |
| Net Asset Value, offering price and redemption price per share ($298,370,928 ÷ 6,424,754 shares) | | | | | | $ | | 46.44 |
| |
| Statement of Operations | | | | | | | | |
| | | | | | | | | Year ended February 28, 2006 |
| |
| Investment Income | | | | | | | | |
| Dividends | | | | | | $ | | 8,319,553 |
| Interest | | | | | | | | 198 |
| Income from affiliated Central Funds (including $34,279 from security lending) | | | | | | | | 172,367 |
| Total income | | | | | | | | 8,492,118 |
| |
| Expenses | | | | | | | | |
| Management fee | | $ | | 1,836,083 | | | | |
| Transfer agent fees | | | | 1,027,634 | | | | |
| Accounting and security lending fees | | | | | | | | |
| | | | | 162,376 | | | | |
| Independent trustees’ compensation | | | | 1,512 | | | | |
| Custodian fees and expenses | | | | 15,477 | | | | |
| Registration fees | | | | 28,153 | | | | |
| Audit | | | | 35,245 | | | | |
| Legal | | | | 3,649 | | | | |
| Miscellaneous | | | | 4,870 | | | | |
| Total expenses before reductions | | | | 3,114,999 | | | | |
| Expense reductions | | | | (144,480) | | | | 2,970,519 |
| |
| Net investment income (loss) | | | | | | | | 5,521,599 |
Realized and Unrealized Gain (Loss)
Net realized gain (loss) on:
Investment securities: | | | | | | | | |
See accompanying notes which are an integral part of the financial statements.
|
19 Annual Report
| Utilities Growth Portfolio | | | | | | |
| Financial Statements - continued | | | | | | |
| |
| |
| Unaffiliated issuers | | 62,376,111 | | | | |
| Foreign currency transactions | | 7,981 | | | | |
| Total net realized gain (loss) | | | | | | 62,384,092 |
| Change in net unrealized appreciation (depreciation) on investment securities | | | | | | (16,994,242) |
| Net gain (loss) | | | | | | 45,389,850 |
| Net increase (decrease) in net assets resulting from operations | | | | $ | | 50,911,449 |
See accompanying notes which are an integral part of the financial statements.
Annual Report 20
| Statement of Changes in Net Assets | | | | | | | | | | | | | | | | | | | | | | |
| | | | | | | | | | | | | | | Year ended | | | | Year ended |
| | | | | | | | | | | | | | | February 28, | | | | February 28, |
| | | | | | | | | | | | | | | 2006 | | | | 2005 |
| Increase (Decrease) in Net Assets | | | | | | | | | | | | | | | | | | | | | | |
| Operations | | | | | | | | | | | | | | | | | | | | | | |
| Net investment income (loss) | | | | | | | | | | | | $ | | 5,521,599 | | $ | | | | 5,270,208 |
| Net realized gain (loss) | | | | | | | | | | | | | | 62,384,092 | | | | | | 30,461,218 |
| Change in net unrealized appreciation (depreciation) | | | | | | | | | | | | | | (16,994,242) | | | | | | 11,299,969 |
| Net increase (decrease) in net assets resulting from operations | | | | | | | | | | | | | | 50,911,449 | | | | | | 47,031,395 |
| Distributions to shareholders from net investment income | | | | | | | | | | | | | | (6,178,163) | | | | | | (4,964,482) |
| Share transactions | | | | | | | | | | | | | | | | | | | | | | |
| Proceeds from sales of shares | | | | | | | | | | | | | | 150,205,440 | | | | 205,464,053 |
| Reinvestment of distributions | | | | | | | | | | | | | | 5,869,756 | | | | | | 4,725,459 |
| Cost of shares redeemed | | | | | | | | | | | | | | (227,229,266) | | | | (134,631,549) |
| Net increase (decrease) in net assets resulting from share transactions | | | | | | | | | | | | (71,154,070) | | | | | | 75,557,963 |
| Redemption fees | | | | | | | | | | | | | | | | 60,121 | | | | | | 63,132 |
| Total increase (decrease) in net assets | | | | | | | | | | | | | | (26,360,663) | | | | 117,688,008 |
| |
| Net Assets | | | | | | | | | | | | | | | | | | | | | | |
| Beginning of period | | | | | | | | | | | | | | 324,731,591 | | | | 207,043,583 |
| End of period (including undistributed net investment income of $315,700 and undistributed net investment income of | | | | | | | | | | |
| $995,565, respectively) | | | | | | | | �� | | | | $ | | 298,370,928 | | $ | | 324,731,591 |
| |
| Other Information | | | | | | | | | | | | | | | | | | | | | | |
| Shares | | | | | | | | | | | | | | | | | | | | | | |
| Sold | | | | | | | | | | | | | | 3,527,344 | | | | | | 5,461,648 |
| Issued in reinvestment of distributions | | | | | | | | | | | | | | | | 135,825 | | | | | | 123,302 |
| Redeemed | | | | | | | | | | | | | | (5,348,558) | | | | | | (3,575,021) |
| Net increase (decrease) | | | | | | | | | | | | | | (1,685,389) | | | | | | 2,009,929 |
| |
| Financial Highlights | | | | | | | | | | | | | | | | | | | | | | |
| Years ended February 28, | | | | 2006 | | | | 2005 | | | | 2004F | | | | 2003 | | | | | | 2002 |
| Selected Per-Share Data | | | | | | | | | | | | | | | | | | | | | | |
| Net asset value, beginning of period | | $ | | 40.04 | | $ | | 33.94 | | $ | | 24.44 | | $ | | 34.32 | | | | $ | | 50.37 |
| Income from Investment Operations | | | | | | | | | | | | | | | | | | | | | | |
| Net investment income (loss)C | | | | 73 | | | | .76D,G | | | | .43 | | | | .44 | | | | | | .33 |
| Net realized and unrealized gain (loss) | | | | 6.59 | | | | 5.95 | | | | 9.46 | | | | (9.85) | | | | | | (15.20) |
| Total from investment operations | | | | 7.32 | | | | 6.71 | | | | 9.89 | | | | (9.41) | | | | | | (14.87) |
| Distributions from net investment income | | | | (.93) | | | | (.62) | | | | (.40) | | | | (.48) | | | | | | (.26) |
| Distributions from net realized gain | | | | — | | | | — | | | | — | | | | — | | | | | | (.93) |
| Total distributions | | | | (.93) | | | | (.62) | | | | (.40) | | | | (.48) | | | | | | (1.19) |
| Redemption fees added to paid in capitalC | | | | 01 | | | | .01 | | | | .01 | | | | .01 | | | | | | .01 |
| Net asset value, end of period | | $ | | 46.44 | | $ | | 40.04 | | $ | | 33.94 | | $ | | 24.44 | | | | $ | | 34.32 |
| Total ReturnA,B | | | | 18.48% | | | | 19.90% | | | | 40.71% | | | | (27.55)% | | | | | | (29.94)% |
| Ratios to Average Net AssetsE | | | | | | | | | | | | | | | | | | | | | | |
| Expenses before reductions | | | | 97% | | | | 1.02% | | | | 1.23% | | | | 1.30% | | | | | | 1.11% |
| Expenses net of fee waivers, if any | | | | 97% | | | | 1.02% | | | | 1.23% | | | | 1.30% | | | | | | 1.11% |
| Expenses net of all reductions | | | | 92% | | | | .99% | | | | 1.19% | | | | 1.17% | | | | | | 1.09% |
| Net investment income (loss) | | | | 1.71% | | | | 2.06%D,G | | | | 1.44% | | | | 1.56% | | | | | | .77% |
| Supplemental Data | | | | | | | | | | | | | | | | | | | | | | |
| Net assets, end of period (000 omitted) | | $ 298,371 | | $ 324,732 | | $ 207,044 | | $ 161,359 | | | | $ 274,894 |
| Portfolio turnover rate | | | | 101% | | | | 51% | | | | 76% | | | | 139% | | | | | | 54% |
| |
| A Total returns would have been lower had certain expenses not been reduced during the periods shown. | | B Total returns do not include the effect of the former sales charges. | | C Calculated based on average shares outstanding during the |
| period. D Investment income per share reflects a special dividend which amounted to $.22 per share. Excluding the special dividend, the ratio of net investment income (loss) to average net assets would have been 1.47%. | | E Expense ratios reflect |
operating expenses of the fund. Expenses before reductions do not reflect amounts reimbursed by the investment adviser or reductions from brokerage service arrangements or other expense offset arrangements and do not represent the amount paid by the fund during periods when reimbursements or reductions occur. Expenses net of fee waivers reflect expenses after reimbursement by the investment adviser but prior to reductions from brokerage service arrangements or other expense offset arrange ments. Expenses net of all reductions represent the net expenses paid by the fund. FFor the year ended February 29. GAs a result of the change in the estimate of the return of capital component of dividend income realized in the year ended February 29, 2004, net investment income per share and the ratio of the net investment income to average net assets for the year ended February 28, 2005, have been reduced by $0.02 per share and .06%, respectively. The change in estimate has no impact on total net assets or total return of the fund.
See accompanying notes which are an integral part of the financial statements.
21
Wireless Portfolio
Performance
|
Average annual total return reflects the change in the value of an investment, assuming reinvestment of the fund’s dividend income and capital gains (the profits earned upon the sale of securities that have grown in value) and assuming a constant rate of performance each year. The $10,000 table and the fund’s returns do not reflect the deduction of taxes that a shareholder would pay on fund distributions or the redemption of fund shares. During periods of reimbursement by Fidelity, a fund’s total returns will be greater than it would be had the reimbursement not occurred. How a fund did yesterday is no guarantee of how it will do tomorrow.
| Average Annual Total Returns | | | | | | |
| Periods ended February 28, 2006 | | Past 1 | | Past 5 | | Life of |
| | | year | | years | | fundA |
| Select Wireless | | 26.54% | | --0.06% | | --5.84% |
$10,000 Over Life of Fund
Let’s say hypothetically that $10,000 was invested in Fidelity Select Wireless Portfolio on September 21, 2000, when the fund started. The chart shows how the value of your investment would have changed, and also shows how the S&P 500 Index performed over the same period.
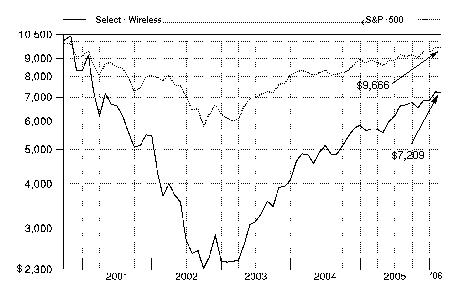
Management’s Discussion of Fund Performance
Comments from Brian Younger, Portfolio Manager of Fidelity® Select Wireless Portfolio
With the exception of several popular large-cap stock performance measures, most major U.S. equity benchmarks had double-digit returns for the year ending February 28, 2006. For much of the period, market gains were driven largely by the energy sector, although utilities ultimately sneaked into the top spot for the year overall. Financials and telecommunication services also reached double figures, outperforming the 8.40% return of the broader market as measured by the large-cap-oriented Standard & Poor’s 500SM Index. The consumer discretionary segment — home to the weak performing automobile and media industries — was the biggest disappointment. Although the overall return for the S&P 500® beat the small-cap Russell 2000® Index in calendar year 2005 — the first time that’s happened in six years — small-caps stormed back in early 2006, leading to a 16.59% advance during the past 12 months, nearly twice the broader market’s gain. Mid-caps soared even higher, returning 17.67% according to the Russell Midcap® Index. The technology-heavy NASDAQ Composite® Index also fared well, climbing 12.13%, but the Dow Jones Industrial AverageSM, an index of 30 large-cap, blue-chip stocks, managed to rise only 4.52% .
For the 12 months ending February 28, 2006, the fund returned 26.54%, beating the Goldman Sachs® Utilities Index, which returned 14.95%, and the S&P 500. The fund benefited from strong stock selection among wireless telecommunication services stocks, which rallied nicely, pushed higher by positive subscriber growth trends and a more favorable competitive environment. A sizable overweighting on average in communications equipment stocks also helped propel the fund past the sector index. The fund lost a bit of ground because it does not invest in certain industries, such as electric utilities, that are included in the sector index and did well during the period. Among the top individual contributors were NII Holdings, which provides push-to-talk wireless services in Latin America, and Nextel Partners, which operates in secondary U.S. markets. The fund had overweightings on average in both stocks, which I sold late in the period to lock in profits. Communications equipment stocks benefited as the wireless carriers invested in expanding their coverage and capacity. Motorola, which makes wireless handsets and networking equipment, did particularly well. Wireless tower companies further aided returns, led by Crown Castle International. By contrast, Great Britain’s Vodafone, the world’s largest wireless provider, detracted from relative performance. It declined as subscriber growth slowed in some European markets. In addition, we had weak results in the electronic equipment area, as Symbol Technologies — which makes wireless handheld devices — fell amid a management change that unsettled investors. Motorola, Crown Castle, Vodafone and Symbol were not in the sector index.
The views expressed above reflect those of the portfolio manager(s) only through the end of the period as stated on the cover of this report and do not necessarily represent the views of Fidelity or any other person in the Fidelity organization. Any such views are subject to change at any time based upon market or other conditions and Fidelity disclaims any responsibility to update such views. These views may not be relied on as investment advice and, because investment decisions for a Fidelity fund are based on numerous factors, may not be relied on as an indication of trading intent on behalf of any Fidelity fund.
23 23 Annual Report
| Wireless Portfolio | | | | |
| Investment Changes | | |
| |
| |
| Top Ten Stocks as of February 28, 2006 |
| | | % of fund’s | | % of fund’s net assets |
| | | net assets | | 6 months ago |
| QUALCOMM, Inc. | | 9.0 | | 3.6 |
| Sprint Nextel Corp. | | 8.5 | | 10.6 |
| ALLTEL Corp. | | 5.5 | | 5.4 |
| Motorola, Inc. | | 5.4 | | 5.8 |
| Harris Corp. | | 5.3 | | 4.8 |
| American Tower Corp. Class A | | 5.2 | | 7.3 |
| Comverse Technology, Inc. | | 5.1 | | 4.3 |
| Crown Castle International Corp. | | 4.9 | | 3.8 |
| Research In Motion Ltd. | | 4.1 | | 0.7 |
| Verizon Communications, Inc. | | 3.5 | | 1.8 |
| | | 56.5 | | |
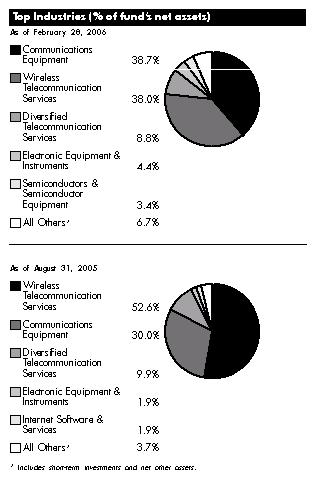
Annual Report 24
| Wireless Portfolio | | | | | | |
| Investments February 28, 2006 | | | | |
| Showing Percentage of Net Assets | | | | | | |
| |
| Common Stocks — 98.2% | | | | | | |
| | | | | Shares | | Value (Note 1) |
| |
| COMMUNICATIONS EQUIPMENT – 38.7% | | | | | | |
| Communications Equipment – 38.7% | | | | | | |
| Andrew Corp. (a) | | | | 962,200 | | $ 13,047,432 |
| Arris Group, Inc. (a) | | | | 200,000 | | 2,538,000 |
| Comverse Technology, Inc. (a) | | | | 895,120 | | 25,743,651 |
| Harris Corp. | | | | 583,000 | | 26,631,440 |
| Lucent Technologies, Inc. (a) | | | | 907,900 | | 2,542,120 |
| Motorola, Inc. | | | | 1,267,880 | | 27,132,632 |
| Nokia Corp. sponsored ADR | | | | 186,100 | | 3,457,738 |
| Nortel Networks Corp. (a) | | | | 627,900 | | 1,795,794 |
| Powerwave Technologies, Inc. (a) | | | | 548,000 | | 8,044,640 |
| QUALCOMM, Inc. | | | | 963,300 | | 45,477,394 |
| Research In Motion Ltd. (a) | | | | 288,700 | | 20,435,025 |
| Sierra Wireless, Inc. (a)(d) | | | | 305,800 | | 3,633,587 |
| Tekelec (a) | | | | 534,800 | | 7,171,668 |
| Telefonaktiebolaget LM (B Shares) sponsored ADR | | | | 202,500 | | 6,905,250 |
| | | | | | | 194,556,371 |
| |
| COMPUTERS & PERIPHERALS – 2.7% | | | | | | |
| Computer Hardware – 2.7% | | | | | | |
| Palm, Inc. (a)(d) | | | | 332,300 | | 13,723,990 |
| DIVERSIFIED TELECOMMUNICATION SERVICES – 8.8% | | | | | | |
| Integrated Telecommunication Services – 8.8% | | | | | | |
| AT&T, Inc. | | | | 569,100 | | 15,701,469 |
| BellSouth Corp. | | | | 291,000 | | 9,189,780 |
| NTELOS Holding Corp. | | | | 24,200 | | 285,560 |
| Telenor ASA sponsored ADR | | | | 40,700 | | 1,326,820 |
| Verizon Communications, Inc. | | | | 519,800 | | 17,517,260 |
| | | | | | | 44,020,889 |
| |
| ELECTRONIC EQUIPMENT & INSTRUMENTS – 4.4% | | | | | | |
| Electronic Equipment & Instruments – 2.7% | | | | | | |
| Symbol Technologies, Inc. | | | | 1,175,300 | | 13,656,986 |
| Electronic Manufacturing Services – 1.7% | | | | | | |
| Trimble Navigation Ltd. (a) | | | | 203,000 | | 8,304,730 |
| |
| TOTAL ELECTRONIC EQUIPMENT & INSTRUMENTS | | | | | | 21,961,716 |
| |
| INTERNET SOFTWARE & SERVICES – 2.2% | | | | | | |
| Internet Software & Services – 2.2% | | | | | | |
| Openwave Systems, Inc. (a) | | | | 570,066 | | 11,315,810 |
| SEMICONDUCTORS & SEMICONDUCTOR EQUIPMENT – 3.4% | | | | | | |
| Semiconductors – 3.4% | | | | | | |
| AMIS Holdings, Inc. (a) | | | | 707,300 | | 6,096,926 |
| Atheros Communications, Inc. (a) | | | | 22,000 | | 452,760 |
| Atmel Corp. (a) | | | | 208,200 | | 947,310 |
| DSP Group, Inc. (a) | | | | 153,900 | | 4,139,910 |
| RF Micro Devices, Inc. (a) | | | | 815,600 | | 5,488,988 |
| | | | | | | 17,125,894 |
See accompanying notes which are an integral part of the financial statements.
|
25 Annual Report
25
| Wireless Portfolio | | | | |
| Investments - continued | | | | |
| |
| |
| |
| | | Shares | | Value (Note 1) |
| |
| WIRELESS TELECOMMUNICATION SERVICES – 38.0% | | | | |
| Wireless Telecommunication Services – 38.0% | | | | |
| ALLTEL Corp. | | 432,988 | | $ 27,343,192 |
| American Tower Corp. Class A (a)(d) | | 820,492 | | 26,116,260 |
| Bharti Televentures Ltd. (a) | | 994,335 | | 8,695,126 |
| Crown Castle International Corp. (a) | | 784,500 | | 24,594,075 |
| Dobson Communications Corp. Class A (a) | | 950,000 | | 6,878,000 |
| Investcom LLC GDR | | 700,000 | | 12,145,000 |
| Leap Wireless International, Inc. (a) | | 308,600 | | 12,995,146 |
| MTN Group Ltd. | | 572,500 | | 5,566,810 |
| Sprint Nextel Corp. | | 1,782,931 | | 42,843,832 |
| Syniverse Holdings, Inc. | | 184,100 | | 2,632,630 |
| Vimpel Communications sponsored ADR (a) | | 239,700 | | 10,546,800 |
| Vodafone Group PLC sponsored ADR | | 448,000 | | 8,655,360 |
| Wireless Facilities, Inc. (a) | | 425,000 | | 1,912,500 |
| | | | | 190,924,731 |
| |
| TOTAL COMMON STOCKS | | | | |
| (Cost $452,355,574) | | | | 493,629,401 |
| |
| Money Market Funds — 4.8% | | | | |
| |
| Fidelity Cash Central Fund, 4.57% (b) | | 10,680,384 | | 10,680,384 |
| Fidelity Securities Lending Cash Central Fund, 4.58% (b)(c) | | 13,438,200 | | 13,438,200 |
| TOTAL MONEY MARKET FUNDS | | | | |
| (Cost $24,118,584) | | | | 24,118,584 |
| |
| TOTAL INVESTMENT PORTFOLIO - 103.0% | | | | |
| (Cost $476,474,158) | | | | 517,747,985 |
| |
| NET OTHER ASSETS – (3.0)% | | | | (15,045,493) |
| NET ASSETS – 100% | | $ | | 502,702,492 |
(a) Non-income producing
(b) Affiliated fund that is available only to investment companies and other accounts managed by Fidelity Investments. The rate quoted is the annualized seven-day yield of the fund at period end. A complete unaudited listing of the fund’s holdings as of its most recent quarter end is available upon request.
(c) Investment made with cash collateral received from securities on loan. (d) Security or a portion of the security is on loan at period end.
| See accompanying notes which are an integral part of the financial statements. | | |
| Annual Report | | 26 |
| Affiliated Central Funds | | |
| Information regarding fiscal year to date income earned by the fund from the affiliated Central funds is as follows: | | |
| |
| Fund | | Income earned |
| Fidelity Cash Central Fund | | $ 229,742 |
| Fidelity Securities Lending Cash Central Fund | | 200,252 |
| Total | | $ 429,994 |
| Other Information | | |
| Distribution of investments by country of issue, as a percentage of total net assets, is as follows: | | |
| |
| United States of America | | 83.4% |
| Canada | | 5.2% |
| United Arab Emirates | | 2.4% |
| Russia | | 2.1% |
| India | | 1.7% |
| United Kingdom | | 1.7% |
| Sweden | | 1.4% |
| South Africa | | 1.1% |
| Others (individually less than 1%) | | 1.0% |
| | | 100.0% |
See accompanying notes which are an integral part of the financial statements.
|
27 Annual Report
27
| Wireless Portfolio | | | | | | | | |
| |
| Financial Statements | | | | | | | | |
| |
| |
| Statement of Assets and Liabilities | | | | | | | | |
| | | | | | | | | February 28, 2006 |
| |
| Assets | | | | | | | | |
| Investment in securities, at value (including securities loaned of $13,363,657) — See accompanying schedule: | | | | | | | | |
| Unaffiliated issuers (cost $452,355,574) | | $ | | 493,629,401 | | | | |
| Affiliated Central Funds (cost $24,118,584) | | | | 24,118,584 | | | | |
| Total Investments (cost $476,474,158) | | | | | | $ | | 517,747,985 |
| Receivable for investments sold | | | | | | | | 3,924,295 |
| Receivable for fund shares sold | | | | | | | | 1,253,199 |
| Dividends receivable | | | | | | | | 243,772 |
| Interest receivable | | | | | | | | 35,143 |
| Prepaid expenses | | | | | | | | 1,591 |
| Other affiliated receivables | | | | | | | | 1,121 |
| Other receivables | | | | | | | | 116,504 |
| Total assets | | | | | | | | 523,323,610 |
| |
| Liabilities | | | | | | | | |
| Payable for investments purchased | | $ | | 5,579,006 | | | | |
| Payable for fund shares redeemed | | | | 1,084,441 | | | | |
| Accrued management fee | | | | 235,908 | | | | |
| Other affiliated payables | | | | 147,270 | | | | |
| Other payables and accrued expenses | | | | 136,293 | | | | |
| Collateral on securities loaned, at value | | | | 13,438,200 | | | | |
| Total liabilities | | | | | | | | 20,621,118 |
| |
| Net Assets | | | | | | $ | | 502,702,492 |
| Net Assets consist of: | | | | | | | | |
| Paid in capital | | | | | | $ | | 434,176,798 |
| Undistributed net investment income | | | | | | | | 161,188 |
| Accumulated undistributed net realized gain (loss) on investments and foreign currency transactions | | | | | | | | 27,186,352 |
| Net unrealized appreciation (depreciation) on investments | | | | | | | | 41,178,154 |
| Net Assets, for 69,836,146 shares outstanding | | | | | | $ | | 502,702,492 |
| Net Asset Value, offering price and redemption price per share ($502,702,492 ÷ 69,836,146 shares) | | | | | | $ | | 7.20 |
| |
| Statement of Operations | | | | | | | | |
| | | | | | | | | Year ended February 28, 2006 |
| |
| Investment Income | | | | | | | | |
| Dividends | | | | | | $ | | 3,474,828 |
| Interest | | | | | | | | 3,348 |
| Income from affiliated Central Funds (including $200,252 from security lending) | | | | | | | | 429,994 |
| Total income | | | | | | | | 3,908,170 |
| |
| Expenses | | | | | | | | |
| Management fee | | $ | | 2,390,692 | | | | |
| Transfer agent fees | | | | 1,463,237 | | | | |
| Accounting and security lending fees | | | | | | | | |
| | | | | 213,514 | | | | |
| Independent trustees’ compensation | | | | 1,768 | | | | |
| Custodian fees and expenses | | | | 28,434 | | | | |
| Registration fees | | | | 56,271 | | | | |
| Audit | | | | 35,486 | | | | |
| Legal | | | | 2,328 | | | | |
| Miscellaneous | | | | 6,165 | | | | |
| Total expenses before reductions | | | | 4,197,895 | | | | |
| Expense reductions | | | | (472,962) | | | | 3,724,933 |
| |
| Net investment income (loss) | | | | | | | | 183,237 |
| Realized and Unrealized Gain (Loss) | | | | | | | | |
| Net realized gain (loss) on: | | | | | | | | |
See accompanying notes which are an integral part of the financial statements.
Annual Report 28
| Investment securities: | | | | | | |
| Unaffiliated issuers (net of foreign taxes of $26,861) | | 122,870,588 | | | | |
| Foreign currency transactions | | 1,548 | | | | |
| Total net realized gain (loss) | | | | | | 122,872,136 |
| Change in net unrealized appreciation (depreciation) on investment securities (net of increase in deferred foreign taxes | | | | | | |
| of $95,673) | | | | | | (26,620,651) |
| Net gain (loss) | | | | | | 96,251,485 |
| Net increase (decrease) in net assets resulting from operations | | | | | | $96,434,722 |
See accompanying notes which are an integral part of the financial statements.
|
29 Annual Report
| Wireless Portfolio | | | | | | | | | | | | | | | | | | | | | | |
| Financial Statements - continued | | | | | | | | | | | | | | | | | | | | | | |
| |
| |
| Statement of Changes in Net Assets | | | | | | | | | | | | | | | | | | | | | | |
| | | | | | | | | | | | | Year ended | | | | Year ended |
| | | | | | | | | | | | | February 28, | | | | February 28, |
| | | | | | | | | | | | | 2006 | | | | 2005 |
| Increase (Decrease) in Net Assets | | | | | | | | | | | | | | | | | | | | | | |
| Operations | | | | | | | | | | | | | | | | | | | | | | |
| Net investment income (loss) | | | | | | | | | | | | $ | | 183,237 | | $ | | | | (996,709) |
| Net realized gain (loss) | | | | | | | | | | | | 122,872,136 | | | | 42,445,395 |
| Change in net unrealized appreciation (depreciation) | | | | | | | | | | | | (26,620,651) | | | | | | 9,980,493 |
| Net increase (decrease) in net assets resulting from operations | | | | | | | | | | | | 96,434,722 | | | | 51,429,179 |
| Share transactions | | | | | | | | | | | | | | | | | | | | | | |
| Proceeds from sales of shares | | | | | | | | | | | | 340,148,847 | | | | 489,721,414 |
| Cost of shares redeemed | | | | | | | | | | | | (306,680,611) | | | | (451,775,776) |
| Net increase (decrease) in net assets resulting from share transactions | | | | | | | | | | 33,468,236 | | | | 37,945,638 |
| Redemption fees | | | | | | | | | | | | | | | | 94,936 | | | | | | 289,802 |
| Total increase (decrease) in net assets | | | | | | | | | | | | 129,997,894 | | | | 89,664,619 |
| |
| Net Assets | | | | | | | | | | | | | | | | | | | | | | |
| Beginning of period | | | | | | | | | | | | 372,704,598 | | | | 283,039,979 |
| End of period (including undistributed net investment income of $161,188 and $0, respectively) | | | | | | | | $ 502,702,492 | | $ | | 372,704,598 |
| |
| Other Information | | | | | | | | | | | | | | | | | | | | | | |
| Shares | | | | | | | | | | | | | | | | | | | | | | |
| Sold | | | | | | | | | | | | 52,205,281 | | | | 94,401,410 |
| Redeemed | | | | | | | | | | | | (47,885,529) | | | | (87,222,522) |
| Net increase (decrease) | | | | | | | | | | | | | | 4,319,752 | | | | | | 7,178,888 |
| |
| Financial Highlights | | | | | | | | | | | | | | | | | | | | | | |
| Years ended February 28, | | | | 2006 | | | | 2005 | | | | 2004E | | | | 2003 | | | | 2002 |
| Selected Per-Share Data | | | | | | | | | | | | | | | | | | | | | | |
| Net asset value, beginning of period | | $ | | 5.69 | | $ | | 4.85 | | $ | | 2.42 | | $ | | 3.68 | | $ | | 7.22 |
| Income from Investment Operations | | | | | | | | | | | | | | | | | | | | | | |
| Net investment income (loss)C | | | | —F | | | | (.01) | | | | (.03) | | | | (.03) | | | | (.04) |
| Net realized and unrealized gain (loss) | | | | 1.51 | | | | .85 | | | | 2.46 | | | | (1.23) | | | | (3.50) |
| Total from investment operations | | | | 1.51 | | | | .84 | | | | 2.43 | | | | (1.26) | | | | (3.54) |
| Redemption fees added to paid in capitalC | | | | —F | | | | —F | | | | —F | | | | —F | | | | —F |
| Net asset value, end of period | | $ | | 7.20 | | $ | | 5.69 | | $ | | 4.85 | | $ | | 2.42 | | $ | | 3.68 |
| Total ReturnA,B | | | | 26.54% | | | | 17.32% | | | | 100.41% | | | | (34.24)% | | | | (49.03)% |
| Ratios to Average Net AssetsD | | | | | | | | | | | | | | | | | | | | | | |
| Expenses before reductions | | | | 1.00% | | | | 1.04% | | | | 1.55% | | | | 2.17% | | | | 1.59% |
| Expenses net of fee waivers, if any | | | | 1.00% | | | | 1.04% | | | | 1.55% | | | | 2.17% | | | | 1.59% |
| Expenses net of all reductions | | | | 89% | | | | .97% | | | | 1.43% | | | | 2.01% | | | | 1.54% |
| Net investment income (loss) | | | | 04% | | | | (.27)% | | | | (.77)% | | | | (1.16)% | | | | (.72)% |
| Supplemental Data | | | | | | | | | | | | | | | | | | | | | | |
| Net assets, end of period (000 omitted) | | $ 502,702 | | $ 372,705 | | $ 283,040 | | $ | | 51,720 | | $ | | 77,266 |
| Portfolio turnover rate | | | | 162% | | | | 96% | | | | 79% | | | | 110% | | | | 148% |
| |
| | | | | |
A Total returns would have been lower had certain expenses not been reduced during the periods shown.B Total returns do not include the effect of the former sales charges.C Calculated based on average shares outstanding during the period. DExpense ratios reflect operating expenses of the fund. Expenses before reductions do not reflect amounts reimbursed by the investment adviser or reductions from brokerage service arrangements or other expense offset arrangements and do not represent the amount paid by the fund during periods when reimbursements or reductions occur. Expenses net of fee waivers reflect expenses after reimbursement by the investment adviser but prior to reductions from brokerage service arrangements or other expense offset arrangements. Expenses net of all reductions represent the net expenses paid by the fund. EFor the year ended February 29. FAmount represents less than $.01 per share.See accompanying notes which are an integral part of the financial statements.
Annual Report 30
Notes to Financial Statements
For the period ended February 28, 2006
|
1. Significant Accounting Policies.
|
Telecommunications Portfolio, Utilities Growth Portfolio, and Wireless Portfolio (the funds) are non-diversified funds of Fidelity Select Portfolios (the trust). The trust is registered under the Investment Company Act of 1940, as amended (the 1940 Act), as an open-end management investment company organized as a Massachusetts business trust. The funds invest primarily in securities of companies whose principal business activities fall within specific industries. Each fund is authorized to issue an unlimited number of shares. Certain funds may invest in affiliated money market central funds (Money Market Central Funds) which are open-end investment companies available to investment companies and other accounts managed by Fidelity Management & Research Company (FMR) and its affiliates. The financial statements have been prepared in conformity with accounting principles generally accepted in the United States of America, which require management to make certain estimates and assumptions at the date of the financial statements. The following summarizes the significant accounting policies of the funds:
Security Valuation. Investments are valued and net asset value (NAV) per share is calculated (NAV calculation) as of the close of business of the New York Stock Exchange (NYSE), normally 4:00 p.m. Eastern time. In addition, each fund intends to calculate a NAV each hour on the hour (commencing at 10:00 a.m. Eastern time until one hour prior to the close of business on the NYSE) under normal business conditions. Each fund’s investments are valued as of these times for the purpose of computing the fund’s hourly NAV. Wherever possible, each fund uses independent pricing services approved by the Board of Trustees to value their investments.
Equity securities, including restricted securities, for which market quotations are readily available, are valued at the last reported sale price or official closing price as reported by an independent pricing service on the primary market or exchange on which they are traded. In the event there were no sales during the day or closing prices are not available, securities are valued at the last quoted bid price. Investments in open-end mutual funds are valued at their closing net asset value each business day. Short-term securities with remaining maturities of sixty days or less for which quotations are not readily available are valued at amortized cost, which approximates value.
When current market prices or quotations are not readily available or do not accurately reflect fair value, valuations may be determined in accordance with procedures adopted by the Board of Trustees. For example, when developments occur between the close of a market and the close of the NYSE that may materially affect the value of some or all of the securities, or when trading in a security is halted, those securities may be fair valued. Factors used in the determination of fair value may include monitoring news to identify significant market or security specific events such as changes in the value of U.S. securities markets, reviewing developments in foreign markets and evaluating the performance of ADRs, futures contracts and exchange-traded funds. Because each fund’s utilization of fair value pricing depends on market activity, the frequency with which fair value pricing is used can not be predicted and may be utilized to a significant extent. The value of securities used for NAV calculation under fair value pricing may differ from published prices for the same securities. Fidelity may suspend the calculation of one or more hourly NAVs for funds for any period in which prices for a portion of the stocks or securities held by the funds are not readily available.
Foreign Currency. Certain funds may use foreign currency contracts to facilitate transactions in foreign-denominated securities. Losses from these transactions may arise from changes in the value of the foreign currency or if the counterparties do not perform under the contracts’ terms.
Foreign-denominated assets, including investment securities, and liabilities are translated into U.S. dollars at the exchange rate at period end. Purchases and sales of investment securities, income and dividends received and expenses denominated in foreign currencies are translated into U.S. dollars at the exchange rate in effect on the transaction date.
The effects of exchange rate fluctuations on investments are included with the net realized and unrealized gain (loss) on investment securities. Other foreign currency transactions resulting in realized and unrealized gain (loss) are disclosed separately.
Investment Transactions and Income. Security transactions are accounted for as of trade date. Gains and losses on securities sold are determined on the basis of identified cost and may include proceeds received from litigation. Dividend income is recorded on the ex-dividend date, except for certain dividends from foreign securities where the ex-dividend date may have passed, which are recorded as soon as the funds are informed of the ex-dividend date. Non-cash dividends included in dividend income, if any, are recorded at the fair market value of the securities received. Distributions received on securities that represent a return of capital or capital gain are recorded as a reduction of cost of investments and/or as a realized gain. The funds estimate the components of distributions received that may be considered return of capital distributions or capital gain distributions. Interest income is accrued as earned. Interest income includes coupon interest and amortization of premium and accretion of discount on debt securities. Investment income is recorded net of foreign taxes withheld where recovery of such taxes is uncertain.
Expenses. Most expenses of the trust can be directly attributed to a fund. Expenses which cannot be directly attributed are apportioned among each fund in the trust.
Income Tax Information and Distributions to Shareholders. Each year, each fund intends to qualify as a regulated investment company by distributing all of its taxable income and realized gains under Subchapter M of the Internal Revenue Code. As a result, no provision for income taxes is required in the accompanying financial statements. Foreign taxes are provided for based on each fund’s understanding of the tax rules and rates that exist in the foreign markets in which it invests.
31 Annual Report
Notes to Financial Statements - continued
1. Significant Accounting Policies - - continued
Income Tax Information and Distributions to Shareholders - continued
Distributions are recorded on the ex-dividend date. Income and capital gain distributions are determined in accordance with income tax regulations, which may differ from generally accepted accounting principles. In addition, certain funds will claim a portion of the payment made to redeeming shareholders as a distribution for income tax purposes.
Capital accounts within the financial statements are adjusted for permanent book-tax differences. These adjustments have no impact on net assets or the results of operations. Temporary book-tax differences will reverse in a subsequent period.
Book-tax differences are primarily due to foreign currency transactions, certain foreign taxes, non-taxable dividends, deferred trustees compensation, capital loss carryforwards, and losses deferred due to wash sales.
The tax-basis components of distributable earnings and the federal tax cost as of period end were as follows for each fund:
| | | Cost for | | | | | | | | | | Net Unrealized |
| | | Federal Income | | Unrealized | | | | Unrealized | | | | Appreciation/ |
| | | Tax Purposes | | Appreciation | | | | Depreciation | | | | (Depreciation) |
| Telecommunications Portfolio | | $ 380,246,570 | | $ 56,760,362 | | $ | | (23,958,499) | | $ | | 32,801,863 |
| Utilities Growth Portfolio | | 286,401,853 | | 23,666,248 | | | | (16,482,189) | | | | 7,184,059 |
| Wireless Portfolio | | 480,089,030 | | 53,567,165 | | | | (15,908,210) | | | | 37,658,955 |
| |
| | | | | | | | | Undistributed | | | | |
| | | | | Undistributed | | | | Long-term | | | | Capital Loss |
| | | | | Ordinary Income | | | | Capital Gain | | | | Carryforward |
| Telecommunications Portfolio | | | | $ 966,197 | | $ | | — | | $ | | (525,296,523) |
| Utilities Growth Portfolio | | | | 316,937 | | | | — | | | | (94,867,710) |
| Wireless Portfolio | | | | 158,119 | | | | 30,120,872 | | | | — |
| |
| The tax character of distributions paid was as follows: | | | | | | | | | | | | |
| |
| February 28, 2006 | | | | | | | | | | | | |
| | | | | | | | | | | | | Ordinary Income |
| Telecommunications Portfolio | | | | | | | | | | $ | | 3,005,035 |
| Utilities Growth Portfolio | | | | | | | | | | | | 6,178,163 |
| |
| February 28, 2005 | | | | | | | | | | | | |
| | | | | | | | | | | | | Ordinary Income |
| Telecommunications Portfolio | | | | | | | | | | $ | | 5,054,509 |
| Utilities Growth Portfolio | | | | | | | | | | | | 4,964,482 |
Trading (Redemption) Fees. Shares in the funds held less than 30 days are subject to a redemption fee equal to .75% of the net asset value of shares redeemed. All redemption fees, including any estimated redemption fees paid by FMR, are retained by the fund and accounted for as an addition to paid in capital. Shareholders are also subject to an additional $7.50 fee for shares exchanged into another Fidelity fund (see Note 4).
Repurchase Agreements. FMR has received an Exemptive Order from the Securities and Exchange Commission (the SEC) which permits certain funds and other affiliated entities of FMR to transfer uninvested cash balances into joint trading accounts which are then invested in repurchase agreements. Certain funds may also invest directly with institutions in repurchase agreements. Repurchase agreements are collateralized by government or non-government securities. Upon settlement date, collateral is held in segregated accounts with custodian banks and may be obtained in the event of a default of the counterparty. Each applicable fund monitors, on a daily basis, the value of the collateral to ensure it is at least equal to the principal amount of the repurchase agreement (including accrued interest). In the event of a default by the counterparty, realization of the collateral proceeds could be delayed, during which time the value of the collateral may decline.
Restricted Securities. Certain funds may invest in securities that are subject to legal or contractual restrictions on resale. These securities generally may be resold in transactions exempt from registration or to the public if the securities are registered. Disposal of these securities may involve time-consuming negotiations and expense, and prompt sale at an acceptable price may be difficult. Information regarding restricted securities is included at the end of each applicable fund’s Schedule of Investments.
| 3. Purchases and Sales of Investments. | | | | |
| |
| Purchases and sales of securities, other than short-term securities and U.S. government securities, are noted in the table below. | | |
| | | Purchases ($) | | Sales ($) |
| Telecommunications Portfolio | | 516,635,738 | | 510,994,912 |
| Utilities Growth Portfolio | | 321,534,809 | | 399,345,108 |
| Wireless Portfolio | | 699,246,687 | | 671,141,774 |
| |
| 4. Fees and Other Transactions with Affiliates. | | | | |
Management Fee. FMR and its affiliates provide the funds with investment management related services for which the funds pay a monthly management fee. The management fee is the sum of an individual fund fee rate and a group fee rate. The individual fund fee rate is applied to each fund’s average net assets. The group fee rate is based upon the average net assets of all the mutual funds advised by FMR. The group fee rate decreases as assets under management increase and increases as assets under management decrease. For the period, each fund’s annual management fee rate expressed as a percentage of each fund’s average net assets was as follows:
| | | Individual Rate | | Group Rate | | Total |
| Telecommunications Portfolio | | 30% | | .27% | | .57% |
| Utilities Growth Portfolio | | 30% | | .27% | | .57% |
| Wireless Portfolio | | 30% | | .27% | | .57% |
Sales Load. Fidelity Distributors Corporation (FDC), an affiliate of FMR, is the general distributor of the funds. Shares purchased prior to October 12, 1990, were subject to a 1% deferred sales charge upon redemption or exchange to any other Fidelity fund (other than Select funds). Effective July 1, 2005, the deferred sales charge was eliminated. For the period, sales charge amounts retained by FDC were as follows:
| | | Retained |
| | | by FDC |
| Telecommunications Portfolio | | $ 4,228 |
| Utilities Growth Portfolio | | 4,926 |
| Wireless Portfolio | | 175 |
Transfer Agent Fees. Fidelity Service Company, Inc. (FSC), an affiliate of FMR, is the funds’ transfer, dividend disbursing and shareholder servicing agent. FSC receives account fees and asset-based fees that vary according to account size and type of account. FSC pays for typesetting, printing and mailing of shareholder reports, except proxy statements. For the period, the transfer agent fees were equivalent to the following annual rates expressed as a percentage of average net assets:
| Telecommunications Portfolio | | 40% |
| Utilities Growth Portfolio | | 32% |
| Wireless Portfolio | | 35% |
Accounting and Security Lending Fees. FSC maintains each fund’s accounting records. The accounting fee is based on the level of average net assets for the month. Under a separate contract, FSC administers the security lending program. The security lending fee is based on the number and duration of lending transactions.
Affiliated Central Funds. Certain funds may invest in Money Market Central Funds which seek preservation of capital and current income and are managed by Fidelity Investments Money Management, Inc. (FIMM) an affiliate of FMR.
The Money Market Central Funds do not pay a management fee.
|
Exchange Fees. FSC receives the proceeds of $7.50 to cover administrative costs associated with exchanges out of the funds to any other Fidelity Select fund or to any other Fidelity fund. For the period, exchange fees retained by FSC were as follows:
| | | Retained |
| | | by FSC |
| Telecommunications Portfolio | | $ 7,830 |
| Utilities Growth Portfolio | | 5,970 |
| Wireless Portfolio | | 13,028 |
Brokerage Commissions. Certain funds placed a portion of their portfolio transactions with brokerage firms which are affiliates of the investment adviser. The commissions paid to these affiliated firms were as follows:
| | | Amount |
| Telecommunications Portfolio | | $ 48,031 |
| Utilities Growth Portfolio | | 17,015 |
| Wireless Portfolio | | 25,931 |
33 Annual Report
Notes to Financial Statements - continued
5. Committed Line of Credit.
|
Certain funds participate with other funds managed by FMR in a $4.2 billion credit facility (the “line of credit”) to be utilized for temporary or emergency purposes to fund shareholder redemptions or for other short-term liquidity purposes. The participating funds have agreed to pay commitment fees on their pro rata portion of the line of credit. During the period, there were no borrowings on this line of credit.
Certain funds lend portfolio securities from time to time in order to earn additional income. On the settlement date of the loan, each applicable fund receives collateral (in the form of U.S. Treasury obligations, letters of credit and/or cash) against the loaned securities and maintains collateral in an amount not less than 100% of the market value of the loaned securities during the period of the loan. The market value of the loaned securities is determined at the close of business of the funds and any additional required collateral is delivered to the funds on the next business day. If the borrower defaults on its obligation to return the securities loaned because of insolvency or other reasons, a fund could experience delays and costs in recovering the securities loaned or in gaining access to the collateral. Any cash collateral received is invested in the Fidelity Securities Lending Cash Central Fund. The value of loaned securities and cash collateral at period end are disclosed on each applicable fund’s Statement of Assets and Liabilities. Security lending income represents the income earned on investing cash collateral, less fees and expenses associated with the loan, plus any premium payments that may be received on the loan of certain types of securities. Security lending income is presented on each applicable fund’s Statement of Operations as a component of income from affiliated central funds.
Many of the brokers with whom FMR places trades on behalf of certain funds provided services to these funds in addition to trade execution. These services included payments of expenses on behalf of each applicable fund. In addition, through arrangements with each applicable fund’s custodian and transfer agent, credits realized as a result of uninvested cash balances were used to reduce each applicable fund’s expenses. All of the applicable expense reductions are noted in the table below.
| | | | | | | | | | | Transfer |
| | | | | | | Custody | | | | Agent |
| | | Brokerage Service | | | | expense | | | | expense |
| | | Arrangements | | | | reduction | | | | reduction |
| Telecommunications Portfolio | | $ 305,144 | | $ | | 225 | | $ | | 3,225 |
| Utilities Growth Portfolio | | 141,020 | | | | — | | | | 3,460 |
| Wireless Portfolio | | 466,872 | | | | — | | | | 6,090 |
| |
| |
| 8. Other. | | | | | | | | | | |
The funds’ organizational documents provide former and current trustees and officers with a limited indemnification against liabilities arising in connection with the performance of their duties to the funds. In the normal course of business, the funds may also enter into contracts that provide general indemnifications. The funds’ maximum exposure under these arrangements is unknown as this would be dependent on future claims that may be made against the funds. The risk of material loss from such claims is considered remote.
Report of Independent Registered Public Accounting Firm
To the Trustees of Fidelity Select Portfolios and the Shareholders of Telecommunications Portfolio, Utilities Growth Portfolio, and Wireless Portfolio:
In our opinion, the accompanying statements of assets and liabilities, including the schedules of investments, and the related statements of operations and of changes in net assets and the financial highlights present fairly, in all material respects, the financial position of Telecommunications Portfolio, Utilities Growth Portfolio, and Wireless Portfolio(funds of Fidelity Select Porfolios) at February 28, 2006, and the results of each of their operations, the changes in each of their net assets and the financial highlights for each of the periods indicated, in conformity with accounting principles generally accepted in the United States of America. These financial statements and financial highlights (hereafter referred to as “financial statements”) are the responsibility of the Fidelity Select Portfolios’ management; our responsibility is to express an opinion on these financial statements based on our audits. We conducted our audits of these financial statements in accordance with the standards of the Public Company Accounting Oversight Board (United States). Those standards require that we plan and perform the audit to obtain reasonable assurance about whether the financial statements are free of material misstatement. An audit includes examining, on a test basis, evidence supporting the amounts and disclosures in the financial statements, assessing the accounting principles used and significant estimates made by management, and evaluating the overall financial statement presentation. We believe that our audits, which included confirmation of securities at February 28, 2006 by correspondence with the custodian and brokers, provide a reasonable basis for our opinion.
/s/ PricewaterhouseCoopers LLP
PricewaterhouseCoopers LLP
Boston, Massachusetts
April 13, 2006
|
35 Annual Report
Trustees and Officers
The Trustees, Members of the Advisory Board, and executive officers of the trust and funds, as applicable, are listed below. The Board of Trustees governs each fund and is responsible for protecting the interests of shareholders. The Trustees are experienced executives who meet periodically throughout the year to oversee each fund’s activities, review contractual arrangements with companies that provide services to each fund, and review each fund’s performance. Except for William O. McCoy, each of the Trustees oversees 326 funds advised by FMR or an affiliate. Mr. McCoy oversees 328 funds advised by FMR or an affiliate.
The Trustees hold office without limit in time except that (a) any Trustee may resign; (b) any Trustee may be removed by written instrument, signed by at least two-thirds of the number of Trustees prior to such removal; (c) any Trustee who requests to be retired or who has become incapacitated by illness or injury may be retired by written instrument signed by a majority of the other Trustees; and (d) any Trustee may be removed at any special meeting of shareholders by a two-thirds vote of the outstanding voting securities of the trust. Each Trustee who is not an interested person (as defined in the 1940 Act) (Independent Trustee), shall retire not later than the last day of the calendar year in which his or her 72nd birthday occurs. The Independent Trustees may waive this mandatory retirement age policy with respect to individual Trustees. The executive officers and Advisory Board Members hold office without limit in time, except that any officer and Advisory Board Member may resign or may be removed by a vote of a majority of the Trustees at any regular meeting or any special meeting of the Trustees. Except as indicated, each individual has held the office shown or other offices in the same company for the past five years.
The funds’ Statement of Additional Information (SAI) includes more information about the Trustees. To request a free copy, call Fidelity at 1-800-544-8544.
Interested Trustees*:
Correspondence intended for each Trustee who is an interested person may be sent to Fidelity Investments, 82 Devonshire Street, Boston, Massachusetts 02109.
| Name, Age; Principal Occupation |
| |
| Edward C. Johnson 3d (75) |
| |
| Year of Election or Appointment: 1980 |
| Mr. Johnson is Chairman of the Board of Trustees. Mr. Johnson serves as Chief Executive Officer, Chairman, and a Director of FMR |
| Corp.; a Director and Chairman of the Board and of the Executive Committee of FMR; Chairman and a Director of Fidelity Re- |
| search & Analysis Company; Chairman and a Director of Fidelity Investments Money Management, Inc.; and Chairman |
| (2001-present) and a Director (2000-present) of FMR Co., Inc. |
| |
| Stephen P. Jonas (53) |
| |
| Year of Election or Appointment: 2005 |
| Mr. Jonas is Senior Vice President of Telecommunications (2005-present), Utilities Growth (2005-present), and Wireless |
| (2005-present). He also serves as Senior Vice President of other Fidelity funds (2005-present). Mr. Jonas is Executive Director of |
| FMR (2005-present). Previously, Mr. Jonas served as President of Fidelity Enterprise Operations and Risk Services (2004-2005), |
| Chief Administrative Officer (2002-2004), and Chief Financial Officer of FMR Co. (1998-2000). Mr. Jonas has been with Fidelity |
| Investments since 1987 and has held various financial and management positions including Chief Financial Officer of FMR. In |
| addition, he serves on the Boards of Boston Ballet (2003-present) and Simmons College (2003-present). |
| |
| Robert L. Reynolds (53) |
| |
| Year of Election or Appointment: 2003 |
| Mr. Reynolds is a Director (2003-present) and Chief Operating Officer (2002-present) of FMR Corp. He also serves on the Board |
| at Fidelity Investments Canada, Ltd. (2000-present). Previously, Mr. Reynolds served as President of Fidelity Investments Institutional |
| Retirement Group (1996-2000). |
* Trustees have been determined to be “Interested Trustees” by virtue of, among other things, their affiliation with the trust or various entities under common control with FMR.
Annual Report 36
Independent Trustees:
Correspondence intended for each Independent Trustee (that is, the Trustees other than the Interested Trustees) may be sent to Fidelity Investments, P.O. Box 55235, Boston, Massachusetts 02205-5235.
| Name, Age; Principal Occupation |
| |
| Dennis J. Dirks (57) |
| |
| Year of Election or Appointment: 2005 |
| Prior to his retirement in May 2003, Mr. Dirks was Chief Operating Officer and a member of the Board of The Depository Trust & |
| Clearing Corporation (DTCC) (1999-2003). He also served as President, Chief Operating Officer, and Board member of The De- |
| pository Trust Company (DTC) (1999-2003) and President and Board member of the National Securities Clearing Corporation |
| (NSCC) (1999-2003). In addition, Mr. Dirks served as Chief Executive Officer and Board member of the Government Securities |
| Clearing Corporation (2001-2003) and Chief Executive Officer and Board member of the Mortgage-Backed Securities Clearing |
| Corporation (2001-2003). Mr. Dirks also serves as a Trustee and a member of the Finance Committee of Manhattan College |
| (2005-present) and a Trustee and a member of the Finance Committee of AHRC of Nassau County (2006-present). |
| |
| Robert M. Gates (62) |
| |
| Year of Election or Appointment: 1997 |
| Dr. Gates is Chairman of the Independent Trustees (2006-present). Dr. Gates is President of Texas A&M University (2002-present). |
| He was Director of the Central Intelligence Agency (CIA) from 1991 to 1993. From 1989 to 1991, Dr. Gates served as Assistant |
| to the President of the United States and Deputy National Security Advisor. Dr. Gates is a Director of NACCO Industries, Inc. |
| (mining and manufacturing), Parker Drilling Co., Inc. (drilling and rental tools for the energy industry, 2001-present), and Brinker |
| International (restaurant management, 2003-present). Previously, Dr. Gates served as a Director of LucasVarity PLC (automotive |
| components and diesel engines), a Director of TRW Inc. (automotive, space, defense, and information technology), and Dean of |
| the George Bush School of Government and Public Service at Texas A&M University (1999-2001). |
| |
| George H. Heilmeier (69) |
| |
| Year of Election or Appointment: 2004 |
| Dr. Heilmeier is Chairman Emeritus of Telcordia Technologies (communication software and systems), where prior to his retirement, |
| he served as company Chairman and Chief Executive Officer. He currently serves on the Boards of Directors of The Mitre Corpo- |
| ration (systems engineering and information technology support for the government), and HRL Laboratories (private research and |
| development, 2004-present). He is Chairman of the General Motors Science & Technology Advisory Board and a Life Fellow of |
| the Institute of Electrical and Electronics Engineers (IEEE). Dr. Heilmeier is a member of the Defense Science Board and the National |
| Security Agency Advisory Board. He is also a member of the National Academy of Engineering, the American Academy of Arts |
| and Sciences, and the Board of Overseers of the School of Engineering and Applied Science of the University of Pennsylvania. |
| Previously, Dr. Heilmeier served as a Director of TRW Inc. (automotive, space, defense, and information technology, 1992-2002), |
| Compaq (1994-2002), Automatic Data Processing, Inc. (ADP) (technology-based business outsourcing, 1995-2002), INET |
| Technologies Inc. (telecommunications network surveillance, 2001-2004), and Teletech Holdings (customer management services). |
| He is the recipient of the 2005 Kyoto Prize in Advanced Technology for his invention of the liquid crystal display. |
| |
| Marie L. Knowles (59) |
| |
| Year of Election or Appointment: 2001 |
| Prior to Ms. Knowles’ retirement in June 2000, she served as Executive Vice President and Chief Financial Officer of Atlantic Rich- |
| field Company (ARCO) (diversified energy, 1996-2000). From 1993 to 1996, she was a Senior Vice President of ARCO and |
| President of ARCO Transportation Company. She served as a Director of ARCO from 1996 to 1998. She currently serves as a |
| Director of Phelps Dodge Corporation (copper mining and manufacturing) and McKesson Corporation (healthcare service, |
| 2002-present). Ms. Knowles is a Trustee of the Brookings Institution and the Catalina Island Conservancy and also serves as a |
| member of the Advisory Board for the School of Engineering of the University of Southern California. |
| |
| Ned C. Lautenbach (62) |
| |
| Year of Election or Appointment: 2000 |
| Mr. Lautenbach has been a partner of Clayton, Dubilier & Rice, Inc. (private equity investment firm) since September 1998. Pre- |
| viously, Mr. Lautenbach was with the International Business Machines Corporation (IBM) from 1968 until his retirement in 1998. |
| Mr. Lautenbach serves as a Director of Italtel Holding S.p.A. (telecommunications (Milan, Italy), 2004-present) and Eaton Corpora- |
| tion (diversified industrial) as well as the Philharmonic Center for the Arts in Naples, Florida. He also is a member of the Board of |
| Trustees of Fairfield University (2005-present), as well as a member of the Council on Foreign Relations. |
37 Annual Report
Trustees and Officers - continued
| Name, Age; Principal Occupation |
| |
| William O. McCoy (72) |
| |
| Year of Election or Appointment: 1997 |
| Prior to his retirement in December 1994, Mr. McCoy was Vice Chairman of the Board of BellSouth Corporation (telecommunica- |
| tions) and President of BellSouth Enterprises. He is currently a Director of Duke Realty Corporation (real estate), and Progress |
| Energy, Inc. (electric utility). He is also a partner of Franklin Street Partners (private investment management firm) and a member of |
| the Research Triangle Foundation Board. In addition, Mr. McCoy served as the Interim Chancellor (1999-2000) and a member of |
| the Board of Visitors for the University of North Carolina at Chapel Hill and currently serves as Chairman of the Board of Directors |
| of the University of North Carolina Health Care System and the Board of Visitors of the Kenan-Flagler Business School (University |
| of North Carolina at Chapel Hill). He also served as Vice President of Finance for the University of North Carolina (16-school |
| system). |
| |
| Cornelia M. Small (61) |
| |
| Year of Election or Appointment: 2005 |
| Ms. Small is a member (2000-present) and Chairperson (2002-present) of the Investment Committee, and a member |
| (2002-present) of the Board of Trustees of Smith College. Previously, she served as Chief Investment Officer (1999-2000), Director |
| of Global Equity Investments (1996-1999), and a member of the Board of Directors of Scudder, Stevens & Clark (1990-1997) and |
| Scudder Kemper Investments (1997-1999). In addition, Ms. Small served as Co-Chair (2000-2003) of the Annual Fund for the |
| Fletcher School of Law and Diplomacy. |
| |
| William S. Stavropoulos (66) |
| |
| Year of Election or Appointment: 2001 |
| Mr. Stavropoulos is Chairman of the Board (2000-present) and a Member of the Board of Directors of The Dow Chemical |
| Company. Since joining The Dow Chemical Company in 1967, Mr. Stavropoulos served in numerous senior management posi- |
| tions, including President (1993-2000; 2002-2003), CEO (1995-2000; 2002-2004), and Chairman of the Executive Committee |
| (2000-2004). Currently, he is a Director of NCR Corporation (data warehousing and technology solutions), BellSouth Corporation |
| (telecommunications), Chemical Financial Corporation, Maersk Inc. (industrial conglomerate, 2002-present), and Metalmark Capi- |
| tal (private equity investment firm, 2005-present). He also serves as a member of the Board of Trustees of the American Enterprise |
| Institute for Public Policy Research. In addition, Mr. Stavropoulos is a member of The Business Council, J.P. Morgan International |
| Council and the University of Notre Dame Advisory Council for the College of Science. |
| |
| Kenneth L. Wolfe (67) |
| |
| Year of Election or Appointment: 2005 |
| Prior to his retirement in 2001, Mr. Wolfe was Chairman and Chief Executive Officer of Hershey Foods Corporation (1993-2001). |
| He currently serves as a member of the boards of Adelphia Communications Corporation (2003-present), Bausch & Lomb, Inc., |
| and Revlon Inc. (2004-present). |
Advisory Board Members and Executive Officers:
Correspondence intended for Messrs. Keyes and Gamper may be sent to Fidelity Investments, P.O. Box 55235, Boston, Massachusetts 02205-5235. Correspondence intended for each executive officer and Mr. Lynch may be sent to Fidelity Investments, 82 Devonshire Street, Boston, Massachusetts 02109.
| Name, Age; Principal Occupation |
| |
| Albert R. Gamper, Jr. (63) |
| |
| Year of Election or Appointment: 2005 |
| Member of the Advisory Board of Fidelity Select Portfolios. Mr. Gamper also serves as a Trustee (2006-present) or Member of the |
| Advisory Board (2005-present) of other investment companies advised by FMR. Prior to his retirement in December 2004, Mr. |
| Gamper served as Chairman of the Board of CIT Group Inc. (commercial finance). During his tenure with CIT Group Inc. Mr. |
| Gamper served in numerous senior management positions, including Chairman (1987-1989; 1999-2001; 2002-2004), Chief |
| Executive Officer (1987-2004), and President (1989-2002). He currently serves as a member of the Board of Directors of Public |
| Service Enterprise Group (utilities, 2001-present), Chairman of the Board of Governors, Rutgers University (2004-present), and |
| Chairman of the Board of Saint Barnabas Health Care System. |
| |
| James H. Keyes (65) |
| |
| Year of Election or Appointment: 2006 |
| Member of the Advisory Board of Fidelity Select Portfolios. Prior to his retirement in 2003, Mr. Keyes was Chairman, President, |
| and Chief Executive Officer of Johnson Controls, Inc. (automotive supplier, 1993-2003). He currently serves as a member of the |
| boards of LSI Logic Corporation (semiconductor technologies, 1984-present), Navistar International Corporation (manufacture and |
| sale of trucks, buses, and diesel engines, 2002-present), and Pitney Bowes, Inc. (integrated mail, messaging, and document man- |
| agement solutions, 1998-present). |
Annual Report 38
| Name, Age; Principal Occupation |
| |
| Peter S. Lynch (62) |
| |
| Year of Election or Appointment: 2003 |
| Member of the Advisory Board of Fidelity Select Portfolios. Vice Chairman and a Director of FMR, and Vice Chairman |
| (2001-present) and a Director (2000-present) of FMR Co., Inc. Previously, Mr. Lynch served as a Trustee of the Fidelity funds |
| (1990-2003). In addition, he serves as a Trustee of Boston College, Massachusetts Eye & Ear Infirmary, Historic Deerfield, John F. |
| Kennedy Library, and the Museum of Fine Arts of Boston. |
| |
| Eric D. Roiter (57) |
| |
| Year of Election or Appointment: 1998 or 2000 |
| Secretary of Telecommunications (1998), Utilities Growth (1998), and Wireless (2000). He also serves as Secretary of other |
| Fidelity funds; Vice President, General Counsel, and Secretary of FMR Co., Inc. (2001-present) and FMR; Assistant Secretary of |
| Fidelity Management & Research (U.K.) Inc. (2001-present), Fidelity Research & Analysis Company (2001-present), and Fidelity |
| Investments Money Management, Inc. (2001-present). Mr. Roiter is an Adjunct Member, Faculty of Law, at Boston College Law |
| School (2003-present). Previously, Mr. Roiter served as Vice President and Secretary of Fidelity Distributors Corporation (FDC) |
| (1998-2005). |
| |
| Stuart Fross (46) |
| |
| Year of Election or Appointment: 2003 |
| Assistant Secretary of Telecommunications, Utilities Growth, and Wireless. Mr. Fross also serves as Assistant Secretary of other |
| Fidelity funds (2003-present), Vice President and Secretary of FDC (2005-present), and is an employee of FMR. |
| Christine Reynolds (47) |
| |
| Year of Election or Appointment: 2004 |
| President and Treasurer of Telecommunications, Utilities Growth, and Wireless. Ms. Reynolds also serves as President and Treasurer |
| of other Fidelity funds (2004-present) and is a Vice President (2003-present) and an employee (2002-present) of FMR. Before join- |
| ing Fidelity Investments, Ms. Reynolds worked at PricewaterhouseCoopers LLP (PwC) (1980-2002), where she was most recently an |
| audit partner with PwC’s investment management practice. |
| |
| R. Stephen Ganis (39) |
| |
| Year of Election or Appointment: 2006 |
| Anti-Money Laundering (AML) officer of Telecommunications, Utilities Growth, and Wireless. Mr. Ganis also serves as AML officer |
| of other Fidelity funds (2006-present) and FMR Corp. (2003-present). Before joining Fidelity Investments, Mr. Ganis practiced law |
| at Goodwin Procter, LLP (2000-2002). |
| Paul M. Murphy (58) |
| |
| Year of Election or Appointment: 2005 |
| Chief Financial Officer of Telecommunications, Utilities Growth, and Wireless. Mr. Murphy also serves as Chief Financial Officer of |
| other Fidelity funds (2005-present). He also serves as Senior Vice President of Fidelity Pricing and Cash Management Services |
| Group (FPCMS). |
| Kenneth A. Rathgeber (58) |
| |
| Year of Election or Appointment: 2004 |
| Chief Compliance Officer of Telecommunications, Utilities Growth, and Wireless. Mr. Rathgeber also serves as Chief Compliance |
| Officer of other Fidelity funds (2004-present) and Executive Vice President of Risk Oversight for Fidelity Investments (2002-present). |
| He is Chief Compliance Officer of FMR (2005-present), FMR Co., Inc. (2005-present), Fidelity Management & Research (U.K.) Inc. |
| (2005-present), Fidelity Research & Analysis Company (2005-present), Fidelity Investments Money Management, Inc. |
| (2005-present), and Strategic Advisers, Inc. (2005-present). Previously, Mr. Rathgeber served as Executive Vice President and |
| Chief Operating Officer for Fidelity Investments Institutional Services Company, Inc. (1998-2002). |
| |
| Bryan A. Mehrmann (44) |
| |
| Year of Election or Appointment: 2005 |
| Deputy Treasurer of Telecommunications, Utilities Growth, and Wireless. Mr. Mehrmann also serves as Deputy Treasurer of other |
| Fidelity funds (2005-present) and is an employee of FMR. Previously, Mr. Mehrmann served as Vice President of Fidelity Invest- |
| ments Institutional Services Group (FIIS)/Fidelity Investments Institutional Operations Corporation, Inc. (FIIOC) Client Services |
| (1998-2004). |
| |
| Kimberley H. Monasterio (42) |
| |
| Year of Election or Appointment: 2004 |
| Deputy Treasurer of Telecommunications, Utilities Growth, and Wireless. Ms. Monasterio also serves as Deputy Treasurer of other |
| Fidelity funds (2004) and is an employee of FMR (2004). Before joining Fidelity Investments, Ms. Monasterio served as Treasurer |
| (2000-2004) and Chief Financial Officer (2002-2004) of the Franklin Templeton Funds and Senior Vice President of Franklin Tem- |
| pleton Services, LLC (2000-2004). |
39 Annual Report
Trustees and Officers - continued
| Name, Age; Principal Occupation |
| |
| Kenneth B. Robins (36) |
| |
| Year of Election or Appointment: 2005 |
| Deputy Treasurer of Telecommunications, Utilities Growth, and Wireless. Mr. Robins also serves as Deputy Treasurer of other |
| Fidelity funds (2005-present) and is an employee of FMR (2004-present). Before joining Fidelity Investments, Mr. Robins worked at |
| KPMG LLP, where he was a partner in KPMG’s department of professional practice (2002-2004) and a Senior Manager |
| (1999-2000). In addition, Mr. Robins served as Assistant Chief Accountant, United States Securities and Exchange Commission |
| (2000-2002). |
| |
| Robert G. Byrnes (39) |
| |
| Year of Election or Appointment: 2005 |
| Assistant Treasurer of Telecommunications, Utilities Growth, and Wireless. Mr. Byrnes also serves as Assistant Treasurer of other |
| Fidelity funds (2005-present) and is an employee of FMR (2005-present). Previously, Mr. Byrnes served as Vice President of |
| FPCMS (2003-2005). Before joining Fidelity Investments, Mr. Byrnes worked at Deutsche Asset Management where he served as |
| Vice President of the Investment Operations Group (2000-2003). |
| |
| John H. Costello (59) |
| |
| Year of Election or Appointment: 1986 or 2000 |
| Assistant Treasurer of Telecommunications (1986), Utilities Growth (1986), and Wireless (2000). Mr. Costello also serves as Assis- |
| tant Treasurer of other Fidelity funds and is an employee of FMR. |
| Peter L. Lydecker (52) |
| |
| Year of Election or Appointment: 2004 |
| Assistant Treasurer of Telecommunications, Utilities Growth, and Wireless. Mr. Lydecker also serves as Assistant Treasurer of other |
| Fidelity funds (2004) and is an employee of FMR. |
| Mark Osterheld (50) |
| |
| Year of Election or Appointment: 2002 |
| Assistant Treasurer of Telecommunications, Utilities Growth, and Wireless. Mr. Osterheld also serves as Assistant Treasurer of other |
| Fidelity funds (2002) and is an employee of FMR. |
| Gary W. Ryan (47) |
| |
| Year of Election or Appointment: 2005 |
| Assistant Treasurer of Telecommunications, Utilities Growth, and Wireless. Mr. Ryan also serves as Assistant Treasurer of other |
| Fidelity funds (2005-present) and is an employee of FMR (2005-present). Previously, Mr. Ryan served as Vice President of Fund |
| Reporting in FPCMS (1999-2005). |
| Salvatore Schiavone (40) |
| |
| Year of Election or Appointment: 2005 |
| Assistant Treasurer of Telecommunications, Utilities Growth, and Wireless. Mr. Schiavone also serves as Assistant Treasurer of other |
| Fidelity funds (2005-present) and is an employee of FMR (2005-present). Before joining Fidelity Investments, Mr. Schiavone |
| worked at Deutsche Asset Management, where he most recently served as Assistant Treasurer (2003-2005) of the Scudder Funds |
| and Vice President and Head of Fund Reporting (1996-2003). |
Annual Report 40
The Board of Trustees of each fund voted to pay to shareholders of record at the opening of business on record date, the following distributions per share derived from capital gains realized from sales of portfolio securities, and dividends derived from net investment income:
| Fund | | Pay Date | | Record Date | | Dividends | | Capital Gains |
| Telecommunications | | 4/10/06 | | 4/7/06 | | $ .07 | | $ | | — |
| Utilities Growth | | 4/10/06 | | 4/7/06 | | $ .06 | | $ | | — |
| Wireless | | 4/10/06 | | 4/7/06 | | $ — | | $ | | .44 |
The funds hereby designate as capital gain dividend the amounts noted below for the taxable year ended February 28, 2006, or, if subsequently determined to be different, the net capital gain of such year.
| Fund | | |
| Wireless | | $30,705,556 |
A percentage of the dividends distributed during the fiscal year for the following funds qualifies for the dividends-received deduction for corporate shareholders:
| Telecommunications | | April 2005 | | 100% |
| | | December 2005 | | 100% |
| Utilities Growth | | April 2005 | | 100% |
| | | December 2005 | | 100% |
A percentage of the dividends distributed during the fiscal year for the following funds may be taken into account as a dividend for purposes of the maximum rate under section 1(h)(11) of the Internal Revenue Code.
| Telecommunications | | April 2005 | | 100% |
| | | December 2005 | | 100% |
| Utilities Growth | | April 2005 | | 100% |
| | | December 2005 | | 100% |
The funds will notify shareholders in January 2007 of amounts for use in preparing 2006 income tax returns.
41 Annual Report
Board Approval of Investment Advisory Contracts and Management Fees
Select Telecommunications
Select Utilities Growth
Select Wireless
On January 19, 2006, the Board of Trustees, including the Independent Trustees (together, the Board), voted to approve a general research services agreement (the Agreement) between FMR, FMR Co., Inc. (FMRC), Fidelity Investments Money Management, Inc. (FIMM), and Fidelity Research & Analysis Company (FRAC) (together, the Investment Advisers) for each fund, effective January 20, 2006, pursuant to which FRAC may provide general research and investment advisory support services to FMRC and FIMM. The Board considered that it has approved previously various sub-advisory agreements for each fund with affiliates of FMR that allow FMR to obtain research, non-discretionary advice, or discretionary portfolio management at no additional expense to each fund. The Board, assisted by the advice of fund counsel and independent Trustees’ counsel, considered a broad range of information and determined that it would be beneficial for each fund to access the research and investment advisory support services supplied by FRAC at no additional expense to each fund.
The Board reached this determination in part because the new arrangement will involve no changes in (i) the contractual terms of and fees payable under each fund’s management contract or sub-advisory agreements; (ii) the investment process or strategies employed in the management of each fund’s assets; (iii) the nature or level of services provided under each fund’s management contract or sub-advisory agreements; (iv) the day-to-day management of each fund or the persons primarily responsible for such management; or (v) the ultimate control or beneficial ownership of FMR, FMRC, or FIMM. The Board also considered that the establishment of each Agreement would not necessitate prior shareholder approval of the Agreement or result in an assignment and termination of each fund’s management contract or sub-advisory agreements under the Investment Company Act of 1940.
Because the Board was approving an arrangement with FRAC under which each fund will not bear any additional management fees or expenses and under which each fund’s portfolio manager would not change, it did not consider each fund’s investment performance, competitiveness of management fee and total expenses, costs of services and profitability, or economies of scale to be significant factors in its decision.
In connection with its future renewal of each fund’s management contract and sub-advisory agreements, the Board will consider: (i) the nature, extent, and quality of services provided to each fund, including shareholder and administrative services and investment performance; (ii) the competitiveness of each fund’s management fee and total expenses; (iii) the costs of the services and profitability, including the revenues earned and the expenses incurred by Fidelity in conducting the business of developing, marketing, distributing, managing, administering, and servicing each fund and its shareholders; and (iv) whether there have been economies of scale in respect of the management of the Fidelity funds, whether the Fidelity funds (including each fund) have appropriately benefited from any such economies of scale, and whether there is potential for realization of any further economies.
Based on its evaluation of all of the conclusions noted above, and after considering all material factors, the Board ultimately concluded that each fund’s Agreement is fair and reasonable, and that each fund’s Agreement should be approved.
Managing Your Investments
Fidelity offers several ways to conveniently manage your personal investments via your telephone or PC. You can access your account information, conduct trades and research your investments 24 hours a day.
By Phone
Fidelity Automated Service Telephone provides a single toll-free number to access account balances, positions, quotes and trading. It’s easy to navigate the service, and on your first call, the system will help you create a personal identification number (PIN) for security.
By PC
Fidelity’s web site on the Internet provides a wide range of information, including daily financial news, fund performance, interactive planning tools and news about Fidelity products and services.
* When you call the quotes line, please remember that a fund’s yield and return will vary and, except for money market funds, share price will also vary. This means that you may have a gain or loss when you sell your shares. There is no assurance that money market funds will be able to maintain a stable $1 share price; an investment in a money market fund is not insured or guaranteed by the U.S. government. Total returns are historical and include changes in share price, reinvestment of dividends and capital gains, and the effects of any sales charges.
43 43 Annual Report
To Write Fidelity
We’ll give your correspondence immediate attention and send you written confirmation upon completion of your request.
Investment Adviser
Fidelity Management & Research Company
Boston, MA
Investment Sub-Advisers
FMR Co., Inc.
Fidelity Management & Research (U.K.) Inc.
Fidelity Research & Analysis Company (formerly Fidelity Management & Research (Far East) Inc.)
Fidelity Investments Japan Limited
Fidelity International Investment Advisors
Fidelity International Investment Advisors (U.K. Limited)
General Distributor
Fidelity Distributors Corporation
Boston, MA
Transfer and Service Agent
Fidelity Service Company, Inc.
Boston, MA
Custodian
Brown Brothers Harriman & Co.
Boston, MA
Corporate Headquarters
82 Devonshire Street
Boston, MA 02109
1-800-544-8888
The Fidelity Telephone Connection
Mutual Fund 24-Hour Service
Exchanges/Redemptions
and Account Assistance 1-800-544-6666
Product Information 1-800-544-8888
Retirement Accounts 1-800-544-4774
(8 a.m. - 9 p.m.)
TDD Service 1-800-544-0118
for the deaf and hearing impaired
(9 a.m. - 9 p.m. Eastern time)
Fidelity Automated Service
Telephone (FAST®) (automated graphic) 1-800-544-5555
| | (automated graphic) Automated line for quickest service
|
| SELUTL-UANN-0406 | | Corporate Headquarters |
| 1.813624.101 | | 82 Devonshire St., Boston, MA 02109 |
| | | www.fidelity.com |
Item 2. Code of Ethics
As of the end of the period, February 28, 2006, Fidelity Select Portfolios (the trust) has adopted a code of ethics, as defined in Item 2 of Form N-CSR, that applies to its President and Treasurer and its Chief Financial Officer. A copy of the code of ethics is filed as an exhibit to this Form N-CSR.
Item 3. Audit Committee Financial Expert
The Board of Trustees of the trust has determined that Marie L. Knowles is an audit committee financial expert, as defined in Item 3 of Form N-CSR. Ms. Knowles is independent for purposes of Item 3 of Form N-CSR.
Item 4. Principal Accountant Fees and Services
(a) Audit Fees.
For the fiscal years ended February 28, 2006 and February 28, 2005, the aggregate Audit Fees billed by PricewaterhouseCoopers LLP (PwC) for professional services rendered for the audits of the financial statements, or services that are normally provided in connection with statutory and regulatory filings or engagements for those fiscal years, for the Air Transportation Portfolio, Automotive Portfolio, Banking Portfolio, Biotechnology Portfolio, Brokerage and Investment Management Portfolio, Business Services and Outsourcing Portfolio, Chemicals Portfolio, Computers Portfolio, Construction and Housing Portfolios, Consumer Industries Portfolio, Cyclical Industries Portfolio, Defense and Aerospace Portfolio, Developing Communications Portfolio, Electronics Portfolio, Energy Portfolio, Energy Service Portfolio, Environmental Portfolio, Financial Services Portfolio, Food and Agriculture Portfolio, Gold Portfolio, Health Care Portfolio, Home Finance Portfolio, Industrial Equipment Portfolio, Industrial Materials Portfolio, Insurance Portfolio, Leisure Portfolio, Medical Delivery Portfolio, Medical Equipment and Systems Portfolio, Money Market Portfolio, Multimedia Portfolio, Natural Gas Portfolio, Natural Resources Portfolio, Networking and Infrastructure Portfolio, Paper and Forest Products Portfolio, Pharmaceuticals Portfolio, Retailing Portfolio, Software and Computer Services Portfolio, Technology Portfolio, Telecommunications Portfolio, Transportation Portfolio, Utilities Growth Portfolio and Wireless Portfolio (the funds) and for all funds in the Fidelity Group of Funds are shown in the table below.
Fund | 2006A | 2005A |
Air Transportation Portfolio | $28,000 | $32,000 |
Automotive Portfolio | $28,000 | $32,000 |
Banking Portfolio | $30,000 | $34,000 |
Biotechnology Portfolio | $33,000 | $37,000 |
Brokerage and Investment Management Portfolio | $31,000 | $33,000 |
Business Services and Outsourcing Portfolio | $28,000 | $32,000 |
Chemicals Portfolio | $29,000 | $32,000 |
Computers Portfolio | $30,000 | $34,000 |
Construction and Housing Portfolios | $29,000 | $32,000 |
Consumer Industries Portfolio | $28,000 | $32,000 |
Cyclical Industries Portfolio | $29,000 | $33,000 |
Defense and Aerospace Portfolio | $31,000 | $33,000 |
Developing Communications Portfolio | $30,000 | $34,000 |
Electronics Portfolio | $36,000 | $40,000 |
Energy Portfolio | $34,000 | $33,000 |
Energy Service Portfolio | $32,000 | $33,000 |
Environmental Portfolio | $28,000 | $32,000 |
Financial Services Portfolio | $31,000 | $34,000 |
Food and Agriculture Portfolio | $29,000 | $32,000 |
Gold Portfolio | $31,000 | $34,000 |
Health Care Portfolio | $36,000 | $37,000 |
Home Finance Portfolio | $30,000 | $34,000 |
Industrial Equipment Portfolio | $28,000 | $32,000 |
Industrial Materials Portfolio | $29,000 | $32,000 |
Insurance Portfolio | $29,000 | $33,000 |
Leisure Portfolio | $29,000 | $33,000 |
Medical Delivery Portfolio | $32,000 | $33,000 |
Medical Equipment and Systems Portfolio | $32,000 | $34,000 |
Money Market Portfolio | $28,000 | $32,000 |
Multimedia Portfolio | $29,000 | $32,000 |
Natural Gas Portfolio | $33,000 | $33,000 |
Natural Resources Portfolio | $30,000 | $32,000 |
Networking and Infrastructure Portfolio | $28,000 | $32,000 |
Paper and Forest Products Portfolio | $28,000 | $32,000 |
Pharmaceuticals Portfolio | $29,000 | $32,000 |
Retailing Portfolio | $29,000 | $32,000 |
Software and Computer Services Portfolio | $30,000 | $34,000 |
Technology Portfolio | $34,000 | $38,000 |
Telecommunications Portfolio | $29,000 | $33,000 |
Transportation Portfolio | $29,000 | $32,000 |
Utilities Growth Portfolio | $29,000 | $33,000 |
Wireless Portfolio | $29,000 | $33,000 |
All funds in the Fidelity Group of Funds audited by PwC | $12,500,000 | $11,200,000 |
A | Aggregate amounts may reflect rounding. |
(b) Audit-Related Fees.
In each of the fiscal years ended February 28, 2006 and February 28, 2005, the aggregate Audit-Related Fees billed by PwC for services rendered for assurance and related services to each fund that are reasonably related to the performance of the audit or review of the fund's financial statements, but not reported as Audit Fees, are shown in the table below.
Fund | 2006A | 2005A |
Air Transportation Portfolio | $0 | $0 |
Automotive Portfolio | $0 | $0 |
Banking Portfolio | $0 | $0 |
Biotechnology Portfolio | $0 | $0 |
Brokerage and Investment Management Portfolio | $0 | $0 |
Business Services and Outsourcing Portfolio | $0 | $0 |
Chemicals Portfolio | $0 | $0 |
Computers Portfolio | $0 | $0 |
Construction and Housing Portfolios | $0 | $0 |
Consumer Industries Portfolio | $0 | $0 |
Cyclical Industries Portfolio | $0 | $0 |
Defense and Aerospace Portfolio | $0 | $0 |
Developing Communications Portfolio | $0 | $0 |
Electronics Portfolio | $0 | $0 |
Energy Portfolio | $0 | $0 |
Energy Service Portfolio | $0 | $0 |
Environmental Portfolio | $0 | $0 |
Financial Services Portfolio | $0 | $0 |
Food and Agriculture Portfolio | $0 | $0 |
Gold Portfolio | $0 | $0 |
Health Care Portfolio | $0 | $0 |
Home Finance Portfolio | $0 | $0 |
Industrial Equipment Portfolio | $0 | $0 |
Industrial Materials Portfolio | $0 | $0 |
Insurance Portfolio | $0 | $0 |
Leisure Portfolio | $0 | $0 |
Medical Delivery Portfolio | $0 | $0 |
Medical Equipment and Systems Portfolio | $0 | $0 |
Money Market Portfolio | $0 | $0 |
Multimedia Portfolio | $0 | $0 |
Natural Gas Portfolio | $0 | $0 |
Natural Resources Portfolio | $0 | $0 |
Networking and Infrastructure Portfolio | $0 | $0 |
Paper and Forest Products Portfolio | $0 | $0 |
Pharmaceuticals Portfolio | $0 | $0 |
Retailing Portfolio | $0 | $0 |
Software and Computer Services Portfolio | $0 | $0 |
Technology Portfolio | $0 | $0 |
Telecommunications Portfolio | $0 | $0 |
Transportation Portfolio | $0 | $0 |
Utilities Growth Portfolio | $0 | $0 |
Wireless Portfolio | $0 | $0 |
A | Aggregate amounts may reflect rounding. |
In each of the fiscal years ended February 28, 2006 and February 28, 2005, the aggregate Audit-Related Fees that were billed by PwC that were required to be approved by the Audit Committee for services rendered on behalf of Fidelity Management & Research Company (FMR) and entities controlling, controlled by, or under common control with FMR (not including any sub-adviser whose role is primarily portfolio management and is subcontracted with or overseen by another investment adviser) that provide ongoing services to the funds ("Fund Service Providers") for assurance and related services that relate directly to the operations and financial reporting of each fund that are reasonably related to the performance of the audit or review of the fund's financial statements, but not reported as Audit Fees, are shown in the table below.
Billed By | 2006A | 2005A |
PwC | $0 | $0 |
A | Aggregate amounts may reflect rounding. |
Fees included in the audit-related category comprise assurance and related services (e.g., due diligence services) that are traditionally performed by the independent registered public accounting firm. These audit-related services include due diligence related to mergers and acquisitions, accounting consultations and audits in connection with acquisitions, internal control reviews, attest services that are not required by statute or regulation and consultation concerning financial accounting and reporting standards.
(c) Tax Fees.
In each of the fiscal years ended February 28, 2006 and February 28, 2005, the aggregate Tax Fees billed by PwC for professional services rendered for tax compliance, tax advice, and tax planning for each fund is shown in the table below.
Fund | 2006A | 2005A |
Air Transportation Portfolio | $2,000 | $1,900 |
Automotive Portfolio | $2,000 | $1,900 |
Banking Portfolio | $2,000 | $1,900 |
Biotechnology Portfolio | $2,000 | $1,900 |
Brokerage and Investment Management Portfolio | $2,000 | $1,900 |
Business Services and Outsourcing Portfolio | $2,000 | $1,900 |
Chemicals Portfolio | $2,000 | $1,900 |
Computers Portfolio | $2,000 | $1,900 |
Construction and Housing Portfolios | $2,000 | $1,900 |
Consumer Industries Portfolio | $2,000 | $1,900 |
Cyclical Industries Portfolio | $2,000 | $1,900 |
Defense and Aerospace Portfolio | $2,000 | $1,900 |
Developing Communications Portfolio | $2,000 | $1,900 |
Electronics Portfolio | $2,000 | $1,900 |
Energy Portfolio | $2,000 | $1,900 |
Energy Service Portfolio | $2,000 | $1,900 |
Environmental Portfolio | $2,000 | $1,900 |
Financial Services Portfolio | $2,000 | $1,900 |
Food and Agriculture Portfolio | $2,000 | $1,900 |
Gold Portfolio | $2,000 | $1,900 |
Health Care Portfolio | $2,000 | $1,900 |
Home Finance Portfolio | $2,000 | $1,900 |
Industrial Equipment Portfolio | $2,000 | $1,900 |
Industrial Materials Portfolio | $2,000 | $1,900 |
Insurance Portfolio | $2,000 | $1,900 |
Leisure Portfolio | $2,000 | $1,900 |
Medical Delivery Portfolio | $2,000 | $1,900 |
Medical Equipment and Systems Portfolio | $2,000 | $1,900 |
Money Market Portfolio | $2,000 | $1,900 |
Multimedia Portfolio | $2,000 | $1,900 |
Natural Gas Portfolio | $2,000 | $1,900 |
Natural Resources Portfolio | $2,000 | $1,900 |
Networking and Infrastructure Portfolio | $2,000 | $1,900 |
Paper and Forest Products Portfolio | $2,000 | $1,900 |
Pharmaceuticals Portfolio | $2,000 | $1,900 |
Retailing Portfolio | $2,000 | $1,900 |
Software and Computer Services Portfolio | $2,000 | $1,900 |
Technology Portfolio | $2,000 | $1,900 |
Telecommunications Portfolio | $2,000 | $1,900 |
Transportation Portfolio | $2,000 | $1,900 |
Utilities Growth Portfolio | $2,000 | $1,900 |
Wireless Portfolio | $2,000 | $1,900 |
A | Aggregate amounts may reflect rounding. |
In each of the fiscal years ended February 28, 2006 and February 28, 2005, the aggregate Tax Fees billed by PwC that were required to be approved by the Audit Committee for professional services rendered on behalf of the Fund Service Providers for tax compliance, tax advice, and tax planning that relate directly to the operations and financial reporting of each fund is shown in the table below.
Billed By | 2006A | 2005A |
PwC | $0 | $0 |
A | Aggregate amounts may reflect rounding. |
Fees included in the Tax Fees category comprise all services performed by professional staff in the independent registered public accounting firm's tax division except those services related to the audit. Typically, this category would include fees for tax compliance, tax planning, and tax advice. Tax compliance, tax advice, and tax planning services include preparation of original and amended tax returns, claims for refund and tax payment-planning services, assistance with tax audits and appeals, tax advice related to mergers and acquisitions and requests for rulings or technical advice from taxing authorities.
(d) All Other Fees.
In each of the fiscal years ended February 28, 2006 and February 28, 2005, the aggregate Other Fees billed by PwC for all other non-audit services rendered to the funds is shown in the table below.
Fund | 2006A | 2005A |
Air Transportation Portfolio | $1,400 | $1,300 |
Automotive Portfolio | $1,400 | $1,300 |
Banking Portfolio | $1,700 | $1,700 |
Biotechnology Portfolio | $2,800 | $2,900 |
Brokerage and Investment Management Portfolio | $1,900 | $1,600 |
Business Services and Outsourcing Portfolio | $1,400 | $1,300 |
Chemicals Portfolio | $1,500 | $1,300 |
Computers Portfolio | $1,900 | $1,900 |
Construction and Housing Portfolios | $1,600 | $1,400 |
Consumer Industries Portfolio | $1,400 | $1,300 |
Cyclical Industries Portfolio | $1,400 | $1,300 |
Defense and Aerospace Portfolio | $2,000 | $1,600 |
Developing Communications Portfolio | $1,800 | $1,800 |
Electronics Portfolio | $3,800 | $3,900 |
Energy Portfolio | $3,000 | $1,700 |
Energy Service Portfolio | $2,400 | $1,700 |
Environmental Portfolio | $1,400 | $1,300 |
Financial Services Portfolio | $1,800 | $1,700 |
Food and Agriculture Portfolio | $1,500 | $1,400 |
Gold Portfolio | $2,100 | $1,800 |
Health Care Portfolio | $3,300 | $2,900 |
Home Finance Portfolio | $1,700 | $1,600 |
Industrial Equipment Portfolio | $1,400 | $1,300 |
Industrial Materials Portfolio | $1,500 | $1,400 |
Insurance Portfolio | $1,500 | $1,400 |
Leisure Portfolio | $1,500 | $1,400 |
Medical Delivery Portfolio | $2,500 | $1,500 |
Medical Equipment and Systems Portfolio | $2,400 | $1,900 |
Money Market Portfolio | $1,500 | $1,500 |
Multimedia Portfolio | $1,400 | $1,400 |
Natural Gas Portfolio | $2,600 | $1,600 |
Natural Resources Portfolio | $1,800 | $1,400 |
Networking and Infrastructure Portfolio | $1,500 | $1,400 |
Paper and Forest Products Portfolio | $1,400 | $1,300 |
Pharmaceuticals Portfolio | $1,500 | $1,300 |
Retailing Portfolio | $1,400 | $1,300 |
Software and Computer Services Portfolio | $1,900 | $1,900 |
Technology Portfolio | $3,100 | $3,100 |
Telecommunications Portfolio | $1,700 | $1,600 |
Transportation Portfolio | $1,400 | $1,300 |
Utilities Growth Portfolio | $1,700 | $1,500 |
Wireless Portfolio | $1,700 | $1,600 |
A | Aggregate amounts may reflect rounding. |
In each of the fiscal years ended February 28, 2006 and February 28, 2005, the aggregate Other Fees billed by PwC that were required to be approved by the Audit Committee for all other non-audit services rendered on behalf of the Fund Service Providers that relate directly to the operations and financial reporting of each fund is shown in the table below.
Billed By | 2006A | 2005A |
PwC | $155,000 | $520,000 |
A | Aggregate amounts may reflect rounding. |
Fees included in the All Other Fees category include services related to internal control reviews, strategy and other consulting, financial information systems design and implementation, consulting on other information systems, and other tax services unrelated to the fund.
(e) (1) | Audit Committee Pre-Approval Policies and Procedures: |
The trust's Audit Committee must pre-approve all audit and non-audit services provided by the independent registered public accounting firm relating to the operations or financial reporting of the funds. Prior to the commencement of any audit or non-audit services to a fund, the Audit Committee reviews the services to determine whether they are appropriate and permissible under applicable law.
The trust's Audit Committee has adopted policies and procedures to, among other purposes, provide a framework for the Committee's consideration of non-audit services by the audit firms that audit the Fidelity funds. The policies and procedures require that any non-audit service provided by a fund audit firm to a Fidelity Fund and any non-audit service provided by a fund auditor to a Fund Service Provider that relates directly to the operations and financial reporting of a Fidelity fund (Covered Service) are subject to approval by the Audit Committee before such service is provided. Non-audit services provided by a fund audit firm for a Fund Service Provider that do not relate directly to the operations and financial reporting of a Fidelity fund (Non-Covered Service) but that are expected to exceed $50,000 are also subject to pre-approval by the Audit Committee.
All Covered Services, as well as Non-Covered Services that are expected to exceed $50,000, must be approved in advance of provision of the service either: (i) by formal resolution of the Audit Committee, or (ii) by oral or written approval of the service by the Chair of the Audit Committee (or if the Chair is unavailable, such other member of the Audit Committee as may be designated by the Chair to act in the Chair's absence). The approval contemplated by (ii) above is permitted where the Treasurer determines that action on such an engagement is necessary before the next meeting of the Audit Committee. Neither pre-approval nor advance notice of Non-Covered Service engagements for which fees are not expected to exceed $50,000 is required; such engagements are to be reported to the Audit Committee monthly.
(e) (2) | Services approved pursuant to paragraph (c)(7)(i)(C) of Rule 2-01 of Regulation S-X: |
Audit-Related Fees:
There were no amounts that were approved by the Audit Committee pursuant to the de minimis exception for the fiscal years ended February 28, 2006 and February 28, 2005 on behalf of each fund.
There were no amounts that were required to be approved by the Audit Committee pursuant to the de minimis exception for the fiscal years ended February 28, 2006 and February 28, 2005 on behalf of the Fund Service Providers that relate directly to the operations and financial reporting of each fund.
Tax Fees:
There were no amounts that were approved by the Audit Committee pursuant to the de minimis exception for the fiscal years ended February 28, 2006 and February 28, 2005 on behalf of each fund.
There were no amounts that were required to be approved by the Audit Committee pursuant to the de minimis exception for the fiscal years ended February 28, 2006 and February 28, 2005 on behalf of the Fund Service Providers that relate directly to the operations and financial reporting of each fund.
All Other Fees:
There were no amounts that were approved by the Audit Committee pursuant to the de minimis exception for the fiscal years ended February 28, 2006 and February 28, 2005 on behalf of each fund.
There were no amounts that were required to be approved by the Audit Committee pursuant to the de minimis exception for the fiscal years ended February 28, 2006 and February 28, 2005 on behalf of the Fund Service Providers that relate directly to the operations and financial reporting of each fund.
(f) Not applicable.
(g) For the fiscal years ended February 28, 2006 and February 28, 2005, the aggregate fees billed by PwC of $1,325,000A and $1,450,000A,B for non-audit services rendered on behalf of the funds, FMR (not including any sub-adviser whose role is primarily portfolio management and is subcontracted with or overseen by another investment adviser) and Fund Service Providers relating to Covered Services and Non-Covered Services are shown in the table below.
| 2006A | 2005A |
Covered Services | $325,000 | $650,000 |
Non-Covered Services | $1,000,000 | $800,000 B |
A | Aggregate amounts may reflect rounding. |
B | Reflects current period presentation. |
(h) The trust's Audit Committee has considered Non-Covered Services that were not pre-approved that were provided by PwC to Fund Service Providers to be compatible with maintaining the independence of PwC in its audit of the funds, taking into account representations from PwC, in accordance with Independence Standards Board Standard No.1, regarding its independence from the funds and their related entities.
Item 5. Audit Committee of Listed Registrants
Not applicable.
Item 6. Schedule of Investments
Not applicable.
Item 7. Disclosure of Proxy Voting Policies and Procedures for Closed-End Management Investment Companies
Not applicable.
Item 8. Portfolio Managers of Closed-End Management Investment Companies
Not applicable.
Item 9. Purchase of Equity Securities by Closed-End Management Investment Company and Affiliated Purchasers
Not applicable.
Item 10. Submission of Matters to a Vote of Security Holders
There were no material changes to the procedures by which shareholders may recommend nominees to the trust's Board of Trustees.
Item 11. Controls and Procedures
(a)(i) The President and Treasurer and the Chief Financial Officer have concluded that the trust's disclosure controls and procedures (as defined in Rule 30a-3(c) under the Investment Company Act) provide reasonable assurances that material information relating to the trust is made known to them by the appropriate persons, based on their evaluation of these controls and procedures as of a date within 90 days of the filing date of this report.
(a)(ii) There was no change in the trust's internal control over financial reporting (as defined in Rule 30a-3(d) under the Investment Company Act) that occurred during the second fiscal quarter of the period covered by this report that has materially affected, or is reasonably likely to materially affect, the trust's internal control over financial reporting.
Item 12. Exhibits
(a) | (1) | Code of Ethics pursuant to Item 2 of Form N-CSR is filed and attached hereto as EX-99.CODE ETH. |
(a) | (2) | Certification pursuant to Rule 30a-2(a) under the Investment Company Act of 1940 (17 CFR 270.30a-2(a)) is filed and attached hereto as Exhibit 99.CERT. |
(a) | (3) | Not applicable. |
(b) | | Certification pursuant to Rule 30a-2(b) under the Investment Company Act of 1940 (17 CFR 270.30a-2(b)) is furnished and attached hereto as Exhibit 99.906CERT. |
SIGNATURES
Pursuant to the requirements of the Securities Exchange Act of 1934 and the Investment Company Act of 1940, the registrant has duly caused this report to be signed on its behalf by the undersigned, thereunto duly authorized.
Fidelity Select Portfolios
By: | /s/Christine Reynolds |
| Christine Reynolds |
| President and Treasurer |
| |
Date: | April 19, 2006 |
Pursuant to the requirements of the Securities Exchange Act of 1934 and the Investment Company Act of 1940, this report has been signed below by the following persons on behalf of the registrant and in the capacities and on the dates indicated.
By: | /s/Christine Reynolds |
| Christine Reynolds |
| President and Treasurer |
| |
Date: | April 19, 2006 |
By: | /s/Paul M. Murphy |
| Paul M. Murphy |
| Chief Financial Officer |
| |
Date: | April 19, 2006 |